Thresholds and Closing Windows - International Cryosphere ...
32
International Cryosphere Climate Initiative www.iccinet.org DECEMBER 2015 • WWW.ICCINET.ORG/THRESHOLDS Thresholds and Closing Windows RISKS OF IRREVERSIBLE CRYOSPHERE CLIMATE CHANGE
-
Upload
khangminh22 -
Category
Documents
-
view
1 -
download
0
Transcript of Thresholds and Closing Windows - International Cryosphere ...

International Cryosphere Climate Initiative
www.iccinet.org
DECEMBER 2015 • W W W.ICCINET.ORG/THRESHOLDS
Thresholds and Closing Windows RISKS OF IRREVERSIBLE CRYOSPHERE CLIMATE CHANGE


i
Thresholds and Closing Windows
DECEMBER 2015
WWW.ICCINET.ORG/THRESHOLDS
International Cryosphere Climate Initiative
www.iccinet.org
R I S K S O F I R R E V E R S I B L E C RYO S P H E R E C L I M AT E C H A N G E

ii
LARGE COVER PHOTO
Newly formed sea ice next to an iceberg in the Bellingshausen Sea off the Antarctic Peninsula. The Peninsula is considered the fastest-warming place on earth. (credit: NASA/Digital Mapping System)
INSET PHOTOS
1. ICE SHEETS Thwaites Glacier in the West Antarctic Ice Sheet (WAIS) (credit: NASA)
2. MOUNTAIN GLACIERS Mendenhall Glacier, Alaska. (credit: Energy.gov/Flickr)
3. PERMAFROST “Drunken” trees in Alaska, tilting as the ground collapses due to permafrost thaw. (© Lynn D. Rosentrater/Flickr)
4. ARCTIC SEA ICE A polar bear rests on an ice floe in the Arctic Ocean. (credit: Patrick Kelley, U.S. Coast Guard)
5. POLAR OCEAN ACIDIFICATION Aragonite saturation in 2100 (Part of the Ocean Acidification Summary for Policymakers – Third Symposium on the Ocean in a High-CO2 World, sponsored by IGBP, IOC-UNESCO and SCOR. More information: www.igbp.net)
© 2015 International Cryosphere Climate Initiative
Contact: [email protected] Twitter: @iccinet.org www.iccinet.org
Thresholds and Closing Windows: Risks of Irreversible Cryosphere Climate Change was produced with the generous support of the Flora Family Foundation and the Oak Foundation.
Thresholds and Closing Windows RISKS OF IRREVERSIBLE
CRYOSPHERE CLIMATE CHANGE
52
4
13

iii
ContentsPrefacea closing window on a thousand-year legacy . . . . . . . . . . . iv
Summarya world aPProaching irreversible thresholds . . . . . . . . . . . 1
chaPter 1 Ice Sheetsawakening giants . . . . . . . . . . . . . . . . . . . . . . . . . . . . . . . . . . . 4
chaPter 2 Mountain Glacierscrossing irreversible thresholds . . . . . . . . . . . . . . . . . . . . . 8
chaPter 3 Permafrostthe frozen amPlifier . . . . . . . . . . . . . . . . . . . . . . . . . . . . . . . . 11
chaPter 4 Arctic Sea Icethe globe’s failing natural refrigerator . . . . . . . . . . . . . . . 15
chaPter 5 Polar Ocean Acidificationloss of resources from the “other” co2 Problem . . . . . . . . 18

iv
Acknowledgements
Drafting TeamPam Pearson (ICCI), Clara Burgard and Dirk Notz (both Max Planck Institute for Meteorology) drafted initial versions of Report chapters; Susan Natali, Brendan Rogers and Seth Spawn (Woods Hole Research Center) worked extensively on the Permafrost Chapter. Final content is the respon-sibility of ICCI. Scientific reviewers shown at the end of each chapter also provided text (sometimes extensive), corrections and commentary. Their time and invaluable contributions are hereby acknowledged and deeply appreciated.
Special thanks also to Matt Pickett, Pickett Designs for design of the summary thresholds figure (S-2), and to Tyler Kemp-Benedict for design and layout.
Scientific Reviewers
1 ice sheets
Richard B. Alley, Pennsylvania State University, AR4 Lead Author, AR3 and AR2 Contributing Author
Ian Allison, University of Tasmania, AR5 and AR4 Lead Author
Jonathan Bamber, University of Bristol, AR5 Review Editor
Carlota Escutia, University of Granada
Ian Joughin, University of Washington
Anders Levermann, Potsdam Centre for Climate Impact Research, AR5 Lead Author
Ricarda Winkelmann, Potsdam Centre for Climate Impact Research
2 mountain glaciers
Graham Cogley, Trent University, AR5 WG1 Contributing Author, WG2 Lead Author
Georg Kaser, University of Innsbruck, AR5 WG1 Lead Author
Ben Marzeion, University of Bremen, AR5 WG1 Contributing Author
3 Permafrost
Julia Boike, Alfred Wegener Institute
Dave Lawrence, National Center for Atmospheric Research
Susan Natali, Woods Hole Research Center
Brendan Rogers, Woods Hole Research Center
Vladimir Romanovsky, University of Alaska-Fairbanks
Kevin Schaefer, National Snow and Ice Data Center, Univer-sity of Colorado
Seth Spawn, Woods Hole Research Center
4 arctic sea ice
Ronald Kwok, NASA Jet Propulsion Laboratory, AR5 Lead Author
Walt Meier, NASA Goddard Space Flight Center
Dirk Notz, Max Planck Institute for Meteorology
Julienne Stroeve, National Snow and Ice Data Center/University College London
5 Polar ocean acidification
Nina Bednarsek, National Oceanic and Atmospheric Administration
Richard Bellerby, East China Normal University/Norwegian Institute for Water Research
Sam Dupont, University of Gothenburg
Richard Feely, National Oceanic and Atmospheric Adminis-tration, AR5 Lead Author
Helen Findlay, Plymouth National Marine Laboratory
text box: estimating indc imPacts
Drew Shindell, Duke University, AR5 Coordinating Lead Author
Elisabetta Vignati, EC Joint Research Centre

v
PrefaceA C L O S I N G W I N D OW O N A T H O U S A N D - Y E A R L E GAC Y
As decision makers approach COP-21 in Paris, it is vital that we comprehend the very great risks posed by the irreversible cryosphere thresholds outlined in this Report. Its main message: current “intended contributions,” or INDCs will not prevent our
crossing into this zone of irreversibility. This means that much higher ambition levels are needed, or the window for effective action may soon close. Reacting with “too little, too late” otherwise could lock in the gradual but unavoidable transformation of our Earth, its ecosys-tems and human communities.
Once thought of as “high risk, low probability,” the summaries in this Report of IPCC AR5 findings – and especially, cryosphere research since AR5 – confirm such irreversible thresh-olds as physically determined realities that in some cases, should we exceed them, result in processes that cannot be halted unless temperatures return to levels below pre-industrial. To put it most bluntly, only a new “Little Ice Age” may re-establish some of today’s mountain glaciers and their reliable water resources for millions of people; or halt melting polar ice sheets that, once started, irrevocably would set the world on course to an ultimate sea-level rise of between 4–10 meters or more.
These thresholds are drawing closer. Unless governments move quickly and effectively in Paris towards larger, earlier commitments to keep peak temperatures in the cryosphere as low as possible, the windows to prevent some of these changes may close during the 2020–2030 commitment period. And some of these cryosphere thresholds, including potential fisheries and ecosystem loss from polar ocean acidification, cannot be reversed at all.
After 2030, changing the course of our global climate and therefore, future human his-tory becomes far more difficult. Never has a single generation held the future of so many coming generations, species and ecosystems in its hands. Cryosphere climate change is not like air or water pollution, where the impacts remain local and when addressed, allow ecosystems largely to recover. Cryosphere climate change, driven by the physical laws of water’s response to the freezing point, is different. Slow to manifest itself, once triggered it inevitably forces the Earth’s climate system into a new state, one that most scientists believe has not existed for 35–50 million years.
This future however is neither defined, nor hopeless. Instead, the pathway to the needed lower emissions levels is both possible, and has become increasingly well-defined by many of our governments and economic advisors. The main missing ingredient is political will – and understanding that the legacy of inaction today will last not for a few decades, but for millennia.
It is our hope that the Thresholds Report will make that political choice clear.
Ambassador Bo Kjellén, Honorary Chair, ICCI Advisory Board
Prof. Jean-Pascal van Ypersele, Former IPCC Vice-Chair
Dr. Phillip B. Duffy, President and Executive Director, Woods Hole Research Center
Pam Pearson, Director and Founder, ICCI
Dr. Svante Bodin, Director, ICCI-Europe

vi

1
SummaryA WO R L D A P P ROAC H I N G I R R E V E R S I B L E T H R E S H O L D S
Most people today know that the Arctic, parts of Antarctica and many mountain regions already have warmed two-three times faster than the
rest of the planet: between 2–3.5°C (3.6–6.3°F). What is less understood outside the scientific community is that the very nature of the cryosphere – regions of snow and ice – carries dynamics that once started, cannot always be reversed or even halted, even if temperatures were some-how returned to lower values.
Just how many of these “triggers” become tripped is dependent on how high we allow temperatures in these regions to peak, and for how long. The hard part for policy makers is that some of the most damaging consequences will mostly occur in hundreds or even thousands of years – but may be determined by our actions or inactions in just the coming few decades, including the 2020–30 com-mitment period that is the focus of the Paris Agreement. Once started however, they inevitably will unfold, with no possible means to halt them on timescales of decades, centuries or millennia.
Cryospheric thresholds reflect an immutable physi-cal reality: when temperatures rise above 0°C (32°F), ice melts or permafrost thaws. Key to this understanding is the higher and more certain temperature rise observed across all cryosphere regions. While mid-latitude tempera-tures may have risen at lower rates over the past 15 years, the rise at higher latitudes and temperatures accelerated (Figure S-1). The so-called “global pause” in warming (actually a lower rate of warming) over the past fifteen years was not reflected at all in the Arctic and Antarctic latitudes. And even the two-degree global goal pathway translates into a peak cryosphere temperature of between 4–7°C above pre-industrial.
This Report has gathered leading cryosphere scien-tists to summarize the different levels of risk that such irreversible processes will begin in five key thresholds: ice sheets loss and related sea-level rise; polar ocean acidifica-tion; land glacier loss; permafrost melt; and loss of Arctic summer sea ice.
Some of these cryosphere changes have actually already begun. Scientists widely accept that even if we could magi-cally halt warming today, committed and irreversible sea-level rise from glaciers, ice sheets and the natural expansion of warming waters is 1 meter (3 feet), though this new normal
will not be reached for about two hundred years. Most sci-entists also agree that the West Antarctic ice sheet has been so destabilized by warming to-date that it likely cannot be halted without a very rapid stabilization of temperatures, and perhaps not even then. At best, we might only delay the resulting ice sheet collapse, and the associated 3–4 meters of additional sea-level rise, by some hundreds of years.
How much worse things get – how many other irre-versible triggers are tripped – is up to us. Unfortunately, this report’s analysis of current Paris climate commitments indicates that they will fail to prevent many, if not most of these irreversible cryosphere processes from beginning.
UNEP, IEA and a number of independent research organizations estimate that current pledges or “INDCs” (“Intended Nationally Determined Contributions”) for Paris will result in global temperatures between 2.7–3.5°C above pre-industrial already by 2100; with final peaks in temperature assumedly higher still, between 3.4–4.2 degrees. these estimates have a great deal of uncertainty; at the same time, they also assume that all “intended”
FIGURE S-1. Temperature Change by Latitude Bands, 1998–2013
While slower warming occurred in the mid-latitudes from 1998-2013, temperatures in both polar regions continued to rise sharply – by nearly 1.1°C in Antarctica, and over 1.4°C in the Arctic.
SOURCE: DREW SHINDELL USING NASA GISS ANN L-O TEMP OBSERVATIONS
−90 −60 −30 0 30 60 90 −.2 −.1
0. .1 .2 .3 .4 .5 .6 .7 .8 .91.01.11.21.31.41.5
Zona
l Mea
n
Latitude
1.4
1.2
1.0
0.8
0.6
0.4
0.2
0
-0.2
Cha
nge
in m
ean
tem
pera
ture
LatitudeSouth North-60 -30 0 30 60 90-90

THRESHOLDS AND CLOSING WINDOWS: RISKS OF IRREVERSIBLE CRYOSPHERE CLIMATE CHANGE
2
contributions actually take place. even so, the resulting peak in global carbon emissions from INDCs will occur well after 2050; and peak atmospheric concentrations likely will reach around 600ppm. This will result in a number of “closing windows” to prevent cryospheric change. As the individual chapters in this Report make clear, these temper-atures almost certainly will trigger permanent changes in cryosphere that cannot in practice be reversed, including:
• Complete loss of most mountain glaciers (highly irreversible without a return to today’s temperatures or below);
• Complete loss of portions of West Antarctica’s Ice Sheets and parts of Greenland, with vulnerable basins of East Antarctica potentially somewhere on the brink, carrying slow (hundreds to thousands of years) but unstoppable sea-level rise of a minimum 4–10 meters of sea-level rise (much more if East Antarctica becomes involved, and highly irreversible without a new Ice Age);
• Threats to Southern Ocean and Arctic Ocean fish-eries, marine ecosystems, and species from higher acidification impacts in these waters (any species loss not reversible, even with a new Ice Age);
• Permafrost thaw and related release of additional greenhouse gases (any carbon release not reversible even with new Ice Age, except on geologic time scales);
• Complete annual loss of summer Arctic sea ice and its tempering effect on global temperatures and weather patterns (not reversible short of a return to regular global temperatures of 1.0-2.0 degrees above pre-industrial).“Thresholds” defines these risks based on IPCC AR5
and literature published in the three years since (see “Esti-mating INDC Impacts,” p. 3). It makes clear that minimizing high-risk, irreversible cryospheric changes demands much higher levels of ambition for greenhouse gas emissions reductions than are included in current INDCs. Figure S-2, produced for ICCI, graphically shows that the trajectory of current INDCs places the Earth well within these irreversi-ble cryospheric risk zones.
Without raised ambitions that fully take cryosphere dynamics into account, avoiding rapid deterioration of snow and ice regions and associated global climate destabi-lization may become close to impossible. Adaptation to the levels of projected climate-related disruption, particularly sea-level rise that cannot be halted and accelerates over the centuries, simply will not be possible without massive migration and other changes to human centers of popula-tion and infrastructure, that will carry enormous economic and not least, historic and cultural costs.
The only way fully to avoid these risks is never to let temperatures rise into these risk zones at all.
FIGURE S-2. Cryosphere Dynamics and Temperature
Potential INDCRange in 2300
INDC Rangein 2100
Global Mean Temperature Above Pre-Industrial
1° 2° 2.4°0.8° 3° 4°
Today’sTemp
RCP 4.5in
2100450 ppmCO2- eq
Celsius5°
Permafrost Thaw: 130-160 Gt total additional carbon released by 2100 should temperatures reach 4.5° C
Arctic Sea Ice:Complete Summer Loss
Mountain Glaciers: 80% Loss
Ice Sheets: WAIS 3-4m SLR
Polar Ocean Acidification:Serious Species and Ecosystem Impacts
Ice Sheets Greenland: 6-7m Committed SLR (sea-level rise)
Ice Sheets East Antarctica??Vulnerable Basins: 4-15m Committed SLR
Approximate temperature ranges at which five cryosphere dynamics or “thresholds” may be triggered to irreversibility, based on current observations and models as outlined in this Report.

SUMMARy: A WORLD APPROACHING IRREVERSIBLE THRESHOLDS
3
Estimating INDC ImpactsTo calculate future temperature impacts, most scientific
studies (including the IPCC Fifth Assessment, called AR5)
have used a set of four carbon emissions pathways (called
RCPs, for “representative concentration pathways”)
through 2100 and that lead to a certain amount of atmos-
pheric warming in 2100, expressed as watts per square
meter (W/m2). So RCP 2.6 results in 2.6 W/m2, RCP 4.5
leads to 4.5 W/m2 in 2100, and so on. Country pledges, or “Intended Nationally Determined Contributions” (INDC) were only due on October 1, 2015, so no solid
cryosphere research has yet been done on their specific
impacts in these regions. However, two well-respected
organizations have estimated the cumulative impact of
INDCs by 2100: the Climate Action Tracker (CAT), a con-
sortium of European research institutions *, estimates 2.7
degrees will result in 2100, and Carbon Tracker (based
out of MIT in the U.S.) estimates the impact in 2100 as 3.5
degrees. The two make different assumptions primarily
about actions after the Paris commitment period ends in
2030; and this Report indicates both, where appropriate
in describing the cryosphere threshold impacts. These
assessment tools have also been used by UNEP and IEA
in coming to similar conclusions as to cumulative INDC
temperature impacts. Since temperature continues to rise
even after all CO2 emissions cease, we also assume sim-
ilar rises for 2100 to peak INDC temperatures about two
centuries later, in 2300 and which would decline only
slowly afterwards
Because most cryosphere research has used the
RCPs, we primarily have used RCP4.5 as a highly conserv-
ative proxy for current INDCs because its resulting 2100
temperature is 2.4 degrees; and RCP2.6 as proxy for the
1.5 degree goal promoted by many countries, especially
those vulnerable to sea-level rise. The accepted Paris
goal is to hold temperatures below 2 degrees in order
to avoid what have been termed the most disastrous cli-
mate change consequences (though as this Report notes,
still too high to avoid many cryosphere thresholds). In
the climate negotiations, governments also use as policy
goals the year that carbon emissions should peak and
then decline; the peak resulting carbon concentrations in
the atmosphere in parts per million (ppm), and the global
“carbon budget” or amount of carbon that can be emitted
and still make the noted goal. The below table details
the different RCPs and underlying assumptions. For the
2-degree goal, no equivalent emissions pathway has been
used for cryosphere projections, but a number of carbon
emissions budgets have been developed so these are
shown here also for comparison, and used in the Report.
scientific reviewers
Drew Shindell, Duke University, AR5 Coordinating Lead Author
Elisabetta Vignati, EC Joint Research Centre
TABLE S-1. Emissions Pathways, Temperatures and Carbon Budgets
RCP T in °C, 2100 Peak T in °C Peak Emissions Year Peak PPM Remaining Carbon Budget* (Gt)
2.6** 1.6** 1.6** 2020** 360** 250**
4.5 2.4 3.1 2040 600 350
8.5 4.3 8–12+ 2100 2000+ N/A
“2°C Goal” 2.0 approx 2.2 approx 2030 approx. 550 275
* For the 2°C Goal, with a >66% chance of staying below that temperature.
**To keep temperatures at 1.6°C, also assumes a technology will be developed to pull carbon from the atmosphere beginning in 2070. This technology does not yet exist in practice; and other RCPs assume CO2 remains in the atmosphere for its accepted lifetime. Hence, temperatures continue to rise long after all carbon emissions cease.
*Climate Analytics, Ecofys, NewClimate Institute and Potsdam Institute for Climate Research

4
CHAPTER 1
atmospheric circulation at high latitudes; and changes in the height and extent of the ice sheets, or related incur-sion of new cold water into ocean currents are reflected by changes in prevailing weather patterns.
Ice Sheet ThresholdsThe Greenland ice sheet and parts of the Antarctic ice sheet have discrete thresholds where near-total loss becomes unstoppable, in some cases at temperatures and carbon concentrations not that far from today. Too often, Antarc-tica especially is considered a simple whole. In reality, it consists of discrete though massive glacier systems that all have their own characteristics, and are likely to exhibit different behaviors at different temperatures. Melting of Antarctica as a whole is a far more rare event in the paleo-climatic record than partial melting; with a potential 60 meters of total sea-level rise (SLR), even loss of a portion of Antarctica’s ice sheet can have serious global impacts. (A recent study noted that burning of all fossil fuel reserves would lead to such continent-wide loss for the first time
BackgroundThe massive ice sheets of Greenland and Antarctica consist of compressed snow that fell, in its oldest sections, up to a million or more years ago. In equilibrium, calving of ice-bergs and outflow of melt water into the ocean balance the snowfall adding mass to the ice sheets. With warmer tem-peratures and greater moisture in the atmosphere, more snow falls at the poles and until recently, scientists have not been certain whether this additional snowfall would balance increased melting and iceberg discharge. However, observations over the past two decades, and the latest model simulations both now point to ice loss in a warming climate that is greater than snowfall accumulation.
Any change in the total mass of land ice bound within the large ice sheets of our planet has direct consequences for global sea level. During ice-age periods, when the ice sheets expanded significantly, sea level was much lower than today. During periods of warming, when the ice sheets lost mass, sea level rose accordingly. In addi-tion, the topography of the ice sheets strongly influences
Ice SheetsAWA K E N I N G G I A N T S
summary Some portions of the ancient and massive ice sheets covering Antarctica and Greenland, together holding over 60 m (200 ft) of sea-level rise, may have begun irreversible melting already at today’s temperatures. This risk becomes more certain as temperatures rise, especially if maintained over time, even at levels 1.5–2.5°C above pre-industrial – well below current INDCs. Total committed sea-level rise today is around 1 meter, primarily from existing mountain glacier melt and thermal expansion: although that new level will not be reached for a few hundred years, today it cannot be reversed. Irreversible ice sheet thresholds may be passed, however in coming decades. The additional projected rise associated with these ice sheet thresholds are 3–4 meters from West Antarctica; plus most of Greenland, which has a potential contribution of 7 meters. This means a total of around 10 meters (33 feet), close to imminent irreversibility, from the two most vulnerable ice sheets on the planet. Although this total rise in sea-level would likely take thousands of years, it could be locked in irrevocably already within the next few decades by processes that are irreversible unless temperatures return to levels below pre-industrial, or even the initiation of a new Ice Age, to re-form these massive ice sheets. New data on the topography of East Antarctica suggest that parts of this much larger ice sheet may also be vulnerable to similar instability. Avoiding these ice sheet thresholds is key to preventing loss of much human heritage and ecosystem resources, but will require far greater and earlier emissions cuts than in existing INDCs.

ICE SHEETS: AWAkENING GIANTS
5
since these ice sheets first formed around 34 million years ago). Equally important is the issue of time scales: since Antarctica does contain so much ice, it can take millennia for just parts of the continent to melt, and most climate forecasts focus only on what will occur between now and 2100. However, a key message for policy makers is that once the melt process begins, for significant sectors of the polar ice sheets it cannot be stopped or reversed until either temperatures go well below pre-industrial (initiation of a new Ice Age), or all the ice has flowed into the ocean.
Unfortunately, it appears that some ice sheet sectors may already have reached this stage of irreversible melt, but actions taken in coming decades may prevent other portions from reaching this state, as well as reducing the rate of melting. Two different mechanisms account for this “threshold” behavior. First, some ice sheets rest on bed-rock below sea level, and that bedrock slopes downwards from the coast inland. This allows warming water to eat away at the ice from below, and it can rapidly become unstable, dumping icebergs into the ocean and raising sea level even before those bergs melt. Second, the effect of increasing temperatures, and hence melting, as the altitude (or elevation) of the ice sheet gets lower, known as the elevation-temperature feedback, affects the Greenland ice sheet and could also affect the Antarctic ice sheet after much warming in the future.
The first mechanism affects the West Antarctic Ice Sheet (WAIS) and parts of the Antarctic Peninsula, where a point of irreversibility will be – or perhaps, already has been – reached. In these regions, the bedrock underlying the ice sheet slopes downwards to over 2000 meters below sea level. When warm ocean water intrudes beneath the
ice sheet, as has been observed over the past decade, the ice at the point where it first comes into contact with the ocean begins to melt rapidly and retreat further inland. As this contact point with ocean water retreats to deeper bedrock regions, the ice speed and discharge to the ocean both increase. This causes even more rapid thinning and retreat, until some topographic barrier is reached – but as Figure 1-1 shows, there are few to none such barriers in West Antarctica. Therefore, as the edge moves inland it is expected only to accelerate until nearly the entire ice sheet has melted, in a kind of slow yet inexorable conveyer belt. For the WAIS, a loss of over 3 m sea-level equivalent of ice is likely over coming centuries.
The large and particularly vulnerable Thwaites and Pine Island basins in West Antarctica have been studied in greatest detail. On Thwaites, observations of melt rates combined with modeling indicate that this ice system will likely collapse and disappear completely even at current rates of melting. Continued rise in temperature and associ-ated faster melting by ocean water will speed that collapse, but unless melt can be decreased below today’s levels the collapse appears inevitable sometime within the next 100 to 1000 years. Similar observations have found melting on the nearby Antarctic Peninsula and potentially, even from the Totten Basin in East Antarctica, the portion of the continent earlier considered largely unaffected by today’s tempera-ture levels. The unexpected thinning of Totten was recently explained by the discovery of a wide trough of seawater underneath its terminus, allowing warm waters to reach the base even when air temperatures remain colder than in West Antarctica. Elsewhere in East Antarctica, an ice plug currently prevents a similar incursion of water from under-mining a large portion of the Wilkes Basin – approximately the size of France, and estimated as Antarctica’s largest contiguous ice basin. Once this ice plug has melted com-pletely, large portions of the Wilkes Basin ice would flow into the sea in a similar process to that of West Antarctica; but the temperatures that would trigger this loss remain highly uncertain.
The largest Greenland glacier systems, such as Jakobshavn Isbrae and Zachariae Isstrom in northeast Greenland, are showing a similar response to oceanic warming. However, the dominant process for a possible irreversible loss of the Greenland ice sheet arises from the elevation-temperature feedback. This feedback occurs because melting on Greenland is strongly associated with altitude: so long as temperatures remain below freezing at higher altitudes, melting will be limited to a few weeks in summer. The Greenland ice sheet is over 3000 m thick and above 3000 m altitude in the interior; but if the height of the ice sheet is lowered through melting, its surface temperature rises, providing a mechanism for additional surface runoff and unstoppable melt. The threshold for Greenland melt to become irreversible has been estimated
FIGURE 1-1. Cross-section of West Antarctica
Much of West Antarctica is below sea-level, allowing water to flow in and potentially, rapidly destabilize the ice sheets above.
SOURCE: ILLUSTRATION By JONATHAN BAMBER
by Adrian Jenkins
Antarc'c Ice Sheet bears possibility of a dynamic instability
Illustra(on: Jonathan Bamber

THRESHOLDS AND CLOSING WINDOWS: RISKS OF IRREVERSIBLE CRYOSPHERE CLIMATE CHANGE
6
to be between 1–4°C above pre-industrial with a best esti-mate of 1.6°C, or a threshold potentially beginning near today’s levels and well below the 2.7–3.5°C estimate from current INDCs.
Finally, the paleo-climatic record shows that both Antarctica and Greenland have been completely deglaci-ated when temperatures and atmospheric concentrations reach a sustained 6°C and >1800ppm, respectively above pre-industrial, associated with 60 meters (200 feet) of SLR. If emissions continue at their current rate, half that CO2 concentration will be reached already by the end of this century. Although such a complete melt would likely take thousands of years to occur, it would be triggered by emissions during this century and the next, given the long lifetime of CO2 in the atmosphere and even more importantly, the longer time ocean waters hold warmth. At today’s temperatures (0.8°C above pre-industrial), both polar ice sheets are already losing mass, and at rates sub-stantially faster than a decade ago and, importantly, much faster than predicted. Ice sheets today contribute over one-third of the present rate of sea-level rise, a proportion expected to grow in coming decades. As emphasized else-where in this Report, global mean temperatures translate into cryosphere warming that is 2–3 times that of the rest of the globe, especially in the Arctic.
RisksObservational estimates based on paleo proxies, model simulations and the paleo-climactic record make it appear very likely that the loss of certain vulnerable parts of our planet’s ice sheets will become unstoppable at tempera-tures and CO2 concentrations at, or very close to those of today. The exact point at which such a threshold is reached, however, will vary with the different glacier systems that make up these ice sheets. For Greenland, further sustained warming over time may be necessary to trigger irreversible melt. For much of the West Antarctic Ice sheet, however, as well as the Antarctic Peninsula, a combination of observa-tional studies and modeling suggest that the ice may have already retreated beyond the point of no return, resulting in an unstoppable rise of sea level of at least 3 meters over the next centuries to millennia that cannot be halted without temperatures much lower than pre-industrial.
Conversely, it is important to note that even with these irreversible thresholds already passed, particularly in West Antarctica, lower temperatures and CO2 emissions – even if not sufficient to halt melting once a threshold is crossed – will slow the process; allowing humanity and ecosystems greater time to adapt, moving important urban centers much further inland, above the point of the new steady-state
FIGURE 1-2. Simulated Ice Loss and Collapse at Thwaites Glacier
In the above figure, Thwaites Glacier is preserved from collapse only if melting at the ocean-ice interface decreases to half of today’s rate. Rapid collapse can occur even faster under some scenarios.
SOURCE: JOUGHIN ET AL, 2014
Melt Rates (1/2 of today to 4x today)Melt Rates (1/2 of today to 4x today)

ICE SHEETS: AWAkENING GIANTS
7
coastlines. One study of Thwaites Glacier on the WAIS, for example, indicates that total collapse, while still inevitable, will occur within 300 years at higher rates of melting, and even faster under some scenarios, but can be delayed by an additional 500 years if we can maintain melt rates close to or below today’s levels (see Figure 1-2).
Nevertheless, with their projected rise to between 2.7–3.5°C already by 2100, current INDCs cannot be consid-ered sufficient to minimize this risk, or the risk of thresholds being passed for other parts of the ice sheets in this century.
scientific reviewers
Richard B. Alley, Pennsylvania State University, AR4 Lead Author
Ian Allison, University of Tasmania, AR5 Lead Author
Jonathan Bamber, University of Bristol, AR5 Review Editor
Carlota Escutia, University of Granada
Ian Joughin, University of Washington
Anders Levermann, Potsdam Centre for Climate Impact Research, AR5 Lead Author
Ricarda Winkelmann, Potsdam Centre for Climate Impact Research
literature
Alley, R.B., Anandakrishnan, S., Christianson, K., Horgan, H.J., Muto, A., Parizek, B.R., Pollard, D., and Walker, R.T. (2015). Oceanic Forcing of Ice-Sheet Retreat: West Antarctica and More. Annual Review of Earth and Planetary Science. 43, 207–231. doi:10.1146/annurev-earth-060614-105344.
Applegate, P.J., Parizek, B.R., Nicholas, R.E., Alley, R.B., and Keller, K. (2014). Increasing temperature forcing reduces the Greenland Ice Sheet’s response time scale. Climate Dynamics, 45(7), 2001–2011. doi: 10.1007/s00382-014-2451-7.
DeConto, R.M., and Pollard, D. (2003). Rapid Cenozoic gla-ciation of Antarctica induced by declining atmospheric CO2. Nature, 421, 245–249. doi: 10.1038/nature01290
Feldmann, J., and Levermann, A. (2015). Collapse of the West Antarctic Ice Sheet after local destabilization of
the Amundsen Basin. Proceedings of the National Academy of Sciences, 112(46), 14191–14196. doi: 10.1073/pnas.1512482112
Greenbaum, J.S., Blankenship, D.D., Young, D.A., Rich-ter, T.G., Roberts, J.L., Aitken, A.R.A., Legresy, D.M., Schroeder, D.M., Warner, R.C., van Ommen, T.D., and Siegert, M.J. (2015). Ocean access to a cavity beneath Totten Glacier in East Antarctica. Nature Geoscience, 8, 294–298. doi:10.1038/ngeo2388
Joughin, I., Smith, B.E., and Medley, B. (2014). Marine ice sheet collapse potentially under way for the Thwaites Glacier Basin, West Antarctica. Science, 344(6185), 735–738.
Marzeion, B., and Levermann, A. (2014). Loss of cultural world heritage and currently inhabited places to sea-level rise. Environmental Research Letters, 9, 034001. doi: 10.1088/1748-9326/9/3/034001
Mengel, M., and Levermann, A. (2014). Ice plug prevents irreversible discharge from East Antarctica. Nature Climate Change, 4(6), 451–455.
Mouginot, J., Rignot, E., Scheuchl, B., Fenty, I., Khazendar, A., Morlighem, M., Buzzi, A., and Paden, J. (2015). Fast retreat of Zachariæ Isstrøm, northeast Greenland. Sci-ence, doi: 10.1126/science.aac7111
Rignot, E., Mouginot, J., Morlighem, M., Seroussi, H., & Scheuchl, B. (2014). Widespread, rapid grounding line retreat of Pine Island, Thwaites, Smith, and Kohler gla-ciers, West Antarctica, from 1992 to 2011. Geophysical Research Letters, 41(10), 3502–3509.
Robinson, A., Calov, R., and Ganopolski, A. (2012). Multista-bility and critical thresholds of the Greenland ice sheet. Nature Climate Change, 2(6), 429–432.
Winkelmann, R., Levermann, A., Ridgewell, A., and Caldeira, K. (2015). Combustion of available fossil fuel resources sufficient to eliminate the Antarctic Ice Sheet. Science Advances, 1(8), e1500589. doi: 10.1126/sciadv.1500589
Wouters, B., Martin-Español, A., Helm, V., Flament, T., Van Wessem, J.M., Ligtenberg, S.R.M., Broeke, M.R.V.D., and Bamber, J.L. (2015). Dynamic thinning of glaciers on the Southern Antarctic Peninsula. Science, 348, 899–903.

8
CHAPTER 2Mountain GlaciersC RO S S I N G I R R E V E R S I B L E T H R E S H O L D S
BackgroundReceding mountain glaciers in the European Alps, Ameri-can Rockies, Andes, East Africa, New Guinea and elsewhere were among the first identified, visible impacts of climate change. Most of this observed retreat however arose from ongoing warming from the end of the Little Ice Age, with rising greenhouse gases only slightly speeding that retreat. Sometime in the past 50 years however, anthropogenic cli-mate change surpassed natural warming as the main driver of retreat for most glacier systems, and between 1991–2010 caused about two-thirds of glacier melt. That figure likely stands at a higher, and increasing, level today.
Glaciers have varying importance to nearby commu-nities as a source of water for drinking or irrigation, with some contributing only a few percent over the course of a year, but of enhanced importance during dry seasons, heat waves and droughts. During the 2003 European heat wave, 9% of the September flow at the mouth of the Danube into the Black Sea was meltwater from glaciers in the Alps, nearly 3000 km upstream, as against 2–4% in more typ-ical years; for the Rhone into the Mediterranean, it was
23%. Glaciers in the Andes, and those in the Indus and Tarim basins in the Greater Himalaya region, contribute most strongly to human water supply. While the current increased melting of glaciers transiently increases water availability, this is not sustainable. Eventually, the decrease and ultimate loss of glacial water resources may make tra-ditional agriculture impossible in these regions, requiring extensive community adaptation.
Glacier melt is accelerating, and expected to reach its peak in terms of total water yield somewhere between 2050–2100. That date however reflects not a slowing but a steady continuation of warming: the glaciers will melt ever more rapidly, but eventually there will be no more ice left to melt. This means a peak in the total yield of meltwater at some date between today and the date of complete disappearance, when glacier meltwater runoff ceases completely. In addition, about one-third of current sea-level rise comes from glacier melt. Towards the end of the 21st century, sea-level rise will occur mainly from thawing polar ice sheets and expanding ocean water.
summary Although mountain glaciers hold only a small fraction of the world’s frozen water, their present contribution to sea-level rise is comparable to that of the ice sheets. Moreover, the proximity of many glaciers to human populations has made their disappearance a highly visible sign of climate change. Glaciers are also among the most sensitive and early indicators of irreversible climate change impact, with total loss occurring already at today’s temperatures for many smaller glaciers worldwide. Although glacier retreat has been ongoing for the past 150 years, this retreat began accelerating in the past decades and is now due more to anthropogenic warming than to natural processes. Many glaciers, such as those of the northern Andes, have already reached a threshold of no return; and only the most ambitious mitigation goals (peaking at 2020), well above current INDCs, have a chance of preserving some remnants of glaciers in the next most vulnerable regions such as Scandinavia, western North America and New Zealand. Stringent observance of current INDCs, with greenhouse gas emissions peaking in 2040, have a chance of preserving some smaller extent of glaciers in the Himalayas, the southern Andes and Caucasus, but still substantially lessened from today. Although many glaciers will soon disappear, a return to temperatures at pre-industrial levels may eventually allow the re-establishment of glacier systems on many mountains.

MOUNTAIN GLACIERS: CROSSING IRREVERSIBLE THRESHOLDS
9
Glacier ThresholdsGlaciers “work” by gaining snow at higher altitude, known as their “accumulation area,” and losing it as meltwater at lower altitude. Warming means a rise in the altitude that separates net annual gain by snowfall from net annual loss by melting. A threshold is crossed when that altitude rises above the glacier’s highest point. It then suffers net loss over its entire surface every year, and is doomed to eventu-ally disappear entirely.
Many glacier systems are relatively small to begin with. These smaller glacier systems have little resilience to rising temperatures. This is true especially in regions where
climate change also leads to long-term drought such as the American West, preventing replenishment of the snowpack that eventually leads to glacier build-up. Glaciers such as those in tropical East Africa and the northern and central Andes, and probably also those in western North Amer-ica, the Alps, Scandinavia, Svalbard and New Zealand, are unlikely to survive even if governments in Paris choose to move rapidly to meet the IPCC recommendation for a 2020 emissions peak. Unfortunately, since many small glaciers grew during a time (the Little Ice Age) of pre-industrial temperatures, their loss must be considered irreversible absent a new global cooling to temperatures at or below pre-industrial.
FIGURE 2-1. Regional Mountain Glacier Melt with Different Emissions Scenarios
Loss of ice in different glacier regions – RCP2.6 (red) has 2100 temperature at 1.6°C; RCP4.5 (green) has a 2100 temperature of 2.4°C (2300 temperature around 3.2°C) and is slightly cooler than current INDCs. With RCP8.5 (purple), temperatures already reach 4.5°C in 2100. Left axis is contribution to sea-level rise, right axis is percent of glacier volume remaining. When glaciers in a given region reach 0 on the right axis, that means complete glacier loss.
SOURCE: MARZEION ET AL, 2012
mm
SLE
020406080100120
Alaska0
20
40
60
020406080100120
Western Canada & US0
1
2
3
% v
olum
e
020406080100120
Arctic Canada (North)0
50
100
mm
SLE
% v
olum
e
mm
SLE
020406080100120
Scandinavia0
0.2
0.4
0.6
% v
olum
e
020406080100120
Russian Arctic0
20
40
mm
SLE
020406080100120
Central Europe0
0.1
0.2
0.3
% v
olum
e
020406080100120
Caucasus & Middle East0
0.05
0.1
0.15020406080100120
Central Asia (North)0
5
10
15 020406080100120
Central Asia (South)0
1
2
3
4
2000 2100 2200
020406080100120
Low Latitudes0
0.2
0.4
0.6
2000 2100 2200
020406080100120
Southern Andes0
5
10
2000 2100 2200
020406080100120
New Zealand0
0.05
0.1
0.15
RCP26 RCP45 RCP85 ensemble membersRCP26 RCP45 RCP85 ensemble mean

THRESHOLDS AND CLOSING WINDOWS: RISKS OF IRREVERSIBLE CRYOSPHERE CLIMATE CHANGE
10
In some regions at higher latitude or altitude however, a lower peak temperature could preserve some extent of ice, though it would be greatly lessened. Glaciers in these regions – notably the Greater Himalayas, southern Andes/Patagonia, Caucasus, and high Arctic of North America and Russia – might then grow again should temperatures return close to those of the pre-industrial era. Current INDCs how-ever, with an emissions peak after 2050, temperatures in 2100 of 2.7–3.5 degrees above pre-industrial, and likely peak sustained temperatures between 3.5–4 degrees warmer, are far too high to allow such a restoration of ice cover. Models suggesting preservation of some diminished amount of ice in these regions require that a global peak in emissions be reached around 2040; with steady decline thereafter.
A sharp strengthening of INDCs, and preferably even stronger commitments in the 2030–40 time frame, could make the difference between significant preservation of glaciers and their water resources and a virtually complete loss of all glacier systems outside the polar regions.
RisksMany smaller glaciers have already lost their accumulation areas, and many more will lose them in coming decades. That is, they have crossed or will cross a threshold that irreversi-bly entails future near-total glacier loss regionally and, in the more distant future, globally. This will have greatest impact on communities in the Andes and Central Asia that are most dependent on glaciers as a seasonal source of water for drinking and irrigation, and on communities dependent on glaciers and associated snowpack for revenue from tourism. Current INDCs, even if stringently followed, are insufficient to avoid these socioeconomic risks, even at some higher latitudes and altitudes. However, significantly strengthened commitments – prior to 2020, in the 2020–30 commitment period and before 2040 – could reduce measurably and significantly the impact of climate change on at least some glaciers, and thus pave the way for constraining those risks for these highly visible and vulnerable “mountains of ice.”
scientific reviewersGraham Cogley, Trent University, AR5 WG1 Contributing Author, WG2 Lead Author
Georg Kaser, University of Innsbruck, AR5 WG1 Lead Author
Ben Marzeion, University of Bremen, AR5 WG1 Contributing Author
literatureBliss, A., Hock, R., and Radić, V. (2014). Global response of
glacier runoff to twenty-first century climate change. Jour-nal of Geophysical Research: Earth Surface, 119, 717–730.
Church, J.A., Clark, P.U., Cazenave, A., Gregory, J.M., Jevrejeva, S., Levermann, A., Merrifield, M.A., Milne, G.A., Nerem, R.S., Nunn, P.D., Payne, A.J., Pfeffer, W.T.,
Stammer, D., and Unnikrishnan, A.S. (2013). Sea Level Change. In Stocker, T.F., Qin, D., Plattner, G.-K., Tignor, M., Allen, S.K., Boschung, J., Nauels, A., Xia, Y., Bex, V., and Midgley, P.M. (eds.), Climate Change 2013: The Physical Science Basis. Contribution of Working Group I to the Fifth Assessment Report of the Intergovernmental Panel on Climate Change. Cambridge, United Kingdom and New York, NY, USA: Cambridge University Press.
Gregory, J.M., White, N.J., Church, J.A., Bierkens, M.F.P., Box, J.E., van den Broeke, M.R., Cogley, J.G., Fettweis, X., Hanna, E., Huybrechts, P., Konikow, L.F., Leclercq, P.W., Marzeion, B., Oerlemans, J., Tamisiea, M.E., Wada, Y., Wake, L.M., and van de Wal, R.S.W. (2013). Twenti-eth-century global-mean sea-level rise: is the whole greater than the sum of the parts? Journal of Climate, 26, 4476–4499. doi: 10.1175/JCLI-D-12-00319.1
Huss, M. (2011). Present and future contribution of glacier storage change to runoff from macroscale drainage basins in Europe. Water Resources Research, 47, W07511. doi:10.1029/2010WR010299
Huss M., and Hock, R. (2015) A new model for global glacier change and sea-level rise. Frontiers in Earth Science, 3, 1–21. doi: 10.3389/feart.2015.00054
Huss, M., and R. Hock (2014). Peak water from glaciers: advances and challenges in a global perspective. 2014 AGU Fall Meeting, abstract #H42B-07. URL: http://adsabs.harvard.edu/abs/2014AGUFM.H42B..07H
Kaser, G., Großhauser, M., and Marzeion, B. (2010). Con-tribution potential of glaciers to water availability in different climate regimes. Proceedings of the National Academy of Sciences USA, 107 (47), 20223–20227. doi: 10.1073/pnas.1008162107
Marzeion, B., Cogley, J.G., Richter, K., and Parkes, D. (2014). Attribution of global glacier mass loss to anthropogenic and natural causes. Science, 345(6199), 919–921. doi: 10.1126/science.1254702
Marzeion, B., Jarosch, A.H., and Gregory, J.M. (2014). Feed-backs and mechanisms affecting the global sensitivity of glaciers to climate change. The Cryosphere, 8, 59–71. doi: 10.5194/tc-8-59-2014
Marzeion, B., Jarosch, A.H., and Hofer, M. (2012). Past and future sea-level change from the surface mass balance of glaciers. The Cryosphere, 6, 1295–1322. doi: 10.5194/tc-6-1295-2012
Vaughan, D.G., Comiso, J.C., Allison, I., Carrasco, J., Kaser, G., Kwok, R., Mote, P., Murray, T., Paul, F., Ren, J., Rignot, E., Solomina, O., Steffen, K., and Zhang, T. (2013). Obser-vations: Cryosphere. In Stocker, T.F., Qin, D., Plattner, G.-K., Tignor, M., Allen, S.K., Boschung, J., Nauels, A., Xia, Y., Bex, V., and Midgley, P.M. (eds.), Climate Change 2013: The Physical Science Basis. Contribution of Working Group I to the Fifth Assessment Report of the Intergovernmental Panel on Climate Change. Cambridge, United Kingdom and New York, NY, USA: Cambridge University Press, 317–382.

11
CHAPTER 3PermafrostT H E F RO Z E N A M P L I F I E R
summary About one quarter of Northern Hemisphere land area contains permafrost – ground that remains frozen throughout the year. Permafrost soils hold vast amounts of ancient organic carbon, and observations confirm that they are rapidly warming. As warming continues, models project that permafrost will be lost across large areas, ranging from 30% of today’s total in the top few meters of soil by 2100 if we hold temperatures close to 1.5°C above pre-industrial globally, to over 70% lost by 2100 should temperature rise exceed 4.5°C. When permafrost thaws, carbon emissions to the atmosphere take place in the form of carbon dioxide and methane, which will fuel further warming. The scale of these permafrost carbon emissions strongly depends on how high temperatures rise in these Arctic and high altitude regions, which already are warming twice as fast as the rest of the globe. Permafrost experts agree that even a 30% loss of near-surface permafrost at 1.5°C warming may result in about 50Gt additional carbon emissions by 2100: this, when the 2-degree carbon budget allows only for 275Gt carbon released from all sources. Current INDCs greatly exceed that budget however, and may double the amount of carbon released from permafrost, necessitating further reductions in the “anthropogenic” carbon budget. Once carbon is released from thawed permafrost, this carbon loss is irreversible on all but geologic time scales. Only the preservation of as much permafrost as possible through lower human carbon emissions can minimize this potentially large amplification of global warming.
BackgroundPermafrost, defined as ground that remains below 0°C for two or more consecutive years, covers nearly 25% of the Northern Hemisphere land area. Permafrost stretches across vast areas of the Arctic, especially Siberia, and occurs in extensive but thinner soil layers of the Tibetan Plateau. In permafrost regions, only the upper layers of soil thaw during summer and then freeze again during winter. Soils underneath this so-called “active layer” remain frozen all year round, sometimes to a depth of more than one thou-sand meters, with their stored carbon remaining stable. The frozen soil in permafrost regions includes organic material with high fractions of carbon. This organic carbon derives primarily from plant inputs accumulated over tens of thou-sands of years. Cold temperatures and wet, saturated soils have protected this organic carbon from decomposition and subsequent release to the atmosphere. However, as the ground thaws, permafrost carbon becomes increasingly available to microbial decomposers.
Permafrost often thaws slowly from the top down in response to warming and other changes in environmen-tal conditions, but abrupt thaw processes such as flood erosion or ground collapse along cliffs can thaw deeper carbon pools up to tens of meters in depth over several years, much faster than would occur as a result of gradual surface thaw. Increasing incidence of wildfires also causes deeper thawing; and the formation of thaw lakes above ice-rich permafrost creates a feedback loop that can exacerbate initial permafrost thaw.
Once permafrost starts thawing, bacterial decompo-sition of organic matter increases, causing the release of carbon dioxide under drier conditions, and both methane and carbon dioxide under saturated conditions, as seen in wetlands, bogs, and many wet tundra soils. While not last-ing as long in the atmosphere as carbon dioxide, methane warms far more potently during its lifetime: 28 times more than carbon dioxide over a 100-year period and approxi-mately 86 times over a 20 year period, leading to faster and more intense atmospheric warming globally.

THRESHOLDS AND CLOSING WINDOWS: RISKS OF IRREVERSIBLE CRYOSPHERE CLIMATE CHANGE
12
Permafrost ThresholdsPermafrost thaw thresholds vary with latitude, soil depth and composition, and landscape and ecosystem character-istics, all of which affect permafrost vulnerability. With rising temperatures, permafrost initially thaws close to the surface, spreading to greater depths as temperatures increase. Geographically, the loss of permafrost at all layers will first occur primarily along the southern edge of its current extent. As the climate warms, this boundary of permafrost thaw is projected to move further northwards and to deeper soil depths.
Warming in the Arctic is occurring at a faster rate than the rest of the planet, in part from regional climate feedbacks such as loss of summer sea ice and the result-ing decrease in albedo. A 2°C higher annual temperature globally may therefore translate into 4–6°C higher seasonal temperatures in the Arctic, leading to much greater perma-frost loss.
In addition to temperature, other factors associated with climate change can alter permafrost stability. Fire frequency and severity, which have been increasing in Arctic tundra and forest ecosystems, remove insulating plant and organic layers, leading to greater permafrost vulnerability for decades following the fire itself. Snow cover duration and depth also are important for per-mafrost because snow insulates it, keeping permafrost
warmer in winter. The duration of Arctic snow cover has decreased over the past decade, which can keep surface permafrost colder. However, for the future some climate models predict increased winter precipitation and deeper snow, which can increase permafrost temperatures. More widespread and taller shrubs in a warming Arctic tundra also will affect permafrost temperatures, because they impact snow depth and shade. The net result of these and many other factors make the exact future of permafrost highly uncertain to predict.
Quite recently, permafrost experts issued a consensus estimate of the amount of carbon that will be released during this century. This consensus was informed by the best available model simulations, field experiments, and long-term measurements. Based on this work, even lower emission levels holding the global mean temperature increase near 1.5°C still means that about 30% of today’s permafrost in the top meter of soil will be lost, resulting in around 50 Gt additional carbon emissions, some of which will occur as methane. Current INDCs, with an increase of 2.7–3.5°C may allow that amount to nearly double by 2100. As warming continues, permafrost will be lost across ever-larger regions, to over 70% of surface permafrost lost by 2100 if global temperature rise exceeds 4.5°C in the highest-emission scenarios, with estimated permafrost carbon emissions between 130–160 Gt.
This consensus estimate is intentionally conservative. Great uncertainty remains, due to a whole host of factors including processes that models still cannot fully take into account, or that remain poorly understood. Some models do show lower ranges, and some permafrost carbon losses will be offset by increased carbon uptake by plants. On the other hand, the above estimates do not encompass poten-tial carbon loss from the thaw of coastal seabed perma frost, which could add substantially to this total and further fuel warming. Regardless, once permafrost thaws and releases its carbon, such permafrost carbon losses are irreversible on all but geological time scales.
RisksIn addition to the climate feedbacks described above, thawing permafrost also threatens infrastructure, with roads, pipelines and houses becoming damaged, some-times permanently as the ground sinks unevenly beneath them. The greatest risk however arises from the additional carbon released, which may radically decrease the carbon budget available to countries to prevent temperatures from rising above 2°C or more.
This additional release of carbon from permafrost has not yet been taken into account by current IPCC carbon budgets, which only allow an additional 275 Gt to be emitted by 2100 to keep increase in global temperature below 2°C with 66% certainty. Even the relatively modest
FIGURE 3-1. Loss of Permafrost at Different Emissions Scenarios
Modeled permafrost loss to-date (purple) and in the future under different emissions scenarios and temperatures. RCP2.6 (green) means a peak temperature of 1.6°C and declining thereafter; RCP4.5 (turquoise) entails a 2100 temperature of 2.4°C; and RCP8.5 means a 2100 tempera-ture of about 4.5°C. Numbers in parentheses indicate CO2 concentrations.
SOURCE: LAWRENCE 2012
CCSM3 (Lawrence and Slater 2005; Lawrence et al.2008a), is that large-scale degradation of near-surfacepermafrost is projected for the twenty-first century, es-pecially under the more severe greenhouse gas emissionscenarios. For RCP 8.5, for example, near-surface per-mafrost extent drops from 12.5 3 106 km2 in the latetwentieth century to only 3.5 3 106 km2 by the end of thetwenty-first century (see Table 3). The less severeemission scenarios show progressively less permafrostdegradation. In RCP2.6, near-surface permafrost extenthas nearly stabilized by 2100 in response to a stabilizingArctic climate.Despite the broad similarities in the results in CCSM3
and CCSM4, there are several important di�erencesbetween the projections in these two versions of themodel. First, there is considerably less variability in near-surface permafrost extent in CCSM4 (cf. oscillations andensemble spread over histor ical period). Interannualvariability in T air and P is similar in the CCSM3 and
CCSM4 historical simulations (within about 10% of eachother), but T soil1m interannual variability is about 35%lower in CCSM4 owing to the damping e�ects of soilorganic matter. Second, the rate of degradation duringthe first half of the twenty-first century is approximately35% slower in CCSM4,which is similar to the 27% slowerdegradation rate seen when organic soil and a deepersoil column were introduced into CLM 3.5 (Lawrenceet al. 2008a). The slower degradation rate in CCSM4means that much less permafrost is degraded by 2050than in CCSM3 (Table 3).Once permafrost begins to thaw in an individual model
grid cell, it often proceeds rapidly under continuedwarming. Lawrence et al. (2008b) showed that active-layer deepening and permafrost thaw in CLM proceedsin a nonlinear fashion even under a linear warmingscenario, with near-surfac e permafrost disappearingquickly once a talik forms (a talik is a layer of perpetuallyunfrozen ground above the permafrost table). Similar
F IG . 6. Time series of Northern Hemisphere near-surface permafrost extent for CCSM3 andCCSM4 for historical and projection periods. Near-surface permafrost extent is the integratedarea of grid cells with at least one soil layer within the top 10 soil layers (3.5 m in CCSM3, 3.8 min CCSM4) that remains frozen throughout the year. Frozen ground underneath glaciers is notincluded in the near-surface permafrost extent. The greenhouse gas concentration in CO 2
equivalents (ppm) for the year 2100 are listed in parentheses for each SRES and RCP scenario.Shading indicates the ensemble spread.
T ABLE 3. Total Northern Hemisphere area containing near-surface permafrost ( 3 106 km2, ensemble mean), or total area containingcontinuous and discontinuous permafrost in the case of the observed estimate for selected periods. Percentage loss relative to 1970–89period is listed in parentheses. Climate bias correction results are italicized, see section 3f.
Model 1870–89 1970–89 2030–49 2080–99 Scenario
6.41–8.11etamitsedevresbOCCSM4 13.6 (14.7) 12.5 (13.5) 9.3 (26%), 11.0 (12%) 8.4 (33%), 10.8 (14%) RCP2.6
9.0 (28%) 6.3 (49%) RCP4.58.1 (35%) 4.8 (62%) RCP6.08.7 (30%), 10.7 (14%) 3.5 (72%), 7.1 (43%) RCP8.5
CCSM3 12.7 11.9 6.9 (42%) 4.6 (61%) SRES B16.5 (45%) 2.7 (77%) SRES A1B6.1 (49%) 2.1 (82%) SRES A2
7.314MLC1.113MLC
1 A PRIL .LATEECNERWAL2102 2215
15
10
5
0
Mill
ions
of k
m2
1850 1900
20thCRCP2.6 (490)RCP4.5 (650)RCP6.0 (850)RCP8.5 (1370)
1950 2000 2050 2100

PERMAfROST: THE fROZEN AMPLIfIER
13
40–50 Gt projected to be released by 2100 should temper-atures reach 1.5°C means that even greater cuts will be required from human activity. Current INDC commitments for the 2020–30 Paris treaty period however will cause global temperatures to rise much higher, to between 2.7–3.5°C already by the end of this century, and close to 4 degrees or more in 2300. This results in an extremely high-risk situa-tion for permafrost, as models show this will lead to much higher temperatures in Arctic and high-altitude permafrost regions, further amplifying permafrost thaw and additional carbon release that fuels warming.
The only means available to minimize this poten-tially monumental amplification of global warming from cryosphere is to keep as much permafrost as possible in its current frozen state. Intensified INDCs, holding global
temperature increases to 1.5 or 2°C, will greatly decrease the amount of new carbon entering the atmosphere from permafrost thaw.
scientific reviewers
Julia Boike, Alfred Wegener Institute
Dave Lawrence, National Center for Atmospheric Research
Susan Natali, Woods Hole Research Center
Brendan Rogers, Woods Hole Research Center
Vladimir Romanovsky, University of Alaska-Fairbanks
Kevin Schaefer, National Snow and Ice Data Center, Univer-sity of Colorado
Seth Spawn, Woods Hole Research Center
FIGURE 3-2. Extent of Permafrost and Stored Permafrost Carbon
Extent of northern hemisphere permafrost, also showing the estimated amount of carbon stored in the top 3 meters, which is the layer most vulnerable to thaw and carbon release. Red and orange indicate very large amounts of stored carbon (50–260 kg per square meter); whereas yellow and blue regions hold far less. (The black dots indicate permafrost sampling sites down to the entire 3 meters; sites that have measured permafrost down to 1 meter however number in the thousands.)
SOURCE: LAWRENCE 2012
down by microbes after thaw as controlled by the energy and nutrientscontained within the organic matter.The inherent range of permafrost carbon decomposability across soil
typesalso intersectswithenvironmental conditions, andaerobicdecomposi-tion is only part of the story for northern ecosystems. While temperaturecontrol over decomposition is implicitwhenconsideringpermafrost thaw,
this region is characterizedbywidespread lakes,wetlands, and soilswater-logged as a result of surface drainage restricted by underlying permafrost.The lack of oxygen in saturated anaerobic soils and sediments presentsanotherkeycontrolover emissions fromnewly thawedpermafrost carbon.Comparingtheresults fromtheaerobicpermafrost soil incubationsynthesis36
with those fromanothercircumpolar synthesisofanaerobicsoil incubations37
0.1–30 kg m –2
30–50 kg m –2
50–100 kg m –2
100–260 kg m –2
Soil organic carbonstorage (0–3 m):
#*
satled revir rojaM
Yedoma largely una�ected by thaw cycles
Region of potential yedoma distribution
Thick sedimentsContinuous permafrost
Discontinuous permafrost
a
b
Figure 1 | Soil organic carbon maps. a, Soil organic carbon pool (kg Cm2 2)contained in the 0–3m depth interval of the northern circumpolar permafrostzone12. Points show �eld site locations for 0–3m depth carbon inventorymeasurements; �eld sites with 1m carbon inventory measurements number inthe thousands and are too numerous to show.b, Deep permafrost carbon pools(. 3m), including the location of major permafrost-a�ected river deltas (greentriangles), the extent of the yedoma region previously used to estimate the
carbon content of these deposits13 (yellow), the current extent of yedoma regionsoils largely una�ected by thaw-lake cycles that alter the original carboncontent17 (red), and the extent of thick sediments overlying bedrock (blackhashed). Yedoma regionsaregenerally also thick sediments. Thebasemap layershows permafrost distribution with continuous regions to the north havingpermafrost everywhere (. 90%), and discontinuous regions further southhaving permafrost in some, but not all, locations (, 90%)96.
REVIEWRESEARCH
G 2015 Macmillan Publishers Limited. All rights reserved9 A P R I L 2 0 1 5 | V O L 5 2 0 | N A T U R E | 1 7 3

THRESHOLDS AND CLOSING WINDOWS: RISKS OF IRREVERSIBLE CRYOSPHERE CLIMATE CHANGE
14
literature
von Deimling, T.S., Grosse, G., Strauss, J., Schirrmeister, L., Morgenstern, A., Schaphoff, S., Meinshausen, M., and Boike, J. (2015). Observation-based modelling of per-mafrost carbon fluxes with accounting for deep carbon deposits and thermokarst activity. Biogeosciences, 12(11), 3469–3488. doi:10.5194/bg-12-3469-2015
Koven, C.D., Lawrence, D.M., and Riley, W.J. (2015). Per-mafrost carbon-climate feedback is sensitive to deep soil carbon decomposability but not deep soil nitrogen dynamics. Proceedings of the National Academy of Sciences USA, 112(12), 3752–3757. doi:10.1073/pnas.1415123112
Lawrence, D.M., Slater, A.G., and Swenson, S.C. (2012). Simulation of Present-day and Future Permafrost and Seasonally Frozen Ground Conditions in CCSM4. Journal of Climate, 25(7), 2207–2225. doi:10.1175/jcli-d-11-00334.1
MacDougall, A.H., Avis, C.A., and Weaver, A.J. (2012). Significant contribution to climate warming from the permafrost carbon feedback. Nature Geoscences, 5(10), 719–721. doi:10.1038/NGEO1573
Schaefer, K., Lantuit, H., Romanovsky, V.E., Schuur, E.A.G., and Witt, R. (2014). The impact of the permafrost carbon feedback on global climate. Envi-ronmental Research Letters, 9, 085003. http://dx.doi.org/10.1088/1748-9326/9/8/085003
Schaefer, K., Lantuit, H., Romanovsky, V.E., and Schuur, E.A.G. (2012). Policy Implementations of Warming Perma-frost, United Nations Environment Programme (UNEP), Nairobi, Kenya, 30 p.
Schaefer, K., Zhang, T., Bruhwiler, L., and Barrett, A.P. (2011). Amount and timing of permafrost carbon release in response to climate warming. Tellus Series B-Chemical and Physical Meteorology, 63(2), 165–180. doi:10.1111/j.1600-0889.2011.00527.x
Schuur, E.A.G., McGuire, A.D., Schädel, Grosse, G., Harden, J.W., Hayes, D.J., Hugelius, G., Koven, C.D., Kuhry, P., Lawrence, D.M., Natali, S.M., Olefeldt, D., Romanovsky, V.E., Schaefer, K., Turetsky, M.R., Treat, C.C., and Vonk, J.E. (2015). Climate change and the permafrost carbon feedback. Nature, 520, 171–179. doi:10.1038/nature14338
Schuur, E.A.G., Abbott, B.W., Bowden, W.B., Brovkin, V., Camill, P., Canadell, J.P., Chanton, J.P., Chapin III, F.S., Christensen, T.R., Ciais, P., Crill, P.M., Crosby, B.T., Czim-czik, C.I., Grosse, G., Harden, J., Hayes, D.J., Hugelius, G., Jastrow, J.D., Jones, J.B., Kleinen, T., Koven, C.D., Krinner, G., Kuhry, P., Lawrence, D.M., McGuire, A.D., Natali, S.M., O’Donnell, J.A., Ping, C.L., Riley, W.J., Rinke, A., Romanovsky, V.E., Sannel, A.B.K., Schädel, C., Schaefer, K., Sky, J., Subin, Z.M., Tarnocai, C., Turetsky, M., Waldrop, M., Walter-Anthony, K.M., Wickland, K.P., Wilson, C.J., and Zimov, S.A. (2013). Expert assessment of potential permafrost carbon feedbacks to climate change. Climatic Change, 119, 359–374. doi:10.1007/s10584-013-0730-7
Zhuang, Q., Melillo, J.M., Sarofim, M.C., Kicklighter, D.W., McGuire, A.D., Felzer, B.S., Sokolov, A., Prinn, R.G., Steudler, P.A., and Hu, S. (2006). CO2 and CH4 exchanges between land ecosystems and the atmosphere in northern high latitudes over the 21st century. Geophysical Research Letters, 33(17), L17403. doi:10.1029/2006GL026972

15
CHAPTER 4Arctic Sea IceT H E G L O B E ’ S FA I L I N G N AT U R A L R E F R I G E R ATO R
summary Arctic summer sea ice has undergone especially rapid decline since 2000. When the polar sun sets in September, the amount of ice that survives the summer today is only about one-half of that which existed in 1950, and far thinner and more fragile. This decline is both a result and a cause of overall Arctic and global warming, because the open water absorbs much more heat than ice does, since ice reflects more of the sun’s rays. More absorbed heat leads to measurably warmer Arctic autumn seasons. The character of Arctic sea ice already has changed fundamentally with the loss of extremely thick, older (4–5 year) ice that covered most of the Arctic Ocean just a few decades ago; instead today, over half is first-year ice. At current INDCs, with temperatures approaching 3°C above pre-industrial, the Arctic Ocean will behave more like an inland high north lake, losing all ice in summer and regaining a new cover in winter that melts rapidly each spring. On the other hand, unlike the other thresholds, this loss of thicker and older, year-round ice cover is reversible on timescales of decades to a few hundred years should temperatures return to pre-industrial, assuming no major changes in ocean circulation; although some of the impacts arising from this reduction in albedo (reflectivity), such as loss of permafrost, are not.
BackgroundArctic sea ice serves as an important regulator of temperature in the northern hemisphere, acting as a “global refrigerator” because this large area of ice-covered ocean – the size of the U.S. and Russia combined – reflects most of the sun’s rays back into space during the entire 6-month polar summer “day,” cooling the planet. It has served this role in the cli-mate system almost continuously for over 200,000 years.
The extent of Arctic sea ice that survives the entire summer has however declined by 35% since 1972, when reliable satellite measurements became available. In con-trast to reflective ice (high albedo), the darker ocean water (low albedo) absorbs heat, amplifying Arctic and overall global warming. In addition, whereas until quite recently most of the sea ice in the Arctic was comprised of very thick multi-year ice with an average lifetime of 4–5 years and with an average winter thickness of 3 meters or more, today’s ice is mostly new ice formed the previous winter, and often thinner than 2 meters. The total volume of Arctic sea ice has therefore declined by even more than its area extent.
This extreme recent loss of summer sea ice is one of the causes of “Arctic amplification," which refers to the greater rise in temperature that has been observed in the
high latitudes of the northern hemisphere compared to the rest of the globe. It also carries significant weather, ecolog-ical, and economic consequences. These include loss of livelihood for indigenous cultures dependent on stable sea ice for hunting and fishing; possible influences on the jet stream, which in turn influences mid-latitude weather sys-tems as exemplified by the extreme cold or warm periods in recent years that can be related to a more “wobbly” jet stream and less stable polar front zones; and ecosystem loss, especially with marine species that have evolved with an ice “ceiling” much of the year, and those that depend on them in the food chain.
Sea Ice ThresholdsSummer Arctic sea ice extent increasingly has been seen as a bellwether of climate change, with great attention to the September minimum each year. In reality however, the consensus of sea ice scientists is that the nature of the Arctic Ocean ice cover already has fundamentally changed and crossed a threshold to a new state. Thinner and younger ice has replaced much of the multi-year ice that circulated several years around the North Pole, before being discharged south along Greenland through the Fram

THRESHOLDS AND CLOSING WINDOWS: RISKS OF IRREVERSIBLE CRYOSPHERE CLIMATE CHANGE
16
Strait. This “ecosystem of ice” no longer exists. Instead, more than half of Arctic sea ice now consists of first-year ice that largely melts each summer, and with the “older” ice existing on average for only 2–3 years.
Despite this fundamental change already at today’s temperatures, public focus remains on when the first ice-free summer will occur: something which the Arctic likely has not experienced since at least the Holocene spike in warming after the last Ice Age 8,000 years ago and possi-bly not since the warm Eemian period 125,000 years ago, which today’s temperatures almost equal (and when sea-level was 4–6 meters (13–20 feet) higher than today. Like many climate change impacts, Arctic sea ice loss over the past three decades has not occurred gradually, but some-times in abrupt loss events when combinations of wind, as well as warmer temperatures pressed extent lower. Ice recovery in subsequent years then tends to stay closer to the new lower summer minimum, until the next sudden drop. Such loss events have for example occurred in 1990, 2007 and 2012. It is likely that complete loss of summer sea ice (defined as dipping below 1 million square kilometers in area) will occur with such a sudden event, then perhaps not occur again for several years; until total-loss summers become more frequent and (if temperatures continue to rise) by the end of this century, become the norm for some portion of each summer.
The occurrence of the first ice-free summer is therefore very unpredictable, but most scientists are fairly confident one could occur before 2040 given current temperature pathways. Modeling work by a number of groups indicates
that ice-free summers will become the norm in the Arctic with high probability as global mean temperatures approach 3 degrees. Current INDCs show temperatures reaching this level by 2100. In a world at 3 degrees or above, ice-free sum-mers are virtually certain. Because of the total darkness of the Arctic winter, winter sea ice will still form at such levels of warming, but even winter sea ice will decrease until its complete loss, should temperatures continue to rise.
Unlike the other threshold risks noted in this report, Arctic summer sea ice loss most likely is reversible should temperatures return to pre-industrial, although stored warming within global oceans may delay this from occur-ring for some period of time even at lower atmospheric temperatures, depending on peak ocean temperatures. Should temperatures stabilize at 2 degrees, summer sea ice extent likely will stabilize at a lower average summer minimum of around 2.5 million km2; at 1.5 degrees, it may recover to close to today’s levels of around 4 million km2.
RisksThe global impact of complete summer sea ice loss is likely to further accelerate global warming and its impacts. Given the greater absorption of solar heat from open water, it will lead to higher fall and winter temperatures in the Arctic as well as potentially affecting the weather patterns of the middle latitudes of the northern hemisphere, accelerating other dynamics in this report such as permafrost loss and especially, melting on the margins of Greenland and from Arctic land glaciers. This would lead to greater release of
FIGURE 4-1. Arctic Minimum Sea Ice Extent, 1850–Present
Extent of Arctic sea ice at the lowest point each summer, which occurs in September. Observational estimates (blue – ship, plane) until satellite observations began in 1979 (red).
SOURCE: J. STROEVE, NSIDC
12
10
8
6
4
2
0
Exte
nt (m
illio
n sq
km
)
Year
1840 1860 1880 1900 1920 1940 1960 1980 2000 2020

ARCTIC SEA ICE: THE GLOBE'S fAILING NATURAL REfRIGERATOR
17
greenhouse gases from permafrost, and higher sea-level rise. The scale of such impacts is highly unpredictable, as the Arctic has never been ice-free in modern human existence.
Finally, while some Arctic governments declare that an ice-free summer Arctic will bring economic opportunity, it is important to qualify such statements with the global impacts elsewhere. In other words, the 2.5–3°C above pre-industrial that creates the ice-free conditions that will allow exploitation of Arctic resources, will also lead to the risks and societal disruptions noted elsewhere in this report, such as 4–10 meters committed long-term sea-level rise and risk of fisheries damage from acidification. Such adverse impacts almost certainly will eclipse temporary economic benefits brought by an ice-free summer Arctic, even among Arctic states and those moving to invest there.
scientific reviewers
Ronald Kwok, NASA Jet Propulsion Laboratory, AR5 Lead Author
Walt Meier, NASA Goddard Space Flight Center
Dirk Notz, Max Planck Institute for Meteorology
Julienne Stroeve, National Snow and Ice Data Center/University College London
literature
Holland, M., Blitz, C.M., and Tremblay, B. (2006). Future abrupt reductions in the summer Arctic sea ice. Geophysical Research Letters, 33, L23503. doi: 10.1029/2006GL028024
Notz, D., and Marotzke, J. (2012). Observations reveal exter-nal driver for Arctic sea-ice retreat. Geophysical Research Letters, 39(8), L08502. doi:10.1029/2012GL051094
Overland, J.E., and Wang, M. (2013). When will the summer Arctic be nearly sea ice free? Geophysical Research Letters , 40 (10), 2097–2101. doi: 10.1002/grl.50316
Stroeve, J.C., Kattsov, V., Barrett, A., Serreze, M., Pavlova, T., Holland, M., and Meier, W.N. (2012). Trends in Arctic sea ice extent from CMIP5, CMIP3 and observations. Geophysical Research Letters, 39, L16502. doi: 10.1029/2012GL052676
Tang, Q., Zhang, X., and Francis, J.A. (2013). Extreme summer weather in northern mid-latitudes linked to a vanishing cryosphere. Nature Climate Change, 4, 45–50.
Wagner, T.J.W., and Eisenman, I. (2015). How Climate Model Complexity Influences Sea Ice Stability. Journal of Cli-mate, 28, 3998–4014. doi: 10.1175/JCLI-D-14-00654.1
FIGURE 4-2. Decrease in Arctic Ocean Multi-year Ice
Amount of multi-year ice from 2000–2015. Blue is the lowest percentage of multi-year ice; red, the highest. By 2015, very thick multi-year ice had decreased to about 15–20%.
SOURCE: R. kWOk, NASA JET PROPULSION LABORATORy
1000
2000
3000
4000
5000
1999 2001 2003 2005 2007 2009 2011 2015
Year
Are
a (1
03
km
2 )
Jan -1 fields
QuikSCAT ASCAT
00 02 04 06
08 10
01 03 05
07 09
MY fraction0.0 1.0
MY fraction
11
12 14
13
15
2013

18
CHAPTER 5Polar Ocean AcidificationL O S S O F R E S O U RC E S F RO M T H E “ OT H E R ” C O2 P RO B L E M
summary Although technically not “cryosphere” (which is frozen water), the Arctic Ocean and the Southern Ocean around Antarctica make up some of the world’s richest fisheries, with diverse marine ecosystems. These cold waters are however highly vulnerable to ocean acidification from increased carbon dioxide (CO2) in the atmosphere. We already are crossing important ocean acidification thresholds in these regions, with early impacts possibly observed on some polar ocean species. There is substantial risk that ocean acidification will damage ecosystems and weaken the food chain in these important resource waters, even should countries meet the stated 2 degree goal, which entails atmospheric CO2 levels peaking at 450ppm. However, CO2 concentrations associated with current INDCs in the 2.7–3.5 degree range are far higher still, anticipated to peak potentially above 600ppm. At such high levels, and because of the very long time scales required for acidity to decrease, there is high risk for irreversible impacts on biodiversity in the Arctic and Southern oceans, with consequences for polar and near-polar fisheries and human activities.
BackgroundIncreasing CO2 concentrations lead not only to climate change, but also to acidification of the world’s oceans. In addition to providing valuable food and other resources, the ocean provides a vital but less visible service to human society and the global climate system by currently absorb-ing approximately one-fourth of all anthropogenic CO2 released into the atmosphere. This has substantially lim-ited climate change thus far despite increases in human carbon emissions. However, this carbon absorption is not without consequences. When dissolved into seawater, carbon dioxide forms carbonic acid: increasing the acidity of seawater, a phenomenon known as ocean acidification.
This uptake of carbon dioxide has increased the acidity of the ocean by 30% since the beginning of the Industrial Revolution, fundamentally changing ocean chemistry. As CO2 is absorbed in the water, it forms carbonic acid. Under stable conditions, this acid can be buffered (neutralized) by carbonate ions. However, if acidity increases rapidly, this buffering capacity is unable to keep up, leading to growing corrosive conditions. Carbonate ions also are used by shell-building organisms to grow and maintain their skeletons. If the amount of available carbonate decreases, so does the ability to build shells; at the same time, more
corrosive conditions can cause shells to dissolve, in a kind of one-two punch from more acidic conditions.
Ocean pH levels have been relatively stable over at least the past several million years, and marine life, including that of the polar oceans, has evolved to live in this relatively narrow band of ocean chemistry. Although organisms have weathered changes equivalent to those of the past century, such past changes have taken many thou-sands of years to occur. The speed of today’s acidification is therefore a key aspect of its threat to marine ecosystems and resources.
The rate of acidification varies regionally and is faster in polar regions, which are particularly sensitive to ocean acidification. This greater sensitivity is because cold polar water takes up CO2 more readily and has a lower salt con-tent from more freshwater entering from melting sea and land ice. Water concentrations of CO2 (called pCO2) most often are about the same as in the atmosphere, which is around 400ppm today. But in some Southern Ocean waters already higher in CO2 due to the cited factors, pCO2 levels of 525 have been found, with a pH of 7.9, compared to 8.1 globally. The higher pCO2 is thought to result in part from anthropogenic emissions.
As a consequence, ocean acidification will have earlier and greater impacts on polar ecosystems and organisms;
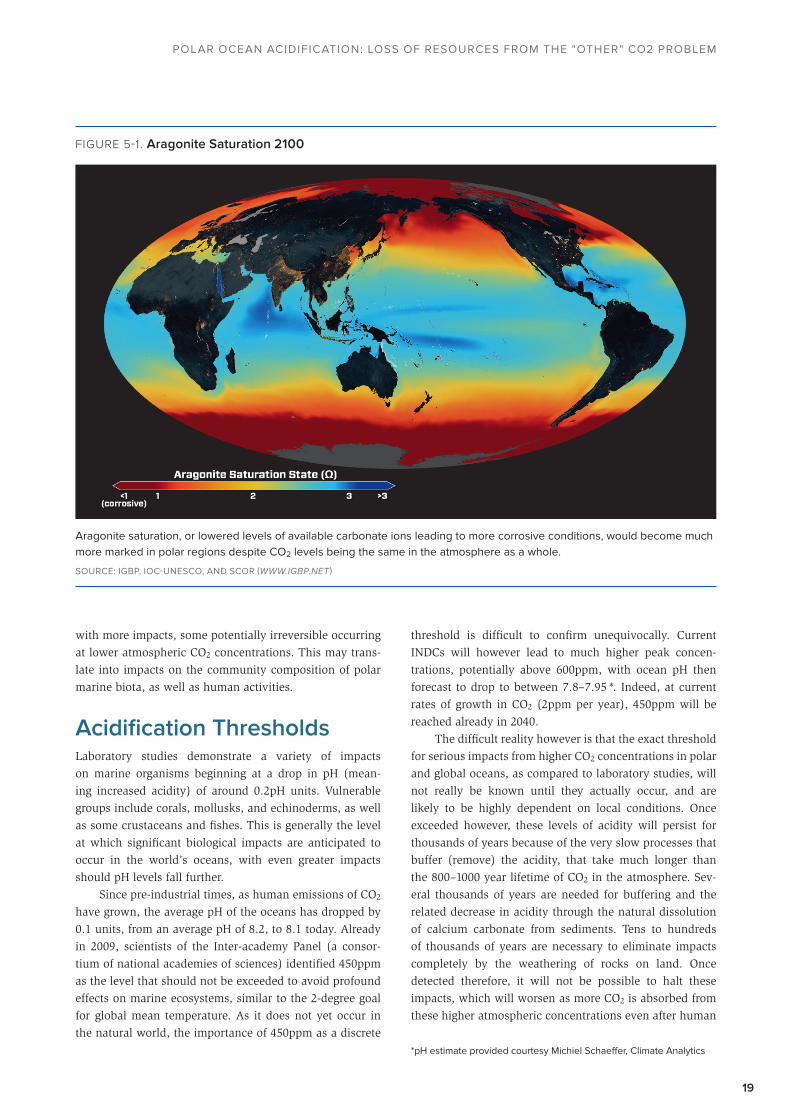
POLAR OCEAN ACIDIfICATION: LOSS Of RESOURCES fROM THE "OTHER" CO2 PROBLEM
19
with more impacts, some potentially irreversible occurring at lower atmospheric CO2 concentrations. This may trans-late into impacts on the community composition of polar marine biota, as well as human activities.
Acidification ThresholdsLaboratory studies demonstrate a variety of impacts on marine organisms beginning at a drop in pH (mean-ing increased acidity) of around 0.2pH units. Vulnerable groups include corals, mollusks, and echinoderms, as well as some crustaceans and fishes. This is generally the level at which significant biological impacts are anticipated to occur in the world’s oceans, with even greater impacts should pH levels fall further.
Since pre-industrial times, as human emissions of CO2 have grown, the average pH of the oceans has dropped by 0.1 units, from an average pH of 8.2, to 8.1 today. Already in 2009, scientists of the Inter-academy Panel (a consor-tium of national academies of sciences) identified 450ppm as the level that should not be exceeded to avoid profound effects on marine ecosystems, similar to the 2-degree goal for global mean temperature. As it does not yet occur in the natural world, the importance of 450ppm as a discrete
threshold is difficult to confirm unequivocally. Current INDCs will however lead to much higher peak concen-trations, potentially above 600ppm, with ocean pH then forecast to drop to between 7.8–7.95 *. Indeed, at current rates of growth in CO2 (2ppm per year), 450ppm will be reached already in 2040.
The difficult reality however is that the exact threshold for serious impacts from higher CO2 concentrations in polar and global oceans, as compared to laboratory studies, will not really be known until they actually occur, and are likely to be highly dependent on local conditions. Once exceeded however, these levels of acidity will persist for thousands of years because of the very slow processes that buffer (remove) the acidity, that take much longer than the 800–1000 year lifetime of CO2 in the atmosphere. Sev-eral thousands of years are needed for buffering and the related decrease in acidity through the natural dissolution of calcium carbonate from sediments. Tens to hundreds of thousands of years are necessary to eliminate impacts completely by the weathering of rocks on land. Once detected therefore, it will not be possible to halt these impacts, which will worsen as more CO2 is absorbed from these higher atmospheric concentrations even after human
*pH estimate provided courtesy Michiel Schaeffer, Climate Analytics
FIGURE 5-1. Aragonite Saturation 2100
Aragonite saturation, or lowered levels of available carbonate ions leading to more corrosive conditions, would become much more marked in polar regions despite CO2 levels being the same in the atmosphere as a whole.
SOURCE: IGBP, IOC-UNESCO, AND SCOR (WWW.IGBP.NET )

THRESHOLDS AND CLOSING WINDOWS: RISKS OF IRREVERSIBLE CRYOSPHERE CLIMATE CHANGE
20
emissions cease. Additional stresses to ocean ecosystems will also occur from warming water, especially to coral reefs. From the geologic fossil record, all indications point to highly serious, irreversible impacts from the forecast INDC levels.
Because of their greater sensitivity, polar oceans already are nearing what seem to be critical ocean acidifi-cation chemical thresholds, with some Arctic seas already becoming seasonally under-saturated and corrosive to the calcium carbonate needed to build shells. Recent observa-tional studies concluded that Arctic surface waters of the Chukchi and Beaufort seas could reach levels of acidity that threaten the ability of animals such as tiny sea snails (pteropods) to build and maintain their shells by 2030, with the Bering Sea reaching this level of acidity by 2044. Large regions of polar surface waters are expected to become sea-sonally under-saturated within the next two decades.
Such impacts are not unique to polar ecosystems, but due to their more sensitive nature as described above, appear to be occurring there first: risking essentially irre-versible changes to polar ecosystems and fisheries, but spreading elsewhere in global oceans as CO2 levels rise.
RisksThe first impacts of ocean acidification, at global CO2 levels of 400ppm, appear already visible today in some polar marine organisms. Shelled pteropods, tiny planktonic snails at the base of the food chain, captured from polar waters that locally had a naturally high CO2 due to other local processes, have begun to show greater levels of shell damage that appear consistent with anthropogenic ocean acidification. Pteropods may not be able to survive in some rapidly acidifying polar waters under projected conditions already by 2050 at current INDCs, with a projected total 0.2pH decrease from pre-industrial possible by that time. By 2100, an additional 0.1–0.2pH fall is projected, as well as lower aragonite saturation levels (fewer carbonate ions for shell-building and to buffer absorbed CO2) especially in polar regions (Figure 5-1). Pteropods are consumed by commercially important species such as pink salmon, and their loss might have significant consequences for the marine food web.
The current rate of ocean acidification is unprece-dented within the last 65 million years. Documented mass extinctions in Earth history have occurred during much slower rates of ocean acidification; and there is no doubt that intense acidification can have severe impacts for a range of marine organisms, from the smallest plankton to the largest fish, with severe ecological consequences for polar ecosystems, seafood and other ocean services. The first cautious observations of seasonal thinning of shells may be an indication that today’s carbon dioxide concen-trations already represent a significant threat; and unlike
conventional water pollution, acidification takes many thousands of years to reverse after CO2 emissions cease. With anticipated CO2 concentrations potentially exceeding 600ppm, current INDCs are not sufficient to constrain this risk to vital polar and global ocean resources.
scientific reviewers
Nina Bednarsek, National Oceanic and Atmospheric Administration
Richard Bellerby, East China Normal University/Norwegian Institute for Water Research
Sam Dupont, University of Gothenburg
Richard Feely, National Oceanic and Atmospheric Adminis-tration, AR5 Lead Author
Helen Findlay, Plymouth National Marine Laboratory
literature
AMAP. (2013). AMAP Assessment 2013: Arctic Ocean Acid-ification. Arctic Monitoring and Assessment Programme (AMAP), Oslo, Norway. viii + 99 pp.
Baumann, H., Talmage, S.C., and Gobler, C.J. (2012). Reduced early life growth and survival in a fish in direct response to increased carbon dioxide. Nature Climate Change, 2, 38–41.
Bednaršek, N., Tarling, G.A., Bakker, D.C.E., Fielding, S., and Feely, R.A. (2014). Dissolution Dominating Calcifi-cation Process in Polar Pteropods Close to the Point of Aragonite Undersaturation. PLoS ONE, 9(10), e109183. doi:10.1371/journal.pone.0109183
Bednaršek, N., Feely, R.A., Reum, J.C.P., Peterson, B., Menkel, J., Alin, S.R., and Hales, B. (2014). Limacina heli-cina shell dissolution as an indicator of declining habitat suitability owing to ocean acidification in the California Current Ecosystem. Proceedings of the Royal Society B, 281(1785), 20140123. doi: 10.1098/rspb.2014.0123
Bednaršek, N., Tarling, G.A., Bakker, D.C.E., Fielding, S., Jones, E.M., Venables, H.J., Ward, P., Kuzirian, A., Lézé, B., Feely, R.A., and Murphy, E.J. (2012). Extensive disso-lution of live pteropods in the Southern Ocean. Nature Geoscience, 5, 881–885 (2012).
Cummings, V., Hewitt, J., Van Rooyen, A., Currie, K., Beard, S., Thrush, S., Norkko, J., Barr, N., Heath, P., Halliday, N.J., Sedcole, R., Gomez, A., McGraw, C., and Metcalf, V. (2011). Ocean Acidification at High Latitudes: Potential Effects on Functioning of the Antarctic Bivalve Laternula Elliptica. PLoS ONE, 6(1), e16069. doi: 10.1371/journal.pone.0016069
Dupont, S., and Pörtner, H. (2013). Marine science: Get ready for ocean acidification. Nature, 498, 429. doi:10.1038/ 498429a
POLAR OCEAN ACIDIfICATION: LOSS Of RESOURCES fROM THE "OTHER" CO2 PROBLEM
21
Dupont, S., Havenhand, J., Thorndyke, W., Peck, L., and Thorndyke, M. (2008). Near-future level of CO2-driven acidification radically affects larval survival and devel-opment on the brittlestar Ophiothrix fragilis. Marine Ecology Progress Series, 373, 285–294. doi: 10.3354/meps07800
Gattuso, J.P., Magnan, A., Billé, R., Cheung, W.W.L., Howes, E.L., Joos, F., Allemand, D., Bopp, L., Cooley, S.R., Eakin, C.M., Hoegh-Guldberg, O., Kelly, R.P., Pörtner H.O., Rogers, A.D., Baxter, J.M., Laffoley, D., Osborn, D., Rank-ovic, A., Rochette, J., Sumaila, U.R., Treyer, S., and Turley, C. (2015). Contrasting futures for ocean and society from different anthropogenic CO2 emissions scenarios. Science, 349 (6243). doi: 10.1126/science.aac4722
Hauri, C., Friedrich, T., and Timmermann, A. (2015). Abrupt onset and prolongation of aragonite undersaturation events in the Southern Ocean, Nature Climate Change, doi:10.1038/nclimate2844
IAP Statement on Ocean Acidification. (2009). See: http://www.interacademies.net/File.aspx?id=9075
IPCC. (2014). Climate Change 2014: Impacts, Adaptation, and Vulnerability. Part A: Global and Sectoral Aspects. Contribution of Working Group II to the Fifth Assessment Report of the Intergovernmental Panel on Climate Change. Edited by Field, C.B., V.R. Barros, D.J. Dokken, K.J. Mach, M.D. Mastrandrea, T.E. Bilir, M. Chatterjee, K.L. Ebi, Y.O. Estrada, R.C. Genova, B. Girma, E.S. Kissel, A.N. Levy, S. MacCracken, P.R. Mastrandrea, and L.L.
White. Cambridge University Press, Cambridge, United Kingdom and New York, NY, USA, 1132 pp.
IPCC. (2014). Climate Change 2014: Impacts, Adaptation, and Vulnerability. Part B: Regional Aspects. Contribution of Working Group II to the Fifth Assessment Report of the Intergovernmental Panel on Climate Change. Edited by Barros, V.R., C.B. Field, D.J. Dokken, M.D. Mastran-drea, K.J. Mach, T.E. Bilir, M. Chatterjee, K.L. Ebi, Y.O. Estrada, R.C. Genova, B. Girma, E.S. Kissel, A.N. Levy, S. MacCracken, P.R. Mastrandrea, and L.L. White. Cam-bridge University Press, Cambridge, United Kingdom and New York, NY, USA, 688 pp.
Mathis, J.T., Cross, J.N., Evans, W., and Doney, S.C. (2015). Ocean acidification in the surface waters of the Pacif-ic-Arctic boundary regions. Oceanography, 28(2), 122–135. http://dx.doi.org/10.5670/oceanog.2015.36
McNeil, B.I., and Matear, R.J. (2008). Southern Ocean acid-ification: A tipping point at 450-ppm atmospheric CO2. Proceedings of the National Academy of Sciences USA, 105(48), 18860–18864. doi:10.1073/pnas.0806318105
Riebesell, U., and Gattuso, J.P. (2015). Lessons learned from ocean acidification research. Nature Climate Change, 5, 12–14.
Wittmann, A.C., and Pörtner, H.O. (2013). Sensitivities of extant animal taxa to ocean acidification. Nature Climate Change, 3, 995–1001.


Policy makers and the general public alike now largely accept that the Arctic, Antarctica and many mountain regions already have warmed two to three times faster than the rest of the planet. What is less understood, outside the scientific community, is that the very nature of the cryosphere – regions of snow and ice – carries dynamics that once triggered, cannot be reversed, even with a return to lower temperatures or CO2 levels. Thresholds and Closing Windows: Risks of Irreversible Cryosphere Climate Change seeks to convey a message from IPCC AR5 and research since: that at current commitment levels or INDCs, humanity faces very high risk of crossing certain irreversible thresholds in its cryosphere regions – setting into motion changes that cannot be stopped or reversed, in most cases short of a new Ice Age, and sometimes not even then. The only way to prevent these dynamics from occurring is to make sure temperatures never rise that high.
International Cryosphere Climate Initiative
www.iccinet.org