Perceptual Thresholds for Acoustical Guitar Models
13
HAL Id: hal-01461755 https://hal.archives-ouvertes.fr/hal-01461755 Submitted on 1 Sep 2021 HAL is a multi-disciplinary open access archive for the deposit and dissemination of sci- entific research documents, whether they are pub- lished or not. The documents may come from teaching and research institutions in France or abroad, or from public or private research centers. L’archive ouverte pluridisciplinaire HAL, est destinée au dépôt et à la diffusion de documents scientifiques de niveau recherche, publiés ou non, émanant des établissements d’enseignement et de recherche français ou étrangers, des laboratoires publics ou privés. Distributed under a Creative Commons Attribution| 4.0 International License Perceptual Thresholds for Acoustical Guitar Models J. Woodhouse, E. K. y. Manuel, L. A. Smith, A. J. C. Wheble, Claudia Fritz To cite this version: J. Woodhouse, E. K. y. Manuel, L. A. Smith, A. J. C. Wheble, Claudia Fritz. Perceptual Thresholds for Acoustical Guitar Models. Acta Acustica united with Acustica, Hirzel Verlag, 2012, 98 (3), pp.475- 486. 10.3813/AAA.918531. hal-01461755
-
Upload
khangminh22 -
Category
Documents
-
view
0 -
download
0
Transcript of Perceptual Thresholds for Acoustical Guitar Models
HAL Id hal-01461755httpshalarchives-ouvertesfrhal-01461755
Submitted on 1 Sep 2021
HAL is a multi-disciplinary open accessarchive for the deposit and dissemination of sci-entific research documents whether they are pub-lished or not The documents may come fromteaching and research institutions in France orabroad or from public or private research centers
Lrsquoarchive ouverte pluridisciplinaire HAL estdestineacutee au deacutepocirct et agrave la diffusion de documentsscientifiques de niveau recherche publieacutes ou noneacutemanant des eacutetablissements drsquoenseignement et derecherche franccedilais ou eacutetrangers des laboratoirespublics ou priveacutes
Distributed under a Creative Commons Attribution| 40 International License
Perceptual Thresholds for Acoustical Guitar ModelsJ Woodhouse E K y Manuel L A Smith A J C Wheble Claudia Fritz
To cite this versionJ Woodhouse E K y Manuel L A Smith A J C Wheble Claudia Fritz Perceptual Thresholdsfor Acoustical Guitar Models Acta Acustica united with Acustica Hirzel Verlag 2012 98 (3) pp475-486 103813AAA918531 hal-01461755
Perceptual Thresholds for Acoustical Guitar
Models
J Woodhouse1) E K Y Manuel1) L A Smith1) A J C Wheble1) C Fritz2)
1) Cambridge University Engineering Department Trumpington St Cambridge CB2 1PZ UK jw12camacuk2) LAM Institut Jean le Rond drsquoAlembert UMR 7190 CNRS UPMC Univ Paris 06 11 rue de Lourmel Paris
France
Summary
Synthesised acoustic guitar sounds based on a d etailed physical model are used to provide input for psycho-acoustical testing
Thresholds of perception are found for changes in the main parameters of the model Using a three-alternative forced-choice
procedure just-noticeable differences are presented for changes in frequency a nd damping of the modes of the guitar body a nd also
for changes in the tension bending stiffness and damping parameters of the strings These are compared with measured data on the
range of variation of these parameters in a s election of guitars
1 Introduction
Assessments of the quality of musical instruments can be
influenced by many factors including appearance and er-
gonomic considerations but the final judgement will pre-
sumably always relate to some extent to perceived quality
of sound Instrument makers want to know how to link
particular changes in physical structure to their effect on
perceived sound so that they can control and improve the
quality of their instruments A useful first step in mapping
out these links which lends itself to relatively uncontro-
versial psychoacoustical testing is to establish the small-
est change of each structural parameter that produces an
audible effect under the most favourable listening condi-
tions A comprehensive set of such just-noticeable differ-
ences (JNDs) would give information about the relative
sensitivity of the sound to the different parameters under
the control of an instrument maker without the compli-
cations of trying to describe the nature of the changes in
sound Such descriptions are important of course but they
require different methods to study them and can raise more
difficult challenges in experimental methodology This pa-
per concentrates on the first stage finding JNDs
A recent research project [1] has investigated some
JNDs for violin acoustics While that work was going on
a series of undergraduate projects was used to perform a
parallel investigation of the acoustical guitar using similar
psychoacoustical methodology This paper summarises the
main findings of those projects As well as psychoacous-
tical results measurements on a variety of guitars will be
presented to provide information about the actual range of
variation in the parameters investigated
In one important respect the guitar is very different from
the violin In the violin the player can produce a sustained
sound by feeding energy into the vibrating string from the
bow This involves nonlinear interactions (from the fric-
tion force at the bow-string contact see eg [2]) that make
theoretical modelling difficult and it also means that the
player can influence the details of the sound of each note
throughout its duration The guitar is quite different the
instrument is to a good approximation a linear vibrat-
ing system The player starts a particular note with control
over the details of the pluck but once the string has been
released the subsequent sound is not under the playerrsquos
control (This study excludes any use of vibrato)
This distinction leads to a difference in the way that
sounds for psychoacoustical testing can most usefully be
generated For the violin it is remarkably hard to synthe-
sise sound that is convincingly realistic because of the all-
pervading influence of the human performer Instead a hy-
brid strategy was adopted for the psychoacoustical tests
in which real playing was combined with digital-filter em-
ulation of the vibration response of the violin body The
fluctuating force exerted by a vibrating string on the violin
bridge during normal playing was measured with an em-
bedded piezoelectric sensor and recorded It was argued
that to a useful first approximation a given bow gesture
on a given string will produce essentially the same force
waveform regardless of the acoustical response of the par-
ticular violin body For example during a steady note the
player will ensure that the string vibrates in Helmholtz mo-
tion producing a sawtooth force waveform at the bridge
with relatively subtle modifications due to the bowing po-
sition and force and the string parameters such as damping
and bending stiffness [2]
It was thus argued that the main effects of a particu-
lar violin body on the perceived sound should arise from
1
the filtering of this bridge-force signal by the linear vi-
bration response and sound radiation characteristics of the
violin Linear vibration response can be analysed into a
sum of modal contributions and can then relatively easily
be emulated by a suitable digital filter So for example
to investigate the JND for a shift in frequency of one par-
ticular vibration mode of the body a series of sound files
could be generated using the same recorded bridge force
signal modified by a range of digital filters initially cal-
ibrated against a particular violin body but with the one
desired mode frequency systematically altered The use of
recorded bridge-force signal from a human performer gets
around the problem of realism without giving the player
any opportunity to alter their bowing in response to the pa-
rameter being varied because the same input signal is used
in every case
For the guitar this approach will not work convincingly
Part of the sound quality of a guitar note comes from the
frequency-dependent decay rates of the different overtone
components of the sound These are determined by inter-
action of the string and the guitar body through the cou-
pling at the bridge The vibration response of a guitar body
could be emulated by digital filter just as easily as a violin
body but if the hybrid approach were to be used for the
guitar the mechanical coupling of string to body would
be missing and it is likely that a crucial part of the influ-
ence of the body acoustics on the sound would be lost
Luckily the issue of non-realism of synthesised sound is
much less challenging for the guitar A synthesis model
for guitar notes based on a detailed physical model has
been described previously [3 4] and this has been found
to produce quite plausible sounds Indeed several partici-
pants in the studies to be described here expressed surprise
when told that they were hearing synthesised sounds In
consequence the JND studies for guitars were carried out
entirely using synthesised sounds
There is very little existing literature that is directly rel-
evant to this study While a lot has been written about the
vibration and sound radiation characteristics of guitar bod-
ies published psychoacoustical studies based on the mod-
elling are very rare the only example seems to be the doc-
toral work of Wright [5] There is however some litera-
ture relating to guitar strings specifically to the perception
of inharmonicity associated with bending stiffness Two
separate studies have been published by Jaumlrvelaumlinen and
co-workers [6 7] using synthesised sounds of differing de-
grees of realism to obtain thresholds for discrimination be-
tween harmonic and inharmonic sounds They found that
thresholds for highly idealised sounds were lower than for
more realistic sounds including the initial transient of a
guitar pluck presumably because of some degree of infor-
mational masking in the more complex sounds
The outline of this paper is as follows The synthesis
model is briefly described and the parameters to be ex-
plored in JND studies are defined The technical details
of the psychoacoustical test procedure are then given fol-
lowed by the acoustical test methods for establishing phys-
ical parameter values for the guitar body and for the strings
investigated Results are then presented first for the prop-
erties of the guitar body Several tests will be presented in
which modal frequencies are shifted all together or con-
fined to particular frequency bands The influence of the
choice of musical passage for the test stimulus is also dis-
cussed After this a more restricted study was undertaken
in which the modal damping factors were scaled The final
section of test results concerns properties of the strings
especially the damping properties These results will be
related to the perception of ldquonewrdquo versus ldquooldrdquo strings by
a change in their characteristic sound in the light of mea-
surements of what actually changes as steel-cored guitar
strings age
2 Outline of synthesis model
The synthesis model to be used here is primarily aimed at
achieving an accurate representation of the coupled me-
chanical vibration of the strings and guitar body It does
not attempt a comparably full treatment of the details of
the playerrsquos pluck gesture or of the sound radiation be-
haviour these are both taken into account in a simple way
only as will be described shortly The input to the model
is a set of parameter values describing separately the be-
haviour of the guitar body and the strings For each body
mode four things are required the natural frequency the
modal damping factor the modal amplitude at the posi-
tion on the bridge where the string is coupled and an
angle describing the orientation of motion at that cou-
pling point The modal amplitude can be equivalently ex-
pressed via an effective mass the amplitudes deduced by
the techniques of experimental modal analysis correspond
to mass-normalised modes (see for example Ewins [8])
and the square of the measured amplitude at a given point
is the inverse of the effective mass for representing that
mode at that point by a mass-spring-damper combination
The angle of motion at the coupling point is needed so that
both polarisations of string motion can be included in the
synthesis
Ideally the amplitudes and angles of each body mode
would be separately determined at the six positions on the
bridge saddle where the strings make contact This would
be possible but laborious and for the present study it has
not been done The body modal parameters are deduced
from a measurement of the input admittance (also called
the driving point mobility) at a position between the 5th
and 6th strings (the two tuned to the lowest frequencies)
The same body response is used for all strings in the syn-
thesis process This position was chosen mainly because it
is easier to perform the measurements necessary to estab-
lish the modal angles at the ends of the bridge rather than
in the middle for practical reasons of access Other posi-
tions on the bridge would of course give the same natural
frequencies and modal damping factors but with differ-
ent amplitudes and angles Since the aspects of body be-
haviour studied here involve only frequencies and damp-
ing one might hope that the conclusions would not be sig-
nificantly changed by a more thorough synthesis allowing
different body behaviour for each string
2
The string is treated as a continuous system rather
than being described in modal terms this was shown to
give a more efficient strategy for computing the coupled
stringbody motion with correct allowance for the very dif-
ferent damping levels of the two systems which causes
the damping of the coupled system to be strongly non-
proportional [3] A given string is specified by its length
L tension T mass per unit length m bending stiffness
EI and a measure of its damping The bending stiffness
is expressed as the product of the Youngrsquos modulus E and
the second moment of area I which for a homogeneous
monofilament string of diameter d is given by
I = πd464 (1)
Inharmonicity due to bending stiffness is often expressed
in terms of the dimensionless parameter B that appears in
the approximate expression for the frequency of the nth
overtone
fn asymp nf0 1 + Bn2 (2)
where f0 is the fundamental frequency In terms of the no-
tation introduced here
B =EIπ2
TL2 (3)
For overwound strings as normally used for the lower
strings of the guitar the effective value of EI or B can-
not be reliably predicted and must be measured
Musical strings in general have been shown to exhibit
strongly frequency-dependent damping and the measured
behaviour can be fitted to a three-parameter model pro-
posed by Valette [9] The loss factor of the nth mode is
assumed to take the form
ηn =T (ηF + ηAωn) + EIηB (nπL)2
T + EI (nπL)2 (4)
The damping is lowest in the mid range of frequencies
with a minimum level set by ηF At very low frequencies
the damping increases an effect attributed by Valette to air
damping and quantified by the parameter ηA At high fre-
quencies the damping increases again because energy dis-
sipation associated with the complex bending stiffness of
the string comes to dominate especially for the polymer-
based strings of classical guitars This effect is charac-
terised by the parameter ηB
The chosen synthesis method works in the frequency
domain then uses an inverse FFT to obtain the time re-
sponse Full details are given in [3 4] The string and body
are coupled at the bridge using the standard point-coupling
formula
Y minus1coup = Y minus1
body+ Y minus1
str (5)
where Ycoup Ybody Ystr are the 2times2 matrices of admittance
at the bridge notch for the coupled system the body alone
and the string alone respectively Each synthesised note
begins with an idealised pluck which is a step function of
force as the finger or plectrum loses contact with the string
The string is assumed to be released from rest at the instant
of the note starting Advantage is taken of the reciprocity
principle it is convenient to apply the force step at the
bridge and calculate the response at the point on the string
where the pluck acts As well as the plucking position on
the string it is possible to specify an angle of pluck (which
determines the mix of the two polarisations of string mo-
tion excited) The playerrsquos finger or plectrum will have a
finite size and this will have the effect of a low-pass filter
on the excitation of string modes This is represented in a
simple way by a frequency-domain Gaussian filter propor-
tional to exp(minusω2K2) Here K = vh where v = Tm
is the wave speed of the string and the width h was given
the value 75 mm in order to obtain a reasonably realistic
sound
The synthesis model calculates the transient waveform
of acceleration at the coupling point between the string and
body A full model would then need to calculate the body
motion at all other positions and perform a rather com-
plicated numerical calculation to give the resulting sound
radiation The present model uses a severely simplified ap-
proach the computed bridge acceleration is regarded as
being applied to a spherical radiating body of radius a
vibrating in the symmetric breathing mode only For that
problem the sound pressure in the far field is given sim-
ply by filtering the acceleration waveform with a low-pass
filter that apart from an overall scale factor takes the form
R(ω) =ika
1 + ika=
iωωc
1 + iωωc
(6)
where k = ωc is the wavenumber for sound in air c is
the speed of sound and ωc = ca is the filter roll-off fre-
quency Setting this roll-off at 250 Hz corresponding to
a sphere radius around 02 m proved to give satisfactory-
sounding results
This synthesis procedure has been implemented in Mat-
lab in a program that allows the user to specify a musical
fragment entered in a form of guitar tablature The result-
ing ldquotunerdquo is saved as a sound file
3 Experimental methodology
31 Psychoacoustical tests
Using synthesised sounds generated by this method ex-
periments were conducted to give some JND information
relating to the major parameters For the body model ex-
periments were done in which all the mode frequencies
were shifted by a given factor and also groups of modes in
particular frequency bands were shifted leaving the other
modes unchanged In a separate pair of tests the damping
factors of all modes were modified by a given factor ei-
ther upwards or downwards from the reference values in
case there was an asymmetry of perception For the string
model the bending stiffness and the damping parameters
ηF ηB were changed The parameter ηA was found to have
so little influence on the chosen test sound that it was not
3
possible to obtain a meaningful JND for changes to its
value A general comment should be noted all the tests
to be reported here were constrained by the time limits
imposed by the format of undergraduate projects In some
cases there is no doubt that more could have been learned
had more time been available but it is felt that the results
have value even with these limitations
JND thresholds were estimated using a three-alternative
forced-choice procedure (3AFC) This is not the only pos-
sible procedure that could have been used but it had al-
ready been chosen for the violin studies and software
to implement 3AFC was conveniently to hand A three-
down one-up adaptive tracking rule was used that esti-
mated the 79 correct point on the psychometric func-
tion [10] It should be noted that this is the definition as-
sumed for ldquoJNDrdquo throughout this paper it is a rather con-
servative value significantly higher than that which would
correspond to the 50 point on the psychometric func-
tion which perhaps better matches the intuitive notion of
ldquothreshold of perceptionrdquo Three sounds ndash two the same
the reference sound and one different the modified sound
ndash were played in a random sequence and the subject was
asked to choose which one was different The amount of
parameter modification between the stimuli in a given trial
was changed by a certain factor the step size The step size
decreased after three correct answers and increased after
one wrong answer The test stopped after eight turnpoints
A relatively large initial step size was applied until the sec-
ond turnpoint was reached in order to allow rapid conver-
gence toward the threshold region After the second turn-
point the step size was reduced The threshold was taken
as the mean of the values of the amount of modification at
the last six turnpoints The values of the two step sizes and
the starting level of parameter modification were chosen
differently for each test on the basis of preliminary trials
Each trial took no more than about 10 minutes and sub-
jects had a break between tests
In all tests the reference sound was kept constant in or-
der to increase discriminability subjects ldquolearntrdquo to rec-
ognize the reference sound It is argued that for the pur-
pose of relating to musical judgments which in practice
are made by musicians who may spend several hours every
day concentrating on subtle details of the sound of their in-
strument the threshold of most interest is the one obtained
under the most favourable conditions for discrimination
It is accepted that the test circumstances are quite remote
from normal musical experience as seems to be inevitable
in the design of any scientifically-acceptable test proce-
dure and the approach adopted seems to the authors the
best that can easily be done The 3AFC software gave vi-
sual feedback on rightwrong answers during the experi-
ment although some subjects performed best by keeping
their eyes shut and ignoring it Subjects did not receive
any training beforehand but if they performed erratically
on the first run they were able to repeat the run This ap-
plied only to a few subjects and they were all able to per-
form the task at the second attempt The sounds were pre-
sented diotically via Sennheiser HD580 headphones cho-
Figure 1 Guitar tablature for sound examples used in psy-
choacoustical tests first the ldquoHuntsupperdquo extract second the
strummed chord with notes E2 B2 D3 B3 C4 A4
sen because of their diffuse field response in a relatively
quiet environment The sampling rate was 441 kHz and
the number of bits was 16
The choice of musical input for the test sounds can
have a significant influence on the JND obtained In the
first tests on mode frequency shifting three different sam-
ple sounds were tested a single note (the open A string
110 Hz) a short musical fragment and a strummed ldquodis-
cordant chordrdquo with notes E2 B2 D3 B3 C4 A4 selected
to give input at a wide range of frequencies The musi-
cal fragment consisted of the first bar of the lute piece
ldquoThe English Huntsupperdquo by John Whitfelde This and
the chord are shown in tablature notation in Figure 1 the
tablature applies to a guitar in regular EADGBE tuning
For the remaining tests a single note was used for the test
sound the open A string (110 Hz) for the damping factor
tests and C3 on the A string (131 Hz) for the string param-
eter tests The total stimulus length for the single notes and
the chord was 1 s while the Huntsuppe fragment took 2 s
These are all longer than the 300 ms length that yielded
the lowest thresholds in the violin tests and perhaps some
advantages of echoic memory are sacrificed by using these
longer stimuli However it was found that the sense of a
realistic guitar sound was compromised if the duration was
too short and it seemed more appropriate to use the longer
more ldquoguitarishrdquo sounds
The test subjects were all ldquomusicalrdquo in one sense or an-
other but for the purposes of the presentation of results
they are divided into two groups using the same criterion
as in the work on the violin [1] those labelled ldquomusiciansrdquo
had at least 8 years of formal training and were currently
active in music-making at least once per week while the
others are labelled ldquonon-musiciansrdquo The first author was
a subject in each test while all the other subjects were of
student age The results for the first author did not seem
in any way atypical of the rest despite his relatively ad-
vanced age
32 Physical measurements
Physical measurements on the body and strings of several
guitars are used in two different ways in this study First
measurements are needed to calibrate the synthesis model
as has been described in detail previously [4] Second the
same range of measurements can be analysed to give es-
timates of the variability in practice of the parameters for
which JNDs will be found By comparing the actual varia-
tion with the JND for perception it is hoped to give a first
4
80 100 200 500 1000 2000 5000-70
-60
-50
-40
-30
-20
-10
Frequency
|Y|(dB)
Figure 2 Magnitude of the input admittances of four guitars
measured normal to the top plate at the bridge saddle near the
lowest string (E2) plotted in decibels relative to 1 mNs Heavy
line flamenco guitar by Martin Woodhouse thin solid line clas-
sical guitar by Michael J OrsquoLeary dashed line classical guitar by
Greg Smallman dash-dot line flamenco guitar by Joseacute Ramirez
Horizontal lines show bands used in testing see text
estimate of the relative sensitivity and importance of dif-
ferent kinds of variation in guitar construction and string-
ing
Input admittance Y (ω) of the guitar body is measured
by applying a controlled force either with a miniature im-
pulse hammer (PCB 086D80) or by gently pulling a length
of fine copper wire looped around a string at the bridge
saddle until it snaps The latter method is less accurate
but has the advantage that it can be used to apply force in
different controlled directions to give information on the
modal angles In all cases the velocity response is mea-
sured with a laser-Doppler vibrometer (Polytec OFV-056)
directed to a spot as close as possible to the forcing point
Signals are collected at a sampling rate of 40 kHz by a
digital data-logger based on a PC running Matlab with
a National Instruments 6220 data acquisition card The
strings of the guitar were damped during admittance mea-
surements
Input admittances in the direction normal to the plane
of the top plate have been measured on a wide range of
acoustic guitars and a representative selection of 15 are
used in the present study Figure 2 shows results for four
of these all hand-made instruments of high quality The
heavy curve is the datum guitar used in the psychoacousti-
cal tests a flamenco guitar by Martin Woodhouse studied
in the previous work [4] The others are a flamenco gui-
tar by Jose Ramirez and classical guitars by Greg Small-
man and Michael J OrsquoLeary It is immediately clear that
all these guitars although different in detail show a lot
of common features All have a strong peak in the range
80ndash100 Hz which is a Helmholtz resonance associated
with the internal air cavity and the soundhole modified by
the compliance of the top and back plates All the guitars
then show a deep antiresonance (marking the frequency at
which the Helmholtz resonance would occur with a rigid
cavity see equation (1019) of Cremer [11]) followed by
a cluster of strong peaks in the range 150ndash250 Hz Most
then show a steady decline to a dip around 400ndash500 Hz
followed by fluctuations around a rather steady level with
gradually reducing peak amplitudes as the modal overlap
becomes significant One guitar (the OrsquoLeary) has an ad-
ditional strong peak around 300 Hz interrupting the de-
cline to the dip The two horizontal lines mark frequency
bands that will be used in frequency-shifting tests in the
next section The first of these bands (150ndash250 Hz) covers
the range where the datum guitar has its strongest peaks
The second band (500ndash1000 Hz) covers a range where the
modal overlap is becoming significant but fairly clear in-
dividual peaks can still be seen
The other physical measurements used in this study are
aimed at establishing the properties of strings Tension and
mass per unit length are readily established but the bend-
ing stiffness and damping properties require careful mea-
surement Such measurements have previously been made
on a typical set of nylon strings for a classical guitar and
in the course of this project corresponding measurements
were made on a set of steel strings as commonly used
on folk guitars The chosen strings were Martin ldquo8020
Bronzerdquo It is a familiar experience to guitarists that the
sound changes a lot between when the strings are new and
when they are well-played so the strings studied here were
measured in both states to give quantitative data on what
changes in the ageing process
The bending stiffness and damping properties can be es-
timated by analysis of sounds recorded from notes played
on the guitar in the usual way [4] The frequencies of the
strongest spectral components corresponding to ldquostringrdquo
modes can be best-fitted to equation (2) to yield values
of B and hence EI The associated decay rate of each
of these ldquostringrdquo modes can also be found using time-
frequency analysis and this gives information about the
string damping The procedure for obtaining damping in-
formation from the decay rates is a little indirect because
in most cases the decay rate is dominated by losses into the
guitar body rather than by internal damping in the string
The approach adopted is to analyse the frequencies for
a plucked note on every fret of a given string and combine
them all into a cloud plot of damping factor against fre-
quency examples are shown in Figure 3 This shows data
for the 3rd string (G3) for the nylon string measured previ-
ously and the new steel-cored string The inherent damp-
ing of the string as a function of frequency determines
the ldquofloor levelrdquo of this cloud plot Approximate values of
ηA ηF ηB can be estimated by fitting eqquation (4) to the
trend of this floor level as illustrated by the curves in Fig-
ure 3 The fitting process was carried out manually with
some regard to the error tolerances of the data points Note
that the high-frequency fit line for the nylon string was
influenced by additional data obtained by a different ap-
proach not shown here see [4] for more detail It is clear
from the figure that the nylon string has higher damping
than the steel string The measured string properties are
summarised in Table I
5
Table I Properties of guitar strings (a) DrsquoAddario Pro Arteacute ldquoComposites hard tensionrdquo nylon strings (b) Martin ldquo8020 bronzerdquo steel
strings in new condition (c) as (b) but in used condition
String 1 2 3 4 5 6
Tuning note E4 B3 G3 D3 A2 E2
Frequency fn (Hz) 3296 2469 1960 1468 1100 824
Tension (a) T (N) 703 534 583 712 739 716
(b) 121 135 182 185 169 147
Massunit length (a) m (gm) 038 052 090 195 361 624
(b) 057 113 242 437 713 1102
Bending stiffness (a) EI (10minus6Nm2) 130 160 310 51 40 57
(b) 108 336 234 255 327 667
(c) 103 394 343 418 480 719
Inharmonicity (a) B (10minus6) 43 70 124 17 13 19
(b) 21 58 30 32 45 106
(c) 20 68 44 53 66 114
Loss coefficients (a) ηF (10minus5) 40 40 14 5 7 2
(b) 7 6 11 9 11 5
(c) 6 7 17 33 17 10
(a) ηB (10minus2) 24 20 20 20 25 20
(b) 07 11 18 11 04 03
(c) 07 11 68 41 29 38
(a) ηA (1s) 15 12 17 12 09 12
(b) 25 10 12 13 12 17
(c) 15 10 06 07 06 14
The differences between the nylon and steel strings in
new condition are broadly as one would expect The nylon
strings have lower tensions and a different pattern of bend-
ing stiffness because of the difference in construction for
the nylon set the top three strings are monofilaments while
the lower three have multifilament cores with metal wind-
ings The steel strings have monofilament cores through-
out and only the top two strings are not wrapped The
monofilament nylon strings have higher internal damping
than the steel but the difference is much less marked for
the lower three strings
The effect of age and use on the steel strings can also
be seen Previous investigators have reported increased
damping between new and old guitar strings [12 13] but
without sufficient detail to allow a fit to equation (4) It
is generally accepted that the mechanism for this ageing
effect is the accumulation of dirt and corrosion products
between the windings of wrapped strings [13] perhaps
with some additional cumulative wear of the outer wrap-
pings where the strings make contact with the frets The
measurements reported here support this picture there is
very little change in the two highest strings which are not
wrapped For the wrapped strings there is a marked in-
crease in damping especially in ηB which determines the
decay at the highest frequencies
Also not noted by previous authors there is a marked
increase in the effective bending stiffness of some of the
strings This seems perfectly credible since the contact
conditions between the windings in the tensioned string
will contribute to the bending stiffness and material col-
lecting between the windings will surely change those con-
ditions This is consistent with the observed increase in ηB
which is the loss factor associated with the bending stiff-
ness term in the governing equation It may be noted that
the bending stiffness values given here are in good gen-
eral agreement with values reported by Jaumlrvelaumlinen et al
[7] noting that their steel-string results match the ldquousedrdquo
results more closely than the ldquonewrdquo results Their paper
does not report the condition of the strings as measured
4 Results for properties of the guitar body
41 Psychoacoustical tests
The first series of psychoacoustical tests concerned the
shifting of all body mode frequencies by a given factor
keeping other simulation parameters fixed This modifica-
tion is of course somewhat artificial but a possible physi-
cal interpretation will be discussed in the next subsection
The datum for this test was based on the modal proper-
ties of the flamenco guitar by Martin Woodhouse This test
was run three times using the three different musical in-
puts described above The three tests were completed by 8
musicians and 5 non-musicians (according to the criterion
described above) The results are summarised in Figure 4
The program that runs the 3AFC protocol gives as output
the mean and standard deviation over the range defined by
the final 6 turnpoints The plots show for each test subject
the mean on the horizontal axis and the relative standard
deviation (standard deviation divided by mean) on the ver-
tical axis The numbers on the horizontal axis indicate the
6
100 200 500 1000 2000 500010
-4
10-3
10-2
Frequency (Hz)
Dampingfactor
100 200 500 1000 2000 500010
-4
10-3
10-2
Frequency (Hz)
Dampingfactor
Figure 3 Damping measurements on (top) a nylon guitar string
(3rd string G3) and (bottom) the corresponding string from a
steel-cored set Discrete points show individual measured decay
rates curves show fits to the floor level using equation (4)
percentage shift in mode frequency Musicians are indi-
cated by stars non-musicians by plus symbols The aver-
ages over all test subjects are shown by the open circles
The open square symbols show the average of the four
subjects who achieved the lowest mean levels As was sug-
gested earlier within the scope of the present study the
most interesting threshold to compare with serious musi-
cal judgments is that achieved by the best listeners under
the most favourable conditions In the violin tests the best
five results were presented for this purpose [1] In the tests
reported here the number of subjects is sometimes rather
low and it was decided to average the best four The nu-
merical results of this best-four measure for all the 3AFC
tests presented here are given in the figure captions
It can be seen that for each of the three musical inputs
the best subjects could discriminate a shift of 1 or less
Interesting patterns can be seen in the detailed results de-
spite the small number of subjects that would make any
elaborate statistical analysis of limited value The general
spread of results and the two averages look very simi-
lar for the single note and the Huntsuppe extract For the
single note the musicians and non-musicians are intermin-
gled while for Huntsuppe all but one of the non-musicians
has a worse result than all the musicians Perhaps non-
musicians have their performance degraded by informa-
03 05 1 2 3 5 100
05
1
(a) Huntsuppe
Percentage shift
RelSTD
03 05 1 2 3 5 100
05
1
(b) Single note
Percentage shift
RelSTD
03 05 1 2 3 5 100
05
1
(c) Discordant chord
Percentage shiftRelSTD
Figure 4 Results from 3AFC studies for shifting all mode fre-
quencies of the datum guitar using as input (a) the Huntsuppe
fragment (b) a single note (open A string) (c) the discordant
chord Horizontal axis shows percentage frequency shift on a
logarithmic scale vertical axis shows relative standard deviation
Points denote musicians points + denote non-musicians Open
circle average of all subjects open square average of best four
subjects The percentage shifts corresponding to the best-four av-
erages are (a) 113 (b) 092 (c) 059
tional masking while experienced musicians do not with
such an obviously musical sound sample as ldquoHuntsupperdquo
The chord reveals a different picture Four of the mu-
sicians achieved very low thresholds with this sound in-
put but all other subjects seem to have been seriously
distracted by this rather non-musical sound and achieved
only rather high thresholds One of the musicians comes
out worst of all in this test whereas for Huntsuppe all the
musicians performed well This is a striking example of
informational masking especially since the group of four
subjects who did well actually produced a lower average
than in either of the other tests That is as one would hope
this signal contains deliberately a wider range of fre-
quency components so that analytical listeners with suffi-
cient skill and experience to take advantage of it can make
very subtle judgements down to 032 shift in the best
case This corresponds to shifting the mode frequencies
about 6 cents or 120 of a semitone an impressively small
amount that is not very much bigger than the threshold for
pitch discrimination tasks (see eg [14])
The thresholds are of the same order as the ldquobest fiverdquo
thresholds in the corresponding violin tests but the de-
tailed pattern seems different The choice of input had a
more marked effect in the violin and to achieve the lowest
thresholds a very short and consequently rather unmusi-
cal sound sample was used
The best-performing 7 subjects of the first test series
were asked to undertake two further tests in which fre-
7
quencies were shifted only in limited bands The two
bands studied were shown in Figure 2 and this time the
only input sound tested was the single-note open A string
The results of the tests are shown in Figure 5 in the same
format as Figure 4 Rather unexpectedly the ldquobest fourrdquo
threshold for the first band containing the strongest peaks
of the datum guitar was much higher than for the sec-
ond band Related tests for the violin using the so-called
ldquoDuumlnnwald bandsrdquo gave thresholds around 2 for the first
three bands (see Figure 6 of Fritz et al [1]) Band 1 in the
present study gave a comparable result but band 2 gave a
lower result than was observed in any of the violin tests
The best-four JND in this case is virtually the same as for
the corresponding test when all frequencies were shifted
Further studies might be worth conducting to add more
detail to this observation
The final pair of tests relating to the perception of body
mode changes investigated the effect of damping factors
This time the mode frequencies were kept fixed but the
modal Q factors were all scaled by a given factor Q fac-
tor is the inverse of damping factor so high Q corresponds
to low damping In two separate tests the Q factors were
increased and decreased to look for any asymmetry in the
perception Thirteen test subjects took these two tests 10
musicians and 3 non-musicians Results are shown in Fig-
ure 6 in the same format as Figs 4 and 5 except that the
numbers on the horizontal axis now indicate the scale fac-
tor applied rather than the percentage change This means
that ldquono changerdquo corresponds to the value 1 rather than 0
as in the previous results which has the effect of making
the relative standard deviations numerically smaller
An asymmetry is seen between the two tests but it does
not significantly affect the threshold value for the best
four listeners They achieved a value around 12 ie a
20 change in Q factors in both cases However across
the whole set of test subjects the spread is much greater
when the Q factors were decreased compared to the in-
creasing case Many participants reported initial difficulty
in hearing the difference when Q factors were decreased
although once they had learned to recognise the sound
change they often achieved quite low thresholds
It was not thought worthwhile to test separate frequency
bands in this case for two reasons First body damping is
most readily altered by a physical change of material and
this is likely to have an effect over a broad frequency range
Second it will be shown shortly that the JND for percep-
tion of a change in body damping is of the same order
as the measured standard deviation among real guitars so
that the perceptual significance is probably marginal and
digging deeper into the details is likely to be of limited
importance
42 Physical measurements
The next step is to look at physical measurements to as-
sess how these thresholds of perception compare with the
actual extent of variation between guitars Of course one
would never find two real instruments which differed by
having all the body frequencies simultaneously scaled by
03 05 1 2 3 5 100
05
1
Percentage shift
RelSTD
(a) 150-250 Hz
03 05 1 2 3 5 100
05
1
Percentage shift
RelSTD
(b) 500-1000 Hz
Figure 5 Results in the format of Figure 4 from 3AFC studies for
shifting all mode frequencies of the datum guitar lying in (a) the
band 150ndash250 Hz and (b) the band 500ndash1000 Hz using as input
a single note (open A string) The percentage shifts correspond-
ing to the best-four averages are (a) 187 (b) 153
1 12 15 2 25 30
005
01
015
02
(a)
Scale factor
RelSTD
1 12 15 2 25 30
005
01
015
02
(b)
Scale factor
RelSTD
Figure 6 Results in the format of Figure 4 from 3AFC studies
for scaling all modal Q factors of the datum guitar (a) upwards
and (b) downwards using as input a single note (open A string)
Horizontal axis shows scale factor applied by multiplication or
division to Q factors The scale factors corresponding to the best-
four averages are (a) 119 (b) 122
exactly the same factor However it is easy to visualise a
change which would in principle have this effect it would
happen if the dimensions of the guitar were all scaled
keeping the same materials and other details Some sim-
ple deductions can then be drawn by scaling analysis If
the main vibrating elements of the guitar body are treated
as thin flat plates deforming in bending then the natural
frequencies scale proportional to hd2 where d is the scale
factor for dimensions in the plane and h is the scale factor
for thickness Taking 1 as a round number for the order
of magnitude of the threshold of detection for shifting fre-
quencies it follows that the JNDs for dimensional scaling
are approximately 1 if d and h are both scaled together
(full geometric scaling) 1 again if thickness is changed
keeping the in-plane dimensions fixed and only 05 if
in-plane dimensions are scaled keeping the thickness the
same These are all very small numbers they amount to
changing in-plane dimensions no more than a few mm and
8
75 80 85 90 95 1000
10
20
30
40
50
60
70
80
Frequency (Hz)
Q
(a)
160 170 180 190 200 210 2200
10
20
30
40
50
60
70
80
Frequency (Hz)
Q
(b)
Figure 7 Modal frequencies and Q factors for 15 guitars for
the highest peak in the frequency bands (a) 75ndash100 Hz the
ldquoHelmholtz resonancerdquo (b) 150ndash250 Hz the ldquofirst top plate
moderdquo Plus and cross symbols show fits without and with com-
pensation for string damping respectively Diamond symbols
mark the datum guitar for the listening tests Open squares show
the means and range bars show one standard deviation above
and below the means for the two sets of fitted data The ranges
for the compensated results can be recognised by their higher Q
values Dashed lines near the axes show approximately 1 JND
above and below the uncompensated means from the results of
section 41
to changing a typical top plate thickness by a mere 25 microm
Real instruments have dimensional variations which are
considerably bigger than this especially in thickness so
on this ground alone it is no surprise that guitars can sound
different
The simplest approach to obtaining quantitative infor-
mation from admittance measurements on a set of gui-
tars is to perform explicit modal analysis This can only
be expected to give reliable results at relatively low fre-
quencies pole-residue extraction whatever the method
becomes sensitive once the modal overlap begins to ap-
proach unity To illustrate the kind of values which emerge
from such an analysis Figure 7 shows results for modal
frequency and Q factor for 15 guitars for the highest peak
in each of the two low-frequency bands mentioned in the
discussion of Figure 2 75ndash100 Hz the ldquoHelmholtz reso-
nancerdquo and 150ndash250 Hz the ldquofirst top plate moderdquo
A complicating factor needs to be noted The ad-
mittance measurements are made with the strings well
damped because the purpose is to obtain information
about the body behaviour without the effect of the strings
However the damped strings remove some energy from
the body vibration and this will tend to reduce the mea-
sured Q factors This effect can be compensated at least
approximately The damped strings will act essentially as
semi-infinite strings and will thus present an impedance to
the bridge which is real and if the strings are all assumed
to be attached at the same point equal to the sum of the
string impedances given by Z =radicTm From the data for
nylon strings in Table I the sum of these impedances is
212 Nsm To compensate the inverse of Y (ω) is taken
this real quantity is subtracted then the result re-inverted
to give a new admittance This approach can be expected
to work well at higher frequencies but it is hard to be sure
if the strings are well enough damped at low frequencies
to justify the semi-infinite approximation
Figure 7 shows results before and after this compensa-
tion For each case the mean and scatter are indicated by
lines showing one standard deviation above and below the
mean for frequency and Q Interestingly the standard de-
viations have a similar pattern for both cases The relative
standard deviations for frequency are 55 and 6 for the
two cases and those for Q factor about 33 in both cases
before compensation
To obtain good comparative information about modal
frequencies over a broader bandwidth is more challeng-
ing It is not possible to identify the ldquosamerdquo mode in dif-
ferent guitars except at very low frequencies sensitivity
to small structural changes increases with frequency as is
familiar in other vibration problems (see eg [15]) For
mode frequencies the threshold for audible changes is so
small that it is hard to obtain any measure which is good
enough scaling frequencies by 1 means that one guitar
body might have 101 modes in a frequency range where
another guitar had 100 and there is no known analysis
method which can give robust discrimination at this level
Any measure which can be computed shows much bigger
variability than this and there is always a strong suspicion
that it is revealing the vagaries of the analysis method more
than the real differences between guitars
Things are a little more promising in the case of damp-
ing estimation over a wide frequency range Taking the
inverse FFT of an input admittance gives an impulse re-
sponse function of the guitar body and this can be pro-
cessed using time-frequency analysis to give a sonogram
representation In each frequency band a best-fitting ex-
ponential decay can then be obtained Combining results
from several different choices of the timefrequency res-
olution tradeoff improves the robustness of the results
The process is described in more detail elsewhere [16]
Some results are shown in Figure 8 compensation for
string damping has been included In Figure 8a the discrete
points represent for the datum guitar frequencydecay
combinations which satisfied an assumed criterion for
good fit quality For compatibility with other plots decay
9
0 200 400 600 800 1000 1200 1400 1600 1800 20000
10
20
30
40
50
60
70
80
90
100
Frequency
Qfactor
(a)
0 200 400 600 800 1000 1200 1400 1600 1800 20000
20
40
60
80
100
120
Frequency
Qfactor
(b)
30 35 40 45 50 55 60 6515
20
25
30
35
40
Mean Q
Relativestandard
deviation(
)
(c)
Figure 8 Damping trends for guitar bodies determined from
time-frequency analysis (a) individual measurements of fre-
quency and equivalent Q factor (circles) and the band average
of these (solid line) for the datum guitar (b) the solid lines as
in (a) for the set of 15 guitars (c) the mean and standard devia-
tion of the results from (b) across the frequency range with range
bars indicating one standard deviation above and below the mean
on each axis The circle marks the datum guitar for the listening
tests
rate is represented as an equivalent Q factor The continu-
ous line is simply a moving band average of these discrete
points
Figure 8b then shows the band-averaged lines for the 15
guitars in the test set Finally Figure 8c shows a scatter
plot of the mean and standard deviation of these band-
averaged lines for the 15 guitars As in Figure 7 the
large cross represents one standard deviation above and
2 3 5 8 100
01
02
03
04 (a)
Scale factor
RelSTD
2 3 5 8 100
01
02
03
04 (b)
Scale factor
RelSTD
2 3 5 8 100
01
02
03
04 (c)
Scale factor
RelSTD
Figure 9 Results in the format of Figure 4 from 3AFC studies
for changing the damping parameters of the 5th string based on
datum values for the new steel strings Case (a) varying ηB test
note E2 (b) varying ηB test note C3 (c) varying ηF test note
C3 The scale factors corresponding to the best-four averages are
(a) 299 (b) 313 (c) 241
below the mean on each axis The main result is that
this frequency-averaged measure of damping has a rela-
tive standard deviation of the order of 20 comparable to
the JND found earlier for perception of damping changes
This suggests that the extremes of mean damping in the
measured set of guitars are sufficiently different that the
effect should be audible but the results do not lead one
to expect that this will be a very strong component of the
perception of tonal differences among guitars
5 Results for properties of the strings
The final set of JND experiments relates to changes in
string properties including those properties that changed
as the string aged one objective was to find out which
of those changes are likely to contribute most to the per-
ception of ageing Using as datum the properties of the
new steel strings listed in Table I changes to the damping
properties of the 5th string were investigated using single-
note test sounds These 3AFC tests were completed by 11
musicians and 5 non-musicians One test was also con-
ducted relating to changes in the bending stiffness of this
string it gave results in line with those of Jaumlrvelaumlinen et
al [7] and the details are not reproduced here The actual
bending stiffness of this string was found to be close to
the threshold for detecting an increase in bending stiffness
when starting from a much lower level In the aged string
the bending stiffness only increased by a factor 16 (see
Table I) If that change is audible at all the effect is likely
to be small
The results for the damping tests are shown in Figure 9
in a similar format to earlier 3AFC results As noted ear-
lier the perceptual effects of changing ηA for this string
10
were found to be so weak that it was not possible to con-
duct a meaningful test However both ηB and ηF gave clear
results The parameter ηB associated with bending stiff-
ness and mainly affecting higher frequencies was tested
using two different notes ldquoplayedrdquo on the same string The
results are shown in Figures 9ab and show a good level
of consistency between the two notes The spread over-
all mean and best-four mean are all very similar for both
cases The best listeners need about a factor 3 increase in
this parameter to perceive the change Note from Table I
that in the aged string this parameter increased from 0004
to 0029 that change should be very clearly audible
Figure 9c shows corresponding results for ηF All sub-
jects gave a somewhat lower threshold for this parameter
compared to ηB and the very best listener achieved a JND
of less than a factor 2 In the aged string ηF increased in
the ratio 1711 for this string from Table I This effect is
probably not audible to most listeners It can be concluded
that the factor most likely to account for the difference in
sound of the aged string is ηB
6 Conclusions
Psychoacoustical experiments have been reported to estab-
lish JND levels for the perception of changes to various
parameters of a model of synthesised guitar sound [3 4]
These investigations parallel earlier work exploring related
JNDs for violin sounds [1] The parameters investigated
here relate to the behaviour of the guitar body (modal fre-
quencies and damping factors) and of the strings (bending
stiffness and damping model parameters) All tests were
carried out using a three-alternative forced-choice method-
ology It is argued that for application to musical judge-
ments which can be very subtle the most interesting per-
ceptual thresholds are those attainable by the best listeners
under the most favourable conditions To give an estimate
of these the results for the best four subjects in each test
were averaged
Results of physical measurements have also been re-
ported to give an indication of the spread of each parame-
ter among real guitar bodies or strings A comparison with
the psychoacoustical results gives a first impression of
which quantities might be responsible for the biggest per-
ceptual differences between instruments By far the most
sensitive parameter of all those tested relates to shifting
the frequencies of body modes The best four listeners
could perceive a 1 shift when all frequencies were scaled
together a small change compared to the actual varia-
tion among guitars This performance was only degraded
slightly when the shifted frequencies were band-limited in
two different bands tested The results were of the same
order as the corresponding JNDs found for violin sounds
[1] if anything the JNDs seem to be somewhat lower for
the guitar sounds perhaps because the fully-coupled syn-
thesis method gives the listener additional auditory cues
associated with transient decay rates of the string over-
tones Body mode damping has to be changed by about
20 for perception according to the definition used here
Actual variations of modal damping exceed this level but
not by a large factor so body damping is probably quite a
minor contributor to tonal perception
String damping parameters are even less sensitive they
have to be changed by a factor of the order of 3 How-
ever this large factor does not mean that the effects are
never heard Measurements have been presented on strings
of different materials and on steel-cored strings in new
and ldquoagedrdquo conditions The damping parameters vary be-
tween these cases by factors significantly bigger than the
JNDs The results strongly indicate that the most important
parameter for the perception of the degradation of sound
in well-used strings is ηB the damping factor associated
with the bending stiffness of the string This parameter
increases greatly with age of strings probably from the
damping effect of dirt and corrosion products accumulat-
ing between the windings of the lower strings of the guitar
[13] Strings without over-winding do not deteriorate in
sound to anywhere near the same extent
The correct interpretation of the high sensitivity to shift-
ing body frequencies is not obvious The actual change in-
vestigated here moving all frequencies in step is very arti-
ficial Listeners might be responding to the actual frequen-
cies or perhaps to the change in modal density (the in-
verse of the mean spacing between resonant frequencies)
or perhaps to the shifting amplitude envelope of the body
response Modal amplitudes were not changed when the
frequencies were scaled so the amplitude pattern moves
along the frequency axis with the scaling It would re-
quire further testing to establish whether one of these fac-
tors dominates or whether all contribute significantly Such
testing would be a good target for future research to bring
the results closer to the detailed concerns of instrument
makers
Acknowledgement
The authors thank Brian Moore Ian Cross and Alan Black-
well for many helpful discussions on this work and Martin
Woodhouse Stewart French Ian Cross and James West-
brook for providing access to guitars for testing Two
anonymous reviewers are thanked for constructive sugges-
tions
References
[1] C Fritz I Cross B C J Moore J Woodhouse Perceptualthresholds for detecting modifications applied to the acous-tical properties of a violin J Acoust Soc Am 122 (2007)3640ndash3650
[2] J Woodhouse P Galluzzo The bowed string as we know ittoday Acta Acustica united with Acustica 90 (2004) 579ndash589
[3] J Woodhouse On the synthesis of guitar plucks ActaAcustica united with Acustica 90 (2004) 928ndash944
[4] J Woodhouse Plucked guitar transients comparison ofmeasurements and synthesis Acta Acustica united withAcustica 90 (2004) 945ndash965
[5] H A K Wright The acoustics and psychoacoustics of theguitar PhD Thesis Cardiff University 1996
[6] H Jaumlrvelaumlinen V Vaumllimaumlki M Karjalainen Audibility ofthe timbral effects of inharmonicity in stringed instrumenttones Acoustics Research Letters Online 2 (2001) 79ndash84
11
[7] H Jaumlrvelaumlinen M Karjalainen Perceptibility of inhar-monicity in the acoustic guitar Acta Acustica united withAcustica 92 (2006) 842ndash847
[8] D Ewins Modal testing Theory practice and applicationResearch Studies Press 2000
[9] C Valette The mechanics of vibrating strings ndash In Me-chanics of Musical Instruments A Hirshberg J Kergo-mard G Weinreich (eds) Springer-Verlag Vienna 1995
[10] H Levitt Transformed up-down methods in psychoacous-tics J Acoust Soc Am 49 (1971) 467ndash477
[11] L Cremer The physics of the violin MIT Press Cam-bridge MA 1984
[12] J B Allen On the aging of steel guitar strings CatgutAcoust Soc Newsletter 26 (1976) 27ndash28
[13] R J Hanson Analysis of ldquoliverdquo and ldquodeadrdquo guitar stringsJ Catgut Acoust Soc 48 (1987) 10ndash16
[14] B C J Moore An introduction to the psychology of hear-ing Elsevier Academic Press London 2004
[15] C S Manohar A J Keane Statistics of energy flows inspring-coupled one-dimensional subsystems Phil TransRoyal Soc London A 346 (1994) 525ndash542
[16] J Woodhouse R S Langley Interpreting the input admit-tance of violins and guitars Acta Acustica united withAcustica (2012) in press
12
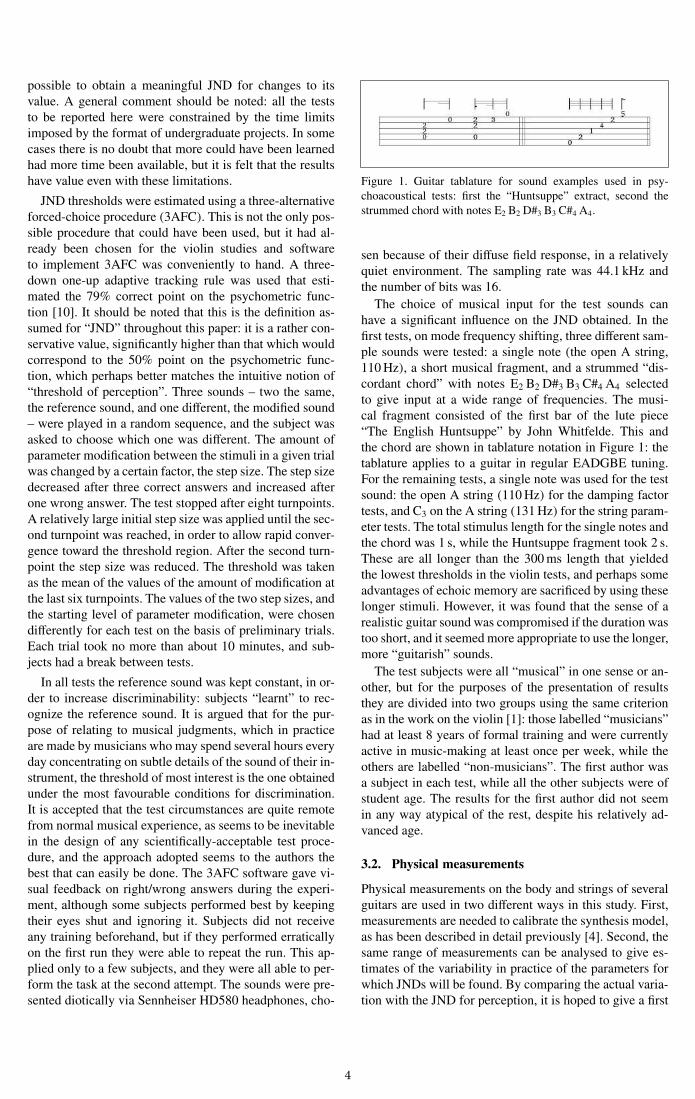
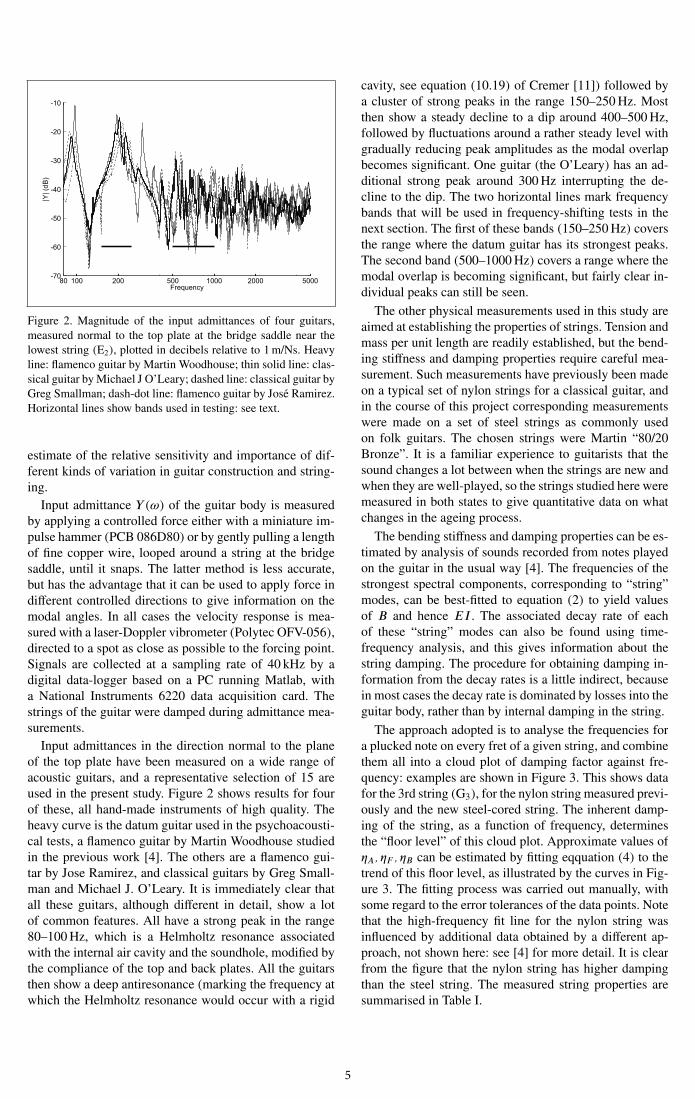
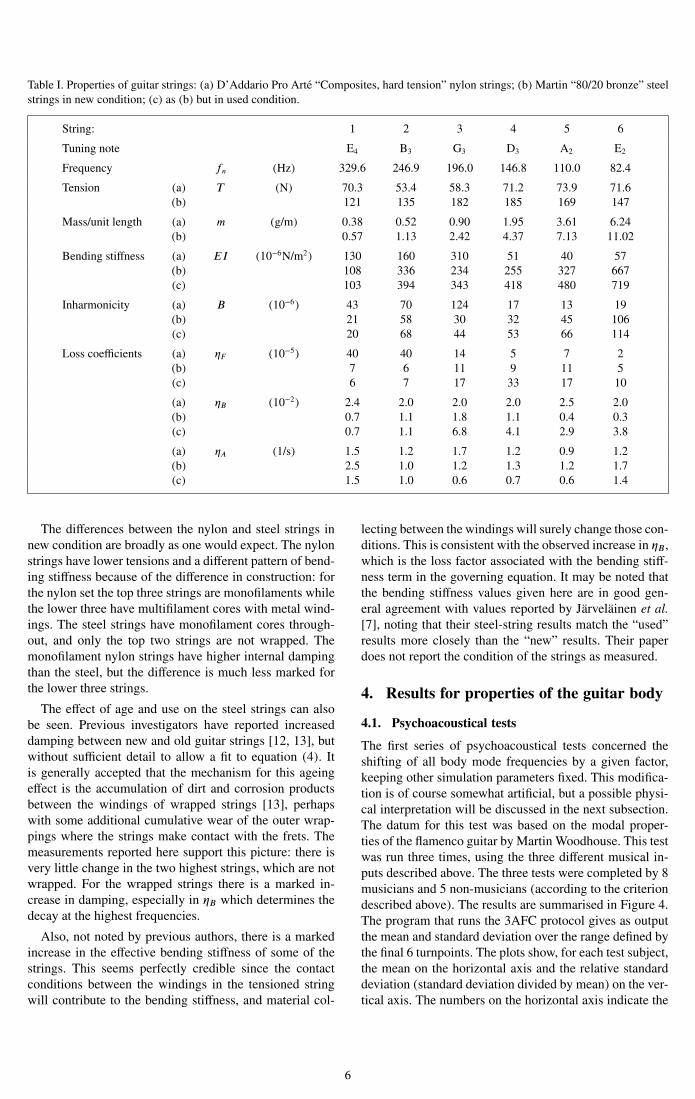
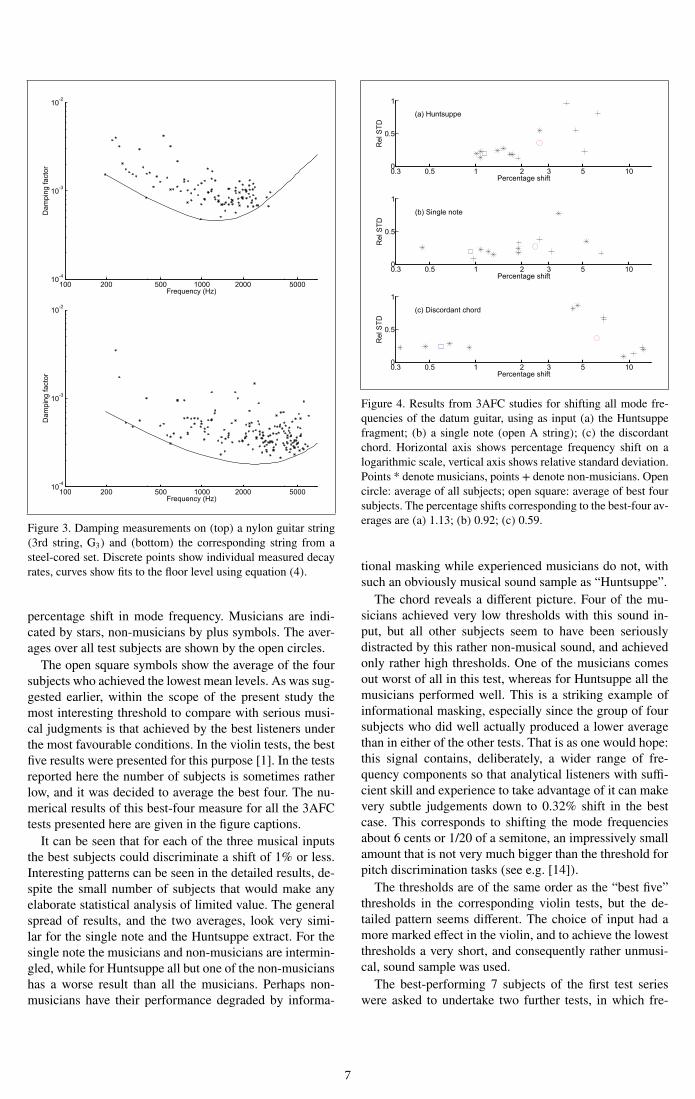
100 200 500 1000 2000 500010
-4
10-3
10-2
Frequency (Hz)
Dampingfactor
100 200 500 1000 2000 500010
-4
10-3
10-2
Frequency (Hz)
Dampingfactor
Figure 3 Damping measurements on (top) a nylon guitar string
(3rd string G3) and (bottom) the corresponding string from a
steel-cored set Discrete points show individual measured decay
rates curves show fits to the floor level using equation (4)
percentage shift in mode frequency Musicians are indi-
cated by stars non-musicians by plus symbols The aver-
ages over all test subjects are shown by the open circles
The open square symbols show the average of the four
subjects who achieved the lowest mean levels As was sug-
gested earlier within the scope of the present study the
most interesting threshold to compare with serious musi-
cal judgments is that achieved by the best listeners under
the most favourable conditions In the violin tests the best
five results were presented for this purpose [1] In the tests
reported here the number of subjects is sometimes rather
low and it was decided to average the best four The nu-
merical results of this best-four measure for all the 3AFC
tests presented here are given in the figure captions
It can be seen that for each of the three musical inputs
the best subjects could discriminate a shift of 1 or less
Interesting patterns can be seen in the detailed results de-
spite the small number of subjects that would make any
elaborate statistical analysis of limited value The general
spread of results and the two averages look very simi-
lar for the single note and the Huntsuppe extract For the
single note the musicians and non-musicians are intermin-
gled while for Huntsuppe all but one of the non-musicians
has a worse result than all the musicians Perhaps non-
musicians have their performance degraded by informa-
03 05 1 2 3 5 100
05
1
(a) Huntsuppe
Percentage shift
RelSTD
03 05 1 2 3 5 100
05
1
(b) Single note
Percentage shift
RelSTD
03 05 1 2 3 5 100
05
1
(c) Discordant chord
Percentage shiftRelSTD
Figure 4 Results from 3AFC studies for shifting all mode fre-
quencies of the datum guitar using as input (a) the Huntsuppe
fragment (b) a single note (open A string) (c) the discordant
chord Horizontal axis shows percentage frequency shift on a
logarithmic scale vertical axis shows relative standard deviation
Points denote musicians points + denote non-musicians Open
circle average of all subjects open square average of best four
subjects The percentage shifts corresponding to the best-four av-
erages are (a) 113 (b) 092 (c) 059
tional masking while experienced musicians do not with
such an obviously musical sound sample as ldquoHuntsupperdquo
The chord reveals a different picture Four of the mu-
sicians achieved very low thresholds with this sound in-
put but all other subjects seem to have been seriously
distracted by this rather non-musical sound and achieved
only rather high thresholds One of the musicians comes
out worst of all in this test whereas for Huntsuppe all the
musicians performed well This is a striking example of
informational masking especially since the group of four
subjects who did well actually produced a lower average
than in either of the other tests That is as one would hope
this signal contains deliberately a wider range of fre-
quency components so that analytical listeners with suffi-
cient skill and experience to take advantage of it can make
very subtle judgements down to 032 shift in the best
case This corresponds to shifting the mode frequencies
about 6 cents or 120 of a semitone an impressively small
amount that is not very much bigger than the threshold for
pitch discrimination tasks (see eg [14])
The thresholds are of the same order as the ldquobest fiverdquo
thresholds in the corresponding violin tests but the de-
tailed pattern seems different The choice of input had a
more marked effect in the violin and to achieve the lowest
thresholds a very short and consequently rather unmusi-
cal sound sample was used
The best-performing 7 subjects of the first test series
were asked to undertake two further tests in which fre-
7
quencies were shifted only in limited bands The two
bands studied were shown in Figure 2 and this time the
only input sound tested was the single-note open A string
The results of the tests are shown in Figure 5 in the same
format as Figure 4 Rather unexpectedly the ldquobest fourrdquo
threshold for the first band containing the strongest peaks
of the datum guitar was much higher than for the sec-
ond band Related tests for the violin using the so-called
ldquoDuumlnnwald bandsrdquo gave thresholds around 2 for the first
three bands (see Figure 6 of Fritz et al [1]) Band 1 in the
present study gave a comparable result but band 2 gave a
lower result than was observed in any of the violin tests
The best-four JND in this case is virtually the same as for
the corresponding test when all frequencies were shifted
Further studies might be worth conducting to add more
detail to this observation
The final pair of tests relating to the perception of body
mode changes investigated the effect of damping factors
This time the mode frequencies were kept fixed but the
modal Q factors were all scaled by a given factor Q fac-
tor is the inverse of damping factor so high Q corresponds
to low damping In two separate tests the Q factors were
increased and decreased to look for any asymmetry in the
perception Thirteen test subjects took these two tests 10
musicians and 3 non-musicians Results are shown in Fig-
ure 6 in the same format as Figs 4 and 5 except that the
numbers on the horizontal axis now indicate the scale fac-
tor applied rather than the percentage change This means
that ldquono changerdquo corresponds to the value 1 rather than 0
as in the previous results which has the effect of making
the relative standard deviations numerically smaller
An asymmetry is seen between the two tests but it does
not significantly affect the threshold value for the best
four listeners They achieved a value around 12 ie a
20 change in Q factors in both cases However across
the whole set of test subjects the spread is much greater
when the Q factors were decreased compared to the in-
creasing case Many participants reported initial difficulty
in hearing the difference when Q factors were decreased
although once they had learned to recognise the sound
change they often achieved quite low thresholds
It was not thought worthwhile to test separate frequency
bands in this case for two reasons First body damping is
most readily altered by a physical change of material and
this is likely to have an effect over a broad frequency range
Second it will be shown shortly that the JND for percep-
tion of a change in body damping is of the same order
as the measured standard deviation among real guitars so
that the perceptual significance is probably marginal and
digging deeper into the details is likely to be of limited
importance
42 Physical measurements
The next step is to look at physical measurements to as-
sess how these thresholds of perception compare with the
actual extent of variation between guitars Of course one
would never find two real instruments which differed by
having all the body frequencies simultaneously scaled by
03 05 1 2 3 5 100
05
1
Percentage shift
RelSTD
(a) 150-250 Hz
03 05 1 2 3 5 100
05
1
Percentage shift
RelSTD
(b) 500-1000 Hz
Figure 5 Results in the format of Figure 4 from 3AFC studies for
shifting all mode frequencies of the datum guitar lying in (a) the
band 150ndash250 Hz and (b) the band 500ndash1000 Hz using as input
a single note (open A string) The percentage shifts correspond-
ing to the best-four averages are (a) 187 (b) 153
1 12 15 2 25 30
005
01
015
02
(a)
Scale factor
RelSTD
1 12 15 2 25 30
005
01
015
02
(b)
Scale factor
RelSTD
Figure 6 Results in the format of Figure 4 from 3AFC studies
for scaling all modal Q factors of the datum guitar (a) upwards
and (b) downwards using as input a single note (open A string)
Horizontal axis shows scale factor applied by multiplication or
division to Q factors The scale factors corresponding to the best-
four averages are (a) 119 (b) 122
exactly the same factor However it is easy to visualise a
change which would in principle have this effect it would
happen if the dimensions of the guitar were all scaled
keeping the same materials and other details Some sim-
ple deductions can then be drawn by scaling analysis If
the main vibrating elements of the guitar body are treated
as thin flat plates deforming in bending then the natural
frequencies scale proportional to hd2 where d is the scale
factor for dimensions in the plane and h is the scale factor
for thickness Taking 1 as a round number for the order
of magnitude of the threshold of detection for shifting fre-
quencies it follows that the JNDs for dimensional scaling
are approximately 1 if d and h are both scaled together
(full geometric scaling) 1 again if thickness is changed
keeping the in-plane dimensions fixed and only 05 if
in-plane dimensions are scaled keeping the thickness the
same These are all very small numbers they amount to
changing in-plane dimensions no more than a few mm and
8
75 80 85 90 95 1000
10
20
30
40
50
60
70
80
Frequency (Hz)
Q
(a)
160 170 180 190 200 210 2200
10
20
30
40
50
60
70
80
Frequency (Hz)
Q
(b)
Figure 7 Modal frequencies and Q factors for 15 guitars for
the highest peak in the frequency bands (a) 75ndash100 Hz the
ldquoHelmholtz resonancerdquo (b) 150ndash250 Hz the ldquofirst top plate
moderdquo Plus and cross symbols show fits without and with com-
pensation for string damping respectively Diamond symbols
mark the datum guitar for the listening tests Open squares show
the means and range bars show one standard deviation above
and below the means for the two sets of fitted data The ranges
for the compensated results can be recognised by their higher Q
values Dashed lines near the axes show approximately 1 JND
above and below the uncompensated means from the results of
section 41
to changing a typical top plate thickness by a mere 25 microm
Real instruments have dimensional variations which are
considerably bigger than this especially in thickness so
on this ground alone it is no surprise that guitars can sound
different
The simplest approach to obtaining quantitative infor-
mation from admittance measurements on a set of gui-
tars is to perform explicit modal analysis This can only
be expected to give reliable results at relatively low fre-
quencies pole-residue extraction whatever the method
becomes sensitive once the modal overlap begins to ap-
proach unity To illustrate the kind of values which emerge
from such an analysis Figure 7 shows results for modal
frequency and Q factor for 15 guitars for the highest peak
in each of the two low-frequency bands mentioned in the
discussion of Figure 2 75ndash100 Hz the ldquoHelmholtz reso-
nancerdquo and 150ndash250 Hz the ldquofirst top plate moderdquo
A complicating factor needs to be noted The ad-
mittance measurements are made with the strings well
damped because the purpose is to obtain information
about the body behaviour without the effect of the strings
However the damped strings remove some energy from
the body vibration and this will tend to reduce the mea-
sured Q factors This effect can be compensated at least
approximately The damped strings will act essentially as
semi-infinite strings and will thus present an impedance to
the bridge which is real and if the strings are all assumed
to be attached at the same point equal to the sum of the
string impedances given by Z =radicTm From the data for
nylon strings in Table I the sum of these impedances is
212 Nsm To compensate the inverse of Y (ω) is taken
this real quantity is subtracted then the result re-inverted
to give a new admittance This approach can be expected
to work well at higher frequencies but it is hard to be sure
if the strings are well enough damped at low frequencies
to justify the semi-infinite approximation
Figure 7 shows results before and after this compensa-
tion For each case the mean and scatter are indicated by
lines showing one standard deviation above and below the
mean for frequency and Q Interestingly the standard de-
viations have a similar pattern for both cases The relative
standard deviations for frequency are 55 and 6 for the
two cases and those for Q factor about 33 in both cases
before compensation
To obtain good comparative information about modal
frequencies over a broader bandwidth is more challeng-
ing It is not possible to identify the ldquosamerdquo mode in dif-
ferent guitars except at very low frequencies sensitivity
to small structural changes increases with frequency as is
familiar in other vibration problems (see eg [15]) For
mode frequencies the threshold for audible changes is so
small that it is hard to obtain any measure which is good
enough scaling frequencies by 1 means that one guitar
body might have 101 modes in a frequency range where
another guitar had 100 and there is no known analysis
method which can give robust discrimination at this level
Any measure which can be computed shows much bigger
variability than this and there is always a strong suspicion
that it is revealing the vagaries of the analysis method more
than the real differences between guitars
Things are a little more promising in the case of damp-
ing estimation over a wide frequency range Taking the
inverse FFT of an input admittance gives an impulse re-
sponse function of the guitar body and this can be pro-
cessed using time-frequency analysis to give a sonogram
representation In each frequency band a best-fitting ex-
ponential decay can then be obtained Combining results
from several different choices of the timefrequency res-
olution tradeoff improves the robustness of the results
The process is described in more detail elsewhere [16]
Some results are shown in Figure 8 compensation for
string damping has been included In Figure 8a the discrete
points represent for the datum guitar frequencydecay
combinations which satisfied an assumed criterion for
good fit quality For compatibility with other plots decay
9
0 200 400 600 800 1000 1200 1400 1600 1800 20000
10
20
30
40
50
60
70
80
90
100
Frequency
Qfactor
(a)
0 200 400 600 800 1000 1200 1400 1600 1800 20000
20
40
60
80
100
120
Frequency
Qfactor
(b)
30 35 40 45 50 55 60 6515
20
25
30
35
40
Mean Q
Relativestandard
deviation(
)
(c)
Figure 8 Damping trends for guitar bodies determined from
time-frequency analysis (a) individual measurements of fre-
quency and equivalent Q factor (circles) and the band average
of these (solid line) for the datum guitar (b) the solid lines as
in (a) for the set of 15 guitars (c) the mean and standard devia-
tion of the results from (b) across the frequency range with range
bars indicating one standard deviation above and below the mean
on each axis The circle marks the datum guitar for the listening
tests
rate is represented as an equivalent Q factor The continu-
ous line is simply a moving band average of these discrete
points
Figure 8b then shows the band-averaged lines for the 15
guitars in the test set Finally Figure 8c shows a scatter
plot of the mean and standard deviation of these band-
averaged lines for the 15 guitars As in Figure 7 the
large cross represents one standard deviation above and
2 3 5 8 100
01
02
03
04 (a)
Scale factor
RelSTD
2 3 5 8 100
01
02
03
04 (b)
Scale factor
RelSTD
2 3 5 8 100
01
02
03
04 (c)
Scale factor
RelSTD
Figure 9 Results in the format of Figure 4 from 3AFC studies
for changing the damping parameters of the 5th string based on
datum values for the new steel strings Case (a) varying ηB test
note E2 (b) varying ηB test note C3 (c) varying ηF test note
C3 The scale factors corresponding to the best-four averages are
(a) 299 (b) 313 (c) 241
below the mean on each axis The main result is that
this frequency-averaged measure of damping has a rela-
tive standard deviation of the order of 20 comparable to
the JND found earlier for perception of damping changes
This suggests that the extremes of mean damping in the
measured set of guitars are sufficiently different that the
effect should be audible but the results do not lead one
to expect that this will be a very strong component of the
perception of tonal differences among guitars
5 Results for properties of the strings
The final set of JND experiments relates to changes in
string properties including those properties that changed
as the string aged one objective was to find out which
of those changes are likely to contribute most to the per-
ception of ageing Using as datum the properties of the
new steel strings listed in Table I changes to the damping
properties of the 5th string were investigated using single-
note test sounds These 3AFC tests were completed by 11
musicians and 5 non-musicians One test was also con-
ducted relating to changes in the bending stiffness of this
string it gave results in line with those of Jaumlrvelaumlinen et
al [7] and the details are not reproduced here The actual
bending stiffness of this string was found to be close to
the threshold for detecting an increase in bending stiffness
when starting from a much lower level In the aged string
the bending stiffness only increased by a factor 16 (see
Table I) If that change is audible at all the effect is likely
to be small
The results for the damping tests are shown in Figure 9
in a similar format to earlier 3AFC results As noted ear-
lier the perceptual effects of changing ηA for this string
10
were found to be so weak that it was not possible to con-
duct a meaningful test However both ηB and ηF gave clear
results The parameter ηB associated with bending stiff-
ness and mainly affecting higher frequencies was tested
using two different notes ldquoplayedrdquo on the same string The
results are shown in Figures 9ab and show a good level
of consistency between the two notes The spread over-
all mean and best-four mean are all very similar for both
cases The best listeners need about a factor 3 increase in
this parameter to perceive the change Note from Table I
that in the aged string this parameter increased from 0004
to 0029 that change should be very clearly audible
Figure 9c shows corresponding results for ηF All sub-
jects gave a somewhat lower threshold for this parameter
compared to ηB and the very best listener achieved a JND
of less than a factor 2 In the aged string ηF increased in
the ratio 1711 for this string from Table I This effect is
probably not audible to most listeners It can be concluded
that the factor most likely to account for the difference in
sound of the aged string is ηB
6 Conclusions
Psychoacoustical experiments have been reported to estab-
lish JND levels for the perception of changes to various
parameters of a model of synthesised guitar sound [3 4]
These investigations parallel earlier work exploring related
JNDs for violin sounds [1] The parameters investigated
here relate to the behaviour of the guitar body (modal fre-
quencies and damping factors) and of the strings (bending
stiffness and damping model parameters) All tests were
carried out using a three-alternative forced-choice method-
ology It is argued that for application to musical judge-
ments which can be very subtle the most interesting per-
ceptual thresholds are those attainable by the best listeners
under the most favourable conditions To give an estimate
of these the results for the best four subjects in each test
were averaged
Results of physical measurements have also been re-
ported to give an indication of the spread of each parame-
ter among real guitar bodies or strings A comparison with
the psychoacoustical results gives a first impression of
which quantities might be responsible for the biggest per-
ceptual differences between instruments By far the most
sensitive parameter of all those tested relates to shifting
the frequencies of body modes The best four listeners
could perceive a 1 shift when all frequencies were scaled
together a small change compared to the actual varia-
tion among guitars This performance was only degraded
slightly when the shifted frequencies were band-limited in
two different bands tested The results were of the same
order as the corresponding JNDs found for violin sounds
[1] if anything the JNDs seem to be somewhat lower for
the guitar sounds perhaps because the fully-coupled syn-
thesis method gives the listener additional auditory cues
associated with transient decay rates of the string over-
tones Body mode damping has to be changed by about
20 for perception according to the definition used here
Actual variations of modal damping exceed this level but
not by a large factor so body damping is probably quite a
minor contributor to tonal perception
String damping parameters are even less sensitive they
have to be changed by a factor of the order of 3 How-
ever this large factor does not mean that the effects are
never heard Measurements have been presented on strings
of different materials and on steel-cored strings in new
and ldquoagedrdquo conditions The damping parameters vary be-
tween these cases by factors significantly bigger than the
JNDs The results strongly indicate that the most important
parameter for the perception of the degradation of sound
in well-used strings is ηB the damping factor associated
with the bending stiffness of the string This parameter
increases greatly with age of strings probably from the
damping effect of dirt and corrosion products accumulat-
ing between the windings of the lower strings of the guitar
[13] Strings without over-winding do not deteriorate in
sound to anywhere near the same extent
The correct interpretation of the high sensitivity to shift-
ing body frequencies is not obvious The actual change in-
vestigated here moving all frequencies in step is very arti-
ficial Listeners might be responding to the actual frequen-
cies or perhaps to the change in modal density (the in-
verse of the mean spacing between resonant frequencies)
or perhaps to the shifting amplitude envelope of the body
response Modal amplitudes were not changed when the
frequencies were scaled so the amplitude pattern moves
along the frequency axis with the scaling It would re-
quire further testing to establish whether one of these fac-
tors dominates or whether all contribute significantly Such
testing would be a good target for future research to bring
the results closer to the detailed concerns of instrument
makers
Acknowledgement
The authors thank Brian Moore Ian Cross and Alan Black-
well for many helpful discussions on this work and Martin
Woodhouse Stewart French Ian Cross and James West-
brook for providing access to guitars for testing Two
anonymous reviewers are thanked for constructive sugges-
tions
References
[1] C Fritz I Cross B C J Moore J Woodhouse Perceptualthresholds for detecting modifications applied to the acous-tical properties of a violin J Acoust Soc Am 122 (2007)3640ndash3650
[2] J Woodhouse P Galluzzo The bowed string as we know ittoday Acta Acustica united with Acustica 90 (2004) 579ndash589
[3] J Woodhouse On the synthesis of guitar plucks ActaAcustica united with Acustica 90 (2004) 928ndash944
[4] J Woodhouse Plucked guitar transients comparison ofmeasurements and synthesis Acta Acustica united withAcustica 90 (2004) 945ndash965
[5] H A K Wright The acoustics and psychoacoustics of theguitar PhD Thesis Cardiff University 1996
[6] H Jaumlrvelaumlinen V Vaumllimaumlki M Karjalainen Audibility ofthe timbral effects of inharmonicity in stringed instrumenttones Acoustics Research Letters Online 2 (2001) 79ndash84
11
[7] H Jaumlrvelaumlinen M Karjalainen Perceptibility of inhar-monicity in the acoustic guitar Acta Acustica united withAcustica 92 (2006) 842ndash847
[8] D Ewins Modal testing Theory practice and applicationResearch Studies Press 2000
[9] C Valette The mechanics of vibrating strings ndash In Me-chanics of Musical Instruments A Hirshberg J Kergo-mard G Weinreich (eds) Springer-Verlag Vienna 1995
[10] H Levitt Transformed up-down methods in psychoacous-tics J Acoust Soc Am 49 (1971) 467ndash477
[11] L Cremer The physics of the violin MIT Press Cam-bridge MA 1984
[12] J B Allen On the aging of steel guitar strings CatgutAcoust Soc Newsletter 26 (1976) 27ndash28
[13] R J Hanson Analysis of ldquoliverdquo and ldquodeadrdquo guitar stringsJ Catgut Acoust Soc 48 (1987) 10ndash16
[14] B C J Moore An introduction to the psychology of hear-ing Elsevier Academic Press London 2004
[15] C S Manohar A J Keane Statistics of energy flows inspring-coupled one-dimensional subsystems Phil TransRoyal Soc London A 346 (1994) 525ndash542
[16] J Woodhouse R S Langley Interpreting the input admit-tance of violins and guitars Acta Acustica united withAcustica (2012) in press
12
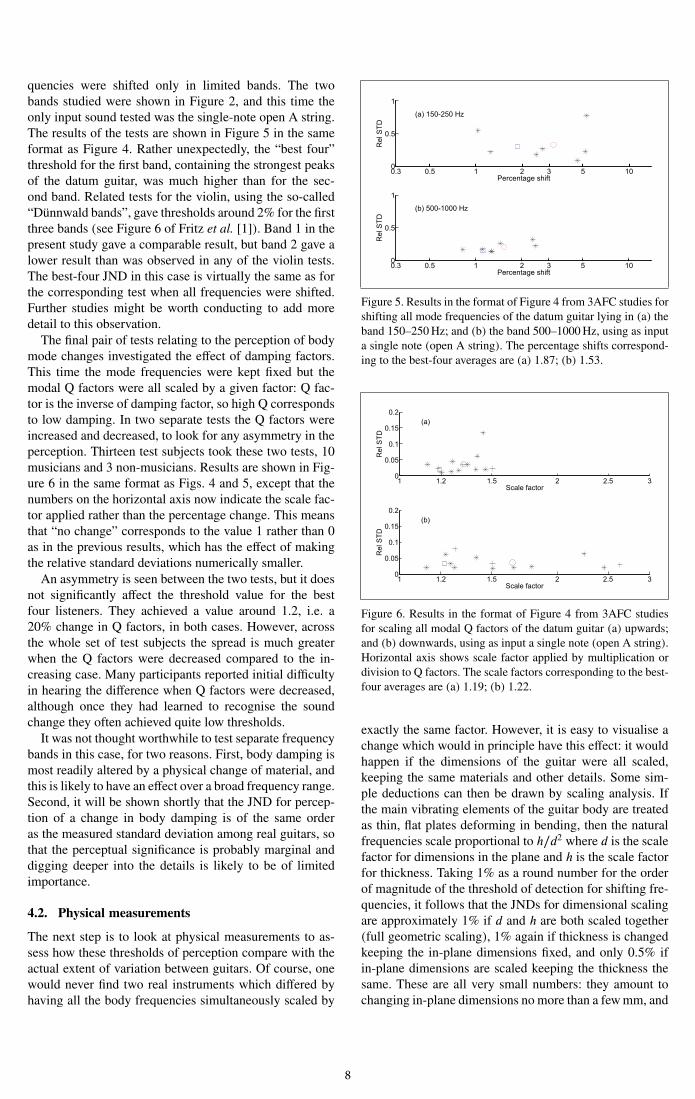
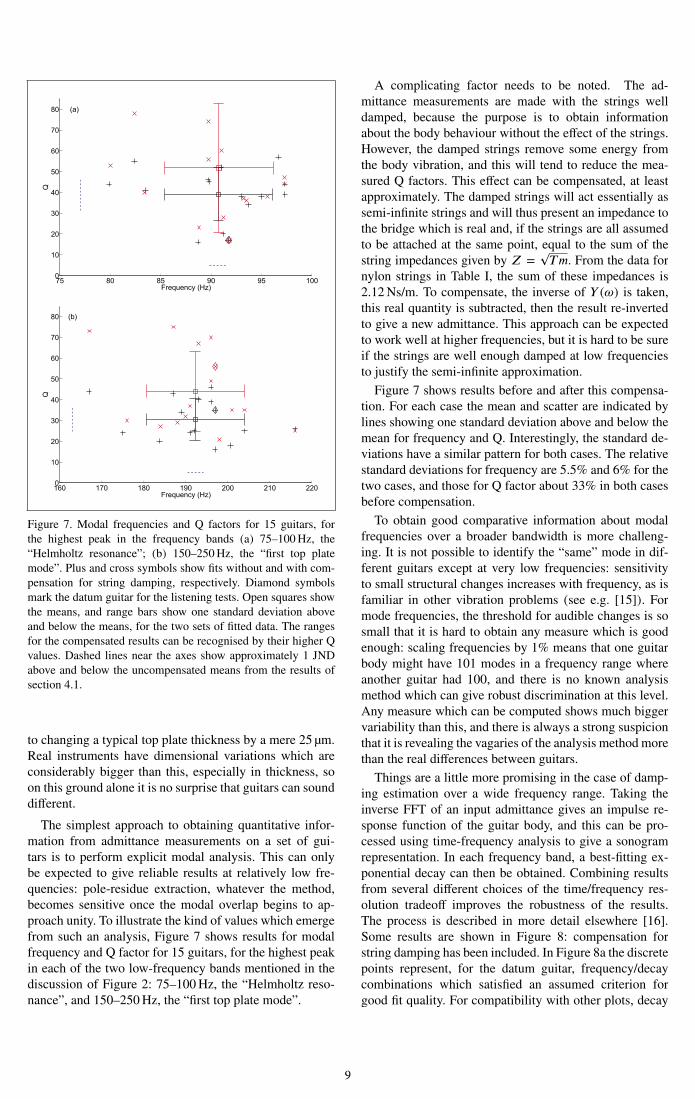
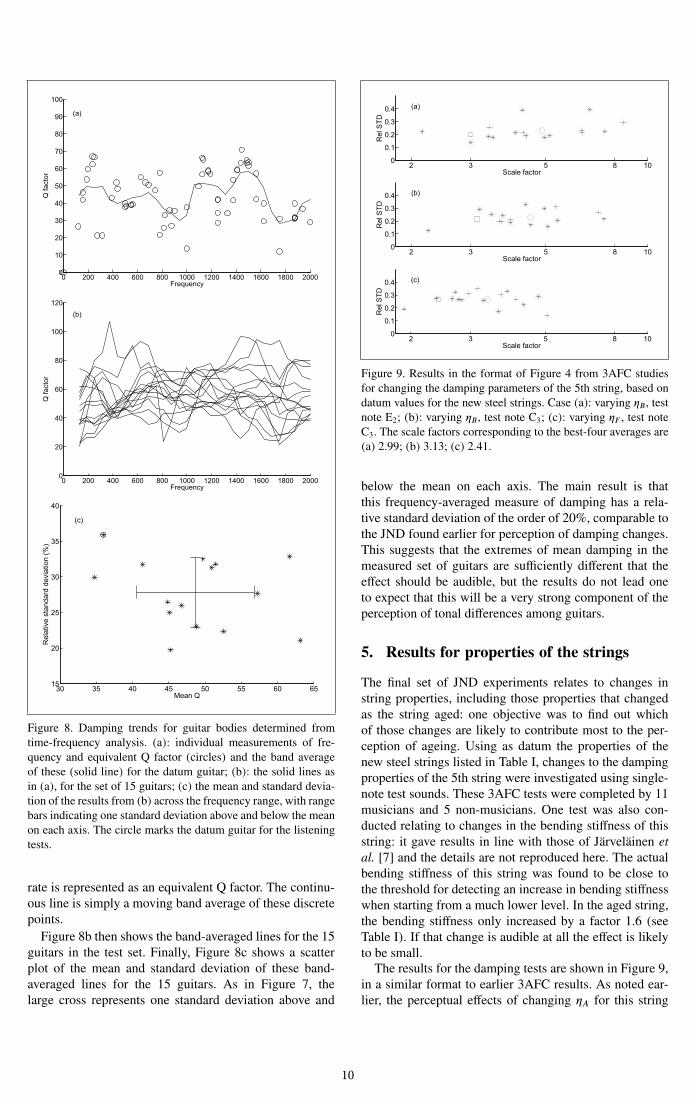
0 200 400 600 800 1000 1200 1400 1600 1800 20000
10
20
30
40
50
60
70
80
90
100
Frequency
Qfactor
(a)
0 200 400 600 800 1000 1200 1400 1600 1800 20000
20
40
60
80
100
120
Frequency
Qfactor
(b)
30 35 40 45 50 55 60 6515
20
25
30
35
40
Mean Q
Relativestandard
deviation(
)
(c)
Figure 8 Damping trends for guitar bodies determined from
time-frequency analysis (a) individual measurements of fre-
quency and equivalent Q factor (circles) and the band average
of these (solid line) for the datum guitar (b) the solid lines as
in (a) for the set of 15 guitars (c) the mean and standard devia-
tion of the results from (b) across the frequency range with range
bars indicating one standard deviation above and below the mean
on each axis The circle marks the datum guitar for the listening
tests
rate is represented as an equivalent Q factor The continu-
ous line is simply a moving band average of these discrete
points
Figure 8b then shows the band-averaged lines for the 15
guitars in the test set Finally Figure 8c shows a scatter
plot of the mean and standard deviation of these band-
averaged lines for the 15 guitars As in Figure 7 the
large cross represents one standard deviation above and
2 3 5 8 100
01
02
03
04 (a)
Scale factor
RelSTD
2 3 5 8 100
01
02
03
04 (b)
Scale factor
RelSTD
2 3 5 8 100
01
02
03
04 (c)
Scale factor
RelSTD
Figure 9 Results in the format of Figure 4 from 3AFC studies
for changing the damping parameters of the 5th string based on
datum values for the new steel strings Case (a) varying ηB test
note E2 (b) varying ηB test note C3 (c) varying ηF test note
C3 The scale factors corresponding to the best-four averages are
(a) 299 (b) 313 (c) 241
below the mean on each axis The main result is that
this frequency-averaged measure of damping has a rela-
tive standard deviation of the order of 20 comparable to
the JND found earlier for perception of damping changes
This suggests that the extremes of mean damping in the
measured set of guitars are sufficiently different that the
effect should be audible but the results do not lead one
to expect that this will be a very strong component of the
perception of tonal differences among guitars
5 Results for properties of the strings
The final set of JND experiments relates to changes in
string properties including those properties that changed
as the string aged one objective was to find out which
of those changes are likely to contribute most to the per-
ception of ageing Using as datum the properties of the
new steel strings listed in Table I changes to the damping
properties of the 5th string were investigated using single-
note test sounds These 3AFC tests were completed by 11
musicians and 5 non-musicians One test was also con-
ducted relating to changes in the bending stiffness of this
string it gave results in line with those of Jaumlrvelaumlinen et
al [7] and the details are not reproduced here The actual
bending stiffness of this string was found to be close to
the threshold for detecting an increase in bending stiffness
when starting from a much lower level In the aged string
the bending stiffness only increased by a factor 16 (see
Table I) If that change is audible at all the effect is likely
to be small
The results for the damping tests are shown in Figure 9
in a similar format to earlier 3AFC results As noted ear-
lier the perceptual effects of changing ηA for this string
10
were found to be so weak that it was not possible to con-
duct a meaningful test However both ηB and ηF gave clear
results The parameter ηB associated with bending stiff-
ness and mainly affecting higher frequencies was tested
using two different notes ldquoplayedrdquo on the same string The
results are shown in Figures 9ab and show a good level
of consistency between the two notes The spread over-
all mean and best-four mean are all very similar for both
cases The best listeners need about a factor 3 increase in
this parameter to perceive the change Note from Table I
that in the aged string this parameter increased from 0004
to 0029 that change should be very clearly audible
Figure 9c shows corresponding results for ηF All sub-
jects gave a somewhat lower threshold for this parameter
compared to ηB and the very best listener achieved a JND
of less than a factor 2 In the aged string ηF increased in
the ratio 1711 for this string from Table I This effect is
probably not audible to most listeners It can be concluded
that the factor most likely to account for the difference in
sound of the aged string is ηB
6 Conclusions
Psychoacoustical experiments have been reported to estab-
lish JND levels for the perception of changes to various
parameters of a model of synthesised guitar sound [3 4]
These investigations parallel earlier work exploring related
JNDs for violin sounds [1] The parameters investigated
here relate to the behaviour of the guitar body (modal fre-
quencies and damping factors) and of the strings (bending
stiffness and damping model parameters) All tests were
carried out using a three-alternative forced-choice method-
ology It is argued that for application to musical judge-
ments which can be very subtle the most interesting per-
ceptual thresholds are those attainable by the best listeners
under the most favourable conditions To give an estimate
of these the results for the best four subjects in each test
were averaged
Results of physical measurements have also been re-
ported to give an indication of the spread of each parame-
ter among real guitar bodies or strings A comparison with
the psychoacoustical results gives a first impression of
which quantities might be responsible for the biggest per-
ceptual differences between instruments By far the most
sensitive parameter of all those tested relates to shifting
the frequencies of body modes The best four listeners
could perceive a 1 shift when all frequencies were scaled
together a small change compared to the actual varia-
tion among guitars This performance was only degraded
slightly when the shifted frequencies were band-limited in
two different bands tested The results were of the same
order as the corresponding JNDs found for violin sounds
[1] if anything the JNDs seem to be somewhat lower for
the guitar sounds perhaps because the fully-coupled syn-
thesis method gives the listener additional auditory cues
associated with transient decay rates of the string over-
tones Body mode damping has to be changed by about
20 for perception according to the definition used here
Actual variations of modal damping exceed this level but
not by a large factor so body damping is probably quite a
minor contributor to tonal perception
String damping parameters are even less sensitive they
have to be changed by a factor of the order of 3 How-
ever this large factor does not mean that the effects are
never heard Measurements have been presented on strings
of different materials and on steel-cored strings in new
and ldquoagedrdquo conditions The damping parameters vary be-
tween these cases by factors significantly bigger than the
JNDs The results strongly indicate that the most important
parameter for the perception of the degradation of sound
in well-used strings is ηB the damping factor associated
with the bending stiffness of the string This parameter
increases greatly with age of strings probably from the
damping effect of dirt and corrosion products accumulat-
ing between the windings of the lower strings of the guitar
[13] Strings without over-winding do not deteriorate in
sound to anywhere near the same extent
The correct interpretation of the high sensitivity to shift-
ing body frequencies is not obvious The actual change in-
vestigated here moving all frequencies in step is very arti-
ficial Listeners might be responding to the actual frequen-
cies or perhaps to the change in modal density (the in-
verse of the mean spacing between resonant frequencies)
or perhaps to the shifting amplitude envelope of the body
response Modal amplitudes were not changed when the
frequencies were scaled so the amplitude pattern moves
along the frequency axis with the scaling It would re-
quire further testing to establish whether one of these fac-
tors dominates or whether all contribute significantly Such
testing would be a good target for future research to bring
the results closer to the detailed concerns of instrument
makers
Acknowledgement
The authors thank Brian Moore Ian Cross and Alan Black-
well for many helpful discussions on this work and Martin
Woodhouse Stewart French Ian Cross and James West-
brook for providing access to guitars for testing Two
anonymous reviewers are thanked for constructive sugges-
tions
References
[1] C Fritz I Cross B C J Moore J Woodhouse Perceptualthresholds for detecting modifications applied to the acous-tical properties of a violin J Acoust Soc Am 122 (2007)3640ndash3650
[2] J Woodhouse P Galluzzo The bowed string as we know ittoday Acta Acustica united with Acustica 90 (2004) 579ndash589
[3] J Woodhouse On the synthesis of guitar plucks ActaAcustica united with Acustica 90 (2004) 928ndash944
[4] J Woodhouse Plucked guitar transients comparison ofmeasurements and synthesis Acta Acustica united withAcustica 90 (2004) 945ndash965
[5] H A K Wright The acoustics and psychoacoustics of theguitar PhD Thesis Cardiff University 1996
[6] H Jaumlrvelaumlinen V Vaumllimaumlki M Karjalainen Audibility ofthe timbral effects of inharmonicity in stringed instrumenttones Acoustics Research Letters Online 2 (2001) 79ndash84
11
[7] H Jaumlrvelaumlinen M Karjalainen Perceptibility of inhar-monicity in the acoustic guitar Acta Acustica united withAcustica 92 (2006) 842ndash847
[8] D Ewins Modal testing Theory practice and applicationResearch Studies Press 2000
[9] C Valette The mechanics of vibrating strings ndash In Me-chanics of Musical Instruments A Hirshberg J Kergo-mard G Weinreich (eds) Springer-Verlag Vienna 1995
[10] H Levitt Transformed up-down methods in psychoacous-tics J Acoust Soc Am 49 (1971) 467ndash477
[11] L Cremer The physics of the violin MIT Press Cam-bridge MA 1984
[12] J B Allen On the aging of steel guitar strings CatgutAcoust Soc Newsletter 26 (1976) 27ndash28
[13] R J Hanson Analysis of ldquoliverdquo and ldquodeadrdquo guitar stringsJ Catgut Acoust Soc 48 (1987) 10ndash16
[14] B C J Moore An introduction to the psychology of hear-ing Elsevier Academic Press London 2004
[15] C S Manohar A J Keane Statistics of energy flows inspring-coupled one-dimensional subsystems Phil TransRoyal Soc London A 346 (1994) 525ndash542
[16] J Woodhouse R S Langley Interpreting the input admit-tance of violins and guitars Acta Acustica united withAcustica (2012) in press
12
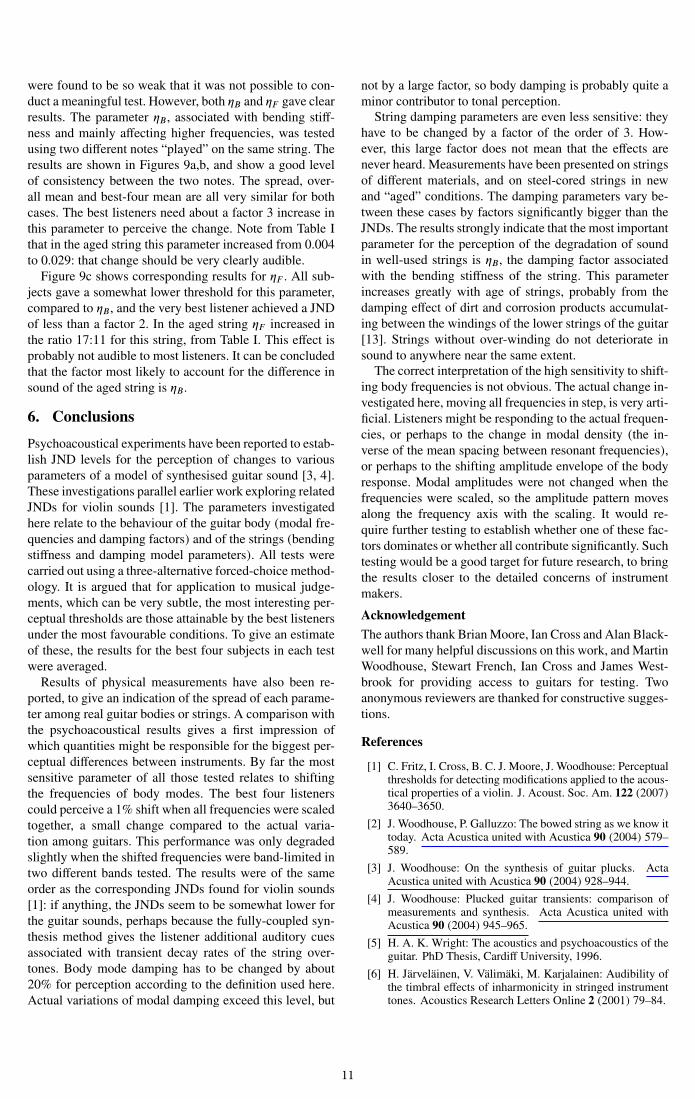
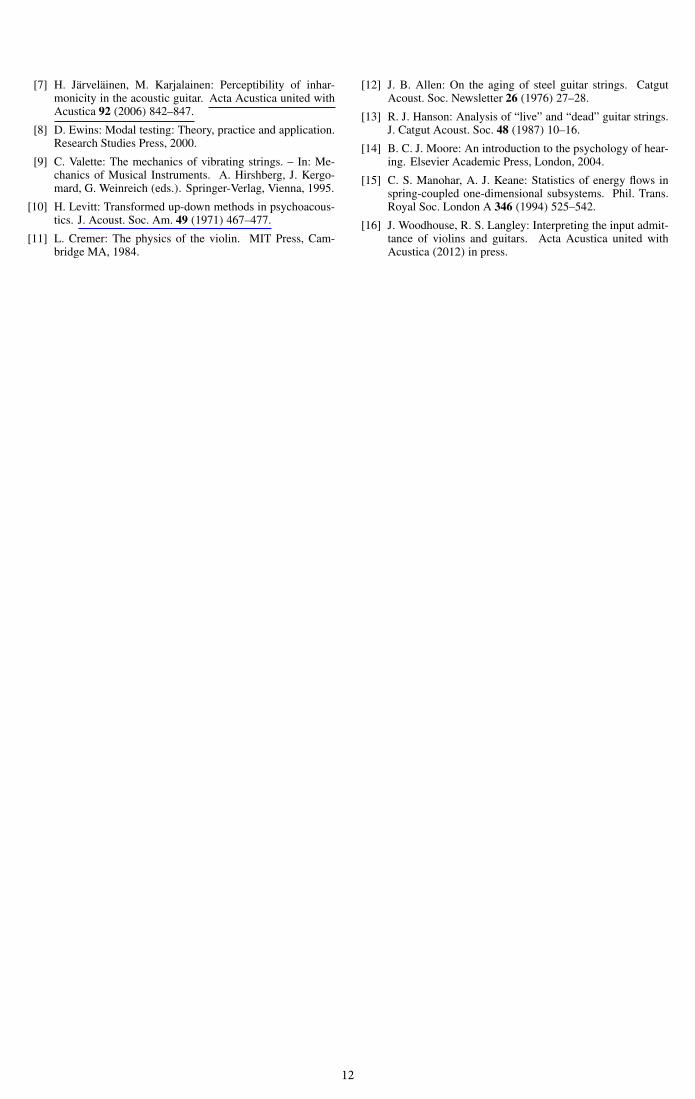