Sucrose Thresholds and Genetic Polymorphisms of Sweet ...
233
University of Pennsylvania University of Pennsylvania ScholarlyCommons ScholarlyCommons Publicly Accessible Penn Dissertations 2015 Sucrose Thresholds and Genetic Polymorphisms of Sweet and Sucrose Thresholds and Genetic Polymorphisms of Sweet and Bitter Taste Receptor Genes in Children Bitter Taste Receptor Genes in Children Paule Valery Joseph University of Pennsylvania, [email protected] Follow this and additional works at: https://repository.upenn.edu/edissertations Part of the Genetics Commons, Human and Clinical Nutrition Commons, and the Nursing Commons Recommended Citation Recommended Citation Joseph, Paule Valery, "Sucrose Thresholds and Genetic Polymorphisms of Sweet and Bitter Taste Receptor Genes in Children" (2015). Publicly Accessible Penn Dissertations. 1793. https://repository.upenn.edu/edissertations/1793 This paper is posted at ScholarlyCommons. https://repository.upenn.edu/edissertations/1793 For more information, please contact [email protected].
-
Upload
khangminh22 -
Category
Documents
-
view
2 -
download
0
Transcript of Sucrose Thresholds and Genetic Polymorphisms of Sweet ...

University of Pennsylvania University of Pennsylvania
ScholarlyCommons ScholarlyCommons
Publicly Accessible Penn Dissertations
2015
Sucrose Thresholds and Genetic Polymorphisms of Sweet and Sucrose Thresholds and Genetic Polymorphisms of Sweet and
Bitter Taste Receptor Genes in Children Bitter Taste Receptor Genes in Children
Paule Valery Joseph University of Pennsylvania, [email protected]
Follow this and additional works at: https://repository.upenn.edu/edissertations
Part of the Genetics Commons, Human and Clinical Nutrition Commons, and the Nursing Commons
Recommended Citation Recommended Citation Joseph, Paule Valery, "Sucrose Thresholds and Genetic Polymorphisms of Sweet and Bitter Taste Receptor Genes in Children" (2015). Publicly Accessible Penn Dissertations. 1793. https://repository.upenn.edu/edissertations/1793
This paper is posted at ScholarlyCommons. https://repository.upenn.edu/edissertations/1793 For more information, please contact [email protected].

Sucrose Thresholds and Genetic Polymorphisms of Sweet and Bitter Taste Sucrose Thresholds and Genetic Polymorphisms of Sweet and Bitter Taste Receptor Genes in Children Receptor Genes in Children
Abstract Abstract SUCROSE THRESHOLDS AND GENETIC POLYMORPHISMS OF SWEET AND BITTER TASTE RECEPTOR GENES IN CHILDREN
Paule Valery Joseph
Charlene Compher, PhD, RD
Background: Many illnesses of modern society are due to poor food choices. Excess consumption of sugars has been associated with obesity and diabetes. Children, due to their basic biology, are more vulnerable than adults to overeat foods rich in sugars. Little research has focused on whether there are individual differences among children in their sensitivity to sweet taste and if so the biological correlates of such differences.
Aims: The goal of this study was to determine whether variations in children’s sucrose detection thresholds relate to their age and sex, taste genotype, added sugar or caloric intake, temperament or food neophobia and adiposity.
Methods: Sucrose detection thresholds in children age 7-14 years were tested individually using a validated two-alternative, forced-choice, paired-comparison tracking method. Genetic variants of taste receptor genes were assayed: TAS1R2, TAS1R3 and GNAT3 (sweet taste receptor genes; one variant each) and the bitter receptor gene TAS2R38 (three variants). Children (n=216) were measured for body weight and height. A subset of 96 children was measured for percent body fat, waist to height ratio and added sugar and kcal intake.
Results: Mean sucrose threshold was 12.0 (SD 12.9), 0.23 to 153.8 mM. Girls were more sensitive than boys [t(214) = 2.0, p=0.047] and older children more sensitive than younger children [r(214) = -0.16, p = 0.016]. Variants in the bitter but not the sweet taste receptor genes were related to sucrose threshold and sugar intake; children with two bitter-sensitive alleles could detect sucrose at lower concentrations [F(2,165) = 4.55, p = 0.012; rs1726866]. Children with these variants also reported eating more added sugar (%kcals; [F(2, 62) = 3.64, p = 0.032]) than did children with less sensitive alleles. Sucrose detection thresholds predicted central adiposity [F(2, 59) = 6.1, p = 0.016), but not percent body fat [F(2, 58) = 1.4, p = 0.238]) when adjusted for added sugar intake, temperament, age, sex and negative reaction to foods.
Conclusions: Differences in sweet taste sensitivity may affect childhood dietary sugar intake with long-term health consequences, including obesity. There may be a more complex interplay between the bitter and sweet taste systems during development than previously appreciated. Understanding taste related parameters as well as other dimensions that may affect food consumption might help in developing weight management to minimize childhood obesity risk.
Degree Type Degree Type Dissertation
Degree Name Degree Name Doctor of Philosophy (PhD)
Graduate Group Graduate Group Nursing

First Advisor First Advisor Charlene W. Compher
Second Advisor Second Advisor Danielle R. Reed
Keywords Keywords Diet, Genetics, Obesity, Polymorphism, Sucrose, Thresholds
Subject Categories Subject Categories Genetics | Human and Clinical Nutrition | Nursing | Nutrition
This dissertation is available at ScholarlyCommons: https://repository.upenn.edu/edissertations/1793

SUCROSE THRESHOLDS AND GENETIC POLYMORPHISMS OF SWEET AND
BITTER TASTE RECEPTOR GENES IN CHILDREN
Paule Valery Joseph, MSN, CRNP, CTN-B
A DISSERTATION
in
Nursing
Presented to the Faculties of the University of Pennsylvania
in
Partial Fulfillment of the Requirements for the
Degree of Doctor of Philosophy
2015
Supervisor of Dissertation Co-Supervisor of Dissertation ___________________________ ___________________________
Charlene W. Compher, PhD, RD, FADA Danielle R. Reed, PhD Professor of Nutrition Science Member, Monell Chemical Senses Center Graduate Group Chairperson _________________________ Connie Ulrich, PhD, RN, FAAN Associate Professor of Nursing; and Associate Professor of Bioethics, Department of Medical Ethics, School of Medicine
Dissertation Committee Marilyn S. Sommers, PhD, RN, FAAN Lillian S. Brunner Professor of Medical-Surgical Nursing Danielle Reed, PhD Member, Monell Chemical Senses Center Julie Mennella, PhD Member, Monell Chemical Senses Center

SUCROSE THRESHOLDS AND GENETIC POLYMORPHISMS OF SWEET AND
BITTER TASTE RECEPTOR GENES IN CHILDREN
COPYRIGHT©
2015
Paule Valery Joseph
This work is licensed under the Creative Commons Attribution-NonCommercial-
ShareAlike 3.0 License
To view a copy of this license, visit
http://creativecommons.org/licenses/by-ny-sa/2.0/

iii
DEDICATION
I dedicate my dissertation work to my family and my loving partner.
“The best kind of people, are the ones that come into your life, and make you see the sun
where you once saw clouds. The people that believe in you so much, you start to believe
in you yourself. The people that love you simply for being you. The once in a lifetime
kind of people.”-~Unknown

iv
ACKNOWLEDGMENTS
I would like to first thank the members of my interdisciplinary dissertation
committee—not only for their time and extreme patience, but also for their intellectual
contributions to my development as a nurse scientist. I would like to acknowledge my
dissertation chair and academic mentor, Dr. Charlene Compher, who supported my idea
of choosing a study in genetics for my dissertation, for her unconditional time and
support. Thank you to Dr. Danielle Reed for taking a chance with me despite my
unconventional career trajectory, for her time and dedication to mentor me. Thank you
for the Friday afternoon science discussions, they certainly allowed me to explore things
through different lenses and more specially thank you for giving me the opportunity to
develop my science in her laboratory. Thank you to Dr. Julie Mennella for all of her
advice and the generous use of her dataset for this project. I am grateful she agreed to
serve as a member of my dissertation committee, for challenging me and pushing my
thinking. Also my gratitude to Dr. Marilyn Sommers for helping me think about
methodological and disparity issues and for the many thought-provoking questions and
ideas. Thank you for being a member of my dissertation committee. Without all of their
guidance, persistence and constant sharing of their perils of wisdom this dissertation
would have not been possible. I would like to express my appreciation to a number of
readers who contributed their time during my studies Drs. Linda Hatfield, Bart de Jonghe,
Joseph Libonati and Yvonne Paterson.

v
My sincere regards to many people at Monell Chemical Senses Center, but a
special token of gratitude to Anna Lysenko, Michael Marquis, Corrine Mansfield, Lauren
Shaw, Loma Inamdar, Susana Finkbeiner, Daniel Hwang, Charles Arayata (CJ), Dr.
Nuala Bobowski, Dr. Valentina Parma, Dr. Casey Trimmer and Dr. Katharine Prigge
their expert technical assistance and friendship. My experience in the lab was greatly
enhanced thanks to the support they provided. Specially thanks to Ms. Patricia J. Watson
for her valuable editorial assistance.
My utmost gratitude to people at Penn. Particularly to Jesse Chittams who
provided insight and statistical expertise that greatly assisted my dissertation. Thank you
to Dr. Sherry Morgan from the biomedical library for the innumerable times she provided
help. I would also like to thank my very amazing PhD cohort and other doctoral students
at Penn Nursing and other programs at Penn for their friendship, care and moral support.
The PhD program can be very isolating and lonely. I have been blessed to find a tight-
knit group of friends to commiserate with. I will always appreciate all they have done for
me and the many prayers.
Profound thanks to my hard working parents who have sacrificed their lives for
my sister and I. My parents unconditionally and good examples have taught me to work
hard for the things that I aspire to achieve and for instilling in me the importance of
responsibility, endurance and education. They provided unconditional love and care. I
certainly would not have made it this far without them. Thank you to my lovely sister,
who has been my best friend and beacon of support during my PhD program. Also to the
rest of my family with my warmest regards for believing in me and supporting me when

vi
all I had was a dream to come to America. Finally, to my partner I could have not asked
for a better companion. Thank you for being my best friend and my rock, your
unconditional support and encouragement helped me when I needed it the most. Thanks
for always listening and being my cheerleader. To all, I will always be grateful for your
constant prayers, source of support and encouragement during the times of success and
challenges. I am truly thankful for having each of you in my life. Above all, I owe it all to
God Almighty for granting me the wisdom, health and strength to undertake this journey and
enabling me to its completion.
FUNDING ACKNOWLEDGEMENTS
I am most grateful to the funding agencies that supported my training:
1. Training grant for Research on Vulnerable Women, Children, and
Families (T32NR007100) from the National Institute of Nursing
Research of the National Institute of Health to the University of
Pennsylvania, School of Nursing (awarded to M. Sommers).
2. Johnson and Johnson, American Association of Colleges of Nursing
3. International Society Of Nurses in Genetics
4. Fontaine Society at the University of Pennsylvania
This work was supported by the National Institute of Deafness and Other
Communication Disorders (NIDCD), National Institutes of Health (NIH), grant R01
DC011287 and an investigator-initiated grant from Ajinomoto, Inc., to Julie Mennella,
PhD. Research Award received by Ms. Paule Joseph from the International Society of
Nurses in Genetics helped support the purchase of assays use for genotyping samples.
Ms. Paule Joseph was supported by training grant T32NR007100 from the National
Institute of Nursing Research of the National Institutes of Health to the University of

vii
Pennsylvania, School of Nursing (awarded to M. Sommers). The content is solely the
responsibility of the authors and does not necessarily represent the official views of
NIDCD or NIH.

viii
ABSTRACT
SUCROSE THRESHOLDS AND GENETIC POLYMORPHISMS OF SWEET AND
BITTER TASTE RECEPTOR GENES IN CHILDREN
Paule Valery Joseph
Charlene Compher, PhD, RD
Background: Many illnesses of modern society are due to poor food choices. Excess
consumption of sugars has been associated with obesity and diabetes. Children, due to
their basic biology, are more vulnerable than adults to overeat foods rich in sugars. Little
research has focused on whether there are individual differences among children in their
sensitivity to sweet taste and if so the biological correlates of such differences.
Aims: The goal of this study was to determine whether variations in children’s sucrose
detection thresholds relate to their age and sex, taste genotype, added sugar or caloric
intake, temperament or food neophobia and adiposity.
Methods: Sucrose detection thresholds in children age 7-14 years were tested
individually using a validated two-alternative, forced-choice, paired-comparison tracking
method. Genetic variants of taste receptor genes were assayed: TAS1R2, TAS1R3 and
GNAT3 (sweet taste receptor genes; one variant each) and the bitter receptor gene
TAS2R38 (three variants). Children (n=216) were measured for body weight and height.
A subset of 96 children was measured for percent body fat, waist to height ratio and
added sugar and kcal intake.

ix
Results: Mean sucrose threshold was 12.0 (SD 12.9), 0.23 to 153.8 mM. Girls were more
sensitive than boys [t (214) = 2.0, p=0.047] and older children more sensitive than
younger children [r (214) = -0.16, p = 0.016]. Variants in the bitter but not the sweet taste
receptor genes were related to sucrose threshold and sugar intake; children with two
bitter-sensitive alleles could detect sucrose at lower concentrations [F (2,165) = 4.55, p =
0.012; rs1726866]. Children with these variants also reported eating more added sugar (%
kcals; [F (2, 62) = 3.64, p = 0.032]) than did children with less sensitive alleles. Sucrose
detection thresholds predicted central adiposity [F (2, 59) = 6.1, p = 0.016), but not
percent body fat [F (2, 58) = 1.4, p = 0.238]) when adjusted for added sugar intake,
temperament, age, sex and negative reaction to foods.
Conclusions: Differences in sweet taste sensitivity may affect childhood dietary sugar
intake with long-term health consequences, including obesity. There may be a more
complex interplay between the bitter and sweet taste systems during development than
previously appreciated. Understanding taste related parameters as well as other
dimensions that may affect food consumption might help in developing weight
management to minimize childhood obesity risk.

x
Table of Contents
DEDICATION .............................................................................................................. iii
ABSTRACT ................................................................................................................ viii
Introduction ................................................................................................................... 1
Purpose and Significance .............................................................................................. 7
Specific Aims ................................................................................................................ 10
Theoretical Framework and Conceptual Model ...................................................... 11
Concepts and Definitions ............................................................................................ 16
CHAPTER 2 .................................................................................................................... 20
Development of Taste .................................................................................................. 23
Taste and Age .............................................................................................................. 24
Fetus.............................................................................................................................. 24
Newborn ....................................................................................................................... 25
Infant ............................................................................................................................ 26
Childhood and Adolescence ....................................................................................... 27
Taste and Race ............................................................................................................. 30
Taste and Gender ........................................................................................................ 31
Taste and Disease ........................................................................................................ 31
Biology of Taste ........................................................................................................... 33
Anatomy of the Gustatory System ............................................................................. 33
xi
Genetics of Sweet and Bitter Taste ............................................................................ 35
Sweet and Bitter Taste Transduction Pathway ........................................................ 43
Sweet Taste Detection in Children and Adults ......................................................... 46
CHAPTER 3 .................................................................................................................... 61
Research Design and Methods ................................................................................... 61
Research Design........................................................................................................... 61
Recruitment, Setting and Consent ............................................................................. 61
Inclusion and Exclusion Criteria ............................................................................... 63
Methods and Procedures ............................................................................................ 63
Demographic Information .......................................................................................... 64
Sucrose Detection Thresholds .................................................................................... 65
Preparation of Sucrose Solutions ............................................................................... 65
Children’s Testing and Training for Sucrose Detection Thresholds ...................... 65
Single Nucleotide Polymorphism (SNP) Selection ................................................... 69
Genotyping ................................................................................................................... 73
Adiposity Measures ..................................................................................................... 74
Height and Weight ...................................................................................................... 74
Body Mass Index (BMI) Categories and BMI z-Scores ........................................... 74
Waist Circumference (WC) ........................................................................................ 77
Waist-to-Height Ratio (WHtR) .................................................................................. 77
Diet Related Food Behaviors ...................................................................................... 78

xii
Dietary Intake .............................................................................................................. 78
Personal Characteristics ............................................................................................. 79
Child’s Temperament Questionnaire and Food Neophobia Scale (FNS) .............. 79
Instrumentation: Validity and Reliability ................................................................ 81
Study Variables ........................................................................................................... 82
Importance of the Knowledge Gained ....................................................................... 82
Data Analysis Plan .......................................................................................................... 83
Data Management ....................................................................................................... 83
Screening for Missing Data, Normality, Linearity and Multi-collinearity ............ 84
Assessing for Selection Bias ........................................................................................ 84
Statistical Analysis for Sample Description .............................................................. 85
Statistical Analysis of Aim 1 ....................................................................................... 85
Statistical Analysis for Aim 2 ..................................................................................... 86
Analysis Plan for Multivariable Model Aim 2 .......................................................... 87
Analysis Plan for Multivariable Model Aim 3 .......................................................... 88
CHAPTER 4 .................................................................................................................... 90
Results .............................................................................................................................. 90
Normality test using Kolmogorov-Smirnov (K-S) test............................................. 90
Results from Assessing for Selection Bias ................................................................. 91
Subject Characteristics ............................................................................................... 94
Results for Aim 1 ....................................................................................................... 101

xiii
Relationship of Sucrose Detection Thresholds with Age and Sex ......................... 101
Results for Aim 2 ....................................................................................................... 112
Relationship of Sucrose Detection Thresholds to Genotype ................................. 114
Multivariate ANOVA Models for Sucrose Thresholds .......................................... 120
Analysis for Aim 3 ..................................................................................................... 122
Relationship of Sucrose Detection Thresholds with Adiposity Measures ............ 122
Relationship of Diet-related Food Behaviors with Adiposity Measures .............. 122
CHAPTER 5 .................................................................................................................. 126
Synthesis and Discussion .......................................................................................... 126
Conceptual Model- Revised ...................................................................................... 131
Limitations of the Study ........................................................................................... 132
Implications................................................................................................................ 134
Future Directions....................................................................................................... 135
Summary .................................................................................................................... 137
Appendix A .................................................................................................................... 138
Sucrose Dilution Instructions for Threshold .......................................................... 138
Appendix B .................................................................................................................... 142
Taste Threshold Training Protocol ......................................................................... 142
Appendix C .................................................................................................................... 143
Protocol for Testing Sweet Sensitivity ..................................................................... 143

xiv
Appendix D .................................................................................................................... 144
Protocol to use Threshold Grids for Taste .............................................................. 144
Appendix E .................................................................................................................... 146
Threshold Grid Score Sheet ..................................................................................... 146
Appendix F .................................................................................................................... 147
Approaches to Calculating Goldberg Cutoff .......................................................... 147
Appendix G .................................................................................................................... 149
Child’s Temperament Questionnaire and Food Neophobia Scale (FNS) ............ 149
Appendix H .................................................................................................................... 150
Child’s Temperament Questionnaire and Food Neophobia Scale (FNS) Scoring
Sheet............................................................................................................................ 150
Appendix I ..................................................................................................................... 151
BuccalAmpTM DNA Quick Extract DNA Extraction Protocol for Collection Swabs
..................................................................................................................................... 151
Appendix J ..................................................................................................................... 152
Orangene® DNA Laboratory Protocol for Manual Purification of DNA from 4.0
mL of Oragene®•DNA/saliva ................................................................................... 152
Appendix K .................................................................................................................... 153
TaqMan® GTXpress™ Master Mix Protocol ........................................................ 153
Appendix L .................................................................................................................... 154

xv
Copyright Clearance Center's RightsLink® Service with Elsevier ......................... 154

xvi
LIST OF TABLES
TABLE 1. TABLE OF CONCEPTS AND DEFINITIONS .............................................17 TABLE 2. SUMMARY OF STUDIES REPORTING SUCROSE DETECTION THRESHOLDS IN CHILDREN AND ADULTS ........................................................... 50 TABLE 3. INCLUSION AND EXCLUSION CRITERIA ............................................. 64 TABLE 4. VARIABLES INCLUDED IN ANALYSES ................................................. 65 TABLE 5. TASTE RECEPTOR GENES AND SIHNALING PROTEINS AND RELATED SINGLE NUCLEOTIDE POLYMORPHISMS........................................... 72 TABLE 6. VALIDITY AND RELIABILITY OF INSTRUMENTS .............................. 82 TABLE 7. VARIABLES AND METHODS ................................................................... 83 TABLE 8. NORMALITY TEST USING KOLMOGOROV-SMIRNOV (K-S) TEST....91 TABLE 9. T- TEST OR CHI- SQUARE (Χ2) COMPARISON FOR SUCROSE THRESHOLDS AND AGE FOR THE ORIGINAL STUDIES ..................................... 93 TABLE 10. CHILD, MATERNAL AND HOUSEHOLD CHARACTERISTICS OF PARTICIPANTS ............................................................................................................. 97 TABLE 11. CORRELATIONS (R) BETWEEN SUCROSE DETECTION THRESHOLDS, PERSONALITY CHARACTERISTICS AND DIET RELATED FOOD BEHAVIORS MEASURES AND AGE ...................................................................... 110 TABLE 12. T- TEST FOR SUCROSE THRESHOLDS, PERSONALITY CHARACTERISTICS AND DIET RELATED FOOD BEHAVIORS BY SEX ......... 111 TABLE 13. CORRELATIONS (R) SUCROSE DETECTION THRESHOLDS WITH ADIPOSITY MEASURES, PERSONAL CHARACTERISTICS AND DIET RELATED FOOD BEHAVIORS ..................................................................................................... 112 TABLE 14. HARDY WEINBERG EQUILIBRIUM CALCULATIONS .................... 114 TABLE 15. SUCROSE DETECTION THRESHOLDS IN CHILDREN GROUPED BY TASTE GENOTYPE ..................................................................................................... 115

xvii
TABLE 16. AGE, GENOTYPE, AND SEX EFFECTS ON SUCROSE DETECTION THRESHOLDS FOR ALL CHILDREN ....................................................................... 121 TABLE 17. AGE, GENOTYPE, AND SEX EFFECTS ON SUCROSE DETECTION THRESHOLDS FOR SUBSET OF CHILDREN ......................................................... 122 TABLE 18. AGE, SEX, GENOTYPE, AND ADIPOSITY EFFECTS ON SUCROSE DETECTION THRESHOLDS IN THE SUBSET OF CHILDREN ............................. 122 TABLE 19. CORRELATIONS (R) BETWEEN DIET -RELATED FOOD BEHAVIORS AND ADIPOSITY MEASURES .................................................................................. 124 TABLE 20. CORRELATIONS (R) BETWEEN PERSONALITY CHARACTERISTICS AND ADIPOSITY MEASURES .................................................................................. 124 TABLE 21. AGE, SEX, ACTIVITY, ADDED SUGARS, AND SUCROSE DETECTION THRESHOLDS EFFECTS ON ADIPOSITY (WHTR) ........................ 125 TABLE 22. AGE, SEX, ACTIVITY, ADDED SUGARS AND SUCROSE DETECTION THRESHOLDS EFFECTS ON ADIPOSITY (%BODY FAT) .................................... 126

xviii
LIST OF ILLUSTRATIONS
FIGURE 1. CONTENTO'S MODEL OF INFLUENCES ON FOOD CHOICES .............. 2
FIGURE 2. INTEGRATED THEORETICAL FRAMEWORKS ........................................ 14
FIGURE 3. CONCEPTUAL MODEL: WITH HYPOTHESIZED LINKS ......................... 16
FIGURE 4. TASTE BUDS................................................................................................. 34
FIGURE 5. TYPE OF TASTE CELLS .............................................................................. 35
FIGURE 6. G-PROTEIN COUPLED RECEPTORS (GPCRS) ........................................ 37
FIGURE 7. MAMMALIAN TASTE RECEPTORS AND CELLS ....................................... 39
FIGURE 8. SWEET AND BITTER TRANSDUCTION PATHWAY .................................. 46
FIGURE 9. FORCED CHOICE SUCROSE DETECTION THRESHOLD TRACKING
GRIDS ........................................................................................................................ 69
FIGURE 10. BIVARIATE DATA ANALYSIS PLAN FOR AIM 1...................................... 86
FIGURE 11. BIVARIATE DATA ANALYSIS FOR AIM 2 ................................................ 87
FIGURE 12. RACE DEMOGRAPHICS: COMPARISON OF PEW REPORTS FOR
PHILADELPHIA AND CURRENT STUDY .............................................................. 98
FIGURE 13. OVERWEIGHT AND OBESE: COMPARISON OF PHILADELPHIA PEW
REPORTS, CDC DATA FOR PENNSYLVANIA (CDC, 2015), *PHILADELPHIA
DEPARTMENT OF PUBLIC HEALTH AND CHILDREN IN CURRENT STUDY
................................................................................................................................... 99
FIGURE 14. CHILDREN'S BMI BY SEX ....................................................................... 100
FIGURE 15. SUCROSE TASTE DETECTION THRESHOLDS AND AGE ................... 102
FIGURE 16. SUCROSE TASTE DETECTION THRESHOLDS AND GENDER ........... 103

xix
FIGURE 17. RELATIONSHIP OF DIET RELATED FOOD BEHAVIORS WITH AGE 104
FIGURE 18. RELATIONSHIP OF PERSONAL CHARACTERISTICS WITH AGE ...... 105
FIGURE 19. RELATIONSHIP OF SUCROSE DETECTION THRESHOLDS WITH
ADIPOSITY ............................................................................................................. 106
FIGURE 20. RELATIONSHIP OF SUCROSE DETECTION THRESHOLDS WITH
PERSONAL CHARACTERISTICS (NEGATIVE REACTION TO FOODS AND
FOOD NEOPHOBIA) ............................................................................................. 108
FIGURE 21. SUCROSE DETECTION THRESHOLDS AND TAS1R2, TAS1R3 AND
GNAT3 GENOTYPES .............................................................................................. 115
FIGURE 22. SUCROSE DETECTION THRESHOLDS AND TAS2R38 GENOTYPES . 116
FIGURE 23. DIET RELATED FOOD BEHAVIORS MEASURES AND TAS2R38
GENOTYPES ........................................................................................................... 117
FIGURE 24. REVISE CONCEPTUAL MODEL ............................................................. 132

xx
LIST OF ABBREVIATIONS
A or Ala Alanine
ANOVA Analysis of variance
BIA Bioelectrical impedance analysis
BMI Body mass index
C Cytosine
CDC Centers for Disease Control and Prevention
dbSNP Database of Short Genetic Variation
DNA Deoxyribonucleic acid
DXA Dual-energy X-ray absorptiometry
GNAT3 Guanine nucleotide-binding protein G (t) subunit alpha-3
GPCR G protein coupled receptor
HWE Hardy-Weinberg equilibrium
I Isoleucine
NHANES National Health and Nutrition Examination Survey
P Proline
PROP 6-n-Propylthiouracil
PTC Phenylthiocarbamide
PCR Polymerase chain reaction
SD Standard deviation
SNP Single nucleotide polymorphism
T Thymine

xxi
TAS1R2 Taste receptor type 1 member 2 gene
TAS1R3 Taste receptor type 1 member 3 gene
TAS2R38 Taste receptor type 2 member 38 gene
V Valine
WHO World Health Organization

1
CHAPTER 1
Introduction
The sense of taste plays a major role in food consumption. There are biological,
inter/intra personal, and social-environmental factors that influence food intake, as shown
in the Contento’s model in Figure 1 (Contento, 2007, 2008). Taste is a biologically
determined behavioral predisposition that is linked to brain reward and sensory systems.
The sense of taste is crucial in assessing a food’s nutritional value and is important in the
development of food preferences and appetite. Taste information is sent to the feeding
and reward system of the brain (Katz & Sadacca, 2011). The food-reward system plays a
significant part in regulating eating behavior. Understanding why an individual eats what
he/she eats and the driving factors behind food choices is important to addressing the
epidemic of obesity since food consumption has a noteworthy role in the development of
this condition (Grimm & Steinle, 2011).

2
Figure 1. Contento's Model of Influences on Food Choices
Copyright © 2007 (Contento, 2007, 2008)
People of all ages eat sugars in excessive amounts, often because these foods have
a potent hedonic appeal, particularly for children (Mennella, Finkbeiner, Lipchock,
Hwang, & Reed, 2014). In the childhood obesity literature, there is evidence that this
over consumption of added sugars may contribute to obesity (Fiorito, Ventura, Mitchell,
Smiciklas-Wright, & Birch, 2006; Lim et al., 2009; Linardakis, Sarri, Pateraki, Sbokos, &
Kafatos, 2008). The increased BMI associated with the consumption of added sugars is
long lasting, and that, when present in an early childhood, increased BMI will persist into
adolescence (Fiorito, Marini, Francis, Smiciklas-Wright, & Birch, 2009). A prospective
study conducted with African American children showed that increased of drinks with
added sugar at baseline predicted increased weight gain when followed up 2 years later.
Through basic psychophysical research, we have learned that children live in
different sensory worlds than adults when it comes to sweet taste (Mennella, Finkbeiner,

3
& Reed, 2012). Children’s basic biology makes them more vulnerable than adults to
overeating foods that are rich in sugars (Mennella, 2008, 2014; Mennella et al., 2012).
Not only are children born into this world being able to detect and prefer sweet tastes, the
predominant taste quality of mother’s milk (Desor, Maller, & Turner, 1977), but also this
heightened preference for sweet tastes persists throughout childhood and adolescence
(Desor, Greene, & Maller, 1975; Mennella, Lukasewycz, Griffith, & Beauchamp, 2011;
Pepino & Mennella, 2006).
This preference may have evolved to solve a basic nutritional problem of
attracting children to mothers’ milk and then fruits, sources of high energy and nutrient
content, during periods of maximal growth (Coldwell, Oswald, & Reed, 2009;
Drewnowski, 2000; Mennella, Finkbeiner, et al., 2014). However, we now live in an
environment where sugars are abundant. Despite recommendations from organizations
worldwide suggesting that we limit the intake of free sugars to less than 10% of total
energy (U.S. Department of Agriculture, 2010; Welsh, Davis, & Shaw, 1993), recent
estimates suggest that the levels of consumption far exceed recommended levels: US
children and adolescents are consuming around 16% of their total caloric intake from
added sugars (Ervin, Kit, Carroll, & Ogden, 2012). This overconsumption of sugars may
lead to pediatric obesity.
Many illnesses of modern society are due in part to poor food choices (Mennella,
Finkbeiner, et al., 2014). Excess consumption of sugars and simple carbohydrates has
been implicated in metabolic diseases like obesity and diabetes (Ambrosini et al., 2013;

4
Battelino & Shalitin, 2014; Gross, Li, Ford, & Liu, 2004; Wang, 2014). Metabolic
syndrome is more prevalent in those with central adiposity, and this fat pattern may be
exacerbated by a diet high in added sugar (Koh, 2010; Parikh & Mohan, 2012; Wang,
2014). The obesity epidemic is plaguing the youngest members of our societies, affecting
more than 42 million children globally (World Health Organization, 2015a). Overweight
and obesity in children are important public health problems in the United States. One
third of US children between the ages of 2-19 years are overweight and 16.9% are obese
(Ogden, Carroll, Kit, & Flegal, 2014). Obese children develop many of the obesity-
related complications such as diabetes and metabolic syndrome that adults do. Even if
they don’t develop these complications as children, they are at greater risk as adults
(Centers for Disease Control and Prevention [CDC], 2014; Ogden et al., 2014).
As this daunting truth emerges, recognizing that obesity and other weight-related
conditions are largely preventable is important. The identification of risk factors is one
key to prevention (Dietz, 2004; Dietz & Gortmaker, 2001). Eating behavior is among
those risks. It has been well established in the literature that the amount of calories
consumed by an individual impacts their weight (Birch & Fisher, 1998; Crowell et al.,
2015; Lee et al., 2011). Whether food habits of children are determined by genetic or
environmental factors, there is no doubt that children have a higher affinity for sweet
foods (Pepino & Mennella, 2006). During the past few decades, age-appropriate
psychophysical methods have been developed to determine the level of sweet taste most
preferred by individuals of varying ages (Mennella et al., 2011).
The sensation of sweet taste starts on the tongue and engages several signaling

5
proteins that are coded by specific genes in the human genome. Sucrose stimulates a
receptor on taste cells; the resulting signal is conducted via G proteins and eventually
produces a signal interpreted centrally as sweet taste (i.e., taste transduction). The sweet
taste receptor has two parts; the gene TAS1R2 encoding the first part was discovered in
1999, and the second gene, TAS1R3, was discovered in 2001 (for a review, see Reed &
McDaniel, 2006). The respective proteins from these genes are T1R2 and T1R3. Among
the G proteins, the one associated with sweet signaling is gustducin (Gα protein subunit),
encoded by GNAT3 (McLaughlin, McKinnon, & Margolskee, 1992). The bitter taste
receptor has also been linked with sweet taste. Previous work has shown that variation in
the bitter taste receptor gene has been associated with individual differences in sweet
taste preference (Mennella et al., 2012; Mennella, Pepino, & Reed, 2005) and children’s
selection of sweet tasting foods (Keller et al., 2014).
When compared to adults, children prefer a more concentrated sweet tasting
solution than adults (Liem & Mennella, 2002; Mennella, Finkbeiner, et al., 2014;
Mennella et al., 2012; Mennella et al., 2011), with the switch-over to adult like patterns
of preferences occurring during mid adolescence (Desor & Beauchamp, 1987; Mennella
et al., 2011). The level of sucrose most preferred was related to measures of growth;
children who were taller for their age preferred sweeter solutions than did those that were
shorter (Mennella, Finkbeiner, et al., 2014). Most research has focused on sucrose
preference, and to date there is a paucity of research on children’s taste sensitivity, which
is the ability to perceive sweetness at low sugar concentrations.
In adult populations, variation in the TAS1R2, TAS1R3 and GNAT3 genes relates

6
to differences in the ability to perceive sweet tasting stimuli. For TAS1R2, adults with one
or two copies of the V alleles had a lower habitual sugar intake (Eny, Wolever, Corey, &
El-Sohemy, 2010). TAS1R2 showed no significant effect with sucrose taste sensitivity
(Fushan, Simons, Slack, Manichaikul, & Drayna, 2009).
For GNAT3, adults with two C alleles (CC) were better able to sort low
concentrations of sucrose into the correct order of concentrations than those with two T
alleles (TT; rs7792845) (Fushan, Simons, Slack, & Drayna, 2010).
For TAS1R3, adults with one or two copies of the T nucleotide (TT) were less
sensitive to the taste of sucrose than were those with two copies of the alternative C allele
(CC; rs35744183) (Fushan et al., 2009). The TAS1R3 genotype is also related to with
differences in sweet preference. Adults with the TT genotype of the TAS1R3 gene also
preferred higher levels of sweetness than those with the CC genotype (Mennella,
Finkbeiner, et al., 2014; Mennella et al., 2012; Mennella, Reed, Mathew, Roberts, &
Mansfield, 2014), possibly because they need more sucrose to obtain the same hedonic
effect.
To our knowledge, whether genotype-related differences in sweet taste sensitivity
exist among children has not been investigated. Although some studies have examined
these genes and their variants in children, these were studies of preference and not
thresholds (Mennella et al., 2012; Mennella, Reed, Mathew, et al., 2014) and none found
a relationship between genetic variation and sweet taste preferences among children. We
do know, however, that variation in the TAS1R3 gene does not relate to differences in
levels of sucrose preference in children, as it does in adults (Mennella, Finkbeiner, et al.,

7
2014; Mennella et al., 2012; Mennella, Reed, Mathew, et al., 2014).
Variation in the bitter receptor gene TAS2R38 may also explain individual
differences in sweet preferences among children. TAS2R38 contains three variant
locations, best known for their association with the bitter perception of thioureas, such as
propylthiouracil (Bufe et al., 2005; Kim et al., 2003). Children with the bitter-sensitive
genotypes (AP, PP; rs713598, A49P) prefer significantly higher levels of sucrose than
those with the bitter-insensitive genotype (AA) both in laboratory-based measures and in
reported preferences of real-world foods like cereal and beverages (Mennella et al., 2012;
Mennella et al., 2005). Other investigators also report that children who are bitter
sensitive consume diets higher in sugar than do bitter-insensitive children (Keller &
Tepper, 2004).
Purpose and Significance
Significant progress has been made in understanding the interactive role of genes
and environment in the development of obesity across the lifespan. For reviews see the
following references (Huang & Hu, 2015; Qi & Cho, 2008; Speakman, 2004; Thomas,
2010). In behavioral genetics research, taste science has focused on how variation in
taste receptor genes accounts for individual differences in a variety of psychophysical
measures in adults, such as taste detection thresholds, taste preference, and diet related
food behaviors. Most of what is known to date regarding sweet taste in children and
adolescents relates to preference. Measuring detection thresholds, the lowest
concentration of a substance (i.e. sugar) that can be reliably detected (Bartoshuk, 1991;
Bartoshuk, 1978), add a new dimension to our knowledge of children. If an individual’s
8
detection threshold is high (a higher concentration is needed to detect a substance), it
means that they have less sensitivity to the given stimulus. Equally, if the detection
threshold is low, they are more sensitive; it means that they require a lesser concentration
to detect the stimulus. With the increased prevalence of childhood obesity, a basic
understanding of determinants of taste threshold differences could give us insights to
potential preventative measures. But little is known about the role of genetics and sucrose
detection thresholds in children. While several investigators have examined taste
thresholds in children, this study was among the first to examine sucrose detection
thresholds in the context of the unique approach of assessing genetic variants known to
show sweet sensitivity in adults (Eny et al., 2010; Fushan et al., 2010; Fushan et al.,
2009). An understanding of the factors associated with individual variability in sweet
thresholds may provide insight into why some children over consume sweet foods or are
overweight/or obese.
In addition, there are many factors that may contribute to difference in food
consumption (called diet-related food behaviors in this study). Of these factors, the role
of temperament has been associated with eating behaviors (Haycraft, Farrow, Meyer,
Powell, & Blissett, 2011) as well as obesity in infancy (Carey, 1985; Darlington &
Wright, 2006; Faith & Hittner, 2010), childhood (Agras, Hammer, McNicholas, &
Kraemer, 2004; Carey, Hegvik, & McDevitt, 1988), and in adulthood (Fassino et al.,
2002; Pulkki-Raback, Elovainio, Kivimaki, Raitakari, & Keltikangas-Jarvinen, 2005). In
addition, temperament has been associated with sweet taste preference in children (Liem
& Mennella, 2002) but not sucrose detection thresholds. Some dimensions of child

9
temperament particularly relate to eating behaviors (Forestell & Mennella, 2012;
Haycraft et al., 2011; Pliner & Loewen, 1997). Furthermore, prior work revealed a
significant effect of taste genotype and race/ethnicity on mothers’ perceptions of the
child’s temperament, activity in particular (Mennella et al., 2005).
With these points in mind, we examined the degree of variation in children’s
sucrose detection thresholds and whether sweet and bitter taste receptor-related genotypes
might partially account for variation in taste thresholds. Genotypes that were related to
sucrose threshold and sweet food consumption were examined for the propensity of
children to consume part of their calories as added sugars. In addition, estimates of
dietary intake of added sugars (g) and daily caloric intake (kcal/day) were available for a
subset of the children. We also hypothesized that if sweet taste sensitivity, diet and
obesity share a common etiology, then sweet sensitivity could potentially provide insights
into obesity risk. To that end, we examined how sensitivity to sweet taste varies with
adiposity measures as assessed by BMIz (a ratio of weight to height compared with
national norms by age and sex); percent body fat (an index of overall adiposity), and
central obesity [waist-to-height ratio (WHtR)]. Considering that there are other factors
that affect both obesity and taste, we considered child’s personal characteristics as
measured by the temperament and food neophobia scales. Those dimensions of the scale
that were associated in the literature with eating behaviors were assessed (negative
reaction to foods and food neophobia). Then all dimensions of temperament and food
neophobia were considered when looking at multiple factors that may contribute to
obesity. This work addressed a gap in the literature of chemosensory science. The study

10
described herein also served as groundwork for future studies that will further elucidate
these relationships.
Specific Aims
The consumption of sweet foods by children likely contributes to obesity, but
little attention has been paid to how children differ in their sense of sweet taste and how
these differences might affect their health and behavior. A paired-comparison, forced-
choice psychophysical method described herein was used to phenotype children for sweet
taste sensitivity (Mennella et al., 2011). Relationships between sucrose detection
thresholds and the sweet and bitter taste receptor genes have had limited examination in
children.
This study was framed with the following three aims:
Aim 1a: We determined whether sucrose detection thresholds, personal characteristics
(temperament, food neophobia), diet-related food behaviors (caloric or added sugar
intake) or adiposity measures varied among children by demographic variables (age, sex).
H1a: We hypothesized that sucrose detection thresholds, personal characteristics
(temperament, food neophobia); diet-related behaviors (caloric or sugar intake)
and adiposity measures would vary in children by age and sex.
Aim 1b: We determined whether sucrose detection thresholds in children correlate with
personal characteristics (negative reaction to foods and food neophobia), diet-related food
behaviors as measured by intake (caloric or added sugar intake) and adiposity measures.

11
H1b. We hypothesized that sucrose detection thresholds would be associated
with personal characteristics (negative reaction to foods and food neophobia),
diet-related behaviors (caloric or added sugar intake) and adiposity measures.
Aim 2: We determined whether sweet and /or bitter taste receptor genes (TAS1R2,
TAS1R3, GNAT3, and TAS2R38) predict differences in sucrose detection thresholds and
diet-related behaviors (caloric or added sugar intake) in children.
H2: We hypothesized that allelic variation in TAS1R2, TAS1R3, GNAT3, and
TAS2R38 genes would partially account for differences in sucrose detection
thresholds and diet-related food behaviors among children while adjusting for
covariates of age, sex and adiposity.
Aim 3: We determined whether sucrose detection thresholds, sweet and bitter taste
receptor genotype, personal characteristics (temperament, food neophobia) or sweet food
diet related behaviors (added sugars as g/kg of body weight, % kcal as added sugars)
were related and predicted measures of adiposity (waist to height ratio and percent body
fat) in children.
H3: We hypothesized that adiposity would be predicted by sucrose detection
thresholds, sweet or bitter taste receptor genotype, personal characteristics
(temperament and food neophobia) or sweet food diet-related behaviors (added
sugars g/kg of body weight, % kcal as added sugars).
Theoretical Framework and Conceptual Model
Considering the multiple factors that influence taste and health (i.e. adiposity),
two theoretical frameworks were used to frame this study. First, Contento’s model of

12
influences on food choices (Figure 1) was used as a lens to examine the intersectionality
of biology, behavior, and environmental factors, as they play a role in taste and adiposity.
Although Contento’s model was first designed with a focus in explaining components or
forces that may impact nutrition education programs, it fits nicely to study individual
choices and behaviors about food. In Contento’s model “biologically determined
behavioral predispositions” refers to individuals’ preference for sweet and dislike of
bitter and sour tasting foods as well as a mechanism for the interplay of the food-reward
system with sensory specific satiety. The second component “experience with food”
focuses on the learned experience with food whether it is by physiological or social
associations. The third part “personal factors” highlights both intra and interpersonal
factors that influence food choice such as knowledge, attitudes, and beliefs, as well as
families and social networks. Lastly, “environmental factors” states that food access and
availability of foods also plays a role in food choices (Contento, 2007). Here the terms
“food choice” and “diet-related behaviors” are referred to as outcomes. A key
acknowledgement of this model is that all these influences interact dynamically with each
other and they are not happening independent of each other.
Second, the behavioral genetics framework was used to examine genetic
underpinnings of behavioral phenotypes (i.e. taste thresholds). The gene-environment
interaction is defined as the diverse influence of a genotype on risk for disease for
individuals with different environmental experiences (Ottman, 1996). This model served
as a lens to understand the gene-environment interaction that can affect both taste and
adiposity, since this framework proposes that the interaction between genes and the

13
environment affects the development of behavior (Fuller & Thompson, 1960; Maxson,
2002). In this model, the environment is defined as an exposure, which can be physical,
chemical, biological, a behavioral pattern, or a life event among others. In this model,
genetics is defined as genes and their genotypes. Phenotypes are the observable traits of
an organism (Wojczynski & Tiwari, 2008) resulting from the interactions of genotypes
and the environment. Phenotypes can be somatophenes or psychophenes, which are
behavioral phenotypes (Fuller, 1979; Fuller & Willmer, 1973), the latter characterizing
behavioral genetics. Somatophenes can further be classified as chemophenes (i.e.,
hematocrit, platelets) or morphenes (i.e. body size). However, one of the limitations of
this model is that it doesn’t take into account an individual’s personal characteristics; in
addition, the phenotype is limited to behavioral ones only.
To create a comprehensive model, the underpinnings of the two theories were
merged (shown in red Figure 2), an additional sphere was added to Contento’s model
named biological factors highlighting taste related genes that were measured in this
study, as well as age and sex, since these measures are related to “biologically determined
behavioral predispositions”. Under the section of biologically determined behavioral
predispositions, sucrose detection threshold was added, since it might be associated with
diet related food behaviors. Other behavioral phenotypes measured in this study-
included: temperament, food neophobia, adiposity and dietary related behaviors. In this
revised model, diet related behaviors were operationalized as dietary intake. To further
complete the framework, the adiposity was added to the diagram as a body of research
indicates that diet-related food behaviors are associated with adiposity.

14
Figure 2. Integrated Theoretical Frameworks
To further address the aims of this study, a conceptual map was developed with
the variables used in this study to further hypothesize whether or not children’s genetic
differences affect sucrose detection thresholds and to assess the effects of age, sex, diet,
temperament and adiposity (see Figure 3). This was used as lens to understand how
genes and environments work together to influence behaviors, and what specific genes
might be responsible for the behavior studied herein. We understand that genetics alone
is not the sole contributor to taste perception and adiposity; therefore other important
15
determinants such as age, gender and personality characteristics are included in this
framework (Eysenck, 1990; Freedman, Khan, Serdula, Ogden, & Dietz, 2006; Freedman
et al., 2007; Keskitalo, Tuorila, et al., 2007). The new model assumes that adiposity and
taste thresholds arise from a complex interplay between genetics, temperament, food
neophobia and diet related food behaviors. The first intention of this conceptual model
was to develop testable hypotheses that informed this study. Secondly, this conceptual
model illustrates the hypothesized links (shown in dotted arrows) and guided the analysis
of the variables chosen for this study (see Specific Aims section).
Some of the hypothesized links are based on what have been published in the
literature to date; both in adults and children and some are being tested in this study.

16
Figure 3. Conceptual Model: with Hypothesized Links
Concepts and Definitions
The purpose of the following section is to briefly define a few concepts that are
used throughout this document. It is divided between taste related definitions, genetics
concepts, obesity and diet related terms (Table 1).

17
Table 1. Concepts and Definitions
Taste-Related Terms
Basic Tastes Refers to the five taste dimensions: sweet (i.e. sugars), sour (i.e. acids), salty (i.e. sodium chloride), bitter (i.e. alkaloids) and umami (i.e. monosodium glutamate)(Guyton, Hall, & Hall, 2006).
Flavor Refers to the combination of taste and smell or the combination of taste, smell, and chemical irritation. Flavor describes the sensation of the food or substance being ingested (A. K. Bartoshuk, 1991; L. Bartoshuk, 1991; Dominguez, 2011; Weiffenbach & Bartoshuk, 1992). Flavor is a complex phenomenon brought forth by a multimodal sensory response that includes taste, olfaction, and perception (e.g., the burn of capsaicin or the tickle of carbonation) (Beauchamp & Mennella, 2011; Small, 2012).
Hedonic Response
to Foods
Refers to the degree of pleasure an individual experience from a food. Foods or substances can be qualified as pleasant, appetizing (e.g., positive hedonic qualities: sweeter, creamier) or unpleasant and aversive (Lowe & Butryn, 2007).
Palatability Refers to how an individual perceives a particular substance to be likeable. Palatability takes into account factors such as taste, an individual’s physiological state, and learning history (Yeomans, Blundell, & Leshem, 2004).
Psychophysics It is a quantitative science that studies the associations among physical stimuli and perceptions (Anderson, 1990).
Taste Defined as the sense that individuals are able to recognize when a substance contacts the taste buds and subsequently triggers nerve responses to the taste centers in the brain. Taste is essentially the chemical reaction that allows us to detect whether the food being consumed contains bitter, salty, umami, sour or sweet compounds (Barlow & Klein, 2015; Bartoshuk, 1991).
Taste Buds They are well-defined structures composed of taste receptor cells and supporting cells. It is considered the smallest functional element of the gustatory system (Barlow & Klein, 2015; Fabian, Beck, Fejerdy, Hermann, & Fabian, 2015; Jung, Akita, & Kim, 2004).
Taste Intensity Refers to the strength of the perceived taste of a substance. It can be measured as no flavor or extremely strong flavor (Stevens, 1969).
Taste Thresholds Taste thresholds refer to the minimum amount of a stimulant that elicits a response to our sense of taste; therefore, concentrations that are below the detection thresholds of an individual are not perceived. It is the lowest concentration of a substance (e.g., sugar) that can be reliability detected. People differ on how sensitive they are to certain compounds. For example: we can have an individual taste two substances (water and sucrose at a certain concentration) and determine at what concentration they are able to detect the substance (Bartoshuk, 1991; Bartoshuk, 1978).
Taste Preference A test used to compare two substances and subjectively evaluate if there is a difference in the liking of the compound being tested. For example: we can provide two cups of sucrose with different concentrations and ask which one they prefer (Drewnowski, 1997).
Taste Receptor
Cells
A sensory receptor cells that transmits information from a substance into a nerve signal and carries gustatory information to the brain (Li et al., 2002).
Genetics-Related Terms
Alleles They are polymorphisms of the same gene (Hart & Jones, 2005).
Diplotype A pair of haplotypes from homologous chromosomes (Zuo, Wang, & Luo, 2014).
Gene A segment of DNA, known to be the molecular unit of heredity. It controls the

18
production of specific proteins that conduct a function in the body (Pearson, 2006).
Haplotype A combination of alleles at multiple loci occurring on the same chromosome. They are inherited together (Malats & Calafell, 2003; Zuo et al., 2014).
RefSNP (rs)
Numbers or rs#
The symbols mean that the SNP has been officially registered and given a reference SNP identifier by dbSNP (National Center for Biotechnology Information, 2005).
Genotype Refers to a collection of genes responsible for an individual’s observable traits. It is also the two alleles inherited for a specific gene (Malats & Calafell, 2003).
Phenotype The actual characterization of physical traits observed in an individual’s, such as taste (Malats & Calafell, 2003).
Homozygous An individual that has two identical alleles for the gene in question (i.e.: CC, cc)(Strachan & Read, 2010).
Heterozygous An individual who has two different alleles for a gene (i.e.: Cc, Bb) (Strachan & Read, 2010).
Locus (Loci)
A gene location on a chromosome (Malats & Calafell, 2003).
G- Protein
Coupled
Receptors
A large family of protein-coupled receptors that sense molecules outside the cell and activate inside signal transduction pathways and, ultimately, cellular responses (Venkatakrishnan et al., 2013).
Hardy-Weinberg
Equilibrium
(HWE)
The theory that states that allele and genotype frequencies will continue to be constant from generation to generation in a given population (Crow, 1999; Malats & Calafell, 2003).
Single Nucleotide
Polymorphisms
(SNPs)
SNPs are variations of a single base pair in a distinct DNA structure, called a nucleotide (i.e.: a SNP replaces the nucleotide thymine (T) with a nucleotide cytosine (C) within a DNA segment (Strachan & Read, 2010).
Obesity and Diet-Related Terms
Added Sugars Refers to the additional sugars, syrups, and other caloric sweeteners added when foods are processed or prepared. Examples of added sugars include brown sugar, cane sugar, corn sugar, corn sweetener, corn syrup, dextrose, fructose (when not naturally occurring), fruit juice concentrates, glucose, high-fructose corn syrup, honey, invert sugar, lactose (when not in milk or dairy products), maltose (U.S. Department of Agriculture, 2010).
Adiposity In this document, adiposity refers to any body weight-related measure by which body fatness is assessed, such as waist-to height ratio; percent body fat, and BMI.
Body Mass Index
(BMI) BMI is a measure of body weight relative to height. BMI; calculated as weight in kilograms divided by the square of height in meters (Janssen, Katzmarzyk, & Ross, 2002).
BMI z Score Body mass index z-scores, also called BMI standard deviation (SD) scores, are measures of relative weight adjusted for child age and sex (Kuczmarski et al., 2002).
BMI Percentile For children, BMI is reported as sex- and age- specific percentiles and as z-scores. BMI charts compare their height and weight to other children of their same sex and age. For children ages 2 to 19 years, those who are at or above the 85th percentile are considered overweight. Those who are at or above the 95th percentile are considered obese (Bartok, Marini, & Birch, 2011; Kahn, Imperatore, & Cheng, 2005).
Metabolic
Syndrome
A group of risk factors that increases an individual risk for heart disease, diabetes, and stroke among others. Metabolic risk factors include a large waist size (abdominal obesity), high blood pressure, high blood sugar levels, high levels of

19
triglycerides, and low levels of high-density lipoprotein (HDL) (Despres & Lemieux, 2006).

20
CHAPTER 2
The sense of taste is produced when a chemical stimulus or substance, comes into
contact with taste cells in the oral cavity and triggers nerve impulses to special taste
centers in the brain (Purves et al., 1997). Taste is essentially the chemical reaction that
allows us to detect whether the food being consumed contains salty, sweet, sour, bitter, or
umami compounds. It is the sense that alerts an individual to recognize and ingest
nutrients while avoiding toxins (Chaudhari & Roper, 2010).
Taste plays a role in eating behaviors. Taste detection and differentiation of taste
stimuli regulate how people distinguish food and develop dietary habits (Cruickshanks et
al., 2009; De Jong, Mulder, De Graaf, & Van Staveren, 1999). This is possible by the
development of taste perception, which allows people to distinguish between different
flavors and help in determining their taste preferences and dislikes. These factors affect
not only food selection but also the amount of food a person ingests (El-Sohemy et al.,
2007; Garcia-Bailo, Toguri, Eny, & El-Sohemy, 2009). Individual variations in taste
perception may therefore affect dietary status and diet- related diseases such as obesity
(Cicerale, Riddell, & Keast, 2012). However, eating behaviors can also be affected by
taste preferences; both are influenced by social, physiological, genetic, and psychological
factors. These can vary among cultures, age groups, and sexes.
Early studies pinpointed taste as one of the prominent elements in food
consumption and selection (Drewnowski, Kurth, Holden-Wiltse, & Saari, 1992; Glanz,
Basil, Maibach, Goldberg, & Snyder, 1998; Nasser, 2001). Although studies of taste have
been around for hundreds of years, new discoveries in this area of research hold much

21
promise for explaining a person’s food choices and eating behaviors that may lead to the
development of overweight and obesity.
In the United States, the prevalence of childhood obesity has tripled in the past 30
years. Specially, one- third of preschool-aged children are at risk for obesity ((CDC),
2012; Ogden et al., 2014). The long term and short-term effects of obesity on health and
well being of children are concerning. Children are at risk of developing conditions such
as the likelihood to develop diabetes, hypertension, high blood pressure, and the greater
risk for bone and joint problems and sleep apnea ((CDC), 2014). In addition to the
physical effects, they are also at high risk of experiencing social stigmatization and
discrimination (Li, Ford, Zhao, & Mokdad, 2009). Understanding the factors driving their
food choices is important in this health context.
American children age 2 and above ingest over 15% of total energy from added
sugars (Welsh & Cunningham, 2011; Welsh, Sharma, Grellinger, & Vos, 2011). There is
a growing concern that this overconsumption of added sugars has contributed to the
obesity epidemic (Drewnowski & Rehm, 2014; Ervin et al., 2012; Ervin & Ogden, 2013).
The alarming consumption of added sugars has become an important issue.
Efforts have been made by several organizations to set recommendations to limit added
sugars in diet. The Institute of Medicine (2002) recommends that added sugars be less
than 25% of total calories in the diet. Other organizations such as the American Heart
Association have recommended that children 2- 8 years should not consume more than 3-
4 teaspoons of added sugars a day (Johnson et al., 2009). The latest report by the World
Health Organization recommended that added sugars be less than 10% of total energy

22
intake, and suggested that an additional decrease to below 5% or approximately 25 grams
(6 teaspoons) per day might produce further health benefits (World Health Organization,
2015).
Children are born with a liking for sweet tastes. Sweet taste is a sign that a food
has calories and nutrition. Foods that are sweet tend to be eaten in order to provide
energy needed to promote growth and development. Preference for sweet tasting foods is
related to environmental effects, evolutionary needs and genetics (Keskitalo, Knaapila, et
al., 2007; Liem & Mennella, 2002; Reed & McDaniel, 2006). As much as children are
drawn to sweet taste, they vary in their sensitivity to sweet taste. This variation may
explain individual differences in their consumption of sweet tasting foods.
Genetic factors that regulate the gustation system and its function may possibly
account for individual differences in sweet taste perception in children. Genetic diversity
of sweet taste receptor genes (TAS1R2, TAS1R3, GNAT3) has been shown to play a role
in sweet taste sensitivity in adults (Eny et al., 2010; Fushan et al., 2010; Fushan et al.,
2009), but no study to date has assessed this influence on sweet taste sensitivity in
children. However, studies have shown that sweet taste preference in adults is associated
with TAS1R3 genotype (Mennella, Reed, Mathew, et al., 2014). In addition, studies have
found that genetic sensitivity to bitter taste may also influence preferences for sweets.
Mennella et al. (2005) reported that children with the bitter-sensitive TAS2R38 genotype
had higher preferences for sweet tasting foods and beverages. Children with one or two
bitter sensitive alleles (AP or PP) preferred higher concentrations of sucrose solutions

23
than those children who had two copies of the bitter insensitive allele (AA). The
association between sweet taste sensitivity and food preferences and consumption is not
clear. However, bitter taste sensitivity may explain the negative reaction of children and
adults to bitter foods such as vegetables (Garcia-Bailo et al., 2009). In the sweet taste
literature, some studies hypothesize that sweet taste sensitivity may explain sweet food
consumption (Eny et al., 2010; Wasalathanthri, Hettiarachchi, & Prathapan, 2014).
Development of Taste
The development of the senses of taste happens parallel to the development of the
nervous system in the embryonic stage (weeks 1-8 of gestation), at the beginning of the
fetal stage, and matures at variable rates (Lawless, 1985; Northcutt, 2004). By the
culmination of gestation, the taste system is activated by the compounds carried by the
amniotic fluid (Nickalaus, Boggio, & Issanchou, 2005). Studies specifically examining
the diversity of tastes and scents experienced by individuals have found sweet taste
compounds to be transmitted through the amniotic fluid to the fetus (Mennella, Jagnow,
& Beauchamp, 2001). The moment that the fetus starts to swallow, taste receptors are
activated, around twelfth week of gestation (Mennella & Beauchamp, 1996). Early
studies conducted in the area of taste development revealed that taste buds are found after
8 weeks of gestation, and by 13 weeks they are similar to those of adults (Forestell &
Mennella, 2012; Witt & Reutter, 1996). There is evidence that sweet taste is the first
sense to develop (Mela, 2001; Mennella & Beauchamp, 1996).

24
Foods that taste sweet are often highly preferred over those that taste bitter by
children and adults. Human preference for sweetness and how this manifests during
development has been of interest to many investigators (Berridge & Robinson, 2003;
Drewnowski, Mennella, Johnson, & Bellisle, 2012; Mennella, Forestell, Morgan, &
Beauchamp, 2009; Ventura & Mennella, 2011). These studies have reinforced the
hypothesis that the sense of sweet is present before birth—sweet taste is distinguished by
unborn infants. Newborns clearly sense and show pleasure in sweet tastes (Mennella et
al., 2005). Despite these known innate preferences for sweet taste, the degree of
preference for sweet foods varies across individuals. These differences in sweet
preferences are influenced by age, gender, previous exposures, and hormonal
fluctuations, as well as genetics (Faas, Melgert, & De Vos, 2010; Overberg, Hummel,
Krude, & Wiegand, 2012; Reed & McDaniel, 2006).
Taste and Age
Fetus
A baby’s first experiences with taste occur long before birth. Studies have
examined taste programming in utero, focusing on maternal diet during pregnancy and
whether it has an impact on infant food preferences. Foods consumed by the mother
affect the content of the amniotic fluid—the unborn infant swallows this fluid and is thus
exposed to different flavors (Mennella, Johnson, & Beauchamp, 1995). In fact, neonates
may identify and prefer flavors they were exposed to before they were born (Beauchamp
& Mennella, 2011; Forestell & Mennella, 2012; Mennella, 1995; Schaal, Marlier, &

25
Soussignan, 2000). Mennella (1996) showed that neonates born of mothers who
consumed carrot juice during pregnancy preferred a carrot-flavored cereal during infancy
compared to the control group whose mothers had not consumed carrot juice (Mennella
et al., 2001).
Newborn
From the earliest studies on the investigation of taste in humans, researchers have
observed that newborns can detect and have an affinity towards sweet taste (Beauchamp
& Moran, 1982; Maller & Desor, 1973; Tatzer, Schubert, Timischl, & Simbruner, 1985).
Facial gestures showed that the newborn could distinguish several taste qualities (bitter,
salty, sour, sweet and umami). Responses to sweet and umami by neonates are usually
thought to express satisfaction (Mennella et al., 2009). Desor, Maller, and (1973) have
shown that from birth human babies prefer sugar solutions to water, which suggested that
sweet taste preference might be manifested before any cultural and environmental factors
are active. Steiner (1979) also showed in earlier studies that newborns preferred sugary
solutions to water. More recent studies have concluded that newborn infants display
preferences for high sugar concentrations and select solutions that are sweeter
(Drewnowski et al., 2012; Pepino & Mennella, 2006). Newborns prefer sweet tastes from
birth and will choose to drink from bottles of sweetened water but will reject substances
that taste bitter or sour (Liem & Mennella, 2002).
Sweet taste has been found to also have analgesic effects in children. The
combination of sweet taste and a pacifier has been found to have a calming effect on
26
newborns, and it has been used as an analgesic for infants (Mennella, Pepino, Lehmann-
Castor, & Yourshaw, 2010; Pepino & Mennella, 2005). The calming effect of sweet
tasting substances has also been observed in both preterm and full term newborns (Smith
& Blass, 1996). Overall, the desirability for sweet and the aversion towards bitter and
sour tastes come to be more marked during childhood but tend to decline in adult life.
The early attraction to sweetness is reinforced by exposure to sweet stimulation (Nicklaus
et al., 2005).
Infant
Age differences in sweet taste preference have been widely studied (Green,
Jacobson, Haase, & Murphy, 2013; Mojet, Christ-Hazelhof, & Heidema, 2005; Mojet,
Heidema, & Christ-Hazelhof, 2003; Overberg et al., 2012). Taste preferences continue to
develop during a child’s first year of life. Early studies indicated that this innate
receptiveness to sweets has evolutionary origins and is inherent (Berridge & Robinson,
2003; Drewnowski et al., 2012; Mennella & Beauchamp, 1998). Early exposure to sweets
leads to an increased preference for these foods and a preference for higher
concentrations of sugar (Harris, 2008; Pepino & Mennella, 2008).
Although preference for sweet is present at birth, this preference it is known to
decrease with age. Schwartz, Issanchou, and Nicklaus (2009) evaluated acceptance of the
five tastes (salt, sour, sweet, bitter, and umami) in the same infants at 3, 6, and 12 months
of age, based on facial expressions during consumption, and found that taste preferences
did indeed change with age. They found that at each age sweet and salty tastes were the

27
most preferred. Beauchamp and Moran (1982) studied taste preferences
for sucrose solutions and water in human infants at birth and at 6 months of age. They
found that the dietary exposure of sweetened water maintained their preference for
sucrose solutions at age 6 months, and the acceptance for sweet taste was slightly
decreased at 6-12 months of age. Several hypotheses have been proposed to explain this
developmental change in sweet preference. One explanation is that dietary experiences
modify the degree of the preference for sweet taste as early as 6 months after birth. The
introduction of solid foods, which may be less sweet than milk, might be driving the
noted decrease in preference, which may be a continuous process through adulthood. A
second explanation is that maternal diet may be a contributory factor, especially for
babies who are breast-feed. Human breast milk often contains flavors from compounds
that a breast-feeding woman takes in through her diet. Flavors from foods consumed by
the mother such as vanilla are detectable in breast milk 1-2 hours after consumption
(Mennella & Beauchamp, 1996). Therefore, the taste of breast milk may also have an
effect on the later preferences of newborns (e.g., sweet). Babies whose mother’s breast-
feed may perhaps be more tolerant of a range of flavors once they begin consuming solid
foods (Beauchamp & Mennella, 2011; Maier, Chabanet, Schaal, Leathwood, &
Issanchou, 2007).
Childhood and Adolescence
Segovia et al. (2002) compared male children 8-10 years of age to adult males.
The children had a higher density of anterior papillae than did the adults, a factor that

28
might make them more sensitive to sucrose or sweet flavors. A later study involving
8,900 Danish school children showed a perceptible change in taste perception as the
children developed into teenagers. In this study, teenagers showed an increased capacity
to distinguish flavors, as well as a decreased preference for sweet flavors, compared with
younger children.
A study by Mennella et al. (2012) analyzed individual’s differences in sucrose
and fat preference related to age, genotype, and lifestyle. In this study, children and their
mothers chose the concentration of sucrose mainly preferred in water using identical,
two-alternative forced-choice procedures and ranked samples based on intensity of
sweetness. In general, while children were found to prefer higher concentrations of
sucrose in water and pudding than did their mothers, children preferred a lesser
concentration of fat in pudding. Further studies revealed that the perception of sweet taste
remains finely tuned throughout childhood and adolescence (Desor, Greene, & Maller,
1975; Mennella & Beauchamp, 2005; Pepino & Mennella, 2006) and declines with age
(Desor & Beauchamp, 1987). The rationale for the changes in preference with age
continues to be explored both in human and in animal models (Mennella, 2008).
Foods that taste sweet are often highly preferred over those that taste bitter. The
sense of taste is essential to one’s capacity to obtain needed nutrients. Despite this
established preference for sweet taste (Berridge & Robinson, 2003; Keskitalo, Knaapila,
et al., 2007; Mennella et al., 2009), the degree of preference for sweet foods varies across
individuals. These differences in sweet preferences are influenced by age, gender,

29
previous exposures, and hormonal fluctuations, as well as genetics (Faas et al., 2010;
Overberg et al., 2012; Reed, Tanaka, & McDaniel, 2006).
When it comes to taste detection thresholds, many investigators have reported a
decrease in sucrose sensitivity with age (Bartoshuk, Rifkin, Marks, & Bars, 1986;
Cooper, Bilash, & Zubek, 1959; Fikentscher, Roseburg, Spinar, & Bruchmuller, 1977;
Hermel, Schonwetter, & Samueloff, 1970; Moore, Nielsen, & Mistretta, 1982; Richter &
Campbell, 1940) and some included children in their taste sensitivity studies (Cooper et
al., 1959; Fikentscher et al., 1977; Hermel et al., 1970; Richter & Campbell, 1940).
Sensitivity for the basic taste qualities decreased more in men than in women with aging
(Fikentscher et al., 1977). Investigators report that children have higher taste thresholds
than adults for sweet. A study compared taste thresholds in children (8- to 9-year-olds)
and adults. They found 8 to 9-year-old boys’ mean threshold for taste detection was
significantly higher than both adult men and women, suggesting that the detection
thresholds of boys of this particular age may not be fully developed. But girls of the same
age had similar thresholds to adults, and there were no gender differences between the
adult participants (James, Laing, & Oram, 1997). Other studies have reported that taste
detection can change not only with age, but also with hormonal status (Alberti-Fidanza,
Fruttini, & Servili, 1998; Allesen-Holm, Frøst, & Bredie, 2009) and temperature
(Talavera, Ninomiya, Winkel, Voets, & Nilius, 2007).

30
Taste and Race
Racial differences in sweet taste preference have also been noted in several
studies (Beauchamp & Moran, 1984; Pepino & Mennella, 2005; Salbe, Delparigi, Pratley,
Drewnowski, & Tataranni, 2004; Schiffman, Graham, Sattely-Miller, & Peterson-Dancy,
2000). African American children (Beauchamp & Moran, 1984) and adolescents (Desor
et al., 1975) have been reported to have a higher preference for sucrose solutions, as well
as increased preference for sugary fat solutions (Bacon, Miles, & Schiffman, 1994).
Studies have suggested that sustained preference for palatable sweet tastes may possibly
contribute to eating patterns that lead to obesity. In a study of the degree of habituation to
sweet-tasting foods, African American children had a prominent and constant desire for
sweet taste, a probable risk factor for the development of obesity (Schiffman et al., 2000).
African-American children age 9-15 years favored more sweetness in sugar and sucrose
in water solutions than Caucasian children (Desor et al., 1973). African American
children preferred higher concentrations of sugar in liquids and solid foods and added
more sugar to foods and drinks (Mennella, Pepino, and Reed 2005). A different study
observed that African-American children within the same age group preferred higher
concentrations of sucrose in liquid dairy products (Bacon et al., 1994).
Few studies have evaluated the effects of race and cultural on taste sensitivity.
Salbe et al. (2004) reported that Pima Indians rated sucrose solutions tasting sweeter than
whites. A study looking at taste perception in Taiwanese and European reported that
Taiwanese individuals rated sucrose solutions as pleasant but sweetened cookies less
appealing compared to those of European descent (Bertino, Beauchamp, & Jen, 1983).
31
Taste and Gender
Investigators have found that there are no major differences in sweet taste
sensitivity between adult men and women (Dinehart, Hayes, Bartoshuk, Lanier, & Duffy,
2006). One study showed no significant difference in the ability for men and women to
detect and differentiate sucrose from other taste qualities and water (Chang, Chung, Kim,
Chung, & Kho, 2006). Girls were better at perceiving different tastes than boys, and
better at distinguishing all concentrations of sour and sweet tastes (Allesen-Holm et al.,
2009). Boys needed an approximately 20 percent more sweetness to recognize the taste.
Changes in sucrose detection thresholds for women may be due to hormonal effects, with
women having increase sweet taste sensitivity with during pre-ovulation (Than, Delay, &
Maier, 1994).
Taste and Disease
Aging and diseases such as cancer, infections, trauma, medication, malnutrition
and surgical procedures can influence taste. Chemosensory dysfunctions increase with
age (Boyce & Shone, 2006; Murphy, 1985). An often-cited etiology for taste disorders is
primarily a defect of olfaction resulting in alteration of taste quality and intensity. For
example, upper respiratory infections, idiopathic causes, head injury or other conditions
can affect the sense of taste (Hummel, Landis, & Hüttenbrink, 2011). Lesions to the taste
buds or mucosa, demyelination of the nerves, or cranial nerve damage may impair
gustation. For example, the chorda tympani nerve is known to function in eliciting taste
response; therefore, damage to this nerve may reduce taste sensitivity, which

32
consequently may affect food choices (Bartoshuk, 1993).
Taste disorders can lead to altered perceptions and taste threshold. Taste
perceptions become somewhat impaired with normal aging, with older individuals having
higher thresholds than younger ones (Moore et al., 1982). Problems with taste can have a
big impact not only in an individual’s food selection but also their quality of life. Healthy
People 2020 Goals have highlighted chemosensory health as an area for attention. A goal
is to decrease the percentage of adults with chemosensory disorders who experience
adverse impact on health status, work or quality of life (U.S. Department of Health and
Human Services, 2013). In addition, the 2012 National Health and Nutrition Examination
Survey added a chemosensory component to assess normal variation and prevalence of
dysfunction of taste (CDC, 2012).
Taste disorders may affect the amount and type of food eaten, leading to under
and over consumption of foods. This can be a problem for people with illnesses such as
diabetes, high blood pressure or obesity (Mattes et al., 1990). Taste disorders are
classified as ageusia which refers to the absence of taste; hypogeusia or decreased
perception of taste; dysgeusia when the taste capacity is distorted; parageusia, which is
the incomplete sense of taste in the presence of stimulus; and lastly phantogeusia which is
the distortion of taste perception, without the manifestation of a stimulus (Schiffman,
1983a, 1983b).
Nutritional deficiencies are also found to affect taste perception. Individuals with
anorexia, malabsorption disorders and kidney function alterations as well as those with
low zinc, and copper serum levels have reported decreased taste perception (Lynch,

33
Lynch, Curhan, & Brunelli, 2013; Stewart-Knox et al., 2005). In children, a loss of sense
of taste might cause a decrease in food intake, possibly resulting in eating disorders,
which can affect physical growth and overall development (Moura, Cunha, Caldas, & Da
Silva, 2015). A recent study looking at differences in taste perception in obese and non-
obese children reported that obese had more difficulties identifying taste qualities than
children and adolescents of normal weight (Overberg et al., 2012).
Biology of Taste
Anatomy of the Gustatory System
Our sensory system for taste is remarkably sensitive. Not only we can detect
substances at extremely low concentrations, we are also able to differentiate between
molecular compounds that are closely related. This amazing sensitivity is made possible
by the taste buds, which are at the forefront of the taste system (Figure 4). These are
onion-shaped structures on the tongue, throat, and pharynx as well as different places in
the mouth. Humans have an average of 5,000-10,000 taste buds (Miller, 1995; Purves et
al., 1997), which are found in aggregates of 50-100 taste receptor cells, composed of
epithelial cells with some neuronal properties (Defazio et al., 2006; Finger et al., 2005).
The taste buds are innervated by the chorda tympani and glossopharyngeal nerves
carrying the taste messages to the brain, generating the sensation of taste (Bradbury,
2004; Chaudhari & Roper, 2010; Miller, 1995). Each taste bud has three cell types: type I
(supportive), type II (receptor), and type III (presynaptic) cells (Herness & Gilbertson,
1999; Northcutt, 2004).

34
Figure 4. Taste Buds
Type I cells have a supportive function and they are the most abundant
(Chaudhari & Roper, 2010; Finger et al., 2005). Type II cells are needed for transduction,
they are known for being associated with the receptors for bitter, sweet, and umami taste
(Adler et al., 2000; Romanov et al., 2007; Zhao et al., 2003). Type III cells are called
presynaptic or synaptic cells (Huang, Maruyama, Stimac, & Roper, 2008; Roper, 2006,
2007). In Figure 5, Chaudari and Roper (2010) show a depiction of the cells and some of
the proteins that are expressed in each cell type. From the activation of these cells,
humans can distinguish five major tastes groups: salt, sour, sweet, bitter, and umami,
each activated by specific receptors (Chaudhari & Roper, 2010).

35
Figure 5. Type of Taste Cells
Permission obtained from author and publisher ©2010 Chaudhari and Roper. Journal of Cell Biology. 190:285-296. doi:10.1083/jcb.201003144
Genetics of Sweet and Bitter Taste
Taste receptor cells in the tongue are at the start of the sensory detection pathway
of the gastrointestinal tract. These receptors provide vital information that affects both
innate behaviors and aversive behaviors to foods (Kim, Breslin, Reed, & Drayna, 2004).
Each taste modality is recognized by G-protein-coupled receptor (GPCR) dimers or
through membrane channels (Figure 6). GPCRs (shown in green) have seven trans-
membranes domains and are known to activate heterotrimeric G proteins, which are

36
composed of three subunits σ, β and γ, Figure 6A shows a GPCR not activated. Ligand
binding (shown in red) activated the receptors and a conformational change occurs that
facilitates the dissociation of the G proteins that interact downstream the effectors. The
alpha subunit of the G protein attaches to either to GTP or GDP contingent on whether
the protein is inactive (GDP) or active (GTP). Beginning with receptor activation by a
ligand, the receptor exchanges the GDP for GTP bound to the alpha subunit while
releasing the beta-gamma (βγ) subunit. These two subunits result in activation of
effectors within the cell (Li et al., 2002) (Figure 6B), that in turn leads to several kinds
of cellular and physiological responses. A detailed explanation of the transduction
pathway for taste is explained in a later section.

37
Figure 6. G-Protein Coupled Receptors (GPCRs)
For taste, there are two GPCR groups. The first one consists of three members (T1R1,
T1R2, and T1R3), which facilitate the perception of sweet and umami tastes. The second
group is the TAS2R, which has around 30 different GPCRs, and the dimers create the
receptors for different bitter-tasting compounds (Chandrashekar, Hoon, Ryba, & Zuker,
2006; Zhao et al., 2003).
Sweet taste is mediated by two types GPCRs that are part of the taste receptor
family 1 (T1R2 and T1R3) (Chandrashekar et al., 2006; Zhao et al., 2003). These
receptors are located within chromosome 1p36 (Liao & Schultz, 2003). The

38
heterodimeric combination of the two proteins (T1R2 and T1R3), are required for the
sweet taste receptor to be functional, and begin the process to sense sweet taste (Nelson et
al., 2002; Zhao et al., 2003). This heterodimer receptor helps recognize all types of sweet
substances, including simple sugars, artificial sweeteners, amino acids and proteins
(Figure 8) (Yarmolinsky, Zuker, & Ryba, 2009).
T2Rs are associated with bitter perception (Conneally, Dumont-Driscoll,
Huntzinger, Nance, & Jackson, 1976; Reed et al., 1999), and are expressed in taste
receptor cells that have gustducin, a G protein α subunit associated in bitter transduction
(Ming, Ruiz-Avila, & Margolskee, 1998). T2Rs recognize a wide variety of compounds;
some are very specific, while others are tuned to a particular class of compounds or
respond broadly to many bitter tastants (see Figure 7).

39
Figure 7. Mammalian Taste Receptors and Cells
Permission obtained to use image from publisher © 2010 Elsevier (Yarmolinsky et al., 2009)
Fuller (1974) identified the Sac locus linked with saccharin preference. The
murine Sac locus is the main genetic factor that establishes the differences between
sweet-preferring and sweet-indifferent strains of mice (Fuller, 1974; Lush, Hornigold,
King, & Stoye, 1995). Several investigators reported that Sac determines both behavioral
and electrophysiological responsiveness to saccharin, sucrose, and other sweeteners

40
(Bachmanov et al., 1997; Ninomiya, Tanimukai, Yoshida, & Funakoshi, 1991). Later
studies identified the T1R G-protein-coupled receptor family in rats and humans (Hoon et
al., 1999; Li et al., 2002). This receptor contains the two proteins responsible for creating
a sweet taste receptor, T1R2 (taste receptor type 1, member 2) and T1R3 (taste receptor
type 1, member 3) (Stone, Barrows, Finger, & Kinnamon, 2007; Zhao et al., 2003), which
together form the T1R2/T1R3 heterodimer necessary in the perception of sweet taste
(Nelson et al., 2001; Reed & McDaniel, 2006).
Genetic differences in the sweet receptor proteins partially determine two types of
taste traits in adults, affecting sweet sensitivity (Fushan et al., 2010; Fushan et al., 2009)
and preference (Mennella, Finkbeiner, et al., 2014). The GNAT3 protein has been
associated with sweet taste sensitivity in adult humans (Fushan et al., 2010). The
TAS1R2 gene, encoding the protein T1R2, is distinguished by high levels of genetic
diversity, but as yet these variants have not been linked with individual differences in
taste perception, although they have been linked to the intake of sweet foods (Eny et al.,
2010). Humans differ in their sensitivity to certain tastes and these thresholds vary in
humans, though the reason is not fully established. Miller and Reedy (1990) noted that
some of the differences observed in human taste sensitivity may be affected by the
numbers of taste buds a subject has, making them more or less sensitive to flavors;
however, people differ not only in the number of taste receptors but also in the DNA
sequences of particular receptors or their transduction molecules (described below) (Reed
et al., 2006). Individuals who have heightened sensitivity to taste are called “supertasters”
(Hayes, Bartoshuk, Kidd, & Duffy, 2008; Miller & Reedy, 1990), and those who have
41
minimal or complete lack of taste papillae due to a genetic disease or age-related decline
(Guo & Reed, 2001) are categorized as “nontasters.” Studies have shown that supertasters
need smaller amounts of fat and sugar in their food to become satiated compared with
nontasters (Bartoshuk, Duffy, Hayes, Moskowitz, & Snyder, 2006; Hayes et al., 2008).
However, due to their keen sense of the taste of bitterness, supertasters have an increased
intake of salt (Hayes et al., 2008), which masks bitterness; this may place them at a
higher risk for hypertension but potentially a lesser risk for obesity. Though it can be
hypothesized that this physiological difference may be responsible for some of the food
choices a person makes and/or correlate with such conditions as obesity, hypertension,
and diabetes, no study was found that examined this hypothesis.
The T1R3 protein (coded for by TAS1R3 in humans and Tas1r3 in rodents) is
responsible for the perception of sucrose (Bachmanov et al., 2001; Max et al., 2001;
Montmayeur, Liberles, Matsunami, & Buck, 2001; Nelson et al., 2001). Using an in vitro
approach, T1R2 and T1R3 were found to be co-expressed in cells. When the receptor
and sugar interact, it sets off a chain of events that result in action potentials conveyed to
the brain (Li et al., 2002; Nelson et al., 2001). Later, Liao and Schultz (2003) confirmed
that T1R1, T1R2, and T1R3 genes are expressed selectively in human taste receptor cells,
consistent with their role in taste perception that was previously described by other
investigators. T1R1 (taste receptor type 1 member 1) is a GPCR that in humans is
encoded by the TAS1R1 gene. T1R1 and T1R3 are found to create a heterodimer that
detects umami taste (Nelson et al., 2001).

42
To further investigate the sweet taste receptor phenomenon, Bachmanov et al.
(2001) used the quantitative trait locus technique in animals to generate high-sweetener-
favoring B6 mice and low-sweetener-favoring 129 mice. Using a positional cloning
approach, a small section of the F2-generation Sac locus was characterized as containing
the G-protein coupled receptor T1R3 in mice. In order to confirm the function of the
Tas1r3 gene in sweet taste perception, congenic (differ in only one locus of the
chromosome) mice were used in these studies. The mice expressing the Tas1r3 gene
showed saccharin and sucrose preferences similar to those of the control taster mice,
while the same generation without the transgene showed no response to the sweetener or
sucrose, thus demonstrating T1R3’s role in sweet perception (Bachmanov et al., 2001). In
studies of human taste genetics, taste receptor proteins such as T1R1 and T1R3 have been
linked to individual variations of sweet taste recognition thresholds in humans (Fushan et
al., 2010; Fushan et al., 2009) but not mice (Lu et al., 2005).
For bitter taste, single-nucleotide polymorphisms (SNPs) in the genes that code bitter
receptors (TAS2Rs) result in different chemical responses. For example TAS2R38 gene,
which codes T2R38, has been associated with individual differences in taste sensitivity
for compounds containing a thiourea, phenylthiocarbamide (PTC) and 6-n-
propylthiouracil (PROP) (Bufe et al., 2005; Kim et al., 2003; Lipchock, Reed, &
Mennella, 2011). The TAS2R38 gene has three SNPs with differences in amino acids.
The receptor gene, which detects bitter, contains a proline at position 49, alanine at
position 262, and valine at position 296 (PAV) (Kim et al., 2003). The polymorphisms

43
and respective genotype for the three variants are: rs713598 AA, AP, and PP; rs1726866
VV, AV, and AA; and rs10246939 II, IV, and VV, respectively.
Sweet and Bitter Taste Transduction Pathway
Signal transduction refers to the flow of chemical indicators that occurs
downstream from chemoreception (e.g., taste receptor cells) that ultimately stimulates the
nervous system to send a signal to the brain (Margolskee, 2002). The taste transduction
pathway and gustatory mechanisms play an important role in food intake and metabolic
regulation.
When discussing sweet taste, the transduction path is unique (Figure 9). In
mammals, once a sweet compound or ligand (sugar or sweetener) binds to a sweet taste
receptor with a G-protein subunit, such as alpha-gustducin, the subunit becomes activated
and causes a downstream intracellular second-messenger cascade (Kitagawa, Kusakabe,
Miura, Ninomiya, & Hino, 2001; Margolskee, 2002). Prior to the discovery of the sweet
taste receptors, investigators focused on cyclic adenosine monophosphate (cAMP) and
inositol 1,4,5-triphosphate (IP3) in signal transduction pathways of the taste receptor
cells, suggesting one model of sweet taste transduction. However, with advances in
technology, investigators further explored the transduction pathway of sweet taste
(Taruno et al., 2013). The GPCR taste receptors stimulate a transduction pathway that
involves the activation of phospholipase C β2 (PCLCB2), IP3-mediated Ca2+ release and
Ca2+ dependent activation of the transient receptor potential cation channel subfamily M
member 5 (TRPM5) channels that depolarize the plasma membrane and generate action

44
potentials, passing through the calcium homeostasis modulator 1 (CALHM1) and
subsequent release of Adenosine triphosphate (ATP) (Taruno et al., 2013). ATP serves
as a neurotransmitter in taste cells (Finger et al., 2005). The generated signal is sent to the
brain through one of three cranial nerves: VII (facial), IX (glossopharyngeal), or X
(vagus). Of these cranial nerves, the facial nerve (VII), more specifically, the chorda
tympani branch is responsible for the sensory perception of the anterior two-thirds of the
tongue. The glossopharyngeal nerve (IX) is responsible for the sensory perception of the
posterior one third of the tongue. These nerves are known to be directly involved with the
sense of taste. It is also important to highlight that the olfactory nerve (I) is responsible
for the sense of smell, which indirectly affects the sense of taste. The vagus nerve (X)
receives a special sense of taste from the epiglottis, specifically conducting the sense of
taste from the mouth to the larynx. The nerves connect to areas of the brain associated
with energy homeostasis (Chaudhari & Roper, 2010; Reed et al., 2006) and visceral
perception and palatability (McCaughey, 2008).
The same transduction pathway is activated when a bitter compound or ligand
comes in touch with the bitter taste receptors (Figure 10) (Taruno et al., 2013). TAS2R
proteins utilize the G-protein gustducin to elicit signal transduction. Both the α- and βγ-
subunits are crucial to the transmission of the taste signal (Margolskee, 2002).
Alteration to the taste transduction proteins, such as T1R3, α-gustducin, or Trpm5
(transient receptor potential cation channel, subfamily M, member 5) may affect intake of
and preference for caloric and noncaloric sweeteners (Sclafani & Ackroff, 2015;
Zukerman, Glendinning, Margolskee, & Sclafani, 2013). Trpm5 is a protein that in

45
humans is encoded by the TRPM5 gene. This protein is a key component of taste
transduction, activated in the presence of high levels of calcium.
The sweet taste receptor is also expressed in other areas of the body, with
additional biological responses (Egan & Margolskee, 2008; Kojima, Nakagawa, Ohtsu,
Medina, & Nagasawa, 2014; Margolskee et al., 2007; Nakagawa et al., 2009). The sweet
taste receptor cells located in human endocrine tissue contribute to incretin hormone
secretion and glucose transport (Beauchamp & Mennella, 2011). Expression of these
taste receptor genes is dysregulated in individuals with type 2 diabetes (for a review, see
Depoortere, 2014). In the hypothalamus, the sweet taste receptor may provide signals for
appetite regulation and food intake (Gerspach, Steinert, Schönenberger, Graber-Maier, &
Beglinger, 2011). The sweet receptor is also expressed in adipocytes. When stimulated
with appropriate ligands, such as high-potency sweeteners, this receptor plays an
essential role in adipocyte proliferation (Laffitte, Neiers, & Briand, 2014). The pattern of
sweet taste receptor expression among particular adipose depots in humans is not
understood but may contribute to adipose tissue distribution (e.g., waist circumference).
Individual differences in sweet taste thresholds may predict how well the sweet taste
receptor functions in these other tissues, which may have a role in obesity, diabetes, and
appetite. It is possible that sweet taste detection threshold may be proxy a measure for
sweet receptor function in the brain, adipocytes, and endocrine cells.

46
Figure 8. Sweet and Bitter Transduction Pathway
Sweet Taste Detection in Children and Adults
A literature review was conducted to elicit what has been published in regards to
sweet taste detection thresholds in children. Studies reported were from 1974 to 2015.
The majority of these studies were conducted in adults (N=27) with some studies focused
in both children and adults (N=4), while only a few studied children (N=8) (Table 2).
When available the age range, numbers of subjects, methods used to measure sucrose
detection thresholds and range of sucrose tested was provided. An attempt was made to
report all thresholds in mM to ease comparison across the studies. In spite of the vast
variety of populations studied and varied methodological approaches underpinning these
studies, important insights and conclusions can be drawn.
47
Based on the studies reported in Table 2, clearly there is a lack of studies in taste
thresholds in children; none of the ones reported for children take into consideration the
taste receptors genes associated with sucrose detection thresholds. Most studies used
traditional psychophysical methodology to assess taste perception, however, even the
traditional methods used vary across studies.
The studies varied between whole mouth and spatial or regional test. A whole-
mouth taste test is used to measure an individual’s ability to detect, evaluate and identify
the concentration of different sweet, sour, salty, and bitter taste solutions. With this
methodology the liquid stimulus is presented in milliliters. The whole mouth procedure
involves sipping a measured volume of a taste solution, keeping it in the mouth for an
allotted time, and then spitting it out (Simon & Nicolelis, 2002). It is the technique most
widely used in taste testing chemosensory procedures (Fushan et al., 2010; Meilgaard,
Civille, & Carr, 2000; Simon & Nicolelis, 2002). By contrast, a spatial or regional test is
used to evaluate diverse areas of the mouth. A cotton swab soaked in a taste solution is
positioned in different areas of the tongue (Berling, Knutsson, Rosenblad, & Von Unge,
2011; Hummel, Erras, & Kobal, 1997; Meilgaard, Civille, & Carr, 2000; Snyder, Prescott,
& Bartoshuk, 2006).
Some authors used a two alternative forced choice method (Pepino, Finkbeiner,
Beauchamp, & Mennella, 2010), others used a three stimulus forced choice method
(Kamath, Booth, Lad, Kohrs, & McGuire, 1983), a triangle method (Panek-Scarborough,
Dewey, & Temple, 2012). Only one study used both electrogustometry data and chemical
liquid stimuli (Park et al., 2015). The electrogustometry data is obtained using a device

48
that provides quantitative gustatory detection thresholds using an electrical current when
exposed to sweet and bitter taste. The methods used by Pepino et al. (2010) were the
only ones similar to the present study, which was validated to be used in children of
diverse background (e.g., African-American, Caucasians) (Bobowski & Mennella, 2015;
Mennella et al., 2011).
In adults sucrose detection thresholds have been studied in a variety of contexts,
for example, in individuals with depression, smokers vs. nonsmokers, diabetics, obese vs.
normal weight and in women with hormonal changes. Some studies only tested men,
which did not allow assessing for differences between genders. In children, the vast
majority of studies reported on populations of healthy children, but one study in children
reported taste thresholds in obese and non-obese children. Many of the earlier studies had
a focus on dental caries and sucrose detection thresholds, with a focus on dietary
influences in later publications.
The sample size used in the studies varied greatly (i.e., 10-180 subjects). In
addition, the range of sucrose used across studies was not standardized and the reporting
of the data obtained varied (e.g., mM, M, g/mL, %), making it difficult to compare sweet
taste thresholds reported among studies. In Table 2 values that were not reported as
milimolar concentrations in the literature were converted for easier comparison across
studies. The range of sucrose detection thresholds reported is very wide; this could be
because of the inconsistencies in methodologies.

49
Table 2. Summary of Studies Reporting Sucrose Detection Thresholds in Children and Adults
Subjects (children, adults,
age range) N=number of subjects in
study
Methods (Whole mouth;
part of the tongue)
Sucrose detection thresholds as reported in manuscript
Sucrose detection thresholds reported (mM)
SNPs Findings of the study Citation
Studies in Adult Subjects
Adults: 20.7 ± 0.3 years (N=70)
Whole mouth: Tested downward from a higher concentration to a lower concentration in decrements of 0.1%. Range of sucrose: not specified
Adults Male: 0.98 ± 0.09% Female students: 1.43 ± 0.21% in female students in the follicular phase Female: 1.27 ± 0.14% in the luteal phase.
Adults Male: 28.7 mM±26 mM Female Students: 41.8 mM±6.1 mM follicular phase Female students: 37.1 mM ± 4.1mM luteal phase
None Sucrose detection was negatively correlated with depression symptoms and trait anxiety in women in the luteal phase. However findings were not significant for males and women in the follicular phase
Nagai, Matsumoto, Endo, Sakamoto, & Wada, 2015
Adults: 20-29 years old N=41
Electrogustometer Range: 3 uA (–8 dB) to 400 uA (34 dB) Whole mouth: chemical test Sucrose Range: 0.05g/ml-2g/ml
Obese group 0.70 g/ml Normal weight group: 0.33g/ml Smoker: 0.71 g/ml Nonsmoker: 0.39 g/ml Standard deviation not reported
Obese group: 2040 mM Normal weight group: 960 mM Smokers: 2070 mM Non-smokers: 1140 mM
None With the chemical taste test, the obese group had higher thresholds for sweet. Smoking had an impact on taste threshold, with smokers having higher thresholds than non-smokers also for sweet.
Park et al., 2015
Adults: 20-60 years old N=40 prediabetic N=40 diabetics N=34 normal glycemic
Whole mouth: forced choice method Sucrose range: 1.25 × 10³
mol/L to 6.4 × 101 mol/L
Diabetic: 0.025 mol/L ± 0.01 Pre-diabetic: 0.018 mol/L ± 0.01 Normoglycemic: 0.015 mol/L ± 0.01
Diabetic: 25 ± 10 mM Pre-diabetic: 18 mM±10 mM Normoglycemic: 15 mM ± 10 mM
None The mean (SD) detection thresholds of diabetics were significant higher when compared to normoglycemic group and pre-diabetics.
Wasalathanthri et al., 2014
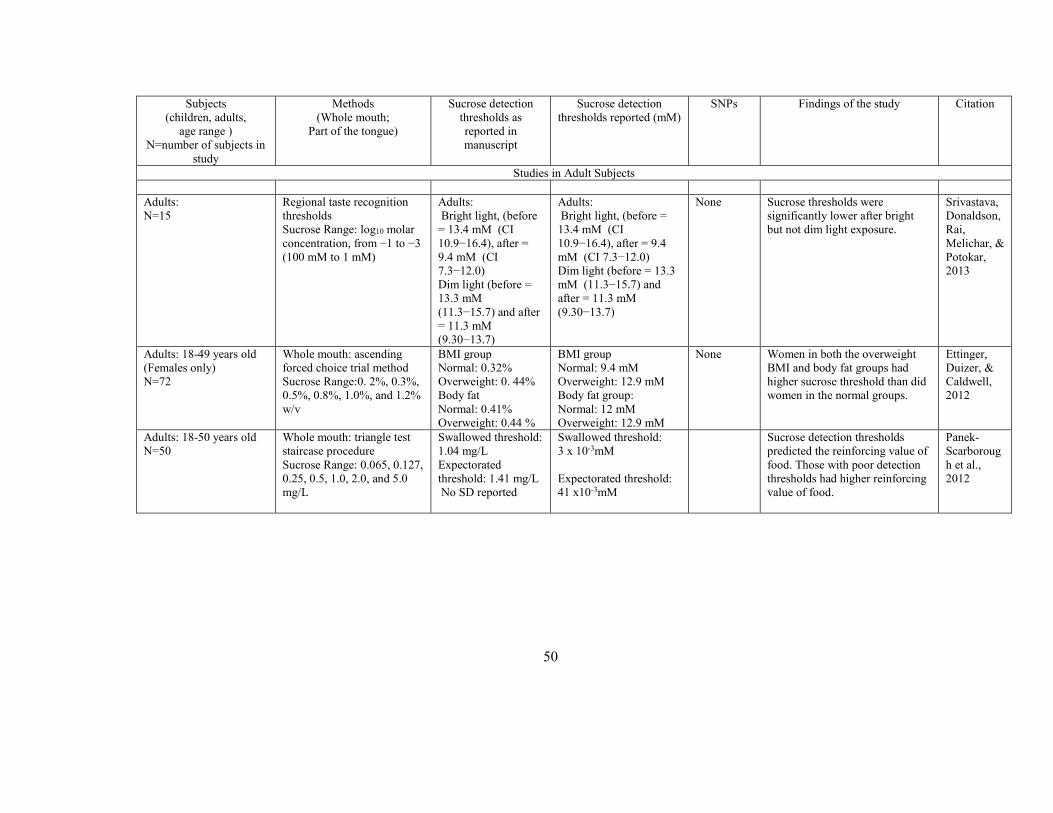
50
Subjects (children, adults,
age range ) N=number of subjects in
study
Methods (Whole mouth;
Part of the tongue)
Sucrose detection thresholds as reported in manuscript
Sucrose detection thresholds reported (mM)
SNPs Findings of the study Citation
Studies in Adult Subjects
Adults: N=15
Regional taste recognition thresholds Sucrose Range: log10 molar concentration, from −1 to −3 (100 mM to 1 mM)
Adults: Bright light, (before = 13.4 mM (CI 10.9−16.4), after = 9.4 mM (CI 7.3−12.0) Dim light (before = 13.3 mM (11.3−15.7) and after = 11.3 mM (9.30−13.7)
Adults: Bright light, (before = 13.4 mM (CI 10.9−16.4), after = 9.4 mM (CI 7.3−12.0) Dim light (before = 13.3 mM (11.3−15.7) and after = 11.3 mM (9.30−13.7)
None Sucrose thresholds were significantly lower after bright but not dim light exposure.
Srivastava, Donaldson, Rai, Melichar, & Potokar, 2013
Adults: 18-49 years old (Females only) N=72
Whole mouth: ascending forced choice trial method Sucrose Range:0. 2%, 0.3%, 0.5%, 0.8%, 1.0%, and 1.2% w/v
BMI group Normal: 0.32% Overweight: 0. 44% Body fat Normal: 0.41% Overweight: 0.44 %
BMI group Normal: 9.4 mM Overweight: 12.9 mM Body fat group: Normal: 12 mM Overweight: 12.9 mM
None Women in both the overweight BMI and body fat groups had higher sucrose threshold than did women in the normal groups.
Ettinger, Duizer, & Caldwell, 2012
Adults: 18-50 years old N=50
Whole mouth: triangle test staircase procedure Sucrose Range: 0.065, 0.127, 0.25, 0.5, 1.0, 2.0, and 5.0 mg/L
Swallowed threshold: 1.04 mg/L Expectorated threshold: 1.41 mg/L No SD reported
Swallowed threshold: 3 x 10⁻³mM Expectorated threshold: 41 x10-3mM
Sucrose detection thresholds predicted the reinforcing value of food. Those with poor detection thresholds had higher reinforcing value of food.
Panek-Scarborough et al., 2012

51
Subjects (Children, Adults,
Age Range) N=number of subjects in
study
Methods (Whole mouth;
Part of the tongue)
Sucrose detection thresholds as reported in manuscript
Sucrose detection thresholds reported (mM)
SNPs Findings of the study Citation
Studies in Adult Subjects
Adults: no age range provided N=160
Whole mouth. Threshold for sucrose were estimated using a storing test and signal detection analysis reported as R-index measures. Range of sucrose: 0, 0.5%, 1%, 2%, 2.4%, 2.8%, 3.2%, 3.6%, and 4% sucrose
R-index obtained for each pairwise comparison ranged from 71% to 94%. The lowest average R-index (71%) was obtained for the comparison of 0 and 0.5% sucrose whereas the largest R-index was obtained when comparing 1% and 2% sucrose solutions. Sucrose reported as AUC scores
CC 5.9 ± 1.4 AUC CT 6.8 ± 1.6 AUC TT 7.2 ± 1.0 AUC
GNAT3 GNAT3 polymorphisms explained variation in sucrose thresholds. Individuals with one or two copies of the C allele have lower sucrose detection thresholds.
Fushan et al., 2010
Adults: no age range provided N=144
Whole mouth. Threshold for sucrose were estimated using a storing test and signal detection analysis signal detection analysis and reported as R-index measures. Range of sucrose: 0, 0.5%, 1%, 2%, 2.4%, 2.8%, 3.2%, 3.6%, and 4% sucrose
R-index obtained for each pairwise comparison ranged from 71% to 94%. The lowest average R-index (71%) was obtained for the comparison of 0 and 0.5% sucrose whereas the largest R-index was obtained when comparing 1% and 2% sucrose solutions. AUC scores
CC 6.90 ± 1.47 AUC CT 6.07 ± 1.08 AUC TT 4.36 ± 1.26AUC
TAS1R3 Individuals with T alleles have lower sucrose sensitivity thresholds.
Fushan et al., 2009

52
Subjects (Children, Adults,
Age Range) N=number of subjects in
study
Methods (Whole mouth;
Part of the tongue)
Sucrose detection thresholds as reported in manuscript
Sucrose detection thresholds reported (mM)
SNPs Findings of the study Citation
Studies in Adult Subjects
Adults: 41-75 years old N=33
Whole mouth, multiple forced-choice presentation with an ascending series Range: sucrose 1.25×10⁻³ to 6.4 x 10⁻¹ mol/L
Pre-surgery: 5.1 mol/L± 1.8 mol/L Discharge: 1.7 mol/L± 1.2 mol/L
Pre-surgery: 5100 ± 1800 mM Discharge: 1700 ± 1200 mM
None Sweet taste detection thresholds were lower at discharge compared to pre-surgery. Thresholds remained lower when checked 16 weeks post-op.
Keith, Mokbel, San Emeterio, Song, & Errett, 2010
Adults: 21-40 years old N=57
Whole mouth, forced choice staircase procedure Sucrose Range: 0.000056 to 1.0 M
Obese: Median ~0.00065M ± 0.0103M Lean: 0.0100 M ± 0.0074M
Obese: 0.65 ± 10.3mM Lean: 10mM ± 7.4 mM
None Obese women had lower sucrose detection thresholds than normal weight women. Both obese and normal weight women preferred sucrose similarly. The level of sucrose preferred was not related to sucrose thresholds for either group or both groups combined
Pepino et al., 2010
Adults: 55-81 years old N=120
Side of the tongue: Forced choice, three-stimulus drop technique Sucrose Range: 34–342 mmol/L
Adults: 48mM± 38 mM
Adults: 48mM ± 38 mM None After an acute stroke, postmenopausal women had abnormal sucrose detection thresholds
Kim, Choi-Kwon, Kwon, & Kwon, 2009
Adults: 18-23 years old N=182
Whole mouth: forced choice method Sucrose Range: 2.5 × 10⁻⁴ to 0.5 M
Average: 10.83 mM ± 0.24 mM, Highest detection threshold: 19.88 mM ± 1.31 mM Lowest detection threshold: 5.85 mM ± 0.43mM
Average sucrose detection threshold: 10.83 mM ± 0.24 mM, Highest detection threshold: 19.88 mM ± 1.31 mM Lowest detection threshold: 5.85 mM ± 0.43 mM
None The density of fungiform papillae and sucrose detection threshold were inversely related. The higher numbers of papillae was associated with lower detection thresholds (more sensitive).
Zhang et al., 2009

53
Subjects (Children, Adults,
Age Range) N=number of subjects
in study
Methods (Whole mouth;
Part of the tongue)
Sucrose detection thresholds as reported in manuscript
Sucrose detection thresholds reported (mM)
SNPs Findings of the study Citation
Studies in Adult Subjects
Adults: 21-30 years old N= 91 healthy, non-obese, non-diabetic
Whole mouth: Standard staircase methodology (modified from Pasquet et al., 2006) for various taste stimuli. Sucrose Range: 0.001–0.1 mol/l
Adults: 23.0 mM +2.5 mM in the morning 38.2 mM +4.0mMin the evening.
Adults: 23.0 mM +2.5 in the morning 38.2 mM +4.0 in the evening
None Sweet taste detection thresholds varied by time of day with lowest thresholds in the morning and the highest thresholds at night.
Nakamura et al., 2008
Adults: 21-40 years old N=49
Whole mouth, two alternative staircase method Sucrose Range: 0.000056 to 1.0 M
Smokers Nicotine: 0.01M±0.006M Smokers non-nicotine: 0.010M±0.006M Nonsmokers nicotine: 0.008M ± 0.004M Nonsmokers non-nicotine: 0.012M±0.006M
Smokers non-nicotine: 10mM ± 6mM Smokers non-nicotine: 1mM ± 6mM Nonsmokers nicotine: 8mM ± 4mM Nonsmokers non-nicotine: 12mM ± 6mM
None Smokers had higher sucrose thresholds (decreased sensitivity) than nonsmokers.
Pepino & Mennella, 2007
Adults: mean age 23.9 ± 1.2 N=69
Whole mouth: Standard two alternative forced choice Sucrose range: 3.2 × 10⁻⁴ − 1.0 M
Men: 0.22 x 10⁻² M ± 0.27x10⁻² M Women: 0.18 x10⁻²
± 0.23 x10⁻² M
Men 2.2mM ± 2.7mM Women: 1.8mM ± 2.3mM
None Sweet taste sensitive increased with the ratio of PROP.
Chang et al., 2006
Adults: 28-78 years old N=21
Whole mouth: Test of limits 1.5 to 15.5 mM (in 1.0 mM increments) for sucrose
Sjögren's syndrome patients: Median 7.5 mM Control group: 5.5 mM
Sjögren's syndrome patients: Median 7.5 mM Control group: 5.5 mM No SD reported
None Sucrose detection thresholds were higher in Sjögren’s syndrome patients compared to controls. Detection thresholds for other taste compound were also higher
Gomez, Cassis-Nosthas, Morales-De-Leon, &

54
No SD reported in Sjögren’s syndrome patients. Bourges, 2004
Subjects (Children, Adults,
Age Range) N=number of subjects in
study
Methods (Whole mouth;
Part of the tongue)
Sucrose detection thresholds as reported in manuscript
Sucrose detection thresholds reported (mM)
SNPs Findings of the study Citation
Studies in Adult Subjects
Adults: 18-24 years old N=27
Whole mouth: constant stimuli with the order of presentation Counterbalanced using a Latin square. Sucrose range: 0.1, 0.08, 0.06, 0.04, 0.02, 0.01, and 0.008 M
#1Menstruation 0.025M± 0.002M #2Pre-ovulation: 0.015M ± 0.002M #3Post-ovulation: 0.027M± 0.002M Men measured during the same time frame as women. #1Men: 0.022M ± 0.004M #2 Men: 0.022M ± 0.003M #3 Men: 0.021M± 0.003 M
#1Menstruation: 25mM ± 2mM #2Pre-ovulation: 15mM ± 2mM #3Post-ovulation: 27mM ± 2mM Men measured during the same time frame as women. #1Men: 22mM ± 4mM #2 Men 22mM ± 3mM #3 Men 21mM ± 3mM
None For women, there was an increase in sweet sensitivity during pre-ovulation phase and lower sweet sensitivity during post-ovulation. There was no variation in sucrose detection thresholds in men.
Than et al., 1994
Adults: 20-88 years old N=71
Whole mouth: forced choice procedure Sucrose range: 0.01-580mM
X of 6 reversals Younger group: 3.6mM Older group: 8.0mM 1st downward run Younger group: 5.5mM± Older group: 11.3 mM No SD reported
X of 6 reversals Younger group: 3.6mM Older group: 8.0mM 1st downward run Younger group: 5.5mM Older group: 11.3 mM No SD reported
None Sweet taste sensitivity decreased with age (higher detection thresholds).
Moore et al., 1982
Adults: 23-88 years old N=81
Whole mouth: forced choice Sucrose range: 5.6 x 10⁻¹ and 1.0x 10⁵
5.92x10⁻³ mM± 5.92 mM
5.92x10⁻³ mM ± 5.92 mM
None Sucrose thresholds were not significantly related to age.
Weiffenbach, Baum, & Burghauser, 1982

55
Subjects (Children, Adults,
Age Range) N=number of subjects in
study
Methods (Whole mouth;
Part of the tongue)
Sucrose detection thresholds as reported in manuscript
Sucrose detection thresholds reported (mM)
SNPs Findings of the study Citation
Studies in Adults Subjects
Adults: 65-87 years old Controls: 20-29 years old N=101
Method of Lagan and Yearisk (1976) Sucrose range: 0.01, 0.02, 0.05, 0.1, 0.2, 0.5 M
Mean thresholds not reported
Mean thresholds not reported
None Elderly had higher sucrose thresholds than younger participants.
Lassila, Sointu, Raiha, & Lehtonen, 1988
Adults: 40-79 years old N=26
Whole mouth: 3 stimulus forced choice method Sucrose Range: 0.1, 1.3,6, 10, 30, 60, 100, 300, 600, 1000, and 3000 mmol/L
Unmatched controls: 22 ± 11.1 mM Range: 6-30 mM Patients: 58.8 ± 79.4 mM Matched controls: 54.5 ± 76.4 mM
Unmatched controls: 22 ± 11.1 mM Range: 6-30 mM Patients: 58.8 ± 79.4 mM Matched controls: 54.5 ± 76.4 mM
None There were no significant differences between the groups for sucrose detection.
Kamath et al., 1983
Adults: 18-40 years old Females only N=22
Tip of tongue: Forced choice drop technique Sucrose range: 6, 12, 30, 60, 90, 150, 300, 500, 800, and 1000 mM
Mean thresholds not reported
Mean thresholds not reported
None There was no difference among compared adult-onset obese, juvenile-onset obese, and never-obese females
Malcolm, O’Neil, Hirsch, Currey, & Moskowitz, 1980

56
Subjects (Children, Adults,
age Range) N=number of subjects in
study
Methods (Whole mouth;
part of the tongue)
Sucrose detection thresholds as reported in manuscript
Sucrose detection thresholds reported (mM)
SNPs Findings of the study Citation
Studies in Adult Subjects
Adults: 17-72 years old N=69
Whole mouth: three cup presentation Sucrose Range: 0.03-1.2 mg/100ml
Adult onset diabetes Diabetics: 0.5mg/100ml Control: 0.3 mg/100ml Non diabetic relatives: 0.3 mg/100ml Controls: 0.4 mg/100ml Juvenile onset diabetes: 0.45 mg/100ml Controls: 0.5 mg/100ml No SD reported
Adult onset diabetes Diabetics: 0.0146mM Control: 0.0087mM Non diabetic relatives: 0.0087mM Controls: 0.0116mM Juvenile onset diabetes: 0.0131mM Controls: 0.0146mM No SD reported
None The adult onset diabetics demonstrated a higher sucrose threshold than controls.
Lawson, Zeidler, & Rubenstein, 1979
Adults: 21 young (19–33 years) and 21 elderly (60–75 years)
Whole mouth: Two-alternative forced choice, with concentrations presented in ascending order. Sucrose Range: 4.09 × 10⁻¹–1.63 × 10²
Male elderly: 8.15709 g/l Female elderly: 4.56599 g/l Male young: 5.21838 g/l Female young: 3.90423 g/l No SD reported
Men elderly: 23.83mM Female elderly: 13.35mM Male young: 15.25mM Female young: 11.41mM
No SD reported
None The older men were less sensitive than the young men and women for sucrose. No sex differences observed.
Mojet, Christ-Hazelhof, & Heidema, 2001

57
Subjects (Children, Adults,
age Range) N=number of subjects in
study
Methods (Whole mouth;
part of the tongue)
Sucrose detection thresholds as reported in manuscript
Sucrose detection thresholds reported (mM)
SNPs Findings of the study Citation
Studies in Adult Subjects
Young adults: Mean age 21 years old N=12
Whole mouth: two alternative forced choice method Range of sucrose: not reported
All Anorexics: 0.49%± 0.50 Refeeding anorexics: 0.14%± 0.29 Low body weight anorexics: 0.85%± 0.40
All anorexics: 41.3±14.6 mM Refeeding anorexics: 4.1 ± 8.5 mM Low body weight anorexics: 24.9 ± 11.7 mM
None Overall, anorexics did not have abnormal sucrose detection thresholds, but those anorexics in high caloric refeeding diets had lower sweet sensitivity compared to controls and those in low caloric diet.
Lacey, Stanley, Crutchfield, & Crisp, 1977
Adults: 17-19 years old (Males only) N=50
Tip of tongue: Force choice Sucrose range: 5mM-50mM
Caries free: 8.9 mM ± 0.5mM Control: 12.9 mM ± 0.9mM
Caries free: 8.9 mM ± 0.5 mM Control: 12.9 mM ± 0.9 mM
None The caries-free group had a significantly lower mean sucrose detection threshold compared to that of the control group.
Catalanotto & Keene 1974
Adults: 17-25 years old (Males only) N=52
Tip of tongue: Forced choice 1-drop water and 1 drop tastant. Sucrose Range: 5 mM/L to 70 mM/L
Caries- free: 10.71mM ± 1.83 Caries-active: 16.79mM± 1.46
Caries- free: 10.71mM ± 1.83 mM Caries-active: 16.79mM ± 1.46 mM
None Sucrose detection threshold for the caries-free subjects was significantly lower than that of the caries-active group.
Wrobel, Catalanotto, & Walter, 1978
Studies in Adults and Children
With type I diabetes Adult: 16 years and older N=22 Children: 9-15 years old N=100 Without diabetes N=41-adults N=100- children
Tip of tongue: forced choice triangle method Sucrose range: 0.20, 0.40, 0.60, 0.80, 1.00, 1.20, 1.40, 1.60 %
Youth diabetic: 0.65% Non-diabetic: 0.520% Adults: Diabetic: 0. 860% Non-diabetic:0. 420% No SD reported
Youth Diabetic: 19 mM Non-diabetic: 15.2 mM Adults: Diabetic: 25.1 mM Non-diabetic: 12.3 mM No SD reported
None Diabetes and age can decrease an individual's sucrose detection threshold
Hardy, Brennand, & Wyse, 1981

58
Subjects (Children, Adults,
age Range) N=number of subjects in
study
Methods (Whole mouth;
part of the tongue)
Sucrose detection thresholds as reported in manuscript
Sucrose detection thresholds reported (mM)
SNPs Findings of the study Citation
Studies in Adults and Children
Adults: 22.2 years, range not known (n=61) Children: 8-9 years old (N=68)
Whole mouth: A paired-comparison forced-choice procedure Range of sucrose: 1.171 × 10⁻⁴ − 7.5 × 10⁻² M
Girls: 0.0072±0.0026 M Boys: 0.0170±0.0033M Adult women: 0.0062±0.0017M Adult men: 0.0068±0.0010M
Girls: 7.2mM +2.6mM Boys: 17mM +3.3mM Adult women: 6.2mM +1.7mM Adult men: 6.8mM +1mM
None Boys had higher detection thresholds for sucrose. While female children had similar detection thresholds to adults.
James et al., 1997
Adults: 20-30 years N 10 Children 8 years N: 10
Different areas in the tongue: two forced alternative choice method with filter paper Sucrose rage: 0.2125 M
Data reported the number of correct responses based on the number of papillae and sensitivity to sucrose
Data reported the number of correct responses based on the number of papillae and sensitivity to sucrose
None Children were significantly more sensitive to sucrose than adults. Counts of papillae were similar for both children and adults.
Stein, Laing, & Hutchinson, 1994
Adults: 16-25 years old Children: 6-15 years old N=103 adults N=37 children
Tip of tongue: three drop test Sucrose Range: 10, 15, 20, 25, 30,40, 50,100, 200 mmol/l
Children 6-15: 10-40 mM Adults: 10-100mM No SD reported
Children 6-15: 10-40 mM Adults: 10-100mM No SD reported
None Sucrose thresholds were not related to the caries experience. Sucrose threshold decreased with age. Lower sucrose thresholds for sucrose were not related to sugar in beverages.
Adams & Butterfield, 1979
Studies in Children
Children: 6-18 years old (N= 99 obese N=94 normal weight)
Whole mouth: Taste strips were used and ranked on a 5-point rating scale, with 1-No Taste, and 5 -Very Strong Taste. Range of sucrose: Four different concentrations for sweet, (sweet: 0.4, 0.2, 0.1, 0.05 g/ml sucrose).
Obese children: 12.6±3.0 Total Score Non-obese children: 14.1±3.0 Total Score
Not able to be calculated since the correct number of identified taste strips was reported.
None Obese children had more difficulty identifying sweet as well as other taste qualities less compared to children and adolescents of normal weight
Overberg et al., 2012

59
Subjects (Children, Adults,
age Range) N=number of subjects in
study
Methods (Whole mouth;
part of the tongue)
Sucrose detection thresholds as reported in manuscript
Sucrose detection thresholds reported (mM)
SNPs Findings of the study Citation
Studies in Children
Children: 7-15 years old N=92
Tip of tongue: Up-down forced choice design Sucrose range: 5 to 70 mM
Caries susceptible: 13.7mM Caries free: 15.6mM No SD reported
Caries susceptible: 13.7mM Caries free: 15.6mM No SD reported
None There was no significant difference in sucrose thresholds between the two caries groups. Results were different from the adult literature.
Catalanotto, Gaulin-Kremer, & Shaw, 1979
Children: 15-year-olds N=100 50 with a high and 50 with a low caries
Whole mouth Sucrose Range: 3.91mmol/L-88.39mml/L
Median 15.6 mM/L in both groups No SD reported
Median 15.6 mM/L in both groups No SD reported
None There was not a statistically significant difference in thresholds between the groups. There was not an association between thresholds and preferences for sucrose.
Nilsson, Holm, & Sjostrom, 1982
Children: 5-12 years (N=40 years).
Whole mouth: the subjects tasted solutions at 2 concentrations and asked to identify the lowest concentration. Sucrose Range: 0.032M and 0.32 M.
Mean=1.56 M+ No SD reported
Mean=1560mM No SD reported
None The sucrose solution was detected with the most diluted concentration. There were no gender differences for threshold.
Majorana et al., 2012
Children: 12 years old N=181
Whole-mouth technique Sucrose Range: 3.91 mmol/l to a maximum concentration of sucrose 88.39 mmol/l.
Median: 22.10 mM No SD reported
Median: 22.10 mM No SD reported
None Girls were in the high sucrose perception taster group. There was no significant difference in sweet perception status between low and high caries groups.
Furquim, Poli-Frederico, Maciel, Gonini-Junior, & Walter, 2010
Children: 11-15 years old N=143
Whole mouth, up-down, two cup forced choice Range: 0.056M to 1.000M
Mean:0. 004 M ± No SD reported 4mM
Mean: 4mM No SD reported
None Children with high and low sucrose preference patterns did not differ in sucrose perception.
Coldwell et al., 2009

60
Subjects (Children, Adults,
age Range) N=number of subjects in
study
Methods (Whole mouth;
part of the tongue)
Sucrose detection thresholds as reported in manuscript
Sucrose detection thresholds reported (mM)
SNPs Findings of the study Citation
Studies in Children
Children: 5-9 years old. N=99
Whole mouth: Forced choice triangle test Range of sucrose: 0%, 0.2%, 0.4%, 0.6%, 0.8%, 1.0%, 1.2%, 1.4% and 1.6%.
Median: 1.0% +0.37 Low sucrose threshold: (0.4 and
0.6%; n = 35)
Moderate sucrose
threshold:(0.8–1.2%; n = 36)
High sucrose threshold: (1.4 and
1.6%; n = 28).
No SD reported
Median: 29.2 mM± 10.8 mM Low sucrose threshold: 11.7 mM and 17.5mM Moderate sucrose threshold: 23.4 mM and 35.1 mM High sucrose threshold: 40.9 and 46.8 mM No SD reported
None Children with moderate sucrose detection thresholds consumed the most non-bitter fruits. Children with high sucrose thresholds consumed more green leafy vegetables.
Fogel & Blissett, 2014
Children: 3-6 years old (N=45)
Whole mouth: Two alternative, forced-choice staircase Range of sucrose: 1.5, 3.0, 6, 12, 18, 24, 30, 45, 60, 120, 180, 240 and 300 mmol/l
Children: 31mM Children: 31 mM None The goal of this study was to develop an instrument to measure thresholds in children younger than 6 years old. Found that accurate data can be obtained in children of this age group if method is short, easy to understand and fun.
Visser, Kroeze, Kamps, & Bijleveld, 2000

61
CHAPTER 3
Research Design and Methods
Research Design
This dissertation study was a descriptive, secondary data analysis to which I
contributed original genotype data analysis and interpretation for the candidate genes
selected. It was based in part on data collected from two “taste studies” conducted by Dr.
Julie Mennella and her research staff at the Monell Chemical Senses Center in
Philadelphia, Pennsylvania, in 2004-2012. The goal of this study was to understand
individual differences in taste sensitivity and genetics and their relationship to diet-
related food behaviors and obesity. The study focused specifically on a sample of
racially and ethnically diverse children 7-14 years of age from the Philadelphia area and
the relationships among (a) psychophysical measures of sucrose detection thresholds (b)
inherited forms of the sweet taste genes TAS1R2, TAS1R3, and GNAT3 and bitter taste
gene TAS2R38, (c) adiposity measures, (d) diet related food behaviors reported as dietary
intake of total calories and added sugars, and (e) personal charactertistics measured as
child temperament and food neophobia.
Recruitment, Setting and Consent
Recruitment, informed consent, and assent of subjects had already taken place in
the parent studies. Mothers of children were recruited for a “taste study” from the
metropolitan Philadelphia area using advertisements in local newspapers and magazines
and via mass mailings. Screening procedures were implemented based on previous
research published by the Reed and Mennella labs, all of which have been reviewed and

62
approved by the Office of Regulatory Affairs at the University of Pennsylvania. During
the weeks prior to the study, a blank copy of the consent form was mailed to the home of
each participant. Initial screening interviews were conducted with mothers over the
telephone.
Before testing, written informed consent was obtained from the child’s mother,
and assent was obtained from each child. The mother of the child was provided with a
copy of the consent form to read on the day of testing. During the consenting process
with the parent, each section of the consent was reviewed. The experimenters explained
the study goals and then verbally repeated the statement on the written consent form,
emphasizing that the subject may, at any time and for any reason, withdraw from the
participant group or experiment without penalty or prejudice. Before signing, each parent
was encouraged to ask questions she might have regarding the experiment. To help the
children achieve a developmentally appropriate awareness of the nature of the study,
children were encouraged to ask questions and assent was obtained from each child.
Questions were asked both in the presence of the mother and again in the private testing
room a setting away from maternal influence.
A detailed description of the purpose of the research study as well as the risks
and benefits of the study, compensation, and privacy policy were explained to parents.
After signing the informed consent form, each parent was given a copy of the signed
form and was invited to contact our laboratory at any time if any questions or concerns
arose after study completion. Mother of participants were reimbursed for travel expenses
and given a small incentive for their time and cooperation with study procedures.

63
Inclusion and Exclusion Criteria
Key inclusion criteria were age 7-14 years, ability to speak English, and reported
good health at the time of study participation. Key exclusion criteria were medical
conditions that interfere with eating or that alter taste perception (Table 3).
Table 3. Inclusion and Exclusion Criteria
Inclusion criteria Exclusion criteria
Children age 7-14 years Medical conditions that interfere with taste (i.e. cold or flu)
English-speaking Taking medications that alter appetite
Good health Unable to understand and complete psychophysical testing
Methods and Procedures
The following section focuses on the methods used to obtain the variables in this
study. To further illustrate and clarify data obtained in the original “taste” studies and
what was added in this study, see Table 4.

64
Table 4. Variables Included in Analyses
Measures collected in original studies
Demographic characteristicsa.b
Sucrose detection thresholdsa.b
Child’s DNAa, b
Height and weighta, b
% body fatb
Waist circumference (WC)b
Dietary intakeb
Child’s Temperament and Food Neophobia Scaleb
Added in this study
SNP selection
Genotyping of selected SNPs a, b
Waist–Height Ratio (WHtR)b
Note: aMeasures were collected in study #1; b Measures were collected in study #2
Demographic Information
Demographic information was attained on each participant during the initial
original parent “taste” studies. Age in months was calculated from the difference between
reported date of birth of the child and the date of psychophysical testing. The child’s
mother reported the child’s gender, race, and ethnicity. Mothers were also queried about
their own race/ethnicity. Race ethnicity was assigned using standard US Census
categories. Household income was also reported by the child’s mother in categories
(<$50,000, $50,000-$99,000, >$100,000, unknown).

65
Sucrose Detection Thresholds
Preparation of Sucrose Solutions
Prior to starting the sucrose detection thresholds testing, the tasting solution were
prepared and stored in a cold room. The written protocol on how to prepare solutions was
strictly followed to minimize potential systematic and random errors that can affect the
results. Solutions were discarded after two weeks from the date prepared and replaced for
future studies (see Appendix A)
Children’s Testing and Training for Sucrose Detection Thresholds
Sucrose detection threshold using a two-alternative forced-choice staircase
procedure was developed at the Monell Center for adults (Cowart & Beauchamp, 1990;
Mennella et al., 2011; Pepino & Mennella, 2007; Pribitkin, Rosenthal, & Cowart, 2003)
and later adapted for use among pediatric populations (Bobowski & Mennella, 2015;
Mennella et al., 2011). The two-alternative forced choice is a psychophysical method
developed to elicit responses about an individual’s experience regarding a stimulus. It
focuses on the evaluation of a single attribute (e.g., sweetness), and the stimulus is
adjusted based on the individual responses (Bartoshuk, 1978; Jogan & Stocker, 2014).
For this study, all testing took place in a private, comfortable room specially designed for
sensory testing that was illuminated with red light to mask any visual differences among
samples. Subjects consumed no food or drink other than water for at least one hour before
the task and acclimated to the testing room and to the researcher for approximately 15
minutes before testing.

66
Prior to testing, all children were trained to become familiar with the method and
to assess whether they understood the detection threshold task (Appendix B). Children
were presented with a pair of 30 mL disposable medicine cups (Fisher Scientific, Inc.).
One cup contained distilled water, and the other contained either a 0.056 mM or 18 mM
sucrose solution (Bobowski & Mennella, 2015). Children were asked to taste both
solutions in the order presented and to point to the solution that had a taste. The two pairs
provided the children with the experience of tasting a pair of solutions for which they
could not detect a difference (water vs. 0.056 mM sucrose) and for which the difference
between solutions was easily discernible (water vs. 18 mM sucrose). This method
eliminated the need for a verbal response and has been shown to be an effective method
for assessing both taste and olfaction in children (Bobowski & Mennella, 2015;
Mennella, Finkbeiner, et al., 2014). Training was repeated for those children who did not
understand the task after one training session. If after training children did not comply
with the procedures, became tired, or refused to continue, the testing was stopped and the
data were not analyzed.
The solutions used for testing in the formal threshold detection protocol ranged in
concentrations of 0.056-1000 mM and were equally diluted from the maximum
concentration in quarter log steps. The order of presentation of solutions was randomized
across subjects. The first pair of samples presented to the child was near the middle of the
concentration series, starting at 3.2 mM (Pepino et al., 2010). During each trial, subjects
were presented with pairs of solutions; within each pair, one solution was distilled water
and the other the taste (sucrose) stimulus. Subjects were instructed to taste the first

67
solution presented within a pair, swish the solution in their mouth for 5 seconds, and
expectorate. Subjects tasted the second solution within a pair using the same protocol,
rinsing their mouth with distilled water once between solutions within a pair and twice
between successive pairs. Time was monitored during interpair (5 s) and interseries (1
min) intervals using a digital clock, to prevent the introduction of traces of stimuli (i.e.,
sucrose) left from preceding trials (Bartoshuk, 1978). After tasting both solutions within
a pair, subjects were asked to point to the solution that had a taste, as in the training task
(Appendix C). The concentration of the tastant in the solution presented in the
subsequent pair was increased after a single incorrect response and decreased after two
consecutive correct responses. A reversal occurred when the concentration sequence
changed direction (an incorrect response followed by a correct response or vice versa).
A tracking grid (Figure 9) was used to record subjects’ responses. The testing
procedure was terminated after four reversals occurred, provided the following criteria
were met: (a) there were no more than two dilution steps between two consecutive
reversals, and (b) the reversals did not form a consistent ascending or descending pattern
such that positive and negative reversals were achieved at successively higher or lower
concentrations (Pribitkin et al., 2003). For each subject, the calculated detection threshold
for sucrose was calculated as the mean of the log values of the last four reversals
(Appendixes D & E). The log transformation is used to make non-normally distributed
data less skewed, to make patterns in the data more interpretable and to help meet the
assumptions of inferential statistics (Bland & Altman, 1996; McDonald, 2014). Finally,
the antilog value was determined to represent the mean sucrose detection threshold.

68
Although only a narrow section of the testing grid was required to test the subject
illustrated in Figure 9, some children tasted stimuli over a wider range of concentrations
before their threshold was determined.
Methodological sources of errors with this methodology have been
considered. Careful attention to sources of both random and non-random error was taken
into account in the development of this technique to reduce the potential for invalid and
unreliable data. The two-alternative forced choice staircase approach maximizes
precision by minimizing the number of trials (Bartoshuk, 1978; Jogan & Stocker, 2014).
The methodology has been used in other studies as well where investigators obtained
comparable data (Bobowski & Mennella, 2015; Pepino et al., 2010; Pepino & Mennella,
2012). The advantage of using this technique is that stimulates a large region of the
anterior oral cavity, which has been used to make inferences about normal perception
during eating and drinking. Steps have been taken to reduce limitations related to
stimulus control and residual stimuli that may remain in the mouth by asking participants
to rinse their mouth with water between test doses and measuring time between stimuli.
During the preparation of the sucrose solution, ensuring adequate calibration of pipettes
and scales has reduced some systematic errors.

69
Figure 9. Forced Choice Sucrose Detection Threshold Tracking Grids
Single Nucleotide Polymorphism (SNP) Selection
The taste receptor genes hypothesized to be related to sucrose detection thresholds
were selected through a rigorous literature search limited to articles published in 2001-
2014, written in English, using PubMed and Scopus databases.

70
Genes and their variants chosen for their relation to sweet taste or the
consumption of sweet foods were TAS1R2 (rs35874116), TAS1R3 (rs35744813), and
GNAT3 (rs7792845). For TAS1R2 gene I191V, the variants sites change amino acids in
the proteins from Isoleucine (I) to Valine (V) at position 191.For the three variant sites
within TAS1R2, genotyping results are shown as II, IV, and VV. For each of the
regulatory regions of TAS1R3 and GNAT3, genotyping results are shown as nucleotides
(CC, CT, or TT) (Table 5). Of the three genotypes at this locus, those carrying the V
allele have been associated with a lower habitual sugar intake (Eny et al., 2010). For the
TAS1R3 gene, the TT genotype is associated with a poorer ability to distinguish among
low concentrations of sucrose compared with the CC genotype (Fushan et al., 2009). For
the GNAT3 gene, the CC genotype is associated with poorer ability to distinguish low
concentration of sucrose compared with the CT or TT genotype (Fushan et al., 2010).

71
Table 4. Taste Receptor and Signaling Protein Genes and Related Single Nucleotide Polymorphisms
Sweet Taste Receptor Gene and Signaling Protein Single Nucleotide Polymorphisms
Gene Marker Official
Name
Type MAF Type of Variant Taste
Association
Sample
previousl
y studied
Cite
TAS1R2 rs35874116 Taste receptor, type 1, member 2
G protein-coupled receptor
C=0.266 Missense Sugar consumption
Adults Eny et al., 2010
TAS1R3 rs35744813 Taste receptor, type 1, member 3
G protein-coupled receptor
T=0.253 Upstream Sweet taste sensitivity
Adults Fushan et al., 2009
GNAT3 rs7792845 Guanine nucleotide binding protein, alpha transducing 3
G protein- signal transduction
T=0.320 Intron Sweet taste sensitivity
Adults Fushan et al., 2010
Bitter Taste Receptor Gene Single Nucleotide Polymorphisms
TAS2R38 rs713598 Taste receptor, type 2, member 38
G protein-coupled receptor
C=0.495 Missense Bitter taste sensitivity
Adults and Children
Mennella, Pepino, Duke, & Reed, 2010
TAS2R38 rs1726866 Taste receptor, type 2, member 38
G protein-coupled receptor
A=0.425 Missense Bitter taste sensitivity
Adults and Children
Mennella, Pepino, Duke, et al., 2010
TAS2R38 rs10246939 Taste receptor, type 2, member 38
G protein-coupled receptor
C=0.479 Missense Bitter taste sensitivity
Adults and Children
Mennella, Pepino, Duke, et al., 2010
Note: MAF = Minor allele frequency. A marker polymorphism is an alternative form of a gene, which is denoted with rs numbers that are unique identifiers of each variant.

72
Variations in the bitter taste receptor gene TAS2R38 can explain differences in
sweet taste preference in children. For the TAS2R38 gene, the variant sites are expected
to change amino acids in the proteins as follows: A49P, V262A, and I296V (Timpson et
al., 2007). For TAS2R38 gene A49P, the variants sites change amino acids in the protein
from Alanine (A) to Proline (P) at position 49. For V262A, the change of amino acid
occurs at position 262 with a Valine (V) to Alanine (A). Lastly, for I296V, an Isoleucine
(I) changes to Valine (V) at position 296.The aforementioned TAS2R38 variants sites
form two common haplotypes with the amino acid combination of AVI and PAV. The
diplotypes of these combinations predict bitter taste sensitivity. Commonly, individuals
with the AVI/AVI diplotype are bitter nontasters; AVI/PAV are medium tasters; and
PAV/PAV are tasters (Kim et al., 2003; Mennella, Pepino, Duke, et al., 2010). For A49P,
the P allele is associated with higher sucrose preference in children compared with the
AA allele (Mennella et al., 2005). Because of the tendency for closely linked alleles to be
co-inherited, the V allele of rs1726866 and the I allele of rs10246939 would have a
similar effect as the A allele of A49P (Kim et al., 2003).
The minor allele frequencies (MAF) for the chosen polymorphisms are also
shown in Table 5, along with the type of variant. MAF refers to the frequency at which
the least common allele occurs in a given locus and population. The MAF numbers
reported here are based on dbSNP database (National Center for Biotechnology Information,
2005).

73
Genotyping
As part of the original parent studies, on the day of testing each child provided a
saliva or buccal cell sample from which genomic DNA was extracted, purified, and
quantified (BuccalAmp, Epicenter, Madison, WI, or Genotek, Kanata, Canada [see
appendix I & J) and stored in an -80 °C freezer. Genotyping was conducted in the
laboratory of Dr. Danielle Reed, director of genomics at the Monell Chemical Senses
Center. The methods used and the genetic markers selected were validated in Dr. Reed’s
laboratory (Mennella, Finkbeiner, et al., 2014; Mennella, Pepino, Duke, et al., 2010).
Genomic DNA samples were used as a template in TaqMan® assays (Applied
Biosystems, Foster City, CA) in duplicate using previously established methods
(Mennella et al., 2012). The extracted genomic DNA samples are diluted to 5 ng/µl,
assayed for genotype and alleles identified (see appendix K).
For genotype quality assurance, the concentration of DNA in stored samples was
checked using a Nanodrop® Spectrophometer ND100 prior to use. Subjects with known
genotype from previous studies were added as controls. A random regenotyping of at
least 5% of the sample was used to assess agreement of genotype between duplicate
samples. A comparison of genotypes for those samples that were regenotyped resulted in
100% agreement. Samples that failed to amplify or cluster into genotype groups were
genotyped once more. If no genotype could be obtained with three attempts, the value
was treated as missing data.
We assessed the distribution of the expected and observed genotypes using the
Hardy-Weinberg equilibrium (HWE). HWE, typically used to identify genotyping errors

74
(Teo, Fry, Clark, Tai, & Seielstad, 2007), assumes that the genetic variation in a
population will remain constant from one generation to the next in the absence of other
evolutionary factors, such as mutations, natural selection, nonrandom mating, gene flow,
and genetic drift (Contento, 2008). For example, when there are two alleles for a
particular gene (A and B) and their frequencies is p and q, then p + q must equal 1. The
formula for calculating HWE is p2 + 2pq + q2 = 1. Then, we can calculate the expected
frequencies of the genotypes AA (p2), AB (2pq), and BB (q2) (Hosking et al., 2004;
Ryckman & Williams, 2008).
Adiposity Measures
Height and weight were measured in children in the laboratory. BMI and BMI z-
score measures were available in all children for whom we had height and weight.
However, the measures of fat mass (percent body fat), waist circumference and waist-to
height ratio (WHtR) were taken in a subset of 96 children from study 2. Details on
validity and reliability of the instrumentation used in this study are provided in Table 6
Height and Weight
All but three children (n=232) were weighed (kg) and measured for height (cm)
wearing light clothing and no shoes using a physician’s scale (model 439, Detecto, Webb
City, MO).
Body Mass Index (BMI) Categories and BMI z-Scores
BMI, the most widely used measure to screen for obesity (CDC, 2013), was
computed from the measured weight and height as kilograms per meters squared (Cole,
2008). However, BMI is considered an imperfect tool to measure obesity in adults since

75
it does not discriminate between excess fat mass and excess lean mass (Romero-Corral et
al., 2008). This concern is also true for children and adolescents when using BMI. BMI is
a moderately sensitive measure of adiposity (Demerath et al., 2006; Freedman & Sherry,
2009) and thus measurement of adiposity by other means is indicated.
Participants were then classified into one of four BMI categories (i.e.,
underweight, healthy, overweight, and obese) following the Centers for Disease Control
and Prevention charts for pediatric BMI by age and sex for children 2-18 years of age.
The BMI-for-age reference in the United Stated is based on nationally representative
sample from boys and girls ages 2–20 years (Kuczmarski et al., 2000).
BMI z- scores are the most common method to assess overweight and obesity in
children and adolescents and are validated for use in this population (Inokuchi, Matsuo,
Takayama, & Hasegawa, 2011; Kakinami, Henderson, Chiolero, Cole, & Paradis, 2014;
Kuczmarski et al., 2002; Must & Anderson, 2006). BMI z-scores are measures of relative
weight adjusted for child age and sex. The Z score characterizes the number of standard
deviations from the mean and permits comparing the BMI of a given child to the BMI
distribution for a population of children of the same age and sex (Must & Anderson,
2006). The BMI z score represents a child’s BMI in a standard normal distribution with a
mean of zero and a standard deviation of 1. For this study, BMI z-scores were calculated
using EpiInfo 3.5 www.cdc.gov/epiinfo) (Kuczmarski et al., 2002).

76
Body Fat
Body fat was estimated by bioelectrical impedance analysis (BIA) using the
Quantum X instrument (RJL Systems, Clinton Township, MI) and Body Composition 2.1
software using a new pediatric equation, validated for children 3.9 to 19.3 years of age
(Chumlea et al., 2002; Kriemler et al., 2009; Wu et al., 1993). Body fat was estimated in
kilograms and as a percentage of measured body weight. BIA is a commonly used
method, based on the conduction of electrical current in the body and the differences in
the resistance to conduct electricity between the fat and water components of the body.
BIA has been validated with dual-energy X-ray absorptiometry (DXA) (Sun et al., 2005;
Thomson, Brinkworth, Buckley, Noakes, & Clifton, 2007). The BIA method has been
validated for use in the pediatric population (Houtkooper, Going, Lohman, Roche, & Van
Loan, 1992; Okasora et al., 1999; Talma et al., 2013). Measures were obtained by
following the manufacture’s protocol (http://www.rjlsystems.com/documentation/how-
electrodes-are-placed-on-the-hand-and-foot/). In this study, trained research assistants
measured BIA in a subset of 96 children.

77
Waist Circumference (WC)
This measure has been used in previous studies and validated in children
(Bergmann et al., 2010; McCarthy & Ashwell, 2006; Taylor, Jones, Williams, &
Goulding, 2000). WC was measured to assess central adiposity measuring their
abdominal girth recorded to the nearest 0.1 cm by the subject standing with his or her
weight evenly distributed on both feet and with the feet about 25-30 cm apart.
In this study, trained research assistants measured waist circumference in the
subset of 96 children using a plastic tape measure. The waist was defined as the point
midway between the iliac crest (superior border of hip bone) and the costal margin (lower
rib). Two measures were recorded; if the difference between the measures was greater
than 1 cm, a third measure was performed; the mean of the two closest measures was
calculated and reported.
Waist-to-Height Ratio (WHtR)
WHtR is defined as the ratio obtained from an individual’s waist circumference
(centimeters) divided by their height (centimeters) and is a measure of a central obesity; a
high WHtR is commonly associated with poor metabolic health in adults and in children
(Khoury, Manlhiot, & McCrindle, 2013; Park & Kim, 2012). It is considered by some to
be a measure of body fat distribution that has greater validity than BMI (Khoury et al.,
2013; Savva, Lamnisos, & Kafatos, 2013). WHtR was computed in the subset of 96
children who had waist circumference measured in this study. Children with a WHtR
ratio >0.5 were considered as having central adiposity (Khoury et al., 2013; Mokha et al.,
2010).

78
Diet Related Food Behaviors
Dietary Intake
In the subset of 96 children, a recall of the previous day’s food intake was
obtained using the Automated Self-Administered 24-Hour Recall System (ASA24), a
web-based, validated, self-administered 24-hour dietary recall instrument developed by
the National Cancer Institute (Bethesda, MD) (ASA24-Kids-2012; National Cancer
Institute, n.d.; Kirkpatrick et al., 2014). Mothers and children sat side by side as the
mother reported to a trained researcher the food intake from the previous day for her
child. The child was asked about food eaten and to report any snacks or foods eaten
outside the home (e.g., at school) (Kirkpatrick et al., 2014). After a subject reported a
specific food or beverage, ASA24 provided a visual depiction of the item, which allowed
subjects to estimate portion sizes. The ASA24 used a series of questions to establish a
quick list of foods eaten, a query for long gaps between eating occasions, questions about
preparation methods and serving sizes of food items, forgotten foods, and a final review.
The information obtained was analyzed using the U.S. Department of Agriculture’s Food
and Nutrient Data System software, version 4.1.
From these data, we focused specifically on daily caloric intake (kcal/day), added
sugar intake (g added sugar/day), and added sugars as a percentage the total caloric
intake. The intake of calories and added sugar was expressed relative to body weight
(kg) (National Cancer Institute, n.d.).
The Goldberg cutoff method was used to evaluate an individual’s bias in
reporting energy intake, the greatest risk of which is under-reporting energy intake

79
(Livingstone & Black, 2003). The diet information was eliminated for children identified
as under-reporters prior to further analysis (Champagne, Baker, Delany, Harsha, & Bray,
1998). The child’s reported energy intake (kcal) was calculated relative to the basal
metabolic rate (BMR) based on their age and gender to obtain a ratio (Appendix F).
Physical activity was not measured in this study. Children who reported energy
intake/BMR <1.0 were considered under-reporters as children would not maintain a state
of health with energy intake below basal energy needs. For this study, children who
reported no intake of added sugar were also excluded.
Personal Characteristics
Child’s Temperament Questionnaire and Food Neophobia Scale (FNS)
Temperament is defined as the set of biological characteristics that are present in
an individual from birth to adulthood. A child’s temperament has been associated with
eating behavior (Haycraft et al., 2011) and taste preference (Liem & Mennella, 2002). In
addition, temperament traits have been associated with overweight and obesity in
children and adults (Agras et al., 2004; Haycraft et al., 2011). Children’s temperament
may explain why some children are at risk for overweight or obesity, and temperament
may relate to sucrose detection thresholds in children. Therefore, we measured
dimensions of child temperament particularly as they relate to eating behaviors (Pliner &
Loewen, 1997).
A dimension of children’s temperament that may translate into poor dietary
intakes and unhealthy weight outcomes (underweight and obesity) in children is food
neophobia. Food neophobia is considered the inborn personality attribute characterized

80
by the rejection of foods that are new or completely unknown to the child (Dovey,
Staples, Gibson, & Halford, 2008; Pliner & Hobden, 1992). Food neophobia in children
has been found to be associated with food consumption, particularly fruits and vegetables
(Cooke, Wardle, & Gibson, 2003; Galloway, Lee, & Birch, 2003). Food neophobia has
also been associated with bitter taste sensitivity (Carter et al., 2000).
For this study, mothers filled in their child’s temperament and food neophobia
questionnaires (Appendix G & H). The survey was comprised of 31 items, each rated on
a five-point scale, asking parents whether they agreed or disagreed with the statements
asked about their child. Higher scores indicated more of the characteristic. Twenty-five
items in the scale measured the child’s temperament, which is made up of five
dimensions: emotionality, shyness, activity, sociability, and negative reactions to food.
For example, activity in the temperament scale measures how physically active a child is
and the level of activity a child engages in during a day, ranging from very low to very
high. The original Food Neophobia Scale (FNS) has 10-items with good reliability and
validity (Pliner & Hobden, 1992). In this study, Food Neophobia was measured with six
items in the survey chosen because they seem to best capture responses to new foods.
This short scale has been used in prior studies (Cooke, Carnell, & Wardle, 2006; Liem &
Mennella, 2003).

81
Instrumentation: Validity and Reliability
Table 5. Validity and Reliability of Instruments
Reliability and Validity
Two alternative forced –choice staircase procedure
The two alternative forced-choice procedures discourage response biases (Linschoten, Harvey, Eller, & Jafek, 2001). This method is brief and has evidence of reliability and external validity in children. When methodology was used for sucrose preference reliability was assessed by comparing the results of the first series (i.e., weaker stimulus presented) with the second series (i.e. stronger stimulus) Statistically significant correlations between the concentrations of sucrose chosen in the 2 series were observed for children (ICC = 0.42, n = 338), adolescents (ICC = 0.46, n = 168) (Mennella et al., 2011).
Height Measures obtained in the laboratory by a trained technician were shown to me more reliable. In an adult study of self-reported height participants overestimated their height by 2.2±3.5 cm (mean ± standard deviation [SD]) (Griebeler, Levis, Beringer, Chacra, & Gómez-Marín, 2011). Likewise, children tend to overestimate their height (Beck et al., 2012). Systematic measured height has been reported to be more valid than self-report as discrepancy estimates between the two methods have been observed, with individuals overestimating their height (Powell-Young, 2012).
Weight To ensure accuracy of measurements duplicate assessments are taken. With a third measure needed if the first two are very different. Measures were obtained in the laboratory since measured height by a trained technician was shown to me more reliable. In a self-reported study of adults where weight was obtained, weight was underestimated by 3.1±6.5 lb (1.5 ± 2.9 kg) (Griebeler et al., 2011). Likewise, children tend to underestimate their weight (Beck et al., 2012). Measured weight has been reported to be more valid than self-report, as underestimation of weight is often common (Powell-Young, 2012).
Body Mass Index (BMI) BMI has been evaluated in the literature against the gold standard measure of adiposity dual x-ray absorptiometry (DXA) in children. The correlation of BMI with DXA total fat mass was 0.85 in children 3-8 years old (Eisenmann, Heelan, & Welk, 2004). Correlation between BMI and DXA total fat was 0.84 for boys and 0.90 girls. Bland-Altman plots of the methods indicated agreement (Boeke et al., 2013).
BMI z Score. Association of BMI z score with DXA percent body fat has been reported to be having good agreement (r= 0.82) in children 5-18 years old (Freedman & Sherry, 2009). Similar findings have been reported in other studies in children age 3-18 years (Mei et al., 2002). BMI z score with DXA trunk, DXA % fat, DXA fat, ranged between r=0.63-0.80. In addition it was reported that
the Bland-Altman plots of the methods indicated good agreement (Boeke et al., 2013). The validity and reliability of this measure depends on the accuracy of both height and weight.
Bioelectrical Impedance %body fat
Bioelectrical impedance % body fat was correlated with DXA trunk, DXA % fat, DXA fat 0.82, 0.73 and 0.84 respectively in children (Boeke et al., 2013).
Waist Circumference Waist circumference (WC) has been found to correlate with DXA trunk fat (r=0.79). The correlation between DXA trunk fat with WC has been found to be good for boys (0.79) and girls (r=0.87) (Boeke et al., 2013). Intrarater reliability (degree of agreement among repeated measures by a single rater) of waist circumference across BMI subgroups was reported as ICC>95
(Wang, Liu, & Chen, 2010). Intrarater technical error of measurement did not exceed 1.14 cm (Moreno et al., 2002).
Waist-to-height ratio (WHtR) WHtR strongly relates to children's DXA-trunk fat mass index (r = 0.93). Umbilical waist-to-height ratio and trunk fat mass index (DXA) are markers of central adiposity and insulin resistance in children (Guntsche et al., 2010).
Dietary Intake (ASA 24) The Automated Self-Administered 24-Hour Recall has been validated it against interviewer-administered Automated Multiple-Pass Method (AMPM) recalls and also against weighed actual
food intake at meals. Data reported in ASA24 and AMPM were highly comparable (Kipnis et al., 2003; Kirkpatrick et al., 2014; Moshfegh et al., 2008). This validation was done in adults, not children. However, the ASA24-Kids method is used with a proxy reporter, such as parent or guardian (National Cancer Instititue, 2012).
Child Temperament The child temperament scale was validated against the Reactions to Food Scale of the Colorado Childhood Temperament Inventory as well as EAS Temperament Survey for Adults (Pliner & Loewen, 1997).
Food Neophobia Scale (FNS) The FNS assesses willingness to eat foods. The test-retest correlation in this scale was assessed in two samples r = 0.91 and r = 0.87, p < 0.01, and then tested 15 weeks later for all subjects, and the correlation was r=0.82, p<0.01(Pliner & Hobden, 1992). This measure has been validated against behavioral observations of children’s willingness to taste foods (r = 0.38, p <0.001) and parent predictions of their child’s willingness to try foods (r = 0.34, p < 0.001) (Pliner, 1994). The internal reliability of the short scale has been reported with a Cronbach’s alpha
coefficient of 0.92 (Cooke et al., 2006).

82
Study Variables
Several outcomes were measured in the children recruited for this study. Table 7
summarizes some of the variables and their methods of measurement.
Table 6. Variables and Methods
Importance of the Knowledge Gained
Although there is a body of literature describing the variability of taste preference
and taste thresholds in humans little has been described in regards to sucrose detection in
Variable Method of measurement Operational variable
Demographics
Gender Reported by mother Male or female
Age (at time of testing) Reported date of birth by mother
Age in years on date of testing
Psychophysics
Sucrose detection threshold Lowest sucrose concentration detected
Measured with forced choice paired comparison tracking procedure
mM of sucrose
Genetics
TAS1R1, TAS1R2, TAS2R38,
and GNAT3 polymorphisms Genotyping Genotype
Adiposity measures
Body mass index Measured height and weight kg/m2
BMI percentile and categories
CDC BMI for age and sex standards
Underweight, ≤5% Normal weight, 6-84.9%, Overweight, 85-94.9% Obese, 95-100%
BMI z-score Calculated with EpiInfo 3.5 z-score
Waist circumference Measured Waist circumference in centimeters
Body fat Measured by bioelectrical impedance analysis
Percent (%)
Waist to height ratio (WHtR) Measured waist circumference and height
Diet related food behaviors
Dietary caloric intake From ASA24 kcal/day
Total added sugars per day From ASA24 g, g/kg, % of total kcal
Personal Characteristics
Child temperament and Food Neophobia Scale (FNS).
Reported by mother Emotionality, shyness, activity, sociability, negative reaction to foods and food neophobia
83
children and little attention has been paid to how children differ in their sense of taste and
how these differences might affect their health and behavior. Our study was able to make
a contribution to the growing body of knowledge related to obesity in children and
addresses an important gap in the field of chemosensory testing and obesity. The
findings described herein could enhance our ability to identify children at higher risk for
obesity and enable us to develop individualized interventions and treatment strategies. In
addition, these findings can ultimately provide greater insight on how to intervene to
generate sustainable long-term results for prevention of obesity and its related
comorbidities, therefore helping to decrease health care costs associated with this
condition.
Data Analysis Plan
Data Management
Data collection and coding occurred in the original studies; all subsequent
analyses refer to these coded data in such a manner that individual identities cannot be
traced. To maintain the safety and confidentiality of the subjects, all records were stored
in a locked filing cabinet in a room dedicated solely for this purpose. Computer-based
files were made available only to personnel involved in the study through the use of
access privileges and passwords. Prior to access to any study-related information,
personnel were required to sign statements agreeing to protect the security and
confidentiality of identifiable information.
Each subject tested received a unique identity number, which was used to label
cheek cell and saliva samples, questionnaires, and data collection forms. All hard copy

84
documentation obtained during the study was locked in the laboratory of Dr. Julie
Mennella. All data were maintained in a database (Microsoft Access), and subject ID to
facilitate data manipulation related the tables. The Mennella lab had a RAID 5 network-
attached storage device that was backed up nightly to ensure database integrity. Several
hard drives in her laboratory also maintained multiple backup copies of the database
should any primary drive fail. The coded data were stored and maintained in a secure
server that only Dr. Mennella and her staff can access. All biological samples were stored
as coded samples in Dr. Reed’s lab, kept in a -80 °C freezer. Solely Dr. Reed and her
staff control this laboratory. Genotyping was done with coded samples, and no
identifying information was available to Dr. Reed or her laboratory members.
Screening for Missing Data, Normality, Linearity and Multi-collinearity
Prior to data analysis, the data were screened for missing data. The amount to
which the missing data were a problem was evaluated by exploring the pattern of the
missing data within and across variables. Data were also tested for normality using the
Kolmogorov-Smirnov test for normality. If violations in the normality assumption were
detected, values were transformed to approximate a normal distribution and non-
parametric data analysis options were considered.
Assessing for Selection Bias
We first established that there were no significant differences between the data
obtained in both original taste studies (studies 1 and 2) for children from whom we had
valid sucrose thresholds data for variables for which we had data for both groups. Study 2
refers to those children that were considered a subset in this dissertation. We determined

85
these differences using Student t-test and Chi square test (χ² test). We did this to ensure
that findings with the subgroup of children were still representative of the overall group.
Statistical Analysis for Sample Description
For demographic characteristics and all summary statistics of primary and
secondary measures, we computed means and standard deviations (means ± SD) for
continuous variables and counts and percentages for categorical variables. The primary
outcome measures for this study were sucrose detection thresholds, taste receptor
genotype, adiposity measures, temperament and diet related food behaviors.
Statistical Analysis of Aim 1
For aim 1, student’s t-tests were used to examine sex differences for sucrose
detection thresholds, personal characteristics (temperament, food neophobia), and diet
related food behaviors (Figure 10). Pearson’s correlations were used to examine the
relationship between sucrose detection thresholds, personal characteristics and diet
related behaviors with age. In addition, Pearson’s correlation was also used to explore the
relationship of sucrose detection thresholds with personal characteristics (negative
reactions to foods and food neophobia), diet related behaviors and adiposity. Correlation
results were reported as follows: correlation (r) (degrees of freedom) = p value. We used
the Colton’s rule for interpreting the size of the correlations (Colton, 1974). Those
findings that had a fair [r 0.25 to 0.50 (-0.25 to -0.50)], moderate to good [r 0.50 to 0.75(-
0.50 to -0.75)] or very good [r >0.75 -0.75] relationship with sucrose thresholds were
included in subsequent analysis for GLM in Aim 2 and Aim 3.
86
Figure 10. Bivariate Data Analysis Plan for Aim 1
Statistical Analysis for Aim 2
For aim 2, only subjects for whom valid sucrose thresholds were obtained were
included. Genotype–phenotype association studies require that subjects be genetically
unrelated (N=175) (Khoury, Beaty, & Cohen, 1993), so in instances where more than one
child from a family was tested, only one child was selected at random to be included in
the genetic analysis (Mennella et al., 2012). Departure from the expected genotypic
frequencies in HWE was tested using the Hardy-Weinberg Calculator by Michael H.
Court by comparing the observed and expected genotype frequencies for cases and
controls (Court, 2005). Separate one-way ANOVAs using genotype (TAS1R2, one variant
site; TAS1R3, one variant site; GNAT3, one variant site; and TAS2R38, three variant sites)
were conducted (Mennella et al., 2012). Genotypes that were associated with sucrose
threshold were evaluated for their relationship with measures of diet related food
behaviors (child’s dietary intake), we did this to explore whether there was a difference in

87
dietary consumption based on child’s genotype. Figure 11 shows a depiction of the
bivariate analysis plan for aim 2.
Figure 11. Bivariate Data Analysis for Aim 2
Analysis Plan for Multivariable Model Aim 2
Next drawing on the conclusions from the separate from the bivariate analyses
described above, we used general linear models (GLM) with those outcome measures
significantly related to sucrose detection thresholds (p<0.05). These variables were
included in a multivariable model to establish the effect size of each and examine
independent determinants of sucrose detection thresholds. The first model included
sucrose thresholds, genotype, age and sex. This first model was run in the overall sample
and then a second model with the same variables was run in the subset of children to
assess whether the results remained consistent. Lastly, a model included sucrose
threshold adjusted by age, sex, genotype and one adiposity measure. Only one adiposity
measure was added to the model to avoid multi-collinearity. The variables chosen met
significance in the univariate analysis. The analyses followed methods established in

88
earlier studies of genotype in children and taste-related measures and were conducted
separately for each gene. Variants that were significant with a p<0.05 were included in
subsequent genetic analysis.
Multivariable modeling is appropriate as a strategy because many of the measures
were potentially interrelated (Rosner, 2006). The criterion for statistical significance for
the omnibus statistical tests and Fisher's least squares difference tests were conducted on
significant results to compare specific group means (post hoc tests was alpha=0.05). The
parameter of interest for GLM was sucrose detection threshold.
Statistical Analysis for Aim 3
For aim 3, we further explored the relationship between personal characteristics
with adiposity measures using Pearson’s correlations. Correlation results were reported as
follows: correlation (r) (degrees of freedom) = p value. Here, we used the Colton’s rule
for interpreting the size of the correlations (Colton, 1974) as previously described.
Separate one-way ANOVAs were used to look at whether gene variants that were
related to sucrose thresholds from aim 2 were also related to adiposity measures.
Analysis Plan for Multivariable Model Aim 3
GLMs were used to construct a multivariable model to examine independent
predictors of the adiposity measures. This model had the adiposity measures that were
significantly related with sucrose thresholds as the dependent variables. Age, sex,
sucrose thresholds, diet related food behaviors and personal characteristics were
considered covariates.

89
All analyses for this study were conducted with Statistica, version 12 (StatSoft,
Tulsa, OK), with the level of significance set at alpha = 0.05. HWE was calculated with
Court’s Hardy-Weinberg Calculator (Court, 2005). Graphs were generated using
GraphPad Prism, version 6.01 (GraphPad Software, La Jolla, CA).

90
CHAPTER 4
Results
Normality test using Kolmogorov-Smirnov (K-S) test
The distributions of sucrose detection threshold values were not normally distributed as
evaluated by the Kolmogorov-Smirnov (K-S) test for normality (Chakravarti, Laha, &
Roy, 1967) (d = 0.187, p < 0.01). Prior to the main statistical analyses these values were
square root transformed to approximate a normal distribution K-S d = 0.105, p < 0.05.
The distribution was normal for age, adiposity measures, temperament scale and food
behavior measures (Table 8).
Table 8. Normality Test using Kolmogorov-Smirnov (K-S) Test
Variable K-S (d) P value (p)
Demographic Age 0.077 <0.15
Sucrose Threshold Sucrose detection thresholds
0.187 <0.01
Anthropometric/Adiposity Measures BMIz 0.055 >0.20 WHtR 0.106 >0.20 %Body Fat 0.703 >0.20
Personal characteristics: Temperament Scale and Food Neophobia
Shyness 0.064 >0.20 Emotionality 0.073 >0.20 Sociability 0.096 >0.20 Negative Reaction to foods 0.108 >0.20 Activity 0.076 >0.20 Food Neophobia 0.124 <0.15
Diet related food behaviors Total calories 0.125 <0.10 kCal/kg 0.129 <0.10 Added sugars as percent of kcal
0.118 >0.20
Added sugars g/kg 0.119 >0.20
91
Results from Assessing for Selection Bias
Prior to analyzing our aims, we established that there was no statistically
significant difference between the children from whom data were collected in the original
study #1 and study #2. There was no significant difference in sucrose thresholds t (df
214) = -1.28, p = 0.201, age t (df 214) = +0.03, p = 0.971, or sex (χ2 = 0.71, p = 0.399)
between the two studies (Table 9). We acknowledge that there were significant
differences between the studies based on race, income and education. Parents in study 2
had higher income and levels of education compared to study 1. There were also
significant racial differences between the groups. This could have been because study 1
had a larger percent of participants who selected other, more than one race or Hispanic.
Although these findings were significant differences between groups, these variables
were not part of the aims in this study. In our important predictors and outcome variables,
there were no significant differences between study 1 and study 2. Table 9 describes the
comparison of variables in the two studies.
92
Table 9. T- test or Chi- Square (χ2) Comparison for Sucrose Thresholds, Demographics and Socioeconomic Characteristics
for the Original Studies
Characteristic T-tests or Chi Square
Study #1 Study #2 t-value or χ2 df p-value
Demographics
Age (years) [mean± SD (n)] 10.3±2.0 (130) 10. 4±1.8 (86) +0.036 214 0.971
Sex [% (n)] (female) 52.3% (68) 58.1%(50) +0.710 214 0.399
Race [% (n)]
Black 60.8% (79) 51.2% (44)
+9.751 3 0.021 White 23.1% (30) 16.3% (14) Asian 0% (0) 2.3% (2) Other/more than one race 16.2% (21) 30.2% (26)
Sucrose Detection Threshold
Sucrose Thresholds (mM) [mean± SD (n)] 10.62±15.2 (130) 12.9± 8.5 (86) -1.282 214 0.201
Anthropometric/Adiposity Measures
Weight-for-age z scores [mean± SD (n)] 0.78±1.08 (128) 0.93±1.24 (86) +0.959 212 0.339
Height-for-age z scores [mean± SD (n)] 0.50±1.12 (128) 0.58±1.08 (86) +0.489 212 0.434
BMI z scores [mean± SD (n)] 0.72±0.98 (128) 0.84±1.21 (86) +0.783 212
BMI categories [% (n)]
Underweight: BMI percentile <5% 0.8%(1) 3.5%(3) +6.205 3 0.102
Healthy weight: BMI percentile 5-85% 58.6%(75) 46.5%(40)
Overweight: BMI percentile 85-95% 23.4%(30) 22.1%(19)
Obese: BMI percentile >95% 17.2%(22) 27.9%(24)
Ethnicity [% (n)]
Not Hispanic
96.9%(126) 87.2%(75) +7.588 1 0.006
Hispanic
3.1%(4) 12.8%(11)

93
Socioeconomic Characteristics
Family income [% (n)]
<$49,999 56.2%(73) 75.6% (65) +15.251 3 0.002
$50,000-99,000 23.1%(30) 20.9%(18)
>$100,000 10.8%(14) 3.5%(3)
NO DATA 10% (13) 0%(0)
Highest Level of Education, Mother [% (n)]
Grade school 0%(0) 5.8%(5) +25.003 4 <0.001
High School 36%(45) 44.2%(38)
Trade 0%(0) 9.3%(8)
College 56.8%(71) 37.2%(32)
Graduate 7.2%(9) 3.5%(3)

94
Subject Characteristics
As shown in Table 10, the study population consisted of 235 children whose
race/ethnicity, family income, and maternal education levels reflected the diversity of the
city of Philadelphia (Pew Charitable Trust, 2011). More than half (57.8%) of the children
were Black (n=136), 19.6% were White (n=46), and 21.7% were of more than one race.
The vast majority (93.2%, n=219) were non-Hispanic (Figure 12). This increased
representation of under-represented minorities in the subject population is reflective of
the greater Philadelphia region (Pew Charitable Trust, 2013), and has been achieved, in
part, through outreach efforts advertising in local newspapers throughout the city. The
mean age of the sample was 10.4 ± 1.9 years. Female subjects made up 52.8% (n=124),
and males accounted for 47.2% (n = 111) of the study population. Most children were
unrelated (n = 122), but the sample included 46 two-sibling pairs (n = 92) and 7 families
of three siblings (n = 21). More than half (66.4%, n = 156) of the participants’ mothers
reported a family income of less than $49,999, with 47.7% (n = 112) having a college
degree.
Regarding adiposity measures, 21.6% of children were obese, 22.4% were
overweight, 53.4% were normal weight, and 2.2% were underweight. The overweight
and obese children in the sample were higher than most current statistics for children in
Philadelphia by the CDC and lower than the reported data from the Pew Report for adults

95
in Philadelphia (Figure 13). We further show the breakdown of the sample in regards to
the BMI category by sex (Figure 14).
Demographic Characteristic of the Subset of Children
The subset of children in this study for whom we had additional data did not
differ from the overall sample for sucrose detection thresholds. The demographic
characteristics for the subset of children (Table 10) reflected the diversity of the city of
Philadelphia (Pew Charitable Trust, 2011). The mean age of children in the subgroup was
10.4±1.7 years and the distribution of female subjects made up 55.2% (n=53), and males
accounted for 44.8% (n=43) of the subset group. In this group, 28.1% of children were
obese, 20.9% were overweight, 47.9% were normal weight, and 3.1% were underweight.
In addition, in the subset of children who had data on percent body fat and WHtR (n=96;
Table 10), percent body fat averaged 32.9% (range, 9.8-60.8%) and 38.5% were
classified as having central obesity.

96
Table 10. Child, Maternal and Household Characteristics of Participants
Characteristic
All Children
Study 1+2
N=235
Subseta
Study 2
n=96
Demographics
Age (Years) [mean± SD (n)] 10.4±1.9 (235) 10.4±1.7 (96)
Sex [% (n)] (Female) 52.8% (124)
55.2% (53)
Race [% (n)] Black 57.8% (136) 51.0% (49) White 19.6% (46) 16.7% (16) Asian 0.9% (2) 2.1% (2) Other/more than one race 21.7% (51) 30.2% (29)
Ethnicity [% (n)]
Not Hispanic
93.2% (219) 87.5% (84)
Hispanic
6.8% (16) 12.5% (12)
Sucrose Detection Threshold
Children who completed the task [% (n)] 91.9% (216) 89.6% (86)
Detection thresholds [mM; mean ± SD (n)] 12.0+12.9 (216) 10.6+8.4 (86) Child Adiposity Measures
Weight-for-age z scores [mean ± SD (n)] 98.7% (232) 100% (96)
Height-for-age z scores [mean ± SD (n)] 0.84±1.14 (232) 0.94±1.21 (96)
BMI z-scores [mean ± SD (n)] 0.54±1.09 (232) 0.63±1.07 (96)
BMI categories [% (n)]
Underweight: BMI percentile <5% 2.2% (5) 3.1% (3)
Healthy weight: BMI percentile 5-85% 53.8% (125) 47.9% (46)
Overweight: BMI percentile 85-95% 22.4% (52) 20.9% (20)
Obese: BMI percentile >95% 21.6% (50) 28.1% (27)
Percent body fat [mean ± SD (n)] - 32.9±11.6 (95) Waist-to-hip ratio [mean ± SD (n)] - 0.87±0.14 (96) Waist-for-height ratio (WHtR) [mean ± SD (n)] - 0.49±0.07 (96)
Diet-related Food Behaviorsb
Daily calories - 2,284±794 (73) Total (kcal) - 57±28 (73) Relative to body weight (kcal/kg) -
Daily added sugars [mean ± SD (n)] - 81.43+48.19 (73) Total (g) - 14+7 (73) Percent total calories - 19.7+1.19 (73) Relative to body weight (g/kg) - 2,284±794 (73)
Socioeconomic Characteristics
Family income [% (n)]

97
<$49,999 66.4% (156) 77.1% (74)
$50,000-99,000 20.9% (49) 19.8% (19)
>$100,000 7.2% (17) 3.1% (3)
NO DATA 5.5% (13) 0.0% (0)
Highest Level of Education, Mother [% (n)]
Grade school 2.1% (5) 5.2% (5)
High School 38.7% (91) 44.8% (43)
Trade 3.9% (9) 9.4% (9)
College 47.7% (112) 36.5% (35)
Graduate 5.5% (13) 4.1% (4)
Not known/not reported 2.1% (5) 0% (0)
aIn this subset of children further anthropomorphic and dietary measures were measured. bDietary records for 19 of the 96 children were excluded based on the Goldberg cutoff. 4 children did not provide data for added sugars

98
Figure 12. Race Demographics: Comparison of Pew Reports for Philadelphia and
Current Study

99
Figure 13. Overweight and Obese: Comparison of Philadelphia Pew Reports, CDC Data
for Pennsylvania (CDC, 2015), *Philadelphia Department of Public Health and children in current study

100
Figure 14. Children's BMI by Sex

101
Results for Aim 1
Relationship of Sucrose Detection Thresholds with Age and Sex
Most children (91.9%, n = 216/235) completed the psychophysical task; 19
children did not comply with the procedures, became tired, or refused to continue to
participate. Only data from subjects with valid sucrose detection thresholds were used (n
= 216). The mean detection threshold was 12.0 mM (±12.9 SD) and range was 0.23-153.8
mM sucrose (Table 10). In the whole sample, as age increased children had significantly
lower sucrose detection thresholds (were more sensitive) [r (214) = -0.16, p = 0.016]
(Table 11, Figure 15A), and girls had significantly lower thresholds than did boys [10.5
± 8.6 mM vs. 13.9 ± 16.6 mM; t (214) = 2.0, p = 0.047] (Table 11, Figure 16). We
confirmed the negative correlation between age and sucrose detection thresholds in the
subset of children [r (84) = -0.28, p = 0.009] (Table 11).

102
Figure 15. Sucrose Taste Detection Thresholds and Age
A- All Children (N=216) with outlier
B- Subset of children (N=86)

103
Figure 16. Sucrose Taste Detection Thresholds and Gender
Relationship of Diet Related Food Behaviors with Age and Sex
Diet-related food behaviors were associated with age (Table 11, Figure 17).
While caloric intake was not related to age [r (71) = +0.22, p = 0.051] (Figure 17),
caloric intake relative to body weight (kcal/ kg) was associated with age [r (71) = -0.35, p
= 0.002] (Figure 17B). In addition, the percent total calories from added sugars [r (71) =
+0.27, p = 0.020] (Figure 17C) were associated with age, but not added sugars relative to
their body weight [r (71) = -0.08, p = 0.506] (Figure 17D).
There were no significant sex differences for any of the measures of diet related
food behaviors (Table 12). Girls and boys ate the same percentage of their daily calories
as added sugar [14 ± 7% vs. 14 ± 7%; t (71)=0.17, p = 0.865] and the same amount of
added sugars relative to body weight [girls: 1.96 ± 1.15 g/ kg; boys: 1.99 ± 1.25 g/kg; t
(71) = 0.07, p = 0.943] (Table 12).

104
Figure 17. Relationship of Diet Related Food Behaviors with Age
.
A. Total calories consumed and Age B. Total calories consumed relative to body weight and Age
C. Percent total calories as added sugars consumed and Age
D. Added sugars as g/Kg of body weight and Age

105
Relationships of Personal Characteristics with Age and Sex
We also looked at whether any dimensions of a child’s personality characteristics
were related to age. Both activity [r (84) = -0.24, p = 0.026] and sociability [r (84) = -
0.30, p = 0.004] were significantly negatively correlated with age (Table 11, Figure 18A
& B). This means that older children are less active and less sociable than younger
children. However, we found no significant relationships between shyness, emotionality,
negative reaction to foods and food neophobia and age (Table 11). There were also no
significant sex differences for any of the measures of personal characteristics (Table 12).
Figure 18. Relationship of Personal Characteristics with Age
A. Activity Score and Age
B. Sociability Score and Age

106
Relationship of Sucrose Detection Thresholds with Adiposity
We found no significant relationships between sucrose taste detection thresholds
and z-scores for height-for-age [r (214) = +0.08, p = 0.257], weight-for-age z-score [r
(214) = -0.03, p = 0.702], or BMI z-score [r (214) = -0.07, p = 0.319]. However, the
greater the percent body fat (as measured by bioelectrical impedance) or WHtR, the
lower the sucrose thresholds [r (84) = -0.22, p = 0.047; and r (84) = -0.26, p = 0.015,
respectively] (Table 13, Figure 19A & B). This means that children with more central
adiposity and overall adiposity had lower sucrose detection thresholds, were more
sensitive.
Figure 19. Relationship of Sucrose Detection Thresholds with Adiposity
A. Sucrose detection thresholds and %Body Fat
B. Sucrose detection thresholds and WHtR
107
Relationship of Sucrose Detection Thresholds with Personal Characteristics
We found a positive correlation between sucrose thresholds and negative reaction
to foods [r (84) = +0.32, p = 0.003]. This means that those with more negative reactions
to foods tended to have higher sucrose thresholds levels (less sensitive) (Table 13). There
was no significant relationship between sucrose taste detection thresholds and food
neophobia [r (84) = +0.21, p = 0.054]. Although not statistically significant, the positive
correlation could suggest that children with higher sucrose detection thresholds may be
less likely to try new foods (Figure 20). There were no differences between girls and
boys for negative reaction to foods or food neophobia. We next probed to see whether
negative food reactions were associated with diet of the child. Negative food behaviors
were associated with kcal/kg [F (1,62) = 4.22, p = 0.007] even when sucrose detection
thresholds were added to the analysis. This could suggest that sucrose detection
thresholds is acting as mediator between the negative reactions to food and the calories
consumed per body weight with picky eaters having altered consumption of calories. The
findings were specific to the kcal/kg measure and not added sugars as percent kcal [F
(1,63) = 0.90, p =0.346], or added sugars g/kg [F (1,63) = 0.33, p = 0.567] or total
calories [F (1,63) = 0.07, p =0.788].

108
Figure 20. Relationship of sucrose detection thresholds with personal characteristics
(negative reaction to foods and food neophobia)
A. Sucrose detection thresholds and Negative reaction to foods score
B. Sucrose detection thresholds and Food neophobia score
Relationship of Sucrose Detection Thresholds with Diet Related Food Behaviors
We next looked at whether sucrose taste detection thresholds were associated with
diet-related food behaviors. We found that sucrose thresholds were not significantly
related to total caloric intake [r (63) = -0.14, p =0.268], total calories relative to body
weight [r (63) = +0.09, p =0.439] or added sugar as percentage of total calories [r (63) =
-0.05, p = 0.720] or relative to body weight [r (63) = +0.07, p = 0.577] (Table 13).

109
Table 11. Correlations (r) between Sucrose Detection Thresholds, Personality Characteristics and Diet Related Food
Behaviors Measures and Age
Trait
Age of child (years)
All Children (Study 1 & 2)
Subset (Study 2)
r n p-Value r n p-Value
Psychophysical test
Sucrose Thresholds (mM) -0.16 216 0.016* -0.28 86 0.009*
Personality characteristics: Temperamenta & Food Neophobiab
Shyness NK NK NK -0.06 86 0.557
Emotionality NK NK NK +0.01 86 0.919
Sociability NK NK NK -0.30 86 0.004*
Negative reaction to foods NK NK NK +0.07 86 0.531
Activity NK NK NK -0.24 86 0.026*
Food Neophobia NK NK NK -0.14 86 0.201
Food Neophobia NK NK NK -0.14 86 0.201
Diet related food behaviors
Daily calories
Total calories (kcal) NK NK NK +0.22 73 0.051
Relative to body weight (kcal/kg) NK NK NK -0.35 73 0.002*
Added sugar
Percent total calories NK NK NK +0.27 73 0.020*
Relative to body weight (g/kg) NK NK NK -0.08 73 0.506
Note: r=Pearson’s correlation coefficient, n=sample size. NK; not known since these measures were obtained only for the subset of children. aTemperament measures from Pliner and Loewen (1997). bFood Neophobia measures from Pliner and Hobden (1992). *=p<0.05. See text for other details.

110
Table 12. T- Test for Sucrose Thresholds, Personality Characteristics and Diet Related Food Behaviors by Sex
Variable
T-tests
Mean Boys
Mean Girls
t-value df p-value Valid N
Boys Valid N
Girls SD
Boys SD
Girls
All children
Psychophysical test
Sucrose detection thresholds (mM)
13.88 10.45 1.951 214 0.047* 98 118 8.58 16.61
Subset
Personality characteristics: Temperamenta & Food Neophobiab
Shyness 2.48 2.66 -0.978 84 0.313 36 50 0.93 0.78
Emotionality
2.68 2.84 -0.748 84 0.456 36 50 0.81 1.10
Sociability
3.41 3.33 0.539 84 0.591 36 50 0.73 0.60
Activity
3.49 3.23 1.571 84 0.120 36 50 0.79 0.73
Negative reaction to foods
2.97 3.02 -0.269 84 0.788 36 50 0.87 0.77
Food Neophobia
2.94 2.66 1.393 84 0.167 36 50 0.97 0.87
Diet related food behaviors
Daily calories
2357.59 2221.02 0.7304 71 0.468 34 39 721.99 829.30
Relative to body weight (kcal/kg) 55.75 58.81 -0.462 71 0.865 34 39 30.34 1.63
Added sugar
Percent total calories 14.44 14.16 0.170 71 0.865 34 39 7.32 1.29
Relative to body weight (g/kg) 1.98 1.96 0.072 71 0.943 34 39 1.15 0.00 aTemperament measures from Pliner and Loewen (1997). b Food Neophobia measures from Pliner and Hobden (1992). *=p<0.05.

111
Table 13. Correlations (r) Sucrose Detection Thresholds with Adiposity Measures, Personal Characteristics and Diet Related
Food Behaviors
Trait
Sucrose Threshold (mM)
All Children (Study 1 & 2)
Subset (Study 2)
r n p-Value r n p-Value
Heighta +0.08 214 0.257 +0.00 86 0.991
Weighta -0.03 214 0.702 -0.15 86 0.181
BMIa -0.07 214 0.319 -0.15 86 0.165
Waist-to-height ratio (WHtR) NK NK NK -0.26 86 0.015*
Percent body fat NK NK NK -0.22 86 0.047*
Personality characteristics: Temperamentb& Food Neophobiac
Negative reaction to foods NK NK NK +0.32 86 0.003*
Food Neophobia NK NK NK +0.21 86 0.054
Diet related food behaviors
Daily calories
Total calories (kcal) NK NK NK -0.14 65 0.268
Relative to body weight (kcal/kg) NK NK NK +0.09 65 0.439 Added sugar
Percent total calories NK NK NK -0.05 65 0.720 Relative to body weight (g/kg) NK NK NK +0.07 65 0.577
Note: r=Pearson’s correlation coefficient, n=sample size. NK; not known since these measures were obtained only for the subset of children. aValues are z-scores adjusted for the child’s age and sex. bTemperament measures from Pliner and Loewen (1997). c Food Neophobia measures from Pliner and Hobden (1992) *=p<0.05. See text for other details.

112
Results for Aim 2
Of the 175 unrelated children, 168 had valid sucrose taste detection thresholds
and were included in the genotype analyses. Table 14 shows the allele frequencies and
genotype frequencies of the SNPs used in this study. A few genomic DNA samples were
refractory to genotyping: 6 for TAS1R3 and 10 for GNAT3. All alleles were in HWE
(p>0.05).

113
Table 14. Hardy-Weinberg Equilibrium Calculations
Genotype Observed
Genotype Frequency #observed/
total observed Expected N alleles
Allele frequency
p+q=1
Genotype frequency
p2+2pq+q2=1 χ2 Square (p-value)
Sweet Receptor Genes
TAS1R2; rs35874116
II 16 0.103225806 14 310 0.293548387 0.086170656 0.79 (0.373) IV 59 0.380645161 64 0.706451613 0.414755463
VV 80 0.516129032 77 0.499073881
TAS1R3; rs35744813
CC 52 0.320987654 47 324 0.537037037 0.288408779 2.49 (0.114) CT 70 0.432098765 80 0.462962963 0.497256516
TT 40 0.24691358 35 0.214334705
GNAT3; rs7792845
CC 82 0.518987342 82 316 0.721518987 0.520589649 0.00 (1) CT 64 0.405063291 64 0.278481013 0.401858676
TT 12 0.075949367 12 0.077551674
Bitter Taste Receptor Genes
TAS2R38; rs713598
AA 52 0.30952381 54 336 0.56547619 0.319763322 0.21 (0.643)
AP 86 0.511904762 83 0.43452381 0.491425737
PP 30 0.178571429 31 0.188810941
TAS2R38; rs1726866
VV 34 0.202380952 30 336 0.419642857 0.176100128 1.80 (0.179) AV 73 0.43452381 82 0.580357143 0.487085459
AA 61 0.363095238 57 0.336814413
TAS2R38; rs10246939
II 49 0.291666667 50 336 0.544642857 0.296635842 0.09 (0.7557) IV 85 0.505952381 83 0.455357143 0.496014031
VV 34 0.202380952 35 0.207350128
Note: If P < 0.05- not consistent with HWE

114
Relationship of Sucrose Detection Thresholds to Genotype
As shown in Table 15, sucrose detection thresholds were not significantly related
to genotype of sweet taste receptor genes TAS1R2 [F (2,152) = 0.54, p = 0.581], TAS1R3
[F (2,159) =1.01, p = 0.364] and GNAT3 [F (2,155) = 1.04, p = 0.357] (Figure 21 A-C)
or to the bitter receptor gene TAS2R38 variant rs713598 [F (2,165)=2.45, p=0.09]
(Figure 22 A). However, TAS2R38 bitter taste receptor gene variants rs1726866 and
rs10246939 were related to sucrose detection threshold [F (2,165) = 4.55, p = 0.012; F
(2,165) = 3.14, p = 0.046]. Children with one or two bitter-sensitive alleles (the A allele
of rs1726866 V262A and/or the V allele of rs10246939 I296V) had lower sucrose
detection thresholds (i.e., were more sensitive to the taste of sucrose) (Figure 22C&D).
In addition, after adjustment for age and sex, those children with the TAS2R38 variant
rs713598 A49P were significantly more sensitive to sucrose [F (2,163) = 3.18, p =
0.044], with those having a P allele having lower sucrose detection thresholds (Table 15,
Figure 22B).
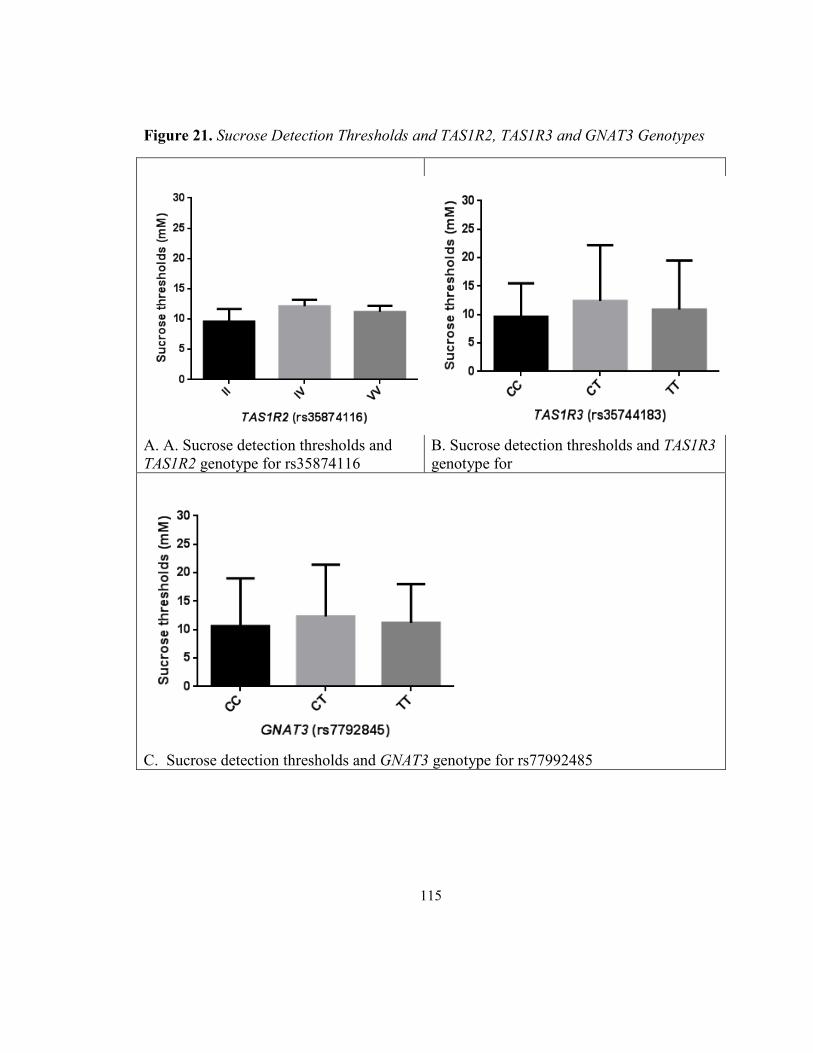
115
Figure 21. Sucrose Detection Thresholds and TAS1R2, TAS1R3 and GNAT3 Genotypes
A. A. Sucrose detection thresholds and TAS1R2 genotype for rs35874116
B. Sucrose detection thresholds and TAS1R3
genotype for
C. Sucrose detection thresholds and GNAT3 genotype for rs77992485
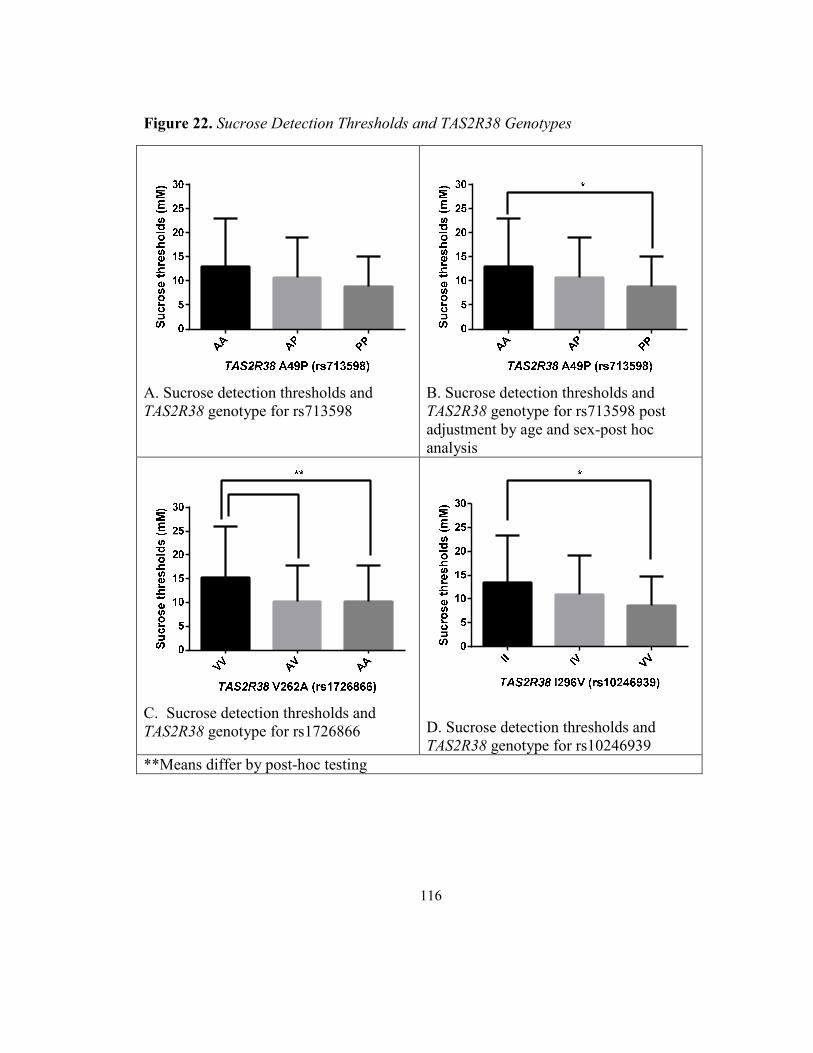
116
Figure 22. Sucrose Detection Thresholds and TAS2R38 Genotypes
A. Sucrose detection thresholds and TAS2R38 genotype for rs713598
B. Sucrose detection thresholds and TAS2R38 genotype for rs713598 post adjustment by age and sex-post hoc analysis
C. Sucrose detection thresholds and TAS2R38 genotype for rs1726866
D. Sucrose detection thresholds and TAS2R38 genotype for rs10246939
**Means differ by post-hoc testing

117
Relationship of Diet Related Food Behaviors with Genotype
We further assessed if there were differences in diet-related food behaviors based on an
individual’s genotype for the TAS2R38 gene (Figure 23). There was no relationship of
genotype with total calories [(F (2,65) = 0.80, p = 0.45], but the diet of children with the
bitter-sensitive genotype (AA, rs1726866, V262A) contained more added sugar as a
percentage of total kcal (16 ± 6% of kcal as added sugars) than the diet of children with
the one or two copies of the other alleles (AV, 11±6 and VV, 13 ±8%; [F (2,62)=3.64, p
= 0.032]). The results were specific to one TAS2R38 variant (rs1726866), and this effect
was not apparent for the remaining two variants (rs713598 [F (2,62) = 0.40, p = 0.67];
rs10246939 [F (2,62) = 0.85, p = 0.43]).
Figure 23. Diet Related Food Behaviors Measures and TAS2R38 Genotypes
A. Added sugars (g) and TAS2R38 genotype for rs1726866
B. Percent total calories (%) as added sugars and TAS2R38 genotype rs1726866
**Means differ by post-hoc testing
TAS2R38 V262A (rs1726866)
AA
AV
VV
0
5
10
15
20
25
**

118
Table 15. Sucrose Detection Thresholds in Children grouped by Taste Genotype
Gene Varianta Genotypeb Nc Sucrose Threshold, [mM; mean ± SD] F (df) p-Value
Unadjusted Thresholds TAS1R2 rs35874116 II 16 9.6±2.1 F (2,152)=0.54 0.581 IV 59 12.1±1.1 VV 80 11.2±1.0 TAS1R3 rs35744183 CC 52 9.6±5.9 F (2,159)=1.01 0.364 CT 70 12.4±9.8 TT 40 10.9±8.6 GNAT3 rs7792845 CC 82 10.6±8.4 F (2,155)=1.04 0.357 CT 64 12.3±9.1 TT 12 11.2±6.8
TAS2R38 rs713598 AA 52 13.1±9.8 F (2,165)=2.45 0.090 AP 86 10.7±8.3 PP 30 8.9±6.2 rs1726866 VV 34 15.3±10.72 F (2,165)=4.55 0.012* AV 73 10.1±7.71 AA 61 10.1±7.61 rs10246939 II 49 13.4±9.92 F (2,165)=3.14 0.046* IV 85 10.9±8.31,2 VV 34 8.6±6.11
Thresholds Adjusted for Age and Sex
TAS1R2 rs35874116 II 16 9.6±1.6 F (2,150)=0.61 0.543
IV 59 12.1±1.2
VV 80 11.2±1.0
TAS1R3 rs35744183 CC 52 9.6±5.9 F (2,157)=1.08 0.343
CT 70 12.4±9.8
TT 40 10.9±8.6
GNAT3 rs7792845 CC 82 10.6±8.4 F (2,153)=1.29 0.277
CT 64 12.3±9.1

119
Gene Varianta Genotypeb Nc Sucrose Threshold, [mM; mean ± SD] F (df) p-Value
Thresholds Adjusted for Age and Sex
TAS2R38 rs713598 AA 52 13.1±9.82 F (2,163)=3.18 0.044*
AP 86 10.7±8.31,2
PP 30 8.9±6.21
rs1726866 VV 34 15.3±10.72 F (2,163)=5.07 0.007**
AV 73 10.1±7.71
AA 61 10.1±7.61
rs10246939 II 49 13.4±9.92 F (2,163)=3.92 0.022*
IV 85 10.9±8.31,2
VV 34 8.6±6.11 a rs=reference single nucleotide polymorphism; rs numbers are publicly cataloged in dbSNP (http://www.ncbi.nlm.nih.gov/SNP/). bVariants are presented as nucleotides if they reside in regulatory regions (e.g., C or T); those in protein-coding regions are presented as amino acid substitutions (e.g., A or P, Alanine to Proline). N=number of children of each genotype. cAlleles were tested for Hardy-Weinberg equilibrium; all p-values>0.05. 1,2Means that do not share a superscript differ by post-hoc testing. *=p<0.05; **=p<0.01.

120
Multivariate ANOVA Models for Sucrose Thresholds
Drawing together the preceding results, we generated multivariate analysis of
variance models to explore the independent determinants of sucrose detection thresholds
with the variables age, sex, and TAS2R38 genotype. In this model we used only the
variant (rs1726866) for TAS2R38. This model explained 7% of the total variance among
children in their sucrose detection threshold [F (2,163) = 3.9, p = 0.021]. Genotype
accounted for the majority of the variance, and age and sex made more minor
contributions (Table 16).
Table 16. Age, Genotype, and Sex Effects on Sucrose Detection Thresholds for All
Children
Variable df F p-Value η2
Age 1 3.3 0.072 0.02 Genotype 2 3.9 0.021* 0.05
Sex 1 2.4 0.122 0.01 Note: Genotype refers to rs1726866 (TAS2R38, V262A). η2=effect size. *p<0.05
We confirmed the results in the subset of children who had measures of adiposity
and food intake. The model in the subset explained 14% of the total variance among
children in their sucrose detection threshold [F (2,64) = 3.6, p = 0.032]. Overall, the
modeling results suggest that sucrose threshold is related to TAS2R38 genotype and, to a
lesser extent, to age (Table 17).

121
Table 17. Age, Genotype, and Sex Effects on Sucrose Detection Thresholds for Subset of
Children
Variable df F p-Value η2
Age 1 2.1 0.148 0.03 Genotype 2 3.6 0.032* 0.10
Sex 1 0.4 0.539 0.01 Note: Genotype refers to rs1726866 (TAS2R38, V262A). η2=effect size. *p<0.05
In a final model we added a measure of adiposity (WHtR) to the variables age,
sex and genotype. Although, percent body fat and WHtR were both significantly related
to sucrose detection thresholds at the univariate level, we only used the strongest
adiposity measure to avoid multi-collinearity for this model. Only variables with a
moderate correlation (r = 0.25 or greater) were included a priori. This model explained
35% of the total variance in the subsample of children [F (1,62) = 4.8, p = 0.01] (Table
18), with age and genotype accounting for 29% of the variance. Overall, the modeling
results suggest that sucrose threshold remains related to TAS2R38 genotype adjusted for
age and sex, but becomes a stronger predictor with the addition of WHtR.
Table 18. Age, Sex, Genotype, and Adiposity Effects on Sucrose Detection Thresholds in
the Subset of Children
Variable df F p-Value η2
Age 1 11.3 0.001* 0.15 Genotype 2 4.8 0.012* 0.13
Sex 1 1.6 0.211 0.03 Note: Genotype refers to rs1726866 (TAS2R38, V262A). η2=effect size. *p<0.05

122
Analysis for Aim 3
Relationship of Sucrose Detection Thresholds with Adiposity Measures
The relationship of sucrose detection thresholds with adiposity measures was
shown and discussed in aim 1, with WHtR and percent body fat being significantly
associated with sucrose thresholds. Because of these findings, in the following analysis
we explored these two measures of adiposity with the other variables of interest for aim
3.
Relationship of Diet-related Food Behaviors with Adiposity Measures
From the analysis conducted for aim 3, we observed that there was no significant
relationship between percent body fat and total daily calories consumed (kcal) [r (70) =
+0.18, p = 0.136] or percentage of calories from added sugars [r (70) = -0.04, p = 0.767].
However, percent body fat was significantly related to added sugar relative to body
weight, with leaner children having higher daily sugar intake by weight (g/kg) [r (70) =
-0.40, p = 0.001] and higher caloric intake (kcal/kg) [r (74) = -0.47, p<0.001].
WHtR was significantly related to total daily calories consumed (kcal) [r (71) =
+0.26, p = 0.022], with children with more central adiposity consuming more calories per
day. There was no relationship between WHtR and daily sugar consumption [r (71) =
+0.12, p = 0.332] or between WHtR and percent total calories from added sugars [r (71)
= -0.09, p = 0.452] or relative to body weight [g/kg: r (71) = -0.22, p = 0.056; kcal/kg: [r
(71) = -0.22, p = 0.059]. Correlations among consumption of added sugar and obesity
measures are shown in Table 19.

123
Table 19. Correlations (r) between Diet -Related Food Behaviors and Adiposity
Measures
Caloric Intake and Added Sugars
Percent Body Fat Waist-to-Height Ratio
r p-value r p-value
Daily calories (kcal)a +0.17 0.136 +0.26* 0.027
By calories (kcal/kg) a -0.48* 0.000 -0.22 0.059
Added sugars
Percent total caloriesb -0.04 0.767 -0.09 0.452
Relative to body weight
By amount (g/kg)b -0.40* 0.001 -0.22 0.056
Note: r=Pearson’s correlation coefficient, aN=72; bN=73 children. *p<0.05
Relationship of Personal Characteristics with Adiposity Measures
Shyness and activity were significantly related with WHtR and percent body fat
suggesting that children who have both greater central adiposity [r (85) = +0.24, p =
0.025] and greater percent body fat [r (71) = +0.21, p = 0.049] tend to exhibit more
shyness. Children who were less active by maternal report have a greater central
adiposity [r (85) = -0.41, p = 0.000] and percent body fat [r (85) = -0.43, p = 0.000]
(Table 20).
Table 20.Correlations (r) between Personality Characteristics and Adiposity Measures
Trait WHtR percent body fat
r n p-Value r N p-Value
Personality characteristics: Temperamenta & Food Neophobiab
Shyness +0.24 86 0.025* +0.21 86 0.049* Emotionality -0.10 86 0.355 +0.08 86 0.493 Sociability -0.16 86 0.146 -0.16 86 0.143
Negative reaction to foods +0.12 86 0.275 +0.19 86 0.089 Activity -0.41 86 0.000* -0.43 86 0.000* Food Neophobia +0.05 86 0.616 +0.05 86 0.623
Note: r=Pearson’s correlation coefficient, n=sample size, Waist-to-height ratio= WHtR. aTemperament measures from Pliner and Loewen (1997). b Food Neophobia measures from Pliner and Hobden (1992). *p<0.05. See text for other details.

124
Multivariate ANOVA Models for Adiposity Measures
For aim 3, we generated multivariate analysis of variance models to explore the
independent determinants of adiposity measures (WHtR) with the variables age, sex,
sweet food diet related behaviors and personal characteristics. Only the categorical
variable of sex and continuous variables with a moderate correlation (r=0.25 or greater)
were included in the models. This model explained 40% of the total variance among
children in their adiposity for WHtR. Here activity had a big effect on that variance [F
(1,59) = 13.3, p = 0.000] with sucrose detection thresholds [F (1,59) = 6.1, p =0.016] and
age [F (1,59) = 5.5, p = 0.022] still being significant predictors (Table 21).
Table 21. Age, Sex, Activity, Added sugars, and Sucrose Detection Thresholds Effects on
Adiposity (WHtR)
Variable df F p-Value η2
Age 1 2.9 0.093 0.05 Sucrose detection thresholds 1 6.1 0.016* 0.09
Sex 1 5.5 0.022* 0.08
Activity 1 13.3 0.000* 0.18
Added sugars g/kg of body weight 1 0.44 0.509 0.00 Note: Genotype refers to rs1726866 (TAS2R38, V262A). η2=effect size. *p<0.05
The second model explored independent determinants of adiposity measures
(percent body fat) with the variables age, sex, sweet food diet related behaviors and
personal characteristics. This model explained 29% of the total variance among children
in their percent body fat. Activity had a large effect on that variance [F (1,58) = 7.9, p =
0.006], as did added sugars g/kg body weight [F (1,58) = 6.6, p = 0.013]. Here, sucrose

125
detection threshold was not a significant predictor and had a very small effect on the
variance [F (1,58) =1.4, p =0.238] (Table 22).
Table 22. Age, Sex, Activity, Added sugars and Sucrose Detection Thresholds Effects on
Adiposity (% body fat)
Variable df F p-Value η2
Age 1 0.0 0.959 0.00
Sucrose detection thresholds 1 1.4 0.238 0.02
Sex 1 2.9 0.093 0.05
Activity 1 7.9 0.006* 0.12
Added sugars g/kg of body weight 1 6.6 0.013* 0.10 Note: Genotype refers to rs1726866 (TAS2R38, V262A). η2=effect size. *p<0.05

126
CHAPTER 5
Synthesis and Discussion
The purpose of this study was to investigate the degree of variation in children’s
sucrose detection thresholds and whether sweet and bitter taste receptor-related genotypes
partially accounted for variation in taste thresholds. We also examined the relationship of
sucrose detection thresholds with adiposity and dietary measures as well as dimensions of
child’s temperament with both thresholds and adiposity.
The findings of this study showed that like adults, children 7 to14 years of age
differed markedly in their ability to detect sucrose at low concentrations. Thresholds for
sucrose detection ranged from 0.23 mM to 153.8 mM, with an average of 12.0 mM,
which approximates thresholds previously reported both for adults (Pepino et al., 2010;
Pepino & Mennella, 2007; Pribitkin et al., 2003) and for children (James et al., 1997;
Overberg et al., 2012).
Age and sex were determinants of sucrose detection threshold, on a continuum
even within this narrow age range, with younger children being less sensitive than older
children and boys less sensitive than girls; the latter finding is consistent with prior work
(James et al., 1997). To further establish the dynamics of changes with age, research is
needed that assesses detection thresholds of children and adults of varying ages within
the same study, using identical methodologies (Pepino et al., 2010; Pepino & Mennella,
2007).
The age- and sex-related effects during childhood and early adolescence may be
specific to sweet taste, as suggested by a recent study that found no such relationships for

127
detection thresholds for example of two other basic tastes: NaCl (salty) and monosodium
glutamate (umami) (Bobowski & Mennella, 2015). That study used the same the
psychophysical method used here in children of the same age range, so we can conclude
that the higher detection thresholds for sucrose we found among younger children and
boys were not likely due to differences in cognition or the ability to complete the task.
Both age and gender of a child reflect underlying hormonal and developmental processes
that may shape this sensory system (Posner, Rothbart, Sheese, & Voelker, 2012). Sex-
related differences may be due to girls undergoing puberty at earlier ages than boys.
Children are born with different taste genotypes, and our results suggest that some
but not all genetic variants affect the sensory experience of the child. Unlike in adults
(Fushan et al., 2009), we found no relationship between a variant in the TAS1R3 gene and
sucrose detection thresholds in these children. Similarly, a variant in GNAT3 related to
taste sensitivity in adults (Fushan et al., 2010) had no measurable effect in the children
studied here. One explanation is that the psychophysical methods used to measure
sucrose detection thresholds in the Fushan studies of GNAT3 and TAS1R3 (Fushan et al.,
2010; Fushan et al., 2009) were slightly different than those we used here, which may
account for the different results. Another explanation may be age-related effects: this
particular genetic variant is in a regulatory region and may regulate gene expression more
in adults than in children. This lack of genetic association is reminiscent of the gene’s
effect on sweet preference, detectable in adults but less apparent in children (Mennella et
al., 2012; Mennella, Reed, Mathew, et al., 2014). We also found no relationship between
a variant of TAS1R2 gene and sucrose detection thresholds in this study. There may be a
128
weight effect since genetic variation was observed in the overweight group and not the
normal weight individuals (Eny et al., 2010), however the investigators did not measure
sucrose detection thresholds.
While we found no relationship among children between sucrose detection
thresholds and sweet-taste genotypes, sucrose detection thresholds were related to
variation in the bitter taste receptor gene TAS2R38. Children differ in their ability to
perceive the bitter compound propylthiouracil, due in large part to TAS2R38 alleles
(Mennella, Pepino, Duke, et al., 2010; Mennella et al., 2005; Mennella, Reed, Roberts,
Mathew, & Mansfield, 2014). As discussed earlier, TAS2R38 alleles also partially
explained individual differences in children’s sweet preferences (Mennella et al., 2005).
Moreover, studies in adults have linked the perception of the bitter ligands of this
receptor to sweet thresholds (Chang et al., 2006; Hong et al., 2005). Taken together, these
studies point to a role of this bitter taste receptor gene in sweet perception and suggest
that the sweet and bitter taste systems are more tightly linked than previously understood
(Mennella, Reed, Mathew, et al., 2014).
Four hypotheses, not mutually exclusive, might account for the observed
relationship between variation in the TAS2R38 gene and heightened sweet preferences
and reduced sweet sensitivity among children. First, alleles of TAS2R38 could lead to
proteins with different capacities to bind sucrose directly. Other sweet substances like
saccharin bind members of the bitter receptor family (Pronin et al., 2007), so this
hypothesis has some experimental support. The results were most marked for one variant
within the protein, which might point to the place in the receptor that binds sucrose

129
(V262A). Second, the TAS2R38 gene and its alleles could be in linkage disequilibrium
with nearby genes that might influence sweet taste perception and sensitivity (“Linkage
disequilibrium” refers to the tendency for genes physically close on the chromosome to
be co-inherited during meiosis). Third, TAS2R38 allele frequency may be an especially
sensitive genetic marker of racial ancestry (Guo & Reed, 2001), a variable with large and
reliable effect on sweet preference (Mennella et al., 2005) and bitter taste thresholds (Guo
& Reed, 2001; Mennella, Pepino, Duke, et al., 2010; Mennella, Pepino, Lehmann-Castor,
et al., 2010). Fourth, differences in diet may affect sucrose threshold via changes in gene
expression (Lipchock, Mennella, Spielman, & Reed, 2013).
In this study, children with a bitter-sensitive allele of TAS2R38 also reported
consuming more added sugars than did those with the less sensitive allele, a finding
consistent with previous reports that children with a bitter sensitive allele preferred cereal
and beverages with higher sugar content than those without the sensitive allele (Mennella
et al., 2005). These results are similar to a recent study that measured added sugar (e.g.,
candy) consumption in children (Hoppu, Laitinen, Jaakkola, & Sandell, 2015). Children
in the study herein consumed, on average, 14% of total calories as added sugar, almost
three times the 5% recommendation of international experts in public health (World
Health Organization, 2015). In fact, of the 73 children in this study that provided valid
dietary data, only 4 did not exceed the dietary recommendation. These reports of added
sugar in the present study, while not in compliance with public health recommendations,
are typical, and remarkably consistent with intake data obtained from larger-scale
epidemiological studies (Ervin et al., 2012).

130
This study also examined the relationships between sweet taste threshold and
body weight, central adiposity, and percent body fat. We found that body mass index was
not related to sucrose thresholds, but when more direct measures of obesity were
examined, children who were fatter and those with larger waistlines relative to their
height had lower thresholds. This result is consistent with results of a study that measured
sucrose threshold in obese and lean adolescents (Pasquet, Frelut, Simmen, Hladik, &
Monneuse, 2007) but differs from results of another study that found obese adolescents,
as measured by body mass index, were less sensitive to low sucrose concentrations than
were lean adolescents (Overberg et al., 2012). Differences in methods relying on less
sensitive measures of childhood obesity such as body mass index (Demerath et al., 2006),
rather than more direct measures like percent body fat or waist- to- height ratio may
account for the inconsistencies across studies. New knowledge about the age-related and
molecular bases of individual differences in taste and the use of methodologies that are
validated and appropriate for children (Mennella, Spector, Reed, & Coldwell, 2013), a
generation that will struggle with obesity and diabetes, may suggest strategies to
overcome diet-induced disease.
In this study, we also examined the relationship between temperament measures
(negative food behaviors and food neophobia) and sucrose detection thresholds. Our
findings suggest that children who have more negative reactions to food have a higher
threshold for sucrose. No previous study has reported an association between these two
measures of temperament and sucrose thresholds but rather sweet taste preference (Liem
& Mennella, 2002) and other food preferences (Cooke et al., 2006; Skinner, Carruth,
131
Wendy, & Ziegler, 2002; Wardle, Herrera, Cooke, & Gibson, 2003). Sucrose detection
thresholds might be a mediator for diet with negative food behaviors. We also examined
temperament and adiposity; we found that children who were shy and were less active
had more adiposity. This finding was consistent with the literature since studies have
reported that obese children may experience stigma and become withdrawn. There is also
evidence that has associated lower physical activity with increased adiposity in children
(Caspersen, Pereira, & Curran, 2000; Janssen et al., 2005; Trost, Kerr, Ward, & Pate,
2001).
Collectively, the results of our study have expanded our knowledge of the
association of bitter taste receptor genes with sucrose detection thresholds. To the best of
our knowledge this study was the first to show that sweet taste receptors genes were not,
but bitter taste receptor genes were associated with sucrose detection thresholds in
children. It is also the first study to report a relationship between negative food reactions
and sweet taste thresholds in children.
Conceptual Model- Revised
The conceptual model described earlier is revised here. The initial hypothesized
linkages were proposed based on the literature on sucrose thresholds, food behaviors,
personal characteristics and adiposity measures. Based on the results in this study, some
changes are suggested to adjust that conceptual model (Figure 24). We expect that the
modifications are not final since changes will be made as new findings emerge. The first
modification includes TAS2R38 as the gene related to sucrose detection thresholds in

132
children and to show that this gene is related to predicted percent of added sugar
consumption as kilocalories. The second change is to alter the outcome measure of
adiposity to reflect that of the direct obesity measures such as WHtR and % body fat were
related to sucrose detection thresholds, but not BMIz scores. The relationship of sucrose
detection thresholds with negative food behaviors has been depicted here as well.
Figure 24. Revise Conceptual Model
Limitations of the Study
The data used in this study were obtained cross-sectionally and a longitudinal
approach would be needed to be able to make claims about change overtime. Although
we combined data from study 1 and study 2, which was a possible strength to increase the
number of subjects, there were some differences between the samples in the two studies
for education, race and income. However, there were no differences for the main

133
variables used in this study (i.e., sucrose thresholds). The study was limited for some
variables such as dietary reports, and percent body fat and waist- to- height ratio, which
limits generalization of results to larger populations of children as expected since we had
data only for a subset of children. Further, while the overall sample of children was
ethnically diverse (which is useful for generalizing to US populations), most participants
were African-American. Thus, we did not have enough power to conduct robust subgroup
analysis based on race (e.g., African American vs. Asian vs. Caucasian). There was no
measure of pubertal status in the participants, so consideration of hormonal influences on
sweet taste threshold was not possible. Our measures of temperament and food intake
were obtained by self-report, a method that carries the risk of recall bias. Furthermore,
the temperament survey questions were answered by the mother about her child, an
indirect approach. Stronger, more direct methods of assessing temperament are needed
for future research. The ASA24, with its web-based interface had the added problem of
no real-time human contact to resolve questions about food choices or portion size,
variables that would greatly impact the accuracy of the data. While the Goldberg cutoff is
a validated method to identify under-reporters, the fact that almost 25% of the food
records were rejected for underreporting resulted in a significant loss of data and raises
the question of whether the ASA24 method was limited in some way. Typical food intake
is best represented by three 24-hour dietary recalls, including both weekdays and a
weekend day. This study was limited to a single day's record. The BIA method of
measuring body composition has the advantage of using portable equipment with no
radiation exposure. However, the method can be less accurate in states of altered

134
hydration, but this would not have been expected in healthy children. The method also
requires the choice of appropriate equation for the population being measured, since the
equations used vary based on the population being studied (i.e., obese adults, people with
HIV or end-stage renal disease, elderly). This study used an equation validated in
children. Despite these limitations, the findings are promising and suggest that the use of
a larger sample is warranted.
Implications
An important goal of this study was to make a novel contribution to the literature
regarding sucrose detection thresholds, sweet and bitter taste receptors genotype and
obesity measures in children. Children are becoming overweight and obese and
consuming large amount of calories as added sugars, which place them at higher risk to
develop obesity related comorbidities. This study has implications for the study of
gustation and adiposity. The findings of this investigation lay some evidence for future
clinical studies that will aid in recognizing children at the greatest at risk of obesity and
over-consumption of calories and added sugars. Ultimately these children can be directed
to early interventions aimed at decreasing environmental factors that may contribute to
weight gain. Effective early intervention may have positive health outcomes by
decreasing the probability of emerging comorbidities such as diabetes, and cardiovascular
disease and avoid the use of surgical procedures like weight loss surgery when possible.

135
Future Directions
There are a few suggestions for future research in this area. Replication of this
study entirely with measurements of body composition, waist circumference and food
intake collected for all the subjects would be recommended. It would also be preferable
that the study be designed as a prospective study with repeated measures over time to
allow for analysis to identify causality. Adding measures of sucrose preference
concurrently with sucrose thresholds measures may also help to assess relationships
between sucrose detection thresholds and sweet taste preference and/or confirm whether
the sweet taste receptor genes are specifically related to preference, but not sensitivity in
children. Development of a developmentally appropriate short survey to assess the
reward processes associated with added sugars might enable comparisons with sucrose
detection thresholds. To obtain a more accurate assessment of typical food intake,
research dietitians could collect three dietary recalls, one-week day and one weekend day.
Lastly, gathering measures of puberty and hormonal changes may elucidate differences in
sucrose detection thresholds by gender. A future study can also be designed measuring
other variables from Contento’s model of food choices to see how these variables relate
to both diet and thresholds and outcomes of obesity.
Although the ultimate goal is to translate research findings into human
interventions, based on the findings from this study a proposed study in animal models is
necessary to further understand the mechanisms that contribute to an association between
TAS2R38 and sweet taste detection thresholds, to describe variations that may relate to
susceptibility in gustatory function. As mentioned in the above discussion the etiology

136
behind this finding is unknown to date. In addition, an epigenetic study is needed to
describe how external factors such as oversaturation of taste buds with sugars might
activate and deactivate genes and how that affects sucrose detection thresholds.
Although sweet taste detection thresholds were not related to variation in sweet
taste receptor genes in this study, it would be helpful to re-assess this relationship in a
larger sample, to examine in more detail the effects of sweet taste genes variants, to
determine which of these variants are found in regulatory regions in the DNA, and to
examine their effects on gene expression and protein abundance in taste cells.
Results of recent studies have strengthened the body of evidence demonstrating
that high intake of added sugars are associated with greater risk of obesity in children (Hu
& Malik, 2010; Linardakis et al., 2008; Malik, Popkin, Bray, Després, & Hu, 2010;
Malik, Willett, & Hu, 2009). But to date, nutritional interventions have been moderately
successful in improving weight and decreasing excess calories and added sugars.
Findings from this work show promise for developing nursing-driven interventions to
advance human health and nutrition. The present findings also suggest that children with
specific genotypes tend to consume a higher percentage of kcal as added sugars.
Applying the knowledge collected from this research and future work will help us take
into account the variability of the sensory world of the child. This evidence may help us
target specific interventions for those children at higher risk for obesity related diseases,
and provide efforts to minimize children’s consumption of added sugars, which continues
to exceed recommended limits. For example, to prevent the development of obesity in

137
susceptible children, a trial of substitution of added sugars by non-caloric sweetener
might be considered.
Summary
In summary, this dissertation illustrated that bitter taste receptor genotypes were
associated with sucrose detection thresholds. Sucrose detection thresholds were also
associated with age and sex in a diverse sample of healthy children living in an urban US
city. Children with the highest risk genotype also reported greater intake of added sugars,
a behavior with potential to lead to obesity. The sweet taste receptor genotype, however,
was not related to sweet taste thresholds. While these findings may suggest possible
useful points for future intervention strategies to prevent pediatric obesity, further studies
in a larger sample are needed to confirm and extend these findings.

138
Appendix A
Sucrose Dilution Instructions for Threshold
A. General Instructions
1. The instructions make 1 liter of the top 5 concentrations and 500 ml of the
rest. 2. Maximum possible test= 15 subjects. 3. The solutions take about 2 hours to make (includes cleanup). 4. The following glassware is required:
a. 2000-, 1000-, 100-, and 50-ml graduated cylinders (one of each) b. 4 2000-ml flasks (labeled 1-4) c. 10- and 50-ml pipettes d. 18 1-liter glass bottles
5. Taste stimuli Info: Tastant Taste Concentration #’s Molarities Formula Weight Sucrose Sweet 0-17 1 M to 5.6x10⁻⁵ M 342.30g 6. All the flasks and solution bottle are numbered with tape, along with the
date made.
****** Solutions need to be remade every two weeks or more often if needed******
B. Step 1: Making 0 concentration
Conc. # Amount Sucrose Glassware used 0 684.6 g 2000 ml (2L) graduated cylinder with stopper
1. Using the large purple cup, weigh 684.6g of sucrose to the nearest 1/100 using
the 1500g scale. 2. Use a funnel to pour sucrose into 2 L graduated mixing cylinder.

139
3. Using dH2O, rinse any sucrose remaining in weigh cup/dish and funnel into
cylinder. 4. Fill the graduated cylinder to the 2000 ml mark with distilled water after the
sucrose is in (Fill the last ½ inch or so with a pipette so you do not go over the mark), make sure the sucrose at the bottom of the cylinder is wet before measuring to the 2000ml.
5. Place stopper on flask and shake until the entire sample is dissolved (make
sure to always hold stopper so it does not fall off or leak).
C. Step 2: Making concentration 1-4 using dilution steps
1. In 2000ml flask labeled 1-4 put the following measured amounts of dH2O: Conc. # Amount dH2O in 1000 ml flask (using graduated cylinders)
1 440ml 2 680ml 3 820ml 4 900ml
2. Fill each 2000 ml flask to mark with 0 concentration of solution.
Conc. # Amount of 0 concentration 1 560ml of 0 concentration 2 320ml of 0 concentration 3 180ml of 0 concentration 4 100ml of 0 concentration
3. Put stoppers in the flask and shake (overturn) 4 times to mix solution. 4. Pour solution into 1-liter bottles using a funnel. 5. To clean glassware soak in soapy water in sink for an hour and rinse out
with hot water 5 times and 5 times with distilled water. Let dry before saving.
D. Step 3: Making concentrations 5-17 using dilution steps (*** NOTE: To make
1000 ml of each solution, just double the amount of water and sucrose solution, ex. 450 ml of dH2O = 900 ml dH2O and 50 ml of sucrose = 100 ml of sucrose)
1. Set up bottles as follows:
17

140
13 ↑ 14 15 16 9 ↑ 10 ↑ 11 ↑ 12 ↑ 5 ↑ 6 ↑ 7 ↑ 8 ↑ 1 ↑ 2 ↑ 3 ↑ 4 ↑
2. Fill 1L bottles number 5-17 with 450 ml dH2O. 3. The rest of the series is a simple dilution from the four bases (bottles 1-4).
Starting with concentration #4, pipette 50ml of 4 and put it into #8. Then pipette 50ml of #3 into #7, 50ml of #2 into #6 and 50ml of #1 into #5 as shown below: Conc. # Amount of dH2O in 1L bottle Amount of conc. 8 450ml dH2O 50ml Bottle #4 7 450ml dH2O 50ml Bottle #3 6 450ml dH2O 50ml Bottle #2 5 450ml dH2O 50ml Bottle #1
Note: The pipette does not need to be rinsed out between each set of
four dilutions as long as you are going from weaker concentration (#8)
toward the stronger (#5). 4. Shake Bottles #5-8 and throw out pipette. 5. Repeat step #3, pipetting 8 thru 5 into 12 thru 9 as follows:
Conc. # Amount of dH2O in 1L bottle Amount of conc. 12 450ml dH2O 50ml Bottle #8 11 450ml dH2O 50ml Bottle #7 10 450ml dH2O 50ml Bottle #6 9 450ml dH2O 50 ml Bottle #5
6. Shake bottle #9-12 to mix and throw out pipette. 7. Repeat step #3 pipetting 12 thru 9 into 16 thru 13 as follows:
Conc. # Amount of dH2O in 1L bottle Amount of conc. 16 450ml dH2O 50ml Bottle #12 15 450ml dH2O 50ml Bottle #11 14 450ml dH2O 50ml Bottle #10 13 450ml dH2O 50 ml Bottle #9
8. Shake #13-16 to mix and throw out pipette. 9. Repeat step #3, pipetting 13 into 17 as follows:
Conc. # Amount of dH2O in 1L bottle Amount of conc.

141
17 450ml dH2O 50ml Bottle #13
10. Shake #17 to mix and throw out pipette 11. Pour solutions into small 120ml bottles for testing. 12. Store bottles in cold room on second floor.
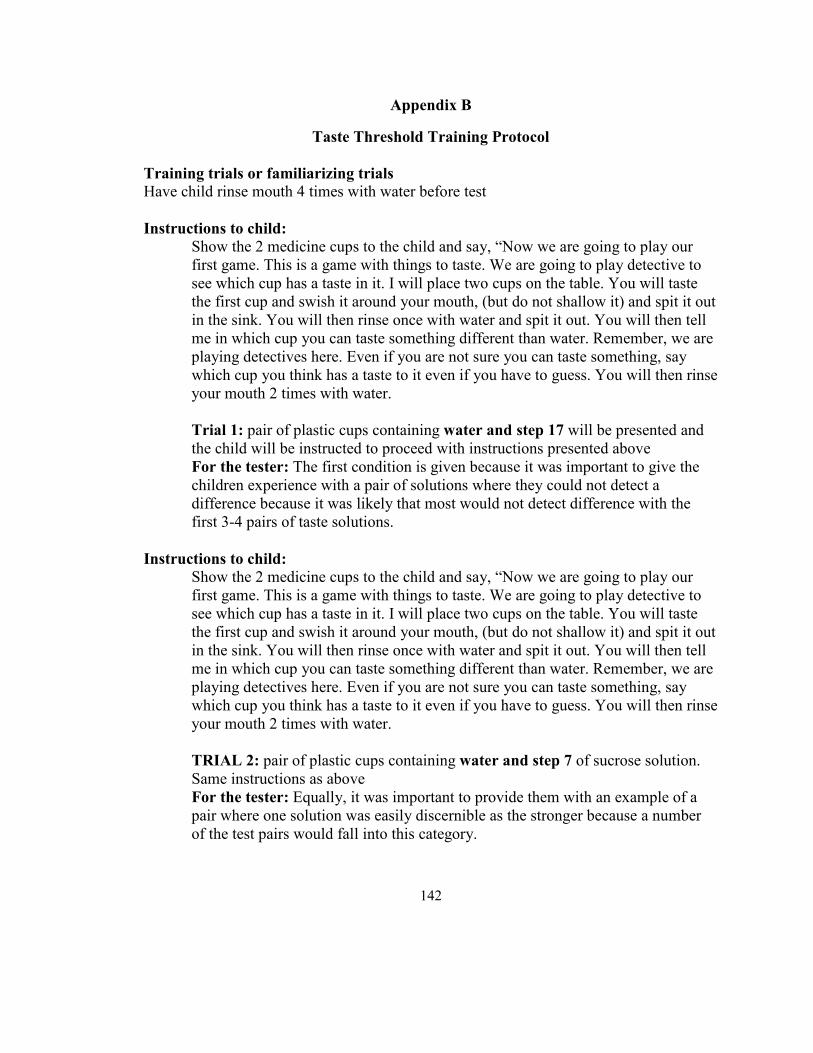
142
Appendix B
Taste Threshold Training Protocol
Training trials or familiarizing trials
Have child rinse mouth 4 times with water before test
Instructions to child:
Show the 2 medicine cups to the child and say, “Now we are going to play our first game. This is a game with things to taste. We are going to play detective to see which cup has a taste in it. I will place two cups on the table. You will taste the first cup and swish it around your mouth, (but do not shallow it) and spit it out in the sink. You will then rinse once with water and spit it out. You will then tell me in which cup you can taste something different than water. Remember, we are playing detectives here. Even if you are not sure you can taste something, say which cup you think has a taste to it even if you have to guess. You will then rinse your mouth 2 times with water. Trial 1: pair of plastic cups containing water and step 17 will be presented and the child will be instructed to proceed with instructions presented above For the tester: The first condition is given because it was important to give the children experience with a pair of solutions where they could not detect a difference because it was likely that most would not detect difference with the first 3-4 pairs of taste solutions.
Instructions to child:
Show the 2 medicine cups to the child and say, “Now we are going to play our first game. This is a game with things to taste. We are going to play detective to see which cup has a taste in it. I will place two cups on the table. You will taste the first cup and swish it around your mouth, (but do not shallow it) and spit it out in the sink. You will then rinse once with water and spit it out. You will then tell me in which cup you can taste something different than water. Remember, we are playing detectives here. Even if you are not sure you can taste something, say which cup you think has a taste to it even if you have to guess. You will then rinse your mouth 2 times with water. TRIAL 2: pair of plastic cups containing water and step 7 of sucrose solution. Same instructions as above For the tester: Equally, it was important to provide them with an example of a pair where one solution was easily discernible as the stronger because a number of the test pairs would fall into this category.

143
Appendix C
Protocol for Testing Sweet Sensitivity
1. Start off with 120-ml bottles of the sucrose concentrations 0-17* and four 120-ml
bottles of dH2O. ** (All bottles labeled accordingly; you will have an extra bottle each of concentrations 7, 8, 9, 10, & 11) *Bottles of sucrose concentrations must be stored in the COLD ROOM on the 3rd floor. **Distilled water is abbreviated “dH2O” throughout the instructions.
2. Every series is started with 2 medicine cups, 1 containing 10 ml dH2O and the
other containing 10 ml of 0.0032 M sucrose (bottle 10).
3. With each trial, every subject receives 10 ml of water and 10 ml of corresponding sucrose solution (order depends on grid numbers and concentration depends on previous correct/incorrect answer).
4. In room 326, set up the 21 bottles. Have a tray of medicine cups ready to use.
(Each tray will be labeled in the order of the grid. Sucrose cups will be placed in the tray cup marked 2, and water cups will be in the tray cups left blank.)
5. Pour 10 ml of water into the cups in the blank cups and pour 10 ml of the sucrose
according to concentration step (concentration step = bottle #).
6. Present order of cups according to the order of the grid one at a time.
7. Place the 2 cups on respective number on table. The subject will swish each cup around in the mouth for at least 5 seconds and then spit it out in the sink, rinsing once between each cup and twice after each set. After the second cup, the subject will say which cup had a taste to it. Even if the subject did not taste anything, a guess must be made.
8. Continue steps 5-7 until the subject has 4 reversals that meet the criteria, or until
the subject reaches his/her maximum threshold.

144
Appendix D
Protocol to use Threshold Grids for Taste
1. The order numbers (the 1’s and 2’s running across the top and bottom of the grid) determine the order of presentation of solution (1’s= water first, 2’s=sucrose first) for each trial.
2. Have a piece of tape labeled 1 or 2 on the table for you to use throughout the
testing. You will put the first cup on the #1 and the second cup on the #2 on the table. After the subject tastes the first cup they will rinse their mouth once with water and then taste the second cup. The subject will swish the liquids around in their mouth for 5 seconds before spitting them out in the sink. The subject will then rinse 2 times between each trial. (The subject cannot go back and re-taste any cups.)
3. Testing is a forced choice paradigm. After the subject has tasted both cups (a
sucrose concentration and water), they must pick the cup they think has a taste to it. Even if the subject cannot taste anything, the subject must pick a cup even if a guess must be made.
4. The threshold testing starts at Step 10 (0.032M) of the 18 step sucrose
concentration. (Step 0= 1M solution (most concentrated), Step 17=0.000056M solution (least concentrated).)
5. To record on the grid, a plus (+) is put in the square if the subject picks the
sucrose cup, which is a correct response, and a minus (-) is put in the square if the water cup is picked, which is an incorrect response.
6. If the subject is incorrect after the first trial (picks water), you then proceed up the
chart to the next concentration (Step 9). If the subject is correct after the first trial, you then retest Step 10. If the subject is correct on the second trial, you then proceed down the grid to the next sucrose concentration (Step 11). Each change in direction on the grid is called a reversal.
If you get:
Minus sign (-): proceed up the grid to the next concentration (ex. Step 10� Step 9)
Plus sign (+): retest same concentration +, + on same concentration: proceed down the grid to the next
concentration (ex. Step 10� Step 11) +, - on same concentration: proceed up the grid to the next concentration
(ex. Step 10� Step 9)

145
7. Total score for the threshold is based on the last 4 reversals and when the
following criteria are met: (The score of the threshold is the average of the last 4 reversal concentration)
a. When 4 reversals are grouped in such a way that there are no more than 2 dilution steps between any two successive reversals (see example 1). If the subject skips 3 or more dilution steps between 2 reversals (after having obtained a second reversal), the tester must continue until 4 reversals are obtained in a group (see example 2).
b. When at least 4 correct answers (any two sets of 2) have been obtained on the same dilution level (see example 1). If the subject never guesses the same dilution level correctly 4 times and successive reversals form an ascending pattern, the tester must continue until either the reversals stabilize or until the subject reaches step 0 (see example 3).
8. If the subject reaches the bottom of the series (step 18) and guesses correctly
twice at step 17, the threshold score is 17. 9. If the subject reaches the top of the series (Step 0) and guesses incorrectly, the
score is 0 (see examples 5 and 6).

146
Appendix E
Threshold Grid Score Sheet
Reversal # Threshold Step
# mM
Concentration
1
2
3
4
Average mM Threshold: __________
Total # of positive (+) reversals: __________
Total # of negative (-) reversals: __________
# of reversals used for threshold: __________
Note: If you need to go for 5 reversals, score the last four reversals
STEP # Mol Concentration
5 .056
6 .032
7 .018
8 .010
9 .0056
10 .0032
11 .0018
12 .0010
13 .00056
14 .00032

147
Appendix F
Approaches to Calculating Goldberg Cutoff
Approach 1: a very conservative approach (will identify least number of under-
reporters)
1. Calculate the BMR (Basal Metabolic Rate) for each subject. Equation for boys Ages 3–10 BMR = 22.706 × W + 504.3 Ages 10–18 BMR = 17.686 × W + 658.2 Equation for girls Ages 3 – 10 BMR = 20.315 x W + 485.9 Ages 10-18 BMR = 13.384 x W + 692.9
2. Compare reported energy intake to BMR for each subject (reported energy intake/BMR)
3. Anyone whose reported energy intake/BMR is < 1.0 is an under-reporter
Approach 2: less conservative, recommended in one article (will identify more
subjects as under-reporters)
1. Calculate the BMR (Basal Metabolic Rate) for each subject. Equation for boys Ages 3–10 BMR = 22.706 × W + 504.3 Ages 10–18 BMR = 17.686 × W + 658.2 Equation for girls Ages 3 – 10 BMR = 20.315 x W + 485.9 Ages 10-18 BMR = 13.384 x W + 692.9
2. Multiply each child’s BMR by the appropriate age/gender PAL to determine estimated energy expenditure Girls PAL Age Boys PAL 1.30 6 – 7 yo 1.30 1.35 7 – 8 yo 1.35 1.40 8 – 9 yo 1.40 1.40 9– 10 yo 1.40 1.45 10–11 yo 1.45

148
1.50 11-12 yo 1.50 1.55 12-13 yo 1.55
3. Compare reported energy intake to estimated energy expenditure for each subject (reported energy intake/estimated energy requirement)
4. Anyone whose reported energy intake/estimated energy expenditure is < 1.0 is an under-reporter.

149
Appendix G
Child’s Temperament Questionnaire and Food Neophobia Scale (FNS)
Please rate, on a scale of 1-5 whether the following statements are true for your child that participates in the study. Circle the appropriate number: 1-Completely disagree, 2-slightky disagree, 3-neither agree or disagree, 4- slightly agree, 5-completely agree
1 Once my child decides s/he doesn’t like something, there is no way of getting him/her to like it
1 2 3 4 5
2 My child makes friends easily 1 2 3 4 5
3 My child likes to be with people 1 2 3 4 5
4 My child has strong likes and dislikes in food 1 2 3 4 5
5 My child tends to be shy 1 2 3 4 5
6 My child is afraid to try new foods 1 2 3 4 5
7 My child often fusses and cries 1 2 3 4 5
8 My child makes faces at new foods 1 2 3 4 5
9 My child is off and running as soon as s/he wakes up in the morning
1 2 3 4 5
10 My child rarely takes a new food without fussing 1 2 3 4 5
11 My child is very friendly with strangers 1 2 3 4 5
12 My child is always on the go 1 2 3 4 5
13 My child reacts intensely when upset 1 2 3 4 5
14 When my child moves about, s/he usually moves slowly 1 2 3 4 5
15 My child likes foods from different countries 1 2 3 4 5
16 My child consistently dislikes many kind of foods 1 2 3 4 5
17 My child will eat almost anything 1 2 3 4 5
18 My child takes a long time to warm up to strangers 1 2 3 4 5
19 My child cries easily 1 2 3 4 5
20 My child tends to be somewhat emotional 1 2 3 4 5
21 My child constantly wants to try new foods 1 2 3 4 5
22 My child finds people more stimulating than anything else 1 2 3 4 5
23 My child gets upset easily 1 2 3 4 5
24 My child does not trust new foods 1 2 3 4 5
25 My child prefers quite, inactive games to more active ones 1 2 3 4 5
26 When alone, my child feels isolated 1 2 3 4 5
27 My child prefers playing with others rather than alone 1 2 3 4 5
28 My child is very sociable 1 2 3 4 5
29 If my child does not know the food, he/she won’t try it 1 2 3 4 5
30 My child is very energetic 1 2 3 4 5
31 My child is something of a loner 1 2 3 4 5

150
Appendix H
Child’s Temperament Questionnaire and Food Neophobia Scale (FNS) Scoring
Sheet
From Pliner, P., and Loewen. (1997). Temperament and Neophobia in Children (5-11years) and their mothers. Appetite, 28, 239-254
Reversed Items: 2, 11, 14,15,17,21,25,28,31
Add score for each item
Shyness: Items 2, 5,11,18,28 Shyness Scores:_____ Emotionality: Items 7, 13,19,20,23 Emotionality Scores:____ Sociability: Items 3, 22,26,27,31 Sociability Scores: _____ (Negative) reactions to food: Items 1,4,8,10,16 (Negative) reactions to food Scores: _____ Activity: Items 9, 12,14,25,30 Activity Scores: ____ From Pliner, P., & Hobden, K. (1992) Development of a scale to measure the trait of food neophobia in humans. Appetite, 19, 105-120 Food Neophobia: Items 6, 15, 17,21,24,29 Food Neophobia Scores: _____
151
Appendix I
BuccalAmpTM DNA Quick Extract DNA Extraction Protocol for Collection Swabs
buccalamp-dna-extra
ction-kit-quickextract-dna-extraction-solution-1-0-catch-all-sample-collection-swabs.pdf

152
Appendix J
Orangene® DNA Laboratory Protocol for Manual Purification of DNA from 4.0
mL of Oragene®•DNA/saliva
Note: DNAgenotek changed the name of the product to PrepIT® L2P but protocol remained the same. Protocol was adjusted for 1mL extraction.
`
Laboratory Protocol
for Manual Purification of DNA of Oragene DNA saliva.pdf

153
Appendix K
TaqMan® GTXpress™ Master Mix Protocol
TaqMan GTXpress
Protocol.pdf

154
Appendix L
Copyright Clearance Center's RightsLink® Service with Elsevier

155
BIBLIOGRAPHY
Adams, D., & Butterfield, N. (1979). Taste thresholds and caries experience. Journal of
Dentistry, 7(3), 208-211.
Adler, E., Hoon, M. A., Mueller, K. L., Chandrashekar, J., Ryba, N. J., & Zuker, C. S.
(2000). A novel family of mammalian taste receptors. Cell, 100(6), 693-702.
Agras, W. S., Hammer, L. D., McNicholas, F., & Kraemer, H. C. (2004). Risk factors for
childhood overweight: A prospective study from birth to 9.5 years. Journal of
Pediatrics, 145(1), 20-25. doi: 10.1016/j.jpeds.2004.03.023
Alberti-Fidanza, A., Fruttini, D., & Servili, M. (1998). Gustatory and food habit changes
during the menstrual cycle. International Journal for Vitamin and Nutrition
Research, 68(2), 149-153.
Allesen-Holm, B. H., Frøst, M. B., & Bredie, W. L. P. (2009). Taste sensitivity and
preferences in Danish school children. Delegate Manual: 8th Pangbor Sensory
Science Symposium. University of Copenhagen.
Ambrosini, G. L., Oddy, W. H., Huang, R. C., Mori, T. A., Beilin, L. J., & Jebb, S. A.
(2013). Prospective associations between sugar-sweetened beverage intakes and
cardiometabolic risk factors in adolescents. American Journal of Clinical
Nutrition, 98(2): 327-34 doi: 10.3945/ajcn.112.051383
Anderson, N. H. (1990). Integration psychophysics. In R. McBride & H. McFaie (Eds.),
Psychological Basis of Sensory Evaluation. London: Elsevier.

156
Bachmanov, A., Li, X., Reed, D. R., Ohmen, J. D., Li, S., Chen, Z., . . . Beauchamp, G.
K. (2001). Positional cloning of the mouse saccharin preference (Sac) locus.
Chemical Senses, 26, 925-933.
Bachmanov, A., Reed, D., Ninomiya, Y., Inoue, M., Tordoff, M., Price, R., &
Beauchamp, G. (1997). Sucrose consumption in mice: Major influence of two
genetic loci affecting peripheral sensory responses. Mammalian Genome, 8, 545-
548.
Bacon, A. W., Miles, J. S., & Schiffman, S. S. (1994). Effect of race on perception of fat
alone and in combination with sugar. Physiology and Behavior, 55(3), 603-606.
Barlow, L. A., & Klein, O. D. (2015). Developing and regenerating a sense of taste.
Current Topics in Developmental Biology, 111, 401-419. doi:
10.1016/bs.ctdb.2014.11.012
Bartok, C. J., Marini, M. E., & Birch, L. L. (2011). High body mass index percentile
accurately reflects excess adiposity in white girls. Journal of the American
Dietetic Association, 111(3), 437-441. doi: 10.1016/j.jada.2010.11.015
Bartoshuk, A. K. (1991). Taste, smell and pleasure. In R. C. Bollef (Ed.), The hedonics of
taste. Hillsdale, NJ: Erlbaum.
Bartoshuk, L. (1991). Losses of taste in regions of the tongue's surface. Appetite, 17(1),
69.

157
Bartoshuk, L. M. (1978). The psychophysics of taste. American Journal of Clinical
Nutrition, 31(6), 1068-1077.
Bartoshuk, L. M. (1993). Genetic and pathological taste variation: What can we learn
from animal models and human disease? Ciba Foundation Symposium, 179, 251-
267.
Bartoshuk, L. M., Duffy, V. B., Hayes, J. E., Moskowitz, H. R., & Snyder, D. J. (2006).
Psychophysics of sweet and fat perception in obesity: Problems, solutions and
new perspectives. Philosophical transactions of the Royal Society of London.
Series B, Biological sciences, 361(1471), 1137-1148. doi: 10.1098/rstb.2006.1853
Bartoshuk, L. M., Rifkin, B., Marks, L. E., & Bars, P. (1986). Taste and aging. Journal of
Gerontology, 41(1), 51-57.
Battelino, T., & Shalitin, S. (2014). Obesity, metabolic syndrome and nutrition. World
Review of Nutrition and Dietetics, 109, 1-22. doi: 10.1159/000356352
Beauchamp, G., & Moran, M. (1982). Dietary experience and sweet taste preference in
human infants. Appetite, 3(2), 139-152.
Beauchamp, G. K., & Mennella, J. A. (2011). Flavor perception in human infants:
Development and functional significance. Digestion, 83(Suppl. 1), 1-6. doi:
10.1159/000323397
Beauchamp, G. K., & Moran, M. (1984). Acceptance of sweet and salty tastes in 2-year-
old children. Appetite, 5(4), 291-305. doi: 10.1016/S0195-6663(84)80002-1

158
Beck, J., Schaefer, C. A., Nace, H., Steffen, A. D., Nigg, C., Brink, L., . . . Browning, R.
C. (2012). Accuracy of self-reported height and weight in children aged 6 to 11
years. Preventing Chronic Disease, 9, E119.
Bergmann, G. G., Gaya, A., Halpern, R., Bergmann, M. L., Rech, R. R., Constanzi, C. B.,
& Alli, L. R. (2010). Waist circumference as screening instrument for
cardiovascular disease risk factors in schoolchildren. Jornal do Pediatria, 86(5),
411-416. doi: 10.2223/JPED.2026
Berling, K., Knutsson, J., Rosenblad, A., & Von Unge, M. (2011). Evaluation of
electrogustometry and the filter paper disc method for taste assessment. Acta Oto-
laryngologica, 131(5), 488-493. doi: 10.3109/00016489.2010.535850
Berridge, K. C., & Robinson, T. E. (2003). Parsing reward. Trends in Neurosciences,
26(9), 507-513. doi: 10.1016/s0166-2236(03)00233-9
Bertino, M., Beauchamp, G., & Jen, K.-L. (1983). Rated taste perception in two cultural
groups. Chemical Senses, 8, 3-15.
Birch, L. L., & Fisher, J. O. (1998). Development of eating behaviors among children and
adolescents. Pediatrics, 101(Suppl. 2), 539-549.
Bland, J. M., & Altman, D. G. (1996). Statistics notes: Transformations, means, and
confidence intervals. BMJ 1996; 312: 1079

159
Bobowski, N. L., & Mennella, J. A. (2015). Disruption in the relationship between blood
pressure and salty taste thresholds among overweight and obese children. Journal
of the Academy of Nutrition and Dietetics. doi: 10.1016/j.jand.2015.02.017
Boeke, C. E., Oken, E., Kleinman, K. P., Rifas-Shiman, S. L., Taveras, E. M., & Gillman,
M. W. (2013). Correlations among adiposity measures in school-aged children.
BioMed Central Pediatrics, 13, 99. doi: 10.1186/1471-2431-13-99
Boyce, J. M., & Shone, G. R. (2006). Effects of ageing on smell and taste. Postgraduate
Medical Journal, 82(966), 239-241. doi: 10.1136/pgmj.2005.039453
Bradbury, J. (2004). Taste perception: Cracking the code. PLoS Biology, 2(3), e64. doi:
10.1371/journal.pbio.0020064
Bufe, B., Breslin, P. A., Kuhn, C., Reed, D. R., Tharp, C. D., Slack, J. P., . . . Meyerhof,
W. (2005). The molecular basis of individual differences in phenylthiocarbamide
and propylthiouracil bitterness perception. Current Biology, 15(4), 322-327. doi:
10.1016/j.cub.2005.01.047
Carey, W. B. (1985). Temperament and increased weight gain in infants. Journal of
Developmental and Behavioral Pediatrics, 6(3), 128-131.
Carey, W. B., Hegvik, R. L., & McDevitt, S. C. (1988). Temperamental factors
associated with rapid weight gain and obesity in middle childhood. Journal of
Developmental and Behavioral Pediatrics, 9(4), 194-198.

160
Carter, E., Donely, V., Sonson, N., Santaniello, M., Stenely, M., & Raudenbush, R.
(2000). PTC sensitivity differentiates food neophobics and food neophilics. Paper
presented at the annual meeting of the Society for the Study of Ingestive
Behavior, Dublin.
Caspersen, C. J., Pereira, M. A., & Curran, K. M. (2000). Changes in physical activity
patterns in the United States, by sex and cross-sectional age. Medicine and
Science in Sports and Exercise, 32(9), 1601-1609.
Catalanotto, F. A., Gaulin-Kremer, E., & Shaw, J. L. (1979). Sucrose taste functions and
dental caries in children. Journal of Dental Research, 58(4), 1327-1332.
Catalanotto, F. A., & Keene, H. J. (1974). Sucrose taste thresholds in caries-free naval
recruits. Archives of Oral Biology, 19(12), 1191-1193.
Centers for Disease Control and Prevention. (2012). National Health and Nutrition
Examination Survey. Retrieved November 20th, 2012 from
http://www.cdc.gov/nchs/nhanes.htm
Centers for Disease Control and Prevention. (2012). Prevalence of obesity in the United
States, 2009-2010. Retrieved November 20th, 2012 from
http://www.cdc.gov/nchs/data/databriefs/db82.pdf
Centers for Disease Control and Prevention. (2013). Defining overweight and obesity.
Retrieved from January 12th, 2013
http://www.cdc.gov/obesity/adult/defining.html

161
Centers for Disease Control and Prevention. (2014). Childhood obesity facts. Retrieved
January 15th, 2014 from http://www.cdc.gov/obesity/adult/defining.html
Centers for Disease Control and Prevention. (2014). Progress on childhood obesity.
Retrieved January 15th, 2014 from
http://www.cdc.gov/VitalSigns/ChildhoodObesity/
Chakravarti, I. M., Laha, R. G., & Roy, J. (1967). Handbook of methods of applied
statistics. New York, NY: Wiley.
Champagne, C. M., Baker, N. B., Delany, J. P., Harsha, D. W., & Bray, G. A. (1998).
Assessment of energy intake underreporting by doubly labeled water and
observations on reported nutrient intakes in children. Journal of the American
Dietetic Association, 98(4), 426-433. doi: 10.1016/s0002-8223(98)00097-2
Chandrashekar, J., Hoon, M. A., Ryba, N. J. P., & Zuker, C. S. (2006). The receptors and
cells for mammalian taste. Nature, 444(7117), 288-294.
Chang, W. I., Chung, J. W., Kim, Y. K., Chung, S. C., & Kho, H. S. (2006). The
relationship between phenylthiocarbamide (PTC) and 6-n-propylthiouracil
(PROP) taster status and taste thresholds for sucrose and quinine. Archives of
Oral Biology, 51(5), 427-432. doi: 10.1016/j.archoralbio.2005.10.002
Chaudhari, N., & Roper, S. D. (2010). The cell biology of taste. Journal of Cell Biology,
190(3), 285-296. doi: 10.1083/jcb.201003144

162
Chumlea, W. C., Guo, S. S., Kuczmarski, R. J., Flegal, K. M., Johnson, C. L.,
Heymsfield, S. B., . . . Hubbard, V. S. (2002). Body composition estimates from
NHANES III bioelectrical impedance data. International Journal of
ObesityInternational Journal of Obesity and Related Metabolic Disorders,
26(12), 1596-1609. doi: 10.1038/sj.ijo.0802167
Cicerale, S., Riddell, L. J., & Keast, R. S. (2012). The association between perceived
sweetness intensity and dietary intake in young adults. Journal of Food Science,
77(1), H31-H35. doi: 10.1111/j.1750-3841.2011.02473.x
Coldwell, S. E., Oswald, T. K., & Reed, D. R. (2009). A marker of growth differs
between adolescents with high vs. low sugar preference. Physiology and
Behavior, 96(4-5), 574-580. doi: 10.1016/j.physbeh.2008.12.010
Cole, T. J. (2008). Measuring normal growth and growth variance in infancy and
childhood. In L. L. Birch & W. Dietz (Eds.), Eating behaviors of the young child:
Prenatal and postnatal influences on healthy eating (pp. 17-31). Elk Grove
Village, IL: American Academy of Pediatrics.
Colton, T. (1974). Statistics in medicine. Boston, MA: Little, Brown.
Conneally, P. M., Dumont-Driscoll, M., Huntzinger, R. S., Nance, W. E., & Jackson, C.
E. (1976). Linkage relations of the loci for Kell and phenylthiocarbamide taste
sensitivity. Human Heredity, 26(4), 267-271.

163
Contento, I. R. (2007). Overview of determinants of food choice and dietary change:
Implications for nutrition education. In Nutrition education: Linking research,
theory, and practice. Ontario, Canada: Jones and Barlett.
Contento, I. R. (2008). Nutrition education: Linking research, theory, and practice. Asia
Pacific Journal of Clinical Nutrition, 17(Suppl. 1), 176-179.
Cooke, L., Carnell, S., & Wardle, J. (2006). Food neophobia and mealtime food
consumption in 4-5 year old children. International Journal of Behavioral
Nutrition and physical activity, 3, 14. doi: 10.1186/1479-5868-3-14
Cooke, L., Wardle, J., & Gibson, E. L. (2003). Relationship between parental report of
food neophobia and everyday food consumption in 2-6-year-old children.
Appetite, 41(2), 205-206.
Cooper, R. M., Bilash, I., & Zubek, J. P. (1959). The effect of age on taste sensitivity.
Journal of Gerontology, 14(1), 56-58.
Court, M. (2005). Hardy-Weinberg calculator. Retrieved March 10th, 2015 from
https://view.officeapps.live.com/op/view.aspx?src=http%3A%2F%2Fwww.tufts.e
du%2F~mcourt01%2FDocuments%2FCourt lab-HW calculator.xls
Cowart, B. J., & Beauchamp, G. K. (1990). Early development of taste perception. In
Psychological Basis of Sensory Evaluation (pp. 1-7). London: Elsevier Applied
Science.

164
Crow, J. F. (1999). Hardy, Weinberg and language impediments. Genetics, 152(3), 821-
825.
Crowell, M. D., Murphy, T. B., Levy, R. L., Langer, S. L., Kunin-Batson, A., Seburg, E.
M., . . . Sherwood, N. E. (2015). Eating behaviors and quality of life in
preadolescents at risk for obesity with and without abdominal pain. Journal of
Pediatric Gastroenterology and Nutrition, 60(2), 217-223. doi:
10.1097/mpg.0000000000000585
Cruickshanks, K. J., Schubert, C. R., Snyder, D. J., Bartoshuk, L. M., Huang, G. H.,
Klein, B. E., . . . Moy, G. S. (2009). Measuring taste impairment in epidemiologic
studies: The Beaver Dam Offspring Study. Annals of the New York Academy of
Sciences, 1170, 543-552. doi: 10.1111/j.1749-6632.2009.04103.x
Darlington, A. S., & Wright, C. M. (2006). The influence of temperament on weight gain
in early infancy. Journal of Developmental and Behavioral Pediatrics, 27(4),
329-335.
Defazio, R. A., Dvoryanchikov, G., Maruyama, Y., Kim, J. W., Pereira, E., Roper, S. D.,
& Chaudhari, N. (2006). Separate populations of receptor cells and presynaptic
cells in mouse taste buds. Journal of Neuroscience, 26(15), 3971-3980. doi:
10.1523/JNEUROSCI.0515-06.2006
De Jong, N., Mulder, I., De Graaf, C., & Van Staveren, W. A. (1999). Impaired sensory
functioning in elders: The relation with its potential determinants and nutritional

165
intake. Journals of Gerontology, Series A, Biological Sciences and Medical
Sciences, 54(8), B324-331.
Demerath, E. W., Schubert, C. M., Maynard, L. M., Sun, S. S., Chumlea, W. C., Pickoff,
A., . . . Siervogel, R. M. (2006). Do changes in body mass index percentile reflect
changes in body composition in children? Data from the Fels Longitudinal Study.
Pediatrics, 117(3), e487-e495. doi: 10.1542/peds.2005-0572
Depoortere, I. (2014). Taste receptors of the gut: Emerging roles in health and disease.
Gut, 63(1), 179-190. doi: 10.1136/gutjnl-2013-305112
Desor, J., Maller, O., & Turner, R. (1973). Taste in acceptance of sugars by human
infants. Journal of Comparative and Physiological Psychology, 84, 496-501.
Desor, J. A., & Beauchamp, G. K. (1987). Longitudinal changes in sweet preferences in
humans. Physiology and Behavior, 39(5), 639-641.
Desor, J. A., Greene, L. S., & Maller, O. (1975). Preferences for sweet and salty in 9- to
15-year-old and adult humans. Science, 190(4215), 686-687.
Desor, J. A., Maller, O., & Turner, R. E. (1977). Preference for Sweet in Humans:
Infants, children and adults. In J. Weiffenbach (Ed.), Taste and development: The
genesis of sweet preference.Washington, DC: U.S. Goverment Printing Office.
Despres, J. P., & Lemieux, I. (2006). Abdominal obesity and metabolic syndrome.
Nature, 444(7121), 881-887. doi: 10.1038/nature05488

166
Dietz, W. H. (2004). Overweight in childhood and adolescence. New England Journal of
Medicine, 350(9), 855-857. doi: 10.1056/NEJMp048008
Dietz, W. H., & Gortmaker, S. L. (2001). Preventing obesity in children and adolescents.
Annual Review of Public Health, 22(1), 337-353. doi:
10.1146/annurev.publhealth.22.1.337
Dinehart, M. E., Hayes, J. E., Bartoshuk, L. M., Lanier, S. L., & Duffy, V. B. (2006).
Bitter taste markers explain variability in vegetable sweetness, bitterness, and
intake. Physiology and Behavior, 87(2), 304-313. doi:
10.1016/j.physbeh.2005.10.018
Dominguez, P. R. (2011). The study of postnatal and later development of the taste and
olfactory systems using the human brain mapping approach: An update. Brain
Research Bulletin, 84(2), 118-124. doi: 10.1016/j.brainresbull.2010.12.010
Dovey, T. M., Staples, P. A., Gibson, E. L., & Halford, J. C. (2008). Food neophobia and
“picky/fussy” eating in children: A review. Appetite, 50(2-3), 181-193. doi:
10.1016/j.appet.2007.09.009
Drewnowski, A. (1997). Taste preferences and food intake. Annual Review of Nutrition,
17, 237-253. doi: 10.1146/annurev.nutr.17.1.237
Drewnowski, A. (2000). Sensory control of energy density at different life stages.
Proceedings of the Nutrition Society, 59, 239-244.

167
Drewnowski, A., Kurth, C., Holden-Wiltse, J., & Saari, J. (1992). Food preferences in
human obesity: Carbohydrates versus fats. Appetite, 18(3), 207-221.
Drewnowski, A., Mennella, J. A., Johnson, S. L., & Bellisle, F. (2012). Sweetness and
food preference. Journal of Nutrition, 142(6), 1142S-1148S. doi:
10.3945/jn.111.149575
Drewnowski, A., & Rehm, C. D. (2014). Consumption of added sugars among US
children and adults by food purchase location and food source. American Journal
of Clinical Nutrition. doi: 10.3945/ajcn.114.089458
Egan, J. M., & Margolskee, R. F. (2008). Taste cells of the gut and gastrointestinal
chemosensation. Molecular Interventions, 8(2), 78-81.
Eisenmann, J. C., Heelan, K. A., & Welk, G. J. (2004). Assessing body composition
among 3- to 8-year-old children: Anthropometry, BIA, and DXA. Obesity
Research, 12(10), 1633-1640. doi: 10.1038/oby.2004.203
El-Sohemy, A., Stewart, L., Khataan, N., Fontaine-Bisson, B., Kwong, P., Ozsungur, S.,
& Cornelis, M. C. (2007). Nutrigenomics of taste—impact on food preferences
and food production. Forum of Nutrition, 60, 176-182. doi: 10.1159/0000107194
Eny, K. M., Wolever, T. M., Corey, P. N., & El-Sohemy, A. (2010). Genetic variation in
TAS1R2 (Ile191Val) is associated with consumption of sugars in overweight and
obese individuals in 2 distinct populations. American Journal of Clinical
Nutrition, 92(6), 1501-1510. doi: 10.3945/ajcn.2010.29836

168
Ervin, R. B., Kit, B. K., Carroll, M. D., & Ogden, C. L. (2012). Consumption of added
sugar among U.S. children and adolescents, 2005-2008. NCHS Data Brief, (87),
1-8. doi: 10.3945/an.112.002279
Ervin, R. B., & Ogden, C. L. (2013). Consumption of added sugars among U.S. adults,
2005-2010. NCHS Data Brief (122), 1-8.
Ettinger, L., Duizer, L., & Caldwell, T. (2012). Body fat, sweetness sensitivity, and
preference: Determining the relationship. Journal of the Canadian Dietetic
Association, 73(1), 45-48. doi: 10.3148/73.1.2012.45
Eysenck, H. J. (1990). Genetic and environmental contributions to individual differences:
The three major dimensions of personality. Journal of Personality, 58(1), 245-
261.
Faas, M. M., Melgert, B. N., & De Vos, P. (2010). A Brief Review on How Pregnancy
and Sex Hormones Interfere with Taste and Food Intake. Chemosensory
Perception, 3(1), 51-56. doi: 10.1007/s12078-009-9061-5
Fabian, T. K., Beck, A., Fejerdy, P., Hermann, P., & Fabian, G. (2015). Molecular
mechanisms of taste recognition: Considerations about the role of saliva.
International Journal of Molecular Sciences, 16(3), 5945-5974. doi:
10.3390/ijms16035945

169
Faith, M. S., & Hittner, J. B. (2010). Infant temperament and eating style predict change
in standardized weight status and obesity risk at 6 years of age. International
Journal of Obesity, 34(10), 1515-1523.
Fassino, S., Leombruni, P., Pierò, A., Daga, G. A., Amianto, F., Rovera, G., & Rovera,
G. G. (2002). Temperament and character in obese women with and without
binge eating disorder. Comprehensive Psychiatry, 43(6), 431-437. doi:
10.1053/comp.2002.35906
Fikentscher, R., Roseburg, B., Spinar, H., & Bruchmuller, W. (1977). Loss of taste in the
elderly: Sex differences. Clinical Otolaryngology and Allied Sciences, 2(3), 183-
189.
Finger, T. E., Danilova, V., Barrows, J., Bartel, D. L., Vigers, A. J., Stone, L., . . .
Kinnamon, S. C. (2005). ATP signaling is crucial for communication from taste
buds to gustatory nerves. Science, 310(5753), 1495-1499. doi:
10.1126/science.1118435
Fiorito, L. M., Marini, M., Francis, L. A., Smiciklas-Wright, H., & Birch, L. L. (2009).
Beverage intake of girls at age 5 y predicts adiposity and weight status in
childhood and adolescence. American Journal of Clinical Nutrition, 90(4), 935-
942. doi: 10.3945/ajcn.2009.27623
Fiorito, L. M., Ventura, A. K., Mitchell, D. C., Smiciklas-Wright, H., & Birch, L. L.
(2006). Girls' dairy intake, energy intake, and weight status. Journal of the
American Dietetic Association, 106(11), 1851-1855.

170
Fogel, A., & Blissett, J. (2014). Effects of sucrose detection threshold and weight status
on intake of fruit and vegetables in children. Appetite, 83, 309-316. doi:
10.1016/j.appet.2014.09.003
Forestell, C. A., & Mennella, J. A. (2012). More than just a pretty face. The relationship
between infant's temperament, food acceptance, and mothers' perceptions of their
enjoyment of food. Appetite, 58(3), 1136-1142. doi: 10.1016/j.appet.2012.03.005
Freedman, D. S., Khan, L. K., Serdula, M. K., Ogden, C. L., & Dietz, W. H. (2006).
Racial and ethnic differences in secular trends for childhood BMI, weight, and
height. Obesity (Silver Spring), 14(2), 301-308. doi: 10.1038/oby.2006.39
Freedman, D. S., Ogden, C. L., Flegal, K. M., Khan, L. K., Serdula, M. K., & Dietz, W.
H. (2007). Childhood overweight and family income. Medscape General
Medicine, 9(2), 26.
Freedman, D. S., & Sherry, B. (2009). The validity of BMI as an indicator of body
fatness and risk among children. Pediatrics, 124(Suppl. 1), S23-S34. doi:
10.1542/peds.2008-3586E
Fuller, J. (1974). Single-locus control of saccharin preference in mice. Journal of
Heredity, 65, 33-36.
Fuller, J. L. (1979). The taxonomy of pshychophenes. In J.Royce and L. Mos (Ed.),
Theorical advances in behavior genetics. Alpheen aan den Rijin, Netherlands:
Sijthoff and Noordoff.

171
Fuller, J. L., & Thompson, W. R. (1960). Behavior genetics. New York: John Wiley and
Sons.
Fuller, J. L., & Willmer, R. E. (1973). Behavior genetics. In D. A. Dewsbury, &
Rethlingshafer, DA. (Eds.), Comparative psychology. New York, NY: McGraw-
Hill.
Furquim, T. R., Poli-Frederico, R. C., Maciel, S. M., Gonini-Junior, A., & Walter, L. R.
(2010). Sensitivity to bitter and sweet taste perception in schoolchildren and their
relation to dental caries. Oral Health and Preventive Dentistry, 8(3), 253-259.
Fushan, A. A., Simons, C. T., Slack, J. P., & Drayna, D. (2010). Association between
common variation in genes encoding sweet taste signaling components and
human sucrose perception. Chemical Senses, 35(7), 579-592. doi:
10.1093/chemse/bjq063
Fushan, A. A., Simons, C. T., Slack, J. P., Manichaikul, A., & Drayna, D. (2009). Allelic
polymorphism within the TAS1R3 promoter is associated with human taste
sensitivity to sucrose. Current Biology, 19(15), 1288-1293. doi:
10.1016/j.cub.2009.06.015
Galloway, A. T., Lee, Y., & Birch, L. L. (2003). Predictors and consequences of food
neophobia and pickiness in young girls. Journal of the American Dietetic
Association, 103(6), 692-698.

172
Garcia-Bailo, B., Toguri, C., Eny, K. M., & El-Sohemy, A. (2009). Genetic variation in
taste and its influence on food selection. Omics: A Journal of Integrative Biology,
13(1), 69-80. doi: 10.1089/omi.2008.0031
Gerspach, A. C., Steinert, R. E., Schönenberger, L., Graber-Maier, A., & Beglinger, C.
(2011). The role of the gut sweet taste receptor in regulating GLP-1, PYY, and
CCK release in humans. American Journal Physiology Endocrinology
Metabolism; 301(2): E317-25. doi: 10.1152/ajpendo.00077.2011.
Glanz, K., Basil, M., Maibach, E., Goldberg, J., & Snyder, D. (1998). Why Americans
eat what they do: Taste, nutrition, cost, convenience, and weight control concerns
as influences on food consumption. Journal of the American Dietetic Association,
98(10), 1118-1126. doi: 10.1016/S0002-8223(98)00260-0
Gomez, F. E., Cassis-Nosthas, L., Morales-De-Leon, J. C., & Bourges, H. (2004).
Detection and recognition thresholds to the 4 basic tastes in Mexican patients with
primary Sjogren's syndrome. European Journal of Clinical Nutrition, 58(4), 629-
636. doi: 10.1038/sj.ejcn.1601858
Green, E., Jacobson, A., Haase, L., & Murphy, C. (2013). Can age-related CNS taste
differences be detected as early as middle age? Evidence from fMRI.
Neuroscience, 232:194-203. doi: 10.1016/j.neuroscience.2012.11.027
Griebeler, M. L., Levis, S., Beringer, L. M., Chacra, W., & Gómez-Marín, O. (2011).
Self-reported versus measured height and weight in Hispanic and non-Hispanic

173
menopausal women. Journal of Women's Health, 20(4), 599-604. doi:
10.1089/jwh.2009.1850
Grimm, E. R., & Steinle, N. I. (2011). Genetics of eating behavior: Established and
emerging concepts. Nutrition Reviews, 69(1), 52-60. doi: 10.1111/j.1753-
4887.2010.00361.x
Gross, L. S., Li, L., Ford, E. S., & Liu, S. (2004). Increased consumption of refined
carbohydrates and the epidemic of type 2 diabetes in the United States: An
ecologic assessment. American Journal of Clinical Nutrition, 79(5), 774-779.
Guntsche, Z., Guntsche, E. M., Saravi, F. D., Gonzalez, L. M., Lopez Avellaneda, C.,
Ayub, E., . . . Cestino, L. (2010). Umbilical waist-to-height ratio and trunk fat
mass index (DXA) as markers of central adiposity and insulin resistance in
Argentinean children with a family history of metabolic syndrome. Journal of
Pediatric Endocinology and Metabolism, 23(3), 245-256.
Guo, S. W., & Reed, D. R. (2001). The genetics of phenylthiocarbamide perception.
Annals of Human Biology, 28(2), 111-142.
Guyton, A. C., Hall, J., Hall, J. E. (2006). Guyton and Hall textbook of medical
physiology (11 ed.). Philadelphia, PA: Elsevier Saunders.
Hardy, S. L., Brennand, C. P., & Wyse, B. W. (1981). Taste thresholds of individuals
with diabetes mellitus and of control subjects. Journal of the American Dietetic
Association, 79(3), 286-289.

174
Harris, G. (2008). Development of taste and food preferences in children. Current
Opinion in Clinical Nutrition and Metabolic Care, 11(3), 315-319. doi:
10.1097/MCO.0b013e3282f9e228
Hart, D. L., & Jones, E. W. (2005). Essential genetics: A genomics perspective (6th ed.).
New York, NY: Jones and Barlett.
Haycraft, E., Farrow, C., Meyer, C., Powell, F., & Blissett, J. (2011). Relationships
between temperament and eating behaviours in young children. Appetite, 56(3),
689-692. doi: 10.1016/j.appet.2011.02.005
Hayes, J. E., Bartoshuk, L. M., Kidd, J. R., & Duffy, V. B. (2008). Supertasting and
PROP bitterness depends on more than the TAS2R38 gene. Chemical Senses,
33(3), 255-265. doi: 10.1093/chemse/bjm084
Hermel, J., Schonwetter, S., & Samueloff, S. (1970). Taste sensation and age in man.
Journal of Oral Medicine, 25(2), 39-42.
Herness, M. S., & Gilbertson, T. A. (1999). Cellular mechanisms of taste transduction.
Annual Review of Physiology, 61, 873-900. doi:
10.1146/annurev.physiol.61.1.873
Hong, J. H., Chung, J. W., Kim, Y. K., Chung, S. C., Lee, S. W., & Kho, H. S. (2005).
The relationship between PTC taster status and taste thresholds in young adults.
Oral Surgery, Oral Medicine, Oral Pathology, Oral Radiology, and Endodontics,
99(6), 711-715. doi: 10.1016/j.tripleo.2004.08.004

175
Hoon, M. A., Adler, E., Lindemeier, J., Battey, J. F., Ryba, N. J., & Zuker, C. S. (1999).
Putative mammalian taste receptors: A class of taste-specific GPCRs with distinct
topographic selectivity. Cell, 96(4), 541-551. doi: S0092-8674(00)80658-3
Hoppu, U., Laitinen, K., Jaakkola, J., & Sandell, M. (2015). The hTAS2R38genotype is
associated with sugar and candy consumption in preschool boys. Journal of
Human Nutrition and Dietetics, 28, 45-51. doi: 10.1111/jhn.12249
Hosking, L., Lumsden, S., Lewis, K., Yeo, A., McCarthy, L., Bansal, A., . . . Xu, C. F.
(2004). Detection of genotyping errors by Hardy-Weinberg equilibrium testing.
European Journal of Human Genetics, 12(5), 395-399. doi:
10.1038/sj.ejhg.5201164
Houtkooper, L. B., Going, S. B., Lohman, T. G., Roche, A. F., & Van Loan, M. (1992).
Bioelectrical impedance estimation of fat-free body mass in children and youth: A
cross-validation study. Journal of Applied Physiology (1985). 1992 Jan; 72(1):
366-73.
Hu, F. B., & Malik, V. S. (2010). Sugar-sweetened beverages and risk of obesity and type
2 diabetes: Epidemiologic evidence. Physiology and Behavior, 100(1), 47-54. doi:
10.1016/j.physbeh.2010.01.036
Huang, T., & Hu, F. B. (2015). Gene-environment interactions and obesity: Recent
developments and future directions. BMC Med Genomics, 8(Suppl. 1), S2. doi:
10.1186/1755-8794-8-s1-s2
176
Huang, Y. A., Maruyama, Y., Stimac, R., & Roper, S. D. (2008). Presynaptic (type III)
cells in mouse taste buds sense sour (acid) taste. Journal of Physiology, 586(Pt.
12), 2903-2912. doi: 10.1113/jphysiol.2008.151233
Hummel, T., Erras, A., & Kobal, G. (1997). A test for the screening of taste function.
Rhinology, 35(4), 146-148.
Hummel, T., Landis, B. N., & Hüttenbrink, K.-B. (2011). Smell and taste disorders. GMS
Current Topics in Otorhinolaryngology, Head and Neck Surgery, 10, Doc04. doi:
10.3205/cto000077
Inokuchi, M., Matsuo, N., Takayama, J. I., & Hasegawa, T. (2011). BMI z-score is the
optimal measure of annual adiposity change in elementary school children.
Annals of Human Biology, 38(6), 747-751. doi: 10.3109/03014460.2011.620625
Institute of Medicine. (2002). Dietary reference intakes for energy, carbohydrate, fiber,
fat, fatty acids, cholesterol, protein, and amino acids. Retrieved from
https://www.iom.edu/Reports/2002/Dietary-Reference-Intakes-for-Energy-
Carbohydrate-Fiber-Fat-Fatty-Acids-Cholesterol-Protein-and-Amino-Acids.aspx
James, C. E., Laing, D. G., & Oram, N. (1997). A comparison of the ability of 8-9-year-
old children and adults to detect taste stimuli. Physiology and Behavior, 62(1),
193-197. doi: S0031-9384(97)00030-9
Janssen, I., Katzmarzyk, P. T., Boyce, W. F., Vereecken, C., Mulvihill, C., Roberts, C., . .
. The Health Behaviour in School-Aged Children Obesity Working, G. (2005).

177
Comparison of overweight and obesity prevalence in school-aged youth from 34
countries and their relationships with physical activity and dietary patterns.
Obesity Reviews, 6(2), 123-132. doi: 10.1111/j.1467-789X.2005.00176.x
Janssen, I., Katzmarzyk, P. T., & Ross, R. (2002). Body mass index, waist circumference,
and health risk: Evidence in support of current National Institutes of Health
guidelines. Archives of Internal Medicine, 162(18), 2074-2079.
Jogan, M., & Stocker, A. A. (2014). A new two-alternative forced choice method for the
unbiased characterization of perceptual bias and discriminability. Journal of
Vision, 14(3):20 doi: 10.1167/14.3.20
Johnson, R. K., Appel, L. J., Brands, M., Howard, B. V., Lefevre, M., Lustig, R. H., . . .
Prevention. (2009). Dietary sugars intake and cardiovascular health. a scientific
statement from the American Heart Association. Circulation. 120(11): 1011-2
doi: 10.1161/circulationaha.109.192627
Jung, H. S., Akita, K., & Kim, J. Y. (2004). Spacing patterns on tongue surface-gustatory
papilla. International Journal of Developmental Biology, 48(2-3), 157-161. doi:
10.1387/ijdb.041824hj
Kahn, H. S., Imperatore, G., & Cheng, Y. J. (2005). A population-based comparison of
BMI percentiles and waist-to-height ratio for identifying cardiovascular risk in
youth. Journal of Pediatrics, 146(4), 482-488. doi: 10.1016/j.jpeds.2004.12.028

178
Kakinami, L., Henderson, M., Chiolero, A., Cole, T. J., & Paradis, G. (2014). Identifying
the best body mass index metric to assess adiposity change in children. Archives
of Disease in Childhood. doi: 10.1136/archdischild-2013-305163
Kamath, S., Booth, P., Lad, T. E., Kohrs, M. B., & McGuire, W. P. (1983). Taste
thresholds of patients with cancer of the esophagus. Cancer, 52(2), 386-389.
Katz, D. B., & Sadacca, B. F. (2011). Taste. In Ja, G. (Ed.), Neurobiology of sensation
and reward.Boca Raton, FL: CRC Press.
Keith, M., Mokbel, R., San Emeterio, M., Song, J., & Errett, L. (2010). Evaluation of
taste sensitivity in patients undergoing coronary artery bypass graft surgery.
Journal of the American Dietetic Association, 110(7), 1072-1077. doi:
10.1016/j.jada.2010.04.005
Keller, K. L., Olsen, A., Cravener, T. L., Bloom, R., Chung, W. K., Deng, L., . . .
Meyermann, K. (2014). Bitter taste phenotype and body weight predict children's
selection of sweet and savory foods at a palatable test-meal. Appetite, 77, 113-
121. doi: 10.1016/j.appet.2014.02.019
Keller, K. L., & Tepper, B. J. (2004). Inherited taste sensitivity to 6-n-propylthiouracil in
diet and body weight in children. Obesity Research, 12, 904-912.
Keskitalo, K., Knaapila, A., Kallela, M., Palotie, A., Wessman, M., Sammalisto, S., . . .
Perola, M. (2007). Sweet taste preferences are partly genetically determined:
Identification of a trait locus on chromosome 16. American Journal of Clinical
Nutrition, 86(1), 55-63.

179
Keskitalo, K., Tuorila, H., Spector, T. D., Cherkas, L. F., Knaapila, A., Silventoinen, K.,
& Perola, M. (2007). Same genetic components underlie different measures of
sweet taste preference. American Journal of Clinical Nutrition, 86(6), 1663-1669.
Khoury, M., Beaty, T., & Cohen, B. (1993). Fundamentals of genetic epidemiology. New
York, NY: Oxford University Press.
Khoury, M., Manlhiot, C., & McCrindle, B. W. (2013). Role of the waist/height ratio in
the cardiometabolic risk assessment of children classified by body mass index.
Journal of the American College of Cardiology, 62(8), 742-751. doi:
10.1016/j.jacc.2013.01.026
Kim, J. S., Choi-Kwon, S., Kwon, S. U., & Kwon, J. H. (2009). Taste perception
abnormalities after acute stroke in postmenopausal women. Journal of Clinical
Neuroscience, 16(6), 797-801. doi: 10.1016/j.jocn.2008.08.038
Kim, U.-K., Breslin, P. A. S., Reed, D., & Drayna, D. (2004). Genetics of human taste
perception. Journal of Dental Research, 83(6), 448-453. doi:
10.1177/154405910408300603
Kim, U. K., Jorgenson, E., Coon, H., Leppert, M., Risch, N., & Drayna, D. (2003).
Positional cloning of the human quantitative trait locus underlying taste sensitivity
to phenylthiocarbamide. Science, 299(5610), 1221-1225.
180
Kipnis, V., Subar, A. F., Midthune, D., Freedman, L. S., Ballard-Barbash, R., Troiano, R.
P., . . . Carroll, R. J. (2003). Structure of dietary measurement error: Results of the
OPEN biomarker study. Am J Epidemiol, 158(1), 14-26.
Kirkpatrick, S. I., Subar, A. F., Douglass, D., Zimmerman, T. P., Thompson, F. E., Kahle,
L. L., . . . Potischman, N. (2014). Performance of the Automated Self-
Administered 24-Hour Recall relative to a measure of true intakes and to an
interviewer-administered 24-h recall. American Journal of Clinical Nutrition,
100(1), 233-240. doi: 10.3945/ajcn.114.083238
Kitagawa, M., Kusakabe, Y., Miura, H., Ninomiya, Y., & Hino, A. (2001). Molecular
genetic identification of a candidate receptor gene for sweet taste. Biochemical
and Biophysical Research Communications, 283(1), 236-242. doi:
10.1006/bbrc.2001.4760
Koh, H. K. (2010). A 2020 vision for healthy people. New England Journal of Medicine,
362(18), 1653-1656. doi: 10.1056/NEJMp1001601
Kojima, I., Nakagawa, Y., Ohtsu, Y., Medina, A., & Nagasawa, M. (2014). Sweet taste-
sensing receptors expressed in pancreatic beta-cells: Sweet molecules act as
biased agonists. Endocrinology and Metabolism (Seoul, Korea), 29(1), 12-19. doi:
10.3803/EnM.2014.29.1.12
Kriemler, S., Puder, J., Zahner, L., Roth, R., Braun-Fahrlander, C., & Bedogni, G.
(2009). Cross-validation of bioelectrical impedance analysis for the assessment of
body composition in a representative sample of 6- to 13-year-old children.

181
European Journal of Clinical Nutrition, 63(5), 619-626. doi:
10.1038/ejcn.2008.19
Kuczmarski, R. J., Ogden, C. L., Grummer-Strawn, L. M., Flegal, K. M., Guo, S. S., Wei,
R., . . . Johnson, C. L. (2000). CDC growth charts: United States. Advance Data
(314), 1-27.
Kuczmarski, R. J., Ogden, C. L., Guo, S. S., Grummer-Strawn, L. M., Flegal, K. M., Mei,
Z., . . . Johnson, C. L. (2002). 2000 CDC Growth Charts for the United States:
Methods and development. Vital and Health Statistics, 11(246), 1-190.
Lacey, J. H., Stanley, P. A., Crutchfield, M., & Crisp, A. H. (1977). Sucrose sensitivity in
anorexia nervosa. Journal of Psychosomatic Research, 21(1), 17-21.
Laffitte, A., Neiers, F., & Briand, L. (2014). Functional roles of the sweet taste receptor
in oral and extraoral tissues. Current Opinion in Clinical Nutrition and Metabolic
Care, 17(4), 379-385. doi: 10.1097/mco.0000000000000058
Lassila, V., Sointu, M., Raiha, I., & Lehtonen, A. (1988). Taste thresholds in the elderly.
Proceedings of the Finnish Dental Society, 84(5-6), 305-310.
Lawless, H. (1985). Sensory development in children: Research in taste and olfaction.
Journal of the American Dietetic Association, 85(5), 577-582, 585.
Lawson, W. B., Zeidler, A., & Rubenstein, A. (1979). Taste detection and preferences in
diabetics and their relatives. Psychosomatic Medicine, 41(3), 219-227.
182
Lee, H. A., Lee, W. K., Kong, K. A., Chang, N., Ha, E. H., Hong, Y. S., & Park, H.
(2011). The effect of eating behavior on being overweight or obese during
preadolescence. Journal of Preventive Medicine and Public Health, 44(5), 226-
233. doi: 10.3961/jpmph.2011.44.5.226
Li, C., Ford, E. S., Zhao, G., & Mokdad, A. H. (2009). Prevalence of pre-diabetes and its
association with clustering of cardiometabolic risk factors and hyperinsulinemia
among U.S. adolescents: National Health and Nutrition Examination Survey
2005-2006. Diabetes Care, 32(2), 342-347. doi: 10.2337/dc08-1128
Li, X., Staszewski, L., Xu, H., Durick, K., Zoller, M., & Adler, E. (2002). Human
receptors for sweet and umami taste. Proceedings of the National Academy of
Sciences of the USA, 99(7), 4692-4696. doi: 10.1073/pnas.072090199
Liao, J., & Schultz, P. (2003). Three sweet receptor genes are clustered in human
chromosome 1. Mammalian Genome, 14(5), 291-301.
Liem, D., & Mennella, J. (2002). Sweet and sour preferences during childhood: Role of
early experiences. Developmental Psychobiology, 41(4), 388-395.
Liem, D. G., & Mennella, J. A. (2003). Heightened sour preferences during childhood.
Chemical Senses, 28(2), 173-180.
Lim, S., Zoellner, J. M., Lee, J. M., Burt, B. A., Sandretto, A. M., Sohn, W., . . .
Lepkowski, J. M. (2009). Obesity and sugar-sweetened beverages in African-

183
American preschool children: A longitudinal study. Obesity (Silver Spring), 17(6),
1262-1268. doi: 10.1038/oby.2008.656
Linardakis, M., Sarri, K., Pateraki, M. S., Sbokos, M., & Kafatos, A. (2008). Sugar-added
beverages consumption among kindergarten children of Crete: Effects on
nutritional status and risk of obesity. BioMed Central Public Health, 8, 279. doi:
10.1186/1471-2458-8-279
Linschoten, M. R., Harvey, L. O., Jr., Eller, P. M., & Jafek, B. W. (2001). Fast and
accurate measurement of taste and smell thresholds using a maximum-likelihood
adaptive staircase procedure. Perception and Psychophysics, 63(8), 1330-1347.
Lipchock, S. V., Mennella, J. A., Spielman, A. I., & Reed, D. R. (2013). Human bitter
perception correlates with bitter receptor messenger RNA expression in taste
cells. American Journal of Clinical Nutrition, 98(4), 1136-1143. doi:
10.3945/ajcn.113.066688
Lipchock, S. V., Reed, D. R., & Mennella, J. A. (2011). The gustatory and olfactory
systems during infancy: Implications for development of feeding behaviors in the
high risk neonate. Clinics in Perinatology, 38(4), 627-641. doi:
10.1016/j.clp.2011.08.008
Livingstone, M. B. E., & Black, A. E. (2003). Markers of the validity of reported energy
intake. Journal of Nutrition, 133(3), 895S-920S.

184
Lowe, M. R., & Butryn, M. L. (2007). Hedonic hunger: A new dimension of appetite?
Physiology and Behavior, 91(4), 432-439. doi: 10.1016/j.physbeh.2007.04.006
Lu, K., McDaniel, A. H., Tordoff, M. G., Li, X., Beauchamp, G. K., Bachmanov, A. A., .
. . Reed, D. R. (2005). No relationship between sequence variation in protein
coding regions of the Tas1r3 gene and saccharin preference in rats. Chemical
Senses, 30(3), 231-240.
Lush, I. E., Hornigold, N., King, P., & Stoye, J. P. (1995). The genetics of tasting in
mice. VII. Glycine revisited, and the chromosomal location of Sac and Soa.
Genetics Research, 66(2), 167-174.
Lynch, K. E., Lynch, R., Curhan, G. C., & Brunelli, S. M. (2013). Altered taste
perception and nutritional status among hemodialysis patients. Journal of Renal
Nutrition, 23(4), 288-295 e281. doi: 10.1053/j.jrn.2012.08.009
Maier, A., Chabanet, C., Schaal, B., Leathwood, P., & Issanchou, S. (2007). Food-related
sensory experience from bith through weaning: Contrasted patterns in two nearby
European regions. Appetite, 49(2), 429-440.
Majorana, A., Campus, G., Anedda, S., Piana, G., Bossu, M., Cagetti, M. G., . . .
Polimeni, A. (2012). Development and validation of a taste sensitivity test in a
group of healthy children. European Journal of Paediatric Dentistry, 13(2), 147-
150.

185
Malats, N., & Calafell, F. (2003). Basic glossary on genetic epidemiology. Journal of
Epidemiology and Community Health, 57(7), 480-482. doi: 10.1136/jech.57.7.480
Malcolm, R., O’Neil, P., Hirsch, A., Currey, H., & Moskowitz, G. (1980). Taste hedonics
and thresholds in obesity. International Journal of Obesity, 4(3), 203-212.
Malik, V. S., Popkin, B. M., Bray, G. A., Després, J.-P., & Hu, F. B. (2010). Sugar-
sweetened beverages, obesity, type 2 diabetes mellitus, and cardiovascular disease
risk. Circulation, 121(11), 1356-1364. doi: 10.1161/circulationaha.109.876185
Malik, V. S., Willett, W. C., & Hu, F. B. (2009). Sugar-sweetened beverages and BMI in
children and adolescents: Reanalyses of a meta-analysis. American Journal of
Clinical Nutrition, 89(1), 438-439. doi: 10.3945/ajcn.2008.26980
Maller, O., & Desor, J. (1973). Effect of taste on ingestion by human newborns. In J.
Bosman (Ed.), Symposium on oral sensation and perception (pp. 279-291).
Bethesda, MD: National Institutes of Health.
Margolskee, R. F. (2002). Molecular mechanisms of bitter and sweet taste transduction.
Journal of Biological Chemistry, 277(1), 1-4.
Margolskee, R. F., Dyer, J., Kokrashvili, Z., Salmon, K. S., Ilegems, E., Daly, K., . . .
Shirazi-Beechey, S. P. (2007). T1R3 and gustducin in gut sense sugars to regulate
expression of Na+-glucose cotransporter 1. Proceedings of the National Academy
of Sciences of the USA, 104(38), 15075-15080.

186
Mattes, R. D., Cowart, B. J., Schiavo, M. A., Arnold, C., Garrison, B., Kare, M. R., &
Lowry, L. D. (1990). Dietary evaluation of patients with smell and/or taste
disorders. American Journal of Clinical Nutrition, 51(2), 233-240.
Max, M., Shanker, Y., Huang, L., Rong, M., Liu, Z., Campagne, F., . . . Margolskee, R.
(2001). Tas1r3, encoding a new candidate taste receptor, is allelic to the sweet
responsiveness locus Sac. Nature Genetics, 28(1), 58-63.
Maxson, S. (2002). Behavioral Genetics. In Gallagher, M. N. R. J. (Ed.), Handbook of
psychology: Biological review. New York, NY: Wiley.
McCarthy, H. D., & Ashwell, M. (2006). A study of central fatness using waist-to-height
ratios in UK children and adolescents over two decades supports the simple
message—“keep your waist circumference to less than half your height.”
International Journal of Obesity, 30(6), 988-992. doi: 10.1038/sj.ijo.0803226
McCaughey, S. A. (2008). The taste of sugars. Neuroscience and Biobehavioral Reviews,
32(5), 1024-1043. doi: 10.1016/j.neubiorev.2008.04.002
McDonald, J. H. (2014). Handbook of biological statistics. Baltimore, MD: Sparky
House.
McLaughlin, S. K., McKinnon, P. J., & Margolskee, R. F. (1992). Gustducin is a taste-
cell-specific G protein closely related to the transducins. Nature, 357(6379), 563-
569. doi: 10.1038/357563a0

187
Mei, Z., Grummer-Strawn, L. M., Pietrobelli, A., Goulding, A., Goran, M. I., & Dietz,
W. H. (2002). Validity of body mass index compared with other body-
composition screening indexes for the assessment of body fatness in children and
adolescents. American Journal of Clinical Nutrition, 75(6), 978-985.
Meilgaard, M., Civille, G. V., & Carr, B. T. (2000). Sensory evaluation techniques. Boca
Raton, FL: CRC Press.
Mela, D. J. (2001). Why do we like what we like? Journal of the Science of Food and
Agriculture, 81(1), 10-16. doi: 10.1002/1097-0010(20010101)81:1<10::AID-
JSFA779>3.0.CO;2-D
Mennella, J., Pepino, M., & Reed, D. (2005). Genetic and environmental determinants of
bitter perception and sweet preferences. Pediatrics, 115(2), e216-222.
Mennella, J. A. (1995). Mother's milk: A medium for early flavor experiences. Journal of
Human Lactation, 11(1), 39-45.
Mennella, J. A. (2008). The sweet taste of childhood. In: A. I. Basbaum, A. Kaneko, C.
M. Shephers, & G. Westheimer (Eds.). Olfaction and taste: Vol. 4. The senses: A
comprehensive reference (pp. 183-188). San Diego, CA: Academic Press.
Mennella, J. A. (2014). Ontogeny of taste preferences: Basic biology and implications for
health. American Journal of Clinical Nutrition, 99(3), 704S-711S. doi:
10.3945/ajcn.113.067694

188
Mennella, J. A., & Beauchamp, G. K. (1996). The early development of human flavor
preferences. In E.D. Capaldi, Why we eat what we eat: The psychology of eating
(pp. 83-112). Washington, DC: American Psychological Association
Mennella, J. A., & Beauchamp, G. K. (1996). The human infants' responses to vanilla
flavors in human milk and formula. Infant Behavior and Development, 19, 13-19.
Mennella, J. A., & Beauchamp, G. K. (1998). The infant’s response to scented toys:
Effects of exposure. Chemical Senses, 23, 11-17.
Mennella, J. A., & Beauchamp, G. K. (2005). Understanding the origin of flavor
preferences. Chemical Senses, 30(Suppl. 1), i242-243.
Mennella, J. A., Finkbeiner, S., & Reed, D. R. (2012). The proof is in the pudding:
Children prefer lower fat but higher sugar than do mothers. International Journal
of Obesity (Lond), 36(10), 1285-1291. doi: 10.1038/ijo.2012.51
Mennella, J. A., Finkbeiner, S., Lipchock, S. V., Hwang, L. D., & Reed, D. R. (2014).
Preferences for Salty and Sweet Tastes Are Elevated and Related to Each Other
During Childhood. PLoS ONE, 9(3), e92201. doi: 10.1371/journal.pone.0092201
Mennella, J. A., Forestell, C. A., Morgan, L. K., & Beauchamp, G. K. (2009). Early milk
feeding influences taste acceptance and liking during infancy. American Journal
of Clinical Nutrition, 90(3 Suppl.), 780S-788S. doi: 10.3945/ajcn.2009.27462O
Mennella, J. A., Jagnow, C. P., & Beauchamp, G. K. (2001). Prenatal and postnatal flavor
learning by human infants. Pediatrics, 107(6), E88.
189
Mennella, J. A., Johnson, A., & Beauchamp, G. K. (1995). Garlic ingestion by pregnant
women alters the odor of amniotic fluid. Chemical Senses, 20(2), 207-209.
Mennella, J. A., Lukasewycz, L. D., Griffith, J. W., & Beauchamp, G. K. (2011).
Evaluation of the Monell Forced-Choice, Paired-Comparison Tracking Procedure
for determining sweet taste preferences across the lifespan. Chemical Senses.
36(4): 345-55
Mennella, J. A., Pepino, M. Y., Duke, F. F., & Reed, D. R. (2010). Age modifies the
genotype-phenotype relationship for the bitter receptor TAS2R38. BMC Genetics,
11, 60. doi: 10.1186/1471-2156-11-60
Mennella, J. A., Pepino, M. Y., Lehmann-Castor, S. M., & Yourshaw, L. M. (2010).
Sweet preferences and analgesia during childhood: Effects of family history of
alcoholism and depression. Addiction, 105(4), 666-675. doi: 10.1111/j.1360-
0443.2009.02865.x
Mennella, J. A., Pepino, M. Y., & Reed, D. R. (2005). Genetic and environmental
determinants of bitter perception and sweet preferences. Pediatrics, 115(2), e216-
222. doi: 10.1542/peds.2004-1582
Mennella, J. A., Reed, D. R., Mathew, P. S., Roberts, K. M., & Mansfield, C. J. (2014).
"A spoonful of sugar helps the medicine go down ": Bitter masking by sucrose
among children and adults. Chemical Senses. doi: 10.1093/chemse/bju053

190
Mennella, J. A., Reed, D. R., Roberts, K. M., Mathew, P. S., & Mansfield, C. J. (2014).
Age-related differences in bitter taste and efficacy of bitter blockers. PLoS ONE,
9(7), e103107. doi: 10.1371/journal.pone.0103107
Mennella, J. A., Spector, A. C., Reed, D. R., & Coldwell, S. E. (2013). The bad taste of
medicines: Overview of basic research on bitter taste. Clinical Therapeutics,
35(8), 1225-1246. doi: 10.1016/j.clinthera.2013.06.007
Miller, I., & Reedy, F. (1990). Variations in human taste bud density and taste intensity
perception. Physiology and Behavior, 47(6), 1213-1219.
Miller, I. J. (1995). Anatomy of the peripheral taste system. New York, NY: Dekker.
Ming, D., Ruiz-Avila, L., & Margolskee, R. F. (1998). Characterization and
solubilization of bitter-responsive receptors that couple to gustducin. Proceedings
of the National Academy of Sciences of the USA, 95(15), 8933-8938. doi:
10.1073/pnas.95.15.8933
Mojet, J., Christ-Hazelhof, E., & Heidema, J. (2001). Taste perception with age: Generic
or specific losses in threshold sensitivity to the five basic tastes? Chemical Senses,
26(7), 845-860.
Mojet, J., Christ-Hazelhof, E., & Heidema, J. (2005). Taste perception with age:
Pleasantness and its relationships with threshold sensitivity and supra-threshold
intensity of five taste qualities. Food Quality and Preference, 16(5), 413-423. doi:
10.1016/j.foodqual.2004.08.001

191
Mojet, J., Heidema, J., & Christ-Hazelhof, E. (2003). Taste perception with age: Generic
or specific losses in supra-threshold intensities of five taste qualities? Chemical
Senses, 28(5), 397-413.
Mokha, J. S., Srinivasan, S. R., Dasmahapatra, P., Fernandez, C., Chen, W., Xu, J., &
Berenson, G. S. (2010). Utility of waist-to-height ratio in assessing the status of
central obesity and related cardiometabolic risk profile among normal weight and
overweight/obese children: The Bogalusa Heart Study. BioMed Central
Pediatrics, 10, 73. doi: 10.1186/1471-2431-10-73.
Montmayeur, J., Liberles, S., Matsunami, H., & Buck, L. (2001). A candidate taste
receptor gene near a sweet taste locus. Nat Neurosci, 4(5), 492-498.
Moore, L. M., Nielsen, C. R., & Mistretta, C. M. (1982). Sucrose taste thresholds: Age-
related differences. Journal of Gerontology, 37(1), 64-69.
Moreno, L. A., Pineda, I., Rodriguez, G., Fleta, J., Sarria, A., & Bueno, M. (2002). Waist
circumference for the screening of the metabolic syndrome in children. Acta
Pædiatrica, 91(12), 1307-1312. doi: 10.1111/j.1651-2227.2002.tb02825.x
Moshfegh, A. J., Rhodes, D. G., Baer, D. J., Murayi, T., Clemens, J. C., Rumpler, W. V.,
. . . Cleveland, L. E. (2008). The US Department of Agriculture Automated
Multiple-Pass Method reduces bias in the collection of energy intakes. American
Journal of Clinical Nutrition, 88(2), 324-332.

192
Moura, R. G. F., Cunha, D. A., Caldas, A. S. C., & Da Silva, H. J. (2015). Quantitative
evaluation of taste in childhood populations: A systematic review. Brazilian
Journal of Otorhinolaryngology, 81(1), 97-106. doi: 10.1016/j.bjorl.2014.04.002
Murphy, C. (1985). Cognitive and chemosensory influences on age-related changes in the
ability to identify blended foods. Journal of Gerontology, 40(1), 47-52.
Must, A., & Anderson, S. E. (2006). Body mass index in children and adolescents:
Considerations for population-based applications. International Journal of
Obesity, 30(4), 590-594.
Nagai, M., Matsumoto, S., Endo, J., Sakamoto, R., & Wada, M. (2015). Sweet taste
threshold for sucrose inversely correlates with depression symptoms in female
college students in the luteal phase. Physiology and Behavior, 141, 92-96. doi:
10.1016/j.physbeh.2015.01.003
Nakagawa, Y., Nagasawa, M., Yamada, S., Hara, A., Mogami, H., Nikolaev, V. O., . . .
Kojima, I. (2009). Sweet taste receptor expressed in pancreatic beta-cells activates
the calcium and cyclic AMP signaling systems and stimulates insulin secretion.
PLoS ONE, 4(4), e5106. doi: 10.1371/journal.pone.0005106
Nakamura, Y., Sanematsu, K., Ohta, R., Shirosaki, S., Koyano, K., Nonaka, K., . . .
Ninomiya, Y. (2008). Diurnal variation of human sweet taste recognition
thresholds is correlated with plasma leptin levels. Diabetes, 57(10), 2661-2665.
doi: 10.2337/db07-1103

193
Nasser, J. (2001). Taste, food intake and obesity. Obesity Reviews, 2(4), 213-218.
National Cancer Institute. (n.d.) ASA24TM Automated Self-Administered 24-Hour
Recall: ASA24TM-Kids-2014 and ASA24TM-Kids-2012. Retrieved from
http://appliedresearch.cancer.gov/asa24/respondent/childrens.html
National Center for Biotechnology Information. (2005). Submission and Assignment of
Submitted SNP(ss)/RefSNP(rs) Numbers. Retrieved from
http://www.ncbi.nlm.nih.gov/books/NBK44391/
Nelson, G., Chandrashekar, J., Hoon, M. A., Feng, L., Zhao, G., Ryba, N. J., & Zuker, C.
S. (2002). An amino-acid taste receptor. Nature, 416(6877), 199-202. doi:
10.1038/nature726
Nelson, G., Hoon, M., Chandrashekar, J., Zhang, Y., Ryba, N., & Zuker, C. (2001).
Mammalian sweet taste receptors. Cell, 106(3), 381-390.
Nicklaus, S., Boggio, V., & Issanchou, S. (2005). Les perceptions gustatives chez
l’enfant [Gustatory perceptions in children]. Archives de Pédiatrie, 12(5), 579-
584. doi: 10.1016/j.arcped.2005.01.027
Nilsson, B., Holm, A.-K., & Sjostrom, R. (1982). Taste thresholds, preferences for sweet
taste and dental caries in 15-year-old children. A pilot study. Swedish Dental
Journal, 6, 21-27.

194
Ninomiya, Y., Tanimukai, T., Yoshida, S., & Funakoshi, M. (1991). Gustatory neural
responses in preweanling mice. Physiology and Behavior, 49(5), 913-918. doi:
10.1016/0031-9384(91)90203-Z
Northcutt, R. G. (2004). Taste buds: Development and evolution. Brain, Behavior and
Evolution, 64(3), 198-206. doi: 10.1159/000079747
Ogden, C. L., Carroll, M. D., Kit, B. K., & Flegal, K. M. (2014). Prevalence of childhood
and adult obesity in the United States, 2011-2012. Journal of the American
Medical Association, 311(8), 806-814. doi: 10.1001/jama.2014.732
Okasora, K., Takaya, R., Tokuda, M., Fukunaga, Y., Oguni, T., Tanaka, H., . . . Tamai,
H. (1999). Comparison of bioelectrical impedance analysis and dual energy X-ray
absorptiometry for assessment of body composition in children. Pediatrics
International, 41(2), 121-125.
Ottman, R. (1996). Gene-environment interaction: Definitions and study designs.
Preventive Medicine, 25(6), 764-770.
Overberg, J., Hummel, T., Krude, H., & Wiegand, S. (2012). Differences in taste
sensitivity between obese and non-obese children and adolescents. Archives of
Disease in Childhood, 97(12), 1048-1052. doi: 10.1136/archdischild-2011-
301189.
Panek-Scarborough, L. M., Dewey, A. M., & Temple, J. L. (2012). Sensation and
perception of sucrose and fat stimuli predict the reinforcing value of food.

195
Physiology and Behavior, 105(5), 1242-1249. doi:
10.1016/j.physbeh.2012.01.001
Parikh, R. M., & Mohan, V. (2012). Changing definitions of metabolic syndrome. Indian
Journal of Endocrinology and Metabolism, 16(1), 7-12. doi: 10.4103/2230-
8210.91175
Park, D. C., Yeo, J. H., Ryu, I. Y., Kim, S. H., Jung, J., & Yeo, S. G. (2015). Differences
in taste detection thresholds between normal-weight and obese young adults. Acta
Oto-laryngologica, 135(5), 478-483. doi: 10.3109/00016489.2014.975370
Park, Y. S., & Kim, J. S. (2012). Association between waist-to-height ratio and metabolic
risk factors in Korean adults with normal body mass index and waist
circumference. Tohoku Journal of Experimental Medicine, 228(1), 1-8.
Pasquet, P., Frelut, M. L., Simmen, B., Hladik, C. M., & Monneuse, M. O. (2007). Taste
perception in massively obese and in non-obese adolescents. International
Journal of Pediatric Obesity, 2(4), 242-248. doi: 10.1080/17477160701440521
Pearson, H. (2006). Genetics: What is a gene? Nature, 441(7092), 398-401.
Pepino, M., & Mennella, J. (2005). Factors contributing to individual differences in
sucrose preference. Chemical Senses, 30(Suppl. 1(i3)), 19-20.
Pepino, M. Y., Finkbeiner, S., Beauchamp, G. K., & Mennella, J. A. (2010). Obese
women have lower monosodium glutamate taste sensitivity and prefer higher

196
concentrations than do normal-weight women. Obesity, 18(5), 959-965. doi:
10.1038/oby.2009.493
Pepino, M. Y., & Mennella, J. A. (2005). Sucrose-induced analgesia is related to sweet
preferences in children but not adults. Pain, 119(1-3), 210-218.
Pepino, M. Y., & Mennella, J. A. (2006). Children's liking of sweet tastes and its
biological basis. In W. J. Spillane (Ed.), Optimising sweet taste in foods. Boca
Raton, FL: Woodhead.
Pepino, M. Y., & Mennella, J. A. (2007). Effects of cigarette smoking and family history
of alcoholism on sweet taste perception and food cravings in women. Alcoholism,
Clinical and Experimental Research, 31(11), 1891-1899.
Pepino, M. Y., & Mennella, J. A. (2008). Effects of breast pumping on the
pharmacokinetics and pharmacodynamics of ethanol during lactation. Clinical
Pharmacology and Therapeutics, 84, 710-714.
Pepino, M. Y., & Mennella, J. A. (2012). Habituation to the pleasure elicited by
sweetness in lean and obese women. Appetite, 58(3), 800-805. doi:
10.1016/j.appet.2012.01.026
Pew Charitable Trust. (2011). A city transformed: The racial and ethnic changes in
Philadelphia over the last 20 years. Retrieved from
http://www.pewtrusts.org/uploadedFiles/wwwpewtrustsorg/Reports/Philadelphia_
Research_Initiative/Philadelphia-Population-Ethnic-Changes.pdf

197
Pew Charitable Trust. (2013). Philadelphia 2013: The State of the City.
Philadelphia.Author. Retrieved from
http://www.pewtrusts.org/~/media/legacy/uploadedfiles/wwwpewtrustsorg/reports
/philadelphia_research_initiative/PhiladelphiaCityStatisticspdf.pdf
Pliner, P. (1994). Development of measures of food neophobia in children. Appetite,
23(2), 147-163. doi: 10.1006/appe.1994.1043
Pliner, P., & Hobden, K. (1992). Development of a scale to measure the trait of food
neophobia in humans. Appetite, 19, 105-120.
Pliner, P., & Loewen, E. R. (1997). Temperament and food neophobia in children and
their mothers. Appetite, 28(3), 239-254.
Posner, M. I., Rothbart, M. K., Sheese, B. E., & Voelker, P. (2012). Control networks and
neuromodulators of early development. Developmental Psychology, 48(3), 827-
835. doi: 10.1037/a0025530
Powell-Young, Y. M. (2012). The validity of self-report weight and height as a surrogate
method for direct measurement. Applied Nursing Research, 25(1), 25-30. doi:
10.1016/j.apnr.2010.06.001
Pribitkin, E., Rosenthal, M. D., & Cowart, B. J. (2003). Prevalence and causes of severe
taste loss in a chemosensory clinic population. Annals of Otology, Rhinology, and
Laryngology, 112(11), 971-978.

198
Pronin, A. N., Xu, H., Tang, H., Zhang, L., Li, Q., & Li, X. (2007). Specific alleles of
bitter receptor genes influence human sensitivity to the bitterness of aloin and
saccharin. Current Biology, 17(16), 1403-1408. doi: 10.1016/j.cub.2007.07.046
Pulkki-Raback, L., Elovainio, M., Kivimaki, M., Raitakari, O. T., & Keltikangas-
Jarvinen, L. (2005). Temperament in childhood predicts body mass in adulthood:
The Cardiovascular Risk in Young Finns Study. Health Psychology, 24(3), 307-
315. doi: 10.1037/0278-6133.24.3.307
Purves, D., Fitzpatrick, D., Katz, L. C., Lamantia, A-S., McNamara, J. O., Williams, M.
S. (1997). Neuroscience. Sunderland, MA: Sinaur.
Qi, L., & Cho, Y. A. (2008). Gene-environment interaction and obesity. Nutrition
Reviews, 66(12), 684-694. doi: 10.1111/j.1753-4887.2008.00128.x
Reed, D., & McDaniel, A. (2006). The human sweet tooth. BioMed Central Oral Health,
6(1), 1-13. doi: 10.1186/1472-6831-6-S1-S17
Reed, D. R., Nanthakumar, E., North, M., Bell, C., Bartoshuk, L. M., & Price, R. A.
(1999). Localization of a gene for bitter-taste perception to human chromosome
5p15. American Journal of Human Genetics, 64(5), 1478-1480. doi:
10.1086/302367
Reed, D. R., Tanaka, T., & McDaniel, A. H. (2006). Diverse tastes: Genetics of sweet
and bitter perception. Physiology and Behavior, 88(3), 215-226.
199
Richter, C. P., & Campbell, K. H. (1940). Sucrose taste thresholds of rats and humans.
American Journal of Physiology, 128, 291-297.
Romanov, R. A., Rogachevskaja, O. A., Bystrova, M. F., Jiang, P., Margolskee, R. F., &
Kolesnikov, S. S. (2007). Afferent neurotransmission mediated by hemichannels
in mammalian taste cells. EMBO Journal, 26(3), 657-667. doi:
10.1038/sj.emboj.7601526
Romero-Corral, A., Somers, V. K., Sierra-Johnson, J., Thomas, R. J., Bailey, K. R.,
Collazo-Clavell, M. L., . . . Lopez-Jimenez, F. (2008). Accuracy of body mass
index to diagnose obesity in the US adult population. International Journal of
Obesity, 32(6), 959-966. doi: 10.1038/ijo.2008.11
Roper, S. D. (2006). Cell communication in taste buds. Cellular and Molecular Life
Sciences, 63(13), 1494-1500. doi: 10.1007/s00018-006-6112-9
Roper, S. D. (2007). Signal transduction and information processing in mammalian taste
buds. Pflügers Archiv: European Journal of Physiology, 454(5), 759-776. doi:
10.1007/s00424-007-0247-x
Rosner, B. A. (2006). Fundamentals of biostatistics (6th ed.). Boston, MA: Thompson
Brooks/Cole.
Ryckman, K., & Williams, S. M. (2008). Calculation and use of the Hardy-Weinberg
model in association studies. Current Protocols in Human Genetics, Chapter 1,
Unit 1 18. doi: 10.1002/0471142905.hg0118s57

200
Salbe, A. D., Delparigi, A., Pratley, R. E., Drewnowski, A., & Tataranni, P. A. (2004).
Taste preferences and body weight changes in an obesity-prone population.
American Journal of Clinical Nutrition, 79(3), 372-378.
Savva, S. C., Lamnisos, D., & Kafatos, A. G. (2013). Predicting cardiometabolic risk:
Waist-to-height ratio or BMI. A meta-analysis. Diabetes, Metabolic Syndrome
and Obesity: Targets and Therapy., 6, 403-419. doi: 10.2147/dmso.s34220
Segovia, C., Hutchinson, I., Laing, D. G., & Jinks, A. L. (2002). A Quantitative Study of
Fungiform Papillae and Taste Pore Density in Adults and Children. Brain Res
Dev Brain Res, 138(2), 135-146.
Schaal, B., Marlier, L., & Soussignan, R. (2000). Human foetuses learn odours from their
pregnant mother's diet. Chemical Senses, 25(6), 729-737.
Schiffman, S., Graham, B., Sattely-Miller, E., & Peterson-Dancy, M. (2000). Elevated
and sustained desire for sweet taste in African-Americans: A potential factor in
the development of obesity. Nutrition, 16(10), 886-893.
Schiffman, S. S. (1983a). Taste and smell in disease (first of two parts). New England
Journal of Medicine, 308(21), 1275-1279. doi: 10.1056/nejm198305263082107
Schiffman, S. S. (1983b). Taste and smell in disease (second of two parts). New England
Journal of Medicine, 308(22), 1337-1343. doi: 10.1056/nejm198306023082207

201
Schwartz, C., Issanchou, S., & Nicklaus, S. (2009). Developmental changes in the
acceptance of the five basic tastes in the first year of life. British Journal of
Nutrition, 102(9), 1375-1385. doi: 10.1017/s0007114509990286
Sclafani, A., & Ackroff, K. (2015). Flavor preference conditioning by different sugars in
sweet ageusic Trpm5 knockout mice. Physiology and Behavior, 140, 156-163.
doi: 10.1016/j.physbeh.2014.12.027
Simon, S. A., & Nicolelis, M. A. (2002). Methods in chemosensory research. Boca
Raton, FL: CRC Press.
Skinner, J. D., Carruth, B. R., Wendy, B., & Ziegler, P. J. (2002). Children’s food
preferences: A longitudinal analysis. Journal of the American Dietetic
Association, 102, 1638-1646.
Small, D. M. (2012). Flavor is in the brain. Physiology and Behavior, 107(4), 540-552.
doi: 10.1016/j.physbeh.2012.04.011
Smith, B. A., & Blass, E. M. (1996). Taste-mediated calming in premature, preterm, and
full-term human infants. Developmental Psychology, 32(6), 1084-1089. doi:
10.1037/0012-1649.32.6.1084
Snyder, D. J., Prescott, J., & Bartoshuk, L. M. (2006). Modern psychophysics and the
assessment of human oral sensation. Advances in Otorhinolaryngology, 63, 221-
241. doi: 10.1159/000093762

202
Speakman, J. R. (2004). Obesity: The integrated roles of environment and genetics.
Journal of Nutrition, 134(8), 2090S-2105S.
Srivastava, S., Donaldson, L. F., Rai, D., Melichar, J. K., & Potokar, J. (2013). Single
bright light exposure decreases sweet taste threshold in healthy volunteers.
Journal of Psychopharmacology, 27(10), 921-929. doi:
10.1177/0269881113499206
Stein, N., Laing, D., & Hutchinson, I. (1994). Topographical differences in sweetness
sensitivity in the peripheral gustatory system of adults and children. Brain
Research: Developmental Brain Research, 82(1-2), 286-292.
Steiner, J. E. (1979). Human facial expressions in response to taste and smell stimulation.
Advances in Childhood Development and Behavior, 13, 257-295.
Stevens, S. S. (1969). Sensory scales of taste intensity. Perception and Psychophysics,
6(5), 302-308. doi: 10.3758/bf03210101
Stewart-Knox, B. J., Simpson, E. E., Parr, H., Rae, G., Polito, A., Intorre, F., . . . Strain, J.
J. (2005). Zinc status and taste acuity in older Europeans: The ZENITH study.
European Journal of Clinical Nutrition, 59(Suppl. 2), S31-36. doi:
10.1038/sj.ejcn.1602295
Stone, L. M., Barrows, J., Finger, T. E., & Kinnamon, S. C. (2007). Expression of T1Rs
and gustducin in palatal taste buds of mice. Chemical Senses, 32(3), 255-262. doi:
10.1093/chemse/bjl053

203
Strachan, T., & Read, A. (2010). Human molecular genetics. New York, NY: Garland
Science.
Sun, G., French, C. R., Martin, G. R., Younghusband, B., Green, R. C., Xie, Y.-G., . . .
Zhang, H. (2005). Comparison of multifrequency bioelectrical impedance
analysis with dual-energy X-ray absorptiometry for assessment of percentage
body fat in a large, healthy population. American Journal of Clinical Nutrition,
81(1), 74-78.
Talavera, K., Ninomiya, Y., Winkel, C., Voets, T., & Nilius, B. (2007). Influence of
temperature on taste perception. Cellular and Molecular Life Sciences, 64(4),
377-381. doi: 10.1007/s00018-006-6384-0
Talma, H., Chinapaw, M. J., Bakker, B., Hirasing, R. A., Terwee, C. B., & Altenburg, T.
M. (2013). Bioelectrical impedance analysis to estimate body composition in
children and adolescents: A systematic review and evidence appraisal of validity,
responsiveness, reliability and measurement error. Obesity Reviews, 14(11), 895-
905. doi: 10.1111/obr.12061
Taruno, A., Vingtdeux, V., Ohmoto, M., Ma, Z., Dvoryanchikov, G., Li, A., . . . Foskett,
J. K. (2013). CALHM1 ion channel mediates purinergic neurotransmission of
sweet, bitter and umami tastes. Nature, 495(7440), 223-226. doi:
10.1038/nature11906

204
Tatzer, E., Schubert, M. T., Timischl, W., & Simbruner, G. (1985). Discrimination of
taste and preference for sweet in premature babies. Early Human Development,
12(1), 23-30.
Taylor, R. W., Jones, I. E., Williams, S. M., & Goulding, A. (2000). Evaluation of waist
circumference, waist-to-hip ratio, and the conicity index as screening tools for
high trunk fat mass, as measured by dual-energy X-ray absorptiometry, in
children aged 3–19 y. American Journal of Clinical Nutrition, 72(2), 490-495.
Teo, Y. Y., Fry, A. E., Clark, T. G., Tai, E. S., & Seielstad, M. (2007). On the Usage of
HWE for Identifying Genotyping Errors. Annals of Human Genetics, 71(5), 701-
703. doi: 10.1111/j.1469-1809.2007.00356.x
Than, T., Delay, E., & Maier, M. (1994). Sucrose threshold variation during the
menstrual cycle. Physiology and Behavior, 56(2), 237-239.
Thomas, D. (2010). Gene--environment-wide association studies: Emerging approaches.
Nature Reviews: Genetics, 11(4), 259-272. doi: 10.1038/nrg2764
Thomson, R., Brinkworth, G. D., Buckley, J. D., Noakes, M., & Clifton, P. M. (2007).
Good agreement between bioelectrical impedance and dual-energy X-ray
absorptiometry for estimating changes in body composition during weight loss in
overweight young women. Clinical Nutrition, 26(6), 771-777. doi:
10.1016/j.clnu.2007.08.003
205
Timpson, N. J., Heron, J., Day, I. N., Ring, S. M., Bartoshuk, L. M., Horwood, J.,
Davey-Smith, G. (2007). Refining associations between TAS2R38 diplotypes and
the 6-n-propylthiouracil (PROP) taste test: Findings from the Avon Longitudinal
Study of Parents and Children. BioMed Central Genetics, 8, 51. doi:
10.1186/1471-2156-8-51
Trost, S. G., Kerr, L. M., Ward, D. S., & Pate, R. R. (2001). Physical activity and
determinants of physical activity in obese and non-obese children. International
Journal of Obesity and Related Metabolic Disorders, 25(6), 822-829. doi:
10.1038/sj.ijo.0801621
U.S. Department of Agriculture. (2010). Dietary guidelines for Americans. Retreieved
from http://www.health.gov/dietaryguidelines/
U.S. Department of Health and Human Services. (2013). Healthy People 2020. Healthy
People 2020. Retrieved August 12, 2014, from
http://www.healthypeople.gov/2020/topicsobjectives2020/default.aspx
Venkatakrishnan, A. J., Deupi, X., Lebon, G., Tate, C. G., Schertler, G. F., & Babu, M.
M. (2013). Molecular signatures of G-protein-coupled receptors. Nature,
494(7436), 185-194. doi: 10.1038/nature11896
Ventura, A. K., & Mennella, J. A. (2011). Innate and learned preferences for sweet taste
during childhood. Current Opinion in Clinical Nutrition and Metabolic Care,
14(4), 379-384. doi: 10.1097/MCO.0b013e328346df65

206
Visser, J., Kroeze, J. H., Kamps, W. A., & Bijleveld, C. M. (2000). Testing taste
sensitivity and aversion in very young children: Development of a procedure.
Appetite, 34(2), 169-176.
Wang, C.-Y., Liu, M.-H., & Chen, Y.-C. (2010). Intrarater reliability and the value of real
change for waist and hip circumference measures by a novice rater. Perceptual
and Motor Skills, 110(3C), 1053-1058. doi: 10.2466/pms.110.C.1053-1058
Wang, J. (2014). Consumption of added sugars and development of metabolic syndrome
components among a sample of youth at risk of obesity. Applied Physiology,
Nutrition, and Metabolism, 39(4), 512. doi: 10.1139/apnm-2013-0456
Wardle, J., Herrera, M. L., Cooke, L., & Gibson, E. L. (2003). Modifying children's food
preferences: The effects of exposure and reward on acceptance of an unfamiliar
vegetable. European Journal of Clinical Nutrition, 57(2), 341-348.
Wasalathanthri, S., Hettiarachchi, P., & Prathapan, S. (2014). Sweet taste sensitivity in
pre-diabetics, diabetics and normoglycemic controls: A comparative cross
sectional study. BioMed Central Endocrine Disorders, 14, 67. doi: 10.1186/1472-
6823-14-67
Weiffenbach, J. M., & Bartoshuk, L. M. (1992). Taste and smell. Clinics in Geriatric
Medicine, 8(3), 543-555.
Weiffenbach, J. M., Baum, B. J., & Burghauser, R. (1982). Taste thresholds: Quality
specific variation with human aging. Journal of Gerontology, 37(3), 372-377.

207
Welsh, D., Davis, C., & Shaw, A. (1993). USDA’s food guide: Background and
development. Hyattsville, MD: U.S. Department of Agriculture.
Welsh, J. A., & Cunningham, S. A. (2011). The role of added sugars in pediatric obesity.
Pediatric Clinics of North America, 58(6), 1455-1466, xi. doi:
10.1016/j.pcl.2011.09.009
Welsh, J. A., Sharma, A. J., Grellinger, L., & Vos, M. B. (2011). Consumption of added
sugars is decreasing in the United States. American Journal of Clinical Nutrition,
94(3), 726-734. doi: 10.3945/ajcn.111.018366
Witt, M., & Reutter, K. (1996). Embryonic and early fetal development of human taste
buds: A transmission electron microscopical study. Anatomical Record, 246(4),
507-523. doi: 10.1002/(SICI)1097-0185(199612)246:4<507::AID-
AR10>3.0.CO;2-S
Wojczynski, M. K., & Tiwari, H. K. (2008). Definition of phenotype. Advances in
Genetics, 60, 75-105. doi: 10.1016/s0065-2660(07)00404-x
World Health Organization. (2015). Childhood overweight and obesity. Retrieved March
10th, 2015 from http://www.who.int/dietphysicalactivity/childhood/en/
World Health Organization. (2015). Guideline: Sugars intake for adults and children.
Retrieved from
http://apps.who.int/iris/bitstream/10665/149782/1/9789241549028_eng.pdf

208
Wrobel, W. L., Catalanotto, F. A., & Walter, R. G. (1978). Taste thresholds in caries-free
and caries-active naval recruits. Archives of Oral Biology, 23(10), 881-885.
Wu, Y. T., Nielsen, D. H., Cassady, S. L., Cook, J. S., Janz, K. F., & Hansen, J. R.
(1993). Cross-validation of bioelectrical impedance analysis of body composition
in children and adolescents. Physical Therapy, 73(5), 320-328.
Yarmolinsky, D. A., Zuker, C. S., & Ryba, N. J. (2009). Common sense about taste:
From mammals to insects. Cell, 139(2), 234-244. doi: 10.1016/j.cell.2009.10.001
Yeomans, M. R., Blundell, J. E., & Leshem, M. (2004). Palatability: Response to
nutritional need or need-free stimulation of appetite? British Journal of Nutrition,
92(Suppl. 1), S3-14.
Zhang, G. H., Zhang, H. Y., Wang, X. F., Zhan, Y. H., Deng, S. P., & Qin, Y. M. (2009).
The relationship between fungiform papillae density and detection threshold for
sucrose in the young males. Chemical Senses, 34(1), 93-99. doi:
10.1093/chemse/bjn059
Zhao, G. Q., Zhang, Y., Hoon, M. A., Chandrashekar, J., Erlenbach, I., Ryba, N. J. P., &
Zuker, C. S. (2003). The Receptors for Mammalian Sweet and Umami Taste.
Cell, 115(3), 255-266. doi: 10.1016/S0092-8674(03)00844-4
Zukerman, S., Glendinning, J. I., Margolskee, R. F., & Sclafani, A. (2013). Impact of
T1r3 and Trpm5 on carbohydrate preference and acceptance in C57BL/6 mice.
Chemical Senses, 38(5), 421-437. doi: 10.1093/chemse/bjt011

209
Zuo, L., Wang, K., & Luo, X. (2014). Use of diplotypes—matched haplotype pairs from
homologous chromosomes—in gene-disease association studies. Shanghai
Archives of Psychiatry, 26(3), 165-170. doi: 10.3969/j.issn.1002-
0829.2014.03.009