Sucrose phosphate synthase and sucrose phosphate phosphatase interact in planta and promote plant...
12
Journal of Experimental Botany doi:10.1093/jxb/erv101 This paper is available online free of all access charges (see http://jxb.oxfordjournals.org/open_access.html for further details) RESEARCH PAPER Sucrose phosphate synthase and sucrose phosphate phosphatase interact in planta and promote plant growth and biomass accumulation Victoria J. Maloney, Ji-Young Park, Faride Unda and Shawn D. Mansfield* Department of Wood Science, University of British Columbia, 2424 Main Mall, Vancouver, BC, V6T 1Z4, Canada * To whom correspondence should be addressed. E-mail: shawn.mansfi[email protected] Received 1 December 2014; Revised 23 January 2015; Accepted 9 February 2015 Abstract Bioinformatic analysis indicates that sucrose phosphate synthase (SPS) contains a putative C-terminal sucrose phos- phate phosphatase (SPP)-like domain that may facilitates the binding of SPP. If an SPS–SPP enzyme complex exists, it may provide sucrose biosynthesis with an additional level of regulation, forming a direct metabolic channel for sucrose-6-phosphate between these two enzymes. Herein, the formation of an enzyme complex between SPS and SPP was examined, and the results from yeast two-hybrid experiments suggest that there is indeed an association between these proteins. In addition, in planta bioluminescence resonance energy transfer (BRET) was observed in Arabidopsis seedlings, providing physical evidence for a protein interaction in live cells and in real time. Finally, bimo- lecular fluorescence complementation (BiFC) was employed in an attempt to detect SPS–SPP interactions visually. The findings clearly demonstrated that SPS interacts with SPP and that this interaction impacts soluble carbohydrate pools and affects carbon partitioning to starch. Moreover, a fusion construct between the two genes promotes plant growth in both transgenic Arabidopsis and hybrid poplar. Key words: BiFC, biomass, BRET, cellulose, poplar, protein–protein interaction, sucrose phosphate phosphatase, sucrose phosphate synthase, yeast two-hybrid. Introduction Sucrose, the major product of photosynthesis, can be utilized directly by glycolysis or translocated within the plant as a soluble carbohydrate via the phloem. It constitutes the most abundant form of soluble storage carbohydrate and also serves as a sig- nalling molecule that triggers essential metabolic events (Koch, 1996). When imported into sink tissues, sucrose can be used for the maintenance of cellular metabolism, cell wall biosynthesis, respiration, or converted into starch for later use (Sturm, 1999; Kutschera and Heiderich, 2002). The synthesis of sucrose has been well characterized in plants and microbes, and involves a two-step process catalysed by sucrose-6-phosphate synthase (SPS; EC 2.4.1.14) and sucrose-6-phosphate phosphatase (SPP; EC 3.1.3.24). The reaction catalysed by SPS, the synthesis of sucrose-6-phosphate (Suc-6-P) from fructose-6-phosphate (Fru-6-P) and UDP-glucose, is an important regulatory step in controlling sucrose synthesis in plants (Stitt et al., 1988). SPS plays a crucial role in carbohydrate metabolism by regulating the partitioning of carbon between starch production and car- bohydrate accumulation in many physiological and develop- mental processes (Geigenberger et al., 1999; Baxter et al., 2003; Lunn and MacRae, 2003; Chen et al., 2005). SPP catalyses the final step in the pathway of sucrose biosynthesis, where Suc- 6-P produced by SPS is irreversibly hydrolysed to sucrose (Lunn and Rees, 1990). Several reports have shown that plants have multiple isoforms of SPS and SPP, and that their expression varies with development, tissue type, and environmental sig- nals (Reimholz et al., 1997; Lunn, 2003; Lutfiyya et al., 2007). Protein phosphorylation of multiple serine residues and direct This is an Open Access article distributed under the terms of the Creative Commons Attribution License (http://creativecommons.org/licenses/by/3.0/), which permits unrestricted reuse, distribution, and reproduction in any medium, provided the original work is properly cited. © The Author 2015. Published by Oxford University Press on behalf of the Society for Experimental Biology. Journal of Experimental Botany Advance Access published April 13, 2015 by guest on May 29, 2016 http://jxb.oxfordjournals.org/ Downloaded from
-
Upload
independent -
Category
Documents
-
view
0 -
download
0
Transcript of Sucrose phosphate synthase and sucrose phosphate phosphatase interact in planta and promote plant...

Journal of Experimental Botanydoi:10.1093/jxb/erv101This paper is available online free of all access charges (see http://jxb.oxfordjournals.org/open_access.html for further details)
ReseaRch PaPeR
Sucrose phosphate synthase and sucrose phosphate phosphatase interact in planta and promote plant growth and biomass accumulation
Victoria J. Maloney, Ji-Young Park, Faride Unda and Shawn D. Mansfield*
Department of Wood Science, University of British Columbia, 2424 Main Mall, Vancouver, BC, V6T 1Z4, Canada
* To whom correspondence should be addressed. E-mail: [email protected]
Received 1 December 2014; Revised 23 January 2015; Accepted 9 February 2015
Abstract
Bioinformatic analysis indicates that sucrose phosphate synthase (SPS) contains a putative C-terminal sucrose phos-phate phosphatase (SPP)-like domain that may facilitates the binding of SPP. If an SPS–SPP enzyme complex exists, it may provide sucrose biosynthesis with an additional level of regulation, forming a direct metabolic channel for sucrose-6-phosphate between these two enzymes. Herein, the formation of an enzyme complex between SPS and SPP was examined, and the results from yeast two-hybrid experiments suggest that there is indeed an association between these proteins. In addition, in planta bioluminescence resonance energy transfer (BRET) was observed in Arabidopsis seedlings, providing physical evidence for a protein interaction in live cells and in real time. Finally, bimo-lecular fluorescence complementation (BiFC) was employed in an attempt to detect SPS–SPP interactions visually. The findings clearly demonstrated that SPS interacts with SPP and that this interaction impacts soluble carbohydrate pools and affects carbon partitioning to starch. Moreover, a fusion construct between the two genes promotes plant growth in both transgenic Arabidopsis and hybrid poplar.
Key words: BiFC, biomass, BRET, cellulose, poplar, protein–protein interaction, sucrose phosphate phosphatase, sucrose phosphate synthase, yeast two-hybrid.
Introduction
Sucrose, the major product of photosynthesis, can be utilized directly by glycolysis or translocated within the plant as a soluble carbohydrate via the phloem. It constitutes the most abundant form of soluble storage carbohydrate and also serves as a sig-nalling molecule that triggers essential metabolic events (Koch, 1996). When imported into sink tissues, sucrose can be used for the maintenance of cellular metabolism, cell wall biosynthesis, respiration, or converted into starch for later use (Sturm, 1999; Kutschera and Heiderich, 2002). The synthesis of sucrose has been well characterized in plants and microbes, and involves a two-step process catalysed by sucrose-6-phosphate synthase (SPS; EC 2.4.1.14) and sucrose-6-phosphate phosphatase (SPP; EC 3.1.3.24). The reaction catalysed by SPS, the synthesis of sucrose-6-phosphate (Suc-6-P) from fructose-6-phosphate
(Fru-6-P) and UDP-glucose, is an important regulatory step in controlling sucrose synthesis in plants (Stitt et al., 1988). SPS plays a crucial role in carbohydrate metabolism by regulating the partitioning of carbon between starch production and car-bohydrate accumulation in many physiological and develop-mental processes (Geigenberger et al., 1999; Baxter et al., 2003; Lunn and MacRae, 2003; Chen et al., 2005). SPP catalyses the final step in the pathway of sucrose biosynthesis, where Suc-6-P produced by SPS is irreversibly hydrolysed to sucrose (Lunn and Rees, 1990). Several reports have shown that plants have multiple isoforms of SPS and SPP, and that their expression varies with development, tissue type, and environmental sig-nals (Reimholz et al., 1997; Lunn, 2003; Lutfiyya et al., 2007). Protein phosphorylation of multiple serine residues and direct
This is an Open Access article distributed under the terms of the Creative Commons Attribution License (http://creativecommons.org/licenses/by/3.0/), which permits unrestricted reuse, distribution, and reproduction in any medium, provided the original work is properly cited.
© The Author 2015. Published by Oxford University Press on behalf of the Society for Experimental Biology.
Journal of Experimental Botany Advance Access published April 13, 2015 by guest on M
ay 29, 2016http://jxb.oxfordjournals.org/
Dow
nloaded from

Page 2 of 12 | Maloney et al.
control via metabolic effectors have been suggested as the main regulatory mechanisms of SPS activity (Huber and Huber, 1992, 1996). In tobacco (Nicotiana tabacum L), two 14-3-3 pro-tein isoforms were found to interact with SPS in a two-hybrid screen. Additionally, deletion analysis suggested that differ-ences in protein affinity for SPS are mediated by the variable C-terminus of 14-3-3s (Bornke, 2005). While uncertainty sur-rounds the exact function of these proteins, it is believed that they are involved in the regulation of protein turnover (Cotelle et al., 2000). It has also been proposed that additional regula-tion of the sucrose synthesis pathway could be facilitated by the formation of a multienzyme complex between SPS and SPP. This was first suggested by Salerno et al. (1996) who identified a protein that altered the catalytic activity of SPS, and the pro-tein was tentatively identified as SPP via co-migration through gel filtration and anion-exchange chromatography. Moreover, Echeverria et al. (1997) who, by measuring the rates of Suc-6-P synthesis and hydrolysis in mixing experiments with partially purified enzymes from spinach (Spinacia oleracea) and rice (Oryza sativa) leaves, provided kinetic evidence for their associa-tion. Altered migration of the two proteins on non-denaturing gels and an indication of metabolite channelling of Suc-6-P provided additional evidence for a close association between SPS and SPP.
In addition to physical and kinetic evidence, phylogenetic analysis of both enzymes has revealed that SPS contains an SPP-like domain at the C-terminus to which SPP may bind. It has been suggested that a gene fusion of a glucosyl-transferase-like domain (GTD) and a phosphohydrolase-like domain (PHD) might have given rise to a hypothetical common ances-tral SPS gene, while duplications of PHD and GTD during cyanobacterial diversification might have produced SPP and sucrose synthase (SUSY) genes, respectively (Cumino et al., 2002; Lunn and MacRae, 2003). Aravind et al. (1998) reported that the N-terminal region of the maize SPP1 shows signifi-cant similarity to proteins in the haloacid dehalogenase (HAD) superfamily of phosphatases/hydrolase. The splitting of SPS and SPP into two different polypeptides could have pro-vided a new level of regulation that allowed protein–protein interactions and the channelling of the intermediate product (Suc-6-P) (Salerno and Curatti, 2003). It has also been shown that chimeric Synechocystis SPS–SPP protein expressed in a heterologous Escherichia coli system displayed SPS and SPP activity. However, at present, little is known about the putative SPS and SPP enzyme complex in vivo. Here, the possibility of protein interaction between Arabidopsis thaliana SPS and SPP was investigated to understand sucrose metabolism, as well as to provide evidence of an association between SPS and SPP. Additionally, the effects that overexpression of an Arabidopsis SPS–SPP fusion construct has on growth and sucrose metabo-lism in plants were examined.
Materials and methods
Plant materialArabidopsis thaliana seeds (ecotype Columbia) and two T-DNA insertion mutants, Atsps– (CS85693) and Atspp– (CS859155), were
surface-sterilized by first washing with 70% ethanol for 2 min, fol-lowed by sodium hypochlorite for 30 min, and finally with sterile distilled water. Sterilized seeds were then imbibed at 4 °C for 3 d in the dark, and then grown on Murashige and Skoog (MS) nutrient agar media containing 2% sucrose in a growth chamber (16/8 h light/dark) at 23 °C. Seedlings were transferred to soil ~7 d post-germi-nation, and grown in a growth chamber at 23 °C under a long-day light cycle (16 h light/8 h dark). When the plants were fully mature (yellowed siliques), they were harvested for cell wall analysis.
Populus alba × P. grandidentata (genotype P39) leaf discs were harvested from 4-week-old tissue culture-grown plants using a cork borer. Twenty plates containing 25 leaf discs (7 mm2) per genotype were co-cultivated with 30 ml of bacterial culture in 50 ml Falcon tubes for 30 min at 28 °C in a rotating shaker (100 rpm). Following co-cultivation, the explants were blotted dry on sterile filter paper and placed abaxially on WPM culture medium containing 0.1 μM 1-naphthylacetic acid (NAA), 0.1 μM benzyladenine (BA), and 0.1 μM thidiazuron (TDZ). The plates were cultured in the dark for 2 d at room temperature. On the third day, residual Agrobacterium was eliminated by transferring the leaf discs to WPM medium con-taining 250 mg l–1 cefotoxine and 500 mg l–1 carbenicillin. All plates were kept in the dark for an additional 2 d. Explants were then trans-ferred to WPM selection medium containing 250 mg l–1 cefotoxine, 500 mg l–1, carbenicillin, and 25 mg l–1 hygromycin. After emergence, only one shoot per leaf disc was excised and placed on WPM selec-tion medium. After 6 weeks growth, explants were transferred to fresh medium with the same composition, and permitted to develop. Plants were confirmed as transgenic by genomic DNA screening, and those identified as positive were then subcultured and multiplied on antibiotic-free WPM medium.
Transgenic trees were multiplied in WPM medium until ~8–10 plants of each transgenic event were of similar size, along with the appropriate control, non-transformed trees. The trees were then moved to 2 gallon pots containing perennial soil (50% peat, 25% fine bark, and 25% pumice; pH 6.0), where they were maintained on flood tables with supplemental lighting (16 h days with 300 μmol s–1 m–2 supplemental lighting) and watered daily with fertilized water in the UBC greenhouse, Vancouver, BC. After 6 months greenhouse growth, tree height from the root collar to the apex of the tree was recorded, while stem diameter was measured using digital calipers at 10 cm above the root collar (soil level). Transgenic lines and cor-responding wild-type trees were harvested after 6 months of growth, and tissues were kept at –80 °C until evaluated.
Yeast two-hybrid assayThe full-length cDNAs of AtSPS5b (At5g20280) and AtSPP (At2g35840) were amplified from whole plants of 2-week-old A. thaliana, and independently cloned into the gateway entry clone pENTR/D-TOPO (Invitrogen). The full-length cDNAs were amplified by using the following primer sets for AtSPS and AtSPP, respectively: forward SPSGWa1 (5’-CACCTACGTAATGGCCGGGAACGAT-3’) and reverse SPSGWb2 (5’-TCAGTCCTTGAGAAGCTCTAATTTC-3’); and forward SPPGWa1 (5’-CACCCCTAGGATGGAGCGTCTAACA TCT-3’) and reverse SPPGWb2 (5’- GCGGCCGCTCAGATGATC CAGATGCTAT-3’). Both cDNAs were transferred to pDEST 32, facilitating fusion to the GAL4 DNA-binding domain or trans-ferred to pDEST 22 for fusion to the GAL4 activation domain. The sequence was confirmed for the paired constructs and intro-duced into Saccharomyces cerevisiae strain MaV203. As a positive control, the yeast two-hybrid combination consisting of transcript factor TT8 and MYB75 was used (a gift from Dr Brian Ellis; Bhargava et al., 2010). Transformants consisting of pDEST32SPS coupled with pDEST22, and empty vector pDEST32 coupled with pDEST22 were employed as negative activation controls. Transformants were selected on SC/-Leu/-Trp (synthetic defined plate deficient for both Leu and Trp) plates. Positive interactions were determined by the ability of the transformed yeast cells to
by guest on May 29, 2016
http://jxb.oxfordjournals.org/D
ownloaded from

The SPS–SPS interaction: a metabolic channel | Page 3 of 12
grow on SC-Leu-Trp-Ura, SC-Leu-Trp-His+10 mM 3AT (3-ami-notriazole) and SC-Leu-Trp+0.2% 5FOA (5-fluoroorotic acid) media. An X-gal colorimetric assay was used for determination of β-galactosidase activity. All media used in these studies were prepared according to ProQuest Two-Hybrid system protocols, and performed according to the manufacturer’s instructions (Invitrogen).
Bioluminescence resonance energy transfer (BRET) construct development and assayConstructs were made using Gateway cloning technology (Invitrogen). The N-terminal tagged human codonized Renilla luciferase destination BRET vector (35SP::hRLUC–attR, AY995142) and AtSPS, the clone generated in the yeast-two hybrid assay, were used to generate the 35SP::hRLUC–AtSPS vector. The 35SP::AtSPS–hRLUC construct was created using an AtSPS clone that was amplified by the primer combination, SPSGWb1 (5’-CCTAGGGTCCTTGAGAAGCTCTAAT-3’) and SPSGWa1 (5’-CACCTACGTAATGGCCGGGAACGAT-3’), and then transferred into the C-terminally tagged luciferase destination vector (35SP::attR–hRLUC, AY995143). The 35SP::AtSPP–YFP (yellow fluorescent protein) vector was made using the recombina-tion of AtSPP (At2g35840) that was amplified using SPPGWa1 (5’-CACCCCTAGGATGGAGCGTCTAACATCT-3’) and SPPGWb1 (5’-GATGATCCAGATGCTATCATCCTTCACC-3’) into the C-terminally tagged YFP structure (35SP::attR–YFP, AY995145). A combination of the 35SP::AtSPP–YFP vector with either the 35SP::hRLUC–AtSPS or the 35SP::AtSPS–hRLUC vec-tor was co-transformed into both the Atspp– and Atsps– mutant backgrounds using the floral dip method (Clough and Bent, 1998). A 35SP::RLUC vector and a 35SP::RLUC–YFP fusion vector (gifts from Dr A.G. von Arnim) were used as negative and positive con-trols, respectively. After YFP expression was confirmed in all four double transgenic lines, BRET signals were visualized in the root tissue of 8- to 9-day-old light-grown transgenic seedlings in the presence of 1 μM coelenterazine. Each sample was distributed into an individual well of a 96-well Optiplate (PerkinElmer Life Sciences) and emissions were measured using a Wallac Victor 3V plate reader (PerkinElmer Life Sciences). For BRET measurement, luciferase emission was measured through a 370–450 nm filter and the resulting YFP emission was measured through a 500–530 nm filter. Calculation of BRET was according to Subramanian et al. (2004). Readings from 4–5 plants from independent double trans-genic lines were averaged and background subtracted using a read-ing from untransformed tissue.
AtSPP–SPS fusion construct development and transformationThe AtSPP gene that was previously cloned was transformed into the pENTR/D-TOPO vector (Invitrogen) with forward primer SPPa1 (5’-CACCCCTAGGATGGAGCGTCTAACAT-3’) and reverse primer SPPb1 (5’-GATGATCCAGCTGCTATCATCCTTCA-3’) in order to include an N-terminal NotI restriction site and a C-terminal NotI restriction site before the stop codon. Similarly, the AtSPS gene that was previously cloned was transformed into the ZeroBlunt/TOPO vector (Invitrogen) with the forward primer SPSa3 (5’-CTCGAGACAAAATGGCCGGGAACGA-3’) and reverse primer SPSb3 (5’-GCGGCCGCAGCGTCCTTGAGAAGCT-3’) in order to include NotI sites. The AtSPP and AtSPS genes were then excised from their respective vectors and ligated together and placed back into the pENTR/D-TOPO vector for verification of correct orientation by sequencing. Using Gateway technology, the AtSPP–AtSPS fusion was then recombined into the 35SP::attR–YFP (AY995145) vector in order to create the 35SP::SPP–SPS–YFP vector. 35SP::SPP–SPS–YFP was then transferred to A. tumefa-ciens strain EHA105 by the freeze–thaw method. Transformation of hybrid poplar plant tissue was achieved using a standard leaf disk inoculation technique, as described above.
Fluorescent microscopyYFP expression of transgenic lines was imaged in 7-day-old seed-lings for Arabidopsis and hybrid poplar. Images were collected on a fluorescence microscope (Zeiss Axiovert 200M, Germany) with a CCD camera (Hamamatsu Orca, USA). Each image shown repre-sents a single focal plane. Images were acquired using Zeiss software, and were imported into Image J software (W. Rasband, National Institutes of Health, Besthesda, MD, USA) for cropping, contrast adjustment, and assembly.
Bimolecular fluorescence complementation (BiFC) in transiently transformed tobacco leaf cellsBiFC expression vectors were created using Gateway vectors pCL112 and pCL113 (Invitrogen), which carry N-terminal (YN) and C-terminal (YC) fragments of YFP, respectively. Atsps (At5g20280) was inserted into pCL112 to create a YN-tagged AtSPS (YN-SPS), while AtSPP1 (At1g51420), AtSPP2 (At2g35840), AtSPP3(3a) (At3g54270), and AtSPP4(3b) (At3g52340) were inserted in pCL113 to create four independent YC-tagged AtSPP vectors (YC-SPPx). Tobacco leaves were transiently transformed with the YN-tagged AtSPS vector and one of the four YN-tagged AtSPP vectors to create four lines denoted as pCL112AtSPS–pCL113AtSPPx (SPS–SPPx). The positive control line was created using a 35SP::YFP vec-tor, while negative control lines pCL112EM–pCL113EM (EM–EM), pCL112EM–pCL113AtSPPx (EM–SPPx), and pCL112AtSPS–pCL113EM (SPS–EM) were created using empty vector combi-nations. All transformations were conducted according to Sparkes et al. (2006). Briefly, leaves of 5-week-old tobacco (Nicotiana taba-cum) were transformed by infiltration with A. tumefaciens carrying the expression vectors. YFP fluorescence was detected 48 h and 65 h post-infiltration on a Leica DMI6000 inverted microscope with a Quorum Wave FX system, which has a modified Yokogawa CSU-10 spinning disk scan head (Yokogawa Electric Corporation). YFP was excited with a 491 nm laser and emissions were passed through a 528/38 band filter (Chroma Technology). Images were acquired using a Hamamatsu 9100–13 EMCCD camera (Hamamatsu) con-trolled by Volocity software (Improvision).
Quantitative real-time PCR (RT-PCR)Tissue was ground in liquid nitrogen using a mortar and pes-tle, and extracted with TRIzol® reagent (Invitrogen) according to the manufacturer’s instructions. cDNA was synthesized using the Superscript™ II first strand synthesis system (Invitrogen) in a 20 μl reaction containing 1 μg of DNase I-treated total RNA with 0.5 μg of dT16 oligonucleotides. An identical reac-tion without the reverse transcriptase was performed to con-firm the absence of genomic DNA. Transcript abundance was quantified with Brilliant® SYBR® Green QPCR Master Mix (Stratagene, La Jolla, CA, USA) on an Mx3000P™ PCR sys-tem (Stratagene) employing the forward and reverse primers: ASPS-F3 (5’-CCACAGTGGCAAAGTGATGATGGC-3’) and ASPS-R4 (5’-TCTGACCTCTCCAGTGATCCC-3’), ASPP-F3 (5’-GTGGTGTGTTTGTCCATCCATGTG-3’), and ASPP-R3 (5’-ACTTGATCTGCCCAAACGCGAAAC-3’). The Arabidopsis ubiquitin5 gene (AtUBQ5; At3g62250) served as a housekeeping control, and was amplified using the following forward and reverse primers: AtUBQF (5’-ACGCCAAGCCGAAGATCAAGCA-3’) and AtUBQR (5’-AAATGACTCGCCATGAAAGTCCCAG-3’). The thermocycler conditions for all real-time analyses were: 95 °C for 10 min, followed by 40 cycles of 95 °C for 30 s, 55 °C for 1 min, and 72 °C for 30 s. Data were analysed using Mx3000P™ Real-Time PCR system software (Stratagene). Transcript abun-dance of Atsps and Atspp was normalized to ubq5 by subtract-ing the Ct value of ubq5 from the Ct value of the specific gene, where ∆Ct=CtAtSPS or CtAtSPP–CtAtUBQ5. Transcript abundance of the Atsps gene in wild-type and transgenic plants was obtained from the equation (1+E)–∆Ct, where E is the PCR efficiency,
by guest on May 29, 2016
http://jxb.oxfordjournals.org/D
ownloaded from
Page 4 of 12 | Maloney et al.
according to Ramakers et al. (2003), which is derived from the log slope of the fluorescence versus cycle number in the exponential phase of each individual amplification plot, using the equation (1+E)=10slope.
Soluble sugar and starch analysisLeaf tissues were harvested and immediately frozen in liquid nitro-gen, ground with a mortar and pestle, and then freeze-dried for 48 h. A 20–50 mg aliquot of tissue was incubated for 24 h at –20 °C with 4 ml of methanol:chloroform:water (12:5:3). The samples were centri-fuged for 10 min at 6000 rpm and 4 °C, and the supernatant was col-lected. The pellet was washed with 8 ml of methanol:chloroform:water (12:5:3), centrifuged for an additional 10 min at 6000 rpm and 4 °C, and the supernatants were pooled. An aliquot of 5 ml of distilled water was then added to the pooled supernatants and phases were partitioned, at which point 1 ml of the resulting aqueous phase con-taining the soluble sugars was dried in a speedvac at 40 °C. The pel-let was resuspended in 1 ml of nanopure water and filtered through a 4 mm nylon filter (0.45 μm). The soluble sucrose concentrations were quantified by anion-exchange high-performance liquid chromatogra-phy (HPLC; Dionex, Sunnyvale, CA, USA) on a DX-600 equipped with a CarboPac™ PA1 column and an electrochemical detector. Sugars were eluted with water at room temperature at a flow rate of 1 ml min–1. Each concentration was determined using regression equa-tions from calibration curves that were derived from external stand-ards. For the hybrid poplar trees, starch content was determined by adding 3 ml of 4% H2SO4 to ~60 mg of the solid tissue remaining after the soluble sugar extraction and then autoclaving for 4 min at 121 °C. Glucose content was then determined by HPLC, as described below, for the structural carbohydrate analyses.
Structural carbohydrate, lignin, and starch analysisTissue samples harvested from ~5 cm of the base of 6-month-old greenhouse-grown hybrid poplar trees were ground in a Wiley mill
to pass a 0.4 mm screen (40 mesh) and Soxhlet extracted overnight in hot acetone to remove extractives. The extractive-free material was used for all further analyses.
The lignin and carbohydrate content was determined with a mod-ified Klason (Coleman et al., 2008), in which extracted ground stem tissue (0.2 g) was treated with 3 ml of 72% H2SO4 and stirred every 10 min for 2 h. Samples were then diluted with 112 ml of deionized water and autoclaved for 1 h at 121 °C. The acid-insoluble lignin fraction was determined gravimetrically by filtration through a pre-weighed medium coarseness sintered-glass crucible, while the acid-soluble lignin component was determined spectrophotometrically by absorbance at 205 nm. Carbohydrate content was determined by using anion-exchange HPLC (Dx-600; Dionex) equipped with an ion-exchange PA1 (Dionex) column, a pulsed amperometric detector with a gold electrode, and a Dionex AS100 autosampler (Dionex).
Wood densityWood density was determined using bark-to-bark segments isolated from 15 cm above the root collar and precision cut to 1.67 mm thick specimens with a precision custom-built twin-blade pneumatic saw. After extraction with hot acetone in a Soxhlet apparatus overnight, the wood sections were acclimated to 7% moisture content prior to density determination. The samples were then scanned by X-ray densitometry at a resolution of 0.254 mm (QTRS-01X; Quintek Measurement Systems Inc., Knoxville, TN, USA).
Results
Yeast two-hybrid assay
In an attempt to assess the putative protein–protein inter-action between AtSPS and AtSPP, the full-length AtSPS cDNA fused in-frame with the DNA-binding domain of
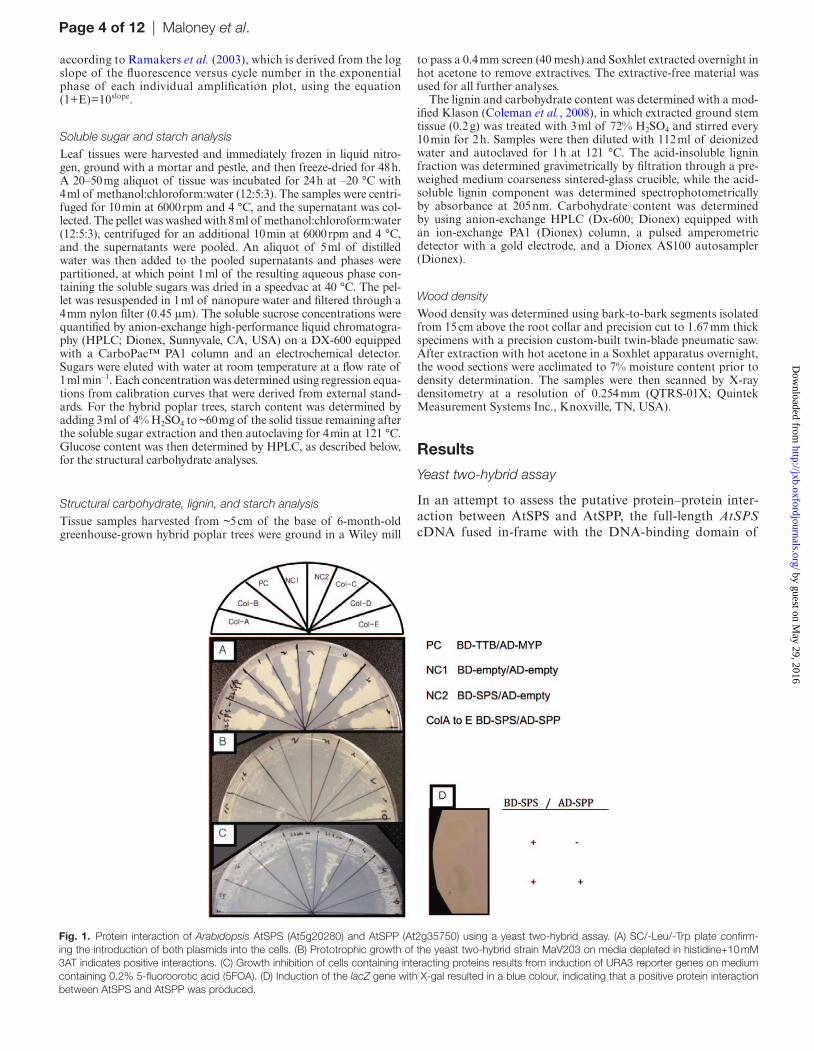
Fig. 1. Protein interaction of Arabidopsis AtSPS (At5g20280) and AtSPP (At2g35750) using a yeast two-hybrid assay. (A) SC/-Leu/-Trp plate confirm-ing the introduction of both plasmids into the cells. (B) Prototrophic growth of the yeast two-hybrid strain MaV203 on media depleted in histidine+10 mM 3AT indicates positive interactions. (C) Growth inhibition of cells containing interacting proteins results from induction of URA3 reporter genes on medium containing 0.2% 5-fluoroorotic acid (5FOA). (D) Induction of the lacZ gene with X-gal resulted in a blue colour, indicating that a positive protein interaction between AtSPS and AtSPP was produced.
by guest on May 29, 2016
http://jxb.oxfordjournals.org/D
ownloaded from

The SPS–SPS interaction: a metabolic channel | Page 5 of 12
GAL4 and the AtSPP fused in-frame with the GAL4 acti-vation domain were used for co-transformation in a direct yeast two-hybrid assay system. Transformed colonies were first selected on medium lacking leucine and tryptophan, confirming the introduction of both plasmids into cells (Fig. 1A), while positive interactions were detected by selec-tion on plates lacking the auxotrophic markers histidine or uracil. These cells were then grown on selective medium lacking histidine, which included 10 mM 3AT as a HIS3 inhibitor (Fig. 1B). In order to monitor the putative posi-tive interaction further, the cells were grown on media with 0.2% 5FOA. The positive yeast cell lines, pDEST™ 32/SPS and pDEST™ 22/SPP, produce the two-hybrid-dependent induction of URA3, which results in the conversion of 5FOA to 5-fluorouracil, which is toxic. Hence, the AtSPS and AtSPP proteins in the cells containing both plasmids must be interacting, as indicated by their inability to grow on medium containing 5FOA (Fig. 1C). Furthermore, induction of the lacZ gene with X-gal (5-bromo-4-chloro-3-indolyl-β-d-galactopyranoside) using the colorimetric assays for β-galactosidase resulted in a blue colour, indi-cating that a positive protein interaction between AtSPS and AtSPP was produced. The combination of pDEST32-SPS and the empty vector pDEST22 served as a negative interaction control and, as expected, showed no interaction (Fig. 1D). The combination of empty vectors pDEST32 and pDEST22 served as additional negative controls on each selective medium.
BRET assay in planta
To support the yeast two-hybrid results, the capacity of AtSPS and AtSPP to interact in planta was studied using the BRET technique. The functionality of each BRET construct described previously was confirmed by complementation of the dwarf phenotype of the respective mutants (Figs 2, 8). Four double transgenic lines were then created by co-trans-forming either the Atsps– mutant or the Atspp– mutant with either the 35SP::AtSPS-hRLUC or 35SP::hRLUC::AtSPS construct and the 35SP::AtSPP–YFP construct, respec-tively. Before the BRET assay was conducted, the double transgenic lines were screened by genomic DNA PCR and subsequently YFP expression was examined by fluorescence microscopy. YFP fluorescent signals were observed clearly in most of the root tissue, excluding the root tip region in the transgenic plants, providing further confirmation that the constructs were functional, as well as providing proof that YFP fusion proteins can be expressed stably in Arabidopsis seedlings (Fig. 3).
Fig. 2. Complementation of the Atspp– mutant line indicates functionality of each BRET construct. (A) Wild type, (B) Atspp– mutant, (C) SPPY in the Atspp– mutant, and (D) RSPS-SPPY in the Atspp– mutant.
Fig. 3. YFP fluorescence in root tissue from 7-day-old transgenic plants expressing SPSRSPPY provides confirmation that the constructs were functional as well as proving proof that YFP fusion proteins can be expressed stably in Arabidopsis seedlings. (A–D) Control Atsps– mutant plant, (E–H) a double transgenic plant expressing both SPSR and SPPY in hairy root and root tip tissue. Scale bar=50 μm.
by guest on May 29, 2016
http://jxb.oxfordjournals.org/D
ownloaded from

Page 6 of 12 | Maloney et al.
Following confirmation of YFP expression, a BRET assay was conducted on the double transgenic lines. In a BRET experiment, the extent of energy transfer from RLUC to YFP is measured via a luminometer by filter-ing the signal luminescence through blue and yellow filters, respectively, and calculating the ratio between yellow and blue signals. Here, the yellow/blue (Y/B) luminescence ratios of 10-day-old light-grown double transgenic seedlings, as well as the negative and positive controls, were calculated. The resultant BRET ratio of the C-tagged RLUC AtSPS in the Atsps– mutant background and the N-tagged RLUC AtSPS in the Atspp– mutant background was significantly higher than that of the RLUC fusion expressed alone as a negative control in the mutant backgrounds (Fig. 4). There was a slight signal discrepancy, of ~0.2, when comparing the interaction in the different mutant backgrounds, with slightly stronger signals in the Atspp– mutant background. According to Subramanian et al. (2006), a BRET signal is considered positive when the yellow to blue ratio is >0.04 compared with the RLUC fusion expressed alone as a neg-ative control. Here, the majority (70%) of 50 pairings of gene products tested showed a ratio >0.04, with some as high as 0.3. These findings suggest a positive protein–pro-tein interaction with these constructs. However, a signifi-cant difference in the BRET ratio was not seen in N-tagged RLUC AtSPS in the Atsps– mutant background and the C-tagged RLUC AtSPS in the Atspp– mutant background. While the exact reason for this is unknown, it has been suggested that an unfavourable orientation of the emis-sion dipoles of RLUC and YFP or an excessive distance due to their spatial separation by the larger fused proteins will abolish the BRET signal (Subramanian et al., 2004,
2006). These data taken together with the protein–protein interaction results observed in the yeast two-hybrid assays suggest that there is an active interaction between AtSPS and AtSPP.
BiFC in transiently transformed tobacco epidermal cells
While the previous yeast two-hybrid and BRET results strongly suggest an interaction between AtSPS and AtSPP, additional evidence was sought by using a BiFC assay to detect AtSPP–AtSPS interactions visually in planta. In BiFC, two proteins that are believed to interact are fused to different non-fluorescent fragments of a flu-orescent protein (i.e. YFP) and expressed in live cells. If the proteins of interest do in fact interact, they will facili-tate the re-formation of the fluorescent protein enabling it to emit its fluorescent signal which can then be visualized using fluorescence microscopy (Kerppola, 2006). In this
Fig. 5. The YFP signal in 5-week-old Nicotiana tabacum cells transiently transformed with BiFC constructs shows interaction between AtSPS and AtSPP proteins. (A) EM–EM negative control, (B) 35SP –YFP positive control, (C) SPS–EM negative control, (D) EM–SPP1 negative control, (E) SPS–SPP1, (F), SPS–SPP2, (G) SPS–SPP3, and (H) SPS–SPP4. Scale bar=20 μm.
Fig. 4. BRET signal ratio in Arabidopsis hypocotyls from seedlings 7 d after germination using 1 μM coelenterazine at 22 °C indicates a significant (P<0.05) difference in the BRET ratio of RSPS in the Atspp– mutant background and SPSR in the Atsps– mutant background, when compared with the RLUC negative control. P35S::hRLUC·YFP and P35S::hRLUC structures were transformed for a positive control and negative control, respectively.
by guest on May 29, 2016
http://jxb.oxfordjournals.org/D
ownloaded from

The SPS–SPS interaction: a metabolic channel | Page 7 of 12
study, leaves from 5-week-old N. tabacum were transiently transformed with YN-SPS and either YC-SPP1, 2, 3, or 4. After infiltration with the BiFC-tagged combinations of AtSPS–AtSPPx, leaf tissue was scanned for fluores-cence as an indication of AtSPS–AtSPS interactions. 35SP::YFP was used as a positive control while EM–EM, EM–SPPx, and SPS–EM were used as negative controls. It was determined that the optimal time to detect the YFP signal was between 48 h and 65 h post-infiltration. YFP signal was clearly detected in all of the SPS–SPP lines, providing additional evidence for an interaction between these two proteins (Fig. 5).
Relative transcript of AtSPS and AtSPP in transgenic Arabidopsis plants
Double transgenic Arabidopsis plants in the Atsps– mutant background were analysed by quantitative RT-PCR to assess the transcript abundance of each cisgene. AtSPS and AtSPP transcripts was quantified in rosette leaf tis-sue for all transformed lines and normalized to AtUBQ5 abundance (Fig. 6). No AtSPS transcript was observed in the Atsps– mutant as expected, and therefore all transcripts measured were due to the expression of the AtSPS cis-gene. Interestingly, the AtSPP transcript level in the Atsps– mutant plant was also reduced compared with wild-type plants. In all cisgenics, the AtSPS transcript abundance was apparent, and the transcript abundance of AtSPP was similar among all lines, which was slightly higher than in the Atsps– mutant plants.
AtSPP–SPS in hybrid poplar
In order to confirm the functionality of the 35SP::SPP-SPS-YFP vector, the presence of YFP fluorescence was confirmed using microscopy (Fig. 7). A strong YFP signal in all of the transgenic hybrid poplar lines clearly indicates that the foreign construct is being expressed and that the proteins are being produced.
Plant growth
Increasing the activity of AtSPS and AtSPP affected plant growth rates in both Arabidopsis and hybrid poplar. In gen-eral, the height of the Arabidopsis cisgenic lines expressing AtSPS and AtSPP under the regulation of the 35S promoter in the Atsps– mutant background outperformed the wild type, as well as the Atsps– mutant lines, grown under similar condi-tions (Fig. 8). Arabidopsis plants transformed with two fused BRET constructs had >50% higher growth than the Atsps– mutant plants or the wild type (Fig. 8A). Moreover, the lines that were shown to have significant increases in the BRET ratio (>0.03) displayed substantially faster growth rates than the control (wild-type or Atsps–) plants (Fig. 8C). In hybrid poplar, the expression of the 35S::AtSPS-SPP fusion con-struct significantly increased both height and stem diameter in four of the five transgenic lines studied (Fig. 9). In contrast, expression of either AtSPP (data not shown) or AtSPS (Park et al., 2009) on their own in hybrid poplar did not manifest in increase in growth. In addition to the increased height and diameter growth, the wood density of the xylem was increased in all transgenic lines, as determined by X-ray densitometry
Fig. 7. YFP signal in AtSPP-SPS-YFP poplar plants indicates functionality of the 35SP::SPP–SPS–YFP vector.
∆
Fig. 6. Real-time PCR analysis of AtSPS (At5g20280) and AtSPP (At2g35750) gene expression in rosette leaves of Arabidopsis indicates increased expression of both transgenes when compared with the Atsps– mutant. AtSPS (At5g20280) was tagged with hRLUC in N- and C-terminal orientations (SPSR and RSPS), and AtSPP (At2g35740) was tagged with YFP at the C-terminus (SPPY). The Arabidopsis ubiqutin5 gene was used as an internal control, and results are given as relative transgene transcript abundance.
by guest on May 29, 2016
http://jxb.oxfordjournals.org/D
ownloaded from

Page 8 of 12 | Maloney et al.
(Table 1). Effectively, the combined growth increase with the enhanced cell wall density significantly increases the total biomass of the transgenic poplar trees over the wild-type con-trols growing concurrently.
Soluble sugar and starch analysis
In order to analyse the influence of increased AtSPS and AtSPP activity on sucrose metabolism in the cisgenic plants, soluble sug-ars from the Atsps– mutants, wild-type, and cisgenic plants were extracted and analysed. The concentration of leaf sucrose in all the SPS–LRUC and SPP–YFP cisgenic lines, which showed an in planta BRET signal, was slightly elevated compared with
wild-type and mutant plants while, glucose and fructose pools were dramatically increased. The constructs that did not show significant increases in the BRET ratio also had increased solu-ble sugar content; however, the increase was smaller (Fig. 10). Similarly, the hybrid poplars overexpressing the AtSPP–SPS fusion construct had an increase in the fructose and glucose pools, especially in the source leaves (Table 2). The starch con-tent in both the source and sink leaves of the AtSPP–SPS transgenic hybrid poplar was also reduced (Table 3).
Structural carbohydrate and lignin analysis
Structural carbohydrates and lignin composition were deter-mined from extractive-free dried stem tissue of 6-month-old hybrid poplar trees to investigate the effects that the expression of the AtSPP–SPS fusion protein had on car-bohydrate-derived polymer synthesis (Table 4). Although none of the AtSPP–SPS transgenic lines shows a striking difference in either carbohydrate composition or lignin content, significant differences in total lignin content were observed, with two lines (10 and 13) showing a statistically significant increase and the other three transgenic lines also having increasing concentrations. Similarly, while the hemi-cellulose and pectic-derived structural carbohydrates were
Fig. 8. Growth comparison of Atsps– Arabidopsis plants expressing AtSPS and AtSPP simultaneously indicates their ability to outperform the Atsps– mutant, as well as the wild-type plants. (A) Height measurements of 2-month-old SPSR:SPPY and RSPS:SPPY Arabidopsis plants compared with the Atsps– mutant plant. Error bars indicate the standard deviation. The line denotes significance at P=0.05. (B) Transgenic Arabidopsis seedlings. (C) Complementation of the Atsps– mutant line with SPSR–SPPY.
WT 9 10 12 13 140
50
100
150
200
250 Height Diameter
Heig
ht (c
m)
11.2
12.4
13.6
14.8
****
***
*
Diameter (m
m)
Fig. 9. Height and stem diameter measurements of hybrid poplar trees after 4 months of growth in the greenhouse indicates increased growth in the AtSPS–SPP fusion lines. Error bars are the standard error of the mean, n ≥6. * indicates P>0.05 using a Students t-test.
Table 1. Wood density of stem segments of AtSPS–SPP transgenic and wild-type poplar trees
Line Wood density (kg m–3)
WT 309.4 ± 12.99 337.1 ± 22.110 343.9 ± 14.812 345.6 ± 10.413 351.2 ± 8.814 339.9 ± 17.9
Means (± SE) were calculated from five plants per line.Bold denotes a significant difference from the control at α=0.05. by guest on M
ay 29, 2016http://jxb.oxfordjournals.org/
Dow
nloaded from

The SPS–SPS interaction: a metabolic channel | Page 9 of 12
unaltered, the total cell wall glucose content was elevated (Table 4).
Discussion
While previous studies have implied that an interaction between SPP and SPS proteins is not only beneficial for plant develop-ment, but also probable (Echeverria et al., 1997; Elcock et al., 1997; Piotrowski and Oecking, 1998; Toroser et al., 1998), to date there has been no in planta evidence that this interac-tion exists. This study therefore was designed to thoroughly investigate the putative interaction between SPS and SPP, and assess the impact of misregulating both genes simultaneously on plant growth and development. The current results using the yeast two-hybrid assay indicated that SPS and SPP do in fact interact, and further evidence was provided using BRET and BiFC assays (Figs 1, 3, 4). Previous enzymatic studies have indicated that there is indeed a significant advantage in having two enzymes working in concert with one another to form a metabolic channel. The two-domain structure of SPS, an N-terminal glycosyltransferase and a C-terminal pho-phatase domain, has a remarkable resemblance to that of the enzymes required for the synthesis of the disaccharide treha-lose. The biosynthesis of trehalose involves a two-step process catalysed by trehalose-6-phosphate synthase (TPS) and treha-lose-6-phosphate phosphatase (TPP). Trehalose-6-phosphate (T6P) is formed by TPS and is then dephosphorylated to tre-halose by TPP. Seo et al. (2000) demonstrated that an interac-tion between TPS and TPP, as well as the catalytic efficiency of the two fusion enzymes, was up to 4.0 times higher than that of a mixture of individual enzymes. A physical interac-tion of TSP and TPP would permit the low abundant T6P to channel from one enzyme to the other without the need to Ta
ble
2.
Com
paris
on o
f sol
uble
sug
ar c
once
ntra
tions
in tr
ansg
enic
AtS
PS
–SP
P a
nd w
ild-t
ype
hybr
id p
opla
r so
urce
and
sin
k le
aves
Line
So
lub
le s
ugar
ext
ract
ed (m
g) m
g–1
tis
sue
(%)
Glu
cose
Fruc
tose
Suc
rose
So
urce
Sin
kS
our
ceS
ink
So
urce
Sin
k
WT
0.95
(0.0
9)0.
36 (0
.05)
0.66
(0.1
1)0.
34 (0
.06)
4.03
(0.8
6)0.
79 (0
.036
)9
1.59
(0.3
7)0.
54 (0
.08)
1.59
(0.4
6)0.
55 (0
.15)
4.99
(0.4
7)0.
96 (0
.23)
101.
36 (0
.13)
0.38
(0.0
3)1.
11 (0
.12)
0.45
(0.0
3)5.
02 (0
.24)
1.16
(0.3
2)12
1.06
(0.2
0)0.
48 (0
.14)
0.80
(0.1
2)0.
40 (0
.08)
4.84
(0.0
6)1.
64 (0
.68)
131.
34 (0
.08)
0.48
(0.0
9)0.
81 (0
.07)
0.49
(0.0
7)4.
99 (0
.15)
0.78
(0.4
3)14
1.37
(0.1
2)0.
32 (0
.10)
1.74
(0.0
4)0.
33 (0
.09)
4.60
(0.0
3)0.
72 (0
.29)
Dat
a ar
e m
eans
(± S
EM
) of fi
ve b
iolo
gica
l rep
licat
esB
old
deno
tes
a si
gnifi
cant
diff
eren
ce a
t P=
0.05
usi
ng a
Stu
dent
t-te
st.
0.0
0.5
1.0
1.5
2.0
Sol
uble
sug
ar c
onc.
in le
af ti
ssue
(ug
mg
-1)
Glucose Fructose Sucrose
R SPS - SPP YSPS R - SPP Y5432154321sps -WT
*
**
* * **
**
** *
** *
*
Fig. 10. Comparison of soluble sugar concentrations in Atsps– Arabidopsis rosette leaf tissue expressing AtSPS and AtSPP simultaneously indicates an increase in these sugars when compared with the Atsps– mutant, as well as the wild type. Data are means (± SD) of five independent plants per line. * denotes significance at P=0.05 compared with Atsps– mutant plants.
by guest on May 29, 2016
http://jxb.oxfordjournals.org/D
ownloaded from

Page 10 of 12 | Maloney et al.
equilibrate with the bulk solution. This mechanism has been explained by the presence of an electrostatic channel on the surface of the proteins that connect the two active sites (Elcock et al., 1997). Recently, T6P has been shown to have a profound effect on plant growth and development, acting as a signal of sugar availability and possibly the overall sucrose status (Yadav et al., 2014). Similarly, a physical interaction between SPS and SPP could facilitate the channelling of Suc-6-P from one enzyme to the other without diffusing freely in solution. Furthermore, physical and kinetic evidence for an association between the two proteins suggested that the presence of SPP did not alter the affinity of SPS for its substrates, but aided in reversing the Pi inhibition at low Fru-6-P levels. Additional evidence from isotope dilution experiments suggests that Suc-6-P is indeed channelled between SPS and SPP (Salerno et al., 1996; Echeverria et al., 1997). A significant advantage to this arrangement would be that enzyme activity in the synthesis of sucrose would dramatically increase when compared with the enzyme activity of individual proteins.
In addition to providing evidence for the presence of an SPP–SPS protein interaction, it was possible to demonstrate that a concurrent increase in AtSPS and AtSPP expres-sion in the Atsps– mutant background enabled the plants to outperform their wild-type controls, as well as the Atsps– mutant line, grown concurrently. Similarly, expression of an AtSPP–SPS chimera fusion construct in hybrid poplar also manifested in faster tree growth in both height and diameter. These findings suggest that changing a plant’s ability to syn-thesize sucrose by simultaneously overexpressing SPS and SPP is sufficient to trigger changes in the entire gene cascade to promote rapid plant growth and development. Häusler et al. (2000) suggested that increased growth and yield of plants with higher SPS activity may be the result of decreased energy costs associated with direct export of sucrose during the day rather than the synthesis of starch and its conver-sion back to sucrose for export at night. Consistent with the hypothesis of Häusler et al. (2000), here not only was a decrease in starch content observed in sink leaves of the AtSPP–SPS hybrid poplar trees, but lower starch contents were also observed in the source leaves. Alternatively, the increased soluble carbohydrate status caused by elevated SPS activity may signal the redistribution of resources to actively growing sink regions of the plant (Laporte et al., 2001). While Ta
ble
4.
Str
uctu
ral c
ell w
all c
arbo
hydr
ates
and
tota
l lig
nin
cont
ent o
f 6-m
onth
-old
AtS
PS
–SP
P a
nd w
ild-t
ype
hybr
id p
opla
r
Line
Car
bo
hyd
rate
s (%
of
dry
mas
s)Li
gni
n (%
of
dry
mas
s)
Ara
bin
ose
Rha
mno
seG
alac
tose
Glu
cose
Xyl
ose
Man
nose
Inso
lub
leS
olu
ble
Tota
l
WT
0.35
(0.0
1)0.
24 (0
.04)
1.23
(0.1
2)44
.75
(1.0
4)17
.05
(0.3
9)1.
97 (0
.15)
18.6
9 (0
.63)
3.81
(0.1
6)22
.50
(0.7
5)9
0.36
(0.0
3)0.
27 (0
.04)
1.13
(0.0
4)46
.20
(0.7
2)17
.37
(0.2
1)2.
02 (0
.11)
19.8
4 (0
.35)
3.83
(0.0
3)23
.68
(0.3
7)10
0.33
(0.0
1)0.
28 (0
.03)
1.05
(0.0
3)45
.97
(0.7
2)17
.62
(0.1
3)1.
83 (0
.04)
20.5
1 (0
.31)
4.04
(0.1
7)24
.55
(0.2
2)12
0.35
(0.0
2)0.
26 (0
.03)
1.14
(0.0
6)45
.26
(0.8
3)17
.49
(0.4
2)2.
09 (0
.10)
19.5
1 (0
.38)
3.89
(0.2
2)23
.40
(0.3
5)13
0.34
(0.0
1)0.
25 (0
.05)
1.08
(0.0
5)46
.41
(0.6
5)17
.69
(0.1
7)2.
00 (0
.03)
20.5
0 (0
.25)
3.87
(0.2
4)24
.36
(0.3
1)14
0.32
(0.0
1)0.
26 (0
.04)
1.13
(0.0
2)48
.41
(0.2
9)17
.16
(0.2
4)1.
99 (0
.14)
19.9
8 (0
.34)
3.85
(0.1
8)23
.84
(0.4
3)
The
SE
M is
giv
en in
par
enth
eses
, n=
5 bi
olog
ical
repl
icat
es.
Valu
es in
bol
d ha
ve a
t-te
st P
-val
ue o
f ≤0.
05 re
lativ
e to
the
wild
type
.
Table 3. Starch content of 6-month-old transgenic AtSPS–SPP and wild-type hybrid poplar source and sink leaves
Line Starch (% of dry mass)
Sink Source
WT 1.70 (0.27) 5.50 (1.01)9 1.36 (0.18) 4.82 (0.75)10 1.29 (0.46) 2.92 (0.11)12 0.95 (0.32) 4.74 (1.58)13 1.38 (0.11) 5.02 (0.84)14 1.02 (0.09) 4.60 (0.53)
The SEM is given in parentheses, n=5 biological replicates.Bold denotes a significant difference at P=0.05 using a Student t-test.
by guest on May 29, 2016
http://jxb.oxfordjournals.org/D
ownloaded from

The SPS–SPS interaction: a metabolic channel | Page 11 of 12
there was only a slight increase in sucrose content in the AtSPS- and AtSPP-overexpressing plants, fructose and glu-cose significantly increased in most lines when compared with the Atsps– mutant and wild-type plants. It appears that the action of the elevated SPS and SPP activity manifests in the synthesis of sucrose that is rapidly broken down to glucose and fructose by either invertase or sucrose synthase counter-parts, and the overall level of sucrose maintains a homeostatic level. Concurrent with the evidence of a protein interaction between SPS and SPP, increased growth rates and altered sol-uble sugar contents in the lines overexpressing both AtSPS and AtSPP could be indicative of a further increase in the effectiveness of sucrose synthesis. Similarly, transformation experiments in tomato, tobacco, sugarcane, and Arabidopsis have suggested that when the activity of an SPS is elevated in transgenic plants, it alters in planta sucrose status, manifest-ing in enhanced growth (Worrell et al., 1991; Micallef et al., 1995; Laporte et al., 1997, 2001; Sharkey et al., 2004; Park et al., 2008; Coleman et al., 2010). It has also been shown that SPS activity strongly influences the partitioning of photosyn-thetic carbon in Zea mays leaves, and that the effect of SPS on growth was a consequence of a shift in partitioning of carbon among starch, sucrose, and ionic compounds, rather than due to an increase in net photosynthesis (Lunn and Hatch, 1997).
While it is fair to conclude that an interaction between SPS and SPP does exist in Arabidopsis and the overexpression of both genes leads to increased growth and soluble carbohy-drates in both Arabidopsis and hybrid poplar, further work is needed to clarify the molecular basis of protein binding with respect to differences among SPS and SPP isoforms and crucial structural elements. It would also be important to test whether other proteins involved in the sucrose synthesis path-way, such as sucrose synthase, form multienzyme complexes with these interacting enzymes. Coleman et al. (2009) showed that an overexpression of sucrose synthase in transgenic poplar manifested in increased cellulose content, but with-out an increase in overall growth characteristics. Moreover, the transgenic sucrose synthase poplar had increased cell wall densities. Herein, it is shown that the SPS–SPP chi-mera could increase plant growth attributes, which also had positive affects on xylem density and cellulose composition. These findings support the possibility of a multienzyme com-plex regulating sucrose partitioning to cellulose biosynthe-sis. Importantly, these findings suggest that altering sucrose metabolism may be key to improving the biomass quantity and quality for bioenergy applications.
AcknowledgementsFunding for this research was provided by the NSERC Discovery program to SDM. The authors also acknowledge James Foster Hart for the densitometry analysis.
ReferencesAravind L, Galperin MY, Koonin EV. 1998. The catalytic domain of the P-type ATPase has the haloacid dehalogenase fold. Trends in Biochemical Sciences 23, 127–129.
Baxter CJ, Foyer CH, Turner J, Rolfe SA. Quick WP. 2003. Elevated sucrose-phosphate synthase activity in transgenic tobacco sustains photosynthesis in older leaves and alters development. Journal of Experimental Botany 54, 1813–1820.
Bhargava A, Mansfield SD, Hall HC, Douglas CJ, Ellis BE. 2010. MYB75 functions in regulation of secondary cell wall formation in the Arabidopsis inflorescence stem. Plant Physiology 154, 1428–1438.
Bornke F. 2005. The variable C-terminus of 14-3-3 proteins mediates isoform-specific interaction with sucrose-phosphate synthase in the yeast two-hybrid system. Journal of Plant Physiology 162, 161–168.
Chen S, Hajirezaei M, Bornke F. 2005. Differential expression of sucrose-phosphate synthase isoenzymes in tobacco reflects their functional specialization during dark-governed starch mobilization in source leaves. Plant Physiology 139, 1163–1174.
Clough SJ, Bent AF. 1998. Floral dip: a simplified method for Agrobacterium-mediated transformation of Arabidopsis thaliana. The Plant Journal 16, 735–743.
Coleman HD, Beamish L, Reid A, Park J-Y, Mansfield SD. 2010. Altered sucrose metabolism impacts plant biomass production and flower development. Transgenic Research 19, 269–283.
Coleman HD, Park J-Y, Nair R, Chapple C, Mansfield SD. 2008. RNAi-mediated suppression of p-coumaroyl-CoA 3’-hydroxylase in hybrid poplar impacts lignin deposition and soluble secondary metabolism. Proceedings of the National Academy of Sciences, USA 105, 4501–4506.
Coleman HD, Yan J, Mansfield SD. 2009. Sucrose synthase affects carbon partitioning to increase cellulose production and altered cell wall ultrastructure. Proceedings of the National Academy of Science, USA 106, 13118–13123.
Cotelle V, Meek S, Provan F, Milne F, Morrice N, MacKintosh C. 2000. 14-3-3s regulate global cleavage of their diverse binding partners in sugar-starved arabidopsis cells. EMBO Journal 19, 2869–2876.
Cumino A, Curatti L, Giarrocco L, Salerno GL. 2002. Sucrose metabolism: Anabaena sucrose-phosphate synthase and sucrose-phosphate phosphatase define minimal functional domains shuffled during evolution. FEBS Letters 517, 19–23.
Echeverria E, Salvucci ME, Gonzalez P, Paris G, Salerno G. 1997. Physical and kinetic evidence for an association between sucrose-phosphate synthase and sucrose-phosphate phosphatase. Plant Physiology 115, 223–227.
Elcock AH, Huber GA, McCammon JA. 1997. Electrostatic channeling of substrates between enzyme active sites: comparison of simulation and experiment. Biochemistry 36, 16049–16058.
Geigenberger P, Reimholz R, Deiting U, Sonnewald U, Stitt M. 1999. Decreased expression of sucrose phosphate synthase strongly inhibits the water stress-induced synthesis of sucrose in growing potato tubers. The Plant Journal 19, 119–129.
Häusler RE, Schlieben NH, Nicolay P, Fischer K, Fischer KL, Flugge UI. 2000. Control of carbon partitioning and photosynthesis by the triose phosphate/phosphate translocator in transgenic tobacco plants (Nicotiana tabacum L.). I. Comparative physiological analysis of tobacco plants with antisense repression and overexpression of the triose phosphate/phosphate translocator. Planta 210, 371–382.
Huber SC, Huber JL. 1992. Role of sucrose-phosphate synthase in sucrose metabolism in leaves. Plant Physiology 99, 1275–1278.
Huber SC, Huber JL. 1996. Role and regulation of sucrose-phosphate synthase in higher plants. Annual Review of Plant Physiology and Plant Molecular Biology 47, 431–444.
Kerppola TK. 2006. Design and implementation of bimolecular fluorescence complementation (BiFC) assays for the visualization of protein interactions in living cells. Nature Protocols 1, 1278–1286.
Koch KE. 1996. Carbohydrate-modulated gene expression in plants. Annual Review of Plant Physiology and Plant Molecular Biology 47, 509–540.
Kutschera U, Heiderich A. 2002. Sucrose metabolism and cellulose biosynthesis in sunflower hypocytyls. Physiologia Plantarum 114, 372–379.
Laporte MM, Galagan JA, Prasch AL, Vanderveer PJ, Hanson DT, Shewmaker CK, Sharkey TD. 2001. Promoter strength and tissue specificity effects on growth of tomato plants transformed with maize sucrose-phosphate synthase. Planta 212, 817–822.
by guest on May 29, 2016
http://jxb.oxfordjournals.org/D
ownloaded from

Page 12 of 12 | Maloney et al.
Laporte MM, Galagan JA, Shapiro JA, Boersig MR, Shewmaker CKmd Sharkey TD. 1997. Sucrose phosphate synthase activity and yield analysis of tomato plants transformed with maize sucrose phosphate synthase. Planta 203, 253–259.
Lunn JE. 2003. Sucrose-phosphatase gene families in plants. Gene 303, 187–196.
Lunn JE, Hatch MD. 1997. The role of sucrose-phosphate synthase in the control of photosynthate partitioning in zea mays leaves. Australian Journal of Plant Physiology 24, 1–8.
Lunn JE, MacRae E. 2003. New complexities in the synthesis of sucrose. Current Opinion in Plant Biology 6, 208–214.
Lunn JE, Rees TA. 1990. Apparent equilibrium constant and mass-action ratio for sucrose-phosphate synthase in seeds of Pisum sativum. Biochemical Journal 267, 739–743.
Lutfiyya LL, Xu N, D’Ordine RL, Morrell JA, Miller PW, Duff SMG. 2007. Phylogenetic and expression analysis of sucrose phosphate synthase isozymes in plants. Journal of Plant Physiology 164, 923–933.
Micallef MM, Haskins KA, Vanderveer PJ, Roh KS, Shewmaker CK, Sharkey TD. 1995. Altered photosynthesis, flowering, and fruiting in transgenic tomato plants that have an increased capacity for sucrose synthesis. Planta 196, 327–334.
Park J-Y, Canam T, Kang K-Y, Ellis DD, Mansfield SD. 2008. Over-expression of an Arabidopsis family A sucrose phosphate synthase (SPS) gene alters plant growth and fibre development. Transgenic Research 17, 181–192.
Park J-Y, Canam T, Kang K-Y, Unda F, Mansfield SD. 2009. Sucrose phosphate synthase (SPS) expression influences phenology in poplar. Tree Physiology 29, 937–946.
Piotrowski M, Oecking C. 1998. Five new 14-3-3 isoforms from Nicotiana tabacum L.: implications for the phylogeny of plant 14-3-3 proteins. Planta 204, 127–130.
Ramakers C, Ruijter JM, Deprez RHL, Moorman AFM. 2003. Assumption-free analysis of quantitative real-time polymerase chain reaction (PCR) data. Neuroscience Letters 339, 62–66.
Reimholz R, Geiger M, Haake V, Deiting U, Krause KP, Sonnewald U, Stitt M. 1997. Potato plants contain multiple forms of sucrose phosphate synthase, which differ in their tissue distributions, their levels during development, and their responses to low temperature. Plant, Cell and Environment 20, 291–305.
Salerno GL, Curatti L. 2003. Origin of sucrose metabolism in higher plants: when, how and why? Trends in Plant Science 8, 63–69.
Salerno GL, Echeverria E, Pontis HG. 1996. Activation of sucrose-phosphate synthase by a protein factor/sucrose-phosphate phosphatase. Cellular and Molecular Biology 42, 665–672.
Seo HS, Koo YJ, Lim JY, Song JT, Kim CH, Kim J-K, Lee JS, Choi YD. 2000. Characterization of a bifunctional fusion enzyme between trehalose 6-phosphate synthase and trehalose 6-phosphate phosphatase of Escherichia coli. Applied and Environmental Microbiology 66, 2484–2490.
Sharkey TD, Laporte MM, Lu Y, Weise SE, Weber APM. 2004. Engineering plants for elevated CO2: a relationship between sugar sensing and starch degradation. Plant Biology 6, 280–288.
Sparkes IA, Runions J, Kearns A, Hawes C. 2006. Rapid, transient expression of fluorescent fusion proteins in tobacco plants and generation of stably transformed plants. Nature Protocols 1, 2019–2025.
Stitt M, Wilke I, Feil R, Heldt HW. 1988. Coarse control of sucrose-phosphate synthase in leaves—alterations of the kinetic-properties in response to the rate of photosynthesis and the accumulation of sucrose. Planta 174, 217–230.
Sturm A. 1999. Invertases. primary structures, functions, and roles in plant development and sucrose partitioning. Plant Physiology 121, 1–7.
Subramanian C, Kim BH, Lyssenko NN, Xu XD, Johnson CH, von Arnim AG. 2004. The arabidopsis repressor of light signaling, COP1, is regulated by nuclear exclusion: mutational analysis by bioluminescence resonance energy transfer. Proceedings of the National Academy of Sciences, USA 101, 6798–6802.
Subramanian C, Woo J, Cai X, Xu X, Servick S, Johnson CH, Nebenfuhr A, von Arnim AG. 2006. A suite of tools and application notes for in vivo protein interaction assays using bioluminescence resonance energy transfer (BRET). The Plant Journal 48, 138–152.
Toroser D, Athwal GS, Huber SC. 1998. Site-specific regulatory interaction between spinach leaf sucrose-phosphate synthase and 14-3-3 proteins. FEBS Letters 435, 110–114.
Worrell AC, Bruneau JM, Summerfelt K, Boersig M, Voelker TA. 1991. Expression of a maize sucrose phosphate synthase in tomato alters leaf carbohydrate partitioning. The Plant Cell 3, 1121–1130.
Yadav UP, Ivakov A, Feil R, et al. 2014. The sucrose-trehalose 6-phosphate (Tre6P) nexus: specificity and mechanisms of sucrose signalling by Tre6P. Journal of Experimental Botany 65, 1051–1068. by guest on M
ay 29, 2016http://jxb.oxfordjournals.org/
Dow
nloaded from