Using CART to identify prescribing thresholds for ...
25
1 Using CART to identify prescribing thresholds for cardiovascular disease. Chris Schilling b,d , Duncan Mortimer a , Kim Dalziel b , Emma Heeley c , John Chalmers c , Philip Clarke b . a) Centre for Health Economics, Monash Business School, Monash University, Victoria 3800, Australia b) Centre for Health Economics, School of Population and Global Health, University of Melbourne, Victoria 3051, Australia c) The George Institute for Global Health, The University of Sydney and the Royal Prince Alfred Hospital, Sydney, New South Wales 2050, Australia d) Corresponding author [email protected] +61 3 9035 3965 Key Words: funding of health care, prescribing, cardiovascular disease, CART This work was supported by Monash University, the George Institute for Global Health and the University of Melbourne. The authors declare that they have no conflicts of interest.
-
Upload
khangminh22 -
Category
Documents
-
view
1 -
download
0
Transcript of Using CART to identify prescribing thresholds for ...
1
Using CART to identify prescribing thresholds for cardiovascular
disease.
Chris Schillingb,d,
Duncan Mortimera,
Kim Dalzielb,
Emma Heeleyc,
John Chalmersc,
Philip Clarkeb.
a) Centre for Health Economics, Monash Business School, Monash University, Victoria
3800, Australia
b) Centre for Health Economics, School of Population and Global Health, University of
Melbourne, Victoria 3051, Australia
c) The George Institute for Global Health, The University of Sydney and the Royal Prince
Alfred Hospital, Sydney, New South Wales 2050, Australia
d) Corresponding author [email protected] +61 3 9035 3965
Key Words: funding of health care, prescribing, cardiovascular disease, CART
This work was supported by Monash University, the George Institute for Global Health and
the University of Melbourne. The authors declare that they have no conflicts of interest.
2
Using CART to identify prescribing patterns for cardiovascular
disease.
Abstract
Background and objective
Many guidelines for clinical decisions are hierarchical and non-linear. Evaluating if these
guidelines are used in practice requires methods that can identify such structures and
thresholds. We use classification and regression trees (CART) to analyse prescribing patterns
of Australian general practitioners (GPs) for the primary prevention of cardiovascular
disease. Our aim is to identify if GPs use absolute risk (AR) guidelines in favour of
individual risk factors to inform their prescribing decisions of lipid-lowering medications.
Methods
We employ administrative prescribing information that is linked to patient level data from a
clinical assessment and patient survey (the AusHeart Study). We assess prescribing of lipid-
lowering medications over a twelve month period for patients (n=1903) who were not using
such medications prior to recruitment. CART models are developed to explain prescribing
practice. Out-of-sample performance is evaluated using receiver operating characteristic
(ROC) curves and optimized via pruning.
Results
We find that individual risk factors (low-density lipoprotein, diabetes, triglycerides and
cardiovascular disease (CVD) history), GP-estimated rather than Framingham absolute risk,
and socio-demographic factors (household income, education) are the predominant drivers of
GP prescribing. However, socio-demographic factors and some individual risk factors
(triglycerides and CVD history) only become relevant for patients with a particular profile of
other risk factors. The ROC area-under-the-curve is 0.63 (95% confidence interval (CI) 0.60,
0.64).
Conclusion
There is little evidence that AR guidelines recommended by the National Heart Foundation
and National Vascular Disease Prevention Alliance, or conditional individual risk eligibility
guidelines from the Pharmaceutical Benefits Scheme, are adopted in prescribing practice. The
hierarchy of conditional relationships between risk factors and socio-economic factors
3
identified by CART provides new insights into prescribing decisions. Overall, CART is a
useful addition to the analyst’s toolkit when investigating health care decisions.
Key Points for Decision Makers
CART provides a methodology to highlight how and why variation between practice
and guidelines occurs, not just that an evidence-practice gap exists
Prescribing practices for lipid-lowering medications do not follow absolute risk
guidelines or eligibility criteria for subsidization by the Pharmaceutical Benefits
Scheme. There are potentially significant gains from clarifying best practice
prescribing, to promote either greater adherence to guidelines, or increased clinical
freedom
Big data techniques such as CART are applicable to a wide range of healthcare
applications, including those where big data are absent
4
1. Introduction
Physicians employ a range of risk assessment strategies when making prescribing decisions
for primary prevention of cardiovascular disease, including assessment against thresholds on
individual cardiovascular disease (CVD) risk factors, and assessment of total or absolute risk
(AR) of cardiovascular (CV) events [1, 2].
Internationally, many clinical practice guidelines recommend calculation of AR of CV
events, with lipid-lowering medication (typically statins or statins in combination with
another drug) recommended for patients evaluated as high risk1. In Australia, an AR
approach is recommended by the National Vascular Disease Prevention Alliance (NVDPA)
[5] and the National Heart Foundation (NHF) [6]. However the Australian Government’s
universal drug insurance scheme, the Pharmaceutical Benefits Scheme (PBS), limits the
subsidising of these medicines using eligibility criteria based on individual risk factors such
as diabetes and cholesterol.
In practice, several studies suggest that clinicians deviate from guidelines and/or eligibility
criteria [7, 8], perhaps in response to care seeking behaviour from patients or other aspects of
patient preference [1, 2]. However Bonner et al [1] noted that while CVD risk management is
not consistently based on AR, “little is known about… …the alternative strategies employed
when AR is not the focus of assessment”. Similarly, few studies have formally tested whether
different prescribing thresholds are being applied in different patient groups and many have
struggled to characterise the complexity of prescribing practice [1, 9].
The purpose of this paper is to employ classification and regression trees (CART) to analyse
the prescribing patterns of Australian general practitioners (GPs) of lipid-lowering
medication for the primary prevention of CVD. CART is a machine-learning ‘big data’
technique that has been shown to be particularly valuable when analysing non-linear
relationships and interactions, where it can outperform standard regression models for
classification [10]. We aim to use CART to improve our understanding of clinical practice;
potentially identifying prescribing thresholds and patient sub-groups missed by traditional
analyses, and to demonstrate how CART can be useful for understanding complex treatment
decisions in health care.
1 For example, the American Heart Association (AHA) recommends using a modified Framingham equation [3].
In the United Kingdom, the National Institute for Health and Clinical Excellence (NICE) recommends an
absolute CVD risk algorithm known as QRISK2 [4].
5
2. Methods
2.1 Data
We use linked survey and administrative data from the AusHeart Study, a cluster-stratified,
cross-sectional survey of CVD risk management in primary care fully documented elsewhere
[7, 11, 12]. The study enrolled GPs from across Australia, who recruited 15-20
consecutively-presenting adults aged 55 years or older. It gathered information on patient
socio-economic factors, CVD risk factors, prescribed medications, and the GP’s own
estimation of the patient’s AR of a CV event within the next 5 years [7].
These data were linked for consenting patients to Medicare administrative data containing
records of all pharmaceuticals purchased under the PBS from 1 March 2008 to 1 January
2010 [12]. To avoid complications associated with prior exposure to medication, we reduce
the dataset to 1,903 patients who had not been prescribed lipid-lowering medication prior to
GP recruitment2. We develop models to classify these patients according to prescription or
not of any lipid-lowering medication (Anatomical Therapeutic Chemical code C10) during a
one year period.
2.2 CART methodology
CART sorts observations into increasingly homogeneous sub-groups [13]. At each step,
CART splits observations using a simple decision-rule (e.g. if total cholesterol exceeds 7.0
mmol/L then prescribe medication) chosen to minimise diversity (with respect to the binary
outcome or classification) in right and left ‘child nodes’. Branches and nodes are added until
a stopping criteria is met and the tree terminates in ‘leaves’ or ‘bins’ containing proportions
of correctly and incorrectly classified observations [10]3.
There are three distinct strengths of CART that make it particularly applicable to analysing
complex decision-making processes such as those employed in clinical practice. First, the
hierarchical structure of CART models is often more intuitive than traditional regression
models, because it mimics the heuristics of decision making [14, 15]. Second, CART can
outperform standard regression models when predicting outcomes in the presence of non-
linear relationships and interactions [10]. In clinical practice, treatment decisions may depend
on non-linear thresholds with respect to one or more risk factors, and thresholds may vary
with other risk factors. For example, PBS guidelines allow prescribing of statins for patients
2 Prior exposure to medication is not preferred as we would observe risk factors after response to treatment. 3 See Schilling et al (forthcoming) for a step-by-step guide to CART modelling.
6
with hypercholesterolemia (>9 mmol/L) [16]. This drops to >5.5mmol/L if the patient has
diabetes [16]4. Third, CART affords the data greater freedom to speak for themselves [20].
Whereas regression models are refined by comparing across a limited number of possible
specifications, CART performs an exhaustive search over all possible cut-points and
predictors [10]. As a result, the precise form of the relationship between a predictor and
outcome is not delimited by the inclusion/exclusion of higher order terms. It is this strength
that has seen CART used in a variety of prognostic analyses to identify risk thresholds for in-
hospital mortality [21], vertebral fractures [22] and cirrhosis [23].
CART is however subject to a number of limitations. CART “…tends not to work very well
if the underlying relationship is linear” [10]. A second limitation in CART is the risk of
overfitting [24, 25]. Finally, CART can be prone to instability. Small differences in the
training data can lead to very different trees [26]. We manage these limitations in the
methodology below.
2.3 Using CART to understand prescribing in CVD
We use a 3-stage approach to construct the CART. In CART-1, we limit predictors to patient
socio-demographics (age, gender, Aboriginal/Torres Strait Islander, household income and
education level) and GP-estimated 5-year AR of a CV event. This provides a benchmark for
which to compare performance. In CART-2, we add individual risk factors (smoking, body
mass index, systolic and diastolic blood pressure, low and high density lipoprotein
cholesterol, total cholesterol, triglycerides, kidney disease, diabetes, CVD history, weekly
exercise and self-reported health) “…to determine whether cardiovascular risk factors might
have an additional influence on prescribing beyond their contribution to [GP-estimated]
cardiovascular risk” [27]. Finally in CART-3 we add AR estimated using the 1991
Framingham risk equations. Framingham AR forms the basis of the NHF 2004 and NVDPA
2008 guidelines. If GPs adopt NHF or NVDPA guidelines, we would expect the addition of
Framingham AR to improve the predictive validity of the CART, and to see cut-off
thresholds and a hierarchy similar to the guidelines (described in Appendix 1).
We implement CART using the Matlab fitctree function [28]. We use Gini’s diversity index
as the default splitting criterion as suggested by Breiman et al [24], and compare model
4 Similar complications exist in clinical decision-making in general [17], and in observed (as well as
recommended) prescribing patterns for statins [1, 18, 19].
7
performance under entropy splitting to check model robustness. In our default models,
variables with missing data still enter the model, but training uses only valid values. In
prediction, an observation with a missing value is assigned to the largest split group. An
alternative method for dealing with missing data in CART is to find ‘surrogate’ variables, by
applying CART with the missing data as the dependent variable [28]. We check model
performance under these two methods to test robustness. We use ten-fold cross validation to
indirectly evaluate out-of-sample performance5. We bootstrap the cross-validation one
hundred times to describe the distribution of mean out-of-sample error and receiver operating
characteristic (ROC) area-under-curve metric. We prune the CART to reduce overfitting and
optimise out-of-sample performance. This helps to eliminate illogical branches that can grow
from the sample data but that would not perform well out-of-sample (e.g. where a node
suggests that patients with a household income between $52,000 and $72,799 are less likely
to be prescribed than those with a household income below $52,000 or above $72,799).
Where there is no difference in out-of-sample performance, we follow Breiman et al [24] in
preferring smaller trees over larger ones.
Once optimised, we evaluate the structure of the CART to identify patient sub-groups and
prescribing thresholds. We calculate a predictor-importance metric for the preferred model
using the predictor-importance Matlab algorithm6. Next, we compare patient sub-groups and
prescribing thresholds identified by the CART against NHF 2004, NVDPA 2008 and PBS
guidelines to identify similarities and differences.
Finally, we evaluate the stability of our results. The robustness of predictor-importance and
specific hierarchies is difficult to assess, because of the conditional nature of the CART [30].
As a simple guide, we train one hundred ‘bagged’ trees7 on bootstrapped samples of the data,
and count the number of times each predictor appears [32, 33]. Following Dannegger [32],
we calculate confidence intervals and density functions of the cut-off thresholds used at key
decision nodes to highlight stability.
3. Results
3.1 Prescribing and risk factor statistics
5 This has been shown to be an optimal method for model selection [29]. 6 This identifies all the nodes where the predictor is selected, sums the improvement in classification from each
of these and divides by the number of tree branches [28]. 7 Bagging or ‘bootstrapped aggregating’ is a method for generating multiple versions of a tree to allow
evaluation of predictor stability [31].
8
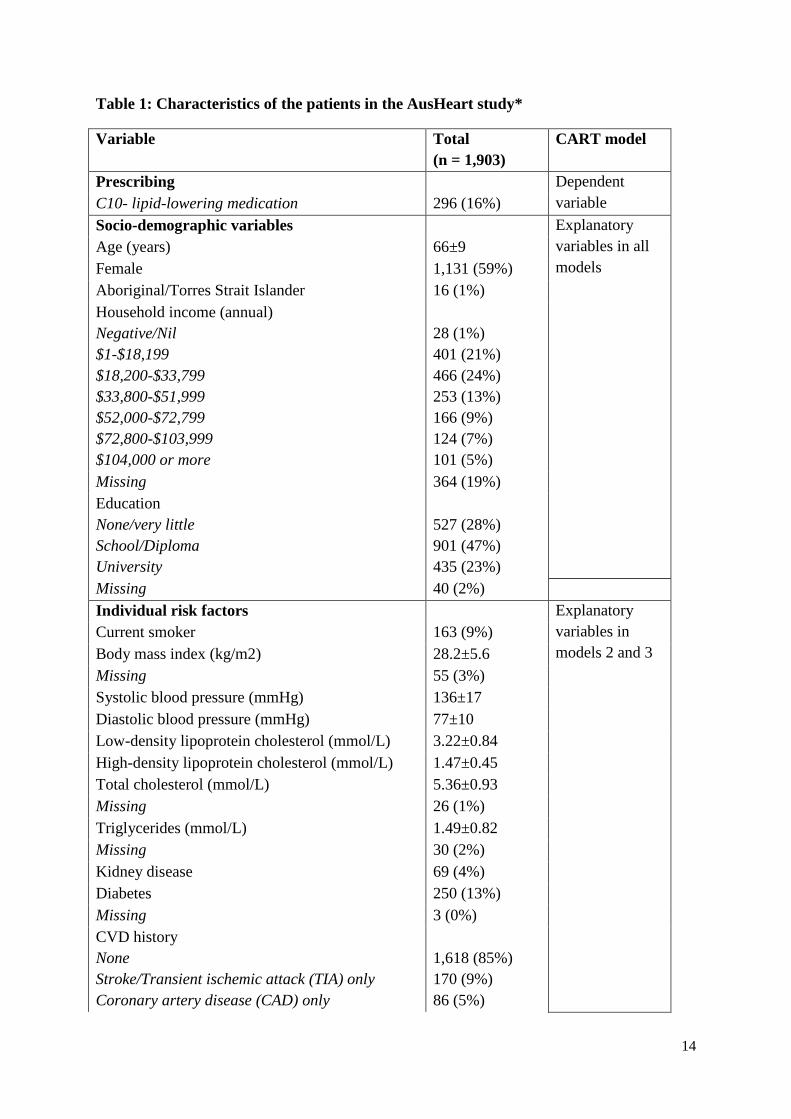
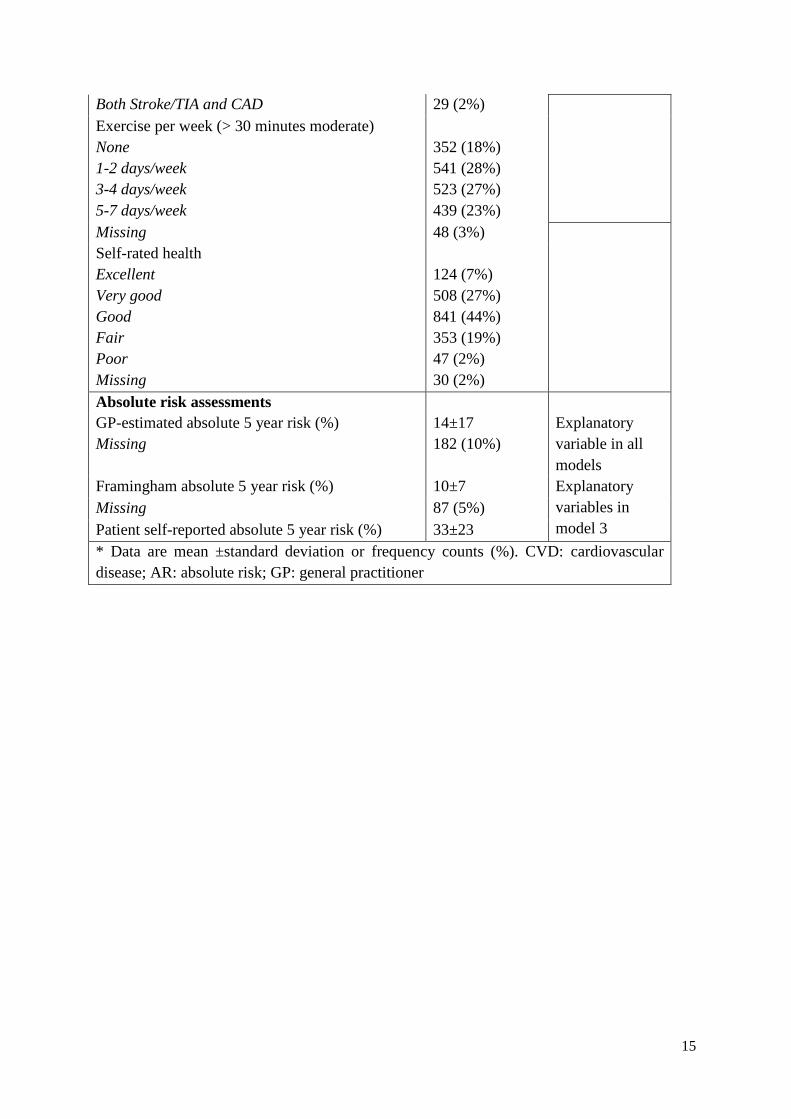
Table 1 provides the sample mean and standard deviation or frequency count and percentage
for demographic and clinical characteristics. Of the 1,903 patients 296 (16%) were prescribed
lipid-lowering medication.
INSERT TABLE 1 HERE
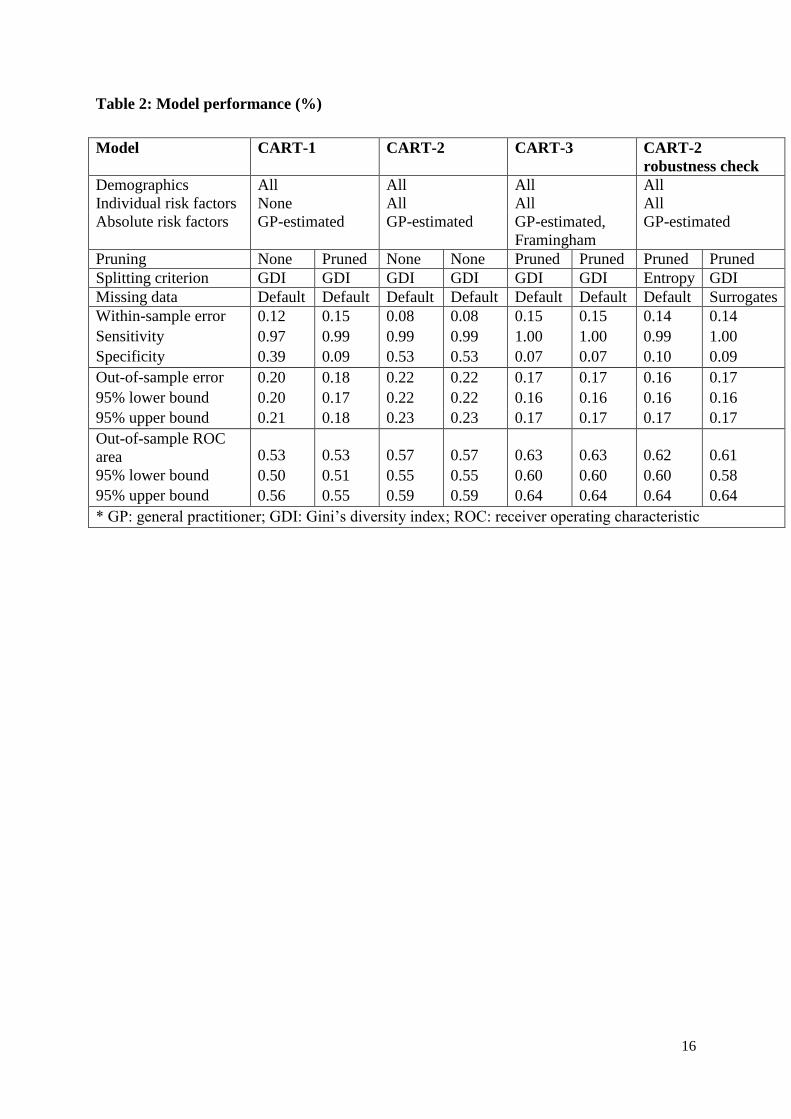
3.2 Model performance
CART-1 considers only patient demographics and the GP-estimated 5-year AR of a CV
event. It provides a performance benchmark but is not expected to perform well given the
absence of individual risk factors or Framingham AR. The unpruned CART-1 correctly
identifies 1,560 (97%) of patients who were not prescribed lipid-lowering medication, but
only 115 (39%) of those who were, for an overall within-sample error rate of 12%. As
expected, the performance of CART-1 drops when moving out-of-sample; error increases to
20% (95% CI: 20%-21%) but with pruning this is reduced to 18% (17%-18%). The out-of-
sample ROC metric is 0.53 (0.51-0.55), indicating the model is barely better than a random
guess at predicting prescribing patterns (Table 2).
CART-2 adds thirteen individual risk factors to CART-1. This improves both within and out-
of-sample performance. Within sample, the model correctly identifies 1,585 (99%) of patients
who were not prescribed lipid-lowering medication, and 157 (53%) of those who were, for an
overall error rate of 8%. After pruning, the out-of-sample error is 17% (16%-17%) and the
ROC metric is 0.63 (0.60-0.64).
CART-3 adds Framingham AR to CART-2, which should identify NHF and/or NVDPA
guidelines if they are followed. Within sample, the model correctly identifies 1,579 (98%) of
patients who were not prescribed, and 172 (58%) of those who were, for an overall error rate
of 8%. After pruning, the out-of-sample error is 17% (16%-18%) and the ROC metric is 0.62
(0.60-0.63), which is not significantly different from CART-2. Framingham AR does not
appear in the pruned version of CART-3.
INSERT TABLE 2 HERE
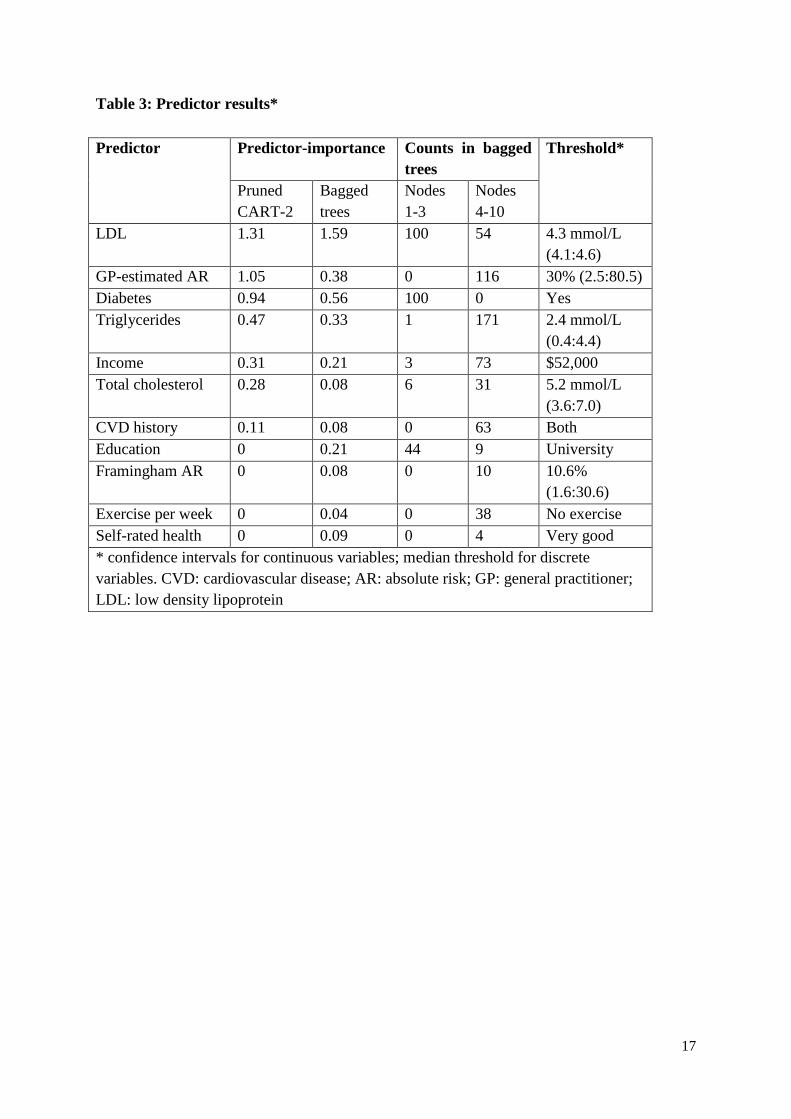
3.3 Predictors of prescribing
Household income, GP-estimated AR and individual risk factors LDL, diabetes, total
cholesterol, CVD history and triglycerides all influence GP prescribing under the pruned
9
CART-2 model. The predictor-importance results suggest that LDL, GP-estimated AR and
diabetes make the most improvement to classification, followed by triglycerides, income,
total cholesterol and CVD history (Table 3).
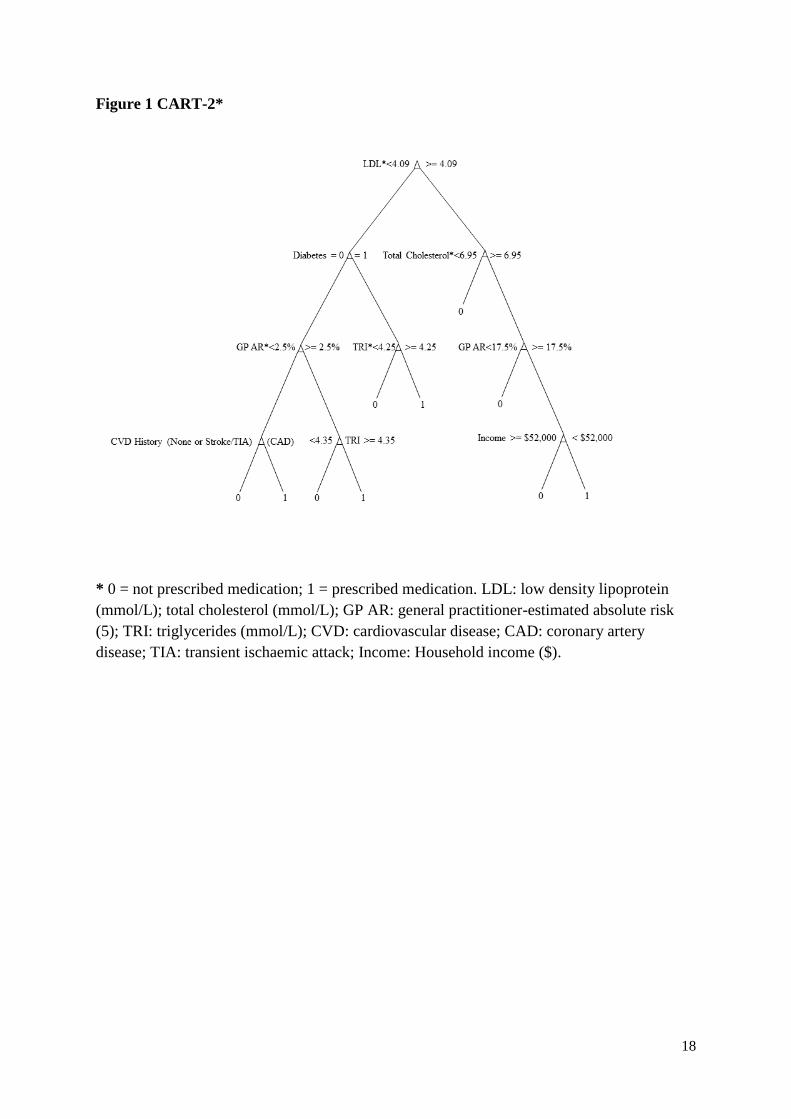
Figure 1 shows interactions between the AR assessments, individual risk factors, and socio-
demographic factors, and highlights the paths that lead to prescribing. On the right hand side
of the tree, prescribing is most likely for patients with high LDL (>4.09 mmol/L), high total
cholesterol (>6.95 mmol/L), high GP-estimated AR (>17.5%) and relatively low household
income (<$52,000). On the left-hand side of the tree, patients without high LDL (<4.09
mmol/L) are more likely to be prescribed if they have high triglycerides (≥4.25 mmol/L for
patients with diabetes; ≥4.35 mmol/L for patients without diabetics and with GP-estimated
AR ≥ 2.5%), or if they have previously had a coronary artery event.
CART also highlights interactions where prescribing is unlikely. Patients with high LDL,
total cholesterol and GP-estimated AR are less likely to be prescribed lipid-lowering
medication if they have relatively high household income (≥$52,000). Patients with high LDL
and high total cholesterol but without high GP-estimated AR are also less likely to be
prescribed. Finally, prescribing is less likely for patients with high LDL but without high total
cholesterol.
INSERT FIGURE 1 HERE
3.4 Robustness of results
Comparison of CART-2 performance under different splitting criteria and approaches to
missing data show no significant differences in ROC out-of-sample performance (Table 2).
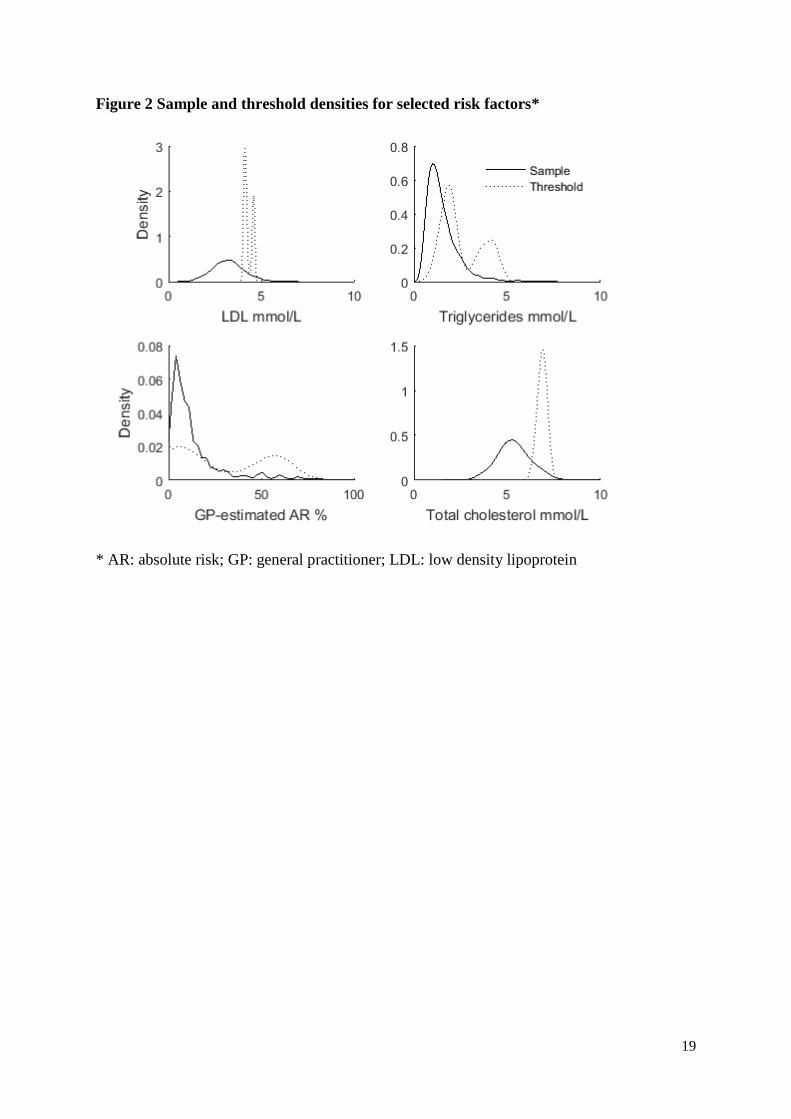
Comparison of the 100 bagged trees highlights robustness of the specific hierarchies and
decision nodes within CART-2. LDL and diabetes appear in all 100 trees, at the root and
second node positions, and have the highest average predictor-importance (Table 3). The
LDL decision threshold is bimodal, with a mode at 4.6 mmol/L in addition to the 4.1 mmol/L
suggested in CART-2 (Figure 2), however the difference between modes is less than one
standard deviation in LDL in the sample (0.8 mmol/L). By contrast, total cholesterol, appears
at the third node in only 6 of the 100 bagged trees. Education (those with University
education are less likely to be prescribed) appears 44 times at node 3. Triglycerides and GP-
estimated AR, which appear twice in CART-2, appear 171 and 116 times respectively within
the first 10 nodes. The triglyceride decision threshold shows the cut-off at 4.3 mmol/L as
10
seen in CART-2, but also identifies another mode at 2.0 mmol/L. Household income appears
76 times in the first 10 nodes with the median cut-off at $52,000 as per CART-2. Exercise,
Framingham AR and self-rated health status are not present in the pruned CART-2 model,
but appear in 38, 10 and four of the 100 bagged trees’ first 10 nodes.
INSERT TABLE 3 HERE
INSERT FIGURE 2 HERE
4 Discussion
4.1 Key findings
Prescribing varies across GPs and does not appear to follow AR guidelines or PBS
regulations
We find that prescribing practices do not appear to be congruent with NHF, NVDPA or PBS
eligibility guidelines. NHF and NVDPA use Framingham AR assessment as the basis of their
guidelines, yet thresholds on Framingham AR rarely appear in the CART. The guidelines
also recommend prescribing on the basis of individual risk factors (e.g. for patients with
kidney disease or diabetes). Kidney disease does not appear in CART-2. Diabetes does
appear, but is neither necessary nor sufficient for prescription.
Similarly, the PBS has conditional criteria based on individual risk that govern eligibility,
such as total cholesterol >5.5 mmol/L for patients with diabetes, and >6.5 mmol/L for
patients with HDL <1 mmol/L. These decision branches do not appear in CART-2. However
the model suggests that prescribing is more likely for low LDL patients with triglycerides
>4.25 mmol/L (for patients with diabetes) and >4.35 mmol/L (for patients with high GP-
estimated AR). This is somewhat consistent with the PBS, which allows prescribing for a
subset of patients with triglycerides >4 mmol/L.
Our findings contribute to a growing body of evidence [2, 7, 18, 27] suggesting there is
considerable room for improvement in the prescribing practices for CVD. If guidelines
provide an accurate description of optimal treatment, divergence from guidelines is likely to
be costly, both in terms of health expenditure and patient outcomes. For example, the
prescription of drugs to patients that fall outside the specified indications, often referred to as
11
leakage [34], is likely to diminish the real-world cost-effectiveness of pharmaceuticals if it
results in patients gaining a lower average benefit than was assumed at the time of the
approval for use. There may then be dividends from interventions to improve adherence to
guidelines, such as IMPLEMENT, ALIGN and IRIS [35-37]. CART would be an appropriate
method to assess such adherence. Conversely, if thresholds for reimbursement constrain best
practice prescribing (e.g. based on total or AR of CV events or a more thorough
understanding of the patient), there may be a case for removing thresholds for reimbursement
and allowing increased clinical freedom in prescribing. Either way, there are potentially
significant opportunity costs to this uncertainty.
While we find discordance between practice and guidelines, we do not identify one standard
decision-tree that consistently explains prescribing behaviour across our representative
dataset. Instead we find that prescribing practices vary across the GP population. This is
perhaps unsurprising given the volume of guidance available [38] and the potential for
between-GP variation in uptake and acceptance of decision-support tools and guideline
recommendations [39]. We posit that the low ROC performance of the CART models is a
result of this variation. In an environment of clearer and more widely adopted guidelines, we
would expect the ROC performance to improve.
CART suggests how and why GP prescribing deviates from guidelines
The CART analysis provides additional insights regarding the roles of individual risk factors
and the hierarchy of GP decision-making. LDL is the root node in all bagged trees, suggesting
it is the first risk factor used in the decision-making process. Similarly, diabetes is
consistently the second node in the decision-tree, suggesting it is an important risk factor that
GPs consider in decision-making. It is well established that lowering CV risk is associated
with the degree to which statins reduce LDL cholesterol [40]. Similarly statins have been
widely prescribed in people with diabetes given their higher CV risk [41]. It appears that
evidence regarding these risk factors takes precedence over AR and the eligibility criteria.
We also show that prescribing to high-risk patients varies based on the patient’s household
income and/or educational attainment, with those with household income above $52,000 or
with a university degree unlikely to be prescribed. There has been some evidence of this
internationally [42, 43] however the CART method uncovers the hierarchy of these factors.
Specifically, we show that income/educational attainment are deciding factors at the bottom
12
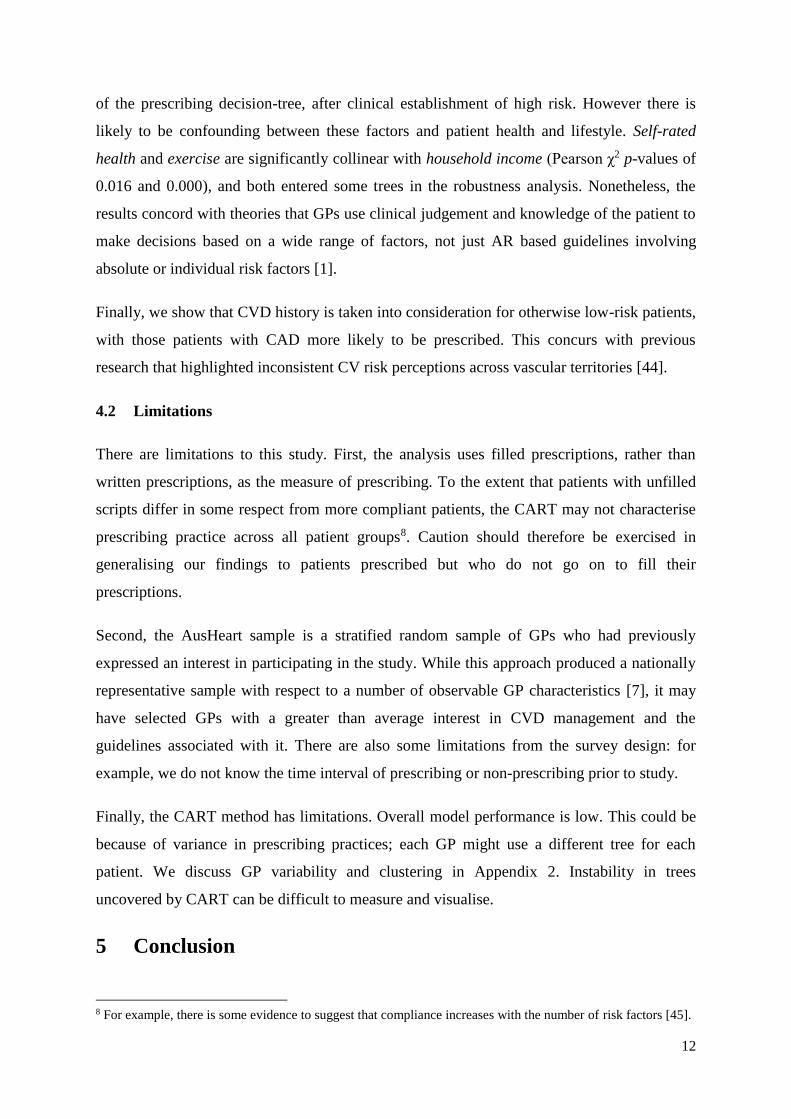
of the prescribing decision-tree, after clinical establishment of high risk. However there is
likely to be confounding between these factors and patient health and lifestyle. Self-rated
health and exercise are significantly collinear with household income (Pearson χ2 p-values of
0.016 and 0.000), and both entered some trees in the robustness analysis. Nonetheless, the
results concord with theories that GPs use clinical judgement and knowledge of the patient to
make decisions based on a wide range of factors, not just AR based guidelines involving
absolute or individual risk factors [1].
Finally, we show that CVD history is taken into consideration for otherwise low-risk patients,
with those patients with CAD more likely to be prescribed. This concurs with previous
research that highlighted inconsistent CV risk perceptions across vascular territories [44].
4.2 Limitations
There are limitations to this study. First, the analysis uses filled prescriptions, rather than
written prescriptions, as the measure of prescribing. To the extent that patients with unfilled
scripts differ in some respect from more compliant patients, the CART may not characterise
prescribing practice across all patient groups8. Caution should therefore be exercised in
generalising our findings to patients prescribed but who do not go on to fill their
prescriptions.
Second, the AusHeart sample is a stratified random sample of GPs who had previously
expressed an interest in participating in the study. While this approach produced a nationally
representative sample with respect to a number of observable GP characteristics [7], it may
have selected GPs with a greater than average interest in CVD management and the
guidelines associated with it. There are also some limitations from the survey design: for
example, we do not know the time interval of prescribing or non-prescribing prior to study.
Finally, the CART method has limitations. Overall model performance is low. This could be
because of variance in prescribing practices; each GP might use a different tree for each
patient. We discuss GP variability and clustering in Appendix 2. Instability in trees
uncovered by CART can be difficult to measure and visualise.
5 Conclusion
8 For example, there is some evidence to suggest that compliance increases with the number of risk factors [45].
13
While previous studies showed discordance between evidence and practice, CART extends
traditional analyses by highlighting the alternative decision-trees and key factors that GPs use
in practice to make prescribing decisions. The advantages of CART are the ability to identify
hierarchies and non-linearities, and to provide results that are relatively easy to understand.
These strengths are evident in this analysis, which show hierarchical decisions with complex
interactions between individual risk factors and socio-demographic factors.
This example has shown that the CART big data technique is applicable to a wide range of
healthcare topics, including those where big data are absent. There are an increasing range of
applications in healthcare that utilize CART’s strength in uncovering non-linear thresholds
and hierarchies to develop guidelines for clinical decisions. It follows that evaluating if these
guidelines are used in practice requires methods that can identify such structures and
thresholds. In these instances, CART provides a useful addition to the analyst’s toolkit.
14
Table 1: Characteristics of the patients in the AusHeart study*
Variable Total
(n = 1,903)
CART model
Prescribing Dependent
variable C10- lipid-lowering medication 296 (16%)
Socio-demographic variables Explanatory
variables in all
models
Age (years) 66±9
Female 1,131 (59%)
Aboriginal/Torres Strait Islander 16 (1%)
Household income (annual)
Negative/Nil
$1-$18,199
$18,200-$33,799
$33,800-$51,999
$52,000-$72,799
$72,800-$103,999
$104,000 or more
28 (1%)
401 (21%)
466 (24%)
253 (13%)
166 (9%)
124 (7%)
101 (5%)
Missing 364 (19%)
Education
None/very little
School/Diploma
University
527 (28%)
901 (47%)
435 (23%)
Missing 40 (2%)
Individual risk factors Explanatory
variables in
models 2 and 3
Current smoker 163 (9%)
Body mass index (kg/m2) 28.2±5.6
Missing 55 (3%)
Systolic blood pressure (mmHg) 136±17
Diastolic blood pressure (mmHg) 77±10
Low-density lipoprotein cholesterol (mmol/L) 3.22±0.84
High-density lipoprotein cholesterol (mmol/L) 1.47±0.45
Total cholesterol (mmol/L) 5.36±0.93
Missing 26 (1%)
Triglycerides (mmol/L) 1.49±0.82
Missing 30 (2%)
Kidney disease 69 (4%)
Diabetes 250 (13%)
Missing 3 (0%)
CVD history
None
Stroke/Transient ischemic attack (TIA) only
Coronary artery disease (CAD) only
1,618 (85%)
170 (9%)
86 (5%)
15
Both Stroke/TIA and CAD 29 (2%)
Exercise per week (> 30 minutes moderate)
None
1-2 days/week
3-4 days/week
5-7 days/week
352 (18%)
541 (28%)
523 (27%)
439 (23%)
Missing 48 (3%)
Self-rated health
Excellent
Very good
Good
Fair
Poor
Missing
124 (7%)
508 (27%)
841 (44%)
353 (19%)
47 (2%)
30 (2%)
Absolute risk assessments
GP-estimated absolute 5 year risk (%)
Missing
14±17
182 (10%)
Explanatory
variable in all
models
Framingham absolute 5 year risk (%) 10±7 Explanatory
variables in
model 3
Missing 87 (5%)
Patient self-reported absolute 5 year risk (%) 33±23
* Data are mean ±standard deviation or frequency counts (%). CVD: cardiovascular
disease; AR: absolute risk; GP: general practitioner
16
Table 2: Model performance (%)
Model CART-1 CART-2 CART-3 CART-2
robustness check
Demographics All All All All
Individual risk factors None All All All
Absolute risk factors GP-estimated GP-estimated GP-estimated,
Framingham
GP-estimated
Pruning None Pruned None None Pruned Pruned Pruned Pruned
Splitting criterion GDI GDI GDI GDI GDI GDI Entropy GDI
Missing data Default Default Default Default Default Default Default Surrogates
Within-sample error 0.12 0.15 0.08 0.08 0.15 0.15 0.14 0.14
Sensitivity 0.97 0.99 0.99 0.99 1.00 1.00 0.99 1.00
Specificity 0.39 0.09 0.53 0.53 0.07 0.07 0.10 0.09
Out-of-sample error 0.20 0.18 0.22 0.22 0.17 0.17 0.16 0.17
95% lower bound 0.20 0.17 0.22 0.22 0.16 0.16 0.16 0.16
95% upper bound 0.21 0.18 0.23 0.23 0.17 0.17 0.17 0.17
Out-of-sample ROC
area 0.53 0.53 0.57 0.57 0.63 0.63 0.62 0.61
95% lower bound 0.50 0.51 0.55 0.55 0.60 0.60 0.60 0.58
95% upper bound 0.56 0.55 0.59 0.59 0.64 0.64 0.64 0.64
* GP: general practitioner; GDI: Gini’s diversity index; ROC: receiver operating characteristic
17
Table 3: Predictor results*
Predictor Predictor-importance Counts in bagged
trees
Threshold*
Pruned
CART-2
Bagged
trees
Nodes
1-3
Nodes
4-10
LDL 1.31 1.59 100 54 4.3 mmol/L
(4.1:4.6)
GP-estimated AR 1.05 0.38 0 116 30% (2.5:80.5)
Diabetes 0.94 0.56 100 0 Yes
Triglycerides 0.47 0.33 1 171 2.4 mmol/L
(0.4:4.4)
Income 0.31 0.21 3 73 $52,000
Total cholesterol 0.28 0.08 6 31 5.2 mmol/L
(3.6:7.0)
CVD history 0.11 0.08 0 63 Both
Education 0 0.21 44 9 University
Framingham AR 0 0.08 0 10 10.6%
(1.6:30.6)
Exercise per week 0 0.04 0 38 No exercise
Self-rated health 0 0.09 0 4 Very good
* confidence intervals for continuous variables; median threshold for discrete
variables. CVD: cardiovascular disease; AR: absolute risk; GP: general practitioner;
LDL: low density lipoprotein
18
Figure 1 CART-2*
* 0 = not prescribed medication; 1 = prescribed medication. LDL: low density lipoprotein
(mmol/L); total cholesterol (mmol/L); GP AR: general practitioner-estimated absolute risk
(5); TRI: triglycerides (mmol/L); CVD: cardiovascular disease; CAD: coronary artery
disease; TIA: transient ischaemic attack; Income: Household income ($).
19
Figure 2 Sample and threshold densities for selected risk factors*
* AR: absolute risk; GP: general practitioner; LDL: low density lipoprotein
20
References
1. Bonner, C., et al., General practitioners’ use of different cardiovascular risk
assessment strategies: a qualitative study. Med J Aust, 2013. 199(7): p. 485-489.
2. Jansen, J., et al., General practitioners’ use of absolute risk versus individual risk
factors in cardiovascular disease prevention: an experimental study. BMJ Open,
2014. 4(5): p. e004812.
3. Greenland, P., et al., 2010 ACCF/AHA Guideline for Assessment of Cardiovascular
Risk in Asymptomatic Adults: A Report of the American College of Cardiology
Foundation/American Heart Association Task Force on Practice Guidelines
Developed in Collaboration With the American Society of Echocardiography,
American Society of Nuclear Cardiology, Society of Atherosclerosis Imaging and
Prevention, Society for Cardiovascular Angiography and Interventions, Society of
Cardiovascular Computed Tomography, and Society for Cardiovascular Magnetic
Resonance. Journal of the American College of Cardiology, 2010. 56(25): p. e50-
e103.
4. Stone, N.J., et al., 2013 ACC/AHA guideline on the treatment of blood cholesterol to
reduce atherosclerotic cardiovascular risk in adults. 2013.
5. Lalor, E., et al., Guidelines for the management of absolute cardiovascular disease
risk. 2012.
6. National Heart Foundation of Australia, Guide to management of hypertension 2008.
2010.
7. Heeley, E.L., et al., Cardiovascular risk perception and evidence-practice gaps in
Australian general practice (the AusHEART study). Med J Aust, 2010. 192(5): p. 254-
259.
8. Razavian, M., et al., Cardiovascular risk management in chronic kidney disease in
general practice (the AusHEART study). Nephrology Dialysis Transplantation, 2011:
p. gfr599.
9. Zwar, N., et al., GPs' views of absolute cardiovascular risk and its role in primary
prevention. Australian family physician, 2005. 34(6): p. 503.
10. Varian, H.R., Big data: New tricks for econometrics. The Journal of Economic
Perspectives, 2014: p. 3-27.
21
11. Knott, R.J., et al., How fair is Medicare? The income-related distribution of Medicare
benefits with special focus on chronic care items. The Medical Journal of Australia,
2012. 197: p. 625-630.
12. Knott, R.J., et al., The effects of reduced copayments on discontinuation and
adherence failure to statin medication in Australia. Health Policy, 2015.
13. Hothorn, T., et al., Party: A laboratory for recursive partytioning, 2010.
14. Drakopoulos, S.A., Hierarchical choice in economics. Journal of Economic Surveys,
1994. 8(2): p. 133-153.
15. Scott, A., Identifying and analysing dominant preferences in discrete choice
experiments: an application in health care. Journal of Economic Psychology, 2002.
23(3): p. 383-398.
16. Pharmaceutical Benefits Scheme, General Statement for Lipid-Lowering Drugs
Prescribed as Pharmaceutical Benefits, 2014.
17. Garg, A.X., et al., Effects of computerized clinical decision support systems on
practitioner performance and patient outcomes: a systematic review. JAMA, 2005.
293(10): p. 1223-1238.
18. Berthold, H., et al., Patterns and predictors of statin prescription in patients with type
2 diabetes. Cardiovascular Diabetology, 2009. 8(1): p. 25.
19. Wong, M., et al., Patterns of antihypertensive prescribing, discontinuation and
switching among a Hong Kong Chinese population from over one million
prescriptions. Journal of human hypertension, 2008. 22(10): p. 714-716.
20. Timofeev, R., Classification and regression trees (CART) theory and applications.
2004.
21. Tomcikova, D., et al., Epidemiology, Quality Improvement and Outcome: Risk of in-
hospital mortality identified according to the typology of patients with acute heart
failure: Classification tree analysis on data from the Acute Heart Failure Database–
Main registry. Journal of Critical Care, 2013. 28: p. 250-258.
22. Navarro, M.d.C., et al., Discriminative ability of heel quantitative ultrasound in
postmenopausal women with prevalent vertebral fractures: application of optimal
threshold cutoff values using classification and regression tree models. Calcified
Tissue International, 2012. 91(2): p. 114-120.
23. Shi, K.-Q., et al., Risk stratification of spontaneous bacterial peritonitis in cirrhosis
with ascites based on classification and regression tree analysis. Molecular biology
reports, 2012. 39(5): p. 6161-6169.
22
24. Breiman, L., et al., Classification and regression trees1984: CRC press.
25. Torgo, L., Inductive Learning of Tree-Based Regression Models. 1999.
26. Briand, B., et al., A similarity measure to assess the stability of classification trees.
Computational Statistics & Data Analysis, 2009. 53(4): p. 1208-1217.
27. Mohammed, M.A., C. El Sayed, and T. Marshall, Patient and other factors
influencing the prescribing of cardiovascular prevention therapy in the general
practice setting with and without nurse assessment. Medical Decision Making, 2012.
32(3): p. 498-506.
28. The Mathworks Inc, Matlab and Statistics Toolbox Release 2015a,, 2015, Natick,
Massachusetts, United States.
29. Kohavi, R. A study of cross-validation and bootstrap for accuracy estimation and
model selection. in Ijcai. 1995.
30. Kitsantas, P., M. Hollander, and L.M. Li, Assessing the stability of classification trees
using Florida birth data. Journal of Statistical Planning and Inference, 2007. 137(12):
p. 3917-3929.
31. Breiman, L., Bagging predictors. Machine learning, 1996. 24(2): p. 123-140.
32. Dannegger, F., Tree stability diagnostics and some remedies for instability. Statistics
in Medicine, 2000. 19(4): p. 475-491.
33. Strobl, C., J. Malley, and G. Tutz, An introduction to recursive partitioning:
rationale, application, and characteristics of classification and regression trees,
bagging, and random forests. Psychological methods, 2009. 14(4): p. 323.
34. Lopert, R.a.H., D;, The Pharmaceutical Benefits Scheme: economic evaluation
works… but is not a panacea. Australian Prescriber, 2002. 25(6): p. 126.
35. French, S.D., et al., Evaluation of a theory-informed implementation intervention for
the management of acute low back pain in general medical practice: the
IMPLEMENT cluster randomised trial. PLoS One, 2013. 8(6): p. e65471.
36. McKenzie, J.E., et al., Evidence-based care of older people with suspected cognitive
impairment in general practice: protocol for the IRIS cluster randomised trial.
Implement Sci, 2013. 8(1): p. 91.
37. McKenzie, J.E., et al., Improving the care for people with acute low-back pain by
allied health professionals (the ALIGN trial): A cluster randomised trial protocol.
Implement Sci, 2010. 5(1): p. 86.
38. Allen, D. and K.J. Harkins, Too much guidance? The Lancet, 2005. 365(9473): p.
1768.
23
39. Prevedello, L.M., et al., Does clinical decision support reduce unwarranted variation
in yield of CT pulmonary angiogram? The American journal of medicine, 2013.
126(11): p. 975-981.
40. Cholesterol Treatment Trialists' (CTT) Collaborators, Efficacy and safety of
cholesterol-lowering treatment: prospective meta-analysis of data from 90 056
participants in 14 randomised trials of statins. Lancet, 2005. 366(9493): p. 1267-
1278.
41. Kearney, P., et al., Efficacy of cholesterol-lowering therapy in 18,686 people with
diabetes in 14 randomised trials of statins: a meta-analysis. Lancet, 2008. 371(9607):
p. 117-125.
42. Ashworth, M., et al., Social deprivation and statin prescribing: a cross-sectional
analysis using data from the new UK general practitioner ‘Quality and Outcomes
Framework’. Journal of Public Health, 2007. 29(1): p. 40-47.
43. Weitoft, G.R., et al., Education and drug use in Sweden—a nationwide register-based
study. Pharmacoepidemiology and Drug Safety, 2008. 17(10): p. 1020-1028.
44. Heeley, E., et al., Disparities between prescribing of secondary prevention therapies
for stroke and coronary artery disease in general practice. International Journal of
Stroke, 2012. 7(8): p. 649-654.
45. Latry, P., et al., Adherence with statins in a real-life setting is better when associated
cardiovascular risk factors increase: a cohort study. BMC cardiovascular disorders,
2011. 11(1): p. 46.
46. Field, C.A. and A.H. Welsh, Bootstrapping clustered data. Journal of the Royal
Statistical Society: Series B (Statistical Methodology), 2007. 69(3): p. 369-390.
24
Appendix 1
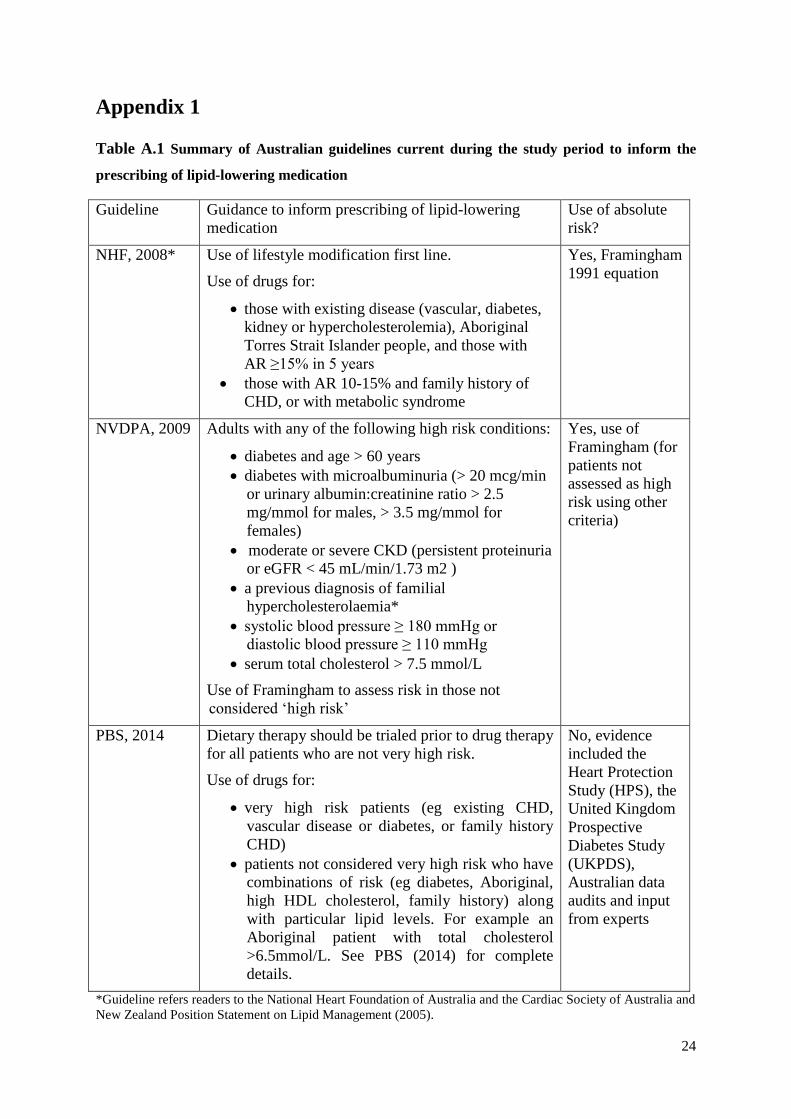
Table A.1 Summary of Australian guidelines current during the study period to inform the
prescribing of lipid-lowering medication
Guideline Guidance to inform prescribing of lipid-lowering
medication
Use of absolute
risk?
NHF, 2008* Use of lifestyle modification first line.
Use of drugs for:
those with existing disease (vascular, diabetes,
kidney or hypercholesterolemia), Aboriginal
Torres Strait Islander people, and those with
AR ≥15% in 5 years
those with AR 10-15% and family history of
CHD, or with metabolic syndrome
Yes, Framingham
1991 equation
NVDPA, 2009 Adults with any of the following high risk conditions:
diabetes and age > 60 years
diabetes with microalbuminuria (> 20 mcg/min
or urinary albumin:creatinine ratio > 2.5
mg/mmol for males, > 3.5 mg/mmol for
females)
moderate or severe CKD (persistent proteinuria
or eGFR < 45 mL/min/1.73 m2 )
a previous diagnosis of familial
hypercholesterolaemia*
systolic blood pressure ≥ 180 mmHg or
diastolic blood pressure ≥ 110 mmHg
serum total cholesterol > 7.5 mmol/L
Use of Framingham to assess risk in those not
considered ‘high risk’
Yes, use of
Framingham (for
patients not
assessed as high
risk using other
criteria)
PBS, 2014 Dietary therapy should be trialed prior to drug therapy
for all patients who are not very high risk.
Use of drugs for:
very high risk patients (eg existing CHD,
vascular disease or diabetes, or family history
CHD)
patients not considered very high risk who have
combinations of risk (eg diabetes, Aboriginal,
high HDL cholesterol, family history) along
with particular lipid levels. For example an
Aboriginal patient with total cholesterol
>6.5mmol/L. See PBS (2014) for complete
details.
No, evidence
included the
Heart Protection
Study (HPS), the
United Kingdom
Prospective
Diabetes Study
(UKPDS),
Australian data
audits and input
from experts
*Guideline refers readers to the National Heart Foundation of Australia and the Cardiac Society of Australia and
New Zealand Position Statement on Lipid Management (2005).
25
Appendix 2
After condensing the data to obtain a single-observation per patient, our CART makes no
further adjustment for clustering of observations by GP. GPs see on average eight patients
within the dataset (minimum of one patient per GP; maximum of 16). Stability across bagged
trees may be overestimated if ‘bags’ of observations are drawn from clustered data. In
supplementary analyses, we evaluated stability of the CART in 100 samples drawn using
cluster-bootstrap methods [46]. Predictor counts and threshold densities were much the same
with the cluster-bootstrap as for the simple bootstrap on clustered data described above.
Similarly, while detailed contextual data on each GP was not available, the data did contain a
State location variable that identifies the GP’s geographic region. In supplementary analyses,
we included this variable within the predictor set, however it did not enter into the preferred
CART model shown in Figure 1.