Goat Cart; An Autonomous Golf Cart - CORE
168
Worcester Polytechnic Institute Digital WPI Major Qualifying Projects (All Years) Major Qualifying Projects March 2018 Goat Cart; An Autonomous Golf Cart Alexander Westfield Briskman Worcester Polytechnic Institute Camila Di Fino Napolitano Worcester Polytechnic Institute David J. Baker Worcester Polytechnic Institute Jade A. Pierce Worcester Polytechnic Institute Jared Greene Perkins Worcester Polytechnic Institute See next page for additional authors Follow this and additional works at: hps://digitalcommons.wpi.edu/mqp-all is Unrestricted is brought to you for free and open access by the Major Qualifying Projects at Digital WPI. It has been accepted for inclusion in Major Qualifying Projects (All Years) by an authorized administrator of Digital WPI. For more information, please contact [email protected]. Repository Citation Briskman, A. W., Napolitano, C. D., Baker, D. J., Pierce, J. A., Perkins, J. G., & Mahan, M. A. (2018). Goat Cart; An Autonomous Golf Cart. Retrieved from hps://digitalcommons.wpi.edu/mqp-all/6654
-
Upload
khangminh22 -
Category
Documents
-
view
1 -
download
0
Transcript of Goat Cart; An Autonomous Golf Cart - CORE

Worcester Polytechnic InstituteDigital WPI
Major Qualifying Projects (All Years) Major Qualifying Projects
March 2018
Goat Cart; An Autonomous Golf CartAlexander Westfield BriskmanWorcester Polytechnic Institute
Camila Di Fino NapolitanoWorcester Polytechnic Institute
David J. BakerWorcester Polytechnic Institute
Jade A. PierceWorcester Polytechnic Institute
Jared Greene PerkinsWorcester Polytechnic Institute
See next page for additional authors
Follow this and additional works at: https://digitalcommons.wpi.edu/mqp-all
This Unrestricted is brought to you for free and open access by the Major Qualifying Projects at Digital WPI. It has been accepted for inclusion inMajor Qualifying Projects (All Years) by an authorized administrator of Digital WPI. For more information, please contact [email protected].
Repository CitationBriskman, A. W., Napolitano, C. D., Baker, D. J., Pierce, J. A., Perkins, J. G., & Mahan, M. A. (2018). Goat Cart; An Autonomous GolfCart. Retrieved from https://digitalcommons.wpi.edu/mqp-all/6654

AuthorAlexander Westfield Briskman, Camila Di Fino Napolitano, David J. Baker, Jade A. Pierce, Jared GreenePerkins, and Matthew A. Mahan
This unrestricted is available at Digital WPI: https://digitalcommons.wpi.edu/mqp-all/6654

MQP-AW1-AV01
I
Submitted by:
Advised by:
Alexander Wyglinski Ph.D
Jade Pierce Camila Di Fino Napolitano
David Baker Matthew Mahan
Alexander Briskman Jared Perkins

MQP-AW1-AV01
II
Abstract
The Goat Cart is an autonomous vehicle that will be summoned via mobile app and
safely drive around Worcester Polytechnic Institute’s campus. In order to accomplish this
multiyear goal, this year’s team worked on the essentials of the golf cart. The primary
subsystems of steering, braking, throttle, power and sensors were all improved and updated so
the cart can drive-by-wire. The 2017-18 team worked to create a solid electro-mechanical base
that future years can build off.

MQP-AW1-AV01
III
Acknowledgments Friends and Family of all of the team members
Professor Wyglinski
Dick Boucher
Michael Boucher
Professor O’Rourke
Professor Bitar
Brad Miller
Professor Lauer
Professor Stafford
Keshuai Xu (Cosine)
Wachusett Country Club
Buggies Unlimited
Curtis Instruments

IV
Table of Contents
ABSTRACT ................................................................................................................................................ II ACKNOWLEDGMENTS ....................................................................................................................... III TABLE OF CONTENTS ......................................................................................................................... IV LIST OF FIGURES ................................................................................................................................ VII CHAPTER 1. INTRODUCTION .............................................................................................................. 1
1.1 MOTIVATION ....................................................................................................................................... 1
1.2 PREVIOUS MQP’S WORK .................................................................................................................... 2
1.3 INITIAL CONDITIONS OF THE GOAT CART .......................................................................................... 3
1.4 CURRENT STATE OF ART IN AV .......................................................................................................... 6
1.5 REPORT ORGANIZATION ..................................................................................................................... 8
CHAPTER 2. PROJECT OBJECTIVES AND ORGANIZATION .................................................... 10 2.1 OBJECTIVES AND GOALS .................................................................................................................. 10
2.2 DIVISION OF LABOR .......................................................................................................................... 11
2.3 TIMELINE .......................................................................................................................................... 13
2.4 BUDGET AND RESOURCES................................................................................................................. 14
2.5 CHAPTER SUMMARY ......................................................................................................................... 15
CHAPTER 3. CONTROL AREA NETWORK (CAN) ......................................................................... 16 3.1 CAN HARDWARE DESIGN PROCESS: ................................................................................................ 19
3.2 CAN SOFTWARE DESIGN PROCESS: ................................................................................................. 35
3.3 CAN CHAPTER SUMMARY ................................................................................................................ 41
CHAPTER 4. STEERING ....................................................................................................................... 42 4.1 STEERING HARDWARE ...................................................................................................................... 42

V
4.1.1 History of Goat Cart Steering ................................................................................................... 43
4.1.2 Steering System Redesign and Rebuild ..................................................................................... 50
4.1.3 Steering System Testing ............................................................................................................. 67
4.2 STEERING SOFTWARE ....................................................................................................................... 68
4.2.1 Steering Controls Circuit .......................................................................................................... 69
4.2.2 Software Design ........................................................................................................................ 73
4.2.3 Steering Software Implementation/ Testing .............................................................................. 80
4.3 STEERING SUMMARY ........................................................................................................................ 82
CHAPTER 5. BRAKING ......................................................................................................................... 84 5.2 BRAKING DESIGN .............................................................................................................................. 84
5.3 BRAKING IMPLEMENTATION ............................................................................................................. 89
5.4 BRAKING TESTING ............................................................................................................................ 95
5.5 BRAKING SUMMARY ......................................................................................................................... 98
CHAPTER 6. THROTTLE ...................................................................................................................... 99 6.1 THROTTLE CIRCUIT DESIGN ........................................................................................................... 100
6.2 THROTTLE IMPLEMENTATION ......................................................................................................... 105
6.3 NEW MOTOR CONTROLLER ............................................................................................................ 106
CHAPTER 7. POWER ........................................................................................................................... 109 7.1 POWER SUMMARY ....................................................................................................................... 114 CHAPTER 8. SENSORS ........................................................................................................................ 115
8.1 ASSESSMENT ................................................................................................................................... 115
8.2 ODOMETER/SPEEDOMETER ............................................................................................................. 116

VI
8.3 ULTRASONICS ................................................................................................................................. 128
8.4 SENSORS SUMMARY ....................................................................................................................... 141
CHAPTER 9. CONCLUSION ............................................................................................................... 143 9.1 LESSONS LEARNED ......................................................................................................................... 144
9.2 FUTURE WORK ................................................................................................................................ 145
9.2.1 CAN Future Improvements: .................................................................................................... 145
9.2.2 Steering System Proposed Work ............................................................................................. 146
9.2.3 Braking Future Plans .............................................................................................................. 148
9.2.4 Throttle Future Improvements................................................................................................. 149
WORKS CITED...................................................................................................................................... 151

VII
List of Figures FIGURE 1: THIS FIGURE REPRESENTS IN A PIE CHART THE DIFFERENT CAUSES OF FATAL CRASHES IN THE UNITED STATES, THE BIGGEST ONE
INVOLVING ALCOHOL. IT IS WORTH TO NOTICE THAT ALMOST 90% OF THE CAUSES INVOLVE HUMAN ERRORS THAT CAN BE
PREVENTED WITH AUTONOMOUS VEHICLES [2] ............................................................................................................... 2
FIGURE 2: FUNDAMENTAL SYSTEMS OF AUTONOMOUS DRIVING CARS [8]. ..................................................................................... 8
FIGURE 3: CAN BUS ARCHITECTURE: THE MOST IMPORTANT HARDWARE COMPONENTS ARE THE MICROCONTROLLER, CONNECTED
THROUGH A CAN CONTROLLER TO THE DIFFERENTIAL PAIR OF WIRES THAT TERMINATE WITH A 120 OHMS. .............................. 17
FIGURE 4: CAN HIGH AND CAN LOW SIGNALS ARE SHOWN IN THIS PICTURE. THE CAN CONTROLLER RESPONDS TO THE ELECTRICAL
DIFFERENCES BETWEEN THE TWO SIGNALS, RATHER THAN A SINGLE SIGNAL AND GROUND. ..................................................... 18
FIGURE 5: THIS FIGURE REPRESENTS THE STRUCTURE OF A CAN MESSAGE. THE NUMBERS IN THE UPPER PART OF EACH FIELD MEAN THE
NUMBER OF BITS ASSIGNED TO THEM. THE MOST RELEVANT FIELDS FOR THIS PROJECT ARE THE MESSAGE IDENTIFIER, THE DATA
LENGTH CODE (DLC) AND THE DATA. .......................................................................................................................... 19
FIGURE 6: CIRCUIT DIAGRAM OF THE ORIGINAL CAN PCB FROM THE 2016-17 MQP TEAM. ......................................................... 20
FIGURE 7: ALTIUM DRAWING OF THE PCB FOR THE 2016-17 CIRCUIT ........................................................................................ 21
FIGURE 8: CAN INTERFACE BOARD VERSION 1 PCB FROM SEPTEMBER 2017. THE INTERFACE BOARD IS TO BE THE GENERIC BOARD FOR THE
GOAT CART AND CAN BE USED TO CONTROL ANY SUBSYSTEM AND USE THE CAN TO COMMUNICATE WITH OTHER SUBSYSTEMS. ... 25
FIGURE 9: CAN INTERFACE BOARD VERSION 1 SCHEMATIC FROM SEPTEMBER 2017. THE INTERFACE BOARD IS TO BE THE GENERIC BOARD
FOR THE GOAT CART AND CAN BE USED TO CONTROL ANY SUBSYSTEM AND USE THE CAN TO COMMUNICATE WITH OTHER
SUBSYSTEMS. ......................................................................................................................................................... 26
FIGURE 10: THE FIRST PROBLEM WAS SOLVED BY WIRING THE TX PINOUT WITH THE TX INPUT IN THE TRANSCEIVER ............................. 28
FIGURE 11: SIGNALED IN PINK ARE THE TWO FILTER CAPACITORS THAT WERE DISRUPTING THE CAN SIGNAL. ...................................... 29
FIGURE 12: THESE TWO WAVEFORMS REPRESENT THE SAME CAN SIGNAL FROM THE TRANSMITTER SIDE OF ONE TEENSY, TO THE RECEIVING
SIDE OF THE OTHER TEENSY. THE SIGNAL BEING TRANSMITTED, WHICH LOOKS LIKE A NORMAL CAN SIGNAL IS SUCCESSFULLY
TRANSMITTED TO ANOTHER CAN NODE. HOWEVER, THE ARDUINO PROGRAM STILL CANNOT DETECT ANY SIGNAL BEING RECEIVED.
........................................................................................................................................................................... 30
FIGURE 13: CAN INTERFACE BOARD VERSION 2 SCHEMATIC FROM DECEMBER 2017. THE INTERFACE BOARD WAS FIXED BASED OFF THE
RESULTS OF TESTING OF THE FIRST VERSION. ................................................................................................................. 33
FIGURE 14: CAN INTERFACE BOARD WITH CAN IN THE MIDDLE PART OF A DAISY CHAIN SO THAT IT CAN CONNECT TO OTHERS IN THE
NETWORK. THE ORANGE AND WHITE WIRES IS ONE TWISTED PAIR AND BLUE AND WHITE IS ANOTHER. ...................................... 34
FIGURE 15: CAN INTERFACE BOARD THAT IS AT THE END OF THE DAISY CHAIN. IT HAS A 120Ω TERMINATING RESISTOR, WHICH IS
HIGHLIGHTED.......................................................................................................................................................... 34
FIGURE 16: NETWORK REPRESENTATION OF ALL 4 SYSTEMS IMPLEMENTED AS FOR NOW. IT IS DESCRIBED WHAT MESSAGES ARE
TRANSMITTED AND RECEIVED IN EACH CAN NODE. EACH CAN NODE IS COMPOSED MAINLY BY A TEENSY MICROCONTROLLER THAT
OWNS ITS OWN DATABASE AND ONLY RECEIVES MESSAGES THAT THEIR ID MATCHES WITH ONE ON ITS DATABASE ....................... 38
FIGURE 17: PROGRAM CREATED TO SEND DISTANCE TRAVELED. THE CORRECT OUTPUTS WERE GIVEN AND WE WERE ABLE TO PROOF
FILTERING OF MESSAGES. .......................................................................................................................................... 39

VIII
FIGURE 18: PHOTO SHOWING THE LOCATION OF THE STEERING SYSTEM IN THE CART. THE PHOTO FEATURES THE STEERING SYSTEM THAT
WAS IN THE CART AT THE BEGINNING OF THE 2017-18 MQP. 44
FIGURE 19: PHOTO SHOWING THE HINGES AND THE ADJUSTMENT SYSTEM THAT WAS USED ON THE STEERING MOUNTING PLATE. THIS IS
PART OF WHAT CAUSED THE MISALIGNMENT OF THE OLD STEERING SYSTEM. ....................................................................... 44
FIGURE 20: EXPLOSION OF THE UPPER STEERING SYSTEM AND STEERING COLUMN IN A 1995 CLUB CAR DS [20] ................................ 46
FIGURE 21: EXPLOSION OF THE LOWER STEERING SYSTEM AND THE FRONT END IN A 1995 CLUB CAR DS [21] ............................... 47
FIGURE 22: EXPLOSION OF THE STEERING RACK SYSTEM IN A 1995 CLUB CAR DS [22] ......................................................... 48
FIGURE 23: EXPLOSION OF THE LOWER STEERING SYSTEM ......................................................................................................... 49
FIGURE 24: LINEAR ACTUATOR THAT WAS PREVIOUSLY USED FOR STEERING THE GOAT CART. .......................................................... 51
FIGURE 25: TYPICAL HEIM JOINT FOR STEERING WHICH FEATURES EYELET MOUNTING. [23] ............................................................ 52
FIGURE 26: POSSIBLE MOUNTING LOCATION IF THE MOTOR IS USED TO DRIVE THE ORIGINAL STEERING RACK OF THE CAN .......... 53
FIGURE 27: POSSIBLE METHOD OF USING THE LINEAR ACTUATOR FOR STEERING SEEN FROM THREE ANGLES. THE LINEAR
ACTUATOR WOULD BE LOCATED WHERE THE STEERING RACK WAS ORIGINALLY. ............................................................ 53
FIGURE 28: POSSIBLE MOUNTING OF LINEAR ACTUATOR IN FRONT OF THE CART'S SUSPENSION. THIS WOULD NOT REQUIRE THE REMOVAL
OF THE ORIGINAL STEERING RACK. ............................................................................................................................... 54
FIGURE 29: LAY OUT OF THE NEW STEERING COMPONENTS ON TABLE PRIOR TO INSTILLATION. ......................................................... 57
FIGURE 30: PULLEY ADAPTER CAD DRAWING ....................................................................................................................... 59
FIGURE 31: STEERING RACK INPUT ADAPTER CAD DRAWING ................................................................................................... 60
FIGURE 32: TEAM MEMBER WORKING ON MACHINING THE PULLEY ADAPTER. ............................................................................... 61
FIGURE 33: FINISHED COUPLER ATTACHED TO THE STEERING RACK. ............................................................................................ 62
FIGURE 34: NOTCH CUT INTO KICK PAN TO ACCOMMODATE THE CIM MOTOR. ............................................................................. 63
FIGURE 35: CIM MOTOR CLEARING THE TWO-DASH FRAME SUPPORTS. THE ARROWS POINT OUT THE MOUNTING POINTS OF THE MOTOR.
........................................................................................................................................................................... 64
FIGURE 36: EXHAUST CLAMP HOLDING THE CIM MOTOR THROUGH THE FERNCO COUPLING. [25] ................................................... 65
FIGURE 37: STEERING CIM MOTOR WRAPPED IN FERNCO COUPLING CLAMPED BY TWO EXHAUST CLAMPS ATTACHED TO DASH FRAME
USING STEEL STRAPS ............................................................................................................................................... 66
FIGURE 38: FRONT END OF CART INCLUDING STEERING SYSTEM DURING TESTING ........................................................................ 67
FIGURE 39: SABERTOOTH HEAT MAP SHOWING INCORRECT GAUGE MOTOR LEADS VS CORRECTLY SIZED LEADS. THE LEFT TWO WIRES ARE
TO SMALL AND ARE CAUSING THE OVERHEATING OF THE SABERTOOTH MOTOR CONTROLLER, THIS CAN CAUSE FATAL AND
UNPREDICTABLE ERRORS. [26] ................................................................................................................................... 70
FIGURE 40: CIRCUIT FOR FILTERING THE PWM SIGNAL BEFORE CONNECTING TO THE SABERTOOTH. THIS CIRCUIT SMOOTHS THE PWM
OUTPUT FROM THE TEENSY REMOVING ANY HIGH FREQUENCY SPIKES IN THE SIGNAL. [26] .................................................... 71

IX
FIGURE 41: MAGNETIC ENCODER CONSTRUCTION. THE SHAFT WITH THE GEAR IS CONNECTED TO THE MOTOR SHAFT AND ROTATES AT THE
SAME SPEED SO THAT THE MAGNETIC PICKUP RECEIVES INPUT FOR EACH TOOTH AND USES THAT TO PRODUCE A VALUE THAT
REPRESENTS THE AMOUNT THE MOTOR HAS SPUN [27] ................................................................................................... 71
FIGURE 42: THE DIRECTION THE ENCODER IS TURNING CHANGES WHICH CHANNEL IS LEADING. THIS ALLOWS THE PROGRAM TO KNOW
WHICH DIRECTION THE ENCODER IS TURNING. [28] ........................................................................................................ 72
FIGURE 43: THE RIGHT LIMIT SWITCH ATTACHED TO THE A-FRAME OF THE STEERING RACK. THE HARD STOP HITS THE LIMIT SWITCH
SIGNALING IT HAS REACHED THE END OF THE RACK. ........................................................................................................ 74
FIGURE 44: THE LEFT LIMIT SWITCH ATTACHED TO THE A-FRAME OF THE STEERING RACK. THE HARD STOP HITS THE LIMIT SWITCH
SIGNALING IT HAS REACHED THE END OF THE RACK. ........................................................................................................ 74
FIGURE 45:FLOW CHART DEPICTING THE PROCESS OF THE STEERING PROGRAM WITH JUST LIMIT SWITCHES. BASED UPON USER INPUT THE
STEERING TURNS LEFT OR RIGHT TILL IT HITS A LIMIT SWITCH AND STOPS. ............................................................................ 76
FIGURE 46: THE PROGRAM FOR CALIBRATION RUNS AT START UP SO THE CART KNOWS WHAT POSITION IT BEGINS AT. THE CART TURNS FULL
RIGHT AND LEFT GRABBING THE EXTREME ENCODER VALUES, AND THEN AVERAGES THE VALUES TO FIND CENTER. ....................... 77
FIGURE 47: DIAGRAM OF GOAT CART WITH STEERING DEGREE CODE INPUTS. STRAIGHT IS 0, WHILE -1 TO -90 DEGREES IS N##, AND 1-90
IS P##, THESE CODES ARE CHOSEN BECAUSE THEY ARE SOMEWHAT SELF-EXPLANATORY. ........................................................ 78
FIGURE 48: STEERING PROGRAM THAT RECEIVES AN INPUT OF DEGREES. THEN BASED OFF THE CURRENT LOCATION THE STEERING TURNS
LEFT OR RIGHT TO REACH THE DESIRED LOCATION WITHIN A RANGE OF TOLERANCE. .............................................................. 79
FIGURE 49: SABERTOOTH SWITCHES ARE USED TO TELL THE CONTROLLER WHAT MODE IT SHOULD BE IN. THE MODE SHOWN IS FOR NON-
LITHIUM BATTERIES, MICROCONTROLLER PWM INPUT, INDEPENDENT MOTOR ONE AND TWO MODE WITH LINEAR CONTROL. [30] 80
FIGURE 50: SHOWS A SIDE IMAGE OF UNDERNEATH THE CART. ITEM 1 IS THE BOTTOM PART OF THE LEVEL THAT IS THE BRAKE PEDAL. ITEM
2 IS THE BRAKE AXLE. ITEM 3 IS THE LEVER WHERE THE PREVIOUS TEAM ATTACHED THE CABLE TO THE BRAKE AXLE. ..................... 85
FIGURE 51: SHOWS THE IDEAL MOUNTING LOCATION FOR THE BRAKING MOTOR AS IT COULD BE HIDDEN AWAY UNDER THE SHELL WHEN
FINISHED. ALSO, SHOW THE INTERFERENCE THAT WOULD OCCUR WITH THE STEERING IT WAS LOCATED THERE ........................... 87
FIGURE 52: SHOWS THE FINAL MOUNTING LOCATION OF THE BRAKING MOTOR DIRECTLY BEHIND THE BRAKE PEDAL. THE BRAKE CANNOT BE
PUSH FAR ENOUGH DOWN FOR IT TO INTERFERE THE BRAKE MOTOR. ................................................................................. 88
FIGURE 53: SHOWS THE HOLE THAT WAS CUT TO ALLOW THE BRAKE TO BE MOUNTED BEHIND THE BRAKE PEDAL. ITEM 1 SHOWS THE
ADDITIONAL HOLE THAT WAS NEED TO BE CUT FOR THE CABLE TO BE RUN FROM THE MOTOR TO THE BRAKE PEDAL. ..................... 90
FIGURE 54: SHOWS THE BRAKE CABLE (ITEM 1) WRAPPING AROUND THE SHAFT OF THE BRAKE MOTOR. ITEM 2 IS THE CRIMP ON THE END
OF THE CABLE KEEPING IT SECURE. .............................................................................................................................. 92
FIGURE 55: THIS FIGURE SHOWS THE CIRCUIT DIAGRAM FOR THE FIRST METHOD OF CONTROL OF THE SABERTOOTH. THE 10K DIGITAL
POTENTIOMETER IS CONTROL THROUGH SPI FROM THE TEENSY. THE SABERTOOTH THEN READS THE DIGITAL POT OUTPUT AND
POWERS THE MOTOR. .............................................................................................................................................. 93
FIGURE 56: THIS IMAGE SHOWS THE LOCATION AND MOUNTING OF THE ENDSTOPS. THESE ARE ACTIVE LOW ENDSTOPS ORIGINALLY
INTENDED FOR CAR EMERGENCY BRAKE DETECTION. ....................................................................................................... 94
FIGURE 57: LOCATION OF THROTTLE SYSTEM ON THE CART ....................................................................................................... 99
FIGURE 58: WIRING DIAGRAM OF THROTTLE SYSTEM AND WIRE COLORS [19] ............................................................................ 101

X
FIGURE 59: PIN LAYOUT ON MOTOR CONTROLLER FACE [31] THE FOLLOWING TABLES, 8 AND 9 ELABORATE ON THE DIFFERENT PINOUTS
......................................................................................................................................................................... 102
FIGURE 60: DIAGNOSTIC PIN CLUSTER DIAGRAM FOR USE WITH PROGRAMMER OR EXTERNAL LED. TABLE 10 ELABORATES ON THE
DIFFERENT PINOUTS. [31] ....................................................................................................................................... 103
FIGURE 61: MOTOR CONTROLLER FACE CLOSE-UP WITH MAIN PINS LABELED .............................................................................. 104
FIGURE 62:DEPICTS THE +12V POWER SYSTEM OF THE GOAT CART. ........................................................................................ 109
FIGURE 63: NOCO GENIUS GEN4 BATTERY CHARGER THAT WAS USED ON THE GOAT CART AND WAS REPLACED BY THE 2017-18 TEAM. IT
HAD AUTOMATIC SHUT-OFF, BUT IT IS NOT A FLOAT CHARGER. [33] ................................................................................ 112
FIGURE 64: NEW FLOAT BATTERY CHARGER THAT WAS INSTALLED. THERE IS ONE FOR EACH BATTERY OF THE 48V SYSTEM AND ANOTHER
FOR THE 12V SYSTEM. ........................................................................................................................................... 112
FIGURE 65: NEW 12V BATTERY FROM THE 48V SYSTEM. ....................................................................................................... 113
FIGURE 66: OLDER BATTERY FROM THE12V SYSTEM. IT IS NEAR IDENTICAL TO THE NEWER ONES EXCEPT FOR THE BATTERY CELL COVERS.
......................................................................................................................................................................... 113
FIGURE 67: HOW AN ELECTRONIC SPEEDOMETER WORKS: 1) A MAGNET CONNECTED TO ONE OF THE WHEELS (OR MORE LIKELY TO A
DRIVESHAFT ATTACHED TO ONE OF THE WHEELS) ROTATES AT HIGH SPEED. 2) EVERY TIME IT MAKES ONE COMPLETE REVOLUTION, IT
PASSES A HALL-EFFECT (OR OTHER MAGNETIC) SENSOR AND THE FIELD FROM THE MAGNET TRIGGERS THE SENSOR. 3) A CIRCUIT
AMPLIFIES THE SIGNALS FROM THE SENSOR AND TRANSLATES THEM INTO YOUR INSTANTANEOUS SPEED AND DISTANCE TRAVELED. 4)
A DIGITAL DISPLAY ON THE DASHBOARD ACTS AS BOTH A SPEEDOMETER AND ODOMETER, DISPLAYING THE SPEED AND DISTANCE SIDE
BY SIDE. ............................................................................................................................................................... 117
FIGURE 68: THE DIAGRAM OF THE TEST CIRCUIT WITH AN LED, RESISTOR, AND A MAGNETIC SWITCH. WHEN THE SWITCH IS CLOSED,
CURRENT FLOWS AND THE LED CAN ILLUMINATE. OTHERWISE NO CURRENT FLOWS, AND THE LED RECEIVES NO POWER. THIS
CIRCUIT WAS USED TO DETERMINE THE ADVANTAGES AND DISADVANTAGES OF EACH MAGNETIC CIRCUIT ELEMENT IN REGARDS TO
THE SPEEDOMETER/ODOMETER APPLICATION [39]. ..................................................................................................... 118
FIGURE 69: THE REED SWITCH USED AS THE PICKUP COMPONENT OF THE SPEEDOMETER/ODOMETER SYSTEM. THIS PRODUCT BY LITTELFUSE
IS A SINGLE-POLE-SINGLE-THROW, NORMALLY-OPEN, PLASTIC-COATED REED SWITCH WITH WIRE LEADS [6]. ........................... 119
FIGURE 70: THE CIRCUIT DIAGRAM OF THE SPEEDOMETER/ODOMETER SYSTEM INSTALLED ON THE WPI GOAT CART. THE SYSTEM IS
COMPRISED OF THE TEENSY 3.5, REED SWITCH AND MAGNET. THE CIRCUIT INCLUDES AN INTERNAL PULL-UP RESISTOR THAT IS USED
TO BIAS THE SWITCH HIGH WHEN OPEN. WHEN CLOSED, THE DIGITAL PIN OF THE TEENSY IS CONNECTED DIRECTLY TO GROUND AND
READS LOW. ......................................................................................................................................................... 121
FIGURE 71: A FLOW CHART DOCUMENTING THE CHANGES IN THE STATUS OF THE SPEEDOMETER/ODOMETER SYSTEM AND THE
CORRESPONDING STATUS OF THE CHANGES IN THE VARIABLES OF THE ASSOCIATED SPECIALIZED PROGRAM. THE CODE THAT THIS
FLOW CHART REPRESENTS CAN BE FOUND IN THE APPENDICES OF THIS PAPER. ................................................................... 123
FIGURE 72: THE SIGNAL VISUALIZATION OF THE PASSING OF A SINGLE MAGNET BY THE PICKUP OF THE SPEEDOMETER/ODOMETER SYSTEM.
WHEN THE MAGNET PASSES, THE MICROCONTROLLER UNIT SEES CHANGES IN STATE FROM HIGH TO LOW AND BACK TO HIGH AGAIN
AT ONE OF ITS DIGITAL INPUT PINS. DURING THESE CHANGES IN STATE, A PHENOMENA KNOWN AS BOUNCING OCCURS WHERE NOISE
BECOMES PRESENT IN THE SIGNAL. THIS SIGNAL VISUALIZATION ALSO REPRESENTS THE STRATEGY OF HOW TO DEAL WITH THIS
PHENOMENA KNOWN AS DEBOUNCING. ..................................................................................................................... 124

XI
FIGURE 73: THE LV-MAXSONAR-EZ3 ULTRASONIC SENSOR MODULE USED IN THE ULTRASONIC SYSTEM. THIS SENSOR MODULE IS A
NARROW BEAM ULTRASONIC SENSOR WITH GOOD SIDE OBJECT REJECTION, LOW POWER CONSUMPTION, EASY TO USE INTERFACE,
LARGE OBJECT DETECTION AND CAN BE POWERED BY MANY DIFFERENT TYPES OF POWER SOURCES [9]. .................................. 131
FIGURE 74: THE MANUFACTURER’S SUGGESTED WIRING GUIDE FOR INDEPENDENT SENSOR OPERATION. FOR THIS PROJECT THE SUPPLY
VOLTAGE SUPPLIED BY THE TEENSY 3.5 IS 3.3V AND WITHIN THE SUGGESTED RANGE. AN ADC, OR ANALOG-TO-DIGITAL
CONVERTER, IS EQUIPPED ON THE TEENSY 3.5 MICROCONTROLLER UNIT FOR EACH OF THE ANALOG PINS TO ACCESS [9]. ........... 132
FIGURE 75: A VISUALIZATION OF AN ULTRASONIC SENSOR SIGNAL WITH INTERFERENCE. AS SEEN IN THE VISUALIZATION, WHEN TWO
SENSORS ARE OPERATING AT THE SAME TIME WITHIN CLOSE PROXIMITY TO ONE ANOTHER, INTERFERENCE MAY OCCUR THAT IS SEEN
AS VOLTAGE NOISE CAUSING DISPARITIES IN THE DATA [10]. .......................................................................................... 132
FIGURE 76: THE MANUFACTURER’S SUGGESTED WIRING OF A CONTINUOUS LOOP CHAIN OF ULTRASONIC SENSORS. IN THIS
CONFIGURATION, ONCE THE FIRST SENSOR IS TRIGGERED TO OPERATE BY THE MICROCONTROLLER UNIT, THE SENSOR WILL RANGE
AND TRIGGER THE NEXT SENSOR IN THE LOOP TO OPERATE. THIS CYCLE WILL CONTINUE THROUGH THE LOOP UNTIL POWER IS
DISCONNECTED FROM THE SYTEM [9]. ....................................................................................................................... 133
FIGURE 77: THE CIRCUIT DIAGRAM OF THE ULTRASONIC SYSTEM DESIGNED TO BE INSTALLED ON THE WPI GOAT CART. THIS SYSTEM IS
DESIGNED TO INCORPORATE TWO ULTRASONIC SENSORS IN A CONTINUOUS LOOP CHAIN. ..................................................... 134
FIGURE 78: A FLOW CHART DOCUMENTING THE CHANGES IN THE STATUS OF THE ULTRASONIC SYSTEM AND THE CORRESPONDING STATUS
OF THE CHANGES IN THE VARIABLES OF THE ASSOCIATED SPECIALIZED PROGRAM. THE CODE THAT THIS FLOW CHART REPRESENTS CAN
BE FOUND IN THE APPENDICES OF THIS PAPER. ............................................................................................................. 136
FIGURE 79. A SINGLE ULTRASONIC SENSOR WIRED TO A TEENSY 3.5 ON A PORTABLE PROTO-BOARD. THIS CONFIGURATION WAS
IMPLEMENTED BECAUSE IT IS BEST SUITED FOR TESTING. WHEN THE CART IS IN A STATE WHERE IT CAN BE USED FOR TESTING
OUTSIDE, THE ATTACHABLE AND DETACHABLE PROTO-BOARD CAN BE MOVED TO DIFFERENT POINTS ON THE CART. THIS WILL HELP TO
DETERMINE WHERE ON THE CART THAT ULTRASONIC SENSORS ARE MOST NECESSARY. ......................................................... 140
FIGURE 80: SHAFT THAT SHOULD BE CUT TO ACCOMMODATE A TWO STAGE GEARBOX ............................................................... 147

XII

MQP-AW1-AV01
1
Chapter 1. Introduction
1.1 Motivation
Safety has been the motivating force for engineers to investigate and develop automated driving
technologies. It is estimated that 1.25 million people die every year due to car accidents
worldwide [1]. Out of the 32,367 fatal car accidents in the United States per year, 93% of these
accidents were caused by human error, be it through alcohol, speeding, sleeping, or simple driver
distraction (Figure 1) [2]. Autonomous vehicles have the potential to reduce these accidents by
40% given the fact that they are programmed to eliminate human error from the equation [2].
With the introduction of autonomous vehicles to the market, it is expected that car crash fatalities
will no longer be the primary cause of death for people ages 14 through 24 [2]. However,
reducing car crashes is expected to be only one of the positive impacts that will come along with
the introduction of autonomous vehicles.
Additionally, there will be a decrease in traffic congestion, fuel consumption, and gas
emissions [2]. Autonomous vehicles are going to have access to information never available
before, such as the driving intentions of the cars surrounding it, leading to a smoother flow of
traffic and the prevention of crashes in congested areas. The average speed in congested cities
can be as low as 20mph, causing people to spend hours sitting in traffic [3]. Depending on the
scenario, autonomous vehicles are expected to decrease traffic by 8-13% and economize fuel by
23-39% [2]. Along with the introduction of autonomous vehicles to the market, there are many
projects regarding autonomous car sharing programs. These are expected to transform cities and
commuting behaviors. Nowadays, there are three parking spaces for every car owned and it is
expected that autonomous car sharing systems could reduce the parking demand by 90% [4]. All

2
of the reasons mentioned above serve as motivation to use all the technologies and knowledge
available to create a safer, greener and more efficient transportation experience.
1.2 Previous MQP’s Work
Motivated by the impact autonomous vehicles (AV) have on society; this MQP was
created many years ago under the direction of the Professor Alexander Wyglinski. The main idea
was to develop a simpler, smaller and affordable version of an autonomous vehicle: an
autonomous golf cart. Many ideas came along during the years of work in order to automate the
Figure 1: This figure represents in a Pie Chart the different causes
of fatal crashes in the United States, the biggest one involving
alcohol. It is worth to notice that almost 90% of the causes involve
human errors that can be prevented with autonomous vehicles [2]

3
golf cart. From using multiple robots (drones) that collected data for path planning, to several
iterations of image processing design and object detection. The 2014-2015 MQP report written
by Prateek Sahay [5], and the 2015-2016 report written by Robert Crimmins and Raymond
Wang [6] talk about how essential is to create a drive by wire system in order to transform the
cart into an autonomous vehicle. Designs were proposed to improve the throttle, breaks, steering
and vision so these systems could be controlled by microcontrollers. However, these designs
were not entirely successful, and they were isolated designs without any integration system.
Finally, important improvements to the power and safety systems of the cart were recorded in the
2016-17 MQP report [7]. After four iterations of this project and many lessons learned from the
past, this year’s MQP team came with the intention and energy to work towards getting closer to
the initial goal of this MQP.
1.3 Initial Conditions of the Goat Cart
Upon receiving the project in August, the team read the previous years’ reports and took
full diagnostics of the different subsystems of the Goat Cart. From the reports, it was discovered
that many of the systems were continually replaced year to year. This made it difficult to
determine which documentation corresponded to each component on the cart. The power system
was revamped in the 2016-2017 school year. The throttle, steering and braking systems were
completed in 2015-2016. Unfortunately, many components that the previous reports described
were either not found on the Goat Cart or were non-functional. It was necessary for this year’s
team to take time to complete a full diagnostic check before deciding the direction of this year's
iteration of the project.

4
The team determined that the steering system required extensive work due to its poor
condition. Previously there was a gear mounted directly to the drive shaft. This gear was
controlled by a 60A motor through a drive chain along with a 10-turn potentiometer. The
potentiometer was used to determine the position of the gear and thus know where the front
wheels were directed. This entire system was exposed and was a major safety concern, for it was
mounted in the passenger’s seat. Additionally, the steering system was simply poorly mounted.
Finally, the drive shaft was at an angle that did not line up with the dashboard component’s
geometry on the golf cart. In order to connect to the drive shaft, a previous team fabricated a
metal plate that held the gearing and motor. While this might have worked in theory, the
execution was sorely lacking. The metal plate was improperly attached to the frame of the cart,
via hinges with washers as spacers, in an unsuccessful attempt to bring the plate perpendicular to
the drive shaft. As a result of the mounting being unstable, there was also a significant amount of
room for movement in the gearing, so much so that two of the gears would actually interfere and
prevent each other from turning. The major problems with the steering system meant that, in
order to steer the cart, the entire subsystem would have had to be fixed or replaced. The software
for the steering was undocumented and impossible to decipher. The program lacked descriptive
variable names and comments. The steering controls were combined with the braking controls,
and because of the lack of comments, it was unknown which motor controlled which subsystem.
Instead of wasting time deciphering the program it was determined that it would be simpler to
write new, separate programs for the steering and braking that were properly commented.

5
The hardware of the braking system was disconnected when the cart was received in
August. The only sign that such a system had previously existed on the cart was through the
documentation from previous years. Unfortunately, the documentation only included the
fabrication process used to create the braking hardware. Luckily, the pieces of the braking
system found were basic enough that this year's team could figure out how the braking
subsystem was supposed to work. However, once the braking was reassembled and tested it was
found that the braking system did not work as thought. The location where the motor was
initially mounted required more torque to pull the brakes then the motor could provide.
The one fully working system on the cart was the throttle. It was found in good condition
and worked successfully. The motor and motor controller were working, despite the motor
controller having an output pin removed from the device. The throttle was controlled via an
Arduino that used a digital potentiometer. The program for the throttle was commented and
easily understood. However, it was later discovered there were no safeguards against going over
the recommended resistance for the throttle input.
The Controller Area Network (CAN bus) which was supposed to be used to connect the
different subsystems was not found on the Goat Cart. The original CAN bus was developed by
Keshuai Xu (Cosine) in 2016. It was a proof of concept that had a Teensy outputting to a laptop
connected via USB. CAN was never implemented for communicating messages between the
subsystems, and the message library was done arbitrarily with no documentation. It was

6
determined that the CAN bus would need to be overhauled and implemented so that the different
subsystems could receive or send commands to a master Teensy.
Initially, the power system appeared to be in working order. There is a set of four 12V
batteries in series that were used to power the throttle at 48V, and a set of two 12V batteries in
parallel to power the remainder of the cart. The power system was sufficient to operate the cart
for short periods; however, the battery life was unknown. Calculations made last year stated that
both systems would run for 1.5hours. Upon inspection, the batteries were not charged with
proper float chargers as the reports stated. Continuously charging lead acid batteries like this
causes the battery acid to evaporate, and potentially explode.
1.4 Current State of Art in AV
Motivated by the impact autonomous cars will have on society, the 2017-2018 Goat Cart
team worked to ensure the functioning of all fundamental elements necessary to build an
autonomous golf cart. According to an article in Mckensy&Company written in 2017, to design
the software required to automate a vehicle, some fundamental systems of the car need to be in
robust shape (Figure 2). Among these elements found: actuation (steering, braking and
acceleration), perception (vision and object detection sensors), sensors that will help gather
important data, drive control (sends signals to the actuator), and decision making (data path
planning) [8]. The team had to undergo mechanical, electrical and software challenges to ensure
the robustness of each systems, while keeping the project realistic and cost effective.

7
By the end of the Major Qualifying Project, the team was able to transform several
subsystems of the cart. Among the actuation subsystems, the team redesigned and rebuilt the
steering system, replaced the rack and pinion, and added controllers that will be crucial when
automating the golf cart. The breaking system was redesigned, and the throttle motor controller
was replaced. The team was able to integrate ultrasonic sensors and is currently working on the
vision sensors. Another sensor added to the system was the odometery sensor, which tells the
distance traveled and speed of the cart. Finally, the team also developed and added the CAN
(Control Area Network), which made communication between subsystems possible. In the
future, the cart will be able to make decisions upon the data being communicated in the network.
Table 1: Overall team contributions during this year's MQP.

8
In terms of autonomy, the golf cart is in a drive by wire state; the team worked primarily
on the systems that are fundamental to control the cart remotely. However, the team was able to
display basic levels of autonomy by creating a program that tracked the cart’s distance traveled
and sent a break signal once a certain distance was reached. Afterwards, it would automatically
send a signal to the steering to turn right and start driving again. This was a simple demonstration
of autonomy; the team hopes that in the future the cart will have more capabilities.
Figure 2: Fundamental systems of autonomous driving cars [8].
1.5 Report Organization
The report is structured to provide insight into the different systems that the team worked
on during this MQP. The team’s goal is defined in Chapter 2, and the logistics regarding how to

9
accomplish that goal. Chapters 3-8 discuss about the communication system, steering redesign,
the breaking system, the throttle system, power system and the sensors implemented on the cart,
respectively. Finally, Chapter 9 presents the team conclusions regarding the lessons learned
during the MQP and the recommendations for the future.

10
Chapter 2. Project Objectives and Organization
In order to complete the MQP, the team needed to set an overarching goal and break it
into manageable sections. It proved most efficient to take the time and plan how best to use the
finite resources of time, manpower and money. This allowed the team to set realistic
expectations and give everyone a defined role in completing the overall task.
2.1 Objectives and Goals
The ultimate goal of the Goat Cart MQP is to create a fully autonomous vehicle that can
be summoned to specific points on the WPI campus via a mobile app. The large scope of this
goal means that no one team can accomplish a task this massive in its entirety within the one
year to work on it. As such, each year the new team must focus on a particular piece of the
overall objective as their goal for the year.
The metric of success chosen at the start of this year’s project was to have the cart
successfully drive around the WPI track with only a laptop or pre-programmed instructions to
guide it. After the evaluation of the initial state of the cart, the steering, braking, and CAN
subsystems were identified as most in need of improvements.
In order to further subdivide the team’s goal into smaller and more easily accomplished
pieces, each subsystem had a specific objective to complete. This allowed the team members to
work in parallel and accomplish more in a limited time. The goal for the steering subsystem was
to create a new functional and reliable design that could be controlled by wire. The existing

11
braking system needed to be replaced with a reliable and remotely controllable replacement
while retaining the ability to manually activate the brakes. In order to have the different
subsystems communicating, the team needed to create a system that used a CAN bus to send
messages. The team needed to create a message library that would be used and easily added to,
as future years of the project add more complexity to the Goat Cart. Additionally, the team set a
goal of having basic sensors added to the Goat Cart so that it could begin collected data about the
cart and its surroundings. By having an effective team of six, the goals stated above was doable
within the time given.
At the beginning of B term 2017, the team was given an intermediate goal to present a
proof of concept presentation at WPI-IEEE Spark Party. Spark Party is an annual event at WPI
of comedic and serious presentations by students and faculty within the Electrical and Computer
Engineering department. Spark Party 2017 was held in early November, which gave the team a
mere two weeks to have a working design. To successfully demo the Goat Cart, the team needed
to get the new steering system installed, and get a prototype control system integrated with
enough time left to move the cart and create a presentation. Luckily, this aligned with the team’s
original plans, though it required a highly accelerated timetable.
2.2 Division of Labor
Each member of the team gravitated towards a different area of the project based on his
or her previous experience and skills. Jade took on the role of project manager as well as

12
working on the software side of the steering system. David's interest hands on electrical and
hardware work lent itself to designing and installing the new steering system. He also helped
design, assemble, and debug the circuit boards for the CAN bus. Camila became the working
expert on the CAN bus system for the cart and worked on both the hardware and software parts
of the subsystem. Jared devoted the bulk of his time to the new braking system. Alex worked on
the throttle as well as ordering parts and budgeting through the department. Matt spent his time
adding odometery and ultrasonic sensors to the cart to improve the amount of environmental data
available for making decisions. Though each team member had one particular system they were
in charge of, team members also assisted each other as needed.
Table 2: Visual summary of division of labor
Name Responsibilities
Jade Team Leader Steering Software
David Steering Hardware CAN Hardware
Camilla CAN Software
Jared Braking
Alex Throttle
Matt Sensors

13
2.3 Timeline
The intended duration of the project was three terms, approximately 6 months. During
this time, the team had to do all work on the cart and generate the report, with minor cleanup and
demonstration work to be finished in the final term.
The first seven weeks were dedicated to evaluating the existing state of the cart and
creating plans for how to proceed. Through late August and September of 2017, the team
identified which systems were most urgently in need of upgrading or repairing. For each
subsystem, several options were considered and compared until an initial plan was decided upon.
Only then could the team begin its work in earnest. Then from October until the Spark Party
presentation, major overhauls to the cart were begun. These changes were primarily focused on
redesigning and improving the steering and braking drive-by-wire systems. Parts were ordered
and installed with the looming Spark Party deadline acting as a driving force. A major issue
confronted was the batteries in the 48V array dying.
After the successes and failures of Spark Party, the team began to feel burned out and
took the following week to pause and reevaluate the state of the cart. The new steering and
braking hardware was found to be adequate. New problems appeared when the motor controller
burned out the day of Spark Party 2017. This prompted the team to refocus their efforts on the
throttle system, as well as expanding the software of each systems. Meanwhile the CAN bus
boards were being debugged.

14
2.4 Budget and Resources
Each student in the project was allocated $200 from the Electrical and Computer
Engineering department’s project fund. With six students working on the project, this gave the
team a total budget of $1200. Additionally, the team’s advisor, Professor Wyglinski, offered to
leverage several of his own independent funding sources for any additional needs beyond what
the department was already providing. This fund was used for purchasing a replacement motor
controller, which was later reimbursed when the team received sponsorship from Curtis for the
part. Additionally a few of the students contributed funds towards small parts orders that were
obtained on Amazon or Home Depot.
Most of the tools and equipment needed for working on the cart had already been
purchased by previous teams. Both mechanical and electrical tools and a collection of wires and
fasteners were already available in the lab. This allowed the team to focus its spending on new
and replacement parts for the cart. The primary expenses of this project were parts for the
steering, power, and embedded communication systems. Each required approximately $400
worth of parts. A summary breakdown of the budget can be seen in Table 3. The full cost
breakdown can be found in the appendix.

15
Table 3: Budget breakdown by each subsystem summary
System Total Spent
Steering $470.63
CAN $476.77
Power $454.79
Sensors $14.87
Throttle $0.00
Braking $0.00
2.5 Chapter Summary
The goal of this year’s project was to return the cart to a drivable state. However, most of
the systems on the cart needed varying levels of attention and repair or replacement before this
could happen. Each member of the team specialized in one of these systems to provide individual
attention. The team’s budget was channeled towards the systems that were most in need of new
hardware: steering, CAN and power. The team was spurred to heightened productivity by the
intermediate deadline of presenting at Spark Party.

16
Chapter 3. Control Area Network (CAN)
CAN (Control Area Network) is a real-time communication protocol that provides fast,
simple, efficient and robust communication among different subsystems. It is widely used in the
automobile industry; in fact, it is mandated by the Environmental Protection Agency that every
car should be equipped with CAN bus communication technologies [9]. The CAN bus is
designed to operate at high speeds, from 500 Kilobits per second up to 1 Megabits per second
and send messages containing up to 8 bytes of content [10]. The idea behind CAN is to connect
and communicate state information through messages and signals between the different Engine
Control Units (ECUs). These signals can be temperature of the car, odometery, oil, steering
wheel position, speed, among others. These signals can be transmitted periodically or
sporadically.
CAN networks consists of at least two nodes connected through a bus of twisted pair of
wires and terminated with two resistors of 120 ohms (Figure 3). The maximum number of nodes
depends on the frequency at which the network operates. Some important features that CAN
contains: every message that enters the bus is visible to every node in the network, there is
prioritization of messages, and the twisted differential pair provides noise immunity [11]. The
differential pair will measure the voltage difference of the pair of wires instead of the voltage in
relation to ground, allowing communication to be clear in hostile environments.

17
Figure 3: CAN bus Architecture: The most important hardware components are the Microcontroller,
connected through a CAN controller to the differential pair of wires that terminate with a 120 ohms.
A CAN node is comprised of a microcontroller, a CAN controller usually embedded in
the microcontroller and a transceiver attached to the CAN bus line. The microcontroller is in
charge of data gathering and processing of data in a certain subsystem of the car. The CAN
controller converts signals from a common microcontroller protocol (SPI and serial are popular)
to the CAN protocol. Attached to the Microcontroller a transceiver is placed, which performs the
conversion between the single-ended CAN controller CAN Tx and CAN Rx signals to the bi-
directional differential pair of the CAN bus called CANH and CANL (CAN High and CAN
Low). The differential pair provides excellent noise immunity and some bus fault protection. In a
differential pair, one line will switch from a common state to a positive voltage state during a
logic 1; the other line will switch from a common state to a negative voltage state during a logic
1. During a logic 0, both lines will switch from their respective voltage states to a common state
(Figure 4) [11].

18
Figure 4: CAN high and CAN low signals are shown in this picture. The CAN controller responds to the
electrical differences between the two signals, rather than a single signal and ground.
The CAN messages, which can be sent periodically, irregularly and on demand, have
different fields that can contain information. The most relevant fields for this project are:
o The Message ID: Is the first field of information that goes after the Start of Field (SOF)
bit marks. The message ID can occupy 11 bits or 29 bits (Extended Identifier) and it can
be prioritized. The smallest number has the highest priority message and the largest the
least. If two nodes are put on the bus at relatively the same time, the message with the
highest priority is going to be read first and the other messages will wait in a queue.
There is a byte that will be set to 0 if the 29-bit-identifier is not used, and 1 if used [12].
o The Data Length Code (DLC): The Data Length Code occupies 4 bits and represents the
length that the message body is going to take. It can be from 0 bytes to 8 bytes if
information [11].

19
o The Data: It can contain any type of data, including none. It is possible that the Data field
is not used and the ID is used as a command [12]. Conversely, if the Data field is used it
is composed of an 8 byte buffer.
There are other fields in the 16-bit Cyclic Redundancy Check (CRC), which contains the
checksum for error detection, the 2-bit acknowledgement flag that states the integrity of the data,
and the 7 bits that state the End of Field (EOF). These fields are not used in Goat Cart yet, but
can be implemented in the future [12]. In Figure 5 it is represented the CAN message structure.
Figure 5: This figure represents the structure of a CAN message. The numbers in the upper part of each field
mean the number of bits assigned to them. The most relevant fields for this project are the message
identifier, the Data Length Code (DLC) and the data.
3.1 CAN Hardware Design Process:
Embedded devices are necessary for each of the different subsystems so that they can be
controlled remotely. The previous teams used the Arduino and the Teensy platforms as their
primary embedded devices. The Teensy used had a PCB board designed by a Ph.D. student
named Kesuai Xu (Cosine) as proof of concept for using CAN bus on the Goat Cart. Figure 6
depicts the circuit diagram of the original CAN PCB from the 2016-17 MQP team. Figure 7
shows an Altium drawing of the PCB for that circuit.

20
Figure 6: Circuit diagram of the original CAN PCB from the 2016-17 MQP team.

21
Figure 7: Altium drawing of the PCB for the 2016-17 circuit
When the 2017-18 team received the cart, the Teensy embedded device was not working
properly. Additionally, the team wanted to add more to the CAN interface board and not have it
specialized for a single subsystem. This would improve upon the 2016-17 CAN interface board

22
which was dedicated for the steering system. This lead to the decision to upgrade and standardize
the embedded devices on the Goat Cart.
The best embedded device for the project would be a member of the Teensy family. The
Teensy has a few very nice features that make it a good fit for the Goat Cart; they are
inexpensive, compact, CAN capable, and have full documentation. The Teensy 3.5 was chosen
over the Teensy 3.2, which the team already had because it has a much faster processer. A full
comparison can be viewed in Table 4. [13]
Table 4: Comparison of the Teensy 3.2 and 3.5 [13]
Feature Teensy
3.2
Teensy
3.5
Price $19.80 $24.25
Processor
Core
Rated Speed
Overclockable
MK20DX256VLH7
Cortex-M4
72 MHz
96 MHz
MK64FX512VMD12
Cortex-M4F
120 MHz
-
Flash Memory
Bandwidth
Cache
256 kB
192 MB/s
256 B
512 kB
192 MB
256 B
RAM 64 kB 192 kB
EEPROM 2048 B 4096 B
Direct Memory Access 16 Channels 16 Channels
Digital I/O
Breadboard I/O
Voltage Output
Current Output
Voltage Input
Interrupts
34 Pins
24 Pins
3.3V
10mA
5V Tolerant
34 Pins
58 Pins
40 Pins
3.3V
10mA
5V Tolerant
58 Pins
Analog Input
Converters
Usable Resolution
Comparators
21 Pins
2 Pins
13 B
3 Pins
27 Pins
2 Pins
13 B
3 Pins

23
Analog Output
DAC Resolution
1 Pin
12 B
2 Pins
12 B
Timers
PWM, 16 bit
Total PWM Outputs
RTC
12 Total
3 Pins
12 Pins
1 Pins
17 Total
4 Pins
20 Pins
1 Pins
Communication
USB
Serial
With FIFOs
High Res Baud
SPI
With FIFOs
I2C
CAN Bus
Digital Audio
SD Card
Ethernet
1
3
2
3
1
1
2
1
2
-
-
1
6
2
6
3
1
3
1
2
1
1
However, the Teensy 3.5 only has a built-in CAN controller and not a CAN transceiver.
To enable proper CAN communication on the cart, it was necessary to create an additional PCB
that had a CAN transceiver. The breakout board was designed in September 2017 (Figure 8 and
Figure 9). It contained the following:
12V-to-5V regulator (LM317)
3.3 output voltage from the Teensy
power LEDs for +3V3 and +5V
3 LEDs for debugging
CAN transceiver (MCP2551) with operating voltage of 5V
2 SPI Ports
2 I2C Ports
3 Serial Ports
7 PWM pins

24
18 Digital pins
12 Analog pins.
The voltage regulator was included so that the 5V could be used for sensors, such as the
encoder used in steering, and for powering the Teensy. The LM317 is a simple component that
has been used in many WPI ECE courses, so the team had experience with its function and
capabilities. [14] The power LEDs are a useful feature for determining if the PCB is receiving
power. The debugging LEDs are useful for testing programs as a visual check that the code is
working as expected. The CAN transceiver is necessary translating the Teensy’s mono bus CAN
communication to a differential bus and vice versa. The MCP2551 was chosen because it is
commonly used as a CAN transceiver for Teensys. [15] This led the team to believe that the
MCP2551 would work flawlessly with the Teensy 3.5. The pins from the Teensy that were
included in the CAN interface board’s connecters were chosen based on versatility. The goal was
to have access to at least five Analog, Digital and PWM pins. These are the most needed pins for
the basic sensors that were used on the 2017-18 Goat Cart. The CAN interface board had SPI,
I2C and serial communication included in its connectors so that sensors supporting more
complex communication methods could be used. The Teensy can be powered via the USB or
through the +5V on the board, which in turn will get power from the 12V power system on the
Goat Cart. The PCB was designed using Eagle; the circuit schematic and PCB layout can be seen
in Figures 8 and 9 respectively.

25
Figure 8: CAN interface board version 1 PCB from September 2017. The interface board is to be the generic
board for the Goat Cart and can be used to control any subsystem and use the CAN to communicate with
other subsystems.

26
Figure 9: CAN interface board version 1 schematic from September 2017. The interface board is to be the
generic board for the Goat Cart and can be used to control any subsystem and use the CAN to communicate
with other subsystems.

27
The process of implementation and debugging of this first design was very intense.
Several design mistakes were encountered and tackled. With some external advice and arduous
work, the team was able to debug the board. The issues found include the following:
Reversal of Tx and Rx signals: The first major obstacle that was encountered was the
reversal of the Tx and Rx signals between the Teensy and the CAN transceiver. This
problem was a design error on the CAN interface boards. The Teensy CAN transmit (Tx)
pin was connected to the receiver (Rx) pin of the transceiver and the Teensy CAN Rx pin
was connected to the Tx pin of the transceiver. The team was able to temporarily fix this
issue by utilizing breadboards to remotely socket the Teensy and connect the Rx pin of
the Teensy with the Rx pin of transceiver, and the Tx pin of the Teensy with the Tx pin of
the transceiver using jumper wires (Figure 10).

28
Figure 10: The first problem was solved by wiring the Tx Pinout with the Tx input in the transceiver
CAN bus always high, never low: During the debugging process, it was noticed that the
CAN signal would always hold high and never drop low. This signal response was solved
by removing improperly placed filter capacitors that connected the CAN_HIGH and
CAN_LOW bus lines to ground (Figure 11).

29
Figure 11: Signaled in pink are the two filter capacitors that were disrupting the CAN signal.
Transceiver Operating Voltage: Another hardware problem encountered was the lack of a
signal appearing on the CAN bus. By disconnecting the Teensy from the transceiver and
using a signal generator as a substitute, it was discovered that the CAN transceiver
MCP2551 would not operate on the +3V3 that the Teensy output. This was due to the
MCP2551 having a hardware requirement of +5V.
CAN Transceiver Signal Voltage: Due to the CAN transceiver only functioning on +5V
the signal it output would swing from ground to +5V, which was beyond the input

30
capability of the Teensy’s CAN inputs. As a result, a voltage divider had to be used to
step down the signal voltage.
Some other problems were encountered, but they were linked to the software implementation
of the CAN system. By the end of the debugging process, a stable CAN signal was viewed at the
output of the receiving transceiver (Figure 12), leading to the conclusion that the design errors of
the first version was found and the team was ready to design and build a second generation of the
PCB.
Figure 12: These two waveforms represent the same CAN signal from the transmitter
side of one Teensy, to the receiving side of the other Teensy. The signal being
transmitted, which looks like a normal CAN signal is successfully transmit ted to
another CAN node. However, the Arduino program still cannot detect any signal being
received.
Tx Signal on
CAN node 1
Rx Signal on
CAN node 2

31
The second version of the board fixed the errors found in the first PCB and further
optimized the layout. The CAN transceiver was replaced with a SN65HVD23x 3.3-V CAN Bus
Transceiver. [16]
The second board has:
Voltage regulation
+12V to +5V
+5V to +3V3 (Teensy)
2 Power LEDs
+5V
+3V3
3 Programmable LEDs
2 differential CAN ports (link together via daisy chain method)
2 SPI Ports
2 Serial Ports
2 I2C Ports
16 Digital Pins
10 Analog Pins
5 PWM Pins
The primary goal of this design was to have many different methods of communication
from the Teensy so that it could communicate to any type of sensor that a future team might use
on the Goat Cart. Another reason for having numerous pins available was to allow a single
Teensy to be used to control multiple subsystems. The only problem with the design was that,
since the pins are software programmable, using a pin for a certain function could limit the

32
availability of its other functions. An example of this is using pin 10 for PWM prevents its use as
one of the SPI channels. The list of connector pinouts can be seen in Table 4. Figures 13 show
the circuit and PCB of the second version of the CAN interface board.
Table 5: Pinouts of the Teensy used in the CAN Interface Board
Pinouts for the CAN Interface Board
1. GND
2. 3.3V
3. CAN L0
4. CAN H0
5. CAN L
6. CAN H
7. Pin 32 - D/A/RX4/CS1
8. Pin 31 - D/A/TX4/SCK1
9. Pin 12 - D/MISO0
10. Pin 11 - D/MISI0
11. Pin 10 - D/PWM/TX2/CS0
12. Pin 13 - D/SCK0
13. Pin 33 - D/A/TX5
14. Pin 34 - D/A/RX5
15. Pin 37 - D/A/PWM/SCL1
16. Pin 38 - D/A/PWM/SDA1
17. Pin 18 - D/A/SDA0
18. Pin 19 - D/A/SCL0
19. Pin 22 - D/A/PWM
20. Pin 23 - D/A/PWM
21. Pin 1 - D/TX1/MISO1
22. Pin 0 - D/RX1/MOSI1
23. 3.3V
24. GND

33
Figure 13: CAN interface board version 2 schematic from December 2017. The interface board was fixed
based off the results of testing of the first version.

34
The CAN interface boards were placed on the cart and daisy-chained together. This
allows the different subsystems to communicate between each other. They are connected via
twisted pair wires, for this, the team deconstructed an Ethernet wire to use. This can be seen in
Figures 14 and 15.
Figure 14: CAN interface board with CAN in the middle part of a daisy chain so that it can connect to others
in the network. The orange and white wires is one twisted pair and blue and white is another.
Figure 15: CAN interface board that is at the end of the daisy chain. It has a 120Ω terminating resistor,
which is highlighted.

35
3.2 CAN Software Design Process:
When receiving the cart and previous CAN software programs in a GitHub, the team
decided to use a more standardized method to build the CAN Network rather than use the CAN
library the team was given by Cosine, the PhD student. Teensy microcontrollers can be
programmed in C with any program editor; however, the team decided to use the Arduino IDE
with an extension called Teensyduino. Libraries to control the CAN capabilities of the Teensy
can be found on the internet. The FlexCan is the most standardized library found for working
with CAN on the Teensy. There were several versions of this Library on GitHub, one of them
being a built-in version within Teensyduino. Teensyduino’s built in FlexCan library was written
by Collin Kidder and the team decided to trust this version because according to research this
library is commonly used and reliable. [17]
To create a CAN network, the team had to design a database of the messages that each
subsystem sends and receives to create useful and efficient communication within the cart. The
messages along with the message’s ID had to be planned. Eventually, prioritization of messages
will be needed in the Goat Cart.
The intended goal with the CAN bus is to connect the subsystems that the team has been
working on for the past year: the throttle, the brakes, the steering system and the sensors. The
plan is that there will eventually be a server connected to the system that will receive all crucial
information, process it, and send commands to the respective subsystems. The team created a list

36
of the messages that are important to send and receive between the different nodes. Refer to
Table 5 to find a summary of the database of messages described below:
o Speed Increase: The Speed Increase message represents a command message.
Receiving this message makes the throttle increase the speed at a fixed rate. The
message ID is 0x14 (20) and does not contain any message in the body.
o Slow Down: Slow Down represents a command message that every time received,
it decreases the speed by a fixed amount. The message ID is 0x12 (18).
o Breaks On: When received the breaks actuate and stop the cart. It is important that
in terms of priority breaking have a lower message ID (more important) than
Speed Increase and Slow Down for safety reasons. The message ID chosen is
0x0A (10).
o Turning Degrees: A turning degrees message with an ID number of 0x25 (37) that
contains in the specific amount of degrees to turn left or right. In the first
character of the message buffer contains either a ‘P’ or ‘N’ to dictate direction.
The second character contains the value of degrees to turn to.
o Center the Wheels: A command message with ID number 0x24 (36) is sent to
center the wheels. It will have a lower ID than the Directions’ message ID since it
is considered to have higher priority.
o Calibrate Steering: When starting the Goat Cart, wheel calibration must be done
to accurately map the steering wheel angle. The message ID is 0x23 (35) and it

37
will represent a command message; whenever received, the steering is calibrated.
This message is expected to be sent every time the golf cart is turn on.
o Distance traveled: This message sends information collected by the odometery
sensor. It is represented by the message ID 0x28 (40). The body of the message
contains the amount of feet traveled since the cart was turned on. The idea is to
restart the counter every time the machine is turned on and store the total miles
traveled in the server.
Table 6: Summary of all messages created by Goat Cart 2017-2018 group.
The diagram found in Figure 16 represents the flow of these messages in the network.
The odometery node constantly sends messages through the CAN bus representing the distance

38
traveled and the only node accepting the distance-traveled message is the server. The server
transmits commands to the different actuators (breaking and throttle, and steering). In the future,
these commands are going to be a result of data processing, vision and path planning programs
inside the server.
Figure 16: Network representation of all 4 systems implemented as for now. It is described what messages
are transmitted and received in each CAN node. Each CAN node is composed mainly by a Teensy
microcontroller that owns its own database and only receives messages that their ID matches with one on its
database

39
Once the hardware was ready for testing and a message database was created extensive
debugging occurred to send and receive a CAN message. The main software problem
encountered when debugging was a register setup problem that apparently was very common
when implementing Collin Kidder’s FlexCan Library. [17] After researching this issue, it was
concluded that the best solution was to switch to library written by a GitHub user called Teachop
instead. [18] The new FlexCan library had to be downloaded from GitHub and included on the
Libraries folder of the Arduino IDE. With the new library, the team was able to send and receive
CAN messages, filter out messages by ID and send information in the message body (Figure 17).
Figure 17: Program created to send distance traveled. The correct outputs were given and we were able to
proof filtering of messages.
Different software tests were performed to simulate the different messages that the
systems are sending and receiving can be seen in the Appendix. The first test consisted of
sending a message from one node and having a receiving program on the other node, which lit up

40
an LED when it received a message. After testing the LED upon Message program, a message
filtering was then tested and implemented successfully. This test consisted of having the
receiving side lighting a LED if the message was of a specific ID number. The third test
performed consisted of sending a message with data in the message body. An odometery
program was written so if the distance to be sent in feet was bigger than the capacity of one
position in the buffer (255) it would split the number so fill the maximum value in one position
and the remainder in the next position. Consequently, having the length of the data buffer vary
depending on the number to be sent. For example: if the total distance traveled was 400ft., the
program would store in the first position of the buffer 255 and in the second position of the
buffer 145, which when added equal to 400. The fourth test simulated sending two different
messages that would be linked to two different LEDs on the receiving side. Whenever one ID
was received it would lit up its respective LED. The test number five simulated the format of
steering messages, and the sixth test was a complete simulation of three systems together: the
throttle and braking system, and the steering system. This test communicated three Teensies and
would send commands to the respective Teensy via a serial port. For more information, refer to
the MQP’s GitHub.
The 2017-18 team has implemented CAN bus tests consisting of two nodes
communicating with each other, and merged the odometery program with CAN. However, is
expected that by the end of the D term 2018 the team will have had integrate all the four systems
this information would be discussed in an appendum to the project.

41
3.3 CAN Chapter Summary
Overall, this year’s MQP was able to study in depth the structure and characteristics of
the CAN network. The team had to understand the requirements of the communication system to
be built and come up with a design that was robust, but at the same time straightforward for
future groups. By going through two design iterations the team was able to tackle some
problems, report the root because so future groups do not commit the same mistakes, and instead,
keep working on merging as much subsystems as possible. Throughout the rest of this MQP
report, the team writes in detail about the different subsystems that are to be integrated, starting
from steering subsystem.

42
Chapter 4. Steering
The steering on the cart presented a number of challenges that were primarily due to the
original design of the cart, the age of the cart, and previous MQP teams. Since the original cart
used a manual steering system, controlling it with a computer proved to be no simple matter.
Both the steering hardware and steering software had their own unique challenges that had to be
overcome. In this MQP, the hardware work turned out to be more challenging than the software
work because the team was made up of six electrical and computer engineering (ECE) students
and no mechanical engineering (ME) students that were working on a mechanical engineering
project. The software part ended up being a simpler process; however, it too was plagued with
problems. Despite the issues, the 2017-18 MQP team managed to redesign and rebuild the
steering system to allow for drive-by-wire operation.
4.1 Steering Hardware
The steering hardware encompasses all of the mechanical and electromechanical
components of the steering system. This is where all of the retrofit from the old system to the
new occurred. There were numerous options for how the steering could be controlled, and
therefore a lot of research and consulting work had to be done before a design could be created
and implemented.

43
4.1.1 History of Goat Cart Steering
When the 2017-18 Goat Cart MQP team received the cart, the steering system was in a
non-functional state. The system that was in the cart was originally designed and built by the
2014-15 MQP team. It was later revised by the 2015-16 and 2016-17 MQP teams to result in the
state seen in Figure 18. It consisted of a sixty-amp motor mounted to a support plate that was
attached to the dashboard frame on the cart. The motor had a sixty-tooth gear directly attached to
it, which drove a chain that connected to a ten-tooth gear. The ten-tooth gear was attached to the
original steering shaft, which supported the steering wheel in the original cart. A ten-turn
potentiometer was also driven off the chain.
The chain drive system failed for two reasons. The first is that the plate supporting the
motor was not firmly mounted in a way that allowed the chain drive system to maintain proper
alignment. It was set up with an adjustment system that consisted of standoffs and hinges. This
system, shown in Figure 19, was meant to allow for adjustments while the alignment was still
being figured out. However, this mounting method caused the alignment to shift when the
steering motor was powered.

44
Figure 18: Photo showing the location of the steering system in the cart. The photo features the steering
system that was in the cart at the beginning of the 2017-18 MQP.
Figure 19: Photo showing the hinges and the adjustment system that was used on the steering mounting
plate. This is part of what caused the misalignment of the old steering system.

45
The other problem with the steering system that existed in the cart, when the 2017-18 MQP team
received it, was the steering shaft itself. The mounting of that shaft, which was being driven by
the chain drive system, was insufficient for maintaining proper alignment. The steering shaft was
floating in a single bearing mounted to the dashboard frame that was worn from years of service.
It completely lacked any linear support because of a set of universal joints that had been installed
by the factory to correct a misalignment at the steering rack. This lack of support allowed the
steering shaft to move independently of the plate, which in turn prevented consistent alignment
of the chain drive system.
When the 2017-18 MQP team checked the status of the cart at the beginning of the school
year, they found that, when the steering motor was running, the chain would jump off its drive
gears. This, combined with extreme amounts of wear and other damage to the factory steering
components meant that almost no part of the steering system, as it was configured at the start of
A-term 2017, would be usable in future, autonomous functions of the cart. In order to fully
understand the steering system and then to make it functional, the 2017-18 MQP team needed to
first understand what was on the cart when the Goat Cart MQP first acquired it.
The team did not have much in the way of reference material to work off when they
received the project. Information was limited to what was available in the previous year’s
reports. The 2016-17 MQP team had stated that the model of the cart was a 1995 Club Car
Powerdrive System 48. It was discovered after a lot of research that this was not the case. The
particular golf cart that the Goat Cart MQP is using is a 1995 Club Car DS. Club Car puts
different model numbers on their golf carts and their powertrains, [19] that allows Club Car to

46
put the same powertrain in different carts and different powertrains in the same cart. The model
of the powertrain, not the cart, is a 1995 Club Car Powerdrive System 48. Once this discovery
was made, manuals and parts for the steering system became a lot easier to find. Below in
Figures 18-21 are the various explosions of the steering system in a 1995 Club Car DS.
Figure 20: Explosion of the upper steering system and steering column in a 1995 Club Car DS [20]

47
Figure 21: Explosion of the lower steering system and the front end in a 1995 Club Car DS [21]
In the original cart, the steering wheel (Figure 20, Item 25), connects to the steering shaft (Figure
20, Item 20), which is supported by bearings (Figure 20, Item 18) inside the steering column
(Figure 20, Item 21). The steering column is attached to the dashboard frame by the steering
column-mounting bracket (Figure 20, Items 4 & 5). The steering shaft connects the steering
wheel to the double U-joint (Figure 20, Item 1) [20], which connects to the steering rack (Items
1-21 in Figure 22). This transfers the rotational motion of the steering wheel to linear motion that

48
can be used to turn the wheels. This linear motion is transferred through the drag link and drag
link end (Figure 22, Items 30 & 24) [22] to the passenger side steering knuckle (Figure 21, Item
2). This is connected to the driver’s side steering knuckle (Figure 21, Item 1) [21] via the tie rod
ends and the tie rod itself (Figure 23, Items 6, 11, & 13) [23].
Figure 22: Explosion of the steering rack system in a 1995 Club Car DS [22]

49
Figure 23: Explosion of the lower steering system
and upper front-end suspension in a 1995 Club
Car DS [21]
When the previous teams removed the steering wheel and attached the gear drive system
to the steering shaft, they removed the steering column. This inadvertently removed all the
support for the bearings, which caused the instability in the shaft.
When the 2017-18 MQP team received the cart, the entire upper steering system,
including the steering column, was worn out and nonfunctional. The steering rack, drag link, and
drag link end were also severely damaged and worn out. This put the team in a position where
they needed to redesign and rebuild the steering system.

50
4.1.2 Steering System Redesign and Rebuild
As the team began to redesign the steering system, it became obvious that there were a
number of different methods that could be used, and deciding on one would be very challenging.
The team had a few resources that were available at the beginning of the steering redesign. The
2013-14 MQP team had previously tried to use linear actuators for steering and breaking.
Although this attempt was unsuccessful, it left the linear actuators in the project’s inventory for
the team to use. The team also had the remnants of the gear drive system available. This put the
idea of using a linear actuator steering system or a system that made use of the factory steering
rack high on the list of possibilities. A few other potential ideas that were examined included an
electric over hydraulic system and a pneumatic system. The latter two were similarly impractical;
they both required systems that did not already exist on the cart. These systems, hydraulic and
pneumatic, were both extremely costly in not only monetary expense, but also in power expense.
The power expense was the major drawback to these methods, as the support systems they
required needed to run constantly.
The other two options, a linear actuator or a modification to the carts original steering
system, both had their advantages and disadvantages. The linear actuator would have eliminated
the manufacturers steering system, but it would cost a lot, would have a few fabrication
challenges, and would require complex testing. Utilizing the original steering system would have
eliminated the need to do complex testing, but would still cost a lot and require complex
fabrication. The cost of the linear actuators would be caused by the fact that the ones already
available were either too small or too big, so a new linear actuator would have to be purchased.

51
Since the steering did not originally use a linear actuator, some fabrication would have needed to
happen to allow for its installation. The linear actuators that were being considered would have
required an interface to the eyelets they used for mounting, shown in Figure 25. It was
unclear how this would be accomplished, so the team decided to consult the WPI Formula SAE
Team. They were able to recommend a type of fastener that would easily be able to interface
between the cart and the actuator. This fastener is known as a Heim Joint. They recommended
that the MQP team have them welded to the ends of the linear actuator. Figure 26 shows what a
typical Heim Joint looks like.
Figure 24: Linear actuator that was previously used for steering the Goat Cart.

52
Figure 25: Typical Heim Joint for steering which features eyelet mounting. [23]
The last major issue for the linear actuator came from choosing specifications for the new
one. The 2017-18 MQP Team had no information available on what amount of force would be
required to turn the wheels on the cart. This presented the challenge of either calculating it or
measuring it. The team brought up this calculation while consulting with the Formula SAE
Team, who stated that, while there was a calculation for it, it was very complex, and that they
had four mechanical engineering students working for six months to calculate the force required
for their own vehicle. They recommended that the goat cart team set the cart on the roughest
surface that it was likely to encounter, deflate the tires slightly, and put the maximum load it was
likely to carry on the cart. The SAE team then recommended that we attach the steering knuckle
arm to a force gauge and use this to turn the wheels. This would give us the maximum linear
force required to turn the wheels in a worst-case scenario. The 2017-18 Goat Cart MQP Team
contemplated doing this; however, they decided to consult another expert first and mock up the
two options. The mock up presented one mounting option for using the carts original steering
system, which is shown in Figure 9. However, with the linear actuator, there were two mounting

53
options: The first option, shown in Figure 27, would place the linear actuator in the location that
the carts steering rack had been mounted in, while the second option, shown in Figure 28, would
put the actuator in front of the rest of the cart.
Figure 26: Possible mounting location if the motor is used to drive the original steering rack of the
can
Figure 27: Possible method of using the linear actuator for steering seen from three angles. The
linear actuator would be located where the steering rack was originally.

54
Figure 28: possible mounting of linear actuator in front of the Cart's suspension. This would not require the
removal of the original steering rack.
A motor driven steering rack would have required a belt or chain drive system of some
kind. The first option for mounting a linear actuator would have allowed the actuators force to be
more effectively used, however the actuator’s range of motion would have been limited. The
second mounting option for a linear actuator would have given plenty of room for a full range of
motion, but the applied force would be reduced. A challenging decision of which option to use
needed to be made.
The team needed the input of an expert to assist with its decision. The team made several
attempts to contact WPI Robotics Professor, Ken Stafford, after WPI Robotics’ Associate
Director of the Robotics Resource Center, Brad Miller, recommended him. When the team
finally made contact with Ken Stafford, he suggested taking the route of using the carts original

55
steering system. Professor Stafford had previously advised a mechanical MQP that had devoted
its entire project to designing a drive-by-wire steering system for a vehicle. He was able to tell
the team that a human is able to produce a maximum of around one hundred fifty watts of power
with their arms. This, he stated, would mean that a three hundred watt motor would be more than
enough to replace the power a human would be able to apply to the steering wheel. Professor
Stafford recommended the team use a CIM motor. According to him, this motor had an unloaded
speed of 5300 RPM and a full load speed of 2600 RPM. He further informed the team that a
human would turn a steering wheel at a rate of approximately 60 RPM. This meant that the CIM
motor would have to be geared down to this speed. Professor Stafford informed the team that the
maximum reduction a gear or chain drive system is capable of is seven to one. He recommended
that a planetary gearbox be used for an initial reduction and a timing belt drive be used from
there on. He recommended that an overall reduction of nine to one be used. He informed the
team that the necessary components would be readily available from the company Andymark.
When the question of how accurate positioning information could be obtained came up,
Professor Stafford recommended inserting an absolute encoder or a ten-turn potentiometer in the
system. After the team acquired expert consultation, there were many answered questions and
there was a clear path to follow, however it also left more unknowns for the team to find
solutions to.
In order to utilize the cart’s original steering system to turn rotational motion into linear
motion, it required at least a portion of that system to be functional. The biggest issue with this
was that the team did not know how or where to acquire parts for this cart. The team considered

56
purchasing a new cart, however taking into consideration what was available on the market and
the budget we had to work with, this proved impractical. The team decided to contact the local
dealer for Club Car. After several unreturned voice messages, this method was abandoned. The
team then thought to consult someone who works with golf carts on a regular basis. The team
ventured to a local golf course, the Wachusett Country Club, where they went to the maintenance
garage. The maintenance personnel were able to point the MQP team to a website-based parts
warehouse located in Florida. This company, Buggies Unlimited, was capable of supplying all
the manufacturer and aftermarket parts that the team would need to make the steering system
functional. The decision was made to remove the upper steering system entirely, including the
very problematic double universal joint at the bottom of the steering shaft. This resulted in the
decision to purchase a new steering rack, drag link, and drag link end to replace the unusable
components that would remain from the original steering system. The team researched the CIM
motor and accessories that would be used to turn the input shaft of the steering rack. They
discovered that Andymark was not capable of supplying what was needed, but another company,
VEX Robotics, was more equipped to serve the needs of the team. VEX Robotics sells a
planetary gearbox that is capable of up to a one hundred to one gear reduction [24]. Since the
nine to one gear reduction was an available option, the team chose to perform all of the driveline
reduction in the gearbox and to have no belt drive reduction. Due to this decision, a one to one
belt drive system was purchased, which allowed the planetary gearbox to interface with the
steering rack. The chosen planetary gearbox, which was a part of the VersaPlanetary Gearbox
product line, had an option for an adapter that would allow it to attach directly to a CIM motor. It

57
also contained provisions for adding an encoder, which was another option that the team chose to
purchase. As parts began to arrive, the team began to realize that the connection between the
steering rack and the gearbox as well as the mounting of the CIM motor would be very difficult.
The challenges of mounting and connecting the CIM motor were largely due to the input
geometry of the steering rack. This geometry is the reason why the factory had to include a
double u-joint at the bottom of the upper steering system. As the parts that were ordered for the
steering system were beginning to arrive, the team started to mock together how the parts were
going to fit together. Figure 30, below, is a photo of them laid out on a lab bench, showing the
connections that would need to be made.
Figure 29: Lay out of the new steering components on table prior to instillation.

58
One thing that became obvious as time went on is that mounting the CIM motor would be
very challenging. As no one knew exactly how that was going to happen, the team made the
decision to work on the interface between the steering rack and the timing belt. They went to
WPI’s Higgins Machine Shop, and were informed that they were not allowed to use the
machines. Following this incident, the team visited a machine shop, Sandy Hill Locomotive
Works, in Georgetown, MA. The owner, Dick Boucher, and his son, Michael Boucher, advised
the group to abandon the timing belt drive, and instead directly mount the CIM motor with the
gearbox to the steering rack input. This would allow the entire driveline to remain in one axis
and it would prevent any issues with maintaining alignment of the timing belt. Following this,
the machine shop advised the team to create a collar that would grab the custom spline on the
input to the steering rack. This could then be attached to one of the pulleys from the timing belt
setup that was no longer being used. Using the pulley would be necessary, as the gearbox output
was a half-inch hexagonal shaft, which required a half-inch hexagonal hole to firmly connect the
gearbox to the collar. The first thing produced was the collar. This was made out of a piece of
steel round stock measuring one inch long by one and a half inch diameter. It was then trimmed
down to seven-eighths of an inch in length. A hole, measuring ten thousandths of an inch smaller
than the outside diameter of the input spline, was bored in the center. Then, four holes were
drilled and counter bored to accept 10-32 machine screws. One of the pulleys was then drilled
and tapped to match the 10-32 clearance holes. This was all accomplished in one night while
being designed on the fly, meaning that poor design decisions were made, and the final product
did not work. The tapped holes blew out the side of the pulley, which meant that the collar and

59
the pulley could not be connected. When the team regrouped, learned from their mistakes, and
realized a design was needed, they decided to review what was made, and to discover what
needed to be done differently. They then realized that the collar needed to be pressed onto the
steering rack input spline. This meant that the pulley could not be attached to the collar while the
collar was being installed, and the cap screws had to be screwed in from the pulley side, not the
collar side. It was further discovered that instead of using a purely press fit system, it would be
better to slit the side of the collar and use a retaining screw to clamp it together. The last major
design decision was to include a setscrew on the pulley with which to firmly attach the gearbox.
Following this, the team drew up a set of designs, which can be seen below in Figures 31 and 32.
Figure 30: Pulley Adapter CAD Drawing

60
Figure 31: Steering Rack Input Adapter CAD Drawing
The steering rack input adapter is the component being referred to as the collar. There
were a few other minor design changes, including the decision to switch to 8-32 screws to
connect the two adapters together, and to use one and three quarter inch diameter stock for the
collar. Armed with these designs and the remaining pulley, the team returned to Sandy Hill
Locomotive Works. The stock for the collar was cut out and trued up. The center hole was then
bored out to a press fit on the steering rack input spline. Next, the counter bore for the Pinch bolt
was milled, and the hole was drilled and tapped for ¼-20. The slit was cut in the side followed by
the clearance drilling of the pinch bolt. The collar was finished by drilling and tapping the four 8-
32 connecting screw holes. Then the pulley adapter was created. As the team began to work on
the pulley, they realized that the flanges of the pulley were separate from the pulley itself. These
flanges were press fit onto the sides of the pulley. The team then cut them off, as they would be
weakened in the process of drilling holes in the pulley. The pulley then had clearance holes and

61
counter bores for the 8-32 connecting screws drilled. Below in Figure 33 is a photo of one of the
team members working on the pulley adapter.
Figure 32: Team member working on machining the pulley adapter.
The last process performed was drilling and tapping the 10-32 set screw hole. The collar
was then pressed onto the input spline of the steering rack. The pulley adapter was screwed to the
collar and the pinch bolt on the collar was tightened. The final procedure was to securely attach
the CIM motor and gearbox to the pulley adapter using the setscrew.

62
Figure 33: Finished coupler attached to the steering rack.
Above in Figure 34 is a photo of the final coupler attached to the steering rack. This was
accomplished rather easily, but the team had little clue what was waiting for them in terms of
mounting the whole setup.
Due to deadlines set by the Spark Party Presentation, the steering system mounting was
completed entirely in one night. This began with mounting the factory replacement parts. This
was a simple process given the fact that all of the components were direct replacement parts. The
only challenge presented was the need to replace the attachment hardware because the old
hardware had been destroyed by a previous teams work. Once the cart’s lower steering system
was functional again, the team began work on the secure mounting of the CIM motor. The first
challenge was that the motor would not fit in the cart due to the geometry of the steering rack’s
input spline pushing the CIM motor into the dashboard. The team rectified this issue by first

63
removing the speaker system and the LED underglow, as both of these systems were run through
the area of the dashboard that the CIM motor would occupy. The next issue was to remove the
driver’s side of the plastic insert that supported a glovebox and previously the ignition switch.
This was rather easy, as it was only held in with a couple of screws and some rivets that were
easily drilled. Then the metal kick pan that ran from the dash to the floor pan needed to be
notched in the area that the CIM motor would occupy. The notch, made in the kick pan where the
motor exists, can be clearly seen in Figure 35. One concern the team had was that dash supports
would need to be cut, and that this would weaken the structural integrity of the dashboard.
Fortunately, however, the CIM motor fell cleanly between the two adjacent supports. The
clearance between the dash frame and the motor is shown in Figure 36.
Figure 34: Notch cut into kick pan to accommodate the CIM motor.

64
Figure 35: CIM motor clearing the two-dash frame supports. The arrows point out the mounting points of
the motor.
This conveniently meant that they could be used for supporting the CIM motor. The next big
question was how the mount that would be created would connect to the CIM motor. The team
decided to head to the hardware store and look through the plumbing hangers and clamps. The
outside of the motor was close to, but not quite as large as the outside diameter of a standard pipe
size. This meant that none of the options would securely hold the motor. The team did find one

65
Fernco coupling that the team was able to stretch over the CIM motor. However, there was still
no clamp that would grab onto the outside of the motor with the coupling. After several
unsuccessful trips through the hardware store, one team member suggested the idea of using
exhaust clamps. The team then headed to a local auto parts store, where they found a U-Bolt
exhaust clamp that grabbed the motor snugly around the Fernco coupling. In Figure 37, is a
photo of the clamp around the Fernco coupler on the CIM motor. It also details the exhaust
clamp, which will help explain how the exhaust clamp was fastened to the frame of the golf cart
The 2017-18 MQP team then made a trip back to the hardware store to purchase a piece
of steel strapping that would get used to secure the exhaust clamps to the golf cart frame. Two of
Figure 36: Exhaust clamp holding the CIM motor
through the Fernco Coupling. [25]

66
the exhaust clamps were then secured to the motor with the Fernco coupling on it. As shown in
Figure 36, each exhaust clamp is made out of a U-bolt and a strap. The U-bolt provides two
sections of threaded rod with nuts that serve as great places to attach a support. [25] The team
used this attachment place to add a piece of the strapping that was bent to match the profile of
the nearby dash frame supports: one strap for each of the two exhaust clamps that each ran to one
of each of the adjacent dash frame supports. Holes were then drilled in each of the straps and in
each of the dash frame supports to allow the exhaust clamps to be securely bolted to the dash
frame supports through the straps. The straps running between the motor exhaust clamps and the
dash frame can be seen below in Figure 37.
Figure 37: Steering CIM Motor Wrapped in Fernco Coupling Clamped by Two Exhaust Clamps Attached to
Dash Frame Using Steel Straps

67
4.1.3 Steering System Testing
With the mounting of the steering system complete, the focus switched to testing the
steering system. At first, the team decided to directly touch the leads of the motor to a battery to
“bump” the steering from the left, to the right, and back again. This worked perfectly, and proved
that there was not any binding in the steering components. The team then attached the motor to
the Sabertooth, and proved that the cart could be steered using drive-by-wire. In Figure 38, is a
photo of the front of the cart, including the steering system during its initial testing.
Figure 38: Front End of Cart Including Steering System During Testing

68
A few problems presented themselves during testing. The major ones were software
related; however, there was a non-critical design mistake discovered. This design mistake was
that the calculation for the gearbox reduction was never performed. The team had assumed that
Professor Stafford’s recommendation of a nine to one reduction would be correct. However, if
the reduction had been calculated using Equation 1 below, the team would have found that they
wanted a much greater gear ratio:
Equation 1: Gear Ratio Equation
𝐺𝑒𝑎𝑟 𝑅𝑎𝑡𝑖𝑜 =𝐼𝑛𝑝𝑢𝑡 𝑆𝑝𝑒𝑒𝑑
𝐷𝑒𝑠𝑖𝑟𝑒𝑑 𝑂𝑢𝑡𝑝𝑢𝑡 𝑆𝑝𝑒𝑒𝑑
Using the loaded speed of the CIM motor, 2600 RPM, as the Input Speed and the Desired
Output Speed of 60 RPM, the team calculated the required gear ratio to be approximately forty to
one. The consequences of using nine to one instead of forty to one was first that the maximum
torque was lower, which wasn't an issue and second that the ability to control the steering speed
was significantly lowered. This meant that under worst-case scenarios the motor speed had to be
limited in software to 11% of full speed to obtain the desired speed. With the testing of the
mechanical components of the steering system completed, the team moved on to work on the
software and controls design of the cart.
4.2 Steering Software
The steering software controls a motor that turns the rack and pinion, moving the angle of
the wheels. The code was built in a way that it started simple and thoroughly tested, then more
complex parts that built on the original were added in and tested. The software is on a Teensy

69
3.5 and receives inputs from the CAN bus telling it what amount of degrees the wheels must be
at. For the system to act intelligently there are sensors that are used to determine the location that
the rack and pinion is at, mainly and encoder and two limit switches. The circuit for the steering
system was simple but used a few complex components.
4.2.1 Steering Controls Circuit
In order to control the steering CIM motor was used with a Sabertooth motor controller
was used. This motor controller fits the specifications needed plus a margin of error to control
the steering motor. The Sabertooth 2x60 is able to be powered by 6V through 30V, meaning that
even if the 12V batteries are draining, the steering motor will still be powered. In addition, it can
take up to 60A continuous per channel, and a spike of 120A. The motor used has a free current,
the current drawn when the motor has no load, is 2.7A, even when the cart is on the ground the
amps drawn should remain below 60A. However, the stall current, the maximum current drawn
when applying maximum torque, of the CIM motor is 131A. Though the stall current is above
the abilities of the Sabertooth, the cart should never be in a position when this is occurring. If the
stall current is reached, there is a larger problem occurring that needs to addressed [26].
For the wiring of the Sabertooth, motor controller the gauge of the wire is important so
that it is not overheating. The expected continuous amp draw is at most 45A. According to the
datasheet, the battery lead size should be at minimum 8 gauge and the motor lead size should be
10 gauge. This is important because if not complied with the Sabertooth can overheat and fail
[26].

70
Figure 39: Sabertooth Heat Map showing Incorrect Gauge Motor Leads vs Correctly Sized Leads. The left
two wires are to small and are causing the overheating of the Sabertooth Motor controller, this can cause
fatal and unpredictable errors. [26]
Figure 39 shows what occurs if the motor leads are too small when 40A is continuously
running. The wires on the left are 12 gauge, instead of being at least 10 gauge, causing the left to
overheat and effect the center of the Sabertooth where the battery leads are. The issue of
overheat could potentially lead to dangerous errors that the cause of are not obvious at first
glance.
The Sabertooth is controlled by the Teensy 3.5 output of a pulse width modulated (PWM)
signal. The datasheet suggests putting the PWM signal through a low pass R/C filter. Following
the suggestions, a 10k ohm resistor was used with a 0.1uF capacitor as seen in Figure 40. [26]

71
Figure 40: Circuit for Filtering the PWM Signal before Connecting to the Sabertooth. This circuit smooths
the PWM output from the Teensy removing any high frequency spikes in the signal. [26]
A quadrature encoder is used on the motor so that the angle of the wheels is known. An
encoder is an electromechanical device that can determine rotational motion; the one being used
for the steering is a magnetic encoder. A magnetic encoder has permanent magnets with altering
poles spaced around a disk that moves with the motor shaft, a Hall Effect sensor stays in place
and picks up the alternating magnetic field, as the magnets pass. For a quadrature magnetic
encoder, a second Hall Effect sensor is placed at 90 degrees offset from the first (Figure 41) [27].
Figure 41: Magnetic Encoder Construction. The shaft with the gear is connected to the motor s haft and
rotates at the same speed so that the magnetic pickup receives input for each tooth and uses that to produce a
value that represents the amount the motor has spun [27]

72
The offset of the two sensors allow there to be two channels, A and B that are 90 degrees
out of phase. Having the two channels out of phase, it is possible to know which direction the
quadrature encoder is turning. If channel A is leading B then the disk is rotating clockwise; else,
if channel B is leading A then the disk is rotating counter-clockwise (Figure 42). [28]
Figure 42: The direction the encoder is turning changes which channel is leading. This allows the program
to know which direction the encoder is turning. [28]
For the Goat Cart a quadrature encoder is used to determine what angle the front wheels
currently are. The motor’s rotational movement moves the pinion in the rack and pinion system,
which moves rotationally along the linear rack, causing the wheels to angle. The quadrature
encoder attached on the gearbox picks up the movement of the steering motor, and because the
movement originates with the steering motor, the angle of the wheels can be calculated from the
quadrature encoder values. Unfortunately, since the quadrature encoder loses power when the
cart turns off, the location of the steering motor is lost, requiring calibration every time the cart is
started.

73
The quadrature encoder used requires 5V and GND, and outputs signals A and B (the
quadrature channels). [29] The power comes from the Teensy breakout board that has a 12V to
5V voltage converter. The outputted signals connect to pins 22 and 23 on the Teensy via the
breakout board.
The encoder does not know where the ends of the steering rack is, for this reason; the
limit switches were added so to not overrun the rack. The limit switches are attached to the A
frame and are hit by hard stops that are built into the steering arms as seen in Figures 43 and 44.
The limit switches do not have a shared ground, most likely because of the liberal use of
epoxy attaching them to the Cart. One of them had to be reattached using JV Weld, which is
conductive, so it connects the ground to the A-frame. The circuit for them is very simple because
the Teensy has internal pull-up resistors, so the signal wires plug directly into the Teensy
breakout board.
4.2.2 Software Design
The program for the steering was built in steps, going from basic human controlled, to
automated using the different sensors. Initially, the program only had the wheels turn left and
right based off when the human presses the buttons for left, right and stop. This is what was used
for Spark Party in November 2017, because there was limited time for development and testing.
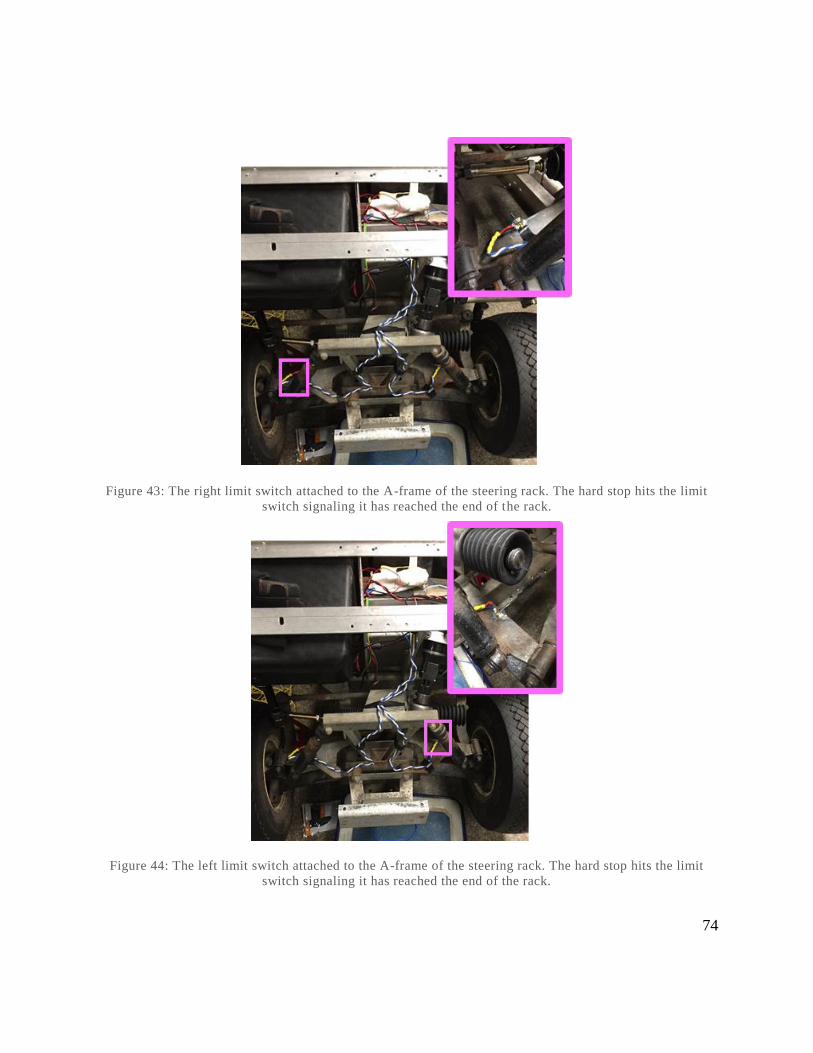
74
Figure 43: The right limit switch attached to the A-frame of the steering rack. The hard stop hits the limit
switch signaling it has reached the end of the rack.
Figure 44: The left limit switch attached to the A-frame of the steering rack. The hard stop hits the limit
switch signaling it has reached the end of the rack.

75
The next version of the program had the program turning left and right based off human
button presses, and having the steering stop at the ends of the rack. This is the first
implementation with the limit switches being used to detect the end of the rack. Adding the limit
switches eliminates the possible issue of the steering not stopping before the end of the rack. It is
better than having just a hard stop because with just a hard stop the motor will continue trying to
turn the rack while it is hitting against it. The logic of this version of steering can be seen in
Figure 45.
The next iteration of the steering program was to include a calibration mode. The
calibration is necessary because upon the startup of the cart it is unknown where straight is in the
steering. To determine the center of the steering rack, which is the straight position, the
quadrature encoder and the limit switches were used. The process for calibration is simple. The
cart turns left as far as it can, hitting the left limit switch and getting the encoder value at that
position. Then the cart turns right as far as it can, hitting the right limit switch and getting the
encoder value at that position. Then the average of the two values is found and then the cart goes
to the value within a small range of tolerance and then zeros the encoder value at that location,
which is then called 0 degrees or straight. This process can be seen in Figure 46.

76
Figure 45:Flow chart depicting the process of the steering program with just limit switches. Based upon user
input the steering turns left or right till it hits a limit switch and stops.

77
Figure 46: The program for calibration runs at start up so the cart knows what position it begins at. The cart
turns full right and left grabbing the extreme encoder values, and then averages the values to find center.

78
The last addition to the steering software is adding a function that receives an input that takes
a character ‘N’ or ‘P’ followed by a number between 1 to 90 and then turns to said degrees. The
character input signifies positive or negative, where 0 degrees is straight, as seen in Figure 47.
This scheme was chosen because it is logical and simple for the CAN bus to send and for the
steering Teensy to decode.
Figure 47: Diagram of Goat Cart with steering degree code inputs. Straight is 0, while -1 to -90 degrees is N##,
and 1-90 is P##, these codes are chosen because they are somewhat self-explanatory.

79
Once the message is received and decoded. The program finds out where the steering initially
is. Then it determines which direction it must go to get to the desired location. Once it starts
turning the desired direction, the program continuously checks if the steering has hit the correct
location by checking the current encoder values with the desired encoder value with in a
tolerance. Once the steering has hit inside the tolerance for the correct range it stops. Figure 48
shows this process
Figure 48: Steering program that receives an input of degrees. Then based off the current location the steering
turns left or right to reach the desired location within a range of tolerance.

80
4.2.3 Steering Software Implementation/ Testing
The program was implemented in stages, as discussed above. Each subsequent part builds
off the previous, making it easy to keep adding additional functionality. Every part is further
broken down into multiple functions that complete a section of the desire part that are then
called. This process was done so that every part can be thoroughly debugged and tested. The
logic is kept straightforward, so that there will be few exception cases that need to be handled. In
addition, by keeping the logic simple, ideally future years of this project will understand how
steering works and can build upon it.
There were a few minor issues when testing the steering programs. The basic steering
program worked well at the first try, the only complication was getting the Teensy to
communicate to the Sabertooth. After checking the switches on the Sabertooth (Figure 49) and
placing it into PWM mode, it worked properly. [30]
Figure 49: Sabertooth switches are used to tell the controller what mode it should be in. The mode shown is
for non-lithium batteries, microcontroller PWM input, independent motor one and two mode with linear
control. [30]
Adding the limit switches added another layer of complicity, but was quickly up and
running. The most bothersome part while testing was keeping track of which limit switch is left

81
or right, and if it was on or off, this required a chart to be made describing the limit switches
(Table 7).
Table 7: Logic chart used for debugging the limit switches, while seemingly simple as a chart, it was much
more difficult when the switches were off the cart.
Limit Switch Logic Chart
Teensy Pin Output 0 Output 1
Right Limit Switch 34 Not at end of rack At end of rack
Left Limit Switch 33 Not at end of rack At end of rack
After that was completed and debugged, the calibration was tested. The calibration
system worked perfectly since the first time it was implemented. The encoder was simple to use
properly because there is a working Teensy library for encoders. Then during later tests, the limit
switch broke off and had to be reattached to the frame twice. The limit switch was then attached
with JV Weld instead of the originally epoxy. The switch that was connected with JV Weld to
the cart would be grounded to the A-frame because JV Weld is metallic. If both switches were
grounded out then only one ground wire would be necessary.
Then when testing resumed C term 2018, the steering was not functioning properly. The
code did not change, nor did the hardware so it was assumed that something broke. This meant it
was necessary to go through the entire steering circuit and debug. The first step was to test the
initial version of code that had no sensors, just the motor turning and stopping based upon user
inputs. This test was successful, so it was concluded that the issue was with one of the sensors.

82
The second test had the limit switches added into the circuit; this did not work as it should have.
From the second test it was determined there was an error with the limit switches. From this, the
limit switch testing had to be redone and compared to the chart shown in Table 7 above. Oddly
enough, the limit switches values were not changing. This led to the conclusion that a wire was
broken. The wires were then tested using a multimeter, from this it was found that two wires in
the harness were broken and another one that was connected to the limit switch. The latter was
replaced and the limit switches were disconnected from the harness and plugged into the Teensy.
In addition, to simplify the circuit, the pull up resistors for the limit switches were removed and
replaced with the internal pull up resistors in the Teensy. Once the steering circuit was repaired
and improved the steering calibration code worked as expected.
4.3 Steering Summary
The steering system was completely redone by the 2017-18 team. The previous steering
was out of alignment and damaged. Instead of wasting time fixing the old system, a new steering
method was devised after consulting with professors and professional machinists. The new
steering system has a new steering rack that is controlled by a CIM motor. The steering motor
was solidly mounted to the front of the cart. When driving the motor will not shift out of
alignment, and excluding a major crash the mechanical steering should not be changed in the
future.
The steering circuit and software was redone and improved. The circuit was simplified to
include the motor controller, two endstop limit switches and a quadrature encoder. By having the

83
limit switches and encoder it is possible for the steering system to know where the end of the
rack is and where the steering is currently pointed. The final 2017-18 version of the steering
program has a calibration mode that must run at the once the cart turns on, so that way the Goat
Cart knows where it is. Then to turn when driving about, the steering can receive a command of
how many degrees it needs to turn from -90 to +90 with 0 being straight. The steering program
does not have any self-correction, which should be added in the future.

84
Chapter 5. Braking
The braking on the car was supposed to be complete from previous team’s work.
Unfortunately, that was not the case and a new design had to be implemented. The existing
motor was repositioned so that it provided enough force to apply the brakes while maintain the
manual functionality of the brake pedal. The final version of this design is very solid and should
last many years of testing and experimentation.
5.2 Braking Design
As stated in the initial conditions, the braking system was installed but was not connected
to anything. In the original design, the brake motor pulled a cable by wrapping the cable around
the motor shaft. The cable, in turn, connected to a lever (Item 3) that attached to the braking axle
(Item 2) as shown in Figure 50.
The brakes are activated when the brake axle (Item 2) turns and wraps another cable
around itself pulling on the brake mechanism. When testing the system, the team found that it did
not activate the brakes. Going back to the data sheets of the motor and doing some basic math,
the team discovered that the brake motor could not provide enough force in its current position to
activate the brakes.

85
Figure 50: Shows a side image of underneath the cart. Item 1 is the bottom part of the level that is the brake
pedal. Item 2 is the brake axle. Item 3 is the lever where the previous team attached the cab le to the brake
axle.
Performing some basic math using the torque equation (Equation 2) the team found that
the previous team’s location of the brake motor was inefficient. The equations shows that the
main factors of torque are the force (F) and the distance from the axis of rotation (r). The sine
component is used to find the vector of the force that is perpendicular to the lever extending out
from the axis and acts as a scaling factor for the force. For rough math, the sine component was
ignored as all of the forces being dealt with acting at or very close to 90 degrees.
Equation 2: T = F*r*sin(θ)

86
Using this information the team analyzed the current position of the brake and the forces
involved in activating the brake manually. To activate the brakes manually, the operator would
push on the pedal, which would turn the brake axle and activate the brakes. Rough
measurements found that the top of the brake pedal was approximately sixteen inches away from
the brake axle whereas the brake motor cable was only mounted two inches away. Using the
torque equation it can be determined that the brake motor needed to exert eight times as much
force in this configuration as the manual use of the brake pedal does. Looking at the data sheet
for the brake motor, it can output 19.2N*m at peak power. Solving the Equation 2 for torque and
converting inches to meters, the brake motor can apply 208Nm of torque on the brake axle,
where for the same amount of force the pedal can exert 1864Nm of torque.
Several options were considered to fix this problem. While buying a more powerful
motor was possible, the team decided to attempt repositioning the existing motor to a location
that would give it more torque. Attaching the motor cable directly to the braking mechanism
was considered, but this had two flaws. The first is that it the motor would still not have enough
torque, the second issue is that it would remove the manual functioning of the brake pedal in an
emergency.
Alternatively, mounting the motor to pull the brake pedal itself would avoid all the
previously mentioned problems. This configuration would provide an eight times increase in
torque compared to the previous implementation and would maintain the functionality of the
brake pedal in emergencies. Another factor in choosing to keep the old motor was that it was a

87
worm drive. A worm gear motor does not require any power to hold its position, only to change
position.
The ideal location for the motor to connect to the brake pedal would have been directly
under the dashboard of the cart as seen in Figure 51.
Figure 51: Shows the ideal mounting location for the braking motor as it could be hidden away under the
shell when finished. Also, show the interference that would occur with the steering it was located there
Unfortunately, this was not possible, as it would have collided with the new steering system,
which took precedence. The only other option was to mount the motor to the floor panel directly
behind the brake pedal (Figure 52).

88
Figure 52: Shows the final mounting location of the braking motor directly behind the brake pedal. The
brake cannot be push far enough down for it to interfere the brake motor.
This option gave the team a mounting point directly on the frame and would require the least
amount of additional structural support.

89
A brief testing of the electronics in the original brake setup seemed sufficient. The motor
controller, a Sabertooth, can output a maximum of 60A and the brake motor stalls out at
40.9A. Therefore, the previous team’s selection of a motor controller is sufficient for this
motor’s needs. Additionally the Sabertooth motor controller can be directly controlled with a
Teensy 3.5 via PWM control, which is the standard for this project.
5.3 Braking Implementation
To mount the motor, a portion of the floor panel needed to be cut away. The team started
cutting with a handheld dremel and several small abrasive cutoff wheels. This method of cutting
ended with the job half way done, after several cut off wheels were used up and the dremel was
melted. To finish cutting the hole, the team used metal shears and pliers to bend, cut, and move
the thin aluminum flooring out of the way. This process of cutting the flooring was crude but the
team was on a very tight timeline because of Spark Party 2017. A proper handheld grinder or
metal saw is advised for any future endeavors to cut the flooring. However, the final hole
created was in line with the brakes and good enough for fitting the motor in place.
After the flooring was cut out, the team drilled a hole through the frame where the motor
shaft needed to go. This hole was positioned such that, when the brake was fully depressed, the
angle between the cable and the brake shaft would be as close to 90 degrees as possible to
maximize the torque under maximum load.

90
Figure 53: Shows the hole that was cut to allow the brake to be mounted behind the brake pedal. Item 1
shows the additional hole that was need to be cut for the cable to be run from the motor to the brake pedal.

91
Once the position of the motor shaft was selected, created the motor was dry fitted in place. One
team member held the motor in place while another team member marked the positions of the
mounting holes. Due to the time crunch, proper measurements to locate the mounting holes for
the motor were not taken. Additionally, because of the location of the holes it was difficult to
place the drill inline. One of the holes was in the correct location, but the other was slightly off
and needed to be widened. Only having two mounting points left the motor slightly wobbly
when the bolts were fully tightened. To remedy this instability, a piece of sheet metal was added
between the motor and the frame of the golf cart to allow a third mounting bolt to be used. Due
to the thickness of the metal sheets available, two plates were stacked for maximum stability.
The sheets of metal stuck out into the front of the cart more than expected and later became a
problem during testing. The result can be seen in Figure 54.
The next step was to hook up the cable from the brake motor shaft and the brake
pedal. The team got 6 feet of steel cable and crimps to secure it on each end. The cable was
crimped in place because there was excess cable and it could be replaced if it needed to be
modified. The brake shaft already had a hole drilled through it from the previous system
design. The cable was threaded through the hole in the motor shaft and crimped back on itself so
that it was secure.
The other end of the cable was then threaded through the hole in the flooring and around
the brake pedal (Figure 55, Item 1). It was secured with a crimp and eye loop to prevent the
motion of the brake pedal from wearing through the cable over time (Figure 55, Item 2). The

92
length of cable between the brake pedal and the motor shaft does not have to be exact because
any excess would be would up on the brake motor shaft.
Figure 54: Shows the brake cable (Item 1) wrapping around the shaft of the brake motor. Item 2 is the crimp
on the end of the cable keeping it secure.
The first circuit that the team designed used voltage to control the Sabertooth and by
extension the motor. One of the input modes of the Sabertooth takes in a voltage value of 0-5
volts. 0V would be full reverse, 2.5V would be stop, and 5V would be full forward. To achieve
this input a MCP4131 digital potentiometer was used as a voltage divider.

93
Figure 55: This figure shows the circuit diagram for the first method of control of the Sabertooth. The 10k
digital potentiometer is control through SPI from the Teensy. The Sabertooth then reads the digital pot
output and powers the motor.
As seen in Figure 55, the MCP4131 is controlled by the Teensy using the SPI library and
sending control bits ranging from 0 to 255. These control bits change the resistance of the
potentiometer from roughly 300Ω to 10kΩ. The MCP4131 has three output pins, a high, a low,
and the wiper. By hooking up the high to 5V, the low to ground, and reading from the wiper a
variable voltage divider is created. The Sabertooth supplies the 5V and ground reference for the
MCP4131, reads back the wiper voltage, and uses that to control the brake motor. In addition to
taking in the wiper value, the Sabertooth is hooked up to a 12V DC supply and the motor itself.
After testing, this first method did not work. The second attempted method of controlling
the Sabertooth used pulse width modulation (PWM) control. The Teensy can directly output
PWM signals to the Sabertooth. In this mode, the Sabertooth control pin is directly wired to the

94
output pin on the Teensy. This method allowed for much finer and more reliable control of the
brake motor.
After the first round of testing, the team added end stops to the brake pedal (Figure
56). These were placed at the extremes of motion of the brake pedal to tell the cart if the brakes
are on or off.
Figure 56: This image shows the location and mounting of the endstops. These are active low endstops
originally intended for car emergency brake detection.
Since, the limit switches sense the movement of the brake pedal and not the activation of
the brake motor, the end system will still trigger if the operator manually engages the brakes.
One of the endstop was directly epoxied to the flooring of the cart such that it is pressed when

95
the brake is in the off position. When this endstop is released, the system knows that the brake is
engaged. The other endstop is epoxied onto a spare strip of metal across the hole in the flooring
for the brake pedal shaft. The purpose of this endstop is to detect when the brake pedal is fully
engaged in order to prevent the brake motor from pulling the brake pedal too far. There are two
different ways to modify this system for finer control. One is that shims can be added to the ends
of the endstops so that they activate quicker. Additionally, the actual brakes themselves can be
adjusted by tightening the clamps within the wheel wells or the cable that runs from the brake
pedal axle to the brakes themselves.
5.4 Braking Testing
The braking system required several stages of testing. The stages alternated between
having the cart up on jack stands and driving it through the hall. The brake motor was hooked up
to the Sabertooth motor controller, which was connected to the 12V system and a Teensy
3.5. The first attempt to use the Sabertooth was with the MCP4131 voltage divider. This method
did not work because the digital potentiometer did not operate correctly when driven by the
Sabertooth. The proper functioning of both the Sabertooth and digital potentiometer were
verified by testing each component individually using a bench power supply. When the digital
potentiometer was driven from the 5V pin on the Sabertooth, it ceases to work properly. The
team believes that there was some problem using the Sabertooth’s own 5V and reference ground
for the voltage divider. This was done because of the Teensy operating on 3.3 volts instead of 5
volts. The Teensy’s 3.3V output prevented it from controlling the Sabertooth directly with
voltage. As a work around, the team found that the Sabertooth could accept PWM control signals

96
directly. This method proved effective and remained the main method of Sabertooth control
currently used.
The initial braking program was contained very basic logic. A counter ranged from 0 to
180 to describe the speed and direction of movement. During testing it was discovered that the
off signal for the Sabertooth was not the expect 90 but instead 91.This method proved effective
for testing but was not viable to use moving forward as it could not be easily controlled via the
CAN bus.
To help create a CAN friendly code, a function was created to set the motor at a set value
to wind in the cable for a set amount of time. This function is called brake on and is quite
simple.
void brakeOn()
myservo.write(135); // turns on one direction
delay(1000);
myservo.write(91); //stop motor
This function tells to motor to turn on at a specific speed and wind up the cable for 1
second then turn off. The motor is treated as servo because there are predefined libraries for
sending out PWM signals to a servo. Additionally, a reciprocal function was created to turn off
the motor.
void brakeOff()
myservo.write(46); //turn the other direction
delay(750);
myservo.write(91); //stop

97
This function tells the motor to unwind at a set speed for 750 microseconds and then turn
off. The BrakeOff function is activated for less time because there is no load on the motor unlike
when it is activating the brakes. These times were what we estimated to be equal amounts of
winding and unwinding of the brake cable. However, it was not perfect and cable would slowly
become more wound after each cycle of BrakeOn and BrakeOff. This would be fixed later by the
endstops, but at this point, it was good enough to test with the cart on the ground.
It was assumed that there would be no addition load with cart on the ground because the
weight of the cart on the wheels should not affect how much force is needed to apply the
brakes. Because of the drifting of the BrakeOn and BrakeOff function for full cart testing, it was
decided to add granular control of the brake motor to the code. This created the ability to manual
increment the value of the servo so that we could set the start position of the brake to start the
test. The cart was brought out of the lab and down into the largest hallway in the building for
testing. The team proceeded to drive the cart up and down the hall for two days testing,
modifying, and retesting everything. During these full cart tests, the BrakeOn and BrakeOff
functions worked perfectly after some slight timing changes.
When endstops were added to the braking system, the code had to be modified to
consider the limit switches. The general logic of brake on and off remained the same; the only
addition was checking if the limit switches were pressed. This was done by making the braking
independent from time, instead having the braking motor stopped if a limit switch was pressed.
The logic of this is very similar to the second iteration of the steering software.
98
When debugging the version of the code with the limit switches there was one major
issue. The limit switches were not working as expected, instead of changing states they remained
single state. This was not the expected result, and had to be tested to see what the problem was.
The limit switches were tested individually and were found to work properly, but when used
together they did not. This lead to the conclusion that the two switches shared a ground. Using a
multi-meter with the limit switches, this was confirmed. The solution was to use a single ground
wire for the two switches instead of one for each switch.
5.5 Braking Summary
This year’s team managed to salvage existing hardware and create a functioning design
while spending minimal amounts of the budget. We took the existing motor and repositioned to
get an eight times increase in torque compared to the previous implementation. The new
implantation was augmented with endstops to detect what state the brake was in. Additionally,
this design maintained the functionality of the brake pedal for manual use in an emergency.
Using the states, we created a state machine that can cycle states for use with CAN bus
commands and have the state overwritten in an emergency. This current design for braking
should last for the rest of the golf carts life spans barring any unforeseen circumstances.

99
Chapter 6. Throttle The throttle system on the cart was functional yet isolated. The team initially left it alone
to work on other, less initially functional, systems. However, the burnout of the motor controller
forced it to be reevaluated and eventually reconstructed.
Figure 57: Location of throttle system on the cart

100
6.1 Throttle Circuit Design
The throttle system on the cart is composed of five components: a digital potentiometer,
motor controller, drive motor, solenoid, and forward/reverse switch. Each piece needs to be
working in order for the cart to drive. In the original system designed by the 2016-17 team, the
digital potentiometer was used as the input for the motor controller and was, itself, controlled by
an Arduino that was intended to be connected to the CAN bus. The motor controller that was on
the cart when received was a Curtis 1204-410 with the A2 pin missing. The drive motor is a Club
Car 48V electric motor, which was original from when the cart was first acquired for the MQP.
The solenoid works in concert with the original onboard computer to act as a breakpoint for most
of the kill switches. The two direct kill switches are the key switch on the dashboard of the car
and the wireless kill switch receiver near the batteries. The third kill switch is an Anderson
power connector located under the seat of the cart that allows the 48v battery array to be
disconnected from the rest of the cart without any disassembly or disconnection of wires. The
forward/reverse switch is a physical switch in line with the main power cable and is used to
change the polarity of the DC motor inputs. The full wiring for the throttle system is described in
Figure 58.
The bulk of the wiring work for the project involved wiring to or from the motor
controller directly. The motor controller has four main power fins, four control fins and a 4-pin
connector as seen in Figure 59.

101
Figure 58: Wiring diagram of throttle system and wire colors [19]

102
Figure 59: Pin layout on motor controller face [31] The following Tables, 8 and 9 elaborate on the different
pinouts
The main power fins are significantly thicker and require cables to be bolted to them. The control
fins are smaller and have header cables to attach to them.
Table 8: Power fin descriptions [31]
Table 9: Control fin descriptions [31]

103
The 4-pin connector is a new feature of the 1204M controller and is primarily used for
interfacing with the programmer (Figure 60). It can, however, be used with an external status
LED for diagnostic purposes.
Figure 60: Diagnostic pin cluster diagram for use with programmer or external LED. Table 10 elaborates on
the different pinouts. [31]
Table 10: Diagnostic pin cluster descriptions [31]
The motor controller is mounted on the underside of the engine housing causing all the
pins to appear reversed relative to the wiring diagram as seen in Figure 61.

104
Figure 61: Motor controller face close-up with main pins labeled

105
6.2 Throttle Implementation The code for the system was found on the server (which is actually a UNIX computer).
The comments were sufficient to make the code understandable. However, no wiring diagram
existed to explain how the digital potentiometer and motor controller were configured together.
Multiple pinouts had to be referenced via their data sheets to identify them and understand the
circuit.
The throttle code found on the server was in much better condition than most of the other
code for the cart. The comments were sufficient to make the code readable; however, no wiring
diagram existed to explain how the digital potentiometer and motor controller were configured
together. Multiple pinouts had to be referenced via their data sheets to identify them and
understand the circuit.
In order to integrate the throttle system with the CAN bus control network, the Arduino
needed to be replaced with one of the team’s CAN interface board that contains a Teensy 3.5.
This required changing references to Arduino pins into references to the correct teensy pins,
which took the bulk of the necessary work time. At the same time, the team decided to integrate
the braking code onto the same Teensy. This hardware level unification allowed the team to
prevent the throttle and brakes from engaging at the same time without having to worry about
signal delay from the CAN bus.
After reviewing all the disparate elements of the throttle system, the team was
successfully able to engage and control the throttle. They then begin to test the capabilities of the
system through a range of speeds. The cart appeared to perform well on the tests until the digital

106
potentiometer suddenly burned out. It was determined that the throttle system had originally been
designed for an analog potentiometer tied to a physical pedal. The key difference between analog
and digital potentiometers is that, though digital potentiometers can be remotely controlled, they
have a much lower maximum current threshold. The resistance of the potentiometer was
continually lowered to increase the speed the cart was tested at causing higher currents through
the potentiometer until it burned out. This was replaced by a higher rated potentiometer and no
further high-speed tests were performed. The code was also altered to include speed limiters at a
software level to prevent this from happening during future testing.
6.3 New Motor Controller The throttle system remained functional during system level testing but the motor
controller broke down just before the team’s demonstration for spark party. There appeared to
have been a loose connection to the motor controller that caused an intermittent disconnection
and current spikes into the controller. This caused the motor controller to fry internally and
rendered it unrepairable.
The team reached out to Curtis, the motor controller manufacturer, about the possibility
of them sponsoring the team for a new motor controller. Curtis agreed on the condition that they
first receive confirmation of the team’s affiliation with WPI in the form of a full letter of request
on school letterhead. They also asked that this letter contain an explanation of what had led to the
problems and what was being requested from Curtis. A letter meeting these conditions was
quickly drafted and signed by both Professor Wyglinski as the team’s advisor as well as by

107
Professor McNeill as the head of the department. A scan of this document plus both professors
business cards with contact information were sent back to the point of contact at Curtis.
A week later, a second point of contact from Curtis reached out to the team and offered to
sponsor the team for the same model of motor controller that burned out the 1204. The only
catch was that they were made to order from a factory in Bulgaria and would take 10-11 weeks
to assemble and ship. Another series of emails were exchanged where the team asked if Curtis
could send them one of their newer models of the same controller and upgrade rather than just
replacing the old design that was over 20 years old. The Curtis representative said that he was
happy to provide a newer motor controller but that the newer models were also made to order
and would take an even longer 13-14 weeks of lead-time. Additionally, a separate programmer
kit was also needed to run diagnostics or to use some of the new settings available in the
upgraded controller. This had a similarly long lead-time but Curtis was generous enough to
donate both the motor controller and programmer kit in exchange for officially sponsoring the
project. The team agreed to this but also wanted to begin work on the cart as soon as possible.
A second motor controller of the same model was purchased from Buggies Unlimited
with the intention of using it until the Curtis controller arrived. However, the Buggies Unlimited
was delayed in shipping around the Christmas season and was unable to be processed through
the ECE department during winter break meaning that it was received only two weeks before the
Curtis controller arrived. The team determined that a burnout of the new controller was unlikely
and so, rather than keep one controller as a spare, decided to return the Buggies Unlimited
controller for a refund.

108
The new motor controller was mounted in the same location as the previous controller as
seen in figure 55. One of the features of the new motor controller is that there are now nine
different accepted types of input. Unfortunately, changing between input types requires the
programmer, which was further delayed in its arrival so input mode 0, was used. In this mode,
the controller tries to read a 0ᘯ to 5kᘯ resistance between two of its input pins. It uses this to
determine what percentage of total power to send to the motor. The behavior of infinite
resistance when the terminals are disconnected has not yet been determined. This input method is
similar to the previous motor controller with the only difference being the resistance range
decreased from 10kᘯ to 5kᘯ allowing the adaptation of the replacement digital potentiometer
with minor software changes to halve every output.
Another feature of the new motor controller is a functional A2 pin. This pin is exclusively
used for resistive braking on the new motor controller. Resistive braking is a throttle based
braking system that automatically engages whenever the throttle is not actively driving the motor
by putting a load across the motor causing it to both slow down and regenerate a small amount of
power.

109
Chapter 7. Power
When the 2017-18 MQP team received the golf cart at the beginning of A-term, they
were told that power had been taken care of by the previous year’s team. There is a +48V system
that powers the throttle (Figure 62). The +12V system powers the peripherals, which for the
current 2017-18 setup is composed of CAN interface boards and a Sabertooth. The +12V system
can be viewed in Figure
Figure 62:Depicts the +12V power system of the Goat Cart.
The 2016-17 report stated that there were automatic chargers on the batteries. This led the
team to assume that leaving these plugged in to a wall outlet, as this is generally an acceptable
way of maintaining batteries. In the middle of B-term, it was discovered that the cart would no
longer drive.

110
When trying to diagnose the issue the team found the voltage across the +48 volt battery
bank was +0 volts. The individual battery voltages were checked to see if the issue was loose
connections. Of the four batteries in the bank, only one had a reasonable voltage for a +12V
battery. The other three, had voltages ranging from a negative voltage to approximately four
volts. This led the team to believe that the batteries might have shorted internally due rough
handling.
The team researched rugged, agricultural batteries from John Deere. These batteries, sold
under the name StrongBox, feature plates that are potted in epoxy at the bottom and include
spacers to prevent shorting even in tough conditions. [32] It was believed that this was the best
solution to prevent this issue from occurring again.
Then to confirm that the batteries were incorrectly chosen and that it was not a different
issue, a professor that was knowledgeable about batteries was consulted. It was discovered that
WPI does not have a professor that specializes in battery technology. After asking whom would
know the most, they determined that Professor O’Rourke might be able to help. Professor
O’Rourke made his own assessment of the batteries. He decided to open the battery cells to
determine the water level in each of them. It was discovered that the three batteries with
unexpected voltages were low on water. The remaining working batteries were also low on
water. In fact, when the cells were opened the water that was left inside them could be seen
boiling. Professor O’Rourke advised the team that the three batteries that were not showing
normal voltages were not going to be recoverable. He also stated that the other three batteries

111
would be fine as long as the water was refilled with distilled water. The cause for the boiling off
the water was the charger.
Once this was discovered, the team investigated the capabilities of the charger that was
attached. The charger, the NOCO genius GEN4 (Figure 63), claimed to be able to maintain a
battery after charging it. [33] In reality, it appeared that this claim was meant more as an
automatic shut off after the battery was charged and not that it was suitable for long-term battery
maintenance. This meant that the batteries went through numerous, and unnecessary 10A charge
cycles, when the batteries were only slightly drained, leading to the water to be boiled out of the
cells. It was discovered that the three remaining batteries that showed an acceptable voltage were
also low on water.
The replacement chargers were Automatic 1.5-Amp Battery Charger/Maintainer, is
capable of float charging which is exactly what is needed in the application of the cart (Figure
64). One of the team members had experience with these battery chargers and knew these
chargers would work perfectly in this application. Five Automatic 1.5-Amp Battery Chargers
were purchased, one for each of the batteries in the forty-eight volt system and one for the two
batteries in parallel for twelve-volt system. [34]

112
Figure 63: NOCO genius GEN4 battery charger that was used on the Goat Cart and was replaced by the
2017-18 team. It had automatic shut-off, but it is not a float charger. [33]
Figure 64: New float battery charger that was installed. There is one for each battery of the 48V system and
another for the 12V system.

113
Three, Duracell 27DC batteries were purchased from SAMS Club to replace the dead
ones. The new battery can be seen in Figure 65, and one of the old batteries can be seen in Figure
66.
Figure 65: New 12V battery from the 48V system.
Figure 66: Older battery from the12V system. It is near identical to the newer ones except for the battery
cell covers.

114
7.1 Power Summary The power system was repaired by the 2017-18 team. Three of the batteries of the +48V
system died and new ones were bought. The cause of death of the batteries was found to be from
being continually charged with the NOCO genius GEN4 battery charger. The battery charger
was replaced with a float battery charger, the Automatic 1.5-Amp Battery Charger/Maintainer.
This new charger can be continually plugged into and outlet and left in the power system. The
only maintenance that needs to be done is that the water level in each of the cells should be
checked and topped off twice a year.

115
Chapter 8. Sensors
A sensor is a device that detects events or changes in its environment and sends the
information to other electronics to be processed [35]. Changes in physical properties (i.e.
temperature, speed, light, pressure, etc.) can be detected and converted into electrical signals.
These signals can then be processed by other electronics in order to provide a response or report
a measurement. Control system-based applications often utilize sensors. A control system
typically comprises of a computer or microprocessor and a control program that handles data
from sensors and sends signals to output devices [36]. Computers or microprocessors are used
for their processing speed, consistency, adaptability and stamina. Along with a properly
configured control program, a control system can process data and make appropriate decisions
faster and more efficiently than a human ever could. Today’s applications of sensors in control
systems include manufacturing and machinery, airplanes and aerospace, automobiles, medicine,
robotics and many other aspects of day-to-day life. In an autonomous vehicle, like the WPI Goat
Cart, sensors are a necessity for making real-time decisions.
8.1 Assessment
After the initial assessment of the pre-existing project, the 2017-2018 WPI Goat Cart
Team elected to allocate time and resources to areas of greatest interest/concern, one being
sensors. It was quickly determined that the project’s previous teams had not seen sensor
implementation as an immediate priority. The only integrated sensor was an infrared sensor used
to operate a wireless kill switch. Matthew Mahan was delegated to head up the 2017-2018

116
sensors team and received assistance from other team members when need be. To begin, it was
agreed upon by the team that incorporating a way to measure speed and distance traveled was the
top priority.
8.2 Odometer/Speedometer
To begin the process of engineering a solution to measure speed and distance traveled,
research on prior technologies was conducted. The modern-day vehicle measures speed and
distance traveled with the use of a computerized speedometer/odometer [37]. A computerized
speedometer/odometer is generally comprised of a magnet, a pickup and a computer with a
specialized program (Figure 67) [38].
The magnet is attached to the rotating drive shaft and a pickup is attached to a stationary
point in close proximity of the magnet. Once per revolution of the wheel, the magnet passes by
the pickup, generating a brief pulse of electric current and a corresponding voltage. The
computer records these voltage spikes, or pulses, and uses the specialized program to calculate
the instantaneous speed and distance traveled [38]. Being the most common, effective and
reasonable method, the team approved and proceeded with this generalized design.
To begin the project, it was agreed upon by the entire team that the Teensy 3.5
microcontroller unit would serve as the cart’s universal programmable device for consistency
purposes. Furthermore, the Teensy 3.5 microcontroller unit met all the requirements for the task.
For these reasons, the Teensy 3.5 microcontroller unit was chosen as the computer component to
the speedometer/odometer system.

117
Figure 67: How an electronic speedometer works: 1) A magnet connected to one of the wheels (or more
likely to a driveshaft attached to one of the wheels) rotates at high speed. 2) Every time it makes one
complete revolution, it passes a Hall-effect (or other magnetic) sensor and the field from the magnet triggers
the sensor. 3) A circuit amplifies the signals from the sensor and translates them into your instantaneous
speed and distance traveled. 4) A digital display on the dashboard acts as both a speedometer and odometer,
displaying the speed and distance side by side.
The pickup component was required to be compact, durable and be able to interface with
a computer. Based off the generalized model, the pickup component would ideally be a magnetic
sensor such as reed switch or Hall-effect sensor [38]. Examples of both a reed switch and a Hall-
effect sensor were ultimately purchased in order to conduct testing and gain understanding of
their operation. The test for the components was designed to be able to control magnet proximity
and compare the component’s effectiveness as a switch. For this test, a circuit with a single LED,
power supply and resistor was constructed (Figure 68). Each sensor was then inserted into the

118
circuit as a switch. A magnet was then brought into close proximity of the switch. When in close
enough proximity, the switch would close, and the LED would light up.
Figure 68: The diagram of the test circuit with an LED, resistor, and a magnetic switch. When the switch is
closed, current flows and the LED can illuminate. Otherwise no current flows, and the LED receives no
power. This circuit was used to determine the advantages and disadvantages of each magnetic circuit
element in regards to the speedometer/odometer application [39].

119
This test type of test provided a best estimate as to what type of range and accuracy each
sensor had. After testing was completed, it was determined that the most appropriate solution
was a single-pole-single-throw, normally open, plastic-coated reed switch with wire leads as seen
in Figure 69 [40].
Figure 69: The reed switch used as the pickup component of the speedometer/odometer system. This product
by Littelfuse is a single-pole-single-throw, normally-open, plastic-coated reed switch with wire leads [6].
This choice was based upon the sensor’s ability to detect a magnet effectively within the
dimensions of the wheel well of the golf cart. The magnet component was required to be
compact and be able to trigger the pickup within close proximity. An inexpensive, effective and
convenient solution were the ½-inch neodymium rare-earth magnet discs from a local hardware
store. Once approved by the team, each component was purchased.

120
Once purchased, the next step was to assemble the system and design a program to
accurately measure speed and distance. To assemble the system, one of the sensor leads was
attached to the ground terminal of the microcontroller unit and the other was attached to an
analog input pin. The remainder of the circuit was completed within the program by configuring
the analog pin with an internal pull-up resistor (Figure 70) [41].
In this configuration, the circuit has two states. The first state is when the switch is closed and in
the presence of a magnet. In this closed state, the analog input pin is connected directly to ground
and reads as low. The second state is when the switch is open and unaffected by a magnetic field.
In this open state, the analog input pin is biased by the internal pull-up resistor and reads as high.
The first program was designed around detecting the changes between these two states. In
theory, the passing of a magnet by the pickup would result in a high state, followed by a low
state, followed by a high state. This series of events corresponds to one revolution of the wheel,
when a single magnet is being used. Using this information, both the speed and distance can be
calculated when a single revolution is detected. The distance traveled during a single revolution
of the wheel is simply the wheel’s circumference, 20.995 centimeters. Upon each detected
revolution, the total distance is incremented by the wheel’s circumference. The speed is simply
distance traveled divided by time. By keeping track of the time elapsed between revolutions
using a specialized program, the instantaneous speed of the cart can be calculated. Using these
principles, a program was developed to meet the needs of the task at hand.

121
Figure 70: The circuit diagram of the speedometer/odometer system installed on the WPI Goat Cart. The
system is comprised of the Teensy 3.5, reed switch and magnet. The circuit includes an internal pull -up
resistor that is used to bias the switch high when open. When closed, the digital pin of the Teensy is
connected directly to ground and reads low.

122
Upon assembly of the corresponding circuitry, a series of program modifications were
designed, tested, troubleshot and improved until the final program version met all accuracy
requirements and suffered zero errors. The final result is a program that will measure speeds up
to approximately 30 mph, measure distance in intervals of approximately 13 inches, and transmit
values of speed and distance to the cart’s main server using CAN communication. In order to
achieve this level of accuracy, four magnets were required to be used. The four magnets were
positioned 90 degrees apart from one another along the circumference of the wheel of the cart. In
this configuration, the passing of a magnet would signify one-fourth of a complete revolution of
the cart’s wheel. The final program is designed to first run the setup() function. The setup()
function is used to initialize variables and configure the microcontroller pins, serial data
transmission, CAN communication and interrupt timer. Upon configuration, an interrupt is
attached to the timer with a period of one millisecond. The interrupt service routine, or
readSensor() function, is called every interrupt. The readSensor() function is used to detect a
valid pass of a magnet by the sensor as well as execute an algorithm for calculating the
instantaneous speed and total distance traveled by the cart. In order for an input from the sensor
to be valid, the signal must transition from high-to-low, remain low after a 2-millisecond period,
transition from low-to-high and remain high after another 2-millisecond period. This is
successfully achieved through a series of conditional statements that keep track of a set of five
variables that determine the current state of system (Figure 71).

123
Figure 71: A flow chart documenting the changes in the status of the speedometer/odometer system and the
corresponding status of the changes in the variables of the associated specialized program. The code that
this flow chart represents can be found in the appendices of this paper.

124
The transition in states represent the passing of a magnetic presence causing the switch to
close and open. The periods after the transition in states are put in place to allot enough time for
the switch’s operating and release times to pass. The operating and release times represent the
amount of time it takes for the switch to open and close, respectively, including the state in
which the signal tends to bounce. The switch using in this system is rated for an operating time
and release time of 1 millisecond [40]. In allotting a buffer of 2 milliseconds for these times to
pass, it is ensured that the switch position indeed changed and is not the result of a noisy signal.
This method of solution is known as debouncing and is depicted in Figure 72.
Figure 72: The signal visualization of the passing of a single magnet by the pickup of the
speedometer/odometer system. When the magnet passes, the microcontroller unit sees changes in state from
high to low and back to high again at one of its digital input pins. During these changes in state, a
phenomena known as bouncing occurs where noise becomes present in the signal. This signal visualization
also represents the strategy of how to deal with this phenomena known as debouncing.

125
Once a valid input is confirmed, the instantaneous speed and total distance traveled are
calculated and stored in variables. The total distance traveled is calculated by multiplying the
circumference of the cart’s wheel by the number of revolutions by a conversion factor (to
convert to feet). The number of revolutions is incremented by 0.25 with every valid input from
the sensor.
revolutions += 0.25;
feet = circumference*revolutions*toFeet;
The instantaneous speed is calculated by dividing 0.25 of the circumference of the cart’s
wheel by the time elapsed between valid inputs from the sensor. Additionally, this value is also
multiplied by a conversion factor (to convert to miles per hour).
mph =
toMPH*((circumference*0.25)/float(revTimeDelta));
The time elapsed is kept track of in the readSensor() function and is also used to reset the
speed to zero if there are no valid inputs for an interval of two seconds.
if (revTimeDelta > timeout)
mph = 0;
else
revTimeDelta++;

126
After the setup() function is called, the loop() function is continuously run. The loop()
function is used to format the speed and distance data to be transmitted over CAN. The
formatting of the data is completed in three steps. First, the size of the buffer used store the data
is determined. The buffer has a maximum length of eight, with each element in the array
consisting of 8 bits, or 1 byte. That being said, under the current implementation the maximum
distance value that can transmitted over CAN is 2047 feet.
if ((feetCopy < 2047) && (feetCopy >= 256))
bussize = (feetCopy/256) + 1;
else if (feetCopy < 256)
bussize = 1;
else
bussize = 8;
dist_msg.len = bussize;
Second, the buffer is filled element by element, starting with index 0. When the first
element is filled to its max value, that value is subtracted from the data attempted to be
transmitted and the remainder is stored in the next element. This is continuously done until the
speed/distance data is completely broken up and stored in the buffer.

127
int i = 0;
while (bussize)
if (feetCopy < 256)
dist_msg.buf[i] = (uint8_t) feetCopy;
else
dist_msg.buf[i] = 255;
feetCopy -= 255;
i++;
bussize--;
Lastly, the message is sent to the CAN bus using a pre-existing library function. Using
this program, the team was successfully able to transmit distance and speed values wirelessly
over CAN with zero known errors.
The final steps in the process of engineering a solution were to install the
speedometer/odometer system onto the cart and prepare future teams for successful operation.
The magnets and sensor are currently being held into place by heavy duty Velcro. There are four
magnets positioned 90 degrees apart from one another on the inside of the back-right tire’s wheel
well. The sensor is attached to the frame of the cart in close proximity of the magnets. The wire
leads of the sensor have been extended for convenient placement of the microcontroller unit.
Future teams should approach this system from two points of view: hardware and software. From

128
the hardware perspective, continue to ensure that the magnets, sensor and microcontroller are in
place and in working order. Improvements could be made to how the components are secured
onto the cart in order to increase durability and longevity. From the software perspective, the
system should be further integrated with CAN. The current code only transmits distance, not
speed. Additionally, the distance data is received over CAN, but no further actions are taken as a
result by other systems. In other words, the system is standalone and makes no interaction with
braking, throttle, etc. It should be known that the current code is adaptable to any change in the
physical parameters of the cart such as change in tire radius.
8.3 Ultrasonics
The team’s next priority regarding sensors was to incorporate a way to detect objects and
measure their associated distance to the cart. To begin the process of engineering a solution,
research on prior technologies was conducted. Similarly, to the odometer/speedometer, an object
detection system is typically comprised of a sensor and a computer with a specialized program.
The types of sensors used in object detection applications can be classified into three different
groups: 1) proximity sensors, 2) motion detectors, and 3) image sensors [42]. Proximity sensors
can be comprised using one of several sensor technologies including ultrasonic sensors,
capacitive, photoelectric, inductive, or magnetic. Motion detectors are based on infrared light,
ultrasound, or microwave/radar technology. Image sensors are typically digital cameras, camera
modules and other imaging devices based on CMOS technology [42]. During the research
process, the team refined the intended solution to be to detect the presence of any object in close
proximity to the cart and signal the cart to stop, regardless of the object’s position. With this goal

129
in mind, image sensors were ruled out due to their number of unnecessary features and
associated cost. Consequently, proximity sensor and motion detector technologies were chosen
to be the potential product pool for our intended solution.
The next step in the process of engineering a solution was to determine component
requirements and choose the appropriate corresponding product. For consistency purposes, the
Teensy 3.5 microcontroller unit was chosen to satisfy the computer component of this system.
When choosing an appropriate proximity sensor the following factors were taken into
consideration: accuracy, resolution, range, control interface, environmental condition, calibration
and cost [42]. A potential option from the motion detector group of object detection sensors was
an infrared sensor. An infrared sensor measures the infrared light that is transmitted in the
environment to find objects via an infrared LED. Infrared sensors are inexpensive, can operate in
real-time, use non-visible light for detection and can detect infrared light over a large area. For
these reasons, this type of sensor is very popular in navigation for object avoidance and distance
measuring applications. However, infrared sensors are very sensitive to infrared lights and
sunlight [42]. For this reason, infrared sensors are best used in applications designed for low
light areas. A potential option from the proximity sensors group was an ultrasonic sensor.
Ultrasonic sensors are designed to generate high frequency sound waves and receive the echo
reflected by the target, without the need for direct contact. One advantage of ultrasonic sensors is
high accuracy, including the detection of small objects. The response of these sensors is not
dependent on the colors, transparency of objects, optical reflection properties, or by the surface
texture of the object [42]. They are also functional in critical conditions such as dirt and dust.

130
Ultrasonic sensors are also suitable for use with a microprocessor. The output value of these
sensors is linear with the distance between the sensor and the target, easing the task of data
processing. For these reasons, ultrasonic sensors are used in a wide range of applications and are
very useful when it is not important for the detection of colors, surface texture, or transparency
[42]. Some disadvantages of ultrasonic sensors are that the response of the sensor can be
sensitive to changes in the environment (i.e. temperature, humidity, pressure) and loud noises.
Additionally, these sensors typically have a response time with a fraction less than some similar
sensors. Ultimately, ultrasonic sensor technology was chosen for the task at hand based on their
capability of performing at a high level for each of our considered relevant factors. Shortly after
this decision was made, it was recalled that a previous team had purchased two ultrasonic sensor
modules from LV-MaxSonar as seen in Figure 73. These LV-MaxSonar-EZ3 modules are
narrow beam ultrasonic sensors with good side object rejection, low power consumption, easy to
use interface, large object detection and can be powered by many different types of power
sources [43]. They can detect objects from 0 to 254 inches and provide sonar range from 6 inches
out to 254 inches with 1-inch resolution. Objects from 0 inches to 6 inches typically range as 6
inches [43].
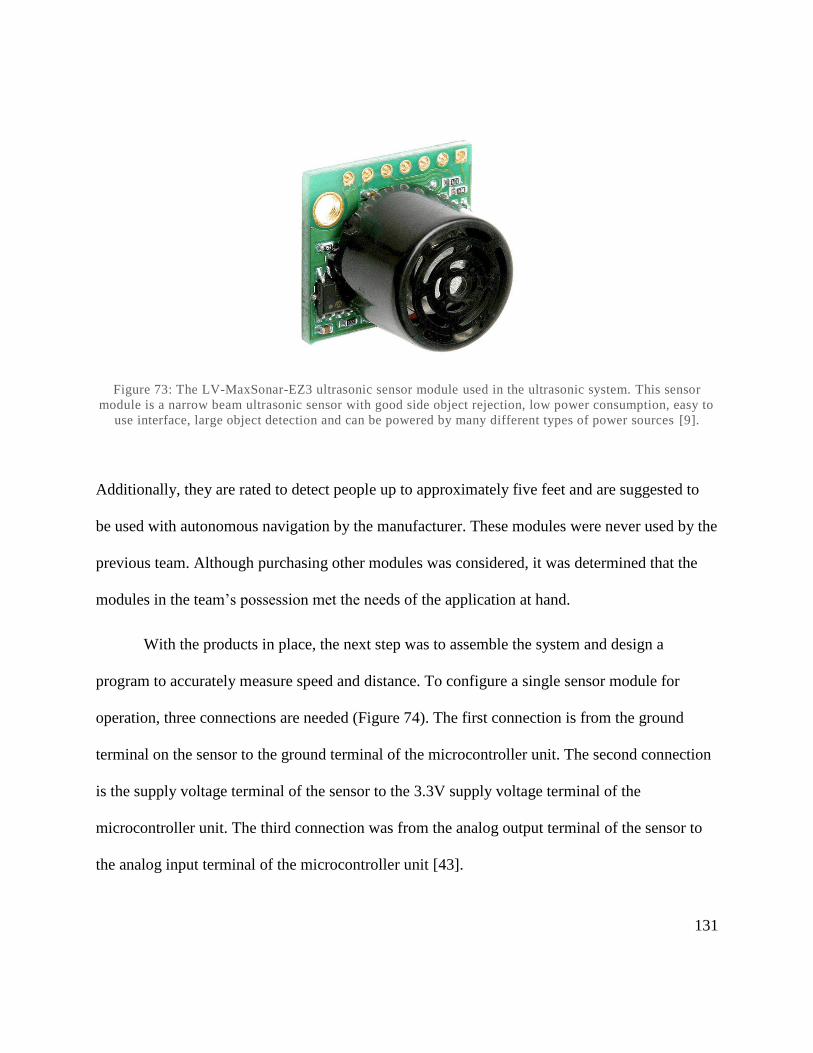
131
Figure 73: The LV-MaxSonar-EZ3 ultrasonic sensor module used in the ultrasonic system. This sensor
module is a narrow beam ultrasonic sensor with good side object rejection, low power consumption, easy to
use interface, large object detection and can be powered by many different types of power sources [9].
Additionally, they are rated to detect people up to approximately five feet and are suggested to
be used with autonomous navigation by the manufacturer. These modules were never used by the
previous team. Although purchasing other modules was considered, it was determined that the
modules in the team’s possession met the needs of the application at hand.
With the products in place, the next step was to assemble the system and design a
program to accurately measure speed and distance. To configure a single sensor module for
operation, three connections are needed (Figure 74). The first connection is from the ground
terminal on the sensor to the ground terminal of the microcontroller unit. The second connection
is the supply voltage terminal of the sensor to the 3.3V supply voltage terminal of the
microcontroller unit. The third connection was from the analog output terminal of the sensor to
the analog input terminal of the microcontroller unit [43].

132
Figure 74: The manufacturer’s suggested wiring guide for independent sensor operation. For this project the
supply voltage supplied by the Teensy 3.5 is 3.3V and within the suggested range. An ADC, or analog-to-
digital converter, is equipped on the Teensy 3.5 microcontroller unit for each of the analog pins to access
[9].
For the needs of our application, two ultrasonic sensor modules were used in a single system.
One is to be positioned on the front left or back left of the cart and the other is to be positioned in
the front right or back right of the cart. This type of setup is often prone to interference (cross-
talk) from other sensors when connected individually [44].
Figure 75: A visualization of an ultrasonic sensor signal with interference. As seen in the visualization,
when two sensors are operating at the same time within close proximity to one another, interference may
occur that is seen as voltage noise causing disparities in the data [10].

133
To avoid interference, a strategy known as continuous loop chaining was implemented. In this
loop, the first sensor will range, then trigger the next sensor to range and so on for all the sensors
in the array as shown in Figure 76 [44]. Once the last sensor has ranged, it will trigger the first
sensor in the array to range again and will continue this loop indefinitely.
Figure 76: The manufacturer’s suggested wiring of a continuous loop chain of ultrasonic sensors. In this
configuration, once the first sensor is triggered to operate by the microcontroller unit, the sensor will range
and trigger the next sensor in the loop to operate. This cycle will continue through the loop until power is
disconnected from the sytem [9].
To achieve this the ground terminals, supply voltage terminals and analog output terminals of
each sensor are connected in the same fashion as a single sensor would be. In addition, the BW,
RX and TX terminals of the sensors are used [44]. The BW terminal for each sensor is connected
to the 3.3V supply voltage terminal of the microcontroller unit. When the BW pin is held high
the TX output sends a pulse, suitable for low noise chaining. The RX pin of the first sensor in the
chain is connected to both a digital output terminal of the microcontroller unit and the TX pin of
the last sensor in the chain. Additionally, a 1 k resistor is placed in series with the path between

134
the RX pin of the first sensor and the TX pin of the last sensor. The RX pin of the first sensor
will initially be triggered by the microcontroller unit to begin the continuous loop and from then
on out will be triggered by the TX pin of the last sensor in the loop. The TX pin of every other
sensor is similarly connected to the RX pin of the next sensor in the loop in order to continue the
sequential triggering process.
Figure 77: The circuit diagram of the ultrasonic system designed to be installed on the WPI Goat Cart . This
system is designed to incorporate two ultrasonic sensors in a continuous loop chain.
In theory, after each complete cycle of the sensor array, multiple readings will be available for
analysis on the processing side of the system. The first program was designed around utilizing
these readings to make an informed decision on whether the cart should stop or not.

135
After being assembled, a series of program versions were designed, tested, troubleshot
and improved until the program met all accuracy requirements and suffered zero errors. The final
result is a program that will report the distance of an object and a corresponding warning to the
serial monitor when an object is within 20 inches of either sensor. This operation is dependent on
the speed of the cart and should only be used when the cart is operating at speeds used for
applications such as parking (0 – 5 mph). In order to achieve this level of accuracy, two
ultrasonic sensor modules were used in a continuously looped chain controlled by the specialized
program. The system status and corresponding program variable status can be easily tracked
using (Figure 78).
The final program is designed to first run the setup() function. The setup() function is
used to initialize variables, print status messages to the serial monitor and configure the
microcontroller pins and serial data transmission. A helper function, called sonarInit(int
controlPin), is used to handle all the timing restrictions of the sensors during power up and
configure the microcontroller pin associated with initially triggering the sensors for ranging. All
the values used for timing restrictions and delays are based off of values reported by the
manufacturer in the datasheet for the sensor [43]. The delays used are essential for operation of
the system.

136
Figure 78: A flow chart documenting the changes in the status of the ultrasonic system and the
corresponding status of the changes in the variables of the associated specialized program. The code that
this flow chart represents can be found in the appendices of this paper.

137
void sonarInit(int controlPin)
// wait for boot
delay(250);
// trigger ranging
digitalWrite(controlPin, HIGH);
delayMicroseconds(25);
digitalWrite(controlPin, LOW);
// Make high-impedance input to signal round-robin
ranging.
pinMode(controlPin, INPUT);
// wait for calibration+initial ranging times.
delay(49+49+100);
// sonars should alternate automatically now
After configuration is complete, the program enters the continuous loop() function. In the loop()
function, the range data is gathered from each sensor. This is accomplished using the helper
function sonarRange(int sonarPin). This helper function makes use of the analogRead() function
of the Arduino library which reads the value from the specified analog pin [45]. Using
analogRead(), the input of voltages between 0 and 3.3V is mapped into integer values between 0
and 1023. This yields a resolution of 3.3V per 1024 units, or 0.003V per unit. The analog output
of each sensor is (3.3V/512) per inch [43]. Using all of this information, the conversation rate for

138
the analogRead() function output value to the desired value of inches is found to be 0.5. The
helper function in this case does just that; returns the desired value of distance in inches.
int sonarRange(int sonarPin)
// At 3.3V, inches =
((analogRead()/1024)*Vcc)/(Vcc/512) = 0.5
return analogRead(sonarPin) * 0.5;
In each iteration of the loop() function, a set of forty values from each sensor are gathered over a
period of approximately two seconds and averaged out. These values represent the average of the
distance of the closest object to the sensor over a period of two seconds. The two second period
is a result of the number of iterations of the loop (controlled by the variable avgRange) and the
time it takes, with delays, for the loop to run through a single interation. The benefit of averaging
the recorded values over a period of time is to eliminate any anomalies to the system.
for(int i = 0; i < avgRange; i++)
anVoltOne = sonarRange(anPinOne);
sumOne += anVoltOne;
anVoltTwo = sonarRange(anPinTwo);
sumTwo += anVoltTwo;
delay(50);
avgInchOne = sumOne / avgRange;
avgInchTwo = sumTwo / avgRange;

139
If either of these averages is less than twenty inches, a warning with the name of the
corresponding sensor and the average distance is printed to the serial monitor.
if((avgInchOne < 20) || (avgInchTwo < 20))
if(avgInchOne < 20)
Serial.print("Object in Zone 1 at distance: ");
Serial.print(avgInchOne);
Serial.println();
Serial.println("WATCH OUT!");
if(avgInchOne < 20)
Serial.print("Object in Zone 2 at distance: ");
Serial.print(avgInchTwo);
Serial.println();
Serial.println("WATCH OUT!");
Using this program, the team was successfully able to detect the presence of any object in close
proximity to the cart and issue a warning when the object became within a user defined
minimum range of twenty inches.
The final steps in the process of engineering a solution were to install the ultrasonic
sensor system onto the cart and prepare future teams for successful operation. As of the end of C-
Term 2018, the ultrasonic sensors have not been temporarily integrated in a way that is ideal for
future testing (Figure 79).

140
Figure 79. A single ultrasonic sensor wired to a Teensy 3.5 on a portable proto-board. This configuration
was implemented because it is best suited for testing. When the cart is in a state where it can be used for
testing outside, the attachable and detachable proto-board can be moved to different points on the cart. This
will help to determine where on the cart that ultrasonic sensors are most necessary.
Future teams should approach this system from two points of view: hardware and software. From
the hardware perspective, consider a more permanent solution to mounting the sensors onto the
cart. It was envisioned by this year’s team that the sensors could be fitted into the plastic body of
the cart. Permanent locations for the cart should be carefully considered for optimal use. To
ensure the functionality of ultrasonic sensors, testing should be conducted outdoors when the cart
in a driving state to determine where on the cart the sensors will be most useful to the overall
system. However, please have it be noted, that if a future team decides to add more than two

141
ultrasonic sensors to the same array that timing restrictions must be taken into consideration.
Adding another sensor to array means that more time will be necessary for the loop to run
through in its entirety. Therefore, data is attained at a slower rate. Additionally, future teams
should consider making improvements to how the components are secured onto the cart in order
to increase durability and longevity. From the software perspective, this data should be able to
transmit over CAN and correspondingly induce actions with the braking and throttle systems. At
this moment in time, the program for this system simply prints a warning message to the serial
monitor. Ideally, a similar warning message would be sent over CAN to the server. The server
could then as a result generate a message to be sent over CAN for the braking system to apply a
full stop when an object is detected within close proximity.
8.4 Sensors Summary
The 2017-2018 project team designed, tested and established plans for integration of two
essential low-level sensor systems for the WPI Goat Cart. The first of the sensor systems is the
speedometer/odometer. This sensor system can measure speeds up to approximately 30 mph,
measure distance in intervals of approximately 13 inches, and transmit values of speed and
distance to the cart’s main server using CAN communication. The system hardware is
completely integrated to the cart but operates only as a standalone feature. The second of the
sensor systems is ultrasonics. This sensor system can report the distance of an object and a
corresponding warning to the serial monitor when an object is within 20 inches of either sensor.
The system hardware has yet to be integrated with the cart. Further software development is

142
required for both sensor systems in order to completely integrate them with the other components
of the cart such as CAN, throttle, braking, or others as seen necessary. Future teams should
continue to improve and adapt the software aspects of these systems as the other components of
the cart evolve (i.e. as CAN improves and becomes more reliable). This year’s team believes that
the next step for sensors in this project would be to add imaging sensors and computer vision.
These future systems are essential for the cart to be fully autonomous.

143
Chapter 9. Conclusion
Considering the state that the 2017-18 MQP team received the Goat Cart, they were able
to improve upon it substantially. Although only one subsystem was initially in working order,
the team was able to add four additional subsystems. Every part of the cart was worked on and
improved. The power system almost exploded this year because the system did not use float
chargers, but three batteries were replaced, and to prevent such an event from repeating itself,
float chargers were installed for the batteries on the cart. The team completely redid the steering
system, from getting a new rack and pinion, to redesigning the software so it could be controlled
by the CAN bus. The braking system was moved in line with the physical break so it had enough
torque to move the pedal. The throttle’s motor controller was replaced. Its software was
combined with the braking’s software because the state of one system directly affects the state of
the other one. Instead of working on vision, the team decided that adding sensors to collect data
about the cart was a good base for future years to build off. All the data from each subsystem
goes through the CAN bus, which gets data either from the subsystem, or sends commands to
actuators. The team designed the CAN hardware and the message structure to be optimal for the
Goat Cart. Additionally, sensors were added so that the cart has knowledge of itself and its
surroundings. This year, the team added both odometery in order to track how far the cart has
traveled, and ultrasonics that can identify if there is something on the ground over six feet away.
Overall, the Goat Cart had to be completely transformed this year, so that future MQP teams
have a solid base in which to build an autonomous cart.

144
9.1 Lessons Learned
What made this year’s iteration of the Goat Cart successful was a strong vision of what
needed to be done. Since the cart was in poor condition, it was easy decide this year’s goal: to
get the cart to go around the track. In other words, the goal was to build a roadworthy cart. Based
on this goal, the team was able to figure out what needed to be improved upon or added to the
Goat Cart.
In order to have successful results in such a big group, it was necessary to assign
someone as the team leader. This person would keep track of everyone’s work, and ensure that
everyone was getting concrete results. Additionally, this team leader organized and kept track of
the budget, planned meetings, and facilitated other logistical necessities. This year’s team leader,
Jade, was respected and well liked enough that everyone would listen to her and generally do
what she said.
With each team member was responsible for a specific part of the project, communication
was vital. During meetings, everyone gave a status update of what they were working on, and if
there were problems, others either gave advice or arranged to help with the work. Using Slack,
an online messaging system, allowed everyone to stay in contact outside of meetings. This
compensated for only having two full team meetings a week and one additional meeting with
Professor Wyglinski.
When working on the cart, the team discovered that, while ideas and plans came easily to
the table, putting them into action was both the most challenging and the most important part.

145
However, understanding the initial state of the cart, and analyzing the best approaches to achieve
the goal were still necessary. For this reason, during A term, the team decided to diagnose the
state of the Goat Cart, do research, and plan the best approach to reach the goals and objectives
proposed. The team also learned how to work under pressure and get the results demanded by
their advisor on time, working to meet the Spark Party presentation deadline. They were able to
get steering, braking, throttle, power and odometery in working condition for the second week of
B term 2017. It was found that some parts, like braking, required less research, and probably
could have been started towards the end of A term. The steering either needed much more
research or advice from a Robotics Professor. The programing needed for the subsystems for
Spark Party 2017 was not thoroughly debugged, and the team just had to pray for the
best. Future teams should attempt to find a balance between research and intuition.
9.2 Future Work
9.2.1 CAN Future Improvements:
The CAN interface board ware went through two design stages and intense debugging to
ensure a stable and reliable design. Hopefully, no problems will be found in the future with the
CAN interface board. Nonetheless, it is expected that additions of CAN nodes with new sensors
will occur in a future and it will require building more boards, currently the team built 10 boards
and is using only four of them. When new boards do need to be made, the diagrams of the board
design can be found in the GitHub documentation.

146
On the other hand, the software development of the CAN network in its infancy. The
team created the basic CAN structure which will serve as the skeleton of the whole
communication system of the cart. When more messages are added to the system, the upcoming
teams will need to begin worrying about timing and prioritization, reliability and error checking,
among other complex features.
9.2.2 Steering System Proposed Work
Do not touch the steering system again! Unless it breaks. The one exception to that is
that a future team may desire to increase the steering gear ratio to facilitate more precise steering
and reduce the likelihood of speed related damage. If this process is undertaken, a forty to one
VersaPlanetary Gearbox should be purchased from VEXpro. The whole gearbox doesn’t need to
be ordered, only the new gear kit and a 0-2 stage screw kit need to be purchased. The
replacement gearbox will be a dual stage gearbox as opposed to the single stage gearbox that is
currently being used. This will occupy more space between the CIM motor and the steering rack,
neither of which should be relocated! The solution to create room and accommodate a second
gearbox stage is to cut the hexagonal output shaft of the gearbox shorter by the length of the
additional gearbox stage. Below in Figure 77 is a photo highlighting the shaft that should be cut
to accommodate the additional gearbox stage.

147
Figure 80: Shaft that Should be Cut to Accommodate a Two Stage Gearbox
There should not be any further modifications made to the steering system, however the
suspension system of the cart is likely to need work in the near future. The bushings on the front
and rear suspension as well as the shock absorbers are severely worn and past the end of their
serviceable life. These parts should all be readily available from Buggies Unlimited.

148
The current state of the steering software is a very good start. It has the basic
functionality that is needed along with some more complex functions that are needed for
autonomous driving such as calibration, receiving commands from CAN, and turning to the
specific location. From this point, much can be done to improve the software.
The most important thing that the current software is missing is accuracy. For turning to
specific degrees, the cart turns to the location but there is some allowed tolerance. Eventually the
tolerances will add up and cause possible issues if there is a series of commands. The solution to
this is to add in feedback. By adding a feedback loop the steering can notice how far off the goal
it is and then continually correct itself. This could be done using a Proportional- Integral-
Derivative (PID) control loop. PID loops are wonderful because they are a mathematically way
of creating a feedback loop. An issue with using a PID loop is that it requires time to go to a
position and then adjust.
A possible problem is that was not addressed is the steering only receives an input from
the CAN bus, it does not send messages back saying that it has completed turning. It is likely that
this is not an issue, because in most cars it is preferable to turn the wheels while driving because
it reduces friction. However, it still would be good for the Goat Cart to keep track of what state
the different subsystems are in.
9.2.3 Braking Future Plans
The team hopes that the braking mechanism that the team implemented is one that can
last and be part of the base for the autonomous golf cart project moving forward and as such,

149
there are only a few plans for the brakes of the golf cart. One possible future improvement is
that the team reached out to the brake motor manufacturer and they have agreed to send their
newest version of the motor once they finish developing it. The new version of the motor has
built in encoding on the motor shaft. This functionality would allow for different levels of
breaking, such as slowing the golf cart instead of bringing it to a complete halt. In addition, this
functionality would add safety into the system as it would no longer have to rely solely on the
endstops for feedback on the position of the brakes. Secondly, the next team should trim the
metal sheets that help mount the motor to prevent heavy loads from bending the plates and
causing them to interact with the wheels. The section on the sheet in need of removal has been
clearly marked. Lastly, the wiring of the brake system needs to be properly cable managed.
Currently, there are wires going everywhere. These should be proper labeled and contained
under or in the golf cart so that they do not get damaged or accidentally cut or unplugged.
9.2.4 Throttle Future Improvements
The main point of improvement the throttle system still needs is the control bridge
between the Teensy and the motor controller currently being filled by the digital potentiometer.
The programmer kit will allow the throttle input to be changed to a new range of acceptable
input types as seen in Table 10. Unfortunately, its delay leaves this decision up to the next years
MQP team.

150
Table 11: List of throttle control schemes possible upon arrival of programmer
If the motor controller and potentiometer are left in their current configuration, the cart
will be unable to to travel at higher speeds without considerable risk of burning out the
potentiometer again. If this deemed an acceptable tradeoff, the motor controller would need to be
set to Type 1 from Type 0. This is needed to put the active slow speeds in the 5kᘯ range instead
of the 0ᘯ range and allow safe operation of the digital potentiometer. Most of the other
potentiometer input Types offer no other major advantage or disadvantage over Type 1 and need
not be considered. However, several other options available for the next team to consider. Given
that analog potentiometers can handle significantly more current than their digital counterparts,
an analog potentiometer input could be used along with a servo as a system to allow the speed to
be set to specific levels. Alternatively, Type 2 could be used by using an analog output pin from
the Teensy. The Teensy’s maximum voltage limit of 3.3 V would still naturally limit the top
speed but would eliminate the intermediary of the potentiometer. This could also be controlled
by a digital output pin using pulse width modulation.

151
Works Cited
[1] World Health Organization, "World Health Organization," January 2018. [Online]. Available:
http://www.who.int/mediacentre/factsheets/fs358/en/. [Accessed 20 February 2018].
[2] D. J. Fagnant and K. Kockelman, "Preparing a nation for autonomous vehicles: opportunities, barriers and
policy recommendations," Elsevier Ltd, vol. A, no. 77, pp. 167-181, 2015.
[3] B. D. Lawrence, "A vision of our transport future," Macmillan Publishers Limited, vol. 497, pp. 182-182, 2013.
[4] W. Zhang, S. Guhathakurta, J. Fang and G. Zhang, "Exploring the impact of shared autonomous vehicles on
urban parking demand: An agent-based simulation approach," Sustainable Cities and Society, vol. 19, pp. 34-
35, 2015.
[5] P. Sahay, "Robocart: Autonomous Ground Vehicle - Electromechanical Foundations Design," Worcester
Polytechnic Institute, Worcester.
[6] R. Crimmins and R. Wang, "Autonomous Ground Vehicle Prototype via Steering-, Throttle-, and Brake- by Wire
Modules," Worcester Polytechnic Institute, Worcester, 2016.
[7] K. Cederberg, R. Dall’Orso, C. Figuereo-Supraner and P. Long, "The Autonomous Golf Cart," Worcester
Polytechnic Institute,, Worcester, 2017.
[8] K. Heineke , P. Kampshoff, A. Mkrtchyan and E. Shao, "Self-driving car technology: When will the robots hit the
road?," McKinsey&Company, May 2017. [Online]. Available:
https://www.mckinsey.com/industries/automotive-and-assembly/our-insights/self-driving-car-technology-
when-will-the-robots-hit-the-road. [Accessed 20 February 2018].
[9] R. I. Davis, A. Burns, R. J. Bril and J. J. Lukkien, "Controller Area Network (CAN) schedulability analysis: Refuted,
revisited and revised," Real-Time Systems, vol. 35, no. 3, pp. 239-272, 2007.
[10
]
H. H. A. J. W. K. W lindell, "Analysing Real-Time Communications: Controller Area Network (CAN)," in Real-
Time Systems Symposium, San Juan , 1994.
[11
]
R. Boys, "CAN Primer: Creating Your Own Network," ARM Ltd, 2012.
[12
]
S. Corrigan, "Introduction to the Controller Area Network (CAN)," Texas Instruments Incorporated, 2016.
[13
]
"Teensy Technical Specifications," PJRC, [Online]. Available: https://www.pjrc.com/teensy/techspecs.html.
[Accessed 2018].

152
[14
]
"LM317," October 2015. [Online]. Available:
http://www.st.com/content/ccc/resource/technical/document/datasheet/8e/b2/ea/56/ad/8c/43/d8/CD0000
0549.pdf/files/CD00000549.pdf/jcr:content/translations/en.CD00000549.pdf. [Accessed 2018].
[15
]
"MCP2551," Microchip Technologies Inc, 2016. [Online]. Available:
http://ww1.microchip.com/downloads/en/DeviceDoc/20001667G.pdf. [Accessed 2018].
[16
]
"SN65HVD23x 3.3-V CAN Bus Transceivers," July 2015. [Online]. Available:
http://www.ti.com/lit/ds/symlink/sn65hvd230.pdf. [Accessed 2018].
[17
]
C. Kidder, "FlexCAN library," July 2017. [Online]. Available: https://github.com/collin80/FlexCAN_Library.
[Accessed 2018].
[18
]
Teachop, "FlexCAN library," March 2017. [Online]. Available: https://github.com/teachop/FlexCAN_Library.
[Accessed 2018].
[19
]
"Club Car 1995-1996 Maintenance/ Service DS Golf Cars Gasoline/ Electric," 1995. [Online]. Available:
http://gaminde.net/clubcar/man/1995_96_ds_gas_elec_service_manual.pdf. [Accessed 2017].
[20
]
"Steering Column - Club Car Parts & Accessories," Golf Cart Parts Direct, 2018. [Online]. Available:
https://golfcartpartsdirect.com/Category/134.
[21
]
"Front Suspension -Lower -Club Car Parts & Accessories," Golf Cart Parts Direct, 2018. [Online]. Available:
https://golfcartpartsdirect.com/Category/245. [Accessed 2018].
[22
]
"Steering Gear Assembly - Club Car Parts & Accessories," Golf Cart Parts Direct, 2018. [Online]. Available:
https://golfcartpartsdirect.com/Category/135. [Accessed 2018].
[23
]
"Standard Steel Heim Joint Rod Ends, 5/8-18 RH Male," Speedway Motors, 2018. [Online]. Available:
https://www.speedwaymotors.com/Standard-Steel-Heim-Joint-Rod-Ends-5-8-18-RH-Male,33807.html. .
[Accessed 2018].
[24
]
"VersaPlanetary Gearbox," Vex Robotics, 2018. [Online]. Available:
https://www.vexrobotics.com/vexpro/motion/gearboxes/versaplanetary.html. [Accessed 2018].
[25
]
"Nickson 2-1/4" Heavy-Duty Muffler," Advanced Auto Parts, 2018. [Online]. Available:
https://shop.advanceautoparts.com/p/nickson-2-1-4-heavy-duty-muffler-clamp-517214/5600510-
P?navigationPath=L1*14932%7CL2*14983. [Accessed 2018].
[26
]
"Sabertooth 2x60 User's Guide," September 2011. [Online]. Available:
https://www.dimensionengineering.com/datasheets/Sabertooth2x60.pdf.. [Accessed 2018].
[27
]
"Magnetic Encoder Fundamentals," National Instruments , 6 September 2006. [Online]. Available:
http://www.ni.com/white-paper/4500/en/.. [Accessed 2018].
[28
]
"Encoder Measurments: How-To Guide," National Instruments, 03 March 2017. [Online]. Available:
http://www.ni.com/tutorial/7109/en/. [Accessed 2018].

153
[29
]
"Magnetic encoder Kit User's Guide," Cross the Road Electronics, January 2016. [Online]. Available:
https://content.vexrobotics.com/vexpro/pdf/Magnetic-Encoder-User's-Guide-01282016.pdf.. [Accessed 2017].
[30
]
"Sabertooth DIP Switch Configuration Wizard," Dimension Engineering, 2018. [Online]. Available:
https://www.dimensionengineering.com/datasheets/SabertoothDIPWizard/start.htm. . [Accessed 2018].
[31
]
Curtis, "Manual: Models 1204M/05M/09M/21M Electronic Motor Controllers," 2012. [Online]. Available:
http://www.nocoev.com/product/curtis/manual/1204m1205m_n.pdf. [Accessed 2017].
[32
]
"StrongBox Batteries," John Deere, [Online]. Available:
http://www.deere.com/en_US/docs/html/brochures/publication.html?id=56e5a02d#4.. [Accessed 2018].
[33
]
"4-Bank 40 Amp On-Board Battery Charger," NOCO, 2018. [Online]. Available: https://no.co/gen4. [Accessed
2018].
[34
]
"Automatic 1.5-Amp Battery Charger/Maintainer (TY26328)," John Deere, January 2018. [Online]. Available:
https://jdparts.deere.com/partsmkt/document/english/pmac/48052_fb_BatteryChargersInverterAccessories.
htm#_Automatic_1.5-Amp_Battery. [Accessed 2018].
[35
]
R. Kacha, "Different Types of Sensors," Electronics Hub, 8 November 2017. [Online]. Available:
https://www.electronicshub.org/different-types-sensors/. [Accessed March 2018].
[36
]
"BBC GCSE Biteszie: Computer Control," BBC, January 2018. [Online]. Available:
http://www.bbc.co.uk/schools/gcsebitesize/ict/measurecontrol/0computercontrolrev1.shtml. [Accessed
March 2018].
[37
]
K. Nice, "How Odometers Work," How Stuff Works, 17 January 2001. [Online]. Available:
https://auto.howstuffworks.com/car-driving-safety/safety-regulatory-devices/odometer2.htm. [Accessed
March 2018].
[38
]
C. Woodford, "Speedometers," Explain That Stuff, 9 January 2018. [Online]. Available:
http://www.explainthatstuff.com/how-speedometer-works.html. [Accessed March 2018].
[39
]
"Switch Basics," Sparkfun, January 2018. [Online]. Available: https://learn.sparkfun.com/tutorials/switch-
basics. [Accessed March 2018].
[40
]
Littelfuse, "Press-Fit Firecracker Reed Sensor," 2 November 2015. [Online]. Available:
https://media.digikey.com/pdf/Data%20Sheets/Littelfuse%20PDFs/59040_57040_Series.pdf. [Accessed March
2018].
[41
]
"Reed Switch Hookup Guide," Sparkfun, 2017. [Online]. Available: https://learn.sparkfun.com/tutorials/reed-
switch-hookup-guide. [Accessed March 2018].
[42
]
J. Hughes, "Types of Sensors for Target Detection and Trackinh," 20 November 2013. [Online]. Available:
https://www.intorobotics.com/types-sensors-target-detection-tracking/. [Accessed March 2018].

154
[43
]
MaxBotix, "LV-MaxSonar-EZ Series," 2015. [Online]. Available: https://www.maxbotix.com/documents/LV-
MaxSonar-EZ_Datasheet.pdf. [Accessed March 2018].
[44
]
MaxBotix, "Using Multiple Ultrasonic Sensors," 7 November 2012. [Online]. Available:
https://www.maxbotix.com/tutorials1/031-using-multiple-ultrasonic-sensors.htm. [Accessed March 2018].
[45
]
Arduino, "Language Reference," Arduino, 2018. [Online]. Available: https://www.arduino.cc/reference/en/.
[Accessed March 2018].
[46
]
"Curtis," 2012. [Online]. Available: http://www.nocoev.com/product/curtis/manual/1204m1205m_n.pdf.
[Accessed 2017].