Barriers and Thresholds in Learning Media Studies: Part 3
30
Barriers and Thresholds in Learning Media Studies: Part 3 Rick Instrell Originally published in the Media Education Journal published by AMES (Association for Media Education in Scotland): Instrell, R. (2015) ‘Barriers and Thresholds in Learning Media Studies: Part 3’. Media Education Journal, 57, Summer 2015. Note that the visualizations in this article have been compiled into a separate booklet which should be read alongside the article. This can be downloaded from the AMES website . A Microsoft PowerPoint of the figures is also at the AMES website available so that those who wish to edit the visualizations can do so with the minimum of effort. “We need ways of viewing a vigorous but fragmented field of study, if not as a unity at least as a whole.” Richard Johnson, ‘What is Cultural Studies Anyway?’ Introduction In the previous article (Instrell, 2014) I argued that we can overcome some barriers to learning by identifying and explicitly teaching threshold concepts (Mayer and Land, 2008). In my own teaching I have found that presenting objects, concepts and relationships in the form of visualizations rather than linear text is a powerful learning tool. Careful selection of a graphic figure for a topic can lead learners to form a mental picture which mirrors the way that the subject expert ‘sees’ it. The visualizations in this article are simplified and provisional pictures of a very messy reality. Some are ‘structural’ and map the patterns of a phenomenon whereas others are ‘functional’ and try to describe systems through the interaction and influence of their parts (McQuail and Windahl, 1993: 2-3). They are intended to: 1
-
Upload
independent -
Category
Documents
-
view
0 -
download
0
Transcript of Barriers and Thresholds in Learning Media Studies: Part 3

Barriers and Thresholds in Learning MediaStudies: Part 3Rick InstrellOriginally published in the Media Education Journal published by AMES (Association for Media Education in Scotland): Instrell, R. (2015) ‘Barriers and Thresholds in Learning Media Studies: Part 3’. Media Education Journal, 57, Summer 2015.
Note that the visualizations in this article have been compiled into a separate booklet which should be read alongside the article. This can be downloaded from the AMES website.
A Microsoft PowerPoint of the figures is also at the AMES website available so that those who wish to edit the visualizations can do so with the minimum of effort.
“We need ways of viewing a vigorous but fragmented field of study, if not as a unity at least as a whole.”
Richard Johnson, ‘What is Cultural Studies Anyway?’
Introduction
In the previous article (Instrell, 2014) I argued that we can overcome some barriers to learning by identifying and explicitly teaching threshold concepts (Mayer and Land, 2008).In my own teaching I have found that presenting objects, concepts and relationships in the form of visualizations rather than linear text is a powerful learning tool. Careful selection of a graphic figure for a topic can lead learners toform a mental picture which mirrors the way that the subject expert ‘sees’ it.
The visualizations in this article are simplified and provisional pictures of a very messy reality. Some are ‘structural’ and map the patterns of a phenomenon whereas others are ‘functional’ and try to describe systems through the interaction and influence of their parts (McQuail and Windahl, 1993: 2-3).
They are intended to:
1

organize ideas in what can seem a very disordered subject provoke thought and critical reflection guide the learner to key points act as guide to the forming of explanations of media
phenomena inspire teachers and learners to create their own
visualizations.
Before one starts creating a visualization it is best to have an idea of the range of visual maps in common use and where they are most applicable. I will focus on maps which might aidteachers delivering the Scottish Qualifications Authority Higher Media qualification (SQA, 2014) and which might also assist learners to cross conceptual thresholds.
Visualizations can be used in a number of ways. One can start with a simple communication model (sender-text-receiver) applyit to everyday verbal communications and then start to developit to include the social context and receiver feedback.
One can present students with an abstract visualization based on academic research and then encourage student to think of media texts/contexts/use which either fit/don’t fit the model.A model can be developed/presented and then students can be asked to write an explanation of the model, exemplify it and suggest its weaknesses.
One can start a lesson with an exercise such as ‘draw the Internet’ (!) and from these impressions start to generate commonalities between representations as well as absences (students usually omit any reference to the economic base of the Internet). This might serve as a basis for a multilevel model of the Internet and its affordances.
One visualization that generally goes down well is when there has been a complex classroom discussion which seems to be going everywhere and nowhere and then the teacher magically comes up with a diagram or metaphor which clarifies everything. Often this generates a collective Aha! moment.
2

Maps are also invaluable in the planning of well-structured examination answers which integrate the key aspects of media literacy.
Concept maps
In general the standard of visualizations in academic text books is poor. The most common flaw is unlabelled links which may leave the reader to speculate about the precise nature of the link or to dig deeper into the article to find out what itmeans. Often it is unlabelled due to the writer hedging and not wishing to specify a complex multifactorial relationship.
One type of visualization is a concept map which represents knowledge in the form of propositions. A proposition is drawn with 2 nodes linked by a labelled and arrowed line. Figure 1 unpacks the concept of a concept map using propositions such as ‘a node is a part of a concept map’. Note that the arrow indicates how to read the proposition. Common links are APO (‘is a part of’), AKO (‘is a kind of’), AFO (‘is a feature of’) and AEO (‘is an example of’). Note that figure 1 gives examples of concept map structures as a bulleted list rather than six AEO links. This is to avoid a limitation of concept maps – their tendency to spread out and so not fit on an A4 page. Note also how bold text and thickened borders help the intelligibility of the map.
In a concept map if there is no label on a link then it often indicates a temporal and/or causal sequence (‘leads to’). So figure 1 claims that concept maps leads to meaningful teachingand learning, metacognition and lifelong study skills. Figure 2 uses an unlabelled link to illustrate the concept of media agenda-setting.
When creating a concept map a good rule of thumb is to constrain it by only using AKO, APO, AFO, AEO and unlabelled ‘leads to’ links. Such parsimony tends to produce concept mapswhich are easier to assimilate than those that employ an ‘anything goes’ approach to link types.
Note that maps are abstractions and only make sense when they are applied to examples. This process also leads to critical
3
reflection on the map and the reader may then be able to suggest errors, omissions or alternative representations.
Sometimes a two-headed arrow is used to indicate a two-way relationship. For example in sociology, and hence in media studies, many of the debates revolve around the structure-agency couplet (see figure 3). Structure refers to the norms, rules, organizations, influential bodies and social practices that guide and constrain action. Agency is the capacity for action by agents, be they individuals or groups or organizations or institutions. The two cannot be separated: agents are involved in structures and structures need agents. So structures both enable and constrain and it is through the interplay between structure and agency that power relationships are played out. In media studies this debate canbe seen in various guises:
What degree of freedom do journalists have in creating their reports?
Is it possible for readers to escape the ideological influence of media texts?
Is it possible for media creators to escape the expression of dominant ideological discourses?
In class teaching, unlabelled links are acceptable at the beginning of an investigation where the class is gathering ideas and arranging them on a spider diagram with outer nodes radiating round a central node. But by the end of an investigation it should usually be possible to order the nodesin a structured form with labelled links.
Visualization structures
Figure 1 shows a list of common concept map structures (spider, tree, chain, cycle, matrix and network) and I will give example of these and other structures.
Table 1 shows a list of relationships which one might find between ideas, objects, events and properties. The list has been ordered vertically to move from unstructured relationships to structured relationships where the link can be specified and finally to complex relationships where the
4

links may be multiple, variable and the subject of debate. I will go through this list in sequence and give examples which might be useful for both teachers and students.
5

Relationship Structure Example1. Metaphor Pictorial
representationFigures 4, 24
2. Cluster Bulleted listSpider diagram
Figure 1Figure 5
3. Comparison Table Table 24. Taxonomy (‘kind of’ relationship)
Tree Figures 6, 7, 8
5. Partonomy (‘part of’ relationships)
TreeOrganization chart Figure 9
6. Temporal sequence ChainCycle
Figure 10Figures 11, 12
7. Typology Linear scaleMatrix
Figure 13Figures 14, 15
8. Levels Concentric circlesStrata
Figure 16Figure 17
9. Interactions Cause-effect diagram Figures 18, 19
10. System flows CircuitHelix
Figures 20, 21, 22
11. Multiple interactions Network Figure 2312. Assemblages Rhizome Figure 2513. Overlapping categories
Venn diagram Figure 26
Table 1: Relationships and possible visualization structures
1. Metaphor
A visual metaphor uses a familiar image to convey the meaning of an abstract idea. For example, we might use the scales metaphor (figure 4) in discussions of media power in a democracy and discuss the notion of ‘checks and balances’ which promote balanced power over unbalanced power. With balanced power there is relative symmetry between competing powers whereas imbalanced power has a relative asymmetry (Hearn, 2012: 7-9). In democracies, media regulation attempts to reduce the negative effects of media power. This can be quickly conveyed by a visual metaphor as in figure 4.
2. Cluster
A cluster is an unordered set of items related to a higher level concept. It can be shown as a vertical bulleted list as in several nodes in figure 1. The use of bullets (and hence
6

lack of numerals or letters) indicates that the order is unimportant.
Clusters can also be represented as spider diagrams. For example one might try to map consumers’ images of a brand suchas McDonald’s by mapping interviewees’ comments on to a spiderdiagram as in figure 5.
Radial diagrams are useful devices for brainstorming at the beginning of a class discussion or practical exercise. But by the end of the topic it should be possible for students to produce much more structured visualizations.
3. Comparison
Sometimes a diagrammatic representation is not the most effective way of delivering complex information. When two or more concepts/conceptions are being compared then the most appropriate concept map is the traditional table. For example we could compare three dominant conceptions of the role of media as in table 2. Traditionalist Free market
(neoliberal)Public service
• Media should uphold traditional values
• Media should uphold law and order
• Media should uphold ‘family values’
• Media should reflect traditional views of identity (e.g. gender,ethnicity, sexuality, culture)
• Media can have a harmful effect on society
• Media need to be censored in respect ofsex and violence
• Media are responsible
• Media have responsibility to owners and shareholders
• Media can use free market to deliver global wealth, democracy and diversity to consumers
• Public service media should be privatized (e.g. universal BBC license should be replaced by subscription)
• Media should be deregulated
• There should be no
• Media have a democratic responsibility towardssociety
• Media must fulfil social functions of providing information,equal access and a public forum for different viewpoints
• Media collectively should represent diverse social groups and diverse viewpoints
• Media should allow access to diverse social groups
• Media should be
7
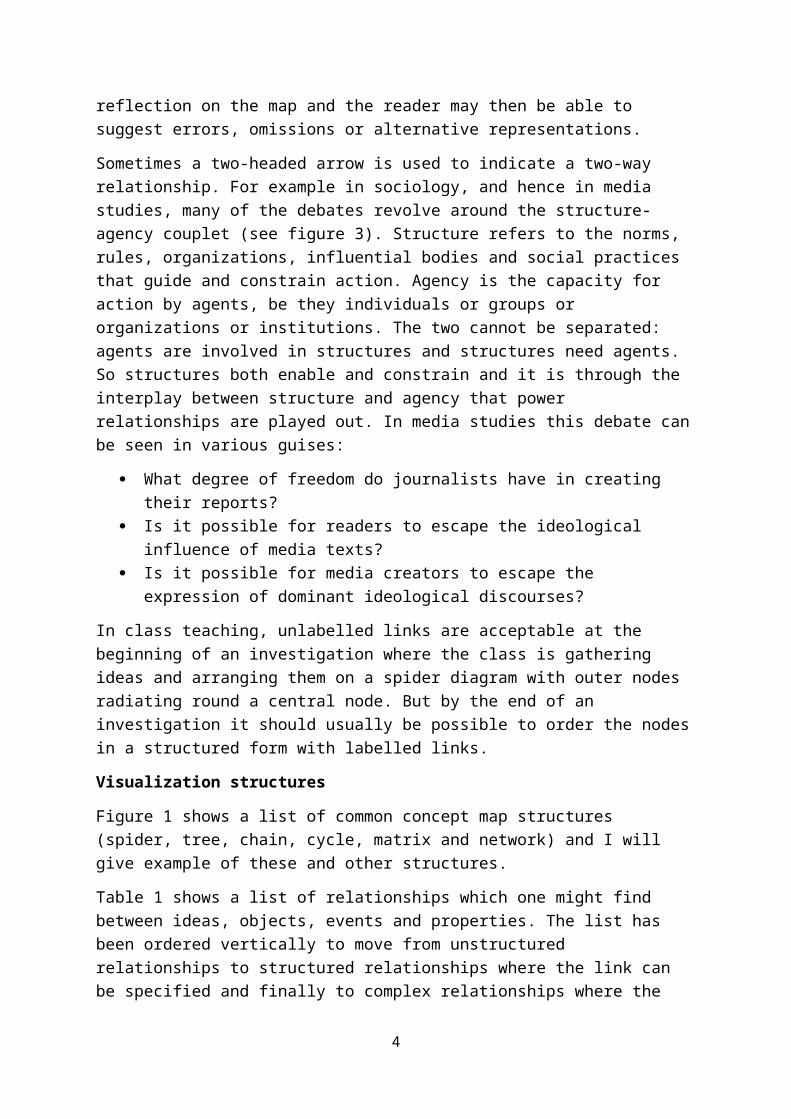
for ‘dumbing down’ society.
barriers to concentrated media ownership.
independent from interference from business and government
• Media should apply self-regulation with regard to content and conduct
• Media markets should be regulated to prevent domination by a single or a few large corporations
• Media should set and meet standards with regards to conduct andthe truth, accuracy, objectivity and balance
• Media should avoid publicizing content that can offend or lead to disorder
• Society is entitled tohigh standards and intervention is justifiable if the media fail to meet these.
Table 2: Comparison of three conceptions of the media
A good exercise for students would be order the entries in thetable 2 so that common features such as purpose, finance, regulation, conception of audience etc. could be compared across the table. They would need to add a column headed ‘Features’ at the left and then add rows for each feature. In this way the simple table will have been restructured as a matrix.
Table 3 illustrates the threshold concept that values are an inescapable part of debates about the media and media policy. It illustrates the dilemma faced by media policymakers trying to satisfy all stakeholders’ demands. An historical examination of media systems is likely to show that systems reflect the dominant values of the period.
8

Raymond Williams (1981) has provided us with a simple but powerful way of the analysing the dynamics of cultural change.He distinguishes between the residual, the dominant and the emergent in cultural production. The residual is the product of earlier and different societies but lives on as still available significant practices and values. Dominant cultural production uses the most influential practices and values of the present day. Emergent cultural production tries to move beyond the dominant and residual. Looked at historically, a particular cultural phenomenon will emerge, perhaps become dominant and then decline to a residual state or disappear altogether.
For example, looking at the historical development of UK broadcasting, we might identify its first phase as dominated by the paternalistic monopoly of John Reith’s BBC. This paternalism lives on as a residual traditionalist discourse which tries to mitigate negative media effects by upholding ‘family values’. As commercial broadcasting developed there emerged a new liberal pluralist discourse which tried to balance commercial and public service aims. Academic study of the media in the 1970s led to the emergence of a radical critique of both paternalism and liberal pluralism. In the 1980s a neoliberal free market discourse emerged to drive the move to multichannel broadcasting and became dominant over theresidual traditionalism and liberal pluralism. The dominance of News Corp in media markets and the criminal behaviour of redtop editors and journalists has led to an alliance between media academics, concerned journalists, victims of hacking andleftists/liberals. Thus pressure groups such as Hacked Off, the Campaign for Press and Broadcasting Freedom and the Media Reform Coalition can be viewed as representing a re-emergence and articulation of earlier liberal pluralist and radical discourses.
4. Taxonomy
Taxonomies show ‘kind of’ relationships and can be representedas tree diagrams with the superordinate category at the top and subcategories underneath. Taxonomies can be mapped as tree
9

diagrams with AKO links. Adding AEO links helps the reader connect the abstract concept to actual examples.
Figure 6 shows a taxonomy of national daily newspapers available in Scotland with examples of titles at the foot. Note that it might be better to use a table to represent this information and one could then add typical features of each ‘genre’ of newspaper.
Figure 7 is a taxonomy of film sound which lacks examples. An excellent exercise for learners is to add examples of these uses of sound from their own film viewing or from a compilation provided by the teacher. Or the teacher could ask students to shoot and dub their own short clips illustrating each technique. The clips could then be edited together and intertitles used to introduce each.
Figure 8 explains the challenging concept of differential decoding through easily understandable examples.
5. Partonomy
Partonomies show ‘part of’ relationships by splitting wholes into component parts. Like taxonomies they may be represented using tree diagrams. In the case of a physical object like a video camera it is better not to use a tree diagram but to usea schematic block diagram which shows the physical layout and linking of parts.
However trees are often used in organization charts to show how an organization or department is divided up. Conventionally links are unlabelled. On some, arrows show the line management structure. Figure 9 shows the structure of a video games production company. Note that such tree cannot show the flow of project work through the company and it may be preferable use a visualization which can show temporal sequences and iterations.
6. Temporal sequence
The most obvious temporal sequence in media analysis is narrative structure. For example figure 10 shows two narrative
10

models represented as a chain (of events): Tzetvan Todorov’s model (Todorov, 1975) and Kristin Thompson’s four act model ofHollywood narrative (Thompson, 1999).
Note that the Todorov model could be represented as a cycle. Figure 11 is a visualization of Joseph Campbell’s hero’s journey. The hero(ine)’s quest is employed both consciously and unconsciously by many Hollywood scriptwriters (Vogler, 1996).
If we turn to media creation by students then we could represent the sequence of pre-production, production, post-production as a chain. However I think it is better to presentthe process as a cycle to emphasize the iterative nature of digital media production which makes it technically straightforward to return to previous stages (iterate) in order to revise ideas and then re-create and re-edit content.
For Higher Media it is useful to use a ‘compass diagram’ (figure 12) for planning and annotating media production ideas. It is so-called because it should give direction to a media production as well as encompassing eight of the points which should be considered in an SQA Media practical assessment.
Note that a compass diagram can also be used to annotate observations from an analysis of a professional production anda teacher-led example of this can help students understand thestandard required for annotating their own work.
7. Typology
Sociologists often borrow mathematical representations such asscales, graphs, matrices and sets. These can allow us to show patterns in what might seem at first sight a chaotic ‘soup’ ofdifferent concepts/conceptions. Figure 13 uses a linear scale to plot different source-reporter relations on a linear scale from low to high independence.
The natural progression from this is to use two scaled axes atright angles thus producing four quadrants. For example in discussion of media ‘effects’ one will wish to distinguish between long-term and short-term effects and between planned
11

and unplanned effects. Denis McQuail employs a typology of news and its effects suggested by Peter Golding:
“He argued that, in the case of news, intended short-termeffects may be considered as ‘bias’; unintended short-term effects fall under the heading of ‘unwitting bias’; intended long-term effects indicate ‘policy’ (of the medium concerned); while unintended long-term effects of news are ‘ideology’.”
(McQuail, 2010: 465)
McQuail uses Golding’s typology to set up two axes: intention(intentional to unintentional) and time (short-term to long-term) as in figure 14 (adapted from McQuail, 2010: 466). Various types of explanations of media effects can then be assigned to one or more quadrants. Such a map could form the basis for class discussion and examples from the media (or classic studies thereof) could be plotted on a blank ‘graph’. Such a grid – with a one or two examples in each quadrant – should also prove an excellent device for planning an examination answer about different kinds of media effect.
The social impact of media has been variously classified as fragmenting or unifying and there have been both optimistic and pessimistic evaluations of these. This suggests a two-dimensional typology with impact and evaluation as axes. Figure 15 shows this (based on McQuail and Windahl, 1993: 129).
8. Levels
Sociologists trying to develop dynamic models of social systems often resort to using spatial metaphors to visualize relationships between different strata or levels. In figure 16, a concentric circles model is used as a spatial metaphor for analysing the infrastructural levels which provide the contexts for the work of journalists (Shoemaker and Reese, 2014: 9).
Shoemaker and Reese’s model does not include the audience. It would be a productive exercise for students to develop a
12

similar model for individuals receiving rather than mediating media messages.
When introducing such analyses to students I tend to start notwith the media but with the familiar situation of the classroom and the various structures and agents that affect teaching and learning. Once we have teased out the levels we can ask questions which explore the structure-agency couplet. Is creative agency possible within restrictive structures suchas resource-starved and highly routinized secondary schools? Is creative agency possible with the structures and stricturesof SQA assessment?
This suggests that we need to consider more holistic models. The most famous of these is Marx’s base-superstructure model. Colin McArthur describes it thus, using an architectural rather than a geological metaphor:
“Marxism, analysing successive kinds of society (slave, feudal and capitalist) describes the social formation as rather like the several floors of a house, the ground floor (the base or infrastructure) consisting of the forces of production and the social relations of production and the upper floors (the superstructure) consisting first of all of the coercive factors of the state and the legal system and, beyond that, of the factors concerned primarily with live experience – the family, religion, education, the arts and the mass media.
The simile of the successive levels of a house is a particularly pertinent one since it poses the notion of a structural relationship among the various levels with the ‘ground floor’ being the most important in that it holds the others up.
All Marxians accept some form of this analytic model although there is considerable debate about the nature andextent of the dependence of the superstructure(s) upon the base:some argue that the economic base is very directly reflected in the superstructure(s), others that the superstructure(s), though ‘in the last analysis’ dependent
13

on the base, have a great degree of autonomy. This autonomy has the consequence of masking the relationship with the base and of allowing it to be reciprocal, dialectical, rather than the base simply acting in a one way direction on the superstructure(s).”
(McArthur, 1980:2)
We could picture this as in figure 17. Such a model only comesalive when one applies it to familiar situations. Again one could use education as context familiar to students and discuss questions such as: How does the capitalist system shape education? Does the education system maintain and legitimate the capitalist system? Can education change the capitalist system?
Once these questions have been tackled (if not answered!) one can then ask similar questions of the media.
When considering the question of the relative autonomy of the superstructure we are experiencing the echo of the structure/agency couplet at work in the sociological imagination. The question arises of exactly how the base-superstructure interaction operates and this leads to considerations of media effects and of ideology.
9. Interactions
The dependency model of Ball-Rokeach and DeFleur (1976) views effects as being the result of three interdependent elements as in figure 18: the social system (which can vary in terms ofoverall stability); the media system (which can vary in response to the needs of the society and audiences); and audiences (who vary in terms of their social position, dependency on media and access to media). As a result there will be variable cognitive, affective and behavioural effects on individuals and groups which in turn feed back into the social and media systems.
Effects studies tend to look at what the media does to the audience. We need to balance this with considerations of what the audience does to media texts. Figure 19 is a cause-effect diagram which tries to show the complex of factors at work as
14

well as multiple cycles as socially situated individuals develop their media tastes and distastes.
10. System flows
The Higher Media course requires learners to integrate textualkey aspects (categories, language, narrative, representation) and contextual key aspects (institution, audience). In order to do this it is useful to have a holistic model which displays these interactions.
Perhaps the most influential holistic model of media is found in Richard Johnson’s seminal article What is Cultural Studies Anyway? (Johnson, 1987) On first reading this article can seem obscurebut I have found over the years that returning to it is rewarding because of its intellectual breadth and wisdom.
Johnson seeks to answer his question by asking:
1. What is the characteristic object of cultural studies?2. What is cultural studies about?
For Johnson the characteristic object is cultural forms or subjective forms. The terms are two sides of the same coin – one social and in the public sphere, the other subjective and in the private sphere of lived culture. For Johnson, cultural studies is about the “subjective forms we live by”:
“It focuses on the "who I am" or, as important, the "who we are" of culture, on individual and collective identities. It connects with the most important structuralist insight: that subjectivities are produced, not given …”
(Johnson, 1987: 43)
Subjective/cultural forms include “language, signs, ideologies, discourses, myths” that we find in and around physical objects as well as media texts. By subjectivity Johnson includes not only conscious cognitive activity but also the unconscious elements or impulses that move us withoutbeing consciously known. Unconscious elements will include notonly the psychological unconscious (memories, desires and needs) but also socially learned attitudes and behaviour which
15

we draw on without thinking, what Colin McArthur (2003: 6) hastermed the ‘discursive unconscious’.
Johnson suggests that the two key concerns for cultural studies are:
1. The pleasures and use values of cultural forms.2. What are the outcomes of cultural forms? Do they reproduce
dominant ideologies and existing forms of inequality? Or do they challenge existing forms of oppression and point toalternatives?
Let’s now consider Richard Johnson’s circuit of culture model.The word ‘circuit’ is used rather than ‘cycle’ to suggest a flow or flows. In this case there is a dual flow of meaning and money.
The simplest version (figure 20) has four nodes:
“All cultural products go through the moments shown in [figure 19], though we can start the circuit at differentpoints. The model fits face-to-face exchanges or forms such as television programmes or useful and meaningful objects such as personal hi-fi. Importantly, everyday life is both a starting point (A) and an end point or result (E) of the process. In this model, specialist cultural producers (B) make representations in the form of texts (C). These are read under definite conditions (D) and have consequences at the level of everyday life. There are, however, innumerable cultural circuits, the conditions of which are constantly in process, so they are, perhaps, more spirals than circuits.”
(Johnson et al, 2004: 37-38)
Perhaps ‘spirals’ is the wrong word and ‘helices’ might be more appropriate because it suggests a third dimension, in this case of time. We might imagine multiple but interlinked cultural helices which take place over regular intervals such as the daily news cycle and others with longer irregular periodicities such as those related to circulations of meanings around social categories such as gender, race, class and age.
16
An implication of this is that when we analyse a text such as Coppola’s The Godfather in its contexts we need to ‘wind’ the helices back in time to the sociohistorical, institutional, intertextual and audience contexts at the time of its production.
Key aspects version of the circuit
Johnson’s model is obviously relevant to the SQA Higher Media course so it seems natural to try to map the key aspects of media literacy on to the diagram as in figure 21.
Many teachers and learners find these diagrams (and their morecomplex versions) difficult to understand. So, as always in teaching, start where the pupils are. Before thinking about media communication, pupils should explore simple circuit models as a way of thinking about and abstracting the key elements of everyday face-to-face communications such as joke-telling, arguments and classroom teaching. This should bring out abstract ideas such as sender, text, receiver, common culture, feedback, genre, style, tone, multimodal communication and so on.
Let’s now examine figure 21 and paraphrase Johnson’s original text to fit in with the SQA Media approach. In the key aspectsmodel, specialist media producers select aspects of society and create (encode) representations in texts. Genre, style, tone, media language, narrative and representational discourses construct the mode(s) of address and preferred meaning(s) appropriate to the perceived target audience. Theseare decoded differentially by the audience due to individual and social needs and differences. This process has consequences at the level of everyday social life.
Figure 20 showed a simplified version of the circuit of culture. Figure 22 shows a version which I have adapted from Johnson’s 1987 article. First it suggests that the moment of publication (or public-ation) of the text involves a shift from the private sphere to the public sphere. For example, theprivate concepts of a scriptwriter based on her life experience are transformed into a movie and then enter the public realm where these experiences come to represent a more
17
general version of the human condition. Alternatively considerthe 2015 claims of PM David Cameron that we are undergoing an economic revival. These appear in the public sphere of internet, television, radio and the press. In evaluating the validity of that claim members of the audience will compare such abstract public sphere claims with their own personal lived experience in the private sphere.
The cultural/subjective circuit can be seen as the circulationof ideological discourses. As Catherine Belsey says:
“Ideology is inscribed in discourse in the sense that it is literally written or spoken in it; it is not a separate element which exists independently in some free-floating realm of ‘ideas’ and is subsequently embodied in words, but a way of thinking, speaking and experiencing.”
(Belsey, 1980: 5). We would want to extend Belsey’s conception to multimodal page-based and time-based texts thus: ideology is inscribed in multimodal ideological discourses.
How individuals respond to ideological discourses is fed back into lived culture via what Bourdieu (1977) has called habitus, the embodiment of cultural representations in the habits and routines of everyday life. This process not only reproduces common-sense ideologies and discourses of dominant social powers but at the same time may provoke oppositional ideologies and discourses which challenge this dominance. Following Gramsci (1971) we might say that in stable democratic societies the process of hegemony is a ‘moving equilibrium’ with fluctuations in the relative dominance of ruling class ideologies over those of subordinate classes.
This is of course not just a circuit of discourse but is driven by a circuit of capital. Money is key to the production, distribution, marketing and use of media content. Media production arises from the entertainment, educational and informational needs of users but is exploited for financial gain, thus having a profound effect on the range andcontent of texts in circulation. Thus Johnson’s circuit is at
18

the same time a circuit of capital and of culture reflecting of course Marx’s base-superstructure conception.
The cycle also represents a transformation of meaning from theprivate sphere particulars of our individual and social lives to the more abstract debates of the public sphere. Media textsare the primary medium of the public sphere and set the agendafor discussion of social, political and cultural issues in themedia and in our everyday lives.
Johnson’s model was developed before the rise of the internet and social media. So we would need to revise such models to take account of media ‘production’ by sectors of the audience which is then distributed via social media as well as by mediaproducers (for example, citizen journalist footage). Some of this user-generated content may become viral and can within a few hours spread globally via innumerable links between old and new media. Trying to visualize this demands new metaphors.
11. Multiple interactions
Figure 22 suggests that each of the four nodes in the circuit are affected by other factors. Each stage of the circuit of culture depends on multiple networks of interactions and infrastructure. Following Ognyanova and Monge (2013), when we think about the media and their economic, social and individual roles we need a holistic model which helps us to cope with their textual and contextual interconnections. The media system can be viewed as having four major nodes: institutions, texts, audiences and society and a diverse rangeof relationships between these nodes. Each node can be seen asexisting in a dynamic network of relationships. So the institutional node can be viewed as emerging from a network ofinternal and external links. Texts can be seen as arising froma complex set of intertextual links. The different audience responses can be seen as arising from a mixture of individual and social differences as well as varying face-to-face and/or on-line interactions. Society can be seen as a formation of economic, political and cultural institutions which have local, national and/or global linkages.
19

This separation of the media system into four nodes is a grosssimplification. The social is reflected in and constituted viathe other nodes. The audience is comprised of not just the target audience but also of media professionals who are looking for talent and innovative practice. Economic, political and cultural institutions have close links to the media institutions.
Such a model needs to be multilevel and we need to think of three levels at least:
financial: the circulation of capital network: the technological, cultural and social links
that facilitate the circulation of finance and meaning discursive: the circulation of social meanings.
To model this conception probably needs us to move into the third dimension with a set of Lego pieces!
I will resist that and merely suggest ways in which we might visualize the complex networks which shape each node. Rather than nodes and links of computer network diagrams I prefer to use tiled hexagons (which can be created using Microsoft PowerPoint’s Smart Art graphics). I use dotted lines to indicate that the hexagons are not sealed cells but allow the flow of money, concepts, ideologies, content, people and so on. No diagram can fit all cases and should just be a guide asto what to look for in specific situations.
Figure 23 (adapted from Ognyanova and Monge, 2013) shows a network diagram which fills out the Johnson model at each nodeand views the social system as the context for all intranodal and internodal interactions.
The separation into separate nodes is a fiction created as an analytical aid. The actual situation can only be thought aboutas a highly complex convolution of linked networks in a state of continual flux.
12. Assemblages
So far the visualizations presented would seem to be capable of enriching teaching and learning in the SQA Media course.
20

Curiously the new course seems far more like academic media studies than the Media Studies qualification it replaced – at least Media Studies as it was in the mid-1980s. And that is the problem for me with the course. It looks as if it was designed in the 1980s; media studies locked in amber like the majority of other subjects. The growth of media education was motivated by a critique of traditional subjects, their pedagogies and assessment methods. This critical cutting edge is in danger of being forgotten.
So what is wrong with the new course? There seem to me to be at least two elephants in the room that have been overlooked: technology and globalization.
Technology has been dropped as a key aspect which seems astonishing given the way digital communications technology has transformed media production and use since the mid-1980s. And most teachers teach the course from a very ‘UK/US-centric’viewpoint. We need to adapt our concept of media to the 21st century and the way in which culture is distributed and consumed globally.
P David Marshall (2011) argues that there has been a shift from a ‘representational culture’ to one where we now have a hybrid of ‘representational culture’ and ‘presentational culture’ which he terms (in my view rather unsatisfactorily) ‘intercommunication’.
In representational culture, media forms generally have a collective mode of address, embracing the population as a whole. In politics, politicians represent ‘the people’ and thegovernment is an expression of the ‘collective will’. In the media, broadcasters such as Channel 4’s Jon Snow act on the people’s behalf and hold politicians to account. The use of ‘we’ and ‘us’ (in opposition to a range of ‘thems’) signals that the audience is being invited to imagine a national community, thus legitimating the ideological notion of nation/community. The filter for news and culture are journalists and cultural pundits who select content on behalf of ‘us’. 1980s and 1990s UK television was a highpoint of representational media with television events such as Diana’s
21

funeral and live sporting finals framed as if ‘we’ were all watching the same event.
The explosion of multichannel pay television with Sky (and nowBT) buying up major sporting rights has expanded the numbers of viewers globally but reduced the numbers who watch such events nationally. The convergence of broadcasting with interactive media and the internet has led to a personalized mode of address – ‘you tv’ rather than ‘we tv’: you are individually offered content you watch any time or in any place or on any device. This has resulted in the emergence of a presentational culture where the personal becomes the channel and the filter of media and communication. This individualization of address has been given added impetus by the rise of social media such as Facebook and Twitter which allow each user to present an online identity. As Marshall says, “presentational media implies the public performance of self through the accoutrements of links and commentary.” (Marshall, 2011: 12)
Representational media created a mythical public sphere addressing the nation. This was attractive to journalists, soap scriptwriters, advertisers and politicians. The individualized address of presentational media and its linkingfacility has meant that the ‘public’ has now fractured into myriad ‘micropublics’ inside and across nations.
The rise and rise of presentational media has not replaced representational media. What we now have is a complex two-way flow between the two: both regimes share links and allow content and comment to flow between them. Blogs feed off newspaper and broadcasting content and in turn journalists andbroadcasters exploit online content. Content from either regime can go viral, be shared across the globe and generate more content. This implies that media communication models such as the circuit of culture developed prior to the Internetneed to reflect the flows and impacts of social media and user-generated content.
We also need to change our conception of the institutional operations of the media industries. What is required is an
22
understanding of how media corporations satisfy our needs for entertainment, information, education and social interaction using representational and presentational media whilst they meet their own commercial and/or public service and/or promotional goals.
Let’s now consider globalization. Arjun Appadurai says that its central problem is the tension between cultural homogenization and cultural heterogenization and that this cannot be understood in terms of traditional sociological models. Instead the new global cultural economy has to be understood as highly complex with both conjunctive and disjunctive effects. Appadurai (1990: 297-301) proposes a basic framework for examining these disjunctures which comprises five dimensions or ‘scapes’:
Ethnoscape: “… the landscape of persons who constitute the world in which we live: tourists, immigrants, refugees, exiles, guestworkers and other moving groups and persons” and which “appear to affect the politics of and between nations to a hitherto unprecedented degree.”
Technoscape: “the global configuration, also ever fluid, of technology, and of the fact that technology […] now moves at high speeds across various kinds of previously impervious boundaries.”
Finanscapes: the complex “global grid of capital of currency speculation and capital transfer.”
Mediascapes: “image-centred, narrative-based accounts of strips of reality” which “constitute narratives of the ‘other’ and proto-narratives of possible lives, fantasieswhich could become the prolegomena [introduction] to the desire for acquisition and movement.”
Ideoscapes: like mediascapes, “concatenations of images” which are “often directly political and frequently have to do with the ideologies of states and the counter-ideologies of movements explicitly oriented to capturing state power or a piece of it.” The Euro-American master narrative of the Enlightenment, with its master term democracy and satellite terms like freedom, rights and sovereignty may be understood in very different ways in different countries and cultures of the world.
23

Appadurai argues that the global de-territorialized flows of people, technologies, money, images and ideas “occur in and through disjunctures” between the five scapes:
“[B]ecause of the disjunctive and unstable interplay of commerce, media, national policies and consumer fantasies, ethnicity, once a genie contained in a bottle of some locality (however large), has now become a globalforce, forever slipping in and through the cracks betweenstates and borders.”
(Appadurai, 1990: 306)
The suffix ‘scapes’ signals that these are perspectival constructs “inflected very much by the historical, linguistic and political situatedness of different sorts of actors: nation-states, multinationals, diasporic communities, as well as sub-national groupings and movements (whether religious, political or economic) and even intimate face-to-face groups such as villages, neighbourhoods and families. Indeed the individual actor is the last locus of this perspectival set oflandscapes.” (Appadurai, 1990: 296)
Disjuncture seems to me to express the current UK zeitgeist. The old local and national certainties are gone. Most UK citizens grew up in a nation-state ‘imagined community’ with national media providing a unified (if mythical) public spherefor rational debate. But the impacts of globalization, immigration and personalized digital communications (not to mention of the possible break-up of the Union) has led to a transformation of the conception of the public sphere.
Marshall argues that within the nation-state, interactive media have allowed the creation of local, regional and national ‘micropublic spheres’ which conjoin with and clash with the dominant frames of the national public sphere. Furthermore Appadurai (1996) says that the international flow of people, fuelled by their search for a better life, has led to the emergence of multiple ‘diasporic spheres’.
An overall effect of all these conjunctions is a shared general sense of disjuncture as cherished certainties of the Enlightenment (democracy, equality, debate, free speech) come under multiple attack. Appadurai comments, “one man’s imagined
24

community is another man’s political prison.” (Appadurai, 1990: 295)
How can we visualize this? French philosophers Gilles Deleuze and Félix Guattari (1980) utilize the rhizome concept from botany. A rhizome describes the multiple, horizontal, open dynamic growth of underground tuber systems such as bulbs and common weeds which flower from the root rather than a stem. They pose the rhizome as a concept in opposition to the tree (see figure 24). For example the oak tree has a single foundation, a tap root, from which, by a process of binary division, the whole structure emerges. The tree metaphor is used as a metaphor for Western philosophy with its preference for roots and trees over flows and rhizomes. The former assumes that multiplicity emerges from a single source whereas, with the rhizome concept, multiplicity is substantiveand not simply derived from a single source. The technical infrastructure of the internet and its emergent social structures are areas in which rhizomatic analysis has been applied.
Roger Griffin has also applied the rhizome concept to the analysis of fundamentalist and antidemocratic terrorist groups:
“the concept ‘rhizome’ throws into relief its dynamic nature as a polycratic movement by stressing that it doesnot operate like a single organism such as a tree with a tap-root, branch and canopy, and with a well-defined inside and outside, beginning and end. Instead it behaveslike the tangled root-system of some species of grass andtuber, displaying ‘multiple starts and beginnings which intertwine and connect which each other’, constantly producing new shoots as others die off in an unpredictable, asymmetrical pattern of growth and decay. If a political network has a rhizomic political structureit means that it forms a cellular, centreless, and leaderless network with ill-defined boundaries and no formal hierarchy or internal organizational structure to give it a unified intelligence.” (Griffin, 2003: 9-10)
Griffin concludes that their combined effect is “to act as a pervasive ‘dark matter’ latent within the liberal-capitalist
25

cosmos” which “could help ensure that the centre of gravity ofwestern democracies stays firmly on the right, an invisible counterweight to visions of a shared humanity and social justice for all.” (Griffin, 2003: 29)
Is it possible to map this? One can see elements of both Marx’s base-superstructure model and Johnson’s circuit of culture, but rather than strata and circuits we would seem to require a highly convoluted constantly shifting formation of intersecting scapes producing highly disjunctive perspectives.
Figure 25 tries inadequately to represent Marshall’s and Appadurai’s arguments. Given Appadurai’s use of a landscape metaphor it is surprising that he does not include the environment or the ‘enviroscape’. I have added this to make six scapes.
Despite its flaws I find figure 25 instructive because it seems to relate to the world we currently live in. One can seein it echoes of all the economic, political, technological, environmental, religious and ethnic struggles that we see reflected in today’s media texts. It registers some of the changes that the media have gone through over the last two decades. It seems to me to provide some footholds and handholds to scaffold discussion with students about recent historical events as well as the changes in media and society.
13. Overlapping CategoriesOne problem of using nodes in visualizations is that on the page they separate what are in fact overlapping ideas or categories. However Venn diagrams can be useful for picturing overlap.
Let’s apply this to the notion of the public sphere. The public sphere, as an informed public arena for the discussion of collective issues and concerns, is seen as a cornerstone ofa civil society and the media are viewed as its main locus. This of course raises concerns over access to, representation in, and commercialization of, the public sphere. However as Bart Cammaerts notes:
26
“media have evolved even more into a heavily contested battlefield for meanings to make sense of the world, as well as for competing ideas of what citizenship — from a national, but also increasingly also from a regional or global perspective — entails. From this perspective the image of a unified rational and consensual Habermassian public sphere is difficult to sustain.”
(Cammaerts, 2007: 4)
Rather than a single public sphere we need the notion of multiple public spheres (such as the micropublic and diasporicspheres previously discussed) existing alongside a dominant public sphere represented in a nation’s broadcasting and pressas in figure 26 (adapted from Cammaerts, 2007: 4). It uses a Venn diagram to visualize these multiple public spheres. We could divide the alternative public spheres into those that are autonomous from the dominant sphere and those that are oppositional to it and seek to intervene in rational debate.
We need also to distinguish between civil society and uncivil society. There are hate spheres outside or on the margins of civil society which promote hostility and violence towards others. Some of these (for example, the British National Party) may enter the oppositional sphere or even the dominant sphere (seeking election as an MP). However other hate groups may mutate rhizomically into fundamentalist terrorist groups such as ISIS which operate across state boundaries. This implies that we have to consider public spheres as being not just intranational, but also international.
ConclusionMedia studies is a subject which should have a life beyond theexamination hall. I suggest it can do this in two ways:
by using visualizations which aid reflective thought and learning in any subject or area of life
by using texts/contexts which tackle the key issues of the present and future (climate change, economics, technology, global flows of people, media, ideologies).
It would be a lie to suggest to students that we will ever fully understand the complexities of the social world. But the
27

least we can give them is tools for thinking that allow them to visualize fields of enquiry in complex, interconnected and holistic ways. And such visualization skills should prove invaluable in crossing learning thresholds throughout their lives.
28
References
Appadurai, A. (1990) ‘Disjuncture and difference in the global cultural economy’. Theory Culture Society, 7, 295-310.
Appadurai, A. (1996) Modernity at Large: cultural dimensions in globalization. Minneapolis: University of Minnesota Press.
Ball-Rokeach, S. and DeFleur, M. L. (1976) ‘A dependency model of mass media effects’. Communication Research, 3, 3-21.
Belsey, C. (1980) Critical Practice. London: Methuen.
Bourdieu, P. (1977) Outline of Theory and Practice. Cambridge: Cambridge University Press.
Cammaerts, B. (2007) ‘Jamming the political: beyond counter-hegemonic practices’. Continuum: Journal of Media & Cultural Studies, 21:1, 71-90.
Campbell, J. (1949, 1988) The Hero with a Thousand Faces. London: Paladin.
Deleuze, G. and Guattari, F. (1980) A Thousand Plateaus. London: Continuum.
Golding, P. (1981) ‘The missing dimensions: news media and the management of change’. In E. Katz. And T. Szecsk (eds) Mass Media and Social Change. London: Sage.
Gramsci, A. (1971) Selections from the Prison Notebooks. London: Lawrence and Wishart.
Griffin, R. (2003) ‘From slime mould to rhizome: an introduction to the groupuscular right’. Patterns of Prejudice, 37:1, 27-50.
Hearn, J. (2012) Theorizing Power. Houndmills: Palgrave Macmillan.
Instrell, R. (2014) ‘Barriers and thresholds in learning media studies: part 2’. Media Education Journal, 56, 13-17.
Johnson, R. (1987) ‘What is cultural studies anyway?’ Social Text, 16, 38–80.
Johnson, R., Chambers, D., Raghuram, P. and Tincknell, E. (2004) The Practice of Cultural Studies. London, Sage.
Marshall, P. D. (2011) ‘The intercommunication challenge: developing a new lexicon of concepts for a transformed era of communication’. ICA 2011: Proceedings of the 61st Annual ICA Conference. Boston, MA: International Communications Association, 1-25.
Mayer, J. H. F. and Land, R. (eds) (2008) Overcoming Barriers to Student Understanding: threshold concepts and troublesome knowledge. London: Routledge.
McArthur, C. (1980) Television and History. London: BFI.
McArthur, C. (2003) "Brigadoon", "Braveheart" and the Scots: distortions of Scotland in Hollywood cinema. London: I. B. Tauris.
29

McQuail, D. (2010) McQuail’s Mass Communication Theory (6th edn). London: Sage.
McQuail, D. and Windahl, S. (1993) Communication Models for the Study of Mass Communication. (2nd edn). London: Sage,
Ognyanova, K., & Monge, P. (2013) ‘A multitheoretical, multilevel, multidimensional network model of the media system: production, content, and audiences’. Communication Yearbook, 37, 67–94.
Scottish Qualifications Authority (2014) SQA Higher Media course documents.Accessed 29/04/2015 at http://www.sqa.org.uk/sqa/47908.html.
Shoemaker, P. J. and Reese, S. D. (2014) Mediating the Message in the 21st Century: a media sociology perspective. London: Routledge.
Thompson, K. (1999) Storytelling in the New Hollywood: understanding classical narrative technique. Cambridge, MA: Harvard University Press.
Todorov, T. (1975) The Fantastic. New York: Cornell University Press.
Vogler, C. (1996) The Writer’s Journey: mythic structure for storytellers and screenwriters. London: Boxtree.
Williams, R. (1981) Culture. Glasgow: Fontana.
30