The hydrocarbon potential, thermal maturity - De Gruyter
17
Cent. Eur. J. Geosci. • 3(1) • 2011 • 12-28 DOI: 10.2478/v10085-010-0032-5 Central European Journal of Geosciences The hydrocarbon potential, thermal maturity, sequence stratigraphic setting and depositional palaeoenvironment of carbonaceous shale and lignite successions of Panandhro, northwestern Kutch Basin, Gujarat, Western India Research Article Vinay K. Sahay * Department of Earth Sciences, Indian Institute of Technology Bombay, Powai-400076, India Received 27 May 2010; accepted 6 October 2010 Abstract: The objective of the present paper is to provide geochemical and palynological data to characterize lignites and carbonaceous shales from Panandhro, northwestern Kutch Basin, Gujarat, Western India, in terms of their hy- drocarbon potential, thermal maturity, sequence stratigraphic settings and depositional palaeoenvironment. The samples, collected in Panandhro lignite mine, belong to Naredi Formation of Late Paleocene-Early Eocene age. The geochemical results are based on proximate analysis, ultimate analysis, X-ray diffraction and Rock-Eval py- rolysis analyses, whereas palynological data include palynofossil composition and thermal alteration index (TAI). The TOC, hydrogen index (HI), cracked hydrocarbon (S2), bitumen index (BI), quality index (QI), and the total ge- netic potential (S1+S2) values indicate that the studied lignites and carbonaceous shales have good source rock potential. The organic matter is predominantly of type II and type II/III kerogen, which has potential to generate oil as well as gas. Thermal maturity determined from thermal alteration index (TAI), T and production index (PI) indicates that the organic matter is immature, and in the diagenesis stage of organic matter transformation. The deposition of the studied carbonaceous shales and lignites took place in palaeoenvironments varying from brackish mangrove to freshwater swamp. This study indicates that the proportion of ferns, palms, volatile matter content, S/C, H/C ratios, as well as the presence of siderite and quartz can be used as an indicator of accommo- dation trends in the coal depositional system. The Panandhro carbonaceous shales and lignites were deposited during the lowstand systems tract with many cycles of small magnitude trangressive-regressive phases. Thus, the geochemistry and ecological palynology are useful not only for the investigation of coal quality and origin, but also to infer accommodation space settings of the mire. This can be gainfully utilized in the coal industry for coal mine planning, development and exploitation, because of the predictive ability to infer changes in stratigraphy and coal quality. Keywords: hydrocarbon potential • organic matter • maturity • accommodation space • palaeoenvironment • Panandhro • India © Versita Sp. z o.o. * E-mail: [email protected], *Present Adress: MEPL, Nagpur, India. 12
-
Upload
khangminh22 -
Category
Documents
-
view
7 -
download
0
Transcript of The hydrocarbon potential, thermal maturity - De Gruyter

Cent. Eur. J. Geosci. • 3(1) • 2011 • 12-28DOI: 10.2478/v10085-010-0032-5
Central European Journal of Geosciences
The hydrocarbon potential, thermal maturity,sequence stratigraphic setting and depositionalpalaeoenvironment of carbonaceous shale and lignitesuccessions of Panandhro, northwestern Kutch Basin,Gujarat, Western India
Research Article
Vinay K. Sahay∗
Department of Earth Sciences,Indian Institute of Technology Bombay,Powai-400076, India
Received 27 May 2010; accepted 6 October 2010
Abstract: The objective of the present paper is to provide geochemical and palynological data to characterize lignites andcarbonaceous shales from Panandhro, northwestern Kutch Basin, Gujarat, Western India, in terms of their hy-drocarbon potential, thermal maturity, sequence stratigraphic settings and depositional palaeoenvironment. Thesamples, collected in Panandhro lignite mine, belong to Naredi Formation of Late Paleocene-Early Eocene age.The geochemical results are based on proximate analysis, ultimate analysis, X-ray diffraction and Rock-Eval py-rolysis analyses, whereas palynological data include palynofossil composition and thermal alteration index (TAI).The TOC, hydrogen index (HI), cracked hydrocarbon (S2), bitumen index (BI), quality index (QI), and the total ge-netic potential (S1+S2) values indicate that the studied lignites and carbonaceous shales have good source rockpotential. The organic matter is predominantly of type II and type II/III kerogen, which has potential to generateoil as well as gas. Thermal maturity determined from thermal alteration index (TAI), Tmax and production index(PI) indicates that the organic matter is immature, and in the diagenesis stage of organic matter transformation.The deposition of the studied carbonaceous shales and lignites took place in palaeoenvironments varying frombrackish mangrove to freshwater swamp. This study indicates that the proportion of ferns, palms, volatile mattercontent, S/C, H/C ratios, as well as the presence of siderite and quartz can be used as an indicator of accommo-dation trends in the coal depositional system. The Panandhro carbonaceous shales and lignites were depositedduring the lowstand systems tract with many cycles of small magnitude trangressive-regressive phases. Thus,the geochemistry and ecological palynology are useful not only for the investigation of coal quality and origin, butalso to infer accommodation space settings of the mire. This can be gainfully utilized in the coal industry for coalmine planning, development and exploitation, because of the predictive ability to infer changes in stratigraphy andcoal quality.
Keywords: hydrocarbon potential • organic matter • maturity • accommodation space • palaeoenvironment • Panandhro •India© Versita Sp. z o.o.
∗E-mail: [email protected], *Present Adress: MEPL, Nagpur, India.12

Vinay K. Sahay
1. Introduction
The Panandhro lignite mine (23˚41’ N 68˚45’ E) is sit-uated at the northwestern part of Kutch, Gujarat, India(Figure 1). Black shale facies comprising carbonaceousshales and lignites are locally developed on post trap-pean (Deccan trap) topography in Panandhro. Previousstudies on petrology of Panandhro lignites were reportedby Singh and Singh (2005) [1], and the palynological stud-ies of Panandhro lignites by Misra and Navale (1992) [2]provided information of the flora and palaeoenvironment.However, up to now no studies have addressed the hydro-carbon potential and accommodation space settings of thePanandhro lignites and carbonaceous shales. This workpresents the petroleum source rock potential, thermal ma-turity, sequence stratigraphic settings, and depositionalenvironment of the Panandhro lignites and carbonaceousshales based on integrated geochemistry (proximate anal-ysis, ultimate analysis, X-ray diffraction, and Rock-EvalPyrolysis), and palynology. The proximate and ultimateanalysis has been used mainly to infer the quality of coals.In these analyses, the ash yields and sulfur contents [3, 4]have been used to understand the depositional palaeoen-vironment as well. In this study, the utility of various othercomponents of the proximate and ultimate analysis hasbeen investigated to infer their response to the variationin accommodation space conditions. In addition, ecologi-cal palynomorphs and X-ray diffraction have been used tostudy the cyclic response of ecological palynomorphs andminerals to changes in accommodation space and theirfacies.
Figure 1. Location of Panandhro lignite mine (after Singh and Singh,2005 [1]).
2. Geology of the areaThe Kutch basin is an elliptical-shaped pericratonic shelfbasin with well developed Tertiary strata over volcanicDeccan Traps. The basin extends far to the west into thepresent continental shelf area [5]. The Tertiary sedimentsare developed in the western part of this basin with a ma-jor part occurring in the offshore region. Biswas (1992) [5]have studied in detail the Tertiary sediments of the KutchBasin. A geological map of the northwestern part of Kutchis given in Figure 2. The Panandhro lignite of the NarediFormation, which is dominantly argillaceous, overlies di-rectly Deccan Trap volcanics in the study area. The age ofthe Naredi Formation is Late Paleocene to Early Eocene.The Naredi Formation comprises of a shale member (car-bonaceous shales and lignites), a limestone member anda claystone member [5]. Organic rocks consisting of lig-nite and carbonaceous shale occur in a small isolated andpartially closed basin like structure (3 km width) createdby post trappean (Deccan trap) topography. Lignite oc-curs as a multiple bed with fingering intercalations of car-bonaceous shale. The thickness range is from 0.10 to 12 mforming a composite seam, while the overburden thicknessvaries from 8 to 17 m.
Figure 2. Geological map of Northwestern part of Kutch basin (afterSaraswati and Banerji, 1984 [47]).
3. MethodsFifteen samples of lignites and carbonaceous shales werecollected from a working section of the Panandhro mine.The sampling interval ranged from 0.3 to 0.8 m dependingon the thickness of the lignite and carbonaceous shale.The geochemical analyses were carried out on the bulksamples, and the results were plotted with depth. For ul-timate and proximate analysis, samples were crushed to
13

The hydrocarbon potential, thermal maturity, sequence stratigraphic setting and depositional palaeoenvironment of carbonaceous shale and lignitesuccessions of Panandhro, northwestern Kutch Basin, Gujarat, Western India
72 mesh size. Representative samples were taken by theconing and quartering method. The proximate and ulti-mate analyses were carried out according to Bureau ofIndian Standards [6, 7]. The organic carbon, hydrogenand total sulfur were determined on a CHNSO elemen-tal analyser (model FLASH EA 1112 series of ThermoFinnigan) at Sophisticated Analytical Instrument Facility(SAIF), IIT Bombay. The organic carbon contents weremeasured on the same instrument on samples pretreatedwith concentrated hydrochloric acid. Generally the atomicH/C ratio is determined from the extracted organic matter,free from the influence of inorganic components, to clas-sify the kerogen and type of organic matter. Here thebulk samples have been used to determine atomic H/Cand S/C ratio. The atomic H/C ratio and S/C ratio of bulksamples has been used to study the depositional environ-ment and depositional trend and to investigate relativeinfluence of the inorganic components on organic matter.Another objective is to develop a database for future ref-erences to compare between the bulk sample H/C ratioand extracted organic matter H/C ratio to better under-stand changes in depositional environment and control theamount and type of organic matter with reference to theinorganic matter. The proximate analysis was carried outat the Central Fuel Research Institute, Nagpur Unit.Sample preparation for X-Ray diffraction analysis wascarried out according to the standard procedure [8] toidentify mineral phases. X-Ray diffraction analysis wascarried out on samples of the lignites and carbonaceousshales, pretreated with H2O2 to remove the effect of or-ganic matter interference as per the standard. The treatedsamples were scanned by a X-ray diffractometer (RigakuGeigerflex, Rigaku Denki Co. Ltd; Japan).Characterization of the dispersed organic matter was per-formed using a Rock-Eval Delsi II pyrolyzer [9]. Smallamounts (∼100 mg) of the powdered rock samples werepyrolysed under an inert He-atmosphere according to aspecific time/temperature program. In this study the CO2
content coming from the cracking of kerogen (S3-peak) isnot taken into consideration because of the early decom-position of carbonate minerals below the CO2 trappingtemperature of 390˚C due to mineral matrix effects. Thisproduces additional CO2, which leads to elevated oxygenindices [10]. The total organic carbon (TOC) contents weremeasured in the same way after removal of the inorganiccarbon with 24% hydrochloric acid.For the palynomorph study a total of 15 samples were pro-cessed in several steps according to standard methods [11].Accordingly, samples were treated with HCl to removecarbonates, HF to remove silicates, Schulze’s solution foroxidation, and KOH to remove humic substances. Sampleswere considered representative if counts are above 70–100
specimens [12]. The samples having palynomorphs above100 grains have been counted and used for the quantita-tive study and remaining samples have been used quali-tatively.
4. Results and DiscussionThe results of ultimate, proximate, X-ray diffraction androck-eval pyrolysis results are shown in the Table 1. Thebulk geochemical analysis results were plotted with thestudied lithologic section as shown in the Figure 3. Theresults of the hydrogen index and Tmax were plotted tocharacterize the type of organic matter in the lignite andcarbonaceous shales with their state of maturation (Fig-ure 4). Results from the organic carbon (Corg) and ele-mental hydrogen of bulk samples from CHNSO analyzerwith TOC and hydrogen index of bulk samples from LECOanalyzer and Rock-eval analysis were correlated (Table 1;Figure 5A, B). Stratigraphic distribution of palynofossilsfrom the carbonaceous shales and lignites of Panandhrohas been shown in Table 2, and the quantitative palyno-logical result based on some selected samples is shownin Figure 6.
4.1. Geochemistry
The lower carbonaceous shale is 1.2 meter thick (sam-ples O and N), black in colour and directly overlies theDeccan Trap succession. The samples from this lower car-bonaceous shale contain organic carbon (18.1% to 18.9%),hydrogen (3.1% to 3.3%), sulfur (4.9% to 5.5%), H/C (2.07 to2.1), S/C (0.098 to 0.115), volatile matter (26.4% to 27.7%),and ash (46.2% to 47.7%) (Table 1). The minerals presentin lower carbonaceous shale are clay minerals, pyrite andquartz (Table 1).Atomic S/C ratio increases towards the upper part of thelower carbonaceous shale indicating an inverse relation-ship between the organic carbon and sulfur (Table 1). Thisindicates that sulfur is not related to the organic car-bon. The occurrence of pyrite further corroborates it. Thehigher ash content [3], which represents inorganic compo-nent, and the lower volatile matter content in the samplesindicate relatively higher accommodation space conditionsduring the deposition of the lower carbonaceous shale.The hydrogen content in the studied samples of the lowercarbonaceous shale is comparatively low (Table 1). Thisindicates organic matter with a low hydrogen content. Thefrequency of sulfur, pyrite [3, 13] and atomic S/C ratio in-dicates brackish or marine influence. The palynologicaldata containing foraminiferal linings and mangrove pol-lens [12] further supports this interpretation (Table 2).
14

Vinay K. Sahay
Table 1. Ultimate, Proximate, X-ray Diffraction and Rock-Eval pyrolysis results of lignites and carbonaceous shales of Panandhro Mine.
Lith
olog
y
Sam
ple
No.
Thic
knes
s(m
)
o Cor
g%
o Hyd
roge
n%
o Tot
alSu
lfur%
Atom
icH
/C
Atom
icS/
C
o Ash
%
o Vol
atile
mat
ter%
←− More Abundant Less Abundant −→ TOC
%
S1(m
g/g
rock
)
S2(m
g/g
rock
)
PIS
1/(S
1+S2
)
HI (
mg
/gTO
C)
Tmax
cor.
(˚C)
S1+
S2(m
gH
C/g
rock
)
Bitu
men
Inde
x(B
I=10
0*S1
/TO
C)m
gH
C/g
TOC
Qua
lity
Inde
x(Q
I=10
0*(S
1+S2
)/TO
Cm
gH
C/g
TOC
Carb. ShaleA 9 6.7 2.4 0.1 4.37 0.007 69.3 21.8 Smectite-Kaolinite Siderite Quartz - 9.17 0.35 12.66 0.03 138 428 13.01 3.81 141.87B 8.4 6.9 2.3 0.1 4.03 0.009 68.2 21.6 Smectite-Kaolinite Siderite Quartz - 10.42 0.43 15.66 0.03 150 429 16.09 4.12 154.41C 7.9 9.6 2.5 - 3.2 - 66.2 22.6 Smectite-Kaolinite Siderite Quartz - 11.78 0.54 19.47 0.03 165 429 20.01 4.58 169.86
LigniteD 7.4 26.4 4.7 1 2.13 0.015 8.9 47.4 Kaolinite Anatase Quartz Feldspar 55.73 8.53 146.56 0.05 263 417 155.09 15.30 278.28E 6.7 45.6 4.2 1.2 1.12 0.01 8.5 40.1 Smectite-Kaolinite Anatase Calcite - 54.19 6.81 108.17 0.06 200 415 114.98 12.56 212.17F 5.9 27.5 4.3 0.2 1.88 0.004 9.2 39.2 Kaolinite - - - 53.71 6.04 105.75 0.05 197 417 111.7 11.24 208.13
Carb. Shale G 5.1 8.5 2.4 4.2 3.41 0.186 61.3 22.6 Kaolinite Pyrite Calcite - 20.01 4.56 60.57 0.07 303 409 65.13 22.78 325.48H 4.8 8.8 2.7 3.3 3.69 0.14 60.4 23.2 Kaolinite Pyrite Sphalerite Quartz 13.29 1.84 15.77 0.10 119 407 17.61 13.84 132.50
Lignite
I 4.5 20.1 3.7 1.1 2.28 0.021 17.2 39.3 Kaolinite Chlorite Pyrite - 53.83 14.21 160.40 0.08 298 411 174.61 26.39 324.37J 3.8 44.3 4.2 3.4 1.15 0.029 16.4 36.1 Smectite-Kaolinite Chlorite Pyrite Calcite 48.60 5.18 82.13 0.06 169 415 87.31 10.65 179.65K 3.1 16.7 3.3 0.7 2.43 0.016 11.2 41.5 Kaolinite Baryte - - 57.90 13.86 190.87 0.07 330 415 204.73 23.93 353.59L 2.4 27.4 3.6 3.9 1.58 0.054 33.6 33.8 Smectite-Kaolinite - - - 35.25 4.90 61.95 0.07 176 415 66.85 13.90 189.64M 1.7 29.9 4.5 0.9 1.81 0.012 9.2 41 Smectite-Kaolinite - - - 44.80 8.03 115.99 0.06 259 418 124.02 17.92 276.83
Carb. Shale N 1.0 18.1 3.1 5.5 2.07 0.115 47.7 26.4 Kaolinite Pyrite Aragonite - 19.64 1.96 20.97 0.09 107 411 22.93 9.97 116.75O 0.5 18.9 3.3 4.9 2.1 0.098 46.2 27.7 Kaolinite Smectite-kaolinite Pyrite Quartz 20.46 1.78 16.08 0.10 79 405 17.83 8.69 87.29
N.B. Corg%- Organic Carbon, oAir dry basis, TOC%-Total organic carbon, PI-Production Index, HI- Hydrogen Index, S1+S2- Total genetic potential
Figure 3. Plot of lithology, organic carbon, hydrogen, total sulfur, ash, atomic H/C, S/C ratio and volatile matter with depth.
15

The hydrocarbon potential, thermal maturity, sequence stratigraphic setting and depositional palaeoenvironment of carbonaceous shale and lignitesuccessions of Panandhro, northwestern Kutch Basin, Gujarat, Western India
Table 2. Stratigraphic distribution of palynofossils from carbonaceous shales and lignites of Panandhro.
Lith
olog
y
Sam
ple
No.
Thic
knes
s(m
)
Prox
aper
tites
spp.
Tric
olpi
tes
sp.
Pseu
dono
thof
agid
ites
kutc
hens
isLo
ngap
ertit
essp
.Fu
ngal
spor
esPa
lmid
ites
sp.
Inap
ertu
rate
polle
nsp
.La
evig
atos
porit
essp
.N
eoco
uper
ipol
lisac
hina
tus
Cupr
ifero
idae
polle
nite
ssp
.Po
lypo
diis
porit
essp
.Po
lypo
diac
eois
porit
esp
.Sc
hiza
eois
porit
essp
.Ti
liapo
lleni
tes
sp.
Mon
osul
cite
ssp
.Ec
him
onoc
olpi
tes
sp.
Cyat
hidi
tes
sp.
Palm
aepo
lleni
teov
atus
Tric
olpo
rite
sp.
Iugo
polli
ssp
.Li
liaci
dite
ssp
.Rh
oipi
tes
sp.
Pseu
dono
thof
agid
ites
sp.
Cica
trico
sisp
orite
ssp
.D
icol
popo
llis
sp.
Psilo
dipo
rite
sp.
Spin
izon
ocol
pite
sba
cula
tus
Pinu
spol
leni
tes
sp.
Mar
goco
lpor
ites
sp.
Tric
olpo
ropo
lleni
tes
sp.
P rot
eaci
dite
ssp
.En
gelh
ardt
iodi
tes
sp.
T rio
rites
sp.
Spin
izon
ocol
pite
sec
hina
tus
Retit
ricol
pite
ssp
.Fo
ram
inife
ralin
ings
Carb. ShaleA 9 • • • • • • • • • • • • •B 8.4 • • • • • • • • • • •C 7.9 • • • • • • • • • •
LigniteD 7.4 •E 6.7 •F 5.9 • • • • • • • • •
Carb. Shale G 5.1 • • • • • •H 4.8 • • • • • • • • • •
Lignite
I 4.5 • • • • • •J 3.8 • •K 3.1 • • • • • • • • •L 2.4 • • • • • • • • • • • • •M 1.7 • • • • • • •
Carb. Shale N 1.0 • • • • • •O 0.5 • • • • • • • •
The lower lignite is 3.4 meters thick (samples M, L, K,J and I) and overlies the lower carbonaceous shale. Thislower lignite unit contains organic carbon (16.7% to 44.3%),hydrogen (3.3% to 4.5%), sulfur (0.7% to 3.4%), H/C (1.15to 2.43), S/C (0.012 to 0.054), volatile matter (33.8% to41.5%), and ash (9.2% to 33.6%) (Table 1). The mineralscomprising this lower lignite are clay minerals, chlorite,pyrite, barite, aragonite and calcite (Table 1).
The relatively lower ash and higher volatile matter con-tent in the samples indicate lower accommodation spaceconditions during the deposition of the lower lignite. Inthis lignite the geochemical parameters does not show anytrend with respect to their organic carbon, sulfur, hydro-gen, ash, and volatile matter contents (Table 1). Theseindicate fluctuating accommodation space during deposi-tion. The higher sulfur content, ash [3, 13] and mangrovepollen in the sample L indicates brackish or marine influ-ence in the mire (Table 1 and 2). Coals that are coveredby marine clastic rocks are rich in sulfur [3, 13].
The middle carbonaceous shale (0.6 m thick, samples Hand G) shows a very similar trend to the lower carbona-ceous shale. This middle carbonaceous shale unit con-tains the organic carbon (8.5% to 8.8%), hydrogen (2.4% to2.7%), sulfur (3.3% to 4.2%), H/C (3.41 to 3.69), S/C (0.14 to0.186), volatile matter (22.6% to 23.2%), and ash (60.4% to61.3%) (Table 1). This unit contains clay minerals, pyrite,calcite, sphalerite and quartz (Table 1).
The comparatively higher ash content and lower volatile
matter content indicate higher accommodation space con-ditions during the deposition of the middle carbonaceousshale. The accommodation space was comparatively sta-ble as shown by less variability in the content of ash andvolatile matter (Table 1). The sulfur content, pyrite [3, 13]and atomic S/C ratio indicates brackish or marine influ-ence. The palynological data containing mangroves pol-lens [12] further corroborate this interpretation (Table 2;Figure 6).
The upper lignite unit is 2.4 meters in thickness Figure 3).This unit contains the organic carbon (26.4% to 45.6%),hydrogen (4.2% to 4.7%), sulfur (0.2% to 1%), H/C (1.12to 2.13), S/C (0.004 to 0.015), volatile matter (39.2% to47.4%), and ash (8.5% to 9.2%) (Table 1). The upper lig-nite samples contain clay group minerals, anatase, calcite,quartz, and feldspar (Table 1).
The comparatively lower ash content and the highervolatile matter content in the studied samples suggestlower accommodation space condition during the depo-sition of the upper lignite (Table 1). These values alsosuggest relatively stable accommodation space conditions.The higher hydrogen content of the upper lignite samplesindicates hydrogen rich organic matter.
The upper carbonaceous shale is brown in colour and1.6 meters in thickness (samples C, B and A). The samplesfrom this upper carbonaceous shale contains organic car-bon (6.7% to 9.6%), hydrogen (2.3% to 2.5%), sulfur (0.1%),H/C (3.2 to 4.37), S/C (0.007 to 0.009), volatile matter
16

Vinay K. Sahay
Figure 4. A plot of HI versus Tmax from Rock-Eval pyrolysis show-ing position of analyzed samples (after Espitalie et al.1977 [9]).
Figure 5. (A)Plot of TOC content and Hydrogen Index (B) Plot oforganic carbon and hydrogen.
Figure 6. Percentage diagram of the major palynomorphs and eco-logic groups present in the studied samples. The resultsshown are of some selected samples. For lithological de-tails refer Figure 4.
(21.6% to 22.6%), and ash (66.2% to 69.3%) (Table 1). Theupper carbonaceous shale contains clay minerals, sideriteand quartz (Table 1).The comparatively higher ash and lower volatile mattercontent suggest higher accommodation space conditionduring the deposition of the upper carbonaceous shale.The presence of siderite, low sulfur and S/C ratio in theupper carbonaceous shale samples indicates freshwateraccommodation medium (Table 1). The palynological datashowing the presence of fern palynomorphs further sup-port this (Figure 6). The presence of quartz in the uppercarbonaceous shale suggests terrestrial influence.
4.2. Source Rock Potential
Total organic carbon (TOC wt. %) is a measure of the or-ganic carbon in a rock, expressed as weight percent, usedas fundamental parameter in classifying source rocks inconjunction with kerogen type and maturation [14]. TOCcontent of the lignite and carbonaceous shales is between9.17 and 57.90% (Table 1). These values indicate verygood source rock potential [15]. But TOC content alonecan not be taken as only indicator of source rock poten-tial. The hydrogen content, thermal maturity, thicknessand areal extent of the source rock are also an importantfactor in the investigation of the source rock potential.S1 hydrocarbons are the free hydrocarbons thermally lib-erated at 300oC. S1 values of Panandhro lignites andcarbonaceous shales are minimum 0.35 and maximum14.21 mg HC/g rock (Table 1). These hydrocarbon yieldsindicate weak to good source rock potential [15].The Bitumen Index (BI) [16] and Quality Index (QI) [17]
17
The hydrocarbon potential, thermal maturity, sequence stratigraphic setting and depositional palaeoenvironment of carbonaceous shale and lignitesuccessions of Panandhro, northwestern Kutch Basin, Gujarat, Western India
were determined further to evaluate the results (Table 1).The carbonaceous shales have BI values in the range 3.81-22.78 mg HC/g TOC, and the lignites have BI valuesin the range 10.65-26.39 mg HC/g TOC. The carbona-ceous shales have shown QI values in the range 87.29-325.48 mg HC/g TOC, and the lignites have QI values of179.65-353.59 mg HC/g TOC. The bitumen index resultsindicate that the lignites have generated comparativelyhigher bitumen like substances than the carbonaceousshales. The quality index (QI) values are higher thanthe bitumen index (BI) values. The correlation of QI withthe S2 values further suggests good source rock poten-tial. The S2 hydrocarbons are cracked from the kerogenby heating to 550oC. The S2 hydrocarbon values from thePanandhro lignites and carbonaceous shales are between12.66 and 190.87 mg HC/g rock (Table 1). S2 hydrocar-bon values suggest good source rock potential [15]. Thetotal genetic potential (S1+S2) values of all samples arehigher than 10 mg HC/g rock (Table 1). These valuesindicate very good source rock potential [18].
Sykes and Snowdon (2002) [19] and Petersen (2006) [20]studied a data set from humic coals respectively from Ter-tiary of New Zealand and from worldwide Cenozoic, Juras-sic, Permian and Carboniferous coals. Sykes and Snow-don (2002) [19] based on plots of hydrogen index (HI)against Rank (Sr) and Tmax , inferred that as coals maturetowards oil expulsion, their apparent potential to gener-ate hydrocarbons (S2) increases. This results an increasein HI from Rank (Sr∼4, Tmax ∼400-420oC, Ro∼0.35-0.4%) to a peak near the onset of oil expulsion at Rank(Sr∼11.12.5, Tmax ∼430-440oC, Ro∼0.65-0.85%).
The samples from Panandhro mine are similar with theNew Zealand coal band category [19]; where as the sam-ples with the highest HI and TOC are similar with theworldwide data set [20]. Sykes and Snowdon (2002) [19]attributed the increase in HI to the re-incorporation ofhydrogen rich, volatile components into coal. This in-terpretation underestimates the variability in the maceralcomposition of coals and their relative thermal reactiv-ity, and hydrocarbon generation kinetics of the maceralsand maceral groups, and kerogen. It is important to notethat above discussed rank zone (Rm∼0.5%) also marks thefirst coalification jump of liptinites, during which alterationof lipid constituents begins [21]. The liptinite maceralsare rich in hydrogen and volatile matter contents. Bailey(1981) [22] showed that during the organic matter mat-uration sapropelic kerogen releases hydrocarbons faster,more completely at lower levels of maturity than humickerogen. Hunt (1996) [18] observed that the type II kero-gen is more reactive and requires less activation energythan the type III kerogen. Therefore, during the thermalmaturation of organic matter, Type II kerogen is the first to
react and generate hydrocarbons. The type II kerogen issapropelic and represents the sporinite, resinite, cutiniteand liptodetrinite of the liptinite group macerals, where asthe marine plankton, and lacustrinealginite is consideredas a type I kerogen. The type III kerogen is humic andrepresents the vitrinite and inertinite group macerals [23].Tertiary coals usually have some fractions of the liptinitegroup macerals in variable amount along with the vitriniteand inertinite group macerals. These liptinite maceralsrepresent the sapropelic and type II kerogen fraction incoals. So the hydrogen index (HI) increase as observedby Sykes and Snowdon (2002) [19] is not apparent, buttrue and natural. The HI increase in the studied samplesis due to the early generation kinetics of these sapropelicand type II fractions (liptinite group macerals-sporinite,resinite, cutinite and liptodetrinite) present in coals, pe-culiarly in the case of the Panandhro lignite that contains17% liptinite and can be considered a tertiary equivalentto a Carboniferous cannel coal [24].
The relationship between the results of TOC and hydrogenindex (HI) from Rock-Eval Pyrolysis analysis and betweenorganic carbon and element hydrogen from CHNSO ana-lyzer has been compared (Figure 5A, B). The result fromboth analyses has shown the broad similarity betweenhigher TOC versus hydrogen index, and organic carbonversus elemental hydrogen. In both results the higherorganic carbon content samples have higher hydrogen in-dex and hydrogen values. This indicates that in general,organic matter with higher TOCs has higher hydrogencontent. This relationship has been also observed in theLower Permian bituminous coal samples of Wardha Valleycoalfields [25]. This relationship is due to a certain fixedcarbon to hydrogen ratio of each basic molecular buildingblock like carbohydrates, proteins, lignin and lipids whichforms the organic matters. Due to this as carbon contentis increases the content of hydrogen also increases.
Plot of results of hydrogen index with volatile matter con-tent of the studied samples of lignites and carbonaceousshales indicates a broad relationship (Figure 7). Highervolatile matter content samples have shown the relativelyhigher hydrogen index (Figure 7). This indicates that thesamples are relatively rich in liptinite macerals, whichhave higher volatile matter content. On the contrary, sul-fur and TOC have shown a broad inverse relationship.Higher TOC contents samples have shown the lower sulfurcontent and vice-versa (Figure 8). This indicates that sul-fur content in those samples is not related to the organicmatter and is external in origin. Higher sulfur content withhigher ash in carbonaceous shale indicates saline water(marine) control on sulfur formation as discussed earlier.The occurrences of pyrite (Table 1) further corroborate thisinference that these sulfurs are inorganic.
18

Vinay K. Sahay
Figure 7. Hydrogen Index versus Volatile Matter.
Figure 8. Sulfur versus TOC.
A plot of the TOC content, free hydrocarbons (S1), andcracked hydrocarbons (S2) is shown in Figure 9. S1 iscomparatively low in all lignite and carbonaceous shalesamples. S1 values show slight increase with increasedTOC content (Figure 9). This indicates relatively morerelease or presence of free hydrocarbons (S1) in the an-alyzed samples with higher TOC values. S2 (cracked hy-drocarbons from kerogen) indicates increasing trend withincreasing TOC contents of the lignite and carbonaceousshale samples (Figure 9).A plot of the Tmax
oC, free hydrocarbons (S1), and crackedhydrocarbons (S2) is shown in Figure 10. S1 values do notshow any variability with the Tmax values (Figure 10). Themajority of the studied samples of lignite and carbona-ceous shale indicate maximum generation of S2 (crackedfrom kerogen) hydrocarbons between 410 and 420oC (Fig-ure 10).
Figure 9. Plot of TOC versus S1 and S2 (mg/g rock).
Figure 10. Plot of TmaxoC versus S1 and S2 (mg/g rock).
19

The hydrocarbon potential, thermal maturity, sequence stratigraphic setting and depositional palaeoenvironment of carbonaceous shale and lignitesuccessions of Panandhro, northwestern Kutch Basin, Gujarat, Western India
A plot of results of Tmax with HI and S2 values (Figure 11)of lignites and carbonaceous shales suggest that higherS2 (cracked from kerogen) hydrocarbons are associatedwith higher hydrogen index values between Tmax valuesof 410oC and 420oC (Figure 11). This indicates and cor-roborates earlier assumptions [18] that higher hydrogencontent organic matter generates relatively more hydro-carbons.Lower amount of S1 (free hydrocarbons) in the studiedsamples indicates that organic matter is thermally imma-ture, as with increasing thermal maturity, S1 (free) hy-drocarbons increase and S2 (cracked) hydrocarbons de-crease [18] (Figure 12).
Figure 11. Plot of Tmax versus HI and S2.
Figure 12. Plot of Cracked hydrocarbons (S2) with Ash% andTOC%.
Correlation of the cracked hydrocarbons (S2) (Figure 12)with ash% and TOC% indicates a positive relationship be-tween S2 and TOC, while a negative relationship betweenS2 and ash content. As the ash content, which repre-sents inorganic components, is increasing, the amounts ofcracked hydrocarbons (S2) are decreasing (Figure 12).
4.3. Type of organic matter
The plot of hydrogen index and Tmax indicates that onlythree samples (samples H, N and O) from the middle andlower carbonaceous shales were found to contain Type IIIkerogen organic matter, which has the potential to gener-ate gas and condensate (Table 1, Figure 4). Seven sam-ples from upper carbonaceous shale and lignites are lo-cated at the transition between Type III and Type II kero-gen organic matter which has potential to generate moreoil and gas comparatively than three samples of type IIIkerogen. Five samples from the lignites and middle car-bonaceous shale were found to contain Type II kerogenorganic matter, which has the potential to generate bothoil and gas (Figure 4). The Panandhro lignites containan average 80% huminite macerals, 17% liptinite maceralsand 3% inertinite group macerals [1]. Coals having lip-tinite content above 15% have the potential to generateand release oil as well as gas [18]. The correlation be-tween the liptinite content and the hydrogen index valuesindicates that the type II kerogen is due to enrichment ofthese 17% liptinite macerals. This also indicates that ina source rock study, based on only maceral, enrichmentof the liptinite macerals above 15% can be considered asa type II kerogen which has potential to generate oil aswell as gas.
4.4. Thermal Maturity
Even though the source rocks possess adequate total or-ganic content and suitable kerogen type, they cannot gen-erate oil or gas without sufficient a time interval or depthof burial or thermal exposure. Maturity is a measure ofthe time-temperature history experienced by the organicmatter. Thermal maturity of the organic matter has beendetermined by Tmax values with its calibrated vitrinite re-flectance curve, Production Index (PI) and Thermal Alter-ation Index (TAI).A low value of Tmax (<430oC) and PI (<0.1) from the stud-ied lignite and carbonaceous shale samples indicates thatorganic matter is immature and in the diagenesis stageof organic matter transformation [18]. Tmax values arebetween 405 to 429oC and Production Index (PI) valuesare between 0.03 to 0.1 (Figure 4, Table 1). These val-ues indicate that all the organic matter is immature and
20

Vinay K. Sahay
in the diagenesis stage of organic matter transformation.Thermal Alteration Index, based on the colour of the paly-nomorphs, has proved to be a rapid and reliable techniqueto measure thermal maturity of organic matter. Gener-ally, these colour changes are from colourless, yellow toorange to brown to black, with increasing thermal matu-rity [18]. The TAI scale of Staplin [18], which is from 1to 5, has been used to investigate the maturity level ofthe organic matter. Evaluation of colour of palynomorphsindicates TAI values between 1 and 2. These TAI val-ues also indicate immaturity of the organic matter. Thecalibrated vitrinite reflectance value is below 0.5% (R0)(Figure 4). Singh (2002) [26] has reported the maturityof Panandhro lignites with average R0max values between0.39% and 0.40%, which also indicates the immature stateof organic matter. All these values suggest towards thethermally immature organic matter in the studied samples.The effective oil window would begin at R0 equal to 0.65for Tertiary H-rich coal after Petersen (2006) [20].
4.5. Hydrocarbon potential of Kutch Basin
Source rock studies have been conducted, by the Direc-torate General of hydrocarbons [27] on samples from on-land wells Banni-2, Nirona-1, Lakhpat-1, Suthri-1 andthe offshore wells in Kutch Basin. The geochemical dataof outcrop samples and onland wells indicate that Up-per Jurassic to Lower Cretaceous stratigraphic units, inthe western onland part of the basin, contain good sourcerocks with TOC as high as 10% and Tmax suggesting ade-quate maturity. The organic matter is of type II and III. Theproductivity index of the Mesozoic outcrop samples indi-cates migrated hydrocarbons. The outcrop samples fromthe western onland part of the basin indicate that Eoceneand Oligocene sediments contain type III and type II mixedKerogens with TOC ranging from 0.54% to 3.45% [27].Geochemical data from the offshore wells reveal that fairoil-prone and mature source rocks are present in the shaleunits of Upper Cretaceous and Paleocene sequences in theeastern offshore part of the basin. Studies on subsidencehistory, temperature and thermal maturation indicate thatoil generation in these sequences began relatively re-cently, i.e. around 5-10 Ma (Late Miocene). Eocene shalewith adequate TOC and mature, type II and III organicmatter started generating hydrocarbons around 8 Ma inthe region of the Kori-Comorin depression and the Kori-Comorin ridge. This sequence is presently in peak oilgeneration phase [27]. Oil-source correlation indicates aclose similarity between the oil of KD structure and theextracts from Eocene sediments of well GKH-1 suggestingthat the Kori-Comorin depression and the deep depressionin the region between structures KI and KD form effective
charge areas. The oil pool of KD structure, the gas poolsof GK-29A and GK-22C structures, and mild bubbling ofcombustible gas containing C1 to C6 components duringtesting a limestone reservoir of Middle-Late Jurassic age(Jumara Formation) in the onland well Lakhpat-1, confirmthe generation of hydrocarbons in the Kutch Basin [27].The gas pools were struck in GK-29A and GK-22C struc-tures in sandstone reservoirs of Paleocene and Late Cre-taceous age respectively, whereas oil was struck in KDstructure in Middle Eocene limestone and siltstone reser-voirs [27].These data on comparison with Panandhro lignite andshale data suggest that Eocene equivalent offshore or-ganic rocks have in the catagenesis stage may be due toenough geothermal exposure with relatively deeper depthof burial, but Panandhro lignite and shale have not expe-rienced enough geothermal heat, may be due to shallowburial depth, and are still in the immature stage. This datamay be further useful to define the optimum burial depthof various source rocks and favorable geothermal condi-tion, in Kutch Basin, for finding the generated/generatingsource rocks and tracking the migration pathway of gen-erated hydrocarbons to a reservoir.
4.6. Palynology
The quantitative palynological result of the major palyno-fossil groups (spores, pollens, fungal spores, foraminiferalinings) shows that pollen palynofossils are the dominantgroup present in all the samples of lignites and carbona-ceous shales, except in sample F of lignite where it iscomparatively less than the fungal spore component (Fig-ure 6). Next to pollen, spore palynofossils are the nextdominant group present in the studied samples of lignitesand carbonaceous shales. In samples F of lignite and N ofcarbonaceous shale spore amounts are comparatively lessthan the amounts of fungal spore. In sample N of carbona-ceous shale, foraminiferal linings are the dominant groupnext to the pollen group (Figure 6).Poumot (1989) [28] introduced the concept of a pollen cy-cle, which he connected to changes in sea level oscil-lations and showed that eustatic and climate cycles areclosely related and so variation in coastal plant commu-nities can be followed through plant assemblages. Thisecological palynology approach is based on the conceptof Poumot, but it also includes other groups, based on theecological approach of Rull (1998) [29]. The inclusion ofother ecological palynomorphs in the investigation helpsfurther to get more detailed information on the palaeofloraof any region and the mutual influence of palaeofloralgroups, climate, and depositional trend on each other. Theecological palynomorphs (mangroves, ferns, palms, forests,
21

The hydrocarbon potential, thermal maturity, sequence stratigraphic setting and depositional palaeoenvironment of carbonaceous shale and lignitesuccessions of Panandhro, northwestern Kutch Basin, Gujarat, Western India
montane and unknown) have been used, in this study, toinvestigate their cyclic response to facies change. Ecolog-ical and botanical grouping of all species and genus arebased on the works of Mandaokar (2000, 2002) [30, 31],Samant and Tapaswi (2001) [32], Ramanujam (1987) [33],Thanikaimoni et al. (1984) [34], Graham (1998) [35], Ger-meraad et al. (1968) [12], Muller (1968) [36], De Villiersand Cadman (2001) [37] and Hoorn (1994) [38] (Table 3).
4.7. Depositional palaeoenvironment
The palynological and geochemical characteristic of thelower carbonaceous shale indicates that during the LatePaleocene relative sea level was higher. This is evidentby occurrence of foraminiferal linings, Spinizonocolpitessp., higher sulfur content and pyrite (Tables 1, 2; Fig-ure 6). This indicates that lower carbonaceous shale wasdeposited in a brackish-mangrove environment [12]. Later,sea level decreased, creating a favorable depositional en-vironment for growth of flora and vegetation and its depo-sition leading to the formation of the lower lignite. Sealevel was fluctuating as evidenced by presence of Spini-zonocolpites sp., higher ash, and sulfur in the middle ofthe lower lignite sample (Tables 1, 2; Figure 6). Higheramount of fern spores indicates its deposition in a freshwa-ter swamp with intermittent sea water influx in the swamp.Middle carbonaceous shale deposited in brackish-backmangrove depositional environment [12]. This is evidentby absence of foraminiferal linings, presence of Spini-zonocolpites sp., higher ash, sulfur and lower amount offern spores (Tables 1, 2; Figure 6). The upper lignitewas deposited in a freshwater swamp free from marine in-fluence as indicated by absence of foraminiferal linings,mangrove pollens and higher amount of fern spores. Theupper carbonaceous shale was deposited during terres-trial flooding of freshwater in the mire as indicated by theabsence of foraminiferal linings, mangrove pollens, andhigher ash along with predominant siderite mineral andhigher amount of fern spores (Tables 1, 2; Figure 6). Ear-lier, Stach et al. (1982) [3] reported the Miocene browncoal swamps of central Germany and the Pennsylvaniancoals in the eastern and central United States as marineregressive coals. Pasley et al. (1991) [39] showed thatthe transgressive organic sediments have higher TOC andhydrogen in their organic matter compared with the re-gressive organic sediments. Our results indicate that theregressive organic sediments (lignites) have higher TOC,hydrogen index and liptinite macerals content comparedwith the transgressive organic sediments (carbonaceousshales). Thus, regressive cycles can also deposit goodsource rock.
4.8. Sequence stratigraphyThe workers of the Exxon research facility developedsequence stratigraphy from seismic stratigraphy in the1970s [40]. The basic unit in sequence stratigraphy is thedepositional sequence. Decreasing water depth triggersformation of the sequence boundaries. Thus, accommoda-tion space in which sediments are deposited is controlledby the interplay of tectonics, sea level, sediment supplyand climate. Coals generally have an in situ origin. Soin coal sequence stratigraphy, instead of sediment supply,the rate of peat accumulation is the factor, along with tec-tonics, sea level and climate, which control the creation ofaccommodation space.For peat forming mires, the base level is very specificallythe ground water table [41]. In coastal regions, the groundwater table is related to sea level. Peat accumulationbegins only after decreases in relative sea level reach arate that is in equilibrium with the growth rate of plantmaterial [4].High-frequency changes in the balance between accom-modation and peat production in the peat window shouldresult in changes in the nature of the coaly rocks thatare deposited. Higher accommodation rates should giverise to coaly shales and shaly coals with inorganic min-eral contents in excess of 30%, as rapidly rising base levelprovides a mechanism for the transport of waterborne, de-trital minerals into the mire [42]. Lower accommodationrates should result in the formation of limnotelmatic andombrotrophic coal, with mineral content below 30 and 10%,respectively. An upward increase in mineral content (wet-ting upward successions) indicates an increasing accom-modation rate. An upward decrease in mineral content(drying-upward successions) indicates a decreasing ac-commodation rate [43]. Though ash content is not equiva-lent to bulk mineral matter, it can be used instead of for-mula based determination of bulk mineral matter, whichtakes into account the loss of hydration of minerals, car-bon dioxide and sulfur dioxide. These losses are variablein different types of coal, which are comprised of differenttypes of macerals and contain different mineral assem-blages. So it is useful in general, but specifically it canoveremphasize or underemphasize the mineral matter con-tent. In this study the ash content (ad basis) is used toinfer the trends in accommodation change and mire set-tings. The ash content below 10% and 30% respectivelyhas been used, instead of mineral matter to distinguishbetween the ombrotrophic and limnotelmatic type of coalmires.The geochemistry of coal is a sum of its organic and inor-ganic components, and so the geochemical data may alsocontain the imprints of the depositional conditions, de-positional trend as well as the depositional environment.
22

Vinay K. Sahay
Table 3. Palynofloras with their botanical and ecological affinity.
Genus/Species Authors Botanical/Biological Affinity and Ecological group
Laevigatosporites sp. Ibrahim, 1933 Polypodiaceae (Fern)Polypodiisporites sp. Potonie, 1934 Polypodiaceae (Fern)Cicatricosisporites sp. Thomson and Pflug, 1953 Schizaeaceae (Fern)Schizaeoisporites sp. Potonie, 1951 Schizaeaceae (Fern)
Polypodiaceoisporites sp. Thiergart, 1940 Polypodiaceae (Fern)Cyathidites sp. Couper, 1953 Cyatheaceae (Fern)
Pinuspollenites sp. Raatz, 1937 Pinaceae (Montane)Inaperturate pollen sp. Thomson and Pflug, 1953 UnknownEchimonocolpites sp. Van der Hammen and Garcia de Mutis, 1965 Unknown
Liliacidites sp. Couper, 1953 Agavaceae (Unknown)Proxapertites spp. Van der Hammen, 1956 PalmaeLongapertites sp. Von Hoeken Klinkenberg, 1964 Palmae
Spinizonocolpites baculatus Muller, 1968 Nypa (Mangrove)Spinizonocolpites echinatus Muller, 1968 Nypa (Mangrove)
Proteacidites sp. Cookson ex. Couper, 1953 Proteaceae (Montane)Triorites sp. Eardtman ex. Cookson, 1950 Unknown
Tricolpites sp. (Eardtman) Potonie, 1959 UnknownRetitricolpites sp. Van der Hammen, 1956 Unknown
Cupuliferoidaepollenites sp. Potonie,Thomson and Thiergart ex.Potonie,1960 UnknownMargocolporites sp. Ramanujam, 1966 Caesalpiniaceae(Forest)
Rhoipites sp. Wodehouse, 1933 Anacardiaceae (Unknown)Tricolporites sp. Cookson, 1947 Unknown
Tiliapollenites sp. Potonie ex. Traverse, 1988 UnknownPsilodiporites sp. Verma and Rawat, 1963 UnknownDicolpopollis sp. Pflanzl ex. Muller, 1968 UnknownMonosulcites sp. Cookson, 1947; ex Couper, 1953 UnknownPalmidites sp. Couper, 1953 Palmae
Pseudonothofagidites spp. Venkatachala and Kar, 1969 UnknownPseudonothofagidites kutchensis Venkatachala and Kar, 1969 Unknown
Neocouperipollis echinatus Kar and Kumar, 1986 PalmaePalmaepollenites ovatus Potonie, 1951 Palmae (Forest)
Iugopollis sp. Venkatachala & Rawat, 1972 Sapotaceae (Forest)Engelhardtiodites sp. Potonie, Thomson and Thiergart, 1950 Juglandaceae (Montane)
Tricolporopollenites sp. Thomson and Pflug, 1953 Moraceae (Unknown)Fungal spores - Fungi Imperfecti
Foraminiferal linings - Foraminifera
The coastal region is most sensitive to the influence of thecontinental and marine processes, therefore it can be usedto study the change of the depositional processes and theirindicators. Such indicators can be gainfully utilized in ter-restrial as well as marine depositional systems. Variousgeochemical and palynological indicators of accommoda-tion change have been summarized in the Table 4. Palmsof the genus Nypa have been observed to be restricted tobrackish front/back-mangrove environments in the humidIndo-Malaysian tropics [12]. Coals that are covered by
marine clastic rocks are rich in sulfur [3, 13].The higher ash content, foraminiferal linings, mangrovepollen, sulfur, hydrogen, H/C, S/Cand relatively lowercontent of volatile matter content has been observed inthe lower carbonaceous shale. These suggest that thedeposition of the lower carbonaceous shale took place ina higher accommodation space condition and a brackishmangrove depositional environment (Tables 1, 2; Figure 6).The lower lignite deposited during relatively a lower ac-commodation space condition and regressive phase in themire as identified by the higher frequency of fern spores
23
The hydrocarbon potential, thermal maturity, sequence stratigraphic setting and depositional palaeoenvironment of carbonaceous shale and lignitesuccessions of Panandhro, northwestern Kutch Basin, Gujarat, Western India
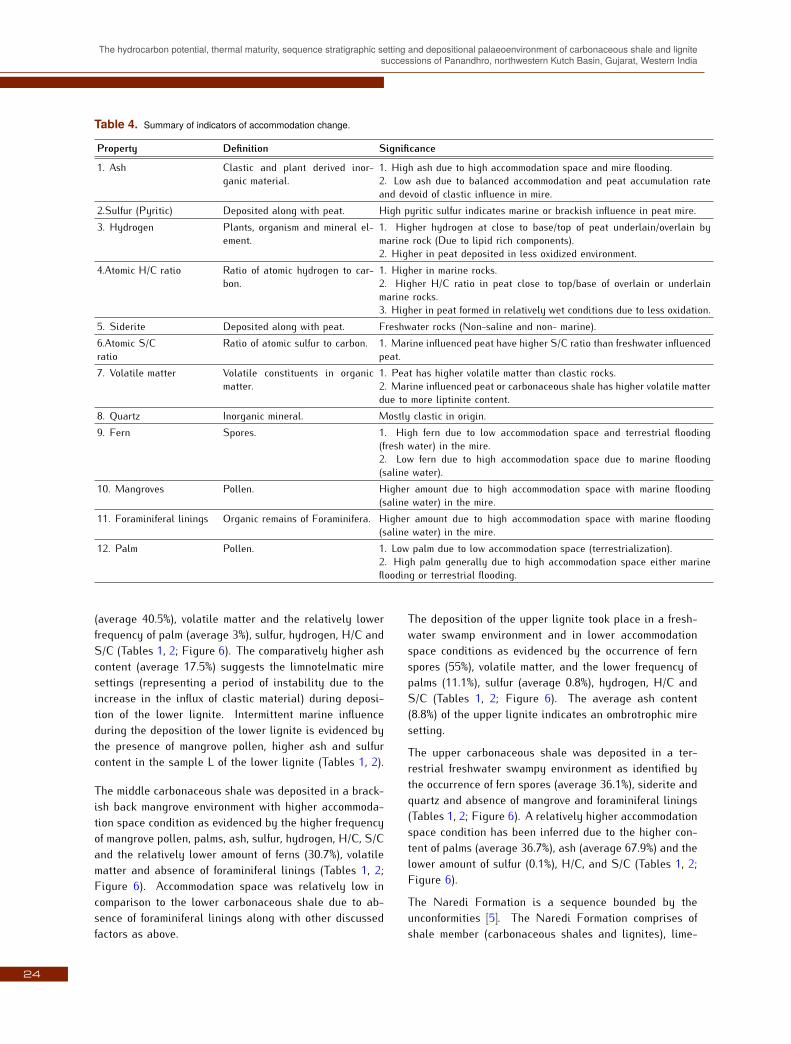
Table 4. Summary of indicators of accommodation change.
Property Definition Significance
1. Ash Clastic and plant derived inor-ganic material.
1. High ash due to high accommodation space and mire flooding.2. Low ash due to balanced accommodation and peat accumulation rateand devoid of clastic influence in mire.
2.Sulfur (Pyritic) Deposited along with peat. High pyritic sulfur indicates marine or brackish influence in peat mire.3. Hydrogen Plants, organism and mineral el-
ement.1. Higher hydrogen at close to base/top of peat underlain/overlain bymarine rock (Due to lipid rich components).2. Higher in peat deposited in less oxidized environment.
4.Atomic H/C ratio Ratio of atomic hydrogen to car-bon.
1. Higher in marine rocks.2. Higher H/C ratio in peat close to top/base of overlain or underlainmarine rocks.3. Higher in peat formed in relatively wet conditions due to less oxidation.
5. Siderite Deposited along with peat. Freshwater rocks (Non-saline and non- marine).6.Atomic S/Cratio
Ratio of atomic sulfur to carbon. 1. Marine influenced peat have higher S/C ratio than freshwater influencedpeat.
7. Volatile matter Volatile constituents in organicmatter.
1. Peat has higher volatile matter than clastic rocks.2. Marine influenced peat or carbonaceous shale has higher volatile matterdue to more liptinite content.
8. Quartz Inorganic mineral. Mostly clastic in origin.9. Fern Spores. 1. High fern due to low accommodation space and terrestrial flooding
(fresh water) in the mire.2. Low fern due to high accommodation space due to marine flooding(saline water).
10. Mangroves Pollen. Higher amount due to high accommodation space with marine flooding(saline water) in the mire.
11. Foraminiferal linings Organic remains of Foraminifera. Higher amount due to high accommodation space with marine flooding(saline water) in the mire.
12. Palm Pollen. 1. Low palm due to low accommodation space (terrestrialization).2. High palm generally due to high accommodation space either marineflooding or terrestrial flooding.
(average 40.5%), volatile matter and the relatively lowerfrequency of palm (average 3%), sulfur, hydrogen, H/C andS/C (Tables 1, 2; Figure 6). The comparatively higher ashcontent (average 17.5%) suggests the limnotelmatic miresettings (representing a period of instability due to theincrease in the influx of clastic material) during deposi-tion of the lower lignite. Intermittent marine influenceduring the deposition of the lower lignite is evidenced bythe presence of mangrove pollen, higher ash and sulfurcontent in the sample L of the lower lignite (Tables 1, 2).
The middle carbonaceous shale was deposited in a brack-ish back mangrove environment with higher accommoda-tion space condition as evidenced by the higher frequencyof mangrove pollen, palms, ash, sulfur, hydrogen, H/C, S/Cand the relatively lower amount of ferns (30.7%), volatilematter and absence of foraminiferal linings (Tables 1, 2;Figure 6). Accommodation space was relatively low incomparison to the lower carbonaceous shale due to ab-sence of foraminiferal linings along with other discussedfactors as above.
The deposition of the upper lignite took place in a fresh-water swamp environment and in lower accommodationspace conditions as evidenced by the occurrence of fernspores (55%), volatile matter, and the lower frequency ofpalms (11.1%), sulfur (average 0.8%), hydrogen, H/C andS/C (Tables 1, 2; Figure 6). The average ash content(8.8%) of the upper lignite indicates an ombrotrophic miresetting.
The upper carbonaceous shale was deposited in a ter-restrial freshwater swampy environment as identified bythe occurrence of fern spores (average 36.1%), siderite andquartz and absence of mangrove and foraminiferal linings(Tables 1, 2; Figure 6). A relatively higher accommodationspace condition has been inferred due to the higher con-tent of palms (average 36.7%), ash (average 67.9%) and thelower amount of sulfur (0.1%), H/C, and S/C (Tables 1, 2;Figure 6).
The Naredi Formation is a sequence bounded by theunconformities [5]. The Naredi Formation comprises ofshale member (carbonaceous shales and lignites), lime-
24

Vinay K. Sahay
stone member and claystone member. The shale member(carbonaceous shale and lignite) was deposited in brack-ish to freshwater (terrestrial) depositional environment asdiscussed in the earlier sub-section. The occurrence ofAssilina spinosa, Lokhartia, Nummulites sp., Globigerinasp., and Globorotalia sp. in middle limestone membersuggests deposition in a shallow marine inner shelf envi-ronment [5]. The upper claystone member was depositedin a regressive phase [5]. The Early Eocene marine trans-gression took place in the region leading to the depo-sition of this middle limestone member. The lower partof transgressive system tract (TST) has been consideredto be the start up phase during which carbonate produc-tion starts after initial flooding event. During the middleto upper part of maximum flooding surface (MFS) of TSTindicates the catch up phase during which carbonate pro-duction tracks rising sea level [44, 45]. Thus, the MFSmarks the level between the catch up of TST and keep upphase of the highstand system tract (HST) of carbonateproduction. During the highstand, the shelf region mayhave become progressively thinned as the rate of forma-tion of accommodation space slows, approaching the latehighstand, leading to deposition of upper ferruginous clay-stone and sequence boundary. The ferruginous claystonein the upper part (above limestone) indicates regression.A red laterite bed caps the sequence and marks the un-conformity [5]. As per the system tract setting, the HST isbounded by MFS at the bottom and unconformities at thetop. The TST is bounded by maximum regressive surface(MRS) at the bottom and MFS at the top. Where as thelowstand system tract (LST) is bounded by the unconfor-mities at the base and MRS at the top [45]. The aboveaspects and the position of the Panandhro carbonaceousshales and lignites in the Naredi Formation (in context ofthe shale member, limestone member and claystone mem-ber) and overall stratigraphic setup of the Naredi For-mation indicates deposition during the lowstand systemtract with many cycles of small magnitude trangressive-regressive phases. The sequence of the Naredi Formationcan be correlated with a global sequence that extendsfrom the uppermost Paleocene to the mid-Eocene [46].
4.9. Use of accommodation space settings incoal mine development and production
Results show that the lower lignite and the upper lig-nite were deposited during a regressive phase in the mire.But, the quality of lower lignite (avg. 2% sulfur and 17.5%ash content) is comparatively low due to deposition influctuating accommodation space conditions (higher clas-tic influence), and the cover of brackish water depositedcarbonaceous shales (marine influence). The quality of
upper lignite (avg. 0.8% sulfur and 8.8% ash content) isrelatively higher due to their deposition in a stable accom-modation space conditions (low clastic influence) and thecover of terrestrial deposited upper carbonaceous shale(low clastic influence and non- marine). Thus, the use ofsequence stratigraphy in coal provides an improved un-derstanding of the coal deposits. The integration of thedepositional trend with the quality parameters of coal de-posits provides a very useful predictive tool in the fieldof coal mining. The simultaneous mining and blending ofthese upper and lower lignites can be used to increasethe overall quality of Panandhro lignites and there by en-hancing the quality and market value of these lignites. Asimilar approach can be used for the whole mines, takinginto account accommodation space setting of each litho-unit in space and time. Thus, an understanding of theaccommodation space setting at each lithological unit canbe very useful in the prediction of the quality of coals,and accordingly the planning, designing, development andproduction of the coal reserves.
4.10. Use of the quantitative ecological paly-nology in the study of coal origin
The lower lignite contains ferns, montane, mangrove,palms and forest ecological palynomorphs in decreasingabundance. However, the upper lignite has fern, andpalms ecological palynomorph groups in decreasing abun-dance (Figure 6). This indicates that the lower lignitehas formed from the more diverse group of the ecologicalpalaeofloras than the upper lignite.Mishra and Navale (1992) [2] have reported the dominantcontribution of the forest palaeofloras in the formation ofthe Panandhro lignites. However, this result does notcorroborate the earlier conclusion. This study indicatesthat, among the above-discussed ecological palynomorphgroups, the ferns have been the dominant contributor inthe formation of Panandhro lignites. Thus, the use ofquantitative ecological palynomorphs provides a relativelyhigh resolution tool in the study of the origin of the coals.
5. ConclusionsThe TOC, Hydrogen Index (HI), S2, bitumen index (BI),quality index (QI), and the total genetic potential (S1+S2)values suggest that the Panandhro lignites and carbona-ceous shale have good source rock potential. The organicmatter in the studied samples of lignite and carbonaceousshale are predominantly of Type II kerogen, which has thepotential to generate both oil and gas. The three sam-ples from the middle and lower carbonaceous shale con-
25
The hydrocarbon potential, thermal maturity, sequence stratigraphic setting and depositional palaeoenvironment of carbonaceous shale and lignitesuccessions of Panandhro, northwestern Kutch Basin, Gujarat, Western India
tain Type III kerogen, which has the potential to generategas. Evaluation of Tmax , production index, thermal alter-ation index values indicates that the organic matter in thelignites and carbonaceous shales is immature, and in thediagenesis stage of organic matter transformation. A rela-tionship between the TOC% content and HI and betweenCorg% and H% suggest that in general, the organic matterwith higher TOC also has higher hydrogen content.
The lower carbonaceous shale was deposited in abrackish-mangrove environment. The lower lignite wasdeposited in a freshwater swamp environment. The higherash content indicates the limnotelmatic mire conditionduring the lower lignite deposition. The middle carbona-ceous shale was deposited in a brackish-back mangroveenvironment. The deposition of the upper lignite tookplace in a freshwater swamp environment. The low ashcontent indicates that ombrotrophic mire setting. The de-position of the upper carbonaceous shale took place in afreshwater swampy environment.
The Panandhro carbonaceous shales and lignites de-posited during the lowstand system tract with many cyclesof small scale trangressive-regressive phases.
Our investigation indicates that the ferns, palms, volatilematter, S/C, H/C, siderite and quartz can be used as anindicator to infer the accommodation change in the coaldepositional system. The understanding of accommoda-tion space settings of coal deposits at each lithologicalunit is useful in the coal mine planning, development andproduction. The quantitative ecological palynology is auseful tool in the study of the origin of coals.
Acknowledgements
This work was carried out as a part of the postgradu-ate studies of the author. The author is thankful to Gu-jarat Mineral Development Corporation for permitting tocarry out sampling in the mine. The ultimate and proxi-mate analyses were carried out at SAIF, IIT Bombay andCentral Fuel Research Institute, Nagpur Unit respectively.The author is thankful to Kanchi Narsimha of Oil and Nat-ural Gas Corporation for useful discussion. The authorexpresses thanks to Drs. Santanu Banerjee and PratulK. Saraswati for providing all infrastructural support forthis work. I thank Mr. Suryendu Dutta of the Institute forChemistry and Dynamics of the Geosphere (ICGV), Ger-many, for making Rock-Eval pyrolysis analyses of sam-ples. I also acknowledge the help of Trupti C. Gurav andShilpa V. Netravali in sample preparation for elementaland X-ray diffraction analysis.
References
[1] Singh A., Singh B.D., Petrology of Panandhro lig-nite deposit, Gujarat in relation to palaeodeposi-tional condition. Journal of Geological Society of In-dia, 2005, 66, 334-344
[2] Mishra B.K., Navale G.K.B., Panandhro lignite fromKutch (Gujarat), India: petrological nature, genesis,rank and sedimentation. Palaeobotanist, 1992, 39,236-249
[3] Stach E., Mackowesky M., Teichmuller M., TaylorG.H., Chandra D., Teichmuller R., Stach’s Textbook ofCoal Petrology. Gebruder Borntraeger, Berlin, 1982
[4] Diessel C.F.K., Utility of coal petrology for sequencestatigraphic analysis. Int. J. Coal Geol., 2007, 70, 3-34
[5] Biswas S.K., Tertiary stratigraphy of Kutch, Journal ofthe Palaentological Society of India, 1992, 37, 1-29
[6] Bureau of Indian Standards, Methods of test for coaland coke, Proximate analysis, Indian Standard (IS):1350. Part1, New Delhi, 1984
[7] Sarkar S., Fuels and Combustion. Orient Longman,India, 1990
[8] Tan K.H., Soil sampling, preparation and analysis.Marcel Dekker, New York, 1996
[9] Espitalie J., Laporte J. L., Madec M., Marquis F., Lep-lat P., Paulet J., Boutefeu A., Methode Rapide deCharacterisation des Roches Meres de leur Poten-tiel Petrolier et de leur Degre d’ Evolution (Rapidmethod for source rock characterization, and for de-termination of their petroleum potential and degreeof evolution). Revue de L’Insitut Francais du Petrole,1977, 32, 23-42 (in French)
[10] Katz B. J., Limitations of Rock-Eval pyrolysis for typ-ing organic matter, Org. Geochem., 1983, 4, 195-199
[11] Traverse A., Paleopalynology. Unwin Hyman, Boston,1988
[12] Germeraad J.H., Hopping C.A., Muller J., Palynologyof Tertiary sediments from tropical areas. Review ofPalaeobotany Palynology, 1968, 6, 189-348
[13] Teichmuller M., The genesis of coal from the viewpointof coal petrology. Int. J. Coal Geol., 1989, 12, 1-87
[14] Tissot B., Welte, D., Petroleum formation and occur-rence. Springer-Verlag, Berlin, 1984
[15] Peters K.E., Cassa M.R., Applied Source Geochem-istry. In: Magoon L.B., Dow W.G. (Eds.), ThePetroleum Systemfrom Source to Trap, AAPG Bul-letin, 1994, 70, 329
[16] Killops S.D., Funnell R.H., Suggate R.P., Sykes R.,Peters K.E., Walters C., Woolhouse A.D., Weston R.J.,Boudou J.P., Predicting generation and expulsion of
26

Vinay K. Sahay
paraffinic oil from vitrinite-rich coals. Org. Geochem.,1998, 29, 1-21
[17] Pepper A.S., Corvi P.J., Simple kinetic models ofpetroleum formation Part I: oil and gas generationfrom kerogen. Mar. Petrol. Geol., 1995, 12, 291–319
[18] Hunt J.M., Petroleum Geochemistry and Geology.W.H. Freeman and Company, New York, 1996
[19] Sykes R., Snowdon L. R., Guidelines for assessing thepetroleum potential coaly source rocks using Rock-eval pyrolysis. Org. Geochem., 2002, 33, 1441-1455
[20] Petersen H.I., The petroleum generation potential andeffective oil window of humic coals related to coalcomposition and age. Int. J. Coal Geol., 2006, 67, 221-248
[21] Teichmuller M., Generation of petroleum like sub-stances in coal seams as seen under the microscope.In: Tissot B., Bienner F. (Eds.), Advances in organicgeochemistry, Technip, Paris, 1974, 379-407
[22] Bailey N.J.L., Hydrocarbon potential of organic mat-ter. In: Brooks J. (Ed.), Organic matter studies andfossil fuel exploration, Academic Press, London, 1981,283-302
[23] Vandenbroucke M., Largeau C., Kerogen origin, evo-lution and structure. Org. Geochem., 2007, 38, 719-833
[24] Han Z., Kruge M.A., Crelling J.C., Bensley D.F., Clas-sification of torbanite and cannel coal, insights frompetrographic analysis of density fractions. Int. J. CoalGeol., 1999, 38, 181-202
[25] Sahay V.K., Determination of GCV equivalence valuefrom carbon, hydrogen of coal with a note on presentCoal Bed Methane generation potential of Wardhavalley coalfields, Vidarbha region, Maharashtra. Jour-nal of the Geological Association and Research Cen-tre, 2006, 14, 50-52
[26] Singh A., Rank assesment of Panandhro lignite de-posits, Kutch basin, Gujarat. Journal of GeologicalSociety of India, 2002, 59, 69-77
[27] Directorate General of Hydrocarbons (DGH), KutchBasin geology, stratigraphy, tectonics and hydrocar-bon potential, 2010 http://www.dghindia.org/17.aspx
[28] Poumot C., Palynological evidence for eustatic eventsin the tropical Neogene. Bulletin des Centres deRecherches Exploration-Production Elf Aquitaine,1989, 13, 437-453
[29] Rull V., Middle Eocene mangroves and vegetationchanges in the Maracaibo basin. Palaios, 1998, 13,287-296
[30] Mandaokar B.D., Palynology of the coal bearing sed-iments in the Tikak Parbat Formation from Jeyporecolliery, Dilli-Jeypore coalfields, Assam, India. Jour-nal of The Palaeontological Society of India, 2000,
45, 173-185[31] Mandaokar B.D., Palynoflora from the Keifang For-
mation (Early Miocene) Mizoram, India and its envi-ronmental significance. Journal of The Palaeontolog-ical Society of India, 2002, 47, 77-83
[32] Samant B., Tapaswi P.M., Palynology of the EarlyEocene Surat lignite deposits of Gujarat, India. Jour-nal of the Palaeontological Society of India, 2001, 46,121-132
[33] Ramanujam C.G. K., Palynology of the NeogeneWarkalli beds of Kerala state in south India. Jour-nal of The Palaeontological Society of India, 1987,32, 26-46
[34] Thanikaimoni G., Caratini C., Venkatachala B.S., Ra-manujam C.G.K., Kar R.K., Selected Tertiary An-giosperm pollen from India and their relationship withAfrican Tertiary pollens. Institut Francais de Pondich-ery, Travaux de la Section Scientific et Technique,Pondichery, 1984
[35] Graham A., Studies in Neotropical Botany. LateTertiary vegetation and environments of southeast-ern Guatemala, Palynofloras from the Mio-PliocenePadre Miguel Group and the Pliocene Herreria For-mation. Am. J. Bot., 1998, 85, 1409-1425
[36] Muller J., Palynology of the Pedawan andPlateau Sandstone formations (Cretaceous-Eocene)in Sarawak, Malaysia. Micropaleontology, 1968, 14,l-37
[37] De Villiers S.E., Cadman A., An analysis of the paly-nomorphs obtained from Tertiary sediments at Koing-naas, Namaqualand, South Africa. J. Afr. Earth Sci.,2001, 33, 17-47
[38] Hoorn C., Fluvial palaeoenvironments in the intracra-tonic Amazonas Basin (Early Miocene - early MiddleMiocene, Colombia). Palaeogeogr. Palaeoecol., 1994,109, 1-54
[39] Pasley M., Gregory W., Hart G. F., Organic mattervariations in transgressive and regressive shales. Org.Geochem., 1991, 17, 483-509
[40] Mitchum R.M.Jr., Vail P.E., Thomson S., The depo-sitional sequence as a basic unit for stratigraphicanalysis. In: Payton C.E. (Ed.), Seismic stratigraphy–Applications to hydrocarbon exploration. AmericanAssociation of Petroleum Geologist Memoir, 1977, 26,53-62
[41] Bohacs K.M., Suter J., Sequence stratigraphic dis-tribution of coaly rocks: fundamental controls andexamples. Am. Assoc. of Petrol. Geol. B., 1997, 81,1612-1639
[42] Diessel C. F. K., Coal-bearing depositional systems.Springer-Verlag, Berlin, 1992
[43] Davies R., Howell J., Boyd R., Flint S., Diesel C., High
27

The hydrocarbon potential, thermal maturity, sequence stratigraphic setting and depositional palaeoenvironment of carbonaceous shale and lignitesuccessions of Panandhro, northwestern Kutch Basin, Gujarat, Western India
resolution sequence stratigraphic correlation betweenshallow marine and terrestrial strata: Examples fromthe Sunnyside Member of the Cretaceous BlackhawkFormation, Book Cliffs, eastern Utah. Am. Assoc. ofPetrol. Geol. B., 2006, 90, 1121-1140
[44] Neumann A.C., McIntyre I.G., Reef response to sea-level-catch up, keep up, or give up. In: Gabrie C.,Toffart J. L. and Salvat B. (Eds.), ”Proceedings ofthe Fifth International Coral Reef Congress”, Morea,French Polynesia, Antenne Museum-Ephe, 1985, 3,105-110
[45] Emery D., Myers K.J., Sequence Stratigraphy. Black-
well Science, London, 1996[46] Haq B.U., Hardenbol J., Vail P.R., Mesozoic and
Cenozoic chronostratigraphy and eustatic cycles. So-ciety for Sedimentary Geology Special Publication,1998, 42, 71-108
[47] Saraswati P.K., Banerji R.K., Lithostratigraphic clas-sification of the Tertiary sequence of northwesternKutch. In: Badve R. M., Borkar V. D., Ghare M. A.and Rajshekhar C. S. (Eds.), Proceedings of X IndianCollquium on Micropalaeontology and Stratigraphy,Pune, 1984, 369-376
28