Investigation of paste flow using positron emission particle tracking
10
Ž . Powder Technology 103 1999 220–229 Investigation of paste flow using positron emission particle tracking R.D. Wildman a, ) , S. Blackburn a , D.M. Benton b , P.A. McNeil b , D.J. Parker b a IRC in Materials for High Performance Applications and School of Chemical Engineering, UniÕersity of Birmingham, Edgbaston, Birmingham B15 2TT, UK b Positron Imaging Centre, School of Physics and Astronomy, UniÕersity of Birmingham, Edgbaston, Birmingham B15 2TT, UK Received 11 July 1998; received in revised form 21 November 1998; accepted 11 January 1999 Abstract Ž . The method of positron emission particle tracking PEPT has been adapted for use during extrusion. A particle 2 mm in diameter was tracked through a 458 conical die geometry using ram speeds of 5 and 10 mm min y1 . The particle was placed at different points across the diameter of the barrel in order to determine the dependence of the speed and strain rate on the initial position. Analysis of the speed of the particle during extrusion showed that the clay based paste used in the experiment exhibited plug flow in the barrel and the die land regions. The maximum extensional strain rate was shown to be independent of the ram speed, whereas the shear strain rate at the wall was highly dependent on the ram speed. q 1999 Elsevier Science S.A. All rights reserved. Keywords: Extrusion; Positron emission particle tracking; Extensional strain rate; Shear strain rate 1. Introduction Extrusion is an extremely efficient method of producing bodies of varying lengths and thicknesses and has been used to mass-produce bricks, for drawing wire and more wx recently in the production of technical ceramics 1 . At- tempts to understand the mechanics of flow in this process have developed mainly through the use of semi-empirical models. The use of finite element analysis enables quan- tification of the stresses and strain rates, but the method has its limitations due the requirement of knowing material parameters before proceeding with the analysis. Constitu- tive equations are limited due to the highly complex nature of most pastes. Rheology is generally considered as the understanding of how a continuum behaves under different flow regimes. If the particles are large and numerous enough to perturb the flow away from that of a pure fluid, then the interaction of two phases, the continuous liquid and the discrete solids, must be considered. ) Corresponding author. Department of Mechanical Engineering, Loughborough University, Loughborough, Leicestershire LE11 3UT, UK. Tel.: q 44-1509-223229; Fax: q 44-1509-223934; E-mail: [email protected] Previously used techniques have been unsuccessful at elucidating the paste behaviour at the die entry region in extrusion. This region is of particular interest. It is in the interface between the barrel and the die land that a combi- nation of high extension and high shear occurs. This is important in the analysis of agglomerate breakdown. The determination of paste behaviour in the die entry region is considered as a pre-requisite to the analysis of agglomerate breakdown behaviour. Popular rheological models used to interpret the pressure drops during extrusion, such as the Benbow–Bridgwater or the Herschel–Bulkley method, pa- rameterise the bulk flow behaviour of the pastes. As a slip layer at the wall is usually assumed to occur, this does not allow information to be gained about the precise strain rate behaviour across the flow front in convergent flow. Any deformation that may occur inside the body of the paste is neglected. Flow visualisation, i.e., the use of different coloured pastes to visualise the flow after a known time of extrusion, is a practical method of observing the develop- ment of the flow, but important areas are often obscured wx and it can lead to the radial behaviour being neglected 2 . For the first time, positron emission particle tracking Ž . PEPT has been used to allow the in situ visualisation of a particle in a paste undergoing flow. The technique has previously been used to enable a statistically accurate 0032-5910r99r$ - see front matter q 1999 Elsevier Science S.A. All rights reserved. Ž . PII: S0032-5910 99 00019-4
-
Upload
nottingham -
Category
Documents
-
view
4 -
download
0
Transcript of Investigation of paste flow using positron emission particle tracking
Ž .Powder Technology 103 1999 220–229
Investigation of paste flow using positron emission particle tracking
R.D. Wildman a,), S. Blackburn a, D.M. Benton b, P.A. McNeil b, D.J. Parker b
a IRC in Materials for High Performance Applications and School of Chemical Engineering, UniÕersity of Birmingham, Edgbaston,Birmingham B15 2TT, UK
b Positron Imaging Centre, School of Physics and Astronomy, UniÕersity of Birmingham, Edgbaston, Birmingham B15 2TT, UK
Received 11 July 1998; received in revised form 21 November 1998; accepted 11 January 1999
Abstract
Ž .The method of positron emission particle tracking PEPT has been adapted for use during extrusion. A particle 2 mm in diameter wastracked through a 458 conical die geometry using ram speeds of 5 and 10 mm miny1. The particle was placed at different points acrossthe diameter of the barrel in order to determine the dependence of the speed and strain rate on the initial position. Analysis of the speed ofthe particle during extrusion showed that the clay based paste used in the experiment exhibited plug flow in the barrel and the die landregions. The maximum extensional strain rate was shown to be independent of the ram speed, whereas the shear strain rate at the wall washighly dependent on the ram speed. q 1999 Elsevier Science S.A. All rights reserved.
Keywords: Extrusion; Positron emission particle tracking; Extensional strain rate; Shear strain rate
1. Introduction
Extrusion is an extremely efficient method of producingbodies of varying lengths and thicknesses and has beenused to mass-produce bricks, for drawing wire and more
w xrecently in the production of technical ceramics 1 . At-tempts to understand the mechanics of flow in this processhave developed mainly through the use of semi-empiricalmodels. The use of finite element analysis enables quan-tification of the stresses and strain rates, but the methodhas its limitations due the requirement of knowing materialparameters before proceeding with the analysis. Constitu-tive equations are limited due to the highly complex natureof most pastes. Rheology is generally considered as theunderstanding of how a continuum behaves under differentflow regimes. If the particles are large and numerousenough to perturb the flow away from that of a pure fluid,then the interaction of two phases, the continuous liquidand the discrete solids, must be considered.
) Corresponding author. Department of Mechanical Engineering,Loughborough University, Loughborough, Leicestershire LE11 3UT, UK.Tel.: q 44-1509-223229; Fax: q 44-1509-223934; E-mail:[email protected]
Previously used techniques have been unsuccessful atelucidating the paste behaviour at the die entry region inextrusion. This region is of particular interest. It is in theinterface between the barrel and the die land that a combi-nation of high extension and high shear occurs. This isimportant in the analysis of agglomerate breakdown. Thedetermination of paste behaviour in the die entry region isconsidered as a pre-requisite to the analysis of agglomeratebreakdown behaviour. Popular rheological models used tointerpret the pressure drops during extrusion, such as theBenbow–Bridgwater or the Herschel–Bulkley method, pa-rameterise the bulk flow behaviour of the pastes. As a sliplayer at the wall is usually assumed to occur, this does notallow information to be gained about the precise strain ratebehaviour across the flow front in convergent flow. Anydeformation that may occur inside the body of the paste isneglected. Flow visualisation, i.e., the use of differentcoloured pastes to visualise the flow after a known time ofextrusion, is a practical method of observing the develop-ment of the flow, but important areas are often obscured
w xand it can lead to the radial behaviour being neglected 2 .For the first time, positron emission particle tracking
Ž .PEPT has been used to allow the in situ visualisation of aparticle in a paste undergoing flow. The technique haspreviously been used to enable a statistically accurate
0032-5910r99r$ - see front matter q 1999 Elsevier Science S.A. All rights reserved.Ž .PII: S0032-5910 99 00019-4
( )R.D. Wildman et al.rPowder Technology 103 1999 220–229 221
w xdescription of the time residences and speeds in mixers 3 ,w xand has been used to follow particles in fluidised beds 4 .
2. Experimental procedure
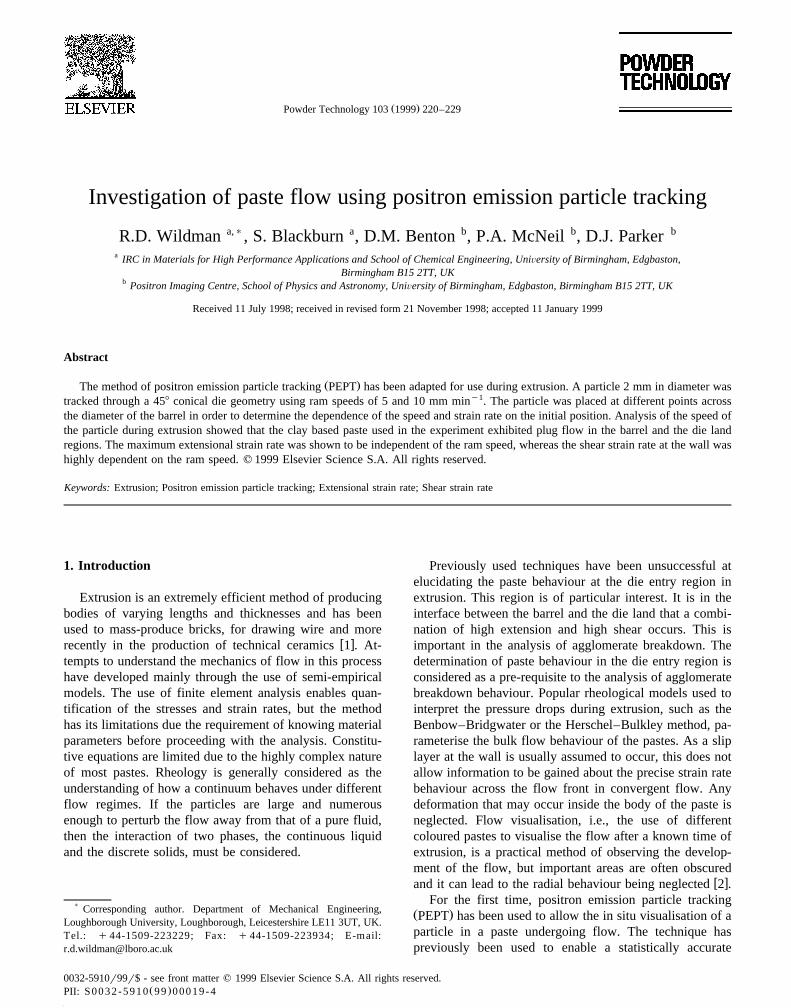
PEPT takes advantage of the properties of a particularclass of radioisotope. If a particle containing relativelylarge quantities of Oxygen is irradiated with a highlyenergetic beam of 3He particles, then the interactionsbetween the target nuclei and the incident particles resultsin the formation of a radioisotope of fluorine, 18 F. Thisradioisotope decays through the emission of positrons,which are annihilated when they encounter electrons. Thisannihilation results in the conversion of the matter into twoback to back 511 keV gamma rays, which are simultane-ously detected in a pair of detectors. The position is thendetermined by triangulation from successive events. A pairof typical logging events are sketched in Fig. 1. Theprinciples behind and discussion of the development of thePEPT method can be found in greater detail in the litera-
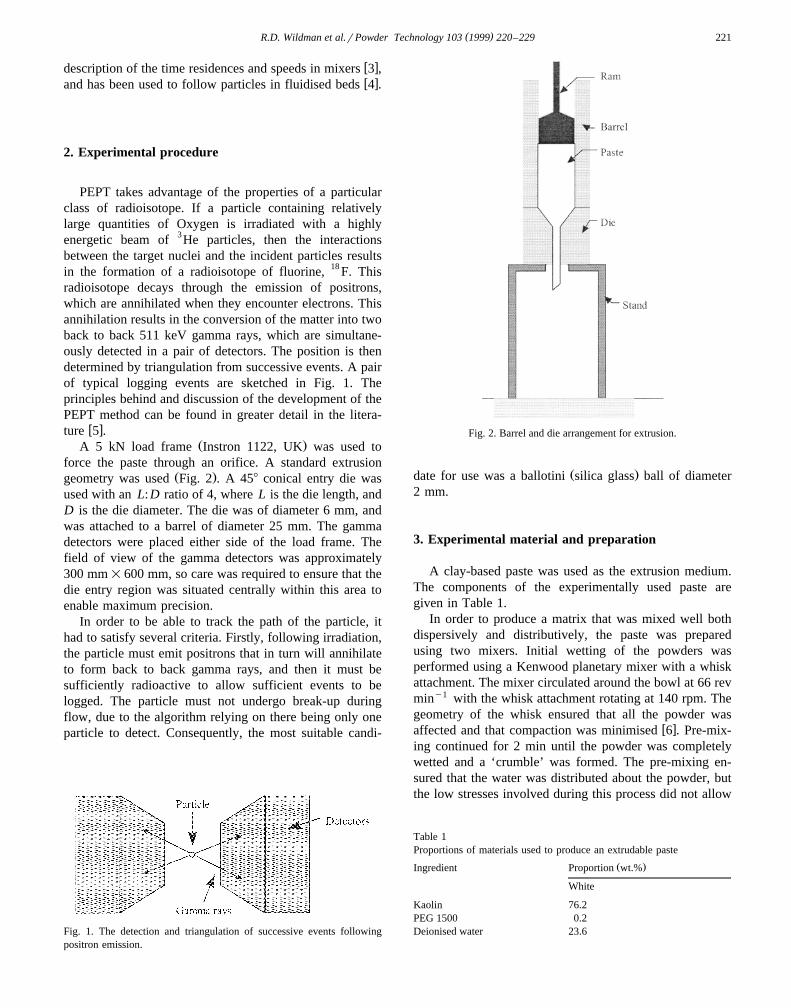
w xture 5 .Ž .A 5 kN load frame Instron 1122, UK was used to
force the paste through an orifice. A standard extrusionŽ .geometry was used Fig. 2 . A 458 conical entry die was
used with an L:D ratio of 4, where L is the die length, andD is the die diameter. The die was of diameter 6 mm, andwas attached to a barrel of diameter 25 mm. The gammadetectors were placed either side of the load frame. Thefield of view of the gamma detectors was approximately300 mm=600 mm, so care was required to ensure that thedie entry region was situated centrally within this area toenable maximum precision.
In order to be able to track the path of the particle, ithad to satisfy several criteria. Firstly, following irradiation,the particle must emit positrons that in turn will annihilateto form back to back gamma rays, and then it must besufficiently radioactive to allow sufficient events to belogged. The particle must not undergo break-up duringflow, due to the algorithm relying on there being only oneparticle to detect. Consequently, the most suitable candi-
Fig. 1. The detection and triangulation of successive events followingpositron emission.
Fig. 2. Barrel and die arrangement for extrusion.
Ž .date for use was a ballotini silica glass ball of diameter2 mm.
3. Experimental material and preparation
A clay-based paste was used as the extrusion medium.The components of the experimentally used paste aregiven in Table 1.
In order to produce a matrix that was mixed well bothdispersively and distributively, the paste was preparedusing two mixers. Initial wetting of the powders wasperformed using a Kenwood planetary mixer with a whiskattachment. The mixer circulated around the bowl at 66 revminy1 with the whisk attachment rotating at 140 rpm. Thegeometry of the whisk ensured that all the powder was
w xaffected and that compaction was minimised 6 . Pre-mix-ing continued for 2 min until the powder was completelywetted and a ‘crumble’ was formed. The pre-mixing en-sured that the water was distributed about the powder, butthe low stresses involved during this process did not allow
Table 1Proportions of materials used to produce an extrudable paste
Ž .Ingredient Proportion wt.%
White
Kaolin 76.2PEG 1500 0.2Deionised water 23.6
( )R.D. Wildman et al.rPowder Technology 103 1999 220–229222
break up of fine agglomerates or dispersive mixing tooccur. Following pre-mixing and wetting, the ‘crumble’
Žwas transferred to a kneading machine Werner and Flei-.derer LUK 3 III-2 Vak . This consisted of two 125 mm
long masticator blades counter-rotating at speeds of 25 and52 rpm. The gap between the blades and the trough wallwas measured to be 1.25 mm, resulting in deformationrates of approximately 130 and 270 sy1 for the two blades,
respectively. To ensure complete mixing occurred, thewalls and blades were scraped free of paste at regularintervals. Following a total mixing time of 45 min, thepaste was removed from the kneading machine and placedinto an airtight container. The kneading machine forced thepaste through repeated large cross-sectional changes bydragging the paste through a narrow gap, creating stresseslarge enough to break down any visible agglomerates.
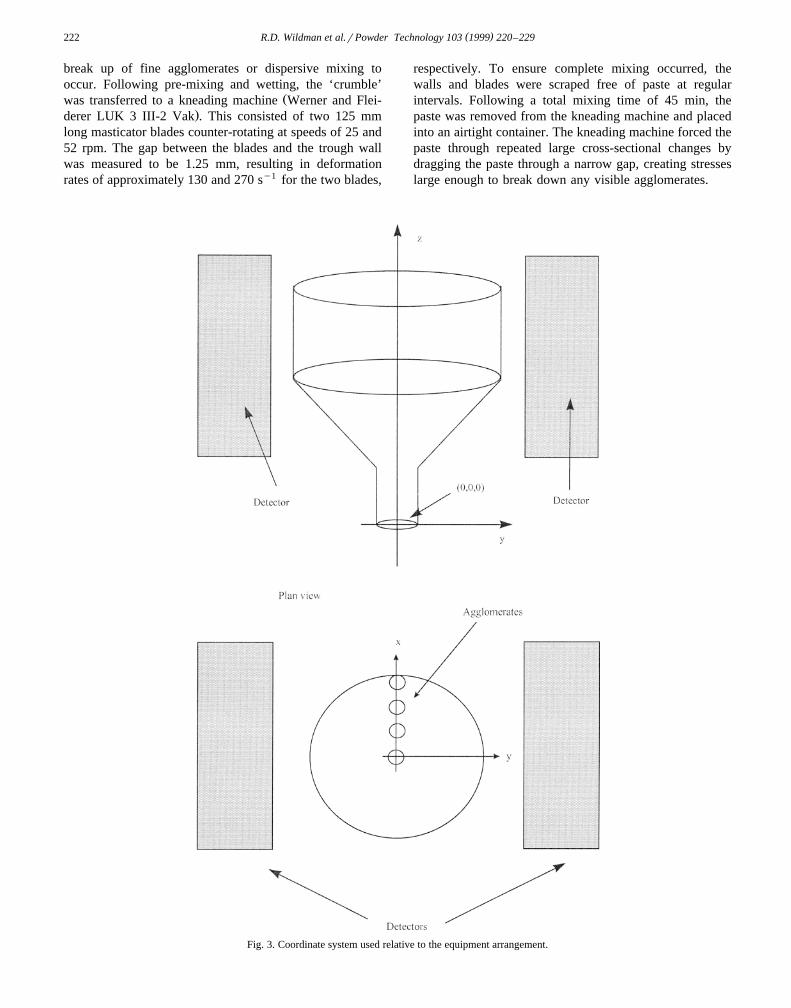
Fig. 3. Coordinate system used relative to the equipment arrangement.
( )R.D. Wildman et al.rPowder Technology 103 1999 220–229 223
4. Paste characterisation
In order to maintain consistency from batch to batch,the rheology of the feed stock material was analysed using
w xthe equations proposed by Benbow and Bridgwater 7 .This particular method was chosen as it allows the dieentry behaviour to be examined explicitly, as compared tothe Herschel–Bulkley method which would require itera-tive modification to fully describe both the die entry anddie land. Extrudable pastes can be considered as two-com-ponent systems containing a particulate powder phase and
w xa continuous liquid phase 7 . If a plastic body is forcedfrom a barrel of area A , into a die of cross-sectional areao
A and length L, then the pressure drop P, can beD
separated into two parts, the pressure required to reducethe cross-sectional area, P , and the pressure to push the1
paste along the die land, P . Then from the theory of2
plastic extrusion of metals,
AoP ss ln , 1Ž .1 y ž /AD
w xwhere s is a uniaxial yield stress 8 . From semi-em-y
pirical relationships, the above may be modified by avelocity factor, a , such that
AoP s s qa Õ ln . 2Ž . Ž .1 o ž /AD
where Õ is the velocity of the paste in the die and s is theo
uniaxial yield stress extrapolated to zero velocity. Thepressure drop P in the die land is opposed by the wall2
shear stress t , which, it is argued, is uniform along thelength of the die in highly loaded pastes due to plug flow.This can be a velocity dependent parameter, which byanalogy with the uniaxial yield stress, can be given by
tst qb Õ , 3Ž .o
where t is the wall shear stress at commencement ofo
movement and b is a factor indicating the change of wallshear stress with velocity. The term b Õ describes viscousflow in a thin layer at the die wallrpaste interface.
A force balance gives
EP s t qb Õ L 4Ž . Ž .2 o ž /AD
where E is the die perimeter. Thus, the total pressure dropduring extrusion is given by
A EoPsP qP s s qa Õ ln q t qb Õ L .Ž . Ž .1 2 o ož / ž /A AD D
5Ž .For dies and ram extruders of circular cross-section,
with diameters D and D , respectively, this can beD o
simplified to
D LoPs2 s qa Õ ln q t qb Õ 4 . 6Ž . Ž . Ž .o ož / ž /D DD D
Where the binder used in the paste shows non-Newtonianbehaviour, the velocity can be raised by the powers m andn to provide the required agreement with experimentalobservations:
D Lom nPs2 s qa Õ ln q t qb Õ 4 7Ž .Ž . Ž .o 1 o 1ž / ž /D DD D
Ž Ž .yŽ n or m..where a and b MPa mrs are not equal to a1 1Ž Ž .y1 .and b MPa mrs . By using a range of die lengths
and ram speeds it is possible to determine estimates for thevalues of the paste parameters through graphing or regres-
w xsion techniques 7 .Following production and characterisation the paste was
then compacted into a barrel, removed and then sectionedinto discs. The ballotini balls were then placed betweentwo discs of kaolin paste, each 20 mm in thickness, whichenabled the start height to be consistent throughout thetests. Five positions were used: centre, one quarter radius,one half radius, three quarters radius and at the wall. Theparticles were always placed between the cameras in thex–z plane such that the expected movement during extru-sion would be in a plane equidistant from the gamma
Ž .cameras Fig. 3 .Two ram speeds were used, 10 mm miny1 and 5 mm
miny1, equivalent to extrudate speeds of 173.6 and 86.8mm miny1, respectively, calculated by
Õ D2R o
s 8Ž .2Õ DD
where Õ is the ram speed.R
Due to the attenuation of the gamma rays being roughlyproportional to the density of the material through which itis passing, nylon was used for both the barrel and die, withthe die attached to the barrel without the need for a ring orflange with simple retaining bolts. A slight modification inthe interaction between the slip layer and the barrelrdiewall was expected when compared to using a metal barrelor die, but was considered necessary in order to attainsufficient accuracy in the measurement of the position and
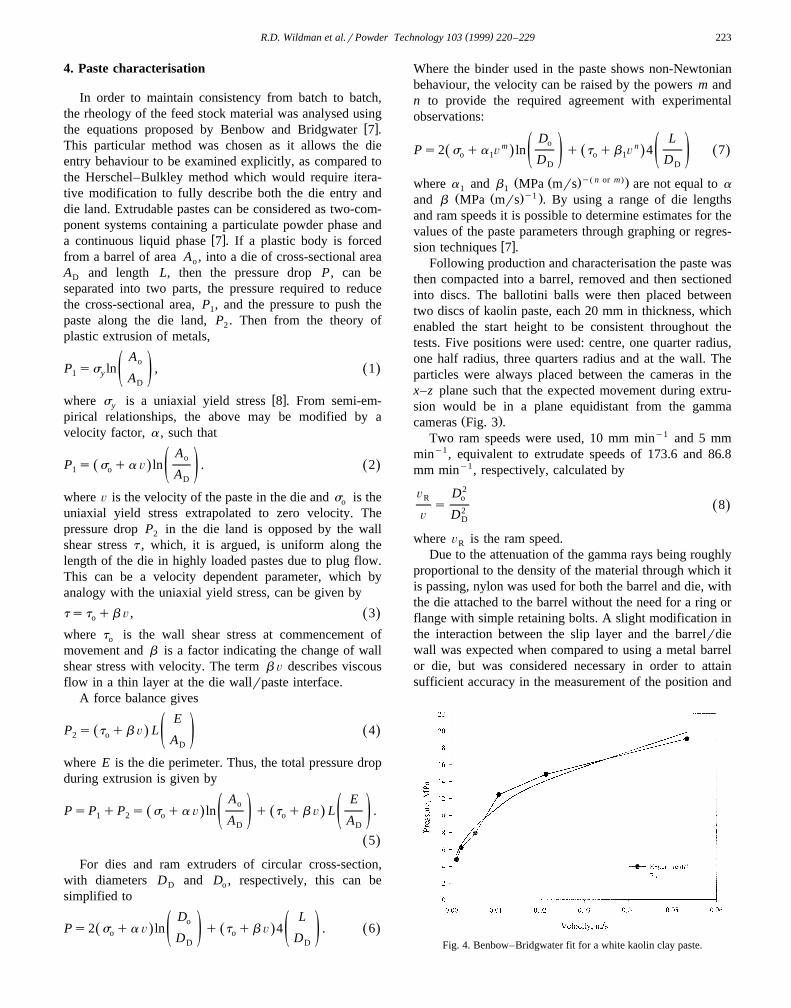
Fig. 4. Benbow–Bridgwater fit for a white kaolin clay paste.
( )R.D. Wildman et al.rPowder Technology 103 1999 220–229224
Table 2Paste parameters for a clay based paste determined using the Benbow–Bridgwater method
Parameter Value
Ž .s MPa 0oymŽ .a MPa s 0.951
m 0.07Ž .t MPa 0o
ynŽ .b MPa s 0.951
n 0.44
speed of the tracer. This was then placed on a rigid plasticstand. This raised the die entry region away from thestand.
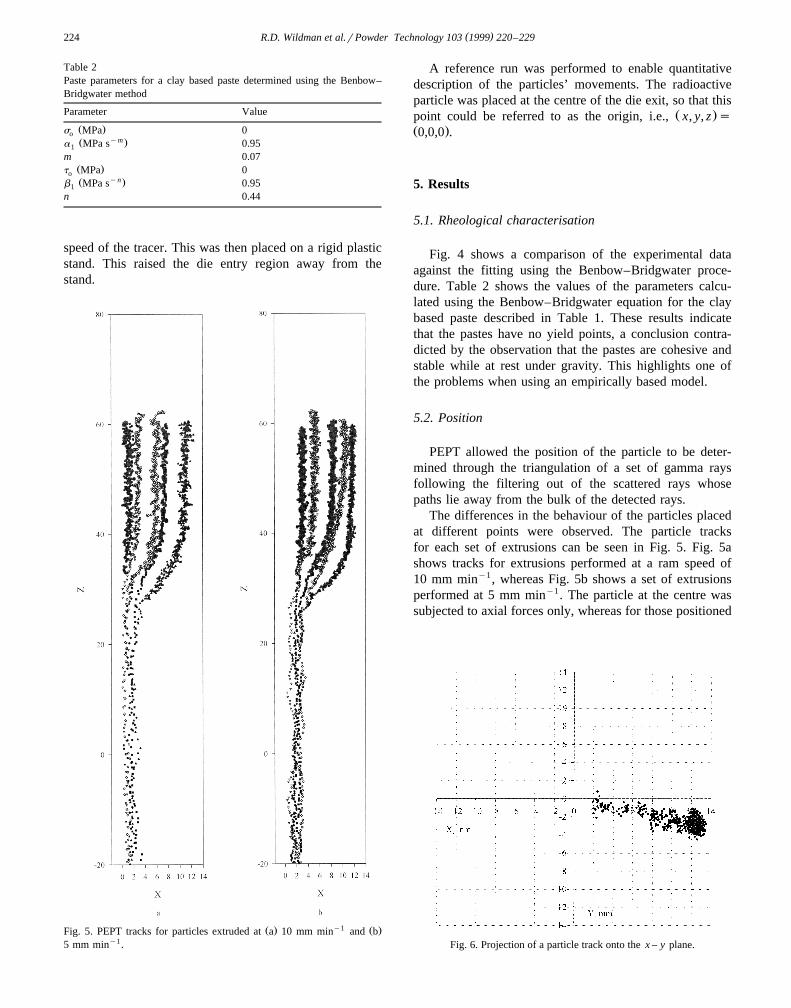
Ž . y1 Ž .Fig. 5. PEPT tracks for particles extruded at a 10 mm min and b5 mm miny1.
A reference run was performed to enable quantitativedescription of the particles’ movements. The radioactiveparticle was placed at the centre of the die exit, so that this
Ž .point could be referred to as the origin, i.e., x, y, z sŽ .0,0,0 .
5. Results
5.1. Rheological characterisation
Fig. 4 shows a comparison of the experimental dataagainst the fitting using the Benbow–Bridgwater proce-dure. Table 2 shows the values of the parameters calcu-lated using the Benbow–Bridgwater equation for the claybased paste described in Table 1. These results indicatethat the pastes have no yield points, a conclusion contra-dicted by the observation that the pastes are cohesive andstable while at rest under gravity. This highlights one ofthe problems when using an empirically based model.
5.2. Position
PEPT allowed the position of the particle to be deter-mined through the triangulation of a set of gamma raysfollowing the filtering out of the scattered rays whosepaths lie away from the bulk of the detected rays.
The differences in the behaviour of the particles placedat different points were observed. The particle tracksfor each set of extrusions can be seen in Fig. 5. Fig. 5ashows tracks for extrusions performed at a ram speed of10 mm miny1, whereas Fig. 5b shows a set of extrusionsperformed at 5 mm miny1. The particle at the centre wassubjected to axial forces only, whereas for those positioned
Fig. 6. Projection of a particle track onto the x – y plane.
( )R.D. Wildman et al.rPowder Technology 103 1999 220–229 225
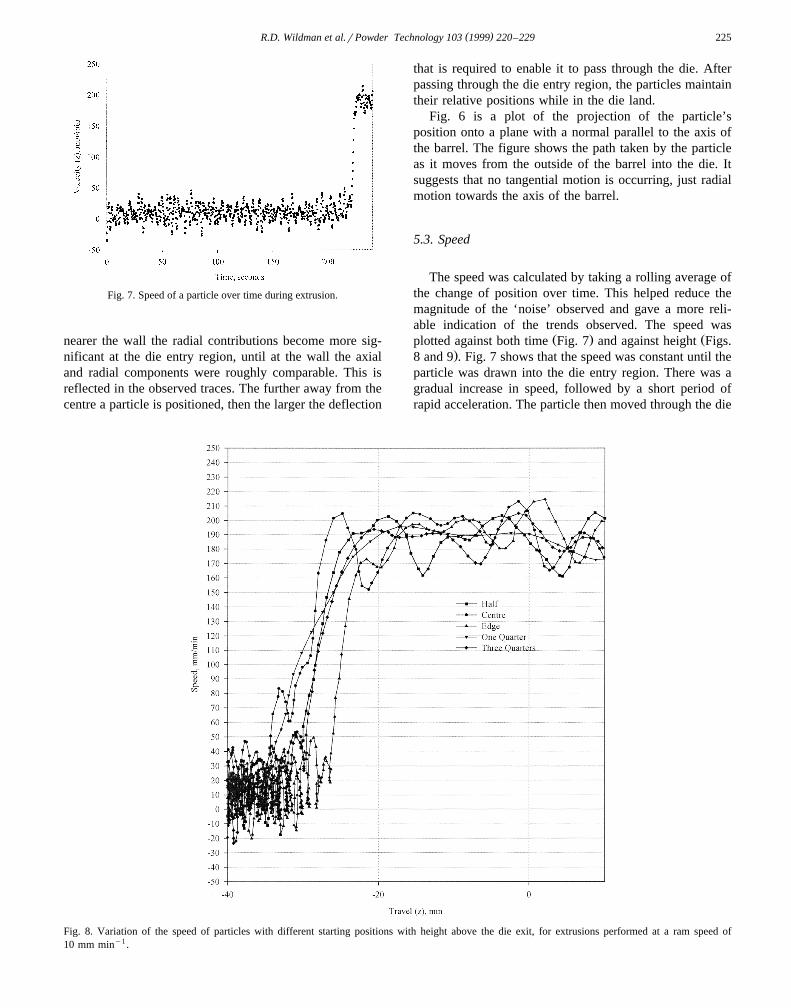
Fig. 7. Speed of a particle over time during extrusion.
nearer the wall the radial contributions become more sig-nificant at the die entry region, until at the wall the axialand radial components were roughly comparable. This isreflected in the observed traces. The further away from thecentre a particle is positioned, then the larger the deflection
that is required to enable it to pass through the die. Afterpassing through the die entry region, the particles maintaintheir relative positions while in the die land.
Fig. 6 is a plot of the projection of the particle’sposition onto a plane with a normal parallel to the axis ofthe barrel. The figure shows the path taken by the particleas it moves from the outside of the barrel into the die. Itsuggests that no tangential motion is occurring, just radialmotion towards the axis of the barrel.
5.3. Speed
The speed was calculated by taking a rolling average ofthe change of position over time. This helped reduce themagnitude of the ‘noise’ observed and gave a more reli-able indication of the trends observed. The speed was
Ž . Žplotted against both time Fig. 7 and against height Figs..8 and 9 . Fig. 7 shows that the speed was constant until the
particle was drawn into the die entry region. There was agradual increase in speed, followed by a short period ofrapid acceleration. The particle then moved through the die
Fig. 8. Variation of the speed of particles with different starting positions with height above the die exit, for extrusions performed at a ram speed of10 mm miny1.
( )R.D. Wildman et al.rPowder Technology 103 1999 220–229226
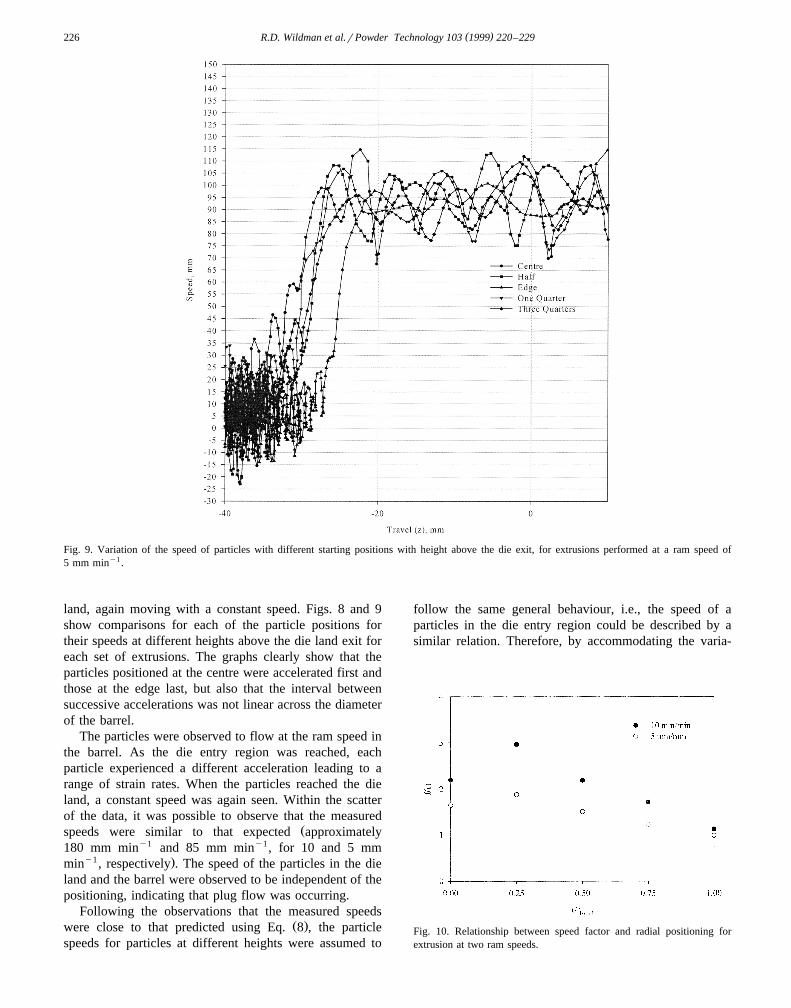
Fig. 9. Variation of the speed of particles with different starting positions with height above the die exit, for extrusions performed at a ram speed of5 mm miny1.
land, again moving with a constant speed. Figs. 8 and 9show comparisons for each of the particle positions fortheir speeds at different heights above the die land exit foreach set of extrusions. The graphs clearly show that theparticles positioned at the centre were accelerated first andthose at the edge last, but also that the interval betweensuccessive accelerations was not linear across the diameterof the barrel.
The particles were observed to flow at the ram speed inthe barrel. As the die entry region was reached, eachparticle experienced a different acceleration leading to arange of strain rates. When the particles reached the dieland, a constant speed was again seen. Within the scatterof the data, it was possible to observe that the measured
Žspeeds were similar to that expected approximately180 mm miny1 and 85 mm miny1, for 10 and 5 mm
y1 .min , respectively . The speed of the particles in the dieland and the barrel were observed to be independent of thepositioning, indicating that plug flow was occurring.
Following the observations that the measured speedsŽ .were close to that predicted using Eq. 8 , the particle
speeds for particles at different heights were assumed to
follow the same general behaviour, i.e., the speed of aparticles in the die entry region could be described by asimilar relation. Therefore, by accommodating the varia-
Fig. 10. Relationship between speed factor and radial positioning forextrusion at two ram speeds.
( )R.D. Wildman et al.rPowder Technology 103 1999 220–229 227
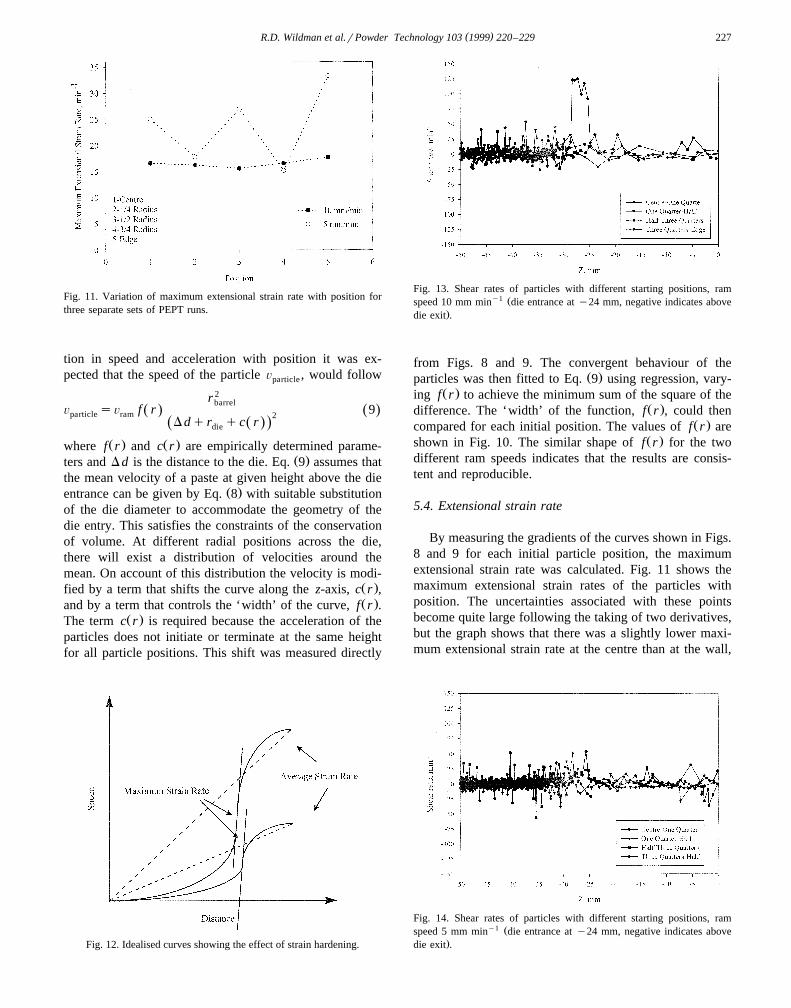
Fig. 11. Variation of maximum extensional strain rate with position forthree separate sets of PEPT runs.
tion in speed and acceleration with position it was ex-pected that the speed of the particle Õ , would followparticle
r 2barrel
Õ sÕ f r 9Ž . Ž .particle ram 2Ddqr qc rŽ .Ž .die
Ž . Ž .where f r and c r are empirically determined parame-Ž .ters and Dd is the distance to the die. Eq. 9 assumes that
the mean velocity of a paste at given height above the dieŽ .entrance can be given by Eq. 8 with suitable substitution
of the die diameter to accommodate the geometry of thedie entry. This satisfies the constraints of the conservationof volume. At different radial positions across the die,there will exist a distribution of velocities around themean. On account of this distribution the velocity is modi-
Ž .fied by a term that shifts the curve along the z-axis, c r ,Ž .and by a term that controls the ‘width’ of the curve, f r .
Ž .The term c r is required because the acceleration of theparticles does not initiate or terminate at the same heightfor all particle positions. This shift was measured directly
Fig. 12. Idealised curves showing the effect of strain hardening.
Fig. 13. Shear rates of particles with different starting positions, ramy1 Žspeed 10 mm min die entrance at y24 mm, negative indicates above
.die exit .
from Figs. 8 and 9. The convergent behaviour of theŽ .particles was then fitted to Eq. 9 using regression, vary-
Ž .ing f r to achieve the minimum sum of the square of theŽ .difference. The ‘width’ of the function, f r , could then
Ž .compared for each initial position. The values of f r areŽ .shown in Fig. 10. The similar shape of f r for the two
different ram speeds indicates that the results are consis-tent and reproducible.
5.4. Extensional strain rate
By measuring the gradients of the curves shown in Figs.8 and 9 for each initial particle position, the maximumextensional strain rate was calculated. Fig. 11 shows themaximum extensional strain rates of the particles withposition. The uncertainties associated with these pointsbecome quite large following the taking of two derivatives,but the graph shows that there was a slightly lower maxi-mum extensional strain rate at the centre than at the wall,
Fig. 14. Shear rates of particles with different starting positions, ramy1 Žspeed 5 mm min die entrance at y24 mm, negative indicates above
.die exit .

( )R.D. Wildman et al.rPowder Technology 103 1999 220–229228
y1 ŽFig. 15. Shear rates at the die entry region, 10 mm min ram speed die.entrance at y24 mm, negative indicates above die exit .
and that again, this was not linear across the radius. If the10 mm miny1 and 5 mm miny1 points are compared andconsidering the high level of scatter associated with the
Ž y1 .data "5 min , then it can be seen that the maxi-mum extensional strain rate during the 5 mm miny1 ex-trusion was higher than, or equal to that, observed in the10 mm miny1 extrusion. An explanation for this behaviouris that the paste was strain hardening, i.e., the pastebecomes stiffer with increasing strain. Fig. 12 shows howthis may influence the observed behaviour. In each of theidealised curves the maximum strain rates are observed tobe similar, the maximum strain rate being limited by thestrain hardening, but the average strain rate was propor-tional to the ram speed.
5.5. Shear strain rate
It was possible to calculate the shear rate from theparticle tracks seen in Fig. 5. The average speed wascalculated at each point above the die entry region. The
y1 ŽFig. 16. Shear rates at the die entry region, 5 mm min ram speed die.entrance at y24 mm, negative indicates above die exit .
Table 3Value of maximum shear rate in die entry region and its location
y1Ž .Ram speed mm min 10 5y1Ž .Max. shear rate min 120 50Ž .Height above die exit mm 27.5 25.8
Initial position Three quarters-edge Three quarters-edge
shear strain rate was calculated using the following expres-sion
dÕ DÕgs ( . 10Ž .˙
d r D r
For the particle tracks in PEPT, DÕ is the difference inspeed for particles at a given height, and D r is their radialseparation. Therefore, if the speeds are compared for allheights, the shear rate could be calculated for all points ofthe particle tracks.
Figs. 8 and 9 show that in the barrel and die landŽ .regions y)24 mm and y-20 mm the speed at differ-
ent radial positions was the same due to plug flow. Thisindicates that the shear strain rate at this point was zero. In
Ž .the die entry region 24 mm-y-20 mm the behaviourwas more complex due to the speed of the paste beingposition-dependent.
The shear rates were compared for the resulting fourpositions. Figs. 13 and 14 show the calculated shear ratesfor each set of PEPT runs. These figures show that in thebarrel, there was too much scatter to enable quantitativedescription of the shear rate. It can be seen that anydifferences in the speed of the particles in the barrel aretoo small to be seen amongst the scatter. When the parti-cles began to enter the die entry region, acceleration of theparticles is staggered and the differences in speed werethen much greater than the scatter associated with thespeed, and consequently the shear rate could be quantifiedwith much greater confidence.
Figs. 15 and 16 show the shear rates for each setbetween the die entry and the die land. The speeds are verydifferent in this region and this was reflected in the shearrate. Table 3 shows the maximum shear rates calculated inthe die entry region, the height above the die land exit, andthe initial position of the particle. It can be seen that themaximum shear rate was always experienced by the parti-cles placed towards the edge of the barrel. The peak shearrate also tended to occur at a height of 25–28 mm abovethe die land exit, or alternatively, 1–4 mm above the dieland entrance.
6. Conclusions
Positron emission particle tracking has enabled the loca-tion of a particle in a paste to be determined whileundergoing extrusion. The use of a nylon barrel and aplastic stand kept the attenuation to a minimum and al-
( )R.D. Wildman et al.rPowder Technology 103 1999 220–229 229
lowed the position to be determined to "0.5 mm at lowŽ y1 .speeds 5 to 10 mm min . Calculation of the average
speed of the particles established that plug flow occursboth in the barrel and in the die land regions. Elongationalstrain rates for different ram speeds and particle positionswere calculated from the extensional strain rates of theparticles. Comparisons of the elongational strain rates at 10and 5 mm miny1 showed that, considering the scatterwithin the data sample, they were largely independent ofthe speed of extrusion, and the strain rate was greatertowards the wall rather than towards the centre of thebarrel. Shear strain rate was also calculated, but was onlyavailable for the die entry region due to the scatter associ-ated with the speed. This showed that maximum shear ratewas dependent on the speed of extrusion, and that themaximum shear rate in the used geometry always occurredat the edge close to the barrel wall.
Acknowledgements
The authors would like to acknowledge the support ofŽthe EPSRC and the National Physical Laboratory under a
Department of Trade and Industry funded project on Mate-.rials Metrology .
References
w x1 A.T. Green, G.H. Stewart, Ceramics, Br. Ceram. Soc., Stoke-on-Trent,UK, 1953.
w x2 R.D. Wildman, PhD Thesis, University of Birmingham, 1997.w x3 C.J. Broadbent, J. Bridgwater, D.J. Parker, The effect of fill level on
powder mixer performance using a positron camera, Chem. Eng. J.Ž . Ž .and Biochem. Eng. J. 56 3 1995 119.
w x4 M. Stein, J.P.K. Seville, D. Benton, P. McNeil, D.J. Parker, Particlesegregation and movement in gas fluidised beds, IChemE ResearchEvent, 1996, p. 1060.
w x5 D.J. Parker, C.J. Broadbent, P. Fowles, M.R. Hawkesworth, P.A.McNeil, Positron emission particle tracking—a technique for study-ing flow within engineering equipment, Nuclear Instr. and Meth. A
Ž . Ž .326 3 1993 592.w x6 H. Bohm, S. Blackburn, An investigation into ceramic paste mixing,¨
IChemE Research Event, 1993, p. 705.w x7 J.J. Benbow, J. Bridgwater, Paste Flow and Extrusion, Oxford Univ.
Press, Oxford, UK, 1993.w x8 J.J. Benbow, J. Bridgwater, E.W. Oxley, Extrusion mechanics of
pastes—the influence of paste formulation on extrusion parameters,Ž .Chem. Eng. Sci. 42 1987 2151.


![Molecular Imaging of Murine Intestinal Inflammation With 2-Deoxy-2-[18F]Fluoro-d-Glucose and Positron Emission Tomography](https://static.fdokumen.com/doc/165x107/6344fffc596bdb97a908b96f/molecular-imaging-of-murine-intestinal-inflammation-with-2-deoxy-2-18ffluoro-d-glucose.jpg)