Physiological responses to mixing in large scale bioreactors
Upload
independentCategory
view
1download
0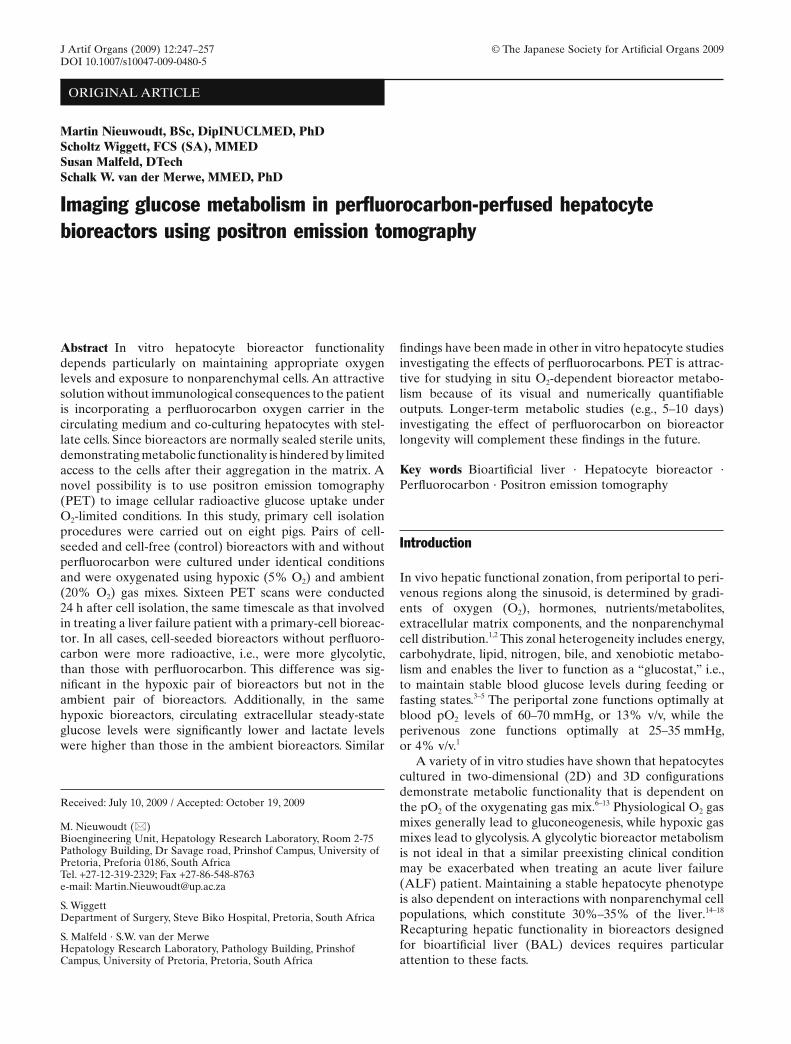
Martin Nieuwoudt, BSc, DipINUCLMED, PhD Scholtz Wiggett, FCS (SA), MMED Susan Malfeld, DTech Schalk W. van der Merwe, MMED, PhD
Imaging glucose metabolism in perfl uorocarbon-perfused hepatocyte bioreactors using positron emission tomography
Abstract In vitro hepatocyte bioreactor functionality depends particularly on maintaining appropriate oxygen levels and exposure to nonparenchymal cells. An attractive solution without immunological consequences to the patient is incorporating a perfl uorocarbon oxygen carrier in the circulating medium and co-culturing hepatocytes with stel-late cells. Since bioreactors are normally sealed sterile units, demonstrating metabolic functionality is hindered by limited access to the cells after their aggregation in the matrix. A novel possibility is to use positron emission tomography (PET) to image cellular radioactive glucose uptake under O2-limited conditions. In this study, primary cell isolation procedures were carried out on eight pigs. Pairs of cell-seeded and cell-free (control) bioreactors with and without perfl uorocarbon were cultured under identical conditions and were oxygenated using hypoxic (5% O2) and ambient (20% O2) gas mixes. Sixteen PET scans were conducted 24 h after cell isolation, the same timescale as that involved in treating a liver failure patient with a primary-cell bioreac-tor. In all cases, cell-seeded bioreactors without perfl uoro-carbon were more radioactive, i.e., were more glycolytic, than those with perfl uorocarbon. This difference was sig-nifi cant in the hypoxic pair of bioreactors but not in the ambient pair of bioreactors. Additionally, in the same hypoxic bioreactors, circulating extracellular steady-state glucose levels were signifi cantly lower and lactate levels were higher than those in the ambient bioreactors. Similar
fi ndings have been made in other in vitro hepatocyte studies investigating the effects of perfl uorocarbons. PET is attrac-tive for studying in situ O2-dependent bioreactor metabo-lism because of its visual and numerically quantifi able outputs. Longer-term metabolic studies (e.g., 5–10 days) investigating the effect of perfl uorocarbon on bioreactor longevity will complement these fi ndings in the future.
Key words Bioartifi cial liver · Hepatocyte bioreactor · Perfl uorocarbon · Positron emission tomography
Introduction
In vivo hepatic functional zonation, from periportal to peri-venous regions along the sinusoid, is determined by gradi-ents of oxygen (O2), hormones, nutrients/metabolites, extracellular matrix components, and the nonparenchymal cell distribution.1,2 This zonal heterogeneity includes energy, carbohydrate, lipid, nitrogen, bile, and xenobiotic metabo-lism and enables the liver to function as a “glucostat,” i.e., to maintain stable blood glucose levels during feeding or fasting states.3–5 The periportal zone functions optimally at blood pO2 levels of 60–70 mmHg, or 13% v/v, while the perivenous zone functions optimally at 25–35 mmHg, or 4% v/v.1
A variety of in vitro studies have shown that hepatocytes cultured in two-dimensional (2D) and 3D confi gurations demonstrate metabolic functionality that is dependent on the pO2 of the oxygenating gas mix.6–13 Physiological O2 gas mixes generally lead to gluconeogenesis, while hypoxic gas mixes lead to glycolysis. A glycolytic bioreactor metabolism is not ideal in that a similar preexisting clinical condition may be exacerbated when treating an acute liver failure (ALF) patient. Maintaining a stable hepatocyte phenotype is also dependent on interactions with nonparenchymal cell populations, which constitute 30%–35% of the liver.14–18 Recapturing hepatic functionality in bioreactors designed for bioartifi cial liver (BAL) devices requires particular attention to these facts.
J Artif Organs (2009) 12:247–257 © The Japanese Society for Artificial Organs 2009DOI 10.1007/s10047-009-0480-5
Received: July 10, 2009 / Accepted: October 19, 2009
M. Nieuwoudt (*)Bioengineering Unit, Hepatology Research Laboratory, Room 2-75 Pathology Building, Dr Savage road, Prinshof Campus, University of Pretoria, Preforia 0186, South Africa Tel. +27-12-319-2329; Fax +27-86-548-8763e-mail: [email protected]
S. WiggettDepartment of Surgery, Steve Biko Hospital, Pretoria, South Africa
S. Malfeld · S.W. van der MerweHepatology Research Laboratory, Pathology Building, Prinshof Campus, University of Pretoria, Pretoria, South Africa
ORIGINAL ARTICLE
248
Some BAL designs perfuse only plasma to avoid the coagulatory and immunological reactions associated with whole-blood exposure to extracorporeal materials. However, under normal conditions, approximately 98% of the O2 in whole blood is carried by hemoglobin (Hb). Thus, at atmo-spheric gas concentrations, metabolically active hepatocytes in plasma-only BALs are likely to become hypoxic and consequently to exhibit glycolytic metabolism. Synthetic perfl uorocarbons (PFCs) are exceptionally inert and have excellent O2 carrying properties. Their inclusion in the circulating medium or plasma therefore represents an at-tractive Hb replacement solution without immunological consequences and may be used to emulate the heteroge-nous gas levels in the liver.
The O2-carrying benefi ts of PFCs have been demon-strated in a limited number of in vitro studies, including 2D hepatocyte cultures,19–22 alginate packed-bed 3D confi gura-tions,23,24 3D microbial bioreactors,25–27 and in one case a 3D C3A-hepatoma bioreactor.28 However, in dynamically cir-culating 3D primary hepatocyte or hepatocyte–stellate cell co-culture bioreactors, the effectiveness of PFC has not been conclusively shown to date. In a previous study,29 we demonstrated that including a (20% v/v) perfl uorooctyl bromide (PFOB)–lecithin emulsion in the circulating medium did maintain the metabolic functionality of primary hepatocyte bioreactors. Lidocaine clearance was signifi -cantly improved relative to PFC-negative [PFC(−)] con-trols, but all other metabolite measurements were similar to those of the control. Our calculations indicated that the O2 level of the oxygenating gas mix (60%) was likely too high to result in hypoxia in the PFC(−) bioreactors.29
A diffi culty in demonstrating bioreactor metabolic func-tionality is the limited access to hepatocytes once they have become aggregated in the matrix. Accessing them requires a bioreactor design that enables parts of the cell-containing matrix to be removed during operation without disrupting either the sterility or metabolic functionality of the system. Bioreactors are normally autoclaved for sterilization prior to application and subsequently remain sealed units. Flow cytometric or gene expression techniques that require the enzymatic liberation or lysis of cells from the matrix conse-quently result in the termination of an experiment. Simi-larly, there is also a lack of consensus regarding the means of reporting metabolite production or clearance values, and highly divergent results have been presented.30 Thus, physi-ologically relevant in situ methods for demonstrating bio-reactor metabolism remain desirable. Owing to its particular benefi ts, positron emission tomography (PET) may be one such method.
In this study, primary in vitro hepatocyte–stellate cell co-culture bioreactors with and without 20% v/v perfl uo-rooctyl bromide–lecithin emulsions were compared in terms of their O2-dependent glucose uptake. The 20% v/v level was selected based on optimal oxygenation and viscosity characteristics.31,32 Hypoxic and ambient O2 gas mixes were used as the oxygenating gas mixes. PET scans, using radio-active glucose (2-[18F]fl uoro-2-deoxy-D-glucose or 18FDG) as the imaging label, were then conducted on the bioreac-tors within 24 h after the primary cell isolation procedure,33
i.e., the same period as would occur if a patient underwent such a BAL treatment. PET is an attractive method for studying bioreactors in that it is well established in the human clinical environment, provides metabolically rele-vant information, and the results are visual and numerically quantifi able.
Materials and methods
After gaining approval from the University of Pretoria Animal Use and Care Ethics Committee, a total of eight Landrace pigs were used in these experiments.
Media and chemicals
Perfl uorooctyl bromide emulsion (40% v/v) was prepared according to the method of Moolman et al.31,32 Briefl y, leci-thin phospholipid (Lipoid E80S, Lipoid AG, Cham, Swit-zerland) was homogenized with a vitamin E stabilizer using a Silverson rotor/stator homogenizer (L4R, Silverson, Chesham Bucks, England) for 1 min at 8000 rpm. Fluoro-carbon was added slowly there after and the mixture homog-enized for 15 min at 6000 rpm. The resulting pre-emulsion was then additionally homogenized with a high-pressure homogenizer (APV-2000, APV Invensys, Midrand, South Africa) for 15 cycles at 1800 bar. This ensured a mean droplet size of 0.2 μm. The emulsion was periodically cooled with ice and gassed with nitrogen to reduce lipid oxidation. Tests to confi rm emulsion stability and droplet size followed.
After autoclaving at 121°C for 30 min, the emulsion was then allowed to cool and was mixed with double-concen-trated cell culture medium and sterile de-ionized water to achieve a 20% v/v PFC emulsion–medium mixture. The mixture was adjusted to pH 7.35–7.4 and used as a culturing medium. Modifi ed hepatocyte growth medium (m-HGM), as previously described,34–38 was used for all cell culturing purposes. Briefl y, this is a cell culture formulation employ-ing Dulbecco’s modifi ed Eagle medium (DMEM) as a base, supplemented with hormones, growth factors, minerals, and antibiotics (see Table 1). All ingredients were purchased from Sigma-Aldrich (Johannesburg, South Africa). After constitution in a high-pressure steel fi ltration container, the m-HGM was sterile fi ltered through a 0.2-μm fi lter using compressed nitrogen. The m-HGM formulation aimed to provide the best possible milieu for hepatocyte function.
The composition of the liver perfusion and cell isolation buffers were as previously described.33 Solutions used for perfusing the liver during and after hepatectomy were cold clinical saline and University of Wisconsin (UW) solution, both of which were supplemented with ethylenediamintet-raacetic acid (EDTA), insulin, dexamethasone, and antibi-otics. For the cell isolation media, freshly prepared fi lter-sterilized collagenase type IV was used for the dissolu-tion of collagen. Cell wash and perfusion buffers were made of sterile deionized water, balanced minerals (NaCl, KCl, CaCl2, and NaHCO3), glucose, hydroxyethylpipera-
249
zineethanesulfonic acid, dexamethasone, and fetal calf serum (FCS). EDTA was used as the chelating agent prior to the addition of collagenase. The oxygenating gas mixture used during the liver perfusions was carbogen (5% CO2 and 90%O2). The density gradient solution included Percoll (Sigma-Aldrich), and Hank’s balanced salt solution. The pH of all solutions was adjusted in a sterile manner to between 7.35 and 7.4 using concentrated HCl or NaOH.
Hepatectomy, organ transport, and cell isolation procedures
All procedures were as previously described in Nieuwoudt et al.33 The animals were sedated, anesthetized, and intu-bated for ventilation. A midline incision was made and the liver was skeletonized. A small endotracheal tube (size 4.0, ET) was inserted into the portal vein and the liver perfused with saline followed by UW organ preservation solution. After complete blanching, the liver was removed, placed in a sterile dish, and transported to the laboratory for the cell isolation procedures. During transportation, the livers were gravitationally perfused with UW solution.
On arrival at the laboratory, the sterile dish containing the liver was transferred to a stainless steel liver perfusion dish in a laminar fl ow cabinet. The ET tube attached to the liver was connected to a circulation loop which sequentially accessed the various perfusion buffers. A peristaltic pump was used to circulate the buffers through the liver. The last of these buffers contained the collagenase solution, which was slowly recirculated through the liver until the capsule ruptured. Flow was then terminated and the liver combed to a cellular mass using a broad-toothed steel comb. The resulting cellular fi ltrate was transferred to a sterile oxygen-ation fl ask.
After gentle oxygenation, the cellular fi ltrate was sucked out of the oxygenation fl ask into the sterile disposable cen-trifuge bowl of a Baylor rapid autologous transfusion
(BRAT) machine. The addition of cell wash buffer, cell resuspension in m-HGM, and centrifugation cycles were carried out until the waste became clear of cell debris. The Percoll density gradient solution was then slowly added until a clear separation formed between the parenchymal and nonparenchymal cell fractions in the bowl. After addi-tional washing, the resulting hepatocytes were suspended in m-HGM and the volume noted for subsequent viability and yield calculations using the trypan blue exclusion test in a Neubauer hemocytometer.
Simultaneous to the hepatocyte isolation procedure, stellate cells were fractionated from the nonparenchymal cell suspensions using the method of Riccalton-Banks et al.15 Briefl y, the cellular collagenase perfusate and discarded supernatant from the hepatocyte washings were pooled in a 1-l Schott bottle and gently oxygenated. The cell suspen-sion was poured into 50-ml centrifuge tubes and then cen-trifuged for 5 min at 50 g. The cell pellets were discarded after the supernatant was transferred to new tubes and centrifuged again for 5 min at 50 g. The pellets were then discarded and the supernatant centrifuged for 10 min at 205 g. Thereafter, the supernatant was discarded and the pellet resuspended in 10 ml m-HGM. Two 10-min centrifu-gation cycles at 205 g and pellet m-HGM resuspension followed.
Cell phenotype confi rmation
As previously demonstrated, the employed cell isolation method33 ensured pure hepatocyte and stellate cell yields, specifi cally by means of Percoll density gradient centrifuga-tion followed by confi rmation with the trypan blue test. However, in additional 2-D culture fl ask experiments in our laboratory, the phenotypes of co-cultured hepatocytes and stellate cells were additionally confi rmed using a triple-stain fl uorescence microscopy procedure. Briefl y, Hoechst 33258 was used to stain the DNA of all cell nuclei blue (emission λ = 505 nm, Sigma-Aldrich B2883);39 hepatocytes were discriminated through their ability to metabolize fl uo-rescein diacetate to green fl uorescein (emission λ = 530 nm, Sigma-Aldrich F7378);40 and stellate cells, activated and expressing smooth muscle actin after the isolation proce-dures, were stained red with phalloidin-tetramethylrhoda-mine B isothiocyanate (emission λ = 570 nm, Sigma-Aldrich P1951).41 These experiments were done in complete dark-ness with an inverted Olympus CKX41 fl uorescence cell culture microscope and an Olympus C4040 digital camera. The photomicrographs revealed differentiated cell aggre-gates resembling bile canalicular structures, which were taken as a sign of a successful co-culture and as a corollary to that in the matrix of the bioreactors.
Bioreactor seeding and evaluation methods
After the isolation procedures, the hepatocyte and stellate cell suspensions were pooled into one container and then divided into two equal portions, resulting in two volumes of
Table 1. Composition of modifi ed hepatocyte growth medium
Component Concentration
Deionized autoclaved H2O 10 l/bottle of DMEMPowdered DMEM Equivalent for 10 lSodium carbonate (NaHCO3) 22 g for 10 l equivalentStreptomycin-fungizone 10 ml/lGentamicin sulfate 1 ml/lFetal calf serum 100 ml/lInsulin mUnits/lGlucagon 15–20 μg/lDexamethazone 67 μg/lEpidermal growth factor 20 μg/lTransferrin (Fe2+ saturated) 200 μl/l or 5–6 mg/lDimethyl sulfoxide (DMSO) 1% v/vGlucose 2 g/lGalactose 2 g/lNicotinamide 0.610 g/lZinc chloride (ZnCl2) 0.544 mg/lZinc sulfate (ZnSO4) 0.750 mg/lCupric sulfate (CuSO4) 0.2 mg/lManganese sulfate (MnSO4) 0.025 mg/lSodium selenite (NaSeO3) 5–6 μg/l
DMEM, Dulbecco’s modifi ed Eagle medium

250
300 ml m-HGM with an equal number of cells in each. These volumes were transferred to independent cell culture media reservoirs and recirculated at 50 ml/min by means of silicon tubing and a single peristaltic pump through two identical 150 ml radial-fl ow bioreactors housed in a nongas nonhumidifi ed incubator at 37.5°C. The medium in the res-ervoirs was oxygenated using an autoclavable aquarium bubbler and a single high-pO2 gas mix (60% O2, 5% CO2, balance N2). Previous studies have demonstrated that high pO2 levels facilitate hepatocyte aggregation following cell isolation procedures.7–9,42 Thus, cell aggregation, or “seeding,” in the open-cell polyurethane foam (PUF) cell-aggregation matrices of the bioreactors followed as previ-ously described.29 A closed and sterile dual-bioreactor confi guration was used (Fig. 1), which represents an in vitro dynamic model of a BAL device. The material from which the bioreactors were machined, polycarbonate, was specifi -cally selected for its autoclavability at 121°C and radiotrans-parency in PET.
After 4 h of recirculation, the media containing the remaining nonaggregated cells was discarded and replaced with fresh medium. One bioreactor was given normal m-HGM while the other received the PFC/m-HGM mixture as described above. The oxygenating gas was also changed to a hypoxic (5% O2, 5% CO2, balance N2) or ambient (20% O2, 5% CO2, balance N2) mix, depending on the particular experiment in progress. The term “ambient” was used in view of the similarity of the particular O2 level to that of air (21%). These gas mixes were selected based on our calcula-tions29 and the fi ndings of previous studies.6–10 They were chosen to discriminate differences in O2-dependent carbo-hydrate metabolism, i.e., glucose uptake between PFC(+) and PFC(−) cell-seeded bioreactors.
Steady-state medium sampling
After 24 h of oxygenation and circulation, sterile 1-ml media samples were taken from the sampling ports of both biore-actors for the electrochemical detection of steady-state pH and gas partial pressures, pO2 and pCO2. A Chiron diagnos-tics Rapidlab 865 clinical blood gas analyzer (Bayer, Johan-nesburg, South Africa) was used for this purpose. At the same time, media samples were also taken in duplicate and immediately frozen for glucose, lactate, and pyruvate detec-tion to investigate bioreactor carbohydrate metabolism as represented by the composition of the circulating extracel-lular medium. Standard spectrophotometric laboratory kits were used for this purpose (Sigma-Aldrich kits: 472500 for glucose, 445875 for lactate, and 726 for pyruvate).
Bioreactor transport and PET imaging
The bioreactors were removed from the incubator and transported to the Little Company of Mary hospital PET facility in Pretoria, South Africa. Recirculation was main-tained throughout by powering the peristaltic pump with a 12-V car battery and a 220-V inverter. The media in the reservoirs was also oxygenated using the particular gas mix being tested in each experiment. The duration of the trans-portation was no more than 20 min, allowing minimal reduction of bioreactor temperature.
At the PET facility the bioreactors were placed on the scanning bed of a Siemens Biograph 6 computed tomogra-phy (CT) PET machine and then centralized with respect to the gantry. Media recirculation and oxygenation was con-tinued throughout. The standard brain scan image data-acquisition program was loaded.
Independent 2.1 ± 0.01 mCi IV-syringe doses of 18FDG were eluted from the on-site Eclipse RD cyclotron and asso-ciated Explora FDG4 automated chemical synthesis unit. In these instruments, deoxyglucose is labeled with 18F (t1/2 = 110 min) by nucleophilic displacement of an acetylated sugar derivative (1,3,4,6-tetra-O-acetyl-2-O-trifl uoromethane-sulfonyl-β-D-mannopyranose) followed by hydrolysis with hydrochloric acid. The hydrolysate is then passed through a C-18 Sep-Pak (Millipore, Johannesburg, South Africa) column to yield 18F-2-fl uoro-2-deoxyglucose (18FDG).
Each bioreactor was sequentially subjected to an identi-cal procedure. The 18FDG dose was injected into the respec-tive PFC(+) or PFC(−) bioreactor circuit’s sampling port and circulated in the medium for 15 min, allowing uptake by the resident cells. Thereafter, the radioactive medium was discarded, followed by two 5-min washout cycles using 150 ml of fresh nonradioactive medium, after which that was also discarded. This ensured, fi rst, that any radioactivity remaining in a given bioreactor was the result of glucose taken up by cells, and second, that a minimal amount of the PFC remained in the cell aggregation matrix. Each biore-actor was scanned with the brain scan program for 20 min, fi rst by CT for positioning, then by PET for 18FDG absorption. Image slice intervals were set to 4 mm. Since positron–electron extinction reactions result in coincident
Fig. 1. Schematic of the dual-bioreactor confi guration. I, nongas incu-bator at 37.5°C; G, regulated gas supply; R1, reservoir with normal modifi ed hepatocyte growth medium (m-HGM); R2, reservoir with synthetic perfl uorocarbons (PFC) with m-HGM medium; P, dual-head peristaltic pump at 50 ml/min; B1, 150-ml bioreactor with normal m-HGM medium; B2, 150-ml bioreactor with PFC + normal m-HGM medium; dashed arrows, silicon tubing with bubbler in-gassing into media; solid arrows, independently circulating silicon tubing media lines

251
gamma photons, the selective detection of these photons by the PET machine results in inherently 3D images.
Image analysis and reporting
CT-corrected PET images were reconstructed using the system’s Syngo (Siemens) image processing software. This fuses the anatomical (CT) data with the functional (PET) data and enables the rotation of the reconstructed bioreac-tor in 3D. The resulting fi les were then transferred to a Siemens multimodality workstation (MI applications 2006A). A volume of interest was drawn around only the cell aggregation matrix within each bioreactor in three axes, i.e., the transverse, sagittal, and coronal axes. The 18FDG radioactive count density (in Bq/ml) for the volume of inter-est was then recorded. Reports were drawn up by slicing each bioreactor through its midline in the above axes and displaying in rows from the top down the PET images, then the CT images, then the fused CT-PET images (Figs. 2 and 3). The report for each bioreactor was printed using
an HP color laser printer. Three-dimensional rotatable video reconstructions were also generated and saved to CD-ROM.
Following PET scanning, the bioreactors were returned to the laboratory and dismantled. The PUF foam from each bioreactor was removed and photographed to confi rm that cells were present.
Statistics and calculations
Microsoft Excel (2003) was used as the spreadsheet for all data. Mean and standard deviations were calculated where possible. Statistix 8, (Analytical Software, Tallahassee, FL, USA) was used when signifi cant differences (P < 0.05) were calculated with two-sample t tests.
The dissolved gas concentrations in the recirculating medium were calculated using the method of Moolman et al.,31,32 i.e., these were either [theoretical] values calculated from absolute atmospheric levels compared to [measured] values calculated from the electrochemical results:
Fig. 2. Computed tomography (CT) and positron emission tomogra-phy (PET) scans of hypoxic gas mix cell-seeded bioreactor without PFC. The fi rst row of images are PET only, the second CT only, the third is the combined CT (in black and white) and PET (in color)
images. The columns represent the transverse, sagittal, and coronal planes respectively. The PET images of PFC(−) bioreactors were more radioactive, indicating greater glucose uptake, i.e., with a more glyco-lytic metabolism than the PFC(+) bioreactors (shown in Fig. 3)
252
CH H
PCO Op
CO O
p
CO OCO Ototal
p w
w2 2
2 2 2 2
2 2
1,
= +−⎡
⎣⎢
⎤
⎦⎥ ⋅
− −
−
ø ø (1)
in mol/m3 with the pressure in bars, where øp is PFOB volume fraction in emulsion, PCO2/O2−w is partial gas tension for CO2 or O2 in aqueous/water/plasma phases in bar, HCO2/O2−p
is Henry’s constant for CO2 or O2 in PFOB at 37°C, HCO2/O2−w
is Henry’s constant for CO2 or O2 in water at 37°C. The constants are HO2−p
is 0.0516 bar·m3/mol, HO2−w is 0.95
bar·m3/mol in water or 0.988 bar·m3/mol in blood plasma (taken as approximately equivalent), HCO2−p
is 0.0121 bar·m3/mol, HCO2−w
is 0.0394 bar·m3/mol in blood plasma.
The following assumptions were made:
1. The gases were completely equilibrated in all phases, e.g., pO2 (water) = pO2 (gas). This is reasonable in that the 0.2-μm droplets have a large surface area for mass trans-fer and measurements were taken following 24 h of in-gassing.
2. The medium was maximally gas loaded, i.e., pCO2 and pO2 were at their maximum when the CO2 in the gas mix was 5%.
3. O2 consumption and CO2 release by cells was not taken into account in that the medium was in-gassed maximally during the experiments.
Results
Since the BRAT centrifuge bowls used for isolating hepa-tocytes were all of a fi xed volume (165 ml) and the stellate cell isolation procedures were identical, the total cell quan-tities remained approximately equivalent, i.e., a mean of 1.852 × 10¹⁰ hepatocytes and 1.84 × 10⁸ stellate cells prior to subdivision for the two bioreactors. The number of PET experiments conducted per experimental group, the mean number of cells seeded per bioreactor (9.26 × 10⁹ hepato-cytes and 1.84 × 10⁸ stellate cells), the calculated gas con-
Fig. 3. CT and PET scan of hypoxic gas mix cell-seeded bioreactor with PFC. PFC(+) bioreactors were all less radioactive than the PFC(−) bio-reactors, having absorbed less glucose, i.e., they exhibited a less glycolytic metabolism than the PFC(−) bioreactors

253
Tabl
e 2.
See
ded
cell
coun
ts, p
osit
ron
emis
sion
tom
ogra
phy
(PE
T)
bior
eact
or r
adia
tion
cou
nts
(18F
DG
-upt
ake)
, and
ele
ctro
chem
ical
pH
and
gas
res
ults
24
h af
ter
cell
isol
atio
n pr
oced
ures
Gro
upG
as m
ix[T
heor
etic
al]a
(mol
/m3 )
Cel
ls/b
iore
acto
rP
ET
cou
nts/
bior
eact
or(B
q/m
l)M
easu
red
med
ia p
H a
nd g
as p
arti
al p
ress
ures
[Mea
sure
d]a
(mol
/m3 )
(mm
Hg)
(mm
Hg)
Hyp
oxic
(n
= 4)
5%O
2, 5%
CO
2, ba
lanc
e N
2
PF
C(−
) O
2 =
0.05
PF
C(+
) O
2 =
0.24
PF
C(−
) C
O2
= 1.
27P
FC
(+)
CO
2 =
1.84
9.26
× 1
09 hep
atoc
ytes
1.84
× 1
08 ste
llate
cel
lsP
FC
(+):
3.29
× 1
04 ± 2
.28
× 10
3
PF
C(−
): 7.
94 ×
104 ±
1.8
9 ×
104
(−)
> (+
): 5
7.0%
± 9
.99%
c
PF
C(+
) pH
: 7.6
15
± 0.
021
pO2:
108.
03 ±
5.5
3pC
O2:
13.4
8 ±
5.51
PF
C(−
) pH
: 7.6
64 ±
0.2
99pO
2: 71
.74
± 0.
79pC
O2:
24.6
03 ±
0.3
2
PF
C(−
) O
2 =
0.10
PF
C(+
) O
2 =
0.55
PF
C(−
) C
O2
= 0.
83P
FC
(+)
CO
2 =
0.86
PF
C(−
) O
2/CO
2 = 0
.04
PF
C(+
) O
2/CO
2 = 0
.13
pO2/p
CO
2: 8.
02pO
2/pC
O2:
2.92
PF
C(−
) O
2/CO
2 = 0
.12
PF
C(+
) O
2/CO
2 = 0
.97
Hyp
oxic
con
trol
(n
= 1
)5%
O2,
5%C
O2,
bala
nce
N2
As
abov
e0
PF
C(+
): 1.
77 ×
104
PF
C(−
): 2.
32 ×
104
(−)
> (+
): 2
3.7%
b
PF
C(+
) pH
: 7.6
1 pO
2: 67
.8pC
O2:
21.4
PF
C(−
) pH
: 7.4
6pO
2: 67
.2pC
O2:
24.0
pO2/p
CO
2: 3.
17pO
2/pC
O2:
2.80
Am
bien
t (n
= 2
)20
%O
2,5%
CO
2,ba
lanc
e N
2
PF
C(−
) O
2 =
0.21
PF
C(+
) O
2 =
0.94
PF
C(−
) C
O2
= 1.
27P
FC
(+)
CO
2 =
1.84
9.26
× 1
09 hep
atoc
ytes
1.84
× 1
09 ste
llate
cel
lsP
FC
(+):
2.05
× 1
04 ± 1
.28
× 10
4
PF
C(−
): 5.
24 ×
104 ±
2.8
1 ×
104
(−)
> (+
): 6
2.0%
± 4
.0%
c
PF
C(+
) pH
: 7.7
97
± 0.
117
pO2:
113.
6 ±
12.4
5pC
O2:
9.72
± 1
.67
PF
C(−
) pH
: 7.4
49 ±
0.0
23pO
2: 10
6.96
± 1
2.67
pCO
2: 22
.42
± 1.
67
PF
C(−
) O
2 =
0.15
PF
C(+
) O
2 =
0.73
PF
C(−
) C
O2
= 0.
79P
FC
(+)
CO
2 =
0.77
PF
C(−
) O
2/CO
2 = 0
.16
PF
C(+
) O
2/CO
2 = 0
.51
pO2/p
CO
2: 11
.69
pO2/p
CO
2: 4.
77P
FC
(−)
O2/C
O2 =
0.1
9P
FC
(+)
O2/C
O2 =
0.9
5A
mbi
ent
cont
rol
(n =
1)
20%
O2,
5%C
O2,
bala
nce
N2
As
abov
e0
PF
C(+
): 4.
65 ×
104
PF
C(−
): 5.
49 ×
104
(−)
> (+
): 1
5.4%
b
PF
C(+
) pH
: 7.6
1pO
2: 11
7.3
pCO
2: 21
.4
PF
C(−
) pH
: 7.4
45pO
2: 11
6.0
pCO
2: 24
.1pO
2/pC
O2:
5.48
pO2/p
CO
2: 4.
81P
revi
ous
stud
ies
60%
O2
90%
O2
PF
C(−
) O
2 =
0.63
PF
C(+
) O
2 =
2.83
PF
C(−
) O
2 =
0.96
PF
C(+
) O
2 =
4.29
All
valu
es g
iven
as
mea
n ±
SD18
FD
G, 2
-[18
F]fl
uor
o-2-
deox
y-D
-glu
cose
; PF
C(−
), w
itho
ut p
erfl u
oroc
arbo
n; P
FC
(+),
wit
h pe
rfl u
oroc
arbo
na [T
heor
etic
al]
and
[Mea
sure
d] v
alue
s w
ere
calc
ulat
ed a
s pe
r th
e m
etho
d of
Moo
lman
et
al.31
,32
b The
mea
n di
ffer
ence
in t
he P
ET
cou
nts
for
the
cell-
free
con
trol
s: P
FC
(−)
vs. P
FC
(+)
was
19.
6%c T
here
was
a s
igni
fi can
t di
ffer
ence
bet
wee
n th
e 18
FD
G r
adio
acti
vity
cou
nts
of h
ypox
ic c
ell-
seed
ed P
FC
(−)
vs. P
FC
(+)
bior
eact
ors
(57%
, P =
0.0
1). T
his
was
not
the
cas
e fo
r th
e am
bien
t ce
ll-se
eded
bi
orea
ctor
s (6
2%, P
= 0
.3),
but
the
resu
lts
wer
e si
gnifi
cant
whe
n co
mbi
ned
(59.
5%, P
= 0
.04)
254
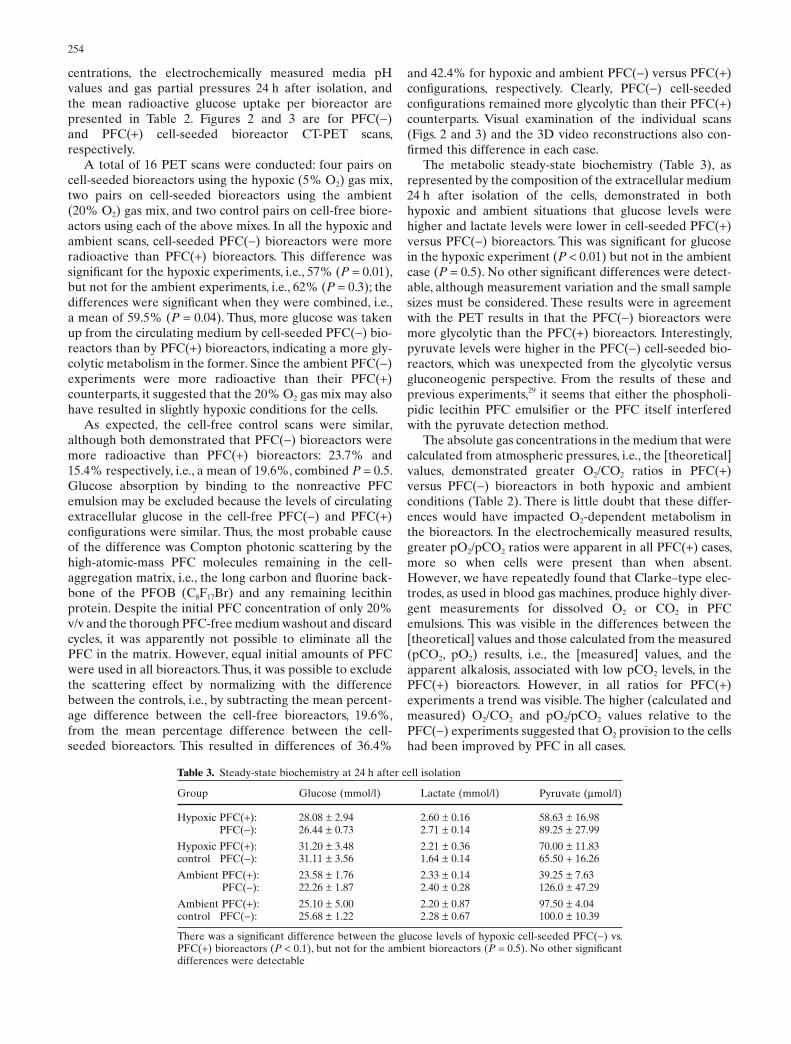
Table 3. Steady-state biochemistry at 24 h after cell isolation
Group Glucose (mmol/l) Lactate (mmol/l) Pyruvate (μmol/l)
Hypoxic PFC(+): 28.08 ± 2.94 2.60 ± 0.16 58.63 ± 16.98PFC(−): 26.44 ± 0.73 2.71 ± 0.14 89.25 ± 27.99
Hypoxic PFC(+): 31.20 ± 3.48 2.21 ± 0.36 70.00 ± 11.83control PFC(−): 31.11 ± 3.56 1.64 ± 0.14 65.50 + 16.26
Ambient PFC(+): 23.58 ± 1.76 2.33 ± 0.14 39.25 ± 7.63PFC(−): 22.26 ± 1.87 2.40 ± 0.28 126.0 ± 47.29
Ambient PFC(+): 25.10 ± 5.00 2.20 ± 0.87 97.50 ± 4.04control PFC(−): 25.68 ± 1.22 2.28 ± 0.67 100.0 ± 10.39
There was a signifi cant difference between the glucose levels of hypoxic cell-seeded PFC(−) vs. PFC(+) bioreactors (P < 0.1), but not for the ambient bioreactors (P = 0.5). No other signifi cant differences were detectable
centrations, the electrochemically measured media pH values and gas partial pressures 24 h after isolation, and the mean radioactive glucose uptake per bioreactor are presented in Table 2. Figures 2 and 3 are for PFC(−) and PFC(+) cell-seeded bioreactor CT-PET scans, respectively.
A total of 16 PET scans were conducted: four pairs on cell-seeded bioreactors using the hypoxic (5% O2) gas mix, two pairs on cell-seeded bioreactors using the ambient (20% O2) gas mix, and two control pairs on cell-free biore-actors using each of the above mixes. In all the hypoxic and ambient scans, cell-seeded PFC(−) bioreactors were more radioactive than PFC(+) bioreactors. This difference was signifi cant for the hypoxic experiments, i.e., 57% (P = 0.01), but not for the ambient experiments, i.e., 62% (P = 0.3); the differences were signifi cant when they were combined, i.e., a mean of 59.5% (P = 0.04). Thus, more glucose was taken up from the circulating medium by cell-seeded PFC(−) bio-reactors than by PFC(+) bioreactors, indicating a more gly-colytic metabolism in the former. Since the ambient PFC(−) experiments were more radioactive than their PFC(+) counterparts, it suggested that the 20% O2 gas mix may also have resulted in slightly hypoxic conditions for the cells.
As expected, the cell-free control scans were similar, although both demonstrated that PFC(−) bioreactors were more radioactive than PFC(+) bioreactors: 23.7% and 15.4% respectively, i.e., a mean of 19.6%, combined P = 0.5. Glucose absorption by binding to the nonreactive PFC emulsion may be excluded because the levels of circulating extracellular glucose in the cell-free PFC(−) and PFC(+) confi gurations were similar. Thus, the most probable cause of the difference was Compton photonic scattering by the high-atomic-mass PFC molecules remaining in the cell-aggregation matrix, i.e., the long carbon and fl uorine back-bone of the PFOB (C8F17Br) and any remaining lecithin protein. Despite the initial PFC concentration of only 20% v/v and the thorough PFC-free medium washout and discard cycles, it was apparently not possible to eliminate all the PFC in the matrix. However, equal initial amounts of PFC were used in all bioreactors. Thus, it was possible to exclude the scattering effect by normalizing with the difference between the controls, i.e., by subtracting the mean percent-age difference between the cell-free bioreactors, 19.6%, from the mean percentage difference between the cell-seeded bioreactors. This resulted in differences of 36.4%
and 42.4% for hypoxic and ambient PFC(−) versus PFC(+) confi gurations, respectively. Clearly, PFC(−) cell-seeded confi gurations remained more glycolytic than their PFC(+) counterparts. Visual examination of the individual scans (Figs. 2 and 3) and the 3D video reconstructions also con-fi rmed this difference in each case.
The metabolic steady-state biochemistry (Table 3), as represented by the composition of the extracellular medium 24 h after isolation of the cells, demonstrated in both hypoxic and ambient situations that glucose levels were higher and lactate levels were lower in cell-seeded PFC(+) versus PFC(−) bioreactors. This was signifi cant for glucose in the hypoxic experiment (P < 0.01) but not in the ambient case (P = 0.5). No other signifi cant differences were detect-able, although measurement variation and the small sample sizes must be considered. These results were in agreement with the PET results in that the PFC(−) bioreactors were more glycolytic than the PFC(+) bioreactors. Interestingly, pyruvate levels were higher in the PFC(−) cell-seeded bio-reactors, which was unexpected from the glycolytic versus gluconeogenic perspective. From the results of these and previous experiments,29 it seems that either the phospholi-pidic lecithin PFC emulsifi er or the PFC itself interfered with the pyruvate detection method.
The absolute gas concentrations in the medium that were calculated from atmospheric pressures, i.e., the [theoretical] values, demonstrated greater O2/CO2 ratios in PFC(+) versus PFC(−) bioreactors in both hypoxic and ambient conditions (Table 2). There is little doubt that these differ-ences would have impacted O2-dependent metabolism in the bioreactors. In the electrochemically measured results, greater pO2/pCO2 ratios were apparent in all PFC(+) cases, more so when cells were present than when absent. However, we have repeatedly found that Clarke–type elec-trodes, as used in blood gas machines, produce highly diver-gent measurements for dissolved O2 or CO2 in PFC emulsions. This was visible in the differences between the [theoretical] values and those calculated from the measured (pCO2, pO2) results, i.e., the [measured] values, and the apparent alkalosis, associated with low pCO2 levels, in the PFC(+) bioreactors. However, in all ratios for PFC(+) experiments a trend was visible. The higher (calculated and measured) O2/CO2 and pO2/pCO2 values relative to the PFC(−) experiments suggested that O2 provision to the cells had been improved by PFC in all cases.

255
Discussion
Several techniques have historically been employed to overcome O2 limitations in hepatocyte cultures and bioreac-tors, including optimizing the porosity of the extracellular matrix (ECM),23 the incorporation of perfl uorocarbon-based O2 carriers in the ECM,24 adding 5% Perftoran to the cell culture medium,28 the use of bovine hemoglobin O2 carriers in the circulating medium,43 and increasing the number and diameter of gas carrying hollow fi bers (HF) in such bioreactors.44 A simplistic approach is to increase the pO2 of the oxygenating gas mix. However, this is potentially hazardous in that large hepatocyte aggregates may be exposed to hyperoxic conditions externally, while remain-ing hypoxic in their internal regions and resulting in an increase in cell mortality.24 Including a 20% v/v PFOB–leci-thin emulsion in the circulating medium is a feasible method (and is without immunological impacts) for replacing circu-lating hemoglobin and attaining a milieu similar to the metabolic zonation found in the in vivo liver.
The gas mixes used in this study to represent either hypoxic or ambient/normal situations were based on previ-ous examples6–10 and on estimates calculated by ourselves.29 However, some uncertainty remained because bioreactor oxygenation characteristics vary according to the reactor design and are consequently different in each case. The bioreactors used in this study were an improved form of an earlier version.29 Extensive fl ow and mass transport optimi-zation had subsequently been carried out.45 Thus, the fl ow dynamics in this case would clearly differ from that in 2D culture fl asks or 3D HF bioreactors. Our results suggest that the ambient (20% O2) gas mix may also have been slightly hypoxic to the cells. This was despite fi ndings to the con-trary in a previous 2D in vitro study employing the same gas mix.7
Mareels et al.44 found by numerical modeling and experi-mentation that a large majority of the cells in an earlier iteration of the Amsterdam Medical College (AMC) HF bioreactor were hypoxic using a 60% O2 gas mix. As a result, the AMC bioreactor’s internal confi guration and oxygenating gas was altered to a 95% O2 mix. We have reservations regarding this approach. Our results suggest an ideal O2 level of greater than 20%, but certainly less than 60%, as was previously employed by us.29 Additional numerical modeling and experimentation will aid in resolv-ing this fi gure in the future.
In agreement with a previous study,46 we have found that electrochemical methods, e.g., blood gas machines, are not ideal for measuring the O2 dissolved in PFC emulsions. This was evident in the differences between the [theoretical] values calculated from atmospheric pressure and the [mea-sured] values calculated from the electrochemical results. The measured pO2 and pCO2 values (Table 2) represent those predominantly in the aqueous phase and do not accu-rately account for the substantially more gas dissolved in the micellar–organic phase. Unfortunately, aqueous pO2 and pCO2 levels can only indirectly be compared with those measured in whole blood or in the organic phase of PFC.
However, our results did indicate improved theoretical O2/CO2 and measured pO2/pCO2 ratios associated with PFC in all cases. This would suggest that PFC had improved the delivery of O2 to cells in all cases.
Clinical imaging technologies have previously been employed in studying hepatocyte bioreactors. This has been done using magnetic resonance imaging (MRI)45,47–51 and once by ourselves using single photon emission tomography (SPET) with 99mTc-diisopropyliminondiacetic acid (publica-tion in progress), but apparently never with PET. Two studies used PET to image bioartifi cial myocardial grafts in a solid matrix52,53 and one to image a tissue-engineered trachea.54 In general, MRI provides anatomical informa-tion, fl ow information, or both, while SPET and PET provide physiological information. In 18FDG-PET, a hydroxyl group in glucose is replaced with 18F, and owing to its short half-life (t1/2 = 110 min), noninvasive in vivo studies of carbohydrate metabolism are possible.55 PET scan data is inherently three-dimensional owing to the elec-tronic scintillation detection of 180°-coincident photons originating in a positron–electron extinction reaction. The resolution of the images is high owing to the coincidence detection methodology. PET scans of in situ hepatocytes in bioreactors require the latter to be constructed of materials that are sterilizable and radiotransparent to 511-keV gamma photons. In this case, the bioreactors were machined from polycarbonate, which is autoclavable at 121°C and provides no obstruction to such photons.
All the PET scans in this study indicated higher levels of glycolytic metabolism in cell-seeded bioreactors without PFC. The extracellular steady-state glucose and lactate levels were in agreement with this, and also with similar fi ndings in other cell culture studies investigating the effects of PFCs.24,28 Taken together, this fi nding may be accepted as confi rmation of the success of our procedures. Bearing in mind the normal clinical purpose of 18FDG-PET, namely to examine glycolytic lesions such as cancer in human patients,55 it is perhaps unsurprising that it was successful in this case. Having said that, maintaining exactly the same experimental conditions was necessary throughout, and success must partly be owing to this.
Since the application of PET in this case was novel, it was necessary to estimate the radioactive doses. In view of the necessity of discarding the washout media to maximally control the experimental conditions, and to decrease radia-tion exposure to personnel, and because the employed bio-reactors were sealed units following their autoclaving prior to cell seeding, it was not possible to gather information using methods that would require cell liberation or lysis from the cell aggregation matrix. This was a short-term study, i.e., it was on the same timescale following cell isola-tion as would occur in BAL treatments using primary cells. However, hepatocyte metabolism is diverse and may change with the duration of culturing. In the future, the use of lower 18FDG doses may allow longer-term bioreactor inves-tigations (e.g., 5–10 days) after PET scans. It will then be interesting to additionally investigate the effect of improved O2 provision by PFC on nitrogenous metabolism, xenobi-otic hepatocyte metabolism, or both. No studies thus far

256
have investigated the effects of PFC on bioreactor longevity.
In conclusion, this study demonstrated that 18FDG-PET was an effective imaging modality for investigating the in situ O2-dependent metabolism of hepatocyte bioreactors in conditions simulating those likely to be found in plasma-only BAL treatments. Agreement with the PET results was found in the levels of the circulating extracellular metabo-lites. In the future, longer-term metabolic studies will provide complementary information to the above fi ndings.
Acknowledgments To the staff of the Little company of Mary PET facility for their patience and enthusiasm for this study. To Professor JHR Becker of the Department of Surgery, University of Pretoria, for his advice and assistance with this study.
References
1. Nahmias Y, Berthiaume F, Yarmush ML. Integration of technolo-gies for hepatic tissue engineering. Adv Biochem Eng Biotechnol 2006;103:309–329
2. Arias IM, Boyer JL, Chisary FV, Fausto N, Jakoby WB, Schachter D, Shafritz DA (eds). The liver: biology and pathobiology. Phila-delphia: Lippincott, Williams, and Wilkins, 2001;3
3. Jundermann K, Kietzmann T. Zonation of parenchymal and non-parenchymal metabolism in liver. Annu Rev Nutrit 1996;16:179–260
4. Jundermann K, Thurman RG. Hepatocyte heterogeneity in the metabolism of carbohydrates. Enzyme 1992;46:33–58
5. Lindros KO. Zonation of cytochrome P450 expression, drug metabolism and toxicity in liver. Gen Pharmacol 1997;28:191–196
6. Allen JW, Bhatia SN. Formation of steady-state oxygen gradients in vitro. Biotechnol Bioeng 2003;82(3):253–362
7. Nishikawa M, Uchino J, Matsushita M, Takahashi M, Taguchi K, Koike M, Kamachi H, Kon H. Optimal oxygen tension conditions for functioning cultured hepatocytes in vitro. Artif Organs 1996;20(2):169–177
8. Rotem A, Toner M, Bhatia S, Foy BD, Tompkins RG, Yarmush ML. Oxygen is a factor determining in vitro tissue assembly: effects on attachment and spreading of hepatocytes. Biotech Bioeng 1994;43:654–660
9. Wolfe D, Schmidt H, Jungermann K. Short-term modulation of glycogen metabolism, glycolysis and gluconeogenesis by physiolog-ical oxygen concentrations in hepatocyte cultures. Eur J Biochem 1983;135:405–412
10. Wolfe D, Jundermann K. Long-term effects of physiological oxygen concentrations on glycolysis and gluconeogenesis in hepa-tocyte cultures. Eur J Biochem 1985;151:299–303
11. Ohno K, Maier P. Cultured rat hepatocytes adapt their cellular glycolytic activity and adenylate energy status to tissue oxygen tension. J Cellular Physiol 1994;160:358–366
12. Allen JW, Khetani SR, Bhatia SN. In vitro zonation and toxicity in a hepatocyte bioreactor. Toxicol Sci 2005;84:110–119
13. Sivaraman A, Laech JK, Townsend S, Iida T, Hogan BJ, Stolz DB, Fry R, Samson LD, Tannenbaum SR, Griffi th LG. A microscale in vitro physiological model of the liver: predictive screens for drug metabolism and enzyme induction. Curr Drug Metab 2005;6:569–591
14. Allen JW, Bhatia SN. Improving the next generation of bio-artifi cial livers. Cell Develop Biol 2002;13:447–454
15. Riccalton-Banks L, Liew C, Bhandari R, Fry J, Shakesheff K. Long-term culture of functional liver tissue: 3-D coculture of primary hepatocytes and stellate cells. Tissue Eng 2003;9(3):401–410
16. Watanabe T, Shibata N, Westerman KA, Okitsu T, Kobayashi N. Establishment of immortalized human hepatic stellate scavenger cells to develop bioartifi cial livers. Transplantation 2003;75:1873–1880
17. Morin O, Normand C. Long-term maintenance of hepatocyte func-tional activity in co-culture. J Cell Physiol 1986;129:103–110
18. Okamoto M, Ishida Y, Keogh A, Strain A. Evaluation of the func-tion of primary human hepatocytes co-cultured with the human hepatic stellate cell (HSC) line L190. Int J Artif Org 1998;6:353–359
19. Lowe KC, Davey MR, Power JB. Perfl uorochemicals: their appli-cations and benefi ts to cell culture. Trends Biotechnol 1998;16:272–277
20. King AT, Mulligan BJ, Lowe KC. Review: perfl uorochemicals and cell culture. Biotechnology 1989;7:1037–1042
21. Lowe KC, Anthony P, Wardrop J, Davey MR, Power JB. Perfl uo-rochemicals and cell biotechnology. Artif Cells Blood Substit Immobil Biotechnol 1997;25(3):261–274
22. Lowe KC. Review. Engineering blood: synthetic substitutes from fl uorinated compounds. Tissue Eng 2003;9(3):389–399
23. Niu M, Clemens MG, Coger RN. Optimizing normoxic conditions in liver devices using enhanced gel matrices. Biotechnol Bioeng 2007;99(6):1502–1512
24. Khattak SF, Chin K, Bhatia SR, Roberts SC. Enhancing O2 tension and cellular function in alginate cell encapsulation devices through the use of perfl uorocarbons. Biotechnol Bioeng 2007;96(1):156–166
25. Ju LK, Lee JF, Armiger WB. Enhancing oxygen transfer in biore-actors by perfl uorocarbon emulsions. Biotechnol Prog 1991;7:323–329
26. McMillan JD, Wang DIC. Enhanced oxygen transfer using oil-in-water dispersions. Ann New York Acad Sci 1987;506:569–582
27. Elibol M, Mavituna F. Effect of perfl uorodecalin as an oxygen carrier on actinorhodin production by Streptomyces coelicor. Appl Microbiol Biotechnol 1995;43:206–210
28. Kinasiewicz A, Smietanka A, Gajkowska B, Werynski A. Impact of oxygenation of bioartifi cial liver using perfl uorocarbon emulsion Perftoran on metabolism of human hepatoma C3A cells. Artif Cells Blood Substit Immobil Biotechnol 2008;36:525–534
29. Nieuwoudt M, Moolman S, Van Wyk AJ, Kreft E, Olivier B, Laurens JB, Stegman F, Vosloo J, Bond R, van der Merwe SW. Hepatocyte function in a radial-fl ow bioreactor using a perfl uoro-carbon oxygen carrier. Artif Organs 2005;29(11):915–918
30. Hoekstra R, Chamuleau RAFM. Recent developments on human cell lines for the bio-artifi cial liver. Int J Artif Org 2002;25(3):182–191
31. Moolman FS, Rolfes H, van der Merwe SW, Focke WW. Optimi-zation of perfl uorocarbon emulsion properties for enhancing oxygen mass transfer in a bio-artifi cial liver support system. Biochem Eng J 2004;19:237–250
32. Moolman FS. Oxygen carriers for a novel bio-artifi cial liver support system. PhD Thesis, University of Pretoria, 2004, available at http://upetd.up.ac.za/thesis/available/etd-09092004-162043/
33. Nieuwoudt MJ, Kreft E, Olivier B, Malfeld S, Vosloo J, Stegman F, van der Merwe SW. A large-scale automated method for hepa-tocyte isolation: effects on proliferation in culture. Cell Transplant 2005;14(5):291–299
34. Block GD, Locker J, Bowen WC, Petersen BE, Katyal S, Strom SC, Riley T, Howard TA, Michalopolous GK. Population expan-sion, clonal growth and specifi c differentiation patterns in primary cultures induced by HGF/SF, EGF and TDF in a chemically defi ned (HGM) medium. J Cell Biology 1996;132(6):1133–1149
35. Runge DM, Runge D, Dorko K, Pisarov LA, Leckel K, Kostrub-sky VE, Thomas D, Strom SC, Michalopoulos GK. EGF and HGF activity in serum-free cultures of human hepatocytes. J Hepatol 1999;30:265–274
36. Su T, Waxman D. Impact of DMSO and expression of nuclear receptors and drug-inducible cytochromes P450 in primary rat hepatocytes. Arch Biochem Biophys 2004;424:226–234
37. Powers MJ, Janigian DM, Wack KE, Baker CS, Stolz DB, Griffi th LG. Functional behaviour of primary rat liver cells in a 3D per-fused microarray bioreactor. Tissue Eng 2002;8(3):499–513
38. Jasmund I, Schwientek S, Acikgoz A, Langsch A, Machens HG, Bader A. The infl uence of medium composition and matrix on long-term cultivation of primary porcine and human hepatocytes. Biomol Eng 2007;24:59–69
39. Rago R, Mitchen J, Wilding G. DNA fl uorometric assay in 96-well culture plates using Hoechst 33258. Anal Biochem 1990;191:31–34
257
40. Nyberg SL, Shatford RA, Payne WD, Hu WS, Cerra FB. Staining with fl uorescein diacetate correlates with hepatocyte function. Biotech Histochem 1993;68(1):56–62
41. Faultsch H, Zobeley S, Rinnerthaler G, Small JV. Fluorescent phallotoxins for fi lamentous actin. J Muscle Res Cell Motil 1988;9:370–383
42. Smith MD, Smirthwaite AD, Cairns DE, Cousins RB, Gaylor JD. Techniques for measurement of oxygen consumption rates of hepatocytes during attachment and post-attachment. Int J Artif Org 1996;19(1):36–44
43. Sullivan J, Harris DR, Palmer AF. Convection and hemoglobin-based O2 carrier enhanced transport in a HF bioreactor. Artif Cells Blood Substit Immobil Biotechnol 2008;36:386–402
44. Mareels G, Poyck P, Elloot S, Chamuleau R, Verdonck P. Numeri-cal simulation of fl uid fl ow and oxygen transport in a full-scale model of the AMC bioartifi cial liver with an in vitro determined hepatocyte distribution. Ann Biomed Eng 2006 34(11):1729–1744
45. Ronné LJT. Design considerations and analysis of a bioreactor for application in a bioartifi cial liver support system. Masters disserta-tion, University of Pretoria, 2007
46. Freire MG, Dias AMA, Coutinho JAP, Coelho MAZ, Marrucho IM. Enzymatic method for determining O2 solubility in perfl uoro-carbon emulsions. Fluid Phase Equil 2005;231:109–113
47. Martin Y, Vermette P. Bioreactors for tissue mass culture: design, characterization and recent advances. Biomaterials 2005;26:7481–7503
48. Heath CA, Hammer BE, Pimbley JM. Magnetic resonance imaging of fl ow in HF bioreactors. AIChE J 1990;36(4):547–558
49. Donoghue C, Brideau M, Newcomer P, Pangrle B, DiBasio D, Walsh E, Moore S. Use of MRI to analyse the performance of HF bioreactors. Ann NY Acad Sci 1992;665:285–300
50. Planchamp C, Ivancevic MK, Pastor CM, Valle´e JP, Pochon S, Terrier F, Mayer JM, Reist M. Hollow fi ber bioreactor: new devel-opment for the study of contrast agent transport into hepatocytes by magnetic resonance imaging. Biotechnol Bioeng 2004;85(6):656–665
51. Ferreira EC, Mota M, Pons MN. Image analysis and multiphase bioreactors. In: Multiphase bioreactor design. Cabral JMS, Mota M, Tramper J (eds) London: Taylor and Francis, 2001;25–52
52. Kofi dis T, Lenz A, Boublik J, Akhyari P, Wachsmann B, Stahl KM, Haverich A, Leyh RG. Bioartifi cial grafts for transmural myocar-dial restoration: a new cardiovascular tissue culture concept. Eur J Cardiothorac Surg 2003;24:906–911
53. Kofi dis T, Lenz A, Boublik J, Akhyari P, Wachsmann B, Stahl KM, Hofmann M, Haverich A. Pulsatile perfusion and cardiomyocyte viability in a solid 3D matrix. Biomaterials 2003;24:5009–5014
54. Walles T, Giere B, Hofmann M, Schanz J, Hofmann F, Mertsching H, Macchiarini P. Experimental generation of a tissue-engineered functional and vascularized trachea. Gen Thorac Surg 2004;129(6):900–906
55. Phelps ME. Positron emission tomography provides molecular imaging of biological processes. PNAS 2000;97(16):9226–9233
Copyright © 2022 FDOKUMEN