Microbial Electrolysis Cells for Decentralised Wastewater ...

Desalination and Water Treatmentwww.deswater.com1944-3994 / 1944-3986 © 2011 Desalination Publications. All rights reserved.doi: 10.5004/dwt.2011.2614
33 (2011) 86–96 September
* Corresponding author.
Presented at the 2nd International Conference on Environmental Management, Engineering, Planning and Economics (CEMEPE), Mykonos, Greece, June 21–26, 2009.
Potable water hydrogenotrophic denitrification in packed-bed bioreactors coupled with a solar-electrolysis hydrogen production system
K.A. Karanasiosa, M.K. Michailidesa, I.A. Vasiliadoua, S. Pavloub,c, D.V. Vayenasa,c*aDepartment of Environmental and Natural Resources Management, University of Ioannina, G. Seferi 2, 30100 Agrinio, GreeceTel. +30 26410 74117; Fax +30 26410 74176; email: [email protected] of Chemical Engineering, University of Patras, 26504 Patras, GreececInstitute of Chemical Engineering and High Temperature Chemical Processes, 26504 Patras, Greece
Received 16 January 2010; Accepted in revised form 1 October 2010
abstractThe aim of this study was to investigate the performance of bench-scale packed-bed reactors for hydrogenotrophic denitrification with hydrogen produced from electrolysis of water and electric energy provided by a solar cell. Two configurations were used, a single filter and a triple-column reactor, with gravel of different sizes as support media. The effect of hydrogen and carbon dioxide supply on the performance of the two systems of bioreactors under continuous operation was examined. The multi-filter system achieved high performances as it could safely treat polluted water with a low hydrogen and carbon dioxide consumption. A denitrification rate of 2 kg/m3d was acheived for nitrate nitrogen and hydraulic loading of 1.44 g NO3
–-N/d and 11.5 m3/m2d, re-spectively. Also, a mathematical model was developed by using growth kinetics expressions for four-nutrient limitation (nitrate, nitrite, hydrogen and carbon dioxide) with inhibition by nitrate. The proposed model is capable of describing accurately enough, hydrogenotrophic denitrification under continuous operation.
Keywords: Denitrification; Packed-bed reactors; Hydrogen production; Electrolysis; Modeling
1. Introduction
Nitrate contamination of groundwater and surface water, due to unbounded use of fertilizers and pesticides, has become a common environmental problem in many parts of the world. Nitrate- and nitrite-nitrogen removal is an important issue, since they are dangerous for public health when present in drinking water at levels above 11.3 mg NO3
–-N/L and 0.03 mg NO2–-N/L [1]. Nitrate ni-
trogen (NO3–-N) enrichment of receiving waters should
be avoided, since drinking water containing high NO3–-N
concentrations is reported to increase the probability of
methemoglobinaemia (also called a blue-baby disease) and gastric cancers [2].
Biological denitrification is the process that reduces nitrate (NO3
–) to nitrite (NO2–), to nitric oxide (NO), to
nitrous oxide (N2O), and finally to nitrogen gas (N2). The use of autotrophic over heterotrophic denitrification ensures low biomass build-up, reduction of reactor clog-ging and avoidance of organic carbon contamination of treated water. Hydrogen gas (H2) as an electron donor is an excellent autotrophic choice, due to its clean nature. It does not persist in the treated water and no further steps are required to remove either excess substrate or its derivatives [3].

K.A. Karanasios et al. / Desalination and Water Treatment 33 (2011) 86–96 87
The main limitation of hydrogen-driven denitrifica-tion is the low solubility of hydrogen gas resulting in low-mass transfer rate and possible accumulation of hydrogen gas in a closed head space, thus creating an explosive environment [4]. To date, a variety of reactor configurations have been used for efficient hydrogen delivery. Many researchers have demonstrated effective hydrogenotrophic denitrification with gas permeable hollow fiber membranes, which were used to enhance the efficiency of hydrogen delivery and limit explosion risks through the bubble-less introduction of hydrogen [5,6]. The investigators focus their attention on gas-permeable membranes because they can act as both the hydrogen diffuser and the biofilm carrier. Hollow-fiber membranes are typically employed as gas-permeable membranes [7,8], although silicon tubes have been tested as well [9,10]. Hydrogen flows through the lumen and diffuses into the bulk liquid through membrane walls. Membranes offer high specific surface area and nitrate removal effi-ciencies, but they have high cost. The main drawback of this technology is that the precipitation of mineral solids during the denitrification process might have long-term negative impacts in a hollow fiber membrane bioreactor, which increases the operating cost [11].
Another concern regarding the use of hydrogeno-trophic denitrification is the high cost of the hydrogen supplies needed, which limit its applicability. Bio-electro-chemical reactor (BER) in which denitrification is stimu-lated with the passing of electric current might be a solu-tion to this problem. Biofilm electrode reactors consist of a couple of electrodes [12], in which denitrifying bacteria are cultured on the cathode surface. In a BER, hydrogen gas is produced by electrolysis of water. The advantage of this process is the easy operation and maintenance; however, the denitrification rate is slow. Thus, longer hydraulic retention time is needed to achieve complete denitrification [13–16]. Moreover, excess biomass leaves the process, which calls for additional treatment.
The slow growth of the autotrophic denitrifying bacte-ria and the loss of biomass in the effluent, have an impact on the process efficiency. Due to the low biomass yield of hydrogenotrophic denitrifiers, most of the research conducted on hydrogenotrophic denitrification has been with attached growth systems. Nevertheless, there are limitations to the use of attached growth systems because of difficulty in biofilm control, limited mass transfer and decreasing biomass activity due to thick biofilm forma-tion [7].
As a result, the capital and operating cost, as well as the effective denitrification of a hydrogenotrophic bioreactor must always be considered for potable water denitrification. A cheap and effective installation using silicic gravel as support media was proposed by Vasil-iadou et al. [17]. The size of the support media was found to affect drastically denitrification efficiency. Using a
triple-column reactor, high nitrate concentrations up to 340 mg NO3
–-N/L were treated. Most of the studies reported in the literature used com-
mercially available hydrogen, which raise the operating cost of clean potable water production. On the other hand some efforts have been conducted for cheap hydrogen production. Grommen et al. [18] and Lu et al [19] gener-ated hydrogen gas with electrolytic cells. Vagheei et al. [20] produced in situ hydrogen and carbon dioxide by the electrolysis of methanol. Finally, a multi-electrode system for BER reactors was proposed from Sakakibara and Nakayama [21] and Prosnansky et al [22] for hydro-gen production, where in the later case the operating cost was about 0.18–0.67 US$/m3 of treated water.
The aim of the present work was to investigate the hydrogenotrophic denitrification activity by in situ hydrogen production in order to reduce operating cost. Hydrogen was produced on-line at atmospheric pressure, through a system of electrolysis with energy supplied from a solar cell. Experiments were conducted by using two different bioreactor configurations, in order to inves-tigate the effect of supplied quantities of hydrogen and carbon dioxide on the reactors’ performance under con-tinuous operating mode. Finally, a mathematical model able to predict nitrate and nitrite utilization, as well as H2 and CO2 consumption during denitrification process under various operating conditions was developed.
This is the first time that the electric energy which is required by the electrolysis cell is generated from the solar energy, thus reducing practically to zero the operating cost of a treatment plant. In addition, the use of inexpensive support media can make the hydrogeno-trophic denitrification economically viable for potable water treatment.
2. Materials and methods
2.1. Enrichment culture
The mixed culture utilized in the present work had been acclimatized in a former study [23]. The hydrogen-oxidizing denitrification culture was enriched from acti-vated sludge taken from the wastewater treatment plant of the city of Agrinio, Greece. Seed sludge was added to a 2 L flask containing nitrate (KNO3 0.722 g/L), tap wa-ter, and buffer (KH2PO4 3.39 g/L and Na2HPO4 3.53 g/L). Anoxic conditions were used to enrich the culture, while it was continuously sparged with a gas mixture compris-ing CO2 and H2.
2.2. Experimental system
Three packed-bed reactors were used for the experi-ments. The packed-bed reactors consisted of a Plexiglas tube, 52 cm high and 4 cm i.d. The overall volume of each reactor was 650 ml. The working volume of the filters was

88 K.A. Karanasios et al. / Desalination and Water Treatment 33 (2011) 86–96
250 ml. The support material was gravel with a depth of 40 cm. The mean diameters of the support media were 1.75 mm, 2.41 mm and 4.03 mm. The porosity of these media was 0.39, 0.4 and 0.42, respectively, while the spe-cific surface areas were 32.07, 22.74 and 14.16 cm2/cm3, respectively. Experiments were performed by using two bioreactor systems: the first system (system I) was a filter with gravel of 2.41 mm mean diameter and the second system (system II) consisted of three filters in series with three different gravel sizes (1st filter with gravel of 4.03 mm mean diameter, 2nd 2.41 mm and 3rd 1.75 mm). A detailed description of the experimental set-up has been given by Vasiliadou et al. [17].
Throughout the experiments, carbon dioxide and hydrogen were sparged from the bottom of the filters. Along the depth of filters there were four sampling ports for nitrate, nitrite, and CO2 and H2 concentration measurements in the bulk liquid. Hydrogen is used by the hydrogen oxidizing bacteria as electron donor, while carbon dioxide is used as the carbon source for biosyn-thesis. In addition, CO2 was used for pH adjustment in order to avoid pH rise, since phosphate buffers were not used in the system [24]. The feed solution (synthetically produced contaminated water) was composed of tap water and KNO3 (0.72 g/L → 100 mg NO3
–-N/L) as the contaminant. Throughout the reactors’ operation the systems were maintained at a temperature of 26±1°C, while the pH was maintained at 6.8±0.2.
2.3. Analytical methods
Concentration measurements of nitrate and nitrite nitrogen were performed on a daily basis during all ex-periments. The liquid samples were centrifuged for 5 min at 14000 rpm (Eppendorf Centrifuge 5424) to remove any suspended solids and the supernatants were then analyzed. Each experiment was performed three times to ensure reproducibility. Nitrate and nitrite concentra-tions were measured according to the Standard Methods for the Examination of Water and Wastewater [25] by using a UV/Vis spectrophotometer (Boeco S-22 UV/VIS) and following the procedure of the 4500-NO3
–-B and the colorimetric of 4500-NO2
–-B method, respectively. The pH was measured with Consort C835 a multi-parameter analyzer [25]. Dissolved H2 and CO2 concentrations were measured by the headspace-GC method [26] using a gas chromatography (GC, SRI 8610C) equipped with HID detector.
2.4. Hydrogen production
The hydrogen used in all experiments was produced in the laboratory by electrolysis of water. The electric energy supplied to the Proton Exchange Membrane (PEM) Electrolyzer came from a solar cell. This system of hydrogen production solves the problem of high cost of hydrogen supply during implementation at a
drinking-water treatment plant. The features of the solar-electrolyzer system are shown in Table 1.
3. Results and discussion
3.1. Bioreactor acclimation
After cultivation of microorganisms, the hydrogeno-trophic culture was transferred to the bioreactors. During a 2-month start-up period, filters were operated as batch systems (data not shown) to ensure attachment of the bacterial culture on the support media and development of a biofilm layer. As soon as nitrate degradation was completed, 50 ml of fresh contaminated water, which contained tap water, KNO3 (2.88 g/L), KH2PO4 (3.39 g/L), Na2HPO4 (3.53 g/L), was added to the reactors, to bring nitrate concentration to its initial level (80 mg NO3
–-N/L). This operating cycle was repeated systematically until its duration reduced to only a couple of hours. After about two months, a uniform biofilm was visible on the surface of gravels. At that time it was decided to switch to continuous operation.
3.2. Continuous operation
3.2.1. Continuous operation – single filter
The filter with gravel of 2.41 mm mean diameter (system I) was used to investigate the performance of hydrogenotrophic denitrification under continuous mode. The filter was kept in continuous operation for more than 4 months, before the experimental series took place, in order to ensure that pseudo steady state of the biofilm would be achieved. During continuous opera-tion, water with upflow volumetric rate (VFR) of 5 ml/
Table 1Special features of the solar-electrolysis hydrogen production system
PEM electrolyzer – solar cell
Feature Value
Hydrogen production, L/h 14.5 Maximum pressure AtmosphericHydrogen, % >99.9Water consuption, L/h 0.1 Water Distilled Power/voltage/current 50 W/14 V dc/4 ADimensions (L × W × H), mm 190–264–200Number of cells 7Electrode area, cm2 16 Electrode material CarbonElectrode enrichment Platinum Area of solar cell, m2 2.40

K.A. Karanasios et al. / Desalination and Water Treatment 33 (2011) 86–96 89
min (hydraulic loading 5.7 m3/m2d) was added with feed concentration 100 mg NO3
–-N/L. The nitrate nitrogen loading in the system was 0.72 g NO3
–-N/d. During the experiments of continuous operation, the addition of phosphoric buffers, which were used in the acclimation of the hydrogenotrophic culture and of the bioreactors’ biofilm to enhance biomass growth, was interrupted. The pH was maintained at 6.8±0.2 with adjustment by CO2 supplied to the system.
Filter washing was necessary to avoid operating problems due to pore clogging from biomass growth and for better circulation of the gases (H2, CO2) in the reactor. Washing was performed once every six days with 2 L of water, using high water (4 L/min) upflow velocity and gases (with a flow rate of 300 ml/min) periodically. Before sampling, the filter was washed and then operated in continuous mode, while keeping the influent conditions constant for at least 3 d in order to ensure pseudo-steady-state conditions. The sampling was being done from the third to the fifth day, for each set of operating conditions. Sampling was performed at each sampling valve with an immersed syringe reaching the centre of the filter. Each point in the plots is the result of three measurements.
In order to estimate the optimum hydrogen and car-bon dioxide dose, a theoretical approach was necessary. The overall reaction of autohydrogenotrophic denitrifica-tion [Eq. (1)] reveals that 2.82 mol of H2 and 0.139 mol of CO2 (in the form of carbon dioxide gas) are required to reduce 1 mol of nitrate (NO3) to inert nitrogen gas [24,27].
2 3 2 5 7 2
2 2
2.820H NO 0.139CO H 0.0278C H O N 0.486N 3.3223H O
− ++ + + →+ +
(1)
Namely, the process requires 0.403 mg H2 and 0.437 mg CO2 per mg NO3
–-N. In a previous work, Vasiliadou and co-workers [17] reported that for the same nitrogen loading, 30 ml/min carbon dioxide and
Table 2Operating conditions of the two bioreactors
Description Single filter Multi filter
Run 1 Run 2 Run 3 Run 4 Run 5
H2 CO2 H2 CO2 H2 CO2 H2 CO2 H2 CO2
Gas flow rate, ml/min 24.4 4.7 20.0 3.3 10.0 1.5 4.6 0.8 3.0 0.8Gas ratio, mgH2/mgCO2 1/4.240 1/3.633 1/3.303 1/3.831 1/5.874Experimental ratio, mg gas/mg NO3
–-N4.386 18.6 3.595 13.060 0.899 2.97 0.413 1.584 0.269 1.584
Theoretical ratio, mg gas/mgNO3
–-N0.403 0.437 0.403 0.437 0.403 0.437 0.403 0.437 0.403 0.437
Water flow rate, ml/min 5 10Influent NO3
–-N, mg/L 100 100Effluent NO3
–-N, mg/L 8.04 11.83 2.06 2.76 2.31Effluent NO2
–-N, mg/L 0 0.033 0 0 0
90 ml/min hydrogen were supplied to the reactor pro-vided a hydrogen and carbon dioxide over nitrogen mass ratio of 16.18 mg H2 and 118.62 mg CO2 per mg NO3
–-N. These ratios were chosen to be that high to ensure that gases were not rate-limiting. However, experiments in system I were designed for optimization of gas doses, concerning low cost and high denitrification efficiency. Thus, the first attempt was carried out with H2 and CO2 supplied to the system with flow rates of 24.4 and 4.7 ml/min, respectively, in order to achieve a good per-formance with a lower gas sparging. The mass ratios of the supplied hydrogen and carbon dioxide over nitrogen were 4.386 mg H2 and 18.6 mg CO2 per mg NO3
–-N, respec-tively (Table 2). These mass ratios were lower than those previously reported [17], however higher doses of carbon and electron donor than the theoretical demand were ap-plied to provide abundance of supply and prevent any possible deficiency. It must be noted that the hydrogen over carbon gas ratio that was used in the system was H2/CO2 = 5/1, according to the flow rate ratios (ml H2/ml CO2) supplied to other hydrogenotrophic systems [20,28]. Also, since hydrogen was provided by the solar-electrolysis hydrogen production system without any cost, the only operating cost of the process concerned carbon dioxide.
Fig. 1 presents the experimentally measured NO3–-N,
NO2–-N (Fig. 1a), H2 and CO2 (Fig. 1b) concentrations
along the filter (system I) for the first combination of gas concentrations. The horizontal solid and dash lines rep-resent the highest permitted nitrate- and nitrite-nitrogen concentration limits of 11.3 and 0.03 mg/L, respectively. As shown in Fig. 1a, safe removal of nitrates from water was observed, since at the effluent, the NO3
–-N and NO2–-N
concentrations were below the permitted limits (Table 2). The dissolved Η2 concentration ranged between 0.82 and 1.25 mgH2/L (Fig. 1b), decreasing gradually from the influent to the middle stage of the reactor, where elimination of a great quantity of NO3
–-N took place. The

90 K.A. Karanasios et al. / Desalination and Water Treatment 33 (2011) 86–96
dissolved CO2 concentration ranged between 0.98 and 1.45 g CO2/L (Fig. 1b) with gradually increase from the influent to the effluent of the reactor, as the consumption was low compared to the dissolution of the CO2.
In an effort to reduce the gases waste and as a result the operating cost of the operation of system I, the flow rates of H2 and CO2 were further reduced to 20.0 and 3.3 ml/min, respectively. The ratios of the supplied H2 and CO2 quantities over nitrogen mass are shown in Table 2. It was observed that, for lower gas flow rates, lower con-
0 8 16 24 32 400
10
20
30
40
50
60
70
80
90
100
110
120
0
1
2
3
4
5
6
NO3-- N experimental
limit NO3-- N
Height (cm)
Con
cent
ratio
n NO 2- -N
(mg/
L)
Conc
entra
tion N
O 3- -N (m
g/L)
(a)
NO2-- N experimental
limit NO2-- N
0 8 16 24 32 400.0
0.5
1.0
1.5
2.0
2.5
3.0
3.5
4.0
4.5
5.0
0
200
400
600
800
1000
1200
1400
1600
1800
H2 experimental
Conc
entra
tion
H 2 (mg/
L)
Con
cent
ratio
n CO
2 (mg/
L)
Height (cm)
(b)
CO2 experimental
Fig. 1. Continuous operation of bioreactor with gravel of 2.41 mm diameter. Experimentally determined (a) NO3–-N and NO2
–-N and (b) H2 and CO2 concentrations along the filter height for H2 and CO2 flow rates of 24.4 and 4.7 ml/min, respectively.
Fig. 2. Continuous operation of bioreactor with gravel of 2.41 mm diameter. Experimentally determined (a) NO3–-N and NO2
–
-N and (b) H2 and CO2 concentrations along the filter height for H2 and CO2 flow rates of 20.0 and 3.3 ml/min, respectively.
0 8 16 24 32 400
20
40
60
80
100
120
0
1
2
3
4
5
6
NO3-- N experimental
limit NO3-- N
Height (cm)
Con
cent
ratio
n NO 2- -N
(mg/
L)
Conc
entra
tion N
O 3- -N (m
g/L)
(a)
NO2-- N experimental
limit NO2-- N
0 8 16 24 32 400.0
0.5
1.0
1.5
2.0
2.5
3.0
3.5
4.0
4.5
5.0
0
200
400
600
800
1000
1200
1400
H2 experimental
Conc
entra
tion
H 2 (m
g/L)
Con
cent
ratio
n CO
2 (m
g/L)
Height (cm)
(b)
CO2 experimental
centrations of carbon dioxide were realized in the system (Fig. 2b), while hydrogen concentrations were at the same level as in the first experiment.
As shown in Fig. 2a, although safe removal of nitrate- and nitrite- nitrogen was observed, the system reached its operational critical upper limits. In order to decrease even further the operation cost and increase the bioreac-tor’s performance, an extension of the system’s length, which would lead to greater dissolution of the gases, was considered to be necessary.

K.A. Karanasios et al. / Desalination and Water Treatment 33 (2011) 86–96 91
3.3.2. Continuous operation – multi-filter
In order to increase the bioreactor performance a triple-column bioreactor was set up. The effect of the supplied quantities of hydrogen and carbon dioxide on the performance of three filters (system II) in series with three different gravel sizes (4.03, 2.41 and 1.75 mm mean diameters), was investigated. The three filters in series increase the length of the system and, as a result, the retention time of water and gases in the reactor. The first filter was chosen to be the one with the gravel of 4.03 mm in order to avoid pore clogging due to the high loadings. The filter with gravel of 1.75 mm was decided to be the last one to receive lower loadings in order to avoid any operating problems. During continuous operation, water with upflow volumetric rate of 10 ml/min and hydraulic loading of 11.5 m3/m2d was added with feed concentration 100 mg NO3
–-N/L. The nitrate nitrogen loading to system II was 1.44 g NO3
–-N/d.The filters were kept at continuous operation for
more than 4 months, before the experimental series took place, in order to ensure that pseudo steady state would be achieved. Sampling and filter backwash were carried out following the same procedure described above. Each value in the plots is the result of three measurements.
Initially, H2 and CO2 were fed to the system II with flow rates of 10.0 and 1.5 ml/min, respectively. It was ob-served that, as the nitrate nitrogen loading was doubled, the flow rates of the gases were much lower than those supplied to the system I. The H2 and CO2 supplied to the system gave hydrogen and carbon dioxide over nitrogen mass ratio of 0.899 mgH2 and 2.970 mgCO2 / mg NO3
–-N, respectively (Table 2). Fig. 3 shows the experimentally determined nutrient concentrations along the triple-
Fig. 3. Continuous operation of the three-filter system. Experimentally determined (a) NO3–-N and NO2
–-N and (b) H2 and CO2 concentrations along the filter height and the corresponding model predictions, for gas flow rates of 10.0 and 1.5 ml/min.
0 8 16 24 32 40 48 56 64 72 80 88 96 104 112 1200
20
40
60
80
100
120
NO-3-N
limit NO-3-N
Conc
entra
tion
NO- 3-
N (m
g/L)
Height (cm)
experimental
model
2.41 mm
(a)
0.0
0.5
1.0
1.5
2.0
2.5
3.0
1.75 mm
Con
cent
ratio
n NO
- 2-N
(mg/
L)
NO-2-N
limit NO-2-N
4.03 mm
0 8 16 24 32 40 48 56 64 72 80 88 96 104 112 1200.0
0.5
1.0
1.5
2.0
2.5
3.0
3.5
4.0
2.41 mm 1.75 mm4.03 mm
H2
Conc
entra
tion
H 2 (m
g/L)
Height (cm)
model
experimental
(b)
0
200
400
600
800
1000
1200
1400
1600
Con
cent
ratio
n CO
2 (m
g/L)
CO2
column bioreactor. As shown in Table 2, safe removal of nitrates from water was observed, since at the effluent the NO3
–-N and NO2–-N concentrations were 2.06 and
0.0 mg/L, respectively. Two additional experiments (Figs. 4 and 5) were
conducted in an attempt to further decrease the carbon dioxide and hydrogen doses. Fig. 4 depicts the second experimental trial, with H2 and CO2 supplied to the system at flow rates of 4.6 and 0.8 ml/min, respectively. The H2 and CO2 provide an experimental ratio (mg gas/mg NO3
–-N) still higher than the theoretical (Table 2). Consumption of these two nutrients was further reduced, while maintaining safe treatment of the polluted water. Finally, the last experiment (Fig. 5) was carried out with hydrogen flow rate of 3.0 ml/min, while the carbon diox-ide was maintained at the value of 0.8 ml/min. A further decrease of CO2 caused nitrite nitrogen accumulation and a pH rise to 9 (data not shown). Although, the H2 supplied had a ratio (mg gas/mgNO3
–-N) lower of than the theoreti-cally required, safe removal of nitrates and nitrites from water was achieved (Fig. 5a). The proposed system seems to be very effective for potable water denitrification, as all the three runs which were conducted, achieved high performance with a denitrification rate of 2 g/Ld.
4. Mathematical modelling
As mentioned above, the three-column filter was the optimum as far as efficiency and operating cost are concerned. Thus, a model of this system was used to simulate the process of hydrogenotrophic denitrification for various operating conditions. We adopted the math-ematical model that has been described by Vasiliadou

92 K.A. Karanasios et al. / Desalination and Water Treatment 33 (2011) 86–96
0 8 16 24 32 40 48 56 64 72 80 88 96 104 112 1200
20
40
60
80
100
120
NO-3-N
limit NO-3-N
Conc
entra
tion
NO- 3-
N (m
g/L)
Height (cm)
(a)
experimental
model
0.0
0.2
0.4
0.6
0.8
1.0
1.2
1.4
1.6
1.8
2.0
1.75 mm
2.41 mm
Con
cent
ratio
n NO
- 2-N
(mg/
L)
NO-2-N
limit NO-2-N
4.03 mm
0 8 16 24 32 40 48 56 64 72 80 88 96 104 112 1200.0
0.5
1.0
1.5
2.0
2.5
3.0
3.5
4.0
2.41 mm1.75 mm
4.03 mm
H2
Conc
entra
tion
H 2 (m
g/L)
Height (cm)
(b)experimental
model
0
200
400
600
800
1000
1200
1400
Con
cent
ratio
n CO
2 (m
g/L)
CO2
Fig. 4. Continuous operation of the three-filter system. Experimentally determined (a) NO3–-N and NO2
–-N and (b) H2 and CO2 concentrations along the filter height and the corresponding model predictions, for gas flow rates of 4.6 and 0.8 ml/min.
0 8 16 24 32 40 48 56 64 72 80 88 96 104 112 1200
20
40
60
80
100
120
experimental
NO-3-N
limit NO-3-N
Conc
entra
tion
NO
- 3-N
(mg/
L)
Height (cm)
(a)
model
0.0
0.5
1.0
1.5
2.0
2.5
3.0
1.75 mm
2.41 mm
Con
cent
ratio
n N
O- 2-
N (m
g/L)
NO-2-N
limit NO-2-N
4.03 mm
0 8 16 24 32 40 48 56 64 72 80 88 96 104 112 1200.0
0.5
1.0
1.5
2.0
2.5
3.0
3.5
4.0
experimental
2.41 mm1.75 mm
4.03 mm
H2
Conc
entra
tion
H 2 (m
g/L)
Height (cm)
(b)
model
0
200
400
600
800
1000
1200
1400
Con
cent
ratio
n CO
2 (m
g/L)
CO2
Fig. 5. Continuous operation of the three-filter system. Experimentally determined (a) NO3–-N and NO2
–-N and (b) H2 and CO2 concentrations along the filter height and the corresponding model predictions, for gas flow rates of 3.0 and 0.8 ml/min.
et al. [17]. However, in the present study, the kinetics of growth of hydrogen oxidation bacteria was assumed to be subject to four-nutrient limitation (with nitrate, nitrite, carbon dioxide and hydrogen as the primary nutrients of interest) with inhibition by nitrate. Nitrate and nitrite are considered as nutrients which fulfil the need of the micro-organisms for electron acceptors. The nitrate elimination
was modelled using an Andrews-type expression [29] for nitrate inhibition, while nitrite reduction was modelled by a Monod expression. Hydrogen and carbon dioxide were considered as supplementary nutrients together with nitrate or nitrite, while their limitations were modelled by Monod expressions. The kinetic expressions are given by the following equations:

K.A. Karanasios et al. / Desalination and Water Treatment 33 (2011) 86–96 93
3
3
3
3 2
2 2
2 2 2 2
max1 NO NINO NI 2
NO NINO NI 2 NO NI
H NI CO NI
SH H NI SCO CO NI
( )
s di
r CC
CK C k C
KC C
K C K C
µ =
+ + +
⋅ ⋅+ +
(2)
2 2
2
2 3 2 2
2
2 2
max 2 NO NI H NINO NI
NO NI 1 NO NI NH H NI
CO NI
NCO CO NI
( )n d
r C CC
K C k C K CC
K C
µ = ⋅+ + +
⋅+
(3)
where CNO3NI and CNO
2NI are the nitrate and nitrite nitrogen
concentration (mg/cm3), respectively, CH2NI and CCO2NI are the dissolved hydrogen and carbon dioxide concentra-tion (mg/cm3), respectively, at every NI compartment of the bioreactor, rmax1 and rmax2 (1/h) are the maximum specific growth rates of nitrate and nitrite, respectively, Ks and Kn (mg/cm3) are the saturation constant for nitrate and nitrite, respectively, KSH2
and KNH2 (mg/cm3) are the
saturation constants for H2, KSCO2 and KNCO2
(mg/cm3) are the saturation constants for CO2, Ki (mg/cm3) is the nitrate inhibition constant, kd1 (mg NO2
–-N/mg NO3–-N) and kd2
(mg NO3–-N/mg NO2
–-N) are constants in the growth rate expressions.
In order to describe the continuous operation, the as-sumptions used by Vasiliadou et al. [17] were adopted.
Mass balances for nitrate, nitrite, carbon dioxide and hydrogen inside the biofilm in the NI compartment of the filter yield the following equations:
3 3
3 3
2NO NI NO NI
NO NO NI2
1 ( ) 0s
C CD C X
z t Y∂ ∂
− φ + φ + µ =∂ ∂
(4)
2 2
2 2
3
2NO NI NO NI
NO NO NI2
NO NI
1 ( )
1 ( ) 0
n
s
C CD C X
z t Y
C XY
∂ ∂− φ + φ + µ
∂ ∂
− µ = (5)
2 2
2 2
2
3
2
2CO NI CO NI
CO NO NI2NCO
NO NISCO
1 ( )
1 ( ) 0
C CD C X
z t Y
C XY
∂ ∂− φ + φ + µ
∂ ∂
+ µ =
(6)
2 2
2 2
2
3
2
2H NI H NI
H NO NI2NH
NO NISH
1 ( )
1 ( ) 0
C CD C X
z t Y
C XY
∂ ∂− φ + φ + µ
∂ ∂
+ µ = (7)
where X is the biomass density (mg/cm3), D is the diffu-sion coefficient (cm2/h), Yx mg biomass/mg x is the growth yield coefficient on the x substrate and φ is the biofilm porosity. Eqs. (4)–(7) result by considering the processes of nitrate, nitrite, H2 and CO2 diffusion and consumption and/or generation inside the biofilm in the NI compart-ment of the filter.
Mass balances for nitrate, nitrite, carbon dioxide and hydrogen in the bulk liquid in the NI compartment of the filter yield the following equations:
( )
( ) ( )
3
3 3
3
3 3
NO BNINO BNI-1 NO BNI
NO NINO NO NI1 1
NI
s z L s L
dC Q C Cdt V
CA D A u C
z =
ε = −
∂− − ε φ − − ε φ
∂
(8)
( )
( )
2
2 2
2
2 2
NO BNINO BNI 1 NO BNI
NO NINO NO NI1 (1 )
NI
s z L s L
dC Q C Cdt V
CA D A u C
z
−
=
ε = −
∂− − ε φ − − ε φ
∂
(9)
( )
( )( ) ( )
2
2 2
2 2 2 2
2
2 2
CO BNICO BNI 1 CO BNI
*LCO CO CO CO BNI
1 1
NI
CO NIs CO z L s L CO NI
dC Q C Cdt V
K a C C
CA D A u C
z
−
=
ε = −
+ −
∂− − ε φ − − ε φ
∂
(10)
( ) ( )
( ) ( )
2
2 2 2 2 2 2
2
2 2
H BNI *H BNI 1 H BNI H H H H BNI
H NIH H NI1 1
LNI
s z L s L
dC Q C C K a C Cdt V
CA D A u C
z
−
=
ε = − + −
∂− − ε φ − − ε φ
∂
(11)
where Q is the volumetric flow rate (cm3/h) and VNI is the volume of each compartment (cm3), As (cm2/cm3) is the support media specific surface area, ε is the reactor porosity, L (cm) is the biofilm thickness, uL (cm/h) is the velocity of the biofilm surface, KLH2
and KLCO2 are the mass
transfer coefficients (cm/h) for the gases and aH2 and aCO2
are the specific surface areas of H2 and CO2 gas bubble (cm2/cm3), respectively. C*
H2 and C*
CO2 (mg/cm3) are the
calculated dissolved H2 and CO2 equilibrium concentra-tions by Henry’s law with the Henry’s law constants in aqueous solutions at 26°C [30].
The first terms in the right-hand-side in Eqs. (8)–(11) represent the difference between the inlet and the outlet of nutrients in the bulk liquid in the NI compartment of the filter, while the third terms represent the nutrients’ diffusion from the bulk liquid to the biofilm in the same compartment.
The mass balance equation for biomass detached from the biofilm surface area, in the bulk fluid in the NI compartment of the filter is:

94 K.A. Karanasios et al. / Desalination and Water Treatment 33 (2011) 86–96
( ) ( )(( ) ) ( )
3
2
BNIBNI 1 BNI NO BNI BNI
NO BNI BNI BNI det1NI
d s
dX Q X X C Xdt V
C X k X A u X
−ε = − + µ
+µ − ε + − ε
(12)
where udet (cm/h) is the detachment velocity by which particulate components are detached from the biofilm surface [17] and kd (1/h) is the death rate constant.
The nutrients consumed by detached biomass were negligible, thus it was assumed that the elimination of the nutrient in the bulk liquid was zero.
The boundary conditions for the system of equations are:
3NO NI (0, )B.C. 1: 0
C tz
∂=
∂ (13)
2NO NI (0, )B.C. 2: 0
C tz
∂=
∂ (14)
2CO NI (0, )B.C. 3: 0
C tz
∂=
∂ (15)
2H NI (0, )B.C. 4: 0
C tz
∂=
∂ (16)
3 3NO NI NO BNIB.C. 5: ( , )C L t C= (17)
2 2NO NI NO BNIB.C. 6: ( , )C L t C= (18)
2 2CO NI CO BNIB.C. 7: ( , )C L t C= (19)
2 2H NI H BNIB.C. 8: ( , )C L t C= (20)
and the initial conditions are:
3 3NO BNI NO entranceI.C.1 (0)C C= (21)
2 2NO BNI NO entranceI.C. 2: (0)C C= (22)
2 2CO BNI CO entranceI.C. 3: (0)C C= (23)
2 2H BNI H entranceI.C. 4: (0)C C= (24)
where Centrance is the substrate concentration at the entrance of the filter (mg/cm3).
3NO NII.C. 5: ( ,0) 0C z = (25)
2NO NII.C. 6: ( ,0) 0C z = (26)
2CO NII.C. 7: ( ,0) 0C z = (27)
2H NII.C. 8: ( ,0) 0C z = (28)
and
BNII.C. 9: (0) 0X = (29)
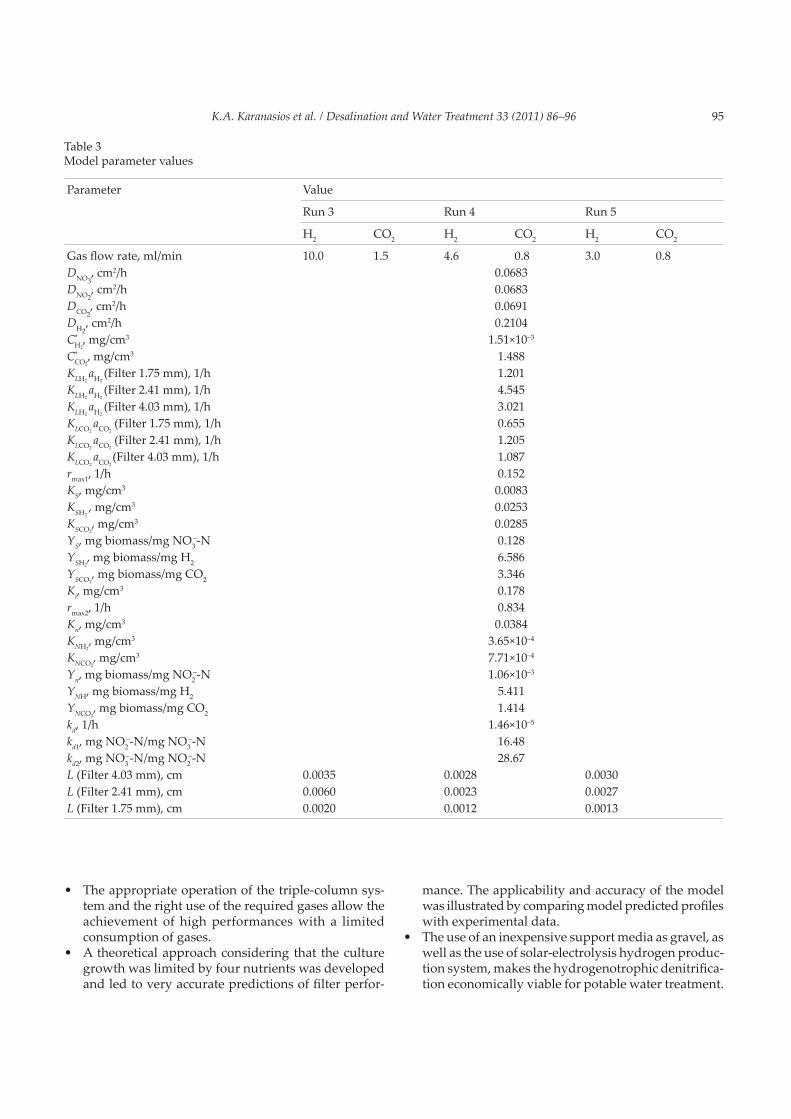
All kinetic parameters, except from diffusion coef-ficients [31], were evaluated from simulation of the experimental data. Data fitting (Figs. 3, 4 and 5) was performed using Aquasim (Version 2.1d) computer code. The computed values of the kinetic parameters of the model are listed in Table 3.
To simulate the continuous operation of the three filters in series (multi-stage filter) (Figs. 3–5), the reactors were modelled as a combination of thirty completely mixed biofilm compartments connected by advective links using the Aquasim program. As mentioned above, the sampling was taking place from the third to the fifth day (after washing), for each set of operating conditions. The biofilm thickness at the beginning of operation (after washing) was estimated to be different for each combina-tion of carbon dioxide and hydrogen flow and for each reactor. These differences in the initial value of the biofilm thickness are due to the different nitrogen and gas load-ings in each reactor and to the different support media in the three filters.
The Aquasim program calculates the development of the biofilm thickness and the theoretical predictions for the nitrate-, nitrite-nitrogen, CO2 and H2 concentrations at the third, fourth and fifth day of filter’s operation. It must be noted that the experimental data used in the data fitting process of the Aquasim program, were the mean values of sampling at the third, fourth and fifth day.
Figs. 3, 4 and 5 show the profiles of nitrate-, nitrite-nitrogen, CO2 and H2 concentrations along system II, as obtained from the experiments and predicted by the model. The theoretical predictions (solid lines) for the nutrient concentrations shown in Figs. 3–5, are the predic-tions for the fourth day of operation. It can be seen that the model predictions matched well the experimental data. The only case that the model failed to predict the experimental data is the hydrogen consumption in the second filter (gravel d = 2.41 mm) for H2 and CO2 flow rates of 24.4 and 4.7 ml/min (Fig. 3b), respectively. The models failure is due to the fact that the initial value of the biofilm thickness in this filter (Table 3) is too high and results to the prediction by the model of high hydrogen elimination.
5. Conclusions
Two bench-scale bioreactor systems were tested in order to study the effect of the supplied quantities of hydrogen and carbon dioxide on the hydrogenotrophic denitrification efficiency. The main conclusions from this work are:
• A comparison between the two systems of water treat-ment showed that, the three-bioreactors system can treat safely twice as much nitrate nitrogen loading, with a drastic reduction of H2 and CO2 consumption.
K.A. Karanasios et al. / Desalination and Water Treatment 33 (2011) 86–96 95
Table 3Model parameter values
Parameter Value
Run 3 Run 4 Run 5
H2 CO2 H2 CO2 H2 CO2
Gas flow rate, ml/min 10.0 1.5 4.6 0.8 3.0 0.8DNO3
, cm2/h 0.0683DNO2
, cm2/h 0.0683DCO2
, cm2/h 0.0691DH2
, cm2/h 0.2104C*
H2, mg/cm3 1.51×10⁻³
C*CO2
, mg/cm3 1.488KLH2
aH2 (Filter 1.75 mm), 1/h 1.201
KLH2 aH2
(Filter 2.41 mm), 1/h 4.545KLH2
aH2 (Filter 4.03 mm), 1/h 3.021
KLCO2 aCO2
(Filter 1.75 mm), 1/h 0.655KLCO2
aCO2 (Filter 2.41 mm), 1/h 1.205
KLCO2 aCO2
(Filter 4.03 mm), 1/h 1.087rmax1, 1/h 0.152KS, mg/cm3 0.0083KSH2
, mg/cm3 0.0253KSCO2
, mg/cm3 0.0285YS, mg biomass/mg NO3
–-N 0.128YSH2
, mg biomass/mg H2 6.586YSCO2
, mg biomass/mg CO2 3.346Ki, mg/cm3 0.178rmax2, 1/h 0.834Kn, mg/cm3 0.0384KNH2
, mg/cm3 3.65×10⁻⁴
KNCO2, mg/cm3 7.71×10⁻⁴
Yn, mg biomass/mg NO2–-N 1.06×10⁻³
YNH, mg biomass/mg H2 5.411 YNCO2
, mg biomass/mg CO2 1.414kd, 1/h 1.46×10⁻⁵
kd1, mg NO2–-N/mg NO3
–-N 16.48kd2, mg NO3
–-N/mg NO2–-N 28.67
L (Filter 4.03 mm), cm 0.0035 0.0028 0.0030L (Filter 2.41 mm), cm 0.0060 0.0023 0.0027L (Filter 1.75 mm), cm 0.0020 0.0012 0.0013
• The appropriate operation of the triple-column sys-tem and the right use of the required gases allow the achievement of high performances with a limited consumption of gases.
• A theoretical approach considering that the culture growth was limited by four nutrients was developed and led to very accurate predictions of filter perfor-
mance. The applicability and accuracy of the model was illustrated by comparing model predicted profiles with experimental data.
• The use of an inexpensive support media as gravel, as well as the use of solar-electrolysis hydrogen produc-tion system, makes the hydrogenotrophic denitrifica-tion economically viable for potable water treatment.

96 K.A. Karanasios et al. / Desalination and Water Treatment 33 (2011) 86–96
References[1] Council Directive 98/83/EC, L330/32, 5/12/1998, Official J. Eur.
Communities, 1998.[2] B.T. Nolan, B.C. Ruddy, K.J. Hitt and D.R. Helsel, A national look
at nitrate contamination of ground water, Water Cond. Purif., 39(12) (1998) 76–79.
[3] V.J. Rijn, Y. Tal and H.J. Schreier, Denitrification in recirculating systems: Theory and applications, Aquacul. Eng., 34(3) (2006) 364–376.
[4] B.O. Mansell and E.D. Schroeder, Hydrogenotrophic denitrifica-tion in a microporous membrane bioreactor, Wat. Res., 36(19) (2002) 4683–4690.
[5] K.C. Lee and B.E. Rittmann, Applying a novel autohydrogeno-trophic hollow-fiber membrane biofilm reactor for denitrification of drinking water, Wat. Res., 36(8) (2002) 2040–2052.
[6] S.J. Ergas and A.F. Reuss, Hydrogenotrophic denitrification of drinking water using a hollow fibre membrane bioreactor, J. Wat. Supply: Res. Technol. – Aqua, 50(3) (2001) 161–171.
[7] H. Mo, J.A. Oleszkiewicz, N. Cicek and B. Rezania, Hydrogen-dependent denitrification in an alternating anoxic–aerobic SBR membrane bioreactor, Wat. Sci. Technol., 51(6–7) (2005) 357–364.
[8] J.H. Shin, B.I. Sang, Y.C. Chung and Y.K. Choung, The removal of nitrogen using an autotrophic hybrid hollow-fiber membrane biofilm reactor, Desalination, 183 (2005) 447–454.
[9] A. Terada, S. Kaku, S. Matsumoto and S. Tsuneda, Rapid auto-hydrogenotrophic denitrification by a membrane biofilm reac-tor equipped with a fibrous support around a gas-permeable membrane, Biochem. Eng. J., 31(1) (2006) 84–91.
[10] M.R. Schnobrich, B.P. Chaplin, M.J. Semmens and P.J. Novak, Stimulating hydrogenotrophic denitrification in simulated groundwater containing high dissolved oxygen and nitrate concentrations, Wat. Res., 41(9) (2007) 1869–1876.
[11] K.C. Lee and B.E. Rittmann, Effects of pH and precipitation on autohydrogenotrophic denitrification using the hollow-fiber membrane-biofilm reactor, Wat. Res., 37(7) (2003) 1551–1556.
[12] Y. Sakakibara and M. Kuroda, Electric prompting and control of denitrification, Biotechnol. Bioeng., 42(4) (1993) 535–537.
[13] Y. Sakakibara, T. Tanaka, K. Ihara, T. Watanabe and M. Kuroda, An in-situ denitrification of nitrate-contaminated groundwater using electrodes, Proc. Environ. Eng. Res., 32 (1995) 407–415.
[14] Z. Feleke, K. Araki, Y. Sakakibara, T. Watanabe and M. Kuroda, Selective reduction of nitrate to nitrogen gas in a biofilm-elec-trode reactor, Wat. Res., 32(9) (1998) 2728–2734.
[15] S. Islam and M.T. Suidan, Electrolytic denitrification: Long term performance and effect of current intensity, Wat. Res., 32(2) (1998) 528–536.
[16] Z. Feleke and Y. Sakakibara, A bio-electrochemical reactor coupled with adsorber for the removal of nitrate and inhibitory pesticide, Wat. Res., 36(12) (2002) 3092–3102.
[17] I.A. Vasiliadou, K.A. Karanasios, S. Pavlou and D.V. Vayenas, Experimental and modelling study of drinking water hydroge-
notrophic denitrification in packed-bed reactors, J. Hazard. Mater., 165 (2009) 812–824.
[18] R. Grommen, M. Verhaege and W. Verstraete, Removal of nitrate in aquaria by means of electrochemically generated hydrogen gas as electron donor for biological denitrification, Aquac. Eng., 34(1) (2006) 33–39.
[19] C. Lu, P. Gu, P. He, G. Zhang and C. Song, Characteristics of hydrogenotrophic denitrification in a combined system of gas-permeable membrane and a biofilm reactor, J. Hazard. Mater., 168 (2009) 1581–1589.
[20] R. Vagheei, H. Ganjidoust, A.A. Azimi and B. Ayati, Nitrate re-moval from drinking water in a packed-bed bioreactor coupled by a methanol-based electrochemical gas generator, Environ. Prog. Sust. Energ., 2009, doi: 10.1002/ep.10404.
[21] Y. Sakakibara and T. Nakayama, A novel multi-electrode system for electrolytic and biological water treatments: electric charge transfer and application to denitrification, Wat. Res., 35 (2001) 768–778
[22] M. Prosnansky, Y. Sakakibara and M. Kuroda, High-rate denitri-fication and SS rejection by biofilm-electrode reactor (BER) com-bined with microfiltration, Wat. Res., 36(19) (2002) 4801–4810.
[23] I.A. Vasiliadou, S. Pavlou and D.V. Vayenas, A kinetic study of hydrogenotrophic denitrification, Process Biochem., 41(6) (2006) 1401–1408.
[24] S. Ghafari, M. Hasan, M.K. Aroua, Effect of carbon dioxide and bicarbonate as inorganic carbon sources on growth and adapta-tion of autohydrogenotrophic denitrifying bacteria, J. Hazard. Mater., 162 (2009) 1507–1513.
[25] APHA, AWWA and WPCF, Standard Methods for the Examina-tion of Water and Wastewater, 17th ed., American Public Health Association, 1989.
[26] I. Shizas and D.M. Bagley, Measurement of dissolved hydrogen and hydrogen gas transfer in a hydrogen-producing reactor, Anaerobic Digestion 10th World Congress, Montreal, Quebec, Canada, Sept. 2004.
[27] S. Ghafari, M. Hasan and M.K. Aroua, A kinetic study of autohy-drogenotrophic denitrification at the optimum pH and sodium bicarbonate dose, Bioresource Technol., 101(7) (2010) 2236–2242.
[28] C.M. Ho, S.K. Tseng and Y.J. Chang, Autotrophic denitrifica-tion via a novel membrane-attached biofilm reactor, Lett. Appl. Microbiol., 33(3) (2001) 201–205.
[29] J.F.Andrews, A mathematical model for the continuous culture of microorganisms utilizing inhibitory substrates, Biotechnol. Bioeng., 10(6) (1968) 707–723.
[30] A. Tiemeyer, H. Link and D. Weuster-Botz, Kinetic studies on autohydrogenotrophic growth of Ralstonia eutropha with nitrate as terminal electron acceptor, Appl. Microbiol. Biotechnol., 76(1) (2007) 75–81.
[31] Y. Sakakibara, J.R.V. Flora, M.T. Suidan and M. Kuroda, Modeling of electrochemically-activated denitrifying biofilms, Wat. Res., 28(5) (1994) 1077–1086.
Copyright © 2022 FDOKUMEN