An AC electrokinetic impedance immunosensor for rapid detection of tuberculosis
Upload
khangminh22Category
view
0download
0
Electrolysis-reducing electrodes for
electrokinetic devices
Per Erlandsson and Nathaniel D Robinson
Linköping University Post Print
N.B.: When citing this work, cite the original article.
This is the authors’ version of the publication:
Per Erlandsson and Nathaniel D Robinson, Electrolysis-reducing electrodes for electrokinetic
devices, 2011, ELECTROPHORESIS, (32), 6-7, 784-790.
http://dx.doi.org/10.1002/elps.201000617
Copyright: Wiley-VCH Verlag Berlin
http://www.wiley-vch.de/publish/en/
Postprint available at: Linköping University Electronic Press
http://urn.kb.se/resolve?urn=urn:nbn:se:liu:diva-67312
For Peer Review
Submitted to Electrophoresis
1
DOI: Electrolysis-reducing Electrodes for Electrokinetic Devices
By Per G. Erlandsson and Nathaniel D. Robinson*
[*] Dr. N. D. Robinson, P. G. Erlandsson Transport and Separations Group, Dept. of Phys. Chem. and Bio., Linköping University, 581 83 Linköping, (Sweden) E-mail: [email protected]
Abbreviations: CP, conjugated polymer; EC, electrochemical; EO, electroosmotic; EOP, electroosmotic pump; HCE, high concentration electrolyte; LCE, low concentration electrolyte; LOC, lab-on-a-chip; PEDOT, poly(3,4-ethylenedioxythiophene); PSS, poly(styrenesulfonate); Keywords: Conducting Polymers / Microfluidics / Electroosmosis / pH / gas evolution Total number of words: 3883
Page 1 of 23
Wiley-VCH
ELECTROPHORESIS
123456789101112131415161718192021222324252627282930313233343536373839404142434445464748495051525354555657585960

For Peer Review
Submitted to Electrophoresis
2
Abstract
Direct current electrokinetic systems generally require Faradaic reactions to occur at a pair of
electrodes to maintain an electric field in an electrolyte connecting them. The vast majority of
such systems, e.g. electrophoretic separations (capillary electrophoresis) or electro-osmotic
pumps, employ electrolysis of the solvent in these reactions. In many cases, the electrolytic
products, such as H+ and OH- in the case of water, can negatively influence the chemical or
biological species being transported or separated, and gaseous products such as O2 and H2 can
break the electrochemical circuit in microfluidic devices. This article presents an
electroosmotic (EO) pump that employs the oxidation/reduction of the conjugated polymer
poly(3,4-ethylenedioxythiophene) (PEDOT), rather than electrolysis of a solvent, to drive
flow in a capillary. Devices made with PEDOT electrodes are compared to devices made
with Pt electrodes in terms of flow and local pH change at the electrodes. Furthermore, we
demonstrate that flow is driven for applied potentials under 2 V, and the electrodes are stable
for potentials of at least 100 V.
Electrochemically active electrodes like those presented here minimize the disadvantage of
integrated EO pumps in, e.g. lab-on-a-chip applications, and may open new possibilities,
especially for battery-powered disposable point-of-care devices.
Page 2 of 23
Wiley-VCH
ELECTROPHORESIS
123456789101112131415161718192021222324252627282930313233343536373839404142434445464748495051525354555657585960
For Peer Review
Submitted to Electrophoresis
3
1 Introduction
Electrokinetic separations and electroosmotic pumps are the heart of many chemistry-related
technologies, ranging from laboratory separations, e.g. capillary electrophoresis (CE), to
microfluidic lab-on-a-chip (LOC) systems. The latter are predicted to significantly increase
efficiency in the healthcare industry by replacing complex procedures involving large-scale
chemistry and biology laboratory equipment with automated hand-held diagnostic tools. This,
in turn, can help bring sophisticated diagnostic techniques to areas with limited laboratory
facilities. The ease-of-manufacture and small size of electroosmotic pumps (EOPs) are
obvious advantages for their use in LOC systems, however EOPs usually produce H2 and O2,
H2O2 and/or H+ and OH- at the electrodes [1-7]. All of these reactions are undesirable, as
gases can quickly break the connection between the aqueous sample and an electrode, and H+,
OH- and H2O2 can disturb sensitive materials (e.g. proteins) being studied. Still, it is
beneficial to integrate the electrodes intimately with the fluidic system as the plug-like
electroosmotic flow (EOF) associated with EOPs only exists between the electrodes.
By taking advantage of the electrochemical (EC) functionality of materials such as conjugated
polymers (CPs) used in organic electronics, we have created EOPs that nearly eliminate the
oxidation/reduction of solvent, without electroplating e.g. Ag from one electrode to another,
and hence the production of EC byproducts or release of materials that could interfere with
biological and chemical samples. Using a blend of oxidized and reduced CP at each electrode
means that electrochemistry, and hence fluid transport, begins at small applied potentials, as
opposed to ~2 V required for the case of Pt electrodes, making low-voltage battery-operated
LOC devices easier to construct. It should also be noted that metal electrodes such as Pt,
which often are considered to be inert, can undergo chemical changes and even dissolve when
used as electrodes to drive EOF [8]. The polymers used here have the additional advantage of
being solution processable, that is to say that they can be cast from solution using e.g. inkjet
Page 3 of 23
Wiley-VCH
ELECTROPHORESIS
123456789101112131415161718192021222324252627282930313233343536373839404142434445464748495051525354555657585960
For Peer Review
Submitted to Electrophoresis
4
printing [9]. This combination makes these integrated pumps ideal for LOC applications, and
also useful in a wide range of laboratory-scale systems.
Organic electronics is currently a very active research area in chemistry and materials
science. Films of semiconducting polymers and molecules are already used in transistors and
light-emitting diodes in electronic products available on the market. These devices almost
exclusively employ the polymers’ ability to transport electrons and holes, just as devices
made of inorganic semiconductors such as Si or GaAs do. In other applications such as
electrochromic windows and displays [10], light-emitting EC cells [11], and EC transistors
[12], the EC interplay between CPs, ions and electrons is employed [13]. Although these EC
devices were some of the first to be created in the lab, they are further from broad
commercialization than their ion-free counterparts. However, it is the EC devices that expand
the use of organic electronics towards “new” areas such as chemistry and microbiology [14],
as hard materials are less hospitable for e.g. nerve cells than soft polymers [15]. The polymer
system used here, poly(3,4-ethylenedioxythiophene) (PEDOT) blended with
poly(styrenesulfonate) (PEDOT:PSS) [16], is commercially available and can be readily
coated onto substrates or printed using e.g. inkjet, screen, or other technologies [9].
Previously, switching CPs like PEDOT between the oxidized and reduced states has been
utilized to change the polymer’s conductivity [12], optical absorbance [17, 18] and wettability
[19, 20]. Here, however, the change of redox state is used to allow an EC reaction to occur
without generating mobile byproducts.
In short, EOF is the result of an electrokinetic force on the charged ions adjacent to an
oppositely-charged surface [6]. The force is generated by an electric field applied along the
length of the channel through which flow is desired. If the channel is small enough, e.g. ~100
µm or smaller in diameter, then the viscosity of the liquid is typically sufficient to cause the
entire content of the capillary to move at the same velocity. The electric field that drives EOF
is traditionally maintained by electrolytic reactions at two metal electrodes The reactions
Page 4 of 23
Wiley-VCH
ELECTROPHORESIS
123456789101112131415161718192021222324252627282930313233343536373839404142434445464748495051525354555657585960
For Peer Review
Submitted to Electrophoresis
5
change the pH both near the electrodes and in the system [6, 7] and can generate gas bubbles
that threaten to interrupt the contact between the fluid and electrode [1-3]. The side-reaction
problem can be mitigated in laboratory-scale devices by using very large (e.g. 1 L) liquid
reservoirs around the electrodes or otherwise ensuring that the solution in proximity to the
pump electrodes does not come near the sample [21, 22], or by adding chemical buffers to the
sample [23]. The former strategy is difficult to employ in a miniaturized device as it requires a
large footprint. The latter works in some cases, but adding new chemical components to an
already complex biological sample comes with the risk of affecting the behavior of the
material to be tested. Furthermore, the buffer is depleted near the electrodes. As a result, fully-
integrated EOPs based on the electrolysis of water are often unacceptable in LOC devices
handling sensitive samples.
Several strategies have been employed to minimize the electrochemical reactions at
EO pump electrodes [1-3]. For example, ion exchange membranes [4] have been designed to
limit the impact of electrode reactions, however, these lowered pumping efficiency without
removing the undesired reactions. Brask et al. present an AC EO pump utilizing valves to
reduce the impact of reactions by alternating flow direction [24], but the advantage of plug-
like flow is lost when using EO as a hydrostatic pressure source. Guzman et al. describe a low
potential electrokinetic system with Ag/AgCl electrodes which can induce reactions at
voltages lower than necessary for electrolysis [25], however, the risk of releasing silver ions
limits its practical use in microfluidics with e.g. proteins.
The device described in this article takes advantage of the ability of many
semiconducting polymers like PEDOT to undergo EC changes, and uses this property to solve
significant challenges in using EOPs and CE, particularly in miniaturized systems. The
potential for using organic electronic materials as electrodes in chemical and biological
systems has been demonstrated in two different types of electrophoretic devices [14, 26, 27].
In other applications for microfluidics, organic electronic materials have been used for
Page 5 of 23
Wiley-VCH
ELECTROPHORESIS
123456789101112131415161718192021222324252627282930313233343536373839404142434445464748495051525354555657585960

For Peer Review
Submitted to Electrophoresis
6
electrochemically-controlled wettability [19, 28, 29]. Here, we demonstrate a metal-free EOP
by using electrodes made of PEDOT:PSS to induce EOF through a glass capillary. When
designed so that the PEDOT:PSS electrodes are never fully electrochemically switched, they
are shown to have only a small impact on solution pH while driving flow in the capillary.
Furthermore, repeated cycling of the device shows that oxidative degeneration [30, 31] (so-
called electrochemical over-oxidation) of the PEDOT can be avoided even when potentials of
over 100 V are employed.
2 Materials and methods
2.1 Electrode Fabrication
Electrodes were produced by drop-casting 100 µl PEDOT:PSS (1.3 wt % dispersion in H2O,
conductive grade, Sigma-Aldrich) containing 5% diethylene glycol (Sigma-Aldrich) to cover
a 20x7 mm2 area on “overhead transparency” film (3M, PP2500, polyester based). The
diethylene glycol acts as a secondary dopant to increase the conductivity of the electrodes
[32]. The transparency film (60x20 mm) was roughened with sandpaper (P240, average
particle diameter 58 µm) and bent at the middle after heating, creating self-standing L-shaped
electrode substrates. After drop-casting, the PEDOT:PSS mixture was dried at room
temperature, and stripes of silver conductive paint (Electrolube) were added to the top edge of
each PEDOT:PSS electrode, as shown in Figure 1, to facilitate electronic contact to the
instrumentation. Please note that Figure 1 is not to scale; for example the PEDOT:PSS films
and capillary appear disproportionally thick. Since it is difficult to use a 4-point probe on soft
polymer films like the one used here, the sheet resistance was measured by creating several
square electrodes of varying size and measuring the resistance between silver electrodes
applied to the full length of two opposite sides with a digital multimeter (Fluke 23). The
Page 6 of 23
Wiley-VCH
ELECTROPHORESIS
123456789101112131415161718192021222324252627282930313233343536373839404142434445464748495051525354555657585960

For Peer Review
Submitted to Electrophoresis
7
PEDOT:PSS films produced showed a sheet resistance of roughly 20 Ω/sq. The Pt electrodes
used in the wells were 25 cm long, 0.2 mm diameter wires (EP1330, Sigma-Aldrich).
2.2 Fluid Displacement Measurements
The pumps consisted of two wells (40x30x12 mm) filled with aqueous salt solution, each
containing a PEDOT:PSS electrode, connected with an untreated fused silica capillary, 10
mm long with a 25 µm inner diameter. Fluid movement was verified with a displacement
setup with wells containing differing electrolyte concentrations, 5 and 20 mM of both
Na2HPO4 (Sigma-Aldrich) (pH 9.4) and NaCl (pH 5.7), 10 mL per well. The potential was
applied and the current through the system measured by a Keithley 2636A Source-Meter.
2.3 pH Measurements
The comparison between PEDOT and Pt electrodes was performed with 20 mM NaCl as
electrolyte, 10 mL per well, adding 10 mM NaOH and HCl solution until the electrolyte was
stable at around pH 5.1. The electrolyte is more sensitive to the generation of H+ and OH- at
this pH than at e.g. pH 7 due to the buffering effects of carbonic acid from atmospheric CO2.
To make any pH changes due to electrolysis apparent, no buffer was added to the electrolyte.
The pump used a 10 mm long, 50 µm i.d. fused silica capillary and was driven at a constant
current of 4 µA. The driving current was periodically paused by opening the electric circuit
so that the pH of the electrolyte in each electrode well could be measured. Then, the current
was resumed until the next pH measurement. During these measurements, the pH of a control
sample, a well containing the same electrolyte without any electrode, was also measured to
quantify any pH changes from e.g. CO2 interactions. All electrolyte pH measurements were
performed with a VWR SympHony SB70P pH-meter.
2.4 Cyclic Voltammetry Measurements
All CV measurements were performed in a three-electrode electrochemical cell in 20 mM
NaCl with a platinum counter electrode and an Ag/AgCl (3 M NaCl) reference electrode
connected to a µAutolab type II potentiostat/galvanostat (Metrohm Autolab). The
Page 7 of 23
Wiley-VCH
ELECTROPHORESIS
123456789101112131415161718192021222324252627282930313233343536373839404142434445464748495051525354555657585960
For Peer Review
Submitted to Electrophoresis
8
PEDOT:PSS electrode used for the voltammogram in Figure 1 was approximately 1 cm by 2
cm and 5 µm thick. The corresponding Pt working electrode had a surface area of 2 mm2.
The sweep rate during the CV measurements was 25 mV/s. Autolab Software (GPES) was
used to capture and analyze the CV data.
2.5 Potential drop across the capillary
The potential, during operation, across a 10 mm long, 50 µm i.d. capillary in the pumping
setup filled with 20 mM NaCl was measured using two Ag/AgCl reference electrodes
(BASinc RE-5B) connected to one channel of a Keithley 2636 source-meter.
2.6 Electrode lifetime measurements
Pumps with PEDOT electrodes, 10 mm long, 25 µm i.d. capillaries and 20 mM NaCl
electrolyte were run with an applied potential of 100V. The polarity was reversed every two
hours, reversing the pumping direction. After cycling the pump for 37 days, the PEDOT
electrodes’ functionality was verified again by cyclic voltammetry and by testing their ability
to pump without modifying the electrolyte pH as previously described. The charge transferred
per cycle during a 37-day lifetime measurement and a subsequent pH measurement with the
same electrodes is presented in the supplementary information.
3 Results and Discussion
When in contact with an electrolyte, switching PEDOT between the p-doped and undoped
state (or vice versa) requires ions (M+) to leave (or enter) the polymer to maintain local
electroneutrality, as shown in Figure 1. The reduction half-reaction for PEDOT is shown in
equation 1. This reaction is reversible, i.e. the PEDOT can be doped via the associated
oxidation. Through these half reactions, the PEDOT effectively acts as an electron-to-ion
transducer [33], allowing an EC reaction to take place at each electrode without causing
electrolysis.
−++−++→+ PSSMPEDOTMPSSPEDOT 0
(1)
Page 8 of 23
Wiley-VCH
ELECTROPHORESIS
123456789101112131415161718192021222324252627282930313233343536373839404142434445464748495051525354555657585960
For Peer Review
Submitted to Electrophoresis
9
The half-reaction shown in (1) occurs well within the EC stability window of water
[16], as verified by cyclic voltammetry and shown in Figure 2. Since it starts as a mixture of
doped and undoped PEDOT, each polymer electrode (solid curve) performs electrochemistry
even at small applied potentials, allowing significant charge to be transferred where
electrolysis is limited (e.g. between 0.3 and -0.3 V vs. Ag/AgCl). Besides reducing the
generation of byproducts, this enables pump operation at low potentials, e.g. those supplied by
batteries in portable devices. After the PEDOT is exhausted (oxidized or reduced), in the CV
sweep, e.g. over 0.5 V or below -0.5 V vs. Ag/AgCl in Figure 2, electrolysis of water
becomes significant. We wish to note that the entire volume of each PEDOT electrode is
available for oxidation/reduction because PEDOT:PSS forms a hydrogel in water that readily
transports ions [34]. In the pump, this means that a significant amount of electrolyte can be
pumped before the device needs to be turned off or the pumping direction reversed.
Furthermore, before the electrodes are exhausted (fully oxidized or reduced), electrolysis is
insignificant compared to the electrochemistry of PEDOT even when much larger external
potentials are applied. Although this device was demonstrated with PEDOT, similar devices
can almost certainly be produced with electrodes made from a wide variety of
electrochemically active conducting polymers and metal oxides. The most important factors
are that the EC change in the electrodes’ redox state occurs within the EC stability window of
the solvent and that the material remains within the electrode rather than being released into
the electrolyte.
The pumps were manufactured by placing a silica capillary between two wells in a
rectangular 8-well polystyrene dish. The relatively large reservoirs compared to the volume of
the capillary allowed easy measurement of pH, freer electrode design and lower impact from
evaporation. While the size of electrodes and wells helped to reliably measure the difference
between electrode materials, the size also made the system too large to be considered
microfluidic. However, the observed impact of electrolysis should be equally or even more
Page 9 of 23
Wiley-VCH
ELECTROPHORESIS
123456789101112131415161718192021222324252627282930313233343536373839404142434445464748495051525354555657585960

For Peer Review
Submitted to Electrophoresis
10
important when scaling down the system. A PEDOT:PSS electrode was placed in each well,
the wells were filled with electrolyte, and a potential applied between the electrodes.
A simple equivalent circuit and schematic of the electrostatic potential within the
pump together with experimental measurements shown and described in the supplementary
information illustrate that the majority of the applied potential drops across the capillary.
However, the potential drop at the platinum electrodes increases with increasing applied
potential while the drop remains low at PEDOT electrodes, see supplementary information.
With small capillary diameters and sufficient undoped (doped) electrode material in the anode
(cathode), this allows large potentials to be applied without risk of over-oxidizing the PEDOT,
an irreversible reaction which permanently reduces the electrode’s capacity [30, 31].
Filling the two wells with salt solutions of differing concentration allowed us to easily
estimate the flow rate through the capillary without the use of dyes, particles, or other
additives, as the current transported through the capillary for a given electric field is
proportional to the ion concentration of the electrolyte within the capillary [35], see the
supplementary information for a detailed description.
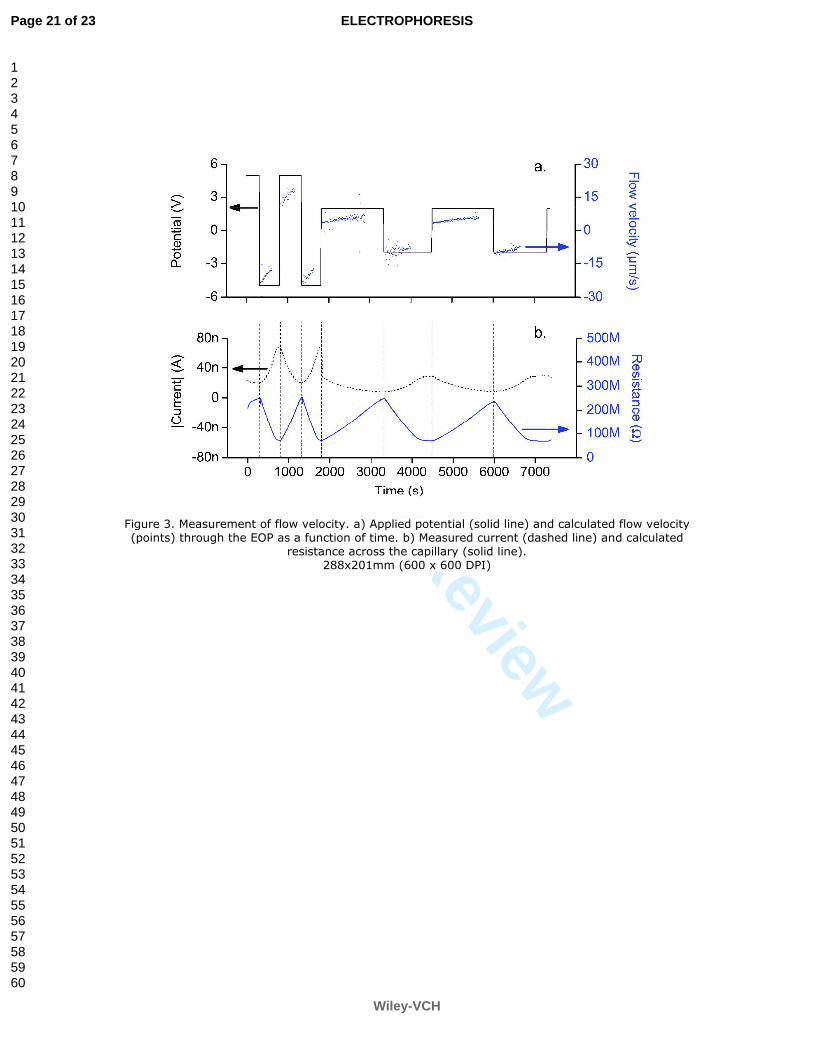
The resistance of the capillary, calculated from the measured current assuming that the
capillary is the only significant resistance, is plotted as a function of time for a sequence of
potentials applied between the PEDOT:PSS electrodes as shown in Figure 3. In this device,
the capillary was 10 mm in length, with an inner diameter of 25 µm. The high and low
concentration electrolytes (HCE and LCE, respectively) were 20 mM and 5 mM solutions of
Na2HPO4, respectively. The applied potential (solid line in Figure 3a) was varied to drive the
flow (points in Figure 3a) in both directions and at several flow rates.
For the experimental sequence shown in Figure 3, the capillary was initially filled
with the LCE. Upon changing the applied potential from +5 V to -5 V at approximately 300
seconds, the HCE was introduced into the capillary. As the HCE displaced the LCE, the
resistance within the capillary (inversely proportional to the average concentration within the
Page 10 of 23
Wiley-VCH
ELECTROPHORESIS
123456789101112131415161718192021222324252627282930313233343536373839404142434445464748495051525354555657585960

For Peer Review
Submitted to Electrophoresis
11
capillary) decreased (nearly) linearly until the capillary was filled with the HCE, at which
point it reached a minimum. Notice that this does not indicate that the pump stopped
transporting electrolyte, but simply that the ionic resistance across the capillary no longer
changed. The flow velocity, shown as points in Figure 3a, was calculated by multiplying the
time derivative of the resistance with the capillary length divided by the difference between
the minimum and maximum in the resistance trace. Notice that differentiating the recorded
current results in a relatively noisy signal. We believe the real flow rate to be much steadier
than indicated. Only the values of the flow velocity where the calculation can be performed
accurately (i.e. while a concentration front was propagating through the capillary) are shown
in Figure 3a. Reversing the potential, for example from -5 V to +5 V at approximately 800 s
in Figure 3, caused the flow to reverse as anticipated. The resistance increased (nearly)
linearly as the LCE progressively filled the capillary. The density of negative charge on the
capillary wall depends on the pH of the solution, changing from 20 mM NaHPO4 (pH 9.4) to
NaCl (pH 5.7) nearly cuts the EOF in half. The flow velocity for 20 mM NaCl (pH 5.7) for
potentials between 2 and 80 V is shown in Figure 4. These single-capillary pumps are not
optimal for generating a large pressure; a multi-channel design would achieve higher pressure
and flow rates with the same cross sectional area [36].
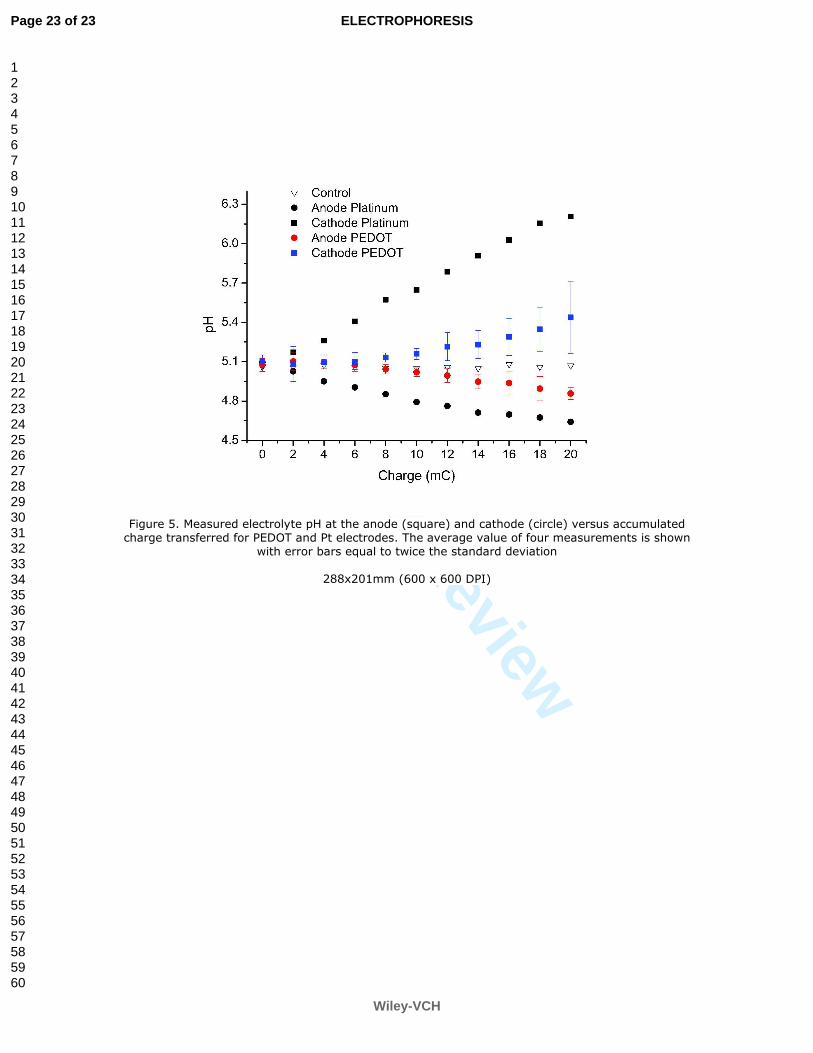
Since the primary reason for using electrochemically-active electrodes is to reduce the
effects of the electrolysis of water, we measured the change in electrolyte pH in EOPs with
PEDOT electrodes and compared them to pumps made with Pt electrodes. Pumps, like those
shown in Figure 1, were operated continuously in one direction at a constant current of 4 µA,
resulting in an applied potential around 80 V. The average pH of measurements from four
separate PEDOT devices as a function of transferred charge is shown in Figure 5. The error
bars on the PEDOT data represent two standard deviations in the measurements. The
reference value was measured in a well without electrodes to detect any pH changes due to
temperature and atmospheric effects. Using the polymer electrodes, the pH remained stable
Page 11 of 23
Wiley-VCH
ELECTROPHORESIS
123456789101112131415161718192021222324252627282930313233343536373839404142434445464748495051525354555657585960
For Peer Review
Submitted to Electrophoresis
12
within one tenth of a pH unit until 10 mC was transferred. In comparison, the same change of
pH occurred during the first 2 mC with Pt electrodes, and when 10 mC was transferred, the
pH difference between the wells exceeded 0.8. Note that both the pH change and associated
error bars are larger for the cathode than for the anode, which is to be expected since the pH is
the negative logarithm of proton concentration, making the measurement more sensitive
closer to pH 7.
Although they can operate for a relatively long time, the electrodes used in this EOP
are finite and can be “exhausted” (oxidized at the anode or reduced at the cathode) so the
pump cannot operate in one direction indefinitely. When one or both electrodes are fully
exhausted, electrolysis of water at the polymer/electrolyte interface takes over and the pump
continues to operate in a manner similar to an EOP based on metal electrodes. This is evident
in the increase (decrease) in pH at the cathode (anode) visible for the PEDOT data in Figure 5
for transferred charge > 10 mC. It is therefore important to design and operate the pump such
that the electrodes are never exhausted, in this case up to about 10 mC.
As with the materials in secondary (rechargeable) batteries, repeatedly charging and
discharging the PEDOT electrodes in the EOP could cause undesired side-reactions within the
polymer that limit the electrodes’ lifetime, particularly at elevated potentials [30, 31]. The
significance of this effect was investigated by reversing a 100 V potential applied between
PEDOT:PSS electrodes in an EOP every 2 hours, resulting in a charge transfer close to 10 mC
during each cycle. The charge transferred during each cycle under a 37-day measurement
shows no deterioration, and the same electrodes were subsequently used in the pH
measurement presented in the supplementary information, verifying that they maintained their
functionality.
Although the pump described here has macroscopic vessels and electrodes, the target
area of application is in the micro and even nano scale. However, there is no reason to expect
difficult challenges in scaling such a device. Techniques such as soft lithography and
Page 12 of 23
Wiley-VCH
ELECTROPHORESIS
123456789101112131415161718192021222324252627282930313233343536373839404142434445464748495051525354555657585960
For Peer Review
Submitted to Electrophoresis
13
photolithography are frequently used to etch capillaries and vessels in glass, and CP
electrodes can be inkjet-printed [9] into such wells with a resolution of a few microns. When
reducing the electrode size, the charge that can be transferred before electrolysis decreases
significantly. Our results indicate approximately 10 mC of charge per mg (dry weight) of
PEDOT:PSS in the electrodes is available for pumping before electrolysis becomes important.
Other studies using PEDOT:PSS show that the electrodes are highly stable in various other
solutions/buffers, apart from those containing oxidizing agents which can cause over-
oxidation of the PEDOT [37, 38].
4 Concluding remarks
Using conducting and electrochemically-switchable materials as electrodes, we have
demonstrated an EOP that drives aqueous samples without significant electrolysis, i.e. without
generating gas or changing the solution’s pH. Furthermore, the pump begins operating at
potentials smaller than the electrochemical stability window of water, making it a strong
candidate for use in portable battery-driven devices. In this example, we employed the CP
PEDOT; however, other conducting materials, e.g. CPs or metal oxides, function as electron-
to-ion transducers in a similar manner. The key criteria are that the electrode material be
conductive and that it can be oxidized/reduced within the EC stability window of the
electrolyte used. The concept should also work for electrodes in, e.g., capillary or gel
electrophoresis systems. It is our hope that the biocompatible nature of these materials,
coupled with the ease with which solution-based manufacturing can be performed, will
facilitate and accelerate the development and use of LOC devices in a wide variety of
applications.
Page 13 of 23
Wiley-VCH
ELECTROPHORESIS
123456789101112131415161718192021222324252627282930313233343536373839404142434445464748495051525354555657585960

For Peer Review
Submitted to Electrophoresis
14
5 References
[1] Arnold, D. W., Paul, P. H., Schoeniger, J. S., US Patent 6,287,440 2001 [2] Khamizov, R. K., Kumakhov, M. A., Bastrukina, N. S., Voronov, A. A., Nikitina, S. V., US Patent 2010034667 2009 [3] Liu, S., Lu, J., US Patent 20020166592 2002 [4] Brask, A., Kutter, J., Bruus, H., Lab Chip 2005, 5, 730-738. [5] Wang, P., Chen, Z., Chang, H., Sens Actuators B 2006, 113, 500-509. [6] Persat, A., Suss, M., Santiago, J., Lab Chip 2009, 9, 2454-2469. [7] Minerick, A. R., Ostafin, A. E., Chang, H.-C., Electrophoresis 2002, 23, 2165-2173. [8] Gencoglu, A., Minerick, A., Lab Chip 2009, 9, 1866-1873. [9] Mannerbro, R., Ranlof, M., Robinson, N., Forchheimer, R., Synthetic Met 2008, 158, 556-560. [10] Nielsen, C. B., Angerhofer, A., Abboud, K. A., Reynolds, J. R., J Am Chem Soc 2008, 130, 9734-9746. [11] Pei, Q. B., Yu, G., Zhang, C., Yang, Y., Heeger, A. J., Science 1995, 269, 1086-1088. [12] Thackeray, J. W., White, H. S., Wrighton, M. S., J Phys Chem-Us 1985, 89, 5133-5140. [13] Leger, J. M., Adv Mater 2008, 20, 837-841. [14] Isaksson, J., Kjall, P., Nilsson, D., Robinson, N. D., et al., Nat Mater 2007, 6, 673-679. [15] Tee, S. Y., Bausch, A. R., Janmey, P. A., Curr Biol 2009, 19, R745-R748. [16] Groenendaal, B. L., Jonas, F., Freitag, D., Pielartzik, H., Reynolds, J. R., Adv Mater 2000, 12, 481-494. [17] Mortimer, R. J., Dyer, A. L., Reynolds, J. R., Displays 2006, 27, 2-18. [18] Schwendeman, I., Hickman, R., Sonmez, G., Schottland, P., et al., Chem Mater 2002, 14, 3118-3122. [19] Robinson, L., Hentzell, A., Robinson, N. D., Isaksson, J., Berggren, M., Lab Chip 2006, 6, 1277-1278. [20] Wang, X., Ederth, T., Inganas, O., Langmuir 2006, 22, 9287-9294. [21] Chuan-Hua, C., Santiago, J. G., J Microelectromech S 2002, 11, 672-683. [22] Culbertson, C. T., Ramsey, R. S., Ramsey, J. M., Anal Chem 2000, 72, 2285-2291. [23] Crabtree, H. J., Cheong, E. C. S., Tilroe, D. A., Backhouse, C. J., Anal Chem 2001, 73, 4079-4086. [24] Brask, A., Snakenborg, D., Kutter, J. P., Bruus, H., Lab Chip 2006, 6, 280-288. [25] Guzman, K. A. D., Karnik, R. N., Newman, J. S., Majumdar, A., J Microelectromech S
2006, 15, 237-245. [26] Henderson, R. D., Guijt, R. M., Haddad, P. R., Hilder, E. F., et al., Lab Chip 2010, 10, 1869-1872. [27] Isaksson, J., Nilsson, D., Kjall, P., Robinson, N. D., et al., Org Electron 2008, 9, 303-309. [28] Isaksson, J., Tengstedt, C., Fahlman, M., Robinson, N., Berggren, M., Adv Mater 2004, 16, 316-+. [29] Causley, J., Stitzel, S., Brady, S., Diamond, D., Wallace, G., Synthetic Met 2005, 151, 60-64. [30] Tehrani, P., Kanciurzewska, A., Crispin, X., Robinson, N. D., et al., Solid State Ionics
2007, 177, 3521-3527.
Page 14 of 23
Wiley-VCH
ELECTROPHORESIS
123456789101112131415161718192021222324252627282930313233343536373839404142434445464748495051525354555657585960

For Peer Review
Submitted to Electrophoresis
15
[31] Tehrani, P., Isaksson, J., Mammo, W., Andersson, M. R., et al., Thin Solid Films 2006, 515, 2485-2492. [32] Crispin, X., Jakobsson, F., Crispin, A., Grim, P., et al., Chem Mater 2006, 18, 4354-4360. [33] Bobacka, J., Anal Chem 1999, 71, 4932-4937. [34] Li, G. C., Pickup, P. G., Phys Chem Chem Phys 2000, 2, 1255-1260. [35] Mela, P., Tas, N. R., Berenschot, E. J. W., van Nieuwkasteele, J., van den Berg, A., Electrophoresis 2004, 25, 3687-3693. [36] Edwards, J. M., Hamblin, M. N., Fuentes, H. V., Peeni, B. A., et al., Biomicrofluidics
2007, 1, 014101. [37] Nikolou, M., Malliaras, G. G., Chem Rec 2008, 8, 13-22. [38] Thaning, E. M., Asplund, M. L., Nyberg, T. A., Inganas, O. W., von Holst, H., J Biomed
Mater Res B Appl Biomater 2010, 93, 407-415.
Page 15 of 23
Wiley-VCH
ELECTROPHORESIS
123456789101112131415161718192021222324252627282930313233343536373839404142434445464748495051525354555657585960

For Peer Review
Submitted to Electrophoresis
16
Acknowledgements
The authors thank the Swedish Science Council (Vetenskapsrådet) for funding of this project.
Supporting Information is available online from Wiley InterScience or from the author.
Page 16 of 23
Wiley-VCH
ELECTROPHORESIS
123456789101112131415161718192021222324252627282930313233343536373839404142434445464748495051525354555657585960

For Peer Review
Submitted to Electrophoresis
17
Conflict of interest statement
The authors have submitted a patent application regarding the device described in this article
and its use (Swedish patent application number: 1050168-2).
Page 17 of 23
Wiley-VCH
ELECTROPHORESIS
123456789101112131415161718192021222324252627282930313233343536373839404142434445464748495051525354555657585960
For Peer Review
Submitted to Electrophoresis
18
Figure captions
Figure 1. A schematic of the electroosmotic pump tested in the laboratory, including the
electrochemical half-reactions occurring at the anode and cathode and the transport of
electrons and cations (e.g. Na+) within the device.
Figure 2. Cyclic voltammogram of Pt (dotted line) and PEDOT:PSS (solid line) electrodes in
20mM NaCl(aq). Arrows indicate the oxidation and reduction peaks associated with the
PEDOT.
Figure 3. Measurement of flow velocity. a) Applied potential (solid line) and calculated flow
velocity (points) through the EOP as a function of time. b) Measured current (dashed line) and
calculated resistance across the capillary (solid line).
Figure 4. Flow velocity versus potential for 20 mM NaCl (pH 5.7) through a 25 µm i.d. 10
mm long fused silica capillary and PEDOT electrodes. Velocities were measured in both
directions (driven by positive and negative potentials) in the symmetric device, but shown
here only as positive values for simplicity. Data shown are the average of three
measurements, error bars are within symbol size.
Figure 5. Measured electrolyte pH at the anode (square) and cathode (circle) versus
accumulated charge transferred for PEDOT and Pt electrodes. The average value of four
measurements is shown with error bars equal to twice the standard deviation
Page 18 of 23
Wiley-VCH
ELECTROPHORESIS
123456789101112131415161718192021222324252627282930313233343536373839404142434445464748495051525354555657585960

For Peer Review
Figure 1. A schematic of the electroosmotic pump tested in the laboratory, including the electrochemical half-reactions occurring at the anode and cathode and the transport of electrons
and cations (e.g. Na+) within the device. 254x190mm (600 x 600 DPI)
Page 19 of 23
Wiley-VCH
ELECTROPHORESIS
123456789101112131415161718192021222324252627282930313233343536373839404142434445464748495051525354555657585960

For Peer Review
Figure 2. Cyclic voltammogram of Pt (dotted line) and PEDOT:PSS (solid line) electrodes in 20mM NaCl(aq). Arrows indicate the oxidation and reduction peaks associated with the PEDOT.
288x201mm (600 x 600 DPI)
Page 20 of 23
Wiley-VCH
ELECTROPHORESIS
123456789101112131415161718192021222324252627282930313233343536373839404142434445464748495051525354555657585960
For Peer Review
Figure 3. Measurement of flow velocity. a) Applied potential (solid line) and calculated flow velocity (points) through the EOP as a function of time. b) Measured current (dashed line) and calculated
resistance across the capillary (solid line). 288x201mm (600 x 600 DPI)
Page 21 of 23
Wiley-VCH
ELECTROPHORESIS
123456789101112131415161718192021222324252627282930313233343536373839404142434445464748495051525354555657585960

For Peer Review
Figure 4. Flow velocity versus potential for 20 mM NaCl (pH 5.7) through a 25 µm i.d. 10 mm long fused silica capillary and PEDOT electrodes. Velocities were measured in both directions (driven by positive and negative potentials) in the symmetric device, but shown here only as positive values for simplicity. Data shown are the average of three measurements, error bars are within symbol
size. 288x201mm (600 x 600 DPI)
Page 22 of 23
Wiley-VCH
ELECTROPHORESIS
123456789101112131415161718192021222324252627282930313233343536373839404142434445464748495051525354555657585960
For Peer Review
Figure 5. Measured electrolyte pH at the anode (square) and cathode (circle) versus accumulated charge transferred for PEDOT and Pt electrodes. The average value of four measurements is shown
with error bars equal to twice the standard deviation
288x201mm (600 x 600 DPI)
Page 23 of 23
Wiley-VCH
ELECTROPHORESIS
123456789101112131415161718192021222324252627282930313233343536373839404142434445464748495051525354555657585960
Copyright © 2022 FDOKUMEN