An AC electrokinetic impedance immunosensor for rapid detection of tuberculosis
9
An AC electrokinetic impedance immunosensor for rapid detection of tuberculosis Haochen Cui, a Shanshan Li, ab Quan Yuan, a Ashutosh Wadhwa, c Shigetoshi Eda, c Mark Chambers, d Roland Ashford, d Hongyuan Jiang b and Jie Wu * a This work presents an AC electrokinetic impedance sensing method that is capable of detecting specific interactions between macromolecules such as antigen–antibody binding. Serum samples were added to the surface of interdigitated electrodes that had been coated with bacterial antigens. After applying an AC signal of 100 mV at a specific frequency continuously, the electrodes' impedance change was recorded and used to determine the occurrence and level of antibody binding to the antigen. Our theoretical analysis indicated that with this AC signal, the target macromolecules will experience a sufficiently strong attraction force towards the electrode surface for acceleration of the binding process. Using this method, 11 human tuberculosis and 10 bovine tuberculosis serum samples were tested. The results were consistent with those obtained by a conventional ELISA method. The limit of detection of the impedance sensing method was estimated to be better than 10 ng mL 1 . In summary, we demonstrate that AC electrokinetic impedance sensing can be used for rapid and sensitive detection of specific antibodies in serum samples. This method may form a basis for development of a point of care diagnostic device for human and bovine tuberculosis. 1. Introduction Tuberculosis (TB) is a chronic infectious disease that affects a broad range of mammalian hosts including humans, cattle, deer, llamas, wild boar, domestic cats, wild carnivores (fox, coyotes, badgers), possums, and rodents. Human TB, caused by Mycobacterium tuberculosis, occurs in more than ten million people worldwide, and is estimated to be responsible for the death of two million people annually. It is also estimated that over one billion dollars is spent on diagnosis and evaluation of human TB worldwide each year. 1 Although bovine TB, caused by Mycobacterium bovis, has been mostly eradicated in the livestock industry of developed countries, the disease in wildlife still poses a risk to livestock, tourism economy, and wildlife conservation. Global economic losses from bovine TB total US$ 3 billion annually. In the United States, $40 million (and in Great Britain, £100 million) were spent on bovine TB manage- ment in the year 2008–2009 alone. In developing countries, bovine TB still causes serious concerns not only for wildlife, but also for public health, food safety and the economy of livestock industries. Conventional methods of TB diagnosis are labor-intensive, time-consuming and/or expensive. For example, medical eval- uation of human TB includes a medical history, physical examination, radiographic imaging (conventional chest X-ray), microbiological smears, and bacterial cultures. It may also include a tuberculin skin test or other measurements of cellular immunity, such as interferon-gamma release assays (IGRA). For human TB, the Cepheid Xpert MTB/RIF assay has recently been used for on-site diagnosis but the assay is costly. 2,3 Bovine TB in animals is commonly conrmed by post mortem examination of gross lesions and bacterial culture. Animals can also be diag- nosed before death by immunodiagnosis (including intra- dermal tuberculin skin testing and IGRA) and culture of clinical samples. Global control and prevention of TB has partly been hampered by the lack of effective diagnostic methods, so there is an urgent need for more simple, rapid and sensitive on-site diagnosis of TB. 4 In recent years, immunosensors have attracted a great amount of research effort because of their potential to achieve rapid, inexpensive, and portable on site diagnosis. 5 Immuno- sensors can detect specic analytes of interest from a biological solution through the use of a functionalized sensor surface, i.e. by immobilizing a capture probe on the sensor surface prior to adding a biological sample solution. The most studied immu- nosensors include induced uorescence immunoassay, 6 giant magnetoresistive sensors, 7 surface plasmon resonance 8 and a Department of Electrical Engineering and Computer Science, The University of Tennessee, Knoxville, TN 37996, USA. E-mail: [email protected] b School of Mechatronics Engineering, Harbin Institute of Technology, 150001, PR China c Department of Forestry, Wildlife and Fisheries, The University of Tennessee, Knoxville, TN 37996, USA d Department of Bovine Tuberculosis, Animal Health and Veterinary Laboratories Agency, Addlestone, Surrey, KT15 3NB, UK Cite this: Analyst, 2013, 138, 7188 Received 4th June 2013 Accepted 7th October 2013 DOI: 10.1039/c3an01112g www.rsc.org/analyst 7188 | Analyst, 2013, 138, 7188–7196 This journal is ª The Royal Society of Chemistry 2013 Analyst PAPER Published on 07 October 2013. Downloaded by University of Tennessee at Knoxville on 07/11/2013 13:59:12. View Article Online View Journal | View Issue
Transcript of An AC electrokinetic impedance immunosensor for rapid detection of tuberculosis

Analyst
PAPER
Publ
ishe
d on
07
Oct
ober
201
3. D
ownl
oade
d by
Uni
vers
ity o
f T
enne
ssee
at K
noxv
ille
on 0
7/11
/201
3 13
:59:
12.
View Article OnlineView Journal | View Issue
aDepartment of Electrical Engineering an
Tennessee, Knoxville, TN 37996, USA. E-mabSchool of Mechatronics Engineering, Harb
ChinacDepartment of Forestry, Wildlife and Fisheri
TN 37996, USAdDepartment of Bovine Tuberculosis, Anim
Agency, Addlestone, Surrey, KT15 3NB, UK
Cite this: Analyst, 2013, 138, 7188
Received 4th June 2013Accepted 7th October 2013
DOI: 10.1039/c3an01112g
www.rsc.org/analyst
7188 | Analyst, 2013, 138, 7188–719
An AC electrokinetic impedance immunosensor forrapid detection of tuberculosis
Haochen Cui,a Shanshan Li,ab Quan Yuan,a Ashutosh Wadhwa,c Shigetoshi Eda,c
Mark Chambers,d Roland Ashford,d Hongyuan Jiangb and Jie Wu*a
This work presents an AC electrokinetic impedance sensing method that is capable of detecting specific
interactions between macromolecules such as antigen–antibody binding. Serum samples were added to
the surface of interdigitated electrodes that had been coated with bacterial antigens. After applying an
AC signal of 100 mV at a specific frequency continuously, the electrodes' impedance change was
recorded and used to determine the occurrence and level of antibody binding to the antigen. Our
theoretical analysis indicated that with this AC signal, the target macromolecules will experience a
sufficiently strong attraction force towards the electrode surface for acceleration of the binding process.
Using this method, 11 human tuberculosis and 10 bovine tuberculosis serum samples were tested. The
results were consistent with those obtained by a conventional ELISA method. The limit of detection of
the impedance sensing method was estimated to be better than 10 ng mL�1. In summary, we
demonstrate that AC electrokinetic impedance sensing can be used for rapid and sensitive detection of
specific antibodies in serum samples. This method may form a basis for development of a point of care
diagnostic device for human and bovine tuberculosis.
1. Introduction
Tuberculosis (TB) is a chronic infectious disease that affects abroad range of mammalian hosts including humans, cattle,deer, llamas, wild boar, domestic cats, wild carnivores (fox,coyotes, badgers), possums, and rodents. Human TB, caused byMycobacterium tuberculosis, occurs in more than ten millionpeople worldwide, and is estimated to be responsible for thedeath of two million people annually. It is also estimated thatover one billion dollars is spent on diagnosis and evaluation ofhuman TB worldwide each year.1 Although bovine TB, caused byMycobacterium bovis, has beenmostly eradicated in the livestockindustry of developed countries, the disease in wildlife stillposes a risk to livestock, tourism economy, and wildlifeconservation. Global economic losses from bovine TB total US$3 billion annually. In the United States, $40 million (and inGreat Britain, £100 million) were spent on bovine TB manage-ment in the year 2008–2009 alone. In developing countries,bovine TB still causes serious concerns not only for wildlife, but
d Computer Science, The University of
in Institute of Technology, 150001, PR
es, The University of Tennessee, Knoxville,
al Health and Veterinary Laboratories
6
also for public health, food safety and the economy of livestockindustries.
Conventional methods of TB diagnosis are labor-intensive,time-consuming and/or expensive. For example, medical eval-uation of human TB includes a medical history, physicalexamination, radiographic imaging (conventional chest X-ray),microbiological smears, and bacterial cultures. It may alsoinclude a tuberculin skin test or other measurements of cellularimmunity, such as interferon-gamma release assays (IGRA). Forhuman TB, the Cepheid Xpert MTB/RIF assay has recently beenused for on-site diagnosis but the assay is costly.2,3 Bovine TB inanimals is commonly conrmed by post mortem examination ofgross lesions and bacterial culture. Animals can also be diag-nosed before death by immunodiagnosis (including intra-dermal tuberculin skin testing and IGRA) and culture of clinicalsamples. Global control and prevention of TB has partly beenhampered by the lack of effective diagnostic methods, so thereis an urgent need for more simple, rapid and sensitive on-sitediagnosis of TB.4
In recent years, immunosensors have attracted a greatamount of research effort because of their potential to achieverapid, inexpensive, and portable on site diagnosis.5 Immuno-sensors can detect specic analytes of interest from a biologicalsolution through the use of a functionalized sensor surface, i.e.by immobilizing a capture probe on the sensor surface prior toadding a biological sample solution. The most studied immu-nosensors include induced uorescence immunoassay,6 giantmagnetoresistive sensors,7 surface plasmon resonance8 and
This journal is ª The Royal Society of Chemistry 2013
Paper Analyst
Publ
ishe
d on
07
Oct
ober
201
3. D
ownl
oade
d by
Uni
vers
ity o
f T
enne
ssee
at K
noxv
ille
on 0
7/11
/201
3 13
:59:
12.
View Article Online
microelectrode impedimetric sensors.9,10 Fluorescent immuno-assay is one of the most widely used methods; however, itrequires multiple steps for antibody incubation and washing,making it too time-consuming to be used for point of carediagnosis. Giant magnetoresistive sensors have also been usedto quantify immunological interactions at the sensor surface,however, similar to uorescent immunoassay, they require alabeling step with magnetic particles. Although surface plas-mon resonance is a label-free sensing method, it requiressophisticated optical instrumentation and highly trainedpersonnel to operate. Compared with the aforementionedimmunosensors, microelectrode impedimetric immunosensorsare rather advantageous due to their simplicity in operation andtheir low cost of fabrication. Currently, research on impedi-metric immunosensors is directed in several directions,11 suchas improving immobilization methods of receptors,12 exploringnanostructured electrodes to amplify the detection signal,9 andinvestigating equivalent circuit or data processing algorithms toeffectively correlate analyte concentrations with impedancechanges.
While signicant progress has been made in electricalimpedance sensors, for them to be used towards on-site detec-tion, there are still some obstacles to be overcome. First, manyimpedimetric tests would require sophisticated and oen time-consuming data processing to extract binding related informa-tion. Expensive benchtop impedance analyzers are usually neededif high test frequencies (>1 MHz) are used. Second, most of thereported impedance assays are conducted with highly processedsamples. To be viable as an on-site diagnostic system, samplepreparation must be simple enough to be performed on site.Third, most of the currently tested systems still require at least 30minutes to perform a single assay on abundant molecules orlonger time for more diluted analytes. While this is an improve-ment over the standard enzyme-linked immunosorbent assay(ELISA) method, an incubation time of half an hour or more maystill be too long under some circumstances. For example, testingmultiple wild animals in eld would be much more feasible if amore rapid test becomes available. AC electrokinetic (ACEK)microuidics13 emerged in the 1990s and has been intensivelystudied as a means to manipulate particles or macromolecules. Ithas been demonstrated by several groups14–17 that ACEK workingwith microelectrodes can induce in situ concentration of particlesfor improved detection sensitivity and throughput. Our previouswork has investigated ACEK concentrations of biomolecules byboth numerical study18 and experiments.19,20
In this study, a new impedance assay was developed byincorporating the AC electrokinetic (ACEK) effect seamlesslywith the signal interrogation process for in situ macromoleculeenrichment and binding process monitoring. Unlike conven-tional impedimetric sensing, which uses a low AC voltage of5–10 mV before and aer binding, our method reads the elec-trode impedance continuously with a voltage of 100 mVrms at aspecic frequency. Such an AC signal would be suitable forinducing ACEK effects to convect/attract macromoleculestowards the electrode surface. It has been demonstrated by ourprevious work that the binding time has been greatly reducedfrom hours to minutes, when compared with the conventional
This journal is ª The Royal Society of Chemistry 2013
method using a static uid chamber (�hours). Our previousstudy found that changes in the level and frequency of ACpotential will lead to corresponding changes in the magnitudeof sensor response.19,21 Therefore, it is surmised that theshortened detection time in our technology is due to ACEKeffects that exert attraction force on macromolecules towardsthe electrode surface, hence accelerating binding reactions.
We also carefully choose our electrode design and detectionprotocol, so that at the AC enrichment frequency, the detectioncell can be represented with a simplied resistor–capacitor serialconnection (solution resistance in series with electrode/uidinterfacial capacitance). Because the effect of sample matrix oncell impedance is mostly evident in its resistive component (e.g.charge transfer resistance), our detection method and devicecombined is relatively unsusceptible to interference from thebackground solution. As a result, our method needs littlepretreatment of the sample (sample pre-treatment requires onlyvolume dilution of serum samples with physiological buffer), anddoes not require a washing step aer binding, which is a majoradvantage over other immunosensors.
It should be noted that the same AC signal is used tomeasure the impedance between microelectrodes, which indi-cates the binding activity and level occurring on the micro-electrodes. So in the ACEK-based impedimetric assay, analyteenrichment and impedimetric detection are conducted simul-taneously. Incorporation of ACEK with sensors has beeninvestigated for various types of sensors, such as in micro-cantilevers22 uorescent labeled affinity sensing21 and imped-ance measurements.23–25 In all the aforementioned methods,the ACEK concentration step is separate from the detectionstep, which is more complicated to operate than the impedi-metric assay reported in this work. In summary, the ACEK basedimpedimetric assay has the following merits, single step oper-ation (it involves only applying the AC signal), label free, short“sample to results” time, reduced reagent cost, simple devicedesign and reliable operation because of little human inter-vention during the test.
This paper is organized as follows. Section 2 introduces themechanism of ACEK impedance immunosensing. Devices andsamples are described in Section 3, sensor characterization inSection 4, serum experimental results in Section 5, and limit ofdetection in Section 6. Finally, conclusions are made inSection 7.
2. Mechanism2.1 Impedance based immunosensing
Electrochemical impedance spectrum (EIS) analysis is a well-established method for characterizing an electrolytic cell. InEIS, a network of electronic components can be developed torepresent an electrochemical cell.26 A change in the EIS spectracan be correlated with a change in the (di)electric properties ofthe sample solution or the electrode/electrolyte interface.
Our impedance immunosensor utilizes an array of inter-digitated microelectrodes, which is obtained by modifyingcommercially available electrode chips, i.e. surface acousticwave (SAW) resonator chips (PARS 433.92, AVX Corp.). Images of
Analyst, 2013, 138, 7188–7196 | 7189
Analyst Paper
Publ
ishe
d on
07
Oct
ober
201
3. D
ownl
oade
d by
Uni
vers
ity o
f T
enne
ssee
at K
noxv
ille
on 0
7/11
/201
3 13
:59:
12.
View Article Online
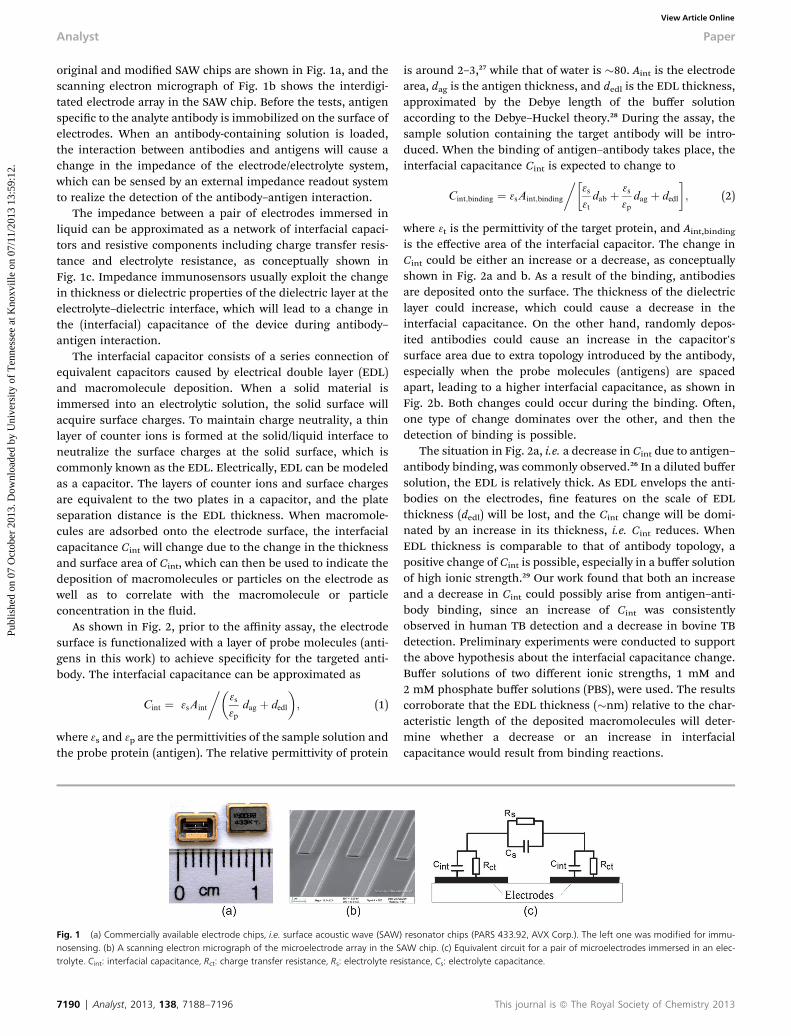
original and modied SAW chips are shown in Fig. 1a, and thescanning electron micrograph of Fig. 1b shows the interdigi-tated electrode array in the SAW chip. Before the tests, antigenspecic to the analyte antibody is immobilized on the surface ofelectrodes. When an antibody-containing solution is loaded,the interaction between antibodies and antigens will cause achange in the impedance of the electrode/electrolyte system,which can be sensed by an external impedance readout systemto realize the detection of the antibody–antigen interaction.
The impedance between a pair of electrodes immersed inliquid can be approximated as a network of interfacial capaci-tors and resistive components including charge transfer resis-tance and electrolyte resistance, as conceptually shown inFig. 1c. Impedance immunosensors usually exploit the changein thickness or dielectric properties of the dielectric layer at theelectrolyte–dielectric interface, which will lead to a change inthe (interfacial) capacitance of the device during antibody–antigen interaction.
The interfacial capacitor consists of a series connection ofequivalent capacitors caused by electrical double layer (EDL)and macromolecule deposition. When a solid material isimmersed into an electrolytic solution, the solid surface willacquire surface charges. To maintain charge neutrality, a thinlayer of counter ions is formed at the solid/liquid interface toneutralize the surface charges at the solid surface, which iscommonly known as the EDL. Electrically, EDL can be modeledas a capacitor. The layers of counter ions and surface chargesare equivalent to the two plates in a capacitor, and the plateseparation distance is the EDL thickness. When macromole-cules are adsorbed onto the electrode surface, the interfacialcapacitance Cint will change due to the change in the thicknessand surface area of Cint, which can then be used to indicate thedeposition of macromolecules or particles on the electrode aswell as to correlate with the macromolecule or particleconcentration in the uid.
As shown in Fig. 2, prior to the affinity assay, the electrodesurface is functionalized with a layer of probe molecules (anti-gens in this work) to achieve specicity for the targeted anti-body. The interfacial capacitance can be approximated as
Cint ¼ 3sAint
��3s
3pdag þ dedl
�; (1)
where 3s and 3p are the permittivities of the sample solution andthe probe protein (antigen). The relative permittivity of protein
Fig. 1 (a) Commercially available electrode chips, i.e. surface acoustic wave (SAWnosensing. (b) A scanning electron micrograph of the microelectrode array in the Strolyte. Cint: interfacial capacitance, Rct: charge transfer resistance, Rs: electrolyte res
7190 | Analyst, 2013, 138, 7188–7196
is around 2–3,27 while that of water is �80. Aint is the electrodearea, dag is the antigen thickness, and dedl is the EDL thickness,approximated by the Debye length of the buffer solutionaccording to the Debye–Huckel theory.28 During the assay, thesample solution containing the target antibody will be intro-duced. When the binding of antigen–antibody takes place, theinterfacial capacitance Cint is expected to change to
Cint;binding ¼ 3sAint;binding
��3s
3tdab þ 3s
3pdag þ dedl
�; (2)
where 3t is the permittivity of the target protein, and Aint,bindingis the effective area of the interfacial capacitor. The change inCint could be either an increase or a decrease, as conceptuallyshown in Fig. 2a and b. As a result of the binding, antibodiesare deposited onto the surface. The thickness of the dielectriclayer could increase, which could cause a decrease in theinterfacial capacitance. On the other hand, randomly depos-ited antibodies could cause an increase in the capacitor'ssurface area due to extra topology introduced by the antibody,especially when the probe molecules (antigens) are spacedapart, leading to a higher interfacial capacitance, as shown inFig. 2b. Both changes could occur during the binding. Oen,one type of change dominates over the other, and then thedetection of binding is possible.
The situation in Fig. 2a, i.e. a decrease in Cint due to antigen–antibody binding, was commonly observed.26 In a diluted buffersolution, the EDL is relatively thick. As EDL envelops the anti-bodies on the electrodes, ne features on the scale of EDLthickness (dedl) will be lost, and the Cint change will be domi-nated by an increase in its thickness, i.e. Cint reduces. WhenEDL thickness is comparable to that of antibody topology, apositive change of Cint is possible, especially in a buffer solutionof high ionic strength.29 Our work found that both an increaseand a decrease in Cint could possibly arise from antigen–anti-body binding, since an increase of Cint was consistentlyobserved in human TB detection and a decrease in bovine TBdetection. Preliminary experiments were conducted to supportthe above hypothesis about the interfacial capacitance change.Buffer solutions of two different ionic strengths, 1 mM and2 mM phosphate buffer solutions (PBS), were used. The resultscorroborate that the EDL thickness (�nm) relative to the char-acteristic length of the deposited macromolecules will deter-mine whether a decrease or an increase in interfacialcapacitance would result from binding reactions.
) resonator chips (PARS 433.92, AVX Corp.). The left one was modified for immu-AW chip. (c) Equivalent circuit for a pair of microelectrodes immersed in an elec-istance, Cs: electrolyte capacitance.
This journal is ª The Royal Society of Chemistry 2013
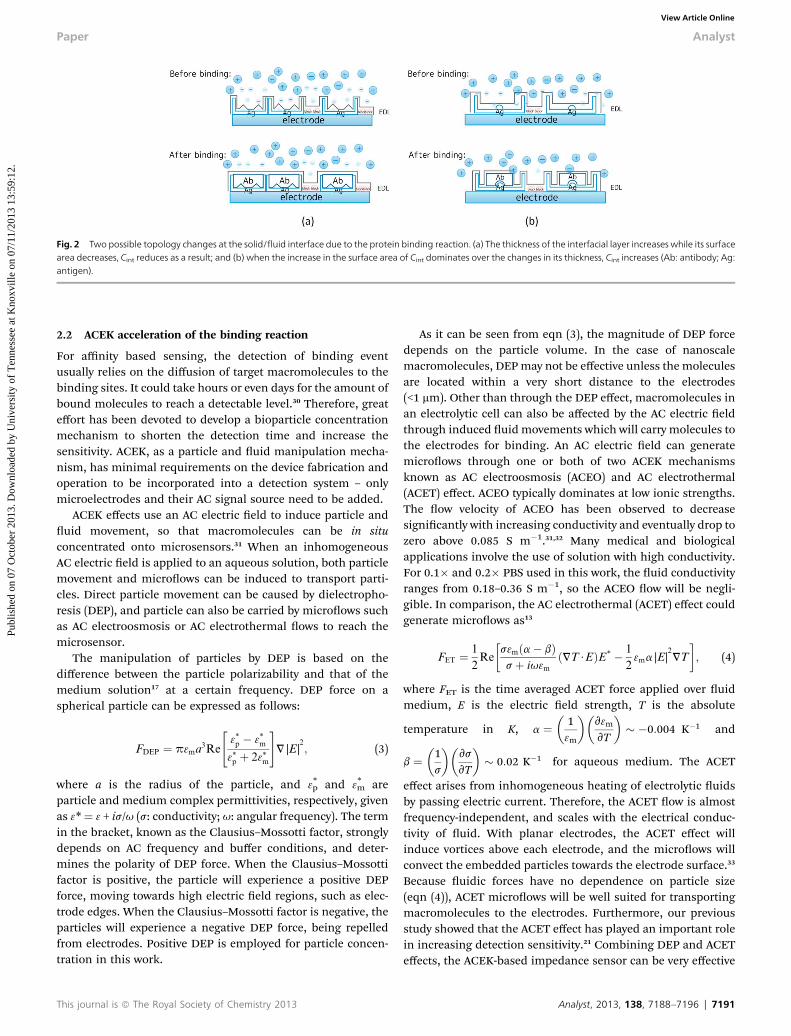
Fig. 2 Two possible topology changes at the solid/fluid interface due to the protein binding reaction. (a) The thickness of the interfacial layer increases while its surfacearea decreases, Cint reduces as a result; and (b) when the increase in the surface area of Cint dominates over the changes in its thickness, Cint increases (Ab: antibody; Ag:antigen).
Paper Analyst
Publ
ishe
d on
07
Oct
ober
201
3. D
ownl
oade
d by
Uni
vers
ity o
f T
enne
ssee
at K
noxv
ille
on 0
7/11
/201
3 13
:59:
12.
View Article Online
2.2 ACEK acceleration of the binding reaction
For affinity based sensing, the detection of binding eventusually relies on the diffusion of target macromolecules to thebinding sites. It could take hours or even days for the amount ofbound molecules to reach a detectable level.30 Therefore, greateffort has been devoted to develop a bioparticle concentrationmechanism to shorten the detection time and increase thesensitivity. ACEK, as a particle and uid manipulation mecha-nism, has minimal requirements on the device fabrication andoperation to be incorporated into a detection system – onlymicroelectrodes and their AC signal source need to be added.
ACEK effects use an AC electric eld to induce particle anduid movement, so that macromolecules can be in situconcentrated onto microsensors.31 When an inhomogeneousAC electric eld is applied to an aqueous solution, both particlemovement and microows can be induced to transport parti-cles. Direct particle movement can be caused by dielectropho-resis (DEP), and particle can also be carried by microows suchas AC electroosmosis or AC electrothermal ows to reach themicrosensor.
The manipulation of particles by DEP is based on thedifference between the particle polarizability and that of themedium solution17 at a certain frequency. DEP force on aspherical particle can be expressed as follows:
FDEP ¼ p3ma3Re
"3*p � 3*m
3*p þ 23*m
#V |E|
2; (3)
where a is the radius of the particle, and 3*p and 3*m areparticle and medium complex permittivities, respectively, givenas 3*¼ 3 + is/u (s: conductivity; u: angular frequency). The termin the bracket, known as the Clausius–Mossotti factor, stronglydepends on AC frequency and buffer conditions, and deter-mines the polarity of DEP force. When the Clausius–Mossottifactor is positive, the particle will experience a positive DEPforce, moving towards high electric eld regions, such as elec-trode edges. When the Clausius–Mossotti factor is negative, theparticles will experience a negative DEP force, being repelledfrom electrodes. Positive DEP is employed for particle concen-tration in this work.
This journal is ª The Royal Society of Chemistry 2013
As it can be seen from eqn (3), the magnitude of DEP forcedepends on the particle volume. In the case of nanoscalemacromolecules, DEPmay not be effective unless the moleculesare located within a very short distance to the electrodes(<1 mm). Other than through the DEP effect, macromolecules inan electrolytic cell can also be affected by the AC electric eldthrough induced uid movements which will carry molecules tothe electrodes for binding. An AC electric eld can generatemicroows through one or both of two ACEK mechanismsknown as AC electroosmosis (ACEO) and AC electrothermal(ACET) effect. ACEO typically dominates at low ionic strengths.The ow velocity of ACEO has been observed to decreasesignicantly with increasing conductivity and eventually drop tozero above 0.085 S m�1.31,32 Many medical and biologicalapplications involve the use of solution with high conductivity.For 0.1� and 0.2� PBS used in this work, the uid conductivityranges from 0.18–0.36 S m�1, so the ACEO ow will be negli-gible. In comparison, the AC electrothermal (ACET) effect couldgenerate microows as13
FET ¼ 1
2Re
�s3mða� bÞsþ iu3m
ðVT$EÞE* � 1
23ma |E|
2VT
�; (4)
where FET is the time averaged ACET force applied over uidmedium, E is the electric eld strength, T is the absolute
temperature in K, a ¼ 13m
� �v3m
vT
� �� �0:004 K�1 and
b ¼ 1s
� �vs
vT
� �� 0:02 K�1 for aqueous medium. The ACET
effect arises from inhomogeneous heating of electrolytic uidsby passing electric current. Therefore, the ACET ow is almostfrequency-independent, and scales with the electrical conduc-tivity of uid. With planar electrodes, the ACET effect willinduce vortices above each electrode, and the microows willconvect the embedded particles towards the electrode surface.33
Because uidic forces have no dependence on particle size(eqn (4)), ACET microows will be well suited for transportingmacromolecules to the electrodes. Furthermore, our previousstudy showed that the ACET effect has played an important rolein increasing detection sensitivity.21 Combining DEP and ACETeffects, the ACEK-based impedance sensor can be very effective
Analyst, 2013, 138, 7188–7196 | 7191

Analyst Paper
Publ
ishe
d on
07
Oct
ober
201
3. D
ownl
oade
d by
Uni
vers
ity o
f T
enne
ssee
at K
noxv
ille
on 0
7/11
/201
3 13
:59:
12.
View Article Online
in enriching nanoscale particle concentration over a large rangeand realizing accelerated detection.
3. Devices and materials3.1 Preparation of microelectrode sensor chips
In this work, interdigitated microelectrodes from SAW reso-nator chips (PARS 433.92, AVX Corp) were modied for ACEKbinding-acceleration and impedance measurement of serumsamples. Our experiments use a frequency range of up to 1MHz,which is much lower than the SAW chip's resonant frequency of433.92 MHz, so no piezoelectric effects were induced in ourexperiments. Modication and preparation of the interdigitatedelectrodes are described as follows.
First, the metal cover of the SAW resonator was removedmechanically to expose the working electrode array for use. Themetal casing around the electrode chip is about 4 mm (L) � 2.5mm (W) � 1 mm (H) ¼ 10 mL, serving as a microchamber forsample solutions. The interdigitated electrodes are made ofaluminum deposited on a quartz substrate. Each microelec-trode is 1.4 mm wide, 170 mm long, 200 nm thick, and separatedby a 1.1 mm gap from one another. The interdigitated electrodesare electrically connected to two contact pads on the chipbottom, which are then connected to an impedance analyzer.
Next, the SAWelectrode chips were cleanedwith washing buffer(Alconox� Powdered Precision Cleaner), acetone, isopropylalcohol and deionized water. The cleaned electrodes were subse-quently functionalized with specic antigens. In this study, themycobacterial antigen was immobilized on the electrodes bypassive adsorption, without the use of a chemical cross-linker. Forbovine TB detection, the electrode chips were loaded with 5 mLbacterial antigen and kept overnight at room temperature, whilefor human TB (hTB), the same amount of puried antigen wasloaded and kept overnight in a humidor to prevent drying. Becausethe quality of electrode cleaning and surface functionalization arecritical to obtain high performance impedance sensors, the inter-facial capacitance of electrodes was monitored at every step of thechip cleaning and preparation process. Interfacial capacitance haslong been used to study thin lm deposition on electrode surfaces.A reference chart has been complied to establish “correct” inter-facial capacitance values aer each processing step.
The functionalized chips were then rinsed with a rinse solu-tion (0.1� PBS-T, see 3.2.1) to remove any unbound antigen.Subsequently, blocking buffer was added to the electrode chips, tosuppress nonspecic adsorption onto the electrode surface whereantigens were not deposited, followed by another rinse. Then theantigen-coated electrode chips would be ready for testing.
3.2 Microbiological sample preparation
3.2.1 Buffer solutions. The following buffer solutions wereused in our immunoassay. 0.1� (0.2�) PBS refers to 1 mM phos-phate buffer (pH 7.0) containing 15 mM (30 mM) NaCl. 0.1�(0.2�) PBS-T is used for rinsing, which is 0.1� (0.2�) PBS con-taining 0.05 v/v% Tween 20 (Fisher Scientic, Pittsburgh, PA). Theblocking buffer, 0.1� (0.2�) buffer B, is 0.1� (0.2�) PBS-T con-taining 10 v/v% SuperBlock (PIERCE Biotechnology, Rockford, IL).
7192 | Analyst, 2013, 138, 7188–7196
3.2.2 ACEK impedance sensor characterization. Both theimpedance spectra study and the limit of detection (LOD) of ourACEK impedance immunosensor were conducted by measuringthe binding of goat anti-bovine IgG (H + L) antibody (unlabeled,JacksonImmunoResearch, West Grove, PA) to bovine IgG wholemolecules (JacksonImmunoResearch, West Grove, PA). Thebovine IgG whole molecules at a concentration of 10 mg mL�1
(diluted in buffer B) were immobilized on the SAW chips as theprobe molecule, and the SAW chips were kept in a humidor for12 hours. The anti-bovine IgG antibodies were used at concen-trations from 1 ngmL�1 to 1000 ngmL�1 (1 : 10 serial diluted in0.1� or 0.2� buffer B).
3.2.3 Human tuberculosis (hTB)Antigen. A puried protein derivative (PPD) of Mycobacterium
tuberculosis (Accurate Chemicals, NY) was used as the probemolecule and immobilized at a concentration of 10 mg mL�1
(diluted in PBS).Serum samples. A total of 11 human serum samples were
obtained from the WHO (World Health Organization/TropicalDiseases, Special Programme for Research and Training) andtested for hTB. Six of these samples were obtained from patientstested positive for hTB based on prior TB history and bacterialculture results. Five of these samples were obtained frompatientstested negative for hTB based on the above mentioned tests.
3.2.4 Bovine tuberculosis (bTB) in badgersAntigen. A virulent strain of Mycobacterium bovis (HC2005T),
which was originally isolated from an M. bovis infected dairycow, was cultured in Middlebrook's 7H9 medium with additionof 0.05% Tween 80 and 10% oleic acid–albumin–dextrose–NaClat 37 �C. For antigen preparation,M. bovis bacilli were harvestedfrom stationary phase cultures, suspended in 80% ethanol(80 mg wet weight of bacteria per mL) and agitated by vortex todislodge surface antigens. The dislodged M. bovis antigen wasdiluted (1 : 80) in the ethanol solution and used as antigen inthe impedance sensing.
Serum samples. A total of 10 badger (Meles meles) serumsamples were provided by the Animal Health and VeterinaryLaboratories Agency (AHVLA), UK. The bovine TB positivesamples (n ¼ 5) were obtained from badgers which had beenpreviously tested positive for M. bovis by bacterial culture fromclinical samples collected ante mortem and by ELISA for inter-feron-gamma. The negative serum samples (n ¼ 5) wereobtained from animals from a region of the UK considered freefromM. bovis infection in badgers and which were conrmed tobe negative for bTB through repeat testing by the proceduresmentioned above.
ELISA procedure. ELISA tests were carried out as described inour previous publication34 by using the aforementioned seraand antigens.
4. Impedimetric characterization of themicroelectrode sensor
In the development of our impedance sensor, impedancespectra of the electrode/electrolyte system were examined toestablish its electric equivalent circuit, and to determinewhich elements would predominately account for the
This journal is ª The Royal Society of Chemistry 2013

Fig. 3 (a) A comparison ofmeasured impedance spectra and curve fitting using the equivalent circuit in Fig. 1c. (Frequency range: 10 kHz–1MHz. Signal applied: 5mVrms.)(b) A comparison of measured impedance spectra and curve fitting using simplified R–C serial connection. (Frequency range: 10 kHz–1 MHz. Signal applied: 5 mVrms.)
Paper Analyst
Publ
ishe
d on
07
Oct
ober
201
3. D
ownl
oade
d by
Uni
vers
ity o
f T
enne
ssee
at K
noxv
ille
on 0
7/11
/201
3 13
:59:
12.
View Article Online
antigen–antibody binding. The electrode chip was prepared asdescribed in Sections 3.1 and 3.2.2. 0.1� PBS (1 mM, pH 7.0)was adopted as the background buffer solution. 10 ng mL�1
goat anti-bovine IgG antibody binding with immobilized bovineIgG was used as the representative binding reaction. Before andaer the antibody binding step, impedance spectra of theelectrode/electrolyte system were recorded at 5 mVrms from10 kHz to 1 MHz, a range of the most interest to our detectionmethod. The equivalent circuit shown in Fig. 1c was employedfor curve tting and extracting component values. The imped-ance spectra together with tted curves are shown in Fig. 3a,with extracted circuit parameters given in Table 1.
Of the four circuit elements listed in Table 1, Rct and Cint
describe the electrical properties at the electrode/electrolyteinterface, while Rs and Cs describe the properties of the elec-trolyte bulk. In our previous experiments with other types ofmacromolecules in 0.1� PBS buffer, we found that the
Table 1 Equivalent circuit parameters obtained by curve-fitting the experi-mental results with the equivalent circuit in Fig. 1c
Steps Rct (U) Cint (nF) Rs (U) Cs (pF)
Before binding 750 30 1750 3Aer binding 800 24 1850 3
This journal is ª The Royal Society of Chemistry 2013
enrichment effect by ACEK is the most pronounced at100 kHz.21 Therefore, 100 kHz is adopted as the testingfrequency in our ACEK impedance sensing, i.e. reading theelectrode impedance continuously with a voltage of 100 mV at100 kHz. At 100 kHz, the reactances for Cint and Cs are calcu-lated to be �53 U (�Rct) and 530 kU ([Rs), respectively. It canbe seen that Cint and Rs dominate the impedance response forthe frequency of interest to this work (100 kHz). Consequently,the equivalent circuit of Fig. 1c can be simplied to a seriesconnection of Rs � Cint as shown in the inset of Fig. 3b. InFig. 3b, the impedance responses from the Rs � Cint serialconnection are plotted along with the measured impedancespectra, and good agreements between them can be seen overthe frequency range of 10 kHz–1 MHz.
The above analysis shows that for the frequency range ofinterest to this work (around 100 kHz), a serial connection of Rs
and Cint could adequately account for the impedance presentedby the microelectrode/electrolyte system, with Cint predomi-nantly responsible for the binding process. Correspondingly,the impedance value measured by an impedance analyzer isalso in the form of Zmeas ¼ R� jX ¼ Rþ 1=juCmeas, where R andX are the real part and imaginary part of the measured imped-ance, respectively. From the imaginary part, a capacitance valueof Cmeas ¼ 1=uX can be found for a preset angular frequency.Based on the above discussion of the electrode impedance
Analyst, 2013, 138, 7188–7196 | 7193
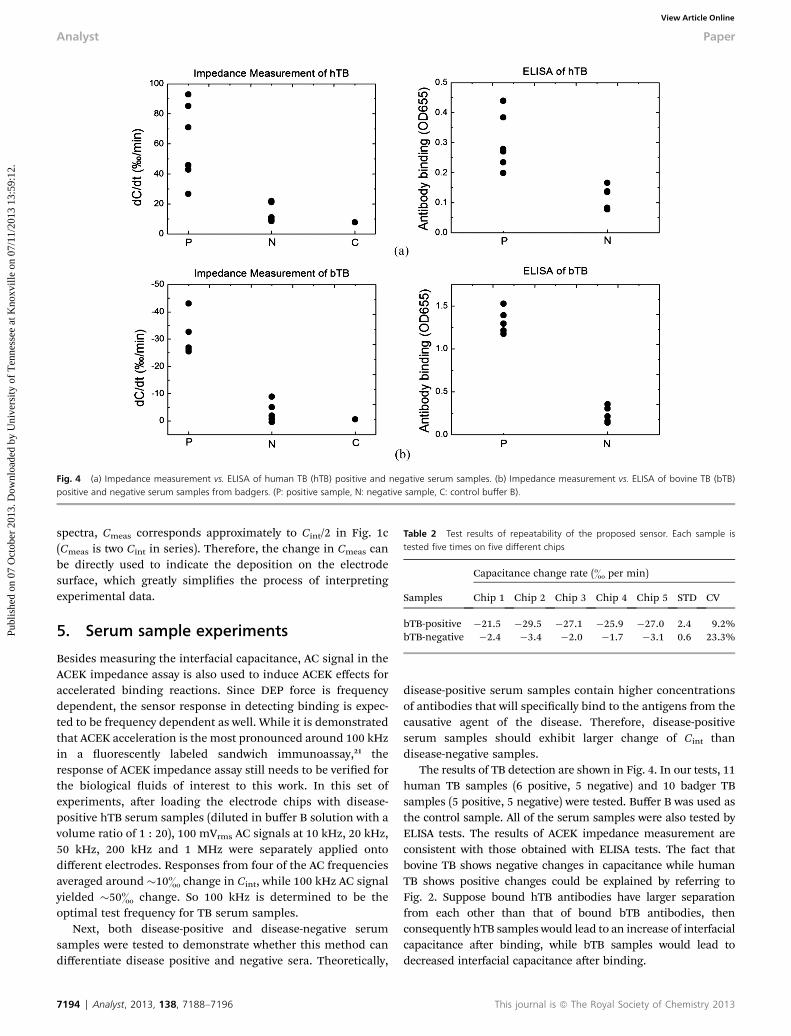
Fig. 4 (a) Impedance measurement vs. ELISA of human TB (hTB) positive and negative serum samples. (b) Impedance measurement vs. ELISA of bovine TB (bTB)positive and negative serum samples from badgers. (P: positive sample, N: negative sample, C: control buffer B).
Table 2 Test results of repeatability of the proposed sensor. Each sample istested five times on five different chips
Samples
Capacitance change rate (& per min)
Chip 1 Chip 2 Chip 3 Chip 4 Chip 5 STD CV
Analyst Paper
Publ
ishe
d on
07
Oct
ober
201
3. D
ownl
oade
d by
Uni
vers
ity o
f T
enne
ssee
at K
noxv
ille
on 0
7/11
/201
3 13
:59:
12.
View Article Online
spectra, Cmeas corresponds approximately to Cint/2 in Fig. 1c(Cmeas is two Cint in series). Therefore, the change in Cmeas canbe directly used to indicate the deposition on the electrodesurface, which greatly simplies the process of interpretingexperimental data.
bTB-positive �21.5 �29.5 �27.1 �25.9 �27.0 2.4 9.2%bTB-negative �2.4 �3.4 �2.0 �1.7 �3.1 0.6 23.3%
5. Serum sample experimentsBesides measuring the interfacial capacitance, AC signal in theACEK impedance assay is also used to induce ACEK effects foraccelerated binding reactions. Since DEP force is frequencydependent, the sensor response in detecting binding is expec-ted to be frequency dependent as well. While it is demonstratedthat ACEK acceleration is the most pronounced around 100 kHzin a uorescently labeled sandwich immunoassay,21 theresponse of ACEK impedance assay still needs to be veried forthe biological uids of interest to this work. In this set ofexperiments, aer loading the electrode chips with disease-positive hTB serum samples (diluted in buffer B solution with avolume ratio of 1 : 20), 100 mVrms AC signals at 10 kHz, 20 kHz,50 kHz, 200 kHz and 1 MHz were separately applied ontodifferent electrodes. Responses from four of the AC frequenciesaveraged around �10& change in Cint, while 100 kHz AC signalyielded �50& change. So 100 kHz is determined to be theoptimal test frequency for TB serum samples.
Next, both disease-positive and disease-negative serumsamples were tested to demonstrate whether this method candifferentiate disease positive and negative sera. Theoretically,
7194 | Analyst, 2013, 138, 7188–7196
disease-positive serum samples contain higher concentrationsof antibodies that will specically bind to the antigens from thecausative agent of the disease. Therefore, disease-positiveserum samples should exhibit larger change of Cint thandisease-negative samples.
The results of TB detection are shown in Fig. 4. In our tests, 11human TB samples (6 positive, 5 negative) and 10 badger TBsamples (5 positive, 5 negative) were tested. Buffer B was used asthe control sample. All of the serum samples were also tested byELISA tests. The results of ACEK impedance measurement areconsistent with those obtained with ELISA tests. The fact thatbovine TB shows negative changes in capacitance while humanTB shows positive changes could be explained by referring toFig. 2. Suppose bound hTB antibodies have larger separationfrom each other than that of bound bTB antibodies, thenconsequently hTB samples would lead to an increase of interfacialcapacitance aer binding, while bTB samples would lead todecreased interfacial capacitance aer binding.
This journal is ª The Royal Society of Chemistry 2013
Paper Analyst
Publ
ishe
d on
07
Oct
ober
201
3. D
ownl
oade
d by
Uni
vers
ity o
f T
enne
ssee
at K
noxv
ille
on 0
7/11
/201
3 13
:59:
12.
View Article Online
It is important to note that disease-positive sera alwaysexhibit larger responses than disease-negative samples, whichis consistent with the fact that disease-positive serum sampleshave higher concentrations of disease-specic antibody. Also,two types of control experiments were conducted. One, asshown in Fig. 4, used functionalized electrodes with serum-freebuffer. Another control experiment (data not shown in Fig. 4 toavoid confusion) used un-functionalized electrodes (blockedbut without antigen) with serum samples. The control experi-ments showed little changes in Cint, (�2.37 � 1.10)& per min,demonstrating the specicity of this method.
Further, to demonstrate the repeatability of our immuno-sensing method, one bTB-positive and one bTB-negative serumsample were tested on ve different chips for a total of 10 chips.The test results and their respective coefficients of variance (CV)are shown in Table 2. The CV for bTB-positive serum wascalculated to be 9.2%, showing good repeatability. The CV forbTB-negative serum is expected to be larger since the chipresponse to the negative sample is small. It should be noted thatthe mycobacterial antigen used in our study was immobilizedon the electrodes by passive adsorption, so the repeatability isexpected to improve with the use of chemical cross-linkers.
6. Capacitance change and limit ofdetection
As shown in Fig. 4, an increase in dC/C for hTB and a decreasein dC/C for bTB were respectively observed. We hypothesize thereason to be larger separation between bound bTB antibodiesthan hTB antibodies, with the difference in their length scalecomparable to the EDL thickness. To test this theory, using twodifferent dilutions of PBS (0.1� and 0.2�) as buffer solutions,binding of bovine IgG was measured at various concentrations.0.2� PBS has a thinner EDL than 0.1� PBS. So varying the ionicstrength of buffer solutions effectively changes the relative gap
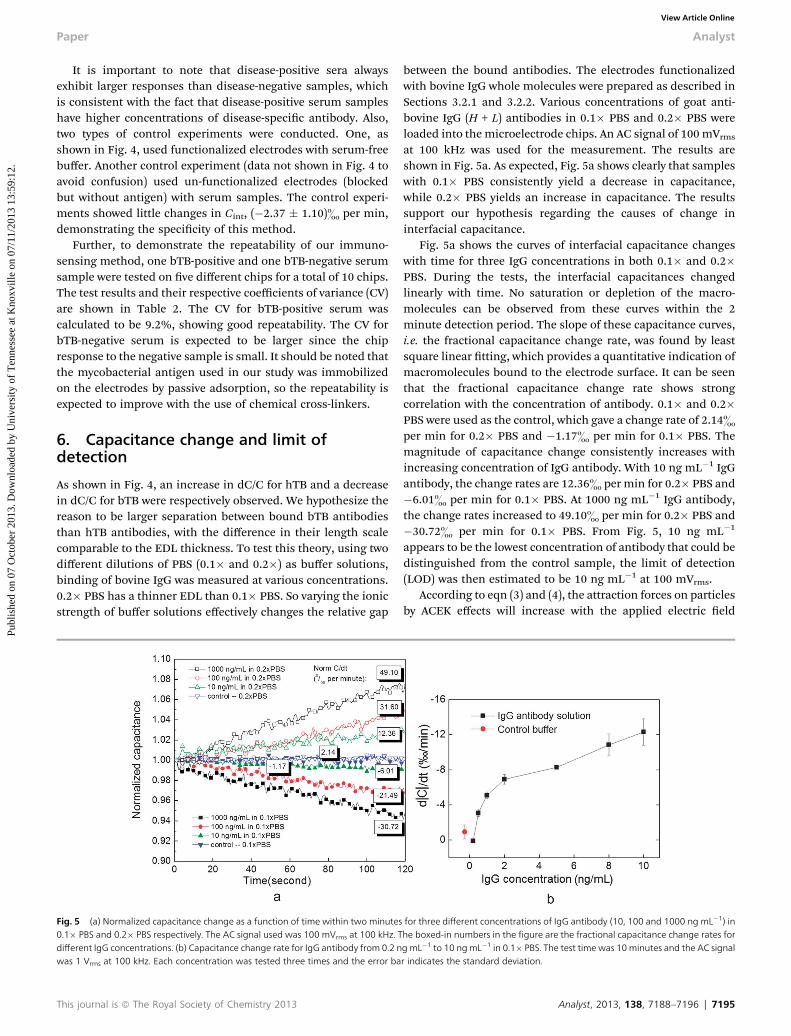
Fig. 5 (a) Normalized capacitance change as a function of time within two minutes0.1� PBS and 0.2� PBS respectively. The AC signal used was 100 mVrms at 100 kHz. Tdifferent IgG concentrations. (b) Capacitance change rate for IgG antibody from 0.2 nwas 1 Vrms at 100 kHz. Each concentration was tested three times and the error ba
This journal is ª The Royal Society of Chemistry 2013
between the bound antibodies. The electrodes functionalizedwith bovine IgG whole molecules were prepared as described inSections 3.2.1 and 3.2.2. Various concentrations of goat anti-bovine IgG (H + L) antibodies in 0.1� PBS and 0.2� PBS wereloaded into the microelectrode chips. An AC signal of 100 mVrms
at 100 kHz was used for the measurement. The results areshown in Fig. 5a. As expected, Fig. 5a shows clearly that sampleswith 0.1� PBS consistently yield a decrease in capacitance,while 0.2� PBS yields an increase in capacitance. The resultssupport our hypothesis regarding the causes of change ininterfacial capacitance.
Fig. 5a shows the curves of interfacial capacitance changeswith time for three IgG concentrations in both 0.1� and 0.2�PBS. During the tests, the interfacial capacitances changedlinearly with time. No saturation or depletion of the macro-molecules can be observed from these curves within the 2minute detection period. The slope of these capacitance curves,i.e. the fractional capacitance change rate, was found by leastsquare linear tting, which provides a quantitative indication ofmacromolecules bound to the electrode surface. It can be seenthat the fractional capacitance change rate shows strongcorrelation with the concentration of antibody. 0.1� and 0.2�PBS were used as the control, which gave a change rate of 2.14&per min for 0.2� PBS and �1.17& per min for 0.1� PBS. Themagnitude of capacitance change consistently increases withincreasing concentration of IgG antibody. With 10 ng mL�1 IgGantibody, the change rates are 12.36& per min for 0.2� PBS and�6.01& per min for 0.1� PBS. At 1000 ng mL�1 IgG antibody,the change rates increased to 49.10& per min for 0.2� PBS and�30.72& per min for 0.1� PBS. From Fig. 5, 10 ng mL�1
appears to be the lowest concentration of antibody that could bedistinguished from the control sample, the limit of detection(LOD) was then estimated to be 10 ng mL�1 at 100 mVrms.
According to eqn (3) and (4), the attraction forces on particlesby ACEK effects will increase with the applied electric eld
for three different concentrations of IgG antibody (10, 100 and 1000 ng mL�1) inhe boxed-in numbers in the figure are the fractional capacitance change rates forg mL�1 to 10 ngmL�1 in 0.1� PBS. The test time was 10minutes and the AC signalr indicates the standard deviation.
Analyst, 2013, 138, 7188–7196 | 7195

Analyst Paper
Publ
ishe
d on
07
Oct
ober
201
3. D
ownl
oade
d by
Uni
vers
ity o
f T
enne
ssee
at K
noxv
ille
on 0
7/11
/201
3 13
:59:
12.
View Article Online
strength. Then it is expected that the ACEK immune-sensingmethod will demonstrate a larger capacitance change rate andbetter sensitivity with a higher applied voltage. Therefore,various concentrations of IgG antibody in 0.1� PBS were testedagain using the AC signal of higher amplitude, 1 Vrms at100 kHz. The test time was ten minutes. The IgG antibodyconcentration ranges from 0.2 ng mL�1 to 10 ng mL�1, and thetests of every IgG antibody concentration were repeated threetimes using a new electrode each time. The results are shown inFig. 5b. The control sample yielded a capacitance change rate of(�0.95 � 0.90)& per min, close to the result in Fig. 5a. Theresponses for IgG antibody samples are (�0.02 � 0.13)& permin at 0.2 ng mL�1, (�3.07 � 0.38)& per min at 0.5 ng mL�1,(�5.09� 0.38)& per min at 1 ngmL�1, and (�6.93� 0.56)& permin at 2 ng mL�1 respectively. At 10 ng mL�1, dC/C0 is(�12.31 � 2.58)& per min at 1 Vrms, which is twice as much asthe response when using 100 mVrms for testing. ComparingFig. 5a and b, it can be seen that a higher testing voltagedoes lead to a higher response and also a better LOD, around1 ng mL�1 with 1 Vrms AC voltage.
7. Conclusion
The experiment demonstrated rapid and sensitive detection ofboth bTB and hTB by our ACEK impedance immunosensor. Ourexperiments showed that 2 minutes is sufficient to differentiatedisease positive and negative samples, which is considerablyfaster than conventional methods using a static uid chamber.Our diagnostic devices also demonstrated a high sensitivitywith a limit of detection of around 10 ng mL�1 with 500 Vrms
and 1 ng mL�1 with 1 Vrms. In summary, the ACEK impedancemethod reported here has a shorter assay time, reduced reagentand device cost, simpler device design and more reliable oper-ation than many conventional diagnostic systems. With someminor adjustment, this technology is expected to be able todetect other infectious diseases.
Acknowledgements
This study was supported by the U.S. National Science Foun-dation under Grant no. ECS-0448896, the University of Ten-nessee Research Foundation Maturation Fund, M-CERV seedgrant and AgResearch Innovation Grant.
References
1 E. Keeler, M. D. Perkins, P. Small, C. Hanson, S. Reed,J. Cunningham, J. E. Aledort, L. Hillborne, M. E. Rafaeland F. Girosi, Nature, 2006, 444, 49–57.
2 P. M. Small and M. Pai, N. Engl. J. Med., 2010, 363, 1070–1071.
3 A. Van Rie, L. Page-Shipp, L. Scott, I. Sanne and W. Stevens,Expert Rev. Mol. Diagn., 2010, 10, 937–946.
4 M. Urdea, L. A. Penny, S. S. Olmsted, M. Y. Giovanni,P. Kaspar, A. Shepherd, P. Wilson, C. A. Dahl,S. Buchsbaum and G. Moeller, Nature, 2006, 444, 73–79.
7196 | Analyst, 2013, 138, 7188–7196
5 J. S. Daniels and N. Pourmand, Electroanalysis, 2007, 19,1239–1257.
6 M. Nichkova, J. Feng, F. Sanchez-Baeza, M. P. Marco,B. D. Hammock and I. M. Kennedy, Anal. Chem., 2003, 75,83–90.
7 A. C. Mak, S. J. Osterfeld, H. Yu, S. X. Wang, R. W. Davis,O. A. Jejelowo and N. Pourmand, Biosens. Bioelectron.,2010, 25, 1635–1639.
8 P. Pattnaik, Appl. Biochem. Biotechnol., 2005, 126, 79–92.9 Z. Zou, J. Kai, M. J. Rust, J. Han and C. H. Ahn, Sens.Actuators, A, 2007, 136, 518–526.
10 A. Ramanavicius, A. Finkelsteinas, H. Cesiulis andA. Ramanaviciene, Bioelectrochemistry, 2010, 79, 11–16.
11 Y. Wang, Z. Ye and Y. Ying, Sensors, 2012, 12, 3449–3471.12 S. K. Arya, P. R. Solanki, M. Datta and B. D. Malhotra,
Biosens. Bioelectron., 2009, 24, 2810–2817.13 H. Morgan and N. G. Green, AC electrokinetics: colloids and
nanoparticles, Research Studies Press, 2003.14 D. Wang, M. Sigurdson and C. D. Meinhart, Exp. Fluids,
2005, 38, 1–10.15 S. Ahualli, M. L. Jimenez, F. Carrique and A. V. Delgado,
Langmuir, 2009, 25, 1986–1997.16 J. Wu, IEEE Trans. Nanotechnol., 2006, 5, 84–89.17 A. Ramos, H. Morgan, N. Green and A. Castellanos, J. Phys. D:
Appl. Phys., 1999, 31, 2338.18 K. Yang and J. Wu, Biomicrouidics, 2010, 4, 034106.19 S. Li, H. Cui, Q. Yuan, J. Wu, A. Wadhwa, S. Eda and H. Jiang,
Biosens. Bioelectron., 2014, 51, 437–443.20 S. Li, Q. Yuan, B. I. Morshed, C. Ke, J. Wu and H. Jiang,
Biosens. Bioelectron., 2013, 41, 649–655.21 X. Liu, K. Yang, A. Wadhwa, S. Eda, S. Li and J. Wu, Sens.
Actuators, A, 2011, 171, 406–413.22 M. S. Aren and T. L. Porter, J. Appl. Phys., 2012, 111, 054919.23 J. Wu, Y. Ben, D. Battigelli and H.-C. Chang, Ind. Eng. Chem.
Res., 2005, 44, 2815–2822.24 A. Susloparova, D. Koppenhofer, X. T. Vu, M. Weil and
S. Ingebrandt, Biosens. Bioelectron., 2013, 40, 50–56.25 J. Wu, Y. Ben and H.-C. Chang, Microuid. Nanouid., 2005,
1, 161–167.26 S. Pruneanu, A. Boughriet, A. Henderson, C. Malins, Z. Ali
and L. Olenic, Part. Sci. Technol., 2008, 26, 136–144.27 T. Simonson and C. L. Brooks, J. Am. Chem. Soc., 1996, 118,
8452–8458.28 M. E. Fisher and Y. Levin, Phys. Rev. Lett., 1993, 71, 3826–
3829.29 R. Reverberi and L. Reverberi, Blood Transfus., 2007, 5, 227.30 P. E. Sheehan and L. J. Whitman, Nano Lett., 2005, 5, 803–
807.31 J. Wu, IET Nanobiotechnol., 2008, 2, 14–27.32 A. Castellanos, A. Ramos, A. Gonzalez, N. G. Green and
H. Morgan, J. Phys. D: Appl. Phys., 2003, 36, 2584.33 M. Lian, N. Islam and J. Wu, IET Nanobiotechnol., 2007, 1,
36–43.34 S. Eda, J. P. Bannantine, W. Waters, Y. Mori, R. H. Whitlock,
M. C. Scott and C. Speer, Clin. Vaccine Immunol., 2006, 13,837–844.
This journal is ª The Royal Society of Chemistry 2013