Extraction of phenolic-carbohydrate complexes from graminaceous cell walls
Upload
independentCategory
view
4download
0
Journal of Chromatography A, 871 (2000) 427–438www.elsevier.com/ locate /chroma
Optimization of the separation of phenolic compounds by micellarelectrokinetic capillary chromatography
*´ ´ ´ ´M.A. Rodrıguez-Delgado , M.L. Perez, R. Corbella, G. Gonzalez, F.J. Garcıa MontelongoDepartment of Analytical Chemistry, Nutrition and Food Science, University of La Laguna, 38071 Tenerife, Spain
Abstract
A group of phenolic compounds including phenolic aldehydes, acids and flavonoids are separated by micellarelectrokinetic chromatography (MECC). The influence of buffer (concentration and pH), concentration of sodiumdodecylsulphate (SDS) and applied voltage were studied. To increase the selectivity of the separation and the resolution ofthe solutes organic solvents are added to the separation buffer, the best results were obtained when methanol was used atlower percentages. An optimized buffer (150 mM boric acid (pH 8.5)–50 mM SDS–5% methanol) provides the optimumseparation with regard to resolution and migration time. This method was applied to the determination of these compounds inwine samples with good results. 2000 Elsevier Science B.V. All rights reserved.
Keywords: Wine; Optimization; Phenolic compounds
1. Introduction The similar chemical characteristics of these com-pounds and the complexity of wine samples make
Phenolic compounds are a wide group of sub- the use of chromatographic methods with highstances that have particular importance in enology. resolution, such as thin layer chromatographic (TLC)These substances contribute to several sensorial and high-performance liquid chromatographiccharacteristics, such as colour, flavour, astringency (HPLC), necessary for their determination [5–10].and hardness of wine, directly or by the formation of However, these methods are very expensive, usecomplexes with proteins, the formation of insoluble toxic solvents, have high separation times and some-polymers and the interaction with other phenolic times need the development of extremely complexcompounds. Furthermore, these compounds are im- gradients for the separation. Capillary electrophoresisportant in food hygiene due to their bactericidal (CE) has been shown to be a fast, powerful, cleaneffects and consequently they are essential in the and efficient separation technique for a wide varietyquality of a wine [1–4]. The types and concen- of compounds [11–15]. These characteristics aretrations of the phenolic compounds depend on the related to the use of high separation voltages andgrape variety and ripening, atmospheric conditions efficient dissipation of Joule heat in a narrow fused-and the techniques employed in producing the must. silica capillary (typically 25–100 mm I.D.). MicellarIt is well-known that the contact of the must and electrokinetic capillary chromatography (MECC)wine with a wood barrel during the aging process continues to gain popularity as a useful technique foraccounts for the presence of some phenols in wine. separating analytes difficult to separate by capillary
zone electrophoresis (CZE). MECC, which is a*Corresponding author. modification of CZE, has extended the utility of CE
0021-9673/00/$ – see front matter 2000 Elsevier Science B.V. All rights reserved.PI I : S0021-9673( 99 )00883-3
´428 M.A. Rodrıguez-Delgado et al. / J. Chromatogr. A 871 (2000) 427 –438
to the separation of neutral analytes under the electrophoresis apparatus equipped with a diodeinfluence of an electric field [16]. In this migration array detector. The fused-silica capillary used was 57mode a surfactant is added to the buffer at a cm (50 cm effective length)375 mm I.D. (Beckmanconcentration above its critical micellar concentra- Instruments, Fullerton, CA, USA). Data were col-tion. The separation principle is based on the dif- lected and analysed using the System Gold softwareferential partition of analytes between the micelle, from Beckman running on a 486DX2-66 MHzwhich is a pseudostationary phase and the surround- computer.ing aqueous phase. Compounds such as flavonoidsstrongly interact with micelles and consequently 2.2. Reagentsselectivity may be varied by modifying micelleconcentration. Micellar liquid chromatography All chemicals were of analytical grade. All phenol(MLC) [17] shows that small amounts of organic (Sigma Chemical Co., St. Louis, MO, USA), stan-solvents may improve separation efficiency and dard solutions were prepared in HPLC grade metha-modify the selectivity, thus the use of an organic nol (Montplet and Esteban, Barcelona, Spain). Stockmodifier is commonly accepted in CE. Therefore, the 1000 mg/ l standard solutions of each compound wastype and concentration of the surfactants and the type prepared in methanol and stored at 248C. Workingand concentration of the organic modifier of the standard solutions were prepared by diluting withaqueous phase is important for the optimization of methanol. Sodium dodecylsulphate (SDS), 2-(N-the efficiency and separation selectivity [18–22]. cyclohexylamino)-ethanesulfonic acid (CHES) and
The development of photodiode-array detectors N-(2-hydroxyethyl)piperazine-N9-(2-ethanesulfonichas increased the advantages of CE in the study of acid) (HEPES) were obtained from Aldrich (Mil-phenolic compounds [23,24], as UV–visible spectra waukee, WI, USA). Acetonitrile, ethanol, 1-propanol,provided by these detectors can be used for identifi- 2-propanol, 1-butanol and acetone, used as solventcation of peaks by comparison with standards, and modifiers, were obtained from Merck (Darmstadt,for checking peak purity in complex samples such as Germany). Buffer solutions were prepared fromwines samples. Modifications in selectivity can be boric acid (Merck, Darmstadt, Germany) (concen-detected with minimal experiences, which is very tration range: 10–150 mM and SDS (10–100 mM)useful to develop the optimization procedure quickly. by dissolving them in ultrapure water from Milli-Q
The aim of this investigation was to develop a system (Millipore, Bedford, USA) with a conduc-method for the rapid analysis of a group of phenolic tivity of 18 MV. The final pH values were adjustedcompounds by MECC using sodium dodecylsulfate with 1.0 M sodium hydroxide. The final volume wasas the surfactant. The influence of buffer pH, con- adjusted by the addition of water and the organiccentration of the electrolyte, concentration of the modifier (3–20%). All buffer solutions were filteredsurfactant, type and concentration of the organic through a 0.22 mm poliamide filter (Sartolon, Sar-modifier (e.g. methanol, ethanol, 1-propanol, 2-pro- torius) and sonicated prior to usage.panol, 1-butanol, acetone and acetonitrile) and volt-age on the migration behaviour was studied. Finally, 2.3. Electrophoretic procedureusing the optimised method examples of analyses ofphenolic compounds in Spanish wine samples are The capillary was conditioned prior to use bypresented. flushing with 1.0 M NaOH for 10 min, with water
for 2 min and finally with the running buffer for 15min. Injections were made using N , pressure 0.52
2. Experimental p.s.i. for 2 s (1 p.s.i.56894.76 Pa). The externaltemperature of the capillary was 258C. Detection
2.1. Apparatus took place at 280 nm. In order to increase themigration time reproducibility, the capillary was
The analysis were carried out in a P/ACE 5510 rinsed between injections with 0.1 M NaOH for 2HPCE (Beckman Instruments, Fullerton, CA, USA) min, ultrapure water for 1 min and fresh buffer for 3
´M.A. Rodrıguez-Delgado et al. / J. Chromatogr. A 871 (2000) 427 –438 429
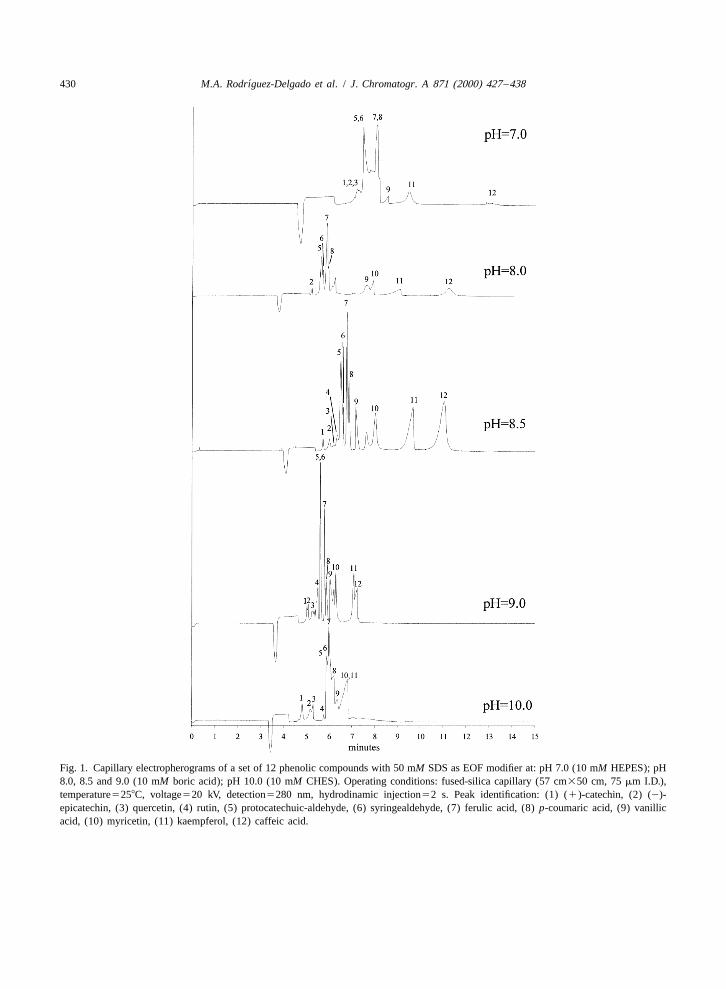
min. If drastic drifts in electrophoretic current and/or in the mixture tested makes pH optimization neces-migration times were observed, the capillary was sary, which depends on the different structures ofrinsed with 1.0 M NaOH solution for 15 min these compounds. The influence of the pH wasfollowed by 10-min rinses with deionized water, studied using three buffer systems in the neutral andmethanol, deionized water again and the running basic region: 10 mM boric–borate at pH 8.0, 8.5 andbuffer. 9.0; 10 mM HEPES at pH 7.0 and 10 mM CHES at
Duplicate injections of the solutions were per- pH 10.0. Every buffer was 50 mM SDS. Fig. 1formed and average peak areas corrected (area /mi- shows the influence of pH in the separation of thisgration time) were used for the quantitation. group of compounds. It is evident that at lower pH
values (,8.5) the peaks are broader and with low2.4. Mobility calculations resolution. The same effect is observed at pH 10.0
when CHES is used as buffer electrolyte. However,The electrophoretic mobility of each analyte was pH 9.0 leads to sharp peaks but with limited res-
calculated from the experimental migration time by olution. Although, the analysis time is higher whenthe equation: pH 8.5 is used, the resolution for the first and the last
peaks is improved. So, the resolution between theL L 1 1d t]] ] ]m 5 m 2 m 5 2 pairs caffeic acid–kaempferol, vanillic acid–S Dep eo V t tm eo myricetin, (1)-catechin–(2)-epicatechin and quer-
where m is the electrophoretic mobility of the cetin–rutin is better than obtained at pH 9.0. Whenep
analyte, m is the apparent mobility, m is the pH increases the migration time becomes shorter, buteo
electroosmotic mobility, t is the migration time the resolution diminishes drastically at higher pHs.m
measured from the electropherogram, t is the Thus, a pH of 8.5 was selected as optimum in ordereo
migration time for an uncharged solute (i.e. metha- to minimise analysis times and good resolutionnol), L is the total length of capillary, L is the between peaks.t d
length of capillary between injection and detectionpoints and V is the applied voltage. 3.2. Effect of micelle concentration
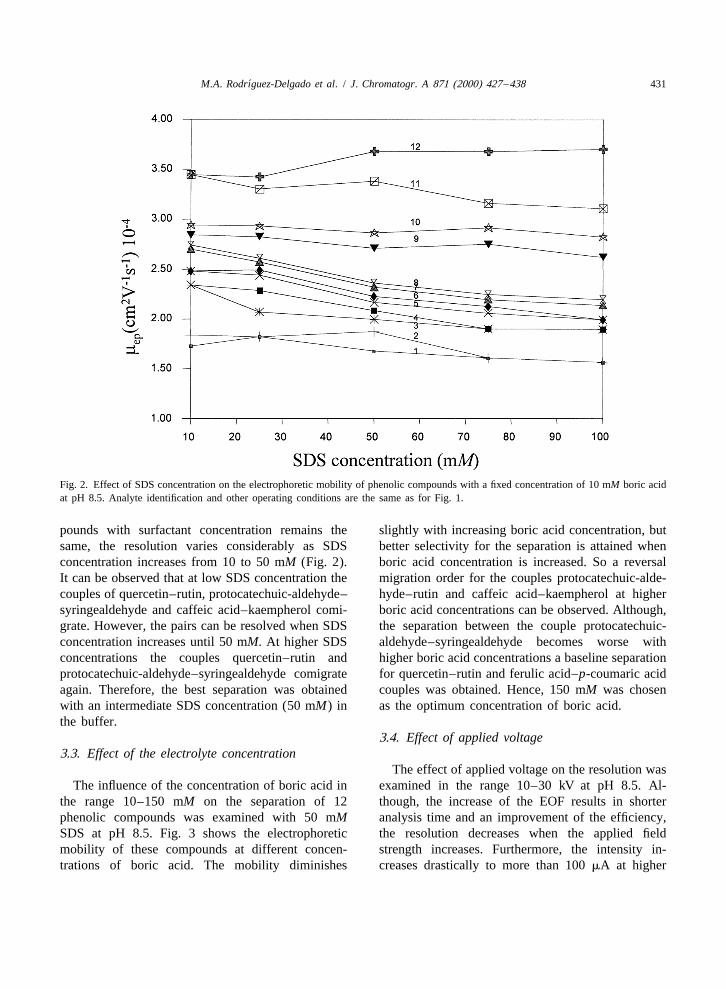
2.5. Sample preparation Fig. 2 shows the electrophoretic mobility of eachphenolic compound at different concentrations of
Samples of comercially available wines from SDS. Different behaviour is observed when thedifferent Spanish regions were analysed with the concentration of surfactant is varied in the range ofproposed method. Wine (5 ml) was extracted with 10–100 mM at pH 8.5. The electrophoretic mobilitydiethyl ether (5 ml) for 15 min using a Selecta of caffeic acid increases with increasing surfactant
21Rotabit (Selecta, Barcelona, Spain) at 120 u min . concentration, with a maximum at 50 mM SDS.The ether layer was separated and evaporated to Kaempferol and (2)-epicatechin present the samedryness using a nitrogen stream. The dry residue was behaviour, while myrecitin and vanillic acid mobilitydissolved in 0.5 ml of methanol and aliquots injected diminish slightly as surfactant concentration in-into the CE system. creases. The electrophoretic mobility of the rest of
the solutes diminishes markedly with increasingsurfactant concentration. This diminution can be
3. Results and discussion justified by the formation of borate complexes withthe hydroxyl groups on the phenol ring resulting in
3.1. Effect of buffer pH one negative charge in the complex. Although, theincreased size of the complex should facilitate its
In CE separation the buffer pH is one of the most partitioning into the micellar phase, the strongimportant parameters since its control determines the electrostatic repulsion between the complex and theextent of ionisation and mobility of each solute. The micelles of SDS results in longer migration time [24]inclusion of flavonoids, phenolic acids and aldehydes Although, the migration order of phenolic com-
´430 M.A. Rodrıguez-Delgado et al. / J. Chromatogr. A 871 (2000) 427 –438
Fig. 1. Capillary electropherograms of a set of 12 phenolic compounds with 50 mM SDS as EOF modifier at: pH 7.0 (10 mM HEPES); pH8.0, 8.5 and 9.0 (10 mM boric acid); pH 10.0 (10 mM CHES). Operating conditions: fused-silica capillary (57 cm350 cm, 75 mm I.D.),temperature5258C, voltage520 kV, detection5280 nm, hydrodinamic injection52 s. Peak identification: (1) (1)-catechin, (2) (2)-epicatechin, (3) quercetin, (4) rutin, (5) protocatechuic-aldehyde, (6) syringealdehyde, (7) ferulic acid, (8) p-coumaric acid, (9) vanillicacid, (10) myricetin, (11) kaempferol, (12) caffeic acid.
´M.A. Rodrıguez-Delgado et al. / J. Chromatogr. A 871 (2000) 427 –438 431
Fig. 2. Effect of SDS concentration on the electrophoretic mobility of phenolic compounds with a fixed concentration of 10 mM boric acidat pH 8.5. Analyte identification and other operating conditions are the same as for Fig. 1.
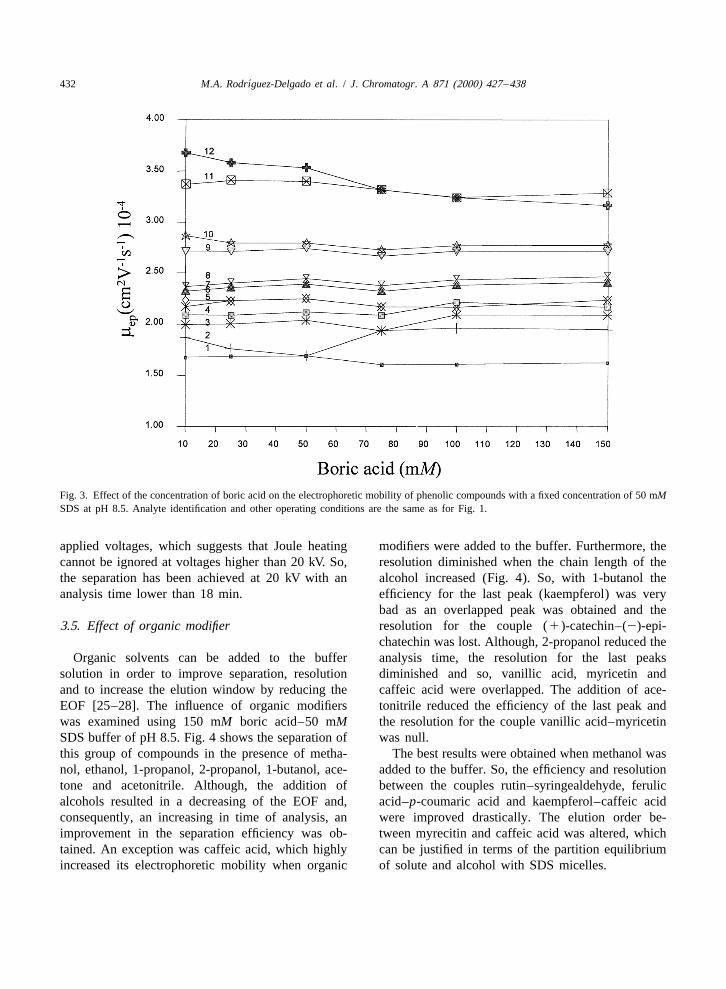
pounds with surfactant concentration remains the slightly with increasing boric acid concentration, butsame, the resolution varies considerably as SDS better selectivity for the separation is attained whenconcentration increases from 10 to 50 mM (Fig. 2). boric acid concentration is increased. So a reversalIt can be observed that at low SDS concentration the migration order for the couples protocatechuic-alde-couples of quercetin–rutin, protocatechuic-aldehyde– hyde–rutin and caffeic acid–kaempherol at highersyringealdehyde and caffeic acid–kaempherol comi- boric acid concentrations can be observed. Although,grate. However, the pairs can be resolved when SDS the separation between the couple protocatechuic-concentration increases until 50 mM. At higher SDS aldehyde–syringealdehyde becomes worse withconcentrations the couples quercetin–rutin and higher boric acid concentrations a baseline separationprotocatechuic-aldehyde–syringealdehyde comigrate for quercetin–rutin and ferulic acid–p-coumaric acidagain. Therefore, the best separation was obtained couples was obtained. Hence, 150 mM was chosenwith an intermediate SDS concentration (50 mM) in as the optimum concentration of boric acid.the buffer.
3.4. Effect of applied voltage3.3. Effect of the electrolyte concentration
The effect of applied voltage on the resolution wasThe influence of the concentration of boric acid in examined in the range 10–30 kV at pH 8.5. Al-
the range 10–150 mM on the separation of 12 though, the increase of the EOF results in shorterphenolic compounds was examined with 50 mM analysis time and an improvement of the efficiency,SDS at pH 8.5. Fig. 3 shows the electrophoretic the resolution decreases when the applied fieldmobility of these compounds at different concen- strength increases. Furthermore, the intensity in-trations of boric acid. The mobility diminishes creases drastically to more than 100 mA at higher
´432 M.A. Rodrıguez-Delgado et al. / J. Chromatogr. A 871 (2000) 427 –438
Fig. 3. Effect of the concentration of boric acid on the electrophoretic mobility of phenolic compounds with a fixed concentration of 50 mMSDS at pH 8.5. Analyte identification and other operating conditions are the same as for Fig. 1.
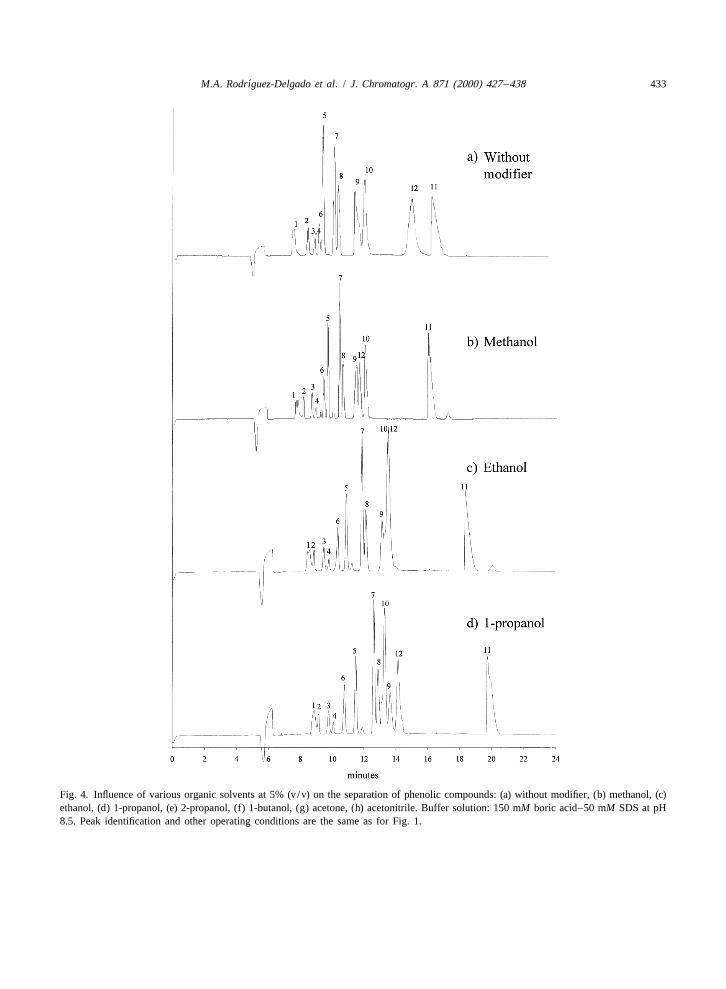
applied voltages, which suggests that Joule heating modifiers were added to the buffer. Furthermore, thecannot be ignored at voltages higher than 20 kV. So, resolution diminished when the chain length of thethe separation has been achieved at 20 kV with an alcohol increased (Fig. 4). So, with 1-butanol theanalysis time lower than 18 min. efficiency for the last peak (kaempferol) was very
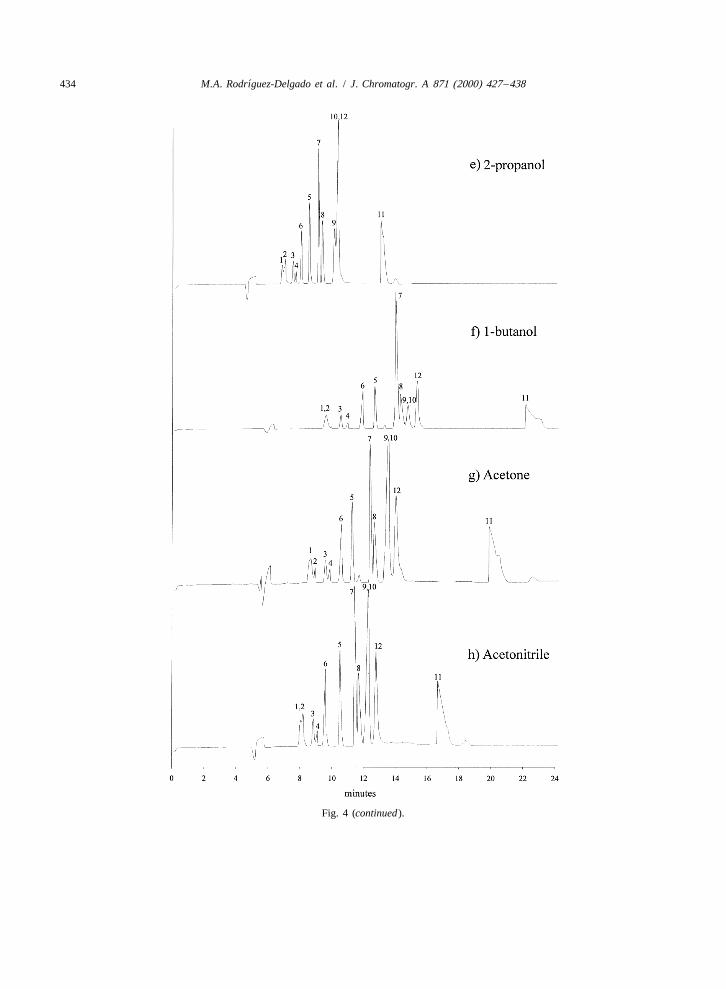
bad as an overlapped peak was obtained and the3.5. Effect of organic modifier resolution for the couple (1)-catechin–(2)-epi-
chatechin was lost. Although, 2-propanol reduced theOrganic solvents can be added to the buffer analysis time, the resolution for the last peaks
solution in order to improve separation, resolution diminished and so, vanillic acid, myricetin andand to increase the elution window by reducing the caffeic acid were overlapped. The addition of ace-EOF [25–28]. The influence of organic modifiers tonitrile reduced the efficiency of the last peak andwas examined using 150 mM boric acid–50 mM the resolution for the couple vanillic acid–myricetinSDS buffer of pH 8.5. Fig. 4 shows the separation of was null.this group of compounds in the presence of metha- The best results were obtained when methanol wasnol, ethanol, 1-propanol, 2-propanol, 1-butanol, ace- added to the buffer. So, the efficiency and resolutiontone and acetonitrile. Although, the addition of between the couples rutin–syringealdehyde, ferulicalcohols resulted in a decreasing of the EOF and, acid–p-coumaric acid and kaempferol–caffeic acidconsequently, an increasing in time of analysis, an were improved drastically. The elution order be-improvement in the separation efficiency was ob- tween myrecitin and caffeic acid was altered, whichtained. An exception was caffeic acid, which highly can be justified in terms of the partition equilibriumincreased its electrophoretic mobility when organic of solute and alcohol with SDS micelles.
´M.A. Rodrıguez-Delgado et al. / J. Chromatogr. A 871 (2000) 427 –438 433
Fig. 4. Influence of various organic solvents at 5% (v/v) on the separation of phenolic compounds: (a) without modifier, (b) methanol, (c)ethanol, (d) 1-propanol, (e) 2-propanol, (f) 1-butanol, (g) acetone, (h) acetonitrile. Buffer solution: 150 mM boric acid–50 mM SDS at pH8.5. Peak identification and other operating conditions are the same as for Fig. 1.
´434 M.A. Rodrıguez-Delgado et al. / J. Chromatogr. A 871 (2000) 427 –438
Fig. 4 (continued).
´M.A. Rodrıguez-Delgado et al. / J. Chromatogr. A 871 (2000) 427 –438 435
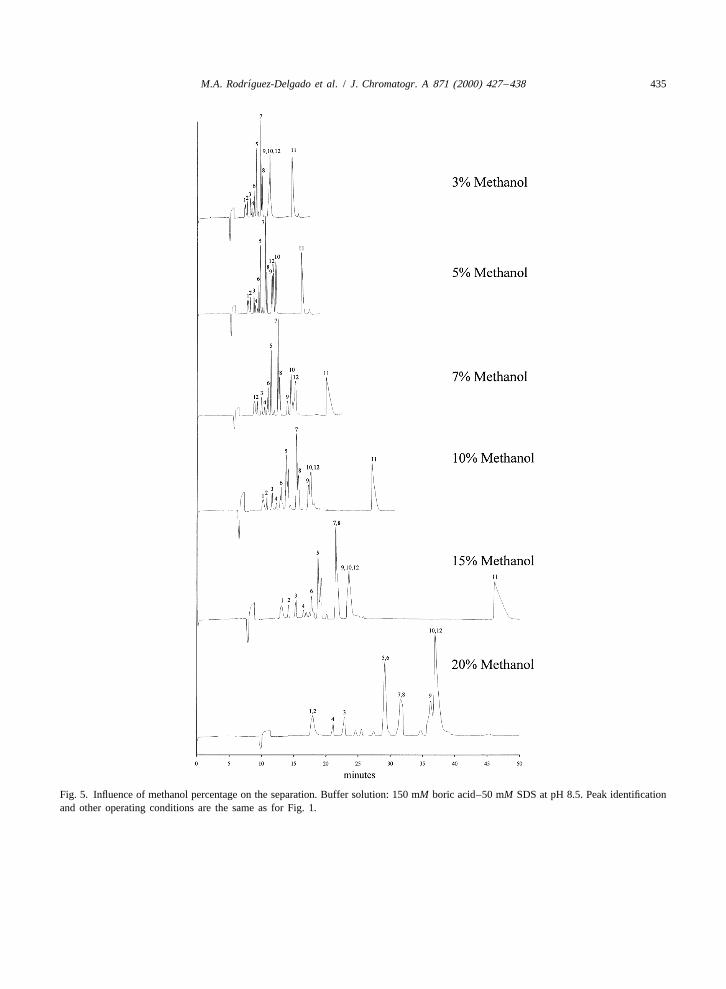
Fig. 5. Influence of methanol percentage on the separation. Buffer solution: 150 mM boric acid–50 mM SDS at pH 8.5. Peak identificationand other operating conditions are the same as for Fig. 1.
´436 M.A. Rodrıguez-Delgado et al. / J. Chromatogr. A 871 (2000) 427 –438
In order to find the best compromise between observed that high methanol contents drives un-resolution and analysis speed, the effect of the satisfactory separations, which is agreement with theconcentration of methanol as organic modifier was statement of Janini and Isaaq [29] that the addition ofinvestigated, and the results are shown in Fig. 5. It is organic solvent above 15% drops the column ef-
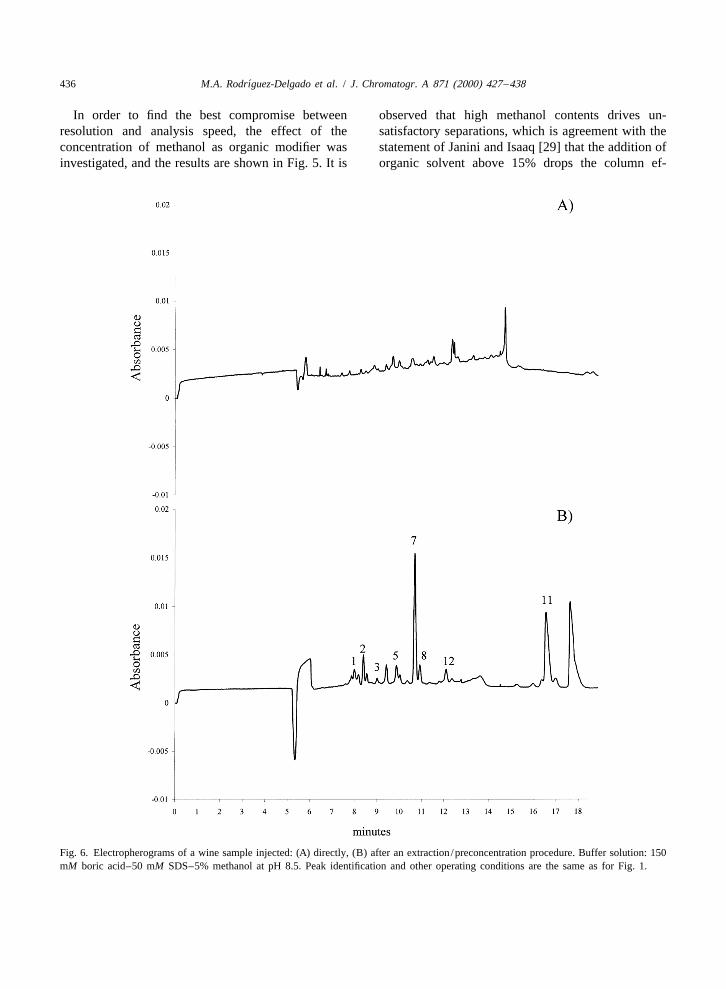
Fig. 6. Electropherograms of a wine sample injected: (A) directly, (B) after an extraction /preconcentration procedure. Buffer solution: 150mM boric acid–50 mM SDS–5% methanol at pH 8.5. Peak identification and other operating conditions are the same as for Fig. 1.
´M.A. Rodrıguez-Delgado et al. / J. Chromatogr. A 871 (2000) 427 –438 437
ficiency, and that migration times become impracti- concentration allows quantifying the analytes. Thiscal. So, the analysis time is higher than 50 min for extraction stage is also necessary for other chromato-20% methanol and about 50 min for 15% methanol. graphic methods such as HPLC or TLC in order toThe best resolution is obtained using a 5% methanol extract this group of compounds. Table 1 shows thein the buffer. The efficiency of the last peak (kaem- concentration of some of the phenolic compoundspferol) increases markedly and peaks 9, 10 and 12 found in the wine samples, where the content ofwhich comigrate at 3% methanol can be resolved at these phenols varies depending on the sample. UV–5% of this modifier. Higher percentages of methanol, visible spectra for the different phenolic compoundsi.e. 7% diminishes the resolution and efficiency of in the wine samples were always compared with thepeaks 7, 8, 9, 10, 12 and 11 and led to long analysis spectra of standard solutions with the same solventtimes. composition.
3.6. Determination of phenolic compounds in winesamples
4. Conclusions
The developed method has been applied for theThe influence of surfactant and electrolyte con-
determination of phenolic compounds in differentcentration and the type and concentration of the
wine samples. Calibration curves for the quantitativeorganic modifier on the migration behaviour was
analysis were obtained at 50 mM SDS–150 mMstudied. It was demonstrated that using intermediate
boric acid–5% of methanol at pH 8.5. Calibrationconcentrations of SDS (50 mM), high concentrations
graphs show excellent correlations (linear correlationof electrolyte (150 mM) and low concentrations of
coefficients $0.995) for all analytes in a widemethanol (5%) as the organic modifier at pH 8.5
concentration range of 0.1–50 mg/ l. Repeatabilityallows the separation of this group of compounds
was examined by ten replicate injections of a mixturewith good resolution, high efficiency and low analy-
of the 12 phenolic compounds at concentrations ofsis time. The optimised method was successfully
1.0 mg/ l. The relative standard deviation (RSD) fellapplied to wine samples.
below 6.8%. Fig. 6 shows the electropherogram of asample of wine directly injected and injected afterextraction with diethyl ether. When the sample isinjected directly it is impossible to quantify the Acknowledgementsphenolic compounds and peak overlapping is ob-served, but the use of an stage of extraction /pre- Authors acknowledge the financial support of this
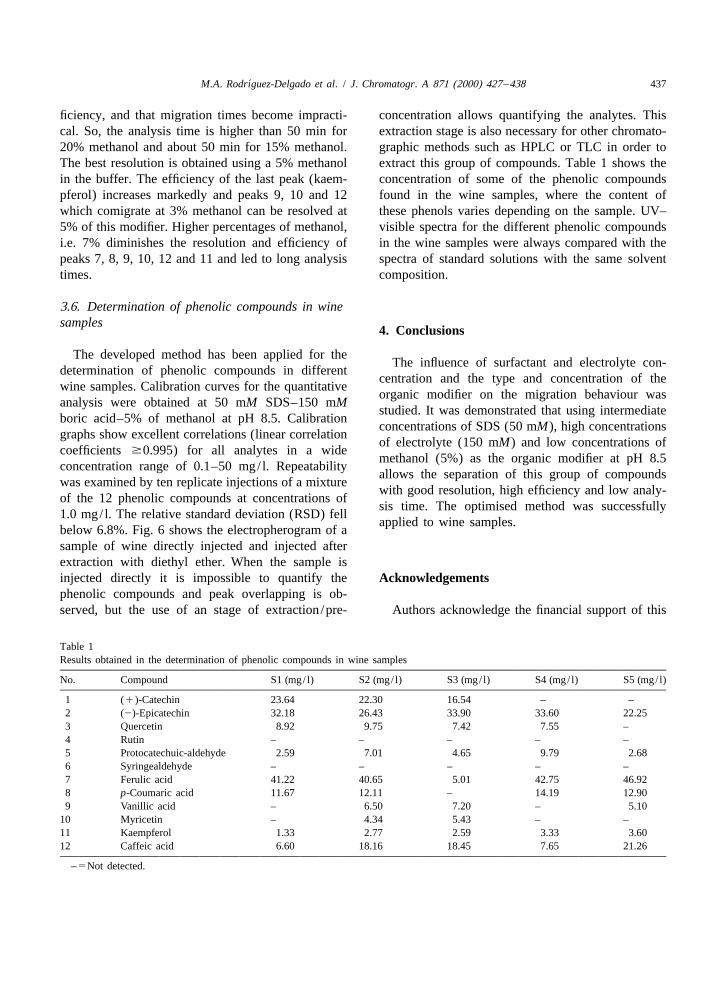
Table 1Results obtained in the determination of phenolic compounds in wine samples
No. Compound S1 (mg/ l) S2 (mg/ l) S3 (mg/ l) S4 (mg/ l) S5 (mg/ l)
1 (1)-Catechin 23.64 22.30 16.54 – –2 (2)-Epicatechin 32.18 26.43 33.90 33.60 22.253 Quercetin 8.92 9.75 7.42 7.55 –4 Rutin – – – – –5 Protocatechuic-aldehyde 2.59 7.01 4.65 9.79 2.686 Syringealdehyde – – – – –7 Ferulic acid 41.22 40.65 5.01 42.75 46.928 p-Coumaric acid 11.67 12.11 – 14.19 12.909 Vanillic acid – 6.50 7.20 – 5.10
10 Myricetin – 4.34 5.43 – –11 Kaempferol 1.33 2.77 2.59 3.33 3.6012 Caffeic acid 6.60 18.16 18.45 7.65 21.26
–5Not detected.
´438 M.A. Rodrıguez-Delgado et al. / J. Chromatogr. A 871 (2000) 427 –438
´[14] L. Arce, M.T. Tena, A. Rios, M. Valcarcel, Anal. Chim. Actawork by University of La Laguna Precompetitive359 (1998) 27.Research Project no. 243-84/97).
[15] A.J. Zemann, J. Cap. Electrophor. 2 (1995) 131.[16] S. Terabe, K. Otsuka, K. Ichikawa, A. Tsuchiya, T. Ando,
Anal. Chem. 56 (1984) 111.References [17] J. Dorsey, M. DeEchegaray, J.S. Landy, Anal. Chem. 55
(1983) 924.[18] P.G. Pietta, P.L. Mauri, A. Rava, G. Sabbatini, J. Chroma-[1] V.L. Singleton, P. Esau, Phenolic Substance in Grapes and
togr. 549 (1991) 367.Wine and Their Significance, Academic Press, New York,[19] C. Bjergegaard, S. Michaelsen, K. Mortensen, H. Sorensen,1969.
J. Chromatogr. A 652 (1993) 477.[2] A.G. Lea, P. Bridle, C. Timberlake, V.L. Singleton, Am. J.[20] Y.-M. Liu, S.-J. Sheu, Anal. Chim. Acta 288 (1994) 221.Enol. Vitic. 30 (1979) 289.[21] P. Pietta, P. Mauri, A. Bruno, C. Gardana, Electrophoresis 15[3] F. Shahidi, M. Naczk, Food Phenolics: Sources, Chemistry,
(1994) 1326.Effects, Applications, Technomic Publishing Company,[22] P. Pietta, P. Mauri, A. Bruno, L. Zini, J. Chromatogr. 638Pennsylvania, 1995.
(1993) 357.[4] A.W. Jaworski, C.Y. Lee, J. Agric. Food Chem. 35 (1987)´ ´[23] B. Bartolome, T. Hernandez, M.L. Bengoechea, C. Quesada,257.
´ ´C. Gomez-Cordoves, I. Estrella, J. Chromatogr. A 723[5] V. Cheynier, J. Rigaud, M. Moutounet, J. Chromatogr. 472(1996) 19.(1989) 428.
[24] P.J. Larger, A.D. Jones, C. Dacombe, J. Chromatogr. A 799[6] B.Y. Ong, C.W. Nagel, J. Chromatogr. 157 (1978) 345.(1998) 309.[7] L.W. Wulf, C. Nagel, J. Chromatogr. 116 (1976) 271.
[25] I.M. Johansson, E.C. Hung, J.D. Henion, J.Z. Weigenbaum,[8] G.P. Cartoni, F. Coccioli, L. Pontelli, J. Chromatogr. 537J. Chromatogr. 554 (1991) 311.(1991) 93.
[26] G.M. Mclaughlin, J.A. Nolan, J.L. Lindahl, R.H. Palmieri,´ ´[9] D.A. Guillen, C.G. Barroso, J.A. Perez-Bustamante, J.K.W. Anderson, S.C. Morris, J.A. Morrison, T.J. Bronzert, J.Chromatogr. A 655 (1993) 227.Liq. Chromatogr. 15 (1992) 927.´ ´[10] D.A. Guillen, C.G. Barroso, J.A. Perez-Bustamante, J.
[27] C. Schwer, E. Kenndler, Anal. Chem. 63 (1991) 1801.Chromatogr. A 724 (1996) 117.[28] X. Huang, J.A. Luckey, M.J. Gordon, R.V. Zare, Anal. Chem.´[11] C. Garcıa-Viguera, P. Bridle, Food Chem. 54 (1995) 349.
61 (1989) 766.[12] O. Maman, F. Marseille, B. Guillet, J. Disnar, P. Morin, J.[29] G.M. Janini, H.J. Issaq, J. Liq. Chromatogr. 15 (1992) 961.Chromatogr. A 755 (1996) 89.
[13] S.M. Masselter, A.J. Zemann, J. Chromatogr. A 693 (1995)359.
Copyright © 2022 FDOKUMEN