Insight into Composition of Bioactive Phenolic Compounds in ...
16
plants Article Insight into Composition of Bioactive Phenolic Compounds in Leaves and Flowers of Green and Purple Basil Bhakti Prinsi * , Silvia Morgutti , Noemi Negrini, Franco Faoro and Luca Espen Department of Agricultural and Environmental Sciences-Production, Landscape, Agroenergy, Università degli Studi di Milano, I-20133 Milano, Italy; [email protected] (S.M.); [email protected] (N.N.); [email protected] (F.F.); [email protected] (L.E.) * Correspondence: [email protected] Received: 6 December 2019; Accepted: 20 December 2019; Published: 23 December 2019 Abstract: Basil (Ocimum basilicum L.) is a culinary, medicinal, and ornamental plant appreciated for its antioxidant properties, mainly attributed to high content of rosmarinic acid. This species also includes purple varieties, characterized by the accumulation of anthocyanins in leaves and flowers. In this work, we compared the main morphological characteristics, the antioxidant capacity and the chemical composition in leaves, flowers, and corollas of green (‘Italiano Classico’) and purple (‘Red Rubin’ and ‘Dark Opal’) basil varieties. The LC-ESI-MS/MS analysis of individual compounds allowed quantifying 17 (poly)phenolic acids and 18 flavonoids, differently accumulated in leaves and flowers of the three varieties. The study revealed that in addition to rosmarinic acid, basil contains several members of the salvianolic acid family, only scarcely descripted in this species, as well as, especially in flowers, simple phenolic acids, such as 4-hydroxybenzoic acid and salvianic acid A. Moreover, the study revealed that purple leaves mainly contain highly acylated anthocyanins, while purple flowers accumulate anthocyanins with low degree of decoration. Overall, this study provides new biochemical information about the presence of not yet characterized bioactive compounds in basil that could contribute to boosting the use of this crop and to gaining new knowledge about the roles of these compounds in plant physiology. Keywords: green/purple basil; LC-ESI-MS/MS; nutraceutical properties; organ chemical differences 1. Introduction Basil (Ocimum basilicum L.) is an herbaceous plant, of the Lamiaceae family, traditionally cultivated worldwide and highly appreciated for its many properties. This species, which gives the common name to its whole genus, includes a large number of varieties with distinct morphological traits, chemical composition, and agro-industrial uses [1,2]. Basil includes both green varieties, with bright green leaves and white flowers, and coloured varieties, characterized by red-purple leaves and flowers, due to anthocyanin accumulation in the vacuole of epidermal cells [1–3]. Green basil is largely used as a culinary herb and for the extraction from leaves and flowers of aromatic essential oils, whose main components are monoterpenes and phenylpropanoids [1,2]. Purple basil encompasses varieties overall similar to green basil, such as ‘Red Rubin’, and types with peculiar traits, such as ‘Dark Opal’, that has a clove-like aroma and is used as ornamental and medicinal plant [2,4]. Several studies, mainly conducted on green varieties, showed that alcoholic and aqueous extracts from aerial parts of basil possess hypoglycemic, hepatoprotective, cardioprotective, and antimycobacterial activities, related to their antioxidant properties [5]. These properties are in part attributed to high contents of phenolic compounds, such as (poly)phenolic acids and flavonoids, Plants 2020, 9, 22; doi:10.3390/plants9010022 www.mdpi.com/journal/plants
-
Upload
khangminh22 -
Category
Documents
-
view
6 -
download
0
Transcript of Insight into Composition of Bioactive Phenolic Compounds in ...

plants
Article
Insight into Composition of Bioactive PhenolicCompounds in Leaves and Flowers of Green andPurple Basil
Bhakti Prinsi * , Silvia Morgutti , Noemi Negrini, Franco Faoro and Luca Espen
Department of Agricultural and Environmental Sciences-Production, Landscape, Agroenergy, Università degliStudi di Milano, I-20133 Milano, Italy; [email protected] (S.M.); [email protected] (N.N.);[email protected] (F.F.); [email protected] (L.E.)* Correspondence: [email protected]
Received: 6 December 2019; Accepted: 20 December 2019; Published: 23 December 2019 �����������������
Abstract: Basil (Ocimum basilicum L.) is a culinary, medicinal, and ornamental plant appreciated forits antioxidant properties, mainly attributed to high content of rosmarinic acid. This species alsoincludes purple varieties, characterized by the accumulation of anthocyanins in leaves and flowers.In this work, we compared the main morphological characteristics, the antioxidant capacity andthe chemical composition in leaves, flowers, and corollas of green (‘Italiano Classico’) and purple(‘Red Rubin’ and ‘Dark Opal’) basil varieties. The LC-ESI-MS/MS analysis of individual compoundsallowed quantifying 17 (poly)phenolic acids and 18 flavonoids, differently accumulated in leaves andflowers of the three varieties. The study revealed that in addition to rosmarinic acid, basil containsseveral members of the salvianolic acid family, only scarcely descripted in this species, as well as,especially in flowers, simple phenolic acids, such as 4-hydroxybenzoic acid and salvianic acid A.Moreover, the study revealed that purple leaves mainly contain highly acylated anthocyanins, whilepurple flowers accumulate anthocyanins with low degree of decoration. Overall, this study providesnew biochemical information about the presence of not yet characterized bioactive compounds inbasil that could contribute to boosting the use of this crop and to gaining new knowledge about theroles of these compounds in plant physiology.
Keywords: green/purple basil; LC-ESI-MS/MS; nutraceutical properties; organ chemical differences
1. Introduction
Basil (Ocimum basilicum L.) is an herbaceous plant, of the Lamiaceae family, traditionally cultivatedworldwide and highly appreciated for its many properties. This species, which gives the commonname to its whole genus, includes a large number of varieties with distinct morphological traits,chemical composition, and agro-industrial uses [1,2]. Basil includes both green varieties, with brightgreen leaves and white flowers, and coloured varieties, characterized by red-purple leaves and flowers,due to anthocyanin accumulation in the vacuole of epidermal cells [1–3]. Green basil is largely used asa culinary herb and for the extraction from leaves and flowers of aromatic essential oils, whose maincomponents are monoterpenes and phenylpropanoids [1,2]. Purple basil encompasses varieties overallsimilar to green basil, such as ‘Red Rubin’, and types with peculiar traits, such as ‘Dark Opal’, that hasa clove-like aroma and is used as ornamental and medicinal plant [2,4].
Several studies, mainly conducted on green varieties, showed that alcoholic and aqueousextracts from aerial parts of basil possess hypoglycemic, hepatoprotective, cardioprotective, andantimycobacterial activities, related to their antioxidant properties [5]. These properties are in partattributed to high contents of phenolic compounds, such as (poly)phenolic acids and flavonoids,
Plants 2020, 9, 22; doi:10.3390/plants9010022 www.mdpi.com/journal/plants

Plants 2020, 9, 22 2 of 16
which can act as reducing agents, metal chelators and free radical scavengers [6]. Rosmarinic andchicoric acids are the two most abundant (poly)phenolic acids identified in basil leaves [6,7]; for both,antioxidant and anti-viral properties were proposed [7,8]. Meanwhile, some evidence indicates thatconstitutive and induced accumulation of rosmarinic acid in plant leaves participates in defense againstpathogens and herbivores [8].
Purple basil was also proposed as a very rich natural source of anthocyanins [3]. These compoundsare the sub-class of flavonoids representing the largest group of water-soluble pigments in fruit andvegetables, and were correlated with prevention of diverse human diseases [9]. It was shown thatbasil has higher contents of anthocyanins than other common red fruit and medicinal herbs [3].Moreover, purple basil contains a peculiar kind of anthocyanins, consisting of cyanidin derivativescharacterized by a high degree of acylation with coumaroyl and malonyl acids [3,10]. Interestingly, itwas recently demonstrated that anthocyanin extracts from purple basil leaves have anti-inflammatoryin vitro activity [11]. At the same time, anthocyanins participate in several plant physiologicalfunctions, in pigmentation of flowers and seeds and in protection of vegetative organs from (a)bioticstresses [12,13]. In purple basil, anthocyanins play key roles in foliar photo-protection during stressescapable of impairing photosynthesis, such as nutrient toxicity [14] and excess solar radiation [15].
Basil varieties show high variability in the contents of total and individual phenols, as well asin antioxidant properties [16–18]. Despite this broad potentiality, differences among plant organswere only poorly investigated. The few studies that quantified the main phenolic compounds inleaves and flowers separately suggest distinct metabolic balances [4,16], as recently observed inOcimum americanum L. [19]. However, to our knowledge, a comprehensive description of phenoliccomposition in flowers of green and purple varieties of the basil species is still lacking. This informationcould be very useful, especially considering that basil flowers are edible [2], in the light of the recentinterest in the use of flowers as foods, additives or novel sources of natural compounds [20,21].
The aim of this study was therefore to compare the main plant morphological traits and thephenolic composition (contents of total phenols, antioxidant properties, and concentrations of individual(poly)phenolic acids and flavonoids) in leaves, flowers and corollas of commercial green and purplebasil varieties, in order to obtain useful indications on the presence of still not characterized bioactivecompounds and on their possible roles in the physiology of the plant.
2. Results
2.1. Evaluation of the Main Phenotypic Traits in Plants, Leaves and Flowers
Basil plants of the green variety ‘Italiano Classico’ (IC) and of the purple varieties ‘Red Rubin’(RR) and ‘Dark Opal’ (DO) were grown from seeds to full flowering in pots in greenhouse conditions.The morphological and chemical analyses of leaves were conducted at 45 days after sowing, whenplants had reached maturity, but were still in the vegetative phase. At that date, IC and DO plants hadsimilar height, of about 18 cm, while the average height of RR plants was of only about 14 cm (p < 0.001,Table 1). The fully expanded leaves had similar sizes (Figure 1), but they significantly differed infresh weight, with a value of 0.53 ± 0.05 g in IC and values lower by 28% and 34% in RR and DO,respectively (p = 0.036 and p = 0.009, respectively, Table 1). The IC leaves were bright green, glossy,oval-shaped, with slightly dentate margin. RR leaves were characterized by a well evident dentatemargin, while DO leaves appeared more irregularly shaped and quite undulate (Figure 1), as describedin the literature [2]. The purple varieties had red-purple leaves that after visual inspection seemed alittle darker in colour in DO. For both varieties, examination of hand-made transverse sections throughlamina (data not shown) allowed to verify that anthocyanins were mainly located in the epidermalcells [14]. In IC and DO plants flowering started at 54 and 55 days after sowing, respectively, while RRshowed a delay (p = 0.003 and p = 0.009 compared to IC and DO, respectively, Table 1). This differenceis in agreement with what reported for plants grown in the field in North America [1], even if in ourclimate zone, in greenhouse conditions, all the three varieties started flowering earlier.

Plants 2020, 9, 22 3 of 16
Table 1. Evaluation of phenotypic traits in green and purple basil varieties (O. basilicum L.). The plantheight and the fresh weight of fully expanded leaves were evaluated at 45 days after sowing. Valuesare means ± SE (n = 6; 1 n = 12). Statistically significant differences were assessed by one-way ANOVAtest (p ≤ 0.05, Tukey post hoc, letters in brackets within each row).
Plant CharacteristicVariety
‘Italiano Classico’ ‘Red Rubin’ ‘Dark Opal’
Plant height 1 (cm) 18.83 ± 0.58 (b) 13.58 ± 0.47 (a) 18.00 ± 0.39 (b)Leaf fresh weight (g) 0.53 ± 0.05 (b) 0.38 ± 0.03 (a) 0.35 ± 0.03 (a)
Days to flowering 54 ± 1 (a) 59 ± 1 (b) 55 ± 1 (a)Flower fresh weight (mg) 11.73 ± 0.13 (b) 9.80 ± 0.13 (a) 10.04 ± 0.22 (a)Corolla fresh weight (mg) 7.94 ± 0.17 (a) 7.51 ± 0.16 (a) 7.04 ± 0.44 (a)
Plants 2019, 8, x FOR PEER REVIEW 3 of 17
America [1], even if in our climate zone, in greenhouse conditions, all the three varieties started
flowering earlier.
Table 1. Evaluation of phenotypic traits in green and purple basil varieties (O. basilicum L.). The plant
height and the fresh weight of fully expanded leaves were evaluated at 45 days after sowing. Values
are means ± SE (n = 6; 1 n = 12). Statistically significant differences were assessed by one‐way ANOVA
test (p ≤ 0.05, Tukey post hoc, letters in brackets within each row).
Plant Characteristic Variety
‘Italiano Classico’ ‘Red Rubin’ ‘Dark Opal’
Plant height 1 (cm) 18.83 ± 0.58 (b) 13.58 ± 0.47 (a) 18.00 ± 0.39 (b)
Leaf fresh weight (g) 0.53 ± 0.05 (b) 0.38 ± 0.03 (a) 0.35 ± 0.03 (a)
Days to flowering 54 ± 1 (a) 59 ± 1 (b) 55 ± 1 (a)
Flower fresh weight (mg) 11.73 ± 0.13 (b) 9.80 ± 0.13 (a) 10.04 ± 0.22 (a)
Corolla fresh weight (mg) 7.94 ± 0.17 (a) 7.51 ± 0.16 (a) 7.04 ± 0.44 (a)
Figure 1. Leaves, inflorescences, and flowers of green and purple basil varieties. Left panel: (a) leaf of
‘Italiano Classico’; (b) leaf of ‘Red Rubin’; (c) leaf of ‘Dark Opal’; (d) part of inflorescence of ‘Italiano
Classico’; (e) part of inflorescence of ‘Red Rubin’; (f) part of inflorescence of ‘Dark Opal’. Scale bars in
black [(a)–(f)] = 1 cm. Right panel: (g) flower of ‘Italiano Classico’; (h) flower of ‘Red Rubin’; (i) flower
of ‘Dark Opal’; anthers are enlarged in (g1), (h1), and (i1), respectively. White bars in [(g)–(i)] = 2 mm;
in [(g(1)–(i1)] = 200 μm.
IC, RR and DO plants showed inflorescences and flowers with the typical morphology of green
and purple basil [22,23]. The plants had a verticillaster type of inflorescence composed by flowers of
about 1 cm in length, with a corolla formed by a larger upper lip and a smaller lower one and with
declinate stamens (Figure 1). Interestingly, the fresh weight of flowers was higher in the green variety
IC (p < 0.001), with values of 11.73 ± 0.13 mg, 9.80 ± 0.13 mg and 10.04 ± 0.22 mg in IC, RR and DO,
respectively. Conversely, the weights of the corollas were comparable among the three varieties
(Table 1). Together with the morphological analysis (Figure 1), this observation suggested that the
differences in flower weight reside in different size and/or weight of the fertile flower parts (i.e., pistil,
stamens, and pollen).
Overall, the phenotypic traits observed in both the vegetative and the reproductive stages
corresponded well with the typical description of green and purple basil, confirming that the
greenhouse condition allowed to maintain the varietal characteristics in IC, RR, and DO.
Figure 1. Leaves, inflorescences, and flowers of green and purple basil varieties. Left panel: (a) leaf of‘Italiano Classico’; (b) leaf of ‘Red Rubin’; (c) leaf of ‘Dark Opal’; (d) part of inflorescence of ‘ItalianoClassico’; (e) part of inflorescence of ‘Red Rubin’; (f) part of inflorescence of ‘Dark Opal’. Scale bars inblack [(a)–(f)] = 1 cm. Right panel: (g) flower of ‘Italiano Classico’; (h) flower of ‘Red Rubin’; (i) flowerof ‘Dark Opal’; anthers are enlarged in (g1), (h1), and (i1), respectively. White bars in [(g)–(i)] = 2 mm;in [(g(1)–(i1)] = 200 µm.
IC, RR and DO plants showed inflorescences and flowers with the typical morphology of greenand purple basil [22,23]. The plants had a verticillaster type of inflorescence composed by flowersof about 1 cm in length, with a corolla formed by a larger upper lip and a smaller lower one andwith declinate stamens (Figure 1). Interestingly, the fresh weight of flowers was higher in the greenvariety IC (p < 0.001), with values of 11.73 ± 0.13 mg, 9.80 ± 0.13 mg and 10.04 ± 0.22 mg in IC, RR andDO, respectively. Conversely, the weights of the corollas were comparable among the three varieties(Table 1). Together with the morphological analysis (Figure 1), this observation suggested that thedifferences in flower weight reside in different size and/or weight of the fertile flower parts (i.e., pistil,stamens, and pollen).
Overall, the phenotypic traits observed in both the vegetative and the reproductive stagescorresponded well with the typical description of green and purple basil, confirming that thegreenhouse condition allowed to maintain the varietal characteristics in IC, RR, and DO.

Plants 2020, 9, 22 4 of 16
2.2. Total Phenolic Compounds, Anthocyanins Contents and Antioxidant Capacity in Leaves, Flowers and Corollas
In Table 2 are reported the contents in total phenolic compounds and anthocyanins, as well as theantioxidant capacity evaluated in leaves, flowers, and corollas of the green variety IC and of the twopurple varieties RR and DO.
Table 2. Total phenolic compounds and anthocyanins contents and antioxidant capacity in leaves,flowers, and corollas of green and purple basil (O. basilicum L.) varieties. IC: ‘Italiano Classico’;RR: ‘Red Rubin’; DO: ‘Dark Opal’; GAE: gallic acid equivalents; CGE: cyanidin-3-O-glucosideequivalents; AAE: ascorbic acid equivalents. Values are means ± SE (n = 3). Statistically significantdifferences were assessed by two-way ANOVA test (p ≤ 0.05, Tukey post hoc); Dvar: significantdifferences among varieties within each organ (leaf: lower case, flower: upper case, corolla: italic);Dorg: significant differences among organs within each variety (IC: lower case, RR: upper case, DO:italic).
Organ Variety
TotalPhenols
(mg GAEg−1 FW)
Dvar Dorg
Anthocyanins(µmol CGE
g−1 FW)Dvar Dorg
AntioxidantCapacity
(µmol AAEg−1 FW)
Dvar Dorg
Leaf IC 5.57 ± 0.29 a c 0.01 ± 0.01 a a 63.48 ± 2.00 a aRR 7.11 ± 0.14 b C 3.96 ± 0.05 b B 68.98 ± 2.12 a ADO 6.07 ± 0.22 a c 3.68 ± 0.20 b b 61.45 ± 0.62 a a
Flower IC 3.58 ± 0.06 A b 0.02 ± 0.01 A a 148.18 ± 2.51 C bRR 4.35 ± 0.10 B B 0.87 ± 0.11 B A 133.45 ± 7.86 B BDO 4.54 ± 0.33 B b 0.75 ± 0.12 B a 106.44 ± 4.45 A b
Corolla IC 2.30 ± 0.16 a a 0.03 ± 0.02 a a 147.59 ± 1.23 b bRR 3.32 ± 0.03 b A 1.30 ± 0.27 b A 135.41 ± 2.44 b BDO 3.74 ± 0.25 b a 1.00 ± 0.14 b a 99.96 ± 3.00 a b
The contents of total phenolic compounds were different comparing the same organ amongthe three varieties (Table 2, Dvar), as well as the different organs within each variety (Table 2, Dorg).The contents of total phenolic compounds were always higher in the leaves (p < 0.001), followed bythe values of flowers and corollas. In leaves, the highest value of 7.11 ± 0.14 mg GAE g−1 FW wasmeasured in RR (p < 0.001 and p = 0.005 compared to IC and DO, respectively), while IC and DOshowed lower and comparable levels. On the contrary, the contents of total phenols in flowers andcorollas were similar in RR and DO, and in all the comparisons they were higher than the valuesdetermined in IC (p = 0.038, p = 0.010 and p = 0.006, p < 0.001 in flowers and corollas, respectively).
The evaluation of anthocyanin contents did not reveal any significant difference between RRand DO. In both the purple varieties, antocyanins were accumulated to a higher extent in the leaves(p < 0.001), while they were present at lower and similar levels in flowers and corollas. This evidencesuggests that also the fertile parts of the flower contain anthocyanins, as supported by the observationthat in these two varieties the stamens were also coloured (Figure 1). As expected, the anthocyanincontents observed in IC were always very low.
The antioxidant capacity followed a peculiar trend (Table 2). In leaf extracts, this parameterdid not reveal any significant difference between green and purple varieties, showing values verysimilar in IC, RR, and DO. Moreover, in all the three varieties, flower and corolla extracts showedsignificantly higher antioxidant capacity (p < 0.001), with about a 2-fold increase respect to the leafextracts. Interestingly, white flowers showed a significantly higher antioxidant capacity (p = 0.023 andp < 0.001 compared to RR and DO) than the purple ones, despite the minor content of phenols andanthocyanins. Finally, the analysis showed similar values of polyphenols and anthocyanins in the twopurple flowers and corollas, whereas the antioxidant capacity was higher in RR (p < 0.001).

Plants 2020, 9, 22 5 of 16
Overall, the patterns observed for the three parameters suggested that the differences in antioxidantcapacity among organs and varieties could be ascribed not directly to the total contents of phenoliccompounds (and anthocyanins), but more probably to different specific compositions of these classesof compounds.
2.3. Identification and Quantification of Individual (Poly)phenolic Acids
The quantification of individual (poly)phenolic acids in green and purple basil varieties wasconducted by LC-ESI-MS/MS (liquid-chromatography tandem mass spectrometry). This approachallowed to characterize 17 compounds, identified on the basis of their molecular weight andfragmentation profile, according to the literature (Table 3). The concentrations of these (poly)phenolicacids in leaves, flowers and corollas in IC, RR and DO are reported in Figure 2.
Table 3. (Poly)phenolic acids identified in the green and purple basil varieties by LC-ESI-MS/MS. n: numberof peak. RT: retention time. [M−H]−: molecular ion detected in negative mode (m/z: mass/charge). Ref.:reference. (iso): isomer. The RT and fragmentation profile of each compound was verified in all varietiesand organs. Quantification of individual compounds is reported in Figure 2.
n. Compound RT(min) Formula [M−H]−
(m/z)
MS2
Fragmentation Profile(m/z) 1
Ref.
1 4-hydroxybenzoic acid 1.5 C7H6O3 137.02 137.02 (5), 93.03 (100) 2 [24]
2 Salvianic acid A 2.5 C9H10O5 197.04197.04 (14), 179.03 (70),135.04 (84), 123.04 (57),
72.99 (100)[24,25]
3 Caftaric acid 5.3 C13H12O9 311.04 179.03 (100), 149.01 (79),135.04 (14) [26]
4 Caffeic acid 8.6 C9H8O4 179.03 179.03 (25), 135.04 (100) [27] 2
5 Fertaric acid 9.0 C14H14O9 325.06 193.05 (100), 134.04 (12) [7,26]
6 Salvianolic acid H/I 11.3 C27H22O12 537.10
537.10 (5), 493.11 (66),339.05 (100), 313.07 (8),295.06 (34), 197.04 (27),
179.03 (8)
[27]
7 Salvianolic acid K 11.7 C27H24O13 555.11 537.10 (10), 493.11 (56),295.06 (100) [28,29] 3
8 Chicoric acid 12.0 C22H18O12 473.07 311.04 (100), 293.03 (24),179.03 (48), 149.01 (82) [26] 2
9 Lithospermic acid A (iso) 12.3 C27H22O12 537.10 537.10 (48), 493.11 (77),295.06 (100) [29] 3
10 Salvianolic acid E 13.9 C36H30O16 717.15 717.15 (100), 519.09 (73),475.10 (19), 339.05 (7) [27,29] 3
11 Salvianolic acid L 14.8 C36H30O16 717.15717.15 (68), 673.16 (10),537.10 (26), 519.09 (71),
321.04 (5), 295.06 (5)[27,29] 3
12 Rosmarinic acid 15.2 C18H16O8 359.08 359.08 (13), 197.04 (35),179.03 (8), 161.02 (100) [27] 2
13 Salvianolic acid A 15.6 C26H22O10 493.11 493.11 (21), 313.07 (7),295.06 (100), 185.02 (17) [27]
14 Lithospermic acid A 16.7 C27H22O12 537.10
493.11 (99), 359.08 (99),313.07 (13), 295.06 (28),197.04 (9), 179.03 (14),161.02 (29), 135.04 (9)
[29] 3
15 Salvianolic acid B 17.4 C36H30O16 717.15 717.15 (23), 519.09 (100),321.04 (10) [27] 2
16 Salvianolic acid F (iso1) 22.0 C17H14O6 313.07 161.02 (100) [29] 3
17 Salvianolic acid F (iso2) 23.7 C17H14O6 313.10 161.02 (100) [29] 3
1 In brackets are reported the average relative abundances of each fragment ion. 2 Identified by standard. 3 Tentatively assigned.

Plants 2020, 9, 22 6 of 16
Plants 2019, 8, x FOR PEER REVIEW 6 of 17
(iso2)
1 In brackets are reported the average relative abundances of each fragment ion. 2 Identified by
standard. 3 Tentatively assigned.
.
Figure 2. Contents of (poly)phenolic acids in green and purple basil. (a) leaf; (b) flower; (c) corolla.Values are the means ± SE (error bars; n = 3) expressed as µmol g−1 FW. Data are grouped in two scalesto visualize differences. Significant differences were assessed by one-way ANOVA test (p ≤ 0.05, Tukeypost hoc); (*) significant difference respect to zero assessed by one-Sample t-test (p ≤ 0.05).

Plants 2020, 9, 22 7 of 16
If needed, in order to tentatively achieve selection of different isomers, the compounds wereassigned by comparing different information. In detail, 4-hydroxybenzoic acid and salicylic acidgive identical fragmentation profiles, but it was possible to assign the chromatographic peak to4-hydroxybenzoic acid (n.1) since it elutes at an earlier retention time respect to a standard of salicylicacid, as reported by literature [24]. Salvianic acid A (n.2) [25] was discriminated from its isomerssyringic acid and ethyl gallate on the basis of different fragmentation profiles [24]. Fertaric acid(n.5) was identified by comparing our results to the fragmentation profile proposed by Lee andScagel in basil leaf [7], i.e., 325→ 282, 193, 149 m/z, and to that proposed by Khoza et al. [26], i.e.,325→ 193, 149, 134 m/z. Most likely, these differences were due to a different collision energy duringthe MS/MS experiments. As far as it regards the isomers of lithospermic acid A (n.6,9,14), it waspossible to identify the salvianolic acid H/I (n.6) by the presence of the base peak at 339 (100) m/z,according to Ruan et al. [27], while lithospermic acid A (n.14) and its isomers (n.9) were tentativelyassigned on the basis of RT and proportion among fragmentation peaks [i.e., 359 (99) and 259 (100)m/z, respectively], as proposed by Barros et al. [29]. Salvianolic acid K was tentatively assignedaccording to the nomenclature proposed in Salvia officinalis L. [28] and to the fragmentation similitudeto the other lithospermic acid derivatives. On the other hand, the profiles obtained for the isomers ofsalvianolic acid B (n.10,11,15), even if consistent with the literature [27,29], did not provide adequateinformation for their discrimination. Salvianolic acid B (n.15) was identified by comparison to thestandard molecule, but salvianolic acid E (n.10) and L (n.11) were only tentatively assigned according toRT [27].
The evaluation of the concentrations of individual (poly)phenolic acids showed that rosmarinicacid was the compound accumulated at the highest amounts in leaves, accounting for more than 80%of the sum of all the molecules detected, followed by chicoric and caftaric acids (Figure 2a). Thesemolecules were accumulated to similar levels in the three basil varieties, with the exception of thehigher concentration of caftaric acid in the IC leaves than in the DO ones (p = 0.019). Interestingly,the analysis revealed the presence of other (poly)phenolic acids. Aside from comparable amounts ofsalvianolic acid K, these compounds were differently accumulated in the three varieties. IC leaveswere characterized by the accumulation of fertaric acid and lithospermic acid A (iso), as well as bythe highest level of salvianolic acid L (p = 0.002 and p < 0.001 compared to RR and DO, respectively).In particular, salvianolic acid L level was less than half in RR and undetectable in DO leaves. The loweraccumulation of these compounds in DO seemed partially balanced by the peculiar accumulation ofsalvianic acid A (Figure 2a). Although the sum of all the (poly)phenolic acids in intact flowers resultedsimilar in the three basil varieties, the analysis revealed a complex and various composition, embracingseveral members of the salvianolic acid family (Figure 2b). Once again, rosmarinic acid was one ofthe more abundant (poly)phenolic acids, but it resulted accumulated to higher levels in the purpleflowers than in the white ones (p = 0.044, comparing IC and RR). Interestingly, an opposite trend wasobserved for salvianolic acid A that reached very high levels in IC flowers (p = 0.005 and p = 0.008compared to RR and DO, respectively). In addition, IC flowers were characterized by a peculiaraccumulation of 4-hydroxybenzoic acid and salvianolic acid K, as well as by significantly higher levelsof salvianic acid A (p < 0.001 and p = 0.004 compared to RR and DO, respectively) and salvianolicacid H/I (p = 0.002 and p < 0.001 compared to RR and DO, respectively). The analysis did not revealdifferences in the concentrations of lithospermic acid A and salvianolic acid B, but it showed a differentcomposition for salvianolic acids E and L. Finally, purple flowers of RR and DO were characterized bysimilar contents of caffeic acid and salvianolic acid F isomers, not detected in white flowers. Overall,the total amounts of poly(phenolic) acids in isolated corollas was lower than in flowers (p = 0.001),especially in DO, where it reached a minimum value, mainly due to lower accumulation of rosmarinicacid (p = 0.021, Figure 2c). In IC the low level of rosmarinic acid seemed partially compensated bysalvianolic acid A (p < 0.001), 4-hydroxybenzoic acid (p = 0.003), salvianic acid A (p = 0.002), and alsoby the highest level of salvianolic acid B (p = 0.003 and p < 0.001) compared to RR and DO. The corollacomposition resulted quite comparable to that of the respective intact flowers in all the three basil
Plants 2020, 9, 22 8 of 16
varieties. A very interesting observation was that lithospermic acid A, salvianolic acids H/I and Kwere not detected in isolated corollas, and the concentrations of salvianic A were significantly lower incorollas than in flowers (p < 0.001), suggesting that these molecules are preferentially accumulated inthe fertile parts of the flowers.
2.4. Identification and Quantification of Individual Flavonoids
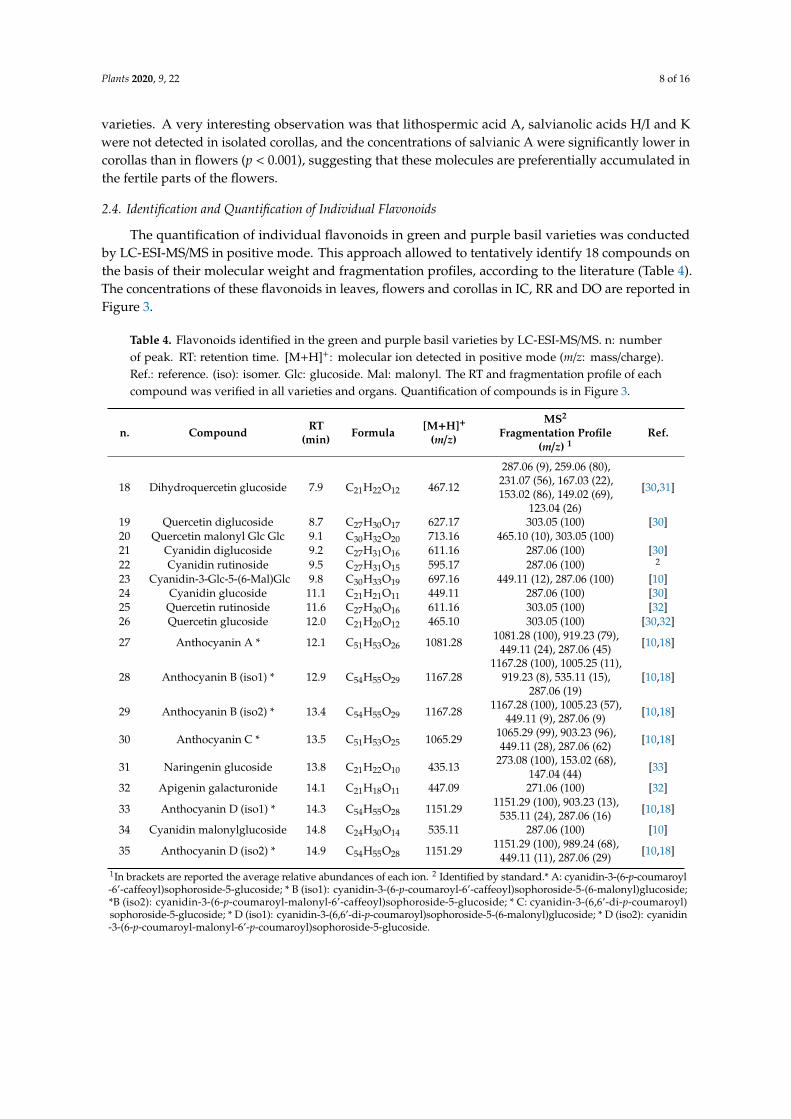
The quantification of individual flavonoids in green and purple basil varieties was conductedby LC-ESI-MS/MS in positive mode. This approach allowed to tentatively identify 18 compounds onthe basis of their molecular weight and fragmentation profiles, according to the literature (Table 4).The concentrations of these flavonoids in leaves, flowers and corollas in IC, RR and DO are reported inFigure 3.
Table 4. Flavonoids identified in the green and purple basil varieties by LC-ESI-MS/MS. n: numberof peak. RT: retention time. [M+H]+: molecular ion detected in positive mode (m/z: mass/charge).Ref.: reference. (iso): isomer. Glc: glucoside. Mal: malonyl. The RT and fragmentation profile of eachcompound was verified in all varieties and organs. Quantification of compounds is in Figure 3.
n. Compound RT(min) Formula [M+H]+
(m/z)
MS2
Fragmentation Profile(m/z) 1
Ref.
18 Dihydroquercetin glucoside 7.9 C21H22O12 467.12
287.06 (9), 259.06 (80),231.07 (56), 167.03 (22),153.02 (86), 149.02 (69),
123.04 (26)
[30,31]
19 Quercetin diglucoside 8.7 C27H30O17 627.17 303.05 (100) [30]20 Quercetin malonyl Glc Glc 9.1 C30H32O20 713.16 465.10 (10), 303.05 (100)21 Cyanidin diglucoside 9.2 C27H31O16 611.16 287.06 (100) [30]22 Cyanidin rutinoside 9.5 C27H31O15 595.17 287.06 (100) 2
23 Cyanidin-3-Glc-5-(6-Mal)Glc 9.8 C30H33O19 697.16 449.11 (12), 287.06 (100) [10]24 Cyanidin glucoside 11.1 C21H21O11 449.11 287.06 (100) [30]25 Quercetin rutinoside 11.6 C27H30O16 611.16 303.05 (100) [32]26 Quercetin glucoside 12.0 C21H20O12 465.10 303.05 (100) [30,32]
27 Anthocyanin A * 12.1 C51H53O26 1081.28 1081.28 (100), 919.23 (79),449.11 (24), 287.06 (45) [10,18]
28 Anthocyanin B (iso1) * 12.9 C54H55O29 1167.281167.28 (100), 1005.25 (11),
919.23 (8), 535.11 (15),287.06 (19)
[10,18]
29 Anthocyanin B (iso2) * 13.4 C54H55O29 1167.28 1167.28 (100), 1005.23 (57),449.11 (9), 287.06 (9) [10,18]
30 Anthocyanin C * 13.5 C51H53O25 1065.29 1065.29 (99), 903.23 (96),449.11 (28), 287.06 (62) [10,18]
31 Naringenin glucoside 13.8 C21H22O10 435.13 273.08 (100), 153.02 (68),147.04 (44) [33]
32 Apigenin galacturonide 14.1 C21H18O11 447.09 271.06 (100) [32]
33 Anthocyanin D (iso1) * 14.3 C54H55O28 1151.29 1151.29 (100), 903.23 (13),535.11 (24), 287.06 (16) [10,18]
34 Cyanidin malonylglucoside 14.8 C24H30O14 535.11 287.06 (100) [10]
35 Anthocyanin D (iso2) * 14.9 C54H55O28 1151.29 1151.29 (100), 989.24 (68),449.11 (11), 287.06 (29) [10,18]
1In brackets are reported the average relative abundances of each ion. 2 Identified by standard.* A: cyanidin-3-(6-p-coumaroyl-6’-caffeoyl)sophoroside-5-glucoside; * B (iso1): cyanidin-3-(6-p-coumaroyl-6’-caffeoyl)sophoroside-5-(6-malonyl)glucoside;*B (iso2): cyanidin-3-(6-p-coumaroyl-malonyl-6’-caffeoyl)sophoroside-5-glucoside; * C: cyanidin-3-(6,6’-di-p-coumaroyl)sophoroside-5-glucoside; * D (iso1): cyanidin-3-(6,6’-di-p-coumaroyl)sophoroside-5-(6-malonyl)glucoside; * D (iso2): cyanidin-3-(6-p-coumaroyl-malonyl-6’-p-coumaroyl)sophoroside-5-glucoside.

Plants 2020, 9, 22 9 of 16
Plants 2019, 8, x FOR PEER REVIEW 10 of 17
Figure 3. Contents of flavonoids in green and purple basil. (a) leaf; (b) flower; (c) corolla. Values are
the means ± SE (error bars; n = 3) expressed as μmol g−1 FW. Data are grouped in two scales to visualize
differences. Significant differences were assessed by one‐way ANOVA test (p ≤ 0.05, Tukey post hoc);
(*) significant difference respect to zero assessed by one‐Sample t‐test (p ≤ 0.05).
Figure 3. Contents of flavonoids in green and purple basil. (a) leaf; (b) flower; (c) corolla. Values are themeans ± SE (error bars; n = 3) expressed as µmol g−1 FW. Data are grouped in two scales to visualizedifferences. Significant differences were assessed by one-way ANOVA test (p ≤ 0.05, Tukey post hoc);(*) significant difference respect to zero assessed by one-Sample t-test (p ≤ 0.05).

Plants 2020, 9, 22 10 of 16
The LC-ESI-MS/MS analysis confirmed that the major flavonoids accumulated in basil arecyanidin derivatives, accounting for 11 molecules out of the total 18 flavonoids identified. Thesemolecules were identified on the basis of the presence in their fragmentation profile of the ions at287.06 m/z, corresponding to the aglycon moiety. As regards anthocyanins with higher molecular weight(n.23,27,28,29,30,33,35), our results confirmed the description recently provided by Luna et al. [10] byan MS2-MS3 approach. Considering that our approach was based only on MS2 spectrum profiles, themolecule assignments matched with a very high reliability, and were also coherent on the basis of RT.Although we verified the chemical information reported in the cited study, whenever possible weadopted, for the sake of clarity, the simpler nomenclature proposed by Flanigan and Niemeyer [18].In detail, Cya-3-Glc-5-(6-Mal)Glc (n.23) lacked the ion at 535.11 m/z, but the presence of the ionat 449.11 m/z, following the rule of the preferential fragmentation through the hydroxyl group atposition 5 (-248 m/z of Mal-Glc moiety) [10], confirmed the glycosidic fractions on positions 5 and 3.For anthocyanin B (1167.28 m/z) and D (1151.29 m/z), the results confirmed the presence of two isomers,differently substituted. The couple of ions at 919.23/535.11 m/z and at 903.23/535.11 m/z in the profile ofthe isomers B1 (n.28) and D1 (n.33) revealed the presence of a malonyl-glucoside moiety at position 5.Meanwhile, the higher intensity of the couple of ions at 1005.23/449.11 m/z and at 989.24/449.11 m/zindicated a simple glucosylation at 5 in the isomers B2 (n.29) and D2 (n.35), respectively.
Although these results confirmed those obtained by Luna et al. [10] in ‘Purple Iranian Basil’,our analysis did not detect the described presence of two other isomers of anthocyanin B, as well asof other six less abundant anthocyanins. In our opinion, this discrepancy derived from the fact that,interestingly, the major highly glycosylated anthocyanins (and isomers) showed different quantitativeproportions among the three purple varieties. However, in addition our analysis allowed detecting,by comparison to standard or to previous literature [10,30], anthocyanins with lower molecularweight (n.21,22,24,34).
Moreover, it was possible to identify other classes of flavonoids. Quercetin derivatives(n.19,20,25,26) were assigned by combining information related to the m/z of the precursor withthe presence of the ion at 303.05 m/z (quercetin aglycon) in the fragmentation profile [30,32]. In thecase of quercetin malonyl Glc Glc (n.20), loss of the malonylglucoside moiety (713.16–248.05→ 465.11,corresponding to quercetin glucoside) was also detected. Dihydroquercetin glucoside (n.18) wasassigned on the basis of the matching between the precursor (467.12 m/z) and the fragmentation of theaglycon proposed by Abad-García et al. [30,31]. Similarly, naringenin glucoside (n.31) and apigeningalacturonide (n.32) were identified by the ion of the aglycon (273.08 and 271.06 m/z, respectively) and,for the first one, by the relative fragmentation described in the literature [32,33].
The quantification of flavonoids in leaves of IC, RR, and DO (Figure 3a) confirmed that thehighly acylated anthocyanins are the predominant molecules [3,10,18]. Although colorimetric analysisdid not detect differences in the contents of total anthocyanins in RR and DO leaves, the MS2
approach revealed that these molecules were more abundant in RR than in DO, with the exception ofanthocyanin C. As far as it concerns the minor flavonoids, the more evident differences resided in thehigher accumulation of dihydroquercetin glucoside and naringenin glucoside in DO compared to RR(p < 0.001), and in the peculiar accumulation of cyanidin rutinoside and apigenin galacturonide in RRleaves. Finally, it was possible to observe that cyanidin glucoside and quercetin rutinoside were alsoaccumulated in the leaves of the green variety.
The analysis revealed a different composition in intact flowers (Figure 3b). Anthocyanins A and Bwere not detected, and anthocyanins C and D were only minor compounds. This seemed to be partiallycompensated by the accumulation of low acylated anthocyanins (i.e., cyanidin-3-Glc-5-(6-Mal)Glc andcyanidin malonyl-glucoside). Moreover, it was observed a higher concentration of cyanidin derivativeswith low molecular weight as well as of quercetin derivatives, some of which were also accumulated inwhite flowers. Differently than in leaves, the flavonoid composition in flowers resulted very similar inthe two purple varieties. Finally, analysis of isolated corollas revealed concentrations and compositionsof flavonoids similar to those observed in intact flowers (Figure 3).

Plants 2020, 9, 22 11 of 16
3. Discussion
The analysis of phenotypic traits in ‘Italiano Classico’ (IC), ‘Red Rubin’ (RR) and ‘Dark Opal’ (DO)plants allowed to highlight interesting differences between green and purple basil varieties in bothvegetative and reproductive stages. As far as it regards leaves, the choice to perform the study duringvegetative growth derived from the fact that this phase corresponds to the main harvest period forbasil crops in the Mediterranean area [2]. Since the accumulation of anthocyanins in basil increasesduring growth, but declines after flowering [3], the choice to conduct the study in this developmentalphase was intended to reduce the possible loss of phenolic compounds. The higher leaf fresh weightin IC (Table 1) suggests anatomical differences and is in agreement with the observation that thegreen variety ‘Tigullio’ tends to have leaves thicker and with more compact mesophyll than RR [15].The higher fresh weight of flowers in IC (Table 1) could be related to different factors. On one hand,this feature could be due to a higher production of pollen. In 2007 Chwil [34] indeed reported highernectar weight and bigger pollen grains in a green variety compared to a purple one. On the other hand,this difference could also be related to a prolonged juvenility in white flowers as compared to colouredones, as described in Petunia × hybrida [30]. Since basil is a melliferous species of great value [23,34],future studies aimed to clarify this aspect could have important implications.
As far as it regards the contents of total phenols in basil, it is important to notice that the valuesreported in the literature differ of up to one order of magnitude. This variability could be probablydue to differences in the harvest time of plants, in the use of fresh or dried tissues for the analyticaldeterminations, and in the methodological approaches adopted. The concentrations of total phenols inleaves, evaluated in dried tissues of several basil cultivars, ranges from 5 to 27 mg GAE g−1 DW [17,18],lower than the values of 5–7 mg GAE g−1 FW observed in the present work (Table 2). However,our results are consistent with those of Lee and Scagel [7] that report values of about 6 mg GAE g−1 FWin the green variety ‘Genovese Italian’. Concerning anthocyanins, whether determined by HPLC [3,10]or colorimetric [17,18] methods, their total concentrations in purple basil leaves range from 0.06 to0.55 mg CGE g−1 FW or from 0.8 to 1.6 mg CGE g−1 FW, respectively (similar to our results).
The present study provides novel information, especially about flowers. Our results confirmthat phenols are accumulated in flowers, as previously described in ‘Dark Opal’ [4] and in Iranianbasil accessions [16], and suggest that the quantitative differences between white and purple flowerscould be mainly ascribed to anthocyanins (Table 2). Moreover, our work confirms a high similarity inanthocyanin concentrations in RR and DO, as described in the entire aerial part of plants at flowering [3],and also provides additional details about the characteristics of leaves, flowers, and corollas. Finally,the results allow highlighting that in all the studied varieties the fertile parts of flowers accumulatesignificant amounts of phenols that may play specific, even if not yet elucidated, physiological roles insuch reproductive tissues.
This work also provides novel information about the antioxidant capacity in the different organsof basil varieties; this property shows only a weak relationship with the total phenols and anthocyanincontents, as previously discussed [4,17,18], suggesting that the antioxidant activity depends on specificmolecules. Moreover, the results show that flowers, and in particular the white ones, possess ahigher antioxidant capacity than leaves (Table 2). This is consistent with what was observed inO. americanum [19] but not in O. sanctus [35], suggesting a different chemical composition in flowers ofthe different Ocimum species.
The above detailed considerations prompted us to investigate the composition, in the differentorgans and basil varieties, of individual (poly)phenolic acids and flavonoids.
The analysis of the concentrations of individual (poly)phenolic acids in IC, RR and DO varietiesconfirms that rosmarinic and chicoric acids are the predominant polyphenolic acids in basil leaves [6,7].The fact that these molecules were accumulated at similar amounts in all the three varieties is probablyone of the major factors determining the similar antioxidant capacity of the leaves (Figure 2, Table 2).Overall, these results are consistent with data from the literature reporting comparable levels ofrosmarinic and chicoric acids in purple and green basil [17], and in different purple varieties [18]. At the

Plants 2020, 9, 22 12 of 16
same time, our study confirms that rosmarinic acid is also accumulated in flowers [4,16], but revealsthe absence of chicoric acid. This biochemical difference between organs could be a useful tool infuture studies to gain new information about chicoric acid biosynthesis, presently not yet completelyelucidated [36].
The results show that basil also accumulates simple phenolic acids and several members ofthe salvianolic acid family (Figure 2). The presence of lithospermic acid A in leaves [7] as well asthat of salvianolic acid B, caffeic acid, and 4-hydroxbenzoic acid in flowers [16] has been reported inrecent years, but only marginally investigated. Caffeic acid and salvianic acid A are the structuralunits of the salvianolic acids [37]. In particular, salvianic acid A is considered a superior antioxidantand one of the main therapeutic components for cardiac dysfunctions [25,38]. Moreover, it wasproposed that salvianolic acids, identified as the main bioactive compounds in Salvia spp., couldpossess pharmacological properties useful to counteract a wide range of human pathologies [37,39].The presence of these compounds in basil could improve the nutraceutical and technological value ofthis crop for food and pharmaceutical industry. Indeed, considering that the nutraceutical benefits ofvegetables are ever more associated with additive and synergistic combinations of phytochemicals [40],it is conceivable that salvianic acid and salvianolic acids, even if present at low amounts, couldcontribute to the beneficial properties of basil. This consideration could be of particular importance forflowers, where the bulk of these phenolic acids reached a concentration similar to that of rosmarinicacid. These (poly)phenolic acids resulted accumulated to a higher extent in IC flowers, suggesting thatthese molecules may contribute to the highest antioxidant properties of white flowers. Absence ofsalvianolic acids H/I, K, E, and L could account for the lowest values of antioxidant capacity observedin DO flowers (Figure 2, Table 2). This trend is in agreement with a recent study that compareswhite and purple flowers of Magnolia spp., where the antioxidant capacity was related to the levels ofsalvianic acid A [41]. It is also noteworthy that flower composition differed in the analyzed varieties,especially as far as it concerns the simpler phenolic acids. In particular, 4-hydroxybenzoic acid andsalvianolic acid K were specific of IC, where in addition salvianic acid A and salvianolic acid A wereaccumulated to higher extents, while caffeic acid and salvianolic acid F were specific of purple flowers(Figure 2). Considering that in Elsholtzia rugulosa (Hemsl.; Lamiaceae) flowers the accumulation of4-hydroxybenzoic acid is a key factor in the selective attraction of pollinators [42], it is possible that inbasil flowers phenolic acids contribute in diversifying the interactions between a specific variety andinsects. Finally, the higher levels of salvianic acid A, salvianolic acids H/I and K, and lithospermic acidA in flowers than in corollas suggest that these compounds are more accumulated in the fertile parts offlowers (Figure 2). This consideration supports the hypothesis that (poly)phenolic acids could have,for plants, other physiological roles, besides their antioxidant properties.
As far as it concerns the analysis of individual flavonoids in leaves and flowers of IC, RR, andDO varieties, one of the more interesting aspects is the observation that highly acylated anthocyaninstypically characterizing purple basil (i.e., anthocyanins A–D and their isomers) [3,10,18] are effectivelypredominant only in leaves, whereas flowers accumulate anthocyanins with lower degree of decoration(Figure 3). This observation has several implications. From a methodological point of view, it isimportant to notice that in comparison to the colorimetric evaluation, the HPLC-MS/MS approach seemsto significantly underestimate the anthocyanin concentration in leaves (Table 2, Figure 3). As previouslystated [3,10], it is possible that the lack of adequate standards affects the MS analysis, bringing tounderestimation of the highly acylated anthocyanins, probably due to different ionization efficiency.In our opinion, this aspect should be taken into account in the critical evaluation of the literature,as well as in the optimization of analytical approaches. The different anthocyanin composition inleaves and flowers could also affect their technological properties, especially because the degree ofacylation and glucosylation affects their stability, chemical reactivity, and antioxidant properties [9].Finally, this difference could be related to physiological aspects. Indeed, it was observed that atsimilar concentration, acylated anthocyanins absorb significantly more visible and UV-B light than thesimpler anthocyanin equivalents [43]. Considering that, in purple basil, anthocyanins play key roles in
Plants 2020, 9, 22 13 of 16
photo-protection [14,15], it is possible to hypothesize that leaves have evolved the metabolic abilityto accumulate a selected set of anthocyanins specifically involved in this process. In this regard, it isimportant to stress that the accumulation of highly acylated anthocyanins has a high metabolic cost,especially in terms of C skeletons, and hence it is conceivable that this ability is adequately sustainedin photosynthetic tissues, but it declines in heterotrophic floral tissues. From a biochemical point ofview, this work appears to provide the basis for future studies aimed at clarifying the biochemicalmechanisms involved in the regulation of the different anthocyanin composition in leaves and flowersof purple basil varieties.
In conclusion, the biochemical picture of the green and purple basil varieties concerning theirphenolic components revealed the presence of bioactive compounds not yet characterized in thisspecies, while also providing new clues about the nutraceutical properties as well as the possible rolesof these compounds in the physiology of this plant.
4. Materials and Methods
4.1. Plant Material and Growing Conditions
Basil seeds (O. basilicum L.) of the selected varieties ‘Italiano Classico’ (IC), ‘Red Rubin’ (RR)and ‘Dark Opal’ (DO) were purchased from Franchi Sementi (Grassobbio, Italy). Plants were grownindividually in 5-l pots filled with commercial universal soil (neutral peat and expanded perlite< 5%, pH 6.8, with 0.5 kg m−3 of slow-release fertilizer (NPKS 14/7/17/9 plus B 0.02 and Zn 0.01)and added with 1.25 g/L of organic mineral fertilizer (NKMgS 5/8/3/16)) and watered daily with tapwater. The experiment was conducted between March and July 2018, in a greenhouse in Milan (Italy)implemented with supplementary light and a cooling system (16 h/8 light-dark photoperiod, PPFDof about 600µmol of photons m−2 s−1, 20–25 ◦C night/day), randomizing pot arrangement of thethree varieties.
Forty-five days after sowing the vegetative phenotypic parameters were recorded and leaf sampleswere collected, selecting six fully expanded leaves from a total of three plants, for each biologicalreplicate. Flowers were collected within two days after anthesis, choosing the ones showing lack ofdamage or browning. Individual flower samples were obtained after removal of pedicel and sepals.Corollas were obtained removing pistil and stamens by means of blunt tweezers under a magnifyingglass. Flower and corolla samples were composed of 18 flowers collected from three inflorescences.All samples were weighed, immediately frozen in liquid N2, and stored at −80 ◦C for further use.The images of flowers and anthers were obtained by a stereo microscope Axio Zoom Zeiss V16,Carl Zeiss A.G., Feldbach, Switzerland.
4.2. Determination of the Total Phenol Compounds and Anthocyanins Contents
Frozen samples (150 mg) were finely powdered (mortar and pestle) in liquid N2, extracted bygentle shaking in 3 volumes of methanol, and centrifuged at 14,000 g for 10 min at 4 ◦C. Samples werediluted in 1:6 (v:v) ratio with 70% (v:v) methanol. The concentration of total phenolic compounds wasdetermined by the microscale Folin–Ciocalteau colorimetric method [44]. The absorbance at 765 nmwas referred to a calibration curve of gallic acid (GA) and expressed as mg gallic acid equivalents(GAE) g−1 fresh weight (FW). The antioxidant capacity was determined by a colorimetric methodbased on the reduction of Mo(VI) and formation of a green phosphate/Mo(V) complex at acidic pH [45].The absorbance at 695 nm was referred to a calibration curve of ascorbic acid (AA), and expressed asµmol AA equivalents (AAE) g−1 FW.
Total anthocyanin concentration was quantified in the same extracts used for the analysis ofindividual anthocyanins. After dilution of the samples from purple tissues in a 1:5 ratio in acidifiedmethanol (50% (v:v) methanol, 0.5% (v:v) formic acid (FA)), the absorbance at 520 nm was referred toa calibration curve of cyanidin-3-O-glucoside (CG) [46]. The concentrations of anthocyanins in the

Plants 2020, 9, 22 14 of 16
samples were reported as µmol CG equivalents (CGE) g−1 FW. All the analyses were conducted inthree biological samples (n = 3).
4.3. Quantification of Individual (Poly)Phenolic Acids and Flavonoids
The analysis of individual (poly)phenolic acids and flavonoids was conducted on the same plantextracts, obtained as previously described by Tattini and coworkers [15], with minor modifications.Briefly, frozen samples of leaves, flowers and corollas were finely powdered in liquid N2 by mortar andpestle. Samples (100 mg) were extracted in 6 ml of CHCl3:CH3OH:H2O (12:5:1, pH 2 by addition of FA)by shaking at 4 ◦C for 30 min, followed by mild sonication at 4 ◦C for 5 min. The samples were thenadded with 3.32 ml of CHCl3 plus 1.54 mL of 0.5% (v:v) FA, shaken at 4◦ C for 20 min, and centrifugedat 3000g for 10 min. The upper phase was collected, filtered by sterilized polyvinylidene difluoride(PVDF) membrane (0.45 µm; Waters S.p.A., Sesto San Giovanni, Italy). After dilution, samples wereanalyzed by capillary HPLC (Agilent Technologies 1200 series) coupled with ESI source on 6520 Q-TOFmass spectrometer (Agilent Technologies Italia S.p.A, Cernusco s/N, Italy). LC runs were performedon a XDB-C18 column (2.1 × 50 mm, 1.8 µm) in acidic condition [0.1% (v:v) FA] applying the followingacidified acetonitrile (0.1% FA) gradient: 0–2 min at 5%, 2–15 min to 15%, 15–45 min to 45%, with a flowrate of 200 µL min−1. The analysis of (poly)phenolic acid compounds was conducted in negative mode,setting the ESI source at 350 ◦C and −3000 V. The analysis of flavonoids was conducted in positivemode, setting the ESI source at 350 ◦C and +3500 V. In both modes, data acquisition was in a range of100–1500 m/z. The targeted MS/MS analyses were performed applying a collision energy of 15 V and25 V in negative and positive modes, respectively. The quantification of compounds was done on MSspectra by extracting the EIC (extracted ion current) with tolerance of 40 ppm, using adequate externalcalibration curves selected on the basis of molecular weight and chemical similitude. In detail, caffeicacid was used to calibrate itself, 4-hydroxybenzoic acid and salvianic acid A; rosmarinic acid wasused to calibrate itself, caftaric acid, fertaric acid, salvianolic acid F; chicoric acid was used to calibrateitself, salvianolic acids A, I, K and lithospermic acid; salvianolic acid B was used to calibrate itself andits isomers; cyanidin rutinoside was used as a standard for flavonoids. Quantitative analyses wereconducted on three biological replicates (n = 3), verifying molecule assignments by MS/MS analysis ineach condition.
Author Contributions: All authors contributed to the experimental work. Conceptualization, B.P. and L.E.;Formal analysis, B.P.; Funding acquisition, B.P.; Investigation, B.P., S.M., N.N., F.F. and L.E.; Supervision, B.P.;Writing—original draft, B.P.; Writing—review & editing, B.P., S.M., N.N. and L.E. All authors have read andagreed to the published version of the manuscript.
Funding: This research was funded by Azione A - Linea 2 – Piano di Sostegno alla Ricerca 2015-2017, Universitàdegli Studi di Milano.
Conflicts of Interest: The authors declare no conflict of interest.
References
1. Simon, J.E.; Morales, M.R.; Phippen, W.B.; Vieira, R.F.; Hao, Z. Basil: A Source of Aroma Compounds and aPopular Culinary and Ornamental Herb. In Perspective on New Crops and New Uses; Janick, J., Ed.; ASHSPress: Alexandria, VA, USA, 1999; pp. 499–505.
2. Makri, O.; Kintzios, S. Ocimum Sp. (Basil): Botany, Cultivation, Pharmaceutical Properties, and Biotechnology.J. Herbs Spices Med. Plants 2008, 13, 123–150. [CrossRef]
3. Phippen, W.B.; Simon, J.E. Anthocyanins in Basil (Ocimum basilicum L.). J. Agric. Food Chem. 1998, 46,1734–1738. [CrossRef]
4. Mastaneh, M.; Ahamd, M.; Taher, N.; Mehrdad, H. Antioxidant Effect of Purple Basil (Lamiaceae) Phenolics.Orient. J. Chem. 2014, 30, 1965–1969. [CrossRef]
5. Ch, M.; Naz, S.; Sharif, A.; Akram, M.; Saeed, M. Biological and Pharmacological Properties of the SweetBasil (Ocimum basilicum). Br. J. Pharm. Res. 2015, 7, 330–339. [CrossRef]

Plants 2020, 9, 22 15 of 16
6. Jayasinghe, C.; Gotoh, N.; Aoki, T.; Wada, S. Phenolics Composition and Antioxidant Activity of Sweet Basil(Ocimum basilicum L.). J. Agric. Food Chem. 2003, 51, 4442–4449. [CrossRef]
7. Lee, J.; Scagel, C.F. Chicoric Acid Found in Basil (Ocimum basilicum L.) Leaves. Food Chem. 2009, 115, 650–656.[CrossRef]
8. Petersen, M. Rosmarinic Acid: New Aspects. Phytochem. Rev. 2013, 12, 207–227. [CrossRef]9. Miguel, M.G. Anthocyanins: Antioxidant and/or Anti-Inflammatory Activities. J. Appl. Pharm. Sci. 2011,
1, 7–15.10. Luna, M.C.; Bekhradi, F.; Ferreres, F.; Jordán, M.J.; Delshad, M.; Gil, M.I. Effect of Water Stress and Storage
Time on Anthocyanins and Other Phenolics of Different Genotypes of Fresh Sweet Basil. J. Agric. Food Chem.2015, 63, 9223–9231. [CrossRef]
11. Szymanowska, U.; Złotek, U.; Karas, M.; Baraniak, B. Anti-Inflammatory and Antioxidative Activity ofAnthocyanins from Purple Basil Leaves Induced by Selected Abiotic Elicitors. Food Chem. 2015, 172, 71–77.[CrossRef]
12. Mol, J.; Grotewold, E.; Koes, R. How Genes Paint Flowers and Seeds. Trends Plant Sci. 1998, 3, 212–217.[CrossRef]
13. Hatier, J.-H.B.; Gould, K.S. Anthocyanin Function in Vegetative Organs. In Anthocyanins; Winefield, C.,Davies, K., Gould, K., Eds.; Springer: New York, NY, USA, 2008; pp. 1–19. [CrossRef]
14. Landi, M.; Guidi, L.; Pardossi, A.; Tattini, M.; Gould, K.S. Photoprotection by Foliar Anthocyanins MitigatesEffects of Boron Toxicity in Sweet Basil (Ocimum basilicum). Planta 2014, 240, 941–953. [CrossRef]
15. Tattini, M.; Landi, M.; Brunetti, C.; Giordano, C.; Remorini, D.; Gould, K.S.; Guidi, L. Epidermal CoumaroylAnthocyanins Protect Sweet Basil against Excess Light Stress: Multiple Consequences of Light Attenuation.Physiol. Plant. 2014, 152, 585–598. [CrossRef]
16. Javanmardi, J.; Khalighi, A.; Kashi, A.; Bais, H.P.; Vivanco, J.M. Chemical Characterization of Basil (Ocimumbasilicum L.) Found in Local Accessions and Used in Traditional Medicines in Iran. J. Agric. Food Chem. 2002,50, 5878–5883. [CrossRef] [PubMed]
17. Kwee, E.M.; Niemeyer, E.D. Variations in Phenolic Composition and Antioxidant Properties among 15 Basil(Ocimum basilicum L.) Cultivars. Food Chem. 2011, 128, 1044–1050. [CrossRef]
18. Flanigan, P.M.; Niemeyer, E.D. Effect of Cultivar on Phenolic Levels, Anthocyanin Composition, andAntioxidant Properties in Purple Basil (Ocimum basilicum L.). Food Chem. 2014, 164, 518–526. [CrossRef][PubMed]
19. Zengin, G.; Ferrante, C.; Gnapi, D.E.; Sinan, K.I.; Orlando, G.; Recinella, L.; Diuzheva, A.; Jeko, J.; Cziáky, Z.;Chiavaroli, A.; et al. Comprehensive Approaches on the Chemical Constituents and PharmacologicalProperties of Flowers and Leaves of American Basil (Ocimum americanum L). Food Res. Int. 2019, 125, 108610.[CrossRef] [PubMed]
20. Pires, T.C.S.P.; Dias, M.I.; Barros, L.; Barreira, J.C.M.; Santos-Buelga, C.; Ferreira, I.C.F.R. Incorporation ofNatural Colorants Obtained from Edible Flowers in Yogurts. LWT 2018, 97, 668–675. [CrossRef]
21. Pires, T.C.S.P.; Barros, L.; Santos-Buelga, C.; Ferreira, I.C.F.R. Edible Flowers: Emerging Components in theDiet. Trends Food Sci. Technol. 2019, 93, 244–258. [CrossRef]
22. Macukanovic-Jocic, M.P.; Rancic, D.V.; Dajic Stevanovic, Z.P. Floral Nectaries of Basil (Ocimum basilicum):Morphology, Anatomy and Possible Mode of Secretion. S. Afr. J. Bot. 2007, 73, 636–641. [CrossRef]
23. Nurzynska-Wierdak, R. Sweet Basil (Ocimum basilicum L.) Flowering Affected by Foliar Nitrogen Application.Acta Agrobot. 2011, 64, 57–64. [CrossRef]
24. Lee, J.; Chan, B.L.S.; Mitchell, A.E. Identification/Quantification of Free and Bound Phenolic Acids in Peeland Pulp of Apples (Malus domestica) Using High Resolution Mass Spectrometry (HRMS). Food Chem. 2017,215, 301–310. [CrossRef] [PubMed]
25. Feng, L.; Fu, S.; Du, W.; Wang, B.; Li, L.; Zhu, M.; Liu, C.; Zhang, J. Validation and Application of an RapidHPLC–MS Method for the Determination of Salvianic Acid A in Human Plasma. J. Chromatogr. Sci. 2015, 53,771–777. [CrossRef] [PubMed]
26. Khoza, B.S.; Gbashi, S.; Steenkamp, P.A.; Njobeh, P.B.; Madala, N.E. Identification of HydroxylcinnamoylTartaric Acid Esters in Bidens Pilosa by UPLC-Tandem Mass Spectrometry. S. Afr. J. Bot. 2016, 103, 95–100.[CrossRef]

Plants 2020, 9, 22 16 of 16
27. Ruan, M.; Li, Y.; Li, X.; Luo, J.; Kong, L. Qualitative and Quantitative Analysis of the Major Constituents inChinese Medicinal Preparation Guan-Xin-Ning Injection by HPLC–DAD–ESI-MSn. J. Pharm. Biomed. Anal.2012, 59, 184–189. [CrossRef]
28. Lu, Y.; Foo, Y. Rosmarinic Acid Derivatives from Salvia officinalis. Phytochemistry 1999, 51, 91–94. [CrossRef]29. Barros, L.; Dueñas, M.; Dias, M.I.; Sousa, M.J.; Santos-Buelga, C.; Ferreira, I.C.F.R. Phenolic Profiles of
Cultivated, In Vitro Cultured and Commercial Samples of Melissa officinalis L. Infusions. Food Chem. 2013,136, 1–8. [CrossRef]
30. Prinsi, B.; Negri, A.S.; Quattrocchio, F.M.; Koes, R.E.; Espen, L. Proteomics of Red and White Corolla Limbs inPetunia Reveals a Novel Function of the Anthocyanin Regulator ANTHOCYANIN1 in Determining FlowerLongevity. J. Proteom. 2016, 131, 38–47. [CrossRef]
31. Abad-García, B.; Garmón-Lobato, S.; Berrueta, L.A.; Gallo, B.; Vicente, F. A Fragmentation Study ofDihydroquercetin Using Triple Quadrupole Mass Spectrometry and Its Application for Identification ofDihydroflavonols in Citrus Juices. Rapid Commun. Mass Spectrom. 2009, 23, 2785–2792. [CrossRef]
32. Nováková, L.; Vildová, A.; Mateus, J.P.; Gonçalves, T.; Solich, P. Development and Application ofUHPLC–MS/MS Method for the Determination of Phenolic Compounds in Chamomile Flowers andChamomile Tea Extracts. Talanta 2010, 82, 1271–1280. [CrossRef]
33. Lozovaya, V.V.; Lygin, A.V.; Zernova, O.V.; Ulanov, A.V.; Li, S.; Hartman, G.L.; Widholm, J.M. Modification ofPhenolic Metabolism in Soybean Hairy Roots through down Regulation of Chalcone Synthase or IsoflavoneSynthase. Planta 2007, 225, 665–679. [CrossRef] [PubMed]
34. Chwil, M. Flowering Pattern, The Structure of Nectary Surface and Nectar Secretion in Two Varieties ofOcimum basilicum L. Acta Agrobot. 2007, 60, 55–65. [CrossRef]
35. Hakkim, F.L.; Shankar, C.G.; Girija, S. Chemical Composition and Antioxidant Property of Holy Basil(Ocimum sanctum L.) Leaves, Stems, and Inflorescence and Their in Vitro Callus Cultures. J. Agric. Food Chem.2007, 55, 9109–9117. [CrossRef] [PubMed]
36. Lee, J.; Scagel, C.F. Chicoric Acid: Chemistry, Distribution, and Production. Front. Chem. 2013, 1. [CrossRef][PubMed]
37. Wang, J.; Xu, J.; Gong, X.; Yang, M.; Zhang, C.; Li, M. Biosynthesis, Chemistry, and Pharmacology ofPolyphenols from Chinese Salvia Species: A Review. Molecules 2019, 24, 155. [CrossRef]
38. Yao, Y.-F.; Wang, C.-S.; Qiao, J.; Zhao, G.-R. Metabolic Engineering of Escherichia Coli for Production ofSalvianic Acid A via an Artificial Biosynthetic Pathway. Metab. Eng. 2013, 19, 79–87. [CrossRef]
39. Habtemariam, S. Molecular Pharmacology of Rosmarinic and Salvianolic Acids: Potential Seeds forAlzheimer’s and Vascular Dementia Drugs. Int. J. Mol. Sci. 2018, 19, 458. [CrossRef]
40. Liu, R.H. Health Benefits of Fruit and Vegetables Are from Additive and Synergistic Combinations ofPhytochemicals. Am. J. Clin. Nutr. 2003, 78, 517–520. [CrossRef]
41. Park, C.; Park, S.-Y.; Lee, S.; Kim, J.; Park, S. Analysis of Metabolites in White Flowers of Magnolia DenudataDesr. and Violet Flowers of Magnolia Liliiflora Desr. Molecules 2018, 23, 1558. [CrossRef]
42. Zhang, F.-P.; Yang, Q.-Y.; Zhang, S.-B. Dual Effect of Phenolic Nectar on Three Floral Visitors of ElsholtziaRugulosa (Lamiaceae) in SW China. PLoS ONE 2016, 11, 0154381. [CrossRef]
43. Kovinich, N.; Kayanja, G.; Chanoca, A.; Otegui, M.S.; Grotewold, E. Abiotic Stresses Induce DifferentLocalizations of Anthocyanins in Arabidopsis. Plant Signal Behav. 2015. [CrossRef] [PubMed]
44. Waterhouse, A.L. Determination of Total Phenolics. Curr. Protoc. Food Anal. Chem. 2002, 6, I1.1.1–I1.1.8.[CrossRef]
45. Prieto, P.; Pineda, M.; Aguilar, M. Spectrophotometric Quantitation of Antioxidant Capacity through theFormation of a Phosphomolybdenum Complex: Specific Application to the Determination of Vitamin E.Anal. Biochem. 1999, 269, 337–341. [CrossRef] [PubMed]
46. Prinsi, B.; Negri, A.S.; Espen, L.; Piagnani, M.C. Proteomic Comparison of Fruit Ripening between‘Hedelfinger’ Sweet Cherry (Prunus avium L.) and Its Somaclonal Variant ‘HS’. J. Agric. Food Chem.2016, 64, 4171–4181. [CrossRef] [PubMed]
© 2019 by the authors. Licensee MDPI, Basel, Switzerland. This article is an open accessarticle distributed under the terms and conditions of the Creative Commons Attribution(CC BY) license (http://creativecommons.org/licenses/by/4.0/).