Veritas Data Insight Administrator's Guide
475
Veritas Data Insight Administrator's Guide 6.1.4 March 2019
-
Upload
khangminh22 -
Category
Documents
-
view
22 -
download
0
Transcript of Veritas Data Insight Administrator's Guide

Veritas Data InsightAdministrator's Guide
6.1.4
March 2019

Veritas Data Insight Administrator's Guide6.1.4.0
Legal NoticeCopyright © 2019 Veritas Technologies LLC. All rights reserved.
Veritas and the Veritas Logo are trademarks or registered trademarks of Veritas TechnologiesLLC or its affiliates in the U.S. and other countries. Other names may be trademarks of theirrespective owners.
This product may contain third-party software for which Veritas is required to provide attributionto the third party (“Third-party Programs”). Some of the Third-party Programs are availableunder open source or free software licenses. The License Agreement accompanying theSoftware does not alter any rights or obligations you may have under those open source orfree software licenses. Refer to the Third-party Legal Notices document accompanying thisVeritas product or available at:
https://www.veritas.com/about/legal/license-agreements
The product described in this document is distributed under licenses restricting its use, copying,distribution, and decompilation/reverse engineering. No part of this document may bereproduced in any form by any means without prior written authorization of Veritas TechnologiesLLC and its licensors, if any.
THE DOCUMENTATION IS PROVIDED "AS IS" AND ALL EXPRESS OR IMPLIEDCONDITIONS, REPRESENTATIONS AND WARRANTIES, INCLUDING ANY IMPLIEDWARRANTY OF MERCHANTABILITY, FITNESS FOR A PARTICULAR PURPOSE ORNON-INFRINGEMENT, ARE DISCLAIMED, EXCEPT TO THE EXTENT THAT SUCHDISCLAIMERS ARE HELD TO BE LEGALLY INVALID. VERITAS TECHNOLOGIES LLCSHALL NOT BE LIABLE FOR INCIDENTAL OR CONSEQUENTIAL DAMAGES INCONNECTION WITH THE FURNISHING, PERFORMANCE, OR USE OF THISDOCUMENTATION. THE INFORMATION CONTAINED IN THIS DOCUMENTATION ISSUBJECT TO CHANGE WITHOUT NOTICE.
The Licensed Software and Documentation are deemed to be commercial computer softwareas defined in FAR 12.212 and subject to restricted rights as defined in FAR Section 52.227-19"Commercial Computer Software - Restricted Rights" and DFARS 227.7202, et seq."Commercial Computer Software and Commercial Computer Software Documentation," asapplicable, and any successor regulations, whether delivered by Veritas as on premises orhosted services. Any use, modification, reproduction release, performance, display or disclosureof the Licensed Software and Documentation by the U.S. Government shall be solely inaccordance with the terms of this Agreement.
Veritas Technologies LLC500 E Middlefield RoadMountain View, CA 94043
http://www.veritas.com

.
Technical SupportTechnical Support maintains support centers globally. All support services will be deliveredin accordance with your support agreement and the then-current enterprise technical supportpolicies. For information about our support offerings and how to contact Technical Support,visit our website:
https://www.veritas.com/support
You can manage your Veritas account information at the following URL:
https://my.veritas.com
If you have questions regarding an existing support agreement, please email the supportagreement administration team for your region as follows:
[email protected] (except Japan)

Section 1 Getting started ............................................................. 15
Chapter 1 Introduction to Veritas Data Insight administration........................................................................................... 16
About Veritas Data Insight administration .......................................... 16Operation icons on the Management Console .............................. 16Data Insight administration tasks ............................................... 17Supported data sources and platforms ........................................ 20
Chapter 2 Configuring Data Insight global settings ..................... 23
Overview of Data Insight licensing ................................................... 24Managing Data Insight licenses ................................................ 26
Configuring SMTP server settings ................................................... 27About scanning and event monitoring ............................................... 27
Configuring scanning and event monitoring ................................. 32About filtering certain accounts, IP addresses, and paths ...................... 38
About exclude rules for access events ........................................ 39About exclude rules for Scanner ................................................ 39Adding exclude rules to Data Insight .......................................... 40
About archiving data ..................................................................... 42About purging data ................................................................. 43Configuring data retention settings ............................................. 43
About Data Insight integration with Symantec Data Loss Prevention(DLP) ................................................................................... 46About configuring Data Insight to integrate with Data Loss
Prevention (DLP) .............................................................. 47Configuring Symantec Data Loss Prevention settings .................... 49Importing SSL certificate from the DLP Enforce Server to Data
Insight Management Server ................................................ 50About Symantec Data Loss Prevention (DLP) integration with Data
Insight ............................................................................ 51Importing sensitive files information through CSV ................................ 52Configuring advanced analytics ...................................................... 53
Choosing custom attributes for advanced analytics ........................ 54
Contents

About open shares ....................................................................... 55Configuring an open share policy ............................................... 56
Configuring file groups ................................................................... 57Configuring Workspace data owner policy ......................................... 58Configuring Management Console settings ....................................... 60About bulk assignment of custodians ................................................ 60
Assigning custodians in bulk using a CSV file ............................... 61Assigning custodians based on data ownership ............................ 62
Configuring Watchlist settings ......................................................... 63
Section 2 Configuring Data Insight ....................................... 65
Chapter 3 Configuring Data Insight product users ...................... 66
About Data Insight users and roles ................................................... 66Reviewing current users and privileges ............................................. 68Adding a user .............................................................................. 69
Add or edit Data Insight user options ......................................... 69Editing users ............................................................................... 71Deleting users ............................................................................. 72Configuring authorization for Symantec Data Loss Prevention users
........................................................................................... 72
Chapter 4 Configuring Data Insight product servers ................... 73
About Data Insight product servers .................................................. 74Adding a new Data Insight server .................................................... 74Managing Data Insight product servers ............................................. 75Viewing Data Insight server details ................................................... 78About node templates ................................................................... 79
Managing node templates ........................................................ 79Adding or editing node templates ............................................... 80
Adding Portal role to a Data Insight server ......................................... 81Adding Classification Server role to a Data Insight server ..................... 82Assigning Classification Server to a Collector ..................................... 82Associating a Classification Server pool to a Collector .......................... 84Viewing in-progress scans .............................................................. 85Configuring Data Insight services ..................................................... 86Configuring advanced settings ........................................................ 88Monitoring Data Insight jobs .......................................................... 106Rotating the encryption keys ......................................................... 107Viewing Data Insight server statistics .............................................. 107About automated alerts for patches and upgrades ............................. 109
5Contents

Viewing and installing recommended upgrades and patches .......... 109Deploying upgrades and patches remotely ....................................... 110Using the Upload Manager utility .................................................... 111About migrating storage devices across Indexers .............................. 112Viewing the status of a remote installation ........................................ 113
Chapter 5 Configuring saved credentials ..................................... 115
About saved credentials .............................................................. 115Managing saved credentials ................................................... 115
Handling changes in account password ........................................... 117
Chapter 6 Configuring directory service domains ...................... 118
About directory domain scans ....................................................... 118Adding a directory service domain to Data Insight .............................. 119
Add/Edit Active Directory options ............................................. 119Add/Edit LDAP domain options ................................................ 120Add/Edit NIS domain options ................................................... 123Add/Edit NIS+ domain options ................................................. 123
Managing directory service domains .............................................. 124Fetching users and groups data from NIS+ scanner ........................... 125Configuring attributes for advanced analytics .................................... 126Deleting directory service domains ................................................ 128Scheduling scans ....................................................................... 129Configuring business unit mappings ............................................... 129Importing additional attributes for users and user groups ..................... 130
Chapter 7 Configuring containers ................................................... 132
About containers ........................................................................ 132Adding containers ....................................................................... 132
Add new container/Edit container options .................................. 133Managing containers ................................................................... 133
Section 3 Configuring native file systems in DataInsight ........................................................................ 135
Chapter 8 Configuring NetApp file server monitoring ............... 136
About configuring NetApp file server monitoring ................................ 137Prerequisites for configuring NetApp file servers ............................... 137Credentials required for configuring NetApp filers .............................. 138Credentials required for configuring NetApp NFS filers ....................... 142
6Contents
Configuring SMB signing .............................................................. 143About FPolicy ............................................................................ 144Preparing Data Insight for FPolicy ................................................. 145Preparing the NetApp filer for Fpolicy .............................................. 146Preparing the NetApp vfiler for Fpolicy ............................................ 148Configuring NetApp audit settings for performance improvement .......... 150Preparing a non-administrator domain user on the NetApp filer for Data
Insight ................................................................................ 151Enabling export of NFS shares on a NetApp file server ....................... 154Excluding volumes on a NetApp file server ....................................... 155Handling NetApp home directories in Data Insight ............................. 155
Chapter 9 Configuring clustered NetApp file servermonitoring .................................................................... 157
About configuring a clustered NetApp file server ............................... 157About configuring FPolicy in Cluster-Mode ....................................... 159Pre-requisites for configuring clustered NetApp file servers ................. 159Credentials required for configuring a clustered NetApp file server
.......................................................................................... 161Preparing a non-administrator local user on the clustered NetApp filer
.......................................................................................... 163Preparing a non-administrator domain user on a NetApp cluster for
Data Insight ......................................................................... 165Preparing Data Insight for FPolicy in NetApp Cluster-Mode ................. 167Preparing the ONTAP cluster for FPolicy ......................................... 168About configuring secure communication between Data Insight and
cluster-mode NetApp devices .................................................. 169Generating SSL certificates for NetApp cluster-mode authentication
.................................................................................... 170Preparing the NetApp cluster for SSL authentication .................... 172
Enabling export of NFS shares on a NetApp Cluster-Mode file server.......................................................................................... 175
Chapter 10 Configuring EMC Celerra or VNX monitoring .......... 177
About configuring EMC Celerra or VNX filers .................................... 177About EMC Common Event Enabler (CEE) ................................ 178Preparing the EMC filer for CEPA ............................................. 178Preparing Data Insight to receive event notification ...................... 181
Credentials required for configuring EMC Celerra filers ....................... 183
7Contents

Chapter 11 Configuring EMC Isilon monitoring ............................. 185
About configuring EMC Isilon filers ................................................. 185Prerequisites for configuration of Isilon or Unity VSA file server
monitoring .......................................................................... 186Credentials required for configuring an EMC Isilon cluster ................... 187Configuring audit settings on EMC Isilon cluster using OneFS GUI
console .............................................................................. 188Configuring audit settings on EMC Isilon cluster using the OneFS CLI
.......................................................................................... 190Configuring Isilon audit settings for performance improvement ............. 193Preparing Veritas Data Insight to receive event notifications from an
EMC Isilon or Unity VSA cluster ............................................... 194Creating a non-administrator user for an EMC Isilon cluster ................. 195Using SmartConnect mapping for access zones ................................ 196Purging the audit logs in an Isilon filer ............................................. 197
Chapter 12 Configuring EMC Unity VSA file servers .................. 199
About configuring Dell EMC Unity storage platform ............................ 199Credentials required for configuring an EMC Unity VSA file server
.......................................................................................... 200Configuring audit settings on EMC Unity cluster using Unisphere VSA
Unity console ....................................................................... 201
Chapter 13 Configuring Hitachi NAS file server monitoring.......................................................................................... 202
About configuring Hitachi NAS ....................................................... 202Credentials required for configuring a Hitachi NAS EVS ...................... 203Creating a domain user on a Hitachi NAS file server for Data Insight
.......................................................................................... 203Preparing a Hitachi NAS file server for file system auditing .................. 204Advanced configuration parameters for Hitachi NAS .......................... 205
Chapter 14 Configuring Windows File Server monitoring .......... 207
About configuring Windows file server monitoring .............................. 207Credentials required for configuring Windows File Servers .................. 208Using the installcli.exe utility to configure multiple Windows file servers
.......................................................................................... 210Upgrading the Windows File Server agent ....................................... 212
8Contents

Chapter 15 Configuring Veritas File System (VxFS) file servermonitoring .................................................................... 213
About configuring Veritas File System (VxFS) file servers .................... 213Credentials required for configuring Veritas File System (VxFS) servers
.......................................................................................... 214Enabling export of UNIX/Linux NFS shares on VxFS filers ................... 216
Chapter 16 Configuring monitoring of a generic device ............. 218
About configuring a generic device ................................................. 218Credentials required for scanning a generic device ............................ 219
Chapter 17 Managing file servers ..................................................... 221
About configuring filers ................................................................ 222Viewing configured filers .............................................................. 222Adding filers .............................................................................. 224
Add/Edit NetApp filer options ................................................... 225Add/Edit NetApp cluster file server options ................................. 229Add/Edit EMC Celerra filer options ........................................... 234Add/Edit EMC Isilon file server options ...................................... 237Add/Edit EMC Unity VSA file server options ............................... 240Add/Edit Windows File Server options ...................................... 243Add/Edit Veritas File System server options ............................... 247Add/Edit a generic storage device options .................................. 250Add/Edit Hitachi NAS file server options .................................... 252
Custom schedule options ............................................................. 254Editing filer configuration .............................................................. 255Deleting filers ............................................................................ 257Viewing performance statistics for file servers ................................... 257About disabled shares ................................................................. 258Adding shares ............................................................................ 258
Add New Share/Edit Share options .......................................... 259Managing shares ........................................................................ 260Editing share configuration ........................................................... 264Deleting shares ......................................................................... 264About configuring a DFS target ...................................................... 264Adding a configuration attribute for devices ...................................... 265Configuring a DFS target .............................................................. 265About the DFS utility .................................................................... 267Running the DFS utility ................................................................ 267Importing DFS mapping ............................................................... 268
9Contents

Chapter 18 Renaming storage devices ........................................... 269
About renaming a storage device ................................................... 269Viewing the device rename status .................................................. 270Considerations for renaming a storage device .................................. 270
Section 4 Configuring SharePoint data sources.......................................................................................... 272
Chapter 19 Configuring monitoring of SharePoint webapplications .................................................................. 273
About SharePoint server monitoring ............................................... 273Credentials required for configuring SharePoint servers ...................... 274Configuring a web application policy ............................................... 275About the Data Insight web service for SharePoint ............................. 276
Installing the Data Insight web service for SharePoint ................... 276Adding web applications .............................................................. 277
Add/Edit web application options .............................................. 278Editing web applications ............................................................... 281Deleting web applications ............................................................. 282Adding site collections ................................................................. 282
Add/Edit site collection options ................................................ 283Managing site collections ............................................................. 284Removing a configured web application .......................................... 287
Chapter 20 Configuring monitoring of SharePoint Onlineaccounts ....................................................................... 289
About SharePoint Online account monitoring .................................... 289Prerequisites for configuring SharePoint Online account ............... 291
Registering Data Insight with Microsoft to enable SharePoint Onlineaccount monitoring ............................................................... 293
Configuring an administrator account for Data Insight ......................... 295Adding SharePoint Online accounts ............................................... 297
Add/Edit SharePoint Online account options ............................... 297Managing a SharePoint Online account ........................................... 301Adding site collections to SharePoint Online accounts ........................ 303
Add/Edit site collection options ................................................ 304Managing site collections ............................................................. 304
10Contents

Section 5 Configuring cloud data sources ..................... 309
Chapter 21 Configuring monitoring of Box accounts ................... 310
About configuring Box monitoring ................................................... 310Using a co-admin account to monitor Box resources .......................... 311Configuring monitoring of cloud sources in Data Insight ...................... 312
Add/Edit Box account ........................................................... 312Configuring Box cloud resources through proxy server ....................... 315
Chapter 22 Configuring OneDrive account monitoring ............... 316
About configuring OneDrive monitoring ........................................... 316Registering Data Insight with Microsoft to enable OneDrive account
monitoring ........................................................................... 320Configuring user impersonation in Office 365 .................................... 322Add/Edit OneDrive account ........................................................... 323Adding OneDrive user accounts ..................................................... 326
Add/edit OneDrive user accounts ............................................. 327
Chapter 23 Managing cloud sources ................................................ 328
Viewing configured cloud sources .................................................. 328Managing cloud sources .............................................................. 330
Section 6 Configuring ECM data sources ...................... 332
Chapter 24 Configuring Documentum data source ...................... 333
About Documentum device monitoring ............................................ 333Credentials required for configuring Documentum devices .................. 335Configuring Documentum monitoring in Data Insight .......................... 335
Add/Edit Documentum device ................................................. 336Managing ECM Sources .............................................................. 338Adding repositories ..................................................................... 340
Add New/Edit Repository options ............................................. 340Managing repositories ................................................................. 341
11Contents

Section 7 Health and monitoring .......................................... 345
Chapter 25 Using Veritas Data Insight dashboards ..................... 346
Viewing the system health overview ............................................... 346Viewing the scanning overview ...................................................... 349Viewing the scan status of storage devices ...................................... 351Viewing the scan history of storage devices ..................................... 353
Chapter 26 Monitoring Data Insight .................................................. 354
Viewing events .......................................................................... 354About high availability notifications ................................................. 355Monitoring the performance of Data Insight servers ........................... 355Configuring email notifications ...................................................... 357Enabling Windows event logging ................................................... 358Viewing scan errors .................................................................... 360
Section 8 Alerts and policies ................................................... 361
Chapter 27 Configuring policies ......................................................... 362
About Data Insight policies ........................................................... 362Managing policies ....................................................................... 364
Create Data Activity Trigger policy options ................................. 365Create User Activity Deviation policy options .............................. 368Create Real-time Data Activity User Whitelist-based policy options
.................................................................................... 370Create Real-time Data Activity User Blacklist-based policy options
.................................................................................... 372Create Real-time Sensitive Data Activity policy options ................. 375
Managing alerts ......................................................................... 378
Section 9 Remediation ................................................................ 380
Chapter 28 Configuring remediation settings ................................ 381
About configuring permission remediation ........................................ 381Managing and configuring permission remediation ...................... 382Configuring exclusions for permission recommendation ................ 385
About managing data .................................................................. 385About configuring archive options for Enterprise Vault ........................ 386
Adding new Enterprise Vault servers ......................................... 387
12Contents

Managing Enterprise Vault servers ........................................... 388Mapping file server host names .............................................. 390
About deleting files from CIFS devices ............................................ 391Configuring deletion of files and folders ..................................... 391Deleting files from the Workspace tab on the Data Insight interface
.................................................................................... 392Deleting files from the Reports tab on the Data Insight interface
.................................................................................... 392Viewing and managing the status of an operation .............................. 393
Section 10 Reference ...................................................................... 397
Appendix A Backing up and restoring data .................................... 398
Selecting the backup and restore order ........................................... 398Backing up and restoring the Data Insight Management Server ............ 398Backing up and restoring the Indexer node ...................................... 400
Appendix B Data Insight health checks ............................................ 403
About Data Insight health checks ................................................... 403Services checks ................................................................... 404Deployment details checks ..................................................... 404Generic checks .................................................................... 405Data Insight Management Server checks ................................... 409Data Insight Indexer checks .................................................... 410Data Insight Collector checks .................................................. 413Data Insight Windows File Server checks .................................. 416Data Insight SharePoint checks ............................................... 418
Understanding Data Insight best practices ....................................... 418
Appendix C Command File Reference ............................................. 421
fg.exe ....................................................................................... 422indexcli.exe ............................................................................... 424reportcli.exe ............................................................................... 430scancli.exe ................................................................................ 434installcli.exe ............................................................................... 439
Appendix D Data Insight jobs .............................................................. 441
Scheduled Data Insight jobs .......................................................... 441
13Contents

Appendix E Troubleshooting ................................................................ 452
About general troubleshooting procedures ....................................... 452About the Health Audit report ........................................................ 453Location of Data Insight logs ......................................................... 453Downloading Data Insight logs ...................................................... 455Migrating the data directory to a new location ................................... 456Enterprise Vault exceptions and their meanings ................................ 457Troubleshooting FPolicy issues on NetApp devices ........................... 461
Viewing FPolicy-related errors and warnings .............................. 462Resolving FPolicy connection issues ........................................ 462
Troubleshooting EMC Celera or VNX configuration issues .................. 463Troubleshooting EMC Isilon configuration issues ............................... 466Troubleshooting SharePoint configuration issues .............................. 467Troubleshooting Hitachi NAS configuration issues ............................. 471Troubleshooting installation of Tesseract software ............................. 471
Index .................................................................................................................. 473
14Contents

Getting started
■ Chapter 1. Introduction to Veritas Data Insight administration
■ Chapter 2. Configuring Data Insight global settings
1Section

Introduction to VeritasData Insight administration
This chapter includes the following topics:
■ About Veritas Data Insight administration
About Veritas Data Insight administrationYou administer the Veritas Data Insight system through the Management Console.The console has components for system administration, viewing data accessinformation, configuring policies and alerts, and generating reports, which areaccessible from the tabs located on the header panel. Navigate to the Settings tabon the console to carry out the various Data Insight administration tasks.
The Console is automatically installed with the Management Server. You accessthe Console through a Web browser that has a network connection to theManagement Server. By default, the Management Server runs on HTTPS port 443.To access it, in the Web browser's address field, type https://ms-host/.
Provided a valid license is installed, the Server Administrator user can see andaccess all parts of the administration console. Other users can see only the partsto which their roles grant them access. The user account under which you arecurrently logged on appears at the footer of the Management Console screen.
Operation icons on the Management ConsoleTable 1-1 shows the operation icons that are located on the console screen:
1Chapter

Table 1-1 Operation icons on the Management Console
DescriptionIcon
The settings icon is used in assigning custodians.
Screen refresh. Veritas recommends using thisrefresh button instead of your browser's Refresh orReload button.
Email the data on the current screen to one or morerecipients. If the current screen's data cannot be sentas an email, the icon is unavailable.
Exports all data on a panel on the current screen toa .csv file.
Exports all data on the current screen to a .csv file.
Submits request to the Enterprise Vault server toarchive the selected folders.
The action selector icon displays a menu with thefollowing two options:
■ Archive files using Enterprise Vault.■ Submit request to invoke a custom action on
selected paths.
Submit request to invoke a custom action on selectedpaths.
Data Insight administration tasksTable 1-2 summarizes the tasks to be performed to set up a new Data Insightinstallation:
Table 1-2 Data Insight administration tasks
DescriptionAction
See “Configuring SMTP server settings ”on page 27.
Configure SMTP server settings.
See “Configuring email notifications ”on page 357.
Setup notification policies.
17Introduction to Veritas Data Insight administrationAbout Veritas Data Insight administration

Table 1-2 Data Insight administration tasks (continued)
DescriptionAction
See “Adding a directory service domain toData Insight” on page 119.
Configure directory service domain.
See “Configuring data retention settings”on page 43.
Configure data retention settings.
See “Adding exclude rules to Data Insight ”on page 40.
Configure Exclude Rules.
See “Managing Data Insight licenses ”on page 26.
Install license.
See “About node templates” on page 79.
See “Managing Data Insight product servers”on page 75.
Configure Data Insight nodes eitherindividually or configure multiple nodes byapplying node templates.
See “Preparing Data Insight for FPolicy ”on page 145.
If monitoring events for NetApp file servers,configure Fpolicy service on collectors.
See “Preparing Data Insight for FPolicy inNetApp Cluster-Mode” on page 167.
If monitoring events for a clustered NetAppfile server, install the DataInsightFPolicyCmodservice on the collectors.
See “About EMC Common Event Enabler(CEE)” on page 178.
If monitoring events for EMC Celerra fileservers, configure Celerra service oncollectors.
See “Preparing Veritas Data Insight to receiveevent notifications from an EMC Isilon orUnity VSA cluster” on page 194.
See “About configuring EMC Isilon filers”on page 185.
See “About configuring Dell EMC Unitystorage platform” on page 199.
If monitoring events for EMC Isilon or EMCUnity file servers, configure EMC CommonEvent Enabler (CEE) on the collectors.
See “About configuring Windows file servermonitoring” on page 207.
If monitoring events for Windows file servers,upload agent packages to collectors.
See “About configuring a generic device”on page 218.
If monitoring events for a generic device, useweb APIs to collect access event information.
See “Installing the Data Insight web servicefor SharePoint” on page 276.
If monitoring events for SharePoint servers,install the Data Insight Web service on theSharePoint server.
18Introduction to Veritas Data Insight administrationAbout Veritas Data Insight administration

Table 1-2 Data Insight administration tasks (continued)
DescriptionAction
See “Registering Data Insight with Microsoftto enable OneDrive account monitoring”on page 320.
If monitoring a Microsoft OneDrive account,create and register an application withMicrosoft. This application is used toauthorize Data Insight to access the OneDriveaccount.
See “About configuring Box monitoring”on page 310.
See “About configuring OneDrive monitoring”on page 316.
If monitoring events from cloud storagesources, configure authorization to the cloudstorage account
See “Adding filers” on page 224.
See “Adding web applications” on page 277.
See “Adding SharePoint Online accounts ”on page 297.
See “Configuring monitoring of cloud sourcesin Data Insight” on page 312.
See “Configuring Documentum monitoring inData Insight” on page 335.
Configure data sources, as applicable to yourenvironment:
■ Configure file servers.■ Configure the SharePoint web
applications or SharePoint Onlineaccounts.
■ Configure cloud data sources such as Boxor Microsoft OneDrive.
■ Configure ECM data sources, such asDocumentum.
See “Configuring advanced analytics ”on page 53.
Configure advanced analytics
See “About configuring archive options forEnterprise Vault” on page 386.
Configure archiving settings
Do the following:
■ Install the Classification Server or assignclassification role to a Data Insight server.See “Adding Classification Server role toa Data Insight server” on page 82..
■ Enable classification and configuresafeguard settings for the ClassificationServer.For details, see the Veritas Data InsightClassification Guide.
■ Configure settings for content scanning.See “Configuring advanced analytics ”on page 53..
Set up classification
19Introduction to Veritas Data Insight administrationAbout Veritas Data Insight administration

Table 1-2 Data Insight administration tasks (continued)
DescriptionAction
See “Managing and configuring permissionremediation” on page 382.
Configure permission remediation settings
Do the following:
1 Install the Self-Service Portal.
For details, see the Veritas Data InsightInstallation Guide.
2 Configure workflow templates.
3 Create remediation workflows andsubmit them for further action on theSelf-Service Portal.
Configure workflows to remediate DLPincidents, review permissions on dataresources, confirm ownership of files andfolders, and to classify sensitive files forretention.
Supported data sources and platformsTable 1-3 lists the Network Attached Storage (NAS) devices and SharePointplatforms that Data Insight supports.
Table 1-3 Supported data sources and platforms
VersionDevice
Hitachi NAS 13.xHitachi NAS
7.3.5 or higherNetApp ONTAP 7-Mode
CIFS - ONTAP 8.2.x or higher
NFS version 3 - ONTAP 8.2.3 or higher and ONTAP 8.3.1or higher
NetApp ONTAP Cluster-Mode
EMC Celerra DART version 5.6.45 or higherEMC
EMC Isilon OneFS version 7.1.0.6 or higher
VNX version 7.1.71.1 or higher
Dell EMC Unity 4.2 or 4.3
Unity VSA 11.0
20Introduction to Veritas Data Insight administrationAbout Veritas Data Insight administration

Table 1-3 Supported data sources and platforms (continued)
VersionDevice
Windows Server 2008, or 2008 R2 64-bit
Windows Server 2012, or 2012 R2 64 bit
Windows Server 2016, 64-bit
Windows File Server
6.1 or higher, configured in standalone or clustered modeusing Cluster Server (VCS)
Note: For VCS support, Clustered File System (CFS) isnot supported.
Veritas File System (VxFS)server (NFS version 3)
Microsoft SharePoint Server 2010
Microsoft SharePoint Server 2013
Microsoft SharePoint Server 2016
Microsoft SharePoint
-Box (Cloud-based contentmanagement platform)
SharePoint Online
Microsoft OneDrive
Microsoft Office 365
6.7OpenText Documentum
Note the following:
■ Veritas strongly recommends that you upgrade your NetApp filer to the latestavailable firmware. Veritas recommends ONTAP 7.3.5 or higher.
■ For all supported versions of 7-mode NetApp filers, Data Insight supports CIFSprotocol over NTFS and NFS protocol v3. NFS v4 is not supported.For supported versions of Cluster-Mode NetApp filers, Data Insight supportsthe following volume/qtree styles:
■ NTFS and Mixed for CIFS protocol.
■ UNIX and Mixed for NFS protocol on 7-mode NetApp filers only.
■ NFS exports on the NetApp cluster.
■ For all supported versions of EMC Celerra/VNX and EMC Isilon, Data Insightsupports only CIFS protocol over NTFS. Data Insight supports Common EventEnabler (CEE), version 8.2 or higher. Data Insight still supports the older versionof CEE and VEE, but Veritas recommends that you move to the latest EMCCommon Event Enabler, which you can download from the EMC website.
21Introduction to Veritas Data Insight administrationAbout Veritas Data Insight administration

■ To use the Self-Service Portal to remediate DLP incidents, ensure that SymantecData Loss Prevention (DLP) version 12.5 or higher is installed. Data Insightuses the DLP Smart Response Rules to remediate incidents, which areintroduced in DLP version 12.5.
22Introduction to Veritas Data Insight administrationAbout Veritas Data Insight administration

Configuring Data Insightglobal settings
This chapter includes the following topics:
■ Overview of Data Insight licensing
■ Configuring SMTP server settings
■ About scanning and event monitoring
■ About filtering certain accounts, IP addresses, and paths
■ About archiving data
■ About Data Insight integration with Symantec Data Loss Prevention (DLP)
■ Importing sensitive files information through CSV
■ Configuring advanced analytics
■ About open shares
■ Configuring file groups
■ Configuring Workspace data owner policy
■ Configuring Management Console settings
■ About bulk assignment of custodians
■ Configuring Watchlist settings
2Chapter

Overview of Data Insight licensingYou must install a license key file that covers the Data Insight features that youwant to implement. To use all Data Insight functionality, you must have the followinglicenses:
■ Data Insight base license – The base product license enables you to accessbasic product features including viewing audit and scan data, reports, classifyingcontent, and adding resources such as filers and SharePoint web applications.The Data Insight base license is available in two types - based on the numberof users and based on the amount of storage that is monitored by Data Insight.When the storage limit-based license is applied, Data Insight computes the totalstorage that it monitors on filers, generic devices, Documentum devices, andSharePoint servers. It also includes the storage space that is occupied bydisabled shares. However, it does not include the storage monitored on DFSpaths and cloud storage resources such as Box.For paths on generic devices, Data Insight considers the storage occupied byparent and child shares independently. This behavior is observed because forgeneric devices, Data Insight is not able to distinguish between the physical andthe logical paths. As a result, during the computation of the total storage capacity,Data Insight considers the nested storage as independent storage.
■ Self-Service Portal license – A separate add-on license is needed if you wantto create workflow templates and workflows. The Self-Service Portal licenseenables you to access the portal to take action on remediation workflows. Youwill also not be able to access the Self-Service Portal until valid base and portallicenses are applied.
■ Data Insight cloud license – The cloud license is an add-on license that enablesyou to monitor data sources residing within the cloud environment, such as Box,SharePoint Online, and OneDrive. The cloud license is granted based on thenumber of users for your cloud accounts.A valid cloud license lets you add cloud sources for monitoring, discovering andscanning data, and viewing the audit and metadata information.
If you do not have a valid base license or when the license expires, the softwarecontinues to run in a restricted mode. The following functionality is disabled on theManagement Console:
■ The Workspace, Policies, and Reports tab are hidden on the ManagementConsole. Only theWorkflows and Settings tabs are visible on the UI. However,you will not be able to take any remediation actions from theWorkflows >Auditpage.
■ The options on the console to add new filers, shares, SharePoint webapplications, SharePoint Online accounts, site collections, repositories, cloud
24Configuring Data Insight global settingsOverview of Data Insight licensing

storage resources, and directory services are disabled. However, Data Insightlets you edit properties of the resources that are already configured in DataInsight.
■ Auto-discovery does not result in discovering new shares, site collections,OneDrive user accounts, Documentum repositories, or equivalents that arecreated on storage device, filer, or web application if the license on the DataInsight system is not valid.
■ Creation of workflow templates and workflows is disabled, even if portal licenseis valid but the base license has expired.
■ Ability to add cloud data sources is disabled even if the cloud license is validbut the base license has expired.
Until Data Insight 5.0.x, the product functionality operates on Trust and Verify model.A message in the footer indicates whether the base as well as Self-Service portallicense has expired, but product features are fully functional if the license has expiredor in the absence of a valid license.
Note that if the portal license is not valid:
■ When you click Workflows > Self-Service Portal Settings, Workflows >Templates, or Workflows for the first time, a pop-up is displayed in the bottomright corner indicating that a valid Self-Service Portal license must be appliedto use the feature.
■ The options to add workflow templates and workflows are disabled.
■ Custodians for a workflow continue to receive reminder emails for existingworkflows. However, when you click the portal link in the email, they see amessage indicating that the license has expired and must be renewed.
■ The footer of the reminder email contains a message indicating that the licensehas expired.
Depending on the state of the license, the following warnings and errors aredisplayed in the footer of the Management Console:
■ In case of a license in grace period, the footer shows an icon and messageindicating that the license has expired and is in grace period. On clicking thefooter, a detailed message indicating the number of grace days and the fact thatfeatures will be disabled after expiry is displayed. Additionally, a Data Insightevent is raised daily at the WARNING level indicating that the license is in graceperiod.After the grace period ends, a warning period will then be in effect until thelicense completely expires.
■ In case of a license in warning period, Data Insight displays an icon and amessage indicating that the license is in the warning period and is due to expire
25Configuring Data Insight global settingsOverview of Data Insight licensing

in a certain number of days. The Licensing team configures the warning period.Click the footer icon or message to view the detailed message. Additionally, aData Insight event is raised daily at the INFO level indicating that a warn policyis in effect for the license.
■ On license expiry, the footer displays the message indicating that the licensehas expired. On clicking the message, a detailed message is displayed indicatingthat some of the features are disabled. Additionally, a Data Insight event israised daily at the CRITICAL level stating that the license has expired.After the license expires, certain functionality is disabled and the applicationruns in a restricted mode.
■ In case of a storage limit-based license, if the storage monitored by Data Insightexceeds the licensed limit then the footer displays a warning message indicatingthat the storage monitored by Data Insight has exceeded. However, Data Insightcontinues to function with uninterrupted access to all functionality. Click thefooter message to view the detailed message.
■ In case of a cloud license, if the cloud license is expired then the ability to addnew cloud data sources such as SharePoint Online and Box for monitoring andto add shares or their equivalent data containers is disabled until the license isrenewed. However, Data Insight continues to monitor the existing data sourceswithout any interruption. To view the detailed message, click the footer message.
In case of multiple error conditions, the error message pop-up populates themessages based on their severity status.
For more information about licenses, contact your Licensing team.
Managing Data Insight licensesWhen you purchase Veritas Data Insight, you must install the Data Insight licensefile. License files have names in the format name.slf.
To install a license
1 Obtain the new license file.
2 In the Management Console, click Settings > Licensing.
The Licensing page displays the type of license applied, number of users forwhom the license is applied, date on which the license will expire, and totalnumber of user accounts that Data Insight monitors.
3 To add or update a license, click Add/Update License.
4 On the Add new license pop-up, browse to the new Data Insight license filethat you have downloaded, and click Upload.
26Configuring Data Insight global settingsOverview of Data Insight licensing

Configuring SMTP server settingsBefore Data Insight can send email notifications for events, reports, workflows, andalerts you must configure SMTP details for the Management Server.
To edit the SMTP settings
1 In the Management Console, click Settings > SMTP Settings.
2 On the SMTP settings page, click Edit.
3 Enter the following details:
■ A valid SMTP server hostname or IP address.
■ The port number for the SMTP mail server used to send email notifications.The default is 25.
■ The username for the email server (optional).
■ The password for the email server (optional).
■ The address from which emails are sent (optional).
■ Maximum attachment size. This information is used when Data Insightsends report notifications. Data Insight will not send reports as attachments,if the size of the report is over the specified limit.
4 Click Save.
About scanning and event monitoringData Insight scans the file system hierarchy to collect information related topermissions and file system metadata from the monitored storage devices.
Event monitoring is an operation that keeps track of the access events happeningon a file system. During event monitoring if Data Insight detects an event such ascreate, write or file system ACL level permission changes, it uses this informationto perform incremental scans for the paths on which events are reported.
Data Insight uses asynchronous APIs, such as FPolicy for NetApp filers, the CEEframework for EMC filers, and filter driver for Windows File Servers to collect accessevents.
By default, Data Insight initiates event monitoring every 2 hours. You can disableevent monitoring for the individual storage devices. To turn off event monitoring,navigate to Settings > Filers. In the edit page for filer, uncheck the option Enablefile system event monitoring.
27Configuring Data Insight global settingsConfiguring SMTP server settings

Note: Data Insight scans only share-level permission changes when eventmonitoring is turned off.
To fetch file system metadata, Data Insight performs the following types of scans:
Full scanDuring a full scan Data Insight scans the entire file system hierarchy. A full scan istypically run after a storage device is first added to the Data Insight configuration.Full scans can run for several hours, depending on the size of the shares. After thefirst full scan, you can perform full scans less frequently based on your preference.Ordinarily, you need to run a full scan only to scan those paths which might havebeen modified while file system auditing was not running for any reason.
In case of large shares, a full scan can take long time to complete. To reduce thetime it takes to scan certain large shares, you can configure parallel scanning whichuses multiple threads to scan the share. By default, the single thread scanner runson the shares regardless of their size. To use the parallel scanner feature, you mustconfigure it for each share.
Note: Parallel scanner supports only full scans on CIFS.
To configure parallel scanning for a Collector or a filer from theData Insight Servers> Advanced Settings tab.
See “Configuring advanced settings” on page 88.
To configure multiple threads to scan a share:
See “Add New Share/Edit Share options ” on page 259.
By default, each Collector node initiates a full scan at 7:00 P.M. on the last Fridayof each month.
For SharePoint, the default scan schedule is 11:00 P.M. each night.
28Configuring Data Insight global settingsAbout scanning and event monitoring

Figure 2-1 Scanner - Single thread and parallel threads
Incremental scanDuring an incremental scan, Data Insight re-scans only those paths of a share thathave been modified since the last full scan. It does so by monitoring incomingaccess events to see which paths had a create, write, or a security event on it sincethe last scan. Incremental scans are much faster than full scans.
Note: For Data Insight versions before version 5.0, incremental scans were triggeredonly when Data Insight detected any events during event monitoring.
Incremental scans are not available Documentum, SharePoint Online, and OneDrivedata sources.
By default, an incremental scan is scheduled once every night at 7:00 P.M. Youcan initiate an on-demand incremental scan manually by using the command lineutility scancli.exe. It is recommended to run the IScannerJob before you executethe utility.
29Configuring Data Insight global settingsAbout scanning and event monitoring

See “Scheduled Data Insight jobs” on page 441.
Path re-confirmation scanAfter Data Insight completes indexing the full scan data, it computes the paths thatno longer seem to be present on the file system. A re-confirmation scan confirmsif a path which is present in the indexes, but appears to be no longer present onthe file system, is indeed deleted. A re-confirmation scan is automatically triggered,when Data Insight detects potentially missing paths on the file system during a fullscan.
You can turn off re-confirmation scan for any Indexer, using the Advanced Settingfor that Indexer. When the re-confirmation scan is turned off, Data Insight readilyremoves the missing paths from the indexes without carrying out a re-confirmation.
See “Configuring advanced settings” on page 88.
At a global level, full scans are scheduled for individual Collectors or Windows FileServer agents. The Table 2-1 gives you the details of all the entities for which youcan schedule a full scan.
Table 2-1 Entities having configurable scan schedules
DetailsScopeScan schedule settingslocation
Entity
See“Configuringadvancedsettings”on page 88.
Applies to all the storagedevices associated withthe Collector, for which aschedule is defined.
Settings > Data Insight Servers >Advanced Setting > File SystemScanner settings.
Collector orWindowsFile Serveragents
30Configuring Data Insight global settingsAbout scanning and event monitoring

Table 2-1 Entities having configurable scan schedules (continued)
DetailsScopeScan schedule settingslocation
Entity
See “Addingfilers”on page 224.
See “Addingwebapplications”on page 277.
See“Configuringmonitoringof cloudsources inDataInsight”on page 312.
Applies to filers,SharePoint webapplications, SharePointOnline accounts, ECMsources, or cloudsources for whichschedule is defined.
This setting overrides thescan schedule definedfor the Collectorassociated with the filer,web applications, andcloud sources.
In case of a filer, Settings > Filers >Add New Filer.
In case of a SharePoint webapplication, Settings > SharePointSources >Add SharePoint Source> SharePoint Web Application.
In case of a SharePoint Onlineaccount, Settings > SharePointSources >Add SharePoint Source> SharePoint Online Account.
In case of a ECM source, Settings> ECM Sources > Add New ECMSource > Documentum.
In case of a cloud storage account,Settings > Cloud Sources > AddNew Cloud Source.
Note: You can also configurescanning at the time of editing filers,web applications, and cloud sources.
Filers, webapplications,ECMsources,and cloudsources
See “Addingshares”on page 258.
See “Addingsitecollections”on page 282.
Applies to the entireshare or site collectionfor which schedule isdefined.
Overrides the scanschedules defined for thefiler or the webapplication associatedwith the share or the sitecollection.
Settings > Filers > MonitoredShares > Add New Share.
Settings > SharePoint Sources >WebApplications >Monitored SiteCollections > Add Site Collection.
Settings > SharePoint Sources >Online Accounts > Monitored SiteCollections > Add Site Collection.
Settings > ECMSources >Devices> Monitored Repositories > AddNew repository.
Note: You can also configurescanning at the time of editing sharesand site collections.
Shares, sitecollections,andrepositories
You can override all the full scan schedules and initiate an on-demand full scan forconfigured shares or site collections. See “Managing shares” on page 260.
31Configuring Data Insight global settingsAbout scanning and event monitoring

Sometimes for maintenance and diagnostic purposes, you may need to disable allthe scans. You can disable all scans:
■ At the time of adding or editing a storage device.See “Adding filers” on page 224.See “Adding site collections” on page 282.See “Adding site collections to SharePoint Online accounts” on page 303.See “Adding repositories” on page 340.
■ Or from the Settings > Scanning and Event Monitoring page of theManagement Console.See “Configuring scanning and event monitoring ” on page 32.
If you disable scanning for any device, you will not be able to view any permissionsdata for that device. However, you may still see some stale metadata like size,permissions etc., which was collected before the scanning was disabled. If you runa report on the paths for which scanning is disabled, you may get a report with staledata.
You can specify pause schedules for both full and incremental scans to indicatewhen scanning should not be allowed to run. You can configure a pause schedulefrom the Settings > Data Insight Servers > Advanced Settings page. See“Configuring advanced settings” on page 88. to know more about configuring apause schedule.
You can view the details of the current and historical scan status for your entireenvironment from the scanning dashboard. To access the scanning dashboard,from the Data Insight Management Console, navigate to Settings > Scanning >Overview. See “Viewing the scanning overview” on page 349. to know more aboutthe scanning dashboard.
Configuring scanning and event monitoringYou can configure Data Insight to globally turn on or off receipt of event notificationsand safeguards related to FPolicy communication.
Data Insight allows you to disable scanning of all file systems. The scans can beenabled at any convenient time.
You can also configure whether you want the Scanner to fetch the Access ControlLists (ACLs) defined on folders and ownership information for files and folders. ForWindows File Servers, you can configure safeguards that prevent an agent fromtaking up too much disk space.
32Configuring Data Insight global settingsAbout scanning and event monitoring

To configure scanning and event monitoring
1 In the Management Console, clickSettings >Scanning andEventMonitoring.
You can view the state of scanning and event monitoring.
2 To change the state of a process to Enabled or Disabled, click Edit.
3 Do one of the following:
■ Select the check box for the process that you want to enable.
■ Clear the check box for the process that you want to disable.
4 Click Save to save the changes.
Table 2-2 Scanning and Event Monitoring options
DescriptionOption
Clear the check box to turn off all future file system scanning on allfilers. Once you save the setting, it will also stop all currently runningscans.
Scan File Systemmeta-data
Clear the check box if you do not want Scanner to fetch Access ControlList (ACLs) for folders during scanning.
If you disable this option, the Workspace > Permissions tab in theConsole is disabled and permission related reports will not produceany data. If you do not need permissions data, you can disable thisoption to make the scans run faster.
Get Folder ACLs
Clear the check box if you do not want Scanner to fetch the Ownerattribute for files and folders.
Ownership information is used to determine ownership for data whenaccess events are not available. If you do not need this information,you can disable this option to make scans run faster.
Get Ownershipinformation for filesand folders
33Configuring Data Insight global settingsAbout scanning and event monitoring

Table 2-2 Scanning and Event Monitoring options (continued)
DescriptionOption
Select Throttle scanning based on latency of the filer to enablethrottling of Data Insight scans for NetApp 7-mode and Cluster-Modefile servers. This option is not selected by default.
Data Insight collects latency information from NetApp file servers. Itcan use this information to throttle scanning, if latency of the file serverincreases above a certain level. This ensures scanner does not putadditional load on the file server during peak load conditions.
You can configure the following parameters to enable throttling forNetApp file servers:
■ Latency threshold - Specify latency in milliseconds, which whencrossed, should throttle scanning for the file server.
■ Minimum pause - Specify the minimum duration (in milliseconds)for which the scanner should pause between paths when inthrottling mode.
■ Back off value - If increased latency is sustained, pause intervalwill be increased by the Back off value specified (in milliseconds).
■ Maximum pause - Specify the maximum pause interval for thescanner (in milliseconds). If exceeded, pause interval is no longerincremented by Back off value.
Throttling forNetApp filers
Clear the check box to stop Data Insight from collecting access eventsfrom all file servers. In case of NetApp, it means all collector nodeswill disconnect their Fpolicy connections to file servers.
Note: Monitoring of file system access events is not supported forECM data sources, such as Documentum.
Monitor file systemaccess events
34Configuring Data Insight global settingsAbout scanning and event monitoring

Table 2-2 Scanning and Event Monitoring options (continued)
DescriptionOption
Select Enable node safeguard check box to monitor the disk usageon the Windows File Server node, and to prevent it from running outof disk space by implementing safeguards.
You can specify the threshold for disk utilization in terms of percentageand size. The DataInsightWatchdog service initiates the safeguardmode for the Windows File Server node if the free disk space fallsunder the configured thresholds.
The DataInsightWatchdog service automatically resets the safeguardmode when the free disk space is more than the configured thresholds.
You can edit the threshold limits as required. If you specify values interms of both percentage and size, then the condition that is fulfilledfirst is applied to initiate the safeguard mode.
Note: It is recommended that you configure the same safeguardthresholds for the Windows File Server and the Classification Server(if present in your environment).
For more information on the DataInsightWatchdog service, see theVeritas Data Insight Installation Guide.
Disk safeguardsettings forWindows FileServer agents
35Configuring Data Insight global settingsAbout scanning and event monitoring

Table 2-2 Scanning and Event Monitoring options (continued)
DescriptionOption
Select the following:
■ Enable FPolicy 7-Mode Safeguard to initiate safeguard mode forthe NetApp file servers.
■ Select Enable FPolicy 7-Mode safeguard for VFilers to initiatesafeguard mode for virtual file servers by monitoring latencystatistics for the associated physical NetApp filers.The safeguard mode for the virtual filers is initiated only if the detailsof the physical filer corresponding to the virtual filer are providedwhile adding the virtual filer.
■ Select Enable FPolicy Cluster Mode Safeguard to initiatesafeguard mode for the NetApp cluster mode file servers.
This Fpolicy Safeguard settings are not selected by default.
Data Insight collects latency information from NetApp file servers. Itcan use this information to initiate safeguard mode, if latency of thefile server increases above or falls below a certain level. When thesafeguard is in effect, Data Insight drops its Fpolicy connection to thefiler. This ensures event collection does not put additional load on thefile server in peak load conditions.
If the latency (CIFS or NFS) on the physical file server increases abovethe configured threshold, Data Insight disconnects from the associatedvirtual file server even if monitoring for that type (CIFS/NFS) was notenabled on the virtual filer. This information is also displayed on theData Insight System Overview dashboard.
Configure the following values:
■ The high and low thresholds for CIFS and NFS.■ The number of samples to be considered to calculate the average
latency.■ The minimum time to wait before Data Insight reconnects to the
filer after a disconnection.
See “Add/Edit NetApp filer options” on page 225.
Fpolicy Safeguardsettings
You can choose to override the global scan throttling and FPolicy safeguard settingsfor specific Collector nodes.
See “Configuring advanced settings” on page 88.
Considerations for running a parallel scanYou can configure a collector to scan multiple shares of filers in parallel. By default,each scan process uses a single thread to perform the scanning. For certain large
36Configuring Data Insight global settingsAbout scanning and event monitoring

shares, scanning with a single thread can take a long time to complete. For suchshares, Data Insight lets you use multiple parallel scanning threads within a scanprocess to enable faster scans.
To configure parallel scanning for a collector or a filer from the Advanced Settingspage:
See “Configuring advanced settings” on page 88.
To configure multiple threads to scan a single share:
See “Add New Share/Edit Share options ” on page 259.
Enabling multiple threads for a scan process has certain performance implicationsfor the collector and the filer.
The following considerations apply when you enable parallel scanning for one ormore shares on a collector:
■ It is recommended that the collector meets the following system requirementsfor running multi-threaded scans:
■ 32 cores
■ 64GB RAM
■ Windows Server 2012. The operating system must be 64-bit.
■ As a precautionary measure to avoid excessive load on the filers, Data Insightruns a maximum of four multi-threaded scans in parallel on a collector regardlessof the value configured on the Advanced Settings page.
■ Based on your scanning requirements and available system resources, you canset the number of scan threads that you want Data Insight to use in parallelwithin a share from theAddNewShare/Edit Share page. Data Insight interpretsthe scan thread count as follows:
■ Automatic: Data Insight computes the number of parallel scan threads basedon the number of processors and the amount of workload. The maximumnumber of threads that Data Insight runs is between 1-16.
■ 1-128: Data Insight runs the specified number of scan threads.
Note: For optimal parallel scan performance, it is recommended to select thescan option as Automatic.
■ When a parallel scan is configured for certain shares, those shares are scannedfaster. However, higher number of parallel scan threads may introduce a resourceoverhead on the filers. Thus, ensure that you do not set an excessively highvalue.
37Configuring Data Insight global settingsAbout scanning and event monitoring

■ It is recommended that the DatainsightComm service should be stopped onlyafter the parallel scans are completed. Or, on the next restart of the service, theparallel scan automatically starts a fresh scan.
■ If you edit a share to use parallel scanner instead of the single-threaded scannerwhile scanning is in the running or paused state, the single-threaded scancontinues to run till it completes. For the subsequent full scans, the parallelscanner is executed. If you need to start using the parallel scanner immediately,then you must cancel the current scan from the Settings > Scan Status>In-Progress Scan page and restart the scan.
LimitationsThe following limitations apply for the parallel scanner.
■ Support for incremental scan is not available. Only full scans are supported.
■ Support for NFS shares, and SharePoint Online, Microsoft OneDrive, andDocumentum data sources is not available.
■ Support for filtering out shares based on the Exclude Rules configuration isnot available.
■ For Windows File Server agents version older than 5.2, the parallel scannercannot be executed. Even if it is configured, the single thread scan runs.
■ Support for scanning circular or symbolic links is not available.
■ Support for scanning junction-based paths is not available.
About filtering certain accounts, IP addresses,and paths
You can configure Veritas Data Insight to filter data accesses by specific users, IPaddresses, file system paths, and URLs. You can combine these criteria togetheror use them individually to create a filter.
You can create separate exclude rules for file servers and SharePoint servers. Foreach of these, Data Insight supports two types of filters:
■ Exclude rules for access events
■ Exclude rules for Scanner
Note:Exclude rules for Scanner and access events are not supported for SharePointOnline, Microsoft OneDrive, and Documentum data sources.
38Configuring Data Insight global settingsAbout filtering certain accounts, IP addresses, and paths

About exclude rules for access eventsYou can configure the following types of exclude rules for access events:
Typically, used to mask service accounts fromregistering data accesses into Veritas DataInsight. For example, if an antivirus softwareperforms scans on a mounted share using aspecific user account, you can add that useraccount to a filter. Data Insight omits allaccesses made by that service user account.
Filters for account names or SIDs
Used to filter data accesses from specific IPaddresses. Such filters are useful if you havefile system scanners configured on certainmachines in your environment, whoseaccesses you want to ignore.
Note: IP addresses for events are notavailable for Windows File Servers andSharePoint.
Filters for IP addresses
Filters for path names are of two types, fileextension based and path based.
The file extension based filter specifies thefile extensions to be filtered.
The path based filter specifies the path of afolder and filters out all events which havethat path prefix. For path-based filtering, youmust specify a fully qualified path prefix or apath relative to the root of each share. Youcan also use the wildcard (*) with a prefixstring to exclude paths that have the string inthe path name.
Filters for path names
Used to filter data accesses from specifiedweb applications or from SharePoint sites.Use fo wildcard (*) in exclude rules for accessevents is not supported.
Filter for URLs
About exclude rules for ScannerScanner supports filtering out a top-level folder for all shares. You can define rulesto exclude the scanning of the specified share, or SharePoint URL by the Scannerprocess.
39Configuring Data Insight global settingsAbout filtering certain accounts, IP addresses, and paths

Scanner does not support excluding folders under a top-level folder. Also, use ofwildcard (*) in exclude rules for access events is not supported.
Adding exclude rules to Data InsightYou must create a rule for every filter you want to add to Data Insight. The rulemust contain a value for at least one criterion that you want to exclude.
To add an exclude rule
1 In the Console, click Settings > Exclude Rules.
2 Click Add Exclude Rule for File System or Add Exclude Rule forSharePoint, as the case may be.
From the drop-down, select Exclude access or Exclude scanning.
3 On the Add Exclude Rule screen, enter the Exclude rule properties.
4 Click Save.
Add/Edit Exclude rule for access events optionsUse this dialog box to add a new exclude rule for access events to Data Insight orto edit the an existing exclude rule.
Table 2-3 Add/Edit file system Exclude rule for access events options
DescriptionField
Enter a logical name for the Exclude rule.Rule name
Enter the username or SIDs that you want to exclude.
Note: The usernames must be present in the Data Insight usersdatabase, before they can be added to a exclude rule.
Usernames/SIDs
Enter the IP addresses that you want to exclude.
This filter only applies to NetApp and EMC Celerra file servers.
IP Addresses
40Configuring Data Insight global settingsAbout filtering certain accounts, IP addresses, and paths

Table 2-3 Add/Edit file system Exclude rule for access events options(continued)
DescriptionField
When defining a file system rule, enter the file extensions or paths thatyou want to exclude. A CIFS file system path must be fully qualifiedpath in the format, \\filer\share\folder or relative to each share,for example, <name of folder>. A NFS path must be a fully qualifiedphysical path on the actual file system in the format,/path/in/the/physical/filesystem.
The logical operator OR is used create a rule with multiple values of thesame dimension and the logical operator AND is used to combine valuesacross dimensions in a rule. For example, if you create a rule to ignoreuser_foo1, user_foo2, and IP_10.209.10.20, it means that all accessesfrom IP_10.209.10.20 AND (user_foo1 OR user_foo2) will be ignored.
You can also specify the wildcard (*) in an exlude rule for paths. DataInsight allows the use of wildcard (*) in the following formats in anexclude rule:
■ <prefix string> - Events for paths that start with the specified <prefixstring> are excluded .
■ <prefix string>* - Events on paths that start with the specified <prefixstring> are excluded.
■ *<string> - Events on paths which start with anything followed bythe specified string are excluded.
■ *<string>* Events on paths which have the specified stringsomewhere in the path name are excluded.
For example, if you specify *<abc>*, events on all paths that have thestring abc anywhere in the path name will be excluded.
When defining a SharePoint rule, enter the URL of the SharePoint webapplication or the site.
You can use the wildcard (*) to exclude events for URLs that contain aspecified sting in its name. For example, if you specify <abc>*, eventson all URLs that have the string abc anywhere in the path name areexcluded.
Exclude patterns
Select PREFIX or EXTENSION from the Pattern Type drop-down.
This field is only available for a file system rule.
Pattern Type
Select the Yes radio button to enable the rule and the No radio buttonto disable it.
Rule is enabled
41Configuring Data Insight global settingsAbout filtering certain accounts, IP addresses, and paths

Add/Edit Exclude rule for Scanner optionsUse this dialog box to add a new exclude rule for access events to Data Insight orto edit the an existing exclude rule.
Table 2-4 Add/Edit file system Exclude rule for Scanner options
DescriptionField
Enter a logical name for the Exclude rule.Rule name
When defining a CIFS file system rule, specify the name of the folderto exclude as /<name of first level folder>. For NFS filesystem rule, specify the name of the folder to exclude as /<name offirst level folder>
When defining a SharePoint rule, enter the URL of the SharePoint webapplication or the site.
Exclude Patterns
Select the Yes radio button to enable the rule and the No radio buttonto disable it.
Rule is enabled
About archiving dataData Insight stores system events, alerts, and access events on the Indexer workernode in a pre-determined folder. You can configure Data Insight to automaticallyarchive access events older that the specified interval to another folder to savespace. Once the data is archived, it is no longer available for querying. You can,however, restore the data back to the original location on the Indexer node, ifneeded.
By default, archived data is automatically moved to $data/indexer/archive folderon each Indexer worker node. You can also configure a different archive folder onthe Indexer nodes. The archive folder is organized by YEAR/MONTH to makerestoring easy. Once data is moved to this folder based on the configured archivepolicy, you can do one of the following:
■ Backup the archive folder and delete the archived files from the Indexer node.
■ Or, configure a file system archiving solution like Enterprise Vault File SystemArchiving to archive all files in the archive folder.
If you want to restore archived data at a later time, you must bring back theappropriate segments from the backup folder to their original location in the archivefolder and use the indexcli utility to restore these segments. Once restored, segmentsare not archived or purged by the data retention policy till they are marked forre-archiving.
42Configuring Data Insight global settingsAbout archiving data

Note: You can disable archiving of access events information by enforcing a legalhold on shares and site collections.
See “About purging data” on page 43.
See “Configuring data retention settings” on page 43.
About purging dataIf you want Data Insight to automatically delete data, such as access events, systemevents, report outputs, and alerts older than specified interval, you can configurea purging policy. The purging policy must take into account your organization'srequirements to retain data for legal compliance reasons.
Use the indexcli utility if you want to purge data at a more granular level thanwhat you can configure on the Data Retention page on the Management Console.Purged data cannot be restored back at a later time.
Note: You can disable purging of access events information by enforcing a legalhold on shares and site collections.
See “About archiving data” on page 42.
See “Configuring data retention settings” on page 43.
Configuring data retention settingsData Insight enforces the data retention policy twice a month. Archived indexsegments can be restored using a command line indexcli.exe utility. The utilityis also useful to enforce a more granular archiving or purging policy, if the globaloption is not sufficient for your needs.
See indexcli.exe on page 424.
You can configure the duration for which you want Data Insight to retain varioustypes of data and the duration after which you want to purge data. Automaticarchiving and purging of data is not enabled by default.
To configure the data retention period
1 Click Settings > Data Retention.
2 On the Data Retention page, click Edit.
3 Enter the following information:
43Configuring Data Insight global settingsAbout archiving data

Use the Purge workflows data automaticallyoption to delete workflow records that are olderthan the configured age for purging to comply withyour organization's data retention policy.
Do the following:
1 Select the check box to enable automaticpurging of historical workflow records fromData Insight.
2 Enter the age of the workflow data that youwant to retain so that the workflow data olderthan that will be purged (deleted).
Note: This option is disabled by default to ensurethat workflow data is not deleted. When you enableit, the data for workflows which are in Completed,Canceled, Error, Failure, or Failed state is deleted.
Purge workflows dataautomatically
Use the setting to delete old copies of reports tofree up storage space on the Management Server.Unless you configure this global setting or the perreport setting to preserve only a certain number ofreports, Data Insight keeps unlimited copies ofreport outputs in its database.
Select one or both options:
■ Purge older report outputs if count exceeds- Enter a value that denotes the number ofreport outputs that you want to retain.
Note: The number of reports to be preservedis also specified when configuring reports. Thelocal setting for a report specified in theMaximum reports to preserve field takesprecedence over the global count-based settingconfigured here. If you have not configured anylocal setting then Data Insight uses the globalsetting.
■ Purge report data older than <number ofmonths> - Enter the duration (in months). Youcan choose to purge reports that are older thanthe configured time period.
Note: If both, the local and the global settings areconfigured, then the global time-based option takesprecedence for purging, and then the localcount-based setting is considered.
Purge report outputsautomatically
44Configuring Data Insight global settingsAbout archiving data

Do the following:
1 Select the check box to enable archiving offile system, SharePoint, or or cloud sourceevents.
2 Enter the age of the data (in months) afterwhich the data must be archived.
3 Enter the path of the archive folder.
In case, you want to archive access dataimmediately, execute the following command onthe Indexer node:
INSTALL_DIR/bin/configcli execute_jobDataRetentionJob
Archive access dataautomatically
Select the check box to enable purging of filesystem, SharePoint, or cloud source access events,and enter the age of the data (in months) afterwhich the data must be deleted.
Purge access data automatically
Select the check box to enable purging of DataInsight system events, and enter the age of thedata (in months) after which the data must bedeleted.
Data Insight system events are displayed on theSettings > Events page.
Purge Data Insight systemevents automatically
Select the check box to enable purging of alerts,and enter the age of the alerts (in months) afterwhich they must be deleted.
Purge alerts automatically
Select the check box to delete all classificationrequests completed before the specified numberof months.
Purge classification requests
Select the check box to enable purging of datapertaining to deleted shares. This option is enabledby default.
If you clear the check box, the index data for theshare or site collection remains on the disk untilthe global archive or purge takes place. Thus, ifyou decide to decommission a filer, or sitecollection, the data continues to be available forreporting.
Automatically purge data fordeleted shares or sitecollections
45Configuring Data Insight global settingsAbout archiving data

4 Click Save.
5 In case, you want to purge workflows or audit data immediately, execute thefollowing command on Management Server:
INSTALL_DIR/bin/configcli execute_job DataRetentionJob
About Data Insight integrationwith SymantecDataLoss Prevention (DLP)
Symantec Data Loss Prevention (DLP) helps you detect potential breach of sensitivedata from your environment. The DLP Network Discover Server scans files on yourNAS devices and generates incidents with details of the files that violate DLPpolicies.
Figure 2-2 Data Insight- DLP integration
ManagementServer
Data Insight
Enforce Server
Network DiscoverServer
DLP
Monitored Storage
Collector
Indexer
Data ownership, access, andpermission information
Data classificationinformation
Data ownership, access,and permission information
Data classificationinformation
Data Insight has a bi-directional integration with DLP. Based on your requirementyou can integrate the two products in any or both of the following ways:
■ Configure DLP in Data Insight:DLP provides Data Insight the information about sensitive files in a storageenvironment monitored by DLP. Data Insight uses this information to raise alerts
46Configuring Data Insight global settingsAbout Data Insight integration with Symantec Data Loss Prevention (DLP)

in response to configured DLP policies. Data Insight runs theDLPSensitiveFilesJob at 12:00 A.M. every night to retrieve a list of sensitivefiles from DLP.The information about sensitive files and DLP policies is used to calculate therisk-scores for storage resources and their users. The risk-scores and relatedinformation are displayed on the dashboard view of the Data Insight ManagementConsole. You can use this information to find the high-risk shares and the foldersthat violate important DLP policies. Additionally, you can use the informationfrom DLP to define DLP Incident Remediation workflow to take action on thefiles that violate certain DLP policies.See “About configuring Data Insight to integrate with Data Loss Prevention(DLP)” on page 47.
■ Configure Data Insight in DLP:Data Insight provides DLP ownership, access and permission-related information.DLP uses this information to generate folder risk reports and to display ownershipinformation against incidents.See “About Symantec Data Loss Prevention (DLP) integration with Data Insight”on page 51.
For a visual representation of the integration refer Figure 2-2
About configuring Data Insight to integrate with Data Loss Prevention(DLP)
To configure Data Insight to fetch sensitive files information from DLP, completethe following tasks:
■ Configure DLP settings from the Data Insight Management Console.See “Configuring Symantec Data Loss Prevention settings” on page 49.
■ Import the SSL certificate from the DLP Enforce Server to Data Insight.See “Importing SSL certificate from the DLP Enforce Server to Data InsightManagement Server” on page 50.
To view the complete workflow for setting up Data Insight to integrate with DLP,refer to Figure 2-3
47Configuring Data Insight global settingsAbout Data Insight integration with Symantec Data Loss Prevention (DLP)

Figure 2-3 Data Insight - DLP integration workflow
Five steps to integrate Data Insight with DLP
This user must have the role with the IncidentReporting and the Update API privileges.
When assigning a role to the user, select theDisplay Attribute: Location.
The user credentials must have access to DLPNetwork Discover scan data and the DLP SavedReport IDs.Refer to Symantec Data Loss PreventionAdministration Guide for details.
You can create a Saved Report from theIncidents tab of the Enforce ServerAdministration Console. For details, refer toSymantec Data Loss Prevention AdministrationGuide.To find the ID of a Saved Report, navigate tothe Incidents tab of the Enforce ServerAdministration Console. On the left hand panethat lists the Saved Reports, hover yourmouse pointer over the Saved Report name.
Refer to the section Configuring SymantecData Loss Prevention settings for details.
Refer to the section Importing SSL certificatefrom the DLP Enforce Server to Data InsightManagement Server for details.
Obtain the host name/IP address and port of theDLP Enforce server to be used by Data Insight toestablish communication.
You will need the account details in step 5.
Log in to the DLP Enforce Server AdministrationConsole using Administrator credentials.
Create a new user account in DLP so that DataInsight can use the credentials to access theEnforce Server.
Note down the following details of the new account:1. User name2. Password3. Domain name
You will need the server details in step 5.
Login to the DLP Enforce Server AdministrationConsole using the credentials you have created instep1.
Create Saved Report(s) to include classificationinformation of the data configured with DLP.Data Insight imports the data classificationinformation from DLP using these IDs.
Note the IDs of the report(s) you have created.
Import the SSL certificate from the DLP EnforceServer to Data Insight.
Configure DLP settings from the Data InsightManagement Console.
You will need the Saved Report IDs in step 5.
2
1
3
4
5To configure the settings use the informationfrom steps 1, 2, and 3.
48Configuring Data Insight global settingsAbout Data Insight integration with Symantec Data Loss Prevention (DLP)

Configuring Symantec Data Loss Prevention settingsYou must configure the settings that allow Data Insight to communicate withSymantec Data Loss Prevention.
To configure Data Loss Prevention settings
1 In the Management Console, click Settings > Data Loss Prevention.
2 Click Edit, and enter the following details:
■ Hostname /IP address of DLP ServerThe host name or IP address of the DLP Enforce Server. DLP host namesare case-sensitive.
■ PortThe port through which Data Insight connects to the DLP Enforce Server.The default port number is 443.
■ UsernameThe user name of the account that is used to access the DLP EnforceServer. DLP user names are case-sensitive.
Note: Ensure that the credentials belong to an existing DLP user assignedthe Incident Reporting and Update API role. Also ensure that when assigninga role to the user, the Display Attribute Location is selected. This attributeallows Data Insight to view the complete path of a file.
The user credential being used must have access to DLP Network Discoverscan data and DLP Saved Report IDs.
■ PasswordThe password of the account that is used to access the DLP Enforce Server.
■ DomainThe name of the domain to which the user belongs. DLP domains arecase-sensitive. Specifying the domain is optional for a user who is a DLPadministrator.
■ DLP RoleSpecify the role you want to use to log on to DLP. DLP roles arecase-sensitive.Users who are assigned more than one role can only log on under one roleat a time.
■ Configure storage resources automaticallyBy default, Data Insight discards classification information for paths onstorage devices that it does not monitor. Select this option to add the
49Configuring Data Insight global settingsAbout Data Insight integration with Symantec Data Loss Prevention (DLP)

unmonitored devices as generic devices in Data Insight and includeclassification information for all paths on those devices. Note that only dataclassification information is available for the paths. To enable Data Insightto get audit and metadata information for the paths, you must manuallyconfigure the devices in Data Insight.
■ Saved Report IDsEnter a comma-separated list of Saved Report IDs in DLP.Data Insight fetches classification information for all the paths present inthe DLP Saved Report. Data Insight uses the DLP Reporting API Webservice to request a list of incident IDs by specifying a saved report ID. AData Insight process then fetches the sensitive files corresponding to theincident IDs.
3 Click Test Connection to verify the connection to the DLP Enforce Server.
4 Click Save to save the settings.
See “Importing SSL certificate from the DLP Enforce Server to Data InsightManagement Server” on page 50.
Importing SSL certificate from the DLP Enforce Server to Data InsightManagement Server
The DLP Enforce Server administration console requires SSL transport for allcommunication. Data Insight must be able to negotiate the SSL connection withthe Enforce Server. For this purpose, you must import the certificate to the keystoreused by Data Insight.
To import the SSL certificate from the DLP Enforce Server to Data Insightusing Firefox
1 Type the URL to connect to a DLP Enforce Server Administration console.
2 On the security certificate warning page, click I understand the risks.
3 Click Add Exception.
4 On the Add Security Exception page, click View to view the certificate details.
5 Click the Details tab and click Export.
6 From the Save as type drop-down, select X.509 Certificate (DER).
7 Click Save.
50Configuring Data Insight global settingsAbout Data Insight integration with Symantec Data Loss Prevention (DLP)

To import the SSL certificate from the DLP Enforce Server to Data Insightusing Internet Explorer
1 Type the URL to connect to a DLP Enforce Server Administration console.
2 On the security certificate warning page, clickCertificate Error next to addressbar.
3 Select View certificates.
4 Click the Details tab, and select the appropriate certificate.
5 Click Copy to File
6 In the Certificate Export Wizard, select DER encoded binary.
7 Click Next.
8 Enter the name of the file and browse to the location where you want to savethe file.
9 Click Next
10 Click Finish to save the file.
After the SSL certificate is imported, complete the following steps to import the SSLcertificate on the Data Insight server.
To import the SSL certificate on the Data Insight server
1 From the Windows Start menu, select Run and type cmd in the dialog box toopen a command prompt window.
2 Run the following command:
cd C:\Program Files\DataInsight\jre\bin
.\keytool -importcert -alias dlp -keystore c:\
DataInsight\data\keys\commd.keystore -trustcacerts -file <file
path of SSL certificate>
Specify changeit as the password for the keystore.
You can now pull a list of sensitive files from Symantec Data Loss Prevention(DLP).
See “Configuring Symantec Data Loss Prevention settings” on page 49.
About Symantec Data Loss Prevention (DLP) integration with DataInsight
Complete the following tasks in DLP to configure DLP to pull access data from DataInsight:
51Configuring Data Insight global settingsAbout Data Insight integration with Symantec Data Loss Prevention (DLP)

■ Configure a connection between the DLP Enforce Server and Data Insight.
■ Configure the Data Insight Lookup Plug-in to retrieve data owner information.
■ Configure other lookup plug-ins to populate the Data Owner email field in DataInsight.Refer to the Symantec™ Data Loss Prevention Administration Guide for detailson configuring these plug-ins.
■ On the Enforce Server, create custom attributes for each file detail that you wantretrieved from the Data Insight Management Server.
■ Map the custom attributes that you have created to the details from the DataInsight Management Server.
■ Restart the DLP Enforce services.
The steps mentioned in this section are applicable for DLP users who want to pulldata ownership, permissions and access information from Data Insight. For thedetailed steps, see the Data Loss Prevention Data Insight Implementation Guide.
See “About Data Insight integration with Symantec Data Loss Prevention (DLP)”on page 46.
Importing sensitive files information through CSVData Insight pulls information about sensitive files in your storage environment fromSymantec™ Data Loss Prevention (DLP).
However, if you use a third-party application other than DLP, Data Insight providesyou the ability to identify sensitive files in your storage environment using a .csvfile. A scheduled Data Insight process reads the .csv file to retrieve the list ofsensitive files from Data Insight.
52Configuring Data Insight global settingsImporting sensitive files information through CSV

To use a .csv file to classify sensitive files in Data Insight
1 Log in to the Data Insight Management Server.
2 Create a .csv file, in which each line indicates the path of the sensitive file, andpolicy names which that particular file violates.
The format for each file that has one or more policy violations is:
\\path\to\file\filename.ext, policy1, policy2...
For example, you have a file \\foo\bar\info.txt which violates the policiesPersonal Information andHipaa. And another file \\foo\ssn.pdfwhich violatesthe policy Personal Information. Another Windows share based file violatesanother policy called any-policy. In this case, create a .csv file as follows:
\\foo\bar\info.txt, Personal Information, Hipaa
\\foo\ssn.pdf, Personal Information
\\svr\sharedir\Employees.doc, any-policy
3 Edit the <datadir>\conf\dlp_db.conf file to add the following lines:
dlp.csv.enabled=true
external.file.path=<path and filename of the .csv file on
Management Server>
Note: The path to the .csv file has double "\" in the path.
For example,external.file.path=d:\\DataInsight\\DLPCSV\\sensitive_files.csv
Where senstive_files.csv is the list of sensitive files collected by thethird-party tool.
Note: If the dlp.csv.enabled property is set to true in the dlp_db.conf file, theData Insight process uses the .csv file to identify sensitive files, even if DLP isconfigured in Data Insight.
Configuring advanced analyticsData Insight provides several advanced data analytics features in the form ofDashboard reports and Social Network Map. These features let you make intelligentdecisions about your data.
Use theAdvanced Analytics Configuration page to configure the following criteria:
53Configuring Data Insight global settingsConfiguring advanced analytics

■ The period for which the activity information should be considered to calculatethe device and share statistics. This period is also considered for analyzingcollaborative activity on a share when displaying Social Network Map, and forgenerating data displayed on the Workspace views.
■ The depth of the folder hierarchy with respect to the root of the share that mustbe evaluated to compute the control points within a share. The default folderdepth for computing control points within a share is 5. This means that by defaultData Insight evaluates the folder hierarchy 5 levels deep to calculate the controlpoints within a share.Data Insight displays the information about control points on the Workspace >Data Sources view of the Management Console.
■ The interval for refreshing the data that is displayed Workspace > Dashboardview of the Management Console.You must ensure that you decide the frequency of refreshing the data judiciously,because the statistics are calculated for all the configured devices, shares, andsite collections.
Note: The Data Insight dashboard does not display any data, if a summaryreport has not run even once.
The page also displays information about refresh cycles that have failed. Clickon the Failed link to download the logs that you can use to troubleshoot thecause for failure.
To configure advanced analytics
1 In the Management Console, click Settings > Advanced Analytics. Theexisting analytics settings display by default.
2 Click Edit to change the appropriate settings.
3 Click Save to save the changes.
4 Click Compute Now to refresh the data on the Data Insight dashboard.
See “About open shares” on page 55.
Choosing custom attributes for advanced analyticsData Insight lets you configure the custom attributes that you can use for the purposeof advanced analytics, reporting, and remediation.
See “Configuring attributes for advanced analytics” on page 126.
54Configuring Data Insight global settingsConfiguring advanced analytics

The configured attributes are available for selection on the Advanced AnalyticsManager. Use this page to mark the attributes that you want to consider for analyticsand for grouping of users based on the primary attribute.
The primary attribute is used to best identify users in the Social Network Map clustergroups. It is also used to distinctly categorize the users in the cluster groups. Ensurethat the attribute that you choose as the primary attribute is the one that is populatedfor the majority of the users in your directory service. For example, good choicesfor primary attribute would be department or cost code. Attributes such as, employeeID or title are different for each user, and should ideally not be used as the primaryattribute.
To choose attributes for advanced analytics
1 On the Settings tab, click Advanced Analytics.
2 Click Attributes to display the Advanced Analytics Manager.
The Available Attributes panel displays all the configured custom attributes.
3 Select an attribute, and click the right arrow to select an attribute. Similarly,you can click the left arrow to remove an attribute from the list of selectedattributes.
4 Use the up and down arrows to set the priority of the attributes for computingthe analytics data.
5 From the Primary grouping attribute drop-down, select the attribute that youwant to use as the primary attribute for identifying users and for creatingattribute-based filters.
About open sharesA share is considered to be open due to the permissions assigned on it. You candefine the parameters that determine whether a share should be considered asopen. However, the open share policy does not allow you to define specificpermissions that render a share open.
One of the following parameters determine whether a share is open:
■ If certain group has access to a share, either directly or as a nested group.
■ If more than a certain number of users have access to the share.
Additionally, you can also specify granular criteria for examination, such as:
■ The level at which Data Insight should start examining the paths.
■ The number of levels deep to examine the path permissions.
For example, you can define the following criteria to consider a share to be open:
55Configuring Data Insight global settingsAbout open shares

■ List of groups: Domain Users or Everyone.
■ No of users who have access to the share: 500.
■ Level to start examining permissions: 1.
■ Depth to examine: 3.
According to the above specification, any share that is accessed by the DomainUsers/Everyone group or by more than 500 users is considered to be open. Forthis purpose, the ACLs are examined from level 1 (root being level 0), and all foldersthree levels down are examined.
Defining an open share policy helps you to review the permissions assigned atshare level and revisit entitlement decisions. You can view the details of the openshares, the size of the data in open shares, and the number of files in open shareson the Dashboard tab on the Management Console.
Note: Data Insight does not fetch permissions for SharePoint Online, MicrosoftOneDrive, and Documentum data sources. Thus, reporting of open shares on thesedata sources is not supported.
See “Configuring an open share policy” on page 56.
Configuring an open share policyYou can define the parameters for an open share on the Open Share Policy pageof the Management Console. The paths on a storage device that meet the criteriaspecified in the policy are considered as open.
See “About open shares” on page 55.
To configure an open share policy
1 Click Settings > Advanced Analytics. The Configuration page opens bydefault.
2 Click the Open Share Policy sub-tab.
The page displays the existing policy that defines the parameters that determinewhether a share is open.
3 To change the existing policy, click Edit.
4 Enter the criteria for considering a share to be open:
■ Enter the threshold for users that have access to the share. Or select theuser(s) or group(s) that have access to the share. You can choose to selectboth conditions simultaneously.
56Configuring Data Insight global settingsAbout open shares

■ You can choose to specify the users and groups that have permissions onthe share. Use the users and groups selection widget or upload a .csv filewith the users and groups information. The selected entities are listed inthe Selected Users/Groups pane.You can type a name in the search bar to search for a user or group. Youcan also type a domain name in the Domain Filter field to narrow yoursearch to users in a specific domain. You can also filter a user or groupfrom the Select Filter drop-down. Select the All Filtered Users check boxin the Selected Users/Group pane to include all filtered users in the policydefinition.All the configured users and groups are displayed on the open share policydefinition page.
5 Use the Up and Down arrows to define the level in the share hierarchy that thepolicy should be applied. You can also examine the depth starting from level0, that is the root of the share.
6 The depth in terms of number of levels of the folder heirarchy for which thepermissions should be examined.
7 Click Save to save the policy and close the window.
You can use the report.exe utility to exclude certain paths from the open sharecomputation for the dashboard.
See reportcli.exe on page 430.
Configuring file groupsBy default, Data Insight sorts files into 18 file groups based on the extension of thefiles. The file group information is used for reporting on ownership, access pattern,and space consumption on storage devices. Data Insight uses file group informationwhen generating the following reports:
■ Inactive Data by File Group
■ Consumption by File Group
■ Consumption by File Group and Owner
You can modify the default file groups by adding custom extensions or by deletingextensions from the file groups. You can also create new file groups in File Groupsview from the Management Console or use the fg.exe command from the commandline interface. When a new extension is added, all indexes update their extensioninformation. This process can take several hours depending on size of your indexes.Thus, new extensions will not show in your report output till all indexes have beenupdated.
57Configuring Data Insight global settingsConfiguring file groups

You can issue fthe ollowing command on your Indexer nodes to monitor the statusof updating the indexes:
indexcli -j
You can search for extensions and file groups by using the filter at the top rightcorner of the screen.
For detailed information on fg.exe, see the Command File Reference.
To configure file groups
1 In the Management Console, click Settings > File Groups.
2 To add a new file group, click Add new file group.
3 Enter a logical name for the file group.
4 In the Extension field, enter the extension that you want to include in the filegroup.
5 Click Add Extension.
You can add multiple file extensions to a single file group.
6 To modify an existing file group, click the file group.
7 Click the delete icon corresponding to the extension you want to remove, orenter the extension that you want to include in the file group, and click AddExtension.
8 To delete an entire file group, click the corresponding delete icon.
Configuring Workspace data owner policyBy default, Data Insight infers owners of files or folders based on the access history.The most active user of a file is considered to be the data owner for the purposeof efficient remediation and data management. The Workspace data owner policyis used to infer the probable owner when configuring workflows and reports.
However, you can define a global policy to infer the owners of files or folders basedon one of the following criteria:
■ The number of read events on the file or folder.
■ The number of write events on the file or folder.
■ The cumulative count of all activities except for the permission change eventson the file or folder.
■ The creator of the file or folder.
■ The user account which last accessed the file or folder.
58Configuring Data Insight global settingsConfiguring Workspace data owner policy

■ The user account which last modified the file or folder.
■ Owner of the parent folder.If Data Insight is not able compute the owner on the basis of read, write, lastaccessed, last modified, or create events, the owner of the immediate parentfolder is displayed as the owner of the file or folder.
For example, you can define a policy to consider the count of read and write eventson a file to determine the data owner. In this case, the user with the most read andwrite accesses is considered to be the data owner.
The criteria that is defined in the global Workspace data owner policy are alsoconsidered for determining the data owner when you configure reports andworkflows. However, you can choose to override the policy when you create anInferred Data Owner report.
For information about configuring workflows and reports, see the Veritas DataInsight User's Guide.
To configure a Workspace data owner policy
1 In the Management Console, click Settings >Workspace Data Owner Policy.
2 The Data Owner Policy details page displays the current policy.
3 Use the up and down arrow keys to arrange the criteria in the preferred order.
Data Insight serially evaluates the criteria in the list to compute the data owner.
4 Select the check boxes to exclude the following types of users when DataInsight calculates the data owner:
■ Disabled users - These are the users whose accounts are disabled in thedirectory service, but are still present in the Data Insight configuration.
■ Deleted users - These are the users whose accounts are removed fromthe directory service.Accounts of users are typically disabled or deleted in the directory servicewhen a user leaves an organization.
■ Unresolved SIDs - These are accounts for which the corresponding userinformation is missing in the directory service.
For example, you define a policy that considers the number of write events ona file to compute the data owner. If the user account with the most write eventson a particular file is either deleted or disabled, Data Insight excludes suchuser from the data owner computation. It then considers the next criteria in thelist to determine the owner of the file.
59Configuring Data Insight global settingsConfiguring Workspace data owner policy

5 Select the groups or users that you want to exclude from the scope of thepolicy. Double-click the group or user to select it. The selected data set is listedin the Exclusion List pane.
Use the Domain Filter drop-down to search for specific users, users in aparticular domain, built-in user accounts, and SIDs that have been migratedto another domain.
6 Click Save.
Configuring Management Console settingsIn the Console Settings view, you can configure global settings that apply to varioustasks that you carry out on the Management Console.
To configure the Console settings
1 Click Settings > Console Settings.
2 Click Edit.
You can edit any of the following settings:
Your login session on the ManagementConsole times out after certain period ofinactivity. The default timeout period is onehour.
To configure the session timeout period,enter the time in minutes.
Session Timeout
You can choose to add a footer to all thereports that you run in the Console. Enterthe sentence string that you want to appearin the footer of the report. For example,Proprietary and Confidential.
Report Footer Text
3 Click Save.
For more information about creating reports, see the Veritas Data Insight User'sGuide.
About bulk assignment of custodiansData Insight uses the information about data custodians to distribute remediationrequests and reports. The custodians are responsible for taking action on the data
60Configuring Data Insight global settingsConfiguring Management Console settings

assigned to them. To know more about the Data Insight custodians, you can referto the Veritas Data Insight User's Guide.
You can assign custodians to a data resource from the Workspace tab. However,assigning custodians on a path at a time can be tedious and time-consuming. Youcan use the Custodian Manager to easily assign multiple custodians using only afew steps.
You can bulk-assign custodians by using any of the two options:
■ Assign by CSV – You can use a CSV file that contains the information aboutthe paths and their respective custodians for to assign custodians on paths.See “Assigning custodians in bulk using a CSV file” on page 61.
■ Assign by owner method – You can specify the criteria for computing thepossible owner of the selected paths, and assign the computed owners as thecustodians.See “Assigning custodians based on data ownership” on page 62.
Assigning custodians in bulk using a CSV fileTo assign custodians by using a CSV file
1 Prepare a .csv file containing the following details separated by a comma:
■ Paths for which a custodian is to be assigned.For example: \\30.219.81.23\Managers\Reportees\
■ Custodian to be assigned to that path.To specify a custodian, you can use the user name along with the domainname. For example: Custodian_name@domain_name. Alternatively, youcan specify the SID of the user.
2 On the Data Insight Management Console, navigate to Settings > GlobalSettings > Custodian Manager.
3 From the drop-down menu, select Assign by CSV.
4 Click Choose File.
5 Browse to the location where you have saved the CSV file. Select the CSV fileand click Open.
6 Click Assign.
Note: The custodian assignment in Data Insight can take some time depending onthe number of paths. You can view the status of the operation on the Settings >Events page of the Management Console.
61Configuring Data Insight global settingsAbout bulk assignment of custodians

See “About bulk assignment of custodians” on page 60.
Assigning custodians based on data ownershipData Insight computes the possible owners for any path based on parameters suchas read counts, write counts, last modifiers, last accessors, creators etc. Based onyour requirements, you can select any of these parameters and assign them prioritiesfor ownership computation. For computing the owner, Data Insight by defaultconsiders the activity period configured on the Advanced Analytics page.
To assign custodians in bulk based on data ownership
1 From the Data Insight Management Console, navigate toSettings >CustodianManager.
2 From the drop-down menu, select Assign by owner method. The paneexpands to display the Custodian Selection Criteria panel.
3 Note that the Use default data owner policy check box is selected by default.Do any of the following:
■ Click the Use default data owner policy check box to let Data Insight usethe data owner policy and exclusion rules as defined under theWorkspaceData Owner Policy setting.
■ Clear the Use default data owner policy check box to define your ownset of criteria to calculate the data owner. Use the right arrows and the leftarrows to select or deselect a criterion. Use the up arrow and the downarrow to change the priority of the criteria.
Note:When you clear theUse default data owner policy check box, DataInsight still enforces the exclusion rules for deleted, disabled, and unresolvedusers as defined under the Workspace Data Owner Policy setting.
See “Configuring Workspace data owner policy” on page 58.
4 From the Paths panel, select the paths for which you want to assign custodians.The selected paths are displayed under the Selected resources tab.
5 Click Assign to complete the request.
Note: The custodian assignment in Data Insight can take some time depending onthe number of paths. You can view the status of the operation from the Settings>Events page of the Management Console.
See “About bulk assignment of custodians” on page 60.
62Configuring Data Insight global settingsAbout bulk assignment of custodians

Configuring Watchlist settingsData Insight lets you add users and groups to a watchlist. You can add such usersor groups to the watchlist that you want to monitor closely for one of the followingreasons:
■ A long-serving employee who is leaving the organization.
■ A user or group who has access to a number of content repositories that storesensitive data.
■ An outlier that is suggested by the Social Network Map.
You can review the risk score assigned to a user and track the activities of the useror group that is added to a watchlist from the Data Insight dashboard.
For information about the Data Insight dashboard, see the Veritas Data InsightUser's Guide.
To add a user or group to a watchlist
1 From the Management Console, navigate to Settings > Watchlist Settings.The Configure Watchlist page opens.
2 You can add the users or groups to a watchlist in one of the following ways:
You can use the domain filter search bar to filter users or groups according todomains.
■ Under the User Selection tab, click either the Users or the Groups radiobuttons to view the configured users or groups respectively. Click a useror a group to select it.Alternatively, you can upload the users and groups information through aCSV file. Click Upload CSV.
■ Under the User Inclusion Using Attributes tab, click Add Condition.From each of the drop-down menu, select the criteria to build the query.The query is used to select users based on their Active Directory attributes.You can add multiple conditions to select users. Data Insight evaluates aquery as follows:
■ Data Insight uses the logical OR operation for same attribute conditionwith different values.
■ It uses the logical AND operation between multiple attribute conditions.
3 Similarly, you can exclude specific users from a watchlist in the following ways:
■ Under Exclusion list tab, select the users or groups that you want toexclude from the watchlist.Or click Upload CSV to upload a list of users or groups in bulk.
63Configuring Data Insight global settingsConfiguring Watchlist settings

■ Under the User Exclusion Using Attributes tab, click Add Condition.From each of the drop-down menu, select the criteria to build the query.The query is used to exclude users based on their Active Directory customattributes.
4 Click Save.
64Configuring Data Insight global settingsConfiguring Watchlist settings

Configuring Data Insight
■ Chapter 3. Configuring Data Insight product users
■ Chapter 4. Configuring Data Insight product servers
■ Chapter 5. Configuring saved credentials
■ Chapter 6. Configuring directory service domains
■ Chapter 7. Configuring containers
2Section

Configuring Data Insightproduct users
This chapter includes the following topics:
■ About Data Insight users and roles
■ Reviewing current users and privileges
■ Adding a user
■ Editing users
■ Deleting users
■ Configuring authorization for Symantec Data Loss Prevention users
About Data Insight users and rolesBefore a user can log in to Veritas Data Insight, you must add an account for thatuser. The user can then use that account to log in to the Console. The user accountcan be any account that is valid on the Management Server system. This includeslocal system accounts as well as users belonging to the domain which theManagement Server is a part of.
When you create an user account, a role (set of access privileges) is associatedwith the account. Roles specify access privileges to the Veritas Data Insight system.For example, a role might let users view access and permissions data, but preventthem from adding or deleting filers. Data Insight role-based access control governsaccess to product features and functionality. Roles consist of the user privilegesthat determine what a user can see and do in the Management Console.
The Data Insight administrator (a user mapped to the predefined ServerAdministrator role) and a user with a User Administrator role assign roles to other
3Chapter

users. Users can be mapped to one role only. Data Insight ships with predefinedroles that you can assign to user accounts.
Table 3-1 summarizes the various Data Insight roles.
Table 3-1 Veritas Data Insight roles
DescriptionRole name
Allows the user to perform all actions in the product GUI thatincludes setting up all infrastructure (including devices, users, andothers) and view all the access and permissions data.
Server Administrator
Allows the users to manage filer settings and optionally to view allthe access and permissions data for the given filers. Productadministrator role, configured for a selected set of filers/webapplications, is not allowed to add new filers or delete configuredfilers.
Product Administrator
Allows the user to view and edit all reports that are configured inthe system and all data on the Workspace tab. Additionally, theReport Administrator may or may not be configured to take postprocessing actions on a report output.
A Report Administrator does not have access to the Settings tab.
Report Administrator
This role has access to all sub-tabs of the Workflows tab, butdoes not have access to the Settings tab.
The role allows the user to do the following tasks:
■ Configure the Self-Service Portal settings.■ View, create, edit, copy, and delete all workflow templates.■ Create workflows for paths
The Workflow Administrator has access to all configured datasources, DFS paths, and containers and can select them tocreate workflows.
■ View and manage (edit, submit, and delete) workflows createdby Server Administrator or other workflow administrators.
■ Take remediation action (archive or remove permissions) onworkflows created by all workflow administrators.However, the workflow administrators cannot view the statusof the remediation actions triggered from the Workflows >Audit tab.
■ Log in as custodian into the Self-Service Portal to take thenecessary actions.
Workflow Administrator
67Configuring Data Insight product usersAbout Data Insight users and roles

Table 3-1 Veritas Data Insight roles (continued)
DescriptionRole name
Allows the user to assign roles and manage the permissions tothe user accounts.
The User Administrator can create new Data Insight users, deleteusers, and manage the scope of their permissions.
The user assigned the User Administrator role only has access tothe Settings > Data Insight Users screens. The UserAdministrator does not have access to any other parts of theconsole.
User Administrator
Allows the users to view all permissions data. However, user inthis role may or may not be allowed to view activity data of otherusers and certain reports.
See “Add or edit Data Insight user options ” on page 69.
Users assigned this role also do not have access to any tasks onthe Settings tab.
The User Administrator can manage all users created by the ServerAdministrator and other user administrators.
User
Allows the users to view storage-related data in the Workspacetab, but does not allow them to view permissions data or auditlogs. Users in this role do not have access to the Settings tab.
Storage User
Note: Only a Server Administrator or a User Administrator can add a user with theReport Administrator, Workflow Administrator, or User Administrator role.
Reviewing current users and privilegesYou can review the current Data Insight users and the roles assigned to them onthe Product Users list page. On this page you can also review the filers and webapplications that these users are allowed to monitor.
To review current users and privileges
1 In the Console, double-click Settings > Product Users.
The following information is displayed:
■ The name of the user.
■ The role assigned to the user.
68Configuring Data Insight product usersReviewing current users and privileges

■ The scope of the access available to the user.
■ The time when the user last logged into Data Insight.
2 Click the Export icon at the bottom of the page to save the data to a .csv file.
Adding a userThis section describes how to add users to Veritas Data Insight. To add new DataInsight users, you must be logged in as Server Administrator or a User Administrator.
To add new a Data Insight user
1 In the Console, click Settings > Data Insight Users to display the ProductUsers listing page.
2 Click Add New Data Insight User.
3 On the Configure new product user page, enter the user properties, click AddNew Data Insight User.
Add or edit Data Insight user optionsUse this dialog box to add a new user to Data Insight, or edit the properties of anexisting user.
Table 3-2 Add/Edit Data Insight user options
DescriptionField
Enter the user name for the user.User name
Enter the name of the domain to which the user belongs.Domain name
From the drop-down, select the role you want to assignthe user.
See “About Data Insight users and roles” on page 66.
Role
Select the check box to enable the user to view thescreens on the Workspace and the Reports tabs
This option is only available if the user is assigned theProduct Administrator role.
Allow access to Workspace data
69Configuring Data Insight product usersAdding a user

Table 3-2 Add/Edit Data Insight user options (continued)
DescriptionField
Select one of the following:
■ All filers/Web applications (Includes the onesadded in the future)
■ Selected Filers/Web applications■ Selected Shares/Site Collections■ Selected DFS paths■ Containers
If you selectSelected filers/WebApplications ,SelectedShares/Site Collections, Selected DFS paths, orContainers , the system displays a list of the appropriateconfigured entity. Use the arrows to select the entities youwant the user to monitor.
Note: A user, assigned the Server Administrator role,has the scope set to All Filers/Web Applications, bydefault. The scope by DFS paths is applicable only forUser and Storage User roles.
Resources/Containers to grantaccess to
Select the check box to enable the user to takeremediation actions on the report output. If the user isrestricted access to the Remediation tab during reportsconfiguration, the user cannot execute remediation actionswhen the report is run. Also, if a role restricts the userfrom taking remediation actions, the actions are notexecuted even if such user runs a report created by a userwho is allowed to take remediation actions on a reportoutput.
This option is only available if the user is assigned theReport Administrator role.
To know more about post-processing action refer VeritasData Insight User's Guide.
Allowed to remediate data andpermissions
70Configuring Data Insight product usersAdding a user

Table 3-2 Add/Edit Data Insight user options (continued)
DescriptionField
This option lets you restrict the user's access to activityviews and certain reports. Select the check box to enablethe user to view access information of other users. If thecheck box is cleared, the following tabs and views will notbe accessible to the user:
■ For a path, the Permissions, User Activity, AuditLogs, and Social Network Analysis tabs.
■ For a user, the Permissions, Activity, and AuditLogs tabs.
■ The Activity view on the Dashboard and List viewsof the Workspace tab.
■ The report categories -Access Details Reports,Ownership Reports, Custom Reports.
■ All Consumption reports, except Consumption byFolder, Data Aging, Inactive Data by Owner, InactiveUsers, Entitlement Review, Group Change Analysis,and Consumption by File Group and Owner.
Allowed to view activity data
Editing usersAfter you add a user to Data Insight, you can edit the user properties. For example,you might need to edit any of the following:
■ The role assigned to the user
■ The view option for the user
■ The filers and/or web applications that the user is allowed to monitor
Note: To add new Data Insight users, you must be logged in as Server Administratoror a User Administrator.
To edit the properties of a user
1 In the Console, double-click Settings > Data Insight Users to display theProduct Users listing page.
2 Click the Edit button for the corresponding user.
3 On the Edit Data Insight user page, make changes. as necessary, and clickSave.
See “About Data Insight users and roles” on page 66.
71Configuring Data Insight product usersEditing users

Deleting usersYou can delete Data Insight users.
To delete an user
1 In the Console, double-click Settings > Data Insight Users to display theProduct Users listing page.
2 Select the user, and click Delete.
3 Click OK on the confirmation message.
Configuring authorization for Symantec Data LossPrevention users
Symantec Data Loss Prevention makes web service calls into Data Insight to obtainownership information for sensitive files and folders. However, you must firstprovision a Data Insight account for Symantec Data Loss Prevention in Data Insight.
You can provision a Active Directory service account OR a local system accountand assign it the Server Administrator privilege. Symantec Data Loss Preventioncan use this account to access Data Insight data.
72Configuring Data Insight product usersDeleting users

Configuring Data Insightproduct servers
This chapter includes the following topics:
■ About Data Insight product servers
■ Adding a new Data Insight server
■ Managing Data Insight product servers
■ Viewing Data Insight server details
■ About node templates
■ Adding Portal role to a Data Insight server
■ Adding Classification Server role to a Data Insight server
■ Assigning Classification Server to a Collector
■ Associating a Classification Server pool to a Collector
■ Viewing in-progress scans
■ Configuring Data Insight services
■ Configuring advanced settings
■ Monitoring Data Insight jobs
■ Rotating the encryption keys
■ Viewing Data Insight server statistics
■ About automated alerts for patches and upgrades
4Chapter

■ Deploying upgrades and patches remotely
■ Using the Upload Manager utility
■ About migrating storage devices across Indexers
■ Viewing the status of a remote installation
About Data Insight product serversA Data Insight product server is any server which has Data Insight software installed.This includes the Management Server, zero or more Collectors, zero or moreIndexers, and zero or more Windows File Server agents.
For more information about the Data Insight servers, see the Veritas Data InsightInstallation Guide.
You can view information about configured product servers, check the status ofrunning scans, and change advanced settings from the Settings tab of theManagement Console.
Adding a new Data Insight serverYou can add a new Data Insight from the Management Console.
To add a Data Insight server
1 In the Console, click Settings > Data Insight Servers to display list ofconfigured product servers.
2 Click Add new server.
3 On the Add New Server page, enter the following details:
■ The host name or IP address of the server.
■ Select a credential from the Select Saved Credential drop-down. Thecredential must belong to a user with Administrator privileges on the nodewhere the software needs to be installed.See “Managing saved credentials ” on page 115.
■ The location where you want to store the product data. Select a locationwith enough free space and high-performance disks. By default the datadirectory is located at C:\DataInsight\data.
■ The directory in which you want Data Insight to be installed. By default, thedestination directory is C:\Program Files\DataInsight.
74Configuring Data Insight product serversAbout Data Insight product servers

■ Depending on your deployment scenario, select Collector only or Indexerand Collector, Self-Service Portal, or Classification Server as theinstallation option.
■ TheCommunication Service Port. By default, the Communication Serviceconnects through service port 8383.
■ The Configuration Service Port. By default, the Configuration Serviceconnects through service port 8282.
■ If you to install the Self-Service Portal, enter the port numbers for theSelf-Service Portal service and the Workflow service. By default the portnumbers are 443 for the Portal Webserver Port and 8686 for theWorkflowService Port.
4 Click Install.
You can view the progress and status of the installation on the Installation Statuspage.
See “Viewing the status of a remote installation” on page 113.
See “Configuring Data Insight services” on page 86.
Managing Data Insight product serversOn the Data Insight servers listing page you can do following tasks:
■ View detailed information about all configured servers.
■ Add a new Data Insight server.See “Adding a new Data Insight server” on page 74.
■ Add the Portal role to the existing Management Server or an existing Collectornode.See “Adding Portal role to a Data Insight server” on page 81.
■ Adding the Classification role to the existing Management Server or Collectornode.See “Adding Classification Server role to a Data Insight server” on page 82.
■ Get a list of currently running scans.See “Viewing in-progress scans” on page 85.
■ Edit the server's configuration.
■ Apply a node template.
■ View and install recommended patches for a server node.See “Viewing and installing recommended upgrades and patches” on page 109.
75Configuring Data Insight product serversManaging Data Insight product servers

■ Remotely upgrade and push-install rolling patches on Collector and Windowsfile server agent nodes.See “Deploying upgrades and patches remotely” on page 110.
■ Run a specific Data Insight process.See “Monitoring Data Insight jobs” on page 106.
■ Delete the server.
Use the filter on the left to filter the list of servers based on the health of the serveror role of the server. You can also search for a server by entering the name or IPaddress of the server in the Filter text box. The displayed list of servers changesautomatically as you enter the term in the Filter text box or when you select thecheck boxes. For example, you can search for all Healthy servers that are assignedthe Collector role. Data Insight displays all the Collectors in your environment thatare in the Healthy state.
The following parameters determine the health of a Data Insight server:
■ Whether a node is online.
■ Whether all the required services are running on a node.
■ The disk space on the server.
■ Whether the node has error files in the err folder.
■ CPU and Memory usage on the server
The health of a server is not known for five minutes after starting theDataInsightWatchdog service, or if the DataInsightWatchdog service is stopped.
The Servers pie chart on the System Overview dashboard gives a high-leveloverview of the number of Data Insight severs in Faulted, at Risk, and Healthy state.
See “Viewing the system health overview” on page 346.
To view configured product servers
1 In the Console, click Settings > Data Insight Servers to display list ofconfigured product servers.
2 Use the provided dynamic search filter to search for configured servers basedon the name of the server.
3 Review the following information about the servers:
■ The ID of the server.
■ The name of the server.
■ The role of the server.
76Configuring Data Insight product serversManaging Data Insight product servers

■ In case of a node with the role Management Server, Collector, or Collectorand Indexer, the Classification Server assigned to the node.
■ The status of the server — whether the server is online or offline.
■ A list of matching templates for this server.
■ The version of the Data Insight software that is installed on the server.
■ The credentials used to install the server.
■ The links to recommended patches and hot fixes.
Data Insight also displays the recommendation to upgrade to the latest version, ifavailable.
To view server events
1 In the Console, click Settings > Data Insight Servers.
2 Click the Select Action drop-down for the corresponding server in the serverslisting table, and select Event Log.
Or, on the details page for a server, click Event Log.
The event log for that server appears.
You can create a node template to change one or few settings on multiple nodes.Using node templates is useful when multiple nodes need to inherit the samesettings, for example, more number of indexer threads for all indexers in yourenvironment.
See “Managing node templates” on page 79.
To apply a template to a Data Insight node
1 In the Console, click Settings > Data Insight Servers.
2 Select the server to which you want to apply a template, and from the Applya node template drop-down, select a configured template.
3 Click Yes to confirm.
To delete a server
1 In the Console, click Settings > Data Insight Servers.
2 Click the Select Action drop-down for the corresponding server in the serverslisting table, and select Delete.
Note: Data Insight does not allow you to delete a server if it is associated with astorage device.
See “About automated alerts for patches and upgrades” on page 109.
77Configuring Data Insight product serversManaging Data Insight product servers

See “Configuring advanced settings” on page 88.
Viewing Data Insight server detailsYou can view server details on the Overview tab and perform various tasks, suchas, changing th eadvanced settings, monitor in-progress scans, view server statistics,and check event logs for the server.
To review server details
1 In the Console, click Settings > Data Insight Servers
2 Click the server that you want to review, or click Select Action and selectView.
TheOverview tab of the server details screen appears. It displays the followinginformation:
■ NameThis is the address of the server configured when the server was added.Remote product servers use this address when communicating with thisserver. At this time, Data Insight does not support changing the address ofthe server.
■ RolesThis indicates the roles that the server plays. Possible server role valuesare Management Server, Indexer, Collector, Classification Server, andWindows File Server Agent.
■ Filer NameIf the server is a Windows File Server Agent, the name of the associatedfile server is displayed here.
■ Data Insight VersionIndicates the version of Data Insight installed on this server.
■ Operating SystemIndicates the operating system installed on this server.
■ CPUsIndicates the number of CPUs available on this server.
■ MemoryIndicates the RAM installed on this server in MBs.
■ Associated Windows File ServerThis detail is available only if you select the server with the Windows FilerServer agent role. Indicates the host name or IP address of the WindowsFile Server that the agent is monitoring.
78Configuring Data Insight product serversViewing Data Insight server details

■ Server HealthIndicates the current state of the server - whether a server is in a healthystate, is faulted, or at risk. You can also view the reasons for the currenthealth state of the server.
■ Composition of Data DirectoryThe pie chart shows the disk space utilized by various folders under thedata directory. These folders include Collector, Indexer, Workflow,Attic, Inbox, Outbox, Reports, Classification, and Other.You can configure purge settings to delete old data to free disk space onthe server.See “Configuring data retention settings” on page 43.
■ Product UpdatesThe suggestion for upgrades if a newer version of Data Insight is available.
See “Configuring advanced settings” on page 88.
About node templatesA node template consists of a set of pre-defined node settings. To ensureconsistency of configuration across all Data Insight server nodes, you can createtemplates with the required settings and apply them when configuring the servers.
Data Insight comes bundled with three standard templates which include frequentlyused settings to help you set up nodes for well known configurations, for example,templates for POC configuration, large Indexer, and large Collector. The standardnode templates are stored in the INSTALL_DIR\conf\node_templatefolder. Youcannot edit or delete the standard node templates from the console.
You can apply multiple templates when configuring a server. However, when youapply multiple templates to a node, Data Insight applies each template serially whenevaluating the configuration for that node. You can also use a node template tochange a single setting on all nodes. For example, if you want to change the Pingtimeout setting for all nodes, you can create a template with the required timeoutsetting and apply to all Data Insight nodes in your environment.
Managing node templatesYou can view configured templates, create new node templates, edit existingtemplates, and delete a template from the Node Templates list page.
79Configuring Data Insight product serversAbout node templates

To view configured node templates
1 In the Console, click Settings > Data Insight Servers.
2 From the Node Templates drop-down, select Manage Node Templates.
3 The list page displays all standard and configured node templates.
You can choose to delete configured node templates.
To delete a node template
1 In the Console, click Settings > Data Insight Servers.
2 From the Node Templates drop-down, select Manage Node Templates.
3 On the node templates list page, select the template that you want to edit, andfrom the Select Action drop-down, select Delete.
4 Click OK on the confirmation dialog to delete the node template.
See “Adding or editing node templates” on page 80.
Adding or editing node templatesYou can create new templates that you can apply to multiple nodes simultaneouslyor edit existing templates to change the configuration settings.
To create a node template
1 In the Console, click Settings > Data Insight Servers .
The Data Insight Servers list page displays.
2 From the Node Templates drop-down, select Manage Node Templates.
3 Click Add New Node Template.
4 In the node template name field , enter a unique name for the template.
5 For each configuration category, click Edit,.
Select the check box for the settings that you want in the template, andconfigure appropriate values for the settings, as required.
See “Configuring advanced settings” on page 88.
6 Click Close Configuration to save the settings as a node template.
To edit a node template
1 In the Console, click Settings > Data Insight Servers.
2 From the Node Templates drop-down, select Manage Node Templates.
80Configuring Data Insight product serversAbout node templates
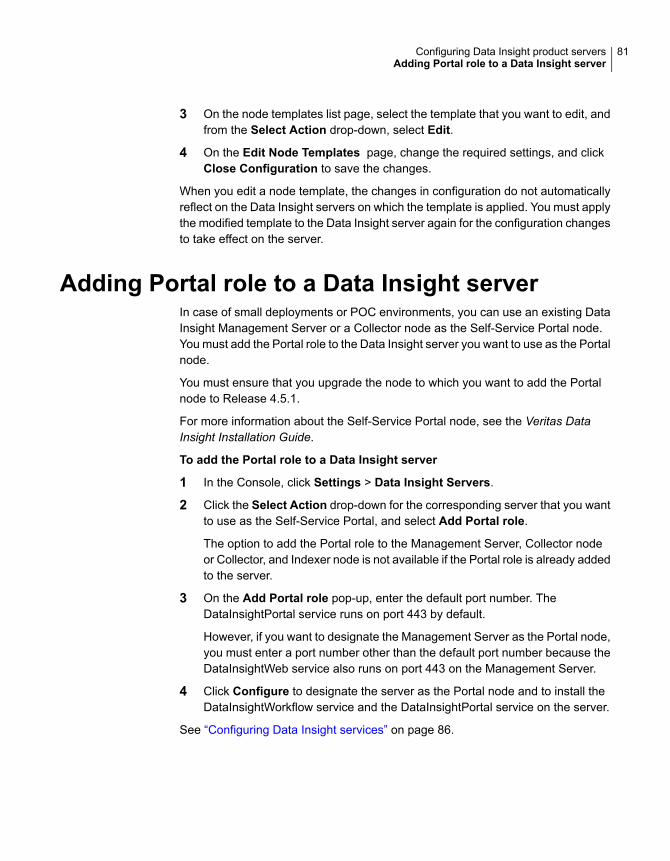
3 On the node templates list page, select the template that you want to edit, andfrom the Select Action drop-down, select Edit.
4 On the Edit Node Templates page, change the required settings, and clickClose Configuration to save the changes.
When you edit a node template, the changes in configuration do not automaticallyreflect on the Data Insight servers on which the template is applied. You must applythe modified template to the Data Insight server again for the configuration changesto take effect on the server.
Adding Portal role to a Data Insight serverIn case of small deployments or POC environments, you can use an existing DataInsight Management Server or a Collector node as the Self-Service Portal node.You must add the Portal role to the Data Insight server you want to use as the Portalnode.
You must ensure that you upgrade the node to which you want to add the Portalnode to Release 4.5.1.
For more information about the Self-Service Portal node, see the Veritas DataInsight Installation Guide.
To add the Portal role to a Data Insight server
1 In the Console, click Settings > Data Insight Servers.
2 Click the Select Action drop-down for the corresponding server that you wantto use as the Self-Service Portal, and select Add Portal role.
The option to add the Portal role to the Management Server, Collector nodeor Collector, and Indexer node is not available if the Portal role is already addedto the server.
3 On the Add Portal role pop-up, enter the default port number. TheDataInsightPortal service runs on port 443 by default.
However, if you want to designate the Management Server as the Portal node,you must enter a port number other than the default port number because theDataInsightWeb service also runs on port 443 on the Management Server.
4 Click Configure to designate the server as the Portal node and to install theDataInsightWorkflow service and the DataInsightPortal service on the server.
See “Configuring Data Insight services” on page 86.
81Configuring Data Insight product serversAdding Portal role to a Data Insight server

Adding Classification Server role to a Data Insightserver
Veritas recommends that you deploy a standalone Classification Server becauseassigning a Classification Server role to an existing Data Insight node will affect itsperformance.
You can assign a Management Server, Collector, or Collector and Indexer node toserve as a Classification Server instead of a designated standalone ClassificationServer. This indicates that the Data Insight node behaves as a Classification Server.However, you cannot add a Classification Server role to a pure Indexer, Self ServicePortal node, and Windows File Server Agent node.
For more information about Classification Server, see the Veritas Data InsightInstallation Guide.
To add the Classification Server role
1 In the Console, click Settings > Data Insight Servers.
2 Click the Select Action drop-down on the row corresponding to the server thatyou want to use as the Classification Server, and select Add Classificationrole.
The option to add classification role is available only for the ManagementServer, Collector, or Collector and Indexer node. This option is not availablewhen the role is already set to Classification Server.
3 Click Yes on the confirmation message to designate the server as theClassification Server. As part of this configuration, the DataInsightVICClient
and the DataInsightVICServer services are installed on the designated server.
Note that when you add a classification role to a server, it can have a impacton the performance of the server.
See “Assigning Classification Server to a Collector” on page 82.
For information about how Data Insight classifies files, see the Veritas Data InsightClassification Guide.
Assigning Classification Server to a CollectorEvery data source is associated with a Collector node. The mapping of the Collectorto the Classification Server decides to which Classification Server the request shouldbe fanned out. When you submit paths for classification, a Data Insight server witha Collector role fans out the file paths to the assigned Classification Server whichclassifies those files.
82Configuring Data Insight product serversAdding Classification Server role to a Data Insight server

Before assigning a Classification Server to a Collector, note the following:
■ Make sure that a pure Classification Server is installed.
■ Assign a Classification Server only to a Data Insight server with the Collectorrole.
■ If a Collector is assigned a classification role, then it cannot be assigned as aClassification Server to another Collector.
■ If there is any previously configured mapping, then it will be overwritten whenyou assign a Classification Server to a Collector.
See “Adding Classification Server role to a Data Insight server” on page 82.
To assign a Classification Server
1 From the Data Insight Management Console, click Settings > Data InsightServers to display list of configured servers.
2 Select the server with the role as Management Server, Collector, or Collectorand Indexer.
3 Click Assign Classification Server.
4 In the Select Classification Server window, review the information about theconfigured Classification Servers. Click Select on the row corresponding tothe Classification Server with which you intend the Data Insight server tocommunicate. Only pure Classification Servers are listed on this pop-up.
5 Click OK on the confirmation message.
Alternatively, you can also assign a Classification Server from the command lineinterface of the Management Server by issuing the following command:
configdb -o -T node -k <node id of the Collector node> -J
vic.server.id -j <node id of Classification Server>
Deleting the assignment of a Classification Server to aData Insight serverYou can delete the mapping with the Classification Server by issuing the followingcommand on the Management Server:
configdb --delete-obj-attr -J vic.server.id -T node -k <node id of
the Collector node>
83Configuring Data Insight product serversAssigning Classification Server to a Collector

Associating a Classification Server pool to aCollector
You can deploy a Classification Server pool and map the Collector node to theserver pool instead of to single Classification Server. Every data source is associatedwith a Collector node. When you submit paths for classification, a Data Insightserver with a Collector role fans out the classification workload (file paths that mustbe classified) among classification servers in a pool. The master classification serverdistributes the classification requests to various slaves nodes which helps to balancethe workload on the assigned classification server and increases the classificationthroughput.
Deploying a classification server pool
1 From the Data Insight Management Console, click Settings > Data InsightServer to display list of configured servers. Make a note of node ID of all theclassification servers.
2 Add a custom property on all classification slave nodes so that they areassigned to a classification master server. Use custom property ‘vic.master.id’as the property name and set the property value to classification master nodeID.
3 InAdvanced settings, modify the classification settings on each classificationserver according to their hardware configuration. We recommend setting thenumber of threads equal to the value to the number of CPUs.
See “Configuring advanced settings” on page 88.
4 Complete the following steps:
■ Select all nodes in Data Insight Server in WebGUI and run UpdateConfigJob
■ Restart all Data Insight Services on all servers that are assigned the roleof Classification Server.
■ Remote Desktop to Classification Master Node and go todatadir\data\classification and check for ‘workload’ folder. Forexample : C:\DataInsight\data\classification
■ If the workload folder is not present on the Master node , restart all DataInsight services of this node and check again.
■ If the workload is present now proceed with the following step.
■ In Reports > Edit DQL Report, use a custom DQL Query to classify onlythe required file extensions.
5 In theRemediation tab of the Reports wizard, select the Classify option andclick Save and Run to run the report immediately.
84Configuring Data Insight product serversAssociating a Classification Server pool to a Collector

Classification Server pool limitationsTh following limitations apply when deploying a classification server pool:
■ Unable to support load distribution for WinNAS Agent.
■ One Classification Server cannot be part of two pools.
■ A Collector or Management Server with classification role cannot be a slavenode in the pool.
■ A node cannot be a slave if it is already a master of some other node.
Viewing in-progress scansYou can view a list of currently running scans on the In-progress scans tab.
To review the in-progress scans
1 On the product server details page, click In progress scans.
2 Review the following information from the in-progress scans table:
■ Object Name - Name of the object being scanned.
■ Object Type - The type of object being scanned. This can be a share, sitecollection or Active Directory.
■ Task Name - Indicates the type of the scan.
■ Task State -Whether the task is RUNNING or IN QUEUE.If none of the tasks are in RUNNING state, it usually means a scan pausewindow is in effect. You can configure the pause interval for the server fromAdvanced Settings page for the server. To override the pause schedulefor a share or site collection and start the scan immediately, from the Actiondrop-down, select Override pause schedule.See “Configuring advanced settings” on page 88.
■ Start Time - Time the scan started if it's in RUNNING state.
■ Time elapsed - Indicates how long the scan has been running.
■ Task Statistics- Indicates the statistics of the in-progress scans. It showsthe number of folders scanned and the files or folders scanned per minute.
3 Click Cancel to cancel a particular scan or click Cancel All to cancel all scans.
Note: To view the in-progress scans across all nodes in your environment, navigateto the Settings > Scanning > In-progress Scans tab.
85Configuring Data Insight product serversViewing in-progress scans

Configuring Data Insight servicesYou can view the status of all Data Insight processes from the Services tab on theManagement Console. You can manage the following services from this page:
■ Data Insight Web server service - The process runs on the Management Server.It starts by default when you start your Management Server.
■ Data Insight Communication service - The process runs on each node in a DataInsight deployment. This service is responsible for all inter-node communication.
■ Data Insight Configuration service - The process that provides interface toconfiguration and other product data that is stored on the local system.
■ DataInsightFpolicy service - The process runs on the Collector node or theManagement Server. This service is responsible for registering the Data Insightserver with the NetApp filer and enables Data Insight to receive access eventsfrom the filer.
■ DataInsightFpolicyCmod service - The Windows service runs on the Collectornode. It is responsible for interacting with the NetApp Cluster Management hostto receive access events from the nodes in the cluster.
■ DataInsightCelerra service - The process runs on the Collector Worker node orthe Management Server. This service is responsible for registering the DataInsight server with the EMC Celerra filer and enables Data Insight to receiveaccess events from the filer.
■ DataInsightWatchdog service - The process runs on all nodes in a Data Insightdeployment and monitors the health of the node. The service also monitors thedisk usage on the Windows File Server node and prevents it from running outof disk space by implementing safeguards.
■ DataInsightWinNAS service - The process runs on the Windows File Server.The service receives event information from the Windows File Server filter driverand transfers it to the Collector node that is configured for the filer.
■ DataInsightGenericCollector service - The service runs on the Collectorassociated with a generic file server. The service collects all incoming eventsfrom generic file servers and web API clients, and copies them to a specificfolder on the Collector.
■ DataInsightWorkflow service - The service runs only on the Management Server.This service is responsible for managing the lifecycle of various actions initiatedfrom the Management Server.
■ DataInsightPortal service - The service runs on any server that is designatedas the Portal node. It provides an interface to the portal where the custodians
86Configuring Data Insight product serversConfiguring Data Insight services

can log on to take remediation action. The service runs on the ManagementServer and the Portal node.
■ DataInsightVICClient service- The service runs on the Management Server andany Data Insight server that is designated as the Classification Server. It isresponsible for interactions that happen between the Data Insight servers andthe Classification Server such as when a file is submitted for classification, thisservice routes the request to the Classification Server.
■ DataInsightVICServer service - The service runs on the Management Serverand anyData Insight server that is designated as the Classification Server. Thisservice hosts the classification engine which is responsible for evaluating filesagainst the configured policies and detecting the patterns.
■ DataInsightSPOnline service- This service is installed on the Collector nodedesignated to monitor the site collection. It is responsible for discovery, scanning,and collecting audit events for site collections in SharePoint Online account.
■ DataInsightCMIS service- This service is installed on the Collector node assignedto monitor the ECM data sources. It is responsible for discovery and scanningof repositories.
■ DataInsightOneDrive service - This service is installed on the Collector nodedesignated to monitor the Microsoft OneDrive account. It is responsible fordiscovering and scanning the OneDrive account, and collecting audit events forcloud accounts in a OneDrive account.
For detailed information about the Data Insight services, see the Veritas Data InsightInstallation Guide.
Depending on the type of the filers managed by the Collector, you can enable theFPolicy, EMC Celerra, or Genericcollector service on the server from this page.
To enable or reconfigure the FPolicy or EMC Celerra service
1 On the Services tab, click the service that you want to enable on the server.
2 From the Select saved credential drop-down, select the credential that theservice uses to run. Ensure that the user used to configure the FPolicy serviceis added to the Group Policy object with the Log on as a service privilege inyour Active Directory domain controller.
3 If configuring the DataInsightFpolicy service, enter the name of the policy.
4 If configuring the DataInsightCelerra service, select one of the following tospecify the location of the server on which the EMC CAVA service is installed:
■ EMC CAVA Service is installed locally on this server
■ Remote EMC CAVA Server Pool publishes events to this server
5 Click Configure.
87Configuring Data Insight product serversConfiguring Data Insight services

See “Configuring advanced settings” on page 88.
See “Credentials required for configuring NetApp filers” on page 138.
See “Credentials required for configuring EMC Celerra filers” on page 183.
Configuring advanced settingsYou can edit various settings of the Data Insight servers from the Settings > DataInsight Servers > Advanced Settings page.
The advanced settings are divided into the following categories:
■ Filesystem Scanner settings - Configures how the server scans file systems.Data Insight performs two types of scans on the configured shares:
■ Full scansDuring a full scan, Data Insight scans the complete share. These scans canrun for several hours, if the share is very big. Typically, a full scan should berun once for a newly added share. After the first full scan, you can performfull scans less frequently based on your preference. Ordinarily, you need torun a full scan only to scan those paths which might have been modifiedwhile event monitoring was not running for any reason. In all other cases,the incremental scan is sufficient to keep information about the file systemmetadata up-to-date.See Table 4-1 on page 90.
■ Incremental scansDuring an incremental scan, Data Insight re-scans only those paths thathave been modified since the last full scan. It does so by monitoring incomingaccess events to see which paths had a create event or write event on itsince the last scan.See Table 4-2 on page 91.
■ Indexer settings - Configures how the indexes are updated with new information.This setting is applicable only for Indexers.See Table 4-5 on page 94.
■ Audit events preprocessor settings - Configures how often raw access eventscoming from file servers must be processed before they are sent to the Indexer.See Table 4-6 on page 96.
■ High availability settings - Configures how this server is monitored.Each server periodically monitors its CPU, memory, state of essential services,number of files in its inbox, outbox, and err folders. Events are published if thesenumbers cross the configured thresholds. Also, each worker node periodically
88Configuring Data Insight product serversConfiguring advanced settings

heartbeats with the Management Server. The Management Server publishesevents if it does not receive a heartbeat from a node in the configured interval.See Table 4-8 on page 98.
■ FPolicy safeguard settings - Configures the safeguards related to FPolicycommunication. You can either choose to use the global settings or customizethe settings for a specific Collector node. You can configure settings for FPolicyCluster-Mode and 7-modeSee Table 4-7 on page 97.
■ Report settings - Configures settings for reports.See Table 4-11 on page 102.
■ Classification settings - Configures how the Classification Server scans filesystem contents.Table 4-9Table 4-10
■ Windows File Server Agent settings - Configures the behavior of the WindowsFile Server filter driver. This setting is applicable only for the Windows File ServerAgent server.See Table 4-12 on page 102.
■ Veritas File System server (VxFS) settings - Configures how Data Insightscans the VxFS filer.See Table 4-13 on page 103.
■ NFS settings - Configures how Data Insight scans NFS shares.See Table 4-14 on page 103.
■ SharePoint settings - Configures the duration for which old audit logs are kepton the SharePoint server. Audit logs that are fetched from the SharePoint serverare automatically deleted from the Data Insight database. You can disable thisfeature at the web application level.See Table 4-15 on page 104.
■ Troubleshooting settings - Configures settings that aid troubleshooting.See Table 4-16 on page 105.
■ Set custom properties - Configures certain advanced properties of a DataInsight worker node. Using this facility, you can customize certain propertiesthat are not accessible by the normal settings.
Note: Veritas recommends using the custom properties settings under theguidance of Veritas Support.
89Configuring Data Insight product serversConfiguring advanced settings

You can configure the advanced settings per node or save commonly used settingsas a templates. See “About node templates” on page 79.
To configure advanced settings
1 In the Console, click Settings > Data Insight Servers.
2 Click the server, for which you want to configure the advanced settings.
3 Click Advanced settings.
4 Click Edit.
5 Make necessary configuration changes, and click Save.
See “Managing node templates” on page 79.
Each of the categories for the advanced settings are described in detail below.
Table 4-1 File system scanner settings - Full scan settings
DescriptionSetting
The Collector can perform multiple full scansin parallel. This setting puts a limit on the totalnumber of full scans that can run in parallelon a Collector. The default value is twothreads. Configure more threads, if you wantscans to finish faster.
The setting is disabled by default.
Maximum scans to run in parallel on thisserver
If multiple shares of a filer can be scanned inparallel, this setting puts a limit on the totalnumber of shares of a filer that you can scanin parallel.
Maximum shares per filer to scan in parallel
Specifies how often full scans must beperformed. By default, full scans arescheduled to repeat at 19:00 P.M. on the lastFriday of each month.
Select the check box to override this settingat a filer or at a share level.
Default scan schedule
You can configure the hours of the day whenscanning should not be allowed. This settingensures that Data Insight does not scanduring peak loads on the filer.
The setting is enabled by default. Scansresume from the point they were at beforethey were paused.
Pause scanner for specific times
90Configuring Data Insight product serversConfiguring advanced settings

Table 4-1 File system scanner settings - Full scan settings (continued)
DescriptionSetting
Configures when scanning should not beallowed to run. By default, scanning is pausedfrom 7:00 A.M. to 7.00 P.M., Monday toFriday.
You can specify multiple scanner pauseschedules for different days of the week. Forexample, you can choose to pause scanningfrom 7:00 A.M. to 7:00 P.M. on weekdays andfrom 7:00 A.M. to 9:00 P.M. on Saturdays andSundays.
To add a scanning schedule:
1 Click Add.
2 On the Pausing schedule pop-up, selectthe time period and the days on whichyou want to pause scanning.
3 Click Save.
You can also edit or delete existing scanningschedules.
Pause scanner schedule
Table 4-2 File system scanner settings - Incremental scan settings
DescriptionSetting
The Collector can perform multiple full scansin parallel. This setting puts a limit on the totalnumber of full scans that can run in parallelon a Collector. The default value is twothreads. Configure more threads, if you wantscans to finish faster.
The setting is disabled by default.
Maximum scans to run in parallel on thisserver
If multiple shares of a filer can be scanned inparallel, this setting puts a limit on totalnumber of shares of a filer that can bescanned in parallel.
The default value is 2.
Maximum shares per filer to scan in parallel
91Configuring Data Insight product serversConfiguring advanced settings

Table 4-2 File system scanner settings - Incremental scan settings(continued)
DescriptionSetting
Specifies how often incremental scans mustbe performed. By default, incremental scansare scheduled to run at 7:00 P.M. each night.
Schedule incremental scans more or lessfrequently based on how up-to-date you needinformation in Data Insight to be.
Default scan schedule
You can configure hours of the day whenscanning should not be allowed. This settingensures that Data Insight does not scanduring peak loads on the filer.
This setting is enabled by default. Scansresume from the point they were at beforethey were paused.
Pause scanner for specific times
Configures when scanning should not beallowed to run. By default, scanning is pausedfrom 7:00 A.M. to 7:00 P.M. Monday toFriday.
Pause scanner schedule
Table 4-3 File system scanner settings - Throttling for NetApp 7-mode andNetApp cluster-mode filer
DescriptionSetting
This option is selected by default. When thisoption is selected, Data Insight uses thethrottling thresholds defined on the Settings> Global Settings > Scanning and EventMonitoring page.
See “Configuring scanning and eventmonitoring ” on page 32.
Use global settings
Select Use custom settings to disablescanning or override the global throttlingthresholds and define custom values.
Use custom settings
92Configuring Data Insight product serversConfiguring advanced settings

Table 4-3 File system scanner settings - Throttling for NetApp 7-mode andNetApp cluster-mode filer (continued)
DescriptionSetting
Clear the check box to disable scanning forthe filers that the collector is monitoring.
Select to enable throttling of Data Insightscans for NetApp 7-mode and Cluster-Modefile servers. This option is not selected bydefault.
Data Insight collects latency information fromNetApp file servers. It can use this informationto throttle scanning, if latency of the file serverincreases above a certain level. This ensuresscanner does not put additional load on thefile server during peak load conditions.
You can configure the following parametersto enable throttling for NetApp file servers:
■ Latency threshold - Specify latency inmilliseconds, which when crossed, shouldthrottle scanning for the file server
■ Minimum pause - Specify the minimumduration (in milliseconds) for which thescanner should pause between pathswhen in throttling mode.
■ Back off value - If increased latency issustained, pause interval will be increasedby the Back off value specified (inmilliseconds).
■ Maximum pause - Specify the maximumpause interval for the scanner (inseconds). If exceeded, pause interval isno longer incremented by Back off value.
Throttle scanning based on latency of the filer
93Configuring Data Insight product serversConfiguring advanced settings

Table 4-4 File system scanner settings - Common settings
DescriptionSetting
Scanning a big share can take several hours.The scanner periodically saves informationto a disk so that information is visible soonerwithout waiting for the entire scan to finish.
You can configure how often information issaved to the disk by the scanner. By default,the scanner creates a snapshot of newinformation every 300 seconds (5 minutes).The minimum value you can set for thisparameter is 300.
Scanner snapshot interval
Table 4-5 Indexer settings
DescriptionSetting
The indexer processes incoming scan andaccess event information for various sharesand updates the per-share database. Thissetting configures how many databases canbe updated in parallel. By default 2 threadsare configured.
Specify a larger value for bigger setups whereindexer is not able to keep up with incomingrate of information. This is indicated whenyou observe too many files in the inbox of theIndexer worker node. However, you mustensure that the Indexer has adequate CPUand memory when configuring a highernumber of indexer threads. You needapproximately 1 GB of RAM per indexerthread.
Total indexer threads
By default, the indexer processes all newincoming events in memory before saving theevents to the disk. If your are falling short ofRAM on your Indexer, you can limit themaximum number of events that the indexerprocesses in memory before it saves them tothe disk.
Note: Specifying a small number makes theindexing very slow.
Limit maximum events processed in memory
94Configuring Data Insight product serversConfiguring advanced settings

Table 4-5 Indexer settings (continued)
DescriptionSetting
After Data Insight indexes full scan data, itcomputes the paths that no longer seem tobe present on the file system. Similarly, ifData Insight discovers folders or subsitesmissing in a SharePoint site, then it computesthose subsites or folders as deleted withoutperforming a reconfirmation scan.
Select this check box to have Data Insightre-confirm if those paths are indeed deletedusing an incremental scan before removingthem from the index.
When the check box is clear, Data Insightreadily removes the missing paths from theindexes without carrying out a re-confirmation.
Note: Re-confirm scan is not supported forsite collections.
Reconfirm deleted paths when reconciling fullscan information
Specify how often an index should be updatedwith new information. By default, all new datais consumed once every four hours.
Indexer gets better throughput if moreinformation is given to it when indexing.However, if you configure a very high value,new information will not be visible in theConsole for a much longer period.
Indexer schedule
Data Insight checks the integrity of itsdatabases once a week. If any errors arefound in the database, an event is published.You can configure a different schedule ifrequired.
Indexer integrity checking schedule
95Configuring Data Insight product serversConfiguring advanced settings

Table 4-6 Audit events preprocessor settings
DescriptionSetting
Incoming raw audit events from file serversmust be pre-processed before sending themto the Indexer. At this stage,collector.exe applies various heuristicsto the raw events and also removes transientevents.
By default, raw events are processed every2 hours.
Audit events preprocessor schedule
The maximum size of the raw audit event filesthat a single Collector thread can process.
The default batch size is 2 GB.
Batch size (MB)
The Collector can run multiple pre-processorsin parallel. This setting configures how manyinstances can run in parallel.
Total Collector threads
96Configuring Data Insight product serversConfiguring advanced settings

Table 4-7 FPolicy safeguard settings
DescriptionSetting
This option is selected by default. Use theFPolicy safeguard settings for NetApp 7-modeand Cluster-mode filers as defined on theSettings >Global Settings > Scanning andEvent Monitoring page.
See “Configuring scanning and eventmonitoring ” on page 32.
Data Insight collects latency information fromNetApp file servers. It can use this informationto initiate safeguard mode, if latency of thefile server increases above or falls below acertain level. When the safeguard is in effect,Data Insight drops its FPolicy connection tothe filer. This ensures event collection doesnot put additional load on the file server inpeak load conditions.
If the latency on the physical file serverincreases above the configured threshold,Data Insight disconnects from the associatedvirtual file server. This information is alsodisplayed on the Data Insight SystemOverview dashboard.
Use global settings
Select Use custom settings to disable thesafeguard settings or to override the globalsafeguard thresholds and define customvalues.
Use custom settings
97Configuring Data Insight product serversConfiguring advanced settings

Table 4-7 FPolicy safeguard settings (continued)
DescriptionSetting
Select one of the following, as appropriate:
■ Select Enable FPolicy 7-ModeSafeguard to initiate safeguard mode forthe NetApp file servers.
■ Select Enable FPolicy 7-Modesafeguard for VFilers to initiatesafeguard mode for virtual file servers bymonitoring latency statistics for theassociated physical NetApp filers. Thesafeguard mode for the virtual filers isinitiated only if the details of the physicalfiler corresponding to the virtual filer areprovided while adding the virtual filer.
■ Select Enable FPolicy Cluster ModeSafeguard to initiate safeguard mode forthe NetApp cluster mode file servers.
These FPolicy safeguard settings are notselected by default. When these check boxesare cleared, the safeguard settings are not ineffect.
Configure the following values:
■ The high and low thresholds for CIFS andNFS.
■ The number of samples to be consideredto calculate the average latency.
■ The minimum time to wait before DataInsight reconnects to the filer after adisconnection.
Enable FPolicy safeguard settings
Table 4-8 High availability settings
DescriptionSetting
If a worker node does not heartbeat in thespecified interval, Management server willpublish an event to that effect. This setting isonly applicable for the Management Server.
Ping timeout (in minutes)
If CPU used on this server is consistently overthe specified percentage, an event ispublished. (Default value: 90%)
Notify when CPU continuously over(percentage)
98Configuring Data Insight product serversConfiguring advanced settings

Table 4-8 High availability settings (continued)
DescriptionSetting
If Memory used on this server is consistentlyover the specified percentage, an event ispublished. (Default value: 80%)
Notify when memory continuously over(percentage)
If disk usage, either for the system drive ordata drive, is over the specified threshold, anevent is published. (Default value: 80%)
Notify when disk usage over (percentage)
If the free disk space for the system drive ordata drive is over the specified threshold inmegabytes, an event is published. (Defaultvalue: 500 MB)
Notify when disk free size under (MB)
If Data Insight is not able to process anincoming file for some reason, that file ismoved to an err folder. Data Insightpublishes an event if number of files in theerr folder crosses the specified threshold.(Default value: 50)
Notify when number of files in err foldersover
If Data Insight is not able to process incomingdata fast enough, the number of files in thetransient folders, inbox and outbox, goeson building up. Data Insight publishes anevent if number of files crosses the configuredthreshold. (Default value: 5000)
Notify when number of files in inbox andoutbox folder over
Table 4-9 Classification settings - Content scans for file system
DescriptionSetting
The Classification Server can perform multiplecontent scans in parallel. This setting puts alimit on the total number of scans that can runin parallel on a Classification Server. Thedefault value is two threads. Configure morethreads, if you want scans to finish faster.
Ensure that the server has enough resourcesto run the configured parallel threads.
Maximum content scans to run in parallel onthis server
When content is being classified in parallel,this setting puts a limit on the total number ofclassification threads that you can run inparallel.
Maximum classification threads to run inparallel on this server
99Configuring Data Insight product serversConfiguring advanced settings

Table 4-9 Classification settings - Content scans for file system (continued)
DescriptionSetting
When multiple shares of a filer are scannedin parallel, this setting puts a limit on the totalnumber of shares of a filer that you can scanin parallel.
Maximum shares per filer to content scan inparallel
You can configure the hours of the day whencontent scanning should not be allowed. Thissetting ensures that Data Insight does notscan during peak loads on the filer. Thesetting is enabled by default. Scans resumefrom the point they were at before they werepaused.
Content scanning is paused by default fromMonday to Friday from 7:00 A.M. to 7:00 P.M.
To configure the pause schedule, click Editon the scheduler to configure the days andtime on which content scanning should bepaused.
You can configure more than one pauseschedules. Click Add to add new pauseschedule.
Pause content scanner for specific times
Veritas Classification Server master ID
This property represents the masterClassification Server ID assigned to slaveClassification Server.
Veritas Classification lb. disabled
This property is applicable to VeritasClassification master server only if at leastone server is in the pool used to turn loadbalancing feature on/off. By default, it is setto false. If you want to disable this feature setits value to true.
Matrix.classify.fetch.max_batches
This is the global property used to setmaximum number of batches per priority tokeep in content fetch queue on every slave.This is used only if load balancing is enabled.The default value is 10.
Custom Property
100Configuring Data Insight product serversConfiguring advanced settings
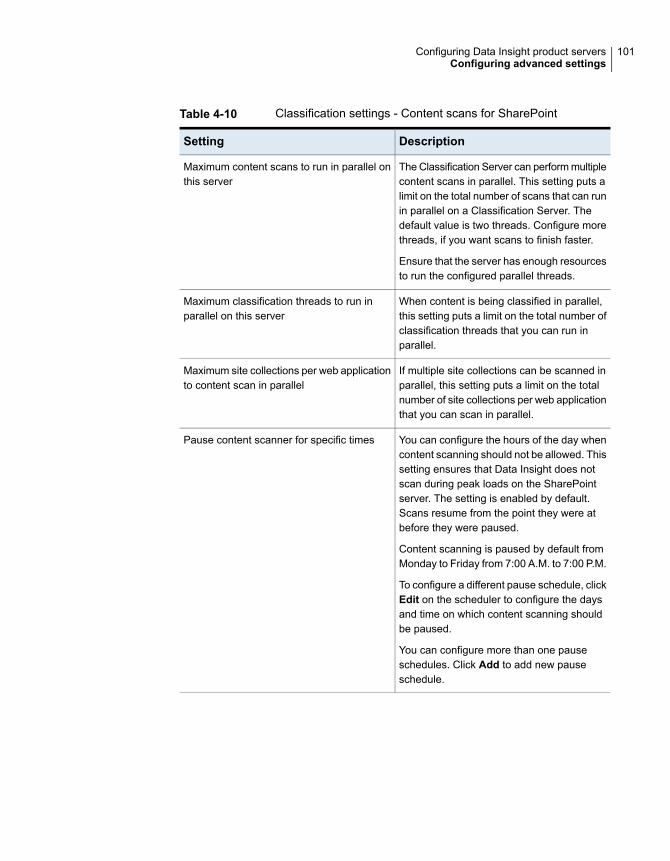
Table 4-10 Classification settings - Content scans for SharePoint
DescriptionSetting
The Classification Server can perform multiplecontent scans in parallel. This setting puts alimit on the total number of scans that can runin parallel on a Classification Server. Thedefault value is two threads. Configure morethreads, if you want scans to finish faster.
Ensure that the server has enough resourcesto run the configured parallel threads.
Maximum content scans to run in parallel onthis server
When content is being classified in parallel,this setting puts a limit on the total number ofclassification threads that you can run inparallel.
Maximum classification threads to run inparallel on this server
If multiple site collections can be scanned inparallel, this setting puts a limit on the totalnumber of site collections per web applicationthat you can scan in parallel.
Maximum site collections per web applicationto content scan in parallel
You can configure the hours of the day whencontent scanning should not be allowed. Thissetting ensures that Data Insight does notscan during peak loads on the SharePointserver. The setting is enabled by default.Scans resume from the point they were atbefore they were paused.
Content scanning is paused by default fromMonday to Friday from 7:00 A.M. to 7:00 P.M.
To configure a different pause schedule, clickEdit on the scheduler to configure the daysand time on which content scanning shouldbe paused.
You can configure more than one pauseschedules. Click Add to add new pauseschedule.
Pause content scanner for specific times
101Configuring Data Insight product serversConfiguring advanced settings

Table 4-11 Reports settings
DescriptionSetting
Specifies the maximum memory that can beused for generating a report output. Bydefault, it is 1024 MB on a 32 bit machine and2048 MB on a 64 bit machine
Maximum memory when generating reportoutput
Configure the number of threads forgenerating report output (PDF/HTML/CSV)in parallel. Default value is 2.
This setting applies to the ManagementServer.
Total threads for generating report output
Configure the number of threads responsiblefor generating the report output database fora single report. This configuration applies tothe Indexer node.
This setting helps you speed up the processof report generation.
For a particular Data Insight server, the threadcount applies to all types of reports.
Number of threads for a single report run
By default, Veritas Data InsightAdministrator's Guide executes two reportsin parallel. However, you can configure ahigher value to run multiple reports in parallel.
Maximum reports that can run simultaneously
Table 4-12 Windows File Server agent settings
DescriptionSetting
The Windows File Server filter driver putsevents in an in-memory buffer before theDataInsightWinnas service, consumes them.By default, it uses a 10MB buffer. You canuse a bigger buffer. Data Insight publishesan event that indicates events are beingdropped due to a high incoming rate.
Note: Buffer is in kernel and is limited on a32 bit operating system.
Maximum kernel ring buffer size
102Configuring Data Insight product serversConfiguring advanced settings

Table 4-12 Windows File Server agent settings (continued)
DescriptionSetting
The Windows File Server filter driver ignoresaccesses made by processes running withLocal System account. This setting ensuresthat Data Insight can ignore most eventsoriginating from the operating systemprocesses or other services like antivirus andbackup.
Clear this check box to enable monitoringaccesses made by LOCAL SYSTEM account.This is not recommended on a production fileserver.
Ignore accesses made by Local Systemaccount
Table 4-13 Veritas File System server settings
DescriptionSetting
Set this option to true, if you want to forceVxFS to flush its events to disk each timerequests for information. This option is usefulin Proof-of-Concept (POC) setups andenables you to see events faData Insightster.
Flush events on VxFS filer before audit
This option determines how many filers tofetch audit information from in parallel.
Maximum number of audit threads
The access event records are saved in a logfile on the VxFS filer before Data Insightconsumes them. By default, 50,000 recordscan be saved in the log file. You can alsospecify a larger number. Data Insightpublishes an event that indicates that eventsare being dropped due to a high incomingrate.
Maximum kernel ring buffer size (Number ofrecords)
Table 4-14 NFS settings
DescriptionSetting
Set this option to true if you want to allowData Insight to use the specified User andGroup ID to log in to scan NFS shares.
Set default credentials for NFS scanner
103Configuring Data Insight product serversConfiguring advanced settings

Table 4-14 NFS settings (continued)
DescriptionSetting
The ID of the NFS user that the Data Insightuses to scan the filer.
You can set the value to 0 to allow rootaccess from the Data Insight scan hosts.
User ID
The ID of the group that the Data Insight usesto scan the filer.
You can set the value to 0 to allow rootaccess from the Data Insight scan hosts.
Group ID
Table 4-15 SharePoint settings
DescriptionSetting
When configuring a SharePoint webapplication, you can choose to let Data Insightdelete audit logs that have already beenfetched from SharePoint. By default, DataInsight deletes audit logs older than two days.Deletion of audit logs takes place every 12hours.
Automatically delete audit events fromSharePoint server that are older than (days)
Data Insight fetches new audit events fromSharePoint periodically. By default, it doesso every 2 hours. You can configure adifferent schedule.
Schedule to fetch audit events fromSharePoint server
The Collector can perform multiple full scansin parallel. This setting configures how manyfull scans can run in parallel. The defaultvalue is 2 parallel threads. Configure morethreads if you want scans to finish faster.
The setting disabled by default.
Scan multiple site collections of a webapplication in parallel
If multiple site collections of a web applicationcan be scanned in parallel, this setting putsa limit on the total number of site collectionsof a web application that you can scan inparallel.
Maximum site collections per web applicationto scan in parallel
104Configuring Data Insight product serversConfiguring advanced settings

Table 4-15 SharePoint settings (continued)
DescriptionSetting
Specifies how often scans need to beperformed. You can override this setting at aweb application or site collection level. Bydefault, scans are scheduled to repeat 11:00P.M. each night.
Default scan schedule
You can configure the hours of the day whenscanning should not be allowed. This ensuresthat Data Insight does not scan during peakloads on the SharePoint servers. The settingis enabled by default. Scans resume from thepoint they were at before they were paused.
Pause scanner for specific times
Specify when scanning should not be allowedto run. By default, scanning is paused from7:00 A.M. to 7:00 P.M., Monday to Friday.
Pause scanner schedule
You can configure the hours of the day whenauto-delete of audit events from SharePointserver should not be allowed. This featurecan help you to avoid overloading theSharePoint servers during the peak hours.
By default, deletion of audit logs takes placeevery 12 hours.
Pause auto-delete for specific times
Specify when auto-delete of the audit logsshould not be allowed to run.
Pause schedule for auto-delete
Table 4-16 Troubleshooting settings
SettingSetting
As new data comes into a Data Insightsystem, it moves between various modules.In this process the original files are deletedand a new processed file is generated for thenext stage of processing.
To aid troubleshooting, select this check boxto retain the intermediate data files. Thesefiles get stored in attic folder in the datadirectory.
Preserve intermediate files
105Configuring Data Insight product serversConfiguring advanced settings

Table 4-16 Troubleshooting settings (continued)
SettingSetting
Events processed by the Audit Pre-processorstage are deleted once consumed. If thissetting is enabled, raw audit event files willbe preserved in the attic folder in the datadirectory.
Preserve raw audit event files
See “Managing Data Insight product servers” on page 75.
Monitoring Data Insight jobsYou can monitor and execute the jobs that run on remote Data Insight servers fromthe Management Console. The view enables you to search for the jobs are part ofthe communication Web service, the DataInsightWatchdog service, and theDataInsightWorkflow service. These jobs either run continuously or are scheduled.
For more information about the different Data Insight services, see the Veritas DataInsight Installation Guide.
Note: You can view the SPEnableAuditJob and the SPAuditJob only if the serveris configured to be the Collector for a SharePoint site collection.
To view and execute jobs from the console
1 On the Management Console, click Settings > Data Insight Servers.
2 On the list page, click Select Action > View for the server on which you wantto view or execute a process or a job.
The overview page for the server opens by default.
3 Click the Jobs sub-tab.
The page lists all jobs that are scheduled on the server. Review the followingdetails about a job:
■ The status of the job, whether stopped or running.
■ The date and time when the job was previously run.
■ The date and time of the next scheduled run.
■ The schedule of the job. For example, every day, every hour, every oneminute.
106Configuring Data Insight product serversMonitoring Data Insight jobs

■ The service the job runs on, such as the Communication service or theDataInsightWatchdog service.
4 To execute a job, do one of the following :
■ On the Jobs sub-tab, click Select Action > Run to run the job withoutwaiting for the next scheduled run.
■ On the Data Insight Server list page, click the Run Job drop-down, andselect the job you want to execute.
See “Scheduled Data Insight jobs” on page 441.
Rotating the encryption keysEncryption keys are used to secure communication between the Data Insight serversand to decrypt encrypted passwords for the stored credentials. You can periodicallychange the encryption key to ensure security and to protect data.
To rotate the encryption key
1 On the Management Console, click Settings > Data Insight Servers.
2 On the list page, click the Management Server.
3 On the Management Server details page, click Jobs.
4 On the Jobs list page, search for KeyRotationJob.
5 On the Select Action drop down, click Run to change the encryption key.
When the KeyRotationJob runs, the key is regenerated and all passwords arere-encrypted with the new key.
For more information about the Data Insight security configuration, see the VeritasData Insight Installation Guide.
Note: The KeyRotationJob is not automatically scheduled. You must manually runthe job when you want to rotate the encryption keys. New keys are replicated tothe other worker nodes job by the updateconfig job. Ensure that the networkconnection exists between the Data Insight nodes for receiving the new keys.
Viewing Data Insight server statisticsYou can view the line graphs that indicate the health of the Data Insight servers.The DataInsightWatchdog service collects the server statistics. You can use theinformation to know the performance trends for each Data Insight server. For more
107Configuring Data Insight product serversRotating the encryption keys

information about the DataInsightWatchdog service, see the Veritas Data InsightInstallation Guide.
The line graphs display hourly, weekly, monthly, and yearly data.
To view server statistics
1 Click Settings > Data Insight Servers > Server Name > Statistics.
2 Select the following to filter the data that is displayed on the page:
■ The charts that you want to view.
■ The duration for which you want to view the data.
■ The type of statistics that you want to view - Average, Minimum, andMaximum.
3 The Statistics sub-tab displays the following high-level data:
■ The number of files in the inbox and the outbox folders.
■ The number of files in the classification inbox and classification
outbox folders.
■ The number of error files in the scanner/err, collector/err, indexer/err,and classification/err folders.
■ The CPU and memory usage on the Data Insight servers.
■ The disk space utilization on the Data Insight servers on the system disk,Data Insight installation disk, and the different folders within the Data Insightdata directory.
■ Incoming event rate for this server if it is a collector for one or more filers.
■ Throughput for the event pre-processor.
■ The raw event files being processed by the Collector, that is, the numberof events that are processed by collector.exe per second.
■ The scan and audit files being processed by the Indexer
■ Internal event files being processed by the Management Server.
4 You can view each processing backlog chart from three perspectives. Clickone of the following aspects of the backlog:
■ The size of the backlog in MB or GB; the total size of all files that are yetto be processed.
■ The count of files that are yet to be processed.
108Configuring Data Insight product serversViewing Data Insight server statistics

■ The time lag in terms of hours or days; the time lag is the difference betweenthe current time and the file with the oldest timestamp that is yet to beprocessed.
5 For the Collector and Indexer backlogs, click the drop-down to the right of thechart to view the Top 10 objects that are contributing to the backlog. In caseof Collector backlog, objects are the filers or web application and case of Indexerbacklog, objects mean the shares or site collections
The Top ten chart is a bar chart.
See “Configuring advanced settings” on page 88.
About automated alerts for patches and upgradesData Insight simplifies the task of installing upgrades and patches by providing youwith automated alerts and suggestions. Data Insight fetches this information fromVeritas Operations Readiness Tool (SORT) to help you keep track of the productupdates applicable to your installed version.
For Data Insight to communicate with Veritas SORT, the Data Insight ManagementServer must have an active Internet connection to the website,https://sort.veritas.com/.
Data Insight displays the following upgrade recommendations for each of its productservers:
■ Rolling Patches (RPs) that are available for the installed version. Only the latestrolling patch is displayed.
■ Recommendation for a new product version appears at the footer of the DataInsight servers page.
See “Viewing and installing recommended upgrades and patches” on page 109.
Viewing and installing recommended upgrades and patchesYou can view the recommendations regarding patches and the product versionupgrades from the Data Insight Servers page. Using the download links you candownload the recommended patched and install them on yourData Insight Servers.
109Configuring Data Insight product serversAbout automated alerts for patches and upgrades

To view and install a patch for your product server:
1 In the Management Console, navigate to Settings > Data Insight Servers todisplay a list of configured product servers.
2 Data Insight displays the recommendations for the patches under the ProductUpdates column. The recommendation for upgrading the product version isdisplayed on the footer of the page.
Note: The Product Updates column is displayed only when the Data InsightManagement Server is able to connect to the SORT website. When there isno connection, an error message is displayed in the footer.
3 Click the link to the latest patch that Data Insight recommends. You will beredirected to the SORT website.
4 Download the patch from the Downloads page on the website.
5 You can refer to the README on the page for the installation instructions andto verify the problems that have been fixed in the patch.
Deploying upgrades and patches remotelyYou can remotely deploy installers and patches on the Data Insight worker nodesand Windows file server agents from the Data Insight Management Console. Thissimplifies the task of upgrading and configuring numerous nodes individually in alarge Data Insight deployment. You can do the following:
■ Install rolling patches on the Indexer nodes, the Collector nodes, and theWindows file server agents. Remote installation of rolling patches is not supportedon Linux indexer nodes.
■ Deploy the product installer on the Collector nodes and the Windows file serveragents.
Note: Remote upgrade of an Indexer node (neither Windows nor Linux Indexernodes) is not supported. You must upgrade an Indexer node manually.
■ Windows File Server agents can be upgraded remotely, from the Settings >Data Insight Servers page of the Data Insight Management Console.
■ For Collector nodes, both upgrade and installation of rolling patches can bedone remotely.
110Configuring Data Insight product serversDeploying upgrades and patches remotely

Note: If the first three version numbers for Management server and the concernednode match, then only the option to install a rolling patch is available. For example,when upgrading from 4.5.0 to 4.5.1, if the first three numbers do not match, thenthe option to upgrade must be used. For example, when upgrading a node from4.0.0 to 4.5.0. However, for Windows File server nodes, a rolling patch can beinstalled in spite of version mismatch between the Management Server and theconcerned Windows File Server nodes, because backward compatibility is supported.
You can either use existing saved credentials for upgrading a node or create newcredentials.
You can also perform all the remote deployment actions using the installcli.exe
utility from the Windows command prompt. For detailed information oninstallcli.exe, see the Command File Reference.
To remotely deploy upgrades and patches
1 In the Management Console, navigate to Settings > Data Insight Servers todisplay a list of configured product servers.
2 Select the server node for which you want to remotely deploy patch or upgrade.
3 Click the Install drop-down.
4 Do any of the following:
■ Click Install Rolling Patch for installing a rolling patch on the selectednode.
■ Click Upgrade for installing a product version upgrade.
You can view the progress of the remote deployment operation from the InstallationStatus page.
See “Viewing the status of a remote installation” on page 113.
Using the Upload Manager utilityUse the Upload Manager to upload agent bundle zip files, var files, and patchinstallers on the worker nodes.
Before you can install the agent, ensure that the Windows File Server agentpackages are uploaded on the relevant Collector nodes. You can use the UploadManager utility to upload the agent packages to the Collector nodes in your DataInsight configuration.
111Configuring Data Insight product serversUsing the Upload Manager utility

To upload the agent packages
1 In the Console, click Settings > Upload Manager.
2 Browse to the location where the agent packages are saved.
3 Select the Collector nodes on which you want to upload the packages.
4 Click Upload Bundle.
The agent installation bundle is a zip file that contains the agent installer and variousinstallation template files. There is one bundle for each processor architecture. Youmust upload the appropriate bundles to the Collector worker nodes based on thearchitecture of your file servers. The bundles are available along with the maininstall media and have the name,Veritas_DataInsight_windows_winnas_5_1_0_XXX_arch.zip. You can customizethe agent installation by extracting the bundle in a temporary location, editing theinstallation templates as required, recreating the zip bundle, and then uploadingthe updated bundle to the appropriate Collector nodes using the Upload Managerutility.
To install a rolling patch, upload the rolling patch executable to the ManagementServer node. To upgrade Collector nodes, upload the newer version of the productinstaller to the Management Server.
Note: When a new version is installed on the Management Server, the installerautomatically copies itself to the installers folder of the Management Server. Insuch cases, you do not need to separately upload the package to the ManagementServer for upgrading other worker nodes (except the Windows File Server agents).
Note: Remote install for Linux indexers is not supported.
About migrating storage devices across IndexersEvery storage device that is configured in Data Insight has exactly one Indexernode associated with it. The Indexer node processes the audit data from theCollector to service queries from the Management Server.
You may consider migrating a storage device to another Indexer in the followingsituations:
■ If the existing Indexer for the storage device displays high resource utilizationand the backlog of files being processed starts accumulating on the node.Migrating to another Indexer helps balance the load on the existing Indexer.See “Monitoring the performance of Data Insight servers” on page 355.
112Configuring Data Insight product serversAbout migrating storage devices across Indexers

■ If the existing Indexer is being decommissioned.
■ If you want to migrate from a Windows server to a Linux server.
Before you decide to migrate the storage device to another Indexer, ensure thefollowing:
■ Both the source and the destination Indexers are in good health and cancommunicate with each other using the fully qualified domain name. Ensurethat port 8383 is open between the indexers to allow the Communication Serviceto communicate between them.
■ The destination Indexer has enough disk space, CPU, and memory capacity totake the additional load.
■ The Collector nodes that are associated with the storage device have enoughdisk space, because the files may accumulate on the Collector nodes duringthe migration.
■ All classification requests involving the source Indexer are in Completed state.Pending and in-progress classification requests are canceled during themigration.
■ The migration should take place during quiet hours, so that additional files forconsumption are not flowing in rapidly.
See “Editing filer configuration” on page 255.
See “Editing web applications” on page 281.
See “Managing cloud sources” on page 330.
Viewing the status of a remote installationYou can view the progress of a remote installation of a Data Insight server or aWindows File Server agent, whether you have initiated the installation from theManagement server or by using the command line utility.
To view the status of a remote installation
1 From the Data Insight Management Console, navigate to Settings >Installation Status.
2 The progress of the ongoing operations is displayed along with the followinginformation:
■ The node for which the installation was initiated.
■ The status of the installation.
113Configuring Data Insight product serversViewing the status of a remote installation
■ Time when the installation was initiated.
3 Click View Progress to view a more detailed status of the install operation.
114Configuring Data Insight product serversViewing the status of a remote installation

Configuring savedcredentials
This chapter includes the following topics:
■ About saved credentials
■ Handling changes in account password
About saved credentialsAn authentication credential can be stored as a saved credential in a centralcredential store. It can be defined once, and then referenced by any number offilers, shares, and Active Directory servers. Passwords are encrypted before theyare stored.
The saved credential store simplifies management of user name and passwordchanges.
You can add, delete, or edit stored credentials.
See “Managing saved credentials ” on page 115.
Managing saved credentialsYou can add saved credentials to Data Insight, view details of the configuredcredentials and delete one or more saved credentials on the Saved Credentialsdetails page.
You can add new credentials to the credential store. These credentials can laterbe referenced with the credential name.
5Chapter

To add a saved credential
1 In the Management Console, click Settings > Saved Credentials, and clickCreate Saved Credentials.
2 Enter the following information:
Enter your name for this stored credential.
The credential name must be unique withinthe credential store. The name is used onlyto identify the credential.
Saved Credential Name
Enter the user name for authentication.Access Username
Enter the password for authentication.Access Password
Re-enter the password.Confirm Password
Enter the name of the domain to which theuser belongs.
Domain
3 Click Save.
4 You can later edit or delete credentials from the credential store.
You can delete or edit a saved credential.
To delete a saved credential
1 In the Management Console, click Settings > Saved Credentials.
2 Locate the name of the stored credential that you want to remove.
3 Click the Delete to the right of the name.
A credential can be deleted only if it is not currently used for filers, shares,Active Directory, Fpolicy service, EMC Celerra service, permission remediationscripts, custom action scripts, Enterprise Vault server, and as Data Insightserver credentials..
To edit a saved credential
1 Locate the name of the saved credential that you want to edit.
2 Click the Edit to the right of the name.
3 Update the user name or password.
4 If you change the password for a given credential, the new password is usedfor all subsequent scans that use that credential.
5 Click Save.
116Configuring saved credentialsAbout saved credentials

For the purpose of access control, only a user assigned the role of ServerAdministrator can add, edit, and view all saved credentials. A user assigned theProduct Administrator role can add new saved credentials, but can only view andedit those credentials which the user has created.
Handling changes in account passwordYou use various account credentials at the time of configuring the Data Insightsystem. Accounts are used when configuring the following:
■ Fpolicy Service
■ Celerra Service
■ Filers
■ SharePoint web applications
■ CMIS data sources, such as Documentum
■ Cloud data sources, such as Box, Microsoft OneDrive, or SharePoint Online
■ Scanner
■ Active Directory
Perform the following steps to ensure that updates to account passwords aresynchronized with the passwords used in Data Insight:
To handle changes in account password
1 Determine the places where the account is being used.
2 Log in to the Data Insight console and edit the saved credential password.
For example, navigate to Settings > Saved Credentials, and edit the credentialto update the password.
3 If the password of an account, which is used for Fpolicy service or Celerraservice configuration, has changed, you must reconfigure the services as well.
Navigate to Server details page for the corresponding nodes acting asCollectors, click the Reconfigure Fpolicy or Reconfigure Celerra sectionson the page.
See “Managing saved credentials ” on page 115.
117Configuring saved credentialsHandling changes in account password

Configuring directoryservice domains
This chapter includes the following topics:
■ About directory domain scans
■ Adding a directory service domain to Data Insight
■ Managing directory service domains
■ Fetching users and groups data from NIS+ scanner
■ Configuring attributes for advanced analytics
■ Deleting directory service domains
■ Scheduling scans
■ Configuring business unit mappings
■ Importing additional attributes for users and user groups
About directory domain scansVeritas Data Insight periodically scans the configured directory service domains inyour organization to fetch information about users and user groups. Data Insightcorrelates this information with file and folder access logs to provide access andusage reports. This information is stored on the Management Server in the userdatabase. Veritas recommends that you add each such domain to Data Insightwhose users access file system and SharePoint resources of your organization.The time it takes to scan a directory service domain depends on the number ofusers and groups in the domain.
6Chapter

Data Insight supports the following implementations of a directory service:
■ Microsoft Active Directory
■ Network Information Service
■ LDAP
By default, Data Insight also automatically scans local users of all Windows FileServer agents, all NetApp and Celerra filers, and SharePoint site collections.
See “Adding a directory service domain to Data Insight” on page 119.
Adding a directory service domain to Data InsightData Insight disables addition of directory service domains if you do not have avalid license or if your license has expired. See “Overview of Data Insight licensing”on page 24.
You can configure Data Insight to scan one or more directory service domains.
To add a directory service domain to Data Insight
1 In the console, click Settings > Directory Services to display the configureddirectory service domains in Data Insight.
2 From the Add New Directory Service drop-down, select the type of directoryservice domain you want to add Active Directory, LDAP, NIS, or NIS+.
3 On the Add New Directory Service page, enter the server properties.
4 Click Save.
5 On the Directory Services listing page, click Scan Now.
Once the initial scan is complete, the users and groups appear under theWorkspace tab.
Add/Edit Active Directory optionsUse this dialog box to add an Active Directory server to Data Insight, or edit theproperties of an existing Active Directory server.
119Configuring directory service domainsAdding a directory service domain to Data Insight

Table 6-1 Add/Edit Active Directory options
DescriptionField
Enter the name of the domain which you want to scan.
The domain name is used for display purpose only. The domain namethat appears on the Workspace tab depends on the name set in thedomain.
Domain Name
Enter the hostname or IP address of the Active Directory domaincontroller.
Domain ControllerIP
Do the following:
1 Select the saved credentials from the drop-down or specify newcredentials.
2 Click Test Credentials to test the availability of network connectionbetween the Management Server and the Active Directory Server,and also to verify that the credentials given are correct.
Veritas recommends that you test the connection before proceedingto ensure that the Management Server is able to scan the ActiveDirectory domain controller.
Scanning Details
Select the check box if you want to allow Data Insight to connect to theActive Directory server without a credential.
Use anonymous binding only when connecting to an Active Directoryserver belonging to a trusted domain.
Bind Anonymously
Select the check box to disable the scanning of the directory server.Disable scanning
Add/Edit LDAP domain optionsUse this dialog box to add a LDAP directory service server to Data Insight.
Table 6-2 Add/Edit LDAP properties options
DescriptionField
Enter the fully qualified name of the domain that you want to scan.Entering the FQDN will automatically populate the User and Groupsearch Base DN fields.
Fully QualifiedDomain Name
Enter the hostname and the port of the LDAP server.
By default, the LDAP server runs on HTTPS port 389. If TLS is enabled,the LDAP server runs on port 636, by default.
LDAP serveraddress
120Configuring directory service domainsAdding a directory service domain to Data Insight

Table 6-2 Add/Edit LDAP properties options (continued)
DescriptionField
The type of LDAP schema used by the directory service. Data Insightextracts the attributes from the schema attribute file when scanning thedomain. Select one of the following:
■ OPENLDAP■ Sun ONE
You can also create a schema attribute file with customized attributesfor each LDAP implementation that does not match the defaults. Ensurethat you name the file as ldap_<ldap_type>.conf and save it at$data\conf\ldap on the Management Server.
Type
The Organization Unit (OU) in which all users and groups have beendefined.
Search base DN
Select this check box if the LDAP server uses the TLS protocol.This directory usessecure connection(TLS)
121Configuring directory service domainsAdding a directory service domain to Data Insight

Table 6-2 Add/Edit LDAP properties options (continued)
DescriptionField
Select the saved credentials from the drop-down or specify newcredentials.
The credentials should belong to an LDAP user who has appropriateprivileges to scan the LDAP domain.
If you are specifying scanning credential other than the directoryadministrator, then make sure that you have specified the correct DNfor that user. For example,uid=ldapuser,ou=People,dc=openldap,dc=com. You can connect to theLDAP database to verify the DN for an LDAP user.
The example below shows the DN of a sample user, ldapuser, createdon a Linux openLDAP server:uid=ldapuser,ou=People,dc=openldap,dc=com.
The DN string may change depending upon the LDAP schema used.Refer to the LDAP schema to get correct DN for the user.
If specifying a user other than the directory administrator, ensure thatthe following limits have been set appropriately on the LDAP server:
■ nsSizeLimit - Specifies maximum entries that are returned inresponse to a Data Insight scan. Set this attribute to -1 to returnunlimited entries.
■ nsLookThroughLimit - Specifies the maximum number of Data Insightuser entries checked for matches during a search operation. Setthis attribute to -1 to indicate that there is no time limit.
■ limit.nsIdleTimeout - Specifies the time a Data Insight connectionto the server can be idle before it is terminated. The value is givenin seconds. Set this attribute to -1 to indicate that there is no timelimit.
The schema attribute names for setting these limits may vary dependingupon the LDAP implementation. The above example is for Sun ONE.
Scanning details
Click to verify that the given credentials are correct and to test theavailability of network connection between the Management Server andthe LDAP server.
Veritas recommends that you test the connection before proceeding toensure that the Management Server is able to scan the LDAP server.
Test Credentials
Select the check box if you want to allow Data Insight to connect to theLDAP server without a credential.
Select this option only if the LDAP server permits anonymousconnections.
Bind anonymously
122Configuring directory service domainsAdding a directory service domain to Data Insight

Table 6-2 Add/Edit LDAP properties options (continued)
DescriptionField
Select the check box to disable the scanning of the directory server.Disable scanning
Add/Edit NIS domain optionsUse this dialog box to add a NIS directory service server to Data Insight.
Table 6-3 Add/Edit NIS properties
DescriptionField
Enter the name of the domain that you want to scan.Fully QualifiedDomain Name
Enter the hostname or IP address of the NIS server.Hostname/IPaddress
Click Test Credentials to verify that the given credentials are correctand to test the availability of network connection between theManagement Server and the NIS server.
Veritas recommends that you test the connection before proceeding toensure that the Management Server is able to scan the NIS server.
Scanning Details
Select the check box to disable the scanning of the directory server.Disable scanning
Add/Edit NIS+ domain optionsUse this dialog box to add a NIS+ directory service server to Data Insight.
Table 6-4 Add/Edit NIS+ properties
DescriptionField
Enter the name of the domain that you want to scan.Fully QualifiedDomain Name
Enter the hostname or IP address of the NIS+ server.Hostname/IPaddress
123Configuring directory service domainsAdding a directory service domain to Data Insight

Table 6-4 Add/Edit NIS+ properties (continued)
DescriptionField
This check box is only available when adding a NIS+ server.
When configuring a NIS+ server, select the Configured in NIScompatibility mode check box if the NIS+ server is configured in theNIS compatibility mode. In this mode, Data Insight can fetch the usersand groups data from the NIS+ server remotely in most cases.
In non NIS-compatible mode or when Data Insight cannot scan usersand groups remotely, you must manually fetch the users and groupsdata from the NIS+ server.
See “Fetching users and groups data from NIS+ scanner” on page 125.
Configured in NIScompatibility mode
Click Test Credentials to verify that the given credentials are correctand to test the availability of network connection between theManagement Server and the NIS+ server.
Veritas recommends that you test the connection before proceeding toensure that the Management Server is able to scan the NIS+ server.
Scanning Details
Select the check box to disable the scanning of the directory server.Disable scanning
Managing directory service domainsYou can do the following on the Directory Services listing page:
■ Add directory service domains to Data Insight.
■ View details of the configured domains.
■ Scan one or more domains.
■ View the log of events for the configured directory service domains.
To manage the directory service domain servers
1 In the Console, click Settings > Directory Services to display the configureddirectory service domains in Data Insight.
2 Filter the list by using the Domain Type filter or by specifying the name of thedomain in the search bar at the top of the page.
3 Review the following information about the configured domains:
■ The name of the domain.
■ The address of the domain server hosting the domain.
■ The type of directory service - Microsoft Active Directory, LDAP, or NIS+.
124Configuring directory service domainsManaging directory service domains

■ The number of users and groups in the directory service domain.
■ The additional attributes that Data Insight extracts for the domain.
4 To scan all domains, click Scan Now.
Note: Data Insight scans all domains together because dependencies mightexist between the different domains.
5 To edit the scan schedule for the configured domains, click Edit Schedule.
By default, Data Insight scans all domains at 3:00 A.M. everyday.
On the Set Directory Scan Schedule dialog, change the schedule, and clickUpdate Schedule.
The updated schedule is used for all subsequent scans of the configureddomains.
6 To edit the properties of a directory service domain, from the Select Actionsdrop-down, select edit Edit.
On the directory service properties screen make the necessary changes, andclick Save.
7 To delete a configured directory service domain, from the Actions drop-down,select Delete.
Select OK on the confirmation message.
8 To view events pertaining to configured directory services, click Events.
The events of all directory services are displayed. You can filter these eventsby data, domain server name, severity, and the type of event.
Fetching users and groups data from NIS+scanner
If the NIS+ server is configured in a NIS non-compatible mode, you must manuallyfetch users and groups data from the NIS+ server. However, you must still add theNIS plus domain with correct information like domain name and IP address to DataInsight.
125Configuring directory service domainsFetching users and groups data from NIS+ scanner

To get users and groups data
1 Log in as root to the NIS+ server.
2 Open the command prompt, and type the following commands:
niscat passwd.org_dir >users.txt
To get users data
niscat group.org_dir >groups.txt
To get the groups data
3 Save the users.txt and groups.txt files at$data\users\nisplus\example.com on the Management Server, whereexample.com is your domain name.
4 On the Directory Services listing page, click Scan Now to import the NIS+domain data. You can also run the scan job from the command line by executingthe following command on the Management Server:
configcli execute_job ADScanJob
Configuring attributes for advanced analyticsData Insight lists the custom attributes along with their display names or aliasesthat are configured for a domain. It also provides you the ability to edit configuredattributes and add new custom attributes to Data Insight. Certain well-known customattributes such as Email are added to Data Insight by default. The Email attributeis used to send emails for reporting and remediation.
Data Insight also uses the configured attributes for the following purposes:
■ For advanced analytics, included in reports, and displayed on the console.
■ To sort users in a Social Network Map cluster based on the attribute distribution.
■ To group users who have activity on any given level in the hierarchy. Thisattribute-based grouping is displayed in theDashboard view of theWorkspacetab.
■ To create attribute-based filters. These filters are used to drill down the SocialNetwork Map to identify specific user(s) with the selected attribute.
Data Insight adds the following user attributes implicitly:
1. LatestSID: This attribute is used to keep a track of migration of users acrossdomains. Its value is the SID of the user in the new domain after migration.
126Configuring directory service domainsConfiguring attributes for advanced analytics

2. Watchlisted: This attribute indicates whether a user is watch-listed. Its valueis 1 for the users that are watch-listed.
See “Configuring Watchlist settings” on page 63.
Data Insight adds the following group attributes implicitly:
1. LatestSID: This attribute is used to keep a track of migration of groups acrossdomains. Its value is the SID of the group in the new domain after migration.
2. groupType: This is an Active Directory attribute that defines the type and scopeof the group.
Ensure that the names of configured attributes, including the ones fetchedthrough CSV file, are not the same as any of the implicitly added user or groupattributes. If the attributes are same, the process of updating user informationin the GUI slows down.
To configure user attributes
1 In the Management Console, click Settings > Directory Services. TheDomains page that lists all configured domains opens by default.
2 Click the Attributes sub-tab.
The page lists certain well-known attributes, such as Email and Manager. Youcan edit these attributes, but you cannot delete them.
3 ClickAdd NewCustomAttribute to add the additional attributes that you wantData Insight to extract from the directory service.
4 On the Custom Attributes pop-up, enter the following details:
■ The logical name for the attribute as displayed in Data Insight. You canenter a display name of the attribute.
■ From the Type of custom attribute drop-down, select whether the attributeapplies to a user or a group.
Data Insight extracts the following attributes from Active Directory for users :
■ displayName
■ distinguishedName
■ givenName
■ objectSid
■ sAMAccountName
■ memberOf
■ primaryGroupID
127Configuring directory service domainsConfiguring attributes for advanced analytics

■ userAccountControl
■ sn
Whereas, for user groups,Data Insight extracts the following attributes fromActive Directory:
■ distinguishedName
■ sAMAccountName
■ memberOf
■ objectSid
5 To edit a well-known custom attribute, click Edit and do the following:
■ Enter the default name of the attribute as used by your directory service.
■ Select the domain for which you want to specify an alias for the attribute.
■ Enter the name of the attribute. An attribute can be referred to by manydifferent names across domains. Specify the alias by which the attribute isnamed in the selected domain.The Domain Specific LDAP Attibute Names field supports theauto-complete feature. Data Insight provides suggestions for customattributes when you enter part of an attribute name in the field.For example, the attribute name, Department, can map to the alias Dept indomain A and Department in domain B. In this example, select A and enterthe Dept as the alias.
6 Select the Do not fetch attribute check box if the value for the attribute doesnot exist in the selected domain.
7 Click Add New LDAP Attribute Name to add other domain-specific namesfor the custom attribute.
8 Click Save.
For detailed information about using the Social Network Map to analyze collaborativeactivity, see the Veritas Data Insight User's Guide.
See “Choosing custom attributes for advanced analytics” on page 54.
Deleting directory service domainsYou can delete a configured directory service domain.
128Configuring directory service domainsDeleting directory service domains

To delete a directory service domain
1 In the Console, click Settings > Directory Services to display the configureddirectory service domains.
2 Click Select Action > Delete for the domain that you want to delete.
3 Click OK on the confirmation message.
Note: Users from a deleted directory domain are removed from Data Insight onlyafter the next directory scan runs.
Scheduling scansVeritas Data Insight scans configured domains everyday at 3:00 A.M., by default.You can, however, configure the scanning schedule, as needed.
Data Insight also scans local users of all file servers and site collections that aremanaged Data Insight. Information from these scans becomes visible in Data Insightafter the directory scan runs.
Note: Local user scans are not supported for Microsoft OneDrive and Documentumdata sources.
See “About directory domain scans” on page 118.
See “Managing directory service domains ” on page 124.
Configuring business unit mappingsVeritas Data Insight lets you associate a business unit name and business unitowner with each user imported from directory services. This information is laterincluded in the report outputs and also sent to Symantec Data Loss Prevention asa part of ownership information.
To import business unit mappings
1 Create a .csv file, bucsv.csv, in the users folder in the Data Insight datadirectory on the Management Server. By default, the users directory on theManagement Server is located at C:\DataInsight\data\users.
The CSV file must contain the following information:
■ The name of the user in the format, user@domain name.
■ The name of the business unit.
129Configuring directory service domainsScheduling scans

■ The name of the business unit owner.
For example, [email protected],Sales,Greg Smith
2 The information is imported into the users database when the next ActiveDirectory scan runs. To do so immediately, run the following command:
adcli.exe ––mode importbu
Note: The domain name that is given in the .csv file must be among the domainsthat are scanned by Data Insight.
Importing additional attributes for users and usergroups
Data Insight periodically scans directory domains and fetches basic informationabout users, groups, and their relationships. You can also import the additionalattributes for users and user groups from other user management systems intoData Insight users database. This attribute information is later included in the reportoutputs and also sent to Symantec Data Loss Prevention as a part of ownershipinformation.
To import additional attributes
1 Create and save a .csv file, customattr.csv in the users folder in the DataInsight data directory on the Management Server. By default, the users directoryon the Management Server is located at C:\DataInsight\data\users.
Note: When you save a .csv file with multibyte characters, you must selectUTF-8 encoding instead of unicode or default encoding.
The .csv file must contain the following information:
■ Whether the entity is a user or group.
■ The name of the user or group in the format, logon_name@domain name.
■ The type of custom attribute, for example, Email or DN. Four types of customattributes are defined, Integer, String, DNString, and Email.
■ The name of the custom attribute.
■ The value of the custom attribute. In case a custom attribute has multiplevalues, list each value separated by commas.
130Configuring directory service domainsImporting additional attributes for users and user groups

<user/group>,<logon_name@domain>,<value_type>,<attribute_name>,<value1><value2>,...<value_n>.
For example, user, [email protected], integer, age, 26
2 The information that is contained in the .csv file is imported into the usersdatabase when the next Active Directory scan runs. To do so immediately, runthe following command:
adcli.exe ––mode importcustomattr ––csvfile <location of csv file>
Note: To troubleshoot issues related to import of such attributes, check the log file,adcli.log in the log folder on the Management Server
131Configuring directory service domainsImporting additional attributes for users and user groups
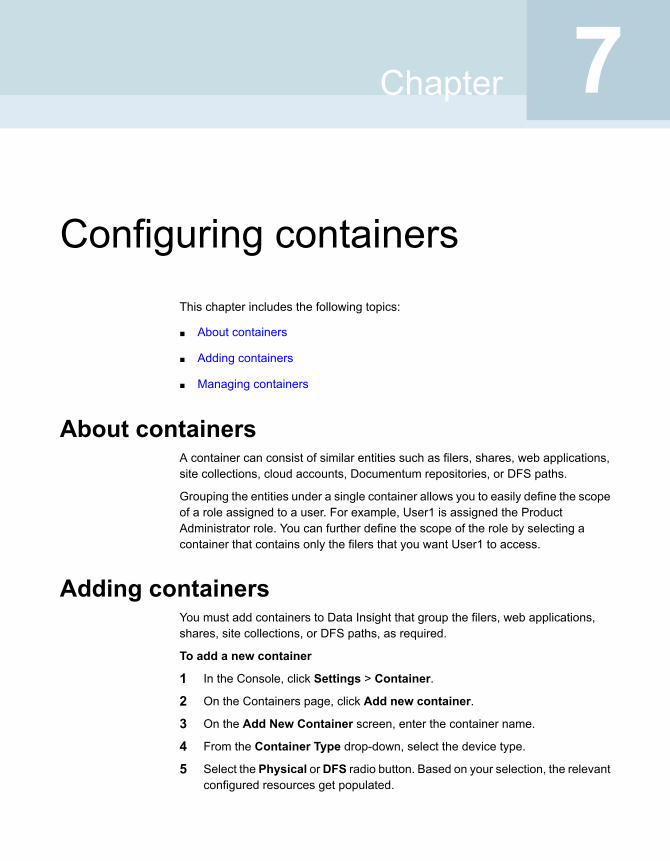
Configuring containersThis chapter includes the following topics:
■ About containers
■ Adding containers
■ Managing containers
About containersA container can consist of similar entities such as filers, shares, web applications,site collections, cloud accounts, Documentum repositories, or DFS paths.
Grouping the entities under a single container allows you to easily define the scopeof a role assigned to a user. For example, User1 is assigned the ProductAdministrator role. You can further define the scope of the role by selecting acontainer that contains only the filers that you want User1 to access.
Adding containersYou must add containers to Data Insight that group the filers, web applications,shares, site collections, or DFS paths, as required.
To add a new container
1 In the Console, click Settings > Container.
2 On the Containers page, click Add new container.
3 On the Add New Container screen, enter the container name.
4 From the Container Type drop-down, select the device type.
5 Select the Physical orDFS radio button. Based on your selection, the relevantconfigured resources get populated.
7Chapter

6 Select the resources that you want to add to the container. The selected dataset is listed in the Selected resources pane.
7 Click Add new container.
Add new container/Edit container optionsUse this dialog box to add a container to Veritas Data Insight or to edit theconfiguration of an existing container.
Table 7-1 Add new container/ Edit container options
DescriptionField
Enter a logical name for the container.Container Name
From the drop-down, select Filer/Web Application, Shares/SiteCollection, or DFS paths.
Based on the selection, Data Insight filters the list of entities.
Do the following to select the resources:
1 Select the Physical Hierarchy radio button to view theconfigured data sources.
Or select the DFS Hierarchy radio button to view theconfigured DFS paths in a domain.
2 The selected data set is listed in the Selected resourcespane.
Container Type
Managing containersYou can add containers to Data Insight, view details of the configured containers,edit the existing containers, and delete containers on the Containers listing page.
To edit the containers
1 In the Console, click Settings > Containers to display the Containers detailspage.
The list of configured containers appears.
2 Select the container and click Edit. You can change the container type andthe data set details.
3 On the Edit Container screen, make the necessary configuration changes.
4 Click Save.
See “Add new container/Edit container options” on page 133.
133Configuring containersManaging containers

To delete the containers
1 In the Console, click Settings > Containers to display the Containers detailspage.
The list of configured containers appears.
2 Select the container and click Delete.
3 Click OK on the confirmation message.
134Configuring containersManaging containers

Configuring native filesystems in Data Insight
■ Chapter 8. Configuring NetApp file server monitoring
■ Chapter 9. Configuring clustered NetApp file server monitoring
■ Chapter 10. Configuring EMC Celerra or VNX monitoring
■ Chapter 11. Configuring EMC Isilon monitoring
■ Chapter 12. Configuring EMC Unity VSA file servers
■ Chapter 13. Configuring Hitachi NAS file server monitoring
■ Chapter 14. Configuring Windows File Server monitoring
■ Chapter 15. Configuring Veritas File System (VxFS) file server monitoring
■ Chapter 16. Configuring monitoring of a generic device
■ Chapter 17. Managing file servers
■ Chapter 18. Renaming storage devices
3Section

Configuring NetApp fileserver monitoring
This chapter includes the following topics:
■ About configuring NetApp file server monitoring
■ Prerequisites for configuring NetApp file servers
■ Credentials required for configuring NetApp filers
■ Credentials required for configuring NetApp NFS filers
■ Configuring SMB signing
■ About FPolicy
■ Preparing Data Insight for FPolicy
■ Preparing the NetApp filer for Fpolicy
■ Preparing the NetApp vfiler for Fpolicy
■ Configuring NetApp audit settings for performance improvement
■ Preparing a non-administrator domain user on the NetApp filer for Data Insight
■ Enabling export of NFS shares on a NetApp file server
■ Excluding volumes on a NetApp file server
■ Handling NetApp home directories in Data Insight
8Chapter

About configuring NetApp file server monitoringData Insight supports the monitoring of Network Appliance (NetApp) 7-mode fileservers. When you add a NetApp file server to the Data Insight configuration, itautomatically discovers the CIFS and the NFS shares on the NetApp file server.
Data Insight uses the FPolicy framework to monitor the filer and collect accessevents from it.
To configure the monitoring of NetApp file servers in Data Insight, complete thefollowing tasks:
■ Complete the prerequisites for configuring the NetApp file servers.See “Prerequisites for configuring NetApp file servers” on page 137.
■ Review the credentials that are required for configuring the file server in DataInsight.See “Credentials required for configuring NetApp filers” on page 138.See “Preparing a non-administrator domain user on the NetApp filer for DataInsight” on page 151.
■ Configure the DataInsightFPolicy service on the Collector node that is configuredto monitor the filer.See “Preparing Data Insight for FPolicy ” on page 145.
■ Enable FPolicy on the NetApp file server to let the Data Insight FPolicy server(Collector node) to register with the NetApp filer.See “Configuring NetApp audit settings for performance improvement”on page 150.See “Preparing the NetApp filer for Fpolicy” on page 146.
■ To enable Data Insight to discover the NFS shares on the NetApp filer, enablethe export of NFS shares on the filer.See “Enabling export of NFS shares on a NetApp file server” on page 154.
■ Add the NetApp filer to the Data Insight configuration.See “Adding filers” on page 224.oSee “Add/Edit NetApp filer options” on page 225.
Prerequisites for configuring NetApp file serversBefore you start configuring NetApp filers, verify the following:
■ The filer is accessible from the collector node using the short name or IP addressyou plan to use when adding the filer.
137Configuring NetApp file server monitoringAbout configuring NetApp file server monitoring

■ There is connectivity to the collector node from the filer using the short nameand the Fully Qualified Host Name (FQHN) of the Collector node.
■ The DNS lookup and reverse-lookup for hostname of the Collector node fromthe filer is working fine.
■ The http port 80 and standard RPC ports are open in the firewall.
■ The local security policies are set. The installer automatically registers the localsecurity policies on all supported versions of Windows machines which are usedas collector nodes. However, if the installer fails to register the security policies,you must set them manually. Click Administrative Tools > Local SecurityPolicy > Local Policies > Security Options and change the following settings:
■ Network access: Named Pipes that can be accessed anonymously - AddNTAPFPRQ to the list.
You must restart the machine after making these changes.
See “Configuring NetApp audit settings for performance improvement” on page 150.
Credentials required for configuring NetApp filersTable 8-1 lists the set of credentials that are required by Veritas Data Insight duringsystem configuration.
Table 8-1 Credentials for configuring NetApp filers
DetailsCredential
The credential should belong to a user in thedomain of which the Data Insight Collectornode and the NetApp filers are a part. Thisuser should be a part of the BackupOperators group on the filer.
The credential should belong to the samedomain as that of the Collector node assignedto the filer. However, when you add filers, theaccount you specify during filer configurationmust be a domain user and must haveBackup Operator privileges on the filer.
Note: LocalSystem account is not supported.
Credentials required to configureDataInsightFpolicy service.
The DataInsightFpolicy service runs on theCollector and processes the events that aresent by the NetApp filer using the FPolicyRPC interface. This service must beconfigured on each Collector that is used toconnect to NetApp filers.
DataInsightFpolicy service also performsmiscellaneous tasks, such as gatheringstorage information from the filer.
138Configuring NetApp file server monitoringCredentials required for configuring NetApp filers

Table 8-1 Credentials for configuring NetApp filers (continued)
DetailsCredential
Required to discover shares and enableFPolicy on the NetApp filer. This credentialbelongs to the NetApp ONTAP user who hasadministrative rights on the NetApp filer (forexample, root) or a domain user who is partof the Administrators group on the filer.
Or, this credential belongs to the NetAppONTAP user or a domain user who is anon-administrator user on the filer, but hasspecific privileges.
See “Preparing a non-administrator domainuser on the NetApp filer for Data Insight”on page 151.
Note: The domain user can be the sameuser account that was specified whenconfiguring the DataInsightFpolicy service.
If you use the Local System account toconfigure the DataInsightFpolicy service onthe Collector, the user you specify here mustalso belong to the Backup Operators groupon the filer.
See “Preparing Data Insight for FPolicy ”on page 145.
Credentials required during filer configurationthrough the Data Insight ManagementConsole.
139Configuring NetApp file server monitoringCredentials required for configuring NetApp filers

Table 8-1 Credentials for configuring NetApp filers (continued)
DetailsCredential
Credentials required for scanning of shares.
140Configuring NetApp file server monitoringCredentials required for configuring NetApp filers

Table 8-1 Credentials for configuring NetApp filers (continued)
DetailsCredential
Required for scanning of shares from theNetApp filer.
When scanning CIFS shares, this credentialbelongs to the user in the domain of whichthe NetApp filer is a part. This user mustbelong to either the Power Users orAdministrator's group on the NetApp filer. Ifthe credential is not part of one of thesegroups, the scanner will not be able to getshare-level ACLs for shares of this filer.
You do not need this privilege if you do notwant to get the share-level ACLs. In this caseyou will only need privileges to mount theshare and scan the file system hierarchy.
You must have the share-level READpermission. Additionally, the folder within theshare must have the following file systemACLs:
■ Traverse Folder/Execute File■ List Folder/Read Data■ Read Attributes■ Read Extended Attributes■ Read Permissions
For scanning NFS shares, Data Insight needsa UNIX account with at least read andexecute permissions on all folders, along withat least Read permission on all files. Bydefault, Data Insight uses User ID or GroupID 0 to scan NFS shares. You can configurean alternate User ID or Group ID from theSettings > Advanced Settings section ofthe Collector node.
See “Configuring advanced settings”on page 88.
When monitoring only NFS shares, you canspecifyUse Local System account from thescanning credentials drop-down, else you canspecify credentials required to scan CIFSshares.
141Configuring NetApp file server monitoringCredentials required for configuring NetApp filers

Table 8-1 Credentials for configuring NetApp filers (continued)
DetailsCredential
Note: Veritas recommends that thecredentials used to discover shares on theNetApp file server must be the same as thecredentials used to configureDataInsightFpolicy the service.
Credentials required for configuring NetApp NFSfilers
Table 8-2 lists the set of credentials that are required by Veritas Data Insight duringsystem configuration.
Table 8-2 Credentials for configuring NetApp NFS filers
DetailsCredential
The credential should belong to a user in thedomain of which the Data Insight Collectornode and the NetApp filers are a part. Thecredential should also be part of the localBackup Operators group of each of theNetApp filer being monitored by the Collectorassigned to the filer.
Note: LocalSystem account is not supported.
Credentials required to configureDataInsightFpolicy service.
The DataInsightFpolicy service runs on theCollector and processes the events that aresent by the NetApp filer using the FpolicyRPC interface. This service must beconfigured on each Collector that is used toconnect to NetApp filers.
DataInsightFpolicy service also performsmiscellaneous tasks, such as gatheringstorage information from the filer.
142Configuring NetApp file server monitoringCredentials required for configuring NetApp NFS filers

Table 8-2 Credentials for configuring NetApp NFS filers (continued)
DetailsCredential
Required to discover shares and enableFpolicy on the NetApp filer. This credentialbelongs to the NetApp ONTAP user who hasadministrative rights on the NetApp filer (forexample, root) or a domain user who is partof the Administrators group on the filer.
Or, this credential belongs to the NetAppONTAP user or a domain user who is anon-administrator user on the filer, but hasspecific privileges.
See “Preparing a non-administrator domainuser on the NetApp filer for Data Insight”on page 151.
See “Preparing Data Insight for FPolicy ”on page 145.
Credentials required during filer configurationthrough the Data Insight ManagementConsole.
Required for scanning of shares from theNetApp filer.
This credential belongs to the user in thedomain of which the NetApp filer and the DataInsight Collector node are a part. This usercan also be the same domain user who isauthorized to run the DataInsightFpolicyservice.
You can also use the LocalSystem accountfor scanning.
Additionally, you must also have share-levelREAD permissions on the NFS export.
Note: Veritas recommends that thecredentials used to discover shares on theNetApp file server should be the same as thecredentials used to configureDataInsightFpolicy the service.
Credentials required for scanning of shares.
Configuring SMB signingEnsure that Server Message Block (SMB) signing is either turned on or turned offon both the Collector node and the NetApp filer. If SMB signing is turned on, all
143Configuring NetApp file server monitoringConfiguring SMB signing

packets of data that is sent over a network to a remote host are signed. A mismatchin the setting on the Collector node and the NetApp filer can cause the filer to dropthe FPolicy connection to the Collector node.
To configure SMB signing
1 Check whether the SMB signing option on the NetApp filer, optionscifs.signing.enable is set to off or on.
2 On the Collector node that is assigned to the NetApp filer, open the Windows’Registry Editor (Start > Run > regedit).
3 In Registry Editor, navigate to HKEY_LOCAL_MACHINE > SYSTEM >CurrentControlSet >SERVICES > LanmanServer > Parameters.
4 Modify the following registry entries:
■ enablesecuritysignature - Enter the value 0 to turn signing off and enterthe value 1 to turn on signing.
■ requiredsecuritysignature - Enter the value 0 to turn signing off andenter the value 1 to turn on signing.
About FPolicyVeritas Data Insight uses the FPolicy framework provided by NetApp to collectaccess events from the NetApp filers.
NetApp provides an interface called FPolicy which allows external applications toreceive file access notifications from the NetApp Storage subsystem. FPolicy allowspartner applications to perform tasks like file access screening and auditing. TheFPolicy interface uses Remote Procedure Calls (RPC) and external applicationscan use these tools to register with the NetApp Filer as FPolicy servers. FPolicysupports both CIFS and NFS.
The unit of FPolicy configuration on the NetApp filer is called a policy, which isidentified by a user specified name. You can configure a policy to monitor all or alist of volumes on the NetApp filer along with a specified set of operations. Themonitored operations are open, close, read, write, create, delete, rename, and setattribute. As soon as a file operation is performed on a file or folder on the filer whichis being monitored, a notification is sent to the registered FPolicy serverasynchronously.
Note: The policy created by Veritas Data Insight should not be shared by any otherapplications or clients.
144Configuring NetApp file server monitoringAbout FPolicy

By default, Data Insight does not register for read and close events from NetAppfilers. Data Insight treats an open event as a read event. This behavior reduces theload on the filer in case of peak traffic loads from third party applications like backupsover CIFS. It also does not have an adverse effect for most consumer applicationsbecause consumer applications seldom write to a file before first reading it. DataInsight assumes that an open event is almost always be followed by a read eventand then optionally by a write event. However, you can customize the defaultbehavior as per your requirements.
See “Enabling export of NFS shares on a NetApp file server” on page 154.
See “Preparing the NetApp filer for Fpolicy” on page 146.
See “Configuring NetApp audit settings for performance improvement” on page 150.
Preparing Data Insight for FPolicyThe Data Insight FPolicy server can reside on the Management Server and/or oneach Collector worker node. The Management Server and/or the Collector workernode must register with the NetApp filer to receive audit information. Before youassign a Data Insight server as a collector for a NetApp filer, you must configurethe FPolicy service on that server.
To set up the environment for Data Insight FPolicy service
1 Provision a supported version of Windows server in the same Active Directorydomain as the filers you want to monitor using FPolicy. This computer hoststhe FPolicy server. Ensure that the filer and the FPolicy server are part of thesame domain.
2 Install the Data Insight Collector worker node or the Data Insight ManagementServer on this server.
3 Logon to the Data Insight Management Console.
4 In the Console, click Settings > Data Insight Servers to open the listing pagefor the server.
5 Select the server from the server list to open the details page for the server.
6 Click the Services tab.
7 Select DataInsightFPolicy to expand the section.
8 In the Policy Name field, enter the policy name that will be enabled on eachfiler, of this node Collector. The default name is matpol.
145Configuring NetApp file server monitoringPreparing Data Insight for FPolicy

9 Under Credentials, select the saved credentials that the service needs to runas. The credentials must belong to the Backup Operators group on the NetAppfiler that is being monitored by the Collector.
See “Credentials required for configuring NetApp filers” on page 138.
10 Click Configure to apply these settings to the server and start the FPolicyservice.
See “Configuring SMB signing” on page 143.
See “About FPolicy” on page 144.
Preparing the NetApp filer for FpolicyThe Veritas Data Insight Fpolicy server registers with the NetApp filer and receivesfile access events from it. Fpolicy must be enabled and configured on that NetAppfiler. Veritas recommends that you automatically configure FPolicy on the filer toenable auditing when adding filers.
See “Adding filers” on page 224.
However if you want more control on the shares you want to monitor use the manualsteps. The manual steps are valid for NetApp ONTAP version 7.0 and higher.
Note: The steps below assume that the name of the policy is matpol.
To configure the Fpolicy on the NetApp filer using manual steps
1 Launch a Telnet session with the filer and run the following commands, asappropriate:
■ To create a policy:
fpolicy create matpol screen
■ To enable a policy:
fpolicy enable matpol -f
2 Use the following optional commands for monitoring:
■ To set the Fpolicy for CIFS to monitor specific events:
fpolicy mon add matpol -p cifs -f write,
open,close,delete,rename,create
■ To set the Fpolicy for NFS to monitor specific events:
146Configuring NetApp file server monitoringPreparing the NetApp filer for Fpolicy

fpolicy mon add matpol -p nfs -f create,delete,rename,write,
open,link,symlink,setattr
■ To monitor specific events on NetApp filer versions 7.3 or higher:
■ Enable set attributes operation:
fpolicy mon options cifs_setattr on - add mon
fpolicy mon options nfs_setattr on - add
■ Add events to be monitored:
fpolicy mon add matpol -p cifs -f write,
open,close,delete,rename,create,setattr
fpolicy mon add matpol -p nfs -f create,delete,rename,write,
open,link,symlink,setattr
■ To see details of a configured policy:
fpolicy show matpol
■ To disable monitoring of specific events:
fpolicy mon remove matpol -p cifs -f write,
open,close,delete,rename,create
fpolicy mon remove matpol -p nfs -f create,delete,rename,write,
open,link,symlink,setattr
■ To disable use of a policy:
fpolicy disable matpol
■ To delete a policy:
fpolicy destroy matpol
147Configuring NetApp file server monitoringPreparing the NetApp filer for Fpolicy

3 To add a domain user to the administrator's group:
useradmin domainuser add domain-username
-g Administrators
Note: The domain user is the user who is configured to run the Fpolicy serviceon the collector.
To configure a non-administrator user:
See “Preparing a non-administrator domain user on the NetApp filer for DataInsight” on page 151.
4 To display a list of users who are already configured:
useradmin domainuser list -g Administrators
A list with the SIDs of the configured domain users appears. To resolve theSIDs, run the following command:
cifs lookup SID
See “Configuring SMB signing” on page 143.
Preparing the NetApp vfiler for FpolicyThe Data Insight Fpolicy server can register with the NetApp vfiler and receive fileaccess events from it. Fpolicy has to be enabled and configured on that NetAppvfiler manually.
To configure the Fpolicy on the NetApp vfiler using manual steps
1 Launch a Telnet session with the filer and run the following commands, asappropriate:
■ To get the vfiler name:
vfiler status
Choose the name of the vfiler that you want to configure and then performthe following operations for that vfiler. Ignore the name, vfiler0, which is thedefault name given to the physical filer by NetApp.
148Configuring NetApp file server monitoringPreparing the NetApp vfiler for Fpolicy

Note: Consult your system administrator to get the IP address of the vfiler.You will need this IP address while adding the vfiler from the ManagementConsole.
See “Adding filers” on page 224.
■ To create a policy:
vfiler run vfilername fpolicy create matpol screen
■ To enable a policy:
vfiler run vfilername fpolicy enable matpol -f
2 Use the following optional commands for monitoring:
■ To set the Fpolicy for CIFS to monitor specific events:
vfiler run vfilername fpolicy mon add matpol -p cifs
-f write,open,close,delete,rename,create
To set Fpolicy for NFS to monitor specific events:
vfiler run vfilername fpolicy mon add matpol -p nfs -f create,
delete,rename,write,open,link,symlink,setattr
■ To set the Fpolicy for CIFS to monitor specific events on NetApp filerversions 7.3 or higher:
■ Enable set attributes operation:
vfiler run vfilername fpolicy options cifs_setattr on
vfiler run vfilername fpolicy options nfs_setattr on
■ Add events to be monitored:
vfiler run vfilername fpolicy mon add matpol -p cifs
-f write,open,close,delete,rename,create,setattr
vfiler run vfilername fpolicy mon add matpol -p nfs -f create,
delete,rename,write,open,link,symlink,setattr
■ To see details of a configured policy:
vfiler run vfilername fpolicy show matpol
149Configuring NetApp file server monitoringPreparing the NetApp vfiler for Fpolicy

■ To disable monitoring of specific events:
vfiler run vfilername fpolicy mon remove matpol -p cifs
-f write,open,close,delete,rename,create
vfiler run vfilername fpolicy mon remove matpol -p nfs -f create,
delete,rename,write,open,link,symlink,setattr
■ To disable use of a policy:
vfiler run vfilername fpolicy disable matpol
■ To delete a policy:
vfiler run vfilername fpolicy destroy matpol
where, vfilername is the name of the vfiler you want to configure.
3 To add a domain user to the administrator's group:
vfiler run vfilername useradmin domainuser
add domain-username -g Administrators
Note: The domain user is the user who is configured to run the Fpolicy serviceon the collector. See “Preparing the NetApp filer for Fpolicy” on page 146.
To configure a non-administrator user:
See “Preparing the NetApp filer for Fpolicy” on page 146.
4 To display a list of users who are already configured:
vfiler run vfilername useradmin domainuser list
-g Administrators
A list with the SIDs of the configured domain users appears. To resolve theSIDs, run the following command:
cifs lookup SID
Configuring NetApp audit settings forperformance improvement
As a default behavior, Data Insight collects audit events for all volumes and exportpolicies which may affect the performance in case of environments with high I/O
150Configuring NetApp file server monitoringConfiguring NetApp audit settings for performance improvement

loads. This may lead to serious degradation of filer performance and increase theresource utilization when you enable auditing in a clustered NetApp file server.
To alleviate the array performance impact in such scenarios, Veritas recommendsthat NFS export polices on NetApp Cluster Storage Virtual Machines (SVM) thathost application volumes or application exports must be scoped for the I/O capturedor eliminated. This is to ensure that they are excluded from audit monitoring beforeyou enable FPolicy.
You can choose to exclude certain volumes and policies from being monitored byFPolicy by using the FPolicy scope configuration. Consult the NetApp documentationfor information on configuring exclusions under FPolicy scopes.
Preparing a non-administrator domain user onthe NetApp filer for Data Insight
To configure a NetApp filer from the Management Console, you can use an accountwhich is not in the administrators group on the NetApp filer, but has some specificprivileges.
Perform the following steps on the NetApp filer console to add a non-administratoruser, for example, testuser.
To create a non-administrator user
1 Create a new role, for example testrole, using the useradmin utility on the filer.
2 Add the login-* and API-* capabilities to the role.
For example, useradmin role add testrole -a login-*,api-*.
You can also choose to assign specific capabilities to the role.
Table 8-3 provides a detailed description of each capability.
3 Create a new group, for example, testgroup and apply the role testrole to it.
For example, useradmin group add testgroup -r testrole.
151Configuring NetApp file server monitoringPreparing a non-administrator domain user on the NetApp filer for Data Insight

4 Add the user testdomain\testuser to testgroup
For example, useradmin domainuser add testdomain\testuser -g
testgroup.
5 Add the user testdomain\testuser to Backup Operators group.
For example, useradmin domainuser add testdomain\testuser -g Backup
Operators.
Note: For vfilers, append the above command-line examples with vfiler run
<vfilername>.
Table 8-3 Additional capabilities for adding a non-administrator user account
DescriptionCapability
Enables you to log into the NetApp filer and runcommands. With this capability, you can get latencystatistics (for scan throttling), volume size information, ordiscover shares.
login-http-admin
Enables you to get the ONTAPI version number and thesystem version number respectively. These are requiredto set the login handle context properly. Data Insightreports a failure when you test the connection to the filer,if these capabilities are absent. Also, if these capabilitiesare absent, you cannot execute any APIs including thoserequired to discover shares, and get latency statistics.
api-system-get-ontapi-version
api-system-get-version
Enables you to set a flag on the NetApp filer to enableACL change notifications. If you choose not to supply thiscapability to Veritas, the filer administrator must set thisproperty manually using the root telnet console (fpolicyoptions <policyname> cifs_setattr on).
api-fpolicy-set-policy-options
Required to enable Data Insight to automatically createand enable FPolicy on the NetApp filer. Optionally, the fileradministrator can set up the policy using the root telnetconsole.
Data Insight reports a failure when you test the connectionto the filer, if these capabilities are absent. However, youcan save a filer with the policy that is already created andenabled by the filer administrator without testing theconnection to the filer.
api-fpolicy-list-info
api-fpolicy-create-policy
api-fpolicy-enable-policy
api-fpolicy-disable-policy
api-fpolicy-destroy-policy
152Configuring NetApp file server monitoringPreparing a non-administrator domain user on the NetApp filer for Data Insight

Table 8-3 Additional capabilities for adding a non-administrator user account(continued)
DescriptionCapability
Used to retrieve useful statistics from the NetApp filer,such as, total event count and event failures. These APIsare used every two hours so they do not load the system.However, absence of these capabilities does not causeany problems.
api-fpolicy-server-list-info
api-fpolicy-list-info
Used to check if this NetApp filer has CIFS license andprint the appropriate diagnostic message.
Data Insight reports a failure when you create or enableFPolicy on the filer or when you test the connection to thefiler, if these capabilities are absent. However, you cansave a filer with the policy that is already created andenabled by the filer administrator without testing theconnection to the filer.
api-license-list-info
Used to enable the global FPolicy flag on the NetApp filer.
In the absence of this capability, FPolicy creation fails.Also, Data Insight reports a failure when you test theconnection to the filer, if these capabilities are absent.However, you can save a filer with the policy that is alreadycreated and enabled by the filer administrator withouttesting the connection to the filer.
api-options-set
Used to discover shares on the NetApp filer. Absence ofthese capabilities can result in a failure to discover theshares. Optionally, you can add shares manually from theData Insight console.
api-cifs-share-list-iter-start
api-cifs-share-list-iter-next
api-cifs-share-list-iter-end
Used to get CIFS latency information from the NetApp filer,which enables the self-throttling scan feature of DataInsight. Absence of these APIs can cause scanner to failif you enable the feature to throttle scanning.
api-perf-object-get-instances-iter-start
api-perf-object-get-instances-iter-next
api-perf-object-get-instances-iter-end
Used to periodically fetch size information for NetAppvolumes.
api-volume-list-info
Used to discover all NFS shares that are exported fromthe NetApp filer. If this capability is absent, these NFSshares are not discovered.
api-nfs-exportnfs-list-rules
api-nfs-exportnfs-list-rules-2
153Configuring NetApp file server monitoringPreparing a non-administrator domain user on the NetApp filer for Data Insight

Table 8-3 Additional capabilities for adding a non-administrator user account(continued)
DescriptionCapability
Used to check network connectivity from the filer to theData Insight Collector. These APIs are useful to run somediagnostic checks on the filer. However, such checks canalso be done manually by the NetApp administrator, andhence these APIs are not mandatory.
api-net-ping
api-net-resolve
Used to set the volume names on the filer which are to beexcluded from being monitored by FPolicy.
If this capability is absent, you cannot exclude volumesfrom being monitored by FPolicy from the Data Insightconsole . However, you can exclude volumes manuallyusing the CLI on the NetApp console.
See “Excluding volumes on a NetApp file server”on page 155.
api-fpolicy-volume-list-set
Used to discover the NetApp system serial number. Theinformation is used by external reporting tools like VeritasOperations Manager (VOM) to report about the NetAppfilers that Data Insight monitors. This privilege is mandatoryif VOM integration is required.
api-system-get-info
Enabling export of NFS shares on a NetApp fileserver
Before you add a NetApp filer to Data Insight, you must enable the export of NFSshares on the NetApp filer to allow Data Insight to discover the NFS shares on thefiler.
To enable export of NFS shares on the NetApp filer
1 On the NetApp filer web console, select NFS > Manage exports.
2 On the Export wizard, click Add Export or you can edit the existing exports tomodify them.
3 On the first page of the wizard ensure that you have at least selected read onlyand root access, Other options can also be specified, as required, and clickNext.
4 Define the export path and give read only access to the Data Insight Collectornode, and click Next.
154Configuring NetApp file server monitoringEnabling export of NFS shares on a NetApp file server

5 On the Read-Write Access page, enable read-write access for all clients or forspecific hosts, as per your need.
6 Click Next.
7 On the Root Access page, define root access to the Data Insight Collectornode, and click Next.
8 On the Security page, accept the default options, and click Next.
9 On the Summary page, review the configuration and click Commit to save thechanges.
See “Adding filers” on page 224.
See “Add/Edit NetApp filer options” on page 225.
Excluding volumes on a NetApp file serverTo optimize the performance of a NetApp file server. you can choose to exclude aset of volumes from being monitored by FPolicy using NetApp commands.
If a configured NetApp filer hosts applications that create a huge number of accessevents on certain volumes, it may cause a high I/O latency for CIFS. Veritasrecommends that you exclude such volumes from being monitored by FPolicy.
To exclude volumes on the NetApp filer
1 Log in to the Net App file server.
2 Execute the following command:
fpolicy vol exc add <name of policy> <comma separated name list
of volumes to be excluded>
Note that the list of volumes is not the path of the volumes, but names of thevolumes.
Handling NetApp home directories in Data InsightData ONTAP enables you to create users’ home directories on the NetApp storagesystem. You can access your home directory share the same way you can accessany other share on the file system. You can connect only to your home directorymatching your user name without seeing other users’ home directories. The username for matching a home directory can be a Windows user name, a domain namefollowed by a Windows user name, or a UNIX user name. Refer the NetAppdocumentation for more details about how Data ONTAP matches a home directorywith a user,
155Configuring NetApp file server monitoringExcluding volumes on a NetApp file server

Data Insight cannot parse FPolicy events coming from home directory sharesbecause of insufficient information regarding mapping to existing shares. To monitorevents on home directory shares, you must configure an artificial share in DataInsight. This share represents all home directories on a NetApp filer, and eventsfrom the users' home directories are directed to this share. Note that Data Insightdoes not scan the artificial share.
To configure an artificial share in Data Insight
1 Log in toData Insight Management Console.
2 Click Settings > Filers.
3 Click the filer for which you want to add a share.
4 On the filer details page, click Monitored Shares.
5 On the Monitored Shares page, click Add New Share.
6 On the New Share pop-up, enter the following details:
■ The name of the share that you want to add - CIFS.HOMEDIR.
■ The physical path of the share on the filer -/CIFS.HOMEDIR..
7 Select the Define custom cron schedule radio button, and select Never fromthe schedule drop-down.
8 To verify that the share is added, on the Management Console, navigate toSettings > Filers.
9 Click the relevant filer. On the filer details page, click the Monitored Sharestab to review the list of configured shares.
10 Repeat the steps for each NetApp filer for which you want to add an artificialshare.
156Configuring NetApp file server monitoringHandling NetApp home directories in Data Insight

Configuring clusteredNetApp file servermonitoring
This chapter includes the following topics:
■ About configuring a clustered NetApp file server
■ About configuring FPolicy in Cluster-Mode
■ Pre-requisites for configuring clustered NetApp file servers
■ Credentials required for configuring a clustered NetApp file server
■ Preparing a non-administrator local user on the clustered NetApp filer
■ Preparing a non-administrator domain user on a NetApp cluster for Data Insight
■ Preparing Data Insight for FPolicy in NetApp Cluster-Mode
■ Preparing the ONTAP cluster for FPolicy
■ About configuring secure communication between Data Insight and cluster-modeNetApp devices
■ Enabling export of NFS shares on a NetApp Cluster-Mode file server
About configuring a clustered NetApp file serverVeritas Data Insight supports the monitoring of CIFS shares on clustered NetApp8.2.1 or later NAS devices along with standalone NetApp file servers.
9Chapter

On Clustered Data ONTAP (cDOT) versions 8.2.3 and 8.3.1, Data Insight alsosupports monitoring of NFS exports.
In Data ONTAP Cluster-Mode (C-mode), a Storage Virtual Machine (SVM) is alogical unit within an ONTAP cluster which can contain a CIFS server and an SVMwith NFS protocol enabled. An SVM facilitates data access within a cluster. Itcontains data volumes and one or more LIFs through which they serve data to theclients. For the purpose of monitoring, a CIFS server within an SVM represents afiler for Data Insight. Every SVM can have multiple physical nodes. Data Insightuses the FPolicy interface on ONTAP to receive event notifications, which are sentin XML format over a TCP connection to the Data Insight's FPolicy server.
Data Insight automatically discovers the following entities in the cluster environment:
■ The SVMs and the CIFS server underneath each SVM.
■ The CIFS shares for each CIFS server.
■ The NFS exports on the NetApp cluster.
To enable Data Insight to discover shares in the cluster, you must ensure thefollowing:
■ Complete all the pre-requisites.See “Pre-requisites for configuring clustered NetApp file servers” on page 159.
■ Provide correct cluster user credentials when adding the clustered file server.You can also use the credentials of a local cluster administrator user.See “Credentials required for configuring a clustered NetApp file server”on page 161.
■ You can also choose to configure the NetApp cluster in Data Insight by usingSSL certificates.See “About configuring secure communication between Data Insight andcluster-mode NetApp devices” on page 169.
■ Configure the DataInsightFPolicyCmod service on the Collector that is configuredto monitor the filer.See “Preparing Data Insight for FPolicy in NetApp Cluster-Mode” on page 167.
■ After you add a CIFS server or an SVM with NFS protocol enabled from theONTAP cluster to Data Insight, Data Insight automatically enables FPolicy onthe corresponding SVM on the ONTAP cluster. This operation helps the ONTAPcluster register with the Data Insight FPolicy server. Note that in ONTAP 8.2Cluster-Mode, the connection is initiated by ONTAP.See “Preparing the ONTAP cluster for FPolicy” on page 168.
■ Add the clustered NetApp file server to the Data Insight configuration.
■ See “Adding filers” on page 224.
158Configuring clustered NetApp file server monitoringAbout configuring a clustered NetApp file server

See “Add/Edit NetApp cluster file server options” on page 229.
Once a TCP connection is established with the Data Insight FPolicy server (Collectornode), it starts receiving access event information from the ONTAP cluster.
About configuring FPolicy in Cluster-ModeFPolicy is a file access notification framework which allows screening of NFS andCIFS accesses. See “About FPolicy” on page 144.
In case of a Cluster-Mode configuration, FPolicy requires that all the nodes in theNetApp cluster are running Data ONTAP 8.2 or later.
To receive access events from the ONTAP cluster, you must first install theDataInsightFPolicyCMod service on the Data Insight Collector node that is configuredto monitor the NetApp cluster. The service communicates with the NetApp clusterand fetches information about the file operations that Data Insight monitors. DataInsight automatically configures the list of operations to monitor when you add theNetApp cluster to Data Insight. However, you can also choose to configure theoperations to be monitored manually.
Note: The FPolicy server for a NetApp standalone (7-mode) configuration andC-Mode configuration can co-exist on the same Data Insight Collector node.
For detailed information about the DataInsightFPolicyCmod service, see the VeritasData Insight Installation Guide.
See “Preparing Data Insight for FPolicy in NetApp Cluster-Mode” on page 167.
See “Preparing the ONTAP cluster for FPolicy” on page 168.
Pre-requisites for configuring clustered NetAppfile servers
Before you can start using Data Insight to monitor the NetApp file servers operatingin Cluster-Mode, verify the following:
■ ONTAP version 8.2.1 or higher cluster is configured in accordance with NetAppdocumentation. Note that Data Insight supports the monitoring of NFS exportson Clustered Data ONTAP (cDOT) versions 8.2.3 and 8.3.1 or higher.
Note: Data Insight does not support monitoring of NFS exports on ClusteredData ONTAP (cDOT) version 8.3.
159Configuring clustered NetApp file server monitoringAbout configuring FPolicy in Cluster-Mode

■ Veritas recommends that Windows 2008 or Windows 2008 R2 server is usedas the Collector node, if you want to NFS exports on NetApp Cluster-Mode.
■ The DataInsightFPolicyCmod service is installed on the Data Insight Collectorthat is configured to monitor the NetApp filers operating in Cluster-Mode.The Data Insight FPolicy server for NetApp cluster runs on a standardrecommended computer for the Data Insight Collector node. However, a Windows2008 or Windows 2012 64bit server with 8GB RAM and quad core processoris preferred.
■ To discover SVMs with NFS protocol enabled, ensure that:
■ An NFS client is installed on the Collector node.
■ The QoS setting configured on the SVM.
■ FPolicy is configured for every Storage Virtual Machine (SVM) in the ONTAPcluster.See “Preparing the ONTAP cluster for FPolicy” on page 168.
■ The ONTAP Cluster Management host is accessible from the Collector usingthe short name or IP address.
■ Data Insight Collector should be able to communicate with port 80 on the ONTAPcluster management host.
■ Data Insight should be able to communicate with the CIFS server hosted withinthe ONTAP cluster and the SVM which has NFS protocol enabled.
■ Run the following command on each VServer where you want to enable NFSmonitoring:vserver nfs modify -vserver <vserver name> -v3-ms-dos-client
enabled
See “Enabling export of NFS shares on a NetApp Cluster-Mode file server”on page 175.
See “About configuring a clustered NetApp file server” on page 157.
160Configuring clustered NetApp file server monitoringPre-requisites for configuring clustered NetApp file servers

Credentials required for configuring a clusteredNetApp file server
Table 9-1 Credentials for configuring NetApp file servers in Cluster-Mode
DetailsCredential
This credential belongs to the NetApp ONTAP clusteradministrator user who is a local user on the ONTAPcluster. Or, this credential belongs to the ONTAP clusternon-administrator user with specific privileges.
See “Preparing a non-administrator local user on theclustered NetApp filer ” on page 163.
Credentials required during filerconfiguration through the DataInsight Management Console.
Data Insight uses thesecredentials to discover sharesand enable FPolicy on theNetApp Cluster-Mode filer.
161Configuring clustered NetApp file server monitoringCredentials required for configuring a clustered NetApp file server

Table 9-1 Credentials for configuring NetApp file servers in Cluster-Mode(continued)
DetailsCredential
Required for scanning of shares from the NetApp filer.
When scanning CIFS shares, this credential belongs tothe user in the domain of which the NetApp filer is a part.This user must belong to either the Power Users orAdministrator's group on the NetApp filer. If the credentialis not part of one of these groups, the scanner is not ableto get share-level ACLs for shares/exports of this filer.
Run the following commands on every Storage VirtualMachine (SVM) that Data Insight is monitoring:
cifs users-and-groups local-groupadd-members -vserver <vserver name >BUILTIN\Administrators-member-names <domain name \usename>
cifs users-and-groups local-groupadd-members -vserver <vserver name >BUILTIN\Power Users-member-names <domain name \usename>
You do not need this privilege if you do not want to getthe share-level ACLs. In this case you only needprivileges to mount the share and scan the file systemhierarchy.
You must have the share-level READ permission.Additionally, the folder within the share must have thefollowing file system ACLs:
■ Traverse Folder/Execute File■ List Folder/Read Data■ Read Attributes■ Read Extended Attributes■ Read Permissions
Credentials required for scanningof shares.
162Configuring clustered NetApp file server monitoringCredentials required for configuring a clustered NetApp file server

Preparing a non-administrator local user on theclustered NetApp filer
To configure a NetApp cluster file server from the Data Insight Management Console,you can use a local user account which is not in the administrators group on theNetApp cluster, but has some specific privileges.
To create a non-administrator user
1 Launch a Telnet session with the NetApp Cluster Management host.
2 Create a new role, for example testrole, using the useradmin utility on the filer.
3 Run the following commands to create the role with specific privileges:
security login role create -role testrole -cmddirname "version"
-access all
security login role create -role testrole -cmddirname "vserver cifs"
-access readonly
163Configuring clustered NetApp file server monitoringPreparing a non-administrator local user on the clustered NetApp filer

4 security login role create -role testrole -cmddirname "vserver"
-access readonly
security login role create -role testrole -cmddirname
"vserver cifs share" -access readonly
security login role create -role testrole -cmddirname
"vserver nfs" -access all
security login role create -role testrole -cmddirname "volume"
-access readonly
security login role create -role testrole -cmddirname
"vserver fpolicy policy" -access all
security login role create -role testrole -cmddirname
"vserver fpolicy" -access readonly
security login role create -role testrole -cmddirname
"vserver fpolicy enable" -access all
security login role create -role testrole -cmddirname
"vserver fpolicy disable" -access all
security login role create -role testrole -cmddirname
"statistics" -access readonly
security login role create -role testrole
-cmddirname "network interface show" -access readonly
The network interface show privilege automatically assigns the followingprivileges to the role:
network interface create
network interface delete
network interface modify
5 Run the following command to create a local user, for example, testuser, andassign the role that you created in 3 to the user:
security login create -username testuser
-application ontapi -authmethod password -role testrole
164Configuring clustered NetApp file server monitoringPreparing a non-administrator local user on the clustered NetApp filer

Preparing a non-administrator domain user on aNetApp cluster for Data Insight
To configure a NetApp cluster from the Management Console, you can use anaccount which is not in the administrators group on the NetApp filer, but has somespecific privileges. You can use the credentials of a domain user to configure DataInsight to monitor a NetApp cluster. These credentials are required to discovershares and to enable FPolicy on the NetApp cluster.
Perform the following steps on the NetApp filer console to add a non-administratoruser, for example, testuser.
To use domain user credentials to configure a NetApp cluster
1 Log on using SSH to the NetApp cluster with administrator credentials. Do oneof the following:
■ If the NetApp cluster has a data SVM with a CIFS server that is alreadycreated, you can use that data SVM as an authentication tunnel. Use thefollowing command:
security login domain-tunnel create -vserver name of data SVM
The following security command displays the specified authentication tunnel:
login domain-tunnel show
■ If the cluster does not have a data Storage Virtual Machine (SVM) with aCIFS server created, you can use any data SVM in the cluster and join itto a domain by using the vserver active-directory create command.Set the --vserver parameter to the data SVM. Joining a data SVM to adomain does not create a CIFS server or require a CIFS license. However,it enables the authentication of users and groups at the SVM or cluster-level.
2 Grant a user or a group access to the cluster or SVM with the -authmethod
parameter set to domain.
Also, create a new role, for example testrole, using the useradmin utility onthe filer.
The following command enables <testuser> in the <DOMAIN1> domain toaccess the cluster through SSH:
cluster1::> security login create -vserver cluster1 <-user-or-group-name>
<DOMAIN1\testuser> -application ontapi -authmethod domain –role testrole
Where, <cluster1> is the name of Admin Vserver.
165Configuring clustered NetApp file server monitoringPreparing a non-administrator domain user on a NetApp cluster for Data Insight

Note the following:
■ The value of the -user and -group-name parameter must be specified inthe format domainname\username, where <domain name> is the name ofthe CIFS domain server and user name is the name of the user or groupyou want to grant access to.
■ The user group authentication supports only SSH and ONTAPI for the-application parameter.
■ If the authentication tunnel is deleted, the directory service logon sessionscannot be authenticated by the cluster, and users and groups cannot accessthe cluster. The open sessions that were authenticated before the deletionof the authentication tunnel remain unaffected.
3 You can also choose to assign specific capabilities to the role.
security login role create -role testrole -cmddirname
"version"-access all
Enables you to log into the NetApp filer and run commands. With this capability,you can get latency statistics (for scan throttling), volume size information, ordiscover shares.
Run the following commands to create the role with specific privileges:
security login role create -role testrole -cmddirname
"version"-access all
security login role create -role testrole -cmddirname "vserver
cifs"-access readonly
security login role create -role testrole -cmddirname "vserver
nfs" -access all
security login role create -role testrole -cmddirname
"vserver"-access readonly
security login role create -role testrole -cmddirname
"volume"-access readonly
security login role create -role testrole –cmddirname "vserver
fpolicy policy" -access all
security login role create -role testrole –cmddirname "vserver
fpolicy" -access readonly
security login role create -role testrole –cmddirname "vserver
fpolicy enable" -access all
166Configuring clustered NetApp file server monitoringPreparing a non-administrator domain user on a NetApp cluster for Data Insight

security login role create -role testrole –cmddirname "vserver
fpolicy disable" -access all
security login role create -role testrole –cmddirname "statistics"
-access readonly
security login role create -role testorle -cmddirname "network
interface show" -access readonly
The network interface show privilege automatically assigns the followingprivileges to the role:
■ network interface create
■ network interface modify
■ network interface modify
You can optionally specify a default role such as admin/vsadmin which alreadyhas these privileges.
Preparing Data Insight for FPolicy in NetAppCluster-Mode
The Veritas Data Insight FPolicy server is represented by DataInsightFpolicyCmodservice which runs on each Collector worker node. Before you assign a Data Insightserver as a Collector for a clustered NetApp filer, you must configure theCluster-Mode FPolicy service on that server.
To configure the DataInsightFPolicyCmod service
1 Provision a supported version of Windows server. Veritas recommends aminimum requirement of a Windows 2008 64-bit server with 4 to 8GB RAMand a quad core processor. A higher configuration may be required if the loadon the FPolicy server is high.
This computer hosts the FPolicy server.
2 Install the Data Insight Collector worker node or the Data Insight ManagementServer on this server.
3 Log in to the Data Insight Management Console.
4 In the Console, click Settings > Data Insight Servers to open the listing pagefor the server.
5 Select the server that is configured to monitor the NetApp clustered file serverto open the details page for the server.
6 Click the Services tab.
167Configuring clustered NetApp file server monitoringPreparing Data Insight for FPolicy in NetApp Cluster-Mode

7 Select DataInsightFPolicyCmod to expand the section.
8 To configure the service, enter the following details:
■ The user-configured name to create FPolicy the ONTAP cluster.
■ The IP address of the Data Insight Collector running the FPolicy server.The NetApp ONTAP Cluster-Mode filer connects with theDataInsightFPolicyCmod service running on the Data Insight Collector nodeon this IP address.
■ The TCP port used on the DataInsightCollector server.The NetApp ONTAP Cluster-Mode filer connects on this port to the DataInsight Collector. Ensure that this port is not blocked by firewall.
9 Click Configure.
See “Configuring Data Insight services” on page 86.
Preparing the ONTAP cluster for FPolicyThe Veritas Data Insight FPolicy server registers with the ONTAP cluster andreceives file access events from it, if FPolicy is enabled and configured on thecorresponding Storage Virtual Machine (SVM) in the cluster. Veritas recommendsthat you automatically enable auditing when adding the clustered filers.
See “Configuring Data Insight services” on page 86.
When you enable FPolicy from the Data Insight console, Data Insight automaticallydoes the following:
■ Creates an FPolicy with a unique name.
■ Creates an FPolicy engine by specifying the server IP address and the serverport.
■ Creates a CIFS and/or NFS event object.
Once you enable FPolicy on the SVM, it initiates a TCP connection to the DataInsight FPolicy server.
Note: You can choose to configure FPolicy on the OnTAP cluster manually.However, Veritas does not recommend using manual steps to monitor the SVMsin the cluster.
168Configuring clustered NetApp file server monitoringPreparing the ONTAP cluster for FPolicy

To configure FPolicy on the ONTAP cluster using manual steps
1 Launch a Telnet session with the SVM on which you want to configure FPolicy.
2 Run the following command to create an External Engine Object on the ONTAPshell:
diontapclust::> vserver fpolicy policy external-engine create
-vserver <Vserver name> -engine-name <choose an external engine
name> -primary-servers <IP address of Data Insight FPolicy server>
-port <port number on which Data Insight FPolicy server is
listening> -extern-engine-type asynchronous -ssl-option no-auth
3 Run the command to configure FPolicy to monitor specific CIFS events:
diontapclust::> vserver fpolicy policy event create -vserver
<Vserver name> -event-name <choose an event name> -protocol cifs
-file-operations create, create_dir, delete, delete_dir,
read,close, rename, rename_dir -filters first-read,
close-with-modification
4 Run the command to configure FPolicy to monitor specific NFS events:
diontapclust::> vserver fpolicy policy event create -vserver
<Vserver name> -event-name <choose an event name> -protocol nfsv3
-file-operations create, create_dir, delete, delete_dir, link,
read,write, rename, rename_dir, setattr
5 Run the command to create a resident FPolicy on the SVM:
diontapclust::> vserver fpolicy policy create -vserver <Vserver
name> -policy-name <choose a policy name> -events <specify list
of events> -engine <specify engine name> -is-mandatory false
6 Run the command to configure the scope of FPolicy:
diontapclust::> vserver fpolicy policy scope create -vserver
<Vserver name> -policy-name <choose a policy name>
-volumes-to-include "*" -export-policies-to-include "*"
About configuring secure communicationbetweenData Insight and cluster-mode NetApp devices
You can secure the data flowing between the Management Server and the NetAppcluster using the Secure Socket Layer (SSL) protocol. Connections between DataInsight and the cluster-mode NetApp devices use a single certificate.
169Configuring clustered NetApp file server monitoringAbout configuring secure communication between Data Insight and cluster-mode NetApp devices

You can enable secure communication between Data Insight and cluster-modeNetApp devices through an SSL connection by using self-signed or CA-signeddigital SSL certificate. Whether you use a CA-signed digital certificate depends onyour security requirements and budget. You can obtain a self-signed digital certificatefor free, but a digital certificate signed by a trusted CA can incur a considerableexpense. A self-signed digital certificate is not as secure as a digital certificatesigned by CA.
Follow these steps to configure the SSL communication:
■ Generate the SSL certificates.See “Generating SSL certificates for NetApp cluster-mode authentication”on page 170.
■ Upload the SSL certificates on the Data Insight Collector node configured tomonitor the filer.
■ Prepare the NetApp cluster for SSL authentication.
■ Install the certificates on the NetApp Admin Vserver.
■ Create security roles.
■ Create security logon.
■ Enable client authentication.See “Preparing the NetApp cluster for SSL authentication” on page 172.
When you configure the NetApp cluster-mode device from the Data InsightManagement Server, you must select the SSL certificate which includes a .key
file and a .pem file that are installed on the cluster-mode NetApp storage device.
See “Add/Edit NetApp cluster file server options” on page 229.
Generating SSL certificates for NetApp cluster-mode authenticationGenerating Self-signed digital SSL certificateUse the openssl command to create a self-signed certificate.
170Configuring clustered NetApp file server monitoringAbout configuring secure communication between Data Insight and cluster-mode NetApp devices

Generating Self-Signed certificate
1 To generate a Certificate Signing Request (CSR), go to the command promptwindow and execute the following command:
openssl req -x509 -nodes -days 365 -newkey rsa:1024 -keyout
<yourKeyFileName>.key -out <yourCertName>.pem
The generated certificate looks as follows:
-----BEGIN CERTIFICATE-----
MIICwjCCAiugAwIBAgIJAJpgINzlWl06MA0GCSqGSIb3DQEBBQUAMHoxCzAJBgNV
BAYTAklOMRMwEQYDVQQIDApTb21lLVN0YXRlMSEwHwYDVQQKDBhJbnRlcm5ldCBX
aWRnaXRzIFB0eSBMdGQxEDAOBgNVBAMMB2Fhc2hyYXkxITAfBgkqhkiG9w0BCQEW
EmFhc2hyYXlAbmV0YXBwLmNvbTAeFw0xMzA3MzAxNjQ2NDRaFw0xNDA3MzAxNjQ2
NDRaMHoxCzAJBgNVBAYTAklOMRMwEQYDVQQIDApTb21lLVN0YXRlMSEwHwYDVQQK
DBhJbnRlcm5ldCBXaWRnaXRzIFB0eSBMdGQxEDAOBgNVBAMMB2Fhc2hyYXkxITAf
BgkqhkiG9w0BCQEWEmFhc2hyYXlAbmV0YXBwLmNvbTCBnzANBgkqhkiG9w0BAQEF
AAOBjQAwgYkCgYEAv8jid3ADQH/HQ05iZ6Tk0NF2cY9iiEna71PVKjM1L8GGkyWJ
kGioW2j1qoHO4kJEXUOMoX7YREOKLYbBQW5nx6rrg8Z3iFvP09YJnByonUIuN9QZ
96OHQ+ws9u6wNgM2LTJbcbOUUdJuOQNgaQ4XhzLDa6g0jEzyDBHbC05m2XUCAwEA
AaNQME4wHQYDVR0OBBYEFDdavnhJnCUHDJXgZEAovxcoYAsxMB8GA1UdIwQYMBaA
FDdavnhJnCUHDJXgZEAovxcoYAsxMAwGA1UdEwQFMAMBAf8wDQYJKoZIhvcNAQEF
BQADgYEAdnD5BzSlV2SiZJbOjzmhkYraNwG3WauDYlnzo8K0v6BFhxKEC/abjUaa
Ic/mBXEE8JqnLN7uqQf1wZtqIU60eNexMMdg+tstYe5O0Fnu27ss9HsmDD51A9LZ
kT5+XIfG21EYJMnFa1LwWTtmkla66GNhVEzzJKUtOXD23H6SyNc=
-----END CERTIFICATE-----
2 Save the content of the generated certificate in two separate files -<yourCertName>.pem and <yourKeyFileName>.key in the -keyout and -outfiles as mentioned in the command.
Generating a CA-signed digital SSL certificateTo generate a unique CA-signed certificate
1 Collect the following information to generate a certificate request:
■ Common nameThe fully qualified DNS name of the NetApp Admin Vserver. This namemust be the actual name of the server that is accessible by all the clients.For example: https://ditest.
■ Organization NameFor example, Veritas ¡ City ¡ State ¡ Country ¡ Expiration
■ Organizational unit (optional)
171Configuring clustered NetApp file server monitoringAbout configuring secure communication between Data Insight and cluster-mode NetApp devices

■ CountryFor example, US
■ StateFor example, CA
■ CityFor example, San Francisco
■ ExpirationExpiration time in days
2 On the cluster-mode Admin Vserver, switch to Administrator mode. From thecommand prompt window, run the following command:
set -privilege admin
3 Run the command to generate the Certificate Signing request:
security certificate generate-csr -common-name <hostname of the
Admin Vserver> -size 2048 -country <name> -state <name of state>
-locality <name of locality> -organization <name of organization>
-unit <name of organizational unit> -email-addr <email address>
4 Copy the certificate and the key strings and save them in two different fileswith extension .pem and .key respectively.
Paste the certificate to a text document exactly as it appears on the screen.Include the top line and bottom line (-----BEGIN CERTIFICATE REQUEST-----and -----END CERTIFICATE REQUEST-----) with the extension .pem. Makesure that no extra lines, spaces, trailing carriage returns, or characters havebeen inadvertently added.
Paste the key strings from (-----BEGIN RSA PRIVATE KEY ----- and -----ENDRSA PRIVATE KEY-----) to a text document with the extension .key.
5 Send the CSR string (the string portion from “-----BEGIN CERTIFICATEREQUEST----- to-----END CERTIFICATE REQUEST-----“) to a CertificationAuthority (CA) electronically to apply for a digital certificate. After the CA sendsyou the signed digital certificate, you must install it with the associated privatekey (<yourKeyFileName>.key) on the Vserver.
Preparing the NetApp cluster for SSL authenticationYou must install the signed digital certificate with the associated private key(<yourKeyFileName>.key) on the NetApp Admin Vserver
172Configuring clustered NetApp file server monitoringAbout configuring secure communication between Data Insight and cluster-mode NetApp devices

Installing the SSL certificate on cluster mode NetAppdeviceTo install the certificate on the NetApp Admin Vserver
1 Log on to the Admin Vserver, and manually copy over the .key file to the server.
2 From the command prompt window, navigate to the location where you havesaved the .key file.
3 Run the following command:
security certificate install -type client-ca -vserver <Host name
of AdminVserver>
Note: : If you have a CA-signed SSL certificate, install the root certificate andeach intermediate certificate of the CA that signed the certificate by using thecommand security certificate install command with –type client-ca
parameter.
4 To verify whether the certificate is installed, run the following command:
security certificate show –vserver <Host name of AdminVserver>
Note: You should keep a copy of your certificate and private key for future reference.If you revert or downgrade to an earlier release, you must first delete the certificateand private key.
Creating security rolesYou must security roles for ONTAPI access with the common name that you havementioned in the certificate.
Note: Authentication of a domain user credentials using SSL for monitoring NFSexports is not supported.
To create the security roles
1 From the command prompt on the Storage Virtual Machine (SVM), run thefollowing commands:
security login role create -role testrole -cmddirname
"version"-access all
security login role create -role testrole -cmddirname "vserver
cifs"-access readonly
173Configuring clustered NetApp file server monitoringAbout configuring secure communication between Data Insight and cluster-mode NetApp devices

security login role create -role testrole -cmddirname
"vserver"-access readonly
security login role create -role testrole -cmddirname
"volume"-access readonly
security login role create -role testrole –cmddirname "vserver
fpolicy policy" -access all
security login role create -role testrole –cmddirname "vserver
fpolicy" -access readonly
security login role create -role testrole –cmddirname "vserver
fpolicy enable" -access all
security login role create -role testrole –cmddirname "vserver
fpolicy disable" -access all
security login role create -role testrole –cmddirname "statistics"
-access readonly
security login role create -role testrole -cmddirname "vserver
nfs" -access all
security login role create -role testorle -cmddirname "network
interface show" -access readonly
The network interface show privilege automatically assigns the followingprivileges to the role:
■ network interface create
■ network interface modify
■ network interface modify
2 To view the security roles that were created, run the following command:
security login role show –vserver <Host name of AdminVserver>
Creating a security logonYou must create two security logon credentials - one with authmethod as cert andanother with authmethod as password.
174Configuring clustered NetApp file server monitoringAbout configuring secure communication between Data Insight and cluster-mode NetApp devices

To create a security logon
1 Create a security logon with the common name that you have mentioned inthe certificate. For the purpose of this procedure, let us assume that thecommon name is ditest. Run the following commands:
security login create -username ditest -application ontapi
-authmethod cert -role ditest -vserver <Host name of AdminVserver>
security login create -username ditest -application ontapi
-authmethod password -role ditest -vserver <Host name of
AdminVserver>
2 To view the security logon that you created, run the following command:
security login show –vserver Host name of AdminVserver>
Enabling client authentication on the NetApp clusterTo enable client authentication
1 Run the following command:
security ssl modify –vserver <Host name of AdminVserver>
For example -security ssl modify –vserver < name of admin vserver
> -ca < default ontap cert > -serial <default ontap cert>
-common-name <default cert name> -server-enabled true
-client-enabled true
Note: Default values can be obtained by pressing tab key from Ontapmanagement interface command prompt.
2 To check the status, run the following command:
>> security ssl show –vserver <Host name of AdminVserver>
After you install all required certificates, create the appropriate role and logoncredentials, and enable client authentication, you can add the NetApp cluster tothe Data Insight configuration.
Enabling export of NFS shares on a NetAppCluster-Mode file server
Before you add a NetApp Cluster-Mode file server to Data Insight, you must identifythe volumes and export policies to allow Data Insight to discover the NFS shareson the cluster.
175Configuring clustered NetApp file server monitoringEnabling export of NFS shares on a NetApp Cluster-Mode file server

Data Insight requires Read only access to root namespace (/) and super user (ROOT) access to volume namespace to scan NFS exports. If the root namespaceand volume are configured with two different export policies, then you must provideaccess to the Data Insight Collector under each export policy rules to enable DataInsight to scan the NFS shares.
To enable export of NFS shares on a NetApp Cluster-Mode file server
1 To verify whether the Data Insight Collector IP address is specified in the exportpolicy rule, execute the following command.
export-policy rule show -vserver <name of vserver> -policyname
<export policy> -clientmatch <IP of Data Insight Collector>
The command must be repeated if root namespace is configured to use differentexport policies.
2 The following command will display a denied access message if the IP addressof the Collector host is not specified in the export policy rule.
export-policy check-access -vserver <vserver name> -volume <volume
name> -client-ip <collector IP of DI> -authentication-method sys
-protocol nfs3 -access-type read
3 If the Data Insight Collector is not specified in the export policy, modify theexport policy rule. Run the following command:
export-policy rule modify -vserver <name of vserver> -policyname
<export policy> -clientmatch <IP of Data Insight Collector>
4 To validate the access given, run the following command and check read/writeaccess is shown:
export-policy check-access -vserver <vserver name> -volume <volume
name> -client-ip <collector IP of DI> -authentication-method sys
-protocol nfs3 -access-type read-write
176Configuring clustered NetApp file server monitoringEnabling export of NFS shares on a NetApp Cluster-Mode file server

Configuring EMC Celerraor VNX monitoring
This chapter includes the following topics:
■ About configuring EMC Celerra or VNX filers
■ Credentials required for configuring EMC Celerra filers
About configuring EMC Celerra or VNX filersVeritas Data Insight supports EMC Celerra, EMC VNX, and EMC Isilon file servers.Data Insight uses the EMC Common Event Enabler (CEE) framework to collectaccess events from the EMC filers.
As a prerequisite, you must complete the following tasks to enable Data Insight tomonitor an EMC Celerra file server:
■ Download the CEE framework from the EMC website. Install the framework onthe same Windows server as the Data Insight Collector node or on a remoteserver in the same Active Directory domain.
■ Obtain the necessary user credentials for accessing the EMC Celerra filer.See “Credentials required for configuring EMC Celerra filers” on page 183.
■ Configure the EMC Celerra filer for auditing.See “Preparing the EMC filer for CEPA” on page 178.
■ Configure Data Insight to receive event notifications from an EMC Celerra fileserver.See “Preparing Data Insight to receive event notification” on page 181.
■ Add the EMC Celerra filer to Data Insight.See “Adding filers” on page 224.
10Chapter

See “Add/Edit EMC Celerra filer options” on page 234.
■ Ensure that if share discovery /event monitoring is enabled, the ports HTTPS433 and 12228 are open and for scanning, the standard RPC ports 139 and445 are open and accessible.
About EMC Common Event Enabler (CEE)The CEE framework provides a working environment for the following mechanisms:
■ VNX/Celerra Antivirus Agent (CAVA)
■ VNX/Celerra Event Publishing agent (CEPA)
Veritas Data Insight uses the CEPA functionality of the CEE framework to receiveevent notifications. The EMC VNX/Celerra Event Publishing Agent (CEPA) is amechanism that enables Data Insight to register with the EMC VNX or Celerra filerto receive event notifications from the filer. You can specify filters for the event type,the CIFS server, and the shares that you want to monitor during registration withthe CEPA facility in the CEE framework. CEPA then sends notifications regardingthe registered events to Data Insight.
Preparing the EMC filer for CEPAThe Veritas Data Insight server registers with the EMC Celerra or the EMC VNXfiler through the EMC Common Event Enabler (CEE) framework. Data Insight usesthis framework to receive notifications of file access events from the filer.
See “About EMC Common Event Enabler (CEE)” on page 178.
178Configuring EMC Celerra or VNX monitoringAbout configuring EMC Celerra or VNX filers

To configure the EMC Celerra or EMC VNX filer to send event information toVeritas Data Insight
179Configuring EMC Celerra or VNX monitoringAbout configuring EMC Celerra or VNX filers

1 Create a cepp.conf file on the EMC filer. The following is a sample of the codethat the cepp.conf file must contain:
surveytime=90
pool name=matrixpool \
servers=<IP Address/Hostname of Windows server running the EMC CAVAservice> \
postevents=* \
option=ignore \
reqtimeout=500 \
retrytimeout=50
Note: If the CEE server pool contains more than one server, you may separateeach of the server entry by a | character. The setting ensures that the filersends events to the CEE servers in a round robin fashion which ensures loadbalancing and high availability. However, the filer does not concurrently forwardevents to the multiple CEE servers. In case of VNX, you must modify thecepp.conf file so that events are simultaneously forwarded to the CEE serverpool.
If there are two or more applications that make use of EMC’s CAVA / CEEaudit functionality, the cepp.conf file that resides on the filer(s) must beconfigured to include both servers. In such a case, the cepp.config containsdetails of each application pool that uses the CAVA/CEE auditing functionality.
surveytime=90
pool name=matrixpool \
servers=<IP Address/Hostname of Windows server running the EMC CAVAservice> \
postevents=* \
option=ignore \
reqtimeout=500 \
retrytimeout=50
pool name=QFSpool \
servers=<IP Address/Hostname of Windows server running the EMC CAVAservice> \
180Configuring EMC Celerra or VNX monitoringAbout configuring EMC Celerra or VNX filers

postevents=* \
option=ignore \
reqtimeout=500 \
retrytimeout=50
2 Copy the cepp.conf file to the root directory of the Data Mover. Run the followingcommand: server_file <datamover_name> -put cepp.conf cepp.conf
For example, server_file server_2 -put /tmp/CEPA/cepp.conf cepp.conf
3 Start the CEPP service on the filer. Run the following command:
server_cepp <datamover_name> -service -start
Ensure that the service has started by running the following command:
server_cepp name of data mover -service -status
Note: For detailed information about configuring CEPA, refer to the EMCdocumentation.
Preparing Data Insight to receive event notificationThe EMC Common Event Enabler (CEE) can be installed on the same Windowsserver as the Data Insight Collector node or on a remote server in the same ActiveDirectory domain.
You must perform the following steps to route events from the Windows server onwhich the EMC CEE is installed to the Collector node.
To prepare Data Insight to receive event notification
1 Provision a supported version of Windows server to run the EMC CEEframework in the same Active Directory domain as the filers you want to monitor.
2 Open Windows’ Registry Editor (Start > Run > regedit).
3 In Registry Editor, navigate to HKEY_LOCAL_MACHINE > SOFTWARE > EMC >
CEE > CEPP > Audit > Configuration.
4 Double-click Endpoint.
5 Modify the registry entry for the EMC CAVA service to allow access to the DataInsight Collector node. Depending on the type of your Data Insight deployment,there can be the following different scenarios:
■ The EMC CAVA service and the Collector node are running on the samemachine, and the EMC CAVA service is only being used by Data Insight.
181Configuring EMC Celerra or VNX monitoringAbout configuring EMC Celerra or VNX filers

In this case, add the Data Insight key, SymantecDataConnector, to theEndpoint option.
■ The EMC CAVA service and the Collector node are running on the samemachine, and the EMC CAVA service is also being used by applicationsother than Data Insight. In this case, append the Data Insight key,SymantecDataConnector, to the Endpoint option. Each entry must beseparated by a semi-colon.
Note: The above-mentioned scenarios are automatically configured at thetime adding filers.
■ The EMC CAVA service and the Collector node are running on separatemachines, and the EMC CAVA service is being used only by Data Insight.In this case, add the Data Insight key in the format,SymantecDataConnector@<IP address of the Collector>, to theEndpoint option.
■ The EMC CAVA service and the Collector node are running on separatemachines, and the EMC CAVA service is also being used by applicationsother than Data Insight. In this case, append the Data Insight key in theformat, SymantecDataConnector@<IP address of the Collector>, tothe Endpoint option.
If the EMC CAVA service is installed on multiple machines, modify the registryentries on each of these machines.
6 Double-click the Enabled setting, and set its value to 1.
7 To start the EMC CAVA service, run the following command on the EMC filerto check the service status. For example,
Server_cepp server_2 -pool -info
8 Install Data Insight Collector node.
9 Log in to the Data Insight Management Console.
10 Navigate to Settings > Data Insight Servers to open the Data Insight Serversdetails page for the Collector.
11 Navigate to the service configuration section on the filer, and click Enable tostart the DataInsightCelerra service on the Collector node.
182Configuring EMC Celerra or VNX monitoringAbout configuring EMC Celerra or VNX filers

12 Under Credentials, enter the credentials that the service needs to run as. Thespecified credentials must be that of a domain user.
13 Click Configure to apply these settings to the server and start the EMC CAVAservice.
See “Adding filers” on page 224.
See “Add/Edit EMC Celerra filer options” on page 234.
Credentials required for configuring EMCCelerrafilers
Table 10-1 lists the set of credentials that are required by Veritas Data Insight duringsystem configuration.
Table 10-1 Credentials for configuring EMC filers
DetailsCredential
Required by the DataInsightCelerra serviceto run and authenticate itself with the EMCCAVA service provided by EMC, which runson the Data Insight Collector node.
The credential should belong to the user inthe domain of which the Data Insight Collectornode and the EMC filer are part.
Credentials required to configureDataInsightCelerra service.
The DataInsightCelerra service runs on theCollector and processes events sent by theCAVA services using the Windows RPCinterface. This service must be configured oneach Collector node that is used to connectto the EMC filers.
Required to discover shares for EMC filer.This credential belongs to the EMC filerControl Station user who has administrativerights including XMLAPI v2 privilege (forexample, nasadmin).
These credentials are used to discover shareson the filer and add them to the configuration.You can specify non-administrativecredentials, however, Test Connection willfail. In this case, you can continue to add thefiler, but you must add shares manually.
See “Preparing Data Insight to receive eventnotification” on page 181.
Credentials required during filer configurationthrough the Data Insight ManagementConsole.
183Configuring EMC Celerra or VNX monitoringCredentials required for configuring EMC Celerra filers

Table 10-1 Credentials for configuring EMC filers (continued)
DetailsCredential
Required for scanning of shares from theEMC filer. This credential belongs to the userin the domain of which the EMC filer is a part.
Additionally, to be able to obtain share-levelACLs, the credentials must belong to theDomain Administrators group on the fileserver. You do not need this privilege if youdo not want to get the share-level ACLs. Inthis case you will only need privileges tomount the share and scan the file systemheirarchy.
You must have the share-level READpermission. Additionally, the folder within theshare must have the following file systemACLs:
■ Traverse Folder/Execute File■ List Folder/Read Data■ Read Attributes■ Read Extended Attributes■ Read Permissions
See “About configuring EMC Celerra or VNXfilers” on page 177.
Credentials required for scanning of shares.
184Configuring EMC Celerra or VNX monitoringCredentials required for configuring EMC Celerra filers

Configuring EMC Isilonmonitoring
This chapter includes the following topics:
■ About configuring EMC Isilon filers
■ Prerequisites for configuration of Isilon or Unity VSA file server monitoring
■ Credentials required for configuring an EMC Isilon cluster
■ Configuring audit settings on EMC Isilon cluster using OneFS GUI console
■ Configuring audit settings on EMC Isilon cluster using the OneFS CLI
■ Configuring Isilon audit settings for performance improvement
■ Preparing Veritas Data Insight to receive event notifications from an EMC Isilonor Unity VSA cluster
■ Creating a non-administrator user for an EMC Isilon cluster
■ Using SmartConnect mapping for access zones
■ Purging the audit logs in an Isilon filer
About configuring EMC Isilon filersVeritas Data Insight supports the monitoring of EMC Isilon OneFS file servers,version 7.1 or later. Isilon OneFS is a cluster that has multiple hosts and a unifiednamespace-based file system across those hosts. Data Insight uses the CEEframework that is provided by EMC to fetch access events from EMC Isilon fileservers. Ensure that CEE version 6.1 is used to enable Data Insight to fetch accessevent information from the filer.
11Chapter

Note: To avail the performance enhancements for auditing, Veritas recommendsthat the EMC Isilon cluster should be running OneFS version 7.1.0.6 or higher.Consult EMC Support to know if the OneFS version on your Isilon cluster is updatedwith the audit performance enhancements.
Veritas Data Insight also supports scanning and event monitoring of user's homedirectories on the EMC Isilon storage system.
Complete the following tasks to enable Data Insight to monitor an EMC Isilon fileserver:
■ Complete all the prerequisites.See “Prerequisites for configuration of Isilon or Unity VSA file server monitoring” on page 186.
■ Obtain the necessary user credentials for accessing the EMC Isilon filer.See “Credentials required for configuring an EMC Isilon cluster” on page 187.
■ Configure the audit settings on the EMC Isilon filer using either the GUI consoleor the command line.See “Configuring audit settings on EMC Isilon cluster using OneFS GUI console”on page 188.See “Configuring audit settings on EMC Isilon cluster using the OneFS CLI”on page 190.
■ Perform additional auditing configuration for improved performance.See “Configuring Isilon audit settings for performance improvement” on page 193.
■ Configure Data Insight to receive event notifications from an EMC Isilon cluster.See “Preparing Veritas Data Insight to receive event notifications from an EMCIsilon or Unity VSA cluster” on page 194.
■ Add the EMC Isilon filer to Data Insight.See “Adding filers” on page 224.See “Add/Edit EMC Isilon file server options” on page 237.
Once you have configured an Isilon file server, as a maintenance activity you mustperiodically clear the audit logs.
See “Purging the audit logs in an Isilon filer” on page 197.
Prerequisites for configuration of Isilon or UnityVSA file server monitoring
Before you start configuring Isilon file servers, ensure the following pre-requisitesare complete:
186Configuring EMC Isilon monitoringPrerequisites for configuration of Isilon or Unity VSA file server monitoring

■ The EMC Common Event Enabler (CEE) version 6.1 or later is installed. Youcan install CEE either on the same Windows server as the Data Insight Collectoror on a remote server in the same directory service domain.
Note: Veritas recommends you to use the latest version of CEE.
■ The DataInsightCelerra service is installed on the Data Insight Collector.
■ Microsoft .Net Framework version 4.5 is installed on your Collector node.
■ A local or a domain user is configured on Isilon for use by Data Insight.
■ If monitoring an Unity filer, ensure that user credentials that are used fordiscovery have at least Operator privileges on the filer.If you want to use LDAP user credentials for scanning, you must enter thecredentials in the format LDAPDomainname/Username. For example,tulip.local/user1.
■ Ensure that file system auditing is enabled and audit settings are configured.For EMC Isilon - See “Configuring audit settings on EMC Isilon cluster usingOneFS GUI console” on page 188.For EMC Unity - See “Configuring audit settings on EMC Unity cluster usingUnisphere VSA Unity console” on page 201.
Note: The port number from the URL is used to access the Isilon OneFSManagement Console. This port number is used by Data Insight for discoverypurposes. Ensure that the port is not blocked by the Windows firewall in theCollector node. In case of Unity VSA filers, the communication between the filerand Data Insight for discovery takes place on port 443 and for scanning, takesplace on Standard RPC ports 139 and 445.
Credentials required for configuring an EMC Isiloncluster
Table 11-1 lists the set of credentials that are required by Veritas Data Insight duringsystem configuration.
187Configuring EMC Isilon monitoringCredentials required for configuring an EMC Isilon cluster

Table 11-1 EMC Isilon cluster credentials
DetailsCredential
Required by the DataInsightCelerra service to run andauthenticate itself with the Isilon cluster. The service runs onthe Data Insight Collector node.
The credential should belong to the user in the domain ofwhich the Data Insight Collector node and the Isilon clusterare part.
Credentials required toconfigure DataInsightCelerraservice.
Required to discover shares for the Isilon cluster.
See “Preparing Veritas Data Insight to receive eventnotifications from an EMC Isilon or Unity VSA cluster”on page 194.
Credentials required duringfiler configuration through theData Insight ManagementConsole.
Required for scanning of shares from the Isilon cluster. Thiscredential belongs to the user in the domain of which theIsilon is a part.
Additionally, to be able to obtain share-level ACLs, thecredentials must belong to the Domain Administrators groupon the file server. You do not need this privilege if you do notwant to get the share-level ACLs. In this case you will onlyneed privileges to mount the share and scan the file systemhierarchy.
You must have the share-level READ permission. Additionally,the folder within the share must have the following file systemACLs:
■ Traverse Folder/Execute File■ List Folder/Read Data■ Read Attributes■ Read Extended Attributes■ Read Permissions
See “About configuring EMC Isilon filers” on page 185.
Credentials required forscanning of shares
Configuring audit settings on EMC Isilon clusterusing OneFS GUI console
To enable Data Insight to receive access event information from the Isilon cluster,you must configure auditing on the Isilon cluster. You can configure the audit settingseither from the Isilon OneFS web-based GUI console. Alternatively, you can performthe same configuration using the Isilon command line interface.
188Configuring EMC Isilon monitoringConfiguring audit settings on EMC Isilon cluster using OneFS GUI console

See “Configuring audit settings on EMC Isilon cluster using the OneFS CLI”on page 190.
To configure audit settings on Isilon using OneFS console
1 On the OneFS WebUI, navigate to theCLUSTERMANAGEMENT >Auditing.
2 Under the Edit Auditing Settings section, select Enable Protocol AccessAuditing.
Note: It is recommended that you enable the OneFS auditing feature only afteryou install and configure Data Insight for your storage environment. Otherwise,the backlog consumed by Data Insight may be so large that results may bestale for a prolonged time.
3 Under theAudited Zones section, add the access zone that you want to audit.To enable auditing for the entire Isilon cluster, you can select the default Systemzone. For more information about access zones, see the EMC Isilondocumentation.
Note: Do not enable auditing for the access zones having file systemsconfigured only for the NFS protocol. Data Insight currently does not supportmonitoring of NFS shares.
4 Under the Event Forwarding section, enter the uniform resource identifier forthe server where the Common Event Enabler is installed. The format of theentry is: http://<IP of the CEE server>:port/cee.
For example: http://10.209.302.152:12228/cee.
Note that 12228 is the default CEE HTTP listen port. You must choose a portnumber that is same as the one configured in the registry on the computerwhere CEE is installed.
See “Preparing Veritas Data Insight to receive event notifications from an EMCIsilon or Unity VSA cluster” on page 194.
5 Under the section,Event Forwarding, add the host name of the storage cluster.You can either use the EMC Isilon SmartConnect cluster name or the DNSresolvable host name of one of the nodes of the cluster. Do not leave this fieldblank. This host name is later used to add the EMC Isilon cluster to the VeritasData Insight configuration.
See “Configuring Isilon audit settings for performance improvement” on page 193.
189Configuring EMC Isilon monitoringConfiguring audit settings on EMC Isilon cluster using OneFS GUI console

Configuring audit settings on EMC Isilon clusterusing the OneFS CLI
You can configure the audit settings on an EMC Isilon cluster using thecommand-line interface (CLI). You must be a root user on the EMC Isilon clusterto perform the configuration steps.
To configure and view audit settings on Isilon using the OneFS CLI
1 Log on to the Isilon OneFS cluster using the command line interface.
2 Issue the following commands:
■ To enable auditing:For OneFS 7.2 or earlier:di-isilon-1# isi audit settings
modify--protocol-auditing-enabled on
For OneFS 8.0 or later:di-isilon-1# isi audit settings global
modify--protocol-auditing-enabled on
Note: Veritas recommends that you enable the OneFS auditing featureonly after you install and configure Data Insight for your storage environment.Otherwise, the backlog consumed by Data Insight may be so large thatresults may be stale for a prolonged time.
■ To adjust the audit log timeSometimes, auditing on the OneFS cluster may have been enabled beforeData Insight is configured to monitor the cluster. In such cases, the clusterattempts to forward all events from the time auditing was configured. OnOneFS, you can configure a setting to manually adjust time from which tobegin forwarding the events to Data Insight.For example, use the following command to update the time to forwardevents newer than November 19, 2014 at 2:00 P.M.For OneFS 7.2 or earlier:isi audit settings modify --cee-log-time "protocol@2014-11-19
14:00:00"
For OneFS 8.0 or later:isi audit settings global modify --cee-log-time
"protocol@2014-11-19 14:00:00"
■ To disable auditing:For OneFS 7.2 or earlier:
190Configuring EMC Isilon monitoringConfiguring audit settings on EMC Isilon cluster using the OneFS CLI

di-isilon-1# isi audit settings
modify--protocol-auditing-enabled off
For OneFS 8.0 or later:di-isilon-1# isi audit settings global
modify--protocol-auditing-enabled off
■ To configure the audit settings:For OneFS 7.2 or earlier:di-isilon-1# isi audit settings modify
--add-cee-server-uris=http://cee.example.com:12228/cee
--audited-zones=system
--hostname=di-isilon.example.com
--config-auditing-enabled=no
For OneFS 8.0 or later:di-isilon-1# isi audit settings global modify
--add-cee-server-uris=http://cee.example.com:12228/cee
--audited-zones=system --hostname=di-isilon.example.com
--config-auditing-enabled=no
■ To view the audit settings:For OneFS 7.2 or earlier:di-isilon-1# isi audit settings view
For OneFS 8.0 or later:di-isilon-1# isi audit settings global view
Depending upon the configured audit settings, you may see the followingresponse:
Protocol Auditing Enabled: Yes
Audited Zones: System
CEE Server URIs: http://cee.example.com:12228/cee
Hostname: di-isilon.example.com
Config Auditing Enabled: No
After you have enabled audit settings on the EMC Isilon cluster you must configurethe Access Zones on the cluster.
Note: Do not enable auditing for the access zones having file systems configuredonly for the NFS protocol. Data Insight currently does not support monitoring ofNFS shares.
191Configuring EMC Isilon monitoringConfiguring audit settings on EMC Isilon cluster using the OneFS CLI

To configure Access Zones using the OneFS CLI
1 Log on to the Isilon OneFS cluster using the command line interface.
2 Issue the following command:
isi zone zones modify <zone>
--audit-success {close | create | delete | get_ security | logoff
| logon | read | rename | set_security | tree_ connect | write |
all} | --clear-audit-success
--add-audit-success {close | create | delete | get_security |
logoff | logon | read | rename | set_security | tree_ connect |
write | all}
--remove-audit-success <string>
--audit-failure {close | create | delete | get_security | logoff
| logon | read | rename | set_security | tree_ connect | write |
all} | --clear-audit-failure
--add-audit-failure {close | create | delete | get_security |
logoff | logon | read | rename
Using the command line interface, you can enable specific audit events.
192Configuring EMC Isilon monitoringConfiguring audit settings on EMC Isilon cluster using the OneFS CLI

To enable specific audit events using the OneFS CLI
1 Log on to the Isilon OneFS cluster using the command line interface.
2 Issue the following command:
isi zone zones modify system --audit-success
create,delete,rename,set_security
Depending on your configuration, you may see the following response:
di-isilon-1# isi zone zones list -v
Name: System
Cache Size: 4.77M
Map Untrusted:
SMB Shares: -
Auth Providers: -
Local Provider: Yes
NetBIOS Name:
All SMB Shares: Yes
All Auth Providers: Yes
User Mapping Rules: -
Home Directory Umask: 0077
Skeleton Directory: /usr/share/skel
Audit Success: create, delete, rename, set_security
Audit Failure: -
Zone ID: 1
See “Configuring audit settings on EMC Isilon cluster using OneFS GUI console”on page 188.
See “Configuring Isilon audit settings for performance improvement” on page 193.
Configuring Isilon audit settings for performanceimprovement
Use the Isilon OneFS web-based GUI console to enable auditing of the followingtypes of events by default:
■ audit-success
■ audit-failure
■ create
■ delete
■ rename
193Configuring EMC Isilon monitoringConfiguring Isilon audit settings for performance improvement

■ set_security
The number of different types of events that Data Insight monitors affects the systemperformance. To reduce performance overhead, you may disable auditing ofaudit-failure events. You must use the OneFS CLI to disable auditing.
To disable auditing for audit-failure events
1 Log on to the Isilon OneFS cluster using the command line interface.
2 Issue the command:
isi zone zones modify system --remove-audit-failure all
Note: To avail the performance enhancements for auditing, Veritas recommendsthat the EMC Isilon cluster should be running OneFS version 7.1.0.6 or higher.Consult EMC Support to know if the OneFS version on your Isilon cluster is updatedwith the audit performance enhancements.
Preparing Veritas Data Insight to receive eventnotifications from an EMC Isilon or Unity VSAcluster
EMC Common Event Enabler (CEE) version 6.1 or later is required to receive eventsfrom EMC Isilon OneFS cluster. In case of Unity VSA filers, ensure that CEE versionis 8.x.x. You can install CEE either on the same Windows server as the Data InsightCollector node or on a remote server in the same directory service domain.
To prepare Data Insight to receive event notification
1 Install EMC CEE framework on a Windows server so that it runs in the samedirectory service domain as the filers you want to monitor.
2 On the machine where you have installed the CEE, open the Windows RegistryEditor (Start > Run > regedit).
3 Navigate to the location: HKEY_LOCAL_MACHINE > SOFTWARE > EMC >CEE > CEPP > Audit > Configuration. Depending on the type of your DataInsight deployment, perform any of the following:
■ If EMC CAVA service and the Collector node are running on the samemachine, add the Data Insight key, SymantecDataConnector, to theEndpoint option.
■ If EMC CAVA service and the Collector node are running on separatemachines, add the Data Insight key in the format,
194Configuring EMC Isilon monitoringPreparing Veritas Data Insight to receive event notifications from an EMC Isilon or Unity VSA cluster

SymantecDataConnector@<IP address of the Collector>, to theEndpoint option.
Additionally, configure the following registry values:
■ Navigate to the location:HKEY_LOCAL_MACHINE >SOFTWARE >EMC> CEE > Configuration. Note the key called HttpPort. The default keyvalue is specified as 12228. You can modify this key value, but you mustensure that this value matches the port in the CEE URL that is specifiedduring Isilon or Unity audit configuration.See “Configuring audit settings on EMC Isilon cluster using OneFS GUIconsole” on page 188.
■ Navigate to the location:HKEY_LOCAL_MACHINE >SOFTWARE >EMC> CEE > CEPP > Audit > Configuration. Set the value of key Enabled to1.
4 Log on to the Data Insight Management Console.
Navigate to Settings > Data Insight Servers to open the Data Insight Serversdetails page for the Collector.
5 Navigate to the Service Configuration section on the filer, and click Enable tostart the DataInsightCelerra service on the Collector node.
6 Under Credentials, enter the credentials that the service needs to run as. Thespecified credentials must be that of a domain user.
7 Click Configure to apply these settings to the server.
8 Restart the EMC CAVA and EMC CEE Monitor service on the Collector machineor on the remote CAVA server, if the services are remotely installed.
Creating a non-administrator user for an EMCIsilon cluster
Data Insight requires a user account on Isilon to perform automatic discovery ofCIFS shares and to list all local groups, group memberships, and local users. DataInsight can use a non-administrator account for this purpose. This account can bea local Isilon OneFS account or a domain account.
To configure a domain user for discovery and scanning of CIFS shares
1 Log on as an Isilon administrator to the Isilon cluster CLI using SSH or Telnet.
2 Run the following commands:
■ To create a role named dirole
195Configuring EMC Isilon monitoringCreating a non-administrator user for an EMC Isilon cluster

isi auth roles create --name dirole --description "Read-only
role for DataInsight"
■ To give the user the privileges to log on to the REST API platform frameworkto get a list of CIFS shares and to list users and groupsisi auth roles modify dirole --add-user=username@domain
--add-priv-ro=ISI_PRIV_SMB --add-priv-ro=ISI_PRIV_LOGIN_PAPI
--add-priv-ro=ISI_PRIV_AUTH --add-priv-ro=ISI_PRIV_NETWORK
■ To add the user to the Backup Operators group on Isilon, which enablesData Insight to scan all the CIFS sharesisi auth groups modify "Backup Operators" --add-user
username@domain
To configure a local user for discovery of CIFS shares
1 Log on as an Isilon administrator to the Isilon cluster CLI using SSH or Telnet.
2 Run the following commands:
To create a new local user called diuser
■ isi auth users create diuser --enabled yes --password xxxxxx
■ To create a role named diroleisi auth roles create --name dirole --description "Read-only
role for DataInsight"
■ To grant the user the privileges to log on to the REST API platformframework to get a list of CIFS shares and to list users and groupsisi auth roles modify dirole --add-user=diuser
--add-priv-ro=ISI_PRIV_SMB --add-priv-ro=ISI_PRIV_LOGIN_PAPI
--add-priv-ro=ISI_PRIV_AUTH --add-priv-ro=ISI_PRIV_NETWORK
Using SmartConnect mapping for access zonesEMC Isilon publishes shares through access zones. Access zones are virtualcontainers in which the Isilon cluster is partitioned. An access zone may beassociated with an IP address pool. A pool is used to map an access zone with aSmartConnect zone and a range of IP addresses. The SmartConnect zone hostnameand alias is typically used to discover shares instead of the access zone name.Data Insight discovers access zone to SmartConnect zone mapping and uses thesenames for scanning the shares. You must configure your preference when addingan Isilon filer to the Data Insight configuration. Ensure that access zone names areDNS resolvable.
See “Add/Edit EMC Isilon file server options” on page 237.
196Configuring EMC Isilon monitoringUsing SmartConnect mapping for access zones

Note: Support for using SmartConnect to discover shares is available for IsilonOneFS version 8.0 and later.
You can also choose to input the alternate SmartConnect names against accesszones mappings using a CSV file as input.
The CSV file must be in the following format:
filer name, access zone name, SmartConnect name.
The CSV file must be placed in the directory DATADIR/confon the Managementserver. The name of the CSV is isilon.csv. When DiscoverySharesJob_mrg runsthe next time, it discovers and scans shares using alternate name provided in theCSV file.
Note:
Data Insight does not support adding of two DFS shares with the same name fromtwo different access zones to its configuration.
Purging the audit logs in an Isilon filerBy default an Isilon file server does not automatically clear the audit logs.Accumulation of audit logs over a long time can clutter disk space and as a resultinterrupt the auditing process itself. To avoid these problems you must periodicallyperform manual cleanup of the audit logs.
Note: The cleaning of audit logs may cause interruptions in the SMB clientconnections between the Isilon file server and the Collector node, leading to scanfailures. To avoid disruption in scanning service, perform the cleaning operationduring a planned maintenance window. The described procedure is applicable onlyto OneFS 7.1 and OneFS 7.2. For more information refer to EMC Isilon technicalsupport.
To purge the audit logs from an Isilon filer
1 Log on to the Isilon cluster CLI using SSH or Telnet as a root user.
2 Stop the isi_audit_d and isi_audit_cee processes from automatically restarting,by executing the commands:
isi services -a isi_audit_d ignore
isi services -a isi_audit_cee ignore
197Configuring EMC Isilon monitoringPurging the audit logs in an Isilon filer

3 Terminate the isi_audit_d and isi_audit_cee processes, by executing thecommands:
isi_for_array 'pkill isi_audit_d'
isi_for_array 'pkill isi_audit_cee'
4 Verify that no isi_audit processes are running on the cluster, by executing thecommand:
isi_for_array -s 'pgrep -l isi_audit'
5 Change directory to the audit directory, by executing the command:
cd /ifs/.ifsvar/audit
6 To ensure that you are in the /ifs/.ifsvar/audit directory, execute the command:
pwd
7 Optionally, create a backup of your audit directory if you want to preserve yourold audit logs. You can move or copy them to another directory by using eithermv or cp command.
8 Delete the audit directory by executing the command:
rm -rf /ifs/.ifsvar/audit
9 Inform the Master Control Program (MCP) to resume monitoring the auditdaemons, by executing the following commands:
isi services -a isi_audit_d monitor
isi services -a isi_audit_cee monitor
MCP automatically restarts the audit daemons and reconstructs the auditdirectory on each node when the isi_audit_d process is running.
10 Check if the audit processes have restarted, by executing the command:
isi_for_array -s 'pgrep -l isi_audit'
11 Verify that audit data was removed and reconstructed, by executing thecommand:
isi_audit_viewer -t protocol
12 Verify that the audit log files are being populated after audit processes haverestarted, by executing the command:
isi_audit_viewer -t protocol
198Configuring EMC Isilon monitoringPurging the audit logs in an Isilon filer

Configuring EMC UnityVSA file servers
This chapter includes the following topics:
■ About configuring Dell EMC Unity storage platform
■ Credentials required for configuring an EMC Unity VSA file server
■ Configuring audit settings on EMC Unity cluster using Unisphere VSA Unityconsole
About configuring Dell EMC Unity storageplatform
Veritas Data Insight supports the monitoring of CIFS shares on the Dell EMC UnityVSA 11 storage platform. Data Insight uses the CEE framework that is provided byEMC to fetch access events from EMC Unity file servers.
Complete the following tasks to enable Data Insight to monitor a Dell EMC UnityVSA file server:
■ Complete all the prerequisites.See “Prerequisites for configuration of Isilon or Unity VSA file server monitoring” on page 186.
■ Obtain the necessary user credentials for accessing the Dell EMC Unity filer.See “Credentials required for configuring an EMC Unity VSA file server”on page 200.
■ Configure the audit settings on the Dell EMC Unity filer .See “Configuring audit settings on EMC Unity cluster using Unisphere VSAUnity console” on page 201.
12Chapter

■ Configure Data Insight to receive event notifications from an EMC Unity filer.See “Preparing Veritas Data Insight to receive event notifications from an EMCIsilon or Unity VSA cluster” on page 194.
■ Add the EMC Unity filer to Data Insight.See “Adding filers” on page 224.See “Add/Edit EMC Unity VSA file server options” on page 240.
Credentials required for configuring an EMCUnityVSA file server
Table 12-1 lists the set of credentials that are required by Veritas Data Insight duringsystem configuration.
Table 12-1 EMC Unity credentials
DetailsCredential
Required by the DataInsightCelerra service to run andauthenticate itself with the Unity cluster. The service runs onthe Data Insight Collector node.
The credential should belong to the user in the domain ofwhich the Data Insight Collector node and the Unity clusterare part.
Credentials required toconfigure DataInsightCelerraservice.
See “Preparing Veritas Data Insight to receive eventnotifications from an EMC Isilon or Unity VSA cluster”on page 194.
Credentials required duringfiler configuration through theData Insight ManagementConsole.
Required to discover sharesfor the Unity cluster.
Required for scanning of shares from the Unity cluster. Thiscredential belongs to the user in the domain of which theUnity cluster is a part.
See “Prerequisites for configuration of Isilon or Unity VSA fileserver monitoring ” on page 186.
If you want to use LDAP user credentials for scanning, youmust enter the credentials in the formatLDAPDomainname/Username. For example, tulip.local/user1.
Credentials required forscanning of shares
200Configuring EMC Unity VSA file serversCredentials required for configuring an EMC Unity VSA file server

Configuring audit settings on EMC Unity clusterusing Unisphere VSA Unity console
To enable Data Insight to receive access event information from the Unity cluster,you must configure auditing on the Unity cluster.
To configure audit settings on EMC Unity VSA
1 On the Unisphere VSA Unity console, navigate to STORAGE > File > NASServers.
2 Select the NAS server(s) or file system for which you want to enable auditing,and click Edit.
On the server properties page, click Protection & Events > Event Publishing.Select Enable Common Event Publishing.
3 Or navigate to STORAGE > File > File Systems.
On the File System properties page, click Advanced > Events Notifications,and select Enable SMB events publishing.
4 On the New Event Pool pop-up, enter the IP address of the Data InsightCollector node, and click Add. This step forwards the events for that NASserver to the Collector Node.
5 To notify CEPA of the events performed by a user, select Post Events >Configure.
6 On the Configure PostEvents for New Event Pool pop-up, click Select Allto select all configured events, or select the individual events that you want tomonitor. Click OK.
7 Click Configure.
201Configuring EMC Unity VSA file serversConfiguring audit settings on EMC Unity cluster using Unisphere VSA Unity console

Configuring Hitachi NASfile server monitoring
This chapter includes the following topics:
■ About configuring Hitachi NAS
■ Credentials required for configuring a Hitachi NAS EVS
■ Creating a domain user on a Hitachi NAS file server for Data Insight
■ Preparing a Hitachi NAS file server for file system auditing
■ Advanced configuration parameters for Hitachi NAS
About configuring Hitachi NASVeritas Data Insight lets you monitor the storage devices running Hitachi NAS 12.x.For Hitachi NAS, you can monitor only the CIFS shares. Monitoring of NFS sharesare not supported.
Each Hitachi NAS (HNAS) file server can consist of several Enterprise VirtualServers (EVS). An EVS is a logical entity with its own IP address and file system.Data Insight monitors the configured EVS and the shares residing on these virtualservers.
Note: Veritas recommends that you do not use any version which is lower thanHitachi NAS 12.x. This may lead to serious degradation of filer performance whenyou enable auditing.
13Chapter

Note: When you enable the SACL operation on HNAS shares, it causes BackupSoftware to run full back-up once.
Complete the following tasks to enable Data Insight to monitor a Hitachi NAS fileserver:
■ Obtain the necessary user credentials for accessing the Hitachi EVS host.See “Credentials required for configuring a Hitachi NAS EVS” on page 203.
■ Create a domain user with necessary privileges on the Hitachi NAS EVS.See “Creating a domain user on a Hitachi NAS file server for Data Insight”on page 203.
■ Configure the audit settings on the Hitachi NAS file server.See “Preparing a Hitachi NAS file server for file system auditing” on page 204.
■ Add the Hitachi NAS EVS to Data Insight.See “Adding filers” on page 224.See “Add/Edit Hitachi NAS file server options” on page 252.
■ Ensure that the Standard RPC ports 139 and 445 are open between the collectorand the Hitachi NAS device for configuring the device and scanning shares.
■ Ensure that the RPC/CIFS ports are used to communicate with the Hitachi NASEVS device for configuring the device and discovering shares.
Credentials required for configuring a Hitachi NASEVS
Table 13-1
DetailsCredential
A domain user in the Administrators group onthe Hitachi NAS EVS.
Credentials required during filer configurationthrough the Data Insight ManagementConsole. Data Insight also uses the samecredentials also for scanning of file metadata.
Creating a domain user on a Hitachi NAS fileserver for Data Insight
Data Insight needs a domain user with administrative privileges on Hitachi NASEVS to perform the following tasks:
203Configuring Hitachi NAS file server monitoringCredentials required for configuring a Hitachi NAS EVS

■ To discover shares.
■ To scan the shares for metadata.
■ To automatically enable the Security Access Control Lists (SACLs) on eachshare.
To create a domain user on the Hitachi NAS file server:
1 Log in using SSH to the Hitachi NAS Admin Services EVS using the manager(administrator) credentials.
2 Execute the following command:
localgroup add Administrators <domain name> /<username>
Preparing a Hitachi NAS file server for file systemauditing
To enable Data Insight to receive event information from a Hitachi NAS file server,you must complete the following tasks:
■ Enable file system auditing on each EVS file system that you want to monitor.
■ Configure and enable the audit log consolidated cache.
Note: The audit log consolidated cache accumulates all the individual audit logsfor each EVS. Data Insight accesses the cache to monitor the audit events.
To configure file system audit settings on a Hitachi NAS EVS
1 Log in to the Hitachi NAS console using administrator credentials.
2 Navigate to Home > File Services > File System Audit Policies.
3 Select the EVS for which you want to enable auditing.
4 Click add. The Add File System Audit Policy page is displayed. The AddFile System Audit Policy page displays a set of default settings for the auditpolicies. Retain the default settings.
5 Click OK.
6 Repeat the steps from 4 through 5 for the file systems in the EVS for whichyou want to enable auditing.
204Configuring Hitachi NAS file server monitoringPreparing a Hitachi NAS file server for file system auditing

To configure and enable the audit log consolidated cache
1 Log in to the Hitachi NAS Admin Services EVS using SSH. Use an administratorcredentials.
2 Execute the following command to switch from admin EVS to file services EVS:
console-context --evs <EVS name>
3 Execute the following command to configure the audit log consolidated cache:
audit-log-consolidated-cache add -s <Size> <EVS name>
For example:
audit-log-consolidated-cache add -s 50MB EVS1
Where, EVS1 is the name of file system EVS where you want to store the auditlog consolidated cache file. Veritas recommends that you provision disk spaceof at least 50MB size for audit log consolidated cache to avoid loss of events.
4 To verify if the auditing is enabled on the EVS for the required file system,generate some activity on the shares created on the file system. Execute thefollowing command on the Hitachi NAS Console to see if the events aregenerated:
audit-log-show <Name of file system>
Advanced configuration parameters for HitachiNAS
Sometimes the file operations per seconds (FOPS) for a Hitachi NAS filer may beaffected once Data Insight starts fetching events. Data Insight introduces an idleperiod between two successive read calls to let the filer improve the speed of fileoperations.
You can configure the following parameters to tune Hitachi NAS filer:
Specifies the maximum number of raw eventsfetched by Data Insight per execution ofhnas_util.exe.
Default value is 300000.
max_events_to_pull
Specifies the maximum number of events thatcan be stored in the Data Insight auditdatabase.
Default value is 100000.
max_valid_events
205Configuring Hitachi NAS file server monitoringAdvanced configuration parameters for Hitachi NAS

For all the read calls which fetch less numberof events than min_events_per_run, DataInsight sleeps for sleep_per_runmicroseconds, before making next read call.
Default value is 100.
You can set this parameter to fetch events atan optimized rate which does not degradethe performance of the filer.
If the number of events to be fetched is toohigh, some of the events might be lost. In asingle invocation of audit utility Data Insightmakes read calls till it finds no new events tobe fetched.
min_events_per_run
Specifies the amount of time by which DataInsight waits between two successive readcalls if the minimum number of events fetchedper read call decreases below the valuespecified by the min_events_per_runparameter
Default value is 500000 microseconds (0.5seconds).
sleep_per_run (in microseconds)
Specifies the approximate time interval afterwhich audit file would be generated.
Default value is 10 minutes.
max_audit_interval (in minutes)
To alter the configuration parameters, you can use configdb.exe command fromthe Data Insight Management Server.
For example:
configdb.exe -o -T filer -k 2 -J max_events_to_pull -j 50000
Where,
o- Object attribute
k- Filer ID
J- Attribute name
j- Attribute value
206Configuring Hitachi NAS file server monitoringAdvanced configuration parameters for Hitachi NAS

Configuring Windows FileServer monitoring
This chapter includes the following topics:
■ About configuring Windows file server monitoring
■ Credentials required for configuring Windows File Servers
■ Using the installcli.exe utility to configure multiple Windows file servers
■ Upgrading the Windows File Server agent
About configuringWindows file servermonitoringData Insight uses an agent to collect access events from the Windows file server.The agent resides on the file server. The Data Insight agent consists of a filter driverthat monitors the file system and records events that are relevant for Data Insight.It also consists of the Data Insight WinNAS service, which receives the eventinformation from the filter driver and transfers it to the collector node that isconfigured for that filer.
Note that the Windows filter driver does not capture IP address from which accessesare made.
Complete the following tasks to enable Data Insight to monitor the Windows fileserver:
■ Install the Data Insight agent on the Windows file server.You can choose to install the agent on the Windows file server automaticallywhen adding the filer, or manually. Before you can install the agent automatically,ensure that the communication service port 8383 on the Collector node isaccessible from the Windows file server.
14Chapter

For detailed information about installing the agent manually, see the VeritasData Insight Installation Guide.If you do not want Data Insight to access events for a Windows file server, it ispossible to configure Windows file server without an agent. In this case, DataInsight scans shares of the filer from the Collector.
■ Review the credentials that are required for configuring Windows file servermonitoring in Data Insight.See “Credentials required for configuring Windows File Servers” on page 208.
■ Add the Windows file server to Data Insight.See “Adding filers” on page 224.See “Add/Edit Windows File Server options ” on page 243.You can either add a Windows file server to Data Insight through theManagement Console, or if you want to add multiple filers together, you canuse the installcli.exe utility.See “Using the installcli.exe utility to configure multiple Windows file servers”on page 210.
Note: All Data Insight worker nodes must be at the same level of major version asthe Management Server. Windows file server agents can be one level lower thanthe Management Server version. Thus, Management Server 6.1.4 is compatiblewith versions 4.0.x, 4.5.x & 5.0.x as well as 6.1.4 of Windows file server agents.This gives you enough time to plan out the upgrade of your Windows file serveragents.
You can also add a clustered Windows file server to Data Insight. Data Insightsupports only a Microsoft Cluster Server (MSCS) configuration.
See “About configuring a DFS target” on page 264.
See “Using the Upload Manager utility” on page 111.
See “Adding filers” on page 224.
See “Add/Edit Windows File Server options ” on page 243.
Credentials required for configuringWindows FileServers
Table 14-1 lists the set of credentials that are required by Veritas Data Insight duringsystem configuration.
208Configuring Windows File Server monitoringCredentials required for configuring Windows File Servers

Table 14-1 Credentials for configuring Windows File Servers
DetailsCredential
This credential belongs to a user in theAdministrators group on the Windows FileServer.
The credential is also used to discover sharesand obtain storage utilization information fromthe filer.
Credentials required to install agent on theWindows File Server.
Required for monitoring shares or whenconfiguring a Windows File Server cluster.This credential belongs to a user in theAdministrators group on the file server.
If your configuration is not a Windows clusteror you do not want to collect storageutilization information for the filer, a credentialwith the privilege to list shares on the filer issufficient.
Credentials required to discover shares andobtain storage utilization information on thefiler.
209Configuring Windows File Server monitoringCredentials required for configuring Windows File Servers

Table 14-1 Credentials for configuring Windows File Servers (continued)
DetailsCredential
Required to scan a share. This credentialbelongs to a user with necessary share-levelpermissions and file system ACLs on aWindows File Server share.
To be able to obtain share-level ACLs, thecredentials must belong to the Power Usersor Administrators group on the Windows FileServer. You do not need this privilege if youdo not want to get the share-level ACLs.
To be able to scan a Windows File Servershare successfully, you must have theshare-level READ permission. Additionally,the folder within the share must have thefollowing file system ACLs:
■ Traverse Folder/Execute File■ List Folder/Read Data■ Read Attributes■ Read Extended Attributes■ Read Permissions
Note: To enable Data Insight to successfullyscan the shares on a clustered Windows FileServer, you must ensure that the scanninguser has domain level permissions of Allowlogon locally.
Credentials required for scanning shares onthe Windows File Server.
Note: If you neither want Data Insight to install an agent automatically, nor do youwant Data Insight to discover shares on the cluster or get storage utilizationinformation, specifying the filer credentials is optional.
Using the installcli.exe utility to configuremultipleWindows file servers
If you want to add multiple Windows file servers to Data Insight, you can use theinstallcli.exe utility.
The installcli.exe utility uses a .csv file with the following details as input:
210Configuring Windows File Server monitoringUsing the installcli.exe utility to configure multiple Windows file servers

■ The host name or IP address of the Windows file servers that you want DataInsight to monitor.
■ The host name, IP address, or ID of the Collector node that is configured toscan the filer.
■ The host name, IP address, or ID of the Indexer node that is configured for thefiler.
■ The credentials that Data Insight should use to install the agent on the Windowsfile server. The credential should be in the format user@domain. installcli.exealso accepts LocalSystem credentials as value _LOCAL_. The same credentialsmust be added to Data Insight as a saved credential previously.
■ True or false value indicating if the filer is clustered.
■ The IP addresses of the agents. Separate multiple IP addresses with asemi-colon. If you do not want to use an agent to monitor the filer, indicate thisoption with a hyphen (-).
■ The credentials that are required to scan the filer. The credential should be inthe format user@domain. The same credentials should be added to Data Insightas a saved credential previously.See “Credentials required for configuring Windows File Servers” on page 208.
■ True or false value indicating whether the scan should be enabled according tothe specified schedule.
■ In case of a Windows file server agent upgrade, RP or Full value indicating thetype of upgrade you want to perform. This parameter is optional.Optionally, the name of the installer. If the name of the installer is not specified,an appropriate installer is picked from installers folder on the Collector.
■ True or false value indicating whether event monitoring should be enabled. Forexample, winnas.company.com,collector.company.com,indexer.company.com,Administrator@DOMAIN,FALSE,winnas.company.com,Administrator@DOMAIN,TRUE,TRUE,RP,Veritas_DataInsight_windows_winnas_6_0_0_3002_x64.exe
To add multiple Windows file servers
1 Log in to the Data Insight Management Server.
2 Open a Windows command prompt and change to the INSTALL_DIR\bin
directory, where install_dir\bin is the installation path for Veritas DataInsight.
3 Type the following command:
installcli -w <Path to .csv file with Windows File Server
specifications>
211Configuring Windows File Server monitoringUsing the installcli.exe utility to configure multiple Windows file servers

For detailed information on installcli.exe, see the Command File Reference.
Upgrading the Windows File Server agentYou can upgrade the Windows File Server agent automatically from the Data InsightManagement Console.
Note: The option to upgrade the agent automatically appears only if you haveconfigured the Windows File Server to allow Data Insight to automatically installthe agent.
To upgrade Windows File Server agent automatically
1 Log on to the Management Console as Administrator.
2 Use the Upload Manager utility to upload the agent packages on Collectorworker nodes corresponding to the Windows File Server agent. The installerpackage goes by the nameVeritas_DataInsight_windows_6_1RP4_6_1_4_N_x64.exe.
See “Using the Upload Manager utility” on page 111.
3 Select Settings > Filers to view the list of configured Windows File Servers.
4 Click the server on which you want the upgrade the agent.
5 On the configuration details page, click Upgrade Agent
6 Windows File Server agent upgrade window appears and displays a progressbar while upgrading.
7 Click Finish to exit setup.
Note: To upgrade the Windows File Server agent manually, see the Veritas DataInsight Installation Guide. You can upgrade multiple Windows File Server agentsusing the installcli utility. See “About configuring Windows file server monitoring”on page 207.
Note: Data Insight does not support upgrading a Windows File Server agent from4.0 to 6.1.4. You must first upgrade the Windows File Server agent first to 4.5, 5.0or 5.1, and then upgrade the agent to 6.1.4. Also, you can not upgrade a 32 bit4.0.x Windows File Server agent to 6.1.4 as the last supported 32 bit agent is 4.5.x.
212Configuring Windows File Server monitoringUpgrading the Windows File Server agent

Configuring Veritas FileSystem (VxFS) file servermonitoring
This chapter includes the following topics:
■ About configuring Veritas File System (VxFS) file servers
■ Credentials required for configuring Veritas File System (VxFS) servers
■ Enabling export of UNIX/Linux NFS shares on VxFS filers
About configuring Veritas File System (VxFS) fileservers
A Data Insight agent plugin, vxdiplugind, is used to monitor access events on theVxFs file servers. The plugin is part of the VxFS package and is automaticallyinstalled on the file server when Veritas Storage Foundation is installed. The plug-incaptures events from the VxFS filer that Data Insight is monitoring, and saves it toa temporary database.The event data is then pulled by Data Insight, which fetchesthe access event information through Veritas Operations Manager (VOM) to gainvital insight into the user activity on the filer.
Data Insight uses NFS to scan all or a portion of VxFS shares remotely from theCollector node. Data Insight only monitors the access events on the VxFS devicesexported by NFS.
Before you start configuring VxFS filers, verify the following:
■ The file server must be installed with Storage Foundation 6.0.1 or higher.
15Chapter

■ The file server must be installed with Veritas Operations Manager (VOM) 4.1or higher.
■ NFS version 3.0 is configured on the VxFS filer.
■ The LDAP or NIS domains that your users are part of must be configured inData Insight.
■ The Collector node for the VxFs filer must be a supported version of WindowsEnterprise server. Ensure that the Collector node monitoring the VxFS filer hasservices for NFS enabled as file server roles. You can install a role on theWindows Enterprise server through the Server Manager > Add roles option.
■ The filer is accessible from the Collector node using the host name or IP addressyou plan to use when adding the filer.
You can also add a clustered VxFS file server to Data Insight. Data Insight supportsonly a Veritas Cluster Server (VCS) configuration for VxFS file servers configuredin failover mode. Parallel Clustered File System is not supported in this release.
See “Adding filers” on page 224.
See “Enabling export of UNIX/Linux NFS shares on VxFS filers” on page 216.
See “Add/Edit Veritas File System server options” on page 247.
Credentials required for configuring Veritas FileSystem (VxFS) servers
Table 15-1 lists the set of credentials that are required by Veritas Data Insight duringsystem configuration.
214Configuring Veritas File System (VxFS) file server monitoringCredentials required for configuring Veritas File System (VxFS) servers

Table 15-1 Credentials required for configuring VxFS filers
DetailsCredentials
Required to discover shares on the VxFs filer.This credentials belongs to a user on theUNIX server who has administrative rights onthe VxFS filer (for example, root). Thecredential should belong to a root user on theVxFS filer.
Optionally, this credential can also belong toa local user who has access to the DataInsight namespace which is alreadyconfigured under/opt/VRTSsfmh/di/web/admin.
To configure a user other than the root user,you must create or use an existing useraccount, which you can use to add the filerinto the Data Insight namespace. To add alocal user account under VOM:
1 Log in as root on the VxFs filer.
2 Change directory to/opt/VRTSsfmh/di/web/admin.
3 Create a .xprtlaccess file, and addthe user to that file. For example, addvomuser@unixpwd:user, wherevomuser is the name of the local useraccount.
Credentials required during filer configurationthrough the Veritas Data Insight ManagementConsole.
215Configuring Veritas File System (VxFS) file server monitoringCredentials required for configuring Veritas File System (VxFS) servers

Table 15-1 Credentials required for configuring VxFS filers (continued)
DetailsCredentials
Required for scanning of shares from theVxFS filer.
For scanning NFS shares, Data Insight needsa domain account or a LocalSystem accountwith at least read and execute permissionson all folders, alongwith at least readpermission on all files. By default, Data Insightuses the User ID or Group ID 0 to scan NFSshares. You can configure an alternate UserID or Group ID from theData Insight Servers>Advanced Settings section of the Collectornode.
See “Configuring advanced settings”on page 88.
Additionally, you must also have share-levelREAD permissions on the NFS export.
Credentials required for scanning on VxFSfiler server
Enabling export of UNIX/Linux NFS shares onVxFS filers
These instructions are for Red Hat Enterprise Linux operation system which hasstandalone Storage Foundation 6.0 installed and a file system created using VxFS.The steps will change depending upon other operating system flavors.
216Configuring Veritas File System (VxFS) file server monitoringEnabling export of UNIX/Linux NFS shares on VxFS filers

To enable export of NFS shares on VxFS filers
1 Login as root on the VxFS filer and open the /etc/exports file.
2 Specify the name of the share that you would like to monitor. For example,/demoshare, where the VxFS file system is mounted.
Ensure that the device entries are added in /etc/fstab to automatically mountNFS file systems after reboot.
Data Insight uses /etc/exports and /etc/fstab for NFS share discovery. Sampleentries are shown below:
root@RHEL5-VxFS ~]# cat /etc/fstab | grep vxfs
/dev/vx/dsk/openldapdg/vol01 /openldaphome vxfs defaults,_netdev 0 0
/dev/vx/dsk/openldapdg/vol02 /data vxfs defaults,_netdev 0 0
/dev/vx/dsk/openldapdg/vol03 /didata vxfs defaults,_netdev 0 0
[root@RHEL5-VxFS ~]# cat /etc/exports
/openldaphome 192.168.0.10(ro,sync,no_root_squash) 192.168.0.11
(rw,syc) /data/exportshare *(rw,sync,no_root_squash)
/didata *(rw,sync,no_root_squash)
3 Specify the root access and read only access to Data Insight Collector node.For example,
/demoshare <Collector node IP> (ro,sync,no_root_squash)
ro:read only
no_root_squash: root access.
You can specify read +write, root_squash, anonuid, anongid or other settings,as required.
4 Run the following command to start the NFS daemon
#service nfs start
See “Adding filers” on page 224.
217Configuring Veritas File System (VxFS) file server monitoringEnabling export of UNIX/Linux NFS shares on VxFS filers

Configuring monitoring ofa generic device
This chapter includes the following topics:
■ About configuring a generic device
■ Credentials required for scanning a generic device
About configuring a generic deviceData Insight supports scanning and auditing of access events on storage deviceswith varied file systems. You can configure Data Insight to monitor generic devicefilers in addtion to NetApp, EMC Celerra, Veritas File System (VxFS), WindowsFile Server.
Data Insight uses a web API to collect access event files from the generic devicefiler. The web API enables web clients to push events from the generic device filersto the DataInsightGenericCollector web service. The DataInsightGenericCollectorweb service collects incoming events and copies them to a specific location on theCollector worker node configured for the storage device. The events are laterprocessed by the corresponding Indexer.
The DataInsightGenericCollector service uses one-way Secure Sockets Layer (SSL)to secure communication between the generic device filer and the Collector node.The client connects to the DataInsightGenericCollector service through a specificport, which is configurable.
You must develop a customized client using the API specification provided by DataInsight to add a filer as a generic device to Data Insight, and to start monitoring,auditing, and scanning events on the filer. For more information on the web APIspecification for the generic Collector service, refer to theData Insight Programmer'sReference Guide.
16Chapter

See “Add/Edit a generic storage device options” on page 250.
Credentials required for scanning a generic deviceTable 16-1 lists the set of credentials that are required by Veritas Data Insight toscan a generic storage device.
219Configuring monitoring of a generic deviceCredentials required for scanning a generic device

Table 16-1 Credentials for scanning a generic device
DetailsCredential
Required for scanning of shares from the filer.
When scanning CIFS shares, this credentialbelongs to the user in the domain of whichthe filer a part. While the exact set ofpermissions depends on the generic devicebeing scanned, this user must generallybelong to the Administrator's group on thedevice. If the credential is not part ofAdministrator's group, the scanner might notbe able to get share-level ACLs for shares ofthis device.
Typically, to scan CIFS shares, you musthave the share-level READ permission.Additionally, the folder within the share musthave the following file system ACLs enabledfor the scan credential:
■ Traverse Folder/Execute File■ List Folder/Read Data■ Read Attributes■ Read Extended Attributes■ Read Permissions
For scanning NFS shares, Data Insight needsa Unix account with at least read and executepermissions on all folders, alongwith at leastread permission on all files. By default, DataInsight uses User ID or Group ID 0 to scanNFS shares. You can configure an alternateUser ID or Group ID from the Settings >Advanced Settings section of the Collectornode.
See “Configuring advanced settings”on page 88.
When monitoring only NFS shares, you canspecifyUse Local System account from thescanning credentials drop-down, else you canspecify credentials required to scan CIFSshares.
Credentials required for scanning of shares.
220Configuring monitoring of a generic deviceCredentials required for scanning a generic device

Managing file serversThis chapter includes the following topics:
■ About configuring filers
■ Viewing configured filers
■ Adding filers
■ Custom schedule options
■ Editing filer configuration
■ Deleting filers
■ Viewing performance statistics for file servers
■ About disabled shares
■ Adding shares
■ Managing shares
■ Editing share configuration
■ Deleting shares
■ About configuring a DFS target
■ Adding a configuration attribute for devices
■ Configuring a DFS target
■ About the DFS utility
■ Running the DFS utility
■ Importing DFS mapping
17Chapter

About configuring filersVeritas Data Insight collects and stores access events from NAS devices to servicequeries on user activity and data accesses. Before Data Insight can start collectingevents, you must ensure that auditing is configured properly on the storage device.Data Insight collects access events using asynchronous APIs, namely, Fpolicy forNetApp filers, the CEE framework for EMC Celerra filers, and file system filter driversfor Windows File Server. Additionally, other generic devices can also publish eventsto Data Insight using web APIs.
Data Insight does not natively support monitoring and scanning of NFS shares forNetApp Cluster-Mode, EMC Celerra, EMC Isilon, Windows File Server, and HitachiNAS devices. To enable Data Insight to discover NFS shares, you must add thefiler as a generic device in the Data Insight configuration.
See “Managing Data Insight product servers” on page 75.
See “About configuring NetApp file server monitoring” on page 137.
See “About configuring a clustered NetApp file server” on page 157.
See “About configuring EMC Celerra or VNX filers” on page 177.
See “About configuring EMC Isilon filers” on page 185.
See “About configuring a generic device” on page 218.
See “About configuring Hitachi NAS” on page 202.
Viewing configured filersIn the Management Console, you can view all the filers that Data Insight is configuredto monitor.
Additionally, you can also do the following tasks from the filer list page:
■ Add multiple filers to the Data Insight configuration.See “Adding filers” on page 224.
■ Add shares in bulk to a selected filer.See “Adding shares” on page 258.
Use the provided dynamic search filter to search for configured filers based onvarious pre-defined criteria, for example, the type of the filer. You can also use theFilter field at the top of the content pane to filter the list of filers based on the IPaddress or hostname of the filer in addition to the pre-defined filter criteria. Thedisplayed list of filers changes automatically when you select the check box for afilter criteria. For instance, when you select NetApp in the Device Type category,the application displays a list of configured NetApp devices. Similarly, when you
222Managing file serversAbout configuring filers

select a Collector node in the By Collector filter, Data Insight displays a list of filersassociated with the selected Collector node.
To view configured filers
1 In the Console, click Settings > Filers.
The screen displays the list of configured filers
2 Review the following information about the filers:
■ The object ID of the filer. This numerical value is used to identify the filerwhen troubleshooting issues with the filer. This column is hidden by default.To view this column, click on the column header and select Columns > ID.
■ The name of the filer.
■ The number of shares monitored by the filer.
■ The health of the filer.
■ The type of filer -NetApp, EMC Celerra, Windows File Server, Veritas FileSystem (VxFS) server, or a generic device.
■ Whether file system event monitoring is enabled.
■ The Collector node for the filer.
■ The Indexer node for the filer.To change the Indexer node associated with the filer, clickChange Indexer.See “About migrating storage devices across Indexers” on page 112.
■ The scanning schedule for the filer. This column is hidden by default.
To review filer details
1 In the Console, click Settings > Filers.
2 Click the filer that you want to review, or click the Select Action drop-downand select View.
The filer details screen appears.
223Managing file serversViewing configured filers

To view filer events
1 In the Management Console, click Settings > Filers.
2 Click the Select Action drop-down for the corresponding server in the filerslisting table, and select Event Log.
The event log for that filer appears.
3 To download Data Insight logs for the filer for troubleshooting purposes, clickthe Select Action drop-down for the corresponding filer, and selectDownloadLogs.
Data Insight downloads a compressed folder containing the logs related to thisfiler from all relevant Data Insight servers.
See “Downloading Data Insight logs” on page 455.
See “Adding shares” on page 258.
Adding filersYou must add filers that you want Veritas Data Insight to monitor.
To add filers
1 In the Console, click Settings > Filers.
The Filers page displays the list of available filers.
2 On the Filers page, click the Add New Filer drop-down, and select the type offiler you want to add.
3 On the New Filer screen, enter the filer properties, and click Add New Filer.
If you are adding a Windows File Server, Data Insight can automatically installan agent on the filer. This agent enables Data Insight to receive eventnotifications from the filer.
For detailed information about installing the agent manually, see the VeritasData Insight Installation Guide.
Adding filers in bulkYou can also add multiple filers at once to the Data Insight configuration.
To add filers in bulk
1 In the Console, click Settings > Filers.
2 On the Filers page, click the Add Filers in Bulk drop-down, and select thetype of filer you want to add.
224Managing file serversAdding filers

3 On the Bulk Add <Name of filer> pop-up, browse to the location of the CSVfile that contains the configuration details for each filer.
Note: If you are configuring multiple filers for the first time, download a sampleof the CSV file; create a CSV file with the details corresponding to the type offiler you want to configure.
4 Click Upload.
Note: Data Insight disables addition of filers if you do not have a valid license or ifyour license has expired. See “Overview of Data Insight licensing” on page 24.
Add/Edit NetApp filer optionsUse this dialog box to add a new NetApp filer to Veritas Data Insight or to edit theconfiguration of an existing filer.
Table 17-1 Add/Edit NetApp filer options
DescriptionField
Enter the host name or IP address of the filer that you want Data Insightto monitor.
Note: The host name or IP address should be the same as the filername is entered in Symantec Data Loss Prevention targets.
Filer host name orIP address
225Managing file serversAdding filers

Table 17-1 Add/Edit NetApp filer options (continued)
DescriptionField
Do the following:
1 Click Select Collector.
2 The Select Collector pop-up displays the configured collectorsthat are available for selection.
3 Review the performance parameters such as disk and CPUutilization and backlog of files accumulating on the configurednodes. You can also view the number of devices, shares or sitecollections assigned to each configured node. It is recommendedthat you assign a node on which the resource utilization is low.
4 Click Select to assign the Collector to the filer.
Data Insight connects to the filer from this server. Veritas recommendsthat the Collector worker node share a fast network with the filer.
Note: When monitoring NFS shares, ensure that the Collector nodemonitoring the filer must have services for NFS enabled as file serverroles. You can install the role on a supported version of Windows throughthe Server Manager > Add roles option.
Collector
Do the following:
1 Click Select Indexer.
2 The Select Indexer pop-up displays the configured indexers thatare available for selection.
3 Review the performance parameters such as disk and CPUutilization and backlog of files accumulating on the configurednodes. It is recommended that you assign a node on which theresource utilization is low.
4 Click Select to assign the Indexer to the filer.
Events and metadata collected from the filer are processed and storedon the Indexer node.
You can also migrate the file server to another Indexer.
See “About migrating storage devices across Indexers” on page 112.
Indexer
See “Credentials required for configuring NetApp filers” on page 138.
Specifying the filer administrator credentials is optional, if you chooseto not monitor events on the filer, nor enable share discovery.
Filer administratorcredentials
226Managing file serversAdding filers

Table 17-1 Add/Edit NetApp filer options (continued)
DescriptionField
Click to test the availability of network connection between the Collectorworker node and the filer, and to test the validity of specified credentials.
Veritas recommends that you test the connection before proceeding toensure that Data Insight is able to connect to the filer.
Test credentials
Select the check box to indicate that this filer is a NetApp virtual fileserver.
Filer is vFiler
The host name or IP address of the physical NetApp file server that isassociated with the virtual file server.
If the Data Insight FPolicy safeguard is not enabled for the virtual fileserver, the field is not editable.
See “Configuring scanning and event monitoring ” on page 32.
Physical filer forvFiler
Select this check box to enable monitoring of CIFS shares.Enable CIFSmonitoring
Select this check box to enable monitoring of NFS shares.Enable NFSmonitoring
From the drop-down, select the domain to which the NetApp filerbelongs.
This option is enabled when you enable the monitoring of NFS shares.
Select domain
Select Automatically discover and monitor shares on this filer toallow Data Insight automatically discover shares of the filer and addthem configuration.
Discovery of shares takes place as soon as you add a new filer andthen twice each day at 2:00 A.M. and 2:00 P.M.
You can also choose to add shares manually.
See “Adding shares” on page 258.
Monitoring details
Enter the details of shares which should not be included duringdiscovery.
This option is available if you selectAutomatically discover all shareson this filer. Specify comma-separated patterns that you want to ignore.Patterns can have 0 or more wildcard * characters. For example, tmp*ignores tmp_A, tmp_abc, *$ ignores shares C$, EXT$, and others.
Exclude sharesfrom discovery
227Managing file serversAdding filers

Table 17-1 Add/Edit NetApp filer options (continued)
DescriptionField
Select the check box to allow Data Insight to gather storage utilizationinformation from the filer. This information is used when you generateFiler Utilization and Filer Growth Trend reports.
Note: The Filer utilization and Filer Growth Trend reports are availableonly for NetApp and Windows File Server.
The DataInsightFpolicy service running on the Collector node gathersinformation about storage utilization on the filer.
Enable storageutilization analytics
Select to enable event monitoring on the filer.Enable file systemevent monitoring
Select to automatically enable FPolicy on the filer.
If you clear this check box, you must manually enable FPolicy on thefiler.
See “Preparing the NetApp filer for Fpolicy” on page 146.
Enable FPolicyautomatically
Select the option to register for explicit Read events.
When this option is not selected, OPEN events are treated as READevents.
Note: NFSv3 does not support OPEN events. This means that you willnot see READ events for NFS shares when this check box is cleared.
Veritas recommends that you do not register for explicit Read events.This can increase the load on the filer during peak traffic from third partyapplications such as backups over CIFS.
Register for explicitRead events
Select the check box to enable filer scanning according to the specifiedschedule.
Enable filerscanning
Select one of the following to define a scanning schedule for shares ofthis filer:
■ Use Collector's default scanning schedule.■ Use custom schedule.
See “Custom schedule options” on page 254.
Veritas Data Insight periodically scans shares of the filer to obtain filemetadata and security descriptors. Each Collector worker node bydefault initiates a full scan of shares at 7:00 P.M. on the last Friday ofeach month.
Scanning schedulefor full scans
228Managing file serversAdding filers

Table 17-1 Add/Edit NetApp filer options (continued)
DescriptionField
See “Credentials required for configuring NetApp filers” on page 138.Scannercredentials
Select this option to scan newly added shares immediately, instead ofwaiting for the normal scan schedule. Scanning proceeds only whenscanning is permitted on the Collector node.
Scan new sharesimmediately
See “Enabling export of NFS shares on a NetApp file server” on page 154.
Add/Edit NetApp cluster file server optionsUse this dialog box to add a new NetApp filer in cluster mode to Veritas Data Insightor to edit the configuration of an existing filer.
Table 17-2 Add/Edit NetApp cluster file server options
DescriptionField
Enter the host name or IP address NetApp Cluster Management hostinterface that is used to manage the nodes in the cluster.
ClusterManagement Host
Do the following:
1 Click Select Collector.
2 The Select Collector pop-up displays the configured Collectorsthat are available for selection.
3 Review the performance parameters such as disk and CPUutilization and backlog of files accumulating on the configurednodes. You can also view the number of devices, shares or sitecollections assigned to each configured node. It is recommendedthat you assign a node on which the resource utilization is low.
4 Click Select to assign the Collector to the filer.
Data Insight connects to the NetApp Cluster Management host fromthis server. Veritas recommends that the Collector worker node sharea fast network with the cluster management host.
Collector
229Managing file serversAdding filers

Table 17-2 Add/Edit NetApp cluster file server options (continued)
DescriptionField
Do the following:
1 Click Select Indexer.
2 The Select Indexer pop-up displays the configured indexers thatare available for selection.
3 Review the performance parameters such as disk and CPUutilization and backlog of files accumulating on the configurednodes. It is recommended that you assign a node on which theresource utilization is low.
4 Click Select to assign the Indexer to the filer.
Events and metadata that are collected from the cluster are processedand stored on the Indexer node.
You can also migrate the file server to another Indexer.
Indexer
Data Insight uses the credentials that you specify to discover thefollowing:
■ The SVMs in the cluster and the CIFS server underneath each SVM.■ The CIFS shares for each of the CIFS servers.■ The NFS exports on the NetApp cluster.
To enable Data Insight to successfully discover shares, ensure thatHTTP port 80 is not blocked between Data Insight Collector and NetAppcluster management host.
Specifying the filer administrator credentials is optional, if you chooseto not monitor events on the filer, nor enable share discovery.
See “Credentials required for configuring a clustered NetApp file server”on page 161.
ClusterManagementInterfacecredentials
230Managing file serversAdding filers

Table 17-2 Add/Edit NetApp cluster file server options (continued)
DescriptionField
Optionally, you can use an SSL certificate instead of the ClusterManagement Interface credentials.
■ Select the radio button if you want to authenticate the communicationbetween Data Insight and the NetApp cluster using a digitally signedcertificate.
■ You must generate a self-signed or a CA signed certificate and installthe SSL certificate on the cluster Admin Vserver to use this option.See “Generating SSL certificates for NetApp cluster-modeauthentication” on page 170.See “Preparing the NetApp cluster for SSL authentication”on page 172.
■ From the drop-down, select the a saved SSL certificate, or clickAddNew.
■ On the Add SSL Certificate pop-up, do the following:■ In the Saved SSL Certificate Identifier field, enter a logical
name to identify the filers for which the certificate is used.■ Browse to the location of the .pem and .key files to select each
of them.■ Click Upload to upload the SSL certificate to the Data Insight
Collector assigned to the filer.
Note: If you choose to use SSL authentication, use local usercredentials. Do not choose this option if you are using domain usercredentials to configure the NetApp cluster-mode filer. The SVMs withNFS protocol enabled are not be discovered if you are using domainuser credentials authenticated using SSL.
ClusterManagement SSLCertificate
Click to test the availability of network connection between the Collectorworker node and the filer, and to test the validity of specified credentials.
Veritas recommends that you test the connection before proceeding toensure that Data Insight is able to connect to the cluster managementhost.
By default, Data Insight does not test credentials for the followingHOMEDIR shares:
■ ~■ ~CIFS.HOMEDIR■ CIFS.HOMEDIR■ %w■ %d
Test credentials
231Managing file serversAdding filers

Table 17-2 Add/Edit NetApp cluster file server options (continued)
DescriptionField
Every SVM node in the cluster has a CIFS server configured on it. TheCIFS server represents a file server for Data Insight.
If both CIFS and NFS protocols are enabled, Data Insight automaticallydiscovers the CIFS server name. If only CIFs protocol is enabled, DataInsight discovers all the CIFS servers that are configured in the cluster.If only NFS protocol is enabled then Data Insight fetches the SVM name.
From the drop-down, select the CIFS server/SVM that you want DataInsight to monitor.
Ensure that you can resolve the CIFS server host name from theCollector node.
Storage VirtualMachine (SVM)
Select this check box to enable monitoring of CIFS shares.Enable CIFSmonitoring
Select this check box to enable monitoring of NFS exports on the NetAppcluster.
Enable NFSmonitoring
You can use a Logical Interface (LIF) associated with the SVM tocommunicate with Data Insight.
Data Insight uses the Data LIF to access data from the CIFS and NFSservers . If the Admin LIF and Data LIF are associated with two differentnetworks, then you must specify the Data LIF name while scanning theCIFS shares or NFS exports that reside on configured CIFS servers.
Providing a Data LIF hostname is also useful if the Admin LIF for thecluster is not configured for CIFS or NFS protocol access.
Selecting the LIF hostname is optional if the name of the CIFS serverand the Data LIF is the same.
Use CIFS Data LIFhostname forscanning(Optional) / UseNFS Data LIFhostname forscanning
Select Automatically discover and monitor shares on this filer toallowData Insight to automatically discover shares of the filer and addthem configuration.
Discovery of shares takes place as soon as you add a new filer andthen twice each day at 2:00 A.M. and 2:00 P.M.
You can also choose to add shares manually.
See “Adding shares” on page 258.
Monitoring details
232Managing file serversAdding filers

Table 17-2 Add/Edit NetApp cluster file server options (continued)
DescriptionField
Enter the details of shares which should not be included duringdiscovery.
This option is available if you selectAutomatically discover all shareson this filer. Specify comma-separated patterns that you want to ignore.Patterns can have 0 or more wildcard * characters. For example, tmp*ignores tmp_A, tmp_abc, *$ ignores shares C$, EXT$, and others.
Exclude sharesfrom discovery
Select the check box to allow Data Insight to gather storage utilizationinformation from the filer. This information is used when you generateFiler Utilization and Filer Growth Trend reports.
Note: The Filer utilization and Filer Growth Trend reports are availableonly for NetApp and Windows File Server.
The DataInsightFpolicyCmod service running on the Collector nodegathers information about storage utilization on the filer.
See “About configuring FPolicy in Cluster-Mode” on page 159.
Enable storageutilization analytics
Select to enable event monitoring on the filer.Enable file systemevent monitoring
Select to automatically enable FPolicy on the filer.
Once you enable FPolicy, the Clustered Data ONTAP SVM node serverinitiates a TCP connection to the Data Insight FPolicy server. Ensurethat the communication port in the firewall between the FPolicy serverand the cluster management host is open.
If you clear this check box, you must manually enable FPolicy on thefiler.
See “Preparing the NetApp filer for Fpolicy” on page 146.
Enable FPolicyautomatically
Select if you want Data Insight to monitor the changes to permissionsin your storage environment.
By default, this option is not selected because it has a significant impacton the performance of the file server.
Register forpermission changeevents
Select the check box to enable filer scanning according to the specifiedschedule.
Enable filerscanning
Select this option to scan newly added shares immediately, instead ofwaiting for the normal scan schedule. Scanning proceeds only whenscanning is permitted on the Collector node.
Scan new sharesimmediately
233Managing file serversAdding filers

Table 17-2 Add/Edit NetApp cluster file server options (continued)
DescriptionField
See “Credentials required for configuring a clustered NetApp file server”on page 161.
Scannercredentials
Select one of the following to define a scanning schedule for shares ofthis filer:
■ Use Collector's default scanning schedule.■ Use custom schedule.
See “Custom schedule options” on page 254.
Veritas Data Insight periodically scans shares of the filer to obtain filemetadata and security descriptors. Each Collector worker node bydefault initiates a full scan of shares at 7:00 P.M. on the last Friday ofeach month.
Scanning schedulefor full scans
Add/Edit EMC Celerra filer optionsUse this dialog box to add a new EMC Celerra filer to Veritas Data Insight or to editthe configuration of an existing filer.
Table 17-3 Add/Edit EMC Celerra filer options
DescriptionField
Enter the host name of the CIFS server that is exported by the filer.
Entering the IP address of the CIFS server is not permitted
CIFS Server Name
Enter the IP address of the filer's Control Station.Control StationHostname/IPaddress
234Managing file serversAdding filers

Table 17-3 Add/Edit EMC Celerra filer options (continued)
DescriptionField
Do the following:
1 Click Select Collector.
2 The Select Collector pop-up displays the configured Collectorsthat are available for selection.
3 Review the performance parameters such as disk and CPUutilization and backlog of files accumulating on the configurednodes. You can also view the number of devices, shares or sitecollections assigned to each configured node. It is recommendedthat you assign a node on which the resource utilization is low.
4 Click Select to assign the Collector to the filer.
Data Insight connects to the filer from this server. Veritas recommendsthat the Collector worker node share a fast network with the filer
Collector
Do the following:
1 Click Select Indexer.
2 The Select Indexer pop-up displays the configured indexers thatare available for selection.
3 Review the performance parameters such as disk and CPUutilization and backlog of files accumulating on the configurednodes. It is recommended that you assign a node on which theresource utilization is low.
4 Click Select to assign the Indexer to the filer.
Events and metadata that are collected from the cluster are processedand stored on the Indexer node.
You can also migrate the file server to another Indexer.
Indexer
Enter the credentials for the filer's Control Station.
These credentials are used to discover shares on the filer and add themto the configuration.
You can specify non-administrative credentials, however, TestConnection will fail. In this case, you can continue to add the filer, butyou must add shares manually.
Control StationCredentials
Select the check box if the filer is running a virtual data mover.
This field is used to handle physical paths that are returned for virtualdata movers.
Virtual Data Mover
235Managing file serversAdding filers

Table 17-3 Add/Edit EMC Celerra filer options (continued)
DescriptionField
Click to test the availability of network connection between the Collectorworker node and the control station and the validity of the specifiedcredentials.
Veritas recommends that you test the connection before proceeding toensure that Data Insight is able to connect to the filer.
Note: You must skip testing of credentials if you choose to use anon-administrator user. When you click Test Credentials, Data Insightby default tries to discover shares on the filer using the Control Stationcredentials.
Test credentials
Select Automatically discover and monitor shares on this filer toenable Data Insight to automatically discover shares of the filer and addthem configuration.
You can also choose to add shares manually.
Clear the check box if you use Control Station credentials withinsufficient privileges for share discovery. If you choose to usecredentials that do not have administrator rights and XML v2 privilege,you must manually add shares to the configuration.
Discovery of shares takes place as soon as you add a new filer andthen twice each day at 2:00 A.M. and 2:00 P.M.
See “Adding shares” on page 258.
Monitoring details
Select to enable event monitoring on the filer.Enable file systemevent monitoring
Select the check box to enable filer scanning according to the specifiedschedule.
Enable filerscanning
Select one of the following to define a scanning schedule for shares ofthis filer:
■ Use the Collector's scanning schedule■ Use custom schedule
See “Custom schedule options” on page 254.
From the drop-down, select the appropriate frequency option. VeritasData Insight periodically scans shares of the filer to obtain file metadataand security descriptors. Each Collector worker node by default initiatesa full scan of shares on the last Friday of each month.
Note: You can also customize the schedule per share using theAdd/Edit Share dialog box.
Scanning schedulefor full scans
236Managing file serversAdding filers

Table 17-3 Add/Edit EMC Celerra filer options (continued)
DescriptionField
See “Credentials required for configuring EMC Celerra filers”on page 183.
Scannercredentials
Select this option to scan newly added shares immediately, instead ofwaiting for the normal scan schedule.
Scanning will still run only when scanning is permitted on the Collectornode.
Scan new shareimmediately
Add/Edit EMC Isilon file server optionsTable 17-4
DescriptionField
Enter the host name for the Isilon cluster. It can be EMC IsilonSmartConnect Cluster name or it can be the DNS resolvable host nameof one of the hosts of the cluster.
Note: The Cluster Management host name is the same host namewhich is entered during the configuration of audit settings on the Isiloncluster. See “Configuring audit settings on EMC Isilon cluster usingOneFS GUI console” on page 188.
ClusterManagement Host
Enter the port number on Isilon to be used for discovery.
Note: This is the port which is part of the URL used to access EMCIsilon OneFS web-based management console.
ClusterManagement Port
Do the following:
1 Click Select Collector.
2 The Select Collector pop-up displays the configured Collectorsthat are available for selection.
3 Review the performance parameters such as disk and CPUutilization and backlog of files accumulating on the configurednodes. You can also view the number of devices, shares or sitecollections assigned to each configured node. It is recommendedthat you assign a node on which the resource utilization is low.
4 Click Select to assign the Collector to the filer.
Data Insight connects to the filer from this server. Veritas recommendsthat the Collector worker node share a fast network with the filer
Collector
237Managing file serversAdding filers

Table 17-4 (continued)
DescriptionField
Do the following:
1 Click Select Indexer.
2 The Select Indexer pop-up displays the configured indexers thatare available for selection.
3 Review the performance parameters such as disk and CPUutilization and backlog of files accumulating on the configurednodes. It is recommended that you assign a node on which theresource utilization is low.
4 Click Select to assign the Indexer to the filer.
You can also migrate the file server to another Indexer.
Indexer
Select the saved credentials from the drop-down list to access theCluster Management host.
ClusterManagement HostCredentials
Click to test the availability of network connection between the Collectorworker node and the Isilon cluster.
Test credentials
238Managing file serversAdding filers

Table 17-4 (continued)
DescriptionField
Select Discover shares automatically to enable Data Insight todiscover the shares on the filer automatically and add themconfiguration.
Indicate your preference as to the options that Data Insight should useto discover shares on the Isilon cluster. Select one of the following:
■ Access zones - Discovers shares from the configured access zonesnames, including the shares from the System zone.
■ SmartConnect Zone Name - Data Insight uses the SmartConnectname to discover and scan shares (including shares on systemaccess zones) whenever SmartConnect is configured.
■ SmartConnect Zone Alias - SmartConnect aliases are used to ensurethat SmartConnect names work across migration. Thus, aliases takeprecedence over SmartConnect names for scanning a share. If theSmartConnect Zone alias is not available, Data Insight usesSmartConnect name to discover shares across access zones.
If none of these are DNS resolvable scan fails for these shares.
Note: Support for using SmartConnect to discover shares is availablefor Isilon OneFS version 8.0 and later.
Ensure that the host name of the access zones that you want DataInsight to discover are resolvable from the Collector node monitoringthe filer.
When access zone names are not used for accessing SMB shares,additional mapping can be imported into Data Insight
See “Using SmartConnect mapping for access zones” on page 196.
Monitoring Details
Select to enable event monitoring on the filer.Enable file systemevent monitoring
Select the check box to enable filer scanning according to the specifiedschedule.
Enable filerscanning
Select one of the following to define a scanning schedule for shares ofthis filer:
■ Use the Collector's default scanning schedule■ Use custom schedule
From the drop-down, select the appropriate frequency option.
ScanningSchedule(FullScan)
See “Credentials required for configuring an EMC Isilon cluster”on page 187.
Scannercredentials
239Managing file serversAdding filers

Table 17-4 (continued)
DescriptionField
Select this option to scan newly added shares immediately, instead ofwaiting for the normal scan schedule. Note that a scan can run onlywhen scanning is permitted on the Collector node.
Scan newly addedsharesimmediately
Add/Edit EMC Unity VSA file server optionsTable 17-5 Add/Edit EMC Unity cluster file server options
DescriptionField
Enter the host name or IP address EMC Unity Cluster Managementhost interface that is used to manage the nodes in the cluster.
ClusterManagement Host
Do the following:
1 Click Select Collector.
2 The Select Collector pop-up displays the configured Collectorsthat are available for selection.
3 Review the performance parameters such as disk and CPUutilization and backlog of files accumulating on the configurednodes. You can also view the number of devices, shares or sitecollections assigned to each configured node. It is recommendedthat you assign a node on which the resource utilization is low.
4 Click Select to assign the Collector to the filer.
Data Insight connects to the Unity Cluster Management host from thisserver. Veritas recommends that the Collector worker node share a fastnetwork with the cluster management host.
Collector
240Managing file serversAdding filers

Table 17-5 Add/Edit EMC Unity cluster file server options (continued)
DescriptionField
Do the following:
1 Click Select Indexer.
2 The Select Indexer pop-up displays the configured indexers thatare available for selection.
3 Review the performance parameters such as disk and CPUutilization and backlog of files accumulating on the configurednodes. It is recommended that you assign a node on which theresource utilization is low.
4 Click Select to assign the Indexer to the filer.
Events and metadata that are collected from the cluster are processedand stored on the Indexer node.
You can also migrate the file server to another Indexer.
Indexer
Data Insight uses the credentials that you specify to discover thefollowing:
■ The NAS servers in the cluster and the CIFS server underneatheach NAS server.
■ The CIFS shares for each of the CIFS servers.
To enable Data Insight to successfully discover shares, ensure thatHTTP port 80 is not blocked between Data Insight Collector and Unityfile server.
Specifying the filer administrator credentials is optional, if you chooseto not monitor events on the filer, nor enable share discovery.
See “Credentials required for configuring an EMC Unity VSA file server”on page 200.
ClusterManagementInterfacecredentials
241Managing file serversAdding filers

Table 17-5 Add/Edit EMC Unity cluster file server options (continued)
DescriptionField
Click to test the availability of network connection between the Collectorworker node and the filer, and to test the validity of specified credentials.
Veritas recommends that you test the connection before proceeding toensure that Data Insight is able to connect to the cluster managementhost.
By default, Data Insight does not test credentials for the followingHOMEDIR shares:
■ ~■ ~CIFS.HOMEDIR■ CIFS.HOMEDIR■ %w■ %d
Test credentials
Select this check box to enable monitoring of CIFS shares.Enable CIFSmonitoring
Select Automatically discover and monitor shares on this filer toallow Data Insight to automatically discover shares of the filer and addthem configuration.
Discovery of shares takes place as soon as you add a new filer andthen twice each day at 2:00 A.M. and 2:00 P.M.
You can also choose to add shares manually.
See “Adding shares” on page 258.
Monitoring details
Enter the details of shares which should not be included duringdiscovery.
This option is available if you selectAutomatically discover all shareson this filer. Specify comma-separated patterns that you want to ignore.Patterns can have 0 or more wildcard * characters. For example, tmp*ignores tmp_A, tmp_abc, *$ ignores shares C$, EXT$, and others.
Exclude sharesfrom discovery
Select to enable event monitoring on the filer.Enable file systemevent monitoring
Select the check box to enable filer scanning according to the specifiedschedule.
Enable filerscanning
Select this option to scan newly added shares immediately, instead ofwaiting for the normal scan schedule. Scanning proceeds only whenscanning is permitted on the Collector node.
Scan new sharesimmediately
242Managing file serversAdding filers

Table 17-5 Add/Edit EMC Unity cluster file server options (continued)
DescriptionField
See “Credentials required for configuring a clustered NetApp file server”on page 161.
Scannercredentials
Select one of the following to define a scanning schedule for shares ofthis filer:
■ Use Collector's default scanning schedule.■ Use custom schedule.
See “Custom schedule options” on page 254.
Veritas Data Insight periodically scans shares of the filer to obtain filemetadata and security descriptors. Each Collector worker node bydefault initiates a full scan of shares at 7:00 P.M. on the last Friday ofeach month.
Scanning schedulefor full scans
Add/Edit Windows File Server optionsUse this dialog box to add a new Windows File Server to Veritas Data Insight or toedit the configuration of an existing filer.
Table 17-6 Add/Edit Windows File Server options
DescriptionField
Select the check box if the Windows File Server is part of a MicrosoftCluster Server configuration.
Is a MSCSclustered fileserver
Enter the host name or IP address of the filer that you want Data Insightto monitor.
In case of a clustered Windows File Server, enter the host name or IPaddress of the cluster.
Note: The hostname or IP address should be same as the filer nameentered in Symantec Data Loss Prevention Discover targets.
Windows servername/Clustername
243Managing file serversAdding filers

Table 17-6 Add/Edit Windows File Server options (continued)
DescriptionField
Do the following:
1 Click Select Collector.
2 The Select Collector pop-up displays the configured Collectorsthat are available for selection.
3 Review the performance parameters such as disk and CPUutilization and backlog of files accumulating on the configurednodes. You can also view the number of devices, shares or sitecollections assigned to each configured node. It is recommendedthat you assign a node on which the resource utilization is low.
4 Click Select to assign the Collector to the filer.
Data Insight connects to the filer from this server. It is recommendedthat the Collector worker node share a fast network with the filer.
Select Collectornode for this filer
Do the following:
1 Click Select Indexer.
2 The Select Indexer pop-up displays the configured indexers thatare available for selection.
3 Review the performance parameters such as disk and CPUutilization and backlog of files accumulating on the configurednodes. It is recommended that you assign a node on which theresource utilization is low.
4 Click Select to assign the Indexer to the filer.
Events and metadata that are collected from the cluster are processedand stored on the Indexer node.
You can also migrate the file server to another Indexer.
Select Indexernode for this filer
Select one of the following monitoring options:
■ Monitor this filer using an agentIf you select this option, Data Insight is able to monitor all file systemevents on the filer and scan file system metadata.
■ Monitor this filer without an agentIf you select this option, Data Insight scans the filer using CIFS todiscover shares and obtain file metadata. However, in this case,Data Insight will not be able to monitor file system events.
Monitor mode
244Managing file serversAdding filers

Table 17-6 Add/Edit Windows File Server options (continued)
DescriptionField
This option is visible when adding a clustered file server that is monitoredusing an agent, but where the agent is installed manually.
Select one or more agent nodes from the list that belong to this cluster.
This option is also visible when editing a clustered file server.
Agent names forthis filer
Select to allow Data Insight to install or upgrade the agent on theWindows File Server.
Data Insight automatically installs the Windows File Server agent onthe filer using the WMI interface and also registers the filer with theManagement Server.
Let Data Insightinstall the agentautomatically
This option is only visible if you have selected Is a MSCS clusteredfile server.
In the text box, enter comma-separated IP addresses or hostnames ofthe Windows File Server nodes, on which you want to install the agent.
Node names toinstall agent
Enter the credentials that Data Insightshould use to install the agent onthe Windows File Server.
See “Credentials required for configuring Windows File Servers”on page 208.
Filer AdministratorCredentials
Click to test the availability of network connection between the Collectorworker node and the filer, and the validity of the specified credentials.
Veritas recommends that you test the connection before proceeding toensure that Data Insight is able to connect to the filer.
Test Connection
Use this option to have Data Insight automatically discover shares ofthe filer and add them configuration. You can choose to exclude certainshares using the Exclude shares field. Discovery of shares takes placeas soon as you add a new filer and then twice each day at 2:00 A.M.and 2:00 P.M.
Automaticallydiscover andmonitor all shareson this filer
Enter the details of shares which should not be included in sharediscovery.
This option is available if you selectAutomatically discover all shareson this filer. Specify comma separated patterns that you want to ignore.Patterns can have 0 or more wildcard * characters. For example, tmp*ignores shares tmp_A, tmp_abc, *$ ignores shares C$, EXT$ andothers.
Exclude followingshares fromdiscovery
245Managing file serversAdding filers

Table 17-6 Add/Edit Windows File Server options (continued)
DescriptionField
Select to enable Data Insight to collect storage utilization informationfrom the filer. This information is used to create Filer utilization and FilerGrowth Trend reports.
Note: The Filer utilization and Filer Growth Trend reports are availableonly for NetApp and Windows File Server.
Collect storageutilizationinformation for thefiler
Select to enable event monitoring on the filer.Enable file systemevent monitoring
Select the check box to enable filer scanning according to the specifiedschedule.
Enable filerscanning
Select one of the following to define a scanning schedule for shares ofthis filer:
■ Use the Collector's scanning schedule■ Define custom schedule
Veritas Data Insight periodically scans shares of the filer to obtain filemetadata and security descriptors. Each Collector worker node bydefault initiates a full scan of shares on the last Friday of each month.
Note: You can also customize the schedule per share using theAdd/Edit Share dialog box.
Scanning schedulefor full scans
Select one of the following:
■ Use LOCAL SERVICE credentialsSelect to use the LOCAL SERVICE account to scan shares of thefiler.This option is available only for the filers monitored using an agent.If you select this option, ensure that the LOCAL SYSTEM accounthas appropriate privileges to scan the shares. If the account doesnot have adequate privileges, the scans for such shares will fail ifperformed using this account.
■ Use saved credentialsSelect the saved credentials from the drop-down or specify newcredentials.
See “Credentials required for configuring Windows File Servers”on page 208.
Scannercredentials
246Managing file serversAdding filers

Table 17-6 Add/Edit Windows File Server options (continued)
DescriptionField
Select this option to scan newly added shares immediately, instead ofwaiting for the normal scan schedule.
Scanning will still take place during the hours when scanning is permittedon the Collector node.
Scan new sharesimmediately
Add/Edit Veritas File System server optionsUse this dialog box to add a new Veritas File System (VxFS) filer to Veritas DataInsight or to edit the configuration of an existing filer.
Table 17-7 Add/Edit Veritas File System (VxFS) filer options
DescriptionField
Select the check box if the Veritas File System server is part of a VeritasCluster Server (VCS) configuration.
This is a VCSclustered fileserver
Enter the logical name of the VCS cluster. This field is available only ifyou select the This is a VCS clustered file server check box.
VCS cluster name
Enter the comma-separated list of the host names or IP addresses ofthe physical nodes in the VCS cluster.
Cluster Node IPaddresses
Enter the hostname or IP address of the filer that you want Data Insightto monitor.
Note: The hostname or IP address should be the same as the filername entered in Symantec Data Loss Prevention Discover targets.
Filer hostname orIP address
247Managing file serversAdding filers

Table 17-7 Add/Edit Veritas File System (VxFS) filer options (continued)
DescriptionField
Do the following:
1 Click Select Collector.
2 The Select Collector pop-up displays the configured Collectorsthat are available for selection.
3 Review the performance parameters such as disk and CPUutilization and backlog of files accumulating on the configurednodes. You can also view the number of devices, shares or sitecollections assigned to each configured node. It is recommendedthat you assign a node on which the resource utilization is low.
4 Click Select to assign the Collector to the filer.
Data Insight connects to the filer from this server. It is recommendedthat the Collector worker node share a fast network with the filer.
Note: Ensure that the Collector node monitoring the NFS must haveservices for NFS enabled as file server roles. You can install the roleon a supported version of Windows through Server Manager > Addroles option.
Collector
Do the following:
1 Click Select Indexer.
2 The Select Indexer pop-up displays the configured indexers thatare available for selection.
3 Review the performance parameters such as disk and CPUutilization and backlog of files accumulating on the configurednodes. It is recommended that you assign a node on which theresource utilization is low.
4 Click Select to assign the Indexer to the filer.
Events and meta-data collected from the filer is processed and storedon the Indexer node.
You can also migrate the file server to another Indexer.
Indexer
See “Credentials required for configuring Veritas File System (VxFS)servers” on page 214.
Specifying filer administrator credentials is optional, if you choose notto monitor events on the filer, nor enable share discovery.
Login credentials
248Managing file serversAdding filers

Table 17-7 Add/Edit Veritas File System (VxFS) filer options (continued)
DescriptionField
Click to test the availability of network connection between the Collectorworker node and the filer, and to test the validity of the specifiedcredentials.
Veritas recommends that you test the connection before proceeding toensure that Data Insight is able to connect to the filer.
Test credentials
Select Automatically discover and monitor shares on this filer tohave Data Insight automatically discover shares of the filer and addthem to the configuration.
Discovery of shares takes place as soon as you add a new filer andthen twice each day at 2:00 A.M. and 2:00 P.M.
You can also choose to add shares manually.
See “Adding shares” on page 258.
Monitoring details
Enter the details of shares which should not be included duringdiscovery.
This option is available if you selectAutomatically discover all shareson this filer. Specify comma separated patterns that you want to ignore.Patterns can have 0 or more wildcard * characters. For example, tmp*ignores tmp_A, tmp_abc, *$ ignores shares C$, EXT$ and others.
Exclude sharesfrom discovery
Select to enable file system monitoring on the filer.
Enter the following details:
■ Select the Enable file system event monitoring check box toenable event monitoring on the VxFS filer.
■ Time to live - The value indicates the time for which the VxFS pluginwill try to communicate with Data Insight. If communication fails afterthe specified time, the plugin will terminate and stop capturing eventsfrom the VxFS filer. The default TTL value is 24 hours.
■ Records per file - The number of records after which the events areflushed to the Collector node. You can also enable an advancedsetting to flush the records to the Collector node every 10 minutes,irrespective of the number of records specified. By default, the limitis set to 100000 records per file.See “Configuring advanced settings” on page 88.
■ Domain: The name of the LDAP or NIS domain that the filer is a partof. The VxFS filer that you want to add should not be part of twodomains at the same time.
Audit details
249Managing file serversAdding filers

Table 17-7 Add/Edit Veritas File System (VxFS) filer options (continued)
DescriptionField
Select the checkbox to enable filer scanning according to the specifiedschedule.
Enable filerscanning
Select one of the following to define a scanning schedule for shares ofthis filer:
■ Use the Collector's scanning schedule■ Define custom schedule
Veritas Data Insight periodically scans shares of the filer to obtain filemetadata and security descriptors. Each Collector worker node bydefault initiates a full scan of shares at 7:00 P.M. on the last Friday ofeach month.
Note: You can customize the schedule per share using the Add/EditShare dialog box.
Scanning schedulefor full scans
See “Credentials required for configuring Veritas File System (VxFS)servers” on page 214.
Scannercredentials
Select this option to scan newly added shares immediately, instead ofwaiting for the normal scan schedule.
Scan newly addedsharesimmediately
See “Enabling export of UNIX/Linux NFS shares on VxFS filers” on page 216.
Add/Edit a generic storage device optionsUse this dialog box to add a new generic storage device to Veritas Data Insight orto edit the configuration of an existing device.
Table 17-8 Add/Edit generic device options
DescriptionField
Enter the hostname or IP address of the device that you want DataInsight to monitor.
Filer hostname orIP address
250Managing file serversAdding filers

Table 17-8 Add/Edit generic device options (continued)
DescriptionField
Do the following:
1 Click Select Collector.
2 The Select Collector pop-up displays the configured Collectorsthat are available for selection.
3 Review the performance parameters such as disk and CPUutilization and backlog of files accumulating on the configurednodes. You can also view the number of devices, shares or sitecollections assigned to each configured node. It is recommendedthat you assign a node on which the resource utilization is low.
4 Click Select to assign the Collector to the filer.
Data Insight connects to the filer from this server. It is recommendedthat the Collector worker node share a fast network with the filer.
Note: When monitoring NFS shares, ensure that the Collector nodemonitoring the filer must have services for NFS enabled as file serverroles. You can install the role on a supported version of Windowsthrough the Server Manager > Add roles option.
Collector
Do the following:
1 Click Select Indexer.
2 The Select Indexer pop-up displays the configured indexers thatare available for selection.
3 Review the performance parameters such as disk and CPUutilization and backlog of files accumulating on the configurednodes. It is recommended that you assign a node on which theresource utilization is low.
4 Click Select to assign the Indexer to the filer.
Events and metadata that are collected from the cluster are processedand stored on the Indexer node.
You can also migrate the file server to another Indexer.
Indexer
From the drop-down, select the domain to which the device belongs.
This option is enabled when monitoring NFS shares.
Domain
Select the check box to enable filer scanning according to the specifiedschedule.
Enable filerscanning
251Managing file serversAdding filers

Table 17-8 Add/Edit generic device options (continued)
DescriptionField
Select one of the following to define a scanning schedule for shares ofthis filer:
■ Use Collector's default scanning schedule.■ Use custom schedule.
See “Custom schedule options” on page 254.
Veritas Data Insight periodically scans shares of the filer to obtain filemetadata and security descriptors. Each Collector worker node bydefault initiates a full scan of shares at 7:00 P.M. on the last Friday ofeach month.
Scanning schedulefor full scans
Do the following:
1 Click to test whether the selected credentials have the requiredpemission to scan shares on the device.
2 Enter the name of a share on the device, and click OK.
Test credentials
See “Credentials required for scanning a generic device” on page 219.Scannercredentials
Select this option to scan newly added shares immediately, instead ofwaiting for the normal scan schedule. Scanning proceeds only whenscanning is permitted on the Collector node.
Scan new sharesimmediately
Add/Edit Hitachi NAS file server optionsUse this dialog box to add a new Hitachi NAS file server to Veritas Data Insight orto edit the configuration of an existing file server.
Table 17-9 Add/Edit New Hitachi NAS file server
DescriptionField
Enter the host name or IP address of the HNAS file system EVS thatyou want Data Insight to monitor.
Hitachi EVSHostname/IP
252Managing file serversAdding filers

Table 17-9 Add/Edit New Hitachi NAS file server (continued)
DescriptionField
Do the following:
1 Click Select Collector.
2 The Select Collector pop-up displays the configured Collectorsthat are available for selection.
3 Review the performance parameters such as disk and CPUutilization and backlog of files accumulating on the configurednodes. It is recommended that you assign a node on which theresource utilization is low.
4 Click Select to assign the Collector to the filer.
Veritas recommends that the Collector worker node share a fast networkwith the filer.
Collector
Do the following:
1 Click Select Indexer.
2 The Select Indexer pop-up displays the configured indexers thatare available for selection.
3 Review the performance parameters such as disk and CPUutilization and backlog of files accumulating on the configurednodes. You can also view the number of devices, shares or sitecollections assigned to each configured node. It is recommendedthat you assign a node on which the resource utilization is low.
4 Click Select to assign the Indexer to the filer.
Events and metadata collected from the filer is processed and storedon the Indexer node.
You can also migrate the file server to another Indexer.
See “About migrating storage devices across Indexers” on page 112.
Indexer
Data Insight uses the credentials that you specify to discover the CIFSshares for each of the CIFS servers.
See “Credentials required for configuring a Hitachi NAS EVS”on page 203.
Hitachi EVSCredentials
Click to test the availability of network connection between the Collectorworker node and the Hitachi NAS file server.
Test Credentials
253Managing file serversAdding filers

Table 17-9 Add/Edit New Hitachi NAS file server (continued)
DescriptionField
Select Automatically discover and monitor shares on this filer toallow Data Insight to automatically discover shares of the filer and addthem to the configuration.
Discovery of shares takes place as soon as you add a new filer andthen twice each day at 2:00 A.M. and 2:00 P.M.
You can also choose to add shares manually.
See “Managing shares” on page 260.
Monitoring Details
Select to enable event monitoring on the filer.Enable file systemevent monitoring
Select the check box to enable filer scanning according to the specifiedschedule.
Enable FilerScanning
Select one of the following to define a scanning schedule for shares ofthis filer:
■ Use the Collector's default scanning schedule■ Use custom schedule
From the drop-down, select the appropriate frequency option.
ScanningSchedule(FullScan)
Select this option to scan newly added shares immediately, instead ofwaiting for the normal scan schedule. Note that a scan can run onlywhen scanning is permitted on the Collector node.
Scan newly addedsharesimmediately
Custom schedule optionsTable 17-10 describes the options that you can use to define the frequency of thescans.
Table 17-10 Custom schedule options
DescriptionOption
Runs the scan as and when required.Never
Runs the scan once at the specified time and date.Once
Runs the scan once every day. You must specify the time when the scanshould be run.
Daily
254Managing file serversCustom schedule options

Table 17-10 Custom schedule options (continued)
DescriptionOption
Runs the scan once every week. You can choose to run it on every weekday,or on specific weekdays. Also, you must specify the time when the scanshould be run.
Weekly
Runs the scan on the specified days of a month. You must specify the daysof the month and the time when the scan should be run. Separate multipledays with a comma. For example, 2,5.
Monthly
Runs the scan according to a defined cron schedule. You can build stringsin the cron format to specify custom schedules such as every Friday atnoon, or weekdays at 10:30 a.m., or every 5 minutes between 9:00 a.mand 10 a.m. on Wednesdays and Fridays.
More information about defining a cron schedule, seehttp://quartz-scheduler.org/api/2.1.7.
Custom Cron
Editing filer configurationAfter you add a filer to Data Insight, you can edit the filer's configuration. Forexample, you might need to edit any of the following:
■ The IP address or hostname of the filer.
■ The username and password of the user authorized to log in to the filer.
■ The IP address or hostname of the Collector worker node configured to scanthe filer.
■ The Indexer node associated with the filer.
■ The scanning schedule.
■ The scanner credentials.
■ Whether all shares are to be monitored.
■ Whether new shares are to be scanned immediately.
Note: Data Insight disables addition of filers if you do not have a valid license or ifyour license has expired. You can edit the configuration of the filers that havealready been added to Data Insight. However, Data Insight will not discover sharesthat have been added on the file server after the expiry of the license. See “Overviewof Data Insight licensing” on page 24.
255Managing file serversEditing filer configuration

To edit filer configuration
1 In the Console, click Settings > Filers.
This displays the list of available filers.
2 Do one of the following:
■ In the filer summary table click the Select Action drop-down and selectEdit.
■ Click the filer whose configuration you want to edit. On the Filer detailsscreen, click Edit.
3 On the Edit Filer page, make the necessary configuration changes.
Note: The Name field is editable only for the filer types for which Data Insightsupports renaming.
4 Click Save to save the changes.
See “Considerations for renaming a storage device” on page 270.
Migrating the filer to another indexerBefore you migrate a filer from one indexer to another, ensure the following:
■ There is network connectivity between the old and the new Indexer.
■ There is ample storage space on the new Indexer.
■ Port 8383 is open between the indexers to allow the Communication Service tocommunicate between them.
To migrate a file server from one Indexer to another:
1 In the Data Insight Management Console, click Settings > Filers. This displaysthe list of available filers.
2 From the Select Action drop-down menu, select Edit.
The Edit Filer screen is displayed. The Connection Details section displaysthe Collector and the Indexer nodes associated with the file server.
3 Click Change Indexer.
The Select Indexer window opens displaying a list of available Indexers.
4 Select a destination Indexer.
256Managing file serversEditing filer configuration

5 Click OK to confirm the changes. The Select Indexer window closes.
The migration of Indexer takes place in the background. The time taken tocomplete a migration operation is proportional to the amount of data containedby the source Indexer.
6 To view the status of migration to another Indexer, navigate to the Filers listpage.
7 Click the Select Action drop-down corresponding to the filer being migrated,and select View Migration Status.
8 On the Migration Status panel, you can view the status of each share on thefiler that is being migrated. The status can either be Success or Pending.
9 You can cancel an ongoing migration by clicking the Cancel Migration buttonavailable in the Migration Status panel.
Canceling a migration reverses all the changes affected by the migrationoperation. You can cancel only the ongoing migrations. You cannot cancel amigration operation whose status is displayed as Success.
See “About migrating storage devices across Indexers” on page 112.
Deleting filersYou can delete a configured filer.
To delete a filer
1 In the Console, click Settings > Filers to display the configured filers.
2 Do one of the following:
■ In the filer summary table, click the Select Action drop-down, and selectDelete.
■ Click the filer you want to delete, and on the filer details page, click Delete.
3 Click OK on the confirmation message.
Viewing performance statistics for file serversYou can view the performance graphs for the configured filers.
To view file server statistics
1 Click Settings > Filers.
2 Select the filer for which you want to view the performance statistics.
257Managing file serversDeleting filers

3 On the filer details page, click the Statistics sub-tab.
4 From the Period drop-down, select the duration for which you want to viewthe data.
5 The Statistics sub-tab displays the following high-level data:
■ The time (in milliseconds) required to perform one CIFS I/O operation fora filer. The graph displays both average and maximum latency statistics.
■ The average and maximum rate of incoming events per second for a filer.
■ The count of all files and folders across all shares for a filer. The graphdisplays the number of paths that are scanned across all shares on a filer
Note: For EMC Celerra, VxFS, and Windows File Servers, you can only view thecount of files and folders across all the shares on the filer.
About disabled sharesData Insight automatically discovers new shares on file servers and adds them toData Insight configuration, if automatic discovery of shares is enabled for the fileserver. Share discovery takes place when a new filer is added to Data Insight orwhen the scheduled share discovery process runs on the filer.
During the process of share discovery, Data Insight also discovers shares that havebeen deleted from the filer but are still present in the Data Insight configuration.Such shares are marked as disabled and Data Insight stops scanning these shares.
Adding sharesAll shares on a filer are added to the Data Insight configuration when you add thefiler to Data Insight. You must add shares present on the filer manually if you donot select the Discover shares automatically option when adding a filer. You caneither add multiple shares at once using a CSV file or select individual shares ona filer that you want to add to the Data Insight configuration.
Note: Data Insight disables addition of shares if you do not have a valid license orif your license has expired. Also, Data Insight will not discover shares that havebeen added on configured file servers after the expiry of the license.
258Managing file serversAbout disabled shares

To add a share
1 In the Console, click Settings > Filers .
2 To add shares from a filer, do one of the following:
■ On the Filer list page, select the filer from which you want to add shares.Click Add Shares in Bulk. On the pop-up, browse to the location of theCSV file and select it. Click Upload.If you are adding shares in bulk for the first time, you must create a CSVfile in a specific format. Download a sample CSV file to view the format.
■ Click a configured filer. On the Details page, click Monitored Shares.
3 On the Monitored Shares list page, click Add New Share or Add Shares inBulk.
4 On the Add Share pop-up, enter the share properties, and click Save.
See “Add New Share/Edit Share options ” on page 259.
Add New Share/Edit Share optionsUse this dialog box to add a new share to Veritas Data Insight or to edit theconfiguration of an existing share.
Table 17-11 Field Descriptions
DescriptionsField
Enter the name of the share you want to add. For example, share1.
If this share belongs to a clustered filer, enter share name asfileserver@share, where, fileserver is the name of the file server withinthe cluster that hosts the share.
Share name
Enter the physical path of the share on the filer. For example,F:\<Share name>.
Physical path onfiler
Select one of the following to define a scanning schedule:
■ Use filer's scanning schedule■ Define custom schedule
From the drop-down, select the appropriate frequency option.
Scanning schedule
Select to preserve the activity information on the share. Selecting thisoption disables the deletion or archiving of access event information onthe share.
See “About archiving data” on page 42.
See “About purging data” on page 43.
Enable legal holdfor this share
259Managing file serversAdding shares

Table 17-11 Field Descriptions (continued)
DescriptionsField
■ Select the Enable parallel scanning within this share check box.■ From the Parallel Thread Count drop-down, select the number of
scan threads that you want Data Insight to run. It is recommendedthat you consider the number of processors while selecting thevalues.Based on your selection, Data Insight runs the scan threads:■ Automatic: Data Insight computes the number of parallel scanner
threads based on the number of processors and the amount ofworkload.
■ 1 or a higher value: Data Insight runs the specified number ofscanner threads.
See “Considerations for running a parallel scan” on page 36.
Parallel Scanning
Managing sharesOn the Monitored Shares details page you can view the detailed information aboutconfigured shares and run a customized scan on the configured shares.
Use the provided dynamic search filter to search for configured shares based onthe name of the share.
To view configured shares
1 In the Console, click Settings > Filers.
2 Click the filer on which the share resides.
3 On the Filer Detail screen, click Monitored Shares.
Review the following information about the shares:
■ ID of the share. The ID is required during troubleshooting. This column ishidden by default.
■ The name of the share.If this share belongs to a clustered filer, then the name should appear asfileserver@share, where, fileserver is the name of the file server within thecluster that hosts the share.
■ Type of this share, CIFS or NFS.
■ Enabled status of this share. This column is hidden by default.
■ Legal hold status for this share. This column is hidden by default.
260Managing file serversManaging shares

■ The number of parallel scan threads running on the share. This column ishidden by default.
■ The scanning schedule for the share. This column is hidden by default.
■ The date and time of the last full scan of the share.
■ The date and time of the last incremental scan.Incremental scans are scans of the file system that includes only thosepaths that have changed since the last full scan. Incremental scans aremuch faster than full scans and they take place once every night at 7:00P.M. You can configure incremental scans on the Settings > Data InsightServers > Advanced Settings page.
■ The time this share's index was last updated with scan information.After every scan, the index is updated with information about the changesto the folder hierarchy on a share. This indicates whether the last updatewas successful or failed. It also indicates the number of scan files pendingfor this share on the Indexer and the number of files that failed to be indexed.Such files are present in the $data/indexer/err folder on the Indexer. Ifthere are failed files on the Indexer, you can move them from the err folderto $data/inbox folder and attempt a full scan of the share. If the informationfails to be indexed again, contact Veritas Support.
■ The time this share's index was last updated with access event information.As new access events come in, the index for the share is periodicallyupdated with information about the new access events. This indicateswhether the last update was successful or had failed. It also indicates thenumber of audit files pending for this share on the Indexer and the numberof files that failed to be indexed. Such files are present in the$data/indexer/err folder on the Indexer. If there are failed files on theIndexer, you can move them to the $data/inbox folder on the Indexer. Ifthey fail to be indexed again, contact Veritas Support.
■ The status of event monitoring for the share, whether enabled or disabled.
■ Whether a legal hold is being enforced for the share. You can choose toprevent access information for a share from being archived or deleted byputting a legal hold on the share. Data Insight preserves the access eventsinformation for such shares indefinitely.See “Add New Share/Edit Share options ” on page 259.
4 Click the Export icon at the bottom of the page to save the data on the MonitoredShares panel to a .csv file.
261Managing file serversManaging shares

You can also add a new share, edit the share's configuration, delete the share, startan unscheduled scan for a share, view the scan status, and download Data Insightlogs from this page.
To view the scan status of a share
1 In the Console, click Settings > Filers.
2 Click the filer on which the share resides.
3 On the Filer Detail screen, click Monitored Shares.
4 Click the consolidated status icon to view the summary of the scan or the scanhistory of the share.
Or select Select Action drop-down for the corresponding share, and selectScan Status.
The consolidated status of the scans on the share appears. Click the ScanHistory tab on the pop-up to view the following details
■ The start and end time of the scan.
■ The time taken for the scan.
■ The type of scan, whether full or incremental.
■ The Collector node associated with the share.
■ The details of the scan. For example, if a scan has failed, theDetails columnindicates the exit code for the error message.
■ The user account that initiated the scan.
You can also view the scan status for a share from the Scan History sub-tab ofthe Scanning dashboard.
To view events pertaining to a share
1 In the Console, click Settings > Filers.
2 Click the filer on which the share resides.
3 On the filer details screen, click Monitored Shares.
262Managing file serversManaging shares

4 Click the Action drop-down for the corresponding share, and select EventLog.
The event log for that share appears.
5 To download the Data Insight logs for the share, click the Select Actiondrop-down for the corresponding share, and select Download Log.
Data Insight downloads a compressed folder containing logs for this share fromall relevant Data Insight servers.
See “Downloading Data Insight logs” on page 455.
To scan one or more shares in a batch
1 On theMonitored Shares tab, select a share, and select Scan from the SelectAction drop down corresponding to a share.
Note: The Scan option is not available for shares that have been disabled.
2 To scan multiple share, select one or more shares using the check boxes.
3 Click Scan, and select Scan Selected Records.
Optionally, filter shares as needed using the filters available on the page. ClickScan, and select Scan Filtered Records.
Note: You can use a command line utility, scancli.exe, to further customize thescan, view the scan jobs running on a specified node, or display the scan statusfor specified shares. See scancli.exe on page 434. You can also use the Scanningdashboard view to scan shares and site collections based on more granular criteria.
To enable or disable shares
1 In the Management Console, click Settings > Filers.
2 Click the filer on which the share resides.
3 On the filer detail screen, click Monitored Shares.
4 To enable or disable a share, do one of the following:
■ Select the share(s) and click Enable Shares or Disable Shares, as thecase may be. You can select multiple shares and enable or disable themat once.
■ Or, click theAction drop-down corresponding to a share, and select Enableor Disable, as the case may be.
263Managing file serversManaging shares

Editing share configurationAfter you add a share to Data Insight, you can edit the share's configuration. Forexample, you might need to edit the scanning schedule.
To edit share configuration
1 In the Console, click Settings > Filers to expand the Filer node.
This displays the list of available filers. Click the appropriate filer to open theFiler details page.
2 Select the share whose configuration you want to edit, click the Select Actiondrop-down and select Edit.
3 On the Edit Share screen, make the necessary configuration changes.
4 Click Save.
Deleting sharesYou can delete a configured share.
To delete a share
1 In the Console, click Settings > Filers to display the configured filers.
2 Click the filer, on which the share that you want to delete exists.
3 On the filer details page, under Monitored Shares, select the share that youwant to delete.
4 Click the Select Action drop-down and select Delete.
5 Click OK on the confirmation message.
About configuring a DFS targetVeritas Data Insight supports Microsoft Distributed File System (DFS) targets.
DFS allows you to group shared folders located on different servers by transparentlyconnecting them to one or more DFS namespaces. A DFS namespace is a virtualview of shared folders in an organization. DFS simplifies access to and managementof shares by mapping a single logical namespace to shared folders on multiplefilers. You can create folders within a DFS to create an additional level of hierarchy.For example, if you have a NetApp filer, NETAPP01, which has a shared foldercalled NetAppShare1. You can link a target, HQ\Sales\Test, present on a DFSserver, DFSSvr01, to the subfolder named Finance within NetAppShare1.
264Managing file serversEditing share configuration

You must first import the DFS mappings to physical shares in to Data Insight beforeyou can view data using DFS hierarchy.
You can either map a filer using the hostname or IP address that is used to configureit in Data Insight, or use a list of aliases for the filer to map it. To use filer aliasesto map filers to DFS targets, you must add a filer-level object attribute with acomma-separated list of aliases for configured filers and DFS filers.
See “Adding a configuration attribute for devices” on page 265.
When Data Insight consumes the CSV file containing the DFS mappings, it checksthe object attribute to ensure that the filer is not being referred to in the Data Insightconfiguration by another alias. Similarly, Data Insight checks the DFS filer namesin DFS filer alias list. If an alias is found for a DFS filer, then it means that the DFSfiler is already configured in Data Insight and it is not added again to the Data Insightconfiguration.
Adding a configuration attribute for devicesTo enable Data Insight to map physical and DFS filers to DFS targets, you mustadd a filer-level configuration attribute that lists the aliases used for the filers in theData Insight configuration. When importing the DFS mappings, Data Insight checksthe filer aliases in addition to the host name or IP address used to configure thefiler. This feature ensures that DFS mapping is successful even if an alias is beingused for a filer in the Data Insight configuration.
To add a configuration attribute from the Console
1 Click Settings > Filers.
2 On the Filers list page, click the Select Action drop-down for the physical orDFS filer for which you want to add the configuration attribute.
3 Select Add Config Attribute.
4 On the Add Advanced Filer Attributes pop-up, enter the following:
■ A logical name for the attribute. For example, filer.alias
■ A comma-separated list of aliases for the filer. For example,FilerAlias1,Filer_Alias_2,Filer.Alias.3Ensure that there is no space before and after comma in the alias list.
Configuring a DFS targetBefore you can configure a DFS target you must configure all file servers whichmap to your DFS targets.
265Managing file serversAdding a configuration attribute for devices

To set up a DFS target
1 Log in to the Management Console.
2 Create a .csv file containing the following information:
■ The name of the DFS server.
■ The DFS target.
■ The name of the filer that contains the share that you want to map to theDFS target.
■ The share on the filer.
■ Path under the physical share, if the DFS folder is mapped to a folder underphysical share, else this value can be blank.
For example, DFSSvr01,HQ\Sales\Test,NETAPP01,NetAppShare1,\Finance.
3 Click the Settings tab.
4 Click Filers, and select Import DFS Mappings.
5 In the Add new DFS mappings dialog, browse to the location of the .csv file,and click Upload.
6 Alternatively, open a Windows command prompt, and change to theinstalldir\bin directory, where installdir\bin is the installation path forVeritas Data Insight.
7 Type the following command:
configdb -H <name of the .csv file>
If certain DFS filer entries are dropped, you must ensure that:
■ The device is configured or an alias for the device has been added to the DataInsight configuration.
■ If you are adding a standalone DFS server to Data Insight the server cannotalready be part of Data Insight as a filer itself, in this case the DFS Server namecan be replaced by a label representing the DFS namespace.
■ The servers in the CSV file match the filer name configured in Data Insight.
You can download the CSV file containing the dropped DFS shares, modify theDFS mappings file, and import the DFS mappings again.
266Managing file serversConfiguring a DFS target

About the DFS utilityThe DFS utility, mxdfsscan.exe, maps root level DFS paths to actual storage serveror share paths. It is used to export the DFS components (roots, root targets, links,and link targets) for all Windows DFS namespaces. The utility finds out physicallevel storage/filer link for all Domain DFS paths. It takes DFS root UNC path asinput, for example\\<DFS domain>\root. This utility only enumerates online linksand skips all offline links. It generates the output in .csv format.
The mxdfsscan.exe is a command line utility.
mxdfsscan.exe creates a DFS mapping CSV file with details of DFS servers thatmust be mapped in the Data Insight configuration. mxdfsscan.exe lets you specifyonly a single namespace at a time. You can run the utility twice to get informationfrom two different DFS namespaces and create two different files from the output,for example, test1.csv and test2.csv. You can then import settings fromtest1.csv and test2.csv from the Data Insight Management Console
When you import a new DFS mapping file to Data Insight, the old mappings aremaintained in Data Insight. For example, if you import mappings from test1.csv
and then from test2.csv, the mappings from both files are displayed in Data Insight.However, if there are some duplicate mappings (the same DFS link appears twice– whether mapped to the same physical path or a different path), these mappingsare not imported. A message is displayed indicating that there are duplicatemappings and hence one or more mappings cannot be imported.
Running the DFS utilityEnsure that the DFS servers are accessible from the machine you use to run theDFS utility.
267Managing file serversAbout the DFS utility

To run the DFS utility
1 From the Windows Start menu, select Run and type cmd in the dialog box toopen a command prompt window.
2 Change to the installdir\bin directory, where installdir\bin is theinstallation path for Veritas Data Insight.
3 Type the following command:
mxdfsscan -n \\<DFS domain>\root -f dfsmap.csv
where,
-n is the name of the DFS root
-f is the file name to which the DFS mappings have to be exported.
-e is the option to exclude domain DFS paths. For example,
mxdfsscan.exe -n \\MSAD\newroot -f dfsmap.csv -e exclude.txt
An exclude list can have max 128 exclude entries. For example,
\\DFS\root\AP\NUY
\\DFS\root\users
-c is the option to traverse a specified number of intermediate DFS servers tofind a physical storage path. If the -c option is not specified then the utility takesthe default value 5. This option helps avoid circular links in a DFS environment.If there are more hops then it logs all such links into dfs_log_links.txt.
Importing DFS mappingYou can import DFS mappings to Data Insight from the Management Console. Toimport DFS mappings, complete the following steps.
To import DFS mappings
1 Create a .csv file that contains information about the DFS mappings.
See “Running the DFS utility” on page 267.
2 In the Console, click Settings > Filers to display the list of available filers.
3 Click Import DFS mappings.
4 On the Import DFS mappings window, browse to the location of the .csv filethat contains information about the mapped DFS namespaces.
5 Click OK.
268Managing file serversImporting DFS mapping

Renaming storage devicesThis chapter includes the following topics:
■ About renaming a storage device
■ Viewing the device rename status
■ Considerations for renaming a storage device
About renaming a storage deviceData Insight provides an option to conveniently change the name of a data sourcessuch as a filer, SharePoint Online accounts, or a SharePoint web application fromthe Management Console without interfering with the underlying configurations.
Users with the role Server Administrator or Product Administrator with theadministrative rights to the data sources have the permission to rename a device.For other users, the device name field is not editable. Before renaming a device, itis recommended that you complete the ongoing migration, scan, or reports, andworkflow processes configured for the device to be renamed. This ensures that therename operation is completed without any disruption.
Once the device is renamed, the new or changed device name is automaticallyupdated in the related databases, event logs, scan status, policy details, alerts, andreports. If the device is part of an Exclude Rule list, then the device name in the listis updated with the new name.
You can rename the configured data sources from the Edit page for the device.
Note: The ability to rename a device is not available for Documentum and clouddata sources.
See “Editing filer configuration” on page 255.
18Chapter

See “Editing web applications” on page 281.
Viewing the device rename statusWhen a device is renamed, Data Insight logs the status of the rename operation inthe Data Insight event log and the webserver log file.
To access the event log, on the Console > Settings > Inventory > SharePointWeb Application, Filers, or equivalent data source > Select Action > Event Log.
You can filter the logs related to renaming operation, by setting the Severity toConfig.
See “Location of Data Insight logs” on page 453. for information about thewebserver.log file.
Considerations for renaming a storage deviceThe following considerations apply when renaming a storage device in the Console.
■ The rename operation is supported for generic devices, EMC Celerra, NetApp7-Mode, single node Veritas File System Server, Hitachi NAS, SharePoint datasources, cloud sources, and EMC sources.
■ The rename operation is not supported on Box, EMC Isilon, Windows File Server,NetApp Cluster-Mode, and clustered Veritas File System Server.
■ Once a device is renamed, the device references in the following areautomatically updated:
■ Reports
■ Audit logs
■ Event log and event notification
■ Scan history and scan status
■ Policies
■ Alerts
■ Exclude rule list
■ Dashboard
■ Data Insight configurations
■ Enterprise Vault filer mapping configurations
270Renaming storage devicesViewing the device rename status

■ Certain special characters are supported while renaming SharePoint webapplications. These consist of:
SymbolSpecial character
( )Round brackets
@At sign
/Slash
:Colon
-Hyphen
_Dash
■ Certain special characters are not supported while renaming a storage device.These consist of:
SymbolSpecial character
|Pipe
'Apostrophe
" "Double quotes
^Caret
< >Angular brackets
,Comma
{ }Curly brackets
[ ]Square brackets
271Renaming storage devicesConsiderations for renaming a storage device

Configuring SharePoint datasources
■ Chapter 19. Configuring monitoring of SharePoint web applications
■ Chapter 20. Configuring monitoring of SharePoint Online accounts
4Section

Configuring monitoring ofSharePoint webapplications
This chapter includes the following topics:
■ About SharePoint server monitoring
■ Credentials required for configuring SharePoint servers
■ Configuring a web application policy
■ About the Data Insight web service for SharePoint
■ Adding web applications
■ Editing web applications
■ Deleting web applications
■ Adding site collections
■ Managing site collections
■ Removing a configured web application
About SharePoint server monitoringYou can use Data Insight to monitor unstructured data residing on servers runningany of the following:
■ Microsoft SharePoint™ 2016
19Chapter

■ Microsoft SharePoint™ 2013
■ Microsoft SharePoint™ 2010
Data Insight monitors accesses to the data in the following SharePoint library types:
■ Document library - Stores documents in the .pdf, .doc, .xls, .txt and other suchfile extensions.
■ Picture library - Stores images.
Before you use Data Insight to scan a SharePoint server, you must complete thefollowing tasks:
■ Ensure that you know the URLs of the target SharePoint web applications.
■ Ensure that .NET Framework 4.5 is installed on the Collector node that isresponsible for the discovering site collections and collecting audit logs.
■ Configure a policy for each web application.See “Configuring a web application policy” on page 275.
■ Install and configure the Data Insight web service on the SharePoint server.
■ Enable auditing on the SharePoint server. You can enable auditing from theManagement Console when you add web applications, or directly from theSharePoint server.See “ Add/Edit web application options” on page 278.
Credentials required for configuring SharePointservers
Table 19-1 Credentials required for configuring SharePoint servers
DetailsCredential
This credential belongs to a user in theAdministrators group on the SharePointserver.
Credentials required to install the Data Insightweb service on the SharePoint Server.
274Configuring monitoring of SharePoint web applicationsCredentials required for configuring SharePoint servers

Table 19-1 Credentials required for configuring SharePoint servers(continued)
DetailsCredential
This credential belongs to a site collectionadministrator for the configured sites and itmust be in the same domain as theSharePoint server. It must have full controlpermissions not only on the configured webapplications, but also on the web applicationsthat are added to SharePoint subsequently.See “Configuring a web application policy”on page 275. for details on adding such a usercredential.
Credentials required to discover webapplications or site collections, and to collectscan information and audit data
Configuring a web application policyWhen configuring SharePoint from the Data Insight console, you must specify anaccount for monitoring the configured site collections. This account must be a sitecollection administrator for the configured sites and it must be in the same domainas the SharePoint server. It must have full control permissions not only on theconfigured web applications, but also on the web applications that are added toSharePoint subsequently. The account should have the necessary privileges to setthe appropriate audit flags, gather metadata about site collection content, and gatheraudit data from SQL Server databases for SharePoint
To enable Data Insight to gather audit and metadata from multiple site collectionsusing a single user account, you must configure a policy for each web applicationfrom the SharePoint Central Administration Console.
To configure a policy for web application in SharePoint 2010, SharePoint 2013,and SharePoint 2016
1 In the Central Administration Console, click Application Management.
2 Under the web applications section, click Manage Web Applications.
3 In the table displaying web application details, select the appropriate webapplication.
4 Click User Policy.
5 In the Policy for web application popup, click Add Users.
6 Select the appropriate zone. You can select (All Zones) if you want the userto be given permissions on all zones for the web application.
7 Click Next.
275Configuring monitoring of SharePoint web applicationsConfiguring a web application policy

8 Choose the user account that will have Full Control.
In the Choose Permissions section, select Full Control - Has full control
9 Specify whether this account operates as SharePoint System account. If youselect the Account operates as System check box, all accesses made bythis user account are recorded with the user name, SharePoint System.
10 Click Finish.
About the Data Insight web service for SharePointBefore you can configure SharePoint monitoring in Data Insight, you must installthe Data Insight web service on the SharePoint server. The Data Insight web serviceperforms the following functions:
■ Enables or disables auditing on the SharePoint server.You can enable or disable auditing of access events at the site collection level,either manually or from the Data Insight Management Console when addingweb applications.
■ Discovers site collections within a web application.
■ Discovers all web sites and lists or libraries within a site collection
■ Retrieves access event data from the SharePoint server. Data Insight uses thisdata to service queries on user activity and data access.
■ Deletes audit logs from a site collection.
Installing the Data Insight web service for SharePointTo enable Data Insight to collect access events, you must install the Data Insightweb service, on a SharePoint server. When installing in a SharePoint farm, youmust ensure that the web service is configured on all front-end web servers in thefarm. Perform the following steps on any one front-end web server in your SharePointfarm. The web service installer automatically deploys the web service to all front-endweb servers in the farm.
To install the Data Insight web service
1 Log on to the SharePoint server with an account that has SharePointadministrator privileges.
2 Load the Data Insight media on your SharePoint server.
3 Navigate to the folder where you have extracted or copied the installers.
276Configuring monitoring of SharePoint web applicationsAbout the Data Insight web service for SharePoint

4 To start the installation, double-clickVeritas_DataInsight_sharepoint_6.1.4_N.exe, where, N is the buildnumber.
5 Work through the installation wizard.
6 Click Finish to complete the installation process.
7 Verify whether the web service is deployed as expected.
After installing the Data Insight web service, you must verify whether it is successfullydeployed on all front-end web servers in the SharePoint farm.
To verify the deployment of the web service in SharePoint 2010, SharePoint2013, and SharePoint 2016
1 In the Central Administration console, click the System Settings.
2 Under the Farm Management section, click Manage Farm Solutions.
3 Verify that the status for Data Insight solution for SharePoint, sdispwebsvc.wsp,is set to Deployed.
4 Click the link for the solution. Verify that the solution is deployed to all thefront-end web servers in the farm by checking the value of Deployed To field.
Adding web applicationsYou must install the Data Insight web service on the SharePoint server, before youcan add the web applications that you want Data Insight to monitor. In case theweb service is not installed, Data Insight prompts you to install it before you canproceed with adding web applications.
Note: Data Insight disables addition of web applications if you do not have a validlicense or if your license has expired.
To add web applications
1 In the Console, click Settings > SharePoint Sources.
The SharePoint page displays the list of configured SharePoint sources.
2 Click Add SharePoint Source > SharePoint Web Application.
3 On theAddNewWebApplication screen, enter the URL of the web applicationyou want to add and enter the properties.
4 Click Save.
277Configuring monitoring of SharePoint web applicationsAdding web applications

Adding web applications in bulkYou can also add multiple web applications at once to the Data Insight configuration.
To add SharePoint web applications in bulk
1 In the Console, click Settings > SharePoint Sources.
2 On the web applications page, click the Add SharePoint Source > AddSharePoint Web Applications in Bulk drop-down, and select the webapplication that you want to add.
3 On theBulk Add SharePointWebApplications pop-up, browse to the locationof the CSV file that contains the configuration details for each web application.
Note: If you are configuring multiple web applications for the first time, downloada sample of the CSV file; create a CSV file with the details corresponding toeach web application that you want to configure.
4 Click Upload.
Add/Edit web application optionsUse this dialog box to add a new web application to Veritas Data Insight or to editthe configuration of an existing web application.
Table 19-2 Add/Edit web application options
DescriptionField
Enter the URL of the web application that you want Data Insight tomonitor.
Web ApplicationURL
Do the following:
1 Click Select Collector.
2 The Select Collector pop-up displays the configured Collectorsthat are available for selection.
3 Review the performance parameters such as disk and CPUutilization and backlog of files accumulating on the configurednodes. It is recommended that you assign a node on which theresource utilization is low.
4 Click Select to assign the Collector to the filer.
Data Insight connects to the SharePoint server from Collector node. Itis recommended that the Collector worker node share a fast networkwith the SharePoint server.
Collector
278Configuring monitoring of SharePoint web applicationsAdding web applications

Table 19-2 Add/Edit web application options (continued)
DescriptionField
Do the following:
1 Click Select Indexer.
2 The Select Indexer pop-up displays the configured indexers thatare available for selection.
3 Review the performance parameters such as disk and CPUutilization and backlog of files accumulating on the configurednodes. You can also view the number of devices, shares or sitecollections assigned to each configured node. It is recommendedthat you assign a node on which the resource utilization is low.
4 Click Select to assign the Indexer to the filer.
Events and metadata that are collected from the cluster are processedand stored on the Indexer node.
Indexer
Enter the credentials that Data Insight should use to provideauthenticated access to the Data Insight web service on the SharePointserver.
See “Configuring a web application policy” on page 275.
Site CollectionAdministrator
Click to test the availability of network connection between the Collectorworker node and the SharePoint server, and to test the validity ofspecified credentials. You must first ensure that the Data Insight webservice is already installed on the SharePoint server.
Veritas recommends that you verify the credentials before proceedingto ensure that Data Insight is able to connect to the SharePoint server.
Test Credentials
This checkbox is selected by default. This option allows you toautomatically include all site collections in the selected web applicationfor the purpose of monitoring.
Clear the check box to add site collections manually. You can do thisfrom the web application details page.
Automaticallydiscover and addsite collections inthis Webapplication
Enter the details of the site collections which should not be includedduring discovery.
This option is available if you select Automatically discover and addsite collections in this SharePointWebApplication. Specify commaseparated patterns that you want to ignore. Patterns can have 0 or morewildcard * characters.
For example, https://webapp1/sites/test* ignores site collectionshttps://webapp1/sites/testsite1 and https://webapp1/sites/testsite2.
Exclude followingsite collectionsfrom discovery
279Configuring monitoring of SharePoint web applicationsAdding web applications

Table 19-2 Add/Edit web application options (continued)
DescriptionField
Select to enable monitoring of access events for the web application.MonitorSharePointaccesses to thisWeb application
Select to automatically enable event monitoring for all site collectionsof this web application.
You can also choose to manually enable auditing by logging in to theSharePoint server. For this purpose, you must have site collectionadministrator privileges on the SharePoint server.
Automaticallyenable auditing forsite collections ofthe Webapplication
Select to delete audit logs from SharePoint to prevent the webapplication database from growing too large. By default, Data Insightdeletes audit logs that are older than two days from the SharePointserver once every 12 hours. You can configure this interval from theAdvanced Settings page for the corresponding Collector.
You can choose to customize how often Data Insight should delete oldaudit logs from the Data Insight Servers node on the ManagementConsole.
See “Configuring advanced settings” on page 88.
Delete Audit Logsfrom SharePointDatabase afterimporting into DataInsight
Select the checkbox to enable SharePoint scanning according to thespecified schedule.
Enable scanningfor this Webapplication
Select one of the following to define a scanning schedule for theSharePoint servers in this farm:
■ Use Collector's default scanning schedule■ Use custom schedule
From the drop-down, select the appropriate frequency.See “Custom schedule options” on page 254.
Veritas Data Insight periodically scans site collections to obtain filemetadata. Each Collector worker node by default initiates a full scanthe SharePoint servers at 11:00 P.M. each night.
Note: You can also customize the schedule for each site collectionusing the Add/Edit Site Collection dialog box.
Scanning schedulefor full scans
Select this option to scan newly added site collections immediately,instead of waiting for the normal scan schedule. Scanning will stillproceed only when scanning is permitted on the Collector node.
Scan newly addedsite collectionsimmediately
280Configuring monitoring of SharePoint web applicationsAdding web applications

Editing web applicationsAfter you add a web application to Data Insight, you can edit its configuration. Forexample, you might need to edit any of the following:
■ The user who is authorized to log in to the SharePoint server.
■ The Collector worker node that is configured to scan the SharePoint server.
■ The Indexer node that is associated with the web application.
■ Enable or disable web application scanning or audit.
■ The scanning schedule.
Note: Data Insight disables addition of web applications if you do not have a validlicense or if your license has expired. You can edit the configuration of the webapplications that have already been added to Data Insight. However, Data Insightwill not discover site collections that have been added to the configured webapplications after the expiry of the license.
To edit web applications
1 In the Console, click Settings > SharePoint Sources.
2 Do one of the following:
■ In the SharePoint Sources list page, click the Select Actions drop-downand select Edit corresponding to the web application that you want to edit.
■ Click the web application whose configuration you want to edit. On the webapplication detail screen, click Edit.
3 On the Edit Web Application screen, do the following:
■ Make the necessary configuration changes.
■ To rename a web application, edit the name field.
■ To migrate a web application to another Collector, click Change Collector.
■ On the Select Collector panel, select the new Collector that you want toassociate with the web application.
■ Click Select.
■ Click Save to save the changes.
281Configuring monitoring of SharePoint web applicationsEditing web applications

4 To view the status of migration, navigate to the Web Application list page.
5 Click the Select Action drop-down corresponding to the web application beingmigrated, and select View Migration Status.
On the Migration Status panel, you can view the status of each site collectionof the web application that is being migrated. The status can either be Successor Pending.
See “About migrating storage devices across Indexers” on page 112.
See “ Add/Edit web application options” on page 278.
See “Considerations for renaming a storage device” on page 270.
Deleting web applicationsYou can delete a configured web application.
To delete a web application
1 In the Console, click Settings > SharePoint Sources.
2 Do one of the following:
■ In the SharePoint Sources list page, click the Select Actions drop-downand select Delete corresponding to the web application that you want todelete.
■ Click the web application that you want to delete. On the web applicationdetail screen, click Delete.
3 Select the check box to disable auditing of all those site collections within theWeb Application that have been added to Data Insight for monitoring.
4 Click Yes on the confirmation dialog box.
Adding site collectionsAll site collections in a web application are added to the Data Insight configurationwhen you add the web application to Data Insight. You must add the site collectionsmanually if you do not select the Automatically discover and add site collectionsin this web application option when adding a web application. You can either addmultiple site collections at once using a CSV file or select individual site collectionsthat you want to add to the Data Insight configuration.
282Configuring monitoring of SharePoint web applicationsDeleting web applications

Note: Data Insight disables addition of site collections if you do not have a validlicense or if your license has expired. Also, Data Insight will not discover sitecollections that have been added to configured web applications after the expiry ofthe license.
To add a site collection
1 In the Console, click Settings > SharePoint Sources.
2 To add site collections do one of the following:
■ To add site collections in bulk, on the SharePoint Sources list page, clickAdd Site Collections in Bulk. On the pop-up, browse to the location ofthe CSV file and select it. Click Upload.If you are adding site collections in bulk for the first time, you must createa CSV file in a specific format. Download a sample CSV file to view theformat.
■ Click a configured web application. On the Details screen, click MonitoredSite Collections.
3 To add a single site collection, on the Monitored Site Collection list page, clickAdd Site Collection.
4 On the Add New Site Collection pop-up, enter the site collection properties,and click Save.
Add/Edit site collection optionsUse this dialog box to add a new site collection to a configured web application orto edit the configuration of an existing site collection.
Table 19-3 Add/Edit site collection options
DescriptionField
Enter the URL of the site collection that you want to add.Site CollectionURL
Enter a logical name for the site collection.Site CollectionTitle
283Configuring monitoring of SharePoint web applicationsAdding site collections

Table 19-3 Add/Edit site collection options (continued)
DescriptionField
Select one of the following to define a scanning schedule for the sitecollection:
■ Use Web Application's default scanning schedule■ Use custom schedule
From the drop-down, select the appropriate frequency.■ See “Custom schedule options” on page 254.
Veritas Data Insight periodically scans site collections to obtainmetadata. Each Collector worker node by default initiates a full scan ofthe SharePoint servers at 11:00 P.M. each night.
Scanning schedule
Select to preserve the activity information on the site collection. Selectingthis option disables the deletion or archiving of access event informationon the site collection.
See “About archiving data” on page 42.
See “About purging data” on page 43.
Enable legal holdfor this sitecollection
Managing site collectionsOn the site collections details page, you can view detailed information about a sitecollection, and edit or delete the site collection. You can also run a scan on the sitecollection from this page.
Use the provided dynamic search filter to search for configured sites based on thename of the site.
To view configured site collections
1 In the Console, click Settings > SharePoint Sources.
2 In the SharePoint Sources list page, click the web application that the sitecollections are a part of.
3 On the web application details page, click Monitored Site Collections.
The screen displays a list of all configured site collections.
4 On the Site Collections listing page, review the following information about theconfigured site collections.
■ The name of the site collection.
■ The URL of the site collection
284Configuring monitoring of SharePoint web applicationsManaging site collections

■ The scanning schedule for the site collection. By default, this column ishidden. To unhide this column, click the column heading and selectColumns > Scanning Schedule .
■ The date and time of the last full scan of the site collection.
■ The time this site collection's index was last updated with scan information.After every scan, the index is updated with information about the changesto the folder hierarchy on a site collection. This column indicates whetherthe last update was successful or has failed. It also indicates number ofscan files pending for this site collection on the Indexer and the number offiles that failed to be indexed. The files that failed to be indexed, are presentin the $data/indexer/err folder on the Indexer. If you do have failed fileson the indexer, you can move them from the err folder to the $data/inbox
folder and attempt a full scan of the site collection.If the scan information again fails to be indexed, contact Veritas support.
■ The time this site collection's index was last updated with access eventinformation.As new access events come in, the index for the site collection is periodicallyupdated with information about these events. This indicates whether thelast update was successful or has failed. It also indicates number of auditfiles pending for this site collection at the Indexer and the number of filesthat failed to be indexed. Audit files are present in the $data/indexer/err
folder on the Indexer. If you do have failed files on the indexer, you can trymoving them back to $data/inbox folder on the Indexer.If the new audit information again fails to be indexed, contact Veritas support.
■ The status of event monitoring for the site collection, whether enabled ordisabled. By default, this column is hidden.
■ Whether a legal hold is being enforced for the site collection. You canchoose to prevent access information for a site collection from beingarchived or deleted by putting a legal hold on the site collection. Data Insightpreserves the access events information for such site collections indefinitely.By default, this column is hidden.See “Add/Edit site collection options” on page 283.
5 Click the Export icon at the bottom of the page to save the data on theMonitored Site Collections panel to a .csv file.
You can also edit the properties of the site collection, start an unscheduled scanof the site collection, delete the site collection, view the event log or scan historyof the site collection, or download logs for troubleshooting purposes.
285Configuring monitoring of SharePoint web applicationsManaging site collections

To edit a site collection
1 On the web application details page, click Monitored Site Collections.
2 Select the site collection that you want to edit, and from the Select Actiondrop-down, select Edit.
3 On the Edit site collection screen, make the necessary configuration changes.
4 Click Save.
To delete a site collection
1 On the web application details page, click Monitored Site Collections.
2 Select the site collection that you want to delete, and from the Select Actiondrop-down, select Delete.
3 Click OK on the confirmation message.
To view the scan status of a site collection
1 On the web application details page, click Monitored Site Collections.
2 Select the site collection for which you want to view the scan history, and fromthe Select Action drop-down, select Scan Status.
The scan status for the site collection appears.
See “Viewing the scan status of storage devices” on page 351.
You can also view the scan history and scan errors for a site collection.
See “Viewing scan errors ” on page 360.
To view events pertaining to a site collection
1 In the Console, click Settings > SharePoint Sources, and select a webapplication.
2 On the web application details screen, click Monitored Site Collections.
3 Click the Select Action drop-down for the corresponding site collection, andselect Event Log.
The event log for that site collection appears.
4 To download the logs for the site collection, click the Select Action drop-downfor the corresponding site collection, and select Download Logs.
Data Insight downloads a compressed folder containing the logs for this sitecollection from all relevant Data Insight servers.
See “Downloading Data Insight logs” on page 455.
286Configuring monitoring of SharePoint web applicationsManaging site collections

To scan site collections in a batch
1 On the Monitored site collections tab, select a configured site collection, andselect Scan from the Select Action drop down corresponding to a share.
Note: The Scan option is not available for site collections that have beendisabled.
2 To scan multiple site collections, select one or more site collections using thecheck boxes.
3 Click Scan, and select Scan Selected Records.
Optionally, filter site collections as needed using the filters available on thepage. ClickScan, and select Scan Filtered Records.
Note: You can use a command line utility, scancli.exe, to further customize thescan, view the scan jobs running on a specified node, or display the scan statusfor specified site collections. For details, See scancli.exe on page 434. You can alsouse the Scanning dashboard view to scan shares and site collections based onmore granular criteria.
To enable or disable site collections
1 In the Management Console, click Settings > SharePoint Sources.
2 Click the web application that the site collections are a part of.
3 On the filer detail screen, click Monitored Site Collections.
4 Click the Action drop-down corresponding to a share, and select Enable toenable a site collection that has been disabled.
5 Click the Action drop-down corresponding to a share, and select Disable todisable a site collection.
See “Adding site collections” on page 282.
See “Add/Edit site collection options” on page 283.
Removing a configured web applicationIf you want to remove an existing SharePoint web application from Data Insight youmust complete the steps in the correct order.
287Configuring monitoring of SharePoint web applicationsRemoving a configured web application

To remove a web application from Data Insight
1 Delete the configured web applications from the Data Insight console.
Deleting the web application enables you to disable auditing for the monitoredSharePoint web applications
See “Deleting web applications” on page 282.
2 On the SharePoint server, disable auditing of the web applications that aredeleted from Data Insight.
3 If you no longer want Data Insight to monitor one of the web applicationsresiding on a SharePoint server, then uninstall the Data Insight Web servicefrom the SharePoint server. However, if you want to monitor any other webapplication residing on the same SharePoint server, then you require the DataInsight Web service.
288Configuring monitoring of SharePoint web applicationsRemoving a configured web application

Configuring monitoring ofSharePoint Onlineaccounts
This chapter includes the following topics:
■ About SharePoint Online account monitoring
■ Registering Data Insight with Microsoft to enable SharePoint Online accountmonitoring
■ Configuring an administrator account for Data Insight
■ Adding SharePoint Online accounts
■ Managing a SharePoint Online account
■ Adding site collections to SharePoint Online accounts
■ Managing site collections
About SharePoint Online account monitoringData Insight provides the ability to monitor the unstructured data that resides inSharePoint Online, a cloud-based service from Microsoft. When you add aSharePoint Online account from the Management Console, Data Insight discoversthe site collections configured for that account. You can also configure Data Insightto exclude certain site collections from being monitored. This might be a requirementwhen you have personal data that you do not want to be monitored.
20Chapter

The SharePoint Online storage hierarchy consists of account, site collection, sites,or document or picture library. Data Insight logically maps to these descendantsas filers, shares, and folders or files.
Data Insight scans the site collections and the sites in the hierarchy to collect themetadata properties such as the file creation date, created by, and permissions.Data Insight also gathers events for site collections.
Data Insight scans the sites and document libraries available in a SharePoint Onlineaccount that resides on the following SharePoint versions:
■ Microsoft SharePoint™ 2016
■ Microsoft SharePoint™ 2013
You must perform the following steps to enable Data Insight to monitor a SharePointOnline account:
■ Complete all the prerequisite configurations.See “Prerequisites for configuring SharePoint Online account” on page 291.
■ Configure an administrator account in SharePoint Online (in Office 365); makesure that this administrator account has full control over the site collections andis an owner for team site collections. Data Insight uses this account toimpersonate a user account to query the site collections.See “Configuring an administrator account for Data Insight” on page 295.
■ Make sure that the site collections are configured for the SharePoint Onlineaccount. You can configure Data Insight to automatically discover the sitecollections or manually add site collections to the configured Online accounts.See “Adding site collections to SharePoint Online accounts” on page 303.
■ When adding a SharePoint Online account, Data Insight excludes the followingsite collections from getting discovered.
■ <companyname>.sharepoint.com/portals/community
■ <companyname>.sharepoint.com/search
■ <companyname>.sharepoint.com/sites/CompliancePolicyCenter
■ <companyname>-my.sharepoint.com
Once the SharePoint Online accounts are configured successfully, Data Insightstarts receiving the access event information from the SharePoint Online server.
Limitations for SharePoint Online monitoring in DataInsightThe following limitations apply when monitoring SharePoint Online accounts:
290Configuring monitoring of SharePoint Online accountsAbout SharePoint Online account monitoring

■ The ability to add SharePoint Online accounts and site collections in bulk usingCSV is not supported.
■ Scan and audit exclude rules are not supported.
■ Scan errors are not reported on the Scanning dashboard for SharePoint Onlinescan failures. However, the sponline_connector_service and commd logs willcontain information about these errors and exceptions.
■ Archive and classify actions for SharePoint Online paths are not supported.
■ You cannot create Data Loss Prevention (DLP) Incident Remediation workflowsand the Records Classification workflows for SharePoint Online paths.
■ Discovery of site collections that are locked is not supported.
■ On the Settings > Scan Status page, ability to pause or cancel an in-progressscan job is not available. The jobs that are in the queues can be paused orcanceled.
■ Audit events on libraries, such as document libraries, picture libraries, and soon are not fetched for SharePoint Online accounts. This limitation is observedbecause Microsoft Office 365 does not support these event types.
■ Audit is not supported on Microsoft 2016 because the Powershell versionsupported by Data Insight is not compatible with the version supported byMicrosoft 2016.
■ Permissions Search report, Inactive Users report, and Group Change ImpactAnalysis report are not supported for SharePoint Online.
■ Data Insight does not support metadata scan and local user scan for SharePointOnline site collections with special characters in its name.
■ In the Data InsightWorkspace, for site collections with I18N special characters,paths are not shown correctly.
■ Permissions for I18N site collection are not shown correctly in the Data InsightWorkspace.
■ SharePoint Online does not support auditing for site collections with I18N andspecial characters.
Prerequisites for configuring SharePoint Online accountFor Data Insight to access the SharePoint Online account, make sure that thefollowing prerequisites are met:
■ The Collector node is configured on Windows Server 2012 R2 or WindowsServer 2016.
291Configuring monitoring of SharePoint Online accountsAbout SharePoint Online account monitoring

■ Ensure that you are aware of the SharePoint Online Account AdministrationCenter Site URL that you want Data Insight to monitor.
■ The Global administrator and the SharePoint administrator accounts areconfigured in the Office 365 admin center. This account should haveadministrative privileges on the target site collections and should be an ownerfor team site collections.See “Configuring an administrator account for Data Insight” on page 295.
■ The DataInsightSPOnline service is configured and running on the Collectornode. This service is responsible for discovering the site collections and scanningthe Online account hierarchy for metadata and to gather the audit events.See “Configuring Data Insight services” on page 86. for information about theData Insight services.
■ Create a role with View-only audit log privilege. This user credentials are usedby Data Insight to collect SharePoint Online audit logs.Do the following:
■ In the Office 365 Admin Center, navigate to Exchange > permissions. Inthe admin roles tab, click the '+' sign to add a new admin role.Create a role group with selected roles and selected members, provideView-Only Audit Logs privilege to the role, and add the user with role ofSharePoint administrator role to the newly-created role.
Ensure that you use the same user credentials with role as SharePointadministrator.For more information, seehttps://support.office.com/en-us/article/Turn-off-audit-log-search-in-Office-365
■ Note that Data Insight fetches audit data using PowerShell PS Remoting.On the Windows Server, ensure that the execution policy is set to RemoteSigned.This permits running of PowerShell scripts for device discovery and audit datacollection. To configure the policy, start Windows PowerShell as administrator,and run the following commands:To view the configured execution policy:Get-ExecutionPolicy
To configure the execution policy to RemoteSigned:Set-ExecutionPolicy -ExecutionPolicy RemoteSigned -Scope
LocalMachine
■ Enable auditing in Office 365 Admin Center.To enable auditing, in Office 365 Admin Center navigate to Security andCompliance > Search and investigation > Audit log search. Click Startrecording user and admin activities.
292Configuring monitoring of SharePoint Online accountsAbout SharePoint Online account monitoring

Note that it takes 24 hours for the audit logs to start appearing on the Audit logsearch page.
■ If your organization requires internet connections to pass through a proxy server,edit the proxy_server.properties file to update the proxy settings.Do the following:
■ The proxy_server.properties file contains the proxy settings to connectto your SharePoint Online account. It is located inthe<InstallDir>\connectors\sponline folder.
■ Open the properties file in a text editor, and edit the following details:
■ Username or domain\username
■ Proxy password
■ Hostname or IP address of the proxy server
■ Port of the proxy serverConfigure the proxy server in your LAN settings. In the Windows ControlPanel, click Internet Options > Connections > Local Area Network(LAN) Settings. Select Use a proxy server for your LAN and enter theIP of your proxy server.To import the proxy settings, run the following commandnetsh winhttp import proxy source=<ie>
■ Ensure that the following URLs are allowed by your organization's proxyserver and firewall settings:https://graph.microsoft.com/https://login.microsoftonline.comhttps://outlook.office365.com
Registering Data Insight with Microsoft to enableSharePoint Online account monitoring
To authorize Data Insight to access the Microsoft SharePoint Online account, youmust create an application for every Data Insight installation and register it withMicrosoft Azure Active Directory. This step involves associating a set of credentialswith the application and providing the application with the required permissions,which enables communication between Data Insight and Microsoft. This step alsocreates an authorization token that is stored as a named credential in the DataInsight configuration.
Note: You need a Microsoft account to add an application.
293Configuring monitoring of SharePoint Online accountsRegistering Data Insight with Microsoft to enable SharePoint Online account monitoring

To create and register an application with Microsoft
1 Login to https://apps.dev.microsoft.com.
2 Sign-in with your Microsoft account credentials to the Microsoft ApplicationRegistration Portal.
Note: Ensure that you use the credentials of an Office 365 user with MicrosoftGlobal administrator role for authorizing Data Insight.
3 Click Add an app, and give it a name. The portal assigns your application aunique Application ID.
Make a note of the Application ID. You will need it when configuring theSharePoint Online account monitoring in Data Insight.
4 Generate an application secret to enable Data Insight to receive the accesstokens required for calling the required APIs.
Click Generate New Password. The password is required when configuringSharePoint Online account monitoring in Data Insight.
5 Click Platforms, and select Web.
Specify the URL of the Data Insight Management Server. For example,https://<IP address of the Management Server>/spOnline.
294Configuring monitoring of SharePoint Online accountsRegistering Data Insight with Microsoft to enable SharePoint Online account monitoring

6 Assign permissions to the app. Data Insight requires the application to haveat least the following permissions:
7 Click Save.
Configuring an administrator account for DataInsight
Data Insight uses a Global administrator account to discover the site collectionsand scan metadata and a SharePoint administrator account to fetch the accessevents from the configured SharePoint Online account. Global administrator accountsmust have full control over the site collections that you want Data Insight to monitor.You must configure the Global administrator, as owner for team site collections, onthe Office 365 interface and assign the administrative privileges for the target sitecollections.
295Configuring monitoring of SharePoint Online accountsConfiguring an administrator account for Data Insight

Note: Data Insight expects you to procure a separate add-on cloud license tomonitor cloud storage resources. It disables addition of cloud storage sources ifyou do not have a valid base and cloud license or if your license has expired.
To add a SharePoint administrator
1 Log on to Office 365 using the Global admin credentials.
2 On the SharePoint admin center page, click Users > Active users > Add auser.
The New User pop-up windows opens.
3 Enter the name of the user and other properties as appropriate.
4 In the Roles section, select Customized administrator > SharePointadministrator.
5 Click Add.
The SharePoint administrator account collects metadata about site collection content,and gathers audit data from SQL Server databases for SharePoint when it isassigned administrative privileges for the target site collections. It must also havefull control permissions on the configured site collections and the site collectionsthat are incrementally included to the SharePoint account. For team site collections,the SharePoint administrator should be an owner.
To add a Global administrator
1 Log on to Office 365 using the Global admin credentials.
2 On the SharePoint admin center page, click Users > Active users > Add auser.
The New User pop-up windows opens.
3 Enter the name of the user and other properties as appropriate.
4 In the Roles section, select Global administrator.
5 Click Add.
The Global administrator has access to all features in the Admin center and canperform all tasks in the Office 365 Admin center.
To configure administrative privileges on site collections
1 On the SharePoint admin center page, select the site collection URL that youwant Data Insight to monitor.
2 Click Owners > Manage Administrators.
The manage administrators pop-up window opens.
296Configuring monitoring of SharePoint Online accountsConfiguring an administrator account for Data Insight

3 In the Site Collection Administrators field, specify the administrator accountwhich must have the administrator privileges on the selected site collections.You can specify multiple user accounts separated by a comma.
4 Click OK.
To assign owners for team site collections
1 On the SharePoint admin center page, go to Groups > Groups, and selectthe Group Name to which you want to assign owners.
2 In the Group details pane on the right-hand-side, click Edit for the Ownersentry.
3 In the Edit pane, click Add owner and select the check box of a user that is aSharePoint administrator.
4 Click Save.
Adding SharePoint Online accountsData Insight discovers and scans the data residing in the SharePoint Online accountsthat are configured on the Management Console.
Note: Data Insight disables addition of SharePoint Online accounts if you do nothave a valid cloud license or if your license has expired. Also, Data Insight will notdiscover new accounts that have been added after the expiry of the license.
To add a SharePoint Online account
1 In the Console, click Settings > SharePoint Sources.
The SharePoint page displays the list of configured web applications and Onlineaccounts.
2 Click Add SharePoint Source > SharePoint Online Account.
3 On the Add New SharePoint Online Account screen, specify the URL of theaccount you want to add and enter the properties.
See “Add/Edit SharePoint Online account options” on page 297.
4 Click Save.
Add/Edit SharePoint Online account optionsUse this dialog box to add a new SharePoint Online account to Veritas Data Insightor to edit the configuration of an existing account.
297Configuring monitoring of SharePoint Online accountsAdding SharePoint Online accounts

Table 20-1 Add/Edit SharePoint Online account options
DescriptionField
Enter the URL of the SharePoint Online URL that you wantData Insight to monitor. For example,https://myaccount.sharepoint.com
SharePoint Online AccountURL
Do the following:
1 Click Select Collector.
The Select Collector pop-up displays the configuredCollectors that are available for selection.
2 Review the performance parameters such as disk andCPU utilization and backlog of files accumulating on theconfigured nodes. It is recommended that you assign anode on which the resource utilization is low.
3 Click Select to assign the Collector to the filer.
Data Insight connects to the SharePoint server from theCollector node. It is recommended to choose the Collectorworker node that is close in proximity to the SharePoint Onlineaccount server.
Collector node should be running on Windows Server 2012R2 or Windows Server 2016.
Collector
Do the following:
1 Click Select Indexer.
The Select Indexer pop-up displays the configuredindexers that are available for selection.
2 Review the performance parameters such as disk andCPU utilization and backlog of files accumulating on theconfigured nodes. You can also view the number ofdevices, shares or site collections assigned to eachconfigured node. It is recommended that you assign anode on which the resource utilization is low.
3 Click Select to assign the Indexer to the filer.
Events and metadata that are collected from the sitecollections are processed and stored on the Indexer node.
Indexer
298Configuring monitoring of SharePoint Online accountsAdding SharePoint Online accounts

Table 20-1 Add/Edit SharePoint Online account options (continued)
DescriptionField
The client ID is the unique application ID assigned when youcreate and register an app with Microsoft.
Follow the procedure described in the following topic to getthese details:
See “Registering Data Insight with Microsoft to enableSharePoint Online account monitoring ” on page 293.
Client ID
Client Secret Key
Do the following:
1 ClickAuthorize. This invokes the application authorizedto access the SharePoint Online account. .
Note: Ensure that you use the credentials of a Office365 user with Microsoft Global administrator role forauthorizing Data Insight.
This step creates an authorization token that is storedas a named credential in the Data Insight configuration.You will be redirected to the Data Insight console tocomplete the rest of the configuration.
2 Data Insight can now access the user, folder and filemetadata and the information about the activitiesperformed on these files and folders.
Authorize access
This check box is selected by default. This option allows youto automatically include all site collections in the selectedOnline account for the purpose of monitoring.
Clear the check box to add site collections manually. Youcan do this from the Online account details page.
Discovery of site collections takes place as soon as you adda SharePoint Online account and then twice each day at 2:00A.M. and 2:00 P.M.
Automatically discover andadd site collections in thisSharePoint Online account
299Configuring monitoring of SharePoint Online accountsAdding SharePoint Online accounts

Table 20-1 Add/Edit SharePoint Online account options (continued)
DescriptionField
Enter the details of the site collections which should not beincluded during discovery.
This option is available when you select Automaticallydiscover and add site collections in the added SharePointOnline Accounts. Specify comma separated patterns thatyou want to ignore. Patterns can have 0 or more wildcard *characters.
For example, https://onlineaccount1/sites/test* ignores sitecollections https://onlineaccount1/sites/testsite1 andhttps://onlineaccount1/sites/testsite2.
Exclude following sitecollections from discovery
By default, Microsoft SharePoint Event Monitoring is enabled.If disabled, select this check box to enable event monitoringon the SharePoint Online account. You must manually enableauditing in the Office 365 Admin Center to enable Data Insightto collect audit logs for the SharePoint Online account.
From the SharePoint Online Credentials drop-down, selectthe credentials of a user with SharePoint administrator rolewhich has been assigned the View-Only Audit Logs or AuditLogs privilege.
Note: The user used for auditing of the SharePoint Onlineaccount should be set to [email protected] insteadofDOMAIN\username. Microsoft supports the User PrincipalName (UPN) for connecting to a remote Exchange server.
Monitor SharePoint accessesto this SharePoint Onlineaccount
Select the check box to enable SharePoint account scanningaccording to the specified schedule.
Enable Scanning for thisSharePoint Online account
Select one of the following to define a scanning schedule forthe SharePoint Online account:
■ Use the Collector's scanning schedule.■ Define custom schedule.
From the drop-down, select the appropriate frequency.
Veritas Data Insight periodically scans site collections toobtain file metadata. Each Collector worker node by defaultinitiates a full scan of the SharePoint servers at 11:00 P.M.each night.
Note: You can also customize the schedule for each sitecollection using the Add/Edit Site Collection dialog box.
Scanning schedule (for fullscans)
300Configuring monitoring of SharePoint Online accountsAdding SharePoint Online accounts

Table 20-1 Add/Edit SharePoint Online account options (continued)
DescriptionField
Select this option to scan newly added site collectionsimmediately instead of waiting for the regular scan schedule.Scanning will still proceed only when scanning is permittedon the Collector node.
Scan newly added sitecollections immediately
Managing a SharePoint Online accountWhen a SharePoint Online account is configured in Data Insight, it gets listed onthe Management Console. You can view the properties of the configured accounts,change the Indexer associated with the account, or delete the account if you donot want Data Insight to monitor it any longer.
To view the configured SharePoint Online accounts
1 In the Console, click Settings > SharePoint Sources.
The screen displays the list of configured Web applications and SharePointOnline accounts.
2 Click on a configured SharePoint Online account to view its detailed information,or click the Select Actions drop-down and select View.
The SharePoint Online account details page appears.
3 Review the following information about the SharePoint Online accounts:
■ The URL of the SharePoint Online account.
■ The status of the account — whether scanning and event monitoring areenabled for this account.
■ The Collector node for the SharePoint Online account.
■ The Indexer node for the SharePoint Online account.
4 You can change the Indexer for the SharePoint Online account.
To migrate to another Indexer, do the following:
■ Click Change Indexer.The Select Indexer pop-up displays the configured indexers that areavailable for selection.
■ Review the performance parameters such as disk and CPU utilization andbacklog of files accumulating on the configured nodes. You can also viewthe number of devices, shares, or site collections assigned to each
301Configuring monitoring of SharePoint Online accountsManaging a SharePoint Online account

configured node. Veritas recommends that you assign a node on which theresource utilization is low.
■ Click Select to assign the Indexer to the filer.When the migration starts, click View Details to view the progress of themigration.
5 To view the status of migration to another Indexer, navigate to the SharePointOnline account list page.
6 Click the Select Action drop-down corresponding to the account beingmigrated, and select View Migration Status.
On the Migration Status panel, you can view the status of each site collectionof the account that is being migrated. The status can either be Success orPending.
See “Add/Edit SharePoint Online account options” on page 297.
7 To view events pertaining to the SharePoint Online account, click Event Log.
The events for the selected account are displayed. You can filter these eventsby Data Insight node, type of event, severity, and the service or the processthat is generating the event.
Data Insight lets you modify the configurations that you specified when you addeda SharePoint Online account to the Management Console.
Note: Data Insight disables addition of SharePoint Online accounts if you do nothave a valid cloud license or if your license has expired. Data Insight will also notdiscover site collections that have been added to the configured accounts after theexpiry of the license.
To edit SharePoint Online account
1 In the Console, click Settings > SharePoint Sources.
2 Do one of the following:
■ In the SharePoint Sources summary table, click the Select Actionsdrop-down and select Edit.
■ Click the account whose configuration you want to edit. On the SharePointOnline account detail screen, click Edit.
3 On the Edit Online Account screen, do the following:
■ Make the necessary configuration changes.
■ To rename a SharePoint Online account, edit the name field.
302Configuring monitoring of SharePoint Online accountsManaging a SharePoint Online account

■ To migrate an account to another Indexer, click Change Collector.
■ On the Select Collector dialog box, select the new Collector that you wantto associate with the SharePoint Online account.
■ Click Select.
■ Click Close to save the changes and close the dialog box.
When you do not want Data Insight to further monitor a SharePoint Online account,you can delete that account from the Management Console.
To delete an account
1 In the Console, click Settings > SharePoint Sources.
2 Do one of the following:
■ In the SharePoint Sources summary table, click the Select Actionsdrop-down and select Delete.
■ Click the SharePoint Online account that you want to delete. On theSharePoint Online account detail screen, click Delete.
3 Click Yes on the confirmation dialog box.
Adding site collections to SharePoint Onlineaccounts
By default, Data Insight discovers the site collections present in the hierarchy of aSharePoint Online account when it is added to Data Insight. However, if you choseto manually add a site collection, then ensure to clear the Automatically discoverand add site collections in this SharePoint Online account check box that isavailable when you add an account.
To add a site collection
1 In the Console, click Settings > SharePoint Sources.
2 Click a configured account. On the details screen, click Monitored SiteCollections.
3 On the Monitored Site Collections list page, click Add Site Collection.
4 On the Add New Site Collection pop-up, enter the site collection properties,and click Save.
303Configuring monitoring of SharePoint Online accountsAdding site collections to SharePoint Online accounts

Add/Edit site collection optionsUse this dialog box to add a new site collection to a configured SharePoint Onlineaccount or to edit the configuration of an existing site collection.
Table 20-2 Add/Edit site collection options
DescriptionField
From the drop-down, select the URL of the site collection thatyou want to add.
You cannot manually add a site collection if it is not listed in thedrop-down list.
Site Collection URL
Enter a logical name for the site collection.Site Collection Title
Select one of the following to define a scanning schedule for thesite collection:
■ Use SharePoint Online source's default scanning schedule■ Use custom schedule■ From the drop-down, select the appropriate frequency.
Veritas Data Insight periodically scans site collections to obtainmetadata. Each Collector worker node by default initiates a fullscan of the SharePoint servers at 11:00 P.M. each night.
Scanning schedule
Select to preserve the activity information on the site collection.Selecting this option disables the deletion or archiving of accessevent information on the site collection.
Enable legal hold for thissite collection
Managing site collectionsAfter the site collections are added, you can view the configured site collection,modify the properties of the site collection, start an unscheduled scan of the sitecollection, delete the site collection, view the event log or scan history of the sitecollection, or download logs for troubleshooting purposes.
Use the provided dynamic search filter to search for configured sites based on thename of the SharePoint Online account.
To view configured site collections
1 In the Console, click Settings > SharePoint Sources.
2 In the SharePoint Sources summary table, click the SharePoint Online accountthat the site collections are a part of.
304Configuring monitoring of SharePoint Online accountsManaging site collections

3 On the SharePoint Online account details page, click Monitored SiteCollections.
The screen displays a list of all configured site collections.
4 On the Site Collections listing page, review the following information about theconfigured site collections.
■ The title of the site collection.
■ The URL of the site collection.
■ The scanning schedule for the site collection. By default, this column ishidden in the list view. To unhide the column, click the column headingsand select Columns > Scanning Schedule.
■ The date and time of the last full scan of the site collection.
■ The time this site collection's index was last updated with scan information.After every scan, the index is updated with information about the changesto the folder hierarchy on a site collection. This column indicates whetherthe last update was successful or has failed. It also indicates number ofscan files pending for this site collection on the Indexer and the number offiles that failed to be indexed. The files that failed to be indexed, are presentin the $data/indexer/err folder on the Indexer. If you do have failed files onthe indexer, you can move them from the err folder to the $data/inbox folderand attempt a full scan of the site collection.If the scan information again fails to be indexed, contact Veritas support.
■ The time this site collection's index was last updated with access eventinformation.As new access events come in, the index for the site collection is periodicallyupdated with information about these events. This indicates whether thelast update was successful or has failed.Audit files are present in the $data/indexer/err folder on the Indexer. If youdo have failed files on the indexer, you can try moving them back to$data/inbox folder on the Indexer. If the new audit information again failsto be indexed, contact Veritas support.
■ The status of event monitoring for the site collection, whether enabled ordisabled. This column is hidden by default. To view this column, click onthe column header and select Columns > Status.
■ Whether a legal hold is being enforced for the site collection. You canchoose to prevent access information for a site collection from beingarchived or deleted by putting a legal hold on the site collection. Data Insightpreserves the access events information for such site collections indefinitely.
305Configuring monitoring of SharePoint Online accountsManaging site collections

This column is hidden by default. To view this column, click on the columnheader and select Columns > Legal Hold.
5 Click the Export icon at the bottom of the page to save the data on the MonitoredSite Collections panel to a .csv file.
To edit a site collection
1 On the SharePoint Online account details page, click Monitored SiteCollections.
2 Select the site collection that you want to edit, and from the Select Actiondrop-down, select Edit.
3 On the Edit site collection screen, make the necessary configuration changes.
4 Click Save.
To delete a site collection
1 On the SharePoint Online account details page, click Monitored SiteCollections.
2 Select the site collection that you want to delete, and from the Select Actiondrop-down, select Delete.
3 Click OK on the confirmation message.
To view the scan status of a site collection
1 On the SharePoint Online account details page, click Monitored SiteCollections.
2 Select the site collection for which you want to view the scan history, and fromthe Select Action drop-down, select Scan Status.
The scan status for the site collection appears.
See “Viewing the scan status of storage devices” on page 351.
You can also view the scan history and scan errors for a site collection.
See “Viewing scan errors ” on page 360.
You can also view the scan history of a site collection from the Scan History sub-tabof the Scanning dashboard.
To view events pertaining to a site collection
1 In the Console, click Settings > SharePoint Sources, and select theSharePoint Online account that the site collections are a part of.
2 On the SharePoint Online account details screen, click Monitored SiteCollections.
306Configuring monitoring of SharePoint Online accountsManaging site collections

3 Click the Select Action drop-down for the corresponding site collection, andselect Event Log.
The event log for that site collection appears.
4 To download the logs for the site collection, click the Select Action drop-downfor the corresponding site collection, and select Download Logs.
Data Insight downloads a compressed folder containing the logs for this sitecollection from all relevant Data Insight servers.
To scan site collections in a batch
1 On the Monitored site collections tab, select a configured site collection, andselect Scan from the Select Action drop down corresponding to a share.
Note: The Scan option is not available for site collections that have beendisabled.
2 To scan multiple site collections, select one or more site collections using thecheck boxes.
3 Click Scan, and select Scan Selected Records.
Optionally, filter site collections as needed using the filters available on thepage. Click Scan, and select Scan Filtered Records.
Note: You can use a command line utility, scancli.exe, to further customize thescan, view the scan jobs running on a specified node, or display the scan statusfor specified site collections. For details, See scancli.exe on page 434. You can alsouse the Scanning dashboard view to scan shares and site collections based onmore granular criteria.
To enable or disable site collections
1 In the Management Console, click Settings > SharePoint Sources.
2 Click the SharePoint Online account that the site collections are a part of.
3 On the SharePoint Online details screen, click Monitored Site Collections.
4 To enable or disable the site collection, do one of the following:
■ Click the Select Action drop-down corresponding to a site collection, andselect Enable to enable a site collection that has been disabled.
■ Click the Select Action drop-down corresponding to a site collection, andselect Disable.
307Configuring monitoring of SharePoint Online accountsManaging site collections

See “Adding site collections to SharePoint Online accounts” on page 303.
308Configuring monitoring of SharePoint Online accountsManaging site collections

Configuring cloud datasources
■ Chapter 21. Configuring monitoring of Box accounts
■ Chapter 22. Configuring OneDrive account monitoring
■ Chapter 23. Managing cloud sources
5Section

Configuring monitoring ofBox accounts
This chapter includes the following topics:
■ About configuring Box monitoring
■ Using a co-admin account to monitor Box resources
■ Configuring monitoring of cloud sources in Data Insight
■ Configuring Box cloud resources through proxy server
About configuring Box monitoringData Insight monitors the data stored on cloud-based content sharing andmanagement services, such as Box and Microsoft OneDrive, to provide you accessand ownership information.
Box uses the Open Authorization 2 (OAuth2) protocol to permit access to athird-party application. Data Insight uses Box Enterprise administrator credentialsto gain access to a Box Administrator account, get information about all configuredusers, and to get information about events performed by them. The Administratorcredentials authorize Data Insight to access the Box Enterprise account. Theauthorization received from Box is encrypted and saved in the Data Insightconfiguration so that only the Collector and Indexer specific to the device have acopy of it. The credentials are used by Data Insight to impersonate a user accountto query Box for metadata.
In the Data Insight configuration, the Box account corresponds to a share on a fileserver. Since Data Insight uses the administrator account credentials to impersonateother users, you will always see just one share for every Box account. Whereas,different user accounts correspond to folders on a file share.
21Chapter

Data Insight scans the Box account for metadata such as path of the file or folder,modified by, modified at, created by, created at, size, file or folder type, and whethermore than one user collaborate on the resource.
Data Insight maps the user name for every user account attribute to the users'attributes in the directory service for the purpose of ascertaining ownership onfolders.
See “Using a co-admin account to monitor Box resources” on page 311.
Using a co-admin account to monitor Boxresources
It is recommended that you use administrator credentials to configure Box resourcesin Data Insight. However, if you prefer using any other user credentials to allowData Insight to access the Box Administrator account, you must provide that useraccount specific privileges.
To configure a co-admin account
1 Log on to Box Administration console using Administrator account credentials.
2 Select the user account that you want to provide co-admin privileges. Selectthe following check boxes to edit the user's access permission settings:
■ Allow this user to see all managed users.
■ User is granted the following privileges:
Manage users
Manage groups
Users and Groups
View users' content
Log in to users' accounts
Files and Folders
View settings for your company
Run new reports and access existingreports
Reports and Settings
The privileges that are provided in Step 2 do not allow the co-admin accountaccess to the files and folders owned by the Administrator and by otherco-admin users.
3 To provide preview access to all the top-level folders of Administrator and otherco-admin accounts, on the Change User Settings page, select the foldersthat you want to grant the co-admin account access to.
311Configuring monitoring of Box accountsUsing a co-admin account to monitor Box resources

4 The setting in Step 3 provides access only to the shared folders of theAdministrator and co-admin accounts. It does not provide access to their privatefolders.
To provide access to private folders of Administrator and other co-adminaccounts, use the Content Manager view. Select all such folders that you wantthe co-admin account to access.
5 Alternatively, you can create a Box group and add to this group all such userswho you want to grant preview access of all folders.
6 Use the co-admin user credentials to configure the Box account in Data Insight.
Configuring monitoring of cloud sources in DataInsight
Note:Data Insight requires you to install a separate add-on cloud license to monitorcloud storage resources. It disables addition of cloud storage sources if you do nothave a valid base and cloud license or if your license has expired.
You must add the cloud data source account to Data Insight configuration formonitoring.Veritas Data Insight treats every Box and Microsoft OneDrive accountas a separate device.
To add a cloud data source account
1 In the Console, click Settings > Cloud Sources.
The Cloud Sources list page displays the list of configured cloud storageaccounts.
2 On the list page, click the Add New Cloud Source drop-down, and select BoxAccount or Microsoft OneDrive account, as the case may be.
3 On theAdd NewAccount page, enter the properties for the cloud data sourceaccount that you want to monitor, and click Save.
See “Add/Edit Box account ” on page 312.
See “Add/Edit OneDrive account” on page 323.
Add/Edit Box accountUse this dialog box to add a new Box account to Data Insight or to edit theconfiguration of an existing Box account.
312Configuring monitoring of Box accountsConfiguring monitoring of cloud sources in Data Insight

Table 21-1 Add/Edit Box account options
DescriptionField
This is a free-form field. Enter a name that Data Insight uses to identifyyour box account. The name that you enter in this field represents a fileshare.
Box account name
Do the following:
1 Click Select Collector.
2 The Select Collector pop-up displays the configured collectorsthat are available for selection.
3 Review the performance parameters such as disk and CPUutilization and backlog of files accumulating on the configurednodes. It is recommended that you assign a node on which theresource utilization is low.
4 Click Select to assign the Collector to the Box account.
Data Insight connects to the Box application from this server.
Collector
Do the following:
1 Click Select Indexer.
2 The Select Indexer pop-up displays the configured indexers thatare available for selection.
3 Review the performance parameters such as disk and CPUutilization and backlog of files accumulating on the configurednodes. You can also view the number of devices, shares or sitecollections assigned to each configured node. It is recommendedthat you assign a node on which the resource utilization is low.
4 Click Select to assign the Indexer to the Box account.
Events and metadata collected from the Box account are processedand stored on the Indexer node.
Indexer
313Configuring monitoring of Box accountsConfiguring monitoring of cloud sources in Data Insight

Table 21-1 Add/Edit Box account options (continued)
DescriptionField
Do the following:
1 Click Authorize. This displays the Box authorization page.
2 Specify the Box administrator credentials that Data Insight usesto gain access to the Box account, and click Authorize.
You can also use a co-admin account to allow Data Insight toaccess the Box account.
See “Using a co-admin account to monitor Box resources”on page 311.
3 Click Grant Access to Box. This step creates an authorizationtoken that is stored as a named credential in the Data Insightconfiguration.
Data Insight can now access the user, folder and file metadata,and the information about the activities performed on these fileand folders.
Authorize access
Select this check box to enable monitoring on the Box account.Enable Boxaccount eventmonitoring
Select the check box to enable Data Insight to scan the Box accountusing the Box Administrator credentials according to the specifiedschedule.
Enable Boxaccount scanning
Select one of the following to define a scanning schedule for shares ofthis Box account:
■ Use Collector's default scanning schedule.■ Use custom schedule.
See “Custom schedule options” on page 254.
Veritas Data Insight periodically scans the Box account to obtain filemetadata and security descriptors. Each Collector worker node bydefault initiates a full scan of shares at 7:00 P.M. on the last Friday ofeach month.
Scanning schedulefor full scans
314Configuring monitoring of Box accountsConfiguring monitoring of cloud sources in Data Insight

Configuring Box cloud resources through proxyserver
To connect to box cloud resource over the Internet through proxy server, use thefollowing steps:
To configure the proxy settings:
◆ Create a proxy.properties file and place it underC:\DataInsight\data\console\cloud on the Management server andCollector node of the configured Box account.
Note: If the folder cloud is not present, create it manually.
The fields in proxy properties file are:
■ proxy .ip = <IP address of the proxy server>
■ proxy .port = 8080
■ proxy .scheme = HTTP
■ proxy .user = username
■ proxy .password = password
Note: You can provide a plain text password or an encrypted one.
■ proxy .authT ype = NTLM
Note: In case port or authT ype are not applicable, leave them blank.
315Configuring monitoring of Box accountsConfiguring Box cloud resources through proxy server

Configuring OneDriveaccount monitoring
This chapter includes the following topics:
■ About configuring OneDrive monitoring
■ Registering Data Insight with Microsoft to enable OneDrive account monitoring
■ Configuring user impersonation in Office 365
■ Add/Edit OneDrive account
■ Adding OneDrive user accounts
About configuring OneDrive monitoringData Insight monitors Microsoft OneDrive cloud accounts to provide informationabout who owns the data, who is performing activity on the data, and what datashould it be archived or deleted. OneDrive uses the Open Authorization 2 (OAuth2)protocol to permit access to a third-party application.
Data Insight scans the OneDrive account for metadata such as path of the file orfolder, created by, modified by, modified date, and also fetches audit events for theOneDrive user accounts. Note that Data Insight does not fetch permissions forOneDrive accounts.
In the Data Insight configuration, the OneDrive tenant account (your organization'sOneDrive account) corresponds to a file server and the individual user accountscorrespond to shares on a filer. To scan the OneDrive tenant account and theunderlying user accounts, Data Insight uses the access token provided by theOneDrive app. To get the access token from the app, you must provide thecredentials of an Office 365 global administrator privileges on the redirect URLpage.
22Chapter

Prerequisites for configuringOneDrive accountmonitoringBefore you configure OneDrive monitoring in Data Insight, complete the followingprerequisites:
Table 22-1
How toPrerequisite
See “Registering Data Insight with Microsoft to enableOneDrive account monitoring” on page 320.
Create an app and register itwith Microsoft to enablecommunication between DataInsight and the OneDriveaccount.
Do the following:
1 Log in to Microsoft Office365 Admin Center usingglobal Administrator credentials.
2 Navigate to Office365 > Admin Center > Users.
3 Create a new user with role SharePointAdministrator.
Create credentials in Office 365Admin Center that Data Insightuses to monitor access eventson the OneDrive accounts.
1 In the Office 365 Admin Center, navigate to SecurityandCompliance >Search and investigation >Auditlog search.
2 On left-hand panel of the Security & Compliancewizard, expand Search & Investigation, and clickStart recording user and admin activities.
Clicking on this link will start recording user and adminactivities. Note that it takes 24 hours for the audit logsto start appearing on the Audit log search page.
For more information, seehttps://support.office.com/en-us/article/Turn-off-audit-log-search-in-Office-365.
Enable auditing in Office 365Admin Center.
317Configuring OneDrive account monitoringAbout configuring OneDrive monitoring

Table 22-1 (continued)
How toPrerequisite
Do the following:
■ In the Office 365 Admin Center, navigate to Securityand Compliance > Permissions > Add role.
Note: Only an Office 365 Global administrator can login to the Security and Compliance view.
Provide View-Only Audit Logs privilege to the role,and add the user with the SharePoint administrator roleto newly-created role.
■ In the Office 365 Admin Center, navigate to Exchange> Permissions > Add admin role.Ensure that you use the same user credentials with roleas SharePoint administrator.
Create a role with View-onlyaudit log privilege. These usercredentials are used by DataInsight to collect OneDrive auditlogs.
See “Configuring user impersonation in Office 365”on page 322.
Grant permissions to DataInsight to scan a user'sOneDrive account.
See “Configuring Data Insight services” on page 86.The DataInsightOneDriveservice is configured andrunning on the Collector node.This service is responsible forcollecting metadata the auditevents for OneDrive accounts.
Do the following:
■ The proxy_server.properties file contains theproxy settings to connect to your OneDrive account. Itis located in the<InstallDir>\connectors\onedrive folder.
■ Open the properties file in a text editor, and edit thefollowing details:■ Username or domain\username■ Proxy password■ Hostname or IP address of the proxy server■ Port of the proxy server
If your organization requiresinternet connections to passthrough a proxy server, edit theproxy_server.propertiesfile to update the proxy settings.
318Configuring OneDrive account monitoringAbout configuring OneDrive monitoring

Table 22-1 (continued)
How toPrerequisite
In the Windows Control Panel, click Internet Options >Connections > Local Area Network (LAN) Settings.Select Use a proxy server for your LAN and enter the IPof your proxy server.
Run the following command to verify if the proxy settingshave already been configured:
netsh winhttp show proxy
If a proxy server is not configured, you must import thesettings.
To import the proxy settings from Internet Explorer (IE), runthe following command:
netsh winhttp import proxy source=ie
Configure the proxy server inyour LAN settings.
-Ensure that the following URLsare allowed by yourorganization's proxy server andfirewall settings:
https://graph.microsoft.com/
https://login.microsoftonline.com
https://outlook.office365.com
Review the commd, sponline, and onedrive logs in the<InstallDir>/logs folder to troubleshoot the issue.
Ensure that the incoming andoutgoing traffic is routedthrough a single IP and port.
Usually systems with multipleNICs have mismatch inincoming and outgoing IP/Portused. This is important becausethe login request response fromMicrosoft has to be routedthrough the IP/Port configuredin the redirect URL.
In this scenario, Data Insightwill not be able to fetch anyaudit data.
Limitations for OneDrive monitoring in Data InsightThe following Data Insight limitations apply when monitoring OneDrive accounts:
319Configuring OneDrive account monitoringAbout configuring OneDrive monitoring

■ The ability to add OneDrive tenant accounts and user accounts in bulk usingCSV is not supported.
■ Data Insight does not fetch permissions for OneDrive accounts. TheWorkspace> Expand Profile > Permissions tab will be disabled for OneDrive paths (shareequivalent and folders).For this reason, you will also not be able to select configured OneDrive pathswhen creating Permissions reports and Entitlement Review workflows.
■ Scan and audit exclude rules are not supported.
■ Scan errors are not reported on the Scanning dashboard for OneDrive scanfailures. However, the onedrive_connector_service and commd logs willcontain information about these errors and exceptions.
■ You cannot create Data Loss Prevention (DLP) Incident Remediation workflowsand the Records Classification workflows for OneDrive paths.
■ Archive and classify actions for OneDrive paths are not supported.
■ The pause window in the scan schedule does not apply when scanning clouddata sources. On the Settings > Scan Status page, the ability to pause orcancel an in-progress scan job is not available.
■ Certain audit events such as folder create, folder modified, and folder copiesare not fetched for OneDrive accounts. This limitation is observed becauseMicrosoft Office 365 does not support these event types.
■ Audit of OneDrive accounts is not supported on Microsoft 2016 because thePowershell version supported by Data Insight is not compatible with the versionsupported by Microsoft 2016.
Registering Data Insight with Microsoft to enableOneDrive account monitoring
To authorize Data Insight to access the Microsoft OneDrive account, you mustcreate an application for every Data Insight installation and register it with MicrosoftAzure Active Directory. This step involves associating a set of credentials with theapplication and providing the application with the required permissions, whichenables communication between Data Insight and Microsoft. This step also createsan authorization token that is stored as a named credential in the Data Insightconfiguration.
Note: You need a Microsoft account to add an application.
320Configuring OneDrive account monitoringRegistering Data Insight with Microsoft to enable OneDrive account monitoring

To create and register an application with Microsoft
1 Login to https://apps.dev.microsoft.com.
2 Sign-in with your Microsoft account credentials to the Microsoft ApplicationRegistration Portal.
Note: Ensure that you use the credentials of an Office 365 user with MicrosoftGlobal administrator role fo authorizing Data Insight.
3 Click Add an app, and give it a name. The portal assigns your application aunique Application ID.
Make a note of the Application ID. You will need it when configuring theOneDrive account monitoring in Data Insight.
4 Generate an application secret to enable Data Insight to receive the accesstokens required for calling the required APIs.
Click Generate New Password. The password is required when configuringOneDrive account monitoring in Data Insight.
5 Click Platforms, and select Web.
Specify the URL of the Data Insight Management Server. For example,https://<IP address of the Management Server>/oneDrive.
321Configuring OneDrive account monitoringRegistering Data Insight with Microsoft to enable OneDrive account monitoring

6 Assign permissions to the app. Data Insight requires the application to haveat least the following permissions:
7 Click Save.
See “About configuring OneDrive monitoring” on page 316.
Configuring user impersonation in Office 365By default, Office 365 is set up such that the admin does not have access to filesstored in the users’ Office 365 OneDrive Business accounts. In order to allow DataInsight to discover all OneDrive user accounts and subsequently scan thoseaccounts, you must configure impersonation for Office 365 OneDrive Business.
To allow Data Insight to impersonate Office 365 users, do one of the following:
1. Manually configure every user account to grant Data Insight access to thefiles in the account.
In the Office 365 Admin Center, click Users > OneDrive Settings, and selectAccess Files.
2. configure permissions using a PowerShell script.
To configure permissions using a PowerShell script
1 Download and open the OneDriveAccess.ps1 script using a text editor suchas Notepad.
2 Navigate to and edit the following four variables in the script:
322Configuring OneDrive account monitoringConfiguring user impersonation in Office 365

■ $o365login - Replace with your Office 365 service account or administratoraccount username.
■ $o365pw - Replace with your Office 365 service account or administratoraccount password.
■ $spAdminURL - Replace with the same URL used in your organization'sOneDrive URL, with -admin suffix.
■ $spMyURL - Replace with the same URL used in your organization'sOneDrive URL, with -my suffix.
3 Save and close the script.
4 Right-click the installed Management Shell, and click Run as administrator.
5 From the SharePoint Online Management Shell, change your working directoryto the location where you have saved the OneDriveAccess.ps1 script.
6 On the Windows Server, ensure that the execution policy is set toRemoteSigned. This permits running of PowerShell scripts for device discoveryand audit data collection. To configure the policy, start Windows PowerShellas administrator, and run the following commands:
To view the configured execution policy:
Get-ExecutionPolicy
To configure the execution policy to RemoteSigned:
Set-ExecutionPolicy -ExecutionPolicy RemoteSigned -Scope
LocalMachine
7 Run the following command to run the OneDriveAccess.ps1 script:.\OneDriveAccess.ps1
8 Press Enter to exit.
Add/Edit OneDrive accountYou must add the OneDrive account that you want to monitor to the Data Insightconfiguration.
See “Configuring monitoring of cloud sources in Data Insight” on page 312.
Use this dialog box to add a new OneDrive account to Data Insight or to edit theconfiguration of an existing OneDrive account.
323Configuring OneDrive account monitoringAdd/Edit OneDrive account

Table 22-2 Add/Edit OneDrive account options
DescriptionField
This is a free-form field. Enter a name that Data Insight uses to identifyyour OneDrive account. The name that you enter in this field representsthe name of the OneDrive tenant account.
MicrosoftOneDrive accountname
Do the following:
1 Click Select Collector.
2 The Select Collector pop-up displays the configured collectorsthat are available for selection.
3 Review the performance parameters such as disk and CPUutilization and backlog of files accumulating on the configurednodes. It is recommended that you assign a node on which theresource utilization is low.
4 Click Select to assign the Collector to the OneDrive account.
Data Insight connects to the OneDrive application from this server.
Collector
Do the following:
1 Click Select Indexer.
2 The Select Indexer pop-up displays the configured indexers thatare available for selection.
3 Review the performance parameters such as disk and CPUutilization and backlog of files accumulating on the configurednodes. You can also view the number of devices, shares or sitecollections assigned to each configured node. It is recommendedthat you assign a node on which the resource utilization is low.
4 Click Select to assign the Indexer to the OneDrive account.
Events and metadata collected from the OneDrive account areprocessed and stored on the Indexer node.
Indexer
The client ID is the unique application ID assigned when you createand register an app with Microsoft.
Follow the procedure described in the following topic to get these details:
See “Registering Data Insight with Microsoft to enable OneDrive accountmonitoring” on page 320.
Client ID
Client Secret Key
324Configuring OneDrive account monitoringAdd/Edit OneDrive account

Table 22-2 Add/Edit OneDrive account options (continued)
DescriptionField
Do the following:
1 ClickAuthorize. This invokes the application authorized to accessthe OneDrive account. .
Note: Ensure that you use the credentials of a Office 365 userwith Microsoft Global administrator role fo authorizing Data Insight.
This step creates an authorization token that is stored as a namedcredential in the Data Insight configuration. You will be redirectedto the Data Insight console to complete the rest of the configuration.
2 Data Insight can now access the user, folder and file metadataand the information about the activities performed on these fileand folders. .
Authorize access
Select the check box to automatically discover all user accounts thatare part of the OneDrive account.
Clear the check box to add cloud user accounts manually. You can dothis from the OneDrive account details page.
Discovery of cloud user accounts takes place as soon as you add anew user account and then twice each day at 2:00 A.M. and 2:00 P.M.
You can also add user accounts manually from Settings > OneDriveaccount > Monitored cloud accounts page.
Discover cloudaccountsautomatically
Enter the details of the cloud user accounts which should not be includedduring discovery. This option is available when you select Discovercloud accounts automatically check box. Specify comma separatedpatterns that you want to ignore. Patterns can have 0 or more wildcard* characters.
Exclude followingcloud accountsfrom discovery
Select this check box to enable event monitoring on the OneDriveaccount. You must manually enable auditing in the Office 365 AdminCenter to enable Data Insight to collect audit logs for the OneDriveaccount.
From the OneDrive Credentials drop-down, select the credentials of auser with SharePoint administrator role which has been assigned theView-Only Audit Logs and Audit Logs privilege.
Note: The user used for auditing of the OneDrive account should beset to [email protected] instead of DOMAIN\username.Microsoft supports the User Principal Name (UPN) for connecting to aremote Exchange server.
See “About configuring OneDrive monitoring” on page 316.
Enable MicrosoftOneDrive accountevent monitoring
325Configuring OneDrive account monitoringAdd/Edit OneDrive account

Table 22-2 Add/Edit OneDrive account options (continued)
DescriptionField
Select the check box to enable Data Insight to scan the OneDriveaccount using the SharePoint Administrator credentials according tothe specified schedule.
Select Scan newly added cloud accounts immediately to scan newlyadded OneDrive user accounts immediately instead of waiting for thenormal scan schedule. Scanning will still proceed only when scanningis permitted on the Collector node.
Enable MicrosoftOneDrive accountscanning
Select one of the following to define a scanning schedule for shares ofthis OneDrive account:
■ Use Collector's default scanning schedule.■ Use custom schedule.
See “Custom schedule options” on page 254.
Veritas Data Insight periodically scans the OneDrive account to obtainfile metadata and security descriptors. Each Collector worker node bydefault initiates a full scan of shares at 7:00 P.M. on the last Friday ofeach month.
Scanning schedulefor full scans
Adding OneDrive user accountsAll licensed user accounts on a Microsoft OneDrive tenant are added to the DataInsight configuration when you add the tenant account to Data Insight. Note thatonly those users who have logged in at least once in their OneDrive account arediscovered by Data Insight.
You must add user accounts that are part of the tenant account manually if you donot select the Discover cloud accounts automatically option when adding atenant account.
Note: Data Insight disables addition of OneDrive user accounts if you do not havea valid cloud license or if your license has expired. Also, Data Insight will not discovernew user accounts that have been added after the expiry of the license.
To add a user account
1 In the Console, click Settings > Cloud Sources.
2 To add user accounts under a tenant account, do one of the following:
326Configuring OneDrive account monitoringAdding OneDrive user accounts

■ On the Cloud Sources list page, select the OneDrive account from whichyou want to add the user accounts.
■ On the Cloud Sources list page, click a configured OneDrive account. Onthe Details page, click Monitored Cloud Accounts.
3 On theMonitored Cloud Accounts list page, clickAdd NewCloud Account.
4 On the Add Cloud Account pop-up, enter the properties for the user account,and click Save.
Add/edit OneDrive user accountsUse this dialog box to add a new OneDrive user account from a configured MicrosoftOneDrive account or to edit the configuration of a user account that is currentlybeing monitored by Data Insight.
Table 22-3 Add/Edit cloud account options
DescriptionField
The drop-down displays the the list of discovered cloud accounts,for example, [email protected]. Select the cloudaccount that you want to monitor.
Cloud Account Name
Select one of the following to define a scanning schedule for theuser account:
■ Use cloud source's scanning schedule■ Define custom scanning schedule
From the drop-down, select the appropriate frequency.
Data Insight periodically scans user accounts to obtain metadata.Each Collector worker node by default initiates a full scan of theOneDrive account at 11:00 P.M. each night.
Scanning schedule
Select to preserve the activity information on the user account.Selecting this option disables the deletion or archiving of accessevent information on the user account.
Enable legal hold for thiscloud account
327Configuring OneDrive account monitoringAdding OneDrive user accounts

Managing cloud sourcesThis chapter includes the following topics:
■ Viewing configured cloud sources
■ Managing cloud sources
Viewing configured cloud sourcesIn the Management Console, you can view all the cloud data sources that DataInsight is configured to monitor.
Use the provided dynamic search filter to search for configured cloud storageaccounts based on various predefined criteria, for example, the type of the cloudstorage. You can also use the Filter field at the top of the content pane to filter thelist of cloud storage based on the name of the account in addition to the pre-definedfilter criteria. The displayed list of configured accounts changes automatically whenyou select the check box for a filter criteria. For instance, when you select a Collectornode in the By Collector filter, Data Insight displays a list of accounts associatedwith the selected Collector node.
To view configured cloud data sources
1 In the Console, click Settings > Cloud Sources.
The screen displays the list of configured cloud storage accounts.
2 Review the following information about the cloud sources:
■ The object ID of the cloud source. This numerical value is used to identifythe cloud account when troubleshooting issues with it. This column is hiddenby default. To view this column, click on the column header and selectColumns > ID.
23Chapter

■ The name of the cloud storage account. In the case of a Box account, thename represents a share in the Box account. In case of a OneDrive account,the name represents the OneDrive tenant account.
■ The health of the cloud data source.
■ Whether event monitoring is enabled for the cloud source. This statusdecides the scanning and event monitoring of user accounts.
■ The Collector node for the cloud storage account.
■ The Indexer node associated with the cloud source.
■ The scanning schedule for the cloud storage account. This column is hiddenby default.
3 You can change Indexer for the cloud storage account.
See “About migrating storage devices across Indexers” on page 112.
To migrate to another Indexer, do the following:
■ Click Select Indexer.
■ The Select Indexer pop-up displays the configured indexers that areavailable for selection.
■ Review the performance parameters such as disk and CPU utilization andbacklog of files accumulating on the configured nodes. You can also viewthe number of devices, shares or site collections assigned to each configurednode. It is recommended that you assign a node on which the resourceutilization is low.
■ Click Select to assign the Indexer to the filer.When the migration starts, click View Details to view the progress of themigration.
To review cloud storage account details
1 In the Console, click Settings > Cloud Sources.
2 Click the configured account that you want to review, or click the Select Actiondrop-down and select View.
The details screen appears.
329Managing cloud sourcesViewing configured cloud sources

To view events for the cloud storage account
1 In the Management Console, click Settings > Cloud Source.
2 Click the Select Action drop-down for the corresponding cloud source in thelisting table, and select Event Log.
The event log for that cloud account appears.
3 To download Data Insight logs for the cloud storage account for troubleshootingpurposes, click the Select Action drop-down for the corresponding account,and select Download Logs.
Data Insight downloads a compressed folder containing the logs related to thisaccount from all relevant Data Insight servers.
See “Downloading Data Insight logs” on page 455.
See “Managing cloud sources” on page 330.
Managing cloud sourcesOn the cloud sources details page, you can view information about a configuredstorage account, edit the account's configuration, delete the account, and disablethe account.
The Configuration tab on the cloud source details page displays the followinginformation about the cloud source:
■ The type of cloud source. At this time, Data Insight supports monitoring of Boxand Microsoft OneDrive accounts.
■ The name of the cloud data source.
■ The account credentials of the user authorized to log in to the cloud account.Note that this information is not displayed for OneDrive cloud accounts.
■ The IP address or hostname of the Collector worker node configured to scanthe storage account.
■ Whether event monitoring is enabled.
■ The scanning schedule.
To review the account details
1 In the Console, click Settings > Cloud Sources.
2 Click the cloud storage account that you want to review.
The details page for the cloud account appears.
You can edit the configuration of the cloud source.
330Managing cloud sourcesManaging cloud sources

To edit a cloud data source
1 To edit the account configuration, on the account details page, click Edit.
2 On the Edit account page, make the necessary configuration changes.
3 Click Save.
To delete or disable a cloud data source or a user account
1 On the Cloud Sources list page, click the Select Action drop-down for thecloud account that you want to delete or disable, and click Delete or Disable.
Or, click the cloud source, and on the account details page, click Delete orDisable, as the case may be.
2 Click OK on the confirmation message.
3 To delete or disable a monitored user account under a Microsoft OneDriveaccount, on the Cloud Sources details page, click the OneDrive account.
Select the user account that you want to delete or disable, and click OK on theconfirmation message.
331Managing cloud sourcesManaging cloud sources

Configuring ECM datasources
■ Chapter 24. Configuring Documentum data source
6Section

Configuring Documentumdata source
This chapter includes the following topics:
■ About Documentum device monitoring
■ Credentials required for configuring Documentum devices
■ Configuring Documentum monitoring in Data Insight
■ Managing ECM Sources
■ Adding repositories
■ Managing repositories
About Documentum device monitoringOpenText Documentum is a centralized content management system that offersease of management and flexible control over the content. Data Insight supportsmonitoring of Documentum data sources by providing the discovery and scanningcapabilities.
Data Insight interacts with Documentum data sources (devices) that exists acrossmultiple enterprise content management (ECM) systems such as OpentTextDocumentum, OpentText, IBM Filenet etc. It gains access to the device byimpersonating a user with the role as Administrator. This account authorizes DataInsight to access the Documentum device and extract the metadata from therepositories that are pulled using CMIS API. Using CMIS APIs, Data Insight discoversthe repositories in your Documentum content server, scans the cabinets, folders,and files to fetch their metadata.
24Chapter

OpentText Documentum preserves multiple versions of a file. It creates a versionof a file whenever it is checked-out and checked-in. Data Insight emulates thisversioning strategy by preserving versions of the files that reside on a Documentumdevice. You can ascertain the file version from the file name which comprises ofthe version and the extension such as <filename>_<version>.<extension>. Forexample, samplefilename_1.0.extension.
A Documentum device generally maps to a filer in the Data Insight construct. In theDocumentum hierarchy, there are repositories, cabinets and folders or files that areequivalent to shares, and folders or files.
Data Insight scans the Documentum device for metadata such as name of thecabinet or file, or folder, path of the cabinet or file or folder, created at, created by,created on, last modified on, last modified by, and size. Note that Data Insight doesnot collect the access events such as create, write, or file system ACL levelpermission changes.
Before you start configuring Documentum devices, ensure the followingpre-requisites are complete:
■ DataInsightCMIS service is installed on the Collector worker node. Or, else DataInsight prompts you to install the service when configuring a device.See “Configuring Data Insight services” on page 86.
■ The device is accessible from the Collector node using the short name or IPaddress that you plan to use when adding the device.See “Configuring Documentum monitoring in Data Insight” on page 335.
Limitations for Documentum device monitoring in DataInsightThe following limitations apply when monitoring Documentum accounts:
■ The ability to add Documentum devices and repositories in bulk using CSV isnot supported.
■ The test credential feature that is used to validate the network connectivitybetween the Collector and data sources is disabled.
■ Data Insight does not fetch permissions and audit information for Documentumdevice. The Workspace> Expand Profile > Permissions tab will be disabledfor Documentum paths (share equivalent and folders). For this reason, you willalso not be able to select configured Documentum paths when creatingPermissions reports and Entitlement Review workflows.Similarly, the Workspace > Expand Profile > Audit Logs, User Activity,Folder Activity, and Social Network Analysis tabs will be disabled forDocumentum paths.
334Configuring Documentum data sourceAbout Documentum device monitoring

■ Scan and audit exclude rules are not supported. Hence, scan does not fetchthe email address associated with the last modified by and created by users.So, Data Insight may not be able to resolve the users listed on the Workspaceand Reports tab.
■ Scan errors are not reported on the Scanning dashboard for Documentum scanfailures. However, the cmis_connector_service logs and commd logs willcontain information about these errors and exceptions.
■ You cannot create Data Loss Prevention (DLP) Incident Remediation workflowsand the Records Classification workflows for Documentum paths.
■ Archive and classify actions are not supported for Documentum paths.
■ On the Settings > Scan Status page, ability to pause or cancel an in-progressscan job is not available. The jobs that are in the queues can be paused orcanceled.
■ Activity reports are not supported for Documentum devices.
Credentials required for configuringDocumentumdevices
Table 24-1 lists the set of credentials that are required by Veritas Data Insight duringsystem configuration.
Table 24-1 Credentials for configuring for Documentum devices
DetailsCredential
This credential belongs to the Documentum user whohas administrative rights on the Documentum deviceor a domain user who is part of the Administratorsgroup on the device.
Credentials required during deviceconfiguration through the DataInsight Management Console.
Data Insight uses these credentialsfor discovering and scanningrepositories in the device.
Configuring Documentum monitoring in DataInsight
Data Insight scans and collects the metadata of the Documentum account configuredin the Management Console. Each Documentum account is considered as a device.
335Configuring Documentum data sourceCredentials required for configuring Documentum devices

To add a Documentum device
1 In the Console, click Settings > ECM Sources.
The ECM Sources page displays the list of configured data sources.
2 Click the Add New ECM Source drop-down, and select Documentum.
3 On the Add New Documentum Device page, enter the properties for thedevice that you want to monitor, and click Save.
See “Add/Edit Documentum device” on page 336.
Add/Edit Documentum deviceUse this dialog box to add a new Documentum device to Data Insight or to edit theconfiguration of an existing device.
Table 24-2 Add/Edit Documentum device options
DescriptionField
Enter the URL of the Documentum device that you want tomonitor. Typically, the URL is made up of the IP address orhostname of the device. For example:
http://<hostname>/emc-cmis/resources
Documentum Device URL
Do the following:
1 Click Select Collector.
The Select Collector pop-up displays the configuredcollectors that are available for selection.
2 Review the performance parameters such as disk andCPU utilization and backlog of files accumulating onthe configured nodes. It is recommended that youassign a node on which the resource utilization is low.
3 Click Select to assign the Collector to the Documentumdevice.
Data Insight connects to the Documentum device from thisserver.
Collector
336Configuring Documentum data sourceConfiguring Documentum monitoring in Data Insight

Table 24-2 Add/Edit Documentum device options (continued)
DescriptionField
Do the following:
1 Click Select Indexer.
The Select Indexer pop-up displays the configuredindexers that are available for selection.
2 Review the performance parameters such as disk andCPU utilization and backlog of files accumulating onthe configured nodes. You can also view the numberof devices and repositories assigned to each configurednode. It is recommended that you assign a node onwhich the resource utilization is low.
3 Click Select to assign the Indexer to the Documentumdevice.
Events and metadata collected from the Documentum deviceare processed and stored on the Indexer node.
Indexer
Select Discover repositories automatically to allow DataInsight to automatically discover repositories when aDocumentum device is added.
Discovery of repositories happens twice each day at 2:00A.M. and 2:00 P.M.
Discover repositoriesautomatically
Select the check box to prevent Data Insight from discoveringthe specified repositories.
Specify comma-separated patterns that you want Data Insightto ignore. Patterns can have 0 or more wildcard * characters.For example,
myRepo,testRepo1, and others.
Exclude repositories fromdiscovery
Select the check box to enable scanning of the devicedepending on the configured schedule.
Enable Device Scanning
Select one of the following to define a scanning schedule forrepositories of this device:
■ Use collector's default scanning schedule■ Use custom schedule
From the drop-down, select the scan frequency asrequired.See “Custom schedule options” on page 254.
Scanning schedule for fullscans
337Configuring Documentum data sourceConfiguring Documentum monitoring in Data Insight

Table 24-2 Add/Edit Documentum device options (continued)
DescriptionField
Select this option to scan newly added repositories instantly,instead of waiting for the configured scan schedule. Notethat a scan can run only when scanning is permitted on theCollector node.
Scan newly addedrepositories automatically
Managing ECM SourcesYou can view the configuration details about the ECM data sources from theManagement Console. The details include the number of repositories monitored,a visual representation of the health status of the device along with the appropriateremediation action, and so on. From the Management Console, you can also amendthe previous configurations to suit your present needs, such as reset the scanschedule, delete devices that you no longer want to monitor, or disable discoveryof repositories that are deleted from the device.
To view the configured devices
1 In the Console, click Settings > ECM Sources.
The ECM Sources page displays the list of configured devices.
2 Review the following information about the devices:
■ The object ID of the device. This numerical value is used to identify thedevice when troubleshooting issues with the device. This column is hiddenby default. To view this column, click on the column header and selectColumns > ID.
■ The name of device.
■ The number of repositories monitored in the device.
■ The type of ECM device-Documentum.
■ The health of the device.
■ The repository discovery status. This column is hidden by default.
■ The enabled or disabled status of the repository. This column is hidden bydefault.
■ The IP address of the Collector node assigned to the device.
■ The IP address of the Indexer node assigned to the device.
338Configuring Documentum data sourceManaging ECM Sources

■ The scanning schedule for the device. This column is hidden by default.
3 Click the Export icon at the bottom of the page to save the data representedon the ECM Sources page to a .csv file.
From the ECM Sources page, you can also add a new device, edit the deviceconfiguration, delete the device, and download Data Insight logs from this page.
To review device details
1 In the Console, click Settings > ECM Sources.
2 Click the device that you want to review, or click the Select Action drop-downand select View.
The device details screen appears.
To view device events
1 In the Management Console, click Settings > ECM Sources.
2 Click the Select Action drop-down for the corresponding server in the devicelisting table, and select Event Log.
The event log for that device appears.
3 To download Data Insight logs for the device for troubleshooting purposes,click the Select Action drop-down for the corresponding device, and selectDownload Logs.
Data Insight downloads a compressed folder containing the logs related to thisdevice from all relevant Data Insight servers.
After you add a device to Data Insight, you can edit the device's configuration.
To edit device configuration
1 In the Console, click Settings > ECM Sources to view the list of availabledevices.
2 Select the device whose configuration you want to edit, click the Select Actiondrop-down and select Edit.
3 On the Edit Device screen, make the necessary configuration changes.
4 Click Save.
See “Add/Edit Documentum device” on page 336.
You might want to delete a device when you no longer want Data Insight to monitorthat device.
339Configuring Documentum data sourceManaging ECM Sources

To delete a device
1 In the Console, click Settings > ECM Sources to view the list of availabledevices.
2 Select the device which you want to delete, click the Select Action drop-downand select Delete.
3 Click OK on the confirmation message.
Adding repositoriesWhen configuring a device, if you have not selected the option to automaticallydiscover the repositories in the device then you can manually add them.
To add repositories individually
1 In the Console, click Settings > ECM Sources.
The ECM Sources page displays the list of configured devices.
2 Click the device for which you want to add a repository.
3 On the device details page, click Monitored Repositories.
4 Click Add New Repository.
5 On the Add New Repository screen, select the repositories from thedrop-down.
Note: You cannot manually add a repository. It can only be selected from thediscovered list of repositories.
6 Click Save.
See “Add New/Edit Repository options” on page 340.
Add New/Edit Repository optionsUse this dialog box to add a new repository to Data Insight or to edit the configurationof an existing repository.
Table 24-3 Field Descriptions
DescriptionsField
Select the repository from the drop-down. Note that you cannotmanually add the repository.
Repository Name
340Configuring Documentum data sourceAdding repositories

Table 24-3 Field Descriptions (continued)
DescriptionsField
Select one of the following to define a scanning schedule:
■ Use ECM Source's scanning schedule■ Define custom schedule
From the drop-down, select the appropriate frequency option.
Scanning schedule
Managing repositoriesThe Data Insight Management Console lets you view the repositories discoveredor added to the monitored device and properties of the repository, start anunscheduled scan of the repository, delete the repository, view the event log orscan history of the repository, or download logs for troubleshooting purposes.
Use the provided dynamic search filter to search for configured repositories basedon the name of the repository.
To view the configured repositories
1 In the Console, click Settings > ECM Sources.
2 In the ECM devices summary table, click the device that the repositories area part of.
The screen displays a list of all configured repositories.
3 On the devices details page, click Monitored Repositories.
4 On the repositories listing page, review the following information about theconfigured repositories.
■ The name of the repositories.
■ The scanning schedule for the repositories.
■ The date and time of the last full scan of the repositories.
■ The time this repositories's index was last updated with scan information.After every scan, the index is updated with information about the changesto the folder hierarchy on a repository. This column indicates whether thelast update was successful or has failed. It also indicates number of scanfiles pending for this repository on the Indexer and the number of files thatfailed to be indexed. The files that failed to be indexed, are present in the$data/indexer/err folder on the Indexer. If you do have failed files on theindexer, you can move them from the err folder to the $data/inbox folderand attempt a full scan of the repository.
341Configuring Documentum data sourceManaging repositories

If the scan information again fails to be indexed, contact Veritas support.
■ The status of event monitoring, and scanning for the repositories, whetherenabled or disabled.
5 Click the Export icon at the bottom of the page to save the data on theMonitored Repositories panel to a .csv file.
To edit a repository
1 On the device details page, click Monitored Repositories.
2 Select the repository that you want to edit, and from the Select Actiondrop-down, select Edit.
3 On the Edit repository screen, make the necessary configuration changes.
4 Click Save.
To delete a repository
1 On the device details page, click Monitored Repositories.
2 Select the repository that you want to delete, and from the Select Actiondrop-down, select Delete.
3 Click OK on the confirmation message.
To view the scan history of a repository
1 On the device details page, click Monitored Repositories.
2 Select the repositories for which you want to view the scan history, and fromthe Select Action drop-down, select Scan Status
The scan history for the repository appears.
You can also view the scan history of a repository from the Scan History sub tabof the Scanning dashboard.
342Configuring Documentum data sourceManaging repositories

To view events pertaining to a repository
1 On the device details screen, click Monitored Repositories.
2 Click the Select Action drop-down for the corresponding MonitoredRepositories, and select Event Log.
The event log for that repository appears.
3 To download the logs for the repository, click the Select Action drop-down forthe corresponding repository, and select Download Logs.
Data Insight downloads a compressed folder containing the logs for thisrepository from all relevant Data Insight servers.
See “Viewing the scan status of storage devices” on page 351.
You can also view the scan history and scan errors for a repository.
See “Viewing scan errors ” on page 360.
To scan repositories in a batch
1 On the Monitored repositories tab, select a configured repository, and selectScan from the Select Action drop down corresponding to a repository.
Note: The Scan option is not available for repositories that have been disabled.
2 To scan multiple repositories, select one or more repositories using the checkboxes.
3 Click Scan, and select Scan Selected Records.
Optionally, filter repositories as needed using the filters available on the page.Click Scan, and select Scan Filtered Records.
Note: You can use a command line utility, scancli.exe, to further customizethe scan, view the scan jobs running on a specified node, or display the scanstatus for specified repositories. For details, See scancli.exe on page 434. Youcan also use the Scanning dashboard view to scan devices and repositoriesbased on more granular criteria.
343Configuring Documentum data sourceManaging repositories

To enable or disable repositories
1 On the device details screen, click Monitored Repositories.
2 Click the Action drop-down corresponding to a repository, and select Enableto enable a repository that has been disabled.
3 Click the Action drop-down corresponding to a repository, and select Disableto disable a repository.
To delete a repository
1 On the repository details page, under Monitored Repositories, select therepository that you want to delete.
2 Click the Select Action drop-down and select Delete.
3 Click OK on the confirmation message.
344Configuring Documentum data sourceManaging repositories

Health and monitoring
■ Chapter 25. Using Veritas Data Insight dashboards
■ Chapter 26. Monitoring Data Insight
7Section

Using Veritas Data Insightdashboards
This chapter includes the following topics:
■ Viewing the system health overview
■ Viewing the scanning overview
■ Viewing the scan status of storage devices
■ Viewing the scan history of storage devices
Viewing the system health overviewThe System Overview dashboard is available under Settings > Health &Monitoring > System Overview provides a snapshot of the health of your entireenvironment.
Use the System Overview dashboard to do the following:
■ Identify the issues that need immediate attention.
■ Identify any global setting that is yet to be configured. For example, Data Insightflags if settings such as permission remediaton, Exclude Rules, SMTP, orScanning and Event Monitoring are not configured.
■ Review the count of inventory objects and their states.
■ Check the scan status of all configured objects in your environment.
■ Review the count of issues or potential issues with the configured productservers, directory servers, and storage devices.
The System Overview dashboard flags all potential issues. Use the link next to anotification or click the arrow icon next to a notification to navigate the relevant
25Chapter

object's list page. This enables you to view further details and to troubleshoot theissue.
The dashboard contains the following widgets:
The Servers pie chart displays the graphical representation of thetotal number of Data Insight servers that are in the Faulted, At Risk,Unknown, and Healthy state.
The widget also provides an overview of the following:
■ Inventory count of the number of Collectors, Indexers,Self-Service Portal nodes, and Windows File Server agents inyour environment.Click a server type to view the filtered list for the selected servertype on the Settings > Data Insight Servers page.ClickMore details to view the entire list of configured Data Insightservers.
■ The notifications and warnings that indicate the reasons for thehealth status of the configured nodes.See “Managing Data Insight product servers” on page 75. formore information about the factors that affect the health of anode.
■ Click Add Server to navigate to the Add New Server page.See “Adding a new Data Insight server” on page 74.
Data Insight servers
347Using Veritas Data Insight dashboardsViewing the system health overview

The Scanning graph displays a color bar chart representing thenumber of scans during the last 7 days from the current date.
The color bar chart represents the different states of the scans-Failed [Red]; Successful [Green]; and Partially successful [Yellow].
On the Scanning chart, you can also view the following data:
■ An overview of the consolidated scan status of all configuredshares or site collections based on the latest scans that havetaken place on these shares and site collections.Click on a consolidated status to view its details on the Settings> Scan Status > Overview tab.
■ Notifications pertaining to the state of scanning and related alertsand warnings.For example, if scanning for a device is disabled, the dashboarddisplays the notification. It also provides you a link to navigate tothe Scanning and Event Monitoring page to change the stateof scanning.
Click Global Scan Settings to configure the scan settings.
See “Configuring scanning and event monitoring ” on page 32.
See “Viewing the scanning overview” on page 349.
See “Viewing the scan status of storage devices” on page 351.
See “Viewing the scan history of storage devices” on page 353.
See “Viewing in-progress scans” on page 85.
Scanning
348Using Veritas Data Insight dashboardsViewing the system health overview

The Devices pie chart provides a snapshot view of the number ofstorage devices in the Faulted, At Risk, Unknown, and Healthy states.
To the right of the chart, you can view the following data:
■ Inventory of filers, SharePoint data sources, ECM data sources,and cloud sources that are being monitored by Data Insight.Click a device type to view the filtered list of configured devicesof that type on the Settings > Filers, Settings > SharePointSources, Settings > Cloud Sources, or Settings > ECMsources page.
■ Alerts associated with the storage devices that indicate the status,error conditions, and warnings that can help when troubleshootingissues with the device.
■ Click Add Device, and select the device type to navigate to theconfiguration page for that device.See “Adding filers” on page 224.See “Adding web applications” on page 277.See “Configuring monitoring of cloud sources in Data Insight”on page 312.See “Adding SharePoint Online accounts ” on page 297.See “Configuring Documentum monitoring in Data Insight”on page 335.
Devices
The directory services widget provides an inventory count of theconfigured directory services. The widget also displays informationand alert notifications associated with the directory services.
Click Add Directory Service , and select the directory service typeto navigate to the corresponding configuration page.
See “Adding a directory service domain to Data Insight” on page 119.
Directory services
See “Viewing events ” on page 354.
Viewing the scanning overviewThe Scan Status dashboard displays the scanning statistics for the configuredstorage devices. It enables you to quickly and visually evaluate the status of thescans running in your environment. The Scanning dashboard displays the followingcharts that show the various aspects of the scan statistics:
349Using Veritas Data Insight dashboardsViewing the scanning overview

The pie chart provides a summary of the consolidated status of allscans on configured shares and site collections in percentage terms.
The consolidated status represents the combined status of full andincremental scans since the last full scan.
For example, a full scan successfully completes on a share. If thereis subsequent failure of incremental scan on the same share, theconsolidated status of scans for that share is displayed as Failed.Similarly, if a full scan on a share was partially successful, and allincremental scans succeed, the consolidated status stays partial.The consolidated status essentially indicates if any recent scans havefailed for a share or a site collection.
Below the pie chart, you can view the summary of the total failed,successful, and partially successful scans on configured shares orsite collections. Additionally, you may get a summary of scans withthe warning status Needs Attention. You can view the detailedexplanation for such warnings from the Scan status page for thatshare. The summary also displays the number of shares or sitecollections that have never been scanned till date.
Click on an area of the graph to view the filtered list of paths whichhave the selected consolidated status.
Scan Status(Consolidated)
The chart provides a graphical representation of the number of scansduring a specified duration. Use the drop-down to the right of thegraph to select the time period for which you want to view thesummary.
The color bar chart represents the different states of the scans - Failed[Red]; Successful [Green]; and Partially successful [Orange]; for amore visual comparison of the data. In each bar, the number of failed,successful, and partially successful states are indicated by the lengthof the corresponding colors.
Click an area on the bar graph to view detailed information of thescans for the selected scan state on the Scan History sub-tab. Forexample, to display all successful scans, click on the green area ofthe bar graph. You can further narrow the list by using other filterson the Scan History sub-tab.
Scan History
350Using Veritas Data Insight dashboardsViewing the scanning overview

The pie chart provides a high-level overview of the age of lastsuccessful scan for a share or a site collection.
The age of last successful scan represents a consistent state of thescan metadata and comprises of a successful full scan followed byzero or more successful incremental scans. This state helps youdecide if the scan metadata can be used for reporting purposes. Forexample, if the last successful scan for a share is 6 months old, it isrecommended that you run a full scan for that share before yougenerate a report.
In summary, consolidated status indicates if there have been failedscans on a share, which helps you troubleshoot environmental issues.Whereas, the last successful scan indicates how recent and consistentthe scan data is in the Data Insight index.
The chart is rendered for one of the following durations:
■ More than 3 months old■ 3 months old■ One month old■ One week old■ One day old■ None
Clicking an area on the pie chart displays the Scan Status sub-tabwith detailed information of the scans for the selected age. Forexample, clicking on the green area of the pie chart displays theshares or site collections which have a good scan state that is lessthan a day old.
Age of LastSuccessful Scan
Shows all the shares and site collections on which a scan has failedduring the last 24 hours. You may view additional details for the causeof the scan failures such as type of scan that has failed, exit codesetc.
Failed Scans in Last24 Hours
Viewing the scan status of storage devicesThe Scan Status sub-tab of the Settings > Scan Status tab provides an overviewof the status of the scans for all storage devices that are being monitored by DataInsight. The scans include the scans running on the configured data sources, suchas filers, SharePoint sources, and cloud data sources.
Use the Scan Status page to do the following:
■ Review status of the scans on configured storage devices. You can review thestatus of the last full and incremental scans and also list of paths for which thelast scan failed.
351Using Veritas Data Insight dashboardsViewing the scan status of storage devices

■ View the scan history.
■ View the list of paths for which the last scan failed.
■ Filter the list of scans.
■ Start full scans.
Use the provided search filter, to search for scans based on various criteria, forexample, the type of the device. Since it is a dynamic search, the displayed list ofscans changes automatically as you select the check box for a filter criteria. Forinstance, when you select NetApp in the Device Type category, and Successful inthe Scan Status (Consolidated) filter, the application displays a list of NetAppshares which have Successful as the consolidated status. Similarly, when you selecta Collector node in the By Collector filter, Data Insight displays a list of scansrunning on devices associated with the selected Collector node.
To view the scan status
1 Click Settings > Scan Status.
2 The Overview sub- tab displays by default. Do one of the following:
■ Click on the appropriate region of the Scan Status (Consolidated) piechart to filter the scans based on the status of the scans. Or, click on aregion of the Age of Last Successful Scan pie chart to display the list ofshares or site collections with the selected last successful scan.
■ Click the Scan Status sub-tab.
3 The Scan Status sub-tab displays the list of all the shares and site collectionswith colored icons to indicate their consolidated scan status. Use the followingicons to understand the status:
■ Green icon - scan successful.
■ Orange icon - scan partial.
■ Red icon - scan failed.
■ Yellow warning icon - scan needs your attention.
■ Gray icon - scan never happened.
4 Click on a status icon to know more details about the scan status. The scanstatus details pop-up window opens.
The Scan Summary tab displays possible causes, impacts, and solutions incase of scans whose status is either failed, partial, or needs attention.
To start a scan
◆ On the Scan Status page, click Scan.
352Using Veritas Data Insight dashboardsViewing the scan status of storage devices

Do one of the following:
■ Click Scan selected records to scan the selected objects.
■ Click Scan all filtered records to scan all objects that are displayed afterapplying a filter.
See “Viewing the scanning overview” on page 349.
See “Viewing the scan history of storage devices” on page 353.
Viewing the scan history of storage devicesUse the Scan History page to view the history of full and incremental scans of allstorage devices that are being monitored by Data Insight.
Use the provided search filter in the left-side panel, to view the scans based onvarious criteria, for example, the type of entity or the status of the scans. Since itis a dynamic search, the displayed list of scans changes automatically as you selectthe check box for a filter criteria. For example, when you select CIFS in theBy Typecategory and Failed in the By Scan Status category, the application displays a listof failed scans on all configured CIFS shares. You can also use the free-form Filtertext box to enter the search criteria.
To view the scan history
1 Click Settings > Scan Status.
2 The Overview sub-tab displays by default. Do one of the following:
■ Click on the appropriate region of the Scan History chart to filter the scansbased on the status of the scans.
■ On the Scan Status page, click the scan status icon to display the ScanSummary pop-up. Click the Scan History sub-tab
■ From the Scan Status page, click Select Action > Scan Status. Click theScan History sub-tab.
■ Navigate to the share or site collection for which you want to view the scanhistory. See “Managing shares” on page 260. or See “Managing sitecollections” on page 284.
See “Viewing the scanning overview” on page 349.
See “Viewing the scan status of storage devices” on page 351.
353Using Veritas Data Insight dashboardsViewing the scan history of storage devices

Monitoring Data InsightThis chapter includes the following topics:
■ Viewing events
■ About high availability notifications
■ Monitoring the performance of Data Insight servers
■ Configuring email notifications
■ Enabling Windows event logging
■ Viewing scan errors
Viewing eventsYou can monitor Veritas Data Insight recent system events on the Events page.The report displays entries for all system events. These events include the followinginformation about an event:
■ Time
■ Severity
■ Event summary
■ Veritas Data Insight server where the event originated
■ The user if any performing the action
■ The object for which the event originated
26Chapter

To view system events
1 In the Management Console, click Settings > Health & Monitoring > Events.
Do one of the following:
A list of recent system events appears.
23 You can choose to filter the events further using one or all of the following
criteria:
■ By time
■ By any text appearing in the event summary
■ By severity
■ By the product server on which the event originatesEnter the filter criteria in the relevant fields and click Go.
4 Click the Export icon at the bottom of the page to save the data to a .csv file.
About high availability notificationsData Insight raises events for various conditions that might result in a loss ofavailability of a Data Insight system or component. Events are raised for the followingconditions:
■ Changes in the state of various essential services
■ Saturation of the data volume
■ Worker node misses heartbeat with the Management Server
■ Accumulation of excessive files on the worker node
■ Loss of connection between the filers and the Collector
■ Excessive usage of CPU, memory, or disk space for extended period
See “Configuring advanced settings” on page 88.
Monitoring the performance of Data Insightservers
Data Insight enables you to review the performance of the remote Collector andIndexer nodes from the Management Console. You can analyze various performance
355Monitoring Data InsightAbout high availability notifications

parameters, such as the disk and CPU utilization and backlog of files accumulatingon individual server nodes.
Processes running on the Collector node collect information about file and folderhierarchy and access events on storage devices, This information is stored indatabase files with appropriate timestamps, and is periodically processed and sentto the Management Server for the storage device.
Performance alerts are triggered when the resource utilization exceeds the thresholdvalues for multiple scan cycles, and the backlog of files being processed on a nodestarts accumulating. The view enables you to decide whether to reassign or add aCollector, or to make appropriate configuration changes on theAdvanced Settingspage for the server.
See “Configuring advanced settings” on page 88.
To view the performance of the Data Insight servers
1 On the console, click Settings > Performance.
2 The overview list page displays the configured Data Insight servers.
3 From the Processing Backlog drop-down, select the node or the folder forwhich you want to view the performance statistics.
4 Select the period for which you want to view the data.
Data Insight displays the following statistics:
■ The host name of the server node.
■ The size and number of files accumulated on the server.
■ The CPU and memory consumption on the server.
Table 26-1 lists the type of files and their location on server nodes.
Table 26-1 Files and their location on Data Insight servers
CauseLocationServerFile type
Check the throughputrate of thecollector.exeprocess and thenumber of collectorthreads.
<datadir>\collectorCollectorEvent files
356Monitoring Data InsightMonitoring the performance of Data Insight servers

Table 26-1 Files and their location on Data Insight servers (continued)
CauseLocationServerFile type
FileTransferJob islagging.
TheFileTransferJobtransfers the files fromthe outboxof folder onthe Collector to theinboxo folder on theIndexer.
Check the throughputstatistics ofFileTransferJob.
outbox folder on theCollector node or theWindows File Server
Collector, Windows FileServer
Snapshot andaudit files
Check the throughputrate ofidxwriter.exeprocess and thenumber of indexerthreads.
The throughput of theidxwriter.exeprocess in turndepends on the size ofthe batch beingprocessed.
inbox folder on theIndexer node
IndexerSnapshot andaudit files
See “About the Health Audit report” on page 453.
Configuring email notificationsData Insight provides email notifications for important events happening in theproduct. For example, CIFS scan failure or a directory scan failure. Notificationsare sent out every 15 minutes, if new events are available. Email notifications arenot enabled by default.
Note: Before you enable email notifications, you must enable configure the SMTPsettings.
See “Configuring SMTP server settings ” on page 27.
357Monitoring Data InsightConfiguring email notifications

To configure email notifications
1 In the Management Console, click Settings > Global Settings > EventNotifications
2 On the Event Notifications page, select Enable event notifications checkbox.
3 In the Email recipients field, enter a comma separated list of email addressesto be notified.
4 Select the severity of events for which the email notifications must be sent.
5 Click Save.
Enabling Windows event loggingVeritas Data Insight can publish events to the Windows Event log. Events arepublished on the same machine where they originate. Event logging is enabled bydefault.
To configure Windows event logging
1 In the Management Console, click Settings > Global Settings > EventNotifications.
2 Select the Enable Windows logging check box.
3 Select the severity of events for which you want to enable Windows logging.
4 Click Save.
The events published in DataInsightAlerts log adhere to LEEF v 1.0 (Log EventExtended Format. LEEF is a customized event format for IBM QRadar. Here is abrief description of the event format.
Format:
{date} {hostname} LEEF:1.0|Veritas|DataInsight|{product_version}|{eventId}|
attr1=val1\tattr2=val2…
Where,
date : Alert time formatted as MMM dd HH:mm:ss
eventID : <event ID>
The following attributes are populated for each event:
Data Insight policy type (PT_USERCENTRIC /PT_DATACENTRIC / PT_DATACENTRICWL /PT_DATACENTRICBL / PT_RT_DATACENTRIC)
cat
358Monitoring Data InsightEnabling Windows event logging
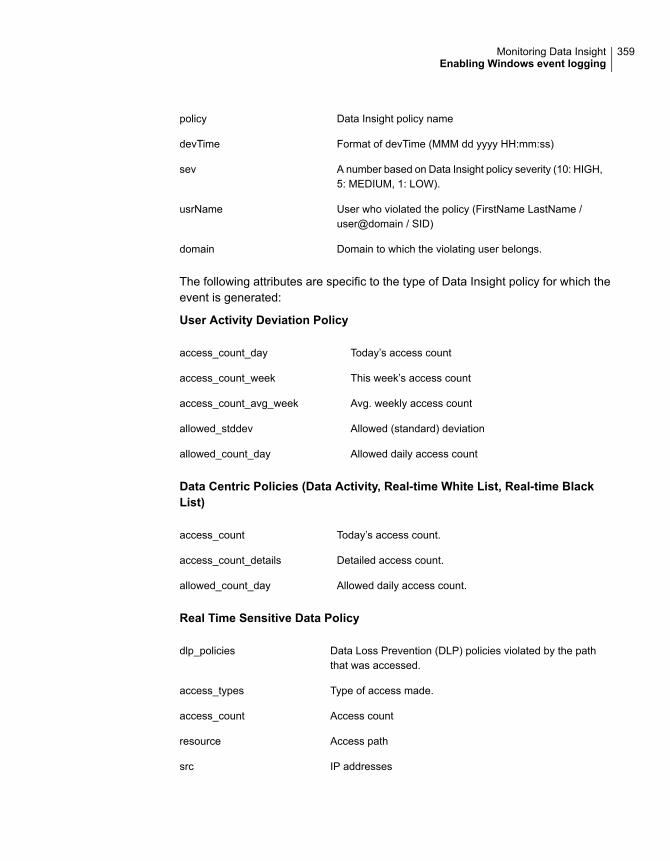
Data Insight policy namepolicy
Format of devTime (MMM dd yyyy HH:mm:ss)devTime
A number based on Data Insight policy severity (10: HIGH,5: MEDIUM, 1: LOW).
sev
User who violated the policy (FirstName LastName /user@domain / SID)
usrName
Domain to which the violating user belongs.domain
The following attributes are specific to the type of Data Insight policy for which theevent is generated:
User Activity Deviation Policy
Today’s access countaccess_count_day
This week’s access countaccess_count_week
Avg. weekly access countaccess_count_avg_week
Allowed (standard) deviationallowed_stddev
Allowed daily access countallowed_count_day
Data Centric Policies (Data Activity, Real-time White List, Real-time BlackList)
Today’s access count.access_count
Detailed access count.access_count_details
Allowed daily access count.allowed_count_day
Real Time Sensitive Data Policy
Data Loss Prevention (DLP) policies violated by the paththat was accessed.
dlp_policies
Type of access made.access_types
Access countaccess_count
Access pathresource
IP addressessrc
359Monitoring Data InsightEnabling Windows event logging

If you do not want certain attributes to be reported into the Event log for privacy orsecurity reasons, the following global attribute can be defined with comma separatedlist of attributes to be excluded:
leef.exclude.attrs=comma separated attr names Global attribute can
be set using following command on MS: configdb.exe -O -J
leef.exclude.attrs -j <attr1,attt2…>
Viewing scan errorsYou can view a list of all the paths on which a scan has failed. In the Workspacetab tree-view panel, the folder icon displays a red cross mark for the paths on whicha scan has failed. The scan errors displayed are from the latest scan completed onthe share.
To view scan errors
1 Do one of the following to view the details of the scan errors on paths:
■ In the Management Console, click Settings > Scanning.The Overview sub-tab of the Scanning dashboard displays the paths onwhich scans have failed in the last 24 hours.
■ On the Scan Status sub-tab of the Scanning dashboard, click the SelectAction drop-down corresponding to a path and select Scan Errors.
■ Navigate to theMonitored Shares,Monitored Site Collections,MonitoredRepositories, or Monitored Cloud Account sub-tab on the data sourcedetails page; click the Select Action drop-down corresponding to a path,and select Scan Errors to view the failed scans on that path.
2 On the Scan Errors page, review the time of the error, the error code, and thepossible cause of the error.
360Monitoring Data InsightViewing scan errors

Alerts and policies
■ Chapter 27. Configuring policies
8Section

Configuring policiesThis chapter includes the following topics:
■ About Data Insight policies
■ Managing policies
■ Managing alerts
About Data Insight policiesA policy is a set of conditions that you configure to monitor access events on filesand folders stored on various repositories. Veritas Data Insight policies help youdetect the sources of threat, access patterns on sensitive data, and anomaloususer behavior. Data Insight classifies files as sensitive based on information receivedfrom Symantec Data Loss Protection (DLP) and based on the content analyticsfrom Veritas Information Classifier. You can also import sensitive file informationin to Data Insight using a CSV file.
See “Configuring Symantec Data Loss Prevention settings” on page 49.
For information about classifying data using Veritas Information Classifier, see theVeritas Data Insight Classification Guide.
Data Insight policies must include at least one condition that is configured to detectabnormal access patterns or user behavior. Data Insight generates an alert wheneverit detects any violation of a condition in a configured policy. Additionally, you canalso configure Data Insight to send email alerts to a select group of recipientswhenever any policy violation is reported. The Real-time Sensitive Data ActivityPolicy, Real-time Data Activity User Whitelist-based policy, and Real-time DataActivity User Blacklist-based policy are evaluated instantaneously whenever thereis a violation. All other (data activity trigger and user activity deviation ) policies areevaluated by default at 12:00 A.M. every night.
27Chapter

Policies can be configured with three severities, namely, high, medium, and low.You can assign the severity level to a policy based on your organizational needs.For example, the Information Security team can define policies to monitor accesseson the share \Finance. For this purpose, they can configure a policy with a mediumseverity to monitor accesses on folders containing Finance policies and guidelinesfiles. Whereas, they can configure a policy with a high severity to monitor accesseson files containing payroll information. When an alert is generated for a policyviolation, the severity of the policy is associated with the alert.
Data Insight comes packaged with the following out-of-the-box policies that youcan configure according to your needs:
■ Data Activity Trigger policyUse this policy to define the maximum cumulative count of the meta operationson the selected paths. For example, if you have defined the maximum accessesper day as 500 on the share \\netapp1\finshare, and the total access countby the active set of users exceeds 500, then Data Insight generates an alert.
■ User Activity Deviation policyUse this policy to define the threshold of deviation from the baseline activity.The baseline activity on a file or folder is the average number of accesses thatare considered normal based on past access counts. If the activity, by theselected users, on the selected data exceeds the specified threshold of thebaseline (for example, three standard deviations above the baseline activity),and the maximum accesses allowed per day, Data Insight generates an alert.You can configure how many standard deviations a user is allowed to deviatefrom the defined baseline.
Note: User Activity Deviation policy is designed at share or filer level and notthe folder or file level.
■ Real-time Data Activity User Whitelist-based policyUse this policy to define a whitelist of users based on the Active Directory customattributes, who can access selected shares or paths. Also, you can create sucha policy with multiple conditions with multiple values for the same customattributes.Whenever the events that violate Real-time Data Activity User Whitelist-basedpolicy are processed by an Indexer node, Data Insight generates alerts and anemail is sent to a configured list of recipients in real-time.
■ Real-time Data Activity User Blacklist-based policyUse this policy to define a blacklist of users based on the Active Directory customattributes, who should not be accessing selected shares or paths. Also, you can
363Configuring policiesAbout Data Insight policies

create such a policy with multiple conditions with multiple values for the samecustom attributes.Whenever the events that violate Real-time Data Activity User Blacklist-basedpolicy are processed by an Indexer node, Data Insight generates alerts and anemail is sent to a configured list of recipients in real-time.
■ Real-time Sensitive Data Activity PolicyUse this policy to trigger real-time alerts when a selected set of users performany access events on the paths that violate configured DLP policies. Wheneverthe events that violate Real-time Sensitive Data Activity Policy are processedby a Collector node, alerts are generated and an email is sent to a configuredlist of recipients.
The policy violations are also published in the Windows Applications and ServicesLogs as DataInsightAlerts events.
You can not configure policies for Documentum paths, because Data Insight doesnot fetch access event information for Documentum paths.
Managing policiesYou can view, edit and delete configured policies, and add new policies to DataInsight from the Policies tab.
To manage policies
1 In the Console, click the Policies tab.
The left pane displays the default policy groups.
2 Click a policy group.
The policy listing page displays the configured policies for that policy group.
3 To edit an existing policy, from the Actions drop-down, click Edit.
4 To delete a policy, select the corresponding check box and click Delete.
To add a new policy
1 In the Console, click the Policies tab.
The left pane displays the default policy groups.
2 Click the policy group that you want to base your policy on.
3 On the policy listing page, click Add new policy. Or in the tree-view panel,right-click the policy type, and select Add.
4 On theAdd new policy page, click each tab and enter the relevant information.
5 Click Save.
364Configuring policiesManaging policies

See “Create Data Activity Trigger policy options” on page 365.
See “Create User Activity Deviation policy options” on page 368.
See “Create Real-time Data Activity User Whitelist-based policy options” on page 370.
See “Create Real-time Data Activity User Blacklist-based policy options” on page 372.
See “Create Real-time Sensitive Data Activity policy options” on page 375.
By default, all policies, except real-time policies, are evaluated at 12:00 A.M. everynight. You can schedule policies to be evaluated more frequently for proof-of-concept(POC) setups. Note that a schedule that is too aggressive can put excessive loadon the Indexer.
You can set a custom schedule to evaluate policies from the Settings tab. Theschedule must be specified in the cron format.
To set a custom schedule for policies
1 Click Settings > Data Insight Servers.
2 Click the entry for the Management Server.
3 On the page for the Management Server node, click Advanced Settings.
4 Click Edit.
5 Scroll to bottom of the page and expand the Set custom properties section.Specify property name to be job.PolicyJob.cron and property value to be thenew schedule. Schedule needs to be specified in cron format
6 In the Property name field, enter job.PolicyJob.cron.
7 In the Property value fields, enter the values as follows:
For example, to evaluate policies every 10minutes, specify value as 0 0/10 * * * ? *.
To evaluate values every N minutes,specify value as 0 0/N * * * ? *.
For example, to evaluate policies everytwo hours, specify value as 0 0 0/2 * * ? *.
To evaluate policies every N hours, specifyvalue as 0 0 0/N * * ? *.
Create Data Activity Trigger policy optionsUse this dialog to create a new Data Activity Trigger policy. Options that are selectedin the respective tabs are displayed in the Summary panel on the right of the page.
365Configuring policiesManaging policies

Table 27-1 Create Data Activity Trigger policy options
DescriptionOption
Enter information in the following fields:
■ Name - The name of the policy.■ Description - A short description of the policy.■ Policy Type - Data Activity Trigger is selected by default.■ Severity - The severity of the policy. From the drop-down,
select High, Medium, or Low.The severity level associated with the policy helps you decidethe possible course of action when an event that matchesthe policy occurs.
Select the Enable Policy check box to enforce the policy.
The policy is not evaluated if the check box is not selected.
Policy Information
Select the following conditions to configure the policy:
■ Select Activity - Select the type of accesses to be monitoredon the selected data set.Select the Meta Access radio button to monitor only thehigh-level access events that Data Insight maps from thedetailed file system and SharePoint access events.Select the Detailed Access radio button to monitor specificfile system and SharePoint access events.
■ Additional Condition - From the Minimum accesses perday for alerts drop-down, select the minimum number ofaccesses on the selected data set on that day that arerequired to trigger an alert.
Configure Policy
366Configuring policiesManaging policies

Table 27-1 Create Data Activity Trigger policy options (continued)
DescriptionOption
Do the following to select the resources:
1 Select the Physical Hierarchy radio button to view theconfigured file servers or SharePoint web applications.
Or select the DFS Hierarchy radio button to view theconfigured DFS paths in a domain.
2 Click a path to select it.
Or you can use a .csv file with information about the pathsthat you want to apply the policy to. Click Browse tonavigate to the location of the .csv file, and click Upload.
3 To limit the scope of the files to be monitored, select Selectall files in folder or Select only sensitive files.
If you select the Select all files in folder option, accesseson all files in the folder are evaluated for determining anyviolation of the policy.
If you select the Select only sensitive files option,accesses on only the sensitive files in the folder areevaluated for determining any violation of the policy.
Note: The list of sensitive files is obtained from SymantecData Loss Prevention or is imported into Data Insight usinga CSV file. The files classified using Veritas InformationClassifier policies are also considered as sensitive for thepurpose of raising alerts.
See “Configuring Symantec Data Loss Prevention settings”on page 49.
4 The selected data set is listed in the Selected resourcespane.
Data Selection
Enter one or more specific email addresses for people to whomyou want to send alerts that are generated for the policy.
Select the Notify custodians check box to send email alerts tothe custodians of the selected paths along with other emailaddresses on the notification list.
Notification
367Configuring policiesManaging policies

Create User Activity Deviation policy optionsUse this dialog to create a new User Activity Deviation policy. Options that areselected in the respective tabs are displayed in the Summary panel on the right ofthe page.
Table 27-2 Create User Activity Deviation policy options
DescriptionOption
Enter the following information:
■ Name - The name of the policy.■ Description - A short description of the policy.■ Type - User Activity Deviation is selected by default.■ Severity - The severity of the policy.
The severity level associated with the policy helps youdecide the possible course of action when an event thatmatches the policy occurs.
Select the Enable Policy check box to enforce the policy.
The policy is not evaluated if the check box is not selected.
Policy Information
Do the following:
1 From the drop-down, select the time range for the baselineactivity. Baseline activity is then computed as the averageaccess in that time range.
From the Threshold Configuration drop-down, selectthe threshold of normal activity.
The threshold is the acceptable number of standarddeviations that a user is allowed to deviate. Accessesabove the defined threshold trigger an alert.
2 Additional Condition - From the drop-down, select theminimum accesses per day per user.
Alerts are raised only if the total accesses exceed theminimum value specified. This prevents Data Insight fromraising too many alerts when baselines are very low.
Configure Policy
368Configuring policiesManaging policies

Table 27-2 Create User Activity Deviation policy options (continued)
DescriptionOption
Do the following to select the resources:
1 Select the Physical Hierarchy radio button to view theconfigured file servers or SharePoint web applications.
2 Click a path to select it.
Or you can use a .csv file with information about thepaths that you want to apply the policy to. Click Browseto navigate to the location of the .csv file, and clickUpload.
The selected data set is listed in the Selected resourcespane.
Data Selection
Do the following:
1 Select theUsers orGroup radio button to view configuredusers or groups respectively.
The list of users and groups is sorted alphabetically. Clickthe star icon to display all the configured users or groups.
You can use the Domain filter search bar to filter usersor groups according to domains.
You can also filter the users according to their ActiveDirectory custom attributes.
2 Click a user or group to select it.
User Selection
Do the following:
1 Click Add Condition.
2 From each of the drop-down menu, select the criteria tobuild the query.
The query is used to select users based on their ActiveDirectory custom attributes.
You can add multiple conditions to an User Activity Deviationpolicy. For evaluating a query, Data Insight uses the logicalAND operation between multiple conditions.
Enter one or more specific email addresses for people to whomyou want to send the alerts that are generated for the policy.
Notification
369Configuring policiesManaging policies

Create Real-time Data Activity User Whitelist-based policy optionsUse this dialog to create a new Real-time Data Activity User Whitelist-based policy.Options selected in the respective tabs are displayed in the Summary panel onthe right of the page.
Table 27-3 Create Real-time Data Activity User Whitelist-based policy options
DescriptionOption
Enter the following information:
■ Name - The name of the policy.■ Description - A short description of the policy.■ Type - Real-time Data Activity User Whitelist-based is
selected by default.■ Severity - The severity of the policy.
The severity level associated with the policy helps youdecide the possible course of action when an event thatmatches the policy occurs.
Select the Enable Policy check box to enforce the policy.
The policy is not evaluated if the check box is not selected.
Policy Information
Select Activity - Select the type of accesses to be monitoredon the selected data set.
Select the Meta Access radio button to monitor only thehigh-level access events that Data Insight maps from thedetailed file system and SharePoint access events.
Select the Detailed Access radio button to monitor specific filesystem and SharePoint access events.
Configure Policy
370Configuring policiesManaging policies

Table 27-3 Create Real-time Data Activity User Whitelist-based policy options(continued)
DescriptionOption
Do the following to select the resources:
1 Select the Physical Hierarchy radio button to view theconfigured file servers or SharePoint web applications.
Or select the DFS Hierarchy radio button to view theconfigured DFS paths in a domain.
2 Click a path to select it.
Or you can use a .csv file with information about the pathsthat you want to apply the policy to. Click Browse tonavigate to the location of the .csv file, and click Upload.
3 To limit the scope of the files to be monitored, select Selectall files in folder or Select only sensitive files
If you select the Select all files in folder option, accesseson all files in the folder are evaluated for determining anyviolation of the policy.
If you select the Select only sensitive files option,accesses on only the sensitive files in the folder areevaluated for determining any violation of the policy.
Note: The list of sensitive files is obtained from SymantecData Loss Prevention or is imported into Data Insight usinga CSV file. The files classified using Veritas InformationClassifier policies are also considered as sensitive for thepurpose of raising alerts.
Alternatively, select All Physical Resources, to select alldata resources, except DFS paths configured in DataInsight. All Physical Resources evaluates all the sensitivefiles, not all the files.
The selected data set is listed in the Selected resourcespane.
Note: Data Insight obtains information about sensitive filesfrom Symantec Data Loss Prevention (DLP) or is imported intoData Insight using a CSV file.
Data Selection
371Configuring policiesManaging policies

Table 27-3 Create Real-time Data Activity User Whitelist-based policy options(continued)
DescriptionOption
Do the following:
1 Click Add Condition.
2 From each of the drop-down menu, select the criteria tobuild the query.
The query is used to select users based on their ActiveDirectory custom attributes.
You can add multiple conditions to a Real-time Data ActivityUser Whitelist-based policy. In case of multiple conditions withsame attributes, the conditions are evaluated with a logical ORoperation. In case of multiple conditions with different attributes,the conditions are evaluated with a logical AND operation.
User attribute query
Enter one or more specific email addresses for people to whomyou want to send alerts that are generated for the policy.
Select the Notify custodians check box to send email alertsto the custodians of the selected paths along with other emailaddresses on the notification list.
Notifications
See “Configuring Symantec Data Loss Prevention settings” on page 49.
Create Real-time Data Activity User Blacklist-based policy optionsUse this dialog to create a new Real-time Data Activity User Blacklist-based policy.Options selected in the respective tabs are displayed in the Summary panel onthe right of the page.
372Configuring policiesManaging policies

Table 27-4 Create Real-time Data Activity User Blacklist-based policy options
DescriptionOption
Enter the following information:
■ Name - The name of the policy.■ Description - A short description of the policy.■ Type - Real-time Data Activity User Blacklist-based is
selected by default.■ Severity - The severity of the policy.
The severity level associated with the policy helps youdecide the possible course of action when an event thatmatches the policy occurs.
Select the Enable Policy check box to enforce the policy.
The policy is not evaluated if the check box is not selected.
Policy Information
Select Activity - Select the type of accesses to be monitoredon the selected data set.
Select the Meta Access radio button to monitor only thehigh-level access events that Data Insight maps from thedetailed file system and SharePoint access events.
Select theDetailed Access radio button to monitor specific filesystem and SharePoint access events.
Configure Policy
373Configuring policiesManaging policies

Table 27-4 Create Real-time Data Activity User Blacklist-based policy options(continued)
DescriptionOption
Do the following to select the resources:
1 Select the Physical Hierarchy radio button to view theconfigured file servers or SharePoint Web applications.
Or select the DFS Hierarchy radio button to view theconfigured DFS paths in a domain. 2
2 Click a path to select it.
Or you can use a .csv file with information about thepaths that you want to apply the policy to. Click Browseto navigate to the location of the .csv file, and clickUpload.
3 To limit the scope of the files to be monitored, selectSelect all files in folder or Select only sensitive files
If you select the Select all files in folder option, accesseson all files in the folder are evaluated for determining anyviolation of the policy.
If you select the Select only sensitive files option,accesses on only the sensitive files in the folder areevaluated for determining any violation of the policy.
Note: The list of sensitive files is obtained from SymantecData Loss Prevention or is imported into Data Insight usinga CSV file. The files classified using Veritas InformationClassifier policies are also considered as sensitive for thepurpose of raising alerts.
Alternatively, select All Physical Resources to select alldata resources, except DFS paths configured in DataInsight. All Physical Resources evaluates all the sensitivefiles, not all the files.
The selected data set is listed in the Selected resourcespane.
Note: Data Insight obtains information about sensitive filesfrom Symantec Data Loss Prevention (DLP) or is imported intoData Insight using a CSV file.
See “Configuring Symantec Data Loss Prevention settings”on page 49.
Data Selection
374Configuring policiesManaging policies

Table 27-4 Create Real-time Data Activity User Blacklist-based policy options(continued)
DescriptionOption
Do the following:
1 Click Add Condition.
2 From each of the drop-down menu, select the criteria tobuild the query.
The query is used to select users based on their ActiveDirectory custom attributes.
You can add multiple conditions to a Real-time Data ActivityUser Blacklist-based policy. In case of multiple conditions withsame attributes, the conditions are evaluated with a logical ORoperation. In case of multiple conditions with different attributes,the conditions are evaluated with a logical AND operation.
User attribute query
Enter one or more specific email addresses for people to whomyou want to send alerts that are generated for the policy.
Select the Notify custodians check box to send email alertsto the custodians of the selected paths along with other emailaddresses on the notification list.
Notifications
See “Configuring Symantec Data Loss Prevention settings” on page 49.
Create Real-time Sensitive Data Activity policy optionsUse this dialog to create a new Real-time Sensitive Data Activity policy. Optionsselected in the respective tabs are displayed in the Summary panel on the right ofthe page.
375Configuring policiesManaging policies

Table 27-5 Create Real-time Sensitive Data Activity policy options
DescriptionOption
Enter the following information:
■ Name - The name of the policy.■ Description - A short description of the policy.■ Type - Real-time Sensitive Data Activity policy is selected by default.■ Severity - The severity of the policy.
The severity level associated with the policy helps you decide thepossible course of action when an event that matches the policyoccurs.
Select the Enable Policy check box to enforce the policy.
The policy is not evaluated if the check box is not selected.
Policy Information
Select Activity - Select the type of accesses to be monitored on theselected data set.
Select the Meta Access radio button to monitor only the high-levelaccess events that Data Insight maps from the detailed file system andSharePoint access events.
Select the Detailed Access radio button to monitor specific file systemand SharePoint access events.
From the DLP Policies violated drop-down list, select a set of DLPpolicies to be considered for alerting.
Configure Policy
Use this tab to directly select the users.
Do the following:
1 Select the Users or Group radio button to view configured usersor groups respectively.
The list of users and groups is sorted alphabetically.
You can use the Domain filter search bar to filter users or groupsaccording to domains.
You can also filter the users according to their Active Directorycustom attributes.
2 Click a user or group to select it.
User Selection
376Configuring policiesManaging policies

Table 27-5 Create Real-time Sensitive Data Activity policy options (continued)
DescriptionOption
You can also select users by using the attribute query.
Do the following:
1 Click Add Condition.
2 From each drop-down menu, select the criteria to build the query.
The query is used to select users based on their Active Directorycustom attributes.
You can add multiple conditions. For evaluating a query, Data Insightuses the logical AND operation between multiple conditions.
User SelectionUsing Attributes
Select the users you want to exclude from the policy. Any activityperformed by these users will be ignored and will not be used to triggeran alert.
Use this tab to directly select the excluded users.
Do the following:
1 Select the Users or Group radio button to view configured usersor groups respectively.
The list of users and groups is sorted alphabetically.
You can use the Domain filter search bar to filter users or groupsaccording to domains.
You can also filter the users according to their Active Directorycustom attributes.
2 Click a user or group to select it.
User Exclusion
You can also exclude users by using the attribute query.
Do the following:
1 Click Add Condition.
2 From each of the drop-down menu, select the criteria to build thequery.
The query is used to select users based on their Active Directorycustom attributes.
You can add multiple conditions. For evaluating a query, Data Insightuses the logical AND operation between multiple conditions.
User ExclusionUsing Attributes
Enter one or more specific email addresses for people to whom youwant to send the alerts that are generated for the policy.
Notification
377Configuring policiesManaging policies

Managing alertsAn alert is a signal generated by a policy when the condition specified in the policyis violated.
You can view alerts on the Alerts tab on the Management Console.
To manage alerts
1 In the Console, click the Policies tab.
The Alerts tab display by default. On the tab, you can view all the alerts thatwere generated by Data Insight.
2 In the Alerts Summary, click the drop-down arrow on any column header andselect Columns. Then, select the parameters you want to show or hide. Youcan sort by:
■ The name of the policy.
■ The severity of the alert.
■ The type of policy associated with the alert - Data Activity Trigger, UserActivity Deviation, Real-time Data Activity User Whitelist-based, Real-timeData Activity User Blacklist-based, or Real-time Sensitive Data Activity.
■ The name of the user account that violated the policy.
■ The date on which the alert was generated.
■ The resolution, if any, taken in response to the alert.
3 To send alerts in email, select the alerts and click Send Email.
4 Enter the email addresses and click Send.
5 To enter the resolution for an alert, select the alert, click in the Resolutioncolumn for the alert and type in the resolution.
To update the resolution for multiple alerts, select the alerts and click UpdateResolution at the top of the summary table.
The events published in the DataInsightAlerts log adhere to LEEF v 1.0 (LogEvent Extended Format. LEEF is a customized event format for IBM QRadar.
See “Enabling Windows event logging” on page 358.
378Configuring policiesManaging alerts

To delete alerts
◆ To delete an alert, select an alert and click Delete.
To delete alerts by severity, click Delete and select the severity. This deletesall alerts that match the selected severity.
To delete alerts older than a certain date, click Delete and select the date atthe top of the table.
Note: You can configure automatic deletion of alerts older than the specifiedinterval on the Data Retention screen. However, you cannot restore the alertsonce they are deleted. Alerts are also automatically published to the Windowsevent log.
See “Configuring data retention settings” on page 43.
Review the Risk Dossier to know the alerts raised in response to the policies violatedby a specific user.
379Configuring policiesManaging alerts

Remediation
■ Chapter 28. Configuring remediation settings
9Section

Configuring remediationsettings
This chapter includes the following topics:
■ About configuring permission remediation
■ About managing data
■ About configuring archive options for Enterprise Vault
■ About deleting files from CIFS devices
■ Viewing and managing the status of an operation
About configuring permission remediationData Insight provides permission recommendations on paths based on activity onthe paths. To fine tune these recommendations and take action on therecommendations, the Data Insight administrator must enable and configurepermission remediation. Depending on your organization process, you can configureData Insight in any of the following two ways:
■ Raise a remediation ticket.Configure when you have a ticketing system, which can assign tickets to relevantstakeholders. The recipients are responsible for the actual implementation ofthe recommendation. You can create remediation tickets by using one of thefollowing two ways:
■ By sending an email to the ticketing system.Use this option if you have a ticketing system which can create a ticket byreading an email.
■ By executing a custom script.
28Chapter

Use this option if you have an alternate mechanism of creating a ticket.The scripts can be created in the .exe, .bat, .pl, or .vbs formats.
■ Apply changes by invoking custom scripts.Configure custom scripts to enable Data Insight to directly apply therecommended changes.You can use the following types as custom scripts,.exe, .bat, .pl, or .vbs.
You can view the status of remediation actions on the Settings > Action Statustab of the Data Insight Management Console.
For information about custom scripts, see the Veritas Data Insight Programmer'sReference Guide.
Note: Permission remediation is not supported for SharePoint Online, MicrosoftOneDrive, and Documentum because Data Insight does not fetch permissions datafor these data sources.
See “Viewing and managing the status of an operation” on page 393.
Managing and configuring permission remediationYou can configure Data Insight to handle the way it implements the recommendedpermission changes. You must have a Data Insight Server Administrator role to beable to configure the permission settings.
To enable permission remediation
1 From the Data Insight Management Console, click Settings > Permissions.The Remediation sub-tab opens by default.
2 Click Edit. The page expands to display the configuration for permissionremediation.
3 Select Enable Permission Remediation.
To configure remediation for raising a ticket
1 From the Data Insight Management Console, click Settings > Permissions.The Remediation sub-tab opens by default.
2 Click Edit. The page expands to display the configuration for permissionremediation.
Select Enable Permission Remediation, if it is not already enabled.
3 Select Raise a ticket. The panel expands to display the configuration details.
4 Select either of the two options:
382Configuring remediation settingsAbout configuring permission remediation

■ Send email - Select to configure settings for an email-based ticketingsystem.
■ Use custom action - Select to configure settings for a non-email basedticketing system.
5 If you selected the Send email option, provide the relevant information in theemail template:
■ The email ID of the sender
■ The email IDs of the recipients
■ The email IDs of other recipients
■ The subject line
■ The header line showing priority and the queue status. The headers canbe set to have custom information sent to the ticketing/request systems.For example, you can set priority=high, assign_to=permission_queue etc.
■ The body of the email. You can use the default variables to enter relevanttext. The variables are evaluated during run-time and are replaced by theircorresponding values. Currently Data Insight provides the following dynamicvariables:
■ Recomendation_textThe value of this variable is the recommendations generated by DataInsight.For information about reviewing permission recommendations, see theVeritas Data Insight User's Guide.
■ Requester_nameThe value of this variable is the user who accepted the Data Insightrecommended changes.
■ Action_idData Insight generates the value of this variable. It is a unique identifierfor the operation.
■ Todays_dateThe value of this variable is the system date.
6 If you selected Use custom action, do the following:
■ Create a custom script by following the guidelines documented in the VeritasData Insight Programmer's Reference Guide.
■ Save the script at the location:$datadir\conf\workflow\steps\permission_remediation\ticketing.
383Configuring remediation settingsAbout configuring permission remediation

7 In the Enter the command to be executed field, provide the file name of thesaved script.
8 Select the relevant saved credential if your system needs to run the script usingthe specified credentials. The script runs with the Local System accountcredentials, however network calls made by the script will impersonate thespecified user credential.
9 Click Save.
To configure the process of applying recommendations
1 Write the relevant scripts to handle changes to the following:
■ The Active Directory.
■ CIFS permissions.
For more information about the custom scripts refer to the Veritas Data InsightProgrammer's Reference Guide.
2 Save the scripts in the following locations:
■ For changes to Active Directory -$DATADIR\conf\workflow\steps\permission_remediation\AD
■ For changes to CIFS permissions -$DATADIR\conf\workflow\steps\permission_remediation\CIFS
3 From the Data Insight Management Console, click Settings > Permissions.The Remediation sub-tab opens by default.
4 Click Edit. The page expands to display the configuration for permissionremediation.
5 Select Enable Permission Remediation if it is not already enabled.
6 Select Remediate using custom scripts. The panel expands to show youthe configuration details.
7 In the Enter the command to be executed field, specify the file name of thecustom script(s) that you have created in step 1
8 Click Save.
The saved scripts are used to handle the permission remediation actions afteryou accept the permissions recommendations displayed on the Workspacetab.
For information on reviewing recommendations and initiating the process of applyingthem, see the Data Insight User's Guide.
384Configuring remediation settingsAbout configuring permission remediation

Configuring exclusions for permission recommendationYou can specify the users and groups that you want to exclude from the purviewof the permission recommendation. Once you exclude a user or group, Data Insightdoes not consider that group for presenting a recommendation for permissionchanges. You can exclude a groups by directly selecting it. You can also excludelarge groups which have more than the specified number of users.
To exclude a user or group from remediation
1 From the Data Insight Management Console, click Settings > >Permissions.The Remediation tab opens by default.
2 Click Recommendation.
3 Do the following:
■ To exclude groups with more than a certain number of users, specify thevalue in the space provided.To exclude specific groups, in the Exclude following groups fromrecommendations pane, click the group's name which you want to exclude.
■ To exclude a specific user, in the Available Members pane, select theuser.
You can use the name filters and domain filters to view and sort the availableuser groups.
The users and groups that you select are displayed in the Exclusion List pane.
4 Click Save.
About managing dataThe storage devices in your environment may accumulate data that is orphan orhas not been accessed for a long time. A large amount of such data on your storagedevices can consume valuable storage space. Data Insight enables you to reclaimstorage space occupied by inactive data. You can manage the inactive data directlyfrom the Data Insight Management Console in the following ways:
■ Archive data using Veritas Enterprise Vault.See “About configuring archive options for Enterprise Vault” on page 386.
Note: Data Insight does not support archive actions for SharePoint Online,Microsoft OneDrive, and Documentum.
■ Manage data by invoking custom scripts.
385Configuring remediation settingsAbout managing data

■ Delete static or orphan files natively from the Workspace and Reports in theData Insight user interface. You can enable the Delete functionality from Settings> Remediation > Data Management > Delete Files.
Note: Data Insight supports delete actions for only CIFS paths.
About configuring archive options for EnterpriseVault
You can handle archiving and maintenance of the data that is stored on networkshares using Veritas Enterprise Vault™ . This feature enables you to identify oldand inactive data residing on storage devices and to archive it directly from theData Insight Management Console. Data Insight uses the Enterprise Vault FileSystem Archiving (FSA) API to archive. When Data Insight sends the command toEnterprise Vault to archive a file, Enterprise Vault uses the account associated withthe FSA task to archive the file. To perform an archive operation on a file, theaccount must have relevant read-write permissions on the file being archived.
To ensure proper functioning of the archive operations, you must have Microsoft.NET Framework 4.5 running on the Data Insight Management Server. Ensure thatyou restart the Management Server after you have finished installing the Microsoft.NET Framework 4.5.
Enterprise Vault (EV) must be successfully configured before you can archive datafrom the Data Insight Management Console. To configure Enterprise Vault completethe following tasks:
■ Run the Enterprise Vault Configuration Wizard to create Enterprise VaultDirectory Database and Enterprise Vault site.
■ Add indexing locations.
■ Add Vault Store Groups and Vault Store Partitions to store archived items. Whenconfiguring a Vault Store, if it makes sense for your organization, set theRemovesafety copies option to Immediately after archive. Selecting this option ensuresthat the post-processing actions, such as creation of a placeholder or deletionof file are performed immediately after the file is archived. This is especiallyuseful during Testing and Proof of Concept deployments.
■ Modify the File System Archiving (FSA) task properties, if necessary.
■ Add the necessary retention categories.
■ Create archiving policies or modify the Default FSA Volume Policy and DefaultFSA Folder Policy, if necessary.
386Configuring remediation settingsAbout configuring archive options for Enterprise Vault

■ Add archiving targets for NetApp filers and Windows file servers. When addinga Windows File Server as a target, select the option to install the placeholderservice on the file server.
■ Add volumes and folders for the targets, and create the necessary archive points.
For detailed instructions on completing the Enterprise Vault configuration tasks,see the Veritas Enterprise Vault documentation.
Note: If there are multiple Enterprise Vault servers in an Enterprise Vault site, thenonly one of the Enterprise Vault servers in the site must be added to the Data Insightconfiguration. If any of the Enterprise Vault servers is down, archiving of files fromthe shares that use vault stores that are managed by that Enterprise Vault serverfails. For information about Enterprise Vault sites and vault stores, see theVeritasEnterprise Vault™ Introduction and Planning Guide.
For instructions on initiating archive requests, see the Veritas Data Insight User'sGuide.
Adding new Enterprise Vault serversYou can configure Enterprise Vault servers to archive inactive data directly fromthe Data Insight Management Console.
To add a new Enterprise Vault server
1 In the Data Insight Management Console, click Settings >Data Management.
The Archiving (Enterprise Vault Configuration) tab opens by default. Itdisplays a list of servers which are already configured.
2 Click Add New EV Server.
3 In the New EV Server window, provide the following information:
■ The IP address of the Enterprise Vault server.
■ The port at which the Enterprise Vault server runs.
■ The relevant login credentials for the Enterprise Vault server. From theLogin Credentials drop-down, select the credentials which are saved inthe system.See “Managing saved credentials ” on page 115.
387Configuring remediation settingsAbout configuring archive options for Enterprise Vault

Note:
Data Insight does not support addition of an Enterprise Vault server using thehost name. You can only add an Enterprise Vault server using the IP addressor the alias name. Ensure that an entry for the server's alias name is added tothe hosts file on the Management Server.
4 Click Test Credentials to verify that Data Insight can connect to the serverusing the saved credentials.
5 Click Save.
Managing Enterprise Vault serversYou can do the following tasks on the Data Management page:
■ Review the configured Enterprise Vault servers
■ Add a new Enterprise Vault server.See “Adding new Enterprise Vault servers” on page 387.
■ Edit the configuration of an Enterprise Vault server.
■ Configure the archive options.
■ Configure the schedule to pause an archive operation.
To view and manage the existing Enterprise Vault servers
1 From the Data Insight Management Console, click Settings > DataManagement.
The Archiving (Enterprise Vault Configuration) tab opens by default. Itdisplays a list of configured servers.
2 Select the server for which you want to edit the configuration, and from theActions drop-down, select Edit.
3 In the Edit EV Server dialog, make necessary changes.
4 Click Save.
You can configure additional options, such as the total size and number of the filesand folders that can be archived in one archive request.
388Configuring remediation settingsAbout configuring archive options for Enterprise Vault

To configure archive options for Enterprise Vault servers
1 From the Data Insight Management Console, click Settings > DataManagement.
The Archiving (Enterprise Vault Configuration) tab opens by default. Itdisplays a list of configured servers.
2 On the Archive Options panel, specify the preferred batch size in MB(s).When archiving files to Enterprise Vault, the batch of files sent to EnterpriseVault in one call does not exceed the given size.
3 Enter the number of files that you want to archive in one operation. By default,you can archive 50 files in one archive request.
4 Click Save.
Note: The batch size has a higher priority than the file count for deciding the list offiles in an archive operation. Thus, Data Insight limits files in the archive operationafter the batch size limit is reached, even if the file count does not exceed thespecified limit.
You can configure a pause window for the Enterprise Vault operations by schedulingData Insight to pause all the archive activities during a specific duration of time.When the pause occurs, Data Insight submits no more new archive requests. Itplaces all new requests in a queue and executes them after the pause window.
To configure a pause schedule for the Enterprise Vault operations
1 From the Data Insight Management Console, click Settings > DataManagement.
2 On the PauseWorkflow Schedule panel, select Pause workflow for specifictimes. Data Insight displays a list for all the previously configured pauseschedules.
3 Do any of the following:
■ To change an existing pause schedule, click the name of the schedule andclick Edit
■ To add a new pause schedule, click Add.
4 Provide the following information:
■ The start time of the pause.
■ The end time of the pause.
389Configuring remediation settingsAbout configuring archive options for Enterprise Vault

■ The days of the week for which you want to schedule the pause.
5 Click Save.
Mapping file server host namesA filer that is assigned a specific host name in Data Insight could be assigned adifferent host name in an Enterprise Vault server. To resolve this conflict, you mustmap the host name assigned to a file server in Data Insight to the host nameassigned by the Enterprise Vault server.
To map the host names of a file server
1 In the Data Insight Management Console, click Settings >Data Management.
The Archiving (Enterprise Vault Configuration) tab opens by default.
2 Click Add Filer Mappings. The Filer Mappings page displays a detailed listof all the file servers that are configured in Data Insight. The list also displayssome already mapped file servers.
For each filer configured in Data Insight, the Enterprise Vault Filer fielddisplays the corresponding mapped filer in Enterprise Vault. For a filer that hasno mapping, Data Insight attempts to automatically map it with thecorresponding filer in Enterprise Vault using host name matching. If Data Insightdoes not find an automatic match, it does not display an entry. In this case,you must manually map the filers.
3 For each file server displayed in the Filer column, verify if its Data Insight hostname is correctly mapped to its Enterprise Vault host name.
4 If an existing mapping is incorrect, then enter the correct value for the hostname in the Enterprise Vault Filer field. Data Insight populates the EnterpriseVault server field based on the Enterprise Vault Filer selected.
5 Click Save.
390Configuring remediation settingsAbout configuring archive options for Enterprise Vault

Note: Clustered Windows File Servers are added to Data Insight using the nameof the cluster. Enterprise Vault requires that virtual file servers configured in thecluster must be added to the Enterprise Vault configuration. To enable EnterpriseVault to archive paths on the virtual file servers, Data Insight automatically mapsthe virtual file servers in the Windows cluster to the configured Enterprise Vaultserver.
About deleting files from CIFS devicesData Insight provides the ability to delete unwanted files from CIFS devices. Youcan delete old and inactive files, and the folders holding those files, from theWorkspace and Reports tab in the Data Insight Management console.
Note: If the Enable delete files action check box is not selected, the Delete Filesaction will be unavailable in both, the Workspace and Reports tab.
If a folder is selected for the Delete Files action, Data Insight deletes all the filesand sub-folders under that folder.
You can monitor the Delete Files action from Settings > Remediation > ActionStatus.
The table in the upper pane of the Action Status UI displays the request statuswhile the table in the lower pane of the UI displays the file status.
Configuring deletion of files and foldersThe Delete Files functionality is disabled by default. You can choose to enable thedelete operation for stale, orphan, or inactive files and folders.
Note: Ensure that the folders and files marked for deletion do not contain anysensitive data or information. Once a delete request is initiated, the folders and filesare deleted with no fore-warning.
To enable and configure the delete action
1 In the Data Insight interface, click Settings > Remediation > DataManagement > Delete Files > Edit.
2 Select the Enable delete files action check box.
3 Select the Delete empty folder check box for deleting the folder containingthe files that have been deleted.
391Configuring remediation settingsAbout deleting files from CIFS devices

4 Enter one or multiple device names on which you need to perform the Deleteaction in the Devices for action field. The device names can be alphanumericand separated by a comma. For example, entering 10.209*in the Devices foraction field indicates the Delete Files action for all devices starting with thename 10.209.
5 Enter the maximum number of files to be deleted in a single delete request inthe File count field.
6 Select the credentials of the user performing the Delete action. You can selectfrom:
■ Use scan credentials: Select the credentials provided for scanning a devicewhile adding the device to Data Insight.
■ Select user > Select saved credentials...: Select the credentials havingsufficient privileges to perform the Delete Files action on all the selecteddevices.
7 Click OK.
Deleting files from the Workspace tab on the Data Insight interfaceYou can initiate a Delete Files request from the Workspace tab on Data Insightinterface in either of the following ways:
■ From the Inactive Subfolders view within Workspace: Workspace > Data >{folder path} > Folder Activity > Inactive Subfolders > Delete files.
■ From the top-level Actions button within Workspace: Workspace > Data >{folder path} > Actions > Delete files.
Note: You cannot initiate a Delete Files request at a share level and must selectfolders or files under the share to perform the same.
Deleting files from the Reports tab on the Data Insight interfaceData Insight lets you delete files from the following reports:
■ DQL Report
■ Inactive Data by File Group
■ Inactive Data by Owner
■ Inactive Folders
The Delete Files option is available on the Reports list page in the Select Actiondrop-down. On selecting Select Action > Actions > Delete Files, the action is
392Configuring remediation settingsAbout deleting files from CIFS devices

performed on the latest successful report output. All the folders, and files and foldersinside the folders, in the report are deleted.
The Delete option is also available in the Select Action drop-down of the ReportDetails dialog box. On selecting Delete, the action is performed on the selectedsuccessful report output. All the folders, and files and folders inside the folders, inthe report are deleted.
To delete files from the Reports tab
1 Go to Reports > {Report type}.
2 Select a report from the Report Name column and from the Select Actiondrop-down, click View.
3 In the Report Details dialog box, click on a report Id, then click Select Action> Remediation > Delete files.
Note: You can trigger the Delete Files action to take place automatically on reportexecution by selecting theDelete Files option in theRemediation tab of theCreateReport or Edit wizard.
Viewing and managing the status of an operationYou can track and manage the progress of the operations that are initiated fromthe Data Insight Management Console. You can perform the following tasks fromthe Action Status page.
■ View the progress of an operation.
■ Cancel an ongoing operation.
■ Re-run a completed or canceled operation.
■ Delete a completed or canceled operation.
Note: The Cancel and Re-run options are not supported for Delete Files action.
You can view the progress of the following types of operations:
■ Archive operations using Enterprise Vault.
■ Permission remediation operations.
■ Remediation operation using custom actions.
■ Deletion of stale, inactive, or orphan files and folders.
The Action Status page displays the following information:
393Configuring remediation settingsViewing and managing the status of an operation

■ The unique identification number of the operation.
■ The system-generated name for the triggered operation indicating its origin.
■ The type of the operation. For Enterprise Vault operations, the type is specifiedas EV. For permission remediation operations, the type is PR. For custom actionoperations, the type is CUSTOM. For delete action operations, the type isDELETE FILES.
■ The time when the user triggered the operation from the Management Console.
■ The user who triggered the operation.
■ The time when the destination server starts processing the triggered request.The destination server is an external server which is responsible for the actualexecution of an operation that is triggered from the Data Insight ManagementConsole. For example, in the case of an archive operation, the destination serveris the Enterprise Vault server.
■ The time when the destination server completes processing the request.
■ The time it takes to complete the operation.
■ The status of the operation.
■ In case of archive operation using Enterprise Vault, the custom index property,including the classification tags applied to the files that are being archived.
Note: Only some columns are displayed in the default view. You can view the othercolumns by selecting them from the column header drop-down.
TheDetails for Action panel shows you the step-by-step break-down of the selectedoperation.
To view the status of an operation
1 In the Management Console navigate to Settings >Action Status. TheActionStatus page displays the details of recently triggered operations.
2 Use the check box filter to display the operations based on their Type or Status.Additionally, you can use the search facility to display the operations based ontheir attributes such as Origin, Type, or Status.
3 Click the Origin of the selected operation to view granular details of anoperation. Alternatively, click the Select Action drop-down, and select View.
394Configuring remediation settingsViewing and managing the status of an operation

4 The details of the selected operation are displayed in the Details for Actionpanel.
5 Use the check box filter to display the operations based on the attributes suchas: Status or Filer. Additionally, you can use the search facility to display thedetails based on attributes such as Path or Status.
You can cancel an operation that is in progress. Cancelling an operation, pausesall the activities of the operation. You can re-run a canceled operation later.
To cancel an ongoing operation
1 In the Management Console, navigate toSettings >Action Status. TheActionStatus page displays the details of recently triggered operations.
2 Use the check box filter to display the operations based on their Type or Status.Additionally, you can use the dynamic filter to display the operations based ontheir attributes such as Origin , Type, or Status.
3 Click Select Action for the operation you want to cancel.
4 Click Cancel.
You can re-run a canceled or a completed operation.
To re-run a canceled or a completed operation
1 In the Management Console navigate to Setting > Action Status. The ActionStatus page displays the details of recently triggered operations.
2 Use the check box filter to display the operations based on their Type or Status.
3 Click Select Action for the operation you want to re-run.
4 Select Run Again.
5 Select any of the following:
■ All - To run all the sub-steps for the operation.
■ Unsuccessful - To run all the failed sub-steps for the operation.
Note: For a permission remediation or custom action-related operation that iscanceled, the option to run the unsuccessful steps again is not available.
You can delete an operation that is canceled or completed.
To delete a canceled or a completed operation
1 In the Management Console navigate to Setting > Action Status. The ActionStatus page displays the details of recently triggered operations.
2 Use the check box filter to display the operations based on their Type or Status.
395Configuring remediation settingsViewing and managing the status of an operation

3 Click Select Action for the operation you want to delete.
4 Select Delete.
396Configuring remediation settingsViewing and managing the status of an operation

Reference
■ Appendix A. Backing up and restoring data
■ Appendix B. Data Insight health checks
■ Appendix C. Command File Reference
■ Appendix D. Data Insight jobs
■ Appendix E. Troubleshooting
10Section

Backing up and restoringdata
This appendix includes the following topics:
■ Selecting the backup and restore order
■ Backing up and restoring the Data Insight Management Server
■ Backing up and restoring the Indexer node
Selecting the backup and restore orderTo maintain consistency in the configuration data during backup, the backup DataInsight components in the following order:
■ Nodes with Indexer role
■ Management Server
Restore the Data Insight components in the following order:
■ Management Server
■ Nodes with Indexer role
Backing up and restoring the Data InsightManagement Server
It is mandatory to backup the Management Server.
AAppendix

To backup Management Server configuration files
1 Log in to Data Insight Management Server.
2 Backup the entire $data folder using backup tools such as Veritas NetBackup.The backup software should be capable of taking Volume ShadowCopy/Snapshot based backups. If your backup software does not have sucha capability, you must stop all Data Insight services before backup, to avoidincomplete backup due to locked files.
To restore the Management Server files
1 Install the operating system. Use the same version, host name (recommendedfor ease of configuration), and architecture as was installed before the backup.
2 Install the same version of Data Insight that was installed before the backup.
3 Select the option to install the Management Server role while installing DataInsight .
4 Specify the original location of the $data directory as the previous install. Bydefault, the $data directory is located at C:\DataInsight\data.
5 Complete the installation. Do not start the services at this time; clear the Startservices now option when the installer prompts for it.
6 Delete the $data folder that is created as a part of the new installation andcopy the backed up data to this location.
7 Start the Data Insight services, which include DataInsightComm,DataInsightWatchdog, DataInsightHttpd, DataInsightweb, andDataInsightConfig.
8 Check the status of the services and ensure that they come to running state.
Successful start of all services indicates that the Management Server issuccessfully restored.
To restore the Management Server with a different host name or IP address
1 Repeat steps 1 through 6 as described in the section, Restoring theManagement Server files.
2 Edit $data/conf/<nodename>.conf and enter the new server name.
Open the file, $data/conf/config.db.<N> (N being the latest version ofconfig.db) in an SQLITE editor.
Update the node_name and node_ip columns in node table with the host nameand IP address of the new server.
399Backing up and restoring dataBacking up and restoring the Data Insight Management Server
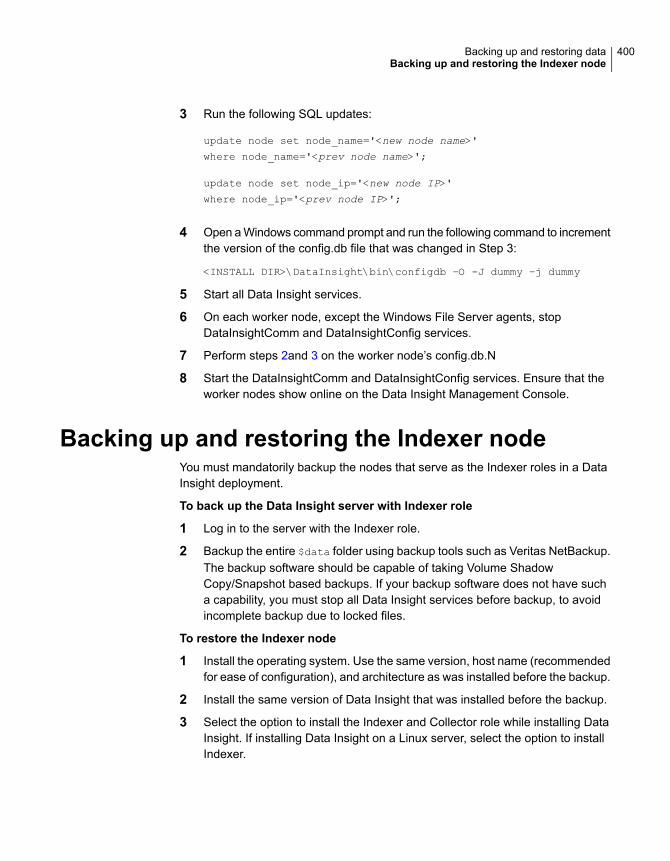
3 Run the following SQL updates:
update node set node_name='<new node name>'
where node_name='<prev node name>';
update node set node_ip='<new node IP>'
where node_ip='<prev node IP>';
4 Open a Windows command prompt and run the following command to incrementthe version of the config.db file that was changed in Step 3:
<INSTALL DIR>\DataInsight\bin\configdb –O -J dummy –j dummy
5 Start all Data Insight services.
6 On each worker node, except the Windows File Server agents, stopDataInsightComm and DataInsightConfig services.
7 Perform steps 2and 3 on the worker node’s config.db.N
8 Start the DataInsightComm and DataInsightConfig services. Ensure that theworker nodes show online on the Data Insight Management Console.
Backing up and restoring the Indexer nodeYou must mandatorily backup the nodes that serve as the Indexer roles in a DataInsight deployment.
To back up the Data Insight server with Indexer role
1 Log in to the server with the Indexer role.
2 Backup the entire $data folder using backup tools such as Veritas NetBackup.The backup software should be capable of taking Volume ShadowCopy/Snapshot based backups. If your backup software does not have sucha capability, you must stop all Data Insight services before backup, to avoidincomplete backup due to locked files.
To restore the Indexer node
1 Install the operating system. Use the same version, host name (recommendedfor ease of configuration), and architecture as was installed before the backup.
2 Install the same version of Data Insight that was installed before the backup.
3 Select the option to install the Indexer and Collector role while installing DataInsight. If installing Data Insight on a Linux server, select the option to installIndexer.
400Backing up and restoring dataBacking up and restoring the Indexer node

4 Specify the original location of the $data directory as the previous install. Bydefault, the $data directory is located at C:\DataInsight\data.
5 Clear the Launch worker node registration wizard after exit checkbox. Youdo not need to register the worker node at this time as the registrationinformation is already present in the data that you have backed up.
6 Complete the installation. Do not start the services at this time; clear the Startservices now option when the installer prompts for it.
7 Delete the $data folder that is created as a part of the new installation andcopy the backed up data to this location.
8 Start the Data Insight services, which include DataInsightComm,DataInsightWatchdog, and DataInsightConfig.
9 Check the status of the services and ensure that they come to running state.
Successful start of all services indicates that the Indexer node is successfullyrestored.
To restore the Indexer node with a different host name or IP address
1 Repeat steps 1 through 6 as described in the section, Restoring the Indexernode.
2 Edit $data/conf/<nodename>.conf and enter the new server name.
3 Open the file, $data/conf/config.db.<N> (N being the latest version ofconfig.db) in an SQLITE editor.
Update the node_name and node_ip columns in node table with the host nameand IP address of the new server.
4 Run the following SQL updates:
update node set node_name='<new node name>'
where node_name='<prev node name>';
update node set node_ip='<new node name>';
where node_name='<prev node name >';
5 Log in to the Management Server and stop the DataInsightComm,DataInsightWeb, and DataInsightConfig services.
6 Perform 3 on the Management Server.
7 Open a Windows command prompt and run the following command to incrementthe version of the config.db file that was changed in 2
<INSTALL DIR>\DataInsight\bin\configdb –O -J dummy –j dummy
8 Start all Data Insight services on the Management Server.
401Backing up and restoring dataBacking up and restoring the Indexer node

9 On each worker node, except the Windows File Server agents, stopDataInsightComm and DataInsightConfig services.
10 If this node is a Collector for one or more Windows File Server agents, log into each Windows File Server, stop the DataInsightComm and DataInsightConfigservices.
Perform step 3 on the worker node’s config.db.N
11 Start the DataInsightComm and DataInsightConfig services on the Indexer andall other worker nodes where configdb.N was changed. Ensure that the workernodes show online on the Data Insight Management Console.
402Backing up and restoring dataBacking up and restoring the Indexer node

Data Insight health checksThis appendix includes the following topics:
■ About Data Insight health checks
■ Understanding Data Insight best practices
About Data Insight health checksYou may want to run Veritas Data Insight health checks in your environment in thefollowing scenarios:
■ Routine check of the Data Insight environment.
■ Troubleshooting Data Insight performance and stability issues
■ Upgrading Data Insight
■ Resolving scalability issues and bottlenecks in your environment
■ Checking for additional resources, for example, while installing the Self-Serviceportal.
■ Migrating resources to new hardware.
You can use the checks for the following objectives:
■ To determine if your configuration, sizing and indexing schedules meet DataInsight requirements.
■ To fine-tune Data Insight efficiency.
■ To free up the unwanted storage that is used by Data Insight.
■ To troubleshoot common issues and collect logs and other evidence for thesame.
Before you run the Data Insight health checks, you must be familiar with the followingconcepts:
BAppendix

■ How Data Insight works
■ Data Insight architecture
■ Data Insight data flow
For more information, see the Veritas Data Insight Installation Guide.
To understand best practices and sizing guidelines for deploying, see the followingtopic:
See “Understanding Data Insight best practices” on page 418.
Services checksVerify if the services listed in the following figure are running:
Figure B-1 Services running on a Data Insight node
Deployment details checksTable B-1 lists the various deployment details that you must gather. The table alsolists the related steps.
Table B-1 Deployment details
StepsDeployment details
■ Check device manager.■ Execute the systeminfo command on each server.
■ Number of product servers■ Server configuration details
(operating system, physical orvirtual, 64-bit, CPU, RAM, diskcapacity, disk usage)
■ List the details.■ Number of NAS devices andconfigured shares
■ Vendor name and modelnumbers
404Data Insight health checksAbout Data Insight health checks

Table B-1 Deployment details (continued)
StepsDeployment details
■ To retrieve these details, on the ManagementConsole, use the following log utility:https://hostname/logsORNavigate to the following location to view requiredfile.:Installation directory>\log
Review the FILER SUMMARY:section of the idxcheck.0.log files(in each indexer) and note thefollowing details:
■ Overall statistics as well as perindexer and per filer statisticsfor events, capacity, file, andfolder counts.
■ The sizes of the indexerdatabase and the segment files.
■ Determine the number of data centers (mentionprimary).
■ Determine the bandwidth between data centers.■ Ensure that the Management Server is located close
to the indexers.■ Look for proximity of filers and collectors; gather
subnet information for the collectors and filers.■ Determine the number of configured directory
services (Active Directory, LDAP, NIS) and thenumber of users that are configured by navigatingto the following location on the Data InsightManagement Console:Settings>Inventory> Directory Services
■ Network topology (proximity)
■ Determine the number of events received weeklyby navigating to https://localhost/datadirIn the list of folders, select stats and then selectstatistics.db.In the query drop down, select "weekly_stats", enterstatid=252842000 in the where text box, and thenclick Go.
■ Determine number of events processed weekly.Navigate as described above but enterstatid=251793411 in the where text box and thenclick Go.
■ Number of the events that aregenerated and processed perCollector (Only in Data Insight4.0 or later.)
Generic checksGeneric checks for all servers include checks for the following information:
■ Configuration version
405Data Insight health checksAbout Data Insight health checks

■ Component version
■ Resource usage statistics
■ Windbg check
■ Error files count
■ Error events check
■ Attic check
■ Crash dump check
Configuration versionTable B-2 lists three configuration scenarios that you must review, and their relatedsteps:
Table B-2 Configuration version checks
StepsConfiguration versioning
Run the following command on ManagementServer/node:
# configdb -V
Are the versions on the Management Serverand the other nodes consistent forconfiguration, users, and database?
Note that the policy versions may vary.
Contact Veritas Support for more information.Are the versions on the Management Serverlower than other Data Insight nodes?
This behavior occurs in restore cases.
■ Ensure that connectivity exists betweenManagement Server and worker nodes.
■ Ensure that connectivity exists betweenCollector nodes and Windows File Serveragents. (if applicable).
Are the versions considerably higher onManagement Server than the other DataInsight nodes?
Component versioningPerform one of the following steps to gather component versions for all nodes:
■ Navigate to Settings > Servers.
■ Or, to get the node number-wise breakdown of component versions, run thefollowing command:# configdb -p -T objattr_node| findstrnode_info_product.version
406Data Insight health checksAbout Data Insight health checks

Note: Data Insight Management Server, Indexer nodes, and Collector nodes mustrun the same version of Data Insight. Windows File Server agent version may bedifferent from the Data Insight version on the head servers. Also note that DataInsight 5.0 supports Windows File Server agents later than version 4.0 or later.
Resource usage statisticsTo view the resource consumption statistics per server, on the Management Console,navigate to Settings > Servers > Statistics.
Verify that the average resource consumption is consistently high.
Figure B-2 Performance chart
Table B-3 describes the various parameters you must verify in the Data Insightperformance chart and the remedial steps required.
Table B-3 Performance checks
StepsPerformance parameter
Look for processes clogging the server.CPU usage is consistently high.
Look for cores and threads settings inserver-specific checks. Verify if a server isunable to process more load.
CPU usage is consistently low.
Look for processes clogging the server.Memory consumption is consistently high.
If the spikes occur in a weekly chart or hourlychart form a pattern, verify if they coincidewith the Data Insight schedule. Alsoinvestigate other schedules on the servers.
Spike patterns exist in hourly or weeklycharts, or both.
Figure B-3 illustrates a stable disk usage pattern.
407Data Insight health checksAbout Data Insight health checks

Figure B-3 Disk usage chart
The following table describes the remedial steps that you must perform, if diskusage increases to high levels.
Table B-4 Disk usage checks
StepsDisk usage
■ Use stale data statistics and purge data
OR
■ Add new storage.
Disk usage is consistently high; that is,consistently reaching 100 per cent.
Windbg checkIf the windbg utility is installed, check for any processes that are captured and arerunning in windbg. For example, if you run a report that fails, say report.exe,Windbg captures the process. Investigate if any process appears to be running,but is not functional.
Error files countTo view the error file count, navigate to Settings > Servers > Statistics
Figure B-4 Error files chart
Ideally, there should be no error files. View errors at the following location:datadir\indexer\err folder.
Where datadir is the path of the data directory
408Data Insight health checksAbout Data Insight health checks

For example: C:\DataInsight\data\indexer\err folder.
Error events checkTo verify if any error events are logged, navigate to:
Settings > Servers > Event Log.
Attic checkEnsure that the attic feature is turned off on all Data Insight nodes.
That is, ensure that there are no intermediate files in the following directory:DATADIR/attic.
Crash dump checkEnsure there are no dump files in the following directory: INSTALLDIR/dumps.
Data Insight Management Server checksTable B-5 lists Data Insight Management Server checks and related steps.
Table B-5 Management Server checks
StepsChecks
■ Over a period of six months, in a moderatelystable environment, the folder size reachesabout 200MB. Set the data retention settingsaccordingly.
■ Purge very old Data Insight events with theapproval of the event owners.
DATADIR/events folder size
■ Verify the date of the oldest file (backlog). Ifthe file is very old, it means that the audit orthe scan files are unable to keep up with thecollection.
■ Use the configcli list_jobs commandto collect the schedule and last run of theADScanJob, ProcessEventsJob, andIndexWriterJob processes.
■ Collect Event Viewer logs.■ Collect the output of the indexcli -j
command.
Accumulation of backlog inDATADIR/inbox
409Data Insight health checksAbout Data Insight health checks

Table B-5 Management Server checks (continued)
StepsChecks
■ If the reports are no longer required, archiveor delete them.
■ For each report, set a reasonable value in theMaximum reports to preserve field.
Presence of old or stale reports in thefollowing folder:
DATADIR/console/reports/reportruns
Ensure that these settings are configured.SMTP and events notification check
Data Insight Indexer checksTable B-6 lists various Data Insight Indexer checks that you must perform and therelated remedial steps:
Table B-6 Indexer checks
StepsChecks
■ Navigate to Settings > Filers, and filter on eachIndexer.
Or
■ Check the idxcheck log for each Indexer.
Number of filers and the sharesthat are serviced by eachIndexer
■ Check Idxcheck0.log under installdir/log folderchecks for database integrity and index.
■ Go to the end of the log file to review the overallintegrity check.
■ If the integrity check fails, review the index check foreach share in the same file.
■ Review two key metrics: IndexDB Size and SegmentsSize. Others metrics indicate stale hash sizes.IndexDB Size is a sum of all index databases. It storesindex information such as scan information (metadataand ACLs).Segment size is a sum of all segment sizes. It storesthe audit events.Hashes are indexed against the two databases -indexDB and segments.ActIndex Size was introduced in Data Insight 4.0 toindicate activity in a social network map.
Index integrity and space usageper Indexer
410Data Insight health checksAbout Data Insight health checks

Table B-6 Indexer checks (continued)
StepsChecks
■ Navigate to Settings > Servers> Statistics.■ Ensure that the Inbox plot follows a smooth saw-tooth
pattern.■ If the number of files in inbox consistently rises, and
so does CPU and memory usage, investigate if thereis an Indexer issue.
■ Check schedule settings and number of threads tofine-tune the processing of incoming files.
Inbox and Outbox chart
Figure B-5 illustrates the chart
In Data Insight UI, navigate to Data Insight > Indexer >Advanced Settings, and fine-tune the followingparameters as necessary:
■ Total Indexer threads (*): This number should notexceed the total CPU core count on the server. For a4-CPU Indexer, ideally set this value to ‘total cpu corecount minus 1’. Allowing one core’s worth of processorensures that index writer processes cannot overcomea server and keeps resources available for queryresponse and product communications. If the Indexerhas more than 4 cores, leaving more cores availablemay be desirable if many reports are run. Disksubsystems start to lose the ability to keep up if thereare more than 10 threads. If the server has more than12 cores, do not set value to more than 10 on indexwriter. Specify a higher value only if the storage is veryhigh performance.
■ Limit the maximum events that are processed inmemory: Keeping this setting unlimited may lead toprocessing issues. Most of these issues should beresolved, but if the filer in question has excessivelylarge number of events. (Application-generatedworkloads sometimes cause this type of load.) A limitof 1,000,000 is recommended.
■ Reconfirm deleted paths when reconciling full scaninformation: This Indexer-side setting enables DataInsight to reconfirm if paths now missing from full scanoutput are deleted.
■ Indexer schedule■ Indexer integrity checking schedule
Basic Settings
411Data Insight health checksAbout Data Insight health checks

Table B-6 Indexer checks (continued)
StepsChecks
In the Data Insight UI, navigate to Data InsightIndexer>Advanced Settings
■ Audit events preprocessor schedule■ Batch size
Audit Events Pre-ProcessorSettings
■ Look for the date of oldest files (backlog): If files arevery old, it means that audit or scan file processing isnot able to keep up with collection.
■ Execute the configcli list_jobs command togather ADScanJob, ProcessEventsJob, andIndexWriterJob.
■ Collect Event Viewer logs. Collect the output of theindexcli -j command.
Accumulation of backlog inDATADIR/inbox
■ Review ldxcheck.log for index corruption.■ Move files to Inbox and verify if they are consumed
in the next run. If not, contact Veritas Support with thefollowing information:■ Event viewer logs■ Index directory for the share or the site collection■ installdir\log\commd.0.0.log
■ installdir\log\indexer\index-msu_id.log
■ Idxcheck.log (summary and integrity informationfor all shares)
■ datadir\indexer\err folder
■ Output of indexcli.exe -j command (To viewthe files queued for indexing.)
Audit/scan files inDATADIR/indexer/err
The following figure illustrates a smooth saw-tooth pattern in an Inbox and Outboxchart:
Figure B-5 Inbox and Outbox chart
412Data Insight health checksAbout Data Insight health checks

Data Insight Collector checksThe following table lists various Data Insight Collector checks that you must performand the related steps:
Table B-7
StepsChecks
If applicable, also specify the number of Windows File Serverswith the Windows File Server agents that are configured.
Number of filers (and shares)serviced by each collector
This value should not be more than 1 microsecond. If thevalue is greater than 1 microsecond, you must investigatenetwork latency issues.
Ping time from Collector tothe filers
To collect server statistics, navigate as follows (for eachserver):Server >Settings >Statistics. Review the following:
■ In the Inbox and Outbox chart, ensure that the Outboxplot follows a smooth saw-tooth pattern.If the number of files in the Outbox folder consistentlyrises, investigate if there is a communication issue ornetwork issue.Check the schedule settings and number of threads tofine-tune the processing of incoming files.
■ If the Event pre-processor throughput drops, investigateif events received are few or if pre-processing is not ableto catch up.
Server statistics
■ Inbox and Outbox chartFigure B-6 illustratesInbox and Outbox chart
■ Event pre-processorthroughput chartPre-processor throughputprovides an idea about theprocessing of collectedaudit events.Pre-processor collectorthreads govern theoptimal throughput andCPU utilization.Figure B-7 illustrates theEvent pre-processorthroughput chart.
413Data Insight health checksAbout Data Insight health checks

Table B-7 (continued)
StepsChecks
In the Data Insight UI, navigate to Data Insight > Collector>Advanced Settings, and fine-tune the following parametersas necessary.
■ Maximum scans to run in parallel on this server (*): Youmay increase these, as these threads are not CPUintensive. This value can be higher than the total CPUcore count on the server. Network latency and bandwidthput limits on scanners. Multiple threads use availablebandwidth better, during the latency for other threadqueries. However, increasing the thread count does slowdown individual scans, due to saturation of networkperformance. Begin with a default value of 4 and monitorthe network performance. If there is plenty of bandwidthavailable, increase thread count until the networkutilization increases, but doesn’t saturate. Ensure thatyou allocate bandwidth and CPU resources for auditevents and inter-product communication. Start with twothreads per core, beyond the default configuration. Ifnetwork resources or CPU resource usage averages over70 per cent, reduce the thread count.
■ Maximum shares per filer to scan in parallel: Ensure thatthis value is not more than 4 per filer.
■ Scan settings: Specify if you want to override a scheduledscan or pause a scheduled scan.
Basic settings for full andincremental scans underFilesystem scanner settings
In the Data Insight UI, navigate to Data Insight Servers >Collector > Advanced Settings, and change the followingsettings:
■ Total collector threads: To improve CPU utilization,increase this value to half the CPU core count. In case of4 cores, you can keep this value as 3. Default value is 1.
■ Schedule: Schedule pre-processing twice per everyindexing job (as per the indexing schedule). For example,if the indexing job runs every 4 hours, pre-processingshould run every 2 hours.
Audit Events Pre-ProcessorSettings
414Data Insight health checksAbout Data Insight health checks

Table B-7 (continued)
StepsChecks
■ Look for the date of oldest files (backlog): If files are veryold, it means pre-processing is not able to keep up withaudit events collection.
■ Verify pre-processing settings. You can set this value tomore than 2 GB. You can increase the number of threads.
■ Collect the following information:■ To see schedule and last run status of theCollectorJob
process, execute the command: configclilist_jobs
■ Collect the following log:installdir\log\collector_n.log.Where installdir is the installation directory: Forexample: C:\ProgramFiles\DataInsight
■ Collect the following log:installdir\log\commd.0.0.log
■ Collect the following contents:datadir\data\config.db.<n>.
■ Collect the following content:datadir\data\collector\err\*.sqlite.
■ Collect Event Viewer logs.
Accumulation of backlog anderrors in DATADIR/collector(error and staging)
■ Look for the date of oldest files (backlog): If the files arevery old, investigate if the network is slow orcommunication is broken
■ Collect the following information■ To see the schedule and last run status of CollectorJob
and FileTransfer job processes on the collector,execute the following command: configclilist_jobs
■ Collect Event Viewer logs.■ If communication issues occur, add the entries of the
Iindexer nodes in etc/hosts directory of collectors;and the Collector nodes’ entries in etc/hosts folderof Windows File Servers.
Accumulation of backlog inDATADIR/outbox
■ Look for the date of the oldest file (backlog): If the filesare very old, investigate if incremental scans are fail.
■ Collect the following information:■ Last scan job■ Scan schedule
Accumulation of backlog inDATADIR/changelog
415Data Insight health checksAbout Data Insight health checks

Table B-7 (continued)
StepsChecks
■ Collect the following information:■ Collect the following Scanner logs:
ext<x>_msu<y>.*log logs
Where x and y are the extract ID and the MSU ID,respectively.In case of SharePoint, sharepoint_scanner_<n>.log,where ‘n’ is the site collection ID.
■ Collect the following log: installdir\log\commd.0.0.log.■ Collect Event Viewer logs
Check for any errors inDATADIR/scanner (err)
The following figure illustrates the smooth saw-tooth pattern in the Inbox and Outboxchart:
Figure B-6 Inbox and Outbox chart
The following figure is a screen shot of the Event Pre-processor throughput:
Figure B-7 Event Pre-processor throughput
Data Insight Windows File Server checksTable B-8 lists various Data Insight Windows File Server checks that you mustperform and the related steps:
416Data Insight health checksAbout Data Insight health checks

Table B-8 Windows File Server checks
StepsChecks
See “Data Insight Collector checks” on page 413.File system scanner settings
■ Look for the date of oldest files (backlog). If files arevery old, it means pre-processing is not able to keepup with audit events collection.
■ Verify pre-processing settings. You can set this valueto more than 2 GB. You can increase the number ofthreads.
■ Collect the following logs:■ installdir\log\collector_n.log
Where installdir is (?) and n is (?) (Query)■ installdir\log\commd.0.0.log
■ <datadir>\data\config.db.<n>
■ <datadir>\data\collector\err\*.sqlite
■ Collect Event Viewer logs.■ To see schedule and last run status of the
CollectorJob process, execute the command:configcli list_jobs.
■ Look for kernel ring buffer error in winnasd.log.If the error is present, increase the Maximum kernelring buffer size setting. (Windows File Server Agentsetting)
Accumulation of backlog anderrors in DATADIR/collector (errorand staging)
■ Look for the date of oldest files (backlog): If the filesare very old, investigate if the network is slow orcommunication is broken.
■ Collect the following information:■ To see the schedule and last run status of
CollectorJob and file FileTransferJob processeson the Collector, execute the following command:configcli list_jobs
■ Collect Event Viewer logs.■ If communication issues occur, add entries of
indexer nodes in the etc/hosts directory of theCollector nodes; and Collector nodes’ entries inetc/hosts folders of Windows File Server.
Accumulation of backlog inDATADIR/outbox
417Data Insight health checksAbout Data Insight health checks

Table B-8 Windows File Server checks (continued)
StepsChecks
■ Look for the date of the oldest file (backlog): If thefiles are very old, investigate if incremental scansfail.
■ Collect the following information:■ Last scan job■ Scan schedule
Accumulation of backlog inDATADIR/changelog
Data Insight SharePoint checksEnsure that the SharePoint collector and SharePoint Agents are running the sameversion.
Understanding Data Insight best practicesThe following topics describe the common practices and sizing guidelines:
■ Common practices
■ General sizing guidelines
Common practices■ Use 64-bit server architecture for better Data Insight performance.
■ Use high performance disks for indexers, SAN disk for ease of expansion andbackup
■ Disk concatenation or RAID 4 may generate hotspots in the array subsystem.Ensure proper distribution to avoid hotspots.
■ Use separate disks for Install and Data directories.
■ Assign faster and bigger Temp directory for indexers.
■ Temp directory (for example, in Windows, the directories that are indicatedby TMP and TEMP system environment variables) must be on disk otherthan system disk (operating system disk). This best practice improves indexvacuum (like defrag for segments) performance, and overall performance.
■ Assign indexer memory of 1 GB per thread.
■ Assign indexer memory sizing of 1 GB per 10 million audit events.
■ Assign low latency high bandwidth (or dedicated) network links for Collector-Filercommunication.
418Data Insight health checksUnderstanding Data Insight best practices

■ Create exclude rules to ensure that the information that is reported is relevantand useful.
■ If a third-party application that generates a lot of events, resides on a volume,exclude that volume from auditing (like NetApp FPolicy) to restrict events.
■ Schedule scans at off peak hours to minimize effect on users accessing theshares.
■ Disable scans from running during peak usage.
■ Manage job scheduling as per load.
■ Assign appropriate roles and access for Data Insight users.
■ Deploy DFS mappings to ensure that all names are recognizable and meaningful.
■ Create containers to logically group related objects together for administrationand reporting purposes.
■ Set up event notifications to ensure that errors and warnings are reported.
■ Define retention policies to ensure the database and log files are maintainedover time.
■ Define report retention in when configuring reports (“Reports to preserve” setting).
■ Maintain adequate proximity – Management Server close to indexers, Collectorclose to filers.
■ Use Chrome for faster UI.
■ Refer to the Veritas Data Insight Installation Guide for the latest platform andversion support information.
General sizing guidelinesThe following sizing guidelines are typically recommended for Data Insight setups.The recommendations may change based on environment.
■ Management Server
■ Up to 16 indexers
■ Indexers
■ Up to 20,000 shares
■ Allocate 100 MB of disk space per million files
■ Allocate 20 MB of disk space per million events
■ Typical storage size range is 40 GB to 400 GB depending upon environment.Large deployments may even need more space.
419Data Insight health checksUnderstanding Data Insight best practices

■ Collectors
■ Up to 10,000 shares or ten filers, whichever comes first
■ Up to 150 Windows NAS agents
■ Up to 20 SharePoint web front-end servers
■ Typical storage size range is 60-80 GB per collector. Additional space mayalso help in case of network outages where data is staged before it istransferred to Indexer.
■ Indexer storage
■ 100 MB/1 million files
■ 20 MB/1 million events
■ Scan times
■ 200 files per second per thread
Risk Dossier sizing guidelinesIf you enable the computation of the Risk Dossier, there will be an overall increasein the space required for the index folder.
For the Management Server, the dossier database size can be calculated as:
Number of users * 2 MB (to store dossier date for 6 months)
Thus, for 50000 users, provision up to 100 GB space to store dossier data of 6months.
420Data Insight health checksUnderstanding Data Insight best practices

Command File ReferenceThis appendix includes the following topics:
■ fg.exe
■ indexcli.exe
■ reportcli.exe
■ scancli.exe
■ installcli.exe
CAppendix

fg.exefg.exe – A script that modifies the file group configuration for Data Insight.
SYNOPSISfg -C -N <name of file group>
fg -D -N <name of file group>
fg -L -d
fg -L -N <name of file group> -d
fg -R -N <name of file group> -t <name of extension>
Descriptionfg is a script used to modify the configuration for sorting files into file groups. Bydefault, Data Insight sorts files into 18 file groups based on the file extensions.
Options-i <username>
(Required) The fully-qualified user name of the user running the command, forexample, user@domian. This user should have Server Administrator privilegesin Data Insight.
-A Adds an extension to an existing file group.
-C Creates a new file group.
-D Deletes an existing file group.
-L Lists existing file groups.
-R Removes an extension from an existing file group.
-N Name of the file group to be created or deleted.
-d Shows file group details when listing existing file groups.
-t <name of extension>
The file extension to add or delete from the file group (For example, doc).
-h Prints the usage message.
422Command File Referencefg.exe

EXAMPLESEXAMPLE 1: The following command creates a new file group.
fg -i <username> -C -N <name of file group>
EXAMPLE 2: The following example adds a new extension to an existing file group.
fg -i <username> -A -N <name of file group> -t <name of extension>
EXAMPLE 3: The following example deletes an extension from an existing filegroup.
fg -i <username> -R -N <name of file group> -t <name of extension>
EXAMPLE 4: The following command deletes a file group.
fg -i <username> -D -N <name of file group>
EXAMPLE 5: The following command displays a detailed listing of all configuredfile groups.
fg -i <username> -L -d
EXAMPLE 6: The following command displays a detailed listing of a particular filegroup.
fg -i <username> -L -N <name of file group> -d
423Command File Referencefg.exe

indexcli.exeindexcli.exe – a utility that manages the index segments available on an Indexerworker node.
SYNOPSISindexcli.exe
--display|--archive|--purge|--restore|--rearchive|--list-jobs
|--stop-jobs [OPTIONS]
indexcli.exe -A <name of the index segments to be archived>
indexcli.exe -c
indexcli.exe -D <name of the index segments to be purged>
indexcli.exe -d
indexcli.exe -h
indexcli.exe -j
indexcli.exe -r
indexcli.exe -t
indexcli.exe -u
Archive optionsindexcli.exe -A -a ¦ -f <FILERS> ¦ -m
<SHARES> ¦ -S <SITECOLLS> ¦ -w <WEBAPPS> ¦ -I
<MONTHS>
-a Archives all index segments older than the specified interval.
-f <name of filer(s)>
Archives all index segments for the specified list of filers.
-I <interval in months>
Archives segments older than the specified interval. The segments which havebeen restored earlier are not archived.
-m <name of share(s)>
Archives all index segments for the specified list of shares.
424Command File Referenceindexcli.exe

-S,--sitecoll <SITECOLLS>
Archives segments for specified list of Microsoft SharePoint site collections.
-w, --webapp <WEBAPPS><
Archives segments for specified list of Microsoft SharePoint web applications.
Purge optionsindexcli.exe -D -a ¦ -f <FILERS> ¦
-m <SHARES> ¦ -S <SITECOLLS> ¦ -w <WEBAPPS> ¦
-I <MONTHS>
-a Purges all index segments older than the specified interval.
-f <name of filer(s).
Purges all index segments for the specified list of filers.
-I ,interval in months.
Purges segments older than the specified interval. The segments which havebeen explicitly restored earlier, for which the lease is still valid, are not purged.
-m <name of share(s)>
Purges all index segments for the specified list of shares.
-S,--sitecoll <SITECOLLS>
Purges segments for specified list of Microsoft SharePoint site collections.
-w, --webapp <WEBAPPS><
Purges segments for specified list of Microsoft SharePoint web applications.
Display optionsindexcli.exe -d -a ¦ -f <FILERS> ¦
-m <SHARES> ¦ -S <SITECOLLS> ¦ -w <WEBAPPS> ¦
-s <STATES>
-a Displays information for all shares.
-f <name of filer(s)>
Displays information for the specified list of filers.
-m <name of share(s)>
Displays information for the specified list of shares.
425Command File Referenceindexcli.exe

-s <name of state>
Displays index segments for the given state only. Multiple stars can beseparated by comma. Possible states are, ARCHIVING, RE-ARCHIVING,ARCHIVED, RESTORING, RESTORED, RESTORE, FAILED, or DELETED.
-S,--sitecoll <SITECOLLS>
Displays information for a specified list of Microsoft SharePoint site collections.
-w, --webapp <WEBAPPS><
Displays information for a specified list of Microsoft SharePoint web applications.
Restore optionsindexcli.exe -r -a ¦ -f <FILERS> ¦
-m <SHARES> ¦ -S <SITECOLLS> ¦ -w <WEBAPPS> -C -F <FROM> ¦ >
¦ -R <RANGE>
[-L <MONTHS> ¦ -l <MONTHS> ¦ -y]
-a Restores the index segments for all shares.
-C If the continue-on-error option is not specified, the restore command fails ifthe segment files required to restore data for the specified parameters are notavailable.
-f <name of filer(s)>
Restores all index segments for the specified list of filers.
-F <month from which the segments need to be restored>
Specify the month in the format, YYYY/MM. For example, indexcli.exe -r
-F 2010/01 restores segments from January 2010 till date.
-L <interval in number of months>
Resets lease on segments that are restored earlier using -l option. Specifythe new lease interval in months. This command replaces the previous leaseinterval. Setting the value to 0 will make the lease permanent.
-l <interval in number of months>
Restores segments for a temporary lease in months. After the lease expires,restored segments are automatically re-archived. If this option is not specified,segments remain restored till you re-archive them with the -u, --rearchive,option.
-m <name of share(s)>
Restores all index segments for the specified list of shares.
-S,--sitecoll <SITECOLLS>
Restores segments for a a specified list of Microsoft SharePoint site collections.
426Command File Referenceindexcli.exe

-w, --webapp <WEBAPPS><
Restores segments for a specified list of Microsoft SharePoint web applications.
-R <range in months>
Restore all index segments for the specified month range. Specify the monthin the format, YYYY/MM-YYYY/MM. For example, indexcli.exe -r -R
2010/01-2010-03 restores segments from January 2010 to March 2010.
-y Instead of restoring segments, this option displays the list of files that must beavailable before restoring the specified segments.
Re-archive optionsindexcli.exe -u -a ¦ -f <FILERS> ¦
-m <SHARES> ¦ -S <SITECOLLS> ¦ -w <WEBAPPS>
-F <FROM> ¦ -R <RANGE>
-a Re-archives all previously restored index segments.
-f <name of filer(s)>
Re-archives previously restored index segments for the specified list of filers.
-F <month FROM which the segments need to be restored>
Specify the month in the format, YYYY/MM. For example, indexcli.exe -u
-F 2010/01 restores segments from January 2010 till date.
-m <name of share(s)>
Re-archives previously restored index segments for specified list of shares.
-S,--sitecoll <SITECOLLS>
Re-archives previously restored segments for a specified list of MicrosoftSharePoint site collections.
-w, --webapp <WEBAPPS><
Re-archives previously restored segments for a specified list of MicrosoftSharePoint web applications.
-R <range in months>
Restore all index segments for the specified month range. Specify the monthin the format, YYYY/MM-YYYY/MM. For example, indexcli.exe -u -R
2010/01-2010-03 restores segments from January 2010 to March 2010.
EXAMPLESEXAMPLE 1: The following command archives index segments for specified list offilers.
427Command File Referenceindexcli.exe

indexcli.exe -A -f \\filer1,\\filer2,ID1,ID2
EXAMPLE 2: The following command archives index segments for specified list ofshares.
indexcli.exe -A -m \\filer1\share1,\\filer2\shares2,ID3,ID4
EXAMPLE 3: The following command purges index segments for specified list offilers.
indexcli.exe -D -f \\filer1,\\filer2,ID1,ID2
EXAMPLE 4: The following command purges segments for specified list of shares.
indexcli.exe -D -m \\filer1\share1,\\filer2\shares2,ID3,ID4
EXAMPLE 5: The following command restores index segments for specified list offilers.
indexcli.exe -r -f <\\filer1,\\filer2,ID1,ID2>
EXAMPLE 6: The following command restores index segments for specified list ofshares.
indexcli.exe -r -m \\filer1\share1,\\filer2\shares2,ID3,ID4
EXAMPLE 7: The following command re-archives previously restored indexsegments for specified list of filers.
indexcli.exe -u -f \\filer1,\\filer2,ID1,ID2
EXAMPLE 8: The following command re-archives previously restored indexsegments for specified list of shares.
indexcli.exe -u -m \\filer1\share1,\\filer2\shares2,ID3,ID4
EXAMPLE 9: The following command archives segments for specified list ofMicrosoft SharePoint site collections.
indexcli.exe -S,--sitecoll<http://sp_webapp:8000/sc1,ID2,ID3...>
EXAMPLE 10: The following command archives segments for specified list ofMicrosoft SharePoint web applications.
indexcli.exe - w,--webapp<http://sp_webapp:8000,ID2,ID3,...>
EXAMPLE 11: The following command purges segments for specified list of MicrosoftSharePoint site collections.
indexcli.exe -S,--sitecoll<http://sp_webapp:8000/sc1,ID2,ID3...>
428Command File Referenceindexcli.exe

EXAMPLE 12: The following command purges segments for specified list of MicrosoftSharePoint web applications.
indexcli.exe - w,--webapp<http://sp_webapp:8000,ID2,ID3,...>
EXAMPLE 13: The following command displays information for specified list ofMicrosoft SharePoint site collections.
indexcli.exe -S,--sitecoll<http://sp_webapp:8000/sc1,ID2,ID3...>
EXAMPLE 14: The following command displays information for specified list ofMicrosoft SharePoint web applications.
indexcli.exe - w,--webapp<http://sp_webapp:8000,ID2,ID3,...>
EXAMPLE 15: The following command restores segments for specified list ofMicrosoft SharePoint site collections.
indexcli.exe -S,--sitecoll<http://sp_webapp:8000/sc1,ID2,ID3...>
EXAMPLE 16: The following command restores segments for specified list ofMicrosoft SharePoint web applications.
indexcli.exe - w,--webapp<http://sp_webapp:8000,ID2,ID3,...>
EXAMPLE 17: The following command re-archives previously RESTORED segmentsfor specified list of Microsoft SharePoint site collections.
indexcli.exe -S,--sitecoll<http://sp_webapp:8000/sc1,ID2,ID3...>
EXAMPLE 18: The following command re-archives previously RESTORED segmentsfor specified list of Microsoft SharePoint web applications.
indexcli.exe - w,--webapp<http://sp_webapp:8000,ID2,ID3,...>
429Command File Referenceindexcli.exe

reportcli.exereportcli.exe – a utility to create reports using a properties file that contains theinput parameters, execute and list configured reports, check the status of the reports,and cancel report runs.
SYNOPSISreportcli.exe ––list-jobs¦——list-reports¦––list-outputs¦––create
––execute¦––cancel¦––help [OPTIONS]
reportcli.exe –c
reportcli.exe –e
reportcli.exe –h
reportcli.exe –j
reportcli.exe –l
reportcli.exe –o
Optionsreportcli.exe -n -r <name of report> -p <property file path> -u <user
name of creator> [-rt <report type>] [--users <path of users' .csv
file>] [-t <path of .csv file of paths>] [--custodian <path of
custodian' .csv file>]
Creates a report using the properties file in which the input parameters arespecified. The following attributes apply:
Creates a report with the specified name.-r --report <name of report>
Property file containing the inputparameters for the report.
Note: By default, a sample properties fileis installed in theINSTALL_DIR/DataInsight/reports folder.
-p --properties <property filepath>
Creator of the report.-u --creator <user name ofcreator>
Creates the specified report type. Forexample, Activity Details report.
-rt --type <report_type>
430Command File Referencereportcli.exe

Path of the .csv file containing the namesof users in the user@domain,<user group>format.
Specify the path to input user informationfor the report.
--users <path of users' .csvfile>
Path of the .csv file containing the fullyqualified paths of the data for which youwant to create the report.
--paths <path of .csv file ofpaths>
Path of the .csv file that containsinformation about custodians on configuredpaths. The names of the custodians arespecified in the .csv file in the formatuser@domain.
Specify the path to the custodian.csv fileto include custodian information in thereport.
--custodian <path of custodian'.csv file>
–j Lists the report jobs that are currently running.
–l Lists all configured reports.
–o –m <TOP_N> –r <Report Name>
Lists all report outputs. The following attributes apply:
Limits output to specified number of records,and lists the latest output first. If the numberof records is not specified, prints status forthe last run.
–m --max <TOP_N>
Prints the status of jobs for the specifiedreport. You can either specify the report IDor the report name.
–r – –report <Report Name>
Prints the status of jobs for the specifiedreport type.
–rt – –type<Report Type>
report.exe –e [–d <Output_Dir> –r <Report Name> –w <Max_Wait>
Executes report. The following attributes apply:
The generated report output, including theSQLite database is copied to the specifieddirectory. If you specify this option, you donot have to pass the –-w option.
–d --output <Output_Dir>
431Command File Referencereportcli.exe

Executes the specified report. You can eitherspecify the report ID or the report name.
–r --report<Report Name>
Returns the report output only after the reportexecution is complete or the specified waittime in minutes is exceeded. Specify –1 towait forever.
–-w --wait <Max_Wait>
reportcli.exe -e -r <name of report> [-rt <report type>]--p <property
file path> --creator <user name of creator> [--output <Output_Dir>]
[--users <path of users' .csv file>] [--paths <path of .csv file >]
[--wait <MAX_WAIT>] [--custodian <path of custodian' .csv file>]
Executes a report using the properties file in which the input parameters arespecified. The following attributes apply:
Creates a report with the specified name.-r --report <name of report>
Property file containing the inputparameters for the report.
-p -properties <property filepath>
Creator of the report.-u --creator <user name ofcreator>
Path of the .csv file containing the namesof the custodians
--custodian <path ofcustodian.csv>
Copies the report database and output tospecified location.
-d --output <OUTPUT_DIR>
Creates the specified report type. Forexample, Activity Details report.
-rt --type <report_type>
Path of the .csv file containing the namesof users in the user@domain,<user¦group>format.
--users <path of users' .csvfile>
Path of the .csv file containing the fullyqualified paths of the data for which youwant to create the report.
--paths <path of .csv file >
If the wait time is specified, the commandreturns only after the report is executedOR the specified wait time in minutes isexceeded. Specify -1 to wait forever. DataInsight cancels the report execution if thewait time is exceeded.
-w --wait<MAX_WAIT>
432Command File Referencereportcli.exe

Path of the .csv file that containsinformation about custodians on configuredpaths. The names of the custodians arespecified in the .csv file in the formatuser@domain.
Specify the path to the custodian.csv fileto include custodian information in thereport.
--custodian <path of custodian'.csv file>
Reportcli.exe –sa op_excl_path [–ap <FILE_PATH>] –at <ATTRIBUTE NAME>
–av <ATTRIBUTE VALUE>] -ty <ATTRIBUTE TYPE> --path –r <name of report>
-rt <report type>
Creates a report by excluding the paths specified in the .csv file for computingopen shares data on the Data Insight dashboard. The following attributes apply:
Path of the .csv file containing the fullyqualified paths that you want to excludefrom open share computation for thedashboard.
– ap <file path>
Creates the specified report type.-rt --type <report_type>
Creates a report with the specified name.-r --report <name of report>
You can exclude any path on a file server or a SharePoint server from thedashboard data computation. However, Data Insight does not support theexclusion of DFS paths using this method.
report.exe –c –i <JOB_ID>
Cancels execution of the specified report job.
433Command File Referencereportcli.exe

scancli.exescancli.exe – scancli.exe - a utility that scans shares and site collections.
SYNOPSISscancli.exe ––start¦ ––stop¦ ––list-jobs¦ ––help [OPTIONS]
–s ––start
Scans the specified shares or site collections.
–c ––stop
Cancels the scans for specified shares or site collections.
–l ––list-jobs
Lists currently running jobs.
–d ––display
Displays the scan status for specified shares or site collections. To view real timescan queue information, use the –l ––list-jobsoption.
–h ––help
Displays help.
Scan optionsscancli.exe –s –a ¦ –f <FILERS> ¦ –m <SHARES> ¦ –S <SITECOLLS> ¦w <WEBAPPS>
[–D] [–e <EXCLUDE] [–F ¦ –N ¦ –p] [–I <INCLUDE>] [–i <DAYS>] [–t]
–a – – all
Scans all shares and site collections.
–D – –disabled
By default, disabled devices or those for which scanning has been disabledare not included in the scan. Specify this option to include shares or sitecollections of disabled devices.
–e – –exclude <EXCLUDE>
Exclude shares or site collections matching specified patterns. Separate multiplepatterns with a comma. You can specify one or more wildcards in the pattern,for example, vol*,*$.
434Command File Referencescancli.exe

–f – –filer <FILERS>
Scans shares of the specified filers. For example, –f – –filer >\\filer1,
filer2, ID1,..>.
–F – –failed
Select the shares or site collections whose last scan failed completely. Thisdoes not include those shares or site collections that have never been scannedbefore or those which succeeded partially (*).
–I – –Include <INCLUDE>
Include the shares or site collections matching the specified patterns. Separatemultiple patterns with a comma. You can specify one or more wildcards in thepattern. For example, –I – –Include >vol*,*$ >
–i – –interval <DAYS>
Select the shares or site collections that have not been scanned for specifiednumber of days. This includes shares or site collections which have never beenscanned before (*).
–m – –share <SHARES>
Scans specified list of shares. For example, –m – –share >\\filer1\share1,
share2, ID3...>.
–n – –never
Select the shares or site collections that have never been scanned before (*).
–p – –partial
Select the shares or site collections whose last scan succeeded partially, thatis, those shares or site collections for which the scan is complete but with failureto fetch information for some paths (*).
–S – –sitecoll <SITECOLLS>
Scans the specified list of Microsoft SharePoint site collections.
– t – –top
Adds shares or site collections to top of the scan queue.
–w – –webapp <WEBAPPS>
Scans site collections for specified list of Microsoft SharePoint web applications.
Note: (*) indicates that the option can only be used on the Management Server.
Stop scan optionsscancli.exe –l –a ¦ –f <FILERS> ¦ –m <SHARES> ¦ –S <SITECOLLS> ¦w <WEBAPPS>
[–D] [–e <EXCLUDE] [–I <INCLUDE>]
435Command File Referencescancli.exe

–a – – all
Stops scans for all shares and site collections.
–e – –exclude <EXCLUDE>
Exclude shares or site collections matching specified patterns. Separate multiplepatterns with a comma. You can specify one or more wildcards in the pattern,for example, vol*,*$.
–f – –filer <FILERS>
Stops scans for shares of the specified filers.
–I – –Include <INCLUDE>
Include shares or site collections matching the specified patterns. Separatemultiple patterns with a comma. You can specify one or more wildcards in thepattern.
–m – –share <SHARES>
Stops scans for the specified list of shares.
–S – –sitecoll <SITECOLLS>
Stops scans for the specified list of Microsoft SharePoint site collections.
–w – –webapp <WEBAPPS>
Stops scans for site collections for specified list of Microsoft SharePoint webapplications.
List job optionsscancli.exe –l [–n ––node <NODE>]
–n ––node <Node ID or Node name>
Lists scan jobs on the specified node. Specify either node ID or node name. Ifnot specified, localnode is assumed.
Display optionsscancli.exe –d –a ¦ –f <FILERS> ¦ –m <SHARES> ¦ –S <SITECOLLS> ¦w <WEBAPPS>
[–D] [–e <EXCLUDE] [–F ¦ –N ¦ –p] [–I <INCLUDE>] [–i <DAYS>]
–a – – all
Displays scan status for all shares and site collections.
–e – –exclude <EXCLUDE>
Exclude shares or site collections matching specified patterns. Separate multiplepatterns with a comma. You can specify one or more wildcards in the pattern,for example, vol*,*$.
436Command File Referencescancli.exe

–f – –filer <FILERS>
Displays scan status for the shares of the specified filers.
–F – –failed
Displays scan status for the shares or site collections whose last scan failedcompletely. The scan status does not include those that have never beenscanned before or those which succeeded partially (*).
–I – –Include <INCLUDE>
Include shares or site collections matching the specified patterns. Separatemultiple patterns with a comma. You can specify one or more wildcards in thepattern.
–i – –interval <DAYS>
Displays scan status for the shares or site collections that have not beenscanned for specified number of days. The scan status includes the shareswhich have never been scanned before (*).
–m – –share <SHARES>
Displays scan status for specified list of shares.
–n – –never
Displays scan status for the shares or site collections that have never beenscanned before (*).
–p – –partial
Displays scan status for the shares or site collections whose last scansucceeded partially, that is, those shares or site collections for which the scanis complete but with failure to fetch information for some paths (*).
–S – –sitecoll <SITECOLLS>
Displays scan status for the specified list of Microsoft SharePoint site collections.
–w – –webapp <WEBAPPS>
Displays scan status for the site collections for specified list of MicrosoftSharePoint web applications.
Note: –w – –webapp <WEBAPPS> option can only be used on the ManagementServer.
ExamplesEXAMPLE 1: The following command scans all shares of a filer, netapp1.
scancli – –start – – filer <netapp1>
437Command File Referencescancli.exe

EXAMPLE 2: The following command scans all shares and site collections for whicha full scan failed 3 or more days ago.
scancli – –start – –all – –failed – –ineterval <3>
The following command scans all site collections of a web application that have notbeen scanned for the past 30 days or have never been scanned.
scancli – –start – –webapp https://sitecoll:8080 – –interval 30
438Command File Referencescancli.exe

installcli.exeinstallcli.exe – A utility that is used to configure multiple Windows File Serversand Data Insight worker nodes simultaneously.
SYNOPSISinstallcli [-w winnas_csv [-q]] [-n node_csv [-q]] [-p operation_token]
[-l] [-h]
Options-w --winnas winnas_csv
Installs Data Insight Windows File Server agents and configures thecorresponding filer.
-w option uses a .csv file with the following details as input:
■ The host name or IP address of the Windows File Server that you wantData Insight to monitor.
■ The host name, IP address, or ID of the Collector node that is configuredto scan the filer.
■ The host name, IP address, or ID of the Indexer node that is configured forthe filer.
■ The credentials that Data Insight should use to install the agent on theWindows File Server. The credential should be in the format [email protected] also accepts Local System credentials as value _LOCAL_.The same credentials must be added to Data Insight as a saved credentialpreviously.
■ True or false value indicating if the filer is clustered.
■ The IP addresses of the agents. Separate multiple IP addresses with asemi-colon. If you do not want to use an agent to monitor the filer, indicatethis with a hyphen (-).
■ The credentials required to scan the filer. The credential should be in theformat user@domain. The same credentials should be added to Data Insightas a saved credential previously.
■ In case of a Windows File Server agent upgrade, RP or Full value indicatingthe type of upgrade you want to perform. This parameter is optional.Optionally, the name of the installer. If not specified, an appropriate onewill be picked up from installers folder on the collector.
439Command File Referenceinstallcli.exe

■ True or false value indicating whether event monitoring should be enabled.For example,winnas.company.com,collector.company.com,indexer.company.com,Administrator@DOMAIN,FALSE,winnas.company.com,Administrator@DOMAIN,TRUE,TRUE,RP,Veritas_DataInsight_windows_winnas_5_1_3002_x64.exe.
■ True or false value indicating whether the scan should be enabled accordingto the specified schedule.
-n --node node_csv
Installs the Data Insight Collector and Indexer nodes. The node_csv file mustbe in the following format:
■ The host name or IP address of the worker node that you want to install orupgrade.
■ True or false value indicating whether the node is a Collector. Since DataInsight does not currently support push-install on Linux nodes, you mustspecify true as that value for this column. I
■ True or false value indicating whether the node is a Indexer.
■ The credentials that Data Insight should use to install the package on theworker node. The credential should be in the format user@domain. Thesame credentials must be added to Data Insight as a saved credentialpreviously.
■ The port used by the DataInsightComm service.
■ The port used by DataInsightConfig service.
■ The destination directory where you want Data Insight to be installed.
■ The location where you want to store the product data.
The values for the Communication service port, query service port, theinstallation path, and the data directory are optional. You can enter ? to usedefault values.
-p --poll operation_token
Starts polling for the latest status of an operation.
-l --list
Lists status and progress information of all currently running and historicoperations.
-q --nowait
Forks off an operation and does not wait for it to complete.
-h --help
Displays help.
440Command File Referenceinstallcli.exe

Data Insight jobsThis appendix includes the following topics:
■ Scheduled Data Insight jobs
Scheduled Data Insight jobsEach Data Insight service performs several actions on a scheduled basis. Theseservices are called jobs. The section explains the function of the important jobs thatrun in various services. The schedule for few jobs can be changed from theAdvanced Settings tab of the Server details page.
Table D-1 Communication service jobs
DescriptionJob
Initiates the adcli process on the Management Server to scan the directory servers.Ensure the following:
■ The directory servers are added to the Data Insight configuration.■ The credentials specified when adding the directory server have permissions to
scan the directory server.
ADScanJob
Initiates the collector process to pre-process raw audit events received from storagedevices. The job applies exclude rules and heuristics to generate audit files to be sentto the Indexers. It also generates change-logs that are used for incremental scanning.
CollectorJob
The CollectorJob generates changelog files containing list of changed paths, oneper device, in the changelog folder. There cab be multiple files with differenttimestamps for each device. The ChangeLogJob merges all changelog files for adevice.
ChangeLogJob
DAppendix

Table D-1 Communication service jobs (continued)
DescriptionJob
Initiates the scanner process to scan the shares and site collections added to DataInsight.
Creates the scan database for each share that it scanned in the data\outbox folder.
ScannerJob
Intiates the incremental scan process for shares or site-collections for paths that havechanged on those devices since the last scan.
IScannerJob
Runs only on the Management Server. It creates the database containing the data forDLP Incident Management, Entitlement Review, and Ownership Confirmation workflowsbased on the input provided by users.
CreateWorkflowDBJob
Retrieves policies and sensitive file information from Data Loss Prevention (DLP).DlpSensitiveFilesJob
Transfers the files from the data\outbox folder from a node to the inbox folder ofthe appropriate node.
FileTransferJob
Runs every 10 seconds on the Windows File Server.
Routes content file and CSQLite file to the assigned Classification Server.
FileTransferJob_content
Sends Data Insight events database from the worker node to the Management Server.FileTransferJob_Evt
Transfers workflow files from Management Server to the Portal service.FileTransferJob_WF
Runs on all Data Insight nodes once every minute.
It distributes the classification events between Data Insight nodes.
FileTransferJob_classify
Runs on the Indexer node; initiates the idxwriter process to update the Indexer databasewith scan (incremental and full), tags, and audit data.
After this process runs, you can view newly added or deleted folders and recent accessevents on shares on the Management Console.
IndexWriterJob
Runs on the Indexer node; It updates the activity index every time the index for a shareor site collection is updated.
The Activity index is used to speed up the computation of ownership of data.
ActivityIndexJob
Verifies the integrity of the index databases on an Indexer node.IndexCheckJob
Sends the heartbeat every minute from the worker node to the Data InsightManagement Server.
PingHeartBeatJob
Runs on the Management Server. It monitors the heartbeat from the worker nodes;sends notifications in case it does not get a heartbeat from the worker node.
PingMonitorJob
442Data Insight jobsScheduled Data Insight jobs

Table D-1 Communication service jobs (continued)
DescriptionJob
Runs on the worker nodes and on the Management Server. Monitors the CPU, memory,and disk space utilization at a scheduled interval. The process sends notifications tothe user when the utilization exceeds a certain threshold value.
SystemMonitorJob
Discovers shares, site collections, or equivalent on the devices for which you haveselected the Automatically discover and monitor shares on this filer check boxwhen configuring the device in Data Insight
DiscoverSharesJob
Checks the changes to the pause and resume settings on the Data Insight servers,and accordingly pauses or resumes scans.
ScanPauseResumeJob
Enforces the data retention policies, which include archiving old index segments anddeleting old segments, indexes for deleted objects, old system events, and old alerts.
DataRetentionJob
Runs on the Management Server and executes the command voldb.exe --index whichconsumes the device volume utilization information it receives from various Collectornodes.
IndexVoldbJob
Sends the node information, such as the operating system, and the Data Insight versionrunning on the node to the Management Server. You can view this information on theData Insight Server > Overview page of the Management Console.
SendNodeInfoJob
Runs on the Management Server and sends email notifications as configured in DataInsight.The email notifications pertain to events happening in the product, for example,a directory scan failure. You can view them on the Settings > SystemOverview pageof the Management Console.
EmailAlertsJob
Runs on the Collector node that monitors configured file servers and SharePointservers. In case of a Windows File Server that uses agent to monitor access events,it runs on the node on which the agent is installed.
It scans the local users and groups on the storage devices.
LocalUsersScanJob
Runs on the Indexer node and updates the custodian information in the Data Insightconfiguration.
UpdateCustodiansJob
Compresses the attic folder and err folders in <datadir>\collector,<datadir>\scanner, and <datadir>\indexer folders. The process uses theWindows compression feature to set the "compression" attribute for the folders.
The job also deletes stale data that's no longer being used.
CompactJob
Compresses the folders that store report output.Compact_Job_Report
On the Indexer node, it records index size statistics to lstats.db. The informationis used to display the filer statistics on the Data Insight Management Console.
StatsJob
443Data Insight jobsScheduled Data Insight jobs

Table D-1 Communication service jobs (continued)
DescriptionJob
Rolls up (into hourly, daily and weekly periods) the published statistics. On the Collectornodes for Windows Filer Server, the job consolidates statistics from the filer nodes.
MergeStatsJob
Publishes statistics related to the size of the index.StatsJob_Index_Size
On the Collector node, it records the filer latency statistics for NetApp filers.StatsJob_Latency
Gets current scan status from all Collector nodes. The scan status is displayed on theSettings > Scanning Dashboard > In-progress Scans tab of the ManagementConsole.
SyncScansJob
Enables auditing for site collections (within the web application), which have beenadded to Data Insight for monitoring.
By default, the job runs every 10 minutes.
SPEnableAuditJob
Collects the audit logs from the SQL Server database for a SharePoint web applicationand generates SharePoint audit databases in Data Insight.
SPAuditJob
Scans the site collections at the scheduled time and fetch data about the documentand picture libraries within a site collection and within the sites in the site collection.
SPScannerJob
Maps every UID in raw audit files for NFS and VxFS with an ID generated for use inData Insight. Or generates an ID corresponding to each User and Group ID in rawaudit files received from NFS/VxFS.
NFSUserMappingJob
Collects statistics information for all indexers on the Indexer.MsuAuditJob
Checks whether a filer migration is in process and carries it out.MsuMigrationJob
Processes all the Data Insight events received from worker nodes and adds them tothe yyyy-mm-dd_events.db file on the Management Server.
ProcessEventsJob
Processes scan error files.ProcessEventsJob_SE
Spools events on worker nodes to be sent to Management Server.SpoolEventsJob
Merges the workflow and action status updates for remediation workflows (DLP IncidentRemediation, Entitlement Reviews, Ownership Confirmation), Enterprise Vault archiving,and custom actions and update the master workflow database with the details so thatusers can monitor the progress of workflows and actions from the ManagementConsole.
WFStatusMergeJob
Reconfigures jobs based on the configuration changes made on the ManagementServer.
UpdateConfigJob
444Data Insight jobsScheduled Data Insight jobs

Table D-1 Communication service jobs (continued)
DescriptionJob
Fetches the audit records from the Hitachi NAS EVS that are configured with DataInsight.
By default, this job runs in every 5 seconds.
DeviceAuditJob
Enables the Security Access Control Lists (SACLs) for the shares when a Hitachi NASfiler is added.
By default, this job runs in every 10 minutes.
HNasEnableAuditJob
This service reads the request file created on the Management Server when a RecordsClassification workflow is submitted from the Portal. The request file contains the pathson which an Enterprise Vault action is submitted. When the action on the paths iscomplete, the job updates the request file with the status of the action.
By default, this job runs in every 1 hour.
WorkflowActionExecutionJob
Runs on each Indexer. The job updates hashes used to compute the user risk score.
By default, the job runs at 2:00 A.M. everyday.
UserRiskJob
Runs only on the Management Server. It is used to update the workflow auditinformation in <DATA_DIR>/workflow/workflow_audit.db.
By default, this job runs every 1 minute.
UpdateWFCentralAuditDBJob
Parses the CSV file containing tags for paths. Imports the attributes into Data Insightand creates a Tags database for each filesystem object.
By default, this job runs once every day.
TagsConsumerJob
Run the job on demand to change the encryption keys. It is not an automaticallyscheduled job.
It is recommended to run this job after the Data Insight servers including Windows FileAgent server is upgraded to 5.2.
If you want to run the KeyRotationJob without upgrading all the servers, restart allservices on the servers that have not been upgraded after the KeyRotationJob isexecuted and the configuration database is replicated on these servers.
KeyRotationJob
Runs on each Indexer and computes the number of files accessible and number ofsensitive files accessible to each user on each share.
This job runs every day at 11.00 P.M. by default.
RiskDossierJob
Runs every 10 seconds on the Management Server.
The job processes the classification requests from the Data Insight console and fromreports for the consumption of the book keeping database.
ClassifyInputJob
445Data Insight jobsScheduled Data Insight jobs

Table D-1 Communication service jobs (continued)
DescriptionJob
Runs every minute on the Indexer.
The job splits the classification batch input databases for the scanner's consumption,which are later pushed to the Collector.
ClassifyBatchJob
Runs once every minute on the Indexer node.
Updates the index with classification tags and also updates the status of the bookkeeping database.
ClassifyIndexJob
Runs once every minute on the Management Server.
The job calls the files with the classification update status that are received from eachindexer. These files are automatically created on the indexer whenever updates areavailable. It also updates the global book keeping database that is used to show highlevel classification status on the Console.
ClassifyMergeStatusJob
Runs once every 70 seconds on the Collector.
Collects the audit data for site collections (within the SharePoint Online account), whichhave been added to Data Insight for monitoring.
CloudDeviceAuditJob_sponline
Runs once every 70 seconds on the Collector.
Fetches the audit records for the OneDrive accounts that are configured with DataInsight.
CloudDeviceAuditJob_onedrive
Runs once every 1 minute on the Indexer to evaluate configured Real-time Data ActivityUser Whitelist-based and Data Activity User Blacklist-based policies and generatesalerts.
RTWBJob
The following processes run in the Data Insight WatchDog service
Table D-2 WatchDog service jobs
DescriptionJob
Runs only on the Management server.Fetches performance related statistics fromall other servers.
SyncPerformanceStatsJob -
Gathers statistics like disk usage, CPU,memory usage.
SystemMonitorJob
Gathers statistics for unprocessed backlogfiles.
SystemMonitorJob_backlog
446Data Insight jobsScheduled Data Insight jobs
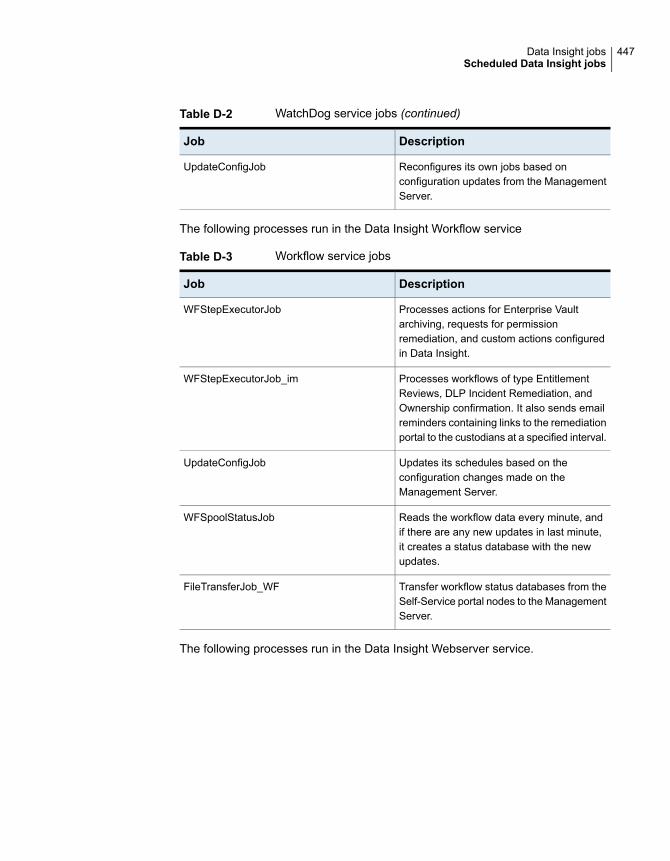
Table D-2 WatchDog service jobs (continued)
DescriptionJob
Reconfigures its own jobs based onconfiguration updates from the ManagementServer.
UpdateConfigJob
The following processes run in the Data Insight Workflow service
Table D-3 Workflow service jobs
DescriptionJob
Processes actions for Enterprise Vaultarchiving, requests for permissionremediation, and custom actions configuredin Data Insight.
WFStepExecutorJob
Processes workflows of type EntitlementReviews, DLP Incident Remediation, andOwnership confirmation. It also sends emailreminders containing links to the remediationportal to the custodians at a specified interval.
WFStepExecutorJob_im
Updates its schedules based on theconfiguration changes made on theManagement Server.
UpdateConfigJob
Reads the workflow data every minute, andif there are any new updates in last minute,it creates a status database with the newupdates.
WFSpoolStatusJob
Transfer workflow status databases from theSelf-Service portal nodes to the ManagementServer.
FileTransferJob_WF
The following processes run in the Data Insight Webserver service.
447Data Insight jobsScheduled Data Insight jobs

Table D-4 Webserver service jobs
DescriptionJob
Periodically runs the custodian summaryreport, which is used to determine thecustodians assigned in Data Insight forvarious resources. The output produced bythis report is used in DLP IncidentRemediation, Entitlement Review, andOwnership Confirmation workflows.
CustodianSummaryReportJob
Periodically creates a report summarizinghealth of the entire deployment, and stores itto log/health_audit folder on theManagement Server. The report aids VeritasSupport to troubleshoot issues on your setup.
HealthAuditReportJob
Evaluates configured policies in the systemand raises alerts.
PolicyJob
Deletes older report outputs.PurgeReportsJob
Updates configuration database on the workernodes based on the configuration changesmade on the Management Server.
UpdateConfigJob
Consolidates user activity and permissionmap from all indexers.
UserIndexJob_merge
Requests each Indexer for user activity andpermission map.
UserIndexJob_split
This job runs on the Management Server. Itsdefault schedule is 6:00 A.M. every day. Thejob combines data from all MSUs into a singlerisk score value for each user. This jobcreates the userrisk_dashboard.db inthe DATA_DIR\conf folder.
UserRiskMergeJob
The following processes run in the Data Insight Classification service.
448Data Insight jobsScheduled Data Insight jobs

Table D-5 Classification service jobs
DescriptionJob
Runs every minute on the server that is assigned the role ofa Classification Server.
It searches the classification/inbox folder for theinput files and adds them to the priority queues. One inputfile can result in multiple snapshots with the name<PRIORITY>_<CRID>_<BATCHID>_<NODEID>_<MSUID>_<TIMESTAMP>_snap<N>.csqlite.The input file contains the location where the actual file hasbeen kept in the classification/content folder. The job alsokeeps a list of files that could not be fetched.
Note: Error logs are created in the <Installdirectory>/log/fetch folder.
ClassifyFetchJob
Runs once every minute on any node that acts as theClassification Server.
Refreshes the pause or resume status of fetch jobs as perthe duration configured for content fetching.
ClassifyFetchPauseJob
Runs every 20 seconds in Communication Service andClassification Service.
Fetches the list of classification requests that are cancelledand distributes this request between Data Insight nodes.
Before classifying files, all the classification jobs consult thislist to identify the requests that are marked for cancellation.If they observe any canceled request in the new request thatis submitted for classification, then that request is deleted.
CancelClassifyRequestJob
Runs once every minute on any node that acts as aClassification Server.
Checks the classification/inbox folder for input filessubmitted for classification folder and adds them to threeseparate priority queues. It picks a file from the highest queuein FIFO order, and starts classifying content using VeritasInformation Classifier. All files in that input file are submittedfor classification. Once all paths in the file have beenclassified, result of the classification and any resulting errorsare written to a database in the classification/outboxfolder.
ClassifyJob
449Data Insight jobsScheduled Data Insight jobs

Table D-5 Classification service jobs (continued)
DescriptionJob
Runs every ten seconds on the Management Server.
It ensures that Data Insight configuration database is in syncwith the Classification Policy Manager.
UpdateVICPolicyMapJob
Reconfigures jobs based on the configuration changes madeon the Management Server.
UpdateConfigJob
Runs once every week on Sunday at 00.01 A.M. on theIndexer.
Checks if sufficient classified data is available for thesupervised learning algorithm to create predictions (trainingsets).
The job has a multi-threaded execution framework whichexecutes actions in parallel. The default thread count is 2.You can set the value using thematrix.classification.sl.features.threadsproperty at global or node level.
Note: The node level property always takes precedenceover the global level property.
CreateFeaturesJob
Runs once every week on Sunday at 05.00 A.M. on theIndexer.
Copies the prediction files from the temp output directory toa classification outbox.
PredictJob
Runs every 2 hours on the Indexer.
The job creates batches of files for the consumption ofVeritas Information Classifier. These files are classified withhigh priority.
SLCreateBatchesJob
450Data Insight jobsScheduled Data Insight jobs

Table D-5 Classification service jobs (continued)
DescriptionJob
Runs every one minute on the server that is assigned therole of a Classification Server. This job is enabled only onthe master Classification Server.
Checks the classification or workload folder on masterClassification Server and counts batches based on theirpriority. If the workload needs to be distributed, the jobfetches a list of servers’ in it its pool and fetches the numberof batches based on their priority in the classificationor inbox folder. If the number of batches on any slave thathave priority less than 10, then the job distributes the batchesacross that slave and copies them to the slave's theclassification or inbox folder.
ClassifyManageWorkloadJob
See “Monitoring Data Insight jobs” on page 106.
451Data Insight jobsScheduled Data Insight jobs

TroubleshootingThis appendix includes the following topics:
■ About general troubleshooting procedures
■ About the Health Audit report
■ Location of Data Insight logs
■ Downloading Data Insight logs
■ Migrating the data directory to a new location
■ Enterprise Vault exceptions and their meanings
■ Troubleshooting FPolicy issues on NetApp devices
■ Troubleshooting EMC Celera or VNX configuration issues
■ Troubleshooting EMC Isilon configuration issues
■ Troubleshooting SharePoint configuration issues
■ Troubleshooting Hitachi NAS configuration issues
■ Troubleshooting installation of Tesseract software
About general troubleshooting proceduresThis section provides an overview of the general troubleshooting procedures thatyou can use to help discover and troubleshoot common problems.
You can use the Events page on the Data Insight Management Console to get aquick overview of the node on which the error has occurred.
To troubleshoot a problem, it helps to consider the following:
■ Check for prior occurrence.
EAppendix

Check existing troubleshooting information to see if the problem has occurredbefore and if there is a workaround available to troubleshoot the same. A goodsource for this type of information is the Veritas Data Insight Release Notes.The Release Notes contain a list of known issues for Data Insight and a list ofpossible workaround.
■ Consider recent alterations.If a system is having problems immediately after some kind of maintenance,software upgrade, or other change, the problem might be linked to thosechanges.
Data Insight runs a daily health audit report that helps you identify potential problemsin your environment.
About the Health Audit reportThe Health Audit report gives you an overall status of the heath of Data Insightdeployment. You can use the report to identify potential problems in the systemand proactively take measures to fine tune the system settings. The report aidsVeritas Support to troubleshoot issues on your setup.
The HealthAuditReportJob periodically creates the report at 5:00 A.M. daily andstores it on the log/health_audit folder.
Location of Data Insight logsVeritas Data Insight log files are located in the Data Insight installation directory,<INSTALLDIR>\log. Typically, the installation directory is located at C:\ProgramFiles\DataInsight\log. On Linux, the logs are located at/INSTALL/DataInsight/log
Table E-1 describes the logs that are relevant for troubleshooting.
Table E-1 Data Insight logs
This file contains the log messages from the Webservice process.
webserver0.0.log
This file contains the log messages from the schedulercommunication service.
commd0.0.log
This file contains the log messages from the ActiveDirectory scanner process, adcli.exe.
adcli.log
This file contains the log messages forDataInsightCelerra service.
celerrad.log
453TroubleshootingAbout the Health Audit report

Table E-1 Data Insight logs (continued)
This file contains the log messages for various commandline utilities.
cli0.0.log
This file contains the log messages for the auditpre-processor (collector.exe).
collector.log.N
This file contains the log messages for the Dashboarddata generation report.
dashboard.log
This file contains the log messages for LDAP, NIS, NIS+Directory scanner.
dscli0.0.log
This file contains the log messages for Full file systemscans.
scanner/extN_msuN.log
This file contains the log messages for Incremental filesystem scans.
scanner/extN_msuN.ilog
This file contains the log messages for parallel scanner.
Note: These logs are located in<INSTALLDIR>\log\scanner folder.
sv3_<extrac_id>_<msu_id>_<process_id>_<timestamp>.log
This file contains the log messages forDataInsightFpolicy service.
fpolicyd.log
This file contains log of index integrity check.idxcheck.log
This file contains log messages for index updaterprocess.
indexer/index-N.log
This file contains log messages for local users scanningprocess.
localusers.log
This file contains log messages for Data Insight policyevaluation process.
mxpolicy.log
This file contains log messages for DataInsightConfigservice.
queryd.log
This file contains log messages for SharePoint auditfetching utility.
sharepoint_audit.log
This file contains log messages of the upgrade utility.upgradecli0.0.log
This file contains log messages of the upgrade process.upgrade_to_X.log
This file contains log messages of Veritas InformationClassifier.
vic.log
454TroubleshootingLocation of Data Insight logs

Table E-1 Data Insight logs (continued)
This file contains log messages of the interaction thathappens between Veritas Information Classifier andData Insight.
vic.0.0.log
This file contains log messages of DataInsightWatchdogservice.
watchdog0.0.log
This file contains log messages of DataInsightWinnasservice.
winnasd.log.0
This file contains log messages of windows sharediscovery utility.
winnas_util.log
This file contains log messages from theDataInsightWorkflow service.
workflowd0.0.log
This file contains log messages from the BIRT utility
Note: This log file shows an exception “Could not loadSQLite driver,” however this is by design and should beignored as the SQLite driver is infact loaded.
birt.log
This file contains log messages of Veritas InformationClassifier.
vic.log
This file contains log messages of the interaction thathappens between Veritas Information Classifier andData Insight.
vic.0.0.log
Downloading Data Insight logsTo troubleshoot errors, you can download the Data Insight logs relevant to a fileserver, share, SharePoint web application, or SharePoint site collection from theSettings tab of the Management Console.
To download Data Insight logs
1 On the relevant listing page, click the Select Action drop-down, and selectDownload Logs for the data repository you want to troubleshoot.
2 On the Download Logs pop-up, select the check box for the information thatyou want to include in the logs.
You can select one or all of the following information:
■ Config database - Select this option to include the configuration databasein the download. Secret information, such as passwords are purged fromthe copied database.
455TroubleshootingDownloading Data Insight logs

■ Indexer database - Select this option to include the index for the problematicshares or site collections in the download.
■ Error files - Select this option to include scan or audit files that have notbeen indexed in the download.
■ User database - Select this option to include the cached Active Directoryinformation in the download.
Note: Contact Veritas Support to help you determine which of these options youshould select when troubleshooting an issue.
Migrating the data directory to a new locationThe data directory is the location where a Data Insight server stores the productdata. You specify the location of the data directory during the Data Insight installation.You can find out the current location of the data directory by reading thedatadir.conf file that is located at C:\Program Files\Veritas\DataInsight\.
To move the data directory from its current location
1 Stop all the Data Insight services that are running on the server.
2 Navigate to C:\Program Files\Veritas\DataInsight\ and open the filedatadir.conf in a text editor. Note the current location of the data directory.For example, matrix.datadir=C:/DataInsight/data.
3 Edit the value for the parameter matrix.datadir to indicate the new location ofthe data directory. For example, matrix.datadir=E:/DataInsight/data.
4 Copy the folder,$DATADIR/data, from the old location to the new location. Forexample, copy the folder from the original location C:/DataInsight to the newlocation E:/DataInsight.
Note: If you choose to rename the data directory, do not use any space in thefilename. Doing so will prevent the Data Insight services from starting.
5 Navigate to C:\Program Files\Veritas\DataInsight\bin using the commandprompt. Execute the following command:
configdb -c
6 Verify that the command output points to the new data directory location.
456TroubleshootingMigrating the data directory to a new location

7 Execute the command configdb -p -T node.
Verify that the command output lists all the Data Insight servers that are in yourdeployment.
8 Start the Data Insight services on the server.
9 After all Data Insight services start successfully, delete the original datadirectory.
Enterprise Vault exceptions and their meaningsSometimes, when you initiate an archive operation from the Data InsightManagement Console, using the Enterprise Vault, you may encounter errormessages. Here is a list of possible error messages and their description:
Table E-2 Enterprise Vault errors and descriptions
DescriptionException
This error can arise when a large number offiles are sent for archiving in a single batch.This causes an overflow of the product buffer.
Exception in methodArchive:System.ServiceModel.CommunicationException:The maximum message size quotafor incoming messages (65536) hasbeen exceeded. To increase thequota, use theMaxReceivedMessageSize propertyon the appropriate bindingelement. ---> System.ServiceModel.QuotaExceededException: Themaximum message size quota forincoming messages (65536) has beenexceeded. To increase the quota,use the MaxReceivedMessageSizeproperty on the appropriatebinding element.
457TroubleshootingEnterprise Vault exceptions and their meanings

Table E-2 Enterprise Vault errors and descriptions (continued)
DescriptionException
This error occurs when the Enterprise VaultAdmin service is down or the Enterprise Vaultserver is unreachable. For instance, whenthe disk on the Enterprise Vault server vaultstore is full, all the Enterprise Vault servicesare stopped. This could also occur if the nameof Enterprise Vault server, protocol, or portare specified incorrectly.
If the AdminService is not down, still this errorcan arise if the EVFileSvrArcMngr service isnot running.
Exception in methodGetFileServerShares:System.ServiceModel.EndpointNotFoundException: There was noendpoint listening athttp://10.209.108.73/EnterpriseVault/FileSystemArchivingAPI that couldaccept the message. This is oftencaused by an incorrect address orSOAP action. See InnerException,if present, for more details. --->System.Net.WebException: Theremote server returned an error:(404) Not Found. 2013-05-0703:37:51 INFO: #{27}[ArchiveStep.archiveFiles][ARCHIVE OUT] --- End of innerexception stack trace ---2013-05-07 03:37:51 INFO: #{27}[ArchiveStep.archiveFiles][ARCHIVE OUT] at System.ServiceModel.Channels.HttpChannelUtilities.ProcessGetResponseWebException(WebExceptionwebException, HttpWebRequestrequest, HttpAbortReasonabortReason)
458TroubleshootingEnterprise Vault exceptions and their meanings

Table E-2 Enterprise Vault errors and descriptions (continued)
DescriptionException
This error occurs when the internal servicesof the Enterprise Vault times out when youtry to archive a batch of files. To resolve thisproblem, you can consider changing the sizeof batch to a smaller value. Also you canconsider reducing the number of files that aresent in a batch.
Alternatively, you can change the timeoutvalues in the configuration for the EnterpriseVault. To change the timeout value:
1 Open theEvFileSvrArcMngr.exe.configfile.
2 Set the appropriate value for the key“<add key="OperationTimeoutInMin"value = "60"/>
[Exception in methodArchive:System.ServiceModel.FaultException`1[www.symantec.com.EnterpriseVault.API.FileSystemArchiving.Data.ExecutionFailedFault]: Thisrequest operation sent tonet.tcp://evserver1.tulip.matrixad.local:5114/TaskService/10E7B53932AB5754980C95B4591BC72171012f00evserver1 did notreceive a reply within theconfigured timeout (00:30:00).The time allotted to thisoperation may have been a portionof a longer timeout. This may bebecause the service is stillprocessing the operation orbecause the service was unable tosend a reply message. Pleaseconsider increasing the operationtimeout (by casting thechannel/proxy to IContextChanneland setting the OperationTimeoutproperty) and ensure that theservice is able to connect to theclient. (Fault Detail is equal towww.symantec.com.EnterpriseVault.API.FileSystemArchiving.Data.ExecutionFailedFault).]
459TroubleshootingEnterprise Vault exceptions and their meanings

Table E-2 Enterprise Vault errors and descriptions (continued)
DescriptionException
This error occurs at random.
To resolve this problem, re-run the failedarchive operation. If you are an Data Insightadministrator user, you can re-run the archiveoperation from the Settings >Action Statuspage of the Management Console.See“Viewing and managing the status of anoperation” on page 393.
Executing Function Archive:Exception in methodArchive:System.ServiceModel.FaultException`1[www.symantec.com.EnterpriseVault.API.FileSystemArchiving.Data.TimeoutFault]: TheFile System Ar chiving taskservice failed to start. Checkthat the File System Archivingtask service is enabled in theconfiguration file,<Enterprise_Vault_installation_folder>\EvFSAArchivingTask.exe.config. (Fault Detail isequal to www.symantec.com.EnterpriseVault.API.FileSystemArchiving.Data.TimeoutFault).
This error occurs when the Enterprise Vaulttask controller service cannot be reached forsome reason.
2013-03-21 11:17:27 WARNING:Archive: Got exception whilearchiving -System.ServiceModel.FaultException 1[www.symantec.com.EnterpriseVault.API.FileSystemArchiving.Data.ServerTemporaryUnavailableFault]: Unable tocontact the Enterprise Vault TaskController service. Check thatthe service is running. (FaultDetail is equal towww.symantec.com.EnterpriseVault.API.FileSystemArchiving.Data.ServerTemporaryUnavailableFault).
460TroubleshootingEnterprise Vault exceptions and their meanings

Table E-2 Enterprise Vault errors and descriptions (continued)
DescriptionException
This error occurs when you attempt tore-archive an already archived file, but theplaceholder service on the File SystemArchiving (FSA) agent is not running.
To resolve this problem, run the placeholderservices on the FSA agent and attempt toarchive the file again.
Exception in methodArchive:System.ServiceModel.FaultException 1[www.symantec.com.EnterpriseVault.API.FileSystemArchiving.Data.ExecutionFailedFault]:Internal error occurred. InternalError : <Error checking if file:\\?\UNC\vnxemc.tulip.matrixad.local\Share4EV\Public ShareCopy\Ganesh\di automaation\logs3\DI_Automation\Library\Copy(3) ofKeyAction\Action1\SnapShots\ssf35f0.html.z is a placeholderfile.> (Fault Detail is equal towww.symantec.com.EnterpriseVault.API.FileSystemArchiving.Data.ExecutionFailedFault)
This error occurs when you restart the DataInsight services, while Data Insight is stillprocessing an archiving operation.
To resolve this error, make sure that the FileSystem Archiving (FSA) task and EnterpriseVault services are running.
[Exception in method Archive:System.Web.Services.Protocols.SoapException: The socketconnection was aborted. This couldbe caused by an error processingyour message or a receive timeoutbeing exceeded by the remote host,or an underlying network resourceissue. Local socket timeout was''''00:29:59.9810000''''., atevClient.Program.Archive(FileSystemArchivingServicechannel)]
Troubleshooting FPolicy issues on NetAppdevices
Data Insight uses the FPolicy framework to collect information about access eventsfrom the NetApp filers. To receive access events from the NetApp filer, Data Insightuses a process called the DataInsightFPolicy service.
461TroubleshootingTroubleshooting FPolicy issues on NetApp devices

The following occurrences indicate that the DataInsightFPolicy service is unable tocommunicate with the NetApp filer:
■ Frequent disconnections between the Collector node and the NetApp filer.
■ No events are registered for a filer, even though the filer is properly configured.
■ Warning or errors are displayed about connection problems.
Viewing FPolicy-related errors and warningsTo view the FPolicy related errors and warnings:
1 From the Management Console, navigate to Settings > Filers. The list of allthe filers added to Data Insight is displayed.
2 Click the name of the filer to view the overview page for the filer.
3 Review the Filer Health section.
4 If FPolicy has disconnected from the filer, you will see an error message tothat effect.
5 Alternatively, navigate to Settings > Events. From Events tab review theevent-related errors and warnings which may indicate FPolicy connectivityproblems.
6 To know more details about the connection problems you can also examinethe fpolicyd.log file. You can locate the log file under the log folder of theData Insight installation directory.
Resolving FPolicy connection issuesTo resolve FPolicy connectivity issues perform the following checks:
■ Check the network connectivity. See if you can connect to the Collector fromthe filer using the short name or the Fully Qualified Host Name of the Collectorand vice versa.
■ Ensure that host name or IP DNS lookup is working. The DNS lookup andreverse-lookup for host name of the Collector node from the filer should beworking fine.
■ Verify that the system-time on the Collector and the filer are within 5 minutes ofthe time on the Domain Controller.
■ Check that the firewall settings or security software on the Collector are notblocking port numbers 139 and 445.
■ Verify that the user whose credentials are used to configure theDataInsightFPolicy service belongs to the same domain as the Data Insight
462TroubleshootingTroubleshooting FPolicy issues on NetApp devices

Collector node and the NetApp filer. Ensure that this user is a part of the BackupOperators group on the filer.
■ If the NetApp filer and Data Insight Collector node are in different domains,ensure that the DataInsightFPolicy service is running as Local System or thereis bidirectional trust between the domains to which the filer and the Collectorbelong.
Once you performed all the checks mentioned in the earlier procedure, you mightneed to perform the following additional checks if the problem persists:
■ Network Settings on the Collector: If you are using a supported version of aWindows machine as a Collector, verify the local security policy for the namedpipes that can be accessed anonymously.See “To verify the correct network security policy for FPolicy” on page 463.
■ Setting entry in the hosts file on the filer: The hosts file entry on the filer and theformat of the hosts file entry. The entry should be in the format shown:<IP_ADDRESS> <FQDN> <Short_name>
For example,10.209.88.190 mycollector.tulip.matrixad.local mycollector
■ SMB signing check on the filer and the Collector: Disable the SMB signing onthe filer and the Collector.
To verify the correct network security policy for FPolicy
1 On the Collector node, navigate to the Control Panel.
2 ClickSystem and Security > Administrative tools > Local Security Policy> Local Policies > Security options.
3 Check if the value for the policy called "Network access: Named Pipes thatcan be accessed anonymously" is NTAPFPRQ.
4 Restart the Collector node if you have made any changes.
TroubleshootingEMCCelera or VNX configurationissues
Data Insight registers with the EMC Celerra or the EMC VNX filer through the EMCCommon Event Enabler (CEE) framework. The CEE framework can be installedon the same Windows server as the Data Insight Collector node or on a remoteserver in the same Active Directory domain. To fetch audit events, the computerrunning CEE must be able to maintain connectivity with the filer being monitored.
To monitor the activities of the CEE server, you can enable Verbose and Debugmodes for the server.
463TroubleshootingTroubleshooting EMC Celera or VNX configuration issues

To enable Verbose mode and Debug mode on the CEE computer
1 Open the Windows Registry Editor (Start > Run > regedit)
2 Navigate to:
HKLM>Software>EMC>CEE>Configuration
Set verbose to 3f.
HKLM>Software>EMC>CEE>Monitor>Configuration
Set debug to 3f.
Once your debuggung session is over, set the values of the changed registrykeys to 0.
464TroubleshootingTroubleshooting EMC Celera or VNX configuration issues

Table E-3 Troubleshooting EMC Celera or VNX configuration issues
Steps to performChecksIssues/Indications
Perform the following steps:
■ Log in to the EMC Control Station using SSHor Telnet.
■ Execute the command for the correspondingdata mover:server_date server_2 timesvc startntp <domain-controller>
where server_2 is the name of the data mover.
Ensure that the system time onthe filer and the Windows hostrunning the CAVA or theDataInsightCelerra service arein sync with the domaincontroller.
Connectivity issues between theEMC filer and the host computerrunning EMC CEE service.
To test the connectivity of the CIFS server withthe domain controller:
■ Log in to the EMC Control Station using SSHor Telnet.
■ Execute the following command for thecorresponding data mover:server_cifs <server_2>
where server_2 is the name of the CIFSserver.
■ Verify that the output of the command containsthe following line:FQDN=<Fully qualified name of the CIFSserver> (Updated to DNS)Appearance of the line is the output confirmsthat connection is established.
Ensure that the CIFS serverscan communicate with thedomain controller.
To check cepp.conf file entry:
■ Log in to the EMC Control Station using SSHor Telnet.
■ Execute the following command for thecorresponding data mover:server_file server_2 -getcepp.conf
■ If you find any entry for msrprcuser, removethe entry.
Ensure that you have configured the EMC CAVAservice and DataInsightCelerra service to runusing a domain user account with administrativeprivileges.
465TroubleshootingTroubleshooting EMC Celera or VNX configuration issues

Table E-3 Troubleshooting EMC Celera or VNX configuration issues(continued)
Steps to performChecksIssues/Indications
Ensure that you have thefollowing entry in thecepp.conf file:
cifsserver=<CIFS server name>
surveytime=90
pool name=matpool \
servers=<IP address of the hostrunning CAVA service> \
postevents=* \
option=ignore \
reqtimeout=500 \
retrytimeout=50
Note that there is a space beforethe ‘\’ character at the end of aline. Also note that there is no ‘\’character on the first and lastline.
To troubleshoot error while trying to start CEPPservice on a VNX filer:
■ Log in to the EMC Control Station using SSHor Telnet.
■ View the cepp.conf file by executing thefollowing command:server_file server_2 -getcepp.conf
■ Note the IP address mentioned in the serverssection.
■ Ensure that the noted IP address is accessibleand resolvable from the EMC filer ControlStation.
To enable the EMC VNX orCelerra filer to send eventinformation to Data Insight youmust start the CEPP service onthe filer.
When you attempt to start theCEPP service you mayencounter the error13162905604.
Error when you attempt to startthe CEPP service on the filer
Troubleshooting EMC Isilon configuration issuesSometimes, Data Insight may fail to fetch audit events from an Isilon filer.
466TroubleshootingTroubleshooting EMC Isilon configuration issues

The Table E-4 describes some common issues and troubleshooting steps to resolvethese issues.
Table E-4 Troubleshooting EMC Isilon configuration issues
Troubleshooting actionsIssues/Indications
■ Ensure that the Isilon hostname configured in Data Insight is the sameas configured in the Isilon Console audit settings.
■ Install Microsoft DebugView on the computer where you have installedEMC CEE.To print debug information modify the following registry settings andchange their respective ‘Debug’ and ‘Verbose’ keys to value ‘3f’:■ [HKEY_LOCAL_MACHINE\SOFTWARE\EMC\CEE\Configuration]■ [HKEY_LOCAL_MACHINE\SOFTWARE\EMC\CEE\Monitor\Configuration]
■ On the Data Insight Management Server, set the Collector log level toFINE using the following command:configcli backend_loglevel <node id of the Collector>collector FINE
You can use the following command to get the node ID:configdb -p -T node
■ After you have set the Collector log level to FINE, you must restartDataInsightCelerra service on the Collector node. To change the log levelback to INFO use the following command on the Management console:configcli backend_loglevel <node id of the Collector>collector INFO
■ Restart DataInsightCelerra Service on the Collector.
Data Insight is unable to fetch auditevents from the EMC Isilon filer.
Troubleshooting SharePoint configuration issuesSometimes during the agent installation, your installer may return an error. Ensurethat you have uninstalled the existing installation of the Data Insight SharePointAgent before you upgrade the agent to a newer version.
The Table E-5 explains some useful troubleshooting steps:
467TroubleshootingTroubleshooting SharePoint configuration issues

Table E-5 Troubleshooting SharePoint configuration issues
Steps to performIssues/Indications
Perform the following steps:
■ Log in to the SharePoint Central Administration Console and set theULS log level to Verbose.
■ Collect the Event Viewer logs and ULS logs from the following locations:■ For SharePoint 2010:
C:\Program Files\Common Files\Microsoft Shared\WebServer Extensions\14\LOGS
■ For SharePoint 2013:C:\Program Files\Common Files\Microsoft Shared\WebServer Extensions\15\LOGS
■ For SharePoint 2016:C:\Program Files\Common Files\Microsoft Shared\WebServer Extensions\16\LOGS
■ Collect the Data Insight logs from the Collector node.■ Send the logs to Support for assistance.
Issues when installing the Data InsightSharePoint agent on the SharePointserver
Perform the following steps:
■ Log in to the SharePoint Central Administration Console.■ Navigate to the Solutions page and check the state of the package called
sdispwebsvc.wsp.■ If the state isDeployed, view the install log file to determine the cause
of the problem.■ If the solution is stuck in Deploying state, go to the Timer Job
Definitions page and delete the Timer Job definitions for the package.Check the state of the package again. If the state is not changed toDeployed, contact Support.
■ If the state changes to Deployed after terminating the Timer job,check if the SharePoint feature, called SDIEventHandler is installed.To verify this browse to one of the monitored site collections URL.Navigate to Site Actions > Site Settings > Site CollectionsFeatures. Search for the keyword 'SDI' to locate the feature. Verifyif the feature SDIFeatureStapler is in the Active state. Otherwisemake it active.
■ If the features are not visible, collect all the install logs and contactSupport.The install and uninstall logs are located in the Windows temp folder.The log file names start with the characters i4j**.
The computer stops responding duringthe agent installation
468TroubleshootingTroubleshooting SharePoint configuration issues

Table E-5 Troubleshooting SharePoint configuration issues (continued)
Steps to performIssues/Indications
In the Data Insight Management Console, when you click the TestConnection for a web application, Data Insight attempts to do the following:
■ Discover site collections■ Check for scanning■ Checks for auditing
Ideally, all the three tasks should succeed. If any of the three tasks fail, lookfor the following log files for further troubleshooting:
■ sharepoint_util.log■ sharepoint_audit.log■ sharepoint_scanner_0.log
Test Connection fails for a webapplication
After you configure a web application, Data Insight discovers and adds sitecollections to the configuration automatically. Data Insight also enables theauditing flags on the site collections.
To troubleshoot any errors during the addition of web applications, view thesharepoint_util.log file.
Errors during the addition of webapplications
469TroubleshootingTroubleshooting SharePoint configuration issues

Table E-5 Troubleshooting SharePoint configuration issues (continued)
Steps to performIssues/Indications
Perform the following steps:
■ Navigate to the following locations and remove the files mentioned:■ Global Assembly Cache (GAC) under
C:\Windows\assembly :■ sdispwebsvc
■ SDIEventHandler
■ SDIFeatureStapler and SDIEventHandler folders underC:\Program Files\Common Files\Microsoft Shared\WebServer Extensions\12\Template\Features■ Elements.xml
■ Feature.xml
■ C:\Program Files\Common Files\Microsoft Shared\WebServer Extensions\12\ISAPI
Note that this location may differ slightly for different SharePointversions.■ sdispwebsvc.asmx
■ sdispwebsvcdisco.aspx
■ sdispwebsvcwsdl.aspx
■ Navigate to C:\Program Files\Veritas\DataInsight\bin, andexecute the command:SPManageFeature.exe -d
Run this utility as Farm Administrator.■ To remove features, run the following commands:
stsadm -o uninstallfeature -filenameSDIFeatureStapler\Feature.xml
stsadm -o uninstallfeature -filenameSDIEventHandler\Feature.xml
■ To remove the DLL files from the Global Assembly Cache (GAC):■ Navigate to C:\Windows\assembly
■ Right-click sdispwebsvc and choose Uninstall.■ Right-click SDIEventHandler and choose Uninstall.■ Repeat this step on all the SharePoint computers.
■ Delete the following files:■ Elements.xml
■ Feature.xml
■ sdispwebsvc.asmx
■ sdispwebsvcdisco.aspx
■ sdispwebsvcwsdl.aspx
■ Repeat this step on all the SharePoint computers.
Agent uninstallation issues
470TroubleshootingTroubleshooting SharePoint configuration issues

TroubleshootingHitachi NAS configuration issuesThe Table E-6 explains some useful troubleshooting steps:
Table E-6 Troubleshooting Hitachi NAS configuration issues
Steps to performIssues/Indications
Refer to the following log:
winnas_util.log.
You can find this log at the following location of your Collector node assignedto the Hitachi NAS file server:
<INSTALLDIR>\log
<INSTALLDIR> refers to the installation directory which is usually locatedin:
C:\Program Files\DataInsight\
Error when Data Insight attempts todiscover shares on the Hitach NAS(HNAS) filer.
Refer to the following log:
hansd_<filer_id>.log
Data Insight Collector node is not ableto fetch audit events from the HNASfiler.
Perform the following steps:
■ Using SSH or Telnet log in to Admin EVS.■ Switch to the EVS you are monitoring.■ Execute the following commands:
console-context --evs <EVS Name>
audit-log-show <File System Name>
To view the audit logs that aregenerated on the Hitachi NAS filer
Perform the following steps:
■ Navigate to the folder:<datadir>\collector
<datadir> represents the data directory of Data Insight, which is locatedat: C:\DataInsight\data by default.
■ Look for the hnas*.sqlite files. The presence of such files indicatesthat Data Insight is able to successfully fetch audit events from HitachiNAS filer.
To verify if Data Insight is able to fetchthe audit events from the Hitachi NASfiler
Troubleshooting installation of Tesseract softwareThe Tesseract software extracts text from images thus facilitating the classificationof images. The software is installed on the Master server, Collector nodes, andClassification server during installation of Data Insight. If Tesseract installation has
471TroubleshootingTroubleshooting Hitachi NAS configuration issues

failed and you need to enable classification of images, you will need to manuallyinstall Tesseract. Use the steps listed below to install Tesseract and update theocr-config.properties file.
To install Tesseract
1 Open tesseract-ocr-w64-setup-4.0.0.20181030.exe located at<installdir>/deps/tesseract-ocr-w64-setup-v4.0.0.20181030.exe andrun it on the classification node.
2 In the installation wizard, select the location: {drive}\{folder}.
3 After the installation is complete, open the file ocr-config.properties locatedat <installdir>/vic/vic-service.
4 Edit the following lines in the ocr-config.properties file:
■ tesseractPath={drive}\\{folder}\\Tesseract-OCR
■ tessdataPath={drive}\\{folder}\\Tesseract-OCR\\tessdata
■ pageSegMode=3
5 Save the updated file and restart the DataInsightVICClient andDataInsightVICServer services.
Note: Tesseract offers default support for the English language. However, if youwant to classify image files that are not in English, you can download the appropriatetraining data, unzip it, and copy the .traineddata file into the tessdata directory({drive}\{folder}\Tesseract-OCR).
You also need to update the language in the ocr-config.properties file.
472TroubleshootingTroubleshooting installation of Tesseract software

AActive Directory domain scans
scheduling 129adding exclude rules 40archiving
adding new Enterprise Vault servers 387filer mapping 390managing the Enterprise Vault servers 388overview 386
archiving dataoverview 42
Bbusiness unit mappings
configuring 129
CClassification Server
registering 82Clustered NetApp filers
about configuration 157configuring
DFS target 265EMC filers 177SMB signing 143Windows File Server 207Workspace data owner policy 58
configuring product usersreviewing current users and privileges 68Symantec Data Loss Prevention users 72
containersadding 132managing 133overview 132
current users and privilegesreviewing 68
DData Insight
adding exclude rules 40
Data Insight (continued)preparing to receive event notification 181
data retentionconfiguring 43
deleting filesconfiguration 391
deleting files and foldersfrom reports tab 392from workspace 392overview 391
deploymentmoving data directory 456
DFS utilityoverview 267running 267
directory domain scansoverview 118
directory serversadding 119managing 124
directory service domaindeleting 128
EEMC Celerra filers
configuration credentials 183preparing for CEPA 178
eventsconfiguring scanning 32email notifications configuring 357enabling Windows event logging 358
Ffilers
Add/Edit EMC Celerra filer dialog 234add/edit geneic device dialog 250Add/Edit Hitachi NAS file server 252Add/Edit NetApp filer dialog 225Add/Edit VxFS filer dialog 247Add/Edit Windows File Server dialog 243adding 224
Index

filers (continued)deleting 257editing configuration 255migrating 255viewing 222
Fpolicyoverview 144preparing NetApp filer 146preparing NetApp vfiler 148preparing Veritas Data Insight 145
Ggeneric device
scanning credentials 219
HHitachi NAS filers
about configuration 202configuration credentials 203
Iimporting
custom attributes 130DFS mappings 268
IndexersMigration 112
Llicenses
managing 26
MManagement Console
configuring global settings 60operation icons 16
Management Serverconfiguring SMTP settings 27
managingundesired data 385
NNetApp cluster
capabilities for adding non-administrator domainuser 165
preparing non-administrator domain user 165
NetApp filerscapabilities for adding non-administrator domain
user 151configuration credentials 138, 142handling events from home directories 155preparing non-administrator domain user 151prerequisites 137
Ooperation progress status
tracking and managing 393overview
administering Data Insight 16configuring filers 222DFS target 264filtering accounts, IP addresses, and paths 38
Ppatches and upgrades
viewing and installing recommendations 109Permission remediation
About 381exclude rules 385managing 382
policiesmanaging 364overview 362
preparingEMC Celerra filer 178NetApp filer for Fpolicy 146NetApp vfiler for Fpolicy 148Veritas Data Insight for Fpolicy 145
product useradding 69
product usersdeleting 72editing 71
product users and rolesoverview 66
purging dataoverview 43
Rrenaming
filer 269SharePoint web application 269storage device 269
474Index

Ssaved credentials
managing 115overview 115
scan errorsviewing 360
sharepoint online monitoringadding an account 297overview 289prerequisites for configuring 291registering with Microsoft 293
SharePoint serversconfiguration credentials 274
sharesAdd New Share/Edit Share dialog 259adding 258deleting 264editing configuration 264managing 260
site collectionsmanaging 284
supported file servers 20Symantec Data Loss Prevention
configuring 49Symantec Data Loss Prevention users
configuring authorization 72system events
viewing 354
Ttroubleshooting
Celera/VNX 463HNAS 471Isilon 466NetApp 461SharePoint 467Tesseract 471
VVeritas Data Insight
administering 16administration tasks 17
viewingconfigured filers 222
VxFS file serverconfiguration credentials 214
WWindows File Server agent
installingusing Upload Manager utility 111
Windows File Serversconfiguration credentials 208
475Index