Handsets/Components - Monthly InsighT
37
December 2020 Handsets/Components Monthly InsighT Seize the day Wonjae Park +822-3774-1426 [email protected]
-
Upload
khangminh22 -
Category
Documents
-
view
0 -
download
0
Transcript of Handsets/Components - Monthly InsighT

De c e m b e r 2 0 2 0
Handsets/Components
Monthly InsighTSeize the day
Wonjae Park [email protected]

Mirae Asset Daewoo Research2 | Monthly InsighT
I. Investment strategy
II. Sector view
III. Spotlight stocks & other notable stocks
IV. Pioneer: Company visits/IR/NDRs/IPOs
V. Global IT navigation

Mirae Asset Daewoo Research3 | Monthly InsighT
Cumulative returns
November
Monthly InsighT returnsNovember: +4.1% for spotlight stocks vs. +19.4% for other notable stocks
Mirae Asset Daewoo IT universe share performance
I. Investment strategy
Note: Mar.-Nov. 2020 data
11.8
14.3
19.4
4.1
0 10 20 30
KOSDAQ
KOSPI
Avg. of other notable stocks
Avg. of spotlight stocks
(%)
45.1
30.9
29.0
64.1
0 20 40 60 80
KOSDAQ
KOSPI
Avg. of other notablestocks
Avg. of spotlight stocks
(%)
16.9
22.0
19.4
1.8
2.0
5.2
7.4
4.1
0 5 10 15 20 25
SEMCO
LS
Avg. of other notable stocks
LGE
LG Innotek
Hanwha Aerospace
SSC
Avg. of spotlight stocks
(%)

Mirae Asset Daewoo Research4 | Monthly InsighT
Share performance and 2020F P/E for Korean IT large caps
Key handsets/components stocks
Company RatingTP
(W)
Current price
(11/30/20)
Upside(%)
Share performance (%)
P/E (x) P/B (x) ROE (x)
1W 1M 20F 21F 20F 21F 20F 21F
SEMCO Buy 196,000 156,000 25.6 2.6 16.9 20.9 16.2 2.1 1.9 10.3 12.0
LG Innotek Buy 221,000 155,000 42.6 -4.9 2.0 11.5 8.0 1.5 1.2 13.3 16.7
LS Buy 80,000 63,200 26.6 0.3 22.0 14.9 10.0 0.6 0.6 3.9 5.6
MCNEX Buy 47,000 36,450 28.9 1.0 11.0 7.7 6.5 1.9 1.5 27.2 25.4
LGE Buy 125,000 85,500 46.2 -4.1 1.8 8.0 7.4 1.0 0.9 12.1 12.0
HAS Buy 39,000 26,400 47.7 -3.6 5.2 12.4 10.0 0.5 0.5 4.2 4.9
SSC Buy 23,100 18,750 23.2 -2.1 7.4 27.8 18.9 1.5 1.5 5.6 7.7
I. Investment strategy
Smartphone components suppliers deserve attention in 2021
Source: WISEfn, Mirae Asset Daewoo Research
■ IT industry update- COVID-19 continues to weigh on the economy, but IT players have benefited from
pandemic effects. 1) Spread of contactless culture: Remote work, e-learning, online games, etc.2) Channel inventory shortages in 1H20 and economic recovery expectations for 2021
� Stockpiling demand3) China backlash (trade war with US, territorial conflict with India): Favorable to Korean IT firms
- Smartphones: The market has normalized, and SEC’s M/S expansion strategy has yielded positive results; Huawei posted weak results, while Xiaomi benefited from Huawei’s predicament.
- TVs/home appliances: Margins have improved on solid demand and lower marketing spending.
- Components: Prices are stable, and stockpiling demand is picking up due to concerns over supply disruptions; F/X rate movements are worrisome.
■ Strategy1) We recommend focusing on companies with strong competitiveness, decent results, and
a robust 2021 outlook, but note that expectations have reached burdensome levels. 2) Amid an increase in uncertainties (F/X rates and COVID-19 resurgence), we recommend a
short-term trading strategy.3) SEC’s smartphone sales likely to expand in 2021 � Overweight components suppliers
■ Spotlight stocks- SEMCO, LG Innotek, LS, MCNEX
■ November company visits/IR/NDRs (small/mid-caps)- SEMCO, SSC, Spigen Korea, Shinsung E&G, Everybot, SD Optics, Optrontec, INNO
Instrument, Innox Advanced Materials, Intellian, JNTC, Park Systems, Point Mobile, LGInnotek, LGE, LS
0
9
18
27
36
-18
-6
6
18
30Price (1M, L) 2020F P/E (R)
(%) (x)
(20.6, 63.0)
Note: Market cap of W1tr+Source: WISEfn, Mirae Asset Daewoo Research

Mirae Asset Daewoo Research5 | Monthly InsighT
Earnings forecast revisions for large-cap handsets/components plays
I. Investment strategy
(Wbn, %)
Source: Mirae Asset Daewoo Research
Previous Revised % chg.Notes
4Q20F 2020F 2021F 4Q20F 2020F 2021F 4Q20F 2020F 2021F
SEMCO Revenue 2,040.6 8,365.2 9,214.2 2,040.6 8,365.2 9,214.2 0.0 0.0 0.0
OP 218.3 781.3 903.6 218.3 781.3 903.6 0.0 0.0 0.0
NP 156.4 557.8 652.4 156.4 557.8 652.4 0.0 0.0 0.0
LG Innotek Revenue 3,483.5 9,264.2 9,299.6 3,483.5 9,264.2 9,299.6 0.0 0.0 0.0
OP 314.9 585.2 660.9 314.9 585.2 660.9 0.0 0.0 0.0
NP 230.8 345.8 450.6 230.8 345.8 450.6 0.0 0.0 0.0
LS Revenue 2,624.7 10,275.3 10,454.2 2,624.7 10,275.3 10,454.2 0.0 0.0 0.0
OP 115.2 426.6 461.8 115.2 426.6 461.8 0.0 0.0 0.0
NP 57.8 129.5 223.4 57.8 129.5 223.4 0.0 0.0 0.0
MCNEX Revenue 322.6 1,349.6 1,478.4 322.6 1,349.6 1,478.4 0.0 0.0 0.0
OP 17.9 64.6 97.3 17.9 64.6 97.3 0.0 0.0 0.0
NP 13.9 55.1 71.9 13.9 55.1 71.9 0.0 0.0 0.0
LGE Revenue 18,320.7 62,801.9 68,272.8 18,320.7 62,801.9 68,272.8 0.0 0.0 0.0
OP 597.6 3,142.4 3,731.2 597.6 3,142.4 3,731.2 0.0 0.0 0.0
NP 299.7 2,007.7 2,222.4 299.7 2,007.7 2,222.4 0.0 0.0 0.0
Hanwha Revenue 1,690.6 5,287.8 5,969.6 1,690.6 5,287.8 5,969.6 0.0 0.0 0.0
Aerospace OP 70.2 237.9 253.4 70.2 237.9 253.4 0.0 0.0 0.0
NP 42.4 107.3 153.8 42.4 107.3 153.8 0.0 0.0 0.0
SSC Revenue 309.8 1,152.3 1,256.2 309.8 1,152.3 1,256.2 0.0 0.0 0.0
OP 19.4 64.5 81.0 19.4 64.5 81.0 0.0 0.0 0.0
NP 10.7 32.7 54.1 10.7 32.7 54.1 0.0 0.0 0.0
Seoul Viosys Revenue 116.9 427.7 507.7 116.9 427.7 507.7 0.0 0.0 0.0
OP 6.0 24.2 35.0 6.0 24.2 35.0 0.0 0.0 0.0
NP 2.0 11.3 13.0 2.0 11.3 13.0 0.0 0.0 0.0
Partron Revenue 265.2 1,111.3 1,148.6 265.2 1,111.3 1,148.6 0.0 0.0 0.0
OP 12.7 45.1 70.7 12.7 45.1 70.7 0.0 0.0 0.0
NP 11.3 28.6 61.2 11.3 28.6 61.2 0.0 0.0 0.0
Spigen Korea Revenue 104.5 398.4 370.2 104.5 398.4 370.2 0.0 0.0 0.0
OP 15.8 80.3 61.4 15.8 80.3 61.4 0.0 0.0 0.0
NP 13.5 70.1 51.4 13.5 70.1 51.4 0.0 0.0 0.0
Amotech Revenue 55.0 217.5 271.2 55.0 217.5 271.2 0.0 0.0 0.0
OP -0.3 -2.7 14.3 -0.3 -2.7 14.3 0.0 0.0 0.0
NP -3.1 -12.5 10.2 -3.1 -12.5 10.2 0.0 0.0 0.0

Mirae Asset Daewoo Research6 | Monthly InsighT
Consensus vs. Mirae Asset Daewoo estimates
I. Investment strategy
(Wbn, %)
Source: WISEfn, Mirae Asset Daewoo Research
Mirae Asset Daewoo Consensus Diff.Notes
4Q20F 2020F 2021F 4Q20F 2020F 2021F 4Q20F 2020F 2021F
SEMCO Revenue 2,040.6 8,365.2 9,214.2 2,152.5 8,479.2 9,397.1 -5.2 -1.3 -1.9
OP 218.3 781.3 903.6 256.9 820.6 1,029.6 -15.0 -4.8 -12.2
NP 156.4 557.8 652.4 173.9 586.6 734.6 -10.1 -4.9 -11.2
LG Innotek Revenue 3,483.5 9,264.2 9,299.6 3,512.3 9,282.0 10,073.1 -0.8 -0.2 -7.7
OP 314.9 585.2 660.9 318.3 592.5 743.9 -1.1 -1.2 -11.2
NP 230.8 345.8 450.6 167.9 304.1 468.2 37.5 13.7 -3.8
LS Revenue 2,624.7 10,275.3 10,454.2 2,701.1 10,322.1 10,844.3 -2.8 -0.5 -3.6
OP 115.2 426.6 461.8 116.0 410.6 467.0 -0.7 3.9 -1.1
NP 57.8 129.5 223.4 60.5 115.8 186.5 -4.5 11.9 19.8
MCNEX Revenue 322.6 1,349.6 1,478.4 319.8 1,345.2 1,547.1 -0.9 -0.3 4.6
OP 17.9 64.6 97.3 16.5 62.8 98.6 -7.8 -2.8 1.3
NP 13.9 55.1 71.9 12.9 53.9 77.0 -7.2 -2.2 7.1
LGE Revenue 18,320.7 62,801.9 68,272.8 17,668.1 62,538.0 67,290.4 3.7 0.4 1.5
OP 597.6 3,142.4 3,731.2 576.7 3,152.6 3,593.7 3.6 -0.3 3.8
NP 299.7 2,007.7 2,222.4 263.2 1,887.9 2,122.4 13.9 6.3 4.7
Hanwha Revenue 1,690.6 5,287.8 5,969.6 1,736.1 5,290.7 5,718.3 -2.6 -0.1 4.4
Aerospace OP 70.2 237.9 253.4 67.0 217.5 244.3 -4.8 9.4 3.7
NP 42.4 107.3 153.8 41.1 102.5 131.0 -3.2 4.7 17.4
SSC Revenue 309.8 1,152.3 1,256.2 314.0 1,155.8 1,267.6 -1.3 -0.3 -0.9
OP 19.4 64.5 81.0 20.7 65.4 88.5 -6.3 -1.4 -8.5
NP 10.7 32.7 54.1 14.3 37.7 58.1 -25.2 -13.3 -6.9
Seoul Viosys Revenue 116.9 427.7 507.7 116.0 426.8 490.7 -0.8 -0.2 -3.3
OP 6.0 24.2 35.0 7.9 26.1 38.3 31.7 7.9 9.4
NP 2.0 11.3 13.0 3.5 14.3 16.9 75.0 26.5 30.0
Partron Revenue 265.2 1,111.3 1,148.6 279.0 1,109.7 1,284.7 -4.9 0.1 -10.6
OP 12.7 45.1 70.7 12.1 45.4 80.1 5.0 -0.7 -11.7
NP 11.3 28.6 61.2 10.7 27.6 57.9 5.6 3.6 5.7
Spigen Korea Revenue 104.5 398.4 370.2 106.3 400.2 405.3 -1.7 -0.4 -8.7
OP 15.8 80.3 61.4 16.5 80.9 68.2 -4.2 -0.7 -10.0
NP 13.5 70.1 51.4 12.6 68.7 56.5 7.1 2.0 -9.0
Amotech Revenue 55.0 217.5 271.2 56.9 219.4 311.3 -3.3 -0.9 -12.9
OP -0.3 -2.7 14.3 0.3 -2.1 26.4 TTR RR -45.8
NP -3.1 -12.5 10.2 -0.8 -8.4 19.3 RR RR -47.2

Mirae Asset Daewoo Research7 | Monthly InsighT
I. Investment strategy
II. Sector view
III. Spotlight stocks & other notable stocks
IV. Pioneer: Company visits/IR/NDRs/IPOs
V. Global IT navigation

Mirae Asset Daewoo Research8 | Monthly InsighT
Huawei rapidly losing ground; SEC’s smartphone sales to expand in 2021; time to accumulate top-tier parts makers
SEC smartphone sales and M/S
Check point
II. Sector view
Apple iPhone shipments and M/S
Source: SEC, Counterpoint, Mirae Asset Daewoo Research
Source: Apple, FactSet, Mirae Asset Daewoo Research
■ Shipment data
- October shipments (Counterpoint): 146mn handsets (-12.4% YoY, +5.9% MoM)
125mn smartphones (-8.6% YoY, +5.3% MoM)
- October shipments and M/S of top five smartphone makers (Counterpoint)
1. SEC: 25.9mn units (-1.1% YoY, +1.2% MoM), 20.8%
2. Apple: 17.4mn units (-23.8% YoY, +44.4% MoM), 14.0%
3. Xiaomi: 15.5mn units (+29.7% YoY, +0.5% MoM), 12.5%
4. Vivo: 11.1mn units (+9.6% YoY, +3.5% MoM), 8.9%
5. Oppo: 11.0mn units (+5.0% YoY, +7.3% MoM), 8.8%
[9. LGE: 2.5mn units (+1.8% YoY, +21.6% MoM), 2.0%]
- Shipments by market: US: 12mn units (-15.1% YoY, +17.1% MoM)
China: 25.9mn units (-22.4% YoY, +1.8% MoM)
India: 20mn units (+0.0% YoY, +2.6% MoM)
■ Key takeaways
1. Global smartphone shipments contracted 8.6% YoY; -15.1% YoY in the US, -22.4% YoY in China, and +0.0% YoY in India
2. SEC: Largest smartphone vendor based on monthly M/S (20.8%; +1.6%p YoY, -0.8%p MoM)- Second-largest vendor in India with a M/S of 22.5%
3. Apple: Delays to new model releases (M/S of 14.0%; -2.8%p YoY, +3.8%p MoM)
4. Huawei: Down to 6th place (M/S of 7.8%; -7.0%p YoY, -4.9%p MoM) following the sale of the Honor brand (M/S of 3.0%; -0.6%p MoM)
5. LGE: Shipments surpassed 2mn units for the fourth straight month (2.5mn units), and M/S increased 0.3%p MoM to 2.0% (9th place).
6. Xiaomi: Third-largest smartphone maker based on monthly M/S; benefited from the US ban on Huawei products and retained its top spot in India with a M/S of 26.3%
* Huawei is rapidly losing ground, which should benefit Xiaomi and SEC.* SEC’s smartphone sales are projected to expand in 2021. For components plays,
performances are likely to diverge. We advise investors to accumulate shares of top-tier components makers.
-15
0
15
30
45
0
25
50
75
100
1Q11 1Q13 1Q15 1Q17 1Q19
(%)(mn units) iPhone shipments (L)
YoY (R)
Apple M/S (R)
-15
0
15
30
45
0
25
50
75
100
1Q11 1Q13 1Q15 1Q17 1Q19
(%)(mn units) Smartphone shipments (L) YoY (R) SEC M/S (R)

Mirae Asset Daewoo Research9 | Monthly InsighT
II. Sector view
Key charts
Global monthly smartphone M/S trends
China monthly smartphone M/S trends
Huawei smartphone shipments and M/S
India monthly smartphone M/S trends
Note: Huawei sold off its Honor business in October.Source: IDC, Mirae Asset Daewoo Research
Source: Counterpoint, Mirae Asset Daewoo Research
Note: Huawei sold off its Honor business in October.Source: Counterpoint, Mirae Asset Daewoo Research
Source: Counterpoint, Mirae Asset Daewoo Research
-15
0
15
30
45
0
25
50
75
100
4Q13 4Q14 4Q15 4Q16 4Q17 4Q18 4Q19
(%)(mn units) Smartphone shipments (L) YoY (R) Huawei M/S (R)
0
10
20
30
40
4/14 10/14 4/15 10/15 4/16 10/16 4/17 10/17 4/18 10/18 4/19 10/19 4/20 10/20
SEC Apple Huawei Xiaomi Oppo Vivo
(%)
0
15
30
45
60
4/16 10/16 4/17 10/17 4/18 10/18 4/19 10/19 4/20 10/20
Oppo + Vivo Huawei Apple Xiaomi SEC
(%)
0
15
30
45
60
4/16 10/16 4/17 10/17 4/18 10/18 4/19 10/19 4/20 10/20
SEC Xiaomi Huawei + Vivo + Oppo Micromax + Lava
(%)

Mirae Asset Daewoo Research10 | Monthly InsighT
Forecasts vs. actual handset shipment data during IT bubble and financial crisis (mn units)
Oppo + Vivo smartphone shipments and M/S
US monthly smartphone M/S trends
Xiaomi smartphone shipments and M/S
Key charts
Source: IDC, Mirae Asset Daewoo Research Source: Counterpoint, Mirae Asset Daewoo Research
Source: Counterpoint, Mirae Asset Daewoo Research Source: Counterpoint, Mirae Asset Daewoo Research
II. Sector view
-15
0
15
30
45
0
20
40
60
80
3Q11 3Q13 3Q15 3Q17 3Q19
(%)(mn units)Oppo + Vivo shipments (L) YoY (R) Oppo + Vivo M/S (R)
-15
0
15
30
45
5
15
25
35
45
4Q13 4Q14 4Q15 4Q16 4Q17 4Q18 4Q19
(%)(mn units)Smartphone shipments (L) YoY (R) Xiaomi M/S (R)
0
15
30
45
60
4/16 10/16 4/17 10/17 4/18 10/18 4/19 10/19 4/20 10/20
(%)SEC Apple LGE ZTE Motorola

Mirae Asset Daewoo Research11 | Monthly InsighT
Global and China handset market trends China monthly smartphone shipments
2015 2016 2017 2018 2019
Global (mn units) Feature phones 542 501 512 489 422
Smartphones 1,438 1,469 1,465 1,403 1,372
Total 1,980 1,971 1,978 1,891 1,794
Global (US$bn) Feature phones 13 10 10 9 7
Smartphones 426 416 458 483 458
Total 439 426 468 492 465
China (mn units) Feature phones 43 34 24 21 18
Smartphones 430 467 444 397 367
Total 473 501 469 417 385
China (US$bn) Feature phones 1 1 0 0 0
Smartphones 112 120 133 127 118
Total 113 121 134 127 118
China proportion (%, volume) Feature phones 7.9 6.8 4.7 4.2 4.2
Smartphones 29.9 31.8 30.3 28.3 26.7
Total 23.9 25.4 23.7 22.1 21.4
China proportion (%, US$ value) Feature phones 5.9 5.3 4.7 5.4 5.2
Smartphones 26.3 28.9 29.1 26.2 25.8
Total 25.6 28.3 28.6 25.8 25.5
II. Sector view
Key charts
Source: IDC, Mirae Asset Daewoo Research Source: CAICT, Mirae Asset Daewoo Research
Note: Huawei sold off its Honor business in October.Source: Counterpoint, Mirae Asset Daewoo Research
0
20
40
60
80
-60
-30
0
30
60
3/16 9/16 3/17 9/17 3/18 9/18 3/19 9/19 3/20 9/20
(%) (mn units)Shipments (L) YoY (R) MoM (R)
China M/S (total) 10/19 11/19 12/19 1/20 2/20 3/20 4/20 5/20 6/20 7/20 8/20 9/20 10/20
SEC 0.7 0.8 0.5 0.6 0.5 0.7 0.7 0.6 0.7 0.5 0.5 0.6 0.6
Apple 13.6 11.8 12.3 11.2 9.1 7.7 9.5 9.2 8.4 7.7 7.8 7.3 9.6
Huawei 37.4 34.9 34.9 34.7 37.7 41.6 43.0 45.7 45.8 47.1 44.4 39.4 25.7
Oppo + Vivo 30.5 32.3 33.1 34.7 34.9 33.6 31.1 30.6 28.6 29.7 30.8 33.6 35.1
China M/S(smartphones)
10/19 11/19 12/19 1/20 2/20 3/20 4/20 5/20 6/20 7/20 8/20 9/20 10/20
SEC 0.7 0.8 0.6 0.6 0.5 0.7 0.7 0.6 0.7 0.5 0.5 0.6 0.6
Apple 14.1 12.2 12.7 11.5 9.5 8.0 9.8 9.4 8.6 7.8 7.9 7.5 9.9
Huawei 38.7 36.2 36.2 35.7 39.4 43.1 44.4 46.8 46.8 47.9 45.2 40.3 26.3
Oppo + Vivo 31.5 33.5 34.3 35.8 36.5 34.8 32.1 31.3 29.2 30.2 31.3 34.3 35.9
China smartphone M/S trends (%) India smartphone M/S trends (%)
India M/S (total) 10/19 11/19 12/19 1/20 2/20 3/20 4/20 5/20 6/20 7/20 8/20 9/20 10/20
SEC19.0 19.8 16.6 16.3 17.1 19.1 7.5 14.8 24.2 25.2 24.1 22.9 22.9
Xiaomi 18.4 16.5 15.9 15.1 18.6 21.7 37.5 24.1 18.6 18.1 17.5 18.8 18.1
Oppo + Vivo 15.7 18.1 19.4 18.0 15.6 15.1 15.0 17.3 22.7 21.2 19.3 18.3 17.3
Realme 8.8 4.5 4.6 5.9 6.5 7.1 5.0 8.1 9.3 9.2 9.6 12.8 10.7
India M/S(smartphones)
10/19 11/19 12/19 1/20 2/20 3/20 4/20 5/20 6/20 7/20 8/20 9/20 10/20
SEC 19.0 20.2 17.1 17.3 17.6 18.9 8.6 17.5 26.2 27.4 26.2 23.6 22.5
Xiaomi 29.8 28.7 27.7 27.2 32.1 35.2 51.7 34.9 24.4 23.8 23.7 25.2 26.3
Oppo + Vivo 25.4 31.4 33.7 32.4 27.0 24.6 20.7 25.0 29.8 27.8 26.2 24.5 25.1
Realme 14.3 7.9 7.9 10.6 11.2 11.6 6.9 11.8 12.2 12.1 13.0 17.2 15.5
Source: Counterpoint, Mirae Asset Daewoo Research

Mirae Asset Daewoo Research12 | Monthly InsighT
I. Investment strategy
II. Sector view
III. Spotlight stocks & other notable stocks
IV. Pioneer: Company visits/IR/NDRs/IPOs
V. Global IT navigation

Mirae Asset Daewoo Research13 | Monthly InsighT
(Maintain)
Target price (12M, W)
Current price (11/30/20, W)
781
Consensus OP (20F, Wbn)
EPS growth (20F, %)
P/E (20F, x)
Market P/E (20F, x)
KOSPI
Market cap (Wbn) (Dec.) 2017 2018 2019 2020F 2021F 2022F
Shares outstanding (mn) Revenue (Wbn) 6,838 8,002 8,041 8,365 9,214 10,278
Free float (%) OP (Wbn) 306 1,150 734 781 904 1,112
Foreign ownership (%) OP margin (%) 4.5 14.4 9.1 9.3 9.8 10.8
Beta (12M) NP (Wbn) 162 656 514 558 652 814
52-week low (W) EPS (W) 2,084 8,457 6,627 7,188 8,407 10,496
52-week high (W) ROE (%) 3.8 14.5 10.2 10.0 10.7 12.1
(%) 1M 6M 12M P/E (x) 48.0 12.2 18.9 21.7 18.6 14.9
Absolute 16.9 24.8 40.5 P/B (x) 1.8 1.6 1.8 2.0 1.9 1.7
Relative 2.2 -2.3 13.2 Div. yield (%) 0.8 1.0 0.9 0.8 0.8 0.9
Notes: Under consolidated K-IFRS; NP is attributable to owners of the parent
Source: Samsung Electro-Mechanics, Mirae Asset Daewoo Research estimates
Buy
196,000
156,000
Expected return 26%
85,700
158,500
21.7
17.7
2,591.34
11,652
78
73.4
8.5
OP (20F, Wbn)
821
34.5
1.04
70
80
90
100
110
120
130
140
150
19.11 20.2 20.5 20.8 20.11
Samsung Electro-Mechanics
KOSPI
Samsung Electro-Mechanics (009150 KS)
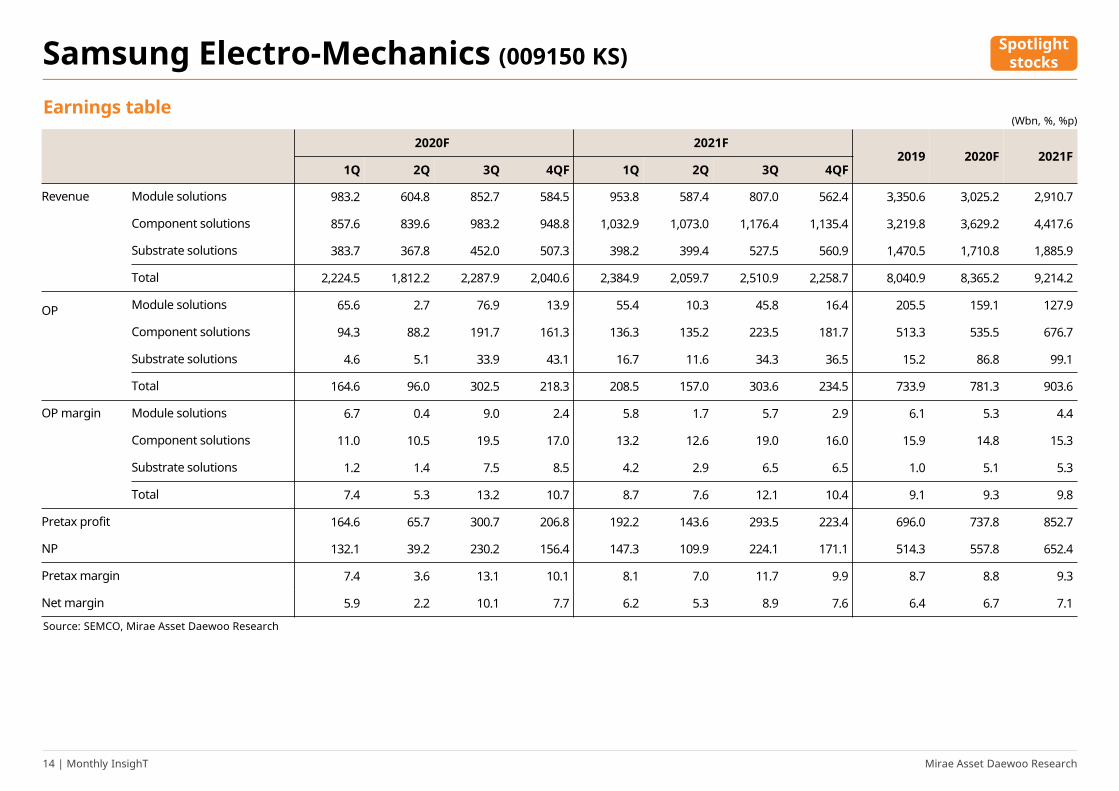
Aiming high for 2021
■ 2020 preview: Decent OP of W781.3bn (+6.5% YoY) expected
- For 2020, we forecast SEMCO to deliver revenue of W8.37tr (+4.0% YoY) and operating profit of W781.3bn (+6.5% YoY).
- IT demand has been stronger than feared, and sales of MLCCs have been decent.
- Moreover, substrate profitability has improved following business streamlining efforts, and SEC’s smartphone volume growth
has had a favorable impact on SEMCO’s earnings.
■ 2021 outlook: OP to expand 15.7% YoY to W903.6bn
- For 2021, we anticipate revenue of W9.21tr (+10.1% YoY) and operating profit of W903.6bn (+15.7% YoY). We think operating
profit could surpass W1tr if market conditions and currency effects turn more favorable.
- We expect SEMCO to benefit from: 1) solid sales of MLCCs for PC/game console applications; 2) improving business
conditions for semiconductor substrates; and 3) a recovery in automotive demand.
■ Reiterate Buy and target price of W196,000
- While the falling USD/KRW rate is worrisome, we note that market conditions are becoming more favorable.
- We maintain our Buy rating and target price of W196,000 (P/B of 2.35x; 10% premium to the three-year upper band average),
in light of solid MLCC sales and the upside potential of the substrate business.
Spotlightstocks
Mirae Asset Daewoo Research14 | Monthly InsighT
2020F 2021F2019 2020F 2021F
1Q 2Q 3Q 4QF 1Q 2Q 3Q 4QF
Revenue Module solutions 983.2 604.8 852.7 584.5 953.8 587.4 807.0 562.4 3,350.6 3,025.2 2,910.7
Component solutions 857.6 839.6 983.2 948.8 1,032.9 1,073.0 1,176.4 1,135.4 3,219.8 3,629.2 4,417.6
Substrate solutions 383.7 367.8 452.0 507.3 398.2 399.4 527.5 560.9 1,470.5 1,710.8 1,885.9
Total 2,224.5 1,812.2 2,287.9 2,040.6 2,384.9 2,059.7 2,510.9 2,258.7 8,040.9 8,365.2 9,214.2
OP Module solutions 65.6 2.7 76.9 13.9 55.4 10.3 45.8 16.4 205.5 159.1 127.9
Component solutions 94.3 88.2 191.7 161.3 136.3 135.2 223.5 181.7 513.3 535.5 676.7
Substrate solutions 4.6 5.1 33.9 43.1 16.7 11.6 34.3 36.5 15.2 86.8 99.1
Total 164.6 96.0 302.5 218.3 208.5 157.0 303.6 234.5 733.9 781.3 903.6
OP margin Module solutions 6.7 0.4 9.0 2.4 5.8 1.7 5.7 2.9 6.1 5.3 4.4
Component solutions 11.0 10.5 19.5 17.0 13.2 12.6 19.0 16.0 15.9 14.8 15.3
Substrate solutions 1.2 1.4 7.5 8.5 4.2 2.9 6.5 6.5 1.0 5.1 5.3
Total 7.4 5.3 13.2 10.7 8.7 7.6 12.1 10.4 9.1 9.3 9.8
Pretax profit 164.6 65.7 300.7 206.8 192.2 143.6 293.5 223.4 696.0 737.8 852.7
NP 132.1 39.2 230.2 156.4 147.3 109.9 224.1 171.1 514.3 557.8 652.4
Pretax margin 7.4 3.6 13.1 10.1 8.1 7.0 11.7 9.9 8.7 8.8 9.3
Net margin 5.9 2.2 10.1 7.7 6.2 5.3 8.9 7.6 6.4 6.7 7.1
Earnings table
Samsung Electro-Mechanics (009150 KS)
Source: SEMCO, Mirae Asset Daewoo Research
(Wbn, %, %p)
Spotlightstocks

Mirae Asset Daewoo Research15 | Monthly InsighT
(Maintain)
Target price (12M, W)
Current price (11/30/20, W)
585
Consensus OP (20F, Wbn)
EPS growth (20F, %)
P/E (20F, x)
Market P/E (20F, x)
KOSPI
Market cap (Wbn) (Dec.) 2017 2018 2019 2020F 2021F 2022F
Shares outstanding (mn) Revenue (Wbn) 7,641 7,982 8,302 9,264 9,300 9,633
Free float (%) OP (Wbn) 296 264 403 585 661 684
Foreign ownership (%) OP margin (%) 3.9 3.3 4.9 6.3 7.1 7.1
Beta (12M) NP (Wbn) 175 163 102 346 451 471
52-week low (W) EPS (W) 7,385 6,891 4,323 14,613 19,039 19,915
52-week high (W) ROE (%) 9.4 8.0 4.7 14.5 16.3 14.6
(%) 1M 6M 12M P/E (x) 19.5 12.5 32.4 10.6 8.1 7.8
Absolute 2.0 5.1 27.0 P/B (x) 1.7 1.0 1.5 1.4 1.2 1.1
Relative -10.8 -17.7 2.4 Div. yield (%) 0.2 0.3 0.2 0.2 0.2 0.2
Notes: Under consolidated K-IFRS; NP is attributable to owners of the parent
Source: LG Innotek, Mirae Asset Daewoo Research estimates
Buy
221,000
155,000
Expected return 43%
76,300
179,500
10.6
17.7
2,591.34
3,668
24
59.2
238.1
OP (20F, Wbn)
593
34.5
0.99
70
80
90
100
110
120
130
140
150
19.11 20.2 20.5 20.8 20.11
LG Innotek
KOSPI
LG Innotek (011070 KS)
Strong performance to continue into 2021
Spotlightstocks
■ 2020 preview: OP of W585.2bn (+45.2% YoY) expected
- For 2020, we expect LG Innotek to report record-high revenue of W9.26tr (+11.6% YoY) and operating profit of W585.2bn
(+45.2% YoY).
- The strong performance should be attributable to record results at the optical solutions unit (camera modules and 3D
sensing modules) and the effects of Apple’s new product releases.
■ Anticipating a quarterly record in 4Q20 followed by a record year in 2021
- For 4Q20, we look for revenue of W3.48tr (+17.5% YoY, +56.2% QoQ) and operating profit of W314.9bn (+50.5% YoY, +252.1%
QoQ).
- In 2021, we forecast LG Innotek to break records again, with revenue of W9.30tr (+0.4% YoY) and operating profit of
W660.9bn (+12.9% YoY).
- The substrates/materials unit (semiconductor/tape substrates, photomasks, and touch windows) is anticipated to deliver
top- and bottom-line growth, and Apple is expected to adopt ToF modules on a broader scale.
■Maintain Buy and target price of W221,000
- The sale of the LED business should remove W100bn in operating losses annually.

Mirae Asset Daewoo Research16 | Monthly InsighT
Earnings table
2020F 2021F2019 2020F 2021F
1Q 2Q 3Q 4QF 1QF 2QF 3QF 4QF
Revenue Total 2,010.9 1,539.9 2,229.9 3,483.5 2,133.1 1,727.1 2,491.8 2,947.5 8,302.0 9,264.2 9,299.6
Optical solutions 1,334.3 929.6 1,458.4 2,757.8 1,423.7 1,037.0 1,697.6 2,140.0 5,425.8 6,480.1 6,298.3
Substrates & materials 289.7 295.7 319.2 312.4 322.4 326.4 346.7 336.2 1,126.0 1,217.0 1,331.8
LED 283.3 232.9 328.2 345.2 335.3 321.7 386.9 420.7 1,131.9 1,189.6 1,464.7
Automotive components 103.6 81.7 124.1 68.1 51.7 42.0 60.7 50.5 618.3 377.5 204.9
OP Total 138.0 42.9 89.4 314.9 143.3 84.5 204.7 228.3 403.1 585.2 660.9
Optical solutions 113.4 12.1 29.2 262.0 85.4 20.7 118.8 149.8 361.0 416.7 374.8
Substrates & materials 42.1 71.4 76.8 70.5 61.7 72.9 87.4 80.3 185.6 260.9 302.3
LED 2.0 -29.0 1.2 2.2 -5.5 -9.4 -1.1 -1.3 -52.9 -23.6 -17.3
Automotive components -19.6 -11.5 -17.8 -19.8 1.7 0.3 -0.5 -0.5 -90.6 -68.7 1.1
OP Total 6.9 2.8 4.0 9.0 6.7 4.9 8.2 7.7 4.9 6.3 7.1
margin Optical solutions 8.5 1.3 2.0 9.5 6.0 2.0 7.0 7.0 6.7 6.4 6.0
Substrates & materials 14.5 24.1 24.1 22.6 19.1 22.3 25.2 23.9 16.5 21.4 22.7
LED 0.7 -12.5 0.4 0.6 -1.6 -2.9 -0.3 -0.3 -4.7 -2.0 -1.2
Automotive components -18.9 -14.1 -14.3 -29.2 3.4 0.7 -0.8 -1.0 -14.7 -18.2 0.5
Pretax profit 109.3 14.6 34.7 298.0 129.6 70.7 187.9 213.1 158.2 456.5 601.2
NP 80.6 7.6 26.9 230.8 97.1 53.0 140.8 159.7 102.3 345.8 450.6
Pretax margin 5.4 0.9 1.6 8.6 6.1 4.1 7.5 7.2 1.9 4.9 6.5
Net margin 4.0 0.5 1.2 6.6 4.6 3.1 5.7 5.4 1.2 3.7 4.8
LG Innotek (011070 KS)
(Wbn, %, %p)
Source: LG Innotek, Mirae Asset Daewoo Research
Spotlightstocks

Mirae Asset Daewoo Research17 | Monthly InsighT
(Maintain)
Target price (12M, W)
Current price (11/30/20, W)
339
Consensus OP (20F, Wbn)
EPS growth (20F, %)
P/E (20F, x)
Market P/E (20F, x)
KOSPI
Market cap (Wbn) (Dec.) 2017 2018 2019 2020F 2021F 2022F
Shares outstanding (mn) Revenue (Wbn) 9,418 10,093 10,176 10,275 10,454 10,689
Free float (%) OP (Wbn) 402 360 272 339 355 373
Foreign ownership (%) OP margin (%) 4.3 3.6 2.7 3.3 3.4 3.5
Beta (12M) NP (Wbn) 297 404 25 130 223 239
52-week low (W) EPS (W) 9,219 12,551 787 4,023 6,939 7,428
52-week high (W) ROE (%) 11.5 13.7 0.8 4.0 6.6 6.7
(%) 1M 6M 12M P/E (x) 7.9 3.9 60.8 15.7 9.1 8.5
Absolute 22.0 69.0 43.1 P/B (x) 0.8 0.5 0.5 0.6 0.6 0.5
Relative 6.7 32.4 15.3 Div. yield (%) 1.7 2.5 3.0 2.3 2.3 2.3
Notes: Under consolidated K-IFRS; NP is attributable to owners of the parent
Source: LS, Mirae Asset Daewoo Research estimates
Buy
80,000
63,200
Expected return 27%
24,100
64,700
15.7
17.7
2,591.34
2,035
32
50.9
411.4
OP (20F, Wbn)
412
11.9
1.27
70
80
90
100
110
120
130
140
150
160
19.11 20.2 20.5 20.8 20.11
LS KOSPI
LS (006260 KS)
Favorable market conditions and recovery of subsidiaries
■ 2020 earnings to be better than feared
- For 3Q20, LS announced revenue of W2.57tr (+3.3% YoY, +2.8% QoQ) and operating profit of W123.8bn (+25.9% YoY, +31.4%
QoQ; including equity-method gains of W23.1bn).
- Revenue and operating profit exceeded our estimates by 3.2% (vs. W2.49tr) and 31.9% (vs. W93.9bn), respectively.
- For 2020, we look for revenue of W10.3tr (+1.0% YoY) and operating profit of W426.6bn (+21.2% YoY; including equity-
method gains of W87.7bn).
■ 2021 outlook: OP to grow 8.3% to W461.8bn (including equity-method gains of W107.1bn)
- Looking ahead to 2021, we see revenue rising 1.7% to W10.45tr and operating profit growing 8.3% to W461.8bn (including
equity-method gains of W107.1bn).
- At LS Cable & System (LSCS), margins are improving thanks to increasing orders for high-end products, while LS-Nikko
Copper looks poised to benefit from higher copper prices.
- LS I&D and LS Mtron should also continue to improve—the former due to Superior Essex’s improvements and the latter due
to increasing electronic parts revenue.
■ Reiterate Buy and lift TP to W80,000
- We reiterate our Buy call on LS and lift our target price to W80,000, applying a P/B of 0.73x (10% premium to the five-year
average) to our 12-month forward BPS of W109,635.
- Assuming a DPS of W1,450, the stock offers a dividend yield of 2.4% based on the current share price.
Spotlightstocks

Mirae Asset Daewoo Research18 | Monthly InsighT
Earnings table
LS (006260 KS)
2020F 2021F2020F 2021F
1Q 2Q 3Q 4QF 1QF 2QF 3QF 4QF
LS Revenue 2,581.5 2,499.4 2,569.8 2,624.7 2,626.3 2,593.6 2,574.8 2,659.5 10,275.3 10,454.2
Equity-method 21.4 12.3 23.1 30.9 27.2 17.7 31.0 31.3 87.7 107.1
OP 93.3 94.2 123.8 115.2 102.9 105.2 134.4 119.3 426.6 461.8
Pretax profit 30.0 52.3 87.3 105.7 78.7 88.9 121.9 106.7 275.3 396.2
NP -7.2 31.1 47.8 57.8 44.3 50.1 69.1 60.0 129.5 223.4
EPS -222 965 1,485 1,795 1,374 1,555 2,145 1,864 4,023 6,939
OP margin 3.6 3.8 4.8 4.4 3.9 4.1 5.2 4.5 4.2 4.4
Pretax margin 1.2 2.1 3.4 4.0 3.0 3.4 4.7 4.0 2.7 3.8
Net margin -0.3 1.2 1.9 2.2 1.7 1.9 2.7 2.3 1.3 2.1
LSCS Revenue 1,155.7 1,216.7 1,171.3 1,162.4 1,250.8 1,230.3 1,157.9 1,169.5 4,706.1 4,808.5
(consolidated) OP 40.9 42.9 42.1 36.0 48.7 47.7 45.8 36.3 161.9 178.4
Pretax profit 23.1 30.5 20.7 45.2 50.6 48.5 54.0 44.0 119.5 197.0
LS I&D Revenue 559.3 464.9 594.6 572.1 564.9 469.5 600.5 577.8 2,190.9 2,212.8
(consolidated) OP -10.6 -0.9 26.0 8.8 -9.6 3.8 20.3 10.1 23.3 24.5
Pretax profit -21.5 -11.6 16.2 6.7 -6.1 2.3 14.5 7.4 -10.2 18.2
LS Mtron Revenue 208.6 204.7 226.2 204.6 232.8 263.9 247.4 233.9 844.1 978.0
(consolidated) OP 0.2 1.6 6.1 6.4 1.8 -9.5 -0.7 1.9 14.3 -6.5
Pretax profit -34.8 -8.0 -8.5 34.1 0.2 4.0 37.5 30.9 -17.2 72.6
LSIS Revenue 635.6 598.3 558.6 685.6 577.8 629.9 568.9 678.3 2,478.1 2,454.8
(consolidated) OP 40.5 38.8 21.8 33.1 34.8 45.5 38.1 39.8 134.2 158.2
Pretax profit 33.0 31.6 28.9 26.5 27.8 36.4 30.5 31.8 120.0 126.6
LS-Nikko Revenue 1,884.7 1,827.1 2,105.5 1,959.3 1,903.5 1,845.4 2,126.6 1,978.9 7,776.6 7,854.4
(consolidated) OP 83.4 44.6 63.7 74.5 84.2 45.0 64.3 75.2 266.2 268.8
Pretax profit 71.1 45.8 79.9 81.0 71.3 46.3 81.3 82.0 277.8 281.0
Source: LS, Mirae Asset Daewoo Research
(Wbn, W, %, %p)
Spotlightstocks

Mirae Asset Daewoo Research19 | Monthly InsighT
(Maintain)
Target price (12M, W)
Current price (11/30/20, W)
65
Consensus OP (20F, Wbn)
EPS growth (20F, %)
P/E (20F, x)
Market P/E (20F, x)
KOSDAQ
Market cap (Wbn) (Dec.) 2017 2018 2019 2020F 2021F 2022F
Shares outstanding (mn) Revenue (Wbn) 668 697 1,268 1,350 1,478 1,609
Free float (%) OP (Wbn) 20 41 113 65 97 114
Foreign ownership (%) OP margin (%) 3.0 5.9 8.9 4.8 6.6 7.1
Beta (12M) NP (Wbn) -1 30 85 55 72 85
52-week low (W) EPS (W) -66 1,767 4,787 3,087 4,022 4,767
52-week high (W) ROE (%) -1.1 26.2 47.7 22.2 23.6 22.9
(%) 1M 6M 12M P/E (x) - 7.3 7.9 11.8 9.1 7.6
Absolute 11.0 13.9 35.3 P/B (x) 2.3 1.7 3.0 2.4 1.9 1.6
Relative -0.7 -8.3 -3.4 Div. yield (%) 1.3 2.3 1.3 1.4 1.9 2.2
Notes: Under consolidated K-IFRS; NP is attributable to owners of the parent
Source: MCNEX, Mirae Asset Daewoo Research estimates
Buy
47,000
36,450
Expected return 29%
21,750
43,350
11.8
17.7
886.11
651
18
70.7
-35.5
OP (20F, Wbn)
63
10.3
0.99
70
80
90
100
110
120
130
140
150
160
170
19.11 20.2 20.5 20.8 20.11
MCNEX KOSDAQ
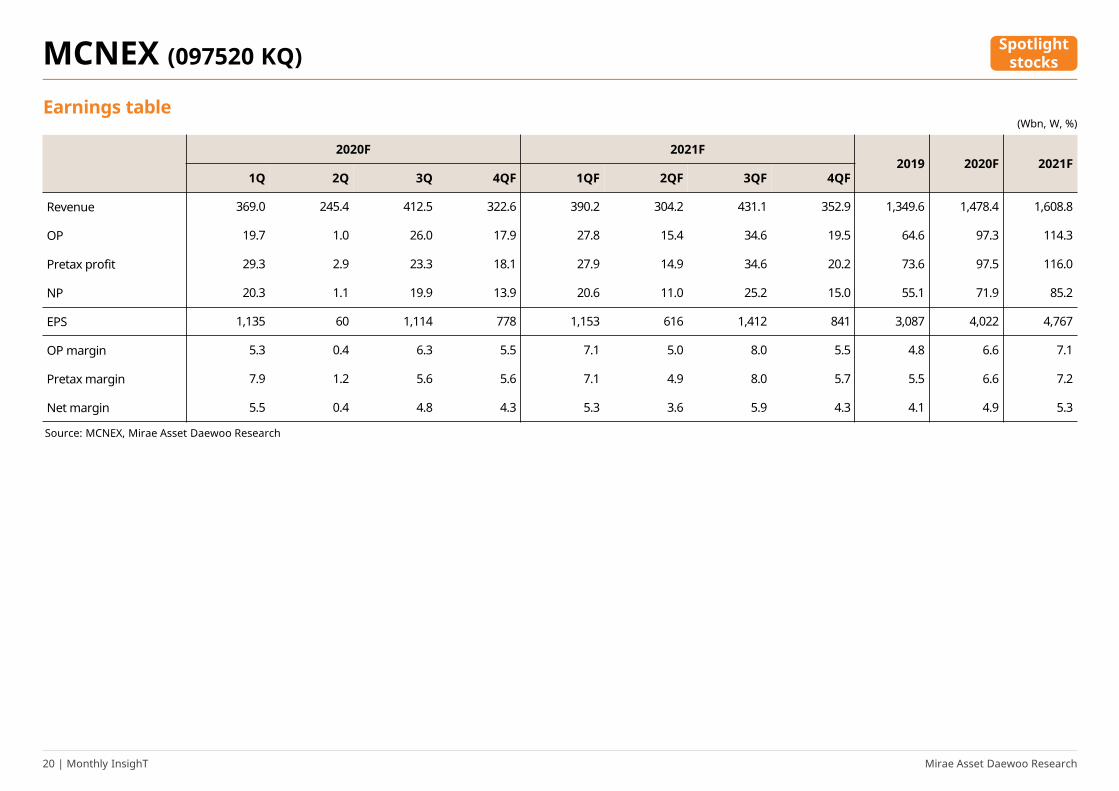
MCNEX (097520 KQ) Spotlight
stocks
A leading smartphone component supplier
■ Revenue to hit a record high in 2020; outstanding risk management capability
- For 2020, we forecast MCNEX to post revenue of W1.35tr (+6.5% YoY) and operating profit of W64.6bn (-42.9% YoY).
- We would view such results as solid, given the sharp deterioration of the smartphone market due to COVID-19.
- We expect revenue to hit a record high on the normalization of SEC’s smartphone sales from 3Q20. However, we see OP
margin contracting 4.1%p YoY to 4.8% due to an unfavorable cost structure.
■ OP to improve to W97.3bn (+50.6% YoY) in 2021
- Looking ahead to 2021, we expect revenue of W1.48tr (+9.5% YoY) and operating profit of W97.3bn (+50.6% YoY).
- We anticipate another year of record-breaking revenue, driven by: 1) SEC’s smartphone sales volume growth; and 2) an
increase in actuator revenue.
- We forecast OP margin to improve 1.8%p YoY to 6.6% (though still lagging behind the 2019 level), fueled by top-line growth
and better automotive camera module margins.
■ Retain Buy and TP of W47,000
- We believe 1) MCNEX’s ability to mass produce smartphone camera modules and 2) the growth potential of its automotive
camera module business deserve attention.
- We derived our target price of W47,000 by applying a P/E of 12x to our 12-month forward EPS of W3,944.
Mirae Asset Daewoo Research20 | Monthly InsighT
Earnings table
2020F 2021F2019 2020F 2021F
1Q 2Q 3Q 4QF 1QF 2QF 3QF 4QF
Revenue 369.0 245.4 412.5 322.6 390.2 304.2 431.1 352.9 1,349.6 1,478.4 1,608.8
OP 19.7 1.0 26.0 17.9 27.8 15.4 34.6 19.5 64.6 97.3 114.3
Pretax profit 29.3 2.9 23.3 18.1 27.9 14.9 34.6 20.2 73.6 97.5 116.0
NP 20.3 1.1 19.9 13.9 20.6 11.0 25.2 15.0 55.1 71.9 85.2
EPS 1,135 60 1,114 778 1,153 616 1,412 841 3,087 4,022 4,767
OP margin 5.3 0.4 6.3 5.5 7.1 5.0 8.0 5.5 4.8 6.6 7.1
Pretax margin 7.9 1.2 5.6 5.6 7.1 4.9 8.0 5.7 5.5 6.6 7.2
Net margin 5.5 0.4 4.8 4.3 5.3 3.6 5.9 4.3 4.1 4.9 5.3
(Wbn, W, %)
Source: MCNEX, Mirae Asset Daewoo Research
SpotlightstocksMCNEX (097520 KQ)

Mirae Asset Daewoo Research21 | Monthly InsighT
(Maintain)
Target price (12M, W)
Current price (11/30/20, W)
3,142
Consensus OP (20F, Wbn)
EPS growth (20F, %)
P/E (20F, x)
Market P/E (20F, x)
KOSPI
Market cap (Wbn) (Dec.) 2017 2018 2019 2020F 2021F 2022F
Shares outstanding (mn) Revenue (Wbn) 61,396 61,342 62,306 62,802 68,273 74,000
Free float (%) OP (Wbn) 2,469 2,703 2,436 3,142 3,731 4,062
Foreign ownership (%) OP margin (%) 4.0 4.4 3.9 5.0 5.5 5.5
Beta (12M) NP (Wbn) 1,726 1,240 31 2,008 2,222 2,587
52-week low (W) EPS (W) 9,543 6,858 173 11,103 12,290 14,308
52-week high (W) ROE (%) 13.7 9.0 0.2 13.2 13.0 13.3
(%) 1M 6M 12M P/E (x) 11.1 9.1 416.8 7.7 7.0 6.0
Absolute 1.8 44.2 22.3 P/B (x) 1.4 0.8 0.9 1.0 0.8 0.7
Relative -10.9 12.9 -1.4 Div. yield (%) 0.4 1.2 1.0 0.9 0.9 0.9
Notes: Under consolidated K-IFRS; NP is attributable to owners of the parent
Source: LG Electronics, Mirae Asset Daewoo Research estimates
Buy
125,000
85,500
Expected return 46%
41,850
96,100
7.7
17.7
2,591.34
13,992
181
65.6
6,317.6
OP (20F, Wbn)
3,153
35.6
0.88
70
80
90
100
110
120
130
140
19.11 20.2 20.5 20.8 20.11
LG Electronics
KOSPI
LG Electronics (066570 KS)
Recovery in auto components; expectations for improvement in smartphones
■ Above-consensus OP of W3.14tr (+29.0% YoY) expected in 2020
- For 2020, we forecast LGE to deliver revenue of W62.80tr (+0.8% YoY) and operating profit of W3.14tr (+29.0% YoY).
- The strong results should be attributable to robust sales of home appliances and TVs amid the COVID-19 pandemic.
■ 2021 outlook: Record OP of W3.73tr (+18.7% YoY)
- For 4Q20, we expect revenue of W18.32tr (+14.1% YoY, +8.3% QoQ) and operating profit of W597.6bn (+487.6% YoY, -37.7%
QoQ).
- Looking to 2021, we anticipate record-high revenue of W68.27tr (+8.7% YoY) and operating profit of W3.73tr (+18.7% YoY).
- Excluding LG Innotek, we expect LGE to post operating profit of W3.07tr, surpassing the record set in 2009 (W2.68tr),
supported by strong home appliance/TV sales.
- The automotive electronics business is projected to swing to profit.
■ Retain Buy and target price of W125,000
- LGE boasts the world’s strongest competitiveness in home appliances and TVs, and the automotive electronics business—a
key growth engine—is improving. Opportunities could also open up for the smartphone business.
- We see no reason for LGE to trade at a P/B of 1x or less. We believe now is the time to aggressively overweight the stock.
Notable stocks

Mirae Asset Daewoo Research22 | Monthly InsighT
2020F 2021F2019 2020F
1Q 2Q 3Q 4QF 1QF 2QF 3QF 4QFMC Revenue 998.6 1,308.7 1,524.8 1,572.6 1,168.2 1,489.9 1,700.3 1,805.0 5,404.7 6,163.4
(Mobile OP -237.8 -206.5 -148.4 -188.7 -116.8 -164.6 -170.0 -151.6 -781.4 -603.0
Communications) OP margin -23.8 -15.8 -9.7 -12.0 -10.0 -11.0 -10.0 -8.4 -14.5 -9.8
HE Revenue 2,970.7 2,256.7 3,669.4 4,125.0 3,348.1 2,808.0 4,170.6 4,762.8 13,021.8 15,089.5
(Home OP 325.8 112.8 326.6 218.6 300.2 238.6 350.4 252.4 983.8 1,141.6
Entertainment) OP margin 11.0 5.0 8.9 5.3 9.0 8.5 8.4 5.3 7.6 7.6
H&A Revenue 5,418.0 5,155.1 6,155.8 5,308.5 5,394.3 4,754.8 6,346.4 5,388.1 22,037.4 21,883.6
(Home Appliance OP 753.5 628.0 671.5 238.9 675.2 579.2 623.1 218.2 2,291.9 2,095.7
& Air Solutions) OP margin 13.9 12.2 10.9 4.5 12.5 12.2 9.8 4.1 10.4 9.6
VS Revenue 1,319.3 912.2 1,655.4 2,069.3 2,014.4 2,115.2 2,326.7 2,443.0 5,956.2 8,899.3
(Vehicle OP -96.8 -202.5 -66.2 -41.4 -40.3 -21.2 65.1 68.4 -406.9 72.1
Components) OP margin -7.3 -22.2 -4.0 -2.0 -2.0 -1.0 2.8 2.8 -6.8 0.8
BS Revenue 1,709.1 1,307.1 1,482.8 1,408.6 1,686.0 1,269.6 1,448.8 1,372.7 5,907.6 5,777.1
OP 212.2 98.3 77.0 63.4 125.6 85.9 75.2 61.8 450.9 348.5
OP margin 12.4 7.5 5.2 4.5 7.4 6.8 5.2 4.5 7.6 6.0
Internal & other Revenue 301.2 354.1 201.6 353.2 273.2 307.2 221.2 358.7 1,210.1 1,160.4
OP -4.5 22.4 9.1 -8.1 -4.3 18.7 8.9 -8.0 18.9 15.4
OP margin -1.5 6.3 4.5 -2.3 -1.6 6.1 4.0 -2.2 1.6 1.3
LG Innotek Revenue 2,010.9 1,539.9 2,229.8 3,483.5 2,133.1 1,727.1 2,491.8 2,947.5 9,264.1 9,299.6
OP 138.0 42.9 89.4 314.9 143.3 84.5 204.7 228.3 585.2 660.9
Total Revenue 14,727.8 12,833.8 16,919.6 18,320.7 16,017.3 14,471.8 18,705.8 19,077.9 62,801.9 68,272.8
OP 1,090.4 495.4 959.0 597.6 1,083.0 821.3 1,157.3 669.6 3,142.4 3,731.2
OP margin 7.4 3.9 5.7 3.3 6.8 5.7 6.2 3.5 5.0 5.5
LGE(excludingLG Innotek)
Revenue 12,860.4 11,441.8 14,916.3 15,014.9 14,046.7 12,929.4 16,412.3 16,291.9 54,233.4 59,680.4
OP 951.2 453.8 872.1 280.2 938.3 741.3 955.1 438.8 2,557.3 3,073.6
OP margin 7.4 4.0 5.8 1.9 6.7 5.7 5.8 2.7 4.7 5.2
Pretax profit 1,389.4 147.9 771.6 390.3 983.6 736.9 1,025.7 457.2 2,699.1 3,203.4
Pretax margin 9.4 1.2 4.6 2.1 6.1 5.1 5.5 2.4 4.3 4.7
NP 1,025.4 56.5 626.1 299.7 735.4 490.6 657.2 339.2 2,007.7 2,222.4
Net margin 7.0 0.4 3.7 1.6 4.6 3.4 3.5 1.8 3.2 3.3
Handset sales volume 5,900 6,300 7,400 7,590 6,195 6,930 7,770 7,970 27,190 28,865
- Smartphones 5,800 6,200 7,300 7,505 6,113 6,850 7,694 7,897 26,805 28,554
TV sales volume 6,500 4,500 7,500 8,385 6,672 5,433 8,000 8,701 26,885 28,806
- OLED TV 370 330 500 800 481 429 650 1,040 2,000 2,600
Earnings table
Source: LGE, Mirae Asset Daewoo Research
LG Electronics (066570 KS) Notable stocks

Mirae Asset Daewoo Research23 | Monthly InsighT
(Maintain)
Target price (12M, W)
Current price (11/30/20, W)
238
Consensus OP (20F, Wbn)
EPS growth (20F, %)
P/E (20F, x)
Market P/E (20F, x)
KOSPI
Market cap (Wbn) (Dec.) 2017 2018 2019 2020F 2021F 2022F
Shares outstanding (mn) Revenue (Wbn) 4,215 4,453 5,264 5,288 5,970 6,341
Free float (%) OP (Wbn) 83 53 165 238 253 294
Foreign ownership (%) OP margin (%) 2.0 1.2 3.1 4.5 4.2 4.6
Beta (12M) NP (Wbn) -48 32 132 107 154 180
52-week low (W) EPS (W) -913 619 2,555 2,111 3,038 3,552
52-week high (W) ROE (%) -2.1 1.4 5.4 4.2 5.8 6.4
(%) 1M 6M 12M P/E (x) - 52.5 13.7 12.5 8.7 7.4
Absolute 5.2 8.6 -31.3 P/B (x) 0.9 0.7 0.7 0.5 0.5 0.5
Relative -8.0 -14.9 -44.7 Div. yield (%) 0.0 0.0 0.0 0.0 0.0 0.4
Notes: Under consolidated K-IFRS; NP is attributable to owners of the parent
Source: Hanwha Aerospace, Mirae Asset Daewoo Research estimates
Buy
39,000
26,400
Expected return 48%
15,000
38,450
12.5
17.7
2,591.34
1,337
51
66.0
-17.4
OP (20F, Wbn)
217
16.7
1.48
70
80
90
100
110
120
130
19.11 20.2 20.5 20.8 20.11
Hanwha Aerospace
KOSPI
Hanwha Aerospace (012450 KS)
Unfairly undervalued
■ 2020F OP of W237.9bn (+44.0% YoY)
- For 2020, we forecast Hanwha Aerospace to post revenue of W5.29tr (+0.5% YoY) and operating profit of W237.9bn (+44.0%
YoY).
- While our revenue forecast would mark a record high, our operating profit forecast is shy of the historical high of W250.7bn
posted in 2011.
- We estimate risk and revenue sharing program (RSP) expenses at W88.4bn.
■ Record-breaking OP of W253.4bn (+6.5% YoY) expected in 2021
- Looking ahead to 2021, we expect the company to deliver record-breaking revenue and operating profit of W5.97tr (+12.9%
YoY) and W253.4bn (+6.5% YoY), respectively.
- The security camera business (Hanwha Techwin) and chip mounter business (Hanwha Precision Machinery) should deliver
robust earnings, while Hanwha Systems should also see stable earnings.
■ Reaffirm Buy and target price of W39,000
- Currently trading at a 2021F P/E of 8.7x and P/B of 0.5x, Hanwha Aerospace’s stock appears excessively undervalued, given
steadily improving earnings.
- We reaffirm our Buy rating and target price of W39,000 and advise investors to start accumulating the stock.
Notable stocks

Mirae Asset Daewoo Research24 | Monthly InsighT
Hanwha Aerospace (012450 KS)
(Wbn, %, %p)Earnings table
2020F 2021F2019 2020F 2020F
1Q 2Q 3Q 4QF 1QF 2QF 3QF 4QF
Revenue Hanwha Aerospace 346.9 264.4 310.7 352.8 364.2 277.6 326.2 370.4 1,265.8 1,274.8 1,338.5
Hanwha Techwin 136.3 125.1 129.7 181.2 147.4 101.0 142.7 218.8 580.1 572.3 609.9
Hanwha Power Systems 18.3 61.0 58.9 80.6 19.2 64.2 62.1 85.2 227.1 218.8 230.8
Hanwha Precision Machinery 63.6 75.6 94.9 90.2 81.1 121.7 109.5 104.1 359.9 324.3 416.4
Hanwha Systems 282.2 323.1 379.6 474.5 332.2 365.8 417.0 469.2 1,546.0 1,459.4 1,584.2
Hanwha Defense 212.5 377.1 435.2 545.3 381.7 425.6 481.2 633.4 1,462.6 1,570.1 1,921.9
Adjustments -32.4 -33.6 -31.9 -33.9 -33.0 -33.1 -33.0 -33.2 -177.5 -131.8 -132.2
Total 1,027.4 1,192.7 1,377.1 1,690.6 1,293.0 1,322.9 1,505.9 1,847.8 5,264.0 5,287.8 5,969.6
OP Hanwha Aerospace -9.1 -5.2 0.0 -3.5 -9.0 -4.0 -3.6 -3.8 -56.2 -17.8 -20.3
Hanwha Techwin 6.0 5.7 7.8 8.2 5.8 6.9 6.7 9.2 29.5 27.7 28.6
Hanwha Power Systems -6.3 4.5 3.4 4.0 -1.0 4.7 1.6 8.3 13.1 5.6 13.6
Hanwha Precision Machinery -6.1 -0.3 8.5 7.2 -4.1 9.6 3.0 2.4 14.0 9.3 10.8
Hanwha Systems 10.9 18.2 44.7 33.2 13.9 21.2 37.6 28.5 85.8 107.0 101.2
Hanwha Defense 11.7 50.6 32.8 24.5 12.9 41.5 49.6 29.4 92.9 119.6 133.4
Adjustments -3.9 -3.3 -2.9 -3.5 -3.4 -3.4 -3.5 -3.7 -13.9 -13.6 -14.0
Total 3.2 70.2 94.3 70.2 15.1 76.6 91.5 70.3 165.2 237.9 253.4
OP margin 0.3 5.9 6.8 4.1 1.2 5.8 6.1 3.8 3.1 4.5 4.2
Pretax profit -9.4 61.0 75.6 62.3 7.0 69.8 84.1 64.5 156.3 189.5 225.4
NP -13.1 36.9 41.1 42.4 4.6 48.9 56.1 44.2 132.2 107.3 153.8
Pretax margin -0.9 5.1 5.5 3.7 0.5 5.3 5.6 3.5 3.0 3.6 3.8
Net margin -1.3 3.1 3.0 2.5 0.4 3.7 3.7 2.4 2.5 2.0 2.6
Source: Hanwha Aerospace, Mirae Asset Daewoo Research
Notable stocks

Mirae Asset Daewoo Research25 | Monthly InsighT
(Maintain)
Target price (12M, W)
Current price (11/30/20, W)
65
Consensus OP (20F, Wbn)
EPS growth (20F, %)
P/E (20F, x)
Market P/E (20F, x)
KOSDAQ
Market cap (Wbn) (Dec.) 2017 2018 2019 2020F 2021F 2022F
Shares outstanding (mn) Revenue (Wbn) 1,110 1,194 1,130 1,152 1,256 1,380
Free float (%) OP (Wbn) 98 95 50 65 81 98
Foreign ownership (%) OP margin (%) 8.8 8.0 4.4 5.6 6.4 7.1
Beta (12M) NP (Wbn) 40 63 34 33 54 65
52-week low (W) EPS (W) 692 1,077 592 560 928 1,121
52-week high (W) ROE (%) 6.7 10.1 5.3 4.8 7.5 8.6
(%) 1M 6M 12M P/E (x) 40.3 18.0 27.5 33.5 20.2 16.7
Absolute 7.4 34.9 41.5 P/B (x) 2.7 1.7 1.4 1.5 1.4 1.4
Relative -3.9 8.6 1.1 Div. yield (%) 0.7 1.5 1.0 1.6 1.6 0.5
Notes: Under consolidated K-IFRS; NP is attributable to owners of the parent
Source: Seoul Semiconductor, Mirae Asset Daewoo Research estimates
Buy
23,100
18,750
Expected return 23%
10,000
20,150
33.5
17.7
886.11
1,093
58
66.5
-5.3
OP (20F, Wbn)
65
10.7
1.04
70
80
90
100
110
120
130
140
150
19.11 20.2 20.5 20.8 20.11
Seoul Semiconductor
KOSDAQ
Seoul Semiconductor (046890 KQ)
Potential end-market improvements and efficient cost management
■ Better-than-feared 2020F OP of W64.5bn (+30.2% YoY)
- For 2020, we expect SSC to deliver revenue of W1.15tr (+2.0% YoY) and operating profit of W64.5bn (+30.2% YoY).
- We believe the company has benefited from IT product demand related to remote work and distance learning amid COVID-
19; sales of backlight units (BLUs) for TV, notebook, and monitor applications came in better than expected.
- In particular, we estimate that BLU earnings related to TV/laptop/monitor applications will exceed our expectations.
■ 2021F OP of W81.0bn (+25.6% YoY)
- For 4Q20, we anticipate revenue of W309.8bn (+10.3% YoY, -6.5% QoQ) and operating profit of W19.4bn (+40.2% YoY, -23.5%
QoQ).
- Looking ahead to 2021, we expect revenue and operating profit to improve to W1.25tr (+9.0% YoY) and W81.0bn (+25.6%
YoY), respectively.
- We expect: 1) the strong performance of TV/monitor BLUs to continue; 2) automotive LED revenue to gradually pick up; and
3) Seoul Viosys’s UV LED sales to grow.
■ Reaffirm Buy and target price of W23,100
- SSC is further strengthening its competitiveness on the back of its strong technology and patents.
- We expect the mini-LED BLU TV market to expand in 2021.
- Bullish expectations on UV LED and micro-LED are also positive to the company’s stock.
Notable stocks

Mirae Asset Daewoo Research26 | Monthly InsighT
Earnings table
2020F 2021F2019 2020F 2021F
1Q 2Q 3Q 4QF 1QF 2QF 3QF 4QF
Revenue 243.2 268.1 331.2 309.8 297.5 310.5 324.0 324.2 1,129.4 1,152.3 1,256.2
OP 6.0 13.7 25.4 19.4 13.0 17.1 28.4 22.6 49.5 64.5 81.0
Pretax profit 10.1 13.0 18.5 15.7 12.6 16.4 28.0 22.5 47.7 57.4 79.6
NP 6.3 5.0 10.7 10.7 8.6 11.2 19.1 15.3 34.5 32.7 54.1
EPS 108 86 184 183 147 192 327 263 592 560 928
OP margin 2.5 5.1 7.7 6.3 4.4 5.5 8.8 7.0 4.4 5.6 6.5
Pretax margin 4.2 4.9 5.6 5.1 4.2 5.3 8.6 6.9 4.2 5.0 6.3
Net margin 2.6 1.9 3.2 3.4 2.9 3.6 5.9 4.7 3.1 2.8 4.3
Seoul Semiconductor (046890 KQ)
(Wbn, W, %)
Source: SSC, Mirae Asset Daewoo Research
Notable stocks

Mirae Asset Daewoo Research27 | Monthly InsighT
I. Investment strategy
II. Sector view
III. Spotlight stocks & other notable stocks
IV. Pioneer: Company visits/IR/NDRs/IPOs
V. Global IT navigation

Mirae Asset Daewoo Research28 | Monthly InsighT
(Wbn)
Consensus (Wbn)Share performance
(%)2020F (x, %)
Notes
4Q20F 2020F 2021F 1W 1M 1Y P/E P/B ROE
Shinsung E&G Revenue - - - 7.3 35.3 333.1 - - - Established in Jan. 1977; went public in Jul. 1996
Market cap: OP - - -Businesses: Clean environment solutions (clean room) and renewable energy (solar cells/modules)
811.5 NP - - -3Q20 results: Revenue of W138.6bn (+18% YoY, +9% QoQ) and OP of W3.5bn (+60% YoY, +2% QoQ)
Everybot Revenue - - - 11.8 55.6 1,478.6 - - - Established in 2015 and listed on the KONEX in Jul. 2017
Market cap: OP - - -Launched the world’s first dual-spin mopping robot in 2016; cumulative sales of over 420,000 units as of Jun. 2020
124.1 NP - - -Sales volume: 142,000 units in 2017, 83,000 units in 2018, 89,000 units in 2019, 77,000 units in 1H20
SD Optics Revenue - - - - - - - - -
Established in 2010
Businesses: Manufacture of optical modules and inspection systems based on Micro-mirror Array Lens System (MALS™)
Market cap: OP - - - Products: MALS lenses (the world’s first ultra-fast varifocal lenses; based on the MEMS technology)
Unlisted NP - - -
Optrontec Revenue 55.2 215.0 245.5 9.8 23.2 -3.3 17.5 1.5 9.2Established in May 1999; listed on the KOSDAQ in Jun. 2005; merged with Havit Information in Feb. 2009
Market cap: OP 5.1 17.4 23.1Products: Optical filters/lenses/zoom and variable aperture lenses
178.5 NP 3.0 8.7 12.4
INNO Instrument Revenue 14.1 45.0 - 2.9 15.4 -23.5 16.0 - 9.3Established in Feb. 2007; completed a merger with NH Special Purpose Acquisition 5 in Apr. 2017 (SPAC)
Market cap: OP 1.7 3.2 - Business: Manufacture/sale of fusion slicers
78.6 NP 1.3 4.2 - A potential beneficiary of 5G market expansion
November company visits/IR/NDRs
IV. Pioneer
Source: Company data, Bloomberg, Mirae Asset Daewoo Research

Mirae Asset Daewoo Research29 | Monthly InsighT
Source: Company data, Bloomberg, Mirae Asset Daewoo Research
November company visits/IR/NDRs
IV. Pioneer
(Wbn)
Consensus (Wbn)Share performance
(%)2020F (x, %)
Notes
4Q20F 2020F 2021F 1W 1M 1Y P/E P/B ROE
Innox AdvancedMaterials
Revenue 94.2 341.5 430.7 -0.4 2.2 -5.6 14.5 2.0 15.1 Spun off from Innox in Jun. 2017 and listed on the KOSDAQ in Jul. 2017
Market cap: OP 12.9 42.6 59.7Businesses: Development/manufacture of materials for FPCBs, semiconductor packages, and OLEDs based on polymer synthesis/compounding technology
428.6 NP 8.1 29.3 43.23Q20 results: Revenue of W105.9bn (+10% YoY, +43% QoQ), OP of W19.4bn (+48% YoY, +178% QoQ)
Intellian Technologies
Revenue - 119.2 141.4 -1.1 13.0 1.4 44.9 4.3 6.0Businesses (established on Feb. 5, 2004): Development/manufacture/distribution of satelliteantennas
Market cap: OP - 6.9 12.2 Key products: Very-small-aperture terminal (VSAT) antennas (C-/Ku-/Ka-bands), fleet broadband (FBB) antennas (L-band), television receive-only (TVRO) antennas, flyaway antennas, etc.246.9 NP - 5.5 10.8
JNTC Revenue 75.4 365.9 376.2 2.7 4.7 - 7.5 1.5 23.7 Established as Hyupjin Industries in Nov. 1996 and renamed JNTC in Apr. 2012
Market cap: OP 12.6 89.5 73.7 Businesses: Development/manufacture of tempered glass and handset-use connectors
650.8 NP 11.3 87.0 68.9 3Q20 results: Revenue of W87.7bn (-6% YoY, -7% QoQ), OP of W17.1bn (-47% YoY, -24% QoQ)
Park Systems Revenue - 68.6 78.2 9.8 22.6 110.3 28.2 - 33.1 Established in Apr. 1997 and listed on the KOSDAQ in Dec. 2015
Market cap: OP - 19.4 24.1 Businesses: Development/manufacture of atomic force microscopes
492.1 NP - 17.4 19.2 3Q20 results: Revenue of W16.4bn (+60% YoY, -12% QoQ), OP of 4bn (+1,417% YoY, -0.5% QoQ)
Point Mobile Revenue - - - - - - - - -Businesses: Development/manufacture of industrial-use PDAs and peripherals (established in 2006)
Market cap: OP - - - No. 1 share in domestic market; products available in 79 countries
IPO NP - - - IPO scheduled for Dec. 2020 at an IPO price of W15,000

Mirae Asset Daewoo Research30 | Monthly InsighT
I. Investment strategy
II. Sector view
III. Spotlight stocks & other notable stocks
IV. Pioneer: Company visits/IR/NDRs/IPOs
V. Global IT navigation

Mirae Asset Daewoo Research31 | Monthly InsighT
IV. Global IT navigation
Stock market remained strong despite resurgence of COVID-19
Global IT index performance table (11/30)
Global IT shares: Top/bottom 15 performers in NovemberDomestic IT shares: Top/bottom 10 performers in November
IndexPerformance (%)
1W 1M 3M 6M 12M
Dow Jones 29,910 1.4 12.9 5.2 17.8 6.6
S&P 500 3,638 1.6 11.3 3.9 19.5 15.8
NASDAQ 12,206 2.5 11.9 3.7 28.6 40.9
KOSPI 2,591 -0.4 14.3 11.4 27.7 24.1
KOSDAQ 886 1.5 11.8 4.5 24.2 40.0
MSCI IT
World 417 2.6 11.8 1.2 26.9 39.7
Korea 1,743 1.0 20.9 26.2 33.6 37.8
US 501 1.3 11.1 0.3 27.2 41.8
Japan 205 5.5 16.4 19.9 24.2 20.3
Taiwan 329 -0.8 12.1 14.6 49.1 43.2
China 1,078 -1.5 9.5 8.3 56.8 69.4
Source: Bloomberg, Mirae Asset Daewoo Research
Source: Bloomberg, Mirae Asset Daewoo ResearchSource: Bloomberg, Mirae Asset Daewoo Research
■ Global industry performance- MSCI IT World (+11.8%), MSCI IT Korea (+20.9%), MSCI IT US (+11.1%), MSCI IT China
(+9.5%), and MSCI IT Taiwan (+12.1%) all posted MoM gains. - IT product demand has increased since the COVID-19 outbreak. - Korean IT plays deserve attention.
■ Sector performance- IT companies (semiconductor, etc.) reported decent earnings, as IT product sales
have increased amid the rise of the contactless culture. - Green/renewable energy stocks that are expected to benefit from the Biden
presidency advanced. - Share performances diverged by downstream industry.
■ Company performance- Lyft (LYFT US, +71.0%): California Assembly Bill 5 (AB5) extended employee
classification status to gig workers (including Uber/Lyft drivers).- Nikola (NKLA US, +52.5%): GM, Nikola’s strategic partner, pulled out of the California
emissions litigation (spearheaded by the Trump administration) in favor of President-elect Joe Biden’s eco-friendly energy policies.
- Tesla (TSLA US, +51.0%): Addition to the S&P 500 and favorable renewable energy policies of the upcoming administration
0
10
20
30
L&F
Won
ik IP
S
Eug
ene
Won
ik M
ater
ials
SK
Hyn
ix LS
Sam
sung
SD
I
TE
S
SE
C
SK
Mat
eria
ls
Han
wha
Aer
ospa
ce KC
Am
otec
h
Par
tron
Sili
con
Wor
ks
Spi
gen
Kor
ea
Inno
x A
MC
LG In
note
k
LGE
Sou
lbra
in
(%)
-40
0
40
80
Lyft
Nik
ola
Ube
r
Tes
la
3D S
yste
ms
Boe
ing
Cre
e
Com
mS
cope
AM
AT
GS
Yua
sa
Bla
ckB
erry
Glo
bal W
afer
s
Lam
Res
earc
h
SU
MC
O
Vee
co
Japa
n D
ispl
ay
Eve
rligh
t
Ten
cent
Ace
r
Sky
wor
ks
Coh
eren
t
SM
IC
Wiw
ynn
TP
K
Alib
aba
Pre
cise
Bio
met
rics
Cal
-Com
p E
lect
roni
cs
His
ense
Alp
s E
lect
ric
Goe
rtek
(%)

Mirae Asset Daewoo Research32 | Monthly InsighT
IV. Global IT navigation
Key charts
Source: Bloomberg, Mirae Asset Daewoo Research Source: Bloomberg, Mirae Asset Daewoo Research
Source: Bloomberg, Mirae Asset Daewoo Research Source: Bloomberg, Mirae Asset Daewoo Research
MSCI World and MSCI World IT
IT sector P/E comparison (2020)
MSCI IT performance by country
IT sector P/B-ROE comparison (2020)
80
120
160
200
240
280
320
360
400
440
480
520
1/12 1/13 1/14 1/15 1/16 1/17 1/18 1/19 1/20
MSCI World MSCI World IT(1/1/12=100)
80
140
200
260
320
380
440
500
560
620
1/12 1/13 1/14 1/15 1/16 1/17 1/18 1/19 1/20
MSCI US IT MSCI Korea IT
MSCI Japan IT MSCI Taiwan IT
(1/1/12=100)
31.9
27.8 29.9 29.6
20.8 18.2
0
10
20
30
40
China Japan World US Taiwan Korea
(x)
0
2
4
6
8
10
12
0 10 20 30 40 50 60 70
ROE (%)
P/B (x)
World
US
China
TaiwanJapan
Korea

Mirae Asset Daewoo Research33 | Monthly InsighT
Important disclosures and disclaimers
Two-year rating and TP history
Company Date Rating TP (W) Company Date Rating TP (W)
Samsung Electro-Mechanics (009150) 11/14/18 Buy 80,000
11/18/20 Buy 196,000 MCNEX (097520)
07/29/20 Buy 178,000 11/18/20 Buy 47,000
07/01/20 Buy 159,000 LG Electronics (066570)
06/01/20 Buy 152,000 10/05/20 Buy 125,000
04/01/20 Buy 143,000 09/01/20 Buy 105,000
01/29/20 Buy 160,000 07/31/20 Buy 91,700
01/01/20 Buy 151,000 04/01/20 Buy 82,000
10/24/19 Buy 143,000 01/30/20 Buy 87,400
03/25/19 Buy 133,000 07/30/19 Buy 89,900
01/01/19 Buy 150,000 03/29/19 Buy 99,500
09/30/18 Buy 195,000 03/03/19 Buy 89,100
LG Innotek (011070) 02/01/19 Buy 86,000
07/01/20 Buy 221,000 01/01/19 Buy 89,000
01/29/20 Buy 201,000 09/30/18 Buy 99,000
11/25/19 Buy 171,000 Hanwha Aerospace (012450)
10/29/19 Buy 166,000 08/12/20 Buy 39,000
10/01/19 Buy 147,000 08/03/20 Buy 35,000
06/30/19 Buy 139,000 05/13/20 Buy 33,000
04/23/19 Buy 156,000 04/01/20 Buy 34,100
03/20/19 Buy 139,000 08/12/19 Buy 44,700
01/27/19 Buy 122,000 02/20/19 Buy 43,000
01/01/19 Buy 126,000 01/17/19 Buy 47,000
09/30/18 Buy 177,000 11/13/18 Buy 42,000
LS (006260) Seoul Semiconductor (046890)
12/01/20 Buy 80,000 10/27/20 Buy 23,100
11/18/20 Buy 72,300 10/05/20 Buy 23,000
10/05/20 Buy 63,600 07/30/20 Buy 21,000
09/01/20 Buy 56,900 07/01/20 Buy 17,000
08/03/20 Buy 53,400 04/01/20 Buy 16,700
04/01/20 Buy 48,800 01/01/20 Buy 21,300
02/11/20 Buy 51,700 11/01/19 Buy 18,300
08/15/19 Buy 57,300 10/01/19 Buy 18,600
05/15/19 Buy 65,900 08/01/19 Buy 21,300

Mirae Asset Daewoo Research34 | Monthly InsighT
Company Date Rating TP (W) Company Date Rating TP (W)
06/30/19 Buy 24,500 10/26/18 Buy 9,900
04/29/19 Buy 29,500 Amotech (052710)
04/08/19 Buy 29,100 08/18/20 Hold 31,800
01/30/19 Buy 30,500 05/18/20 Hold
01/18/19 Buy 27,300 04/20/20 Trading Buy 25,900
01/01/19 Buy 26,700 02/20/20 Buy 37,400
09/30/18 Buy 26,000 10/21/19 Buy 27,700
Seoul Viosys (092190) 08/01/19 Buy 23,500
11/18/20 Buy 23,000 04/10/19 Buy 29,000
Partron (091700) 02/11/19 Buy 26,300
11/03/20 Buy 12,900 11/01/18 Buy 28,200
07/31/20 Hold 11,400 Spigen Korea (192440)
05/04/20 Hold 10/05/20 Buy 90,000
04/20/20 Trading Buy 10,000 08/18/20 Buy 87,000
02/23/20 Buy 14,600 07/01/20 Buy 78,000
10/21/19 Buy 18,000 05/18/20 Buy 63,000
08/15/19 Buy 20,000 04/20/20 Buy 60,000
06/17/19 Buy 22,700 10/21/19 Buy 78,000
05/02/19 Buy 19,000 08/15/19 Buy 76,000
03/21/19 Buy 17,000 01/28/19 Buy 79,000
02/07/19 Buy 12,500 08/01/18 Buy 74,000

Mirae Asset Daewoo Research35 | Monthly InsighT
Ratings distribution and investment banking services
Buy Trading Buy Hold Sell
Ratings distribution 73.62% 14.11% 11.04% 1.23%
Investment banking services 72.22% 11.11% 16.67% 0.00%
* Based on recommendations in the last 12-months (as of September 30, 2020)
Stock ratings Sector ratings
Buy Expected 12-month performance: +20% or greater Overweight Expected to outperform the market over 12 months
Trading Buy Expected 12-month performance: +10% to +20% Neutral Expected to perform in line with the market over 12 months
Hold Expected 12-month performance: -10% to +10% Underweight Expected to underperform the market over 12 months
Sell Expected 12-month performance: -10% or worse
Rating and TP history: Share price (─), TP (▬), Not Rated (■), Buy (▲), Trading Buy (■), Hold (●), Sell (◆)
* Our investment rating is a guide to the expected return of the stock over the next 12 months.
* Outside of the official ratings of Mirae Asset Daewoo Co., Ltd., analysts may call trading opportunities should technical or short-term material developments arise.
* The TP was determined by the research analyst through valuation methods discussed in this report, in part based on estimates of future earnings.
* TP achievement may be impeded by risks related to the subject securities and companies, as well as general market and economic conditions.
0
50,000
100,000
150,000
200,000
250,000
Dec 18 Dec 19 Dec 20
(W) Samsung Electro-Mechanics
0
50,000
100,000
150,000
200,000
250,000
Dec 18 Dec 19 Dec 20
(W) LG Innotek
0
20,000
40,000
60,000
80,000
100,000
Dec 18 Dec 19 Dec 20
(W) LS
0
10,000
20,000
30,000
40,000
50,000
Dec 18 Dec 19 Dec 20
(W) MCNEX
0
50,000
100,000
150,000
Dec 18 Dec 19 Dec 20
(W) LG Electronics
0
10,000
20,000
30,000
40,000
50,000
Dec 18 Dec 19 Dec 20
(W) Hanwha Aerospace
0
10,000
20,000
30,000
40,000
Dec 18 Dec 19 Dec 20
(W) Seoul Semiconductor
0
5,000
10,000
15,000
20,000
25,000
30,000
Dec 18 Dec 19 Dec 20
(W) Seoul Viosys
0
5,000
10,000
15,000
20,000
25,000
Dec 18 Dec 19 Dec 20
(W) Partron
0
10,000
20,000
30,000
40,000
Dec 18 Dec 19 Dec 20
(W) Amotech
0
20,000
40,000
60,000
80,000
100,000
Dec 18 Dec 19 Dec 20
(W) Spigen Korea

Mirae Asset Daewoo Research36 | Monthly InsighT
Disclosures
As of the publication date, Mirae Asset Daewoo Co., Ltd. has acted as a liquidity provider for equity-linked warrants backed by shares of Samsung Electro-Mechanics, LG Innotek, Hanwha Aerospace, LG Electronics as an underlying asset; other than
this, Mirae Asset Daewoo has no other special interests in the covered companies.
As of the publication date, Mirae Asset Daewoo Co., Ltd. is acting as a financial advisor to Seoul Semiconductor for its treasury share buyback and cancellation.
Analyst certification
The research analysts who prepared this report (the “Analysts”) are registered with the Korea Financial Investment Association and are subject to Korean securities regulations. They are neither registered as research analysts in any
other jurisdiction nor subject to the laws or regulations thereof. Each Analyst responsible for the preparation of this report certifies that (i) all views expressed in this report accurately reflect the personal views of the Analyst about any
and all of the issuers and securities named in this report and (ii) no part of the compensation of the Analyst was, is, or will be directly or indirectly related to the specific recommendations or views contained in this report. Mirae Asset
Daewoo Co., Ltd. (“Mirae Asset Daewoo”) policy prohibits its Analysts and members of their households from owning securities of any company in the Analyst’s area of coverage, and the Analysts do not serve as an officer, director, or
advisory board member of the subject companies. Except as otherwise specified herein, the Analysts have not received any compensation or any other benefits from the subject companies in the past 12 months and have not been
promised the same in connection with this report. Like all employees of Mirae Asset Daewoo, the Analysts receive compensation that is determined by overall firm profitability, which includes revenues from, among other business units,
the institutional equities, investment banking, proprietary trading, and private client divisions. At the time of publication of this report, the Analysts do not know or have reason to know of any actual, material conflict of interest of the
Analyst or Mirae Asset Daewoo except as otherwise stated herein.
Disclaimers
This report was prepared by Mirae Asset Daewoo, a broker-dealer registered in the Republic of Korea and a member of the Korea Exchange. Information and opinions contained herein have been compiled in good faith and from
sources believed to be reliable, but such information has not been independently verified and Mirae Asset Daewoo makes no guarantee, representation or warranty, express or implied, as to the fairness, accuracy, completeness, or
correctness of the information and opinions contained herein or of any translation into English from the Korean language. In case of an English translation of a report prepared in the Korean language, the original Korean language
report may have been made available to investors in advance of this report.
The intended recipients of this report are sophisticated institutional investors who have substantial knowledge of the local business environment, its common practices, laws, and accounting principles, and no person whose receipt or
use of this report would violate any laws or regulations or subject Mirae Asset Daewoo or any of its affiliates to registration or licensing requirements in any jurisdiction shall receive or make any use hereof.
This report is for general information purposes only and is not and shall not be construed as an offer or a solicitation of an offer to effect transactions in any securities or other financial instruments. The report does not constitute
investment advice to any person, and such person shall not be treated as a client of Mirae Asset Daewoo by virtue of receiving this report. This report does not take into account the particular investment objectives, financial situations,
or needs of individual clients. The report is not to be relied upon in substitution for the exercise of independent judgment. Information and opinions contained herein are as of the date hereof and are subject to change without notice.
The price and value of the investments referred to in this report and the income from them may depreciate or appreciate, and investors may incur losses on investments. Past performance is not a guide to future performance. Future
returns are not guaranteed, and a loss of original capital may occur. Mirae Asset Daewoo, its affiliates, and their directors, officers, employees, and agents do not accept any liability for any loss arising out of the use hereof.
Mirae Asset Daewoo may have issued other reports that are inconsistent with, and reach different conclusions from, the opinions presented in this report. The reports may reflect different assumptions, views, and analytical methods of
the analysts who prepared them. Mirae Asset Daewoo may make investment decisions that are inconsistent with the opinions and views expressed in this research report. Mirae Asset Daewoo, its affiliates, and their directors, officers,
employees, and agents may have long or short positions in any of the subject securities at any time and may make a purchase or sale, or offer to make a purchase or sale, of any such securities or other financial instruments from time
to time in the open market or otherwise, in each case either as principals or agents. Mirae Asset Daewoo and its affiliates may have had, or may be expecting to enter into, business relationships with the subject companies to provide
investment banking, market-making, or other financial services as are permitted under applicable laws and regulations.
No part of this document may be copied or reproduced in any manner or form or redistributed or published, in whole or in part, without the prior written consent of Mirae Asset Daewoo. For further information regarding company-
specific information as it pertains to the representations and disclosures in this Appendix 1, please contact [email protected] or +1 (212) 407-1000.
Distribution
United Kingdom: This report is being distributed by Mirae Asset Securities (UK) Ltd. in the United Kingdom only to (i) investment professionals falling within Article 19(5) of the Financial Services and Markets Act 2000 (Financial
Promotion) Order 2005 (the “Order”), and (ii) high net worth companies and other persons to whom it may lawfully be communicated, falling within Article 49(2)(A) to (E) of the Order (all such persons together being referred to as
“Relevant Persons”). This report is directed only at Relevant Persons. Any person who is not a Relevant Person should not act or rely on this report or any of its contents.
United States: Mirae Asset Daewoo is not a registered broker-dealer in the United States and, therefore, is not subject to U.S. rules regarding the preparation of research reports and the independence of research analysts. This report is
distributed in the U.S. by Mirae Asset Securities (USA) Inc., a member of FINRA/SIPC, to “major U.S. institutional investors” in reliance on the exemption from registration provided by Rule 15a-6(b)(4) under the U.S. Securities Exchange Act
of 1934, as amended. All U.S. persons that receive this document by their acceptance hereof represent and warrant that they are a major U.S. institutional investor and have not received this report under any express or implied
understanding that they will direct commission income to Mirae Asset Daewoo or its affiliates. Any U.S. recipient of this document wishing to effect a transaction in any securities discussed herein should contact and place orders with
Mirae Asset Securities (USA) Inc. Mirae Asset Securities (USA) Inc. accepts responsibility for the contents of this report in the U.S., subject to the terms hereof, to the extent that it is delivered to a U.S. person other than a major U.S.
institutional investor. Under no circumstances should any recipient of this research report effect any transaction to buy or sell securities or related financial instruments through Mirae Asset Daewoo. The securities described in this
report may not have been registered under the U.S. Securities Act of 1933, as amended, and, in such case, may not be offered or sold in the U.S. or to U.S. persons absent registration or an applicable exemption from the registration
requirements.
Hong Kong: This report is distributed in Hong Kong by Mirae Asset Securities (HK) Limited, which is regulated by the Hong Kong Securities and Futures Commission. The contents of this report have not been reviewed by any regulatory
authority in Hong Kong. This report is for distribution only to professional investors within the meaning of Part I of Schedule 1 to the Securities and Futures Ordinance of Hong Kong (Cap. 571, Laws of Hong Kong) and any rules made
thereunder and may not be redistributed in whole or in part in Hong Kong to any person.
All other jurisdictions: Customers in all other countries who wish to effect a transaction in any securities referenced in this report should contact Mirae Asset Daewoo or its affiliates only if distribution to or use by such customer of this
report would not violate applicable laws and regulations and not subject Mirae Asset Daewoo and its affiliates to any registration or licensing requirement within such jurisdiction.

Mirae Asset Daewoo Research37 | Monthly InsighT
Mirae Asset Daewoo International Network
Mirae Asset Daewoo Co., Ltd. (Seoul) Mirae Asset Securities (HK) Ltd. Mirae Asset Securities (UK) Ltd.
One-Asia Equity Sales Team
Mirae Asset Center 1 Building
26 Eulji-ro 5-gil, Jung-gu, Seoul 04539
Korea
Units 8501, 8507-8508, 85/F
International Commerce Centre
1 Austin Road West
Kowloon
Hong Kong
41st Floor, Tower 42
25 Old Broad Street,
London EC2N 1HQ
United Kingdom
Tel: 82-2-3774-2124 Tel: 852-2845-6332 Tel: 44-20-7982-8000
Mirae Asset Securities (USA) Inc. Mirae Asset Wealth Management (USA) Inc. Mirae Asset Wealth Management (Brazil) CCTVM
810 Seventh Avenue, 37th Floor
New York, NY 10019
USA
555 S. Flower Street, Suite 4410,
Los Angeles, California 90071
USA
Rua Funchal, 418, 18th Floor, E-Tower Building
Vila Olimpia
Sao Paulo - SP
04551-060
Brazil
Tel: 1-212-407-1000 Tel: 1-213-262-3807 Tel: 55-11-2789-2100
PT. Mirae Asset Sekuritas Indonesia Mirae Asset Securities (Singapore) Pte. Ltd. Mirae Asset Securities (Vietnam) LLC
Equity Tower Building Lt. 50
Sudirman Central Business District
Jl. Jend. Sudirman, Kav. 52-53
Jakarta Selatan 12190
Indonesia
6 Battery Road, #11-01
Singapore 049909
Republic of Singapore
7F, Saigon Royal Building
91 Pasteur St.
District 1, Ben Nghe Ward, Ho Chi Minh City
Vietnam
Tel: 62-21-515-3281 Tel: 65-6671-9845 Tel: 84-8-3911-0633 (ext.110)
Mirae Asset Securities Mongolia UTsK LLC Mirae Asset Investment Advisory (Beijing) Co., Ltd Beijing Representative Office
#406, Blue Sky Tower, Peace Avenue 17
1 Khoroo, Sukhbaatar District
Ulaanbaatar 14240
Mongolia
2401B, 24th Floor, East Tower, Twin Towers
B12 Jianguomenwai Avenue, Chaoyang District Beijing 100022
China
2401A, 24th Floor, East Tower, Twin Towers
B12 Jianguomenwai Avenue, Chaoyang District Beijing 100022
China
Tel: 976-7011-0806 Tel: 86-10-6567-9699 Tel: 86-10-6567-9699 (ext. 3300)
Shanghai Representative Office Ho Chi Minh Representative Office
38T31, 38F, Shanghai World Financial Center
100 Century Avenue, Pudong New Area
Shanghai 200120
China
7F, Saigon Royal Building
91 Pasteur St.
District 1, Ben Nghe Ward, Ho Chi Minh City
Vietnam
Tel: 86-21-5013-6392 Tel: 84-8-3910-7715