Bridging the gap between social and market rented housing in ...
Upload
khangminh22Category
view
0download
0
H O U S I N G M A R K E T I N F O R M A T I O N
HOUSING MARKET INSIGHT
Date Released:
C A N A D A M O R T G A G E A N D H O U S I N G C O R P O R A T I O N
SUBSCRIBE NOW!Get email notifications when CMHC publications are released or updated. Sign up for a free myCMHC account for enhanced site access, including one-click subscriptions to the reports and tables that matter to you.
Get your myCMHC account today!
Kitchener-Cambridge-Waterloo CMA
August 2019
A Tale of Three Cities: Short-Term Sales and Investment Activity in the Waterloo Region Between 2015 and spring 2017, MLS®1 prices in Kitchener-Cambridge-Waterloo Census Metropolitan Area (KCW CMA) grew at an unprecedented pace. For instance, across all dwelling types, the seasonally-adjusted average sale price in 2017 Q1 was 26% higher than the average sale price in 2016 Q1. Given that prices were growing at such a rapid pace, KCW CMA became an attractive region to purchase properties if one was interested in making a short-term profit. Although other regions, such as the Greater Toronto Area, also experienced double-digit price growth,2 the price points offered in the KCW market were relatively more attainable,3 even when taking into account its accelerating prices. This study seeks to better understand short-term sales and long-term investment activity in the three cities of Kitchener, Cambridge, and Waterloo during the period between 2015 Q1 and 2018 Q2.
• Approximately 9.0% of all MLS® transactions and new builds4 which became available between 2015 Q1 and 2018 Q2 were involved in short-term sales. Investment activity followed the growth of MLS® prices closely, gaining momentum during the period of price acceleration, which became particularly prominent during the spring of 2017.
• 1 in 5 addresses identified as a short-term sale or long-term investment were purchased by a non-local buyer.
• The number of short-term sales near LRT stations increased when average prices grew, and declined when average prices fell. This movement suggests that proximity to transit may have contributed to investment decisions.
“Escalating prices leading up to the spring of 2017 led to increased investment activity and short-term sales in the three cities of the Waterloo Region.”
Jennifer Y. Tsao Senior Analyst, Economics

Housing Market Insight - Kitchener-Cambridge-Waterloo CMA - Date Released - August 2019
2
Short-Term Sale vs. Long-Term InvestmentUsing the benchmark of 24 months, this study identified that 9.0% of all homes which became available
between January 1st, 2015 and June 30th, 2018 were acquired for the purpose of short-term gains or long-term investment.5 All addresses identified as such were located in
the cities of Kitchener, Cambridge, and Waterloo. From Table I, we see that just over 70% of these identified addresses were involved in a short-term sale.
Table I: Categorization of Short-Term Sales vs. Investments, 2015 - 2018Q2
Where the Property was Bought Data Source
What did the Buyer do with the Property
after Purchase?Category
% of Addresses Identified Acquired
2015-2018 Q2
% of Total Transactions6
2015-2019 M2
Resale Market MLS® Sold within 24 Months Short-Term Sale 50.5% 6.4%
Pre-Construction Market Permit Data, MLS®Sold within 24 Months
of the Permitted Occupancy Date
Short-Term Sale 20.6% 2.6%
Resale Market MLS® Leased Out within 24 Months7
Long-Term Investment 17.0% 2.5%
Pre-Construction Market Permit Data, MLS®Leased Out within
24 Months of the Permitted Occupancy Date
Long-Term Investment 11.8% 1.5%
Sources: MLS® System of the Kitchener-Waterloo Association of REALTORS®, permit data from the City of Kitchener, City of Cambridge, City of Waterloo, author’s calculations
Investment Activity Picked Up Pace when Prices AcceleratedFor both short-term sales and long-term investments, activity in 20128 was markedly less compared to what was experienced during 2015 and onwards. From 2015 Q1 to 2017 Q1, the amount of investment properties acquired moved in tandem with average MLS® prices (Figure I). Perhaps unsurprisingly, investment activity became more pronounced as the pace of average price growth
increased, which makes intuitive sense since there is larger potential gains to be realized in a market where prices are growing rapidly.
It is important to note that since we are counting investments using a 24-month window with up to February 28th, 2019, we were only able to fully account for short-term sales and long-term investments up to February 28th, 2017. In other words, for quarters from 2017 Q1 onwards, there are likely additional investment addresses to be counted (denoted by dashed bars in Figure I).
However, in order to illustrate that the number of short-term sales activity did fall around the same time as when average MLS® prices fell in 2017 Q2 to Q3, we examined the subset of short-term sales bought and sold within twelve months, which is fully counted for up to 2017 Q4. If we only consider this subset, we see that indeed, the number of short-term sales bought and sold within 12 months exhibited a similar pattern to average prices, peaking in 2017 Q2 and declining in 2017 Q3.
Housing Market Insight - Kitchener-Cambridge-Waterloo CMA - Date Released - August 2019
3
Table II: Proportion of All Transactions Involving Short-Term Sales and Investment Activity, by City
Kitchener Cambridge Waterloo
Transactions Involving Short-
Term Sale
Transactions Involving
Long-Term Investment
Transactions Involving Short-
Term Sale
Transactions Involving
Long-Term Investment
Transactions Involving Short-
Term Sale
Transactions Involving
Long-Term Investment
2012 12% 1% 12% 3% 8% 2%
2015 14% 3% 16% 2% 10% 2%
2016 14% 4% 13% 4% 11% 2%
2017 15% 11% 9% 6% 6% 5%
2018 Q1 - Q2 3% 5% 2% 4% 2% 2%
2015 - 2018 Q2 Total 13% 6% 11% 4% 8% 3%
Sources: MLS® System of the Kitchener-Waterloo Association of REALTORS®, permit data from the City of Kitchener, City of Cambridge, City of Waterloo, author’s calculations
Over Half of All Short-Term Sales and Investment-Related Transactions Occurred in KitchenerKitchener saw more short-term sales and investment activity than Cambridge or Waterloo. Although this is partly because Kitchener has
the largest population out of the three cities, population size alone does not entirely explain the findings. Between 2015 and 2018 Q2, 45% of all transactions (MLS® and new homes across the three cities) occurred in Kitchener (Appendix Figures A1 to A3); however, Kitchener was the site of 53% of all short-term sales. Comparing similar metrics, it is apparent that Waterloo saw
disproportionately less investment activity than what its overall transactional activity would suggest.
Interestingly, the proportion of short-term sales and investments occurring in Kitchener has grown over time. Table II shows the percentage of transactions in Kitchener involving an investment grew from 3% in 2015 to 11% in 2017.
$0
$100,000
$200,000
$300,000
$400,000
$500,000
0
50
100
150
200
250
300
Q1 Q2 Q3 Q4 Q1 Q2 Q3 Q4 Q1 Q2 Q3 Q4 Q1 Q2 Q3 Q4 Q1 Q2
2012 2015 2016 2017 2018
Ave
rage
MLS
® P
rice
, Sea
sona
lly A
djus
ted
Num
ber
of U
nits
Short-Term Sale (Sold within 24 Months) Short-Term Sale (Sold within 12 Months)
Long-Term Investment KCW CMA Avg MLS® Price, Seasonally Adjusted
Dashed bars indicate quarters where additional numbers of short-term sales or long-term Investments could potentially increase since we are still within a 24-month window. For more information, please see Appendix Section 24-Month Window.Sources: CREA (seasonally adjusted by CMHC) MLS® System of the Kitchener-Waterloo Association of REALTORS®, Permit data from the City of Kitchener, City of Cambridge, City of Waterloo
Figure 1
Volume of Short-Term Sales and Investments vs. Average MLS® Price in Kitchener-Cambridge-Waterloo CMA, by Quarter

Housing Market Insight - Kitchener-Cambridge-Waterloo CMA - Date Released - August 2019
4
Short-Term Sales and Long-Term Investment Activity near LRT Stations Grew as Average Sales Price IncreasedWhile the annual proportion of transactions (MLS® and new homes) occurring within a 1.0km radius of the LRT stations has stayed roughly the same over time, the proportion of properties acquired for either a short-term sale or long-term investment has changed. In 2012, 7.8% of all short-term sales and long-term investments acquired were addresses within a 1.0 km radius of stations. As per Table III, this figure grew from 9.3% in 2015 to 14.4% in 2017, before falling in the first two quarters of 2018, mimicking the movement of average MLS® prices (Figure I). This movement can be largely attributed to short-term sales activity.
1 in 5 Address Identified as a Short-Term Sale or Long-Term Investment was Purchased by a Non-Local Buyer For 94% of the short-term sales or long-term investments occurring between 2015 and 2018 Q2, we were able to proxy for the buyer’s city of origin by using their agent’s home office as a proxy.9 Local addresses are those located within Kitchener, Cambridge, or Waterloo. From Figure II below, we see that the share of non-local buyers in the three cities gradually increased, peaking in 2017 Q2. This trend moves in tandem with the average prices in KCW CMA.
Table IV: Percentage of Local vs. Non-Local Purchasers
Local Non-Local Unknown
2012 78% 7% 15%
2015 - 2018 Q2 Average 77% 19% 4%
Sources: MLS® System of the Kitchener-Waterloo Association of REALTORS®, Realtor.ca, author’s calculations
$0
$100,000
$200,000
$300,000
$400,000
$500,000
0%
20%
40%
60%
80%
100%
Q1 Q2 Q3 Q4 Q1 Q2 Q3 Q4 Q1 Q2 Q3 Q4 Q1 Q2
2015 2016 2017 2018
Ave
rage
MLS
® P
rice
, Sea
sona
lly A
djus
ted
($)
Prop
ortio
n of
Tot
al P
urch
aser
s (%
)
Unknown
Non-Local
Local
KCW CMA Avg MLS® Price, Seasonally Adjusted
Sources: MLS® System of the Kitchener-Waterloo Association of REALTORS®, CREA (seasonally adjusted by CMHC), author’s calculations
Figure II
Share of Local vs. Non-Local Addresses Acquired as Short-Term Sale or Long-Term Investment
Table III: Share of Short-Term Sales and Long-Term Investments Identified Near LRT Stations Increased
Year when Property was Acquired
% of Total Transactions within 1.0 km of
a LRT Station
% of ST Sales and LT Investments within 1.0 km
of a LRT Station
2012 10.9% 7.8%
2015 10.5% 9.3%
2016 12.2% 13.1%
2017 12.3% 14.4%
2018Q1-Q2 12.4% 8.7%
2015 - 2018 Q2 Average 11.7% 12.3%
Sources: MLS® System of the Kitchener-Waterloo Association of REALTORS®, Grand River Transit (www.grt.ca) , author’s calculations
Housing Market Insight - Kitchener-Cambridge-Waterloo CMA - Date Released - August 2019
5
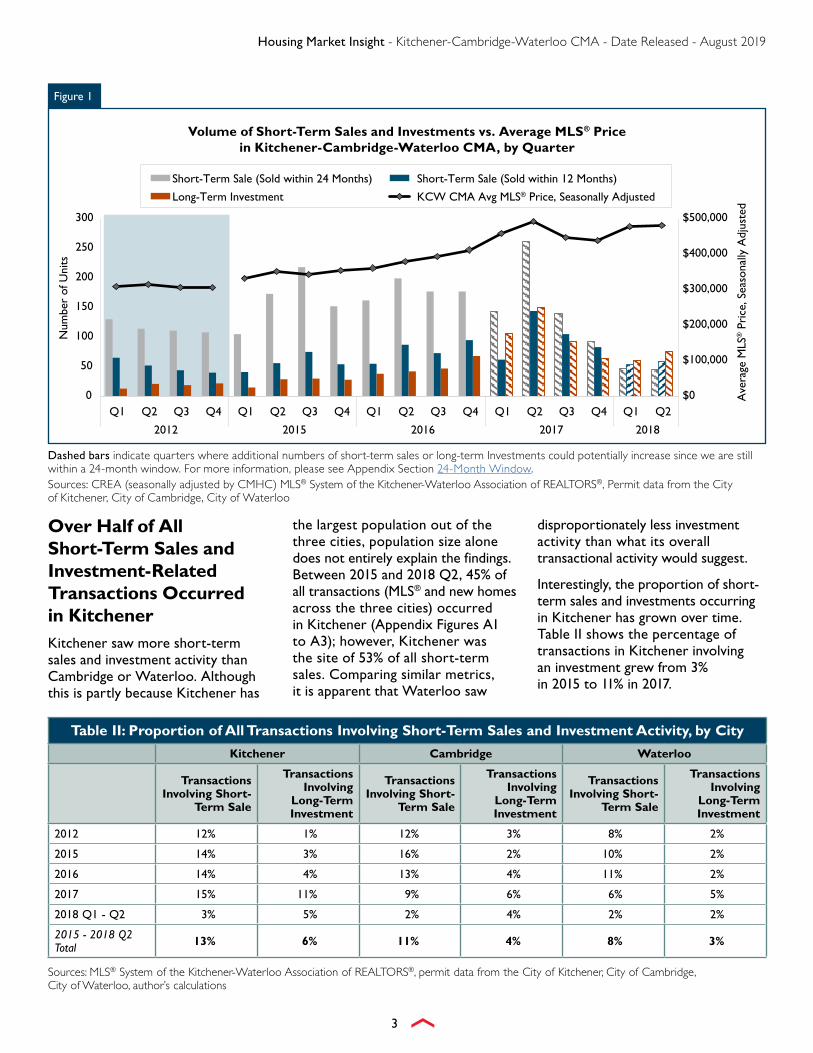
A non-local buyer made one of every five short-term sales or long-term investments during that time. We estimate that 72% of those non-local buyers originated from the Greater Toronto Area. Not surprisingly, the second and third-highest source of non-local buyers came from Guelph and Hamilton. A previous study10 from CMHC found that the growth relationship of house prices in Hamilton and Guelph was tightly linked to that of the GTA. Prices may have escalated in many regions in the Greater Golden Horseshoe in between 2015 and 2017 Q1, but the relative affordability11 of the Waterloo Region encouraged not only homebuyers, but also those looking to acquire an investment property or enter into a short-term sale at a lower price point, to come into the Region.
87% of short-term sales or long- term investments identified listed the size of the property. Using this data, we were able to calculate the average sold price per square foot. From Table VI, we found evidence that non-local buyers displayed a growing propensity towards more expensive properties. Between 2015 and 2018 Q2, the average unit acquired for a short-term sale or long-term investment by a non-local buyer was around $272 per square foot, which was 5.5% more expensive than the units acquired by a local buyer.12
Table VI: Average Sold Price per Square Foot ($) between Local vs. Non-Local Buyers
Local Non-Local
2015 $218.75 $212.80
2016 $244.22 $244.19
2017 $295.06 $299.10
2018 Q1-Q2 $315.59 $318.31
2015 - 2018 Q2 Average $257.46 $271.54
Sources: MLS® System of the Kitchener-Waterloo Association of REALTORS®, author’s calculationsNote: 2012 was excluded due to the small sample size of non-local buyers.
Table V: Places of Origination of Non-Local Buyers, 2015 - 2018 Q2
% of Non-Local Buyers
Greater Toronto Area 72%
Guelph & Wellington County 14%
Hamilton 5%
Other 10%
Sources: MLS® System of the Kitchener-Waterloo Association of REALTORS®, author’s calculations
Housing Market Insight - Kitchener-Cambridge-Waterloo CMA - Date Released - August 2019
6
Sources: MLS® System of the Kitchener-Waterloo Association of REALTORS®, Permit data from the City of Kitchener, City of Cambridge, City of Waterloo, author’s calculations
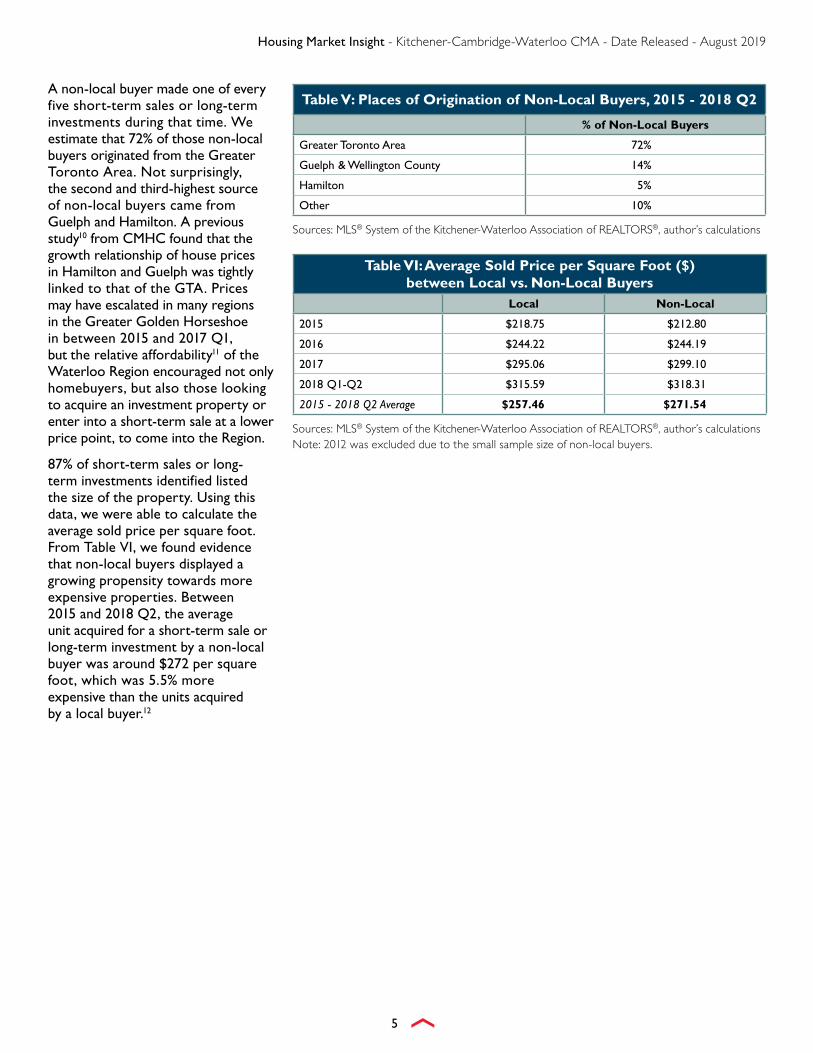
Concluding RemarksUsing our definition of what constitutes an investment, the results of this paper show that approximately 9.0% of MLS® transactions and new builds which became available between 2015 Q1 and 2018 Q2 were involved in a short-term sale or long-term investment. Seeking to better understand the trend over time, it was found that short-term sales and long-term investment activity followed the growth of MLS® prices, gaining momentum during the period of price acceleration, and becoming particularly prominent during the spring of 2017. The fact that investment activity picked up pace during this time makes sense since there is larger potential gains to be realized in a market where prices are growing rapidly.
We also examined the question of whether KCW CMA became more attractive to non-local buyers during our period of study. In this matter, we found that the share of non-local buyers moved and peaked along with average MLS® prices. Lastly, regarding the new LRT transit system, we found that as average MLS® prices grew, the proportion of short-term sales and long-term investment activity near LRT stations increased. This result suggests that proximity to transit may have contributed to investors’ decisions on where to purchase.
Appendix
55.6%
32.3%
50.1%
60.3%58.5%
46.9%
0%
20%
40%
60%
2012 2015 2016 2017 2018 Q1 & Q2
Short-Term Sale Long-Term Investment
% of Transactions Across the Three Cities
Figure A1
Kitchener
Proportion of Short-Term Sales and Long-Term Investments vs. MLS® and New Build Transactions across the Three Cities
27.5%
44.9%
26.6%23.5%
26.4%25.9%
0%
20%
40%
60%
2012 2015 2016 2017 2018 Q1 & Q2
Short-Term Sale Long-Term Investment
% of Transactions Across the Three Cities
Figure A2
Cambridge
17.0%
22.8%23.3%
16.2%15.1%
27.2%
0%
20%
40%
60%
2012 2015 2016 2017 2018 Q1 & Q2
Short-Term Sale Long-Term Investment
% of Transactions Across the Three Cities
Figure A3
Waterloo
Housing Market Insight - Kitchener-Cambridge-Waterloo CMA - Date Released - August 2019
7
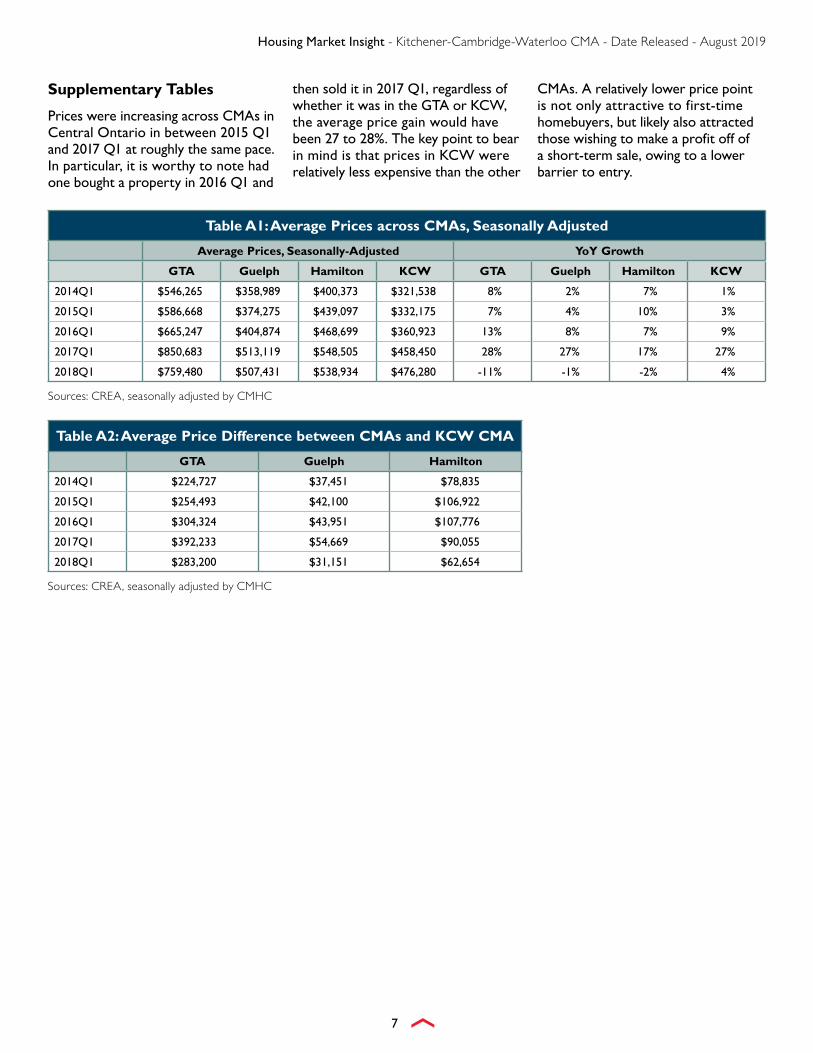
Table A1: Average Prices across CMAs, Seasonally Adjusted
Average Prices, Seasonally-Adjusted YoY Growth
GTA Guelph Hamilton KCW GTA Guelph Hamilton KCW
2014Q1 $546,265 $358,989 $400,373 $321,538 8% 2% 7% 1%
2015Q1 $586,668 $374,275 $439,097 $332,175 7% 4% 10% 3%
2016Q1 $665,247 $404,874 $468,699 $360,923 13% 8% 7% 9%
2017Q1 $850,683 $513,119 $548,505 $458,450 28% 27% 17% 27%
2018Q1 $759,480 $507,431 $538,934 $476,280 -11% -1% -2% 4%
Sources: CREA, seasonally adjusted by CMHC
Table A2: Average Price Difference between CMAs and KCW CMA
GTA Guelph Hamilton
2014Q1 $224,727 $37,451 $78,835
2015Q1 $254,493 $42,100 $106,922
2016Q1 $304,324 $43,951 $107,776
2017Q1 $392,233 $54,669 $90,055
2018Q1 $283,200 $31,151 $62,654
Sources: CREA, seasonally adjusted by CMHC
Supplementary Tables
Prices were increasing across CMAs in Central Ontario in between 2015 Q1 and 2017 Q1 at roughly the same pace. In particular, it is worthy to note had one bought a property in 2016 Q1 and
then sold it in 2017 Q1, regardless of whether it was in the GTA or KCW, the average price gain would have been 27 to 28%. The key point to bear in mind is that prices in KCW were relatively less expensive than the other
CMAs. A relatively lower price point is not only attractive to first-time homebuyers, but likely also attracted those wishing to make a profit off of a short-term sale, owing to a lower barrier to entry.
Housing Market Insight - Kitchener-Cambridge-Waterloo CMA - Date Released - August 2019
8
Methodology
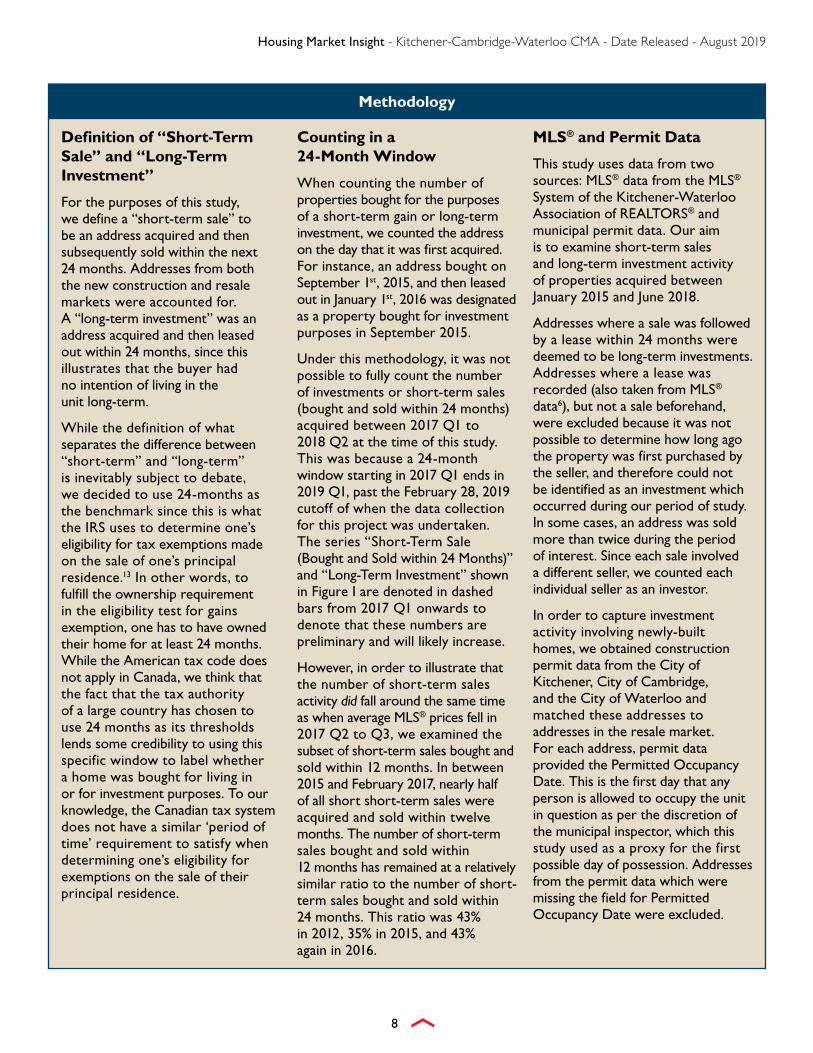
Definition of “Short-Term Sale” and “Long-Term Investment”
For the purposes of this study, we define a “short-term sale” to be an address acquired and then subsequently sold within the next 24 months. Addresses from both the new construction and resale markets were accounted for. A “long-term investment” was an address acquired and then leased out within 24 months, since this illustrates that the buyer had no intention of living in the unit long-term.
While the definition of what separates the difference between “short-term” and “long-term” is inevitably subject to debate, we decided to use 24-months as the benchmark since this is what the IRS uses to determine one’s eligibility for tax exemptions made on the sale of one’s principal residence.13 In other words, to fulfill the ownership requirement in the eligibility test for gains exemption, one has to have owned their home for at least 24 months. While the American tax code does not apply in Canada, we think that the fact that the tax authority of a large country has chosen to use 24 months as its thresholds lends some credibility to using this specific window to label whether a home was bought for living in or for investment purposes. To our knowledge, the Canadian tax system does not have a similar ‘period of time’ requirement to satisfy when determining one’s eligibility for exemptions on the sale of their principal residence.
Counting in a 24-Month Window
When counting the number of properties bought for the purposes of a short-term gain or long-term investment, we counted the address on the day that it was first acquired. For instance, an address bought on September 1st, 2015, and then leased out in January 1st, 2016 was designated as a property bought for investment purposes in September 2015.
Under this methodology, it was not possible to fully count the number of investments or short-term sales (bought and sold within 24 months) acquired between 2017 Q1 to 2018 Q2 at the time of this study. This was because a 24-month window starting in 2017 Q1 ends in 2019 Q1, past the February 28, 2019 cutoff of when the data collection for this project was undertaken. The series “Short-Term Sale (Bought and Sold within 24 Months)” and “Long-Term Investment” shown in Figure I are denoted in dashed bars from 2017 Q1 onwards to denote that these numbers are preliminary and will likely increase.
However, in order to illustrate that the number of short-term sales activity did fall around the same time as when average MLS® prices fell in 2017 Q2 to Q3, we examined the subset of short-term sales bought and sold within 12 months. In between 2015 and February 2017, nearly half of all short short-term sales were acquired and sold within twelve months. The number of short-term sales bought and sold within 12 months has remained at a relatively similar ratio to the number of short-term sales bought and sold within 24 months. This ratio was 43% in 2012, 35% in 2015, and 43% again in 2016.
MLS® and Permit Data
This study uses data from two sources: MLS® data from the MLS® System of the Kitchener-Waterloo Association of REALTORS® and municipal permit data. Our aim is to examine short-term sales and long-term investment activity of properties acquired between January 2015 and June 2018.
Addresses where a sale was followed by a lease within 24 months were deemed to be long-term investments. Addresses where a lease was recorded (also taken from MLS® data6), but not a sale beforehand, were excluded because it was not possible to determine how long ago the property was first purchased by the seller, and therefore could not be identified as an investment which occurred during our period of study. In some cases, an address was sold more than twice during the period of interest. Since each sale involved a different seller, we counted each individual seller as an investor.
In order to capture investment activity involving newly-built homes, we obtained construction permit data from the City of Kitchener, City of Cambridge, and the City of Waterloo and matched these addresses to addresses in the resale market. For each address, permit data provided the Permitted Occupancy Date. This is the first day that any person is allowed to occupy the unit in question as per the discretion of the municipal inspector, which this study used as a proxy for the first possible day of possession. Addresses from the permit data which were missing the field for Permitted Occupancy Date were excluded.

Housing Market Insight - Kitchener-Cambridge-Waterloo CMA - Date Released - August 2019
9
Holding Periods Lengths
By subtracting the date at which an address was first bought from the date at which it was later sold, it was possible to determine the holding period of the short-term sale. For example, if 5668 Example Ave. was recorded to have been sold on October 1st, 2015, and then sold again on September 30th, 2016, we calculate the period in between those dates. Similarly, the same logic was applied to determine the length of time a buyer held onto a property before demonstrating intention of leasing it out.
Identifying Non-Local Investors
MLS® transactions list both the listing brokerage and the cooperating brokerage. The listing brokerage and agent associated represent the seller, while the cooperating brokerage represents the office of the buyer’s agent. Using the address of the cooperating brokerage, we were able to proxy for where the buyer is from.
The name of the cooperating broker was occasionally missing from the MLS® transaction data. In cases where the name did not appear in the database on realtor.ca, the agent’s office was entered into the realtor.ca search engine instead. In instances where a brokerage had more than one office, the brokerage and agent’s full name was searched online to determine which branch of the brokerage the agent was based in. Oftentimes, the agent’s office location was found easily by searching for the agent in the franchise’s database.
Table A3: Transactional Data for 5668 Example Ave.
Sale Date Seller/Lessor Sale Price Rent ($) Listing
DateDays until Seller or Investor
Listed the Property Description
October 1st, 2015 Jackie $340,000 September
15th, 2015 September 20th, 2016 minus October 1st, 2015 equals
355 days
Jordan bought and sold the unit within
355 days. He made a short-term profit.
September 30th, 2016 Jordan $405,000 September
20th, 2016
Chris $1,800 / month
November 1st, 2016
November 1st, 2016 minus September 30th, 2016
equals 32 days
Chris bought the leased out the unit within
32 days. He is a long-term investor.
AcknowledgementsThe author would like to thank the Kitchener Waterloo Association of Realtors (KWAR) for providing access to MLS® data in the MLS® System of the Kitchener-Waterloo Association of REALTORS®, as well as the City of Kitchener, City of Cambridge,
and City of Waterloo for providing permit data. The author would also like to thank Amy Barker from the CMHC GIS team for providing distance-related analysis, as well as all reviewers for their insights and suggestions. Responsibility for any calculation errors remain my own.
Housing Market Insight - Kitchener-Cambridge-Waterloo CMA - Date Released - August 2019
10
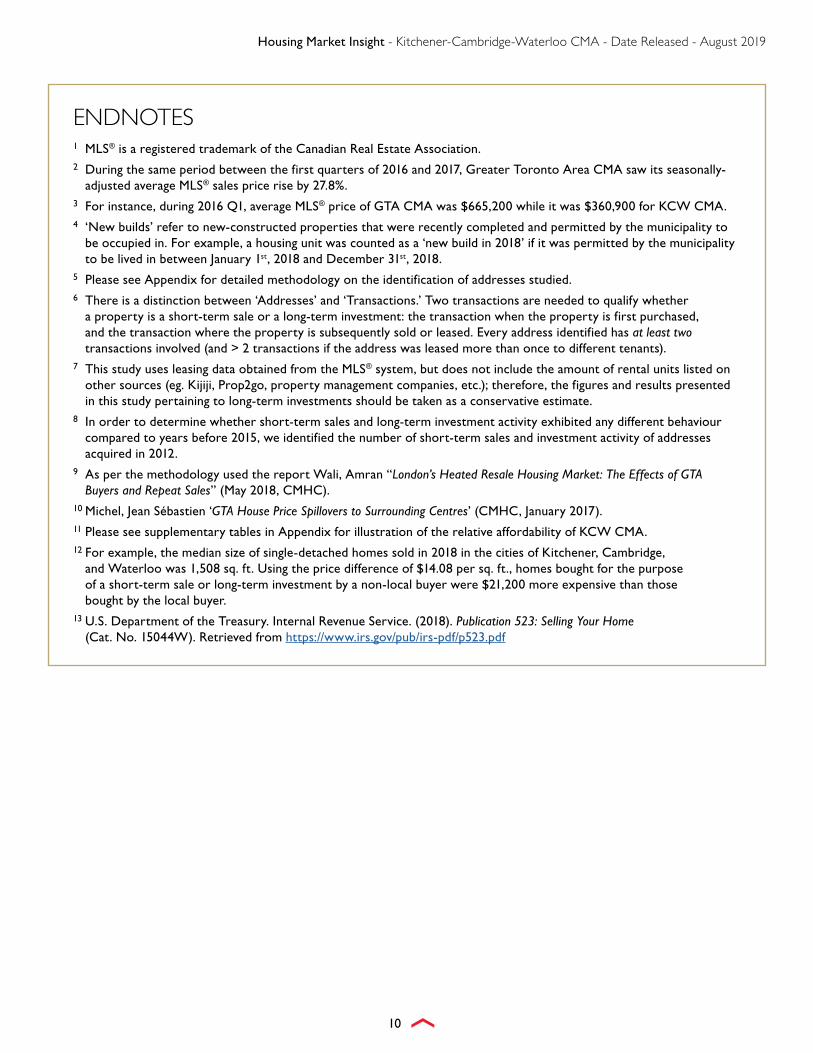
ENDNOTES1 MLS® is a registered trademark of the Canadian Real Estate Association.2 During the same period between the first quarters of 2016 and 2017, Greater Toronto Area CMA saw its seasonally-
adjusted average MLS® sales price rise by 27.8%. 3 For instance, during 2016 Q1, average MLS® price of GTA CMA was $665,200 while it was $360,900 for KCW CMA.4 ‘New builds’ refer to new-constructed properties that were recently completed and permitted by the municipality to
be occupied in. For example, a housing unit was counted as a ‘new build in 2018’ if it was permitted by the municipality to be lived in between January 1st, 2018 and December 31st, 2018.
5 Please see Appendix for detailed methodology on the identification of addresses studied.6 There is a distinction between ‘Addresses’ and ‘Transactions.’ Two transactions are needed to qualify whether
a property is a short-term sale or a long-term investment: the transaction when the property is first purchased, and the transaction where the property is subsequently sold or leased. Every address identified has at least two transactions involved (and > 2 transactions if the address was leased more than once to different tenants).
7 This study uses leasing data obtained from the MLS® system, but does not include the amount of rental units listed on other sources (eg. Kijiji, Prop2go, property management companies, etc.); therefore, the figures and results presented in this study pertaining to long-term investments should be taken as a conservative estimate.
8 In order to determine whether short-term sales and long-term investment activity exhibited any different behaviour compared to years before 2015, we identified the number of short-term sales and investment activity of addresses acquired in 2012.
9 As per the methodology used the report Wali, Amran “London’s Heated Resale Housing Market: The Effects of GTA Buyers and Repeat Sales” (May 2018, CMHC).
10 Michel, Jean Sébastien ‘GTA House Price Spillovers to Surrounding Centres’ (CMHC, January 2017).11 Please see supplementary tables in Appendix for illustration of the relative affordability of KCW CMA.12 For example, the median size of single-detached homes sold in 2018 in the cities of Kitchener, Cambridge,
and Waterloo was 1,508 sq. ft. Using the price difference of $14.08 per sq. ft., homes bought for the purpose of a short-term sale or long-term investment by a non-local buyer were $21,200 more expensive than those bought by the local buyer.
13 U.S. Department of the Treasury. Internal Revenue Service. (2018). Publication 523: Selling Your Home (Cat. No. 15044W). Retrieved from https://www.irs.gov/pub/irs-pdf/p523.pdf

Housing Market Insight - Kitchener-Cambridge-Waterloo CMA - Date Released - August 2019
11
CMHC HELPS CANADIANS MEET THEIR HOUSING NEEDS
Canada Mortgage and Housing Corporation (CMHC) has been helping Canadians meet their housing needs for more than 70 years. As Canada’s authority on housing, we contribute to the stability of the housing market and financial system, provide support for Canadians in housing need, and offer unbiased housing research and advice to Canadian governments, consumers and the housing industry. Prudent risk management, strong corporate governance and transparency are cornerstones of our operations.
For more information, visit our website at www.cmhc.ca or follow us on Twitter, LinkedIn, Facebook, Instagram and YouTube.
You can also reach us by phone at 1-800-668-2642 or by fax at 1-800-245-9274. Outside Canada call 613-748-2003 or fax to 613-748-2016.
Canada Mortgage and Housing Corporation supports the Government of Canada policy on access to information for people with disabilities. If you wish to obtain this publication in alternative formats, call 1-800-668-2642.
©2019 Canada Mortgage and Housing Corporation. All rights reserved. CMHC grants reasonable rights of use of this publication’s content solely for personal, corporate or public policy research, and educational purposes. This permission consists of the right to use the content for general reference purposes in written analyses and in the reporting of results, conclusions, and forecasts including the citation of limited amounts of supporting data extracted from this publication. Reasonable and limited rights of use are also permitted in commercial publications subject to the above criteria, and CMHC’s right to request that such use be discontinued for any reason.
Any use of the publication’s content must include the source of the information, including statistical data, acknowledged as follows:
Source: CMHC (or “Adapted from CMHC,” if appropriate), name of product, year and date of publication issue.
Other than as outlined above, the content of the publication cannot be reproduced or transmitted to any person or, if acquired by an organization, to users outside the organization. Placing the publication, in whole or part, on a website accessible to the public or on any website accessible to persons not directly employed by the organization is not permitted. To use the content of this CMHC publication for any purpose other than the general reference purposes set out above or to request permission to reproduce large portions of, or the entire content of, this CMHC publication, please send a Copyright request to the Housing Knowledge Centre at [email protected]. Please provide the following information: Publication’s name, year and date of issue.
Without limiting the generality of the foregoing, no portion of the content may be translated from English or French into any other language without the prior written permission of Canada Mortgage and Housing Corporation.
The information, analyses and opinions contained in this publication are based on various sources believed to be reliable, but their accuracy cannot be guaranteed. The information, analyses and opinions shall not be taken as representations for which Canada Mortgage and Housing Corporation or any of its employees shall incur responsibility.

■■ Housing Information Monthly■■ Housing Market Assessment■■ Housing Market Insight■■ Housing Now Tables■■ Housing Market Outlook, Canada■■ Housing Market Outlook, Highlight Reports – Northern Housing■■ Housing Market Outlook, Canada and Major Centres■■ Preliminary Housing Starts Data■■ Rental Market Reports, Canada and Provincial Highlights ■■ Rental Market Reports, Major Centres■■ Seniors’ Housing Reports■■ Mortgage and Consumer Credit Trends Report
DATA TABLES AVAILABLE ONLINE■■ Funding and Securitization Data■■ Household Characteristics■■ Housing Market Data■■ Housing Market Indicators■■ Mortgage and Debt Data■■ Rental Market Data
PUBLICATIONS AND REPORTS AVAILABLE ONLINELocal, regional and national analysis and data on current market conditions and future trends.
HOUSING MARKET INFORMATION PORTALThe housing data you want, the way you want it.
■✔ Information in one central location
■✔ Desktop and mobile friendly
■✔ Neighbourhood-level data
cmhc.ca/hmiportal
SUBSCRIBE NOWGet email notifications when CMHC publications are released or updated. Sign up for a free myCMHC account for enhanced site access, including one-click subscriptions to the reports and tables that matter to you.
Get your myCMHC account today!
Get the market intelligence you need today!Find all the latest trends, research and insights at cmhc.ca/housingmarketinformation
Housing market intelligence you can count on
Housing ObserverFeaturing quick reads and videos on...
• Analysis and data • Timely insights• Updates to housing conditions, trends and much more!
Subscribe today to stay in the know!
www.cmhc.ca/observer
Copyright © 2022 FDOKUMEN