From enterprise models to scheduling models: bridging the gap
Upload
khangminh22Category
view
1download
0
H o u s i n g a n d u r b a n P o l i c y s t u d i e s 33
Bridging the gap between social and market rented housing in six European countries?
Marietta HaffnerJoris HoekstraMichael OxleyHarry van der Heijden
Bridging the gap between social and market rented housing in six European countries?

Housing and Urban Policy Studies 33
Editorial CommitteeProf. M. Batty (University College London)Prof. J.B.S. Conijn (Universiteit van Amsterdam)Prof. J.F. Doling (University of Birmingham)Prof. P. Glasbergen (Utrecht University)Prof. P. Hooimeijer (Utrecht University)Prof. G.J. Maas (Technische Universiteit Eindhoven)Prof. N.J.M. Nelissen (Radboud University Nijmegen)Prof. P. Nijkamp (Vrije Universiteit)Prof. H.F.L.K. Ottens (Utrecht University)Prof. J. van der Schaar (Universiteit van Amsterdam)Prof. I. Turok (Glasgow University)Prof. J. van Weesep (Utrecht University)
Guest editorsProf. H. Lind (Royal Institute of Technology, Stockholm)Prof. D. Mullins (University of Birmingham)

Marietta Haffner
Joris Hoekstra
Michael Oxley
Harry van der Heijden
Bridging the gap between social and market rented housing in six European countries?
IOS Press

The series Housing and Urban Policy Studiesis published by IOS Press under the imprint Delft University Press
PublisherIOS Press BVNieuwe Hemweg 6b1013 BG AmsterdamThe NetherlandsFax +31-20-6870019E-mail: [email protected]
Housing and Urban Policy Studies are edited byOTB Research Institute for Housing, Urban and Mobility StudiesDelft University of TechnologyJaffalaan 92628 BX Delft The NetherlandsPhone +31 15 2783005Fax +31 15 2784422E-mail [email protected]://www.otb.tudelft.nl
The authors wish to acknowledge the financial assistance of the Dutch gov-ernment through the Habiforum Program Innovative Land Use and Delft Uni-versity of Technology through the Delft Centre for Sustainable Urban Areas.
Design: Cyril Strijdonk Ontwerpburo, GaanderenDTP: Yvonne Alkemade, DelftPrinted in the Netherlands by Haveka, Alblasserdam
ISSN 0926-6240; 33ISBN 978-1-60750-035-3NUGI 755
Legal noticeThe publisher is not responsible for the use which might be made of the following information.
© Copyright 2009 by Onderzoeksinstituut OTBNo part of this book may be reproduced in any form by print, photoprint, microfilm or any other means, without written permission from the copy-rightholder.

Contents
List of tables List of figures List of abbreviations
Preface . . . . . . . . . . . . . . . . . . . . . . . . . . . . . . . . . . . . . . . . . . . . . . . . . . . . . . . . . . . . . . . . . . .1
1 Introduction.. . . . . . . . . . . . . . . . . . . . . . . . . . . . . . . . . . . . . . . . . . . . . . . . . . . . . . . . . . . .3 1.1 The relationship between social and market housing . . . . . . . . . . 3 1.2 The definitions of social and market rented housing . . . . . . . . . . . 4 1.3 The choice of countries examined . . . . . . . . . . . . . . . . . . . . . . . . . . . . . . . . . . . 5 1.3.1 Demographic and economic indicators . . . . . . . . . . . . . . . . . . . . . . . . . . . . 6 1.3.2 Social and market renting in six countries . . . . . . . . . . . . . . . . . . . . . . . . 7 1.4 An outline of this book . . . . . . . . . . . . . . . . . . . . . . . . . . . . . . . . . . . . . . . . . . . . . . . . 10
2 Perspectives on the gap between social and market renting . . . . . . . . . . . . . . . . . . . . . . . . . . . . . . . . . . . . . . . . . . . . . . . . . . . . . . . . . . . . . . . . . 13
2.1 Introduction . . . . . . . . . . . . . . . . . . . . . . . . . . . . . . . . . . . . . . . . . . . . . . . . . . . . . . . . . . . . . . 13 2.2 Differences in who provides and what is provided . . . . . . . . . . . . . 13 2.3 Differences in whom the sectors are aimed at and
government policies towards the sectors . . . . . . . . . . . . . . . . . . . . . . . . . 16 2.4 Differences in the degree of competition: a theoretical
framework . . . . . . . . . . . . . . . . . . . . . . . . . . . . . . . . . . . . . . . . . . . . . . . . . . . . . . . . . . . . . . . . 21 2.5 Bridging the gap between social and market renting?.. . . . . . . . 29 2.6 Returning to the gap . . . . . . . . . . . . . . . . . . . . . . . . . . . . . . . . . . . . . . . . . . . . . . . . . . . 31
3 England .. . . . . . . . . . . . . . . . . . . . . . . . . . . . . . . . . . . . . . . . . . . . . . . . . . . . . . . . . . . . . . . 33 3.1 Introduction . . . . . . . . . . . . . . . . . . . . . . . . . . . . . . . . . . . . . . . . . . . . . . . . . . . . . . . . . . . . . . 33 3.1.1 England within the UK . . . . . . . . . . . . . . . . . . . . . . . . . . . . . . . . . . . . . . . . . . . . . . . . 33 3.1.2 Political and administrative responsibilities in England . . . . . . 33 3.2 Housing stock . . . . . . . . . . . . . . . . . . . . . . . . . . . . . . . . . . . . . . . . . . . . . . . . . . . . . . . . . . . . 35 3.2.1 Definition of the components of the rented sector . . . . . . . . . . . . . 35 3.2.2 Description of the housing stock.. . . . . . . . . . . . . . . . . . . . . . . . . . . . . . . . . . . 37 3.2.3 Housing quality . . . . . . . . . . . . . . . . . . . . . . . . . . . . . . . . . . . . . . . . . . . . . . . . . . . . . . . . . 38 3.3 Characteristics of tenants . . . . . . . . . . . . . . . . . . . . . . . . . . . . . . . . . . . . . . . . . . . . 39 3.4 Housing policy . . . . . . . . . . . . . . . . . . . . . . . . . . . . . . . . . . . . . . . . . . . . . . . . . . . . . . . . . . . 41 3.4.1 Tenure-specific policies . . . . . . . . . . . . . . . . . . . . . . . . . . . . . . . . . . . . . . . . . . . . . . . 41 3.4.2 Social renting . . . . . . . . . . . . . . . . . . . . . . . . . . . . . . . . . . . . . . . . . . . . . . . . . . . . . . . . . . . . 42 3.4.3 Market renting . . . . . . . . . . . . . . . . . . . . . . . . . . . . . . . . . . . . . . . . . . . . . . . . . . . . . . . . . . . 43 3.4.4 Policy objectives . . . . . . . . . . . . . . . . . . . . . . . . . . . . . . . . . . . . . . . . . . . . . . . . . . . . . . . . . 45 3.5 Rent control, tenant security and other property rights . . . . . . 47 3.5.1 Rent determination in the social sector . . . . . . . . . . . . . . . . . . . . . . . . . . . 47 3.5.2 Rent controls in the market sector . . . . . . . . . . . . . . . . . . . . . . . . . . . . . . . . . 48 3.5.3 Security of tenure . . . . . . . . . . . . . . . . . . . . . . . . . . . . . . . . . . . . . . . . . . . . . . . . . . . . . . . 48

3.6 Allocation procedures and criteria . . . . . . . . . . . . . . . . . . . . . . . . . . . . . . . . . 50 3.7 Regulation and supervision . . . . . . . . . . . . . . . . . . . . . . . . . . . . . . . . . . . . . . . . . . 51 3.7.1 Social-sector regulation . . . . . . . . . . . . . . . . . . . . . . . . . . . . . . . . . . . . . . . . . . . . . . . 51 3.7.2 Market sector regulation . . . . . . . . . . . . . . . . . . . . . . . . . . . . . . . . . . . . . . . . . . . . . . 53 3.8 Subsidisation and finance . . . . . . . . . . . . . . . . . . . . . . . . . . . . . . . . . . . . . . . . . . . . 53 3.8.1 Capital finance . . . . . . . . . . . . . . . . . . . . . . . . . . . . . . . . . . . . . . . . . . . . . . . . . . . . . . . . . . 53 3.8.2 Tax concessions for landlords . . . . . . . . . . . . . . . . . . . . . . . . . . . . . . . . . . . . . . . 55 3.8.3 Housing allowances . . . . . . . . . . . . . . . . . . . . . . . . . . . . . . . . . . . . . . . . . . . . . . . . . . . . 56 3.9 Bridging the gap between social and market renting?.. . . . . . . . 57 Country expert . . . . . . . . . . . . . . . . . . . . . . . . . . . . . . . . . . . . . . . . . . . . . . . . . . . . . . . . . . 62
4 Flanders, Belgium .. . . . . . . . . . . . . . . . . . . . . . . . . . . . . . . . . . . . . . . . . . . . . . . . . . 63 4.1 The federal system .. . . . . . . . . . . . . . . . . . . . . . . . . . . . . . . . . . . . . . . . . . . . . . . . . . . . 63 4.2 Housing stock . . . . . . . . . . . . . . . . . . . . . . . . . . . . . . . . . . . . . . . . . . . . . . . . . . . . . . . . . . . . 64 4.2.1 Definition of rented sector . . . . . . . . . . . . . . . . . . . . . . . . . . . . . . . . . . . . . . . . . . . . 64 4.2.2 Description of housing stock . . . . . . . . . . . . . . . . . . . . . . . . . . . . . . . . . . . . . . . . . 64 4.2.3 Quality of the housing stock . . . . . . . . . . . . . . . . . . . . . . . . . . . . . . . . . . . . . . . . . 68 4.3 Characteristics of tenants . . . . . . . . . . . . . . . . . . . . . . . . . . . . . . . . . . . . . . . . . . . . 70 4.4 Housing policy . . . . . . . . . . . . . . . . . . . . . . . . . . . . . . . . . . . . . . . . . . . . . . . . . . . . . . . . . . . 74 4.4.1 Belgian history.. . . . . . . . . . . . . . . . . . . . . . . . . . . . . . . . . . . . . . . . . . . . . . . . . . . . . . . . . . 74 4.4.2 Flemish history . . . . . . . . . . . . . . . . . . . . . . . . . . . . . . . . . . . . . . . . . . . . . . . . . . . . . . . . . . 75 4.4.3 Recent housing policy . . . . . . . . . . . . . . . . . . . . . . . . . . . . . . . . . . . . . . . . . . . . . . . . . 77 4.5 Rent control, tenant security and other property rights . . . . . . 79 4.5.1 Social rented sector: differential rents . . . . . . . . . . . . . . . . . . . . . . . . . . . . 80 4.5.2 Social rented sector: other property rights . . . . . . . . . . . . . . . . . . . . . . . 81 4.5.3 Market rented sector: rent control and security of tenure . . . 82 4.6 Allocation procedures and criteria . . . . . . . . . . . . . . . . . . . . . . . . . . . . . . . . . 84 4.6.1 Allocation of social rented dwellings . . . . . . . . . . . . . . . . . . . . . . . . . . . . . . 84 4.6.2 Social Rental Agencies: allocation of market rented
dwellings with a social purpose . . . . . . . . . . . . . . . . . . . . . . . . . . . . . . . . . . . . . 86 4.7 Regulation and supervision . . . . . . . . . . . . . . . . . . . . . . . . . . . . . . . . . . . . . . . . . . 87 4.7.1 Supervising and accrediting social rental housing . . . . . . . . . . . . . 88 4.7.2 Regulating market rental housing . . . . . . . . . . . . . . . . . . . . . . . . . . . . . . . . . . 90 4.8 Subsidies and finance . . . . . . . . . . . . . . . . . . . . . . . . . . . . . . . . . . . . . . . . . . . . . . . . . . 91 4.8.1 Support for social rental sector investment . . . . . . . . . . . . . . . . . . . . . . 92 4.8.2 Taxation for market rental investment . . . . . . . . . . . . . . . . . . . . . . . . . . . . 93 4.8.3 Housing allowances . . . . . . . . . . . . . . . . . . . . . . . . . . . . . . . . . . . . . . . . . . . . . . . . . . . . 94 4.9 Bridging the gap between social and market renting?.. . . . . . . . 95 Country experts . . . . . . . . . . . . . . . . . . . . . . . . . . . . . . . . . . . . . . . . . . . . . . . . . . . . . . . 102
5 France . . . . . . . . . . . . . . . . . . . . . . . . . . . . . . . . . . . . . . . . . . . . . . . . . . . . . . . . . . . . . . . . .103 5.1 Introduction . . . . . . . . . . . . . . . . . . . . . . . . . . . . . . . . . . . . . . . . . . . . . . . . . . . . . . . . . . . . 103 5.2 Housing stock . . . . . . . . . . . . . . . . . . . . . . . . . . . . . . . . . . . . . . . . . . . . . . . . . . . . . . . . . . 104

5.2.1 Definition of the social rental and the market rental sector . . . . . . . . . . . . . . . . . . . . . . . . . . . . . . . . . . . . . . . . . . . . . . . . . . . . . . . . . . . . . . . . . . . . 104
5.2.2 A large array of landlords . . . . . . . . . . . . . . . . . . . . . . . . . . . . . . . . . . . . . . . . . . . 104 5.2.3 Development of the French housing stock . . . . . . . . . . . . . . . . . . . . . 107 5.2.4 Quality of the housing stock . . . . . . . . . . . . . . . . . . . . . . . . . . . . . . . . . . . . . . 108 5.3 Characteristics of tenants and rent levels . . . . . . . . . . . . . . . . . . . . . . 109 5.4 Housing policy . . . . . . . . . . . . . . . . . . . . . . . . . . . . . . . . . . . . . . . . . . . . . . . . . . . . . . . . . 112 5.4.1 The history of housing policy . . . . . . . . . . . . . . . . . . . . . . . . . . . . . . . . . . . . . . 112 5.4.2 Recent housing policy developments . . . . . . . . . . . . . . . . . . . . . . . . . . . . 114 5.5 Rent control, tenant security and other property rights . . . . 118 5.5.1 Social rental sector . . . . . . . . . . . . . . . . . . . . . . . . . . . . . . . . . . . . . . . . . . . . . . . . . . 118 5.5.2 Market rental sector . . . . . . . . . . . . . . . . . . . . . . . . . . . . . . . . . . . . . . . . . . . . . . . . . 121 5.6 Allocation procedures and criteria . . . . . . . . . . . . . . . . . . . . . . . . . . . . . . . 122 5.6.1 Social rental sector . . . . . . . . . . . . . . . . . . . . . . . . . . . . . . . . . . . . . . . . . . . . . . . . . . . 122 5.6.2 Market rental dwellings . . . . . . . . . . . . . . . . . . . . . . . . . . . . . . . . . . . . . . . . . . . . 124 5.7 Regulation and supervision . . . . . . . . . . . . . . . . . . . . . . . . . . . . . . . . . . . . . . . . 124 5.7.1 Regulating social rental housing . . . . . . . . . . . . . . . . . . . . . . . . . . . . . . . . . . 124 5.7.2 Regulating market rental housing . . . . . . . . . . . . . . . . . . . . . . . . . . . . . . . . 127 5.8 Subsidies and finance . . . . . . . . . . . . . . . . . . . . . . . . . . . . . . . . . . . . . . . . . . . . . . . 127 5.8.1 Support for social rental sector investment . . . . . . . . . . . . . . . . . . . . 127 5.8.2 Support for intermediate sector investment . . . . . . . . . . . . . . . . . . . 129 5.8.3 Subsidies for renovation . . . . . . . . . . . . . . . . . . . . . . . . . . . . . . . . . . . . . . . . . . . . 130 5.8.4 Taxation of the different types of landlords . . . . . . . . . . . . . . . . . . . . 132 5.8.5 Tax concessions for market rental landlords . . . . . . . . . . . . . . . . . . 133 5.8.6 The 1% logement scheme . . . . . . . . . . . . . . . . . . . . . . . . . . . . . . . . . . . . . . . . . . . 136 5.8.7 Housing allowances . . . . . . . . . . . . . . . . . . . . . . . . . . . . . . . . . . . . . . . . . . . . . . . . . . 136 5.9 Bridging the gap between social and market renting? . . . . . . 138 Country experts . . . . . . . . . . . . . . . . . . . . . . . . . . . . . . . . . . . . . . . . . . . . . . . . . . . . . . . 142
6 Germany .. . . . . . . . . . . . . . . . . . . . . . . . . . . . . . . . . . . . . . . . . . . . . . . . . . . . . . . . . . . . .143 6.1 The federal system .. . . . . . . . . . . . . . . . . . . . . . . . . . . . . . . . . . . . . . . . . . . . . . . . . . 143 6.2 Housing stock . . . . . . . . . . . . . . . . . . . . . . . . . . . . . . . . . . . . . . . . . . . . . . . . . . . . . . . . . . 143 6.2.1 Definition of the subsidised and unsubsidised rented
sector . . . . . . . . . . . . . . . . . . . . . . . . . . . . . . . . . . . . . . . . . . . . . . . . . . . . . . . . . . . . . . . . . . . . 143 6.2.2 Housing stock according to type of landlord . . . . . . . . . . . . . . . . . . . 144 6.2.3 Quality of housing stock . . . . . . . . . . . . . . . . . . . . . . . . . . . . . . . . . . . . . . . . . . . . 149 6.3 Characteristics of tenants . . . . . . . . . . . . . . . . . . . . . . . . . . . . . . . . . . . . . . . . . . 151 6.4 Housing policy . . . . . . . . . . . . . . . . . . . . . . . . . . . . . . . . . . . . . . . . . . . . . . . . . . . . . . . . . 153 6.4.1 History . . . . . . . . . . . . . . . . . . . . . . . . . . . . . . . . . . . . . . . . . . . . . . . . . . . . . . . . . . . . . . . . . . . 153 6.4.2 Recent social and housing policy . . . . . . . . . . . . . . . . . . . . . . . . . . . . . . . . . 156 6.5 Rent control, tenant security and other property rights . . . . 158 6.5.1 Rent control: not-subsidised dwellings . . . . . . . . . . . . . . . . . . . . . . . . . . 159 6.5.2 Rent control: subsidised dwellings . . . . . . . . . . . . . . . . . . . . . . . . . . . . . . . 160

6.5.3 Security of tenure . . . . . . . . . . . . . . . . . . . . . . . . . . . . . . . . . . . . . . . . . . . . . . . . . . . . . 162 6.5.4 Rent surcharge.. . . . . . . . . . . . . . . . . . . . . . . . . . . . . . . . . . . . . . . . . . . . . . . . . . . . . . . . 162 6.6 Allocation procedures and criteria . . . . . . . . . . . . . . . . . . . . . . . . . . . . . . . 163 6.7 Regulation and supervision . . . . . . . . . . . . . . . . . . . . . . . . . . . . . . . . . . . . . . . . 165 6.8 Subsidies and finance . . . . . . . . . . . . . . . . . . . . . . . . . . . . . . . . . . . . . . . . . . . . . . . . 166 6.8.1 Bricks-and-mortar subsidies . . . . . . . . . . . . . . . . . . . . . . . . . . . . . . . . . . . . . . . 166 6.8.2 Tax concessions for landlords . . . . . . . . . . . . . . . . . . . . . . . . . . . . . . . . . . . . . 168 6.8.3 Housing allowances . . . . . . . . . . . . . . . . . . . . . . . . . . . . . . . . . . . . . . . . . . . . . . . . . . 170 6.9 Bridging the gap between social and market renting?.. . . . . . 171 Country experts . . . . . . . . . . . . . . . . . . . . . . . . . . . . . . . . . . . . . . . . . . . . . . . . . . . . . . . 175
7 Ireland .. . . . . . . . . . . . . . . . . . . . . . . . . . . . . . . . . . . . . . . . . . . . . . . . . . . . . . . . . . . . . . .177 7.1 Introduction . . . . . . . . . . . . . . . . . . . . . . . . . . . . . . . . . . . . . . . . . . . . . . . . . . . . . . . . . . . . 177 7.1.1 National responsibilities and local provision . . . . . . . . . . . . . . . . . . 177 7.2 Housing stock . . . . . . . . . . . . . . . . . . . . . . . . . . . . . . . . . . . . . . . . . . . . . . . . . . . . . . . . . . 177 7.2.1 Definition and size of the rented sector . . . . . . . . . . . . . . . . . . . . . . . . . 177 7.2.2 Description of the housing stock.. . . . . . . . . . . . . . . . . . . . . . . . . . . . . . . . . 177 7.2.3 Quality of the housing stock . . . . . . . . . . . . . . . . . . . . . . . . . . . . . . . . . . . . . . . 179 7.3 Characteristics of tenants . . . . . . . . . . . . . . . . . . . . . . . . . . . . . . . . . . . . . . . . . . 180 7.4 Housing policy . . . . . . . . . . . . . . . . . . . . . . . . . . . . . . . . . . . . . . . . . . . . . . . . . . . . . . . . . 181 7.4.1 Home ownership . . . . . . . . . . . . . . . . . . . . . . . . . . . . . . . . . . . . . . . . . . . . . . . . . . . . . . 181 7.4.2 Social renting . . . . . . . . . . . . . . . . . . . . . . . . . . . . . . . . . . . . . . . . . . . . . . . . . . . . . . . . . . 182 7.4.3 The Plan for Social Housing . . . . . . . . . . . . . . . . . . . . . . . . . . . . . . . . . . . . . . . . 182 7.4.4 Market rented policy . . . . . . . . . . . . . . . . . . . . . . . . . . . . . . . . . . . . . . . . . . . . . . . . . 184 7.4.5 Current policy objectives . . . . . . . . . . . . . . . . . . . . . . . . . . . . . . . . . . . . . . . . . . . 185 7.5 Rent control, tenant security and other property rights . . . . 186 7.5.1 Differential rents . . . . . . . . . . . . . . . . . . . . . . . . . . . . . . . . . . . . . . . . . . . . . . . . . . . . . . 186 7.5.2 Housing association rents . . . . . . . . . . . . . . . . . . . . . . . . . . . . . . . . . . . . . . . . . . 188 7.5.3 Market sector rents . . . . . . . . . . . . . . . . . . . . . . . . . . . . . . . . . . . . . . . . . . . . . . . . . . . 188 7.5.4 Rent levels . . . . . . . . . . . . . . . . . . . . . . . . . . . . . . . . . . . . . . . . . . . . . . . . . . . . . . . . . . . . . . 188 7.5.5 Security of tenure in the social rented sector . . . . . . . . . . . . . . . . . . 189 7.5.6 Security of tenure in the market rented sector . . . . . . . . . . . . . . . . 189 7.5.7 Right to buy . . . . . . . . . . . . . . . . . . . . . . . . . . . . . . . . . . . . . . . . . . . . . . . . . . . . . . . . . . . . 190 7.6 Allocation procedures and criteria . . . . . . . . . . . . . . . . . . . . . . . . . . . . . . . 191 7.6.1 Local authority allocation . . . . . . . . . . . . . . . . . . . . . . . . . . . . . . . . . . . . . . . . . . 191 7.6.2 The target group of the social rented sector . . . . . . . . . . . . . . . . . . . 191 7.6.3 Priority criteria . . . . . . . . . . . . . . . . . . . . . . . . . . . . . . . . . . . . . . . . . . . . . . . . . . . . . . . . 192 7.6.4 Housing association allocation . . . . . . . . . . . . . . . . . . . . . . . . . . . . . . . . . . . . 193 7.6.5 Market rental allocation . . . . . . . . . . . . . . . . . . . . . . . . . . . . . . . . . . . . . . . . . . . . . 193 7.7 Regulation and supervision . . . . . . . . . . . . . . . . . . . . . . . . . . . . . . . . . . . . . . . . 193 7.7.1 Regulating social housing . . . . . . . . . . . . . . . . . . . . . . . . . . . . . . . . . . . . . . . . . . . 193 7.7.2 Regulating market sector rental housing . . . . . . . . . . . . . . . . . . . . . . . 194 7.8 Subsidies and finance . . . . . . . . . . . . . . . . . . . . . . . . . . . . . . . . . . . . . . . . . . . . . . . . 195

7.8.1 Support for social-sector investment . . . . . . . . . . . . . . . . . . . . . . . . . . . . 195 7.8.2 Support for market rental investment . . . . . . . . . . . . . . . . . . . . . . . . . . . 195 7.8.3 Tax relief on market rents . . . . . . . . . . . . . . . . . . . . . . . . . . . . . . . . . . . . . . . . . . 196 7.8.4 Rent supplements . . . . . . . . . . . . . . . . . . . . . . . . . . . . . . . . . . . . . . . . . . . . . . . . . . . . 196 7.8.5 Rental Accommodation Scheme . . . . . . . . . . . . . . . . . . . . . . . . . . . . . . . . . . 198 7.9 Bridging the gap between social and market renting?.. . . . . . 200 Country experts . . . . . . . . . . . . . . . . . . . . . . . . . . . . . . . . . . . . . . . . . . . . . . . . . . . . . . . 204
8 The Netherlands . . . . . . . . . . . . . . . . . . . . . . . . . . . . . . . . . . . . . . . . . . . . . . . . . . . .205 8.1 Introduction . . . . . . . . . . . . . . . . . . . . . . . . . . . . . . . . . . . . . . . . . . . . . . . . . . . . . . . . . . . . 205 8.2 Housing stock . . . . . . . . . . . . . . . . . . . . . . . . . . . . . . . . . . . . . . . . . . . . . . . . . . . . . . . . . . 205 8.2.1 Definition of the social rented and the market rented
sector . . . . . . . . . . . . . . . . . . . . . . . . . . . . . . . . . . . . . . . . . . . . . . . . . . . . . . . . . . . . . . . . . . . . 205 8.2.2 Description of the housing stock.. . . . . . . . . . . . . . . . . . . . . . . . . . . . . . . . . 206 8.2.3 Quality of the housing stock . . . . . . . . . . . . . . . . . . . . . . . . . . . . . . . . . . . . . . . 209 8.2.4 Movements between tenures . . . . . . . . . . . . . . . . . . . . . . . . . . . . . . . . . . . . . . 211 8.3 Characteristics of tenants . . . . . . . . . . . . . . . . . . . . . . . . . . . . . . . . . . . . . . . . . . 212 8.4 Housing policy . . . . . . . . . . . . . . . . . . . . . . . . . . . . . . . . . . . . . . . . . . . . . . . . . . . . . . . . . 214 8.4.1 History . . . . . . . . . . . . . . . . . . . . . . . . . . . . . . . . . . . . . . . . . . . . . . . . . . . . . . . . . . . . . . . . . . . 214 8.4.2 Recent housing policy . . . . . . . . . . . . . . . . . . . . . . . . . . . . . . . . . . . . . . . . . . . . . . . 217 8.5 Rent control and security of tenure . . . . . . . . . . . . . . . . . . . . . . . . . . . . . . 219 8.5.1 Rent-setting and rent control . . . . . . . . . . . . . . . . . . . . . . . . . . . . . . . . . . . . . . 219 8.5.2 Security of tenure . . . . . . . . . . . . . . . . . . . . . . . . . . . . . . . . . . . . . . . . . . . . . . . . . . . . . 220 8.6 Allocation procedures and criteria . . . . . . . . . . . . . . . . . . . . . . . . . . . . . . . 221 8.7 Regulation and supervision . . . . . . . . . . . . . . . . . . . . . . . . . . . . . . . . . . . . . . . . 223 8.8 Subsidies and finance . . . . . . . . . . . . . . . . . . . . . . . . . . . . . . . . . . . . . . . . . . . . . . . . 224 8.8.1 Subsidies . . . . . . . . . . . . . . . . . . . . . . . . . . . . . . . . . . . . . . . . . . . . . . . . . . . . . . . . . . . . . . . . 224 8.8.2 Taxation . . . . . . . . . . . . . . . . . . . . . . . . . . . . . . . . . . . . . . . . . . . . . . . . . . . . . . . . . . . . . . . . . 226 8.8.3 Housing allowances . . . . . . . . . . . . . . . . . . . . . . . . . . . . . . . . . . . . . . . . . . . . . . . . . . 227 8.9 Bridging the gap between social and market renting?.. . . . . . 228 Country experts . . . . . . . . . . . . . . . . . . . . . . . . . . . . . . . . . . . . . . . . . . . . . . . . . . . . . . . 233
9 Conclusion . . . . . . . . . . . . . . . . . . . . . . . . . . . . . . . . . . . . . . . . . . . . . . . . . . . . . . . . . . .235 9.1 Introduction . . . . . . . . . . . . . . . . . . . . . . . . . . . . . . . . . . . . . . . . . . . . . . . . . . . . . . . . . . . . 235 9.2 A comparison of the gap in who provides what between
social and market renting in six countries . . . . . . . . . . . . . . . . . . . . . 235 9.3 A comparison of the gap in policy between social and
market renting in six countries . . . . . . . . . . . . . . . . . . . . . . . . . . . . . . . . . . . 242 9.4 Similarities and differences in six countries summarised . 253 9.5 Competitive gap between sectors . . . . . . . . . . . . . . . . . . . . . . . . . . . . . . . . . 255 9.6 Bridging the gap between social and market renting?.. . . . . . 266 9.6.1 Promoting greater competition between sectors . . . . . . . . . . . . . 267 9.6.2 Building an intermediate sector. . . . . . . . . . . . . . . . . . . . . . . . . . . . . . . . . . . 270

9.7 Evaluation of framework . . . . . . . . . . . . . . . . . . . . . . . . . . . . . . . . . . . . . . . . . . . . 273
References . . . . . . . . . . . . . . . . . . . . . . . . . . . . . . . . . . . . . . . . . . . . . . . . . . . . . . . . . . . .279
Index .. . . . . . . . . . . . . . . . . . . . . . . . . . . . . . . . . . . . . . . . . . . . . . . . . . . . . . . . . . . . . . . . .303

List of tables
Table 1.1 A range of demographic and economic indicators concerning the six countries in this study
Table 1.2 Tenure structure of six countries under study, various years
Table 1.3 Characteristics of ‘social’ landlords in the six countries under study
Table 2.1 Who provides what in market and social renting?
Table 2.2 Policy for market and social renting
Table 2.3 Substitutability between market and social renting and the concept of a gap
Table 2.4 Rivalry between market and social renting and the concept of a gap
Table 3.1 Distribution (in percentages) of the housing stock in the United Kingdom by country and type of ownership, various years
Table 3.2 Differences between market and social-sector tenants, England, 2003-2004
Table 3.3 Income and housing tenure UK, 2004-2005
Table 3.4 House building in England, dwellings completed, percentages by sector, and totals, selected years
Table 3.5 The gap between social renting and market renting in who provides what in England
Table 3.6 The gap between social renting and market renting in policy and policy instruments in England
Table 4.1 Occupiers according to tenure, percentages, Flanders, 1981, 1991, 2001 and 2005
Table 4.2 Housing tenure according to level of urbanisation, percentages, Flanders, 2005

Table 4.3 Evaluation of comfort, physical condition, and general satisfaction of dwelling based on the opinion of the occupant, percentages, Flanders, 2005
Table 4.4 Evaluation of external physical condition of dwelling by surveyors, percentages, Flanders, 2005
Table 4.5 Employment, education and household composition of Flemish households and according to tenure, percentages, Flanders, 2005
Table 4.6 Average net household income per month and per percentile in euros, Flanders, 2005
Table 4.7 Average rent per month and per percentile in euros, Flanders, 2005
Table 4.8 Residual incomes (net household income per month after deduction of rent) and per percentile in euros, Flanders, 2005
Table 4.9 Rent as share of net household income per quintile of income, avarage and median, percentages, Flanders, 2005
Table 4.10 Dwellings completed, Belgium, 1980-2003, selected years
Table 4.11 Amounts of rent subsidy per month, in euros, according to limits of net taxable household income three years before application and year of receipt, applicable for 2009
Table 4.12 The gap between social renting and market renting in who provides what in Flanders
Table 4.13 The gap between social renting and market renting in policy and policy instruments in Flanders
Table 5.1 Distribution of the occupied rental dwelling stock among landlords (x 1000 dwellings), France, 2005
Table 5.2 Distribution of the social rental housing stock according to number of inhabitants of the municipality, France 1999 and 2001
Table 5.3 Income distribution of tenants, France, 2002

Table 5.4 Average monthly rent per square metre in the social and market rented sectors, broken down by number of inhabitants in the municipality, France, 2002
Table 5.5 Rent regulation, tenant security and other property rights in the social rental sector, the regulated market rental sector and the ‘normal’ market rental sector, France, 2008
Table 5.6 Main characteristics of the four loans for rental landlords, France, 2008
Table 5.7 Main characteristics of the tax incentives for investment in the market rental sector, France, 2008
Table 5.8 The gap between social renting and market renting in who provides what in France
Table 5.9 The gap between social renting and market renting in policy and policy instruments in France
Table 6.1 Distribution of providers/owners of dwellings, 1987 for the former West Germany, 2003 for Germany
Table 6.2 Development dwelling stock (in percentages) according to tenure and subsidisation, the former West and East Germany, 1978-1993
Table 6.3 Occupied dwellings (in percentages) according to the size of the dwelling, Germany, 2002
Table 6.4 Condition of the dwelling as evaluated by the head of the household (in percentages) and score of satisfaction (on a scale from 0 to 10), the former West and East Germany, 2004
Table 6.5 Average monthly rent (in euros) including ‘cold’ additional charges per square metre by type of landlord, the former West and East Germany, 1994, 1999 and 2004
Table 6.6 Tenants as average percentage of households by net household income, the former West and East Germany, 1994, 1999 and 2004
Table 6.7 Rent as percentage of net household income by income quintiles of tenants, the former West and East Germany, 1994, 1999 and 2004

Table 6.8 Dwellings newly constructed in new-constructed buildings for housing, Germany, 1993-2006
Table 6.9 Average monthly rent (in euros) including ‘cold’ additional charges per square metre by length of contract, the former West and East Germany, 1994, 1999 and 2004
Table 6.10 Subsidised dwellings in Germany, 2003-2006
Table 6.11 The gap between social renting and market renting in who provides what in Germany
Table 6.12 The gap between social and market renting in policy and policy instruments in Germany
Table 7.1 Housing tenure (in percentages), Ireland, 1961-2006
Table 7.2 Type of accommodation by sector, Ireland, 2006
Table 7.3 Age of the housing stock by sector, Ireland, 2006
Table 7.4 Index of average disposable income by household tenure, Ireland
Table 7.5 Total housing completions by sector (in percentages) and totals, Ireland, 1970-2006
Table 7.6 Average weekly rents in euros, Ireland, 2006
Table 7.7 Rental tax relief for market tenants, Ireland
Table 7.8 The gap between social renting and market renting in who provides what in Ireland
Table 7.9 The gap between social renting and market renting in policy and policy instruments in Ireland
Table 8.1 Housing stock according to tenure, the Netherlands, 1947-2006
Table 8.2 Housing production by tenure, the Netherlands, 1971-2006
Table 8.3 Characteristics of the housing stock by tenure, the Netherlands, 2006

Table 8.4 Housing stock by size of municipality and tenure, the Netherlands, 2006
Table 8.5 Satisfaction with current dwelling according to tenure, the Netherlands, 2006
Table 8.6 Recently moved households (within two years) according to current and previous tenure (in percentages), the Netherlands, 2006
Table 8.7 Housing stock according to household type and ownership category, the Netherlands, 2006
Table 8.8 Housing stock according to age group (head of household) and ownership category, the Netherlands, 2006
Table 8.9 Housing stock according to socio-economic position and ownership category, the Netherlands, 2006
Table 8.10 Housing stock according to income group (disposable income) and tenure, the Netherlands, 2006
Table 8.11 Development of housing shortage 1986-2010 and production target for 2005-2009, the Netherlands
Table 8.12 Average rents and incomes in the rented sector, the Netherlands, 2002-2006
Table 8.13 The gap between social renting and market renting in who provides what in the Netherlands
Table 8.14 The gap between social renting and market renting in policy and policy instruments in the Netherlands
Table 9.1 Who provides what in social renting?
Table 9.2 Who provides what in market renting?
Table 9.3 The gap between social renting and market renting in who provides what
Table 9.4 Policy for social renting

Table 9.5 Policy for market renting
Table 9.6 The gap between social renting and market renting in policy and policy instruments
Table 9.7 The substitutability gap in six countries
Table 9.8 The rivalry gap in six countries
Table 9.9 Summarising the gap on competition based on the applicable gaps of substitutability and rivalry

List of figures
Figure 2.1 Rents, quality, market and social housing
Figure 5.1 Tenure distribution in France, 1963-2006
Figure 5.2 Housing production by social rental landlords and other housing providers (number of housing starts) France, 1980-2007
Figure 8.1 Ownership categories per income decile, the Netherlands, 2006
Figure 8.2 Housing allowance system, percentage of the rent covered by housing allowance within the set limits, the Netherlands, 2006-2007


List of abbreviations (mentioned more than once in a country chapter)
England
ALMO Arms Length Management Organisation
DCLG The Department for Communities and Local Government
HA Housing Association
HC Housing Corporation
HRP Housing Reference Person
HMOs Houses in Multiple Occupation
LHA Local Housing Authority
LSVT Large Scale Voluntary Transfer
NAHP National Affordable Housing Programme
ODPM Office of the Deputy Prime Minister (forerunner of DCLG)
ONS Office for National Statistics
RSL Registered Social Landlord
TSA Tenant Services Authority
Flanders, Belgium
BEVAK Beleggingsvennootschap in Vast Kapitaal, housing property firm
NLM Nationale Landmaatschappij, National Land Society
NMGW Nationale Maatschappij voor Goedkope Woningen en Woonvertrekken, National Society for Cheap Dwellings
NMKL Nationale Maatschappij voor de Kleine Landeigendommen, National Society for Small Land Ownership
OCMW Openbaar Centrum voor Maatschappelijk Welzijn, municipal welfare organisation
TIL Tussenkomst In de Leninglast, Financial Contribution to Loan Costs (of homeowners)
VHM Vlaamse Huisvestingsmaatschappij, Flemish Housing Society
VMSW Vlaamse Maatschappij voor Sociaal Wonen, Flemish Association for Social Housing

France
AL L’allocation logement, the French housing allowance
ANAH Agence Nationale de l‘Habitat, a French national body that provides financial support for home refurbishment and improvement
CECODHAS Comité Européen de Coordination d’habitat social, European social housing umbrella organisation.
CIL Comité Interprofessionel du Logement, a registered intermediary organisation of employers that finances social housing. These organisations finance social housing and urban renewal opera-tions and they provide financial support, advice and services to households.
HLM Habitations à Loyer Modéré, French social rental landlords
MIILOS Mission d’Inspection Interministérielle du Logement, a central govern-ment organisation that evaluates the general performance of housing associations.
PLUS Prêt Locatif à Usage Social, a subsidised loan that social rental landlords can use to finance the building or acquisition of social rental dwellings
PLA-I Prêt Locatif Aidé d’Intégration, a subsidised loan that social rental landlords can use to finance the building or acquisition of social rental dwellings that are specifically destined for people with social and/or economic problems.
PLS Prêt Locatif Social (PLS), a subsidised loan that social rental and market rental landlords can use to finance the building or acqui-sition of rental dwellings in the intermediate rental sector.
PLI Prêt Locatif Intermédiaire, a subsidised loan that social rental and market rental landlords can use to finance the building or acqui-sition of rental dwellings in the upmarket part of the intermedi-ate sector.
Palulos Prime à l’amélioration des logements locatifs sociaux, a state subsidy that social rental landlords can use for the renovation of dwell-ings that are at least 15 years old.
SEM Société d’Economie Mixte, partnerships of local governments and private partners that may also provide social rental housing. They are also called Entreprises sociales pour l’habitat
USH Union Sociale pour l’Habitat, umbrella organisation for the French social rental landlords

Germany
GdW Gesamtverband der Gemeinnützigen Wohnungsunternehmen, the organisation of non-profit landlords. It changed its name in 1990, when the non-profit tax status was abolished. Nowadays its name is GdW Bundesverband deutscher Wohnungsunternehmen, GdW Fed-eral Union of German Housing Companies
WoFG Wohnraumförderungsgesetz, bricks-and-mortar subsidy act of 2001
Ireland
PRTB Private Residential Tenancies Board
RAS Rental Accommodation Scheme
SWA Supplementary Welfare Allowance
The Netherlands
BBSH Besluit Beheer Sociale Huursector, Social Housing Management Decree
BWS Besluit Woninggebonden Subsidies, Decree on Dwelling-Linked Subsidies
CFV Centraal Fonds voor de Volkshuisvesting, Central Fund for Social Housing
IVBN Vereniging van Institutionele Beleggers in Vastgoed, Nederland, Asso-ciation of Institutional Property Investors in the Netherlands
WSW Waarborgfonds Sociale Woningbouw, Guarantee Fund for Social Housing


Preface
As a starting point for this book, we followed our impression that private initiatives were increasingly being used to provide social rental dwellings in a number of European countries. The clear demarcation of the funding and roles of each sector of the housing market seemed to be becoming blurred. The private sector would no longer work solely with private finance and no longer operate solely along strictly commercial lines responding to market demand. The social sector, meanwhile, would no longer be funded only by the state and no longer be provided only by non-profit organisations. In other words, we assumed that the boundaries between social and market renting were becoming more blurred by these initiatives.
In order to find out whether there was any truth to our observation, we have collected material in this book about the similarities and differences be-tween what we have called social and market rented housing. The main dis-tinction between these two forms of tenure that we identified was that mar-ket housing was allocated according to effective demand and social housing was allocated according to need, the assumption being that the market can-not provide according to a socially determined level of need that is different from effective demand. In order to analyse the similarities and differences between social and market rented housing, we have developed and applied the concept of a gap between the two forms of tenure, both empirically and theoretically. For the theoretical approach, we set ourselves the aim of opera-tionalising a concept of competition.
In doing this we used information from a variety of sources, mostly the available literature in scientific journals and policy documents and on websites of governments and other organisations. At this point we also would like to thank our country experts (see the end of each country chapter) who helped us gain a clearer understanding of the situation of the rental market and policy discussions, past and present, in their respective countries. The view on ‘the’ gap with its many aspects that we unfold remains clearly our responsibility.
We hope to have provided what may be called an up-to-date commentary (up to sometime in the year 2008 for most countries) on the nature of housing and rental policy in each country. In short, the book aims to provide information on two levels. It is an ‘information handbook’ on the one hand, and on the other it provides an analytical, evidence-based discussion of several issues concerning the rental sector in the countries studied. It aims to provide much more infor-mation than simply an answer to the observation that initially started us off.
December 2008
Marietta HaffnerJoris HoekstraMichael OxleyHarry van der Heijden
[ 1 ]

[ 2 ]

1 Introduction
1.1 The relationship between social and market housing
The dividing line between the private and social rented sectors appears to be shifting in a number of countries. A clear demarcation of the funding and roles of each sector was once the rule in some countries. The private sector would work with private finance and operate along strictly commercial lines responding to market demand. The social sector would be funded by the state and cater strictly for the needs of those on lower incomes. In some cases, the demarcation in terms of whom the social sector serves has become even starker; it has become increasingly residualised with the average incomes of those in the social sector falling in relation to the rest of the population. In other countries, the social sector continues to serve a wide spectrum of the population with some higher-income as well as lower-income households living in social housing. The source of funding for the sector has, however, changed in most cases with commercial finance playing a greater role in the development of new social housing. In many countries, the management of social housing is increasingly expected to occur along commercial lines with regulators imposing performance indicators and information demands that encourage social providers to respond to external pressures rather than oper-ate as protected monopolists. The actors that supply social housing also vary from country to country and within some countries have changed over time. In some cases, supply is met strictly by institutions that are viewed as public sector, non-profit and ‘social’ bodies. In others still, social supply can come from organisations that are commercially oriented and possibly ownership that is deemed to be ‘private’.
These circumstances lead us to a number of general questions about ‘a’ gap between social and market housing. How can this gap be perceived and described? What are the empirical options for doing this? What theory-based options are there? How can the gap be bridged? These questions will be tack-led from theoretical and systematic viewpoints in Chapter 2. The questions used as a basis for our comparison of the countries are as follows: (1) How do the various definitions of the gap vary between countries? (2) Is the gap wid-ening or narrowing? (3) How can the gap be bridged? These questions will be tackled in the chapters dealing with individual countries (Chapters 3 to 8). In Chapter 9, we will present our conclusions about ‘the’ gap. It is indicated here as ‘the’ gap, using ‘the’, but implying our operationalisation of a multidimen-sional concept.
This chapter will be structured as follows. In order to address these ques-tions, it will firstly be necessary to define market and social housing, which will be done in Section 1.2. Section 1.3 will explain the choice of countries to be included in this comparison, based on some housing and socio-econom-ic terms. This section will also summarise how the rental market in the six
[ 3 ]

selected countries is organised. Section 1.4 will outline the structure of this book, including the structure of the country chapters.
1.2 The definitions of social and market rented housing
Market rented housing is often known as private rented housing as it tends to be owned and managed by individuals or firms in the private sector of the economy. We prefer the term ‘market’ to ‘private’ because in some countries (e.g. the Netherlands), social housing suppliers are, in a legal sense, ‘private’ organisations. Our purpose is to distinguish social housing organisations from organisations that operate in price-oriented markets where resources are al-located according to ability to pay.
In fact, the key distinguishing feature is: how is the housing allocated? This means considering who has access to the housing and how the landlord and the tenant come together. Essentially, in what is often called the private sec-tor, they come together in a market. Here, access depends on demand, which is governed by ability to pay. Ability to pay is therefore the primary determi-nant of demand and access to market rented housing. Private landlords may require evidence of ability to pay before accepting a tenant. Rents may be con-trolled by government or they may be set by market forces. Rental agreements, which determine security of tenure and the ability of landlords to raise rents, will usually have a framework prescribed by law. Quality standards relating to accommodation may also be regulated and enforced by government. Market rental housing is not therefore a government-free zone. It is rather a set of ar-rangements whereby housing is allocated on the basis of demand and supply in a process that is moderated by rules determined by government.
Social housing, on the other hand, is sometimes defined in terms of who owns it or how rents are set. It is thus sometimes said to be housing owned by local government or non-profit organisations, or housing that is let at sub-market rents. It is sometimes defined as subsidised housing. These features are often used in official categorisations and divisions of the stock for legal purposes and for the purposes of data gathering. Allocation and management is typically in the hands of organisations appointed and approved by govern-ment and these organisations are sometimes publicly owned. They are usu-ally subsidised, and often they are some form of non-profit organisation. So-cial housing has a social purpose. Its prime purpose is to meet housing needs but the social purpose may extend to wider social goals such as promoting mixed-income communities and contributing to neighbourhood regeneration.
However, none of these factors alone captures the essence of social hous-ing. The essential defining characteristic, as with market housing, is how the accommodation is allocated. Social housing is allocated according to need
[ 4 ]

rather than demand and price, and this concept of need is politically or ad-ministratively defined and interpreted. Social housing is, explicitly, not al-located by market forces. It exists because governments have decided that some housing, at least, should not be allocated by market forces.
On an abstract level, however, it is not a matter of government deciding which housing will be considered social (e.g. housing for the elderly or for key workers), but a market which will not supply housing to meet needs. In eco-nomic theory, the market will only supply housing for effective demand when the market price is paid, and not for some level of need set by society which cannot be achieved at the equilibrium price on the market. In these terms, therefore, social housing is filling the gap between effective demand on the one hand and need on the other (Maclennan & More, 1997). Need, then, is a level of housing that is socially designated as desirable. If the market will not provide social housing, then the provision of social housing must be made at-tractive in some way. Usually this is done through subsidies. For an ‘attractive’ good or service, demand will surpass supply; it will then have to be allocated according to certain rules.
An alternative approach would be to assist demand (rather than supply), so that effective demand increases to a level at which it is sufficient to en-courage a level of supply that meets needs. Such demand-side support may take the form of housing allowances or housing vouchers that increase the financial resources available to households. The effects of such assistance on actual levels of housing demand and supply would depend on the complexi-ties of specific housing markets (Kemp, 2007).Based on the criterion of allocation, the intention in this book is that housing will be classified as either ‘social’ or ‘market’ housing. In the empirical infor-mation provided for the countries examined in this book, however, it will be necessary to depart somewhat from the ‘ideal’ definitions of social and market housing. This is because information is usually gathered according to the own-ership and legal status of organisations, thus according to whether the land-lord is social or market. However, in the analysis in the final chapter, there will be an appraisal of the extent to which the housing provided by both market and social housing organisations in each country in fact meets the ideal defi-nitions of market and social housing according to the allocation criterion.
1.3 The choice of countries examined
This study is based on trends in the rented sectors in the following six coun-tries and regions: Flanders (in Belgium), France, Germany, Ireland, the Neth-erlands and England (in the UK). There were both practical and scientific rea-sons for choosing these six countries.
One of the practical reasons behind this choice relates to one of the moti-
[ 5 ]

vations behind the study: Germany’s exceptional position in earlier interna-tional comparative studies in terms of the subdivision of the rented sector into a social (non-profit) and a market (profit) sector. Most European coun-tries have traditionally had a direct link between the social rented sector and a specific group of (public or private) owners whose existence is justified by letting social housing on a non-profit basis. In Germany, however, the social rented sector is not linked to a specific group of owners, but to a regime that governs how dwellings are let. Grants are provided to commercial and non-commercial parties who intend to let dwellings under certain prescribed conditions to the target group for the agreed period. When the grant period lapses, the dwellings lose the label ‘social’. This ensures a level playing field in both the market rented sector and the social rented sector. It has recently become apparent that there have also been various initiatives in other Euro-pean countries with a view to using the market rented sector for social hous-ing alongside the existing social rented sector (i.e. the state agent model, or contract model). We were curious as to what had prompted this development, and about the possible impact on competition between and within the two rented sectors, and the gap between them. We therefore considered it impor-tant to include some of those countries in this study, as well as Germany.
A second practical consideration in the choice of countries was the avail-ability of information from earlier international comparative studies on the social housing system in general and the rented sector in particular (see next section). For this reason Flanders was selected rather than Belgium, and Eng-land rather than the United Kingdom.
1.3.1 Demographic and economic indicators
As a general introduction to the countries studied, Table 1.1 shows various de-mographic and economic indicators relating to each. It should be noted with respect to Belgium that this study focuses on Flanders, one of the three Bel-gian regions. This focus was chosen because local authority housing in Bel-gium is managed at the regional level, and the approach in Flanders is to use private rented housing for social purposes. With respect to the UK, this study focuses on England alone. England, Wales, Scotland and Northern Ireland dif-fer in terms of local authority housing and institutional arrangements. Eng-land was chosen because it is by far the largest country of the UK. It should be noted, however, that Table 1.1 includes figures for Belgium and the UK, be-cause comparable data are unavailable for Flanders and England in the inter-national statistics.
Three of the six countries in the study (France, Germany and the UK) are among the largest countries in Western Europe in terms of population. Two of the three smaller countries (the Netherlands and Belgium) have the highest population density, while the country with the smallest population (Ireland)
[ 6 ]

also has the lowest population density. In the past 25 years, Ireland has ex-perienced by far the most rapid population growth and the greatest housing production. This population growth has led to a relatively young population, which manifests itself in the large number of people in the average house-hold. Ireland’s considerable population increase appears to have coincided with strong economic growth, with relatively high GDP per capita and rela-tively low unemployment. Moreover, Ireland has seen extremely large rent in-creases in relation to the other countries studied.
Although to a lesser extent than Ireland, France and the Netherlands have also undergone strong population growth in the past 25 years. Housing pro-duction (per 1,000 residents) in the Netherlands is on the low side in propor-tion to population growth. Only in Germany and the UK was housing produc-tion per 1,000 residents lower, but these countries have undergone a far more modest population increase.
1.3.2 Social and market renting in six countries
There are significant differences between the six countries, not only in terms of the share of social and market rented dwellings in the housing stock, but
[ 7 ]
Table 1.1 A range of demographic and economic indicators concerning the six countries in this study
UK Belgium France Germany Ireland Netherlands
Demography
Population x 1,000 (2005) 60,035 10,446 60,561 82,501 4,131 16,306
Population change, % (1980-2005) 6.7 6.0 12.7 5.5 21.8 15.7
Population per km2 (2005) 246 342 110 231 58 459
Number of households x 1,000 (2004) 24,2002 4,402 26,046 39,122 1,3821 6,9961
Average number of persons per household (2004)
2.4 2.4 2.3 2.1 2.9 2.31
Economy
GDP per capita in PPS,EU-25 = 100 (2006)*
118.1 120.0 111.1 114.3 145.7 130.8
Income (in)equality (2006)*3 5.4 4.2 4.0 4.1 4.9 3.8
Harmonised unemployment rate (2005) 4.64 8.4 9.5 9.5 4.3 4.7
Multifamily dwellings, % (2004) 18.7 25.1 43.3 53.9 8.6 31.1
Dwellings per 1,000 inhabitants (2004) 430 5 409 513 477 400 422
Housing production per 1,000 inhabitants (2004)
3.26 4.4 6.0 3.4 19.0 4.0
Rent index, 1996=100 (2003) 121.8 113.3 111.6 109.8 152.3 124.1
1) 2003. 2) Mid-year, Great Britain. 3) Ratio of total income received by the 20% of the population with the highest
income to that received by the 20% of the population with the lowest income.
4) Provisional data. 5) Data for 2003. 6) Data for 2000.
Source: Housing Statistics in the European Union 2005/2006 except * (source Eurostat)

also in terms of the character of the organisations that let social dwellings.Table 1.2 gives an overview of the tenure structure of the six countries.
England, Ireland and Belgium (Flanders) can be characterised as ‘home-own-ing’ countries with relatively small rented sectors of less than 30% of the total housing stock. However, these countries differ in how the rented stock is di-vided between social renting and market renting. In England, the social sec-tor is larger than the market sector, in Ireland both rented sectors are of ap-proximately equal size, whereas in Belgium (Flanders) the social sector is very small, compared to market renting.
In the other three countries, Germany, France and the Netherlands, the rented sector is much larger, although in France and the Netherlands it is still less than 50% of the housing stock. Only in Germany is there more rented housing than owner-occupied housing. In these three countries, the differ-ences in the way the rented stock is divided between social renting and mar-ket renting are even greater than in the three ‘home-owning’ countries. In France and Germany, market renting is more important than social renting, whereas the Netherlands has by far the largest social rented sector.
Market rentIn most countries, private persons or individuals own the majority of market rented dwellings. Only in the Netherlands do private companies such as insti-tutional investors, (64%) play a greater role as landlords in the market sector than private individuals. In Flanders, France (2005) and Ireland, over 90% of landlords are private individuals. In Germany, there is a more equal distribu-tion of landlords: almost 60% are private individuals. In England (2001), too, there is a more equal distribution between private individuals (65%) and oth-ers – these being companies (13%), partnerships (5%) and others (17%).1
1 From a statistical point of view, the English private rental sector is a residual category (effectively all hous-
ing other than owner-occupied and social rented housing) including rent-free dwellings, which in France are
included under ‘other’.
[ 8 ]
Table 1.2 Tenure structure of the six countries in this study, various years
TenureEngland2005
Flanders 2005
France 2002
Germany 2003
Ireland 2006
Netherlands 2006
Mar ket rent ed 11 18 21 46 11 11
Social rented 18 5 17 15* 11 33
Owner-occu pa tion 70 74 56 39 75 56
Other 0 2 6 0 3 0
Total 100 100 100 100 100 100
* Social letting: an estimated 15% of all rented dwellings are let with a social purpose (including municipal housing companies and rented cooperatives). Approximately 5-7% of all rented dwellings is (still) subsidised.

Social rentSome social rented dwellings in almost all countries are owned by public landlords such as local authorities and private non-profit (or limited profit) organisations like housing associations (see Table 1.3). It is only in the Neth-erlands that there are no longer any public landlords in the social sector. The Dutch municipal housing sector underwent a process of privatisation during the last decades of the 20th century. This involved the transfer of the housing owned by the municipal housing companies to the private non-profit housing association sector.
In England and the Netherlands, the activities of housing associations are not necessarily restricted to social renting. In both countries, the unregistered subsidiaries of housing associations may also operate commercially. Addition-ally, housing associations in the Netherlands rent out more expensive dwell-ings to higher-income groups.
Germany has no specifically ‘social’ landlords. The cooperatives and mu-nicipal housing companies may be considered as conducting their activities on a non-profit basis, since the fiscal non-profit tax status was abolished in
[ 9 ]
Table 1.3 Characteristics of ‘social’ landlords in the six countries under study
Country Owner % of housing stock Ownership Control Financial goal
Belgium (Flanders)
Housing association 5 Private Public Non-profit
Public landlord 1 Public Public Non-profit
Private person or individual or company
Very small Private Private Profit
France Public landlord (OPHLM, OPAC) 7 Public Public Non-profit
Public-private landlords (SAHLM, SEM)
10 Private Public/private Limited profit
Private person or company 21 Private Private Profit
Germany (A) Cooperative 6 Private Private Non-profit
Municipal housing company 7 Public Public Non-profit
Private person or company Not available2 Private Private Profit
Ireland Local authority 7 Public Public Non-profit
Housing association 4 Private Private Non-profit
Private person or company Negligible Private Private Profit
Netherlands Housing association 33 Private Private Non-profit
England Local authority1 10 Public Public Non-profit
Housing association 8 Private Private Non-profit
Private person or company Not available Private Private Profit
(A) Alternative for Germany: All investors (profit or non-profit) who receive subsidies or choose to let with special purposes (after the subsidy period is expired).
1) May be managed by an Arms Length Management Organisation (ALMO). 2) An estimated 5 to 7% of dwellings may be considered subsidised with bricks-and-mortar subsidies. There may be
overlap with the stock of cooperative landlords and municipal housing companies.

1990 (with the exception of ‘inactive’ cooperatives). But as explained in the previous section, the real distinction between social renting and market rent-ing in Germany is based on whether bricks-and-mortar subsidies are being provided (on a temporary basis) for certain dwellings, regardless of the type of landlord. For as long as a dwelling is subsidised in this way, they are sub-ject to rules on the allocation of dwellings and a system of rent control. When there is no subsidy or the subsidy has expired, the dwellings concerned are classified as market rented housing; when bricks-and-mortar subsidies are involved, they are classified as social rented housing. However, these classifi-cations do not go hand in hand with any particular type of landlord.
It is not only in Germany where it is possible for private persons (individu-als) or companies to be involved in social renting. With the exception of the Netherlands, social housing can be supplied by commercially oriented organi-sations in all the countries under study. The arrangements for this differ from country to country, however, and are in most cases recent initiatives.2 Their goals also differ and they contribute to a decrease in the gap between social and market renting in different ways. Social housing supply by commercial landlords means the break-down of the traditional (in many countries) divi-sion between suppliers of social housing (public landlords and non-profit organisations) and market renting (commercial landlords). This is leading to an expansion of social housing and may lead to greater competition between suppliers of social housing. The creation of an intermediate sector may be a means of closing the gap between social renting and market renting, or be-tween renting and home ownership.
1.4 An outline of this book
Although information on rented housing in European countries can regularly be found in articles (e.g. Whitehead, 1996; Gibb, 2002; Stephens et al., 2003; Kirchner, 2007; Haffner et al., 2008) and books (e.g. Harloe, 1984, 1995; Balchin, 1986; Whitehead & Scanlon, 2007; Scanlon & Whitehead, 2008), these works have tended to concentrate on either the social or the private rented sector. Books describing or comparing housing systems have usually also included the rental sector as a whole (e.g. Boelhouwer & Van der Heijden, 2002; Donner, 2000), but have not necessarily focused on the differences and similarities be-tween social and market renting. This text aims to contribute to the literature by presenting a contemporary analysis of rented housing in both sectors. It provides information on the role of the rented sector in the countries under
2 It is not always clear what the actual impact is of these arrangements, because they do not fit in the cur-
rent statistics.
[ 10 ]

study and focuses on an analysis of the ‘boundary’ between social and mar-ket rented housing. We will discuss the gap between social and market rent-ing and its significance. We base our evaluation of the gap on our study and interpretation of the literature and information found on how the rental sys-tems work in the different countries.
In order to achieve our aims, Chapter 2 is devoted specifically to how we define the gap in empirical terms. We also provide an outline of the concept of competition that will allow us to view the gap from a new theoretical per-spective.
Chapters 3 to 8 – the country chapters on England, Flanders, France, Ger-many, Ireland, the Netherlands – involve information that will, as far as pos-sible, be structured along the same lines. The introduction of each country chapter will give a general impression of the division of responsibilities and powers in housing across the various levels of government. Section 2 involves the definition, size and quality of the rented sectors, not only in relation to one other, but also in comparison to the owner-occupied sector. Institu-tional arrangements are also described: which organisations are involved in the ownership and control of the dwellings? The next section describes the characteristics of the tenants in terms of income ranges and socio-economic groupings: do they differ between sectors?
Section 4 of the country chapters will give a short historical overview of main housing policy developments since World War II, with a particular em-phasis on policy in the last ten years. This will outline the main aims and objectives of housing policy, specifically in relation to rented housing and the government’s expectations of private and social landlords. It may also include the relationship between housing policy and other policies, such as macro-economic policy, social policy and environmental policy.
These first four sections of each chapter function as an introduction to each country, its housing stock, rental sector and housing policy. The rest of each country chapter is organised according to the structure of the gap delin-eated in the next chapter. That means that Section 5 will deal with the prop-erty rights associated with a rental dwelling in the social and market sec-tors respectively. First, information on rent levels is necessary to determine whether, on average, social and market rents differ. Next, rent regulation will be discussed. This subject includes rent setting when the contract is initiated and changes in the rent of sitting tenants. Tenant security will also be dis-cussed: the types of contract and the duration of the contracts. The other side of this coin is the property rights of landlords: the ability to gain vacant pos-session and the ability to vary rents. The property rights complement the in-formation given earlier in the country chapters on housing quality and rent levels to give as complete a picture as possible of the quality of the accommo-dation available in either tenure.
Section 6 focuses on allocation procedures and criteria in the market and
[ 11 ]

social sector. The question is whether or not there are different systems at work in the two rental sectors when rented property is allocated.
In Section 7, the regulation and supervision of landlords as an organisation type will be presented. Again, the focus is on differences or similarities in the approaches taken. This section covers questions such as how the sector as a whole and each part (market and public) is regulated, how supervision and control are organised, and what the internal governance arrangements are.
Section 8 will deal with finance and subsidy arrangements in the two rent-al sectors. Subsidisation includes a discussion of bricks-and-mortar subsidies, taxation arrangements and personal subsidies. Other points included here are the effects of subsidisation and the extent to which the criteria for sub-sidisation are different between social and market renting.
The concluding section of each country chapter will summarise our differ-ent ways of defining the gap and possibly of bridging the gap.
The concluding chapter, Chapter 9, will summarise the main similarities and differences between the countries examined. It will give an overview in a comparative context of key issues such as who lives in rented housing, how it is regulated, subsidised and more generally influenced by governments, what policy roles it performs and what policy role it could be expected to per-form. It also aims to give an overview of the relationship between social and market rented housing in order to evaluate the role of rented housing and of social and market rented housing in a country: for whom does the sector provide housing? What contributions does it make to policy objectives? In the concluding chapter we will, in effect, discuss the boundary between the social and market rented sectors. We will synthesise material on the gap between the sectors in the six countries studied, summarising the nature and extent of the gap between social and market rented housing.
[ 12 ]

2 Perspectives on the gap between social and market renting
2.1 Introduction
In Chapter 1, it was claimed that the dividing lines between the social and market rented sectors appear to be shifting in some countries and the con-cept of a gap between these sectors, as well as the narrowing of this gap, was postulated. In this chapter, we argue that this gap can be considered from three perspectives. These are:1. Differences in the actors that provide rented housing and in what exactly
is provided;2. Differences in whom the sectors are aimed at and in government policies
towards the sectors;3. A lack of competition between the sectors.
The first two perspectives provide a way of ordering information about the sectors without any strong theoretical underpinning, while the third perspec-tive builds a theoretical foundation from economic analysis. In the next three sections, the relationships between the sectors will be examined according to each of these three aspects. The penultimate section of the chapter will ad-dress the concept of bridging the gap between the sectors and consider the meanings that may be ascribed to bridging the gap as a way of changing the relationship between social and market rented housing.
2.2 Differences in who provides and what is provided
The differences between the sectors could simply be analysed in terms of who the providers are and what they provide. The types of landlords in the two sectors and the types of housing and the associated property rights can both define and distinguish market housing from social housing. Table 2.1 suggests that similarity in each of these contributes to a smaller gap between the sectors, while differences lead to a larger gap. The degree of similarity or difference is not defined in a precise quantitative form and thus whether or not we ascribe difference or similarity, and the degree of each of these, is a matter of interpretation and a good deal of normative judgement. In an over-all evaluation of the size of the gap, one would also need to take account of the weight attached to each item in Table 2.1. Again, we do not suggest any precise formula for this but we will make an informed judgement on the rela-tive significance of these gaps in the six countries in Chapter 9. A brief discus-sion of each element of Table 2.1 will assist the explanation.
[ 13 ]

Types of landlordAs shown in Chapter 1, social housing encompasses a wide variety of organi-sational forms in Europe. There is municipal housing in some countries. Lo-cal authorities may either own and manage housing themselves or delegate management to a separate organisation. Municipalities can also own compa-nies that, in turn, both own and manage rented housing. Other legal forms include various types of housing associations that are managed by a volun-tary board and housing cooperatives in which tenants collectively own the housing stock and often have some control over the management of their dwellings by electing the board of management and appointing the opera-tional managers. In some cases, cooperatives are considered part of the social sector in official definitions and data while in others they are excluded. The term ‘housing association’ is used to include entities that are, as shown in Ta-ble 1.3, under private sector ownership and control. They can thus be legally separate from the public sector and for the purposes of financial accounting their expenditure can be deemed private rather than public; they may, how-ever, be subject to considerable pressure from the public sector by means of regulation and the possible receipt of subsidies. In some countries, housing associations have joined groups that include providers of both social housing and housing that is supplied commercially. This complicates the picture be-cause organisations that at first glance appear purely to be suppliers of social housing in fact turn out to be suppliers of housing for which market rents are charged. It is also quite possible for landlords of housing that is allocated on social terms, and is thus – according to the central definition used in this book – in the social sector, to be a company that is owned by shareholders, partners or private individuals. All these legal and administrative forms exist in various guises in the countries under study here. Most of these social-sec-tor providers are currently, or have been in the past, in receipt of some sort of subsidy. The market sectors also include a variety of owners and managers, including individuals and commercial firms. There are institutional landlords such as pension funds and insurance companies with large housing portfo-lios in some countries, as well as private persons who own only one or two dwellings. As in the social sector, the same organisation can own and manage dwellings, or alternatively management can be contracted to a specialist firm who will be responsible for day-to-day activities such as rent collection and repairs.
[ 14 ]
Table 2.1 Who provides what in market and social renting?
Small gap Large gap
Types of landlord Very similar organisations with similar motives
Very different organisations with different motives
Type of accommodation Very little distinction between property types, quality of accommodation and the desirability of neighbourhoods. Similar rent/quality relationships
Clear differences betweenproperty types, quality of accommodation and desirability of neighbourhoods. Very different rent/quality relationships
Property rights Very little difference in terms of landlord/tenant contracts, including security of tenure and provisions for rent increases
Marked differences in terms of landlord/tenant contracts, including security of tenure and provisions for rent increases

One could differentiate between the social and market sectors according to the motives of the landlords in the two sectors. In some countries, it would be possible to characterise the social sector as a sector dominated by non-profit landlords whose behaviour is governed by goals other than profit maximisa-tion. They may, for example, have charitable motives or effectively be geared to responding to governmental targets and requirements. In other countries, where commercial organisations are used to provide social housing, by for ex-ample contracting with governments to charge sub-market rents and prior-itise low-income households in return for preferential tax treatment or the receipt of grants, firms motivated by profit maximisation can also be active in the social sector. The market sector will typically be dominated by organisa-tions that seek financial rewards and ultimately wish to make as much profit as possible.
If the landlords in both sectors are similar in terms of their legal status and motivation, one can conclude that there is a small gap between the two sectors. When very different types of landlords with different motives are ac-tive in the two sectors, one may conclude that there is a large gap between the sectors.
Types of accommodation and price/quality relationshipsIt is possible to imagine a scenario in which the market and social sectors provide similar types of houses in similar sorts of neighbourhoods, and the relationship between the rents charged and the quality of accommodation is similar in the two sectors. In this case, the gap between the sectors would be small. In another scenario, the dwelling types will vary markedly between the sectors; with perhaps one sector dominated by high-quality housing lo-cated in high-status neighbourhoods, while in the other sector lower-quality accommodation located in down-market neighbourhoods predominates. It is also quite likely that there will be some variety within each sector, with a va-riety of dwelling types and quality in the two sectors. In this case, rents may reflect quality and possibly consumer preferences in both sectors, and anoth-er possibility is that rents are very low with respect to quality in one sector and relatively high in the other. A high degree of similarity on these measures would suggest a small gap, while large differences would suggest a large gap.
Property rightsDescribing the physical features of the accommodation and its location is one way of defining what the tenant receives in return for his rent. Another way involves asking questions about the bundle of property rights enjoyed by tenants in the two sectors. These are rights associated with the dwelling that have a legal foundation and which the tenant acquires as a consequence sim-ply of being a tenant (Becker, 1977; Jaffe, 1996). This may be a complex bundle of items and include many things that influence the enjoyment of the dwell-
[ 15 ]

ing and the terms on which that enjoyment is available. For the purposes of our discussion, these rights include the right to occupy the dwelling and the terms on which the dwelling is provided, including the rent and future rent increases. These matters may be freely negotiated between landlords and ten-ants and incorporated into landlord and tenant contracts. In most cases the parameters within which such contracts can be drawn up will be determined by statute and there will thus be a policy dimension to these rights. The rights may also include the option of acquiring the dwelling from the landlord. This could amount to a right to buy which is a feature of the social sector in some countries. Very different terms in landlord and tenant contracts, and very dif-ferent consequences of the moderation of property rights by government in the two sectors, would suggest a large gap, while very similar property rights in the two sectors would suggest a small gap.
If there are, within a country, very few distinctions in the types of land-lords, the types of accommodation provided, the relationships between qual-ity and rents, and there are also similar property rights in the two sectors, this means that there is very little difference at all between social and mar-ket renting and a very small gap exists. In practice, some differentiation in at least some of these elements is likely.
2.3 Differences in whom the sectors are aimed at and government policies towards the sectors
The differences considered in Section 2.2 could exist quite independently of policy, or they might be a reflection of policy. In this section, we consider the features of the two sectors that are clear functions of policy. This means the purpose, the instruments and the outcomes of policies. In Table 2.2 these sorts of differences and their effect on the gap between the sectors are sum-marised. These differences in the purpose of each housing sector, allocation systems, rent controls and regulations, the regulation and supervision of landlords, subsidies, and their outcomes in terms of the socio-economic pro-files of tenants and the movement of tenants between sectors, are discussed in turn.
The purpose of each housing sectorThe purpose of the social rented sector in particular varies between countries. Its intended role can be limited to providing for the poorest sections of the community, or it can be expected to house a wider cross-section of society. It may thus have a specific role as a safety net and house only those who cannot provide for themselves in the market place, or it may seek to house a broader spectrum of the population. It may in principle have a narrow hous-
[ 16 ]

ing policy focus, or it may be expected to contribute to wider social, economic and environmental objectives. It may therefore, for example, be expected to contribute to social cohesion, ensuring an adequate supply of public sector workers in tight labour markets or a reduction in pollution by promoting en-ergy efficiency in the housing stock and in production.
The market rental sector may also be expected to contribute to policy but usually in a less prescribed fashion. Market-sector suppliers may be required to provide to explicit minimum standards but they are typically not expected
[ 17 ]
Table 2.2 Policy for market and social renting
Small gap Large gap
Purpose of the sectors Sectors house similar types of households and make similar contributions to housing policy objectives
Sectors house different types of households and make different contributions to housing policy objectives
Allocation systems Similar allocation methods in the two sectors Different allocation methods in the two sectors; possibly market forces in one sector and needs-based in the other
Rent regulation new contracts
Initial rents set according to similar criteria Initial rents set according to very different criteria; possibly with a market rent in one sector and a controlled sub-market rent in the other sector
Rent regulation for rent adjustment
Rent increases occur according to similar criteria
Rent increases occur according to very different criteria; possibly according to market forces in one sector and according to government-imposed regulations in the other sector
Regulation and supervision of landlords
Similar means of ensuring the quality of accommodation and service delivery in the two sectors
Very different means of ensuring the quality of accommodation and service delivery in the two sectors; possibly with very little regulation in one sector and tough regulatory requirements in the other sector
Bricks-and-mortar support
Support available on similar terms in the two sectors
Support available on very different terms in the two sectors; possibly support in one sector but not the other sector
Tax concessions Similar rules on taxation liability apply to all types of landlord
Different taxation liabilities according to type of landlord; possibly with significant tax concessions in one sector and no concessions in the other sector
Housing allowances Income-based and housing cost-based assistance is available on similar terms in the two sectors
Income-based and housing cost-based assistance is available on different terms in the two sectors, or possibly available in one sector but not the other
Socio-economic profiles of tenants
A possible outcome of policy and practice is that there is no clear differentiation in the socio-economic characteristics of tenants in the two sectors
A possible outcome of policy and practice is that there are marked differences in the socio-economic characteristics of tenants in the two sectors
Movements between sectors
A possible outcome of policy and practice is that there are significant movements between the sectors
A possible outcome of policy and practice is that there is very little movement between the sectors

to make as profound a contribution to wider policy objectives as social land-lords. However, if both the social and market sectors are expected to house similar types of households, whether these are from a wide section of the population or from a particular segment – as when, for example, both sec-tors may be expected to make a contribution to housing low-income house-holds – then the gap between the sectors may be deemed small. Where the different sectors have very different and clearly demarcated roles, the gap will be relatively large.
Allocation systemsWhilst, as with the items in Table 2.1, we do not suggest a formula for esti-mating the relative importance of the items in the table, it is clear that the method of allocating rented housing is of crucial importance. Allocation sys-tems are usually the key source of differences between the sectors. This fol-lows from our definition of social housing as housing which is allocated ac-cording to need rather than demand based on ability to pay. In the market sector allocation usually occurs simply according to the forces of demand and supply, with landlords accommodating those households that want mar-ket housing and can afford market rents for their housing. A needs-based sys-tem in one sector and a market-forces system in the other will contribute to a large gap between the sectors. A market-based system involves an element of choice by households. If a needs-based system is moderated by a degree of consumer choice, as can happen under choice-based letting systems (Brown & King, 2005) then the allocation system in the social sector arguably becomes a little more like the system in the market sector and it might be claimed that the gap between sectors is smaller where such systems operate.
Rent controls and regulationsIn Table 2.2 a distinction is made between regulations that govern initial rents at the beginning of rental contracts and regulations on rent increases over time. In principle, government may regulate both of these. The details will be a matter for the contract between the landlord and the tenant, but government is likely to provide a framework within which such contracts can be drawn up. There will also be a policy element to rent setting. Rents in the social sector may be determined according to some sort of formula that re-lates them to costs, the facilities provided, and the popularity of the dwell-ing or even local market rents. Increases may also be related to such items or they could additionally be subject to factors that relate them to changes in cost and price indices. Social-sector rents may be directly related to ten-ants’ incomes and even adjusted when incomes change. Such relationships are unlikely in the market sector. Market-sector rents may be freely deter-mined according to the forces of demand and supply, and this is certainly the case in some countries. However, in other countries there are strict controls
[ 18 ]

on both the initial rents and subsequent rent increases charged by market-sector landlords. The level of these rents may thus be influenced by similar factors to those operating in the social sector, or by completely different con-siderations. There may be a policy objective that links rents in the two sectors or social-sector rents could be lower and unrelated to market levels. If initial rents and rent increases in the two sectors are set according to similar crite-ria, we can argue that this will narrow the gap between the sectors, while if the criteria diverge, the argument is that this contributes to a larger gap be-tween the sectors.
Regulation and supervision of landlordsIn addition to taking a view on the rents charged in each sector, governments usually take an interest in the quality of the housing provided and possibly also the quality of the management service supplied to tenants. For the social sector, special organisations have been created in some countries to regulate and supervise landlords and ensure that they meet specified standards and perform according to government-imposed targets. In other countries, regu-lation can be carried out by municipalities or central government. Regular inspections and audits of landlords may form part of such processes. In the market sector, these processes are typically less bureaucratic but can still in-clude the enforcement of minimum standards and measures to protect ten-ants from exploitation by landlords. In principle, it is possible for the regu-latory and supervision regimes to be similar in the two sectors, or even for there to be one system that covers both sectors. Similarity in regulatory pro-cesses can be seen to contribute to a smaller gap between the sectors and dif-ferent processes to contribute to a larger gap.
Subsidies – object and subjectIn an economic sense, the term subsidy is interpreted broadly to include any measure instigated by government that reduces the cost of providing or con-suming housing to below what it would otherwise have been (Haffner & Ox-ley, 1999). The means of achieving this can include an explicit or an implicit flow of funds. In the former case, grants and low-cost loans may be provided by governments. In the latter, tax concessions and loan guarantees can re-duce suppliers’ expenses, thereby also reducing consumers’ outgoings. Social housing suppliers may also have access to land at sub-market prices from the public sector, or be entitled to receive low-cost land or buildings from the pri-vate sector as a consequence of the delivery of affordable housing through the planning system (Gallent & Tewdwr-Jones, 2007). Last but not least, rent regulation can be considered to constitute a form of subsidy for the consumer (Gardiner et al., 1995; Gibb & Whitehead, 2007; Haffner & Oxley, 1999; Ter Rele & Van Steen, 2001).
Rather than engaging in the complex arguments about alternative defini-
[ 19 ]

tions and measurements of subsidies, we will take a straightforward approach and make the usual distinction between object or supply subsidies that are paid to suppliers and subject or personal subsidies that are paid to house-holds. In Table 2.2 we include two major forms of object subsidies (bricks-and-mortar support and tax concessions) and the principal form of subject subsidy that is used to support tenants (housing allowances). In practice, each subsidy comes with conditions attached and it is thus appropriate to use the terms ‘conditional object subsidies’ and ‘conditional subject subsidies’ (Oxley, 2004). The conditions associated with object subsidies can relate to, for example, which types of landlords are eligible for receipt of funds, the rent levels that will be charged for the dwellings concerned and the incomes of the tenants who can occupy such accommodation. Eligibility for housing allowances vary according to the form of tenure that the tenant has and the amount paid is likely to depend on household size, income and rent level. It might also relate to other local economic and housing market conditions, such as incomes and property values. The key issue in Table 2.2 is whether or not the conditions governing eligibility and the size of the subsidy are similar or different in the social and the market sectors. Similar conditions will contribute to a smaller gap, while different conditions will contribute to a larger gap.
Socio-economic profile of tenantsOne outcome of the policies regarding allocation, rent regulation and subsi-dies will be the type of households who live in social and market housing. Are social tenants very different in terms of income, benefit-dependency, age and other social and economic characteristics? Or are they similar? If policy clearly segregates access to the sectors according to such criteria, it is prob-able that they will be very different. If on the other hand the social rented sector is large, and access to the sector is open to a large proportion of the population, while the private rented sector is also large and caters for a wide range of household types, there will be less segregation according to the so-cio-economic characteristics of tenants. Small differences in tenant profiles could be taken as evidence of a smaller gap and large differences as evidence of a larger gap.
Movement between the sectorsAn additional and related consequence of policy will be the amount of move-ment of households between the two sectors. If allocation policies result in very different household types in each sector and over time there is little change in individual household circumstances relative to the rest of the pop-ulation, it can be expected that tenants of social housing will tend to stay in social housing, while tenants of market housing will remain in market hous-ing. Segregating by allocation and by household circumstances would suggest a limited amount of movement between the tenures. A further complication
[ 20 ]

may be the opportunity, or lack of it, to move into owner-occupied housing. Barriers to home ownership may cause households either to stay in their cur-rent rental tenure or move to the other rental tenure, depending on the acces-sibility of the other tenure. As a general rule, very little movement of house-holds between social and market rented housing may be associated with a large gap between the sectors and a good deal of movement associated with a small gap between the sectors.
2.4 Differences in the degree of competition: a theoretical framework
As we have argued, the gap – and more precisely an empirical observation of a similarity or difference in ‘who provides what’ and ‘policy’ – between the social and the market rented sectors has been the starting point for this text. On the basis of this approach, it is possible to describe the differences be-tween the two rented sectors in a country in terms of a smaller or larger gap. This leads us to two further questions. What do certain differences tell us about the position of the rented sectors in relation to each other? Is it possi-ble to consider the empirical information about the relationship between the sectors within a theoretical framework?
From Kemeny to competitionOne of the conceptual frameworks that facilitate analysis of the relationships between social and market rented housing, is based on Kemeny’s distinction between (integrated) unitary and dualist rented systems (Kemeny 1995; Ke-meny et al., 2005). The main difference between these systems is the degree of competition between the forms of tenure. Although Kemeny’s work uses the term ‘competition’, the meaning of competition is not explored in depth. In unitary systems, non-profit landlords compete with profit-making provid-ers while in the dualist rental systems there is a separation that prevents such competition. In Kemeny (1995), there is no distinction between unitary and integrated rental markets. However, in Kemeny et al. (2005) unitary rental markets are defined as arrangements where ground rules facilitate and en-able competition between profit and non-profit renting, and integrated rental markets are defined as systems in which non-profit rental organisations are sufficiently established to compete effectively with profit-renting “without the need for invasive regulation or being given either special protection or special responsibilities” (ibid, p. 856). In a unitary market, there is competition between profit and non-profit renting with the aid of strong state support for non-profits. In an integrated market, meanwhile, competition exists without this level of intervention. What this competition actually involves, however, is not examined in any detail. We concluded that in order to understand the gap,
[ 21 ]

we needed to develop a framework of competition which considers its mean-ing in some depth. Such a framework applied to housing is based on the theo-ry of the firm and developed in earlier work (Oxley et al., 2007, 2008; Elsinga et al., 2007a). Economic theories of competition will allow us to explore the idea of a gap between the forms of tenure based on the degree of competitiveness between the sectors. The less competition there is between the sectors, the larger the gap and vice versa; with a high level of competitiveness the gap will be smaller.
The meaning of competitionIn a competitive market, rival consumers and producers together create the supply and demand that determine prices (McNulty, 1968; Stigler, 1972). Price performs an important function in allocating resources in such markets. Economists agree that competition involves ‘rivalry’ (Vickers, 1995),3 which implies that two or more entities are striving for something that they can-not both obtain. There are rewards for the winners and penalties for the los-ers. In neo-classical economics, rivalry between firms is fed by the desire to make profits. In alternative economic paradigms the motivation is to maxi-mise market share, sales, or the well-being of the managers or owners of the enterprise. A competitive framework involves incentives and risks and organi-sations that are trying to win something such as financial rewards, accolades for good results according to performance indicators or the satisfaction of be-ing placed at or near the top of a league table. Competitive firms are rivals for customers, which means that the goods and services that are supplied must be perceived by consumers as satisfactory alternatives or substitutes. From the consumers’ point of view, the degree of substitutability between alterna-tive items is important in determining the degree of choice they have and therefore the level of competition. In summary, where there is competition there is rivalry, risk, reward, choice and substitutability.
Competition and rented housingThere are three distinctive types of competition that can be identified within rented housing. They are competition within market rented housing, competi-tion within social rented housing and competition between social and market rented housing.
Within market rented housing, rival suppliers offer housing to consumers
3 If we consider the distributional perspective of competition. Hayek’s (2002) interpretation of competi-
tion being important primarily as a ‘discovery procedure’ in order to be able to improve the situation is a
view that is not further taken into account here. This also applies to the propositions of Schumpeter about
whether concentration and market power promote innovation and consumer welfare (Katz & Shelanski,
2005).
[ 22 ]

who make choices between options that they view as substitutes. Rents per-form an allocative function and who obtains which housing is a matter for decisions made by landlords and tenants primarily on the basis of financial considerations.
It is, in principle, possible for there to be competition within social housing. The rivalry in a competitive situation within social housing is not, however, present in a market framework. It is possible for potential consumers and sup-pliers to be rivals. However, given that allocation occurs on the basis of need, rather than as a function of prices and demand, it is impossible for there to be a market and therefore impossible for there to be competitive markets. From the consumer’s point of view, there will be more competition in social housing if they have more choice and if these choices are between genuine-ly substitutable items. From the supplier’s point of view, they will face more competition when there is a greater number of rivals in an area; the easier it will be for new rivals to set up in the area, the more the supply on offer, and the more the supply there is on offer relative to the need, meaning that the smaller the shortage of social housing, and the greater the rewards/penalties for delivery/non-delivery.
In line with the focus in this book, the principal concern here is with com-petition between social and market rented housing. This could be considered impossible, if social and market rented housing were two different products allocated by different sectors and by different means. The two types of hous-ing would then be separate and there could be no substitutability between them and no rivalry between suppliers. However, once we consider the price/quality bundles that consumers are prepared to consider and the possibility of substitution between these bundles, we are able to operationalise a con-cept of competition.
The substitutability of price/quality bundles of housing servicesThe range of quality and rents in each sector will influence the substitutability of the options. Thus, as shown in Figure 2.1, the relationship between the social housing offer curve (AB) and the long-term market supply curve (SS) is crucial, as are the eligibility and allocation criteria for social housing. If both the mar-ket and the social sector offer a wide range of quality, there is the possibility of more substitutability, and thus more competition, between the sectors. Con-sumers who meet social housing eligibility criteria may consider market offers to be acceptable substitutes if they provide either lower quality at lower rents or higher quality at higher rents, as the examples in Figure 2.1 suggest. The ability of social housing to compete with the market sector is highly dependent on the income criteria used for social housing. If only low-income households are eligible for social housing, the possibility of competition at the higher-qual-ity and higher-rent end of the spectrum will be reduced compared to a situa-tion where higher-income households are also eligible for social housing.
[ 23 ]
Several specifics of subsidy and allocation systems will influence the rela-tive attractiveness of housing bundles on offer. In particular, housing allow-ances, waiting lists and security of tenure can all influence the substitutabil-ity of the options available to households. The receipt of a housing allowance reduces the price of a given option to the consumer. If allowances are only available for dwellings supplied by social housing organisations, or are avail-able on different terms to those that apply to market housing, this can influ-ence substitutability and thus the relative competitiveness of social and mar-ket housing. Where waiting lists are important in allocating social housing, a lengthy period on the waiting list may be seen as reducing the attractiveness of a social housing option and increasing the relative attractiveness of a mar-ket-sector alternative. If dwellings supplied by social housing suppliers come with much greater security of tenure than those supplied by market providers, this may increase the attractiveness of the social rented option.
The rivalry between suppliers of rented housing servicesWhenever consumers perceive certain bundles of housing services as reason-able substitutes, the flipside of this is that the suppliers of these bundles be-come rivals in offering these bundles. If both the market and the social sector offer a wide range of quality, there is a possibility of more rivalry between the sectors (imagine AB in Figure 2.1 ‘stretched’ to the left and to the right). If the social sector offers high-quality housing rather than only lower-quali-ty options, this will increase the potential for rivalry with market housing at the ‘top’ end of the market. One can also consider a situation in which the social sector does not offer any low-quality housing, but rather offers medi-um-quality housing at much lower rents than the market sector but has rents that rise very sharply as quality increases (imagine AB rising more steeply). In this case, the social sector may be able to compete so well in medium-quality housing that low-quality housing offered in the market sector becomes un-competitive and low-quality landlords go out of business. For higher-quality accommodation, the market sector will however continue to compete effec-tively with social housing and (as in the scenario depicted in Figure 2.1) be-yond a given quality level it will only be possible to find rented housing in the market sector.
Contract models: rivalry between suppliersA contract model may promote rivalry between suppliers. Maclennan & More (1997) suggest that there are, in principle, two models for the provision of so-cial housing. In one, the standard model, particular types of landlords with non-profit objectives are funded and regulated as suppliers of social housing. In the other, the market produces housing but a ‘state-agent’ secures vacan-cies of an acceptable quality and makes them available to applicants on a waiting list. In this ‘state-agent’ model, the production and pricing of dwell-
[ 24 ]

ings is left to market forces and contracts between the state-agent and the landlord prescribe subsidies in return for the provision of housing to tenants who contribute according to their incomes. It is argued that the major merit of this approach is that it generates market incentives and signals in the pro-duction of homes and services and supply-side subsidies are well-targeted. Efficient production and good targeting could also result in the more efficient use of housing allowances.
Taking a broader view than that adopted by Maclennan and More, the state-agent approach can be seen as one version of a ‘contract approach’ to the provision of social housing. Under this approach, an organisation separate from central or local government has a contract with the state to provide and manage social housing in return for payments from, or authorised by, cen-tral or local government. This contract may be ‘permanent’, as long as certain conditions in the contract are met or it may be ‘temporary’ in the sense of
[ 25 ]
Figure 2.1 Rents, quality, market and social housingRe
nts/
pric
e (e
uros
per
mon
th)
SS = Market supply curveAB = Social housing offer curve
All social housing has a quality of between 50 and 75 pointsSocial housing rents are below market rents and range from 300 to 450 euros per month
For a low income household, A and X are acceptable substitutesFor a medium income household, A and Y are acceptable substitutesFor a low income household, B and Z are acceptable substitutes
Housing quality (points)
S
X
A
B
Y
ZS
10 20 30 40 50 60 70 80 90
800
900
0
100
200
300
400
500
600
700
Source: Oxley et al. (2007)
being time-limited and providing certain rewards or giving certain rights only until a specified date. In this case, we can talk of the provider having a ‘con-cession’ to provide housing.
The housing stock that is to be provided socially may be owned by the con-tracted organisation or by central or local government. The contract may thus be a contract to supply and manage or simply a contract to manage. Those bodies eligible to engage in contracts and the method by which the contracts are allocated impact on the degree of rivalry between suppliers. If suppliers of both social and market housing are eligible to bid for contracts, there will be rivalry between types of organisations for the award of contracts to offer social housing. If contracts are reserved for institutions that have a certain accepted legal or regulatory status which separates them from market suppli-ers, a contract system will not in itself promote rivalry between market and social providers.
Substitutability interpreted as the gap between social and market housingFor substitutability to be possible, tenants must be able to express effective choices between the two sectors. In our interpretation of the degree of the substitutability of bundles of housing services for consumers, we are ana-lysing the dimensions that Table 2.3 shows. The rent level and quality of the accommodation in a wider sense (dwelling and neighbourhood) are the first two aspects that we view as contributing to the substitutability of housing for the consumer. The relationship between the rent to be paid and the quality of housing should follow a similar pattern in each sector. The closeness of the rent/quality relationship, as depicted by SS and AB in Figure 2.1, is an impor-tant indicator of the probability of a high level of substitutability. The wider the range of options offered in the social sector (and thus the longer AB is), the smaller the price-quality gap, and the greater the likelihood that accept-able substitutes to the market sector will be available.4 If there is complete segregation between social and market rented housing with the former offer-ing low-quality accommodation in poor neighbourhoods and the latter offer-ing high-quality housing in pleasant locations, the degree of substitutability will be low and the gap will be large.
The property rights that are associated with a certain form of housing are another aspect of its quality. They will also contribute to higher or lower sub-stitutability. If the ongoing tenancy conditions are markedly different, the rel-ative attractiveness of the options will be different, and the substitutability gap will be large. This is the case when the social sector offers a high degree
4 For alternative housing offers to be substitutable from the consumer’s viewpoint, they must relate to
locations that the household is prepared to choose between, as mentioned above. Geography is therefore
important in housing substitutability, although it is not included in Table 2.3.
[ 26 ]

of long-term security while the market sector offers limited security with the possibility of eviction after short periods of time. There will also be a gap when the social rented sector offers a right to buy or a rent surcharge when income rises above a certain level, while the market rented sector does not.
Rent regulation, dwelling allocation and access to housing allowances will also influence substitutability between tenures. The allocation system is cru-cial to the ability of tenants to choose between tenures. If only low-income households are eligible for social housing, the possibility of prospective social tenants choosing a market-sector alternative will be small unless low-rent options are available in the market sector. Also, the possibility of competition at the high-quality and higher-rent end of the spectrum would be reduced compared with a situation in which higher-income households are also eli-gible for social housing.
In conclusion, small gaps for the various aspects of substitutability be-tween the two rented sectors would suggest a high degree of competition be-tween the tenures, whereas large gaps would suggest a low level of substitut-ability and competition between the tenures.
Rivalry interpreted as the gap between social and market housingParallel to Table 2.3, which shows our conditions for identifying the degree of
[ 27 ]
Table 2.3 Substitutability between market and social renting and the concept of a gap*
Competitive: small gap Uncompetitive: large gap
Accommodation
Quality and quality/rent relationship
Similar range of quality (accommodation and neighbourhoods) and similar quality/rent relationships in both sectors
Different and distinctive quality (accommodation and neighbourhoods) and different quality/rent relationships in the two sectors
Property rights
Rent regulation Similar processes determine rent levels and rent increases in both sectors
Highly regulated rents in the social sector and no regulation of rents in the market sector
Tenant security Security of tenure is very similar in both sectors (could be strong in both sectors or weak in both sectors)
Security of tenure is very different between the two sectors. Possibility of very strong security of tenure for tenants in the social sector and very weak security of tenure in the market sector
Right to buy Little difference in the opportunity for tenants to purchase in the two sectors
The opportunity to buy exists in one sector but not the other.Social sector is likely to have a right to buy
Allocation systemand choice between tenures
Social sector is intended to house a wide range of households. It is not intended to be confined to households on the lowest incomes and in the greatest need
Social sector is intended to meet only the needs of households who cannot house themselves in the market sector. Market sector is open only to those who can afford this option
Housing allowances Housing allowances are available on a similar basis in both sectors. The system does not discriminate between the two types of household
The terms on which housing allowances are available differ between the sectors. In extreme cases, they may be available in one sector but not the other
* The larger the gap, the smaller the likelihood of substitution from the consumer’s perspective.

substitutability between both rented tenures, Table 2.4 shows our conditions for identifying the degree of rivalry between landlords, and thus the degree of competition on this aspect. From the perspective of landlords, the degree of rivalry between suppliers in the two sectors is the key to the size of the gap. This will be reflected in the motives of providers in each sector, the quality of the product on offer and the extent to which they follow market signals in providing (subsidised) rented housing.
Similarities in motives for investing in housing, characteristics of the prod-uct bundle and allocation practice will indicate a small gap between the two rented tenures, suggesting a high likelihood of rivalry/competition between both the rented sectors.
Another condition that may indicate a high level of rivalry among land-lords is summarised under the entry of contracts in Table 2.4. Governments may explicitly decide to promote rivalry between social and market provid-ers by instituting contract methods that allow a variety of organisations to engage in contracts to supply social housing. These contracts allow for rivalry between landlords for the subsidies associated with supplying social housing. In such cases, rivalry will then lead to a greater supply of social rented dwell-ings on offer (see above).
In conclusion, a small gap between the rented sectors in the rivalry be-tween the landlords of both tenures would suggest a high degree of competi-tion between both tenures, whereas a large gap would suggest a low level of rivalry and competition.
Competition interpreted as the gap between social and market housingThe differences in the various aspects that constitute the competition gap be-tween social housing and market housing can be viewed principally as a fea-ture of the degree of competition between the two forms of rented housing.
[ 28 ]
Table 2.4 Rivalry between market and social renting and the concept of a gap*
Competitive: small gap Uncompetitive: large gap
Motives of landlord Landlords in both sectors have similar motives
Landlords have different motives in the two sectors. In one they seek to maximise profits and in the other they do not make profits
Product characteristics Similar products are supplied in the two sectors. The price/quality of the accommodation and the neighbourhoods in which it is located are similar
Different sorts of products with different levels of price/quality in the two sectors
Allocation schemeand customer base
Policy and practice allows a wide range of households to be accommodated in both sectors. Similar households seek accommodation in the two sectors. The customers of the two sectors are thus similar
Policy and practice segregates households into those which are the customers of social housing providers and those who are not. The customers of the two sectors are thus different
Rivalry for contracts to provide social rented dwellings
Profit and non-profit organisations can bid for contracts to provide social rented housing
Only non-profit organisations can bid for contracts to provide social rented housing
* The larger the gap the smaller the likelihood of rivalry from the landlord’s perspective.

We differentiate between two concepts of competition: substitutability be-tween tenures and rivalry between the landlords of the tenures. There will be a high degree of competition between social and market renting when con-sumers see the two forms of housing as good substitutes and the suppliers in both sectors are rivals. The gap between the two tenures will then be small. When there is a low level of competition, social and market housing are poor substitutes; suppliers are not rivals because they are in different ‘markets’ supplying different products.
2.5 Bridging the gap between social and market renting?
Having set out several ways of describing and analysing the gap between so-cial and market housing, the next question that arises is: what do we mean by ‘bridging the gap’? We suggest that the concept of bridging the gap might be seen in three ways: a. Reducing the differences between the sectors according to the items in
Sections 2.2 and 2.3;b. Promoting more competition between the sectors through greater substi-
tutability and greater rivalry as described in Section 2.4;c. Developing an intermediate form of tenure.
a. Reducing the differences between the sectors according to the items in Sections 2.2 and 2.3Measures that make the two sectors resemble one another more closely in terms of the types of landlord operating in each sector, the housing they provide and government policies towards the sectors will all bridge the gap between social and market rented housing. This amounts to closing the gap through changes that allow similar organisations to provide both types of housing and policies that are more ‘tenure neutral’ (Haffner, 2003; Thalmann, 2007) in their approach to rent setting, regulation and subsidisation. Basically, the more circumstances are better described by the characterisation in the
‘small gap’ column in Tables 2.1 and 2.2 and the less by the wording in the ‘large gap’ column, the more the gap will have been bridged. One can imag-ine a number of measures, including opening up support to all types of pro-viders and unifying the rent-setting and regulation processes that could con-tribute to bridging the gap, but at the same time giving the social sector a distinctive social task to perform – principally that of housing lower-income households. However, if moves towards increasing the similarity between the sectors include the allocation system, ultimately the two rented housing sec-tors would come to resemble one single sector in terms of who is housed and how housing is allocated. Unless all rented housing is allocated according to
[ 29 ]

need, the unifying measure will in principle be that market forces allocate all rented housing. The distinction between the sectors would be removed and the ‘bridging’ effectively means that social housing as a distinct entity would cease to exist (King, 2006). In this scenario, subject subsidies would be left as the means by which low-income households would be supported and object subsidies would either not exist or would not involve any conditions about who occupies the supported dwellings. In other words, they are geared to-wards the general support of housing supply rather than a category of hous-ing called ‘social housing’.
b. Promoting more competition between the sectors through more substitutability and more rivalry as described in Section 2.4 In Section 2.4, we presented a framework for examining the relationship between social and market housing using the concept of competition. Tak-ing this approach, bridging the gap can effectively be seen as involving pro-cesses that make the two sectors more competitive or, if the assumption is that the market sector is already competitive, make the social sector more competitive. This means that with the gap bridged, from the household’s per-spective there will be an increase in the substitutability of social and market housing and from the landlord’s perspective there will be more rivalry with landlords in the other sector. More rivalry between social-sector and market-sector landlords could come about as a result of both types of landlord being able to bid against one another for the receipt of subsidies to supply social housing. Alternatively, the government could use a contract approach more generally to widen the types of social housing landlords by making contracts available to a range of organisations. With the gap bridged, the relationship between the sectors comes to resemble more that described in the competi-tive columns in Tables 2.3 and 2.4, and less like that described in the uncom-petitive columns. More choice between the sectors for consumers and more opportunities for landlords to supply to both sectors could conceivably come about while an allocation system continued to operate mainly on the basis of need in the social sector. However, more substitutability from the tenant’s viewpoint would ultimately require an increased chance of being housed in either sector as the result of an allocation system that gives prospective ten-ants access to both sectors. The allocation system is also the key to whether or not landlords have access to a distinct and segregated customer base or whether they are able to access a broader customer base.
c. Developing an intermediate tenureAnother way to bridge the gap between two tenures would be to create a new form of tenure with some of the characteristics of both the other tenures. Such an intermediate sector could, for example, be designed to accommo-date households with incomes higher than those in the social rented sector
[ 30 ]

but lower than those in the market sector. Average rent levels in this sector could be somewhere between those in the other sectors and allocation, whilst needs-based, could address the needs of a different group to those housed in the social sector. Subsidies in this sector may be somewhat lower than in the social sector. An intermediate rental sector would not house the most vulnerable in society, for whom the term ‘very social housing’ has been used to describe accommodation aimed at their particular needs. It does, however, perform a different function than an intermediate sector that is essentially a type of low-cost home ownership (Whitehead & Scanlon, 2007, p. 7). This latter form of intermediate housing is more about bridging the gap between social housing and home ownership than the gap between social and market renting. What the two forms of intermediate housing have in common is that their purpose is to cater for the group within society that is not in the great-est need, but will still struggle to find suitable housing in the market sector of the economy. Intermediate rental housing can in principle provide a means to bridge the renting gap by offering housing that is more subsidised and less expensive housing than market-sector housing, but less subsidised and more expensive than social-sector housing.
2.6 Returning to the gap
In the final chapter of this book, we will return to both the gap and the sub-ject of bridging the gap with evidence from our six countries. In the country chapters, the theoretical framework we have set out in this chapter will help to explain how the tenures work and the consequences for each tenure, but most importantly the theory will lend a structure to our descriptions of the tenures and help to explain the relationships between social and market rent-ing in each country. In the final chapter, the theory will facilitate an analysis of the differences in these relationships between countries. We will then be able to make some suggestions about the connection (or lack of it) between our approach and the dualist/unitary approach as presented by Kemeny.
As we examine each country, we will look for evidence of the gap and of moves that may affect this gap. In the country chapters, there will be an ex-amination of the differences between and the similarities in social and mar-ket renting and, in the final chapter, the differences between and the simi-larities in the countries in terms of the relationships between the two sectors will be summarised. We will in effect discuss the boundary between the so-cial and market rented sectors. We will synthesise the material on the gap in the six countries and summarise the nature and extent of this gap by dealing with each component of Tables 2.1 and 2.2 in turn. We will also consider our indicators of competition and discuss their application in the six countries. The components will be summarised in terms of the concepts of substitut-
[ 31 ]

ability of price/quantity bundles of housing services and the rivalry among the landlords in the rented sector. The analysis will thus involve an examina-tion of the extent to which tenants can choose between the two sectors and the extent to which suppliers in each sector operate in similar or different markets. The purpose, organisation, regulation, financing and subsidisation of social and market housing in the different countries will be compared. We will also summarise the different models of providing social housing, includ-ing non-profits and various forms of contract models (as explained in Section 2.5). Finally, in the light of the evidence provided, some comments about the merits of our approach will be provided.
[ 32 ]

3 England
3.1 Introduction
3.1.1 England within the UK
Within the UK, England, Wales, Scotland, and Northern Ireland have differ-ent political and administrative arrangements for housing policy and housing provision. The Department for Communities and Local Government (DCLG) is responsible for housing policy and for national policy on local government in England. The DCLG oversees the implementation of the policy initiatives set out in Section 1.4. In Scotland, devolved powers mean that the Scottish Executive is responsible for housing policy. In Wales the Welsh Assembly is responsible and in Northern Ireland the Department for Social Development. The Tenant Services Authority (TSA) is the main regulatory body for Housing Associations or Registered Social Landlords in England. These functions are performed by other bodies in the rest of the UK.
Although the policy goals and the principal instruments do not vary sub-stantially between the constituent parts of the UK, the variation in national responsibilities and administrative and governance responsibilities mean that there are some differences in the housing systems between the coun-tries. Rather than dwell on these differences and the associated variations in legislation, administration and terminology, this chapter concentrates on the arrangements in England.
Official housing statistics vary notoriously in their coverage from the con-stituent countries to the whole of the UK with data sets frequently covering England and Wales or Great Britain (thus excluding Northern Ireland from the UK coverage). In order that the position of England within the UK can be put into context, summary data on housing stock in the UK and each of the constituent countries is presented in Table 3.1. Around 83% of the UK housing stock is in England. Whilst around 30% of the UK housing stock is rented this varies between the constituent countries from around 26% to 34%. Around 17% to 26% of the stock is social rented housing supplied by housing associa-tions or local authorities (in Northern Ireland, former local authority housing is managed by the Northern Ireland Housing Executive). Most of the subse-quent data relates to England and some relates to the UK or Great Britain. The distinction will be made at appropriate points in the text.
3.1.2 Political and administrative responsibilities in England
In England, central government sets the framework for national housing poli-cy, which is implemented by Local Housing Authorities (LHAs), and, until 2009, by the Housing Corporation (HC). The HC’s regulatory responsibilities now rest with the new TSA and its investment powers have been taken over by the new
[ 33 ]

Homes and Communities Agency. The Homes and Communities Agency is re-sponsible for a national programme of investment in social housing and has a broad remit to promote regeneration and house building. The National Afford-
[ 34 ]
Table 3.1 Distribution (in percentages) of the housing stock in the United Kingdom by country and type of ownership, various years
1981 1990 2000 2005% of UK stock
2005
England
Market lettings 11.3 9.7 10.3 11.3
Housing associations 2.3 3.1 6.6 8.3
Council housing 28.1 20.1 13.6 9.9
Owner-occupied 58.2 62.2 69.6 70.4
Housing stock (x 1,000) 18,025 19,634 21,096 21,804 83.2
Scotland
Market lettings 9.7 6.0 6.7 7.5
Housing associations 7.8 3.1 6.2 10.5
Council housing 52.1 39.8 24.0 15.8
Owner-occupied 36.4 51.2 63.1 66.3
Housing stock (x 1,000) 1,970 2,124 2,325 2,389 9.1
Wales
Market lettings 9.4 7.8 8.6 8.8
Housing associations 1.1 2.3 4.1 5.0
Council housing 26.9 19.4 15.1 12.1
Owner-occupied 62.6 70.8 72.2 74.0
Housing stock (x 1,000) 1,089 1,169 1,272 1,306 5.0
Northern Ireland
Market lettings 7.6 3.9 5.2 9.6
Housing associations 0.5 1.6 3.0 3.2
NIHE* 37.9 29.2 19.3 14.5
Owner-occupied 54.0 65.3 72.6 72.4
Housing stock (x 1,000) 502 537 610 695 2.7
United Kingdom
Market lettings 11.0 9.1 9.8 10.8
Housing associations 2.2 3.0 6.3 8.2
Council housing 30.4 22.0 14.7 10.7
Owner-occupied 56.4 65.8 69.2 70.3
Housing stock (x 1,000) 21,568 23,476 25,303 26,194 100
Sources: Goodlad & Atkinson (2004) and Housing Statistics, DCLG (www.communities.gov.uk) for 2005 data
* Northern Ireland Housing Executive.

able Housing Programme (formerly the Approved Development Programme) promotes new building and renovation by housing associations. The Agency is expected to help deliver three million new dwellings across all tenures by 2020.
In each of the nine government regions of England, Regional Housing Boards (RHBs) were established as a consequence of the Communities Plan (see below), which was published in 2003. Their role was to ensure that hous-ing policies are properly integrated into regional spatial, transport, economic and sustainable development strategies and to ensure the delivery of the poli-cies in the Communities Plan. The role of the Boards was to identify region-al strategic housing priorities through the production of a regional housing strategy and advise the DCLG on the allocation of public funds to meet these housing priorities. The RHBs were chaired by the Director of the Government Office for the Region and included representatives of local authorities, vari-ous regional agencies, English Partnerships (which was a governmental body responsible for regeneration; its powers now lie with the Homes and Com-munities Agency) and the Housing Corporation. These responsibilities were transferred to Regional Assemblies in 2006, and in 2009 will be moved to Re-gional Development Agencies, which have an overview of housing and plan-ning functions as well as the economic prosperity of regions.
The 354 LHAs in England (in 2008) comprise the 36 Metropolitan Authori-ties, the 47 Unitary Shire Counties, the 238 District Councils and the 33 Lon-don Boroughs. A further 34 County Councils, which are part of a ‘two-tier’ lo-cal government structure with District Councils, have no statutory housing responsibilities. The LHAs are expected to draw up a housing strategy for their area based on an assessment of local housing needs. These needs are to be met by the market sector, including the market rented sector and owner oc-cupation, and by the social rented sector, including housing associations and council housing. Some councils continue to own and manage council housing. Others have handed these management responsibilities to Arms Length Man-agement Organisations (ALMOs), or have transferred the ownership and man-agement to housing associations. In relation to market rented housing, the LHAs have some limited powers of regulation and licensing to ensure mini-mum standards.
3.2 Housing stock
3.2.1 Definition of the components of the rented sector
Rented housing in England is distinctly polarised between the social and market rented sectors. Social rented housing comprised 18% of the housing stock in 2005. As shown in Table 3.1, the main suppliers of this housing were
[ 35 ]
local authorities (10% of the stock) and housing associations (8% of the stock). In England, Arms Length Management Organisations (ALMOs) run around 50% of council housing. Where ALMOs are in place, the local council retains ownership of the stock but management is in the hands of a new company that has a board of councillors, tenants and independent persons. Housing associations (HAs) are non-profit organisations run by voluntary committees. Some are registered as charities. For regulation purposes and in order to ob-tain various rights and privileges, a housing association must be a Registered Social Landlord (RSL) registered with the TSA. Many housing associations op-erate within a group structure where a registered parent oversees a number of subsidiaries under a single group umbrella. Some unregistered subsidiar-ies operate commercially within the wider housing market. Since 2004, it has been possible for approved market-sector bodies that are not RSLs to obtain finance from the Housing Corporation, and now the Homes and Communities Agency, for the development and management of housing, which like that supplied by other social housing suppliers, is provided at sub-market rents and intended for people ‘in need’ as defined by local and national policies.
This housing is not yet sufficiently significant to feature in the statistics. An official definition, allowing for the existence of ALMOs and these new mar-ket-sector suppliers, states: “Social rented housing is rented housing owned and managed by local authorities and RSLs, for which guideline target rents are determined through the national rent regime.…It may also include rented housing owned or managed by other persons and provided under equivalent rental arrangements to the above, as agreed with the local authority or with the Housing Corporation as a condition of grant” (DCLG, 2006, p. 9). The dis-cussion of social housing organisations in this chapter focuses on local au-thority housing, ALMOs and housing associations but also acknowledges the development of the new market-sector suppliers.
In official data, market rented housing includes all rented housing other than that rented from councils and housing associations. In 2005, this com-prised around 11% of the housing stock. It includes accommodation tied to jobs, such as tenanted farms and shops, and dwellings supplied by the armed forces and health authorities as well as student housing and accommodation provided rent-free or to relatives. 15% of all market tenancies in 2003/4 were ‘not accessible to the public’, typically let to employees or friends or relatives of the landlord, over half of whom were living rent-free (ODPM, 2005b, p. 16). It is thus a very diverse category and includes more than housing rented for profit by individuals and companies. Estimates for the whole of the UK us-ing 2001 census data suggest that only about 80% of the market rented sec-tor was overtly traded in the sense of being provided through a market land-lord or letting agency. Around 10% was linked to employment and about 10% consisted of accommodation supplied by a relative or friend. There were also large regional variations in the size of the sector within England. In London
[ 36 ]

16.4% of households rented privately whereas the figure for the North East of England was 8.1% (Rhodes, 2006).
3.2.2 Description of the housing stock
The changing importance of rented housing is a reflection of the growth of home ownership. The volume of rented housing has fallen considerably in re-cent years. As Table 3.1 shows, in 1981 about 42% of the housing stock was rented and by 2005 this was down to 29%, while owner occupation grew from 58% to 71% of the stock. The growth of home ownership and the decline of rented housing reflect consumer preferences, the changing availability of funds for house purchase and government policy. A majority of households aspire to be homeowners. Home ownership involves acquiring an asset with clear tax advantages (despite the abolition of mortgage interest tax relief; see Section 3.4). Home ownership has expanded in the past thirty years as mort-gage markets have become more liberalised, making credit for house purchas-es easier to obtain and lowering the equity required for purchase. Government policy has favoured home ownership through both the Right to Buy scheme and fiscal advantages. Government is also seeking to expand owner occupa-tion amongst lower-income groups through new forms of low-cost home own-ership and equity sharing. These points will be expanded in Section 3.4.
Having fallen over the long run, (from 50% in 1951 and 31% in 1961) the market rented sector has stabilised at around 11% in the last two decades. Es-timates suggest that in 2001, 65% of market-sector lettings in England were by market individual/couple landlords, 5% by partnerships, 13% by companies and 17% by other organisations such as charities, government departments and educational establishments (Kemp, 2004). Crook et al. (2000) distinguish between the following categories of landlords: (the proportion of lettings they were found to be responsible for are shown in brackets) Business Land-lords (15%), who obtain most of their income from market letting and view their properties as a commercial investment, Sideline Investor Landlords (45%), who obtain a minority of their income from market renting but view their properties as a commercial investment, Sideline Non-Investor Landlords (18%), who obtain a minority of their income from letting and do not view their properties primarily as an investment, and Institutional Landlords (22%), that are corporate organisations who obtain a minority of their income from letting and do not regard their properties primarily as investments. Over half of all market renting portfolios consisted of less than four properties and only 13% of portfolios had more than 100 dwellings (Kemp, 2004).
Council housing, owned and managed by local authorities for the benefit of local households, who have been unable to compete in the market-sector housing market as owners or tenants, has for many years been the main form of social rented housing. There has been a significant decline in coun-
[ 37 ]

cil housing with 28% of the stock rented from local authorities in 1981, 20% in 1990 and 10% in 2005. The losses from the local authority sector occurred through the Right to Buy, which, since 1980, has allowed sitting tenants to purchase their homes at a discount and become homeowners, and the trans-fer of dwellings to housing associations. This has included Large-Scale Vol-untary Transfers (LSVT) whereby housing associations have taken over stock that was previously owned and managed by local authorities. The position of council housing has changed dramatically not only as a result of the Right to Buy and the growth of housing associations but also more recently by the development of ALMOs. The first ALMOs were established in 2002. There are currently 70 ALMOs in operation in England, in 66 local authorities, manag-ing over one million council homes. This is approximately half of all council properties. This housing remains in the ownership of the local authority, and the tenancy contracts are with the council, but the ALMO deals with the col-lection of rent, maintenance and management of the properties.
Registered Social Landlords (RSLs) are the main providers of new social housing. There are over 1,800 RSLs in England, managing around 1.8 million dwellings. ‘Registered Social Landlord’ is the technical name for a social land-lord who is registered with the TSA (or in the other parts of the UK, the re-sponsible body). Most RSLs are housing associations, but there are also trusts, co-operatives and companies. Housing associations’ share of the social rent-ed stock has increased markedly in recent years. It has grown from around 8% of the social rented stock in 1981 to 46% in 2005. Associations are run as businesses but they do not trade for profit. Any surplus is ploughed back into the organisation to maintain existing homes and to help finance new ones. A majority of RSLs own fewer than 250 dwellings. However, the largest 13% of RSLs – those with 2,500 plus dwellings – own over 80% of the sector’s homes. Many new RSLs have been formed to manage and develop homes transferred to them by local authorities through LSVT. The Department for Communities and Local Government sponsors the Homes and Communities Agency to in-vest public money in RSLs to provide dwellings that meet local needs.
3.2.3 Housing quality
A judgement on the relative quality of the product on offer depends on which criteria are used to judge that quality. According to official data (DCLG, 2008) levels of basic fitness are higher in the social sector where only 4.4% of dwell-ings fail to meet the required standard compared with 9.6% in the market sector. Using a wider definition of ‘decent homes’ which takes account of the state of repairs, the provision of modern facilities and services and thermal comfort, 50% of privately rented dwellings are ‘non-decent’ and 34% are ‘non-decent’ in the social sector. However, surveys of tenant satisfaction with land-lords (ODPM, 2005, pp 48-49) show higher levels of satisfaction with market
[ 38 ]

landlords. They achieve an overall satisfaction rating of 76% compared with 68% for social renters.
Homeowners tend to be both more satisfied with their dwellings and their neighbourhoods than renters.5 (ODPM, 2006, Housing in England 2003/04, Part 4). Homeowners tend to occupy different sorts of dwellings to renters. Around 92% of owners live in a house compared with only 58% of tenants of both so-cial and market landlords. Whereas 41% of social tenants and 37% of market tenants live in a flat this applies to only 7% of owners. Homeowners are more likely to have a garden. 92% have a garden compared with 71% of social rent-ers and 63% of market renters (ODPM, 2005a, Housing in England 2003/04, Part 1).
If the concept of quality is widened to include the environment in which dwellings are situated then measures of the quality of local neighbourhoods are available that take account of ‘upkeep’ problems such as litter, graffiti, vandalism and neglected buildings; ‘traffic’ problems such as noise and air quality and ‘utilisation’ problems associated with the abandonment or intru-sive use of property for non-residential uses (DCLG, 2007a). On this basis so-cial and market tenants are more likely to be living in areas with upkeep and utilisation problems compared to owner occupiers. Tenants who comprise 29% of all households, make up 40% of all who live in poor quality environ-ments (25% social tenants and 15% market tenants). Traffic problems show a different tenure pattern to upkeep and utilisation. Market tenants are more likely to live in areas where there are problems associated with traffic com-pared to both social tenants and owner-occupiers. Social tenants are more likely to suffer from upkeep and utilisation problems than market renters or homeowners.
3.3 Characteristics of tenants
There are marked differences in the socio-economic characteristics of ten-ants in the social and market rented sectors. Some of the key differences are summarised in Table 3.2.
Market-sector tenants tend to be younger than social-sector tenants. More than half of household reference persons in the market sector (51%) were aged under 35 compared to 24% in the social sector. 61% of social-sector household reference persons were aged 45 or over. 36% of social-sector house-hold reference persons were retired compared with 12% in the market rented
5 70% of homeowners agreed strongly that “taking everything into account my current tenure is a good
tenure”. The comparable figure for social renters was 30% and for private renters 10%. Dissatisfaction with
their local area was highest amongst social-sector tenants (ODPM, 2006, Housing in England 2003/04, Part 4).
[ 39 ]
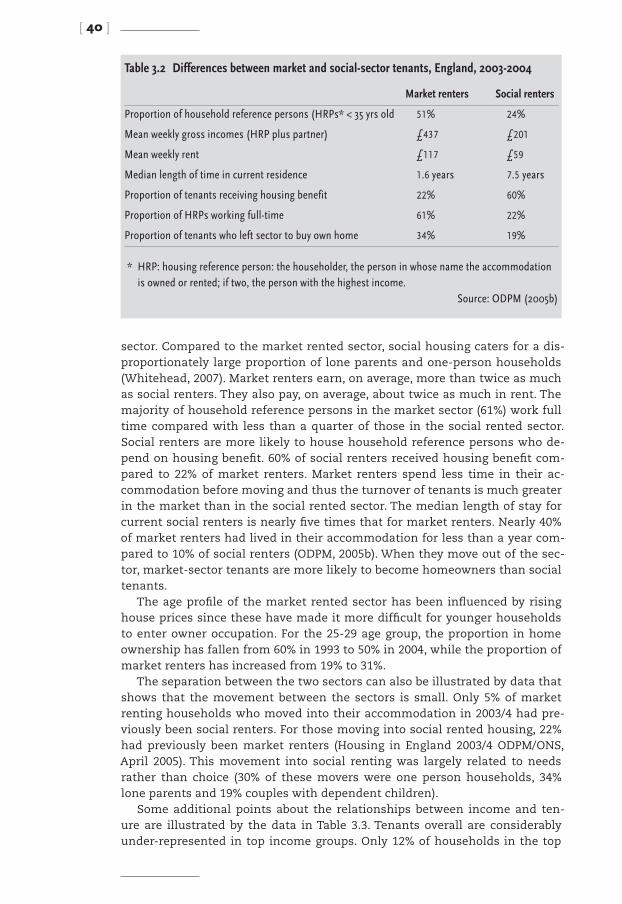
sector. Compared to the market rented sector, social housing caters for a dis-proportionately large proportion of lone parents and one-person households (Whitehead, 2007). Market renters earn, on average, more than twice as much as social renters. They also pay, on average, about twice as much in rent. The majority of household reference persons in the market sector (61%) work full time compared with less than a quarter of those in the social rented sector. Social renters are more likely to house household reference persons who de-pend on housing benefit. 60% of social renters received housing benefit com-pared to 22% of market renters. Market renters spend less time in their ac-commodation before moving and thus the turnover of tenants is much greater in the market than in the social rented sector. The median length of stay for current social renters is nearly five times that for market renters. Nearly 40% of market renters had lived in their accommodation for less than a year com-pared to 10% of social renters (ODPM, 2005b). When they move out of the sec-tor, market-sector tenants are more likely to become homeowners than social tenants.
The age profile of the market rented sector has been influenced by rising house prices since these have made it more difficult for younger households to enter owner occupation. For the 25-29 age group, the proportion in home ownership has fallen from 60% in 1993 to 50% in 2004, while the proportion of market renters has increased from 19% to 31%.
The separation between the two sectors can also be illustrated by data that shows that the movement between the sectors is small. Only 5% of market renting households who moved into their accommodation in 2003/4 had pre-viously been social renters. For those moving into social rented housing, 22% had previously been market renters (Housing in England 2003/4 ODPM/ONS, April 2005). This movement into social renting was largely related to needs rather than choice (30% of these movers were one person households, 34% lone parents and 19% couples with dependent children).
Some additional points about the relationships between income and ten-ure are illustrated by the data in Table 3.3. Tenants overall are considerably under-represented in top income groups. Only 12% of households in the top
[ 40 ]
Table 3.2 Differences between market and social-sector tenants, England, 2003-2004
Market renters Social renters
Proportion of household reference persons (HRPs* < 35 yrs old 51% 24%
Mean weekly gross incomes (HRP plus partner) £437 £201
Mean weekly rent £117 £59
Median length of time in current residence 1.6 years 7.5 years
Proportion of tenants receiving housing benefit 22% 60%
Proportion of HRPs working full-time 61% 22%
Proportion of tenants who left sector to buy own home 34% 19%
* HRP: housing reference person: the householder, the person in whose name the accommodation is owned or rented; if two, the person with the highest income.
Source: ODPM (2005b)

quintile are tenants, compared to 88% that are owner occupiers. In the lower-income groups, social renters are over-represented compared to market rent-ers, and local authority tenants are considerably over-represented compared to housing association tenants.
3.4 Housing policy
3.4.1 Tenure-specific policies
Post-war housing policy has been very tenure-specific, with different policy instruments for different tenures. The objectives have changed over time. From the end of World War II until the 1970s, the emphasis of policy was the promotion of house building in circumstances in which there was an overall housing shortage. Policy changed from the 1970s onwards, with an increasing emphasis on improving the quality of the stock, increasing home ownership and addressing affordability issues for lower-income households. In recent years, there has also been an increasing policy emphasis on the link between housing and broader economic, environmental and social objectives.
Successive post-war governments have encouraged home ownership through a range of tax concessions. Owner occupation rose from around 30% in 1951 to over 70% in 2004. Tax relief on mortgage interest made borrowing for house purchase a state-subsidised activity for much of this period but the gradual withdrawal of this concession began in 1974 by limiting the size of the loan that was eligible for relief and completed between 1991 and 2000 by gradually reducing the percentage rate of tax relief. There is, however, no tax
[ 41 ]
Table 3.3 Income and housing tenure UK, 2004-2005
Disposable income, quintile groups Bottom 2nd 3rd 4th Top
All households
Rented
Local authority rented 23 20 11 4 1 12
Housing association or RSL* 11 11 7 4 1 7
Other rented unfurnished 5 6 6 6 4 5
Rented furnished 6 4 3 5 5 4
Rent free 1 3 2 2 1 2
Total 46 44 29 20 12 30
Owner-occupied
With mortgage 16 26 40 54 67 40
Rental purchase 0 0 0 0 0 0
Owned outright 38 30 30 26 21 29
Total 54 56 71 80 88 70
Source: ONS * Registered Social Landlord.

on capital gains from increasing house values and no tax on imputed rental income for owner-occupiers.
3.4.2 Social renting
Local authorities were used in the early post-war period as vehicles for pro-moting large-scale house-building programmes. Over 80% of all house build-ing in the England in 1950 was undertaken by local authorities. This fell grad-ually to 45% in 1975 (see Table 3.4). This public sector housing for rent was supported by significant production subsidies. In 1972, a national housing al-lowance scheme was established to support low-income market and social-sector tenants. This scheme did not extend to low-income owner-occupiers. In 1975, over 80% of housing subsidies were supply-side subsidies promoting the production of affordable homes. By 2000 more than 85% of subsidies were on the demand side with housing allowances in the form of Housing Benefits as the main subsidy instrument (ODPM, 2005c).
Local authority house building was severely curtailed and eventually al-most completely halted by the removal of subsidies from 1980 onwards. By 1985, less than 15% of all new dwellings were built by local councils, by 1995 it was less than 1%. Subsidies for social rental production were switched from the 1970s onwards, and especially from 1980 onwards, to housing as-sociations. Housing associations’ production increased from around 5% of all dwellings built in 1975 to nearly 20% in 1995.
Since 1980, housing policy measures under both Conservative and La-bour governments have both reduced the size of the social rented sector and changed the relative shares of the sector managed by local authorities and housing associations. The Housing Act 1988 and the 1989 Local Government and Housing Act brought about important changes to the financial regime for social housing in England. The 1988 legislation liberalised housing association funding and allowed associations to borrow and invest without the controls faced by local authorities. They were in effect placed largely outside public sector financial restrictions. The 1989 Act cut councils’ investment spending resources and with the withdrawal of subsidies forced them to increase rents. Housing Associations’ public capital funding counts as public expenditure but the private capital market borrowing they engage in does not count as public expenditure. They are thus able to invest in new housing whereas local au-thorities are not (Pawson, 2006). A fundamental review of the purpose of so-cial housing (Hills, 2007) has helped to confirm government’s commitment to the tenure as a means of providing sub-market housing to households who cannot afford market housing.
In a move to reform the way that council housing is managed, government has, since 2002, encouraged the transfer of the management of council hous-ing to ALMOs. By making funding for investment in housing improvements
[ 42 ]

to meet the government’s Decent Homes Standard (see below) available via ALMOs, but not directly through local councils, government has created an explicit financial incentive for this form of organisation.
Whilst the social rented sector provided a convenient means for boost-ing housing production in the first half of the post-war period, production has been cut back in the second half and the sector has been transformed through shifts in production and ownership from local authorities to housing associations. A large element of the change in the policy stance was driven by a changed view of housing problems, with large-scale public sector house building no longer viewed as necessary, but it was also driven by public ex-penditure and ideological considerations. Government sought both to reduce public expenditure as part of its macroeconomic policy and to get better value for money as it introduced new performance indicators and associated regu-latory controls over the sector. More housing managed by housing associa-tions and less managed by councils was also seen as a means to break down the monopoly power of local authority housing and give tenants more choice. Ideological considerations meant that private ownership was viewed as su-perior to public ownership and thus favoured owner occupation and housing associations, the latter being formerly placed, at least for public expenditure purposes, outside the public sector.
3.4.3 Market renting
The ideological commitment to the market sector has not, however, extended to private rented housing. For the greater part of the twentieth century Brit-
[ 43 ]
Table 3.4 House building in England, dwellings completed, percentages by sector, and totals, selected years
Private enterprise% of total
Registered social landlords% of total
Local authorities% of total
Total number of dwellings completed
1950 15 1 84 163,341
1955 39 2 59 270,006
1960 60 1 39 257,622
1965 60 1 39 327,657
1970 52 3 45 291,793
1975 50 5 45 261,458
1980 54 9 37 204,366
1985 79 7 14 170,039
1990 83 8 9 163,899
1995 80 19.5 0.5 157,141
2000 87.5 12.4 0.1 135,035
2005 88.9 11 0.1 152,872
Source: adapted from house building data, live table 244, Communities and Local Government (www.communities.gov.uk)

ish governments placed severe restrictions on rent levels and gave tenants strong security of tenure whilst landlords’ rates of return and liquidity were severely limited. As those households who could afford home ownership and those tenants who demonstrated a need for social housing increasingly came to be housed in these sectors, market renting declined. Rent controls were introduced in 1915 and continued in various forms until 1989. With rent con-trol went strong security of tenure for tenants. The effect of these measures was to restrict landlords’ rates of return and render the market rented sector a poor investment option. Landlords used almost any opportunity they could to leave the sector. Thus, for example, when the 1957 Rent Act introduced a modest degree of rent decontrol and some relaxation of security of tenure it appears that its main effect was the opposite of that intended in that the rate of decline of the sector accelerated after the Act (Kemp, 2004, p. 42). Landlords seized the opportunity to disinvest by selling, mainly to sitting tenants, there-by boosting home ownership. Measures that provided improvement grants to increase the quality of the ageing market rented stock in the 1950s and 1960s also made these dwellings more attractive to homeowners. Landlords could not raise rents in line with their share of the costs of improvements and were not allowed to offset improvement expenditure against their tax li-ability. Grants were therefore more favourable to homeowners than landlords (Kemp, 2004, p. 42-43). More generally, tax and subsidy policies have worked against market landlords and led to a reduction in supply. More favourable policies towards home ownership and social renting have served to reduce the demand for market renting in the long run.
A major policy change which has helped to halt the decline of the mar-ket rented sector came with the 1988 Housing Act that allowed landlords and tenants, agreeing new contracts, to set rents freely and provided for six months security of tenure. Whilst the market rented sector shrank by 1.7 mil-lion dwellings or by 44% from 1971 to 1989, from 1991 to 2001 the number of households in the sector rose by 27% and the number of people in the sector rose by 44% reflecting the large number of single-person market renter house-holds (Ball, 2004, p. 10). How much of this growth in the market rented sector was due to the 1988 legislation and how much due to changes in supply and demand within the housing market is a matter for conjecture. However, policy continued to search for ways of boosting market renting.
In an attempt to promote institutional investment in the sector, the Busi-ness Expansion Scheme (BES) that provided tax advantages for small busi-nesses was extended to the market rented sector from 1988 to 1994, to enable private organisations letting under assured tenancies to benefit from the fis-cal concessions. Investors in property companies were enticed with tax con-cessions: tax relief was given on the purchase of shares, and shares held for a minimum of five years were exempt from capital gains tax. The gain from tax relief on purchases averaged 44% of the value of the property acquired.
[ 44 ]

During the first two years of the BES, some 10,000 private rented homes be-came available on the market, two-thirds of them new-build. A total of over 81,000 homes were purchased by BES companies, but only 25% of them by ‘re-al’ commercial property companies; the remainder were bought by housing associations, universities and building societies. The evidence suggests that the scheme did increase investment in the sector but that the benefits were short-lived. It has been judged a very expensive way of giving a temporary lift to the sector (Kemp, 2004, p. 59). In a more recent attempt to promote institu-tional investment in property generally, and residential property in particu-lar, the government announced proposals to introduce Real Estate Investment Trusts (REITS) in 2004 which would encourage investment in property funds that would in turn invest in property. This idea is discussed further below in relation to subsidisation and finance.
The government announced new measures in the Housing Act 2004 that were designed to provide improved quality control in the market rented sec-tor. They include selective licensing, tenancy deposit schemes and stricter control over houses in multiple occupation (HMOs). These measures will be discussed below in relation to regulation and supervision.
3.4.4 Policy objectives
Both the social and the market rented sectors are expected to contribute to government’s wide housing policy objectives. These are no longer confined to the quantity and quality of accommodation available and its affordability. They are rather linked to the government’s broader economic, social and en-vironmental objectives. Housing policy is now closely linked to the govern-ment’s Sustainable Communities Plan (ODPM, 2003) that seeks to improve the quality of residential environments by combinations of new building and ren-ovation that respond to regional variations in housing demand and supply. It is increasingly difficult to put housing aims and instruments into a box called
‘housing’ and isolate them from a much broader agenda. The government has stated that “the Government’s objective for housing policy is both simple and fundamental – to ensure a decent home for every individual in the country. Yet housing policy decisions have the potential to impact on a vast array of broader economic and social policy objectives: delivering macroeconomic sta-bility; helping households manage assets, savings and risk; meeting peoples’ housing aspirations; creating sustainable mixed communities and enabling labour market flexibility” (HM Treasury/ODPM, 2005). In the market rented sector, the government has very limited means to ensure that housing provi-sion contributes to these wider goals. However in the social rented sector gov-ernment exercises a strong regulatory regime which judges the performance of housing providers in relation not only to the provision and management of dwellings but also in relation to their contribution to sets of specific social
[ 45 ]

and environmental objectives. This will be discussed further in the section on regulation and supervision.
After several decades of indifference, government has rediscovered the im-portance of housing production in the last few years. The government spon-sored Barker Review of Housing Supply (2004) showed that Britain’s hous-ing production was unresponsive to house price increases by international standards and argued that planning controls were a significant cause of this supply inelasticity. In response, the government is looking at new ways to in-crease housing supply both because of the direct benefits of increased hous-ing provision and also because of a belief that this will dampen house price inflation. New house building targets were subsequently set by government (DCLG, 2007b). Housing construction was to increase considerably. Two million additional dwellings were to be built by 2016 and three million by 2020. 70,000 affordable dwellings a year are to be built by 2011 with 45,000 of those being social housing.
In 2006 the government announced some new initiatives in relation to in-termediate affordable housing which is defined as housing at prices and rents above those in the social rented sector, but below market price or rents. These include shared equity and other low-cost homes for sale, and intermediate rent that are provided by market developers and housing associations (DCLG, 2006, p. 9).
Specifically, intermediate affordable housing includes: ■ Intermediate rented dwellings provided at rent levels above those of the
social rented sector but below the market rented sector. These are intend-ed for key workers who do not wish to buy.
■ Discounted sale homes where the purchaser buys the whole dwelling at a reduced rate.
■ Shared equity where more than one party has an interest in the value of the dwelling such as an equity loan arrangement or a shared ownership lease. There may be a charge on the loan, and restrictions on price, access and resale.
■ Shared ownership is a form of shared equity under which the purchaser buys an initial share in a home from a housing provider, who retains the remainder and may charge a rent. (DCLG, 2006, pp. 10-11).
■ In a renewed attempt to increase the number of lower-income households in home ownership, the government launched a new HomeBuy scheme in April 2006, which provides a new form of equity sharing. There are three HomeBuy options:
■ Social HomeBuy enables tenants of participating local authorities and RSLs to buy a share in their current home at a discount.
■ New Build HomeBuy enables people to buy a share of a newly built prop-erty paying a rent on the remainder (this includes the First Time Buyers Initiative, a form of HomeBuy which uses public sector land).
[ 46 ]

■ Open Market HomeBuy will enable people to buy a property on the open market with the help of an equity loan. From October 2006, half of the eq-uity loan has been provided by one of the four participating lenders, who will also provide the conventional mortgage (the other half is provided by Government).
The government has stated that:“Eligibility for the HomeBuy schemes is wider than for social rented housing. It aims to help the following priority groups:
■ Current and prospective social rented tenants: tenants of councils and RSLs, and those who are on the housing register, waiting for a council or RSL home to rent.
■ Key workers: people employed by the public sector in a frontline role deliv-ering an essential public service in health, education or community safety in areas where there are serious recruitment/retention problems.
■ First time buyers (or other groups): households who can’t afford to buy their own home, and who have been identified as eligible for assistance by the Regional Housing Boards” (DCLG, 2006, p. 15).
If the plans for intermediate housing are successful, it may become important in creating a new route into owner occupation for low-income households and a means to support the labour market in cases where there are shortages of ‘key workers’.
3.5 Rent control, tenant security and other property rights
3.5.1 Rent determination in the social sector
Social and market-sector tenants have different forms of tenancy contracts, differing security of tenure provisions and different rent determination pro-cesses. A process of rent restructuring is underway throughout the social rented sector. This is designed to change rents gradually so that they will eventually reflect the relative attractiveness of individual properties better than in the past. A formula set by central government is to be applied each year. The formula links changes in rents to the condition, location and size of properties as well as to local earnings. The process should be completed by 2011. Central government is promoting this process through its subsidy provi-sion, building assumptions about rent levels into subsidies. The effect of re-structuring will be that the overall function of rents in the social sector will change. Rents have historically been related to costs and have, together with subsidies, been a means of providing revenue to meet ongoing costs. They
[ 47 ]

have not performed an explicitly allocative function or provided an indication of the relative desirability of dwellings as demonstrated by internal quality and location. Rent restructuring will allow rents to perform these more mar-ket-oriented tasks. Linked to the full introduction of choice based lettings by 2010, the change should promote an improved degree of consumer choice and, within the sector, an increased degree of allocation according to preferences, although need will still be the primary determinant of access to the social rented sector.
3.5.2 Rent controls in the market sector
There is still a measure of rent control in the case of the small number of reg-ulated contracts with registered rents that were entered into before 1989. All other types of market lettings are subject to market rents. The 1988 Housing Act removed controls on rents for all new tenancies in the market rented sec-tor. Rents in the commercial market rental sector are therefore determined by market forces and perform an allocative function in that ability to pay, and usually the evidence of that ability to pay, is a key determinant of access to the sector.
3.5.3 Security of tenure
Most councils give new tenants an introductory tenancy for the first year. Introductory tenancies enable a council to evict a tenant more easily if they break the terms of their agreement than when they are a secure tenant. As long as they do not break the tenancy agreement while they are an introduc-tory tenant, they automatically become a secure tenant. This means that they can stay in their dwelling for as long as they wish provided they do not break their tenancy contact in a way that gives the landlord a right of repossession. Such a right can occur if the tenancy agreement is broken by, for example, persistent rent arrears or anti-social behaviour by the tenant or someone staying in or visiting the dwelling. If they keep to the terms of the tenancy, se-cure tenants have strong rights. They can take in a lodger and may be able to pass on the tenancy, get a transfer, exchange their dwelling or buy it at a dis-count. The council has to do most of the repairs and should consult tenants on how their dwelling is managed. Secure tenants who have been involved in anti-social behaviour may be given a ‘demoted tenancy’. This is a one-year probationary council tenancy. Demoted tenants can be evicted much more easily than secure council tenants.
A housing association may provide starter tenancies for a twelve-month trial period at the beginning of a tenancy. During this time, tenants have few-er rights and can be evicted more easily than other tenants. Housing asso-ciations provide secure, assured, assured shorthold and starter tenancies and
[ 48 ]

they can apply to the courts to demote a tenancy. Secure tenants have usually been renting since before 1989. They have strong security of tenure similar to secure council tenants. They have the right to live in their dwelling as long as they do not break the rules of their tenancy agreement. The housing as-sociation should only evict such tenants as a last resort. Most housing asso-ciation tenants now have assured tenancies. Assured tenants pay a rent that is set by the housing association. It should be lower than might be paid to a market landlord for the same kind of property but is likely to be higher than a council rent. Housing associations often provide assured shorthold tenan-cies if the tenancy is temporary or if it is a starter or demoted tenancy. An assured shorthold tenancy provides a legal right to live in accommodation for a period of time. A tenancy might be set for a period (known as a fixed-term phase of the tenancy) such as six months. Or it might rollover on a week-to-week or month-to-month basis (this is known as the periodic phase of the tenancy). Assured shorthold tenants can be evicted fairly easily. The housing association does not have to provide a reason unless the tenancy is within its fixed-term phase. Rents, set on a similar basis to assured tenancies cannot be increased during the ‘fixed term’ unless tenants agree to an increase.
All new market-sector tenancies started after February 1997 are shorthold unless agreed otherwise in writing. The vast majority of market tenants are now assured shorthold tenants. The tenancy may last for a fixed term, or go from one rent period to the next in which case it is a contractual periodic tenancy. Most landlords will grant a tenancy for six months and then from month to month after this. The tenant can, in either case, stay in the prop-erty for at least six months, during which time the landlord cannot ask the tenant to leave unless there are specific reasons for doing so. These reasons include the breaking of the contract through, for example, excessive rent ar-rears or failing to look after the property properly. The landlord must give two months notice in writing. This can be served during the fixed term, but can only be implemented after any fixed term has expired. Thus security of ten-ure for most new tenants is limited to six months. After the six-month period, tenancies continue on a month-by-month basis and either the landlord or the tenant can end the contract, with one month’s notice from the tenant or two months notice from the landlord, without needing to provide a reason.
Right to buyWhile there is no right to buy in the market sector, secure council tenants who meet the necessary qualifications have the right to buy their dwelling at a discount related to the length of their tenancy. The right to buy was in-troduced in 1980 and its terms have changed over the years. In 2005 the ten-ancy-qualifying period was extended from two to five years and the period in which owners must repay their discounts if they sell their dwellings was reduced from five to three years. The value of the discounts now commences
[ 49 ]

at 35% of market value for houses and 50% for flats with national maximum discounts of 60% for houses and 70% for flats. The maximum value of the dis-count is, furthermore, limited to between £16,000 and £38,000 depending on local market conditions. If owners wish to resell, the discount payable back to the local authority depends on the resale value of the property and falls with a taper over time. Owners wishing to resell within ten years of the initial pur-chase must now first offer the property to a local social landlord. All tenants in ALMO managed properties remain council tenants with exactly the same tenancy agreements.
Housing association tenants have a limited right to buy known as the ‘Right to Acquire’. Only some tenants are eligible. They must have been a coun-cil, housing association or armed forces tenant (or a combination of these) for a total of at least two years if the tenancy started before January 2005, or five years if the tenancy started on or after 1 January 2005. Some dwellings are excluded. This includes sheltered housing, where services are provided or the dwelling has been designed or adapted for people with special needs. The dwelling must have been built or bought by the housing association after April 1997, and supported by subsidies. The discounts normally vary from £9,000 to £16,000, depending on location. The maximum discount on any property is 50% of the value of the property.
3.6 Allocation procedures and criteria
Social housing landlords are required to devise their own allocation poli-cies. Beyond the statutory duties of local authorities towards unintentionally homeless people, the allocation criteria imposed by central government are vague. There are no explicit income criteria. Allocation is expected to be ac-cording to need but this is not defined precisely. The Housing Inspectorate requires that an organisation: “Has an allocation policy that records, collects and takes accounts of individual’s needs and support requirements in order to match their needs with appropriate housing. Ensures that appropriate sup-port is available for vulnerable service users at the start of their tenancy.”
The allocation policy must also be publicised, clear, consulted on and be non-discriminatory (Housing Inspectorate KLOE 7, Allocations and Letting, Ju-ly 2004).
Households’ needs as interpreted by social housing landlords qualify them for inclusion on a housing register. The actual allocation of housing from that register is according to their needs as defined by their household composition and current housing circumstances. Added to this is an element of choice in those cases where a choice-based lettings system is in operation. This will be extended to all localities by 2010. The government is encouraging cooperation between all social housing providers – that is councils and housing associa-
[ 50 ]

tions and where they exist ALMOs – within local housing markets, in operat-ing common housing registers and choice-based lettings systems. With the spread of choice-based lettings, social housing providers are increasingly us-ing banding systems to divide those on housing registers into priority groups according to need. The most urgent needs groups have priority over those in lower needs groups. The available properties are also typically targeted to par-ticular need bands and tenant choice is exercised within these bands.
The following evaluation from a government-sponsored report summaris-es the dilemma in allocation policy: “In its Green Paper, published in 2000, the Government stated that it ‘does not believe that social housing should only be allocated to the poorest and most vulnerable members of the community’. Nevertheless it recognised that priority should generally be given to house-holds in greatest need. Because the poorest households have few housing op-tions, some are likely to face total exclusion from the housing market if they are unable to obtain social rented housing. Faced with the inevitable trade-off between social mix and safety net objectives, the Government has opted to strengthen the safety net by increasing the obligations of local authorities to-wards homeless households. Consequently, the social rented sector is likely to become more homogenous in income terms” (Stephens et al., 2005, p. 52).
Key-worker housing allocation is related to occupation. Allocation within the commercial market rented sector is, as previously explained, purely ac-cording to market-based ability to pay criteria.
3.7 Regulation and supervision
3.7.1 Social-sector regulation
The social rented sector is regulated by means that are quite separate from those that apply to the market rented sector. There have been two regulatory bodies for the social rented sector in England: the Housing Inspectorate (which is part of the government’s Audit Commission) and the Housing Corporation. The Housing Inspectorate examined the activities of local authorities, ALMOs and housing associations and the Housing Corporation provided additional regulatory oversight of housing associations. Following the Cave Review of regulation (Cave, 2007), major changes are underway in the processes of social housing regulation. Cave argued in favour of a single regulatory body for so-cial housing. The government has created the Tenants Services Authority that (from 2009) will initially regulate housing associations but within two years of its inception is expected also to regulate local authorities and ALMOs. Under the new system tenants’ groups will be able to alert the regulator to poor ser-vice; the regulator will then have the authority to impose a wide range of pen-alties and sanctions on failing social landlords, including the power to trigger a
[ 51 ]

change of management, and to help ensure that tenants receive a good service.The Housing Inspectorate carries out periodic inspections of housing pro-
viders to check on the quality of services provided and the prospects for im-provement. It applies Key Lines of Enquiry (KLOEs) to areas such as Access, Diversity, Value for Money, Allocations and Lettings and Income Management. The areas investigated depend on the nature and aims of the specific body that is being inspected. For local authorities, for instance, their strategic func-tions in relation to the local housing market as well as the delivery to their tenants is examined. The results are given in reports in the public domain (www.audit-commmission.gov.uk/housing). In particular the Housing Inspec-torate checks to see whether social objectives (as well as the narrower land-lord functions) have been achieved. This process results in a rating that de-termines whether or not funding will be available from central government for investment in dwellings in order to meet the Decent Homes Standard (the Government’s minimum quality requirement with which all social housing organisations are expected to comply with by 2010). Non-delivery could mean an adverse rating and the non-availability of funds. Market-sector landlords and developers are not charged in the same way with these social functions and not rewarded or penalised for their delivery or non-delivery.
The Housing Corporation has required registered social landlords to pro-vide regular information according to sets of performance indicators and is-sues reports on the financial and managerial strength of the organisation. Every housing association with more than 250 homes was continuously as-sessed on its performance under a Regulatory Code, which judged the asso-ciation’s viability, governance and management, and how well it had used any Corporation funds it had been allocated. The judgements were summarised in a Housing Corporation Assessment (HCA). HCAs played a central role in the Corporation’s regulation of the sector. The HCA consisted of a performance summary in the form of ‘traffic lights’ in four key performance areas and a narrative giving more detailed information. The rewards and penalties associ-ated with inspection reports were high. The most important were financial re-wards or penalties. In England, for example, the ‘traffic lights’ awarded by the Housing Corporation were crucial to the possible award of funding for new development. The stars awarded by the Housing Inspectorate have been cru-cial to the awarding of funds to councils and ALMOs for the delivery of the Decent Homes standard. Whilst one penalty is the non-receipt of funds, an-other was the possibility of being put under supervision by the Housing Cor-poration so that an external team of managers takes over the running of an organisation until it improves. Although the new Tenant Services Authority is likely to streamline the regulatory process, giving more weight to the views of tenants and concentrating more on poor performers and less on those who deliver well, the importance of rewards and penalties in the regulatory ap-proach is likely to remain intact.
[ 52 ]

3.7.2 Market sector regulation
In the market rented sector the contractual arrangements between landlords and tenants have, in the long term, been seen as the principal means of en-suring standards in the sector. However, the Housing Act 2004 announced a new means of regulating the sector. The new arrangements allow for the se-lective licensing of market landlords, the mandatory licensing of Houses in Multiple Occupation (HMOs) and new tenancy deposit schemes. Selective li-censing allows local authorities to decide that in their locality (or a part of it) market landlords must, in order to conduct their business, be licensed by the council. For licensing to be applicable, one or more conditions must be satis-fied. For example, the area must have a low demand for housing (or is likely to become such an area) and there must be a significant stock of market hous-ing let on short-term contracts and the local authority is satisfied that licens-ing will improve social or economic conditions; the area must be experiencing significant and persistent problems caused by anti-social behaviour. Before licensing a local authority must consult with landlords and tenants and rec-ognised tenant associations. Licensing schemes must be reviewed after five years. To be granted a licence, a landlord or an agent must be a ‘fit and proper person’, meaning that they have kept within the law on criminal and land-lord and tenant issues. The licence must include conditions about the quality and safety of the accommodation. In addition to the statutory requirements, under the new legislation all local authorities are able to introduce voluntary accreditation schemes that recognise and reward good landlords. Properties that meet required standards will be placed on a register and rented housing of an acceptable standard will thus be separated from that which falls below a minimum threshold.
From April 2006 HMOs had to be licensed. These are buildings occupied by several households in which amenities such as bathrooms, toilets or cook-ing facilities are shared. Licensing has been introduced because of concerns about the quality and safety of HMOs and the new measures are expected to reduce the risks associated with such housing.
3.8 Subsidisation and finance
3.8.1 Capital finance
The subsidisation, taxation and financing arrangements for social rented housing suppliers are quite separate from those for market rented housing. The subsidy, taxation and funding arrangements for local authority housing are, furthermore, separate from those for housing associations. All tenants are, however, subject to their household incomes and rent levels, eligible for
[ 53 ]
housing allowances in the form of housing benefits.Local authority housing operations (and, through local authorities, ALMOs)
receive subsidies that go into the local authority’s Housing Revenue Account. These subsidies contribute to ongoing operating costs. The formula for cal-culating this subsidy for each local authority is complex. In some cases, the Housing Revenue Account subsidy can be negative. This means a local au-thority will in effect be repaying money to central government. The subsidy is linked to local authorities’ costs and rent levels. It is designed to allow coun-cils to keep rents below market levels whilst at the same time exercising a degree of central control over these rents in order to achieve higher and more consistent rent levels across the country through ongoing rent restructuring.
Whilst councils can no longer access subsidised finance to expand their stock, if they have created an ALMO that achieves prescribed performance targets, they can access funds for the improvement of their stock. This is part of the government’s plans for all social housing to meet the Decent Homes Standard by 2010.
Capital grants for new social housing are channelled through the Homes and Communities Agency which manages the National Affordable Hous-ing programme (NAHP). This is a national investment programme that deliv-ers agreed national and regional targets. Grants are paid to Registered Social Landlords and since 2004 the grants are in principle available to unregistered private contractors and developers too. ALMOs are now also eligible to bid for this development funding. Unregistered bodies may own and manage af-fordable housing (DCLG, 2006, p. 12). The Homes and Communities Agency as-sesses bids for the NAHP and judgements are made on the basis of the con-tribution made to housing needs and sustainable communities and value for money.
A significant additional subsidy to social housing providers is a cross-sub-sidy from the private sector development process to social housing organi-sations and tenants. This is a result of the delivery of affordable housing as a part of ‘Section 106 agreements’. These are planning agreements between developers and local authorities in which developers agree to make specific provisions in return for planning permission. In 2004/5, 46% of all affordable housing constructed on sites supported by social housing grant included a developer contribution through planning gain (DCLG, 2006, p. 21). Housing as-sociations borrow on the private capital market. The combination of grants, loans and sometimes developer contributions provide the capital funding for new affordable housing. Housing associations are able to borrow privately at low rates of interest because they are seen as representing a low credit risk. This low risk is a consequence of the regulation and inspection regime as well as the implicit underpinning of their security by the TSA and the oth-er regulatory processes. The ability to borrow on the capital market is a key feature that distinguishes housing associations from local authorities. The
[ 54 ]

private finance that they raise has contributed to a growing volume and pro-portion of development funding in the form of capital market loans. Housing associations borrow both to facilitate stock transfers from local authorities and for new development. Total private finance facilities grew from £26 bil-lion to £33 billion between 2002 and 2004 (Housing Corporation & National Housing Federation, 2004, Private Finance Monitoring Bulletin).
The affordable housing supported by the NAHP comprises social rented housing and ‘intermediate affordable housing’. The government, as explained in Section 3.4, is attempting to increase the overall significance of intermedi-ate affordable housing (DCLG, 2006).
3.8.2 Tax concessions for landlords
Social housing providers benefit from tax concessions, grants, soft loans and other measures that reduce their costs and/or allow them to reduce their prices for similar competing products or provide a higher quality product for a similar price. Housing associations benefit from significant tax concessions from government. The taxation of social housing organisations is complex. The main concessions come about through exemptions from Corporation Tax and Capital Gain Taxes that would be paid by private companies. In the case of some housing associations, though not all, these concessions are linked to their charitable status.
Market renting, by contrast, has not benefited from the subsidies and tax concessions available to the social rented sector. The expansion of the sec-tor in recent years has relied on funds borrowed privately. Buy-to-let mort-gages have grown in significance as lenders have tailored specific mortgage products to the requirements of the sector. At the end of 2004 there were over 526,000 outstanding buy-to-let loans (Scanlon & Whitehead, 2005), cor-responding to a share of about 6% of the mortgage market in the United King-dom. These loans have allowed small-scale investors to borrow with deposits of between 15% and 20%. The financing of the loan is then typically covered by rental income. The private investor’s returns are largely geared to the pros-pects of capital growth engendered by rising house prices. Borrowing costs and other ongoing expenses, such as agents’ fees, are tax deductible. Both in-dividuals and firms investing in market renting are thus eligible for tax relief on mortgage interest (unlike owner occupation). The capital growth is on dis-posal liable for capital gains taxation (again unlike owner occupation).
As part of the 2005 Pre-Budget Report, the Government announced that it would bring forward legislation for the introduction of Real Estate Investment Trusts in the UK (UK-REITs) to improve the efficiency of both the commercial and residential property investment markets. The introduction of UK-REIT legislation provides the basis for liquid and publicly available property in-vestment vehicles to be available to a wide range of investors, contributing to
[ 55 ]

the Government’s wider objectives for raising productivity in the commercial property sector. As suggested in the Barker Review of housing supply (Barker, 2004) UK-REITs will also encourage increased institutional and professional investment to support the market rented sector. In 2006, the government an-nounced that REITS will be able to operate from January 2007. From an indi-vidual’s viewpoint, the attraction will be the ability to invest in a portfolio of properties without the individual transaction costs and without liability for capital gains tax.
3.8.3 Housing allowances
Housing allowances in the form of housing benefits have become the ma-jor housing subsidy for supporting low-income tenants in social and market rented housing. (Table 3.3 shows that in 2003/4 60% of social-sector tenants and 22% of market tenants in England were supported by housing benefit). Housing benefit is a national income-based rent subsidy paid out through the social security system (Boelhouwer & Haffner, 2002; Kemp, 2004; Stephens, 2005). Like any rent subsidy system its aim is to make rented housing afford-able for households on low incomes. Housing benefit is based on net house-hold income, household composition and rent levels (Boelhouwer & Haffner, 2002; Kemp, 2004; Stephens, 2005). If the income is at or below the social se-curity benefit level, the full amount of the eligible rent is paid out as benefit. If the income is higher than the social security benefit level the amount of housing benefit is discounted by 65% of the difference. This formula means that households are not generally faced with the results of rent decreases or increases caused by moving to another home or otherwise, since the margin-al cost of rent is zero. A government agency, the Rent Service, checks that the rents used for claiming housing benefit are in line for local rent levels and that payments are not unnecessarily generous.
The government is experimenting with a new form of housing benefit in the market rented sector. This is termed a Local Housing Allowance (LHA) and was introduced in nine ‘Pathfinder areas’ between November 2003 and Febru-ary 2004. The LHA was introduced as a means of tackling some problems that were associated with the existing system of support for households paying rent in the market rented sector and in particular to provide ‘shopping incen-tives’ so that tenants search for accommodation that best suits their needs and resources. The LHA remains a means tested allowance, but pays a single flat-rate allowance according to household size and local rent levels rather than an amount that varies with actual rent paid. Where households are able to secure property at a rent below the LHA rate, then they are able to keep the difference. The maximum allowances are set by the Rent Service, and re-viewed monthly. The allowance is generally paid to the tenant, and only in certain circumstances paid directly to the landlord or agent. The landlord can
[ 56 ]

receive the benefit directly in cases of excessive rent arrears, or when the ten-ant is ‘unlikely to pay’ their rent due to a history of chronic rent arrears or when the tenant is deemed vulnerable and thus unable to manage their own affairs. The processing of the new benefit is simplified in that all rents are not subject to a Rent Service review. An evaluation of the LHA experiment has been undertaken and it is now being introduced nationwide (www.dwp.gov.uk/housingbenefit/lha/evaluation/index.asp).
3.9 Bridging the gap between social and market renting?
There is a clear and sharp divide between the social and market rented hous-ing sectors. This gap manifests itself in the ownership of the dwellings, the method of allocation and the socio-economic characteristics of the tenants. Social rented dwellings are, as explained above, owned mainly by local gov-ernment or by non-profit Registered Social Landlords. Allocation is based primarily on housing need. Market rented housing is owned by a variety of organisations including individuals and firms who are profit-oriented busi-nesses who let their accommodation in the market place to those who exer-cise effective demand as opposed to need. However, the market rented sec-tor also includes some dwellings that are owned and supplied by public and market-sector employers for the benefit of their employees.
The rental sector is shrinking. In 1981, around 42% of households rented compared to 29% in 2005. The decline in renting overall is related to the rela-tive attractiveness of home ownership and government policies that have en-couraged owner occupation and depleted the size of the social rental stock. For many households who can afford it, home ownership is a more attractive proposition. Homeowners tend to be more satisfied with their home and their neighbourhoods than renters. Home ownership is also seen as a good form of investment.
The gap in who provides whatThere are significant gaps between the ownership, functions, financing, policy support and future prospects of the social and market rented sectors. The so-cial rented stock is owned by local authorities and housing associations, with housing association’s share of the stock having grown to nearly half of the to-tal in recent years. Around half of all council housing is now managed by AL-MOs. The market rented stock is owned mainly by small individual landlords but also by companies, charities, government departments and educational establishments. Subsidised social landlords are almost entirely non-profit or-ganisations. However, as a result of recent changes in legislation, it is possible that in the future more market companies will become social landlords. Non-
[ 57 ]

subsidised market landlords are generally in business to make profits (Table 3.5) but the sector is diverse and it includes housing supplied in relation to employment and some accommodation that is rent-free (Section 3.1.3).
If quality is judged by the ‘decent homes standard’ which takes account of the state of repairs, the provision of modern facilities and services and ther-mal comfort, more privately rented dwellings are ‘non-decent’ than dwellings in the social sector. This measure of higher physical standards contrasts with surveys of tenant satisfaction that show higher levels of satisfaction with market landlords. Social-sector rents are much lower than market rents – on average about half of market levels. Social-sector tenants have a very differ-ent bundle of property rights compared with market tenants. Their security of tenure is much greater and many social tenants have the right to buy.
The gap in government policies and outcomesGovernment policies towards social and market rented housing are quite different (Table 3.6). Social rented housing principally provides a safety net, underpinning the social security system by ensuring a minimum quality of housing for those on low incomes. Investment in the social rented sector is being channelled into housing associations and ALMOs in an attempt to re-place public finance by private investment finance, to make the sector less monopolistic at a local level and to provide more choice.
Despite some recent moves to increase controls on the market rented sec-tor through selective licensing and stricter controls over HMOs, the sector is much less regulated than the social sector. Through a combination of regu-lation and subsidy provision, social housing providers are expected to con-tribute significantly to a wide range of government social and environmental objectives, as well as housing objectives. The performance of social housing
[ 58 ]
Table 3.5 The gap between social renting and market renting in who provides what in England
Social renting Market renting
Landlord
Types RSLs (housing associations), Local authorities (and ALMOs). Recently open to private companies
Private individuals, partnerships, companies, other organisations
Motives of landlords Non-profit. With the possible future exception of private companies who become social landlords
Mostly profit-making
Accommodation
Quality of products on offer
Higher levels of physical quality but lower levels of satisfaction with landlords
Lower levels of physical quality but higher levels of satisfaction with landlords
Rent levels On average around half those in market sector
On average about twice those in social sector
Property rights
Security of tenure Strong More limited
Rent surcharge Increases in line with policy Increases related to market conditions
Right to buy Available to many tenants Does not apply

providers is closely monitored, and good performance is rewarded and poor performance penalised through the provision or non-provision of financial support. Although there is a regional dimension to policy there is significant centralised guidance and control and the social sector is expected to achieve targets set by central government. Whereas market-sector landlords have to deliver according to the terms of the agreement between landlord and tenant, social landlords have to deliver in terms of regulatory guidance and policy ob-jectives.
The distinctive roles of the diverse market rented sector have been sum-marised as “a traditional housing role for people who have lived in the PRS for many years, easy access housing for the young and mobile, the provision of accommodation tied to employment, a residual role for those who are unable to access owner occupation or social renting, and as an escape-route from so-cial rented housing”. The relative importance of these roles is changing: “In particular, the continued movement of the market rented sector away from providing employment-linked accommodation and a reduction in its tradi-
[ 59 ]
Table 3.6 The gap between social renting and market renting in policy and policy instruments in England
Social renting Market renting
Purpose of housing sector
Safety net for low-income households, plus contribution to wide social and economic objectives
Diverse; meeting demands of several household types
Allocation procedures Mainly according to housing needs with some individual choice
Free market
Rent control
New contracts Rents set by a policy formula Market rents
Rent adjustments Rents set by a policy formula As determined by contracts and market circumstances
Regulation and supervision
By TSA and Housing InspectorateSubstantial regulation and supervision
Some selective regulation by local authorities
Government support
Bricks-and-mortar support
Available Not available
Tax concession for landlord
Available Significantly fewer tax concessions
Housing allowances Available, same basic system, but higher dependency in social sector
Outcomes
Socio-economic characteristics of tenants
Low incomes High benefit dependency
Mean incomes more than twice those in social sectorLower benefit dependency
Movement between tenures
Small volume of movement between tenures
Competition
Substitutability Low level of substitutability
Rivalry Low level of rivalry

tional role, have increasingly been replaced by a tenure that is more flexible, short-term, and open market in nature” (Rhodes, 2006, pp. 74-75).
Projections of future household growth suggest that the greatest sources of this growth will come from two of the key demand groups for market rent-ed accommodation: single-person and multi-person households. Substantial growth is expected in these two household types, especially among the mid-dle-aged groups. These projections “tend to suggest that, based on the exist-ing pattern of household composition within the PRS, there may be a healthy demand for market rented accommodation in the future, and particularly in the open market sub-sector” (ibid, p. 78).
Rent levels and allocation processes describe another gap between the two rented sectors. With market rents about twice as high as those of social rents and allocation according to ability to pay contrasting markedly with alloca-tion according to need, these gaps are very wide indeed. Needs-based alloca-tion is the key to access to social housing with, under choice-based lettings, some element of choice once need has been established. As rent restructur-ing pushes social-sector rents upwards and relates them more consistently to the desirability of the dwellings, the rent gap may narrow somewhat. The allocative difference will remain, however, reflecting the fact that the two sec-tors perform contrasting functions, one related to satisfying demand that is not met elsewhere and the other related to satisfying needs that are not met elsewhere.
Public sector renting has been supported by public finance to help develop and improve the stock. There has been virtually no such similar support for the market sector in recent years (although it has been possible for market landlords to obtain financial support for improvements to old housing, this has by comparison occurred on a small and very selective scale). Housing as-sociations borrow money on the private capital market to support their de-velopments. Most new social-sector house building is supported by a com-bination of private and public finance. Market-sector landlords rely almost exclusively on personal equity and private sector borrowing to finance their investments. Due to the scale of the private-sector finance underpinning the social sector, development has grown considerably in recent years, and it might be argued that in terms of private and public finance to support expan-sion, the gap between the two rental sectors has narrowed somewhat. Lower-income households are supported in both sectors by housing allowances that are a function of rent, household size and income and whilst there are opera-tional differences between the two sectors, the basics of the system are the same for both sectors.
It has been shown that the socioeconomic characteristics of the social and market rented sector tenants differ markedly. For example, market renters earn on average twice as much as social-sector tenants and are much more likely to rely on housing benefits to help pay the rent. There is a low level
[ 60 ]

of movement between the two tenures. Only 5% of market renters who had moved in 2003-4 had previously been social renters, and 22% of social renters had been market renters (ODPM, 2005a, p. 17).
The competitive gapIt is unlikely that social-sector tenants will be able to find acceptable substi-tutes in the market sector. Significantly higher rent levels and less security of tenure in the market sector coupled with the relatively lower incomes of so-cial tenants mean that the vast majority of social tenants will be neither will-ing nor able to consider the option of market-sector renting. They are unlikely to be able to find accommodation of a suitable quality for an affordable rent to satisfy their requirements in the market sector. Market-sector tenants are, on average, unlikely to be able to access social housing because their high-er incomes and personal circumstances will mean that they fail to meet the needs-based allocation criteria for social housing. Some may well be willing to consider social housing as a substitute but the realities of allocation are likely to exclude them from entering the sector. Differences in the quality of neighbourhoods are likely to affect substitutability with the higher quality of many market-sector neighbourhoods, making them more attractive to house-holds that can afford such housing and making social housing neighbour-hoods seem like poor substitutes. The low level of movement between the sectors suggests that the desire and opportunities for substitution are small.
The differences in motivation between profit-oriented market landlords and non-profit social landlords will in principle exclude the probability of ri-valry between the two types of suppliers. The pressures on social landlords to meet government-imposed social and economic objectives that go beyond simply housing low-income households reinforces the notion that these land-lords supply different products and have different motives. The differences in subsidisation, taxation and regulation compound this division between the two forms of landlords. Given these factors, combined with the fact that the two types of landlord will be seeking to satisfy the demands of customers with different socio-economic profiles, it is highly unlikely that the suppliers in the two sectors will consider themselves to be rivals.
Bridging the gap?It can be argued that the social rented sector is becoming more market-ori-ented. Private firms are now eligible to bid for social housing grants and to manage social housing, market-based performance indicators are being used to judge performance and rents are being pushed nearer to market levels and closer to reflecting consumer preferences. Moreover, social-sector landlords are, under the umbrella of diversely configured social housing groups, being linked with commercial arms that operate in the free market and cross-subsi-dise social operations.
[ 61 ]

If the government’s attempts to promote intermediate rented dwellings, pro-vided at rent levels above those of social rented housing but below market rented housing, are successful further bridge building between the social and market sectors will have occurred. These dwellings are, however, intended for key workers who, according to policy guidance, are unable to buy as opposed to those who cannot afford to rent privately. Some intermediate housing will be occupied by households with incomes above the average for social renting and the applicant’s occupation will be an important determinant of access to this relatively new sector. A lack of both the availability and affordability of dwellings for home ownership rather than market renting is driving the policy ambitions for this sector. Indeed, most intermediate housing, includ-ing shared equity and HomeBuy, can best be viewed as new forms of home ownership rather than new forms of renting. Given that the target groups for this housing includes current and prospective social rented tenants who are on a housing register, intermediate housing is intended principally to create a bridge between social renting and home ownership rather than between so-cial and market renting.
Given the large differences in both the socio-economic characteristics of the occupants and the functions of the social and market rented sectors, sig-nificant gaps in the policy position, financing, regulation and allocation pro-cedures are likely to continue for many years despite rent restructuring and more market-oriented management and development in the social rented sector.
Country expert
Tim Brown, Centre for Comparative Housing Research, De Montfort University, Leicester.
[ 62 ]

4 Flanders, Belgium
4.1 The federal system
Since 1970, Belgium has transformed itself from a highly centralised coun-try to a federal state consisting of three autonomous Administrative Regions: the Region of Flanders, the Region of the Walloon Provinces and the Region of Brussels (Boelhouwer & Van der Heijden, 1992; Elsinga et al., 2007b; Van der Heijden et al., 2002). In 1980, constitutional reforms were passed which offi-cially recognised the Region of Flanders and the Region of the Walloon Prov-inces. The Brussels Region was recognised in 1988.
Powers have been increasingly devolved to the regions. With the law of 8 August 1980, the regions were formally given complete responsibility for hous-ing policy, although this excluded rent policy and legislation in the private or market rented sector and tax policy and legislation (income tax). These policy fields remained the responsibility of national government. From a legal point of view, the national government and the autonomous regions are equal.
Belgium has a complicated structure of public administration because alongside the national and regional levels of government, there are also two other levels of government, the provincial and the local (municipality) level. Additionally, there are three communities – the French-speaking communi-ty, the Flemish-speaking community and the German-speaking community. These communities do not necessarily coincide geographically with the re-gions. The Flemish-speaking inhabitants of the Region of Brussels, for ex-ample, are considered to be part of the Flemish-speaking community though they live outside the Region of Flanders.
The language communities are chiefly responsible for cultural affairs and education. The regions are responsible for matters such as planning, hous-ing, land, the environment, energy, employment, economic policy and foreign trade.6 The communities and regions are both organised in such a way that they have, in principle, their own governments and their own parliaments. In Flanders, however, these have been merged and there is one combined gov-ernment and one combined parliament.
Because it is the Administrative Regions which are responsible for hous-ing and housing data is also collected by region, Flanders was chosen as the region to be studied in this chapter. Of the almost 10.4 million Belgians, 6.0 million lived in Flanders on 1 January 2005 (http://www.statbel.fgov.be/pub/d2/p201y2005_nl.pdf).
6 The regions and federal government have divided the responsibilities for foreign relations (information of
expert). The federal government is responsible for foreign affairs in general.
[ 63 ]

4.2 Housing stock
4.2.1 Definition of rented sector
In Belgium and Flanders, it is the type of landlord that mainly determines whether one can speak of social or private renting (Elsinga et al., 2007b). If pri-vate persons or companies let the dwellings, they belong to the private rental sector, which we will refer to as the ‘market rented sector’ in this chapter.
If a registered or accredited social housing association (sociale huisvestings-maatschappij) lets the dwellings, on the basis of the old Flemish Housing Code of 1997, the dwellings will be considered ‘social rental dwellings’ (Elsinga et al., 2007b; Winters, 2004). The same applies to dwellings owned by the former Flemish Housing Society (Vlaamse Huisvestingsmaatschappij, VHM; founded in 1988), which became the Flemish Association for Social Housing in 2006 (Vlaamse Maatschappij voor Sociaal Wonen, VMSW).
The new Flemish Housing Code of 2007 applies a broader definition of so-cial housing than the 1997 version (Winters et al., 2007, p. 75; see Section 4.4.3). This includes subsidised dwellings let or sublet by the Flemish Housing Fund (Vlaams Woningfonds),7 local authorities and municipal welfare organisations known as OCMWs (Openbaar Centrum voor Maatschappelijk Welzijn) or groups of local authorities and OCMWs. It also includes the private/market rental stock that is let by Sociale VerhuurKantoren, or ‘Social Rental Agencies’, to use De Decker’s (2002) translation of the term into English. These dwellings are al-located according to social principles, as Section 4.6.2 relates.
4.2.2 Description of housing stock
The dominant form of tenure in Flanders is home ownership, which still ap-pears to be growing. Table 4.18 shows that this form of tenure is slowly ap-proaching 75% of households in 2005, rising from 65% about 25 years ago. Governments led by the Catholic Party in particular have promoted this growth, with their emphasis on private initiative and the nineteenth-century model of family life (Boelhouwer & Van der Heijden, 1992; see also Section 4.4.1). The Liberals, too, have supported home ownership as a form of societal discipline and as a counter to socialism. In short, all the conservative par-ties have supported home ownership (Goossens, 1982). It is thus commonly remarked that Belgians are born with a ‘brick in their belly’ (Winters, 2004).
7 Also offering mortgage loans for families with one or more children, the ‘social loans’.
8 The data in Table 4.1 shows the number of households in 1981, 1991 and 2001 instead of stock statistics.
No information is available about vacant dwellings or households living in accommodation with shared
facilities.
[ 64 ]

Nowadays, home ownership, because of its dominant share on the market, can almost be forced onto households because of social pressure, however (De Decker, 2007).
The flipside of a large and still growing owner-occupier sector is a small and shrinking rental sector. Within the rental sector, social renting has al-ways been the smallest form of tenure, comprising less than 5% or, depending on the definition, less than 6% of households in 2005. Private individual land-lords dominate within the market rental sector with a market share of more than 18% in 2005.
Table 4.2 shows the distribution of tenures between the classifications of urban and rural areas. Home ownership dominates, with a market share of over 80% in the more rural or suburban areas, while the shares of renting are relatively higher in the more urban areas.
Market rentingThe growth in home ownership has resulted in a decrease in the share of households living in rental dwellings from almost 33% in 1981 to less than 24% in 2005, as Table 4.1 shows. It can be assumed that this decrease has mainly affected market renting, which shrank by more than one percentage point between 2001 and 2005.
This decline may not only be the result of the growth of home ownership, but may also be due to a more general perception that many rental dwell-ings simply do not represent good value for money (De Decker, 2001, p. 17): “Complaints about high and rising rents for often poor accommodation and the lack of secure housing are common. The … most vulnerable groups of the population … live often in this sector…”. De Decker (2001, p. 20) describes the market rental sector as not offering “a stable tenure alternative to home own-
[ 65 ]
Table 4.1 Occupiers according to tenure, percentages, Flanders, 1981, 1991, 2001 and 2005
Type of occupier 1981 Census 1991 Census2001 Social and Economic Survey
2005 Flemish Housing Survey
Owner-occupiers 65.0 68.8 72.6 74.4
Tenants 32.6 29.5 25.0 23.8
Market tenants 19.7 18.4
Renting from private person landlords 16.9 17.4
Renting from company landlords 2.8 1.0
Social tenants 5.3 4.5
Tenants in rental dwelling in ownership of public organisations*
0.9
Renting rent free and other 1.8 1.6 2.4 1.5
Source: Elsinga et al. (2007b), based on Woonsurvey (Flemish Housing Survey) 2005. In this chapter we follow Heylen et al. (2007) who refer to Woonsurvey 2005 and data for the year 2005 instead of Elsinga et al. (2007) or Vandenbroucke et
al. (2007) who refer to the Woonsurvey 2005/2006 and the year 2005/2006.
* This includes households that rent from municipal welfare organisations (OCMWs) and local authorities (Heylen et al., 2007, p. 211).
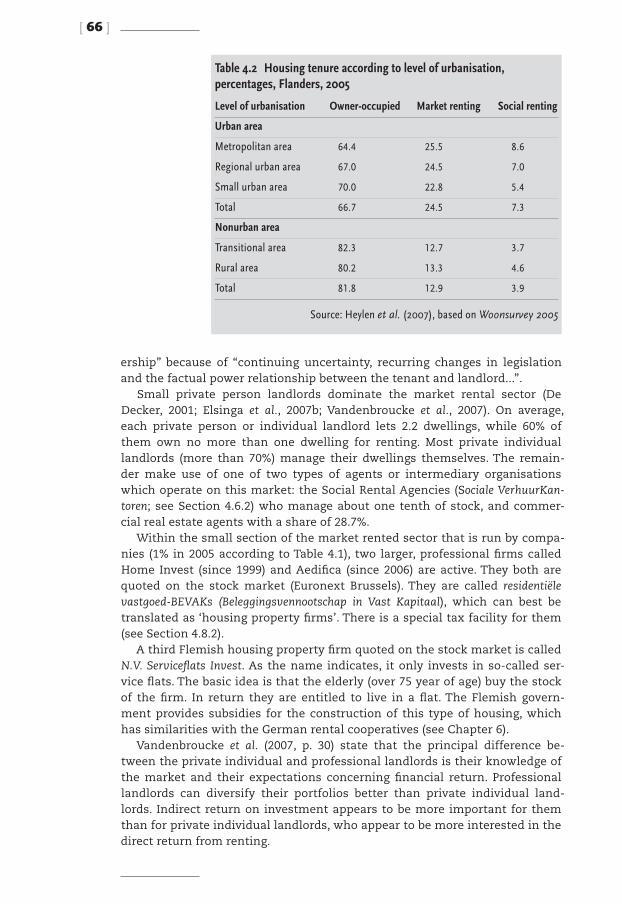
ership” because of “continuing uncertainty, recurring changes in legislation and the factual power relationship between the tenant and landlord...”.
Small private person landlords dominate the market rental sector (De Decker, 2001; Elsinga et al., 2007b; Vandenbroucke et al., 2007). On average, each private person or individual landlord lets 2.2 dwellings, while 60% of them own no more than one dwelling for renting. Most private individual landlords (more than 70%) manage their dwellings themselves. The remain-der make use of one of two types of agents or intermediary organisations which operate on this market: the Social Rental Agencies (Sociale VerhuurKan-toren; see Section 4.6.2) who manage about one tenth of stock, and commer-cial real estate agents with a share of 28.7%.
Within the small section of the market rented sector that is run by compa-nies (1% in 2005 according to Table 4.1), two larger, professional firms called Home Invest (since 1999) and Aedifica (since 2006) are active. They both are quoted on the stock market (Euronext Brussels). They are called residentiële vastgoed-BEVAKs (Beleggingsvennootschap in Vast Kapitaal), which can best be translated as ‘housing property firms’. There is a special tax facility for them (see Section 4.8.2).
A third Flemish housing property firm quoted on the stock market is called N.V. Serviceflats Invest. As the name indicates, it only invests in so-called ser-vice flats. The basic idea is that the elderly (over 75 year of age) buy the stock of the firm. In return they are entitled to live in a flat. The Flemish govern-ment provides subsidies for the construction of this type of housing, which has similarities with the German rental cooperatives (see Chapter 6).
Vandenbroucke et al. (2007, p. 30) state that the principal difference be-tween the private individual and professional landlords is their knowledge of the market and their expectations concerning financial return. Professional landlords can diversify their portfolios better than private individual land-lords. Indirect return on investment appears to be more important for them than for private individual landlords, who appear to be more interested in the direct return from renting.
[ 66 ]
Table 4.2 Housing tenure according to level of urbanisation, percentages, Flanders, 2005
Level of urbanisation Owner-occupied Market renting Social renting
Urban area
Metropolitan area 64.4 25.5 8.6
Regional urban area 67.0 24.5 7.0
Small urban area 70.0 22.8 5.4
Total 66.7 24.5 7.3
Nonurban area
Transitional area 82.3 12.7 3.7
Rural area 80.2 13.3 4.6
Total 81.8 12.9 3.9
Source: Heylen et al. (2007), based on Woonsurvey 2005

Social rentingSocial rented housing has always been the smallest sector within the housing market. Since 2001, the market share of this sector appears to have stabilised at around 5% of households, depending on the precise definition (see Table 4.1).
Social rented housing is intended for households that have insufficient ac-cess to dwellings that match their needs due to their low income or special requirements (decree of the Flemish government of 20th October 20009; Win-ters, 2004; Winters et al., 2007). Income limits are set according to the number of dependent household members (see Section 4.6.1).
On the basis of the net taxable incomes for 2005 and the rules of 2007, it is estimated that almost half of all Flemish tenants were eligible to rent a social dwelling (Heylen et al., 2007; Winters et al., 2007). This means that about 39% of market tenants were eligible for a social rental dwelling. The social rental sector is thus not only small in absolute terms, but also in terms of eligible households.
The bulk of the social housing stock is owned and managed by social hous-ing associations (sociale huisvestingsmaatschappij) which were accredited by the Flemish Association for Social Housing (Vlaamse Maatschappij voor Sociaal Wonen, VMSW; Elsinga et al., 2007b) prior to 2006. Since 2006, this task has been carried out by the Flemish government (Winters & Van Bortel, 2008). Sin-gle housing associations owned slightly over 1,300 dwellings on average, with the total ranging from 300 to almost 6,000 dwellings (2001).
In legal terms, housing associations are private associations (Winters, 2004); and they can also be classified as non-governmental organisations (NGOs; information of expert). The municipal councils are the largest share-holders and housing associations’ Boards of Directors are dominated by mu-nicipal representatives. Tenants are not represented on the Board, but they may become involved in specific projects, mainly urban renewal projects aim-ing at improving the quality of life of the neighbourhoods (information of ex-pert). The level of tenant participation varies considerably between housing associations, however.
In 2001, 99 housing associations were active in the social rental sector.10 No housing association was active in six of the 308 municipalities, meaning that most of the housing associations were active in more than one municipality. Competition among the housing associations, however, is not usually seen as an issue except perhaps in Gent and Antwerp (and also Kortrijk; information of expert). Competition on local housing markets is generally not seen as an
9 The new Decree on Social Rent, that includes income limits, was passed on October 12, 2007 (Vlaamse
Regering, 2007a). See Section 4.4.3.
10 In 2008 there were 95 housing associations left (information of expert).
[ 67 ]

issue, because “there is no overlap between the spheres of activity of the dif-ferent associations” (Winters, 2004, p. 62).
In addition to the 99 housing associations providing mainly social rental dwellings, and some owner-occupied dwellings, there were also 19 housing associations that specialised in building and selling owner-occupied dwell-ings to middle-class households.11 Alongside these activities, they also supply subsidised loans from the VMSW to the buyers of mainly new-build dwellings (information of expert).
4.2.3 Quality of the housing stock
Winters et al. (2004; see also Winters, 2004) report that the quality of the hous-ing stock in Flanders is relatively low compared to that in other European countries, although within Belgium, Flanders is the region with the youngest housing and best-quality housing stock (Van der Heijden et al., 2002; Vanneste et al., 2007). Winters (2004) ascribes the bad quality of dwellings partly to the limited grants that have been made available for urban renewal in Flanders. Neither must it be forgotten that Belgium has an old housing stock combined with a low rate of new construction, compared to other countries (De Deck-er et al., 2005). The sub-standard quality was associated particularly with the market rented sector. In the social rented sector, tenants were generally fairly satisfied with the quality of housing (Pannecoucke, 2001).
The available data confirms these assertions, even though the results of the 2005 Housing Survey show that housing quality in general has improved over the last ten years (Heylen et al., 2007). Social tenants more often live in one-family dwellings (54%) than market tenants (42%). Social tenants have on average more bedrooms (2.2) than market tenants (2.1). The differences be-tween the owner-occupier sector and the rental sector are generally greater, however, than those between the two rental sectors: more than 90% of owner-occupiers live in a one-family dwelling; owner-occupiers have an average of 2.9 bedrooms per dwelling.
When asked, occupiers generally confirm which aspects are of better qual-ity, as Table 4.3 shows. Usually, the social rental sector scores better than the market rental sector in terms of the comfort and physical condition of the dwelling and also in terms of the occupiers’ satisfaction with the dwelling.
It is only when surveyors evaluate the external physical condition of the dwelling that the ranking of the tenures differs (Table 4.4). The external quali-ty of dwellings is evaluated by experts as ‘good’ for almost 96% of cases in the social rental sector. The owner-occupied sector is next with almost 95%, and
11 In 2008 twelve housing associations were specialised in owner-occupied dwellings (information of ex-
pert).
[ 68 ]

the market rental sector follows with 91.5%. The same order of ranking can be found for the bad external quality of the dwelling; differences are small though.
The reasons for these differences between the evaluations of surveyors and occupiers may be due to differences between the inside and the outside of dwellings. The surveyors only evaluated the external physical condition of the dwelling, while the occupiers live inside the dwelling. Another reason may be that the Flemish appear to have strong preference for home owner-ship (see next section). This may explain why homeowners, having achieved their aim, are more satisfied than tenants.
[ 69 ]
Table 4.3 Evaluation of comfort, physical condition, and general satisfaction of dwelling based on the opinion of the occupant, percentages, Flanders, 2005
Measure of evaluation Owner-occupied Market renting Social renting
Evaluation of comfort1
Very good quality 14.2 1.4 0.3
Good quality and spacious 29.7 12.0 19.7
Good quality 32.1 51.4 59.0
Basic quality 22.1 29.1 18.2
Insufficient quality 1.9 6.1 2.7
Total 100.0 100.0 100.0
Summary index of physical condition2
Good 71.2 45.9 56.1
Moderate 22.2 35.2 32.4
Bad 6.3 16.1 10.2
Very bad 0.3 2.7 1.3
Total 100.0 100.0 100.0
General satisfaction
Very satisfied 40.8 22.9 25.5
Satisfied 55.7 57.1 63.4
Neither … nor … 2.7 12.2 6.5
Unsatisfied 0.5 5.5 3.8
Very unsatisfied 0.2 2.3 0.8
Total 100.0 100.0 100.0
Source: Heylen et al. (2007), based on Woonsurvey 2005
1) The comfort of the dwelling is measured based on the opinion of the occupants about the equipment of the dwelling (e.g. toilet, bathroom, double windows, central heating, kitchen), the size of the dwelling, and physical characteristics of the dwelling.
2) The quality of the dwelling is measured on the basis of the opinion of the occupants about six physical characteristics of the dwelling: electrical facilities, walls inside, walls outside, windows, gutter, and roof.

4.3 Characteristics of tenants
According to the Flemish Woonsurvey 2005, the age groups of 35 years of age and younger and 65 years of age and older are overrepresented in the group of market tenants, when compared with owner-occupiers (Elsinga et al., 2007b). Social tenants in particular have a less privileged social profile than the Flemish average, as Table 4.5 shows. They are more often unemployed (a little higher in social renting than in market renting). Their level of schooling is lower: the share of those with no education or lower education in the so-cial rental sector (67%) is almost double that in the market rental sector (34%). The share of single-person households is highest in the market rental sector (42%) and the share of single-parent tenant households is highest in the so-cial rental sector (21%).
Table 4.6 shows some evidence of the incomes of households in 2005. The average monthly net income in the social rental sector (€1,318) is lower than in the market rental sector (€1,710), which again is lower than in the owner-occupied sector (€2,236). The lowest percentiles in the market rental sector and in the social rental sector have a comparable average income, while this is at least €147 per month higher for homeowners. The differences between the sectors become more pronounced the higher the percentile: for percentile 90 the income is almost €1,000 lower in the social rental sector than in the market rental sector.
Table 4.7 shows that rent levels are, both on average and per percentile, higher in the market rental sector than in the social rental sector. Rent lev-els in the market rental sector which involve intermediation by real estate agents are also higher than in the part of the sector without intermediation. This may indicate that there are two segments within the market rental sec-tor, with real estate agents focusing on the segment with the more expensive properties. It may also indicate that real estate agents are able to negotiate higher rents.
As Table 4.8 shows, the higher rent levels of the market rental sector lead to lower residual incomes (the net household income per month after the de-duction of rent) on average for the lowest 30 percentiles in the market rental
[ 70 ]
Table 4.4 Evaluation of external physical condition* of dwelling by surveyors, percentages, Flanders, 2005
Lable of evaluation Owner-occupied Market renting Social renting
Good 94.6 91.5 95.9
Average 4.9 7.1 3.9
Bad 0.5 1.4 0.2
Total 100.0 100.0 100.0
Source: Heylen et al. (2007), based on Woonsurvey 2005
* The external quality of the dwelling is measured based on the quality of the roof, the quality of the façade and the quality of the external woodwork.

sector, when compared with the social rental sector. The average proportion of net household income which is spent on rent (not corrected for household composition) is also higher in the market rental sector than in the social rent-al sector, as Table 4.9 shows. It is also higher in all quintiles. However, as Table 4.8 shows, this does not necessarily mean that affordability is low, especially not for higher-income market tenants. The conclusion must be, however, that the lowest average residual incomes are to be found in the market rental sec-tor. This conclusion is supported by the calculations of Winters et al. (2007), which show that more than 4% of market tenants have an equivalent residual income per month (residual income corrected for household composition) of less than €250, while this applies to a little more than 2% of all social tenants.
Furthermore, in the last ten years the average rent-to-income ratio has in-creased to a greater extent in the market rental sector than in the social rent-al sector (Heylen et al., 2007). In the social rental sector, this increased from around 19% in 1995 to around 22% in 2005, while in the market rental sector it increased from around 22% to 30%, for the same years. Incomes increased less than rent in all cases, and between 1992 and 2005 tenants’ incomes de-
[ 71 ]
Table 4.5 Employment, education and household composition of Flemish households and according to tenure, percentages, Flanders, 2005
Characteristic of respondent Flanders Owner-occupier Market tenant Social tenant
Employment
Paid work 59 61 60 36
Not in paid work 41 40 40 64
Total 100 100 100 100
Not in paid work
Unemployed 14 11 23 26
Pension 64 67 52 48
Other 23 22 24 26
Total 100 100 100 100
Education
No certificate, lower secondary 34 31 34 67
Higher secondary 33 33 37 28
Other higher 34 37 22 6
Total 100 100 100 100
Household composition
Single 25 19 42 33
Couple with children 35 40 19 21
Couple without children 33 35 27 25
Single-parent 8 6 12 21
Total 100 100 100 100
Source: Vandenbroucke et al. (2007), based on Woonsurvey 2005

[ 72 ]
Table 4.6 Average net household income per month and per percentile in euros, Flanders, 2005
Owner-occupier Market tenant Social tenant
Average net income per month 2,236 1,710 1,318
Percentile of monthly net income
10%* 947 800 734
20%* 1,200 1,000 900
30% 1,438 1,150 1,008
40% 1,657 1,300 1,117
50% 2,000 1,500 1,239
60% 2,355 1,645 1,351
70% 2,700 1,983 1,500
80% 3,091 2,479 1,693
90% 3,718 2,947 1,976
Source: Vandenbroucke et al. (2007), based on Woonsurvey 2005
* For example: 10% of the incomes of owner-occupiers is lower than € 947 per month; 20% of the incomes of owner-occupies is lower than € 1,200 per month.
Table 4.7 Average rent per month and per percentile in euros, Flanders, 2005
Market rent
Without the agency of an intermediary or Social Rental Agency
Through the agency of a real estate agent Social rent Landlord1
Average rent per month 4372 415 481 258 470
Percentile of monthly rent
10%3 250 250 312 147 186
20%3 312 300 374 182 250
30% 351 335 405 203 310
40% 397 370 440 235 353
50% 420 400 450 249 400
60% 450 435 475 266 417
70% 496 475 505 300 454
80% 530 500 570 335 500
90% 615 600 670 390 654
Sources: Elsinga et al. (2007b); Vandenbroucke et al. (2007), based on Woonsurvey 2005
1) The rents in the last column are derived from the annual rent income per dwelling divided by 12. 2) Is € 431 in Heylen et al. (2007). 3) For example: 10% of rents of market tenants is lower than € 250 per month; 20% of rents of market tenants is lower
than € 312 per month.
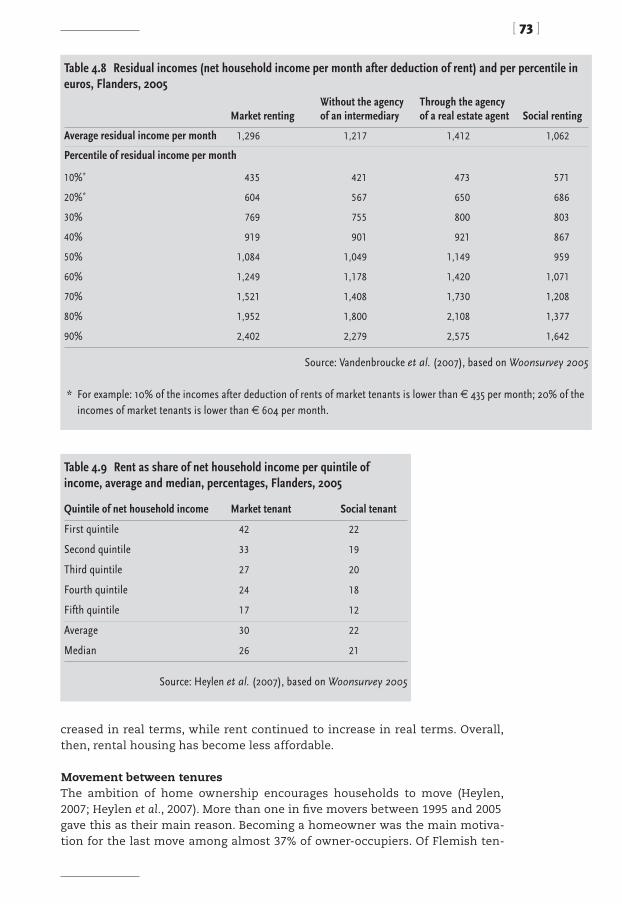
creased in real terms, while rent continued to increase in real terms. Overall, then, rental housing has become less affordable.
Movement between tenuresThe ambition of home ownership encourages households to move (Heylen, 2007; Heylen et al., 2007). More than one in five movers between 1995 and 2005 gave this as their main reason. Becoming a homeowner was the main motiva-tion for the last move among almost 37% of owner-occupiers. Of Flemish ten-
[ 73 ]
Table 4.9 Rent as share of net household income per quintile of income, average and median, percentages, Flanders, 2005
Quintile of net household income Market tenant Social tenant
First quintile 42 22
Second quintile 33 19
Third quintile 27 20
Fourth quintile 24 18
Fifth quintile 17 12
Average 30 22
Median 26 21
Source: Heylen et al. (2007), based on Woonsurvey 2005
Table 4.8 Residual incomes (net household income per month after deduction of rent) and per percentile in euros, Flanders, 2005
Market rentingWithout the agency of an intermediary
Through the agency of a real estate agent Social renting
Average residual income per month 1,296 1,217 1,412 1,062
Percentile of residual income per month
10%* 435 421 473 571
20%* 604 567 650 686
30% 769 755 800 803
40% 919 901 921 867
50% 1,084 1,049 1,149 959
60% 1,249 1,178 1,420 1,071
70% 1,521 1,408 1,730 1,208
80% 1,952 1,800 2,108 1,377
90% 2,402 2,279 2,575 1,642
Source: Vandenbroucke et al. (2007), based on Woonsurvey 2005
* For example: 10% of the incomes after deduction of rents of market tenants is lower than € 435 per month; 20% of the incomes of market tenants is lower than € 604 per month.

ants who had planned to move but not succeeded, a little over 46% reported the desire to become a homeowner, and about half of all tenants reported the same. About 17% of tenants said they would like to buy their rental dwelling.
When studying the actual moves made by households that moved in the ten-year period of 1995-2005, 12% changed from owning to renting, 32% re-mained renting, 34% moved from renting to owning and 22% remained as owner-occupiers. Marital break-up was the most important reason (46%) for moving house for the group changing from owner-occupation to renting. Of all movers, 12% gave this as their reason for moving. The elderly, single peo-ple and lone parents were over-represented among those who changed from owner-occupation to renting. The main reasons for tenants to move from one rented dwelling to another were the termination of the tenancy by the land-lord (14%) and the bad quality of the dwelling (12%).
4.4 Housing policy
4.4.1 Belgian history
Since the first Housing Act of 1889, the main objective of central government has been to encourage owner occupation (Boelhouwer & Van der Heijden, 1992; De Decker, 2001). This was based on the social teachings of the Roman Catholic tradition that owning rather than renting is the best basis for the development of family life and family well-being. The Liberals agreed with this line of reasoning, which is widespread in conservative politics (Goossens, 1982). Various forms of subsidisation, such as the loans available at favourable interest rates that were introduced in 1889, and the premiums for building or buying owner-occupied dwellings that were introduced around 30 years later, were used to help the sector become the largest sector in the Belgian housing market (Elsinga et al., 2007b; Kirchner, 2006; Winters et al., 2007). Such policies helped richer workers find a newly constructed dwelling, rather than solving the general problems of bad quality housing (slums) and the affordability of housing (Elsinga et al., 2007b; see also Boelhouwer & Van der Heijden, 1992; De Decker, 2001; Kirchner, 2006).
In 1919, the National Society for Affordable Dwellings (Nationale Maatschap-pij voor Goedkope Woningen en Woonvertrekken, NMGW) was established. It was to fund the accredited local housing associations that would build social rent-al dwellings. From 1922 onwards, the NMGW was also allowed to sell owner-occupied dwellings. The aim was to improve housing for workers from the cit-ies (Goossens, 1982).
Because of the Great Depression, the NMGW ran short of funds and the government set up the National Society for Small Land Ownership (Nationale Maatschappij voor de Kleine Landeigendommen, NMKL) in order to attempt to im-
[ 74 ]

prove living conditions in the countryside, but without success. The rate of social housing construction remained low, while housing construction in the market rental sector bloomed as a result of the abolition of the strict rent reg-ulation that had been in place since 1919.
After World War II, Belgian policy returned to its roots from before. While the De Taeye Law of 1948 revitalised the system of grants for owner-occupa-tion, the Brunfaut Law of 1949 attempted to provide more funds to the NMGW and the NMKL. The number of grants for owner-occupation and the number of social rental dwellings constructed increased as a result.
The De Taeye Law has been amended several times since its introduction. Income limits were introduced in 1960, and in 1967 grants became available for conversion and redevelopment, as well as construction, in order to facili-tate slum clearance. Other changes were also made in the 1950s and 1960s. The NMGW and NMKL were given more authority, as symbolised in their new names the National Society of Housing (Nationale Maatschappij voor de Huis-vesting, NMH) and the National Land Society (Nationale Landmaatschappij, NLM). In the second half of the 1970s, the government used them to stimulate the economy in Keynesian style. This led to a boom in the construction of social housing (see 1980 in Table 4.10), but also resulted in rapidly increasing debts for both organisations. One of the solutions was to be the introduction of the legal regulation of rents in 1975.
After the goal of a co-ordinated housing policy was formulated in the 1950s, this was realised through the publication of the 1970 National Housing Code (Huisvestingscode; Boelhouwer & Van der Heijden, 1992; Winters, 2004). It sum-marised all the existing housing rules and regulations, thus forming the legal basis for housing policy in Belgium. Three aims of post-war Belgian housing policy can be distinguished:
■ to tackle the housing shortage by encouraging low-income households to become homeowners;
■ to provide social rented housing for those unable to become homeowners; ■ to improve the quality of housing through a renewal policy.
Since the aim of housing policy has been to aid as many households as pos-sible, aid has not necessarily been targeted at the neediest households. With the possible exception of the second half of the 1970s (and 1991 see next sec-tion), housing policy in Belgium has been characterised by a relatively low fi-nancial commitment from the government, not only at the level of the house-hold, but also from a wider macro perspective (De Decker, 2001).
4.4.2 Flemish history
The three aims of housing policy outlined in the last section are still relevant to the regions of Belgium. Responsibility for housing policy (excluding hous-
[ 75 ]

ing taxation and market rent policy) was regionalised in 1980 (see Section 4.1; Elsinga et al., 2007b). However, the passing of housing debts for social rental housing back and forth between the national and regional governments led to a financial and institutional impasse followed by a rapid fall in the rate of construction of social rental housing, as Table 4.10 shows. This collapse coin-cided with the decline in the rate of construction of other dwellings, which reached an all-time low in 1986 due to the economic crisis of the 1980s (see
[ 76 ]
Table 4.10 Dwellings completed, Belgium, 1980-2003, selected years
Year Total Social rental dwellingsShare of social rental dwellings in total
1980 48,600 10,300 22
1981 32,700 10,000 31
1982 28,600 4,500 16
1983 28,000 1,500 5
1984 23,400 1,500 7
1985 30,300 700 2
1986 24,400 530 2
1987 29,300 900 3
1988 33,000 660 2
1989 44,400 1,200 3
1990 43,100 1,200 3
1991 44,500 500 1
1992 46,600 750 2
1993 43,700 10,100 23
1994 3,000
1995 41,600 3,300 8c
1996 2,600
1997 2,700
1998 32,600 2,600c 8
1999
2000 38,900 2,700c 7
2001 41,000 3,500c 8.5
2002 36,500 2,200c 6
2003 40,700 2,400c 6
2004 46,200 6*
Sources: National Board of Housing, Building and Planning (Sweden) & Ministry for Regional Development of the Czech Republic (2005): total 1980, 1985, 1990, 1995, 2000, 2003, 2004; Kirchner
(2006): other years, except 2004; Federcasa, Italian Housing Federation (2006): 2004
c) calculated from data in other columns. * 2005.

also De Decker, 2002). It was not until 1988 that the VHM could begin its work.Budget cuts were reversed, partly in response to the political breakthrough
of the far right in 1991. The Flemish government proclaimed an urgent con-struction programme for the social rental sector. An organisation called NV Domus Flandria was established and charged with the task of building 10,000 social rental dwellings relatively rapidly (see also De Decker, 2001). Political interest in social rental housing tailed off once this aim had been achieved. By the late 1990s, the number of dwellings that the VHM contracted out had fallen to about 2,500 per year.
In 1993, the De Taeye system of subsidising owner-occupied housing was replaced by a new system called Financial Contribution to Loan Costs (Tus-senkomst In de Leninglast; TIL). Under this system the Flemish government sub-sidised these dwellings partly by repaying the loans used for building, buying and renovating dwellings. In 1996, the subsidies were halved and in 1999 the TIL was abolished, ending an era of 75 years of subsidising home ownership through grants.12
In effect, the Flemish government started spending more on social rental housing than on owner-occupied housing in the 1990s (Winters et al., 2007). This signified a substantial policy change, but since the federal government retained its control of income tax policy, the balance of total government spending remained in favour of owner-occupation, overall.
In the 1990s the Flemish government not only replaced the more general owner-occupier subsidies with the TIL – a more specific subsidy – and later scrapped this subsidy entirely, but also introduced other instruments directed more specifically at particular groups or goals (Elsinga et al., 2007b). In the late 1990s for instance, levies were introduced for the market rented sector for owners of dwellings who keep those dwellings vacant, who do not maintain the exterior of the dwellings or who let the dwellings in a bad state.
4.4.3 Recent housing policy
The 1970 National Housing Code (Huisvestingscode) established the legal basis for housing policy in the three regions of Belgium (Winters, 2004). It remained in force even after the process of regionalisation into three federal regions, until the regions started developing their own housing codes.
The Flemish Housing Code (Vlaamse Wooncode), which was passed in 1997, was based on the right to decent housing which is enshrined in Belgium’s constitution (article 23; see also Elsinga et al., 2007b; Vlaamse Overheid, Agent-schap Inspectie RWO – Wooninspectie, 2008). It defined the objectives of housing
12 Social loans for acquisition of dwellings and small renovation grants were still available (information of
expert; see Doms et al., 2001).
[ 77 ]

policy and the tools with which they would be achieved. It created new tools, such as standards for security, health and housing quality. It also charged local authorities with the task of organising broad consultations with stake-holders in order to coordinate their activities in the fields of housing and wel-fare. The local authorities are considered as having few responsibilities for so-cial housing, however, unless they own some units themselves.
Market rentingThe fact that history of the market rental sector has been a matter of contract (see Boelhouwer & Van der Heijden, 1992) and is still largely the legal respon-sibility of central government rather than of the Flemish government may very well explain the sector’s scant treatment in the Flemish Housing Code. The code contains rules on the accreditation of Social Rental Agencies and tenant organisations and on housing quality. The latter rules (information of expert) were stipulated by the Flemish government’s decree of 6 October 1998 which defined the supervision of quality control (see Section 4.7.2). The de-cree was published on 30 October 1998.
Social rentingOn the subject of social housing, the Housing Code identifies the social hous-ing associations and their sector organisation as the preferred partners for the implementation of social rental housing policy. The Flemish Housing Code de-fines their tasks as “the provision of social dwellings, revaluation of the hous-ing stock and pursuit of a social land and buildings policy” (cited from Winters, 2004, p. 64). The letting of social rental dwellings based on the Flemish Housing Code is regulated by the decree of the Flemish government of 20 October 2000.
This situation changed as a result of the reform of the legislative frame-work for social rental housing, which delivered its proposals in the summer of 2007 (Vlaamse Regering, 2007b). The Flemish government passed a draft version of the Decree on Social Renting (Kaderbesluit Sociale Huur), as well as a draft of the Implementing Decree on Finance of Social Landlords. The former decree applies to all types of social housing, housing associations, VMSWs, local au-thorities, OCMWs, Social Rental Agencies and the Flemish Housing Fund. The definition of social landlord is thus broader than only housing associations plus the VMSW, the organisations that were included under the old Flemish Housing Code of 1997.
The most important innovations of this round of legislation include:1. Permanent residence permit. Because social rental dwellings are connected
to an indefinite right to stay, the prospective tenant should have a perma-nent residence permit (compare with Section 4.6.1).
2. Language and naturalisation or establishment requirements at the mo-ment of registration and of allocation of a social rental dwelling. The re-quirements concern the willingness of prospective tenants and new ten-
[ 78 ]

ants to learn the language and follow citizenship courses.13
3. Trial period of two years for new tenants.4. Possibility of allocating dwellings based on local needs within the frame-
work of the Flemish allocation system (information of expert).5. New method of calculating social rent to increase affordability and transpar-
ency. This will no longer be based on basic rent plus income coefficient, but on market rent, household taxable income and the quality of the dwelling.
6. Supervision to guard the implementation of the framework order on social renting (not a new option; information of expert).
7. Financing system based on a repayment-only loan for 33 years, plus a cor-rection based on the difference between the housing association’s income and norms for expenditures in order to promote efficiency.
The new Decree on Social Renting (Kaderbesluit Sociale Huur), which replaced that of 20 October 2000, was passed on October 12, 2007. The implementation Decree on Finance of Social Landlords was also passed on that date (Vlaamse Regering, 2007b). The legislation entered into force on 1 January 2008. In gener-al, this new legislation aimed to give potential tenants and new tenants more obligations (Vlaamse Regering, 2007b).
The respective sections of this chapter will provide further information on the various elements of this new policy and on other recent legislation on so-cial renting, such as the legislation that meant that a conditional right to buy became reality, which is described in Section 4.5.2. Information on the reform of the rent allowance available for those moving to a good-quality dwelling can be found in Section 4.8.3. The supervision and accreditation of housing associations is the topic of Section 4.7.1. All these descriptions demonstrate that Flemish housing policy is undergoing a process of change.
4.5 Rent control, tenant security and other property rights
Rent control, tenant security and other property rights differ between the private and social rental sectors. Since a system of rent calculation based on (inflation-indexed) market rents has recently been introduced for the social sector, rent control has become similar in both rental sectors. The main dif-ference, however, remains that rents in the social sector are calculated on the basis of household income (Section 4.5.1), while this is not taken into account
13 The language requirement appears not to be new, as the Decree of 15 December 2006 (published on 19
February 2007) changing the 1997 Flemish Housing Code, contained the requirement to be willing to learn
Dutch when moving into a social dwelling (with thanks to an expert for drawing attention to this decree).
[ 79 ]

in the market sector (Section 4.5.3). Tenant security also differs between both tenures (Sections 4.5.2 and 4.5.3), as well as the conditional right to buy (Sec-tion 4.5.2), which is valid only for social renting under certain restrictions.
4.5.1 Social rented sector: differential rents
The 2007 Decree on Social Rent, which was implemented on 1 January 2008, stipulates how rents in the social rental sector are calculated. An important change from the method of calculation that had previously been in place is the more prominent role for the market in the calculation of rent.
Under the old method, rent was determined mainly by the ‘updated cost price’ (basic rent) of the dwelling and the income and household composition of the tenant (Winters, 2004). The coefficient used to update the cost price was determined by government and consisted not only of the historic build-ing costs, but also of the costs of renovating and improving the dwelling.
The new method, by contrast, takes as its starting point the market rent14 for a dwelling at the beginning of the contract (Departement RWO, 2008). This market rent is then modified using the health index15 each year for nine years. This (adjusted) market rent is known as the basic rent of the contract. After the period of nine years has elapsed, the basic rent will be reset on the basis of the market rent for the dwelling and a new nine-year period of indexation will start. In principle, the basic rent is the market rent that is owed for a dwelling.
The basic principle by which the affordability of a social rental dwelling is determined is that a tenant should pay no more than 1/55th of their pre-dicted annual taxable income as monthly rent.16 This amount, in addition to a family discount (based on the number of dependents) and a housing qual-ity discount,17 is used to produce the ‘adjusted basic rent’. This adjusted basic rent should fall in the range between the minimum calculated rent18 and the
14 Market rent will be determined by a valuation carried out by public notaries for a representative sample
of dwellings drawn up by the VMSW. The valuation will be valid for a period of nine years, but will be up-
dated annually (method to be determined by the minister). More dwellings will be valued each year to keep
the sample updated. For any dwelling that is not valued by a notary, the landlord will determine the market
value on January 1st of a year.
15 This is the consumer price index minus the price development of some ‘unhealthy’ products such as
alcohol and tobacco (http://www.statbel.fgov.be/indicators/cpi/cpihea_nl.asp#1).
16 The share in the old system was 1/60th of this income (Winters, 2004); thus, in the new method of rent
calculation, rent as share of income can be higher than in the old method.
17 This includes the possibility of a correction for investment in environmentally friendly energy-saving
features by the landlord. The discount for quality will be inversely proportional to the basic rent, varying be-
tween zero (for dwellings with the highest basic rents) and €150 (for dwellings with the lowest basic rents).
18 The minimum rent will vary in direct proportion to the market value, but will be set at €100 for dwell-
ings with the lowest market value and at €200 for dwellings with the highest market value.
[ 80 ]

basic or market rent of a dwelling. The adjusted basic rent is the actual sum that is to be paid as rent for a dwelling. The difference between the basic rent and the adjusted basic rent then becomes the social discount received by the tenant.19 If the dwelling is considered too large for the size of the household, a surcharge was to be payable as of 1 January 2009.
Rent increases will come into force on 1 January of any year. Rent can also be recalculated for a limited number of other reasons. One of these is that household income has fallen by at least 20% for three consecutive months.
The new system of determining rents allows tenants whose incomes ex-ceed the limits for the social rental sector to remain in their dwellings, since the basic or market rent is the maximum rent that any tenant must pay for a dwelling. This mechanism implies that contracts will not have to be termi-nated and situations such as the one that occurred in December 2002 can be avoided (Kirchner, 2006; Winters, 2004). At that time, a political agreement was reached that resulted in many households on higher incomes receiving letters demanding that they leave their social rental dwellings within two years. The reason for this was that the rent surplus they were paying was lower than the market rent (information of expert). The storm of protest arising from tenants and housing associations resulted in the postponement of this agreement.
For the housing associations and the VMSW, the system of rent calculation was introduced on 1 January 2008. It includes a transitional period of three years. For the dwellings of the Flemish Housing Fund (Vlaams Woningfonds), the municipal welfare organisations (OCMWs) and the local authorities, the date of the introduction of the new system is to be determined by the minis-ter responsible for housing. In due course, then, the new system of rent set-ting will be applied by the various groups of social landlords. Only in the case of the Social Rental Agencies (see Section 4.6.2) will this rent calculation not apply; in this case, the rent that the agency has agreed to pay to the landlord will be the relevant rent.
The new system of rent setting and adjustment has been determined en-tirely by the Flemish government (Winters & Van Bortel, 2008). Any degree of autonomy in rent setting that associations previously had, in order to ensure a balanced budget for example, has been made impossible by the new legisla-tion.
4.5.2 Social rented sector: other property rights
Security of tenure in the social rented sector is indefinite after a trial period of two years for new tenants. This provision was introduced by the 2007 De-cree of Social Renting (see Section 4.4.3). The Constitutional Court ruled on 10
19 A discount on a local tax for property is separately available.
[ 81 ]

July 2008 that the social landlord cannot terminate the contract on their own authority (Grondwettelijk Hof Judgement No. 101; with thanks to the experts for drawing attention to this ruling). A decision by the ‘justice of the peace’ (vrederechter) will be necessary for such a termination. The 2007 Decree on So-cial Renting will have to be adapted to this ruling.
Another property right concerns the conditional right to buy. The fact that social tenants in Flanders used to have the ‘right’ to buy may have been a strong reason to make a fresh attempt in this area. The Transfer Decree (Over-drachtenbesluit) that was published on 8 December 2006 and came into law ten days later is the legal basis here. The old ‘right’ to buy was not abolished for policy reasons, but for legal reasons. The Policy Whitepaper 2004-2009 explains that on 30 June 2004 the ‘court of arbitration’ annulled the condi-tional right to buy with effect from 20 December 2002 (Keulen, 2004). Before that date, the conditional right to buy had actually been rather limited. In fact, purchase could only occur with the permission of the housing association, and if the dwelling was at least 15 years old. Sales were thus relatively low. Only slightly over 3,000 dwellings were sold in the period 1992-2002, mostly to improve the financial situation of the housing associations which sold them (Winters, 2004).
The ‘new’ right to buy allows tenants to buy their social rental dwelling provided that it is not an apartment, it is more than 15 years old and the ten-ant has rented it for at least five years. This right to buy appears to be a gen-uine right to buy, since the housing association no longer needs to give its explicit permission for the sale of the dwelling. The previous stipulation that no sales of social rental dwellings were allowed unless sufficient social rental dwellings were available has also been abolished (Winters, 2004).
4.5.3 Market rented sector: rent control and security of tenure
Rent control and security of tenure are federal responsibilities.20 The Belgian Rent Act (Huurwet) is based on the strong protection of property rights. This arises from the Code Napoleon, which was introduced in 1804 (De Decker, 2001; Kirchner, 2006; Winters et al., 2007). Since this is based on a conservative-liberal philosophy, it assumes equality between the parties concerned and is based on contractual freedom between them.
Parliament sought to pursue better tenant security and greater rent con-trol through the Belgian Rent Act of 1991, which dedicated a separate section to rent regulation in the Civil Code (De Decker, 2001, p. 29). A statutorily guar-anteed security of tenure of nine years can be seen as the corner-stone of the
20 There are plans to regionalise these (information of experts).
[ 82 ]

reform, although exceptions to this were and are still allowed. These refer to the revision of the Belgian Rent Law in 1997, which allowed only one renew-al of a short-term contract, for instance. It also contains binding rules which cannot be changed in individual rental agreements and additional rules that apply when the rental agreement includes no other stipulations (Elsinga et al., 2007b; Vandenbroucke et al., 2007).
Security of tenureThe Rent Law distinguishes four different types of rental agreements with limited duration: a life-long agreement, a nine-year agreement, a long-term agreement (of over nine years) and a short-term agreement (of three years or shorter; Elsinga et al., 2007b; Kirchner, 2006).21 The standard rental agree-ment has a duration of nine years. The nine-year period is automatically ap-plicable for oral agreements, written agreements with no contract length or written agreements with a contract period of between three and nine years. Even though the rental agreement with a duration of nine years is denoted as standard contract, with its share of 45% in all the contracts as originally en-tered into that were registered by Flemish Consultation Organisation for Oc-cupiers (Vlaams Overleg Bewonersbelangen, 2008; with thanks to the experts for drawing attention to these data) for 2007, this type of contract does not have a majority. The majority of contracts in 2007 were the short-term contracts of three years or shorter. They had a share of 52%, while the legislator actually introduced them as exceptions. The rest of the contracts are contracts which run longer than nine years (2%).
Neither landlord nor tenant can terminate a short-term contract unless the contract explicitly provides for this. Since 1997, a short-term contract can only be extended once. This must be done in writing and the same terms (same rent, etc.) must be maintained. Unless the rental agreement is termi-nated at the end, it will automatically become a nine-year rental agreement.
The registration of new rental agreements with the government has been incentivised since 2007. Where the rental agreement is not registered, the tenant can opt to leave the dwelling without notice and without reimburse-ment to the landlord. Until 2006, there was little incentive to register new agreements, even though costs involved were low (€30). The advantages were not perceived as large, only the possibility of informing a potential landlord-buyer about rent income (Vandenbroucke et al., 2007).
Rent regulationRent regulation differs for new and existing contracts. For new contracts, there is no rent regulation in general. Rents for existing contracts (sitting ten-
21 Tenant security is also concerned with putting the key money into a blocked bank account.
[ 83 ]

ants) are regulated with the health index (see Section 4.5.1). This concerns an-nual rent changes.
There are some specifications to the general rules (Elsinga et al., 2007b). When a short-term rental agreement (of three years or less) is not terminated at the end, and thus automatically becomes a nine-year agreement, the an-nual rent indexation with the health index will apply, as well as a rent recal-culation every three years (see below). However, if the tenant terminates the contract at the end of the period, the landlord will be free to set the rent for the new tenant. If, however, the landlord terminates the contract and then enters into a new contract of a maximum of three years with another tenant, the indexed rent may not be higher than that of the old contract. Supplemen-tary provisions, not the Rent Law, regulate the landlord’s termination of the contract.
In special cases, rents may be adapted at the end of a three-year period. Either the tenant or the landlord can initiate such negotiations. If they do not reach an agreement, the ‘justice of the peace’ will decide. The justice can al-low a rent change in two cases: firstly, if there is proof that the rent is at least 20% different from the actual rent because of changed circumstances, or sec-ondly if the landlord can prove that the work necessary to reach the mini-mum quality will increase costs by at least 10%.
4.6 Allocation procedures and criteria
For market rented dwellings, there is no special allocation regime. Such a re-gime only exists for social rental dwellings (Section 4.6.1) and for market rent-al dwellings that Social Rental Agencies rent from market landlords for social purposes (Section 4.6.2).
4.6.1 Allocation of social rented dwellings
Although housing associations have had little margin for independent allo-cation rules, they have used the scope they have creatively (Winters, 2004). Some focused on specific target groups such as the elderly or the handi-capped. In order to be able to achieve a better social mix in neighbourhoods with the aim of improving quality of life, social landlords have called for more flexible allocation rules. The appeals resulted in the Flemish Decree on Social Renting of 12 October 2007 (information of expert). Since 1 January 2008, this has regulated the allocation of social rental dwellings by defining eligibility conditions and allocation rules (Departement RWO, 2008).
There are six eligibility rules. The first three are that applicants must be over eighteen, own no dwelling at the time of registration and be registered in the ‘population’ register or as foreigners. The aim of this requirement is that
[ 84 ]

permanent rental agreements (see Sections 4.4.3 and 4.5.2) should not be en-tered into with temporary citizens. A fourth criterion is about income limits. For 2008, the maximum net taxable income limit in the reference year (three years before registration or allocation) reached almost €18,000 for a single person, almost €19,400 for a handicapped single person and almost €26,900 for others plus €1,500 per extra person.
The municipality or partnership of municipalities is regarded as the or-ganiser of local policy, and as such it is possible for this actor to draw up an allocation code, after negotiating with actors on the local housing market. Such an allocation code is necessary in order to ensure habitability, reserve access to social rented housing for special groups, or waive the standard re-quirement of having local ties. If a local authority draws up an allocation code itself, income limits may be higher than the standard: €26,850 for a single person, €28,350 for a handicapped single person and €35,800 for others plus €1,500 per extra person.
The two last criteria for registration concern the willingness of the pro-spective tenant to learn Dutch, unless there are good reasons (such as a health condition) not to, and to become a naturalised citizen, where possible. The Constitutional Court ruled on 10 July 2008, that this requirement is not applicable to prospective tenants in municipalities on the language border who prefer to make use of language facilities offered (Grondwettelijk Hof Judge-ment No. 101). It is also possible for such a potential tenant to insist that com-munication takes place in French. The Constitutional Court specifies here that penalties for a refusal to learn Dutch or to follow a citizenship course should be proportionate to the inconvenience caused. Dissolution of a rental agree-ment is only possible subject to prior judicial verification. The 2007 Decree on Social Renting will need to be adapted to this ruling.
On the subject of registration, the housing association will offer to send the prospective tenant’s registration to other housing associations active within the municipality and in neighbouring municipalities. Each social hous-ing association works with individual waiting lists of prospective tenants once they have registered (Departement RWO, 2008). Waiting lists must be up-dated every second year.
Priority rules determine the allocation sequence of the dwellings. Two sys-tems are in use as of 2008. ‘Other’ social landlords will be able to choose be-tween both systems. The second system is to be used by Social Rental Agen-cies and will be described in the next section.
The first system is to be used by the VSMW and the social housing associa-tions. It is similar to the system that the social housing associations operated until 2008 (Winters, 2004). Priority for a dwelling is determined on the basis of a number of criteria. The first one is whether the dwelling is of a suitable size for the household (Departement RWO, 2008). If not, a payment needs to be made for the ‘oversized’ dwelling. A second criterion is whether the candidate
[ 85 ]

satisfies the ‘absolute priority’ rules (such as having a handicap, being of age, or being in urgent need of (other) housing). Relevant as third criterion is the chronological order of registration. There are also two ‘optional priority’ rules. The first was included in the 2000 Social Rental Decree (Sociaal Huurbesluit) and allows the landlord to prioritise ‘local’ candidates who have been living in the area for at least three of the previous six years. The second allows land-lords to prioritise candidates who do not already live in a social rental dwell-ing or who do not have a permanent rental agreement (renting from a Social Rental Agency or OCMW).
More than 290,000 households were eligible for social rental housing on the basis of income requirements for 2005 and the rules for 2007 (Hey-len et al., 2007; Winters et al., 2007). This group is several times the number of households that were on the waiting lists for social rental housing (more than 58,000 in December of 2005). The average waiting time for a social rent-al dwelling was two years (716 days). Winters (2004) reports that the waiting time for some popular dwellings could be as much as six years or more.
4.6.2 Social Rental Agencies: allocation of market rented dwellings with a social purpose
In Flanders, the allocation of market rental dwellings is generally left to the market (Elsinga et al., 2007b). However, ‘Social Rental Agencies’ (Sociale Ver-huurKantoren) or letting offices exist. These play with 0.2% of households a small role in the allocation of market rented dwellings to vulnerable house-holds for social purposes.
Social Rental Agencies started as grass-roots organisations in the mid-1980s, originating chiefly from welfare work institutions which were seeking to ‘socialise’ the market rented sector (De Decker, 2002). The limited institu-tional response to the economic crisis of the 1980s was the reason for their emergence.
Social Rental Agencies aim to create an alternative in market rent for vulnerable tenants who are unable to find a social rental dwelling (Vanden-broucke et al., 2007). Social Rental Agencies lower the management costs of landlords by doing unpaid work for them, so that lower-than-market rents can be set.22 In exchange for a low rent, the Social Rental Agencies do not charge commission, are responsible for the administration and minor renova-tion work. This is their current primary function (De Decker, 2002). They also offer individualised support for tenants with problems as part of their aim of preventing homelessness. Originally, they also aimed to provide a strong link
22 According to one of the experts, other aspects influence rent level as well. One of them is the desire of
the private landlord to let a dwelling as a social dwelling.
[ 86 ]

between housing and welfare aims and to develop local policy networks on affordable housing.
During the 1990s, the agencies were institutionalised. By 2005 the Flemish government had accredited 40 Social Rental Agencies. They rented out 3,032 dwellings in 2005, and 2,623 of those dwellings were rented out by accredited offices (Vandenbroucke et al., 2007).23 The impact of the letting offices on the housing market is therefore limited.
Twenty-nine of the 40 Social Rental Agencies received subsidies from the Flemish government. According to Winters et al. (2007), the maximum basic subsidy amounts to €65,600 per year. A supplement of €1,500 per dwelling per year is available for the 31st to the 60th dwellings. This amount per dwell-ing decreases to €1,000 per dwelling from the 91st dwelling. At least 75% of the subsidy will be used for staff expenses.
As of 2008, Social Rental Agencies are subject to the 2007 Decree on Social Renting (Departement RWO, 2008). The registration requirements described in the previous section also apply to their clients. The ‘second allocation’ sys-tem is used to allocate the dwellings. It is similar to the system that the So-cial Rental Agencies used prior to 2008. The system allows for the following criteria in this order: the size of household in relation to the dwelling, some ‘absolute priority’ rules (handicap or age if dwelling is suitable; urgency), a needs-based points system and the chronological order of registration. A special absolute priority criterion becomes effective in situations where a potential tenant finds a suitable market rented dwelling. The priority deter-mined on the basis of the points includes weighing four obligatory criteria (need, number of children, actual disposable income, average period of oc-cupation) and two optional criteria (number of years registered, stay in the municipality).
The advantage for the landlord of letting via a Social Rental Agency is that he is not required to carry out the duties performed by the Social Rental Agency, and he also receives a guaranteed rent (Vandenbroucke et al., 2007). If the net income of the landlord does not exceed €50,000, and the landlord lets the dwelling to a Social Rental Agency for at least nine years, the landlord may apply for a renovation subsidy that is also available to owner-occupiers.
4.7 Regulation and supervision
The policy on the supervision and accreditation of social landlords has been undergoing changes since 2006, as will be explained in Section 4.7.1. The
23 The non-accredited stock is owned by OCMWs (9.4%), Social Rental Agencies (2.7%), housing associa-
tions (1.2%) and the provinces (0.3%) (Vandenbroucke et al., 2007).
[ 87 ]
policy on the improvement of housing quality in the private market is being made stricter and more effective. See Section 4.7.2.
4.7.1 Supervising and accrediting social rental housing
Until 2006, the Flemish Housing Association (VHM) was responsible for the finance, supervision and guidance of the social housing associations (Winters & Van Bortel, 2008). On finance, the VHM drew up investment programmes based on the project proposals of the housing associations (Winters, 2004). It also functioned as banker, by offering attractive loans to the housing associa-tions for building and renovating dwellings (see also Section 4.8.1).
The supervisory instruments available to the VHM were a requirement for prior authorisation and the right to approve or ratify decisions. Since the VHM had few sanctioning instruments, the question of the balance between su-pervision and resulting actions emerged. The possibilities for sanctions were either the VHM taking the place of the directors of the housing association or the VHM withdrawing the accreditation of the housing association. These sanctions were seldom used.
Another method of supervision was that the presence of a supervisory di-rector from the VHM on the board of the housing associations to supervise them internally. This director could participate in the meetings of the man-agement bodies of the housing association and had access to all documents. The supervisory director could postpone the implementation of decisions which (s)he considered incompatible with legislation or regulation.
Winters (2004, p. 67) reports that, in general, housing associations found that the Flemish Housing Association (VHM) supervised more on the details than on the final results and they even sometimes perceived this supervi-sion as ‘meddling’. These forms of supervision were labour-intensive and also, therefore, expensive.
Alongside the VHM’s supervisory role, it also had an advisory role for hous-ing associations. These conflicting tasks gave rise to the desire to reform the supervisory structure (information of expert). With the changes in its tasks, the Flemish government also intended to change its relationship with the housing associations (Winters & Van Bortel, 2008). In the 2007 Flemish Hous-ing Code, a new article was inserted specifying that the associations were as-sumed to be autonomous organisations, responsible for good management. They were thus expected to operate more autonomously than before.
Changes in supervision in 2006The change in tasks began with the Decrees on Housing of 24 March 2006 and 30 June 2006 (information of expert). The 2006 decrees (together with other regulation) form the legal framework for the restructuring of the Flemish ministry responsible for housing, which was broader than that for the task
[ 88 ]

of supervision. The decrees also form the legal framework for the transfor-mation of the VHM into the Flemish Association for Social Housing (Vlaamse Maatschappij voor Sociaal Wonen, VMSW). Since 2006, the VMSW has retained its tasks of finance (including financial supervision) and guidance, and was relieved of its supervisory role including the instrument of prior authorisa-tion (Winters & Van Bortel, 2008).
Supervision of the social housing associations was transferred to an agen-cy of the administration called Inspection. This agency is responsible for en-suring that the social housing associations are following the rules and regu-lations. This means that the internal supervisory directors of social housing associations will disappear, because supervisors will be appointed and em-ployed by Inspection. At the beginning of 2008, new legislation on the supervi-sion of social housing associations was being prepared, because the Decree of the Flemish government of 8 June 1999 on the Specific Rules of Supervision of Social Housing Associations was only partially discontinued with the Decree on Housing of 30 June 2006.
The next piece of legislation that was to fill part of this gap was published on 18 July 2008, and was the Decree of the Flemish government With Specific Rules for the Supervision of Social Housing Actors (information of expert). It lays down the duties of social housing actors according to the definition of the 2007 Housing Code (the social housing associations, OCMWs, etc.) vis-à-vis the new external supervisor. They mainly have to provide information on matters such as responsibilities and meetings of the management board to the new external supervisor at the Inspection. This supervisor “can postpone or reverse any decision which the supervisor considers incompatible with laws, decrees, statutes or the public interest.” The supervisor can also levy a fine for a number of offences, such as not submitting documentation on time or implementing decisions that the supervisor had postponed or reversed.
How social landlords are to be supervised is a subject that had still not been fully legislated on by mid-2008. It is difficult to avoid the conclusion that the intended autonomy for social landlords is unlikely to become reality, es-pecially when one considers that any written defence against fines will have to be put before the same supervisor that made the decision to impose the fine in the first place. Even before the Decree of 18 July 2008 appeared, Win-ters & Van Bortel (2008, p. 8) stated: “Unilateral steering by compulsory rules and controls” still forms an important part of reality for social housing asso-ciations.
Changes in accreditationThe registration/accreditation of the housing associations has become the responsibility of the Flemish government (information of expert). According to the Flemish Housing Code, accreditation will be needed if a housing asso-ciation wishes to claim government financing. Accreditation was regulated by
[ 89 ]

the Decree of the Flemish government of 17 December 1997 on the Accredi-tation of Housing Associations. With the Decree on Housing of 30 June 2006, the 1997 decree was partially discontinued. In 2008, new legislation on the ac-creditation of social housing associations was being prepared.
4.7.2 Regulating market rental housing
The 1997 Flemish Housing Code (Vlaamse Wooncode) contains no specific pro-visions for market landlord organisation types. The regulation of the various types of landlord thus depends mainly on the judicial form of the landlord organisation (Vandenbroucke et al., 2007). The normal (accountancy and su-pervisory) rules for firms in other sectors will apply to the larger firms that are quoted on the stock market (see Section 4.2.2). They may be different from the ones that are applicable for the smaller firms, such as vennootschap met beperkte aansprakelijkheid and patrimoniumvennootschap, which are not quoted on the stock market.
The 1997 Flemish Housing Code contains provisions for the market rental sector in three areas. It includes provisions about the accreditation of tenant organisations and Social Rental Agencies (see Section 4.4.3). It also includes stipulations on housing quality based on the Belgian Rent Act (Huurwet) of 1991.
For the first time in Belgian history, the 1991 Belgian Rent Act contained the concept of the level of quality “that a rental dwelling must satisfy some basic requirements with regard to safety, health and habitability” (De Decker, 2001, p. 30). But although the concept was introduced, it was not defined. The Belgian Rent Law states that a landlord needs to ensure that at the moment a rental agreement is entered into, the residential property must conform to ba-sic requirements of safety, health and habitability. The law allows for a rental agreement ‘with renovation’: a contract which includes certain stipulations about renovation to be carried out during the contract period.
In Flanders, two methods have been established to regulate the quality of dwellings (Vlaamse Overheid, Agentschap Inspectie RWO – Wooninspectie, 200824; Elsinga et al., 2007b). The administrative procedure and the process of crim-inal prosecution both have their judicial roots in the 1997 Flemish Housing Code (Vlaamse Wooncode) and the related 1997 Parliamentary Decree (Kamerde-creet), which both find their roots in the Belgian constitutional right to decent housing (article 23).
Since 1998, ‘suspect’ dwellings have been subject to an administrative pro-cedure (Vandenbroucke et al., 2007). Inspectors of the Flemish Region will car-ry out a technical check to establish whether a dwelling is fit or unfit for habi-tation. The mayor of the local authority concerned will, after a hearing, then
24 With thanks to one of the experts for drawing our attention to this annual report.
[ 90 ]

declare a dwelling fit or unfit for habitation. The second way to protect housing quality is through criminal prosecution
(Vandenbroucke et al., 2007; Vlaamse Overheid, Agentschap Inspectie RWO – Woon-inspectie, 2008). This more heavy-handed procedure was introduced in 2001 after it was established that the administrative procedure had not eliminat-ed all malpractices. The Flemish Housing Inspection (Vlaamse Wooninspectie), which is an ‘internal private agency’ of the ministry responsible for housing, will monitor offences against the Flemish Housing Code and the related Par-liamentary Decree. The point of departure of these documents is, in accor-dance with the Belgian Rent Law of 1991, that the quality of each dwelling in Flanders must conform to basic standards of safety health and living qual-ity (woonkwaliteit). When offences are detected, criminal prosecution will fol-low. In the six years since 2001, when the Flemish Housing Inspection started, there have been almost 1,200 actions involving almost 1,100 buildings con-taining almost 3,600 housing units of insufficient quality.
The Decree of Change of 7 July 2006, which came into law on 9 September 2007, aimed to make both procedures more effective. For the administrative procedure, a quick repair claim was introduced, as well as the possibility for local authorities to claim the costs of moving the tenant to a dwelling which was of sufficient quality. The process of criminal prosecution became more effective when some of the possibilities for discussion were removed. It also increased the penalties from a fine of between €100 and €10,000 to a fine of between €500 and €25,000 and a prison sentence of six months to three years. In aggravating circumstances, the fine rises to between €1,000 and €100,000, and the prison sentence is set at one to five years. A repair claim was also introduced in order to be able to check that unfit dwellings are made fit for habitation by the owner.
4.8 Subsidies and finance
There is financing support for social rental sector investment, as described in Section 4.8.1. The taxation of social landlords will also be covered in this section.
The subsidised loans available for social landlords are not available for mar-ket landlords and neither are there any other subsidies for market landlords. Renovation subsidies on the same terms as those for owner-occupiers may be available for landlords who rent out their dwellings via a Social Renting Agen-cy, if the Flemish government decides accordingly (Vandenbroucke et al., 2007). Market landlords do pay taxes, however, as will be discussed in Section 4.8.2.
The system of explicit housing allowances in the market rental sector, which specifically aims to encourage households to move to high quality (adapted) dwellings, is discussed in Section 4.8.3.
[ 91 ]

4.8.1 Support for social rental sector investment25
As well as their own reserves and marginal loans from third parties, there are subsidies for the finances of housing associations (Winters, 2004). Subsidies and cheap loans make up 30% to 50% of finance (information of expert). The cheap loans come from the VMSW (and from the VHM before) via the invest-ment programme. An investment grant from the Flemish Region provides the funds for this programme.
Project subsidies come from the Flemish government (information of ex-pert; De Tijd, 2008). They were to be spent on new construction via public-pri-vate partnerships or cooperation since 2003. In these pilot projects, 431 social dwellings were to be built at 14 locations in seven municipalities. These social dwellings were to be realised on land provided by a social housing associa-tion under building and planning rights for a period of 30 years by private in-vestors who would be responsible for the design, construction, finance and maintenance for 27 years. The subsidy received by the private investor would be the difference between social and market rents plus 5% of social rent as compensation for vacancy and non-payment risks.
In 2008, it became clear that two of the ten planned locations would not be realised. In total, 208 of the planned 431 social rental dwellings were occupied, in construction or planned. For a second batch of 188 dwellings the tender procedure had been stopped in 2005 because of a lack of interest of investors. The subsidy budget had to be increased from €18.5 million to €33 million in order to be able to encourage private investors to start negotiations in 2008.
Winters (2004, p. 72) signals that the housing finance system was not trans-parent and very complex, primarily because different systems had been intro-duced and possibly abolished again for new cases. Each system had its own requirements for subsidy, its own redemption rules and its own administra-tive procedures for submission. That made it difficult for housing associations to make long-term investment plans. Some managers of housing associations therefore felt little responsibility for their financial management, arguing that most of it was taking place at the VMSW.
The new financing system that was introduced on 1 January 2008 (Decree on Finance of Social Landlords; see Section 4.4.3) appears to be reforming the investment programme that ran via the VMSW. The VMSW will receive a capital grant that will become a 33-year repayment-only loan (with an inter-est rate of 0%) for housing associations. In addition to that, the housing as-
25 On December 5, 2008 the Flemish government submitted the Decree on Land and Building Policy (De-
creet Grond- en Pandenbeleid) to the Flemish Parliament. It includes for the first time in Flemish history the
possibility for market parties to provide/build social rental dwellings against the same favourable condi-
tions as for social housing associations (http://www2.vlaanderen.be/ruimtelijk/Nwetgeving/ontwerpde-
creet/wijzigingsdecrintro.html).
[ 92 ]
sociations will receive a ‘regional social correction’ (gewestelijke sociale correctie, GSC) subsidy in order to be able to cover the social discount received by social tenants which is set by the region (Section 4.5.1). This is calculated as the dif-ference between a housing association’s income and norms for expenditures that are set in order to promote efficiency.
In the new investment finance system, the housing associations will be more encouraged to take responsibility than previously by various elements such as a better use of financial planning, the relationship between the subsidies and the financial planning, as well as the standards used for income and expenditure in the Decree on Finance of Social Landlords (information of expert).
TaxationSocial landlords not only receive subsidies, but also pay tax (Kirchner, 2006). Subsidisation is in the hands of the Flemish government, whereas taxation is not always, since in Belgium this responsibility is split between the govern-ment levels (Vandenbroucke et al., 2007). The federal government is responsi-ble for VAT (21% for new construction)26 and for corporation tax. However, the taxation of the ownership of immovable property (onroerende voorheffing) and the taxation of the acquisition of property (registratierechten) are the responsi-bility of the Flemish government, regardless of whether the owner or buyer is a person or a firm (vennootschap).
The corporate tax rate for housing associations is a maximum of 5% (Win-ters et al., 2007). They pay a lower rate of VAT (12% instead of 21%) on con-struction than others, and they pay a lower rate for their immovable property tax (onroerende voorheffing) than market landlords.
4.8.2 Taxation for market rental investment
As we have seen in the previous section, market landlords pay a higher rate of VAT, corporation tax and immovable property tax than social landlords. Private person landlords pay more taxes and have fewer personal income tax deduc-tions in comparison to owner-occupiers, over which the Flemish government has little say since it is a national tax (Elsinga et al., 2007b, Vandenbroucke et al., 2007). As with owner occupiers, a private persons’ actual rent income is not taxed, but the imputed rent income (kadastraal inkomen) is taxed. In theory, im-puted rent income is the net income minus a 40% deduction for imputed costs. For private person landlords this imputed income is 40% higher.
26 VAT is set lower – 6% instead of 21% – for the renovation of dwellings that are five years or older. Other
criteria are relevant as well. Landlord and tenant can be taxed with this lower rate when carrying out main-
tenance. Federal governments can change VAT-rules only within the framework determined by the European
Union (Elsinga et al., 2007).
[ 93 ]

The amount of imputed rent plus 40% does not usually coincide with the actual rent income after the deduction of costs, because the last appraisal took place in 1975 and the indexation of imputed rent was introduced later (information of expert). For dwellings in neighbourhoods that have improved, the taxable imputed rent will be below the rent income (Elsinga et al., 2007b, Vandenbroucke et al., 2007). The reverse situation may apply in neighbour-hoods that have become less attractive (information of expert).
For firms (vennootschappen), actual rent income is always taxed, while ac-tual costs are deductible. The tax rate will be more than the 5% for housing associations.
Two housing property firms that are quoted on the stock market, residen-tiële vastgoed-BEVAKs (Beleggingsvennootschap in Vast Kapitaal; see Section 4.2.2) have a special tax facility on profit paid out as dividends in that they are ex-empt from local movable property tax (roerende voorheffing). However, the firm has to pay local immovable property tax on the profit before paying out dividends (onroerende voorheffing). In order to achieve this status, a residentiële vastgoed-BEVAK needs to diversify and guarantee a certain risk spread limiting new construction.
4.8.3 Housing allowances
As was explained in Section 4.5.1, a differential system of rent setting is used in the social rental sector. This type of subsidisation will be considered an im-plicit type of housing allowance (Kemp, 1997).
As well as that, since 1991 an explicit rent allowance has been available in the rental sector, when moving from a bad quality dwelling to a dwelling of standard quality or from a dwelling deemed unsuitable for a handicapped person to one that is deemed suitable (Winters et al., 2004).
The Decree of the Flemish government of 2 February 2007 changed the target group of this rent subsidy (thanks to one of the experts for drawing our attention to this decree). From 1 May 2007 onwards, it excluded tenants moving to social rental dwellings from housing associations,27 and included tenants moving to dwellings from Social Rental Agencies (Heylen et al., 2007). The limits of net taxable household income per year (three years before appli-cation) were increased from €12,395 to €14,820 (2008),28 while the maximum period of subsidisation was reduced to nine years (from 15 years). The maxi-mum rent to be subsidised was set at €500 per month in 2008.29
27 The maximum period of subsidy receipt was limited to three years for these tenants (Winters et al.,
2004).
28 The maximum income will be increased with €1,330 per dependent person.
29 The maximum amount will be increased with seven percent per dependent person, up to four persons.
[ 94 ]

If the dwelling requirements are disregarded, the target group changes im-ply that rather than 16% of private tenants being eligible for this rent sub-sidy, 21% of private tenants are now eligible. In the first income quintile of net taxable income of 2005, the proportion of eligible households increased from 76.1% to 83.9%. In fact, however, as can be pointed out with the Housing Sur-vey, only 2% of all tenants received this allowance in 2005, with an average of €120 per beneficiary (Haffner & Heylen, 2008).
The explicit rent subsidy consists of two parts, a once-only grant and a monthly subsidy. The once-only grant (installatiepremie) amounts to three times the amount of the monthly subsidy that is set for the first two years ac-cording to the limits of net taxable household income in the third year before application, as Table 4.11 shows. The amount of the monthly subsidy begins at €200 (100) per month in the first two years in the lowest (highest) income category and finishes at €60 per month for years 7, 8 and 9 unless the income has increased to above €14,820, in which case the amount of subsidy will be halved to €30 per month.
There are two exceptions to the maximum period of payment of nine years. First, if income is over €14,820 in the year prior to the application, the subsidy will only be paid out during the first two years. Elderly and handi-capped persons will receive the subsidy as set for the first two years, as long as they remain in a suitable dwelling or a dwelling of sufficient quality.
4.9 Bridging the gap between social and market renting?
Home ownership remains the most important form of tenure in Flanders as it has been for a relatively long period. In 2005, home ownership reached more than 74% of the market. Governments have also subsidised social rental dwellings owned by social landlords, whose legal status is that of a private organisation (social housing associations) supervised by the Flemish govern-ment. This sector currently accounts for around 5% of the housing stock. Sub-
[ 95 ]
Table 4.11 Amounts of rent subsidy per month, in euros, according to limits of net taxable household income three years before application and year of receipt, applicable for 2009
Net taxable household income per year Year 1 and 2 Year 3 and 4 Year 5 and 6 Year 7, 8 and 9*
Less than € 9,170 200 160 120 60
€ 9,171 - € 12,630 150 120 90 60
€ 12,631 - € 14,820 100 80 60 60
More than € 14,820 30
Source: http://www.bouwenenwonen.be/bouwenenwonen-particulieren-woning_huren-steunmaatregelen_voor_wie_een_woning_wil_huren-tegemoetkoming_in_de_huurprijs-hoeveel_
bedraagt_de_tegemoetkoming_in_de_huurprijs.html
* Based on income three years after first application.
sidisation remains largely absent from the market rental sector, which has shrunk to less than 19% of the housing stock.
The gap in who provides whatThe social rented and market rented sectors are generally regarded as two distinct sections of the housing market in Flanders, as Table 4.12 shows for the gap in who provides what. The social rental sector consists mainly of pri-vate non-profit housing associations, but can essentially be regarded as pub-licly run. The private sector is driven by the profit motive. It is mainly private persons, as well as some firms, who are market landlords. Three of those firms are quoted on the stock market.
Furthermore, there are differences between the two rental sectors in terms of the price and quality of the accommodation. Social tenants pay lower rents than in the market rental sector: social-sector rents are around 59% of market rents. However, the quality of the social rental dwellings is generally perceived as better than that of the market rented stock. Higher proportions of social tenants than market tenants judge their housing to be of good or very good quality (79% to 65%) and more market tenants think that the overall quality is insufficient. Only 12% of social tenants think that physical conditions are bad or very bad, compared with 19% for market tenants. Differences between rent-ing and owning, however, are larger than between both rental sectors.
On property rights, there are differences between the two rental tenures, though rent regulation has recently been harmonised to some extent. Rents in both tenures are now based on market rents, and both are annually ad-justed according to inflation for a period of nine years. The nine-year period is the standard period for a contract in the market rental sector, although this may also be set shorter or longer. The short-term contracts (52%) in practice appear to be more popular than the standard contract (45%). The difference between both sectors occurs because rents in the social rental sector are dif-ferentiated according to an income-based formula determined by the Flem-ish government. Furthermore, there are permanent contracts for social rent-ers after a two-year trial period (as opposed to a standard nine-year period for market renters). There is also a conditional right to buy within the social rental sector. For this to apply, the dwelling cannot be an apartment, must be at least 15 years old and the tenant must have rented for at least five years. No other property rights are applicable in the market rental sector.
The gap in government policies and outcomesTable 4.13 shows that on government policies and outcomes there is a gap between the two rental sectors in all aspects. The housing associations are to provide social dwellings (rent and owner occupation) based on the Belgian constitutional right to decent housing, while in the market rental sector the investment incentive dominates. It is thus chiefly the allocation system that
[ 96 ]

divides the rental market. There are two aspects that blur the boundaries between both rental sectors.
Firstly, the presence of the Social Rental Agencies enables vulnerable house-holds to find a market rented dwelling against social conditions. Social Rental Agencies lower the management costs for landlords by carrying out unpaid work for them, so that lower-than-market rents can be set. In exchange for the lower and guaranteed rent, the Social Rental Agencies do not charge com-mission, are responsible for administration and minor renovation work.
The second aspect that blurs the sector boundaries concerns a substan-tial group of low-income households that live in market rental dwellings. This group has a lower average income than social tenants after rent is deduct-ed. They most probably live in market rented sector dwellings because of the small market share of social renting, of which the long waiting lists for social rental dwellings are indicative.
As indicated before, rent control also differs between both rental sectors.
[ 97 ]
Table 4.12 The gap between social renting and market renting in who provides what in Flanders
Social renting Market renting
Landlords
Types Accredited social housing associations and others listed in 2007 Flemish Housing Code; some private person landlords who let out their dwelling(s) via a Social Rental Agency* (some 3,000 dwellings in total)
Private individuals and a few companies
Motives Non-profit: “the provision of social dwellings, revaluation of the housing stock and pursuit of a social land and buildings policy” (1997 Flemish Housing Code)
Profit: direct and indirect return on investment
Accommodation
Quality of products of offer
Quality of social rental dwelling is on average better and also perceived as better than that of market rental dwelling. Difference between rental sectors is usually smaller than between
rental sector and owner-occupied sector, except when the external physical conditions of dwellings evaluated by surveyors are concerned
Rent levels Lower on average Higher on average
Property rights
Rent regulation Differential rent setting (Flemish policy formula): rents based on income, but market rent adjusted according to corrected consumer price index (called health index) is taken as the starting point
Market rents for new contracts, rent adjustment based on corrected consumer price index (called health index)
Security of tenure Indefinite contract after two-year trial period Standard contract of nine years, though shorter and longer contracts are possible; short term contracts (52%) appear to be more popular than the standard contract (45%)
Conditional right to buy Available Not available
* Excluded from rest of table.

In the social rental sector, rents are set on the basis of household income and other variables, while in the market rental sector they are not. Market rents generally apply to new contracts in the market sector, and rent adjustments are based on an index for cost development during the contract.
The regulation and supervision of landlords also vary. For market landlords, important ‘housing’ regulations based on the 1997 Flemish Housing Code concern letting ‘socially’ via Social Rental Agencies and the quality control of dwellings. The concern for quality control reflects the constitutional right to decent housing.
Social landlords’ regulation is based on the 2007 Flemish Housing Code and the 2007 Decree on Social Rent. Since 2006 the regulation of the social sector has changed. Policy discourse indicates that a more independent posi-tion is to be created for social landlords, but in practice this does not seem to have been achieved. The responsibility of monitoring the following of rules and regulations and registration or the accreditation of social landlords was moved from the sector organisation of housing associations, whose name was also simultaneously changed from VHM to VMSW, to the Flemish govern-ment. Guidance and finance remain the responsibilities of the VMSW.
Government support for the ‘objects’ strengthens the gap between both rental sectors. Unlike with the social housing associations, there are no bricks-and-mortar subsidies for market investors, only in a public-private partnership or cooperation projects in which social dwellings are realised. Until 2008, these were realised on a very small scale: 208 dwellings realised or in the pipeline; 188 dwellings in negotiation. No tax facilities are available for the market rented sector. Regarding subsidies, a common element of subsidi-sation between both sectors can be discerned, though not completely when the implicit subsidisation via the differential rent setting is taken into ac-count. The common element would be the income-related subsidies available for certain households up to certain income limits, implicitly for the social tenant and explicitly for the market tenant. In the latter case, they are only available when the tenant moves to a more suitable rented dwelling, either in terms of quality (from low quality to standard quality) or in terms of facilities (adapted because of handicap or age). This explicit housing allowance is also available for tenants renting from a Social Rental Agency.
Housing outcomes, such as the socio-economic characteristics of ten-ants, reinforce the differences between the social and market rental sectors, though the differences between renting and owning are bigger. Social tenants generally have a weaker social profile (particularly in terms of education) and a lower average income than market tenants. However, as stated, a substan-tial group of low-income households can be found in the market rented sec-tor that are on lower average incomes after housing expenses are deducted than in the social rental sector.
[ 98 ]

The competitive gapSubstitutability between the two rented sectors is low, as the policy dimen-sions in Table 4.13 imply. On most of the dimensions we distinguished, there
[ 99 ]
Table 4.13 The gap between social renting and market renting in policy and policy instruments in Flanders
Social renting via non-profit social housing associations Market renting
Purpose of housing sector
Based on the Belgian constitutional right to decent housing: “the provision of social dwellings, revaluation of the housing stock and pursuit of a social land and buildings policy” (1997 Flemish Housing Code)
Profit: direct and or indirect return on investment
Allocation procedures Mainly according to housing need: needs-based points allocation
Free market, except for Social Rental Agencies’ initiatives for vulnerable households: needs-based points allocation
Rent control
Rent control for new contracts
Differential rent setting: rent set by Flemish policy formula based on income and market rent
Market rents for new contracts unless short-term contracts change into a standard contract
Rent control for rent adjustments
Adjustments in line with variables of Flemish policy formula, e.g. household income
Rent adjustment based on corrected consumer price index (called health index)
Regulation and supervision
Based on Flemish Housing Code: Ministry does supervision and registration; the sector organisation VMSW does guidance and finance
Regulation in Flemish Housing Code for housing quality; housing quality and rent contracts regulated in Belgian Rent Act
Government support
Bricks-and-mortar subsidy
Available Not available
Tax concession for landlord
Available: lower rates than standard rates for corporate tax, VAT and immovable property tax
Not available
Housing allowances Differential rent setting (Flemish policy formula) implies implicit housing allowances
An explicit housing allowance (once-only combined with monthly allowance) is available only for those moving up to a certain income that are moving to a standard quality dwelling or to a better adjusted dwelling
Outcomes
Socio-economic characteristics of tenants
Differences between renting and owning bigger than between social and market rent; weaker social profile on average (especially education); lower income on average; policy target group
Stronger social profile; higher income; after housing expenses average income is lower for first 30 percentiles; many of the target group for social rental housing appear to need to live in market rental housing because of the small social rental sector
Movement between tenures
Movements within rental sector not known. In general relatively more movement into owner-occupation than into renting
Competition
Substitutability Low level of ‘unforced’ substitutability; possibly some ‘forced’ substitutability
Rivalry Low level of rivalry

were differences between the two rental sectors: allocation procedures, rent control, quality regulation and government support provided the main differ-ences. Other property rights such as tenant security and a conditional right to buy (Table 4.12) also mean that the package of housing services offered varies between the two sectors, as well as rent levels.
Having said this, there are also some aspects that make the substitution of housing bundles more possible than one may imagine at first sight. Firstly, on housing quality, it seems likely that effective quality control will, in due course, lead to better quality market rental dwellings, closing the gap that ex-ists between the two rental sectors in this area. Secondly, (inflation-correct-ed) market rents are the basis for both rental tenures. If household incomes rise above the limits set in the social rental sector, there will in principle be no difference in the rent paid between a dwelling in the market sector and in the social sector. A third aspect which makes substitutability more likely concerns housing allowances. In the main, housing allowances exist in both sectors, implicit for social tenants, explicit for market tenants who move to a more suitable rental dwelling. Thus there can be help with housing expendi-ture in both rental sectors.
Lastly, up to the income limits that apply in the social rented sector, pro-spective social tenants can choose a private rented dwelling, usually with a worse price-quality ratio than that of a social rented dwelling, as the social rented sector is of limited size and waiting lists are long. In principle, about 39% of market tenants are estimated to be eligible for a social rental dwelling. In fact, it could be argued that there is ‘forced’ substitutability. Many low-in-come households that may otherwise choose to move to a social rental dwell-ing, must choose a market rented dwelling.
Rivalry between market and social landlords can be considered relatively low as Table 4.13 indicates. On the one hand, this can be considered the other side of the coin of what has been argued about substitutability. The charac-teristics of the housing bundles offered are largely different. Thus two sets of suppliers are providing largely different items in different, and thus segment-ed, markets. This also goes for the motives of the landlords – profit in the market sector and non-profit in the social rented sector. Lastly, the allocation scheme segregates households into those that are customers of social hous-ing providers and those that are not, although the long waiting lists and the number of available dwellings in the market sector do provide some counter-weight here, as explained before.
Where rivalry is not the other side of the substitutability coin, it is the ri-valry between the two rented sectors which can be considered to be slightly greater as a result of two types of initiatives. First there is the object subsidi-sation of private investors building social rental dwellings within schemes of public-private cooperation. This type of initiative, which creates rivalry be-tween landlords on the point of offering dwellings, however, only took place
[ 100 ]

on a very small scale until 2008. Secondly, there is the work of the Social Rented Agencies which is also
small-scale but concerns more dwellings than those in public-private coop-eration schemes. Market rented dwellings are made available for vulnerable tenants who cannot find a dwelling in the social rented sector. A lower-than-market and guaranteed rent can be realised because of scale advantages of the intermediary organisation in comparison to those of the individual land-lords.
In these two situations, there is rivalry between landlords, and if rivalry leads to extra supply of social dwellings via a different allocation system, this will also mean more choice for consumers. Overall, because of the small scale of the activities of Social Rental Agencies in combination with the focus on vulnerable households and the even smaller scale of the activities within public-private cooperation, the rivalry gap in offering social rental dwellings remains rather large, however. Furthermore, the activities of Social Rental Agencies will most likely not result in any extra supply of dwellings, but rath-er in fewer market rental dwellings on offer.
Taking these arguments together, despite some small-scale initiatives which work towards closing the gap between the social and market rental sectors, a considerable gap persists and the degree of competition between the sectors is small.
Bridging the gap?At the time of publishing, there was very little evidence of any bridging of the gap between the two rental sectors. The activities of the Social Rental Agen-cies do little to bridge the competition gap. The same goes for the very lim-ited amount of construction undertaken by private investors within public-private partnership schemes. Two other activities, however, may go some way to bridging the gap.
Firstly, the government seems to be putting more emphasis on bad-quality dwellings, especially in the private rental sector, via a levy on landlords for example. This also goes for the explicit housing allowance, which is also ex-plicitly connected to moving to a more suitable rental dwelling, also in terms of quality. Both of these instruments, even though they do not involve large numbers of dwellings or households, could contribute to closing the gap in the physical quality of the housing that exists between the two rental sectors, with the worse quality being found in the market rental sector.
Secondly, government officially gave the housing associations a more au-tonomous position through the reshuffling of tasks, such as supervision, in 2006. Depending on how that ‘new’ role develops, there may be reason for the social sector to operate in a more market-oriented way as a result of oper-ating more autonomously. The latest regulation, however, does not seem to point in this direction.
[ 101 ]

Country experts
Gerard van Bortel, Delft University of Technology.
Pascal de Decker, Hogeschool Gent.
Geert Inslegers, Vlaamse Huurdersbonden, Vlaams Overleg Bewonersbelangen.
Sien Winters, Hoger Instituut voor de Arbeid (Hiva), Katholieke Universiteit Leuven.
[ 102 ]

5 France
5.1 Introduction
France is known for its rather centralised administration and the far-reaching powers of its central government (Blanc, 2004, p. 283). However, in recent de-cades some decentralisation has occurred. In 1983, some powers previously held by the central government were transferred to lower tiers of government, and the regions (régions) were introduced as a new tier of government. The French regions are responsible for implementing national plans, developing regional plans and providing incentives to local authorities in the form of subsidies (Boelhouwer & Van der Heijden, 1992, p. 177). Since 1983, the decen-tralisation process has continued to make steady progress (see Cole, 2006).
At present, France comprises 22 régions, 96 départements and over 36,000 municipalities. In order to make municipal government more responsive, many municipalities have entered into partnerships. Currently there are about 2,500 of these partnerships (établissements publics de coopération intercom-munale). Increasingly, local policies are formulated at this level (personal com-munication Jean-Pierre Schaefer).
The municipalities, or the partnerships in which they are involved, have been charged with responsibility for local housing and building plans and the provision of building permits (Van der Heijden, et al., 2002, p. 123; Tutin, 2008). Central government is still the main influence on housing policy, however, be-cause of the extent to which local authorities are financially dependent on ‘Paris’. After all, funding housing (production subsidies, housing allowances, fiscal concessions) is still predominantly a central government task (Kirch-ner, 2006, p. 175). Also, French law (loi SRU) prescribes that cities with over a particular number of inhabitants (greater than 3,500 inhabitants, or greater than 1,500 inhabitants in the Paris area) should have at least 20% social rental dwellings (Kirchner, 2006, p. 175).30 The municipalities have 20 years to meet this objective. If they do not make sufficient progress towards it, the central government can impose a fine.
Responsibility for housing policy has shifted between the different French ministries. Until 2004, it fell to the State Secretary of the Ministry of Infra-structure and Transport (Ministère de l’Equipement), while from 2004 to 2007, it fell under the responsibility of the Minister of Employment, Social Cohesion and Housing (Ministère de l’emploi, de la cohésion sociale et du logement). In May 2007, the Ministry of Housing and Cities was created (Ministère du logement et de la ville). This ministry is currently responsible for social housing, housing subsidies, and urban renewal.
30 As far as this is concerned, social housing is defined as housing that is financed by PLA-I, PLUS or PLS-
loans (Ministère du logement et de la ville, 2008). In the future, social homeownership might also be included
in the definition of social housing (Boccadoro, 2008, p. 263).
[ 103 ]

5.2 Housing stock
5.2.1 Definition of the social rental and the market rental sector
The distinction between the social and market rented sector in France is less clear-cut than in many other countries (Amzallag & Taffin, 2003, p. 7). This is due to the fact that various definitions are in use. Below, two commonly used definitions are explained (see also Schaefer & Taffin, 2006).
Distinction on the basis of the motives of the landlordAs elsewhere in Europe, in the French rented sector distinctions are often made on the basis of what motivates the landlord, with rented homes let by profit-oriented private individuals or organisations being referred to as mar-ket rental housing, and those let by non-profit landlords as social rented housing. Most French statistical sources apply this definition. In this chapter, unless indicated otherwise, we will also use this definition.
Distinction on the basis of rent setting and allocation rulesHowever, another definition of the social rented sector is also possible. This definition takes account of how the initial rent is set and how the dwellings are allocated. As such, social rental housing is defined as housing where the rent levels and the income of the tenants must comply with certain conditions. Dwellings let by non-profit landlords usually fall under this definition. However, profit-oriented private landlords also let a limited part of this dwelling stock. This is due to the fact that the French government encourages private individu-als and commercial companies to let dwellings against moderate rents in ex-change for grants, tax concessions or low-interest loans (see also Section 5.8).
5.2.2 A large array of landlords
Table 5.1 shows the number of dwellings owned by the different types of landlord in France. The differences between the various types of landlord are explained in more detail below.
Social rental sectorLike many other West European countries at the end of the 19th century, France underwent rapid urbanisation, resulting in poor living conditions in the large cities. Between 1850 and 1914, the population of Paris rose from one million to almost three million. During this period of rapid industrialisa-tion and urbanisation there was an absence of regulation and planning for the housing that was built for the emerging working class. Consequently, the living and housing conditions were bad. Social housing was introduced to
[ 104 ]

improve these conditions. The first social housing initiatives were not taken by local or state authorities but by private actors such as companies, factory owners and philanthropists (Lévy-Vroelant et al., 2008, p. 33). The state did not intervene until 1894 when the loi Siegfried came into force, followed by the loi Ribot (1908) and the loi Bonnevay in 1912. (Lévy-Vroelant et al., 2008, p. 35). These laws provided the statutory basis for French social rented housing.
Initially, social rental dwellings were built by sociétés d’Habitations à Bon Marché (HBMs), which in 1950 became Habitations à Loyer Modéré organisations (HLMs). Since 2008, the public HLMs have been known as Offices Publics de l’habitat. These social rental landlords have a predominantly public character and are controlled by the local authorities (municipalities, groups of munici-palities or departments), who are responsible for their creation and for man-aging their finances and their tasks (CECODHAS, 2007).
There are also HLMs with a private character.31 These are called Entreprises sociales pour l’habitat. Such social rental landlords are private organisations with a non-profit objective (although they are allowed to pay a very limited dividend, referring to a very low capital, to their shareholders) which date back to the nineteenth century (Amzallag & Taffin, 2003, p. 21). The initiators of these social rental landlords were often companies that wanted to provide housing for their own employees (Bougrain, 2004). Private social rental land-lords usually operate under the supervision of shareholders from both the private and public sectors. They not only provide social rental housing but are often also involved in the construction of subsidised owner-occupancy dwell-ings for lower-income groups (Boelhouwer & Van der Heijden, 1992). In the lit-erature, all French social rental landlords, whether they have a public or pri-vate character, are often simply referred to as HLMs.
31 This means that they are subject to private law (Amzallag & Taffin, 2003, p. 20).
[ 105 ]
Table 5.1 Distribution of the occupied rental dwelling stock among landlords (x 1,000 dwellings), France, 2005
Number of dwellings % of rental dwelling stock
Type of landlord
Public HLM 2,026 18
Private HLM 1,756 15
Other social rental landlords (among which SEMs and cooperative housing companies)
1,138 10
Total social rental sector 4,920 43
Individual market rental landlords 6,329 55
Institutional market rental landlords 219 2
Total market rental sector 6,548 57
Total rental sector 11,468 100
Source: information provided by Michel Amzallag

Public and private social rental landlords have the same competences, ex-pressed in the Code de la Construction et de l’Habitation (CCH). The traditional core objective of social rental landlords is the construction and the manage-ment of affordable rental housing for low-income groups. In recent years, some additional objectives have been added to this vocation, such as combat-ing segregation, and providing affordable home ownership housing in areas where this is considered to be desirable (Amzallag & Taffin, 2003).
Specific providers of social rental housing are the Sociétés d’Economie Mixte (SEMs), also called Entreprises Publiques Locales. These are partnerships be-tween local government and private partners that may also provide social rental housing. SEMs that provide social housing operate under the same con-ditions as the other social rental landlords (Amzallag & Taffin, 2003, p. 26). The SEMs possess around half a million dwellings.
Finally, there are various smaller providers of social rented housing. This involves local authorities (municipalities), public or semi-public companies (public hospitals and the state railway company, the SNCF, have dwellings which they let to their employees) and the co-operative housing companies (although the latter mainly focus on the owner-occupied sector). In total, these providers possess more than half a million social rental dwellings.
At the national level, the social rental landlords are united in an organi-sation called Union sociale pour l’habitat (USH). In turn, the Union Sociale pour l’habitat is a member of the European social housing umbrella organisation CECODHAS (Comité Européen de coordination d’habitat social).
The French social rental dwellings are mainly concentrated in the medi-um-sized and larger cities and agglomerations (see Table 5.2).32 This is due to the fact that the history of social rented housing roughly parallels the indus-trial and economic development and the resulting urbanisation of France. The share of social rental housing is particularly high in the formerly heavily in-dustrialised areas, notably around Paris and in the north and the east of France (Schaefer, 2008, p. 100). It is lower in the south-east and west of the country, es-pecially in the more rural areas. In many small municipalities, there are simply no social rental dwellings available (Schaefer & Taffin, 2006). By requiring each municipality to have at least 20% of social rental housing, the government is attempting to counterbalance this uneven geographical distribution.
The French social rental sector offers a variety of products: standard social housing for salaried workers, ‘upper’ social housing for middle class house-holds and ‘lower’ social housing for the more vulnerable groups (Tutin, 2008).
Market rental sectorThe vast majority (97%) of French market rented dwellings are owned by pri-
32 The data in Table 5.2 may not be very recent but the general picture still applies.
[ 106 ]

vate individuals (personnes physiques); only 3% of the rented stock is owned by institutional market rental landlords (companies or institutions: personnes mo-rales). Two-thirds of individual market rental landlords own only one dwelling. In the last decade, the number of market rental dwellings let by individual landlords has grown significantly, mainly as a result of the advantageous tax deductions to which these landlords are entitled (see also Section 5.8.5).
In the category of institutional market rental landlords, insurance compa-nies play a major role. Dwellings let by institutional market rental landlords are generally of higher quality than those let by individual market rental landlords (Donner, 2000, p. 283). The proportion of institutional market rental landlords has declined steadily since the 1970s. This is due to the fact that these actors are increasingly focusing on investing in areas other than hous-ing, where they can enjoy higher returns. Selling off homes previously intend-ed for letting is also part of their strategy. Institutional market rental land-lords that still invest in housing now concentrate their investments primarily in the larger agglomerations.
5.2.3 Development of the French housing stock
Figure 5.1 shows the development of the different tenure sectors in France since 1963, according to the type of landlord. Pre-1963 figures are not avail-able in this figure, but we can assume that the French housing stock before World War II consisted predominantly of market rented property, as was the case in most other European countries. During the 1963-84 period, the propor-tion of market rented housing fell and that of social rented and owner-occu-pied housing rose, as market rented homes were sold off, poor-quality dwell-ings were demolished and there were few incentives to build new homes in the market rented sector. At the same time, the government provided strong support for the development of both the social rental sector and the owner-
[ 107 ]
Table 5.2 Distribution of the social rental housing stock according to number of inhabitants of the municipality, France 1999 and 2001
Number of inhabitantsTotal number of dwellings (1999)
Number of social rental dwellings (2001)
% of social rental dwellings
<2,000 5,752,665 205,452 3,6
2,000 - 5,000 3,208,762 313,593 9,8
5,000 - 10,000 2,572,736 419,350 16,3
10,000 - 20,000 2,586,913 580,920 22,5
20,000 - 50,000 3,883,909 1,130,144 29,1
50,000 - 100,000 2,011,008 581,411 28,9
100,000 - 200,000 1,620,665 410,511 25,3
>200,000 1,600,115 306,053 19,1
Paris 1,110,912 205,722 18,5
Total 24,347,685 4,153,156 17,1
Source: based on information provided by Schaefer

occupancy sector. The social rental sector was stimulated through subsidies and low-interest loans for social rental landlords, whereas the owner-occu-pied sector was stimulated through various favourable loans for homeowners (Van der Heijden et al., 2002, p. 130).
From the mid-1980s, the proportion of social and market rented homes stabilised and that of owner-occupied continued to rise slowly, at the expense of the category ‘other’.33 In a European context this is rather exceptional; in many other European countries, the shares of both the social rental and mar-ket rental sectors show a steady decline (Tutin, 2008). The housing stock in France consists of 26.9 million principal dwellings (57% single-family dwell-ings and 43% apartments), plus 3.18 million second homes and 1.9 million va-cant units, bringing the total to 32 million dwellings (Schaefer, 2008).
5.2.4 Quality of the housing stock
Half of market rented homes in France date back to before 1948, which com-pares to about one-third of the total French housing stock which was built be-
33 This category mainly involves sublets, dwellings (other than owner-occupied) where the occupants live
free of charge, dwellings that are tied to a certain job or profession (logements de function) and farms.
[ 108 ]
Figure 5.1 Tenure distribution in France, 1963-2006 *
0
10
20
30
40
50
60
200620021996199219881984197819701963
home owning sector
social rental sector
private rental sector
other
%
Sources: INSEE (data for 1984-2006) and Satsangi, 1998 (data for 1963-1978)
* The definitions of the different tenures that are used for the period 1963-1978 are slightly different from the definitions that are used for the period 1984-2006.

fore 1948 (Driant, 2000). About 5% of market rented dwellings are designated as ‘lacking in comfort’, as against under 1% of social rented homes and own-er-occupied homes (figures for 1998, derived from Driant, 2000).
Type of dwellingSingle-family rented homes are relatively scarce, especially in the social rented sector (16% single-family dwellings in the social rented sector, 29% single-family dwellings in the market rented sector, figures for 2002). In mul-tiple-family housing, social rented homes are more frequently found in large housing estates than market rental ones. Large estates (grands ensembles) of more than 500 dwellings represent 6% of the social rental housing stock at the national level, but 12% in the Paris agglomeration (Tutin, 2008). In recent years, relatively more single-family rented homes have been built (Minodier, 2004). Of the new rented homes completed between 1998 and 2001, one-third were single-family dwellings (this proportion applies to both the social rented and the market rented sector).
Living areaSocial rented homes tend to be slightly larger than market rental ones (with 70.5 and 65.8 square metres of living area respectively, figures for 2002); the spread among market rented homes is much greater than among social ones, however (Minodier, 2004). The composition of the dwelling stock plays an im-portant role here. On the one hand, there are more single-family dwellings (these dwellings are generally relatively large) in the market rented sector than in the social rented sector. However, in the market rented sector there are also many small apartments (studios with one or two rooms designed for students and other single households), whereas most apartments in the so-cial rental sector are designed to house families with children and therefore generally have three or four rooms.
The average living area per person is 42.4 square metres in the owner-oc-cupied sector, 31.9 in the market rented sector and 27.4 in the social rented sector. The average size of households living in social rented housing is 2.5 persons, as against 2 persons in the market rented sector. One-third of house-holds in the social rented sector and 43% of households in the market rented sector consist of only one person (Minodier, 2004).
5.3 Characteristics of tenants and rent levels
This section deals with the characteristics of the tenants and the rent levels in the French social and market rental sectors.
[ 109 ]

Socio-economic characteristics of tenants Table 5.3 shows the income distribution of French tenants broken down into income deciles. It is clear that tenants are overrepre-sented in the low-income groups and under-represented in the higher-income brackets. This applies especially to tenants in the so-cial rental sector. Average incomes (adjusted for size of household) of tenants in the mar-ket rental sector are 30% higher than those of tenants in the social rental sector. The spread of income in the market sector is larger than in the social sector, however (Minodier, 2005).
In the last 30 years, the concentration of low-income groups in the social rental sector has increased. This is due to the fact that a fair part of the middle class has moved out of this sector in order to become owner-occupier. This process has been given further impetus by strong government support for home ownership (in the form of low-interest loans, subsidies etc.). Furthermore, since 1977 there has been a shift from produc-tion subsidies to personal subsidies (see also Section 5.4). This has led to higher rents in the social rental sector. Lower-income tenants were compensated for this by housing allowances but tenants with higher incomes received no such compensation. The 1977 policy shift therefore resulted in a relative outflow of middle-class households from the social rental sector. The dwellings that were left behind by the departing middle-class households were mostly occupied by low-income households (Van der Heijden et al., 2002, p. 134).
Recently, there has been a fierce debate on the function of the different tenure sectors with regard to housing low-income households (personal com-munication Jean-Pierre Schaefer). Some argue that it is the social rental sec-tor that should be responsible for accommodating these households. Others point out that there are also many low-income people living in the market rental sector and the owner-occupancy sector. Defenders of the social rental sector acknowledge this, but they note that the character of the low-income groups outside the social rental sector tends to be different from that of the low-income groups in the social rental sector. In the market rental sector, a fair amount of low-income households are students living in small studios. These households have good prospects of moving to a higher income at a lat-er stage of their life. In the owner-occupancy sector, households with a low income are often in a better financial position than tenants because they can accumulate wealth in their dwelling (they are cash poor but asset rich).34
34 Of course this only applies to a situation in which house prices are increasing.
[ 110 ]
Table 5.3 Income distribution of tenants, France, 2002
DecilesNumber of households (x 1,000) %
1 1,578 16
2 1,263 13
3 1,107 11
4 1,077 11
5 962 10
6 901 9
7 829 9
8 759 8
9 649 7
10 579 6
Total 9,703 100
Source: Minodier (2005)

Rent levelsRents for market rented property tend to be higher than rents for social hous-ing. However, the differences in rent between the social and market rent-al sectors are much larger in large towns than in small and medium-sized municipalities (see Table 5.4). This is due to the fact that rents in the market rental sector vary widely from the tight housing markets in the cities to the more relaxed ones in the smaller municipalities, whereas there is much less variation in the case of social rental housing. In the Paris area average rents per square metre for social rental housing are clearly higher (+15%) than in the rest of France. However, for market rental housing this effect is even more pronounced; market rental sector rents in the Paris area are almost twice as high as market rental sector rents in the rest of France.
In 2002, the average tenant in a French social rented dwelling paid €299 in monthly rent (before the deduction of housing allowances), whereas the aver-age tenant in the market rental sector paid €434 (also before the deduction of housing allowances). In the market rental sector, tenants who have moved into their homes fairly recently generally pay much higher rents than those who have been living there for some time. This is due to the fact that some market rental landlords raise the rent level substantially once a dwelling be-comes vacant.
The differences in rents between ‘new’ and ‘old’ tenants are much less pronounced in the social rental sector (Minodier, 2004). This is because rents for social rental dwellings are less related to the conditions on the housing market, and more to the conditions of the loan with the help of which the dwellings are financed (personal communication Jean-Pierre Schaefer).
[ 111 ]
Table 5.4 Average monthly rent per square metre in the social and market rented sectors, broken down by number of inhabitants in the municipality, France, 2002
Number of inhabitants in the municipality
Social rented sector
Market rented sector
Ratio (social rented/market rented)
< 2,000 inhabitants 3.8 4.3 0.88
< 5,000 inhabitants 4.2 4.8 0.87
5,000 - 9,999 inhabitants 3.6 5.0 0.72
10,000 - 19,999 inhabitants 3.9 5.6 0.70
20,000 - 49,999 inhabitants 3.8 5.6 0.68
50,000 - 99,999 inhabitants 3.9 5.9 0.66
100,000 - 199,999 inhabitants 3.9 6.4 0.61
200,000 - 1,999,999 inhabitants 4.0 6.8 0.59
Paris 5.2 11.4 0.46
Total 4.2 6.6 0.64
Source: Minodier (2004)

5.4 Housing policy
5.4.1 The history of housing policy
Before 1945Around 1900, the market rented sector was much more important than the social rented sector and the owner-occupancy sector. In those days, invest-ing in the construction of property and letting market rental dwellings was regarded as a financially secure investment, which also enhanced the inves-tor’s social status (Donner, 2000, p. 260). This started to change in World War I, when the French Government decided to introduce a strict rent regulation policy. As a result, market rental landlords suffered losses, and investment in maintenance and construction fell sharply. Between 1918 and 1939 a total of
‘only’ 1.6 million new dwellings was built, and relatively little money was in-vested in home improvement (Boelhouwer & Van der Heijden, 1992, p. 188). The social rental sector still had a limited role in the interbellum period. Al-though this sector started to develop at the end of the 19th century, the hous-ing production of social rental landlords initially remained rather limited. Most pre-war social rental housing was built by philanthropists and ‘enlight-ened’ entrepreneurs in order to accommodate salaried workers who were un-able to find decent accommodation in the existing housing stock (Levy-Vroel-ant & Tutin, 2007, p. 70). Added to the extensive war damage, the low housing investments in the interbellum period meant that by the end of World War II the French housing stock was in a very bad state. The country was also faced with a severe housing shortage.
Housing policy during the 1945-80 periodIn order to deal with the housing shortage, housing was included in the post-war national plans. Central government provided substantial building subsi-dies and low-interest loans to builders of new homes, resulting in a building boom. This large-scale state intervention produced the following two devel-opments.
Firstly, a large social rental housing sector developed. The three decades fol-lowing World War II are often considered to be the golden age of social housing: les trentes glorieuses (Lévy-Vroelant et al., 2008, p. 37). However, the emphasis was on quantity above quality. Social housing enabled the building industry to test new industrialised construction techniques. These new building processes very rapidly proved unsatisfactory, leaving both tenants and social landlords with major problems to solve (Blanc, 2004, p. 288). In some cases, underdevel-oped and badly applied prefab technology resulted in poor-quality, unattractive high-rise developments of tiny flats, often in suburbs around the large cities (Boelhouwer & Van der Heijden, 1992, p. 189). Today many of the estates built in that period suffer from social and quality-of-life problems (Tutin, 2008).
[ 112 ]

The second thrust of French post-war government policy involved promot-ing home ownership through both production and personal subsidies. On the supply-side, builders of dwellings destined for owner-occupiers received state subsidies and could take up low-interest loans. On the demand side, people were encouraged to buy the new homes through low-interest mortgages and one-off premiums. Combined with increasing prosperity, this policy produced a sharp increase in the share of the owner-occupied sector.
In the mid-1960s, housing policy began to change gradually. The housing shortage had largely been dealt with, and housing quality was also improving slowly. Because of this, the French government gradually reduced its inter-ventions in housing. Building subsidies were phased out, more scope was left for market forces, and state aid was targeted more precisely at low-income groups. The market sector therefore started to take on a greater role. To in-centivise saving by households, special high-interest bank accounts were pro-vided for households saving for a home of their own. In 1977, these changes cumulated in a new Housing Act. Financial support for rental landlords, for which both non-profit and profit providers could apply, was not abolished but the subsidy system was simplified. In addition, new personal subsidies were brought in (in both the owner-occupied and rented sectors), along with grants to encourage home improvement (Boelhouwer & Van der Heijden, 1992, p. 193). In short, one could say that the 1977 Housing Act has resulted in a shift from production subsidies to subject subsidies (Van der Heijden et al., 2002, p. 134) and a stronger focus on the low-income groups (Kirchner, 2006). What is more, the different types of subsidies were tied to each other by means of an agree-ment (convention) between the French state and the landlords. This agree-ment specified the financial aid that the French state would provide through both production subsidies and personal subsidies. Furthermore, it formulated quality requirements for subsidised dwellings and income requirements for the tenants of these dwellings (Boelhouwer, 1996, p. 78). Nowadays, a large majority of the social rental dwellings are still subject to such a convention (Levy-Vroelant & Tutin, 2007, p. 73).
Housing policy in the 1980s and 1990sThe somewhat more liberal housing policy that resulted from the 1977 Hous-ing Act remained intact following the inauguration of Mitterrand’s Socialist Government in 1981 (Donner, 2000, p. 261). Only the rent regulation system was made significantly stricter (see Section 5.5).
As a result of the economic crisis and high interest rates, the production of dwellings for the owner-occupied sector decreased substantially in the 1980s. At the same time, the tightening of rent controls in the 1980s made it less at-tractive to invest in the market rented sector. Consequently, there was a clear fall in the rate of house building, with the number of building permits issued dropping from 500,000 in 1980 to 356,000 in 1986. In reaction to this, the gov-
[ 113 ]

ernment introduced a series of tax benefits that aimed to improve investment conditions for market rental landlords. These tax benefits are still in place, al-though the specific conditions (see Section 5.8.5) have been changed regularly over the past twenty years. The tax benefits have resulted in a renewed inter-est in investing in the market rental sector (personal communication Jean-Pierre Schaefer).
In the 1990s, French housing policy had a strong focus on urban renewal and restructuring. During this period, the basic characteristics of the housing finance system remained unchanged. There were subsidies and low-interest loans for social rental landlords who wanted to build social rental dwellings. Low-interest loans were also available to social rental landlords and mar-ket rental landlords who wanted to build in the more up-market sector, also known as the intermediate sector (Donner, 2000, p. 268). Lastly, grants were available for individual market rental landlords refurbishing their properties. These were paid out by the Agence Nationale de l’Habitat (ANAH) (see also Sec-tion 5.8.3).
5.4.2 Recent housing policy developments
In recent years, social rental landlords have become increasingly active in the urban renewal process. In this, they are actively encouraged to cooperate with other stakeholders in the neighbourhood, such as local residents, schools, the police, and welfare organisations (Bougrain, 2004). A national agency dedicat-ed to urban renewal (Agence Nationale Pour la Rénovation Urbaine, ANRU) was created in 2003 to invest in and coordinate urban renewal projects in the most vulnerable neighbourhoods (Bougrain, 2004). According to some observers, the creation of the ANRU is part of a trend towards increasing centralisation and ‘distant governance’ with regard to urban renewal policies (Droste et al., 2008, p. 183).
A scheme known as the Plan de Cohésion Sociale came into force in 2005. The principal housing aims of this scheme are to improve housing quality, en-courage the production of affordable rental dwellings and ensure that empty homes are put on the market. The plan is a response to the fact that over the past ten years, around 50,000 social rental dwellings have been constructed per year, whereas the rate of production required was 80,000 dwellings. This stagnation in the rate of construction of social rental dwellings was due to complexities in the financing and administrative system, long procedures and high land costs, as well as strong competition from the market sector. An ‘urgency programme’ was proposed to overcome these problems. This pro-gramme contained an agreement between central government on the one hand, and social rental landlords on the other hand.
With the help of the programme, the production of social rental dwellings (financed with the help of PLA-I, PLUS or PLS-loans, also see Section 8.8.1)
[ 114 ]

is projected to rise to 500,000 social rental dwellings in period 2005-2009 (Ministère de l’emploi, du travail et de la cohésion sociale, 2004). In 2007, this ambi-tion was even raised to almost 600,000 dwellings.
Another policy aim is to develop the intermediate sector of the rental mar-ket further (logement locatif intermédiaire). Rent levels in this sector, in which both profit and non-profit providers can be active, are higher than in the so-cial rental sector but lower than in the market rental sector. In recent years, the loans and fiscal concessions to promote investment in this sector have been improved (Ministère de l’emploi, de la cohésion sociale et du logement, 2006a).
Furthermore, the ANAH (Agence Nationale de l’Habitat) has been given the task of funding the refurbishment of 200,000 existing dwellings in five years so that they can be put on the market at regulated rents. In the same five-year period, the ANAH is also supposed to put 100,000 homes that are cur-rently vacant onto the market.
The decentralisation of housing policy has also continued. With the sec-ond decentralisation law of 2004 local authorities such as départements and groups of communities (groupements intercommunaux) were given more re-sponsibility with regard to housing policy (they may now allocate loans and other state aids for example), provided they sign a contract with central gov-ernment. It is still too early to assess the effects of this new development; however, some people warn that the decentralisation of decision-making may result in a ‘nimby’ (not in my backyard) effect, as local politicians are often reluctant to welcome low-income households (Tutin, 2008). In any case, the debate concerning whether ‘more’ or ‘less’ centralisation is desirable persists (Blanc, 2004, p. 284).
A very new policy development concerns ‘the enforceable right to hous-ing’ (Droit au logement Opposable, DALO). In the future, every French citizen will have an enforceable right to decent housing. At present, this right only ap-plies to the social rental sector (Schaefer, 2008, p. 103). The enforceable right to housing implies that people who are not offered decent housing have the possibility of going to court. The new law is an extension of the Loi Besson of 1990, which had already introduced a quasi-constitutional right to housing. What triggered the Besson law was the observation that social rental land-lords sometimes are reluctant to house the neediest people (Stephens et al., 2002, p. 5).35 The enforceable right to housing has come into force in 2008 for the most urgent house seekers (the homeless, low-income workers, single women with children). In 2012, the right will also apply to all other types of house seekers (for example people currently in inadequate public housing).
35 The social rental landlords contest this by arguing that housing households with the lowest incomes
implies lower rent revenues. They claim that they can only house (all) these households if they receive suf-
ficient government funding.
[ 115 ]

The effects of this new law are yet unknown. Ball (2008) notes that the new procedure allows access to 30% of social housing allocations at most, and then only after an arduous procedure which still allows social landlords to refuse to house a successful litigant.
Finally, the election of Nicolas Sarkozy as the new French president has led to a new emphasis in French housing policy. The present government seems to be inclined to favour the owner-occupied sector above the rental sector. It has set itself the target of raising the home ownership rate to 70% (Ball, 2008, p. 33). In order to meet this objective, a new tax deduction scheme for first-time buyers has been introduced (personal communication Jean-Pierre Schaefer). The government also wants social rental landlords to sell more dwellings. The large-scale sale of social rental dwellings should increase the rate of home ownership among lower-income groups. It would also mean that social rental landlords could invest in restructuring and new house building with less state support. In 2007, social rental landlords signed an agreement with the French government which declared that the social rental landlords would have to sell 1% of their rental stock. However, this agreement made no mention of the timing and speed of this operation (personal communication Jean-Pierre Schaefer). Until 2008, the sale of social rental dwellings had re-mained relatively limited (4,900 social rental dwellings were sold in 2007).
In December 2008, the financial crisis prompted the French government to invest €1.4 billion extra in housing. With the help of this money, about 100,000 extra new dwellings are planned, most of them in the social rental (30,000 dwellings) and the intermediate rental (40,000 dwellings) sectors. Additionally, more money is being invested in renovation and the financial support for first-time buyers is being improved further (www.logement.gouv.fr). As far as this is concerned, one could say that housing policy is being used in a deliberately Keynesian manner to manage demand in the economy, which is a stated goal of housing policy in a way that is rare elsewhere (Ball, 2008, p. 32).
A new scheme has also been launched with the help of which private rent-al projects can be transformed into social rental programs (personal commu-nication Jean-Pierre Schaefer). Finally, the current French minister for hous-ing, Christine Boutin, is developing a plan that could modify the regulation of the social rental sector. The rent-setting system and the security of tenure are among the main points to be settled (Tutin, 2008).
Housing production since 1980Figure 5.2 shows the evolution of housing production in France in the pe-riod 1980-2007. In most years, housing production was between 300,000 and 400,000 dwellings, although it has recently (2007) increased to a little over 400,000 dwellings. In 2008 and 2009, the housing production is expected to re-main at around 380,000 dwellings (Schaefer, 2008, p. 97). However, it is prob-able that the current housing and financial crisis will adversely affect the
[ 116 ]

housing production rate. The housing production of social rental landlords has varied over the
years.36 In general, this production is of a countercyclical nature. When pri-vate construction decreases, the social rental landlords are supposed to in-crease their construction efforts in order to keep the overall rate of housing production at an acceptable level, thus protecting the house building sector. Finally, it should be noted that social rental landlords increase their dwelling stock not only by constructing new houses, but also by acquiring (and sub-sequently renovating) existing dwellings. In 2005 and 2006, this concerned about 17,000 dwellings per year.
36 It should be noted that not all social rental dwellings are built by these actors. Some social rental dwell-
ings are financed by other non-profit organisations than those mentioned above (for example housing co-
operatives), or by market rental landlords (a proportion of the dwellings that are financed with the PLS, see
also Section 5.8.1).
[ 117 ]
Figure 5.2 Housing production by social rental landlords * and other housing providers (number of housing starts) in France, 1980-2007
0
50,000
100,000
150,000
200,000
250,000
300,000
350,000
400,000
450,000
2007
2006
2005
2004
2003
2002
2001
2000
1999
1998
1997
1996
1995
1994
1993
1992
1991
1990
1989
1988
1987
1986
1985
1984
1983
1982
1981
1980
social rental landlords other
Source: figures derived from the website of the French ministry of Housing (www.logement.gouv.fr)
* This concerns public and private social rental landlords, SEMs and dwellings that are built by the local authorities or by the state.

5.5 Rent control, tenant security and other property rights
France’s social and market rental sectors have always been subject to differ-ent rent regulation regimes. Rent regulation in the market rental sector in particular has changed significantly over time. Times of very strong regula-tion have been followed by times of liberalisation and vice versa. In this re-spect, the 1948 Rent act was a particularly important dividing line (dwell-ings occupied before 1948 are subject to significantly stronger rent control than dwellings occupied after that year). The last major change in the rent regulation of the French market rental sector took place in 1989, when the loi Mermaz-Malandain was introduced. Many elements of this act are still in force today. The principal elements in the current French rent control system are set out below (based mainly on www.logement.gouv.fr and Donner, 2000). They are summarised in Table 5.5.
5.5.1 Social rental sector
Rent control37
Rents in the social rental sector are subject to state regulations. The maxi-mum rent that can be asked varies according to the financial support schemes, which have been granted to the social landlords (see also Section 5.8.1), as well as according to the size of the dwelling. Each subsidised loan has a maximum square metre price. These maximum square metre prices differ between regions, implying regional variation in the maximum admitted rents. However, notwithstanding this regional variation, social housing rents still depend mainly on cost-related factors and not on the housing market conditions. Consequently, in urban areas (where housing markets are gener-ally tight), rents in the social rental sector tend to be significantly lower than those in the market rental sector, whereas these differences are usually much smaller in the more relaxed housing markets in small and medium-sized towns (Amzallag & Taffin, 2003, see also Table 5.4).
The state also makes recommendations with regard to annual rent increas-es in the French social rental sector. However, social rental landlords are not obliged to follow these recommendations38 and they may also decide to apply different rent increases to different complexes.
The maximum rents that are allowed in the social rental sector are not
37 This section applies to the part of the social rental sector that is subject to a contract between the social
rental landlords and the state (secteur HLM conventionné).
38 Nevertheless, the rent after rent increase may not exceed the maximum rent permitted in the financial
agreements by means of which the social rental dwelling has been financed. These maximum rents are re-
viewed annually on the basis of the index of construction costs.
[ 118 ]

always high enough to cover the investment that the social rental landlords make in construction and renovation projects, even when they make use of the subsidised loans available. The rent level that would cover the expenses39 of the social rental landlords is called equilibrium rent (loyer d’équilibre). If the equilibrium rent is higher than the maximum permitted rent, social rental landlords may have to look for additional financial support. To do this, they could decide to substitute part of the state loan with cheaper loans from the
39 The expenses include the repayment of the loan and the interest, maintenance costs, administration
costs, local property taxes (where applicable) and the risk of non-paying tenants and vacant properties.
[ 119 ]
Table 5.5 Rent regulation, tenant security and other property rights in the social rental sector, the regulated market rental sector and the ‘normal’ market rental sector, France, 2008
Social rental sector Regulated market rental sector‘Normal’ market rental sector
Initial rent setting Maximum rents are determined by a contract between landlords and the state
Maximum rents are determined by a contract between landlords and the state
Free
Annual rent increase The state provides non-obligatory guidelines for the maximum annual rent increase
May not exceed the INSEE index of reference rents
May not exceed the INSEE index of reference rents
Term of the contract Indefinite: tenants can stay as long as they like
3 years 3 years for individual market rental landlords, 6 years for institutional market rental landlords
Renewal of the contract Not applicable During the contract between landlord and state, the tenancy agreement is automatically renewed after the three-years period has elapsed
Market rental landlords may not renew the contract if they have a legitimate reason to do so
Rent in renewed contract Not applicable Same rent as in the old contact unless the landlord can prove that that rent is below the market rate. However, the new rent may never be higher than the maximum admitted rent that is determined in the contract between landlord and state
Same rent as in the old contact unless the landlord can prove that that rent below the market rate
Right of refusal for sitting tenant in case of sale of the dwelling
Yes Yes Yes
Right to buy Not applicable Not applicable Not applicable
Rent surcharge for higher income groups
Yes Not applicable Not applicable
Derived from: http://www.logement.gouv.fr

1% logement programme (see Section 5.8.6), they could ask for financial support from the local authorities, they could invest part of their own funds or they could use surpluses on the exploitation of their older property to cover the losses incurred through their new investment (Amzallag & Taffin, 2003, p. 76).
Tenant security and other property rightsSecurity of tenure in the French social rental sector is greater than in the market rental sector. This is largely due to the fact that rental agreements in the social rental sector are of an indefinite nature.40 Non-paying tenants can be evicted, but this requires relatively long and complex procedures.
There is no right to buy in the French social rental sector. However, about 5,000 social rental dwellings are sold each year to private individuals, usually former tenants. Social rental landlords sell dwellings as part of their real es-tate strategy. The sale of dwellings provides equity that can be used for new investment. Only social rental dwellings older than ten years can be sold. Moreover, the sale must be approved by the local authorities because they lose their allocation right on the dwellings that are to be sold (personal com-munication Jean-Pierre Schaefer). Occupied dwellings can only be sold to sit-ting tenants (www.logement.gouv.fr).
Households that already live in a social rental dwelling (defined as dwell-ings that are owned or managed by social rental landlords and financed with the help of the state) and whose income rises above the income ceiling pre-scribed for the dwelling concerned are not required to leave their dwelling. In 2008, the proportion of such households within the social rented sector was estimated at less than 8% of all tenants in this sector. In 2009, when the in-come ceilings for access to the social rented sector are lowered, this figure could rise to 12% (Schaefer, 2008, p. 100). Households who have an income that is at least 120% of the income ceiling for the social rental dwelling con-cerned have to pay a supplement (supplément de loyer de solidarité, SLS) on their rent in order to ‘compensate’ for their good financial situation. The amount of the supplement depends on the household income and the size of the dwell-ing. However, the total housing costs (rent + rent supplement) may not exceed 25% of the total household income.41 This new measure has only applied since August 2008 and it is therefore still too early to assess its effects.
40 Formally, the rental contracts in the social rental sector have a limited term. However, as long as ten-
ants pay their rent, they can stay as long as they like. Thus, in practice the rental contracts in the social
rental sector are of indefinite nature.
41 This is the general rule. Local exceptions to this rule are possible.
[ 120 ]

5.5.2 Market rental sector
A part of the market rental sector is subject to an agreement between land-lords and the government. This concerns, for example, dwellings that are fi-nanced with the various tax concessions or with the renovation subsidies of the ANAH (see Sections 5.8.3 and 5.8.5). With regard to rent regulation and tenant security, there are two main differences between this regulated mar-ket rental sector and the ‘normal’ market rental sector.
Firstly, initial rents in the regulated market rental sector may not exceed the maximum formulated in the contract between the landlord and the state. Second, the tenancy agreement is automatically renewed as long as the con-tract between landlord and government is valid. Apart from these points, rent regulation and tenant security in the regulated market rental sector is identi-cal to rent regulation in the unregulated market rental sector.
Rent controlRents can be set freely for new contracts in the unregulated market rental sector. The INSEE index of reference rents (Indice de référence de loyers: IRL) serves as a guide for annual rent rises during the term of the contract. From 2005, this index was calculated on the basis of three other indices: the in-dex of the cost of daily living (60%), the index of maintenance and renova-tion costs (20%) and the index of construction costs (20%). Since 2008, the IRL has been based completely on the cost of living index (personal communica-tion Jean-Pierre Schaefer). This reform has benefited tenants, at the expense of landlords, because the construction price index has tended to rise much faster than general prices in recent years (Ball, 2008, p. 34).
Tenant security and other property rights In the market rental sector, the standard length of contracts is three years42 for individual market landlords and six years for institutional market rental landlords (Donner, 2000, p. 270). Six months before the term expires the land-lord may offer a new contract. If the landlord can prove that the old rent was substantially below current rents on the market, he can set a new rent on the basis of reference dwellings. The landlord then has to prove that the rents of six (in urban areas of over one million inhabitants) or three comparable dwell-ings are significantly higher than the rent he/she is currently asking (www.logement.gouv.fr). In order to simplify this process, some French cities have set up an observatory of market rental sector rents. In the Paris urban area, the rent increase at the renewal of contracts in the unregulated market rental
42 Shorter contracts are permitted in certain specific cases, e.g. if someone is going abroad for a year and
wishes to let his dwelling for that period.
[ 121 ]

sector is sometimes limited by central government decree. If the landlord does not offer a new contract with a new rent when the old
one expires, the old one is automatically renewed for three years under the existing terms (Boccadoro & Chamberedon, 2004, p. 17). The landlord can only terminate the tenancy agreement in the following cases:
■ the landlord wishes to use the home for his own occupation or to house a close relative;
■ the landlord wishes to sell the property. In this case the tenant must be given first right of refusal (droit de préemption);
■ the landlord wishes to refurbish the property thoroughly; ■ the tenant has not met his obligations in the past (e.g. by falling into ar-
rears with the rent).
Notice to terminate a contract during the tenancy period may only be given if the contract contains a special clause (clause résolutoire) or the tenant has several months of rent arrears. In practice, this involves a relatively time-con-suming and complex legal process (Boccadoro & Chamboredon, 2004, p. 21). Recently however, some changes in this juridical framework have been made in order to make market renting more secure and attractive for landlords (Ministère de l‘emploi, du travail et de la cohésion sociale, 2004, p. 30). At the mo-ment of writing, it is hard to assess the impact of these changes.
5.6 Allocation procedures and criteria
5.6.1 Social rental sector
The French social rental sector is characterised by a rather complex and so-phisticated housing-allocation process involving several stages and various actors (Ball, 2006). The social rental landlords have signed agreements with the various actors that contribute to the financing of the social rental sector. These agreements give the financing parties a say in the allocation of part of the social rental dwelling stock (Observatoire de l’habitat de Paris, 2005). This is done by means of a quota system which generally uses the following shares (CECODHAS, 2003). The central state (usually represented by le Préfet) is enti-tled to allocate 30% of the social rental housing stock (25% is reserved for the most disadvantaged people and 5% is destined specifically for civil servants),43 while the local municipality reserves 20% of the social rental dwellings on of-fer (as compensation for the fact that they guarantee the loans to social rent-
43 However, the state can also delegate its allocation rights to local authorities. This is a very recent devel-
opment (personal communication Jean-Pierre Schaefer).
[ 122 ]

al landlords). The various local collectors of the 1% logement fund (Comité In-terprofessionel du Logement, CIL) (see also Section 5.8.6), and a number of other actors involved in social housing44 are responsible for the allocation of the rest of the available stock of social rental dwellings (Ball, 2006). However, the exact distribution of the contingents may differ between municipalities.
The actors entitled to a reservation (or contingent) in social housing will usually propose three candidates (in order of priority) when a dwelling ear-marked for them falls vacant or is completed. The dossiers of these candi-dates are then presented to the commission d’attribution, a committee that consists of the various relevant stakeholders (employees of the social rental landlord, the mayor of the municipality concerned, representatives of the département and representatives of the tenants). This committee decides to which household the free dwelling is allocated. In reality, however, the com-mittee usually follows the advice of the different parties that put forward the candidates (Ball, 2006; Kirchner, 2006, p. 207).
There are multiple allocation criteria for social rental housing in France (Ball, 2006). First of all, there are income ceilings that depend on the financial support scheme used (see Section 5.8.1). These income ceilings are revised by central government every year (in line with the minimum wage) and vary be-tween regions and household types (Bougrain, 2004).
However, meeting the income requirements is only one of the conditions that must be met to obtain a social rental dwelling. Most tenants in the so-cial rental sector in reality have incomes that are well below these ceilings. Two-thirds of all those entering the social rental sector live on an income be-low 60% of the income level that gives access to social rental housing (income ceiling of the PLUS, see Section 8.5.1). This is partly due to the fact that next to income, a number of other criteria play a role as well in the housing alloca-tion process. These requirements may differ between localities, but all alloca-tion systems prioritise people with housing problems and/or social problems. These priorities are not cumulated (there are no point systems in French so-cial rental housing), so that different priorities can conflict with each other. This makes the allocation process rather complex and somewhat lacking in transparency. This may also explain why there are often complaints that dis-crimination has taken place (Kirchner, 2006, p. 207).
Although French housing allocation in the social rental sector is, in prin-ciple, needs-based to a high degree, the reality may sometimes be different. Local stakeholders and existing tenants may be strongly represented in the allocation process, and they could have an interest in excluding prospective tenants who may be unable to pay the rent or be seen as ‘difficult neighbours’.
44 This may include social rental landlords, ministries, chambers of commerce, and public companies
such as the Post Office and the national railways.
[ 123 ]

There can thus be a conflict between the rights of local stakeholders and the rights of the disadvantaged (Ball, 2008, p. 64). The funding system also plays a role here since it provides landlords with upfront loans for construction but does not offer funding to meet tenants’ social needs later. Extra support for the most disadvantaged households has to come from external sources and is generally in short supply. As a result, social rental landlords are sometimes reluctant to help the most needy (Ball, 2008, p. 73).
Households who want to apply for a social rental dwelling should register with the social rental landlords, the local authorities or various state services. All applicants are subsequently given a unique number at the level of the dé-partement. Waiting times for a social rental dwelling can vary greatly, depend-ing on the housing market situation in the region concerned. In areas with a particularly tight housing market, such as Paris, the waiting time can in fact be very long.
5.6.2 Market rental dwellings
For market rental dwellings that are financed with the help of subsidised loans (PLS or PLI), subsidies (ANAH) or tax concessions, tenants have to meet certain income requirements. These dwellings can be seen as the intermediate rental segment. For the rest of the market rental dwellings, there are no formal alloca-tion criteria. Market rental landlords can allocate these dwellings to whomever they wish, provided they comply with basic French law. Recently, increasing at-tention has been devoted to preventing discrimination by market rental land-lords and real estate agents (personal communication Jean-Pierre Schaefer).
5.7 Regulation and supervision
5.7.1 Regulating social rental housing
The French government determines the instruments and objectives of social housing organisations. Support for French social rental landlords is provided through an unusual financial system in which household savings (accumulat-ed in the state-regulated Caisses d’épargne) are used to provide loans to land-lords which build social rental housing. Most of these savings comes from tax-free or fiscally advantageous saving accounts for households such as the Livret A scheme or similar schemes (Amzallag & Taffin, 2003). The interest rate for the Livret A savings scheme is the mean of the Euribor and Eonia inter-est rates (see www.euribor.org for more information on this). In August 2008, the Livret A interest rate was 4.0% (http://www.caisse-epargne.fr). The interest rate on the loans for landlords is linked to this Livret A interest rate (see also Table 5.6).
[ 124 ]

[ 125 ]
Table 5.6 Main characteristics of the four loans for rental landlords, France, 2008
PLA-I PLUS PLS PLI
Target group Social rental landlords, SEMs, local authorities, organisations that deal with housing for vulnerable groups
Social rental landlords and SEMs
All investors All investors
Interest rate Livret A – 0.2% Livret A + 0.8% Depends on credit provider and type of landlord, usually around Livret A + 1.2%
Depends on credit provider and type of landlord, usually around Livret A + 1,5%
VAT-rate Low (5.5%) Low (5.5%) Low (5.5%) Normal* (19.6%)
Exemption of land and property taxes
Yes (25 years) Yes (25 years) Yes (25 years) No
Term of the loan 40 years (50 years for the value of the land)
40 years (50 years for the value of the land)
30 years (50 years for the value of the land)
30 years (50 years for the value of the land)
Amount of the loan Variable, maximum 100% of investment costs
Variable, maximum 100% of investments costs
> 50% of investment costs
Variable
Duration of contract with state
Long term, typically longer than the term of the loan
Long term typically longer than the term of the loan
Term of the loan, minimum 15 years (longer term for social rental landlords)
Term of the loan, minimum 9 years (longer term for social rental landlords)
Amount of subsidy Depends on region and type of investment, between 16.5% and 35%
Depends on region and type of investment, between 3% and 17.8%
No subsidy No subsidy
Maximum rent level in the most expensive region (Paris) in 2008
€ 5.42/m2 € 6.09/m2 € 9.14 (150% of maximum rent level for PLUS)
€ 16.82/m2
Maximum income level (based on taxable income: revenu imposable)
Depending on region and household size, <60% of the income ceiling of PLUS dwellings
Depending on region and household size, 30% of the tenants should have <60% of the maximum income level, 10% of the tenants may have up to 20% more income
Depending on region and household size, maximum 130% of the income ceiling of PLUS dwellings
Depending on region and household size, maximum 140-180% of the income ceiling of PLUS dwellings (depending on the region)
Housing allowance for tenants?
Yes Yes Yes Yes (but no APL)
Number of dwellings financed in 2006
8,000 51,000 33,000 2,800 (2003)
Sources: www.logement.gouv.fr., Ministère du logement et de la ville, 2008a; Amzallag & Taffin, 2003; personal communication Amzallag
* However, for renovation work, the low Value Added Tax applies.

The above financial system is called the Fonds d’Epargne. It is coordinated by the state-controlled National Deposit Office (Caisse des Dépôts). The system limits the amount of state subsidisation required for social rental housing but also obliges the French state to find a balance between a favourable in-terest rate for the lenders (the social rental landlords) on the one hand, and a favourable interest rate for the capital providers (households) on the other hand (Amzallag & Taffin, 2003). The repayment of the Fonds d’Epargne loans is guaranteed by the municipalities or the guarantee fund for the social rental sector: the Caisse de Garantie du Logement Locatif Social (CGLLS).
Central government has a significant influence on the allocation of the loans the Fonds d’Epargne. It defines housing needs, approves projects and de-cides on the level of the subsidy given to social housing. Nevertheless, local authorities are playing a growing role: they also supervise social landlords, co-finance social housing programmes and are in charge of urban planning. Since 2004, the Second Decentralisation Law has allowed groups of local au-thorities to take responsibility for distributing state grants for social housing (Levy-Vroelant & Tutin, 2007, p. 75).
The Fonds d’Epargne loans are allocated following an analysis of the opera-tions and financial health of the social rental landlords concerned. The Caisse des Dépôts (the manager of the fund) can refuse to provide loans if they deem the financial management of the social rental landlord that is applying for the loan to be unacceptable (Boelhouwer, 1996, p. 76). It is also responsible for the financial supervision of social rental landlords.
Nowadays, only a few institutions may provide Livret A saving accounts and a large part of the savings involved is accumulated in the Caisse des Dépôts. However, according to the EU free competition rules, other banks will also be able to provide such accounts in the future (from 1 January, 2009). In the longer term this may have negative consequences for the French social rental sector. If the money deposited at the Caisse des Dépôts decreases be-cause of competition with regular banks, the social housing organisations will have to obtain loans from the regular banking system at less favour-able conditions. This means that they will have less money available for in-vestment and may have to raise their rents (Ghékière, 2008; Tiset, 2008). The French government has announced that it will study a reform of the Livret A scheme in order to make it compatible with EU rules and preserve its role in funding social housing (Ghékière, 2008, p. 282).
Whereas the Caisse des Dépôts is responsible for the financial supervision of the social rental sector, the general performance of social rental landlords is evaluated by a central government organisation called MIILOS (Mission d’Inspection Interministérielle du Logement), which is related to both the Minister of Housing and the Minister of Finance. MIILOS can advise ministers to im-pose sanctions on social rental landlords that do not perform well, with the dismissal of the board of directors, and in extreme cases even the dissolution
[ 126 ]

of the organisation as the ultimate penalty (Amzallag & Taffin, 2003; Bougrain, 2004). Besides a controlling function, MIILOS also plays an advisory role for the government.
5.7.2 Regulating market rental housing
The market rental sector in France is by no means unregulated. It is subject to housing quality regulations (see Goodchild et al. 2001) and rent regulation (see Section 5.5.2), for example. Various forms of financial support are also avail-able for market rental landlords (see Section 5.8).
5.8 Subsidies and finance
As we saw in Section 5.4, loans and subsidies have always played a major role in French housing policy, particularly during the period following World War II. This section describes the current French housing subsidy system. We will describe the loans and subsidies for rental landlords, the renovation subsidies, taxation issues, the 1% logement scheme and the housing allowances.
5.8.1 Support for social rental sector investment
There are currently four different loans that can be used for the construction, acquisition, or renovation of social rental dwellings. Each loan focuses at a specific segment of the social rental market. The main characteristics of the four loans are described below. More detailed information can be found in Ta-ble 5.6. It should be noted that the specific parameters of the four loans are subject to regular change.
Prêt Locatif à Usage Social (PLUS)The PLUS is a loan that is solely available for private and public social rental landlords and SEMs. The maximum term of this loan is 40 years.45 The inter-est rate is variable; it is 0.8% higher than the interest rate that households receive on a Livret A saving account (Ministère du logement et de la ville, 2008b).
PLUS loans can be used for the purchase of building land, the purchase of existing dwellings, the construction of new dwellings, the transformation of non-residential buildings into dwellings and the realisation of accommoda-tion for vulnerable groups (foyers). Furthermore, the loan may be invested in urban restructuring operations. Dwellings financed with the help of the PLUS
45 For land purchases, the term of the loan can be 50 years (Ministère de l’emploi, de la cohésion
sociale et du logement, 2006).
[ 127 ]

are subject to a reduced value added tax rate (5.5% instead of 19.6%) and for 25 years, no land and property taxes (taxe foncière) have to be paid.
The PLUS is accompanied by a subsidy. The amount of this subsidy ranges between 3% and 17.8% of the estimated costs,46 depending on the region and the type of investment. Dwellings subsidised with the PLUS must meet cer-tain requirements with regard to the maximum rent and incomes of the ten-ants. The maximum rent levels differ between regions.
The income ceilings used in the PLUS serve as a benchmark for the income limits used in the other subsidised loans. These income ceilings vary between household types and regions. In 2007, 71% of all French households had an in-come below the income ceilings of the PLUS (personal communication Michel Amzallag). The French social rental sector is thus accessible to large segments of the French population. However, in 2009 this income ceiling will be lowered so that ‘only’ 60% of the French population will have access to the social rent-al sector (Schaefer, 2008, p. 99).
As far as the income requirements of the PLUS are concerned, there is not only an income limit but there are also conditions with regard to the spread of incomes around this income limit (see Table 5.6). In order to ensure a ‘healthy’ social mix, both middle and low-income groups should have ac-cess to PLUS-subsidised housing (Ministère de l’emploi, de la cohésion sociale et du logement, 2006b). Consequently, 30% of the tenants should have an income that is less than 60% of the maximum income level, whereas 10% of the ten-ants may have up to 20% more income than this income level.
Prêt locatif aidé d’intégration (PLA-I)This loan is a variation of the PLUS that is specifically destined for the con-struction or acquisition of dwellings for people with social and/or economic problems. It has a maximum term of 40 years (50 years for land purchases). The principle of this loan is largely the same as that of the PLUS, but the in-terest rate is significantly lower, the maximum permitted rent is lower, the subsidies are higher (maximum 35% of the estimated costs) and the income obligations for residents of PLA-I dwellings are stricter. The PLA-I regime also consists of a social programme that aims to stimulate the social integration of the tenants of PLA-I dwellings (http://www.logement.gouv.fr).
Subsidies by local governmentsIn addition to the state loans described above, the local authorities (munici-palities, groups of municipalities, départements, régions) may also provide fi-
46 This percentage is not applied to the actual costs but to the estimated costs of the investment. A for-
mula is used to calculate these estimated costs. Also, if the cost of the land passes a certain ceiling, extra
land costs above this ceiling are subsidised as well (at a subsidy percentage of 30 to 50%).
[ 128 ]

nancial aid to social rental landlords. In fact, such aid is increasingly being requested by social rental landlords (personal communication Jean-Pierre Schaefer). The aid may take the form of subsidies, but it can also involve the provision of cheap building land (Amzallag & Taffin, 2003).
5.8.2 Support for intermediate sector investment
This section deals with the two loans that are designed specifically for the in-termediate rental sector: the PLS and the PLI.
Prêt locatif social (PLS)The PLS loan is available to any investor (individual household, company or social rental landlord) that wishes to provide rented homes in the ‘intermedi-ate sector’ (secteur intermédiaire) – the rental segment just above the ‘tradition-al’ social rental sector. The loan is specifically destined for regions with tight housing markets, where there is a relatively large gap between the ‘cheap’ so-cial rental sector and the ‘expensive’ market rental sector.
About three-quarters of PLS loans are taken up by social rental landlords, and the remaining quarter by individual or institutional market rental land-lords (personal communication Jean-Pierre Schaefer). Rents and tenants’ in-comes in this part of the rental sector are higher than in the case of social housing financed under the PLUS system, but they are still subject to state regulations. Dwellings financed with PLS loans are also subject to a lower rate of VAT, and no land or property taxes (taxe foncière, see also Section 5.8.4) are payable on them for the first 25 years. PLS loans can be used either to build new homes or to purchase and refurbish existing property. Investors can ob-tain PLS loans through the Caisse des Dépôts or through banks or finance com-panies that have signed contracts with this organisation.
A PLS loan must cover at least 50% of the investment costs. The term of the loan is agreed between the borrower and the lender (the maximum term is 30 years, or 50 years for land purchases). The interest rate (as of August 2008) is around 5.2%, depending on the credit provider and the type of investor in-volved (social rental landlord or market rental landlord).
To apply for a PLS loan, the landlord must enter into a contract with the French state which runs for 15 to 30 years. During this period, the landlord is required to comply with regulations concerning the rent level and the income of the tenants. For social rental landlords, these obligations remain even after the loan has been fully paid off (Amzallag & Taffin, 2003, p. 9).
Tenants of dwellings financed by a PLS loan may not earn more than 130% of the income limit for ‘normal’ social housing (income ceiling for the PLUS). The number of dwellings financed with PLS loans was around 12,000 in 2002, around 13,000 in 2003 and just under 21,000 in 2004 (www.logement.gouv.fr). In 2005 and 2006 the annual output of PLS rented homes is expected to be be-
[ 129 ]

tween 20,000 and 25,000. In tight housing markets, PLS-financed dwellings are a bit cheaper than comparable market rental dwellings. Some believe that too many PLS-financed dwellings are being constructed and a reduction in the provision of PLS-financed dwellings is foreseen for the near future (personal communication Jean-Pierre Schaefer).
Prêt Locatif Intermédiaire (PLI)The PLI loan is similar to the PLS but targets a somewhat more up-market section of the intermediate rental sector. The PLI is specifically designed for very tight housing markets. In practice, this means that the loan is available in the Paris region, the larger cities (with over 250,000 inhabitants) and a few zones with a tight and expensive housing market such as the Côte d’Azur and the region around the lake of Geneva. In other areas, the loan can only be taken up after explicit permission of the government (Ministère du logement et de la ville, 2008a).
PLI loans are available to both social rental and market landlords. Interest on a PLI loan is slightly higher than on a PLS loan, with rates around 5.5% (as of August 2008). The fiscal advantages that apply to PLA-I, PLUS and PLS loans, do not apply to PLI-loans.
Market rental landlords taking up a PLI loan are required to let the home they build or purchase with the loan for a minimum of nine and a maximum of 30 years. During this period, the landlord is required to comply with regu-lations regarding the rent level and the income of the tenants, although the rent and income limits are higher than in the case of a PLS loan. Tenants of dwellings financed with a PLI loan may not earn more than 180% of the in-come limit for ‘normal’ social housing (the income ceiling for the PLUS).
In practice the take-up of PLI loans is fairly low (Donner, 2000, p. 268): some 3,000-4,000 rented homes a year are financed with them on average (www.logement.gouv.fr).
5.8.3 Subsidies for renovation
Besides the four loans discussed in the Sections 5.8.1 and 5.8.2, there are also some subsidies that aim specifically to improve the quality of the rental hous-ing stock. These subsidies are discussed in this section.
Prime à l’amélioration des logements locatifs sociaux (Palulos)The Palulos is a state subsidy which social rental landlords can use for the renovation of dwellings of at least 15 years old. The government has set up a list indicating which kind of renovations can be subsidised. Dwellings sub-sidised through the Palulos scheme are part of the social rental sector. This means that they are tied to maximum rent levels, that the tenants have to meet certain income obligations, and the low value added tax rate applies.
[ 130 ]
The Palulos subsidy generally covers 10%47 of the renovation costs with a maximum of €13,000 per dwelling. However, if the renovation leads to an increase in the habitable surface of the dwelling of at least 10%, the maxi-mum subsidy rises to €20,000. The Palulos subsidy cannot be used in com-bination with any other subsidy arrangements such as the PLUS, the PLA-I, the PLS, the PLI or the ANAH subsidies. However, a Palulos grant may be com-plemented by a specific 15-year Palulos loan. This loan is also available for renovations that do not qualify for the Palulos subsidy and is known as PAM: Prêt à l’Amélioration. The loan is provided by the Caisse des Dépôts at the same interest rate as the PLUS loans. In 2004, about 60,000 dwellings were reno-vated with the help of Palulos subsidies (http://www.logement.gouv.fr), and since 1980, about 60% of the social rental dwelling stock has been renovated through the Palulos scheme (Amzallag & Taffin, 2003, p. 48).
Grants for home refurbishmentThe Agence Nationale de l’Habitat (ANAH) is a national body that provides grants for home refurbishment and improvements. In 2006, the ANAH pro-vided €478 million in grants (ANAH, 2007). ANAH grants are available to both owner-occupiers and individual market rental landlords. Most of the subsi-dies (€306 million) are taken up by individual market landlords. In order to classify for a grant from the ANAH, individual market rental landlords must meet the following conditions:
■ the dwelling in question must be at least nine years old; ■ after the renovation, the dwelling must be let by the home-owner for at
least six years; ■ the refurbishment must be carried out by professionals; ■ the work must be approved by the ANAH.
The ANAH grants normally cover 15% of the refurbishment costs, but this can rise to 70% if the landlord observes certain guidelines regarding rent, or if the refurbishment is part of a particular social or refurbishment scheme (www.anah.fr). The ANAH is funded partly by money that is raised through the con-tribution sur les revenus locatifs, formerly known as the contribution additionnelle du droit de bail. This is a special tax at a rate of 2.5% which is due on the annual revenue from the letting of market rented properties that are at least 15 years old.48 In 2006, a total of 60,400 market rental dwellings were renovated through ANAH subsidies. Of these 60,400 dwellings, 38,600 had a regulated rent. Rent-al dwellings that are financed with the help of the ANAH grants are also sub-ject to a specific fiscal arrangement (see Table 5.7), also known as Borloo dans
47 Although in specific cases, this percentage can be much higher (up to 40% of the renovation costs).
48 Dwellings with an annual revenue of less than €1,830 are exempt from this tax.
[ 131 ]

l’ancien. Market rental landlords that do not receive ANAH subsidies can also use this tax incentive, provided that they sign a contract with the ANAH.
Premiums for placing empty homes on the marketThe ANAH also provides premiums to people who make their empty homes available for letting. The amount is €2,000 or €5,000, depending on the hous-ing market area. To be eligible for this premium, the dwelling must meet the following conditions (www.logement.gouv.fr):
■ it must have been empty for at least 12 months; ■ it must have been refurbished at a cost of at least €15,000; ANAH grants
are available to finance this refurbishment; ■ the rent must be below a certain limit.
In 2006, 5,400 dwellings were eligible for the above subsidy program (ANAH, 2007).
5.8.4 Taxation of the different types of landlords
This section describes the system of taxation for the various types of land-lords in France.
Taxation of social rental landlordsSocial rental landlords are not required to pay corporation tax or local busi-ness taxes (taxe professionelle). They also pay a lower VAT rate than the stan-dard rate, and they may be exempt from land and property tax49 (Amzallag & Taffin, 2003; Donner, 2000, p. 272).
Taxation of institutional market rental landlordsPrivate companies doing business in France are subject to corporation tax (Parkinson, 2004, p. 41). It should be noted, however, that French companies can have many types of legal status, and the status adopted affects the tax re-gime that applies to the company. Smaller companies in particular are some-times subject to income tax (with each person in the company declaring rev-enue separately) rather than corporation tax, because the French income tax system has a special facility for declaring commercial or industrial income (Parkinson, 2004, p. 98).
A large number of items are deductible under French corporation tax, in-cluding various other taxes, reserves, labour costs, depreciation and interest. Corporation tax is payable on the difference between the revenue and the sum of these deductions. The rate is 33.33% (Parkinson, 2004, p. 116). Certain types of company are (partially) exempt from corporation tax, including the
49 In the first 25 years after they have taken up a PLUS, PLA-I or PLS loan.
[ 132 ]

sociétés immobilières d’investissement, companies that invest in and let property where at least 75% of the floor area is for human habitation (Parkinson, 2004, p. 109). However, the share of these companies is still very limited. In addition to corporation tax, companies that own property in France also have to pay a tax of 3% on the market value of this property (Parkinson, 2004, p. 164).
Taxation of individual market rental landlordsIndividual market landlords have to pay income tax on the rental income they receive from their property. If the annual gross rental income is under €15,000, the micro-foncier regime applies. Under this regime, a fixed percentage of 30% may be deducted from the rental income to offset the costs incurred by the landlord. The micro-foncier regime cannot be combined with tax incentives that aim to encourage investment in the rental sector (see Section 5.8.5).
In the case of individual market landlords who receive over €15,000 in rental income, the standard foncier regime applies. Under this regime, the expenditure that the landlord incurs in connection with letting his property (and not only maintenance costs, but also the cost of refurbishment and im-provement and property taxes, as well as interest on mortgages) may be de-ducted from the rental income. These expenses may in fact be higher than the rental income. A negative balance of a maximum of €10,700 per year50 may be deducted from the market rental landlord’s income.
5.8.5 Tax concessions for market rental landlords
Various tax measures have been brought in over the past twenty years with the aim of stimulating the market rented sector, especially in areas with tight housing markets. The tax incentives are usually named after the Ministers who introduced them, such as Méhaignerie, Périssol, Besson, Robien, and Borloo. Each Minister had his own approach, but ministers of the left have tended to set stricter conditions than ministers of the right. The period for which the tax measures remain in force are usually much longer than the term of office of the minister who introduces them, with the result that the various mea-sures have overlapped in time. In 2006, the law Engagement National pour le Logement (loi ENL) led to a reform of the various tax incentives. Since that time, only the Dispositif Robien recentré, the Dispositif Borloo neuf ou populaire and the ANAH tax incentives (Borloo dans l’ancien) apply. The main characteristics of these tax incentives are explained below (see also Table 5.7).
50 The interest on mortgages may not be taken into account when calculating this deficit. This interest may
only be deducted as long as the remaining balance is positive.
[ 133 ]

Dispositif Robien recentréThis scheme provides tax relief for individual households that wish to invest in market rental dwellings. The scheme focuses on regions with tight housing markets and can be used either to build new homes or to purchase and refur-bish existing property. The scheme, which only applies to the normal foncier re-gime (see Section 5.8.4), allows for a certain percentage of the value of the prop-erty to be deducted from rental income for a period of nine years. As income tax is payable on the revenue from letting, the scheme can mean that less in-come tax is payable on that revenue. In some cases the balance of revenue from letting less tax deductions will be negative, with the result that the landlord is required to pay less income tax than if he or she was not letting property.
Two conditions must be met to qualify for this tax concession. First of all, the rent that can be charged is tied to a maximum. The maximum rents in-volved vary from one region to another but they are generally close to the market rents. Consequently, rental dwellings that are financed with the Robien recentré are considered to be ‘free’ market rental dwellings (secteur libre). Sec-ond, the dwelling concerned must be let for at least ten years, although there are no requirements regarding the income of the tenants.
For the first seven years after the property is built, purchased or refur-bished, the scheme allows for 6% of the acquisition or construction costs (plus any costs of refurbishment) to be deducted from the rental income an-nually, up to a maximum negative balance of €10,700 annually. In years seven and eight, 4% of the acquisition or construction costs may be deducted from the rental income. In total, then, a sum equivalent to 50% of the acquisition or construction costs of the property can be deducted from the rental income.
Borloo neuf ou populaireThis scheme can be seen as a variation of the Dispositif Robien recentré. This tax measure is designed to encourage investments in dwellings with lower rent levels (the maximum permitted rents are 20% lower) than those financed through the Dispositif Robien recentré. The rents of dwellings that are financed with the Dispositif Borloo neuf may not be above around 70% of market rents. The dwellings are destined for households on middle incomes. The tenants of the Borloo neuf dwellings must be on an income below income limits formu-lated by the state. These income limits are similar to those in the intermedi-ate rental sector (Ministère du logement et de la ville, 2008b).
The Borloo neuf ou populaire scheme offers the same fiscal advantages as the Dispositif Robien recentré but also has some extra facilities. First of all, the term of scheme may be extended twice with a term of three years after the initial term of nine years. During these two extra three-year periods, 2.5% of the acquisition or construction costs of the dwelling may be deducted from the rental income, which means that the total amount of money that can be deducted from the rental income is 65% of the investment in the property
[ 134 ]

(over a period of 15 years). Secondly, the scheme is financially more attrac-tive since it offers not only the deduction of a large part of the construction and renovation costs, but also a general deduction of 30% of the gross annual rental income.
Evaluation of the tax incentivesBetween 1995 and 2005, around 471,000 dwellings were sold by developers to market rental landlords. Around half of these dwellings were subject to the various tax incentives. In 2003, these incentives financed 54,000 dwell-ings, in 2004 62,000 dwellings and in 2005 68,600 dwellings. The costs for the government of the tax concessions totalled a little over €600 million in 2008 (Ministère du logement et de la ville, 2008b).
Tax relief on home improvementThe cost of home improvement and refurbishment is deductable from the rental income for income tax purposes. Since the balance of (a) revenue from letting and (b) deductions and expenditure must not exceed –€10,700 annually, the deduction may be spread over a number of years (www.logement.gouv.fr).
[ 135 ]
Table 5.7 Main characteristics of the tax incentives for investment in the market rental sector, France, 2008
Robien recentré Borloo-neufANAHintermédiaire ANAH social
Starting date 1-09-2006 1-1-2006 1-10-2006 1-10-2006
Objective Stimulate supply in the free market rental sector
Stimulate supply in the intermediate rental sector
Make a larger part of the existing dwelling stock available for renting
Income limits No Income limits of the PLI
Yes, depends on household type: ANAH intermédiares
Yes, depends on household type: ANAH sociaux
Maximum rent level in most expensive area (Paris) in 2008
€ 21.02/m2 € 16.82/m2 € 16.81/m2 € 6.06/m2
Yearly tax deduction as % of the investment cost
6% of the investment can be deducted in the first 7 years, 4% in the years 8 and 9
6% of the investment can be deducted in the first 7 years, 4% in the years 8 and 9, after that 2.5% for two periods of three years (optional)
Not applicable Not applicable
Fixed reduction (as % of the rental income)
0% (26% in particular rural areas)
30% 30% 45%
Term of the arrangement
9 years 9 years with the possibility of an extension of 2 times 3 years
6 years (without subsidised renovation) or 9 years (with subsidised renovation)
6 years (without subsidised renovation) or 9 years (with subsidised renovation)
Source: Ministère du logement et de la ville, 2008a and 2008b

Special tax on empty rented homesIn order to stimulate the market rented sector and reduce the vacancy rate, the French Government decided in 1999 to tax properties (other than second homes) located in eight major conurbations that were vacant for two years or more. The tax is 10% of the (potential) rental value in the first year, rising to 15% in the third year. The money raised from this tax is channelled to the ANAH (Kirchner, 2006, p. 193).
Lower VAT (taxe sur la valeur ajouteé) on home improvementSince 1999, under certain conditions, individual market landlords that are renovating their dwelling are liable for a VAT rate of only 5.5% instead of the normal rate of 19.6%. This concession, which ties in with an EU initiative to provide tax incentives for labour-intensive services, applies to tenants and owner-occupiers as well as to individual market rental landlords.
5.8.6 The 1% logement scheme
The 1% logement scheme, which became mandatory in 1953, is paid by any private company employing over 19 people. It is a specifically French scheme that is designed to express social solidarity between employers and employ-ees on the one hand, and wider society on the other hand (personal commu-nication Jean-Pierre Schaefer). The rate, initially set at 1% of the total gross wage bill of private companies, has been set at 0.95% since 1992. The largest proportion of this money (0.50%) goes to the Fonds National d’aide au logement (FNAL), which uses it to finance housing allowances. The rest of the contri-bution (0.45%) is transferred to registered intermediary organisations (CIL: Comités Interprofessionnels du Logement) and chambers of commerce. These or-ganisations finance social housing and urban renewal operations and provide financial support, advice and services to households51. As compensation for their financial help, the intermediary organisations are often made share-holders of social rental landlords. A significant part of the social rental dwell-ing stock is reserved for the employees of the companies that are involved in the 1% logement scheme (Bougrain, 2004).
5.8.7 Housing allowances
In France, the housing allowances are called aides à la personne. They are paid out by the social security offices (Caisses d’Allocations Familiales and Caisses de Mutualité Sociale Agricole). The housing allowances are funded by the Fonds des
51 Some of these services are open to all households whereas others only apply to the employees of the
companies that participate in the 1% logement scheme.
[ 136 ]

prestations familiales (National fund for family benefits) and the National fund for housing benefits (Fonds national des aides au logement, FNAL). Housing al-lowances in France are available to both tenants and owner-occupiers on low-er incomes.
Formally, there are two kind of housing allowances. The APL (L’aide person-nalisée au logement) en the AL (L’allocation logement). The two allowances have a different history, but since 2001, the difference is no longer relevant to ten-ants. Since that date, the AL and the APL have been based on exactly the same subsidy system, although they retain their different names and separate tar-get groups (Satsangi, 2007).
Lower-income tenants who rent a dwelling let under a contract (convention-nement) between the landlord and the central government are eligible for the APL. These contracts cover most HLM dwellings, half of SEM dwellings as well as market rental dwellings that are financed through ANAH subsidies. The contract imposes certain obligations on the landlord regarding rent setting and the income of the tenants to which they let the dwelling. The aim of the contracts is to prevent housing allowances being translated into higher rents. Lower-income tenants that live in rental dwellings that are not let under a contract between landlord and state are entitled to the AL52. In order to be eli-gible for the AL, the dwelling must meet certain criteria with regard to com-fort and surface area.
The level of the allowance depends on the income and composition of the household and its housing costs (these housing costs are only subsi-dised until a certain maximum). Each household is reassessed annually to verify whether it is still eligible for housing allowances and how much sup-port it is entitled to (http://www.logement.gouv.fr). The housing allowances are financed by the French state, by the contributions of employers (the 1% logement scheme) and by social security contributions made by households (through the régimes sociaux).
In 2005, about 6.08 million French households were receiving a housing al-lowance (4.87 million tenants, 570,000 households in foyers and 640,000 own-er-occupiers). In total, these households received a sum of €13.8 billion, or an average of €2,300 per household (personal communication Michel Amzallag).
52 There are two kinds of AL benefits – those of a family nature (l’allocation à caractère familial, ALF) and
those of a welfare nature (l’allocation à caractère social, ALS). ALF is available for newly married couples
(married for less than five years) and for singles and married couples looking after another person in their
household (a child or an elderly or disabled person). ALS is intended for low-income households who are
not entitled to APL or ALF.
[ 137 ]

5.9 Bridging the gap between social and market renting?
The gap in who provides whatIn France, there are considerable differences between the social rental sec-tor and the market rental sector with regard to the types of landlords and the products on offer (see Table 5.8). The dwellings in the social rental sector are let by public or private non-profit or limited-profit organisations (HLMs and SEMs), whereas market rental landlords, which are mainly individual house-holds, are primarily looking for returns on their investment. In the social rent-al sector, the dwellings are on average somewhat larger and newer than in the market rental sector. There are also more apartments, relatively speaking, and fewer dwellings that lack comfort in the social rental sector. At the same time, it should be realised that the market rental sector is highly differentiated. The French market rental sector is composed of several subsectors and provides a wide variety of products (Tutin, 2008). In general, social rental dwellings have substantially lower rents than market rental dwellings and especially in the tight housing markets of the major cities, the differences are considerable.
Rent setting also differs between the two sectors. In the social rental sec-tor, rent setting is determined through agreements between social rental landlords and the government which are usually associated with subsidised loans. In the market rental sector, rent setting is completely free for new con-tracts. As far as annual rent increases are concerned, the differences between the two sectors are less pronounced and in both sectors, the annual rent in-crease is strongly influenced by the government.
Security of tenure is strong in the social rental sector, where the rental contracts are of an indefinite nature. Nevertheless, tenants may have to pay a rent supplement if their income rises well above the income limit. In the market rental sector, security of tenure is less strong, since rental contracts have a term of either three or six years. However, after this term has passed, the contracts are automatically renewed unless the landlord has a legitimate reason not to renew.
In sum, a rather large gap is apparent between the social rental sector and the market rental sector. At the same time, it should be noted that this gap is partly bridged by the intermediate sector.53 The dwellings in the interme-diate rental segment tend to have higher rents than social rental dwellings, but they are still bound by certain regulations concerning rent setting and the
53 In Table 5.8, the intermediate rental sector is treated as part of the market rental sector because most of
the government measures which aim to stimulate this sector are focused at profit-oriented market rental
landlords. However, it should be noted that social rental landlords can also let intermediate rental dwell-
ings. In practice, the French intermediate sector can take many different forms, which makes it difficult to
define it clearly.
[ 138 ]

income of the tenants. As far as these aspects are concerned, intermediate dwellings occupy a true middle position between the social rental sector and the market rental sector. Depending on the specific subsidy arrangements through which they are financed, intermediate rental dwellings can be let by both social rental landlords and profit-oriented market rental landlords.
The gap in government policies and outcomesFrench housing policies and housing outcomes clearly differ between the so-cial rental sector and the market rental sector as well (see Table 5.9). There is much more intervention by government in the form of regulation and super-vision in the social rental sector than the market rental sector. This is clearly visible, for example, in the housing allocation system. Whereas social rental dwellings are allocated according to need by means of a complex and sophis-ticated allocation system, there is no specific housing allocation system with-in the market rental sector. Only market rental landlords that are active in the intermediate sector are required to select tenants with an income below certain limits.
The subsidy and taxation mechanisms also vary between the two rental sectors. There are several loans (PLUS, PLA-I, Palulos) and tax concessions that
[ 139 ]
Table 5.8 The gap between social renting and market renting in who provides what in France
Social renting Market renting
Landlords
Types Public or private, non-profit or limited profit organisations
Mostly individual households, a limited share of institutional market rental landlords
Motives Non-profit, providing affordable housing for low-income groups
Direct and indirect returns on investment
Accommodation
Quality of products of offer Larger, newer and more apartments than in market rental sector, relatively few dwellings that are lacking in comfort
Smaller, older and more single-family dwellings than in social rental sector, relatively many dwellings that are lacking in comfort
Rent levels Relatively low rents Relatively high rents, especially in the more urban housing markets
Rent control and property rights
Rent regulation Rent setting depends on contracts between government and landlord; the annual rent increase is influenced by the government as well
Market rents for new contracts, annual rent increase on the basis of an index
Security of tenure Indefinite security of tenure Rental contracts of three or six years. Contracts are automatically renewed unless the landlord has a legitimate reason not to renew
Other property right: rent surcharge
Tenants with a high income may have to pay a rent supplement
Not applicable
Other property right: right to buy
Not applicable Not applicable

are only available to social rental landlords. Only in the intermediate segment do the two types of landlords ‘meet’, since the PLS and PLI loans, and the at-tached fiscal advantages, are available to both social rental and market rental landlords. However, there are also some financial schemes that aim to stimu-late the intermediate sector and that only focus at individual market rental landlords (for example the ANAH subsidies and the various tax concessions for individual market rental landlords). With regard to housing allowances, there are no differences between the social rental sector and the market rent-al sector. Housing allowances are available to tenants in both sectors, as well as to owner-occupiers with a low income.
The competitive gapIn principle, substitutability between the social rental sector and the market rental sector in France can be considered relatively limited (see Table 5.8). On
[ 140 ]
Table 5.9 The gap between social renting and market renting in policy and policy instruments in France
Social renting Market renting
Purpose of housing sector Affordable housing for lower income households
Direct or indirect return on investment
Allocation procedures Social rental dwellings are allocated according to need through a complex and sophisticated allocation system
No specific housing allocation for market rental sector, income criteria for the intermediate sector
Rent control
Rent control for new contracts
Rent setting depends on contract between government and social rental landlord
Free (based on the old rent or on reference dwellings in case of renewal of a rental contract)
Rent control for rent adjustments
Influenced by the government Based on a specifically developed index
Regulation and supervision Supervision on performance by central government organisation (MIILOS), financial supervision by Caisse desDépôts
No specific supervision. Rent regulation, housing quality regulation and various subsidies apply
Government support
Bricks-and-mortar subsidy Available Not available, except for the intermediate sector
Tax concession for landlord Available Available, especially in the intermediate rental sector
Housing allowances Available Available
Outcomes
Socio-economic characteristics of tenants
Concentration of lower income households Higher incomes than in social rental sector, lower than in owner-occupancy sector
Competition
Substitutability Limited substitutability on most dimensions
Rivalry Low rivalry. Only in a part of the intermediate rental sector there is rivalry between social rental landlords and market rental landlords

most of the dimensions relevant to substitutability, such as housing quality, rent regulation, tenant security and housing allocation, there are substan-tial differences between the two rental sectors. It should also be realised that social rental dwellings are concentrated mainly in the larger cities (in many smaller municipalities, they are simply not available). It is only with regard to the availability of housing allowances that the gap between the two rental sectors is small.
It is the intermediate rental sector that partly bridges the substitutability gap between the social rental sector and the market rental sector. The inter-mediate sector may be a reasonable alternative for tenants in both the social rental sector and the market rental sector (e.g. there is reasonable substitut-ability with both these sectors). Tenants in the non-subsidised rental sector, as well as newcomers to the housing market, may be attracted by the bet-ter price-quality relationship in the intermediate sector, although the income criteria for intermediate rental dwellings limit the accessibility of the inter-mediate sector for higher-income groups. For tenants in the social rental sec-tor with a slightly higher income, intermediate dwellings that are offered by social rental landlords may offer the opportunity to make a housing career within the rental sector. However, to put things into perspective, it should al-so be realised that the size of the intermediate rental sector in France is still limited and that intermediate rental dwellings are primarily available in re-gions with a tight housing market.
Competition between the different types of landlords (rivalry) is virtually non-existent between the social rental sector and the non-subsidised market rental sector. The landlords in these two sectors have different motivations and the two sectors are subject to totally different regulation and subsidisa-tion mechanisms. However, rivalry is greater in the intermediate rental seg-ment where both social rental and market rental landlords can compete for state subsidies and contracts (notably the PLS and PLI loans).
The level of competition between social and market rented housing in France is, all in all, relatively low and the gap between the sectors is large. However, the development of an intermediate sector is reducing the size of this gap and increasing the degrees of substitution and rivalry within the rented sector as a whole.
Bridging the gap?In recent years, French housing policy has invested relatively heavily in the development of the intermediate rental segment in particular. In a way, one could say that these policies are bridging the gap between the social rental and the market rental sector. At the same time, however, one might question the real impact of this development. Despite the various measures that have been taken to stimulate this sector, the government can only exert a relative-ly limited influence on housing production in the intermediate rental sector.
[ 141 ]

After all, this also depends on the relative attractiveness of investing in this sector, and thus also on the interest rate and the investment conditions in the rest of the economy.
Country experts
Michel Amzallag, Union sociale pour l’habitat.
Claire Levy-Vroelant, Université de Paris 8-Saint-Denis.
Jean-Pierre Schaefer, Caisse des Dépôts.
[ 142 ]

6 Germany
6.1 The federal system
Germany is a federal state, and since the unification of the former West Ger-many and the former East Germany in 1990, there have been sixteen federal states (Länder) in the Federation (Van der Heijden et al., 2002). Legislative pow-er generally rests with the federal government, which is responsible for de-signing the system of housing allowances. Tax policy, including taxes on sav-ings for housing and taxes on landlords, are also regulated nationally.
In the case of bricks-and-mortar subsidies, federal government has formu-lated enabling regulation within which the governments of the federal states can set their own rules.54 In the context of the recent reforms to the federal system, the responsibility for the bricks-and-mortar housing subsidies was assigned to the states on 1 September 2007 (Bundesministerium für Verkehr, Bau und Stadtentwicklung, 2007). The federal government will provide the states with annual compensation of €518.2 million until 2013.
Local government and the federal states, which have constitutional re-sponsibility for housing, largely fund housing policy with central government making a contribution (Droste & Knorr-Siedow, 2007; Kofner, 2007). In the case of housing allowances for tenants and owner-occupiers, the states and na-tional government cover half of these expenses each. Local government im-plements policies on both bricks-and-mortar subsidies for subsidised housing, rent regulation and housing allowances. The principle of subsidiarity is im-portant in subsidised housing.
6.2 Housing stock
6.2.1 Definition of the subsidised and unsubsidised rented sector
Unlike most other countries under consideration here, the standard divi-sion of the housing stock into social and private rented sectors on the basis of ownership does not apply in Germany (Haffner, 2005; Van der Heijden et al., 2002). Where a distinction is made, apart from that between owner-occu-pied and rented, this is based on whether bricks-and-mortar subsidies are provided for dwellings, whether they are new-build or existing dwellings, and whether they are rented or owner-occupied, and regardless of the type of landlord. This system was introduced after World War II.
Until 1990, non-profit tax status existed for landlords in the former West
54 As East German policy is gradually being brought into line with West German policy, this chapter gener-
ally does not consider policy specific to East Germany.
[ 143 ]

Germany. These landlords were also referred to as ‘social’ landlords. The co-operatives and the municipal housing companies formed the traditional non-profit sector (Droste & Knorr-Siedow, 2007). Now that non-profit tax status has largely been abolished, Germany officially has only private landlords, who let rented property, in some cases with bricks-and-mortar subsidies.
These subsidies are used to enable subsidised, rented dwellings to be let on a temporary basis. Subsidies used to be available only for new construc-tion. Nowadays, however, they are also used for the acquisition of allocation rights in old buildings. Subsidised dwellings are subject to rules on the alloca-tion of dwellings and a system of rent control. After the subsidy expires, rents can gradually be brought into line with market rents. Almost indefinite secu-rity of tenure does not change once the subsidy expires.
When there is no subsidy or the subsidy has expired, the dwellings con-cerned can be classified as market rented housing; when bricks-and-mortar subsidies are involved, they can be classified as social rented housing. But these classifications do not correspond with the type of landlord – landlords are all private individuals (or persons) or private organisations. In this chap-ter, we will use the terminology subsidised versus non-subsidised rented dwellings.
6.2.2 Housing stock according to type of landlord
In European terms, Germany has a small owner-occupied sector – about 40% in 2002-03, as Table 6.1 shows. As with any mean, the average rate of home ownership for Germany masks differences across the country. In 2002, home ownership rates varied from almost 13% in Berlin to almost 56% and 57% in North Rhine-Westphalia and Rheinland-Pfalz, respectively (Statistisches Bundes amt, 2007a; see also Kirchner, 2006 for slightly different shares of the tenures).
The flip side of a small owner-occupied sector is a large rented sector, which accounts for around 60% of the housing stock, as Table 6.1 shows (Haff-ner, 2005). There are two main types of landlords: private individual landlords (35.6% of the total stock) and commercial (professionell-gewerblich) landlords (25.2%). In the first category, about a quarter of the dwellings are sublet by owner-occupiers and about three-quarters are let by non-professional land-lords. The commercial rented stock is divided about equally between housing cooperatives, municipal housing companies, private housing companies, and other landlords such as churches, government bodies and others. Municipal housing companies are also private entities, but their shares are in the hands of the municipality (Droste & Knorr-Siedow, 2007).
Development of the rented sectorWhereas other countries’ market rented sectors have generally shrunk in re-
[ 144 ]
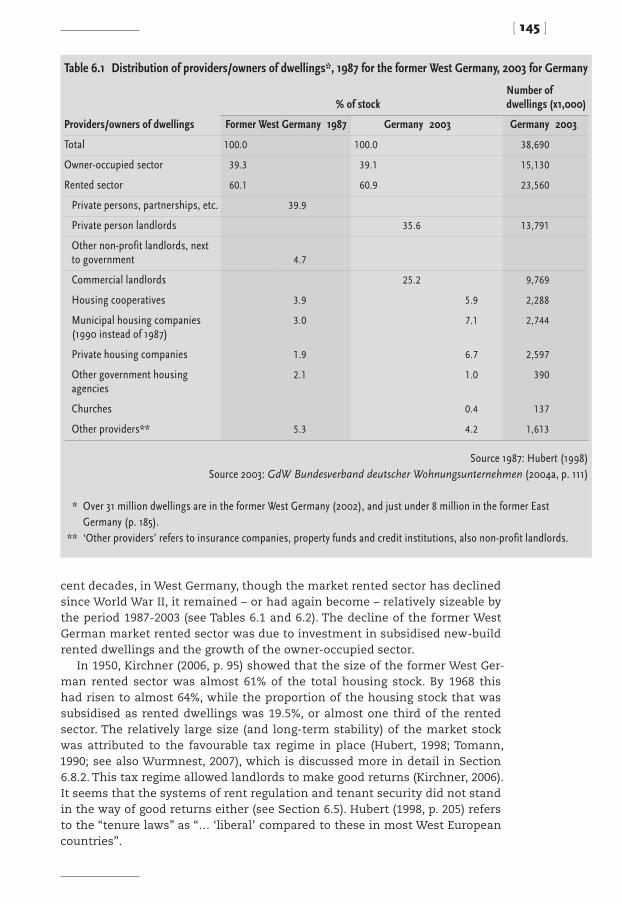
cent decades, in West Germany, though the market rented sector has declined since World War II, it remained – or had again become – relatively sizeable by the period 1987-2003 (see Tables 6.1 and 6.2). The decline of the former West German market rented sector was due to investment in subsidised new-build rented dwellings and the growth of the owner-occupied sector.
In 1950, Kirchner (2006, p. 95) showed that the size of the former West Ger-man rented sector was almost 61% of the total housing stock. By 1968 this had risen to almost 64%, while the proportion of the housing stock that was subsidised as rented dwellings was 19.5%, or almost one third of the rented sector. The relatively large size (and long-term stability) of the market stock was attributed to the favourable tax regime in place (Hubert, 1998; Tomann, 1990; see also Wurmnest, 2007), which is discussed more in detail in Section 6.8.2. This tax regime allowed landlords to make good returns (Kirchner, 2006). It seems that the systems of rent regulation and tenant security did not stand in the way of good returns either (see Section 6.5). Hubert (1998, p. 205) refers to the “tenure laws” as “… ‘liberal’ compared to these in most West European countries”.
[ 145 ]
Table 6.1 Distribution of providers/owners of dwellings*, 1987 for the former West Germany, 2003 for Germany
% of stockNumber of dwellings (x1,000)
Providers/owners of dwellings Former West Ger many 1987 Germany 2003 Germany 2003
Total 100.0 100.0 38,690
Owner-occupied sector 39.3 39.1 15,130
Rented sector 60.1 60.9 23,560
Private persons, partnerships, etc. 39.9
Private person landlords 35.6 13,791
Other non-profit landlords, next to government 4.7
Commercial landlords 25.2 9,769
Housing cooperatives 3.9 5.9 2,288
Municipal housing companies (1990 instead of 1987)
3.0 7.1 2,744
Private housing companies 1.9 6.7 2,597
Other government housing agencies
2.1 1.0 390
Churches 0.4 137
Other providers** 5.3 4.2 1,613
Source 1987: Hubert (1998) Source 2003: GdW Bundesverband deutscher Wohnungsunternehmen (2004a, p. 111)
* Over 31 million dwellings are in the former West Germany (2002), and just under 8 million in the former East Germany (p. 185).
** ‘Other providers’ refers to insurance companies, property funds and credit institutions, also non-profit landlords.

Secondly, the large size of the market rented sector in the former West Germany is a result of the end of the post-war bricks-and-mortar subsidy schemes (Elsinga et al., 2007b). In the post-war period, these schemes in the rented sector lasted for increasingly shorter periods, and the proportion of subsidised rented dwellings in the West German housing stock fell sharply, from 17% in 1978 to 10% in 1993 (Table 6.2).
Another reason for the large market rented sector in Germany can be found in the addition of the East German rented stock (Table 6.2). If we de-fine ‘subsidised’ according to the West German definition – as bricks-and-mortar-subsidised – the rented dwellings in existence at the time of reunifica-tion (just under three-quarters of the total of seven million dwellings in 1993) were counted as part of the market rented stock (Haffner, 1998). Most of these dwellings were converted to municipal housing at the point of reunification in 1990. This ‘new’ classification of dwellings meant that over five million East German rented dwellings were added to the market rented stock, at the same time as the home ownership rate in East Germany of 26% pulled down the average home ownership rate of more than 40% in the former West Germany. Since reunification, the home ownership rate has returned to the level it was at before the reduction caused by the addition of the East German stock.
Members of GdW Bundesverband deutscher WohnungsunternehmenThe GdW Bundesverband deutscher Wohnungsunternehmen is the national umbrel-la organisation for the former non-profit landlords of the federal states (www.gdw.de; last accessed 8 November 2006). It changed its name in 1990, when non-profit tax status was abolished (Van der Heijden et al., 2002). Its predeces-sor, which had been founded in 1949, was known as the Gesamtverband der Ge-meinnützigen Wohnungsunternehmen (the organisation of non-profit landlords).55
55 The umbrella organisation for 60 large landlords (2.2 million managed dwellings) is called AGW Arbe-
itsgemeinschaft grosser Wohnungsunternehmen e.V. (http://www.agw-online.com/web/guest/start; last accessed
on October 2nd, 2007). There is also the umbrella organisation called BFW Bundesverband Freier Immobilien-
und Wohnungsunternehmen e.v.
(http://www.bfw-bund.de/index.php?id=7; last accessed on October 2nd, 2007). About 1,600 medium-sized
landlords manage about 3.2 million dwellings.
[ 146 ]
Table 6.2 Development of dwelling stock (in percentages) according to tenure and subsidisation, the former West and East Germany, 1978-1993
Former West Germany Former East Germany
Tenure 1978 1982 1993 2002 1981 1993
Rent 63 60 58 56 69 74
Subsidised 17 15 10 7 n.a. 1
Not subsidised 45 45 48 48 n.a. 73
Owner-occupied 38 40 42 44 31 26
Sources: Van der Heijden et al. (2002); Kirchner (2006) for 2002n.a. = not available

As of 31 December 2004, just under 3,200 housing companies (Wohnungsun-ternehmen) were represented by the umbrella organisation (GdW Bundesver-band deutscher Wohnungsunternehmen, 2005, pp 105ff). Most of them principal-ly seek to engage in entrepreneurial housing management (unter nehmerische Wohnungswirtschaft).
In 2004, 93% of the members of the GdW Bundesverband deutscher Wohnung-sunternehmen took part in the annual survey (2004a), which showed that on 31 December 2004 these members were running over six million dwellings: 5.4 million rented dwellings owned by themselves and about 625,000 dwellings managed for third parties. Almost half of these latter dwellings, 308,000, were owner-occupied flats. When the stock of the members that did not take part in the survey was included, the total number of dwellings reached almost 6.5 million; this was about 66% of the commercial stock and represented almost 30% of the occupied rented stock.
More than one third of the housing companies that participated in the sur-vey had the legal status of a private limited company or of a company limited by shares; less than 1% of them were legal not-for-profit organisations. Just over 1,850 housing companies were organised on a cooperative basis (see be-low).
Overall, the financial situation of the members of the GdW Bundesverband deutscher Wohnungsunternehmen is not rosy (GdW Bundesverband deutscher Wohnungs unternehmen, 2004a). The average return as a percentage of equity on the balance sheet in 2003 was negative, at -3.7%, coming from a low of -7.4% in 2003 (GdW Bundesverband deutscher Wohnungs unternehmen, 2005). In the for-mer West Germany, return on equity averaged 3.9%. The high vacancy rate of 16% in the former East Germany in 2003 – about 400,000 dwellings – contrib-uted to the bleak financial situation. In the former West Germany, there were almost 121,000 vacancies.
The cooperative sectorGermany currently has about 2,000 housing cooperatives. Their objective is to provide accommodation at cost prices (Bundesministerium für Verkehr, Bau- und Wohnungswesen, 2004a, p. 3; Haffner, 2005). Two-thirds of housing cooperatives own less than 1,000 dwellings; only 13% of them have 2,500 dwellings or more, but these own half of all cooperative rented dwellings.
Housing cooperatives let dwellings to people who buy a share in the hous-ing cooperative. At present this share usually amounts to about 1% of the cost of building the dwelling. This share makes the tenant part-owner of the dwell-ing, ruling out any conflict of interest between the occupant and the owner. The advantage of the cooperative system for rented dwellings is that it pro-vides even better security of tenure.
The government of 2002 saw cooperative housing as the third type of ownership, alongside the rented and owner-occupied sectors (Bundesministe-
[ 147 ]

rium für Verkehr, Bau- und Wohnungswesen, 2004a). It wanted to ensure that so-cial conditions would not deteriorate in cooperative housing and believed it necessary to encourage private individuals to take more responsibility, help themselves and become more engaged.
A subsidy scheme was launched as part of the Experimenteller Wohnungs- und Städtebau (ExWoSt) programme to support innovative experiments in co-operative housing.56 The experiments showed that cooperative housing had a positive effect on the social development of a neighbourhood and housing according to need. The experiments also showed that cooperative housing is attractive to single parents and families with children. Cooperative housing also forms an alternative for housing for the elderly with lower housing costs.
Rented housing with a ‘social’ focus With the shortening of the periods of the bricks-and-mortar schemes in the rented sector, the proportion of subsidised rented dwellings in the West Ger-man housing stock has fallen sharply, from 17% in 1978 to 7% in 1993 (Table 6.2). The number of subsidised rented dwellings fell from 3.9 million in 1987 to 1.8 million in 2001 (Busch-Geertsema, 2004). Every year since 2001, the fig-ure is estimated to have fallen by about 100,000 dwellings, as construction has also fallen sharply since 1993-94 (see below). This brought the total esti-mated number of subsidised rented dwellings to 1.5 million in 2004 (see also Brech, 2004, p. 145; GdW Bundesverband deutscher Wohnungs unternehmen, 2004b, p. 24). This decrease represents one-third of the subsidised rented sector in a period of less than twenty years. On the basis of these calculations, less than 5% of the housing stock is now in the subsidised rented sector. Kirchner (2006, p. 120) estimates the share of subsidised rented dwellings to be 7.1% of the former West-German stock in 2002 (Table 6.2). These dwellings are to be found mainly in the major towns and cities of the former West Germany, es-pecially the Ruhrgebiet, where they account for 20% of the housing stock.
If one were to estimate the number of dwellings with a social purpose available in Germany, one may wonder about the social focus of the mem-bers of the GdW Bundesverband deutscher Wohnungsunternehmen in relation to the dwellings that are not subsidised. Most of these members do no longer have non-profit status. Most of the cooperatives that still have fiscal non-profit status can, however, be considered to have a social focus, and possi-bly local authorities, too. This stock taken together would equal about 15% of the total stock of dwellings, at least twice the size of the stock subsidised through bricks-and-mortar subsidies (Droste & Knorr-Siedow, 2007; Kirchner, 2006, 2007). Of course the ‘social’ focus of these landlords in the future re-
56 The website of the experimental programme is: http://www.bbr.bund.de/cln_016/nn_21210/BBSR/DE/
FP/ExWoSt/exwost.html?__nnn=true.
[ 148 ]

mains uncertain. Cooperative landlords will have to set rents at lower-than-market prices, as they are run indirectly by their members. On the one hand, local authorities will still provide housing for low-income groups; that will be expected by local politicians (Brech, 2004). Droste & Knorr-Siedow (2007, p. 93) call this rented housing quasi-social rented housing. On the other hand, the dwelling stock of local authorities may be sold. About 1.3 million dwellings in large dwelling portfolios resulting in 150 transactions changed owner be-tween 1999 and 2006. 57% of those were public dwellings. Of all dwellings that were bought, 77% went to market investors.57 Veser et al. (2007) conclude that the short-term effects on local housing markets have not been too disturb-ing. However, it is to be expected that market investors will be less willing to join in in social tasks and urban development. Droste & Knorr-Siedow (2007, p. 101) argue that the foreign investors which have bought the dwellings will ‘cherry-pick’, upgrading the good stock in order to sell it to individual inves-tors. “They can thus often recoup the price paid for the whole stock by selling 50% of it after three years.” The ‘cherry-picking’ will result in socio-spatial po-larisation at the cost of low-income and middle-income (key workers) house-holds.
6.2.3 Quality of housing stock
Because the distinction between social and market rented housing is not made in Germany, the statistics are not compiled on this basis. However, Hu-bert (1998) reports that the quality of new subsidised housing since the 1960s has been no different from that of other new non-subsidised housing. He also states that neither market nor social rented housing is regarded as inferior within the housing market.
Most of the statistics distinguish between the owner-occupied and rented sectors.58 On average, households in the owner-occupied sector live in larg-er dwellings (116 square metres) than households in the rented sector (70 square metres), as Table 6.3 shows. These differences are caused by the fact that owner-occupiers are more likely to live in single-family dwellings than tenants. In 2002, dwellings in the former East Germany (77 square metres)
57 The general concern in the media is that Anglo-American enterprises do not display the “social con-
science” of German enterprises (Barry, 1993, p. 17/21). The former Chancellor Gerhard Schröder is quoted
in a newspaper saying that (translated) “dwellings are an economic good, but not a speculation good”
(Wüpper, 2005).
58 The difference between social and private tenants would seem fairly small, when compared with owner-
occupiers. Hubert (1998) makes this statement when he refers to two tables with the following variables:
size, age and social status of (head of ) household and age, size and density of occupation of dwelling. The
difference between renting and owning may be reinforced by the fact that older homes are more likely to be
rented, whereas newer ones from 1969 onwards are more likely to be owner-occupied.
[ 149 ]

were smaller on average than in the former West Germany (93 square metres; Bundeszentrale für politische Bildung, 2006).
Table 6.4 also shows the differences between owning and renting and be-tween the former East and West Germany. Almost 80% of owner-occupiers in the former West Germany evaluate their dwelling as being in a good con-
[ 150 ]
Table 6.4 Condition of the dwelling as evaluated by the head of the household (in percentages) and score of satisfaction (on a scale from 0 to 10), the former West and East Germany, 2004
Former West Germany Former East Germany
Lable of score of satisfaction of head of household % score % score
Owner-occupier
Good 79 8.6 69 8.6
Needs some renovation 20 7.5 27 7.2
Needs complete renovation or demolition 1 5.9 3 4.9
Total 100 8.3 100 8.1
Main tenant
Good 62 7.8 68 7.8
Needs some renovation 34 6.5 26 6.5
Needs complete renovation or demolition 3 4.8 7 5.1
Total 100 7.3 100 7.3
Owner-occupier and main tenant
Good 70 68
Needs some renovation 28 26
Needs complete renovation or demolition 2 5
Total 100 7.7 100 7.6
Source: Bundeszentrale für politische Bildung (2006)
Table 6.3 Occupied dwellings (in percentages )according to the size of the dwelling, Germany, 2002
Size of the dwelling Germany Rent Owner-occupation
<40 m2 4.7 7.7 0.6
40 - 79 m2 43.4 63.1 16.9
80 - 99 m2 17.6 16.9 18.5
100 + m2 34.4 12.3 64.1
Total 100.0 100.0 100.0
Average m2 per dwelling 89.6 70.1 115.7
Source: Bundeszentrale für politische Bildung (2006)

dition, compared to 62% of tenants (2004). In the rented sector, the share of the former East German tenants who evaluated their dwelling as ‘good’ is, surprisingly, six percentage points higher than in the former West Germany, while that of the owner-occupiers is ten percentage points lower than in the former West Germany. Owner-occupiers in the former West Germany are on average a little more satisfied with their housing situation (8.3%) than owner-occupiers in the former East Germany (8.1%). For the tenants (7.3%), there was no difference between the two parts of the country.
The average rents paid to different types of landlords are shown in Table 6.5. In the period under consideration, the former West German households paid more rent per month for their dwellings than the former East German ones, firstly because rented dwellings in the former West Germany in 2002 were larger on average than those in the former East Germany (Deutscher Bundestag, 2003, p. 21). The average size of dwellings in the East had risen by an average of five square metres since 1994, however, whereas that in the West had gone up by only two square metres (Bundeszentrale für politische Bil-dung, 2004). As may be expected, in most years rents paid to private landlords were the highest, on average. In the former West Germany, the relatively low rents of municipal housing companies and cooperatives, as landlords with a social focus, can be observed.
6.3 Characteristics of tenants
Owner-occupiers have higher average incomes than tenants. Table 6.6 shows the market share of the tenants in 1994, 1999 and 2004 according to net household income quintile and also by part of the country. As may be expect-ed, there was a lower share of renting among higher income groups, and the share of renting also fell over time, except in the first quintile. It also shows
[ 151 ]
Table 6.5 Average monthly rent (in euros) including ‘cold’ additional charges* per square metre by type of landlord, the former West and East Germany, 1994, 1999 and 2004
Former West Germany Former East GermanyEast as % of West
Type of landlord 1994 1999 20042004Index 1994 1999 2004
2004Index 2004
Municipal 4.54 5.55 5.80 92 3.54 4.88 5.27 96 91
Cooperative 4.67 5.59 5.95 94 3.51 4.93 5.40 99 91
Employer 4.30 5.00 5.85 93 3.13 3.68 4.81 88 82
Private 5.11 5.87 6.38 101 3.58 5.70 5.79 106 91
Average 4.94 5.78 6.30 100 3.55 5.16 5.48 100 87
Source: Bundeszentrale für politische Bildung (2006)
* Gross cold rent = basic rent plus ‘cold’ additional charges (Brutokaltmiete = Grundmiete + kalte Nebenkosten): ‘cold’ means excluding charges for heating and hot water but including those for water supply, sewerage and refuse disposal (Deutscher Bundestag, 2003, p. 19).

that the market share of renting remains higher on average in the former East Germany than in the former West Germany.
Table 6.7 shows rent as a percentage of net household income according to income quintiles of tenants. As may be expected, this ratio becomes lower on average as income increases. The ratios of 41% and 34% in 2004 in the first quintiles are on average much higher than in the other quintiles. Between 1994 and 2004 the ratios rose. On average, it was lower in the former East Germany than in the former West Germany, but the East German ratios are catching up; especially between 1994 and 1999. Between 1999 and 2004, the average ratios rose much less than in the previous period and even declined in some quintiles.
[ 152 ]
Table 6.7 Rent as percentage of net household income by income quintiles of tenants, the former West and East Germany, 1994, 1999 and 2004
West Germany East Germany
Quintiles of net household income 1994 1999 2004 1994 1999 2004
First quintile 37.1 39.0 41.0 26.1 34.3 34.0
Second quintile 24.8 27.4 28.5 16.1 22.8 24.6
Third quintile 22.2 24.3 23.4 12.7 19.4 20.0
Fourth quintile 19.8 21.2 22.2 10.4 16.1 19.0
Fifth quintile 16.4 19.0 17.9 8.3 17.2 14.1
Average 24.0 26.6 27.2 17.3 24.1 25.5
Source: Bundeszentrale für politische Bildung (2006)
Table 6.6 Tenants as average percentage of households by net household income, the former West and East Germany, 1994, 1999 and 2004
West Germany East Germany
Quintiles of net household income 1994 1999 2004 1994 1999 2004
First quintile 71.8 74.8 73.8 78.2 78.2 78.9
Second quintile 65.4 65.1 63.8 71.3 70.8 67.4
Third quintile 61.4 61.3 53.5 74.1 69.4 62.3
Fourth quintile 58.7 53.2 52.4 77.6 63.5 62.5
Fifth quintile 49.2 45.2 44.6 82.0 60.3 48.9
Total 60.5 59.2 56.6 75.6 70.2 67.1
Source: Bundeszentrale für politische Bildung (2006)

6.4 Housing policy
6.4.1 History
German housing policy has moved from a liberal, laissez-faire approach with strong property rights at the beginning of the 19th century to the social wel-fare state of today (Kofner, 2007). West German post-war housing policy has been based on a social market economy (Boelhouwer & Van der Heijden, 1992; Haffner, 2005; Van der Heijden et al., 2002). The principle behind this is that social welfare is best served by bringing about economic progress (Busch-Geertsema, 2004). In a social market economy, the market dominates, and government intervention is designed to support the proper operation of mar-ket forces (Leutner, 1990, p. 34). Although the German government abandoned the idea of providing merely ‘temporary support’ for housing fairly soon after World War II, it still favours allowing the market to regulate itself as far as possible and intervening (on a time-limited basis) only to correct the opera-tion of the market (Bundesministerium für Raumordnung, Bauwesen und Städte-bau, 1995, pp. 1-2; Expertenkommission Wohnungspolitik, 1995, p. 54). The hous-ing allowance is an example of a subsidy that has attained a permanent place within housing policy (see Section 6.8.3). The temporary nature mentioned illustrates the concession model described in Section 6.8.1, which, on a tem-porary basis, has enabled (and still enables) dwellings with subsidised rents to be built within the rented sector. The fact that it has been mainly market investors that have provided subsidised rented housing is also a feature of the social market economy (Busch-Geertsema, 2004). Droste & Knorr-Siedow (2007, p. 90) call this system a ‘market-based’ system.
West German post-war housing policy – aside from the temporary mea-sures already mentioned – has been based on responses to problems in the housing market (Kofner, 2007; Van der Heijden et al., 2002). Immediately after World War II (until 1956), for instance, a whole raft of measures were designed to ease the housing shortage – together, the security of tenure, the rent con-trol and the housing allocation measures introduced were referred to as Woh-nungszwangswirtschaft.
The period 1956-70 saw the laying of the foundation for the policy that was to last until the end of the 20th century. A start was made on deregulating and relaxing the post-war housing policy: post-war rent controls were abol-ished almost everywhere in the early 1970s (Hubert, 1998). The policy model for the housing market, however, had changed from the laissez-faire approach to a ‘liberal’ model which involved retaining some government intervention, such as basic tenant protection. This period also saw the start of a shift in the target group for housing policy. From subsidising broad sections of the popu-lation (about 75% of households according to Kirchner, 2006), housing policy began to target families and the lower-income groups. The temporary hous-
[ 153 ]

ing allowance (Wohngeld) was made permanent in 1965 (Van der Heijden et al., 2002). The unstable economic climate in the 1970s meant that there was a return to more government intervention, with more government aid. This resulted in a house-building boom.
At the end of the 1970s, however, the cost of government investment pro-grammes, fuelled by high inflation and interest rates, was beginning to spiral out of control (Tomann, 1990). Subsidised rents were increased in line with inflation so as to keep costs under control. The 1980s saw the introduction of more market forces and decentralisation, for one thing because ‘social’ hous-ing policy was proving ever less affordable. A debate erupted on whether a system of bricks-and-mortar subsidies could be justified in a balanced hous-ing market (Expertenkommission Wohnungspolitik, 1995). Doubts about the sys-tem, together with the government’s conviction that markets were better able to solve problems than regulation (Leutner, 1990), resulted in the deregulation of the housing market (Tomann, 1990). One of the results was a reduction in the numbers of new-build subsidised dwellings.
Central government was again able to step back from providing direct bricks-and-mortar subsidies in the 1980s. This came about thanks to (a) steady economic growth and (b) the housing surplus that had gradually come about as a result of the building boom in the early 1970s in particular (almost 500,000 dwellings per year; see Van der Heijden et al., 2002). Consequently, house prices fell. The fact that the population growth forecasts were pessi-mistic increasingly discouraged market investors from investing in new con-struction. Tomann (1990) notes that private investment was also adversely af-fected by the very high real interest rate, both internationally and historically (see also Leutner, 1990).
Following the problem of vacant dwellings in the mid-1980s, a housing shortage began to develop from 1988 onwards (Van der Heijden et al., 2002), although the 1987 census had indicated that the numbers of dwellings and households were almost in equilibrium, at just over 26 million (DIW, 1989). In 1988-89 West Germany was faced with an influx of Aussiedler, people of Ger-man origin mainly from the former Eastern Bloc countries (Leutner, 1990). Households were also becoming rapidly smaller. As the regular bricks-and-mortar subsidy schemes could not cope, the government increased its fi-nancial input into social house building in 1989 (see also Tomann, 1990). The number of subsidised new-build dwellings increased from 65,000 to 111,000 in 1993 (Deutscher Bundestag 2003; Van der Heijden et al., 2002).
Policy on home ownershipEven though the share of owner-occupation in the housing stock can be con-sidered quite low in a European context, this outcome cannot necessarily be regarded as a conscious policy to promote one particular form of tenure only (Haffner, 1992). As early as 1952, a savings scheme for home ownership
[ 154 ]

(Bausparen) was introduced. Households could first save against a lower-than-market interest rate for a certain period of time and also receive a subsidy. In exchange, after having saved, households could obtain a loan against a lower-than-market interest rate (Leutner, 1990).
As early as 1956, with the Second Housing Construction Law (II. Wohnungs-baugesetz), the government’s aim was to increase home ownership (Kirchner, 2006; Leutner, 1990). Owner-occupation was prioritised over subsidised rented dwellings. Almost half of the number of subsidies went to owner-occupation in the early period. However, that was apparently not enough to provide a re-ally significant boost to owner-occupation. In the 1960s, the subsidisation of home ownership took place primarily via the second subsidy system that had been introduced in 1956 for households with incomes classified as above low incomes (up to 40% more than the defined low incomes), as opposed to the first subsidy system which had mainly targeted subsidised rented dwellings for households with very low incomes.
In the 1970s, indirect subsidies via the tax system became the most im-portant source of subsidisation. In the mid-1970s the focus of subsidisation changed to wealth stimulation as opposed to stimulating owner-occupation. The result was that not only was new construction to be subsidised, but also the acquisition of an existing dwelling. In the 1980s the mortgage interest de-duction and the imputed rent taxation were abolished in favour of a depre-ciation deduction. In the 1990s the fiscal subsidy was abolished in favour of a non-fiscal subsidy called Eigenheimzulage. This was a one-off eight-year sub-sidy that was paid out annually.
Low rate of home ownershipAlthough home ownership and wealth accumulation were encouraged for several decades, the rate of home ownership remained low (GEWOS, 1979; Haffner, 1992). According to a study carried out for the ministry responsible for housing, the low rate of home ownership could be explained by several factors: house prices were relatively high, and landlords were not incentiv-ised to sell dwellings because of satisfying returns. Also mortgage amounts were relatively low, meaning that aspiring homeowners were required to save large amounts. The low rate of home ownership was also blamed on the high proportion of multi-family dwellings (Tomann, 1990). Finally, the federal states initially blocked the federal policy of giving priority to owner-occupied dwellings through bricks-and-mortar subsidies (Haffner, 1992; Leutner, 1990). This priority rule was abolished in 1967.
In their regression analysis, Behring & Helbrecht (2002) found that they could explain 88% of the rate of home ownership in the federal states on the basis of four variables. According to this, with relatively high property prices and a high percentage of foreigners, the rate of home ownership will be lower. With rising numbers in average household composition and average rent lev-
[ 155 ]

els, the rate will be higher. The low rate in the former East Germany, the good quality of the rented dwellings and the strong security of tenure in the rented sector explain the relatively low German rate of home ownership. Based on a qualitative analysis, Behring & Helbrecht (2002) conclude that the system of social welfare has covered the risks for households well. There is no perceived need to become a homeowner; the household can find the same security in the rented sector.
In their qualitative research, Tegeder & Helbrecht (2007; see also Toussaint et al., 2007) confirm that their respondents do not necessarily perceive home ownership as a financial instrument of individual protection that is needed because of insufficient security in the social welfare system. Neither do they necessarily judge the social position of a homeowner as safer than that of a tenant. Tenants are inclined to trust the tenancy agreement and rent regula-tions and thus do not feel socially disadvantaged.
6.4.2 Recent social and housing policy
The social market economy is still relevant as a basis for government policy. The guiding principle is that government intervention is necessary to support and correct market forces. It also implies the prioritisation of the provision of social services by non-governmental organisations (NGOs), making government more of an enabler than a provider of social services (Busch-Geertsema, 2004).
Reforms to the welfare systemAnother characteristic of the social market economy was the earnings-related system of social security that helped classify the German welfare system as a corporatist welfare regime with conservative principles, according to the ter-minology of Esping-Andersen. Busch-Geertsema (2004, pp 305-6) argues that the German welfare state made a substantial move away from this welfare re-gime type, and towards the Anglo-Saxon liberal welfare regime when it intro-duced a means-tested unemployment assistance (Arbeitslosengeld II) in 2005, within the fourth package of reform laws called Hartz IV (see also Droste & Knorr-Siedow, 2007). This new unemployment assistance is no longer earn-ings-related, but means-tested. It was introduced in order to incentivise the unemployed to find new work.
As a result of the reform package, Germany now has a ‘two-step transfer system’ for the unemployed: in the first twelve months of unemployment, the assistance is earnings-related (Arbeitslosengeld); thereafter, it has no re-lation to previous earnings and is called Arbeitslosengeld II (Kofner, 2007, p. 170). Arbeitslosengeld II in fact combines the previous earnings-related unem-ployment benefits that were available to those entitled after the first twelve months (Arbeitslosenhilfe) with the previous social benefits (Sozialhilfe) which were available to those that were not entitled to Arbeitslosenhilfe.
[ 156 ]

One important result of these changes for housing was that the number of recipients of housing allowances decreased dramatically, as Section 6.8.3 ex-plains. Housing allowances were included in the transfer of Arbeitslosengeld II, and no longer had to be applied for separately.
Reforms in housing policyHousing policy has also changed, shifting towards the target groups since the late 1990s (Haffner, 2005; see also Droste & Knorr-Siedow, 2007). This has come about partly as a result of minimal population growth – 0.6% between 1998 and 2002 while the number of households increased by 2.5% over the same period. The large numbers of new dwellings actually built in the 1990s resulted in a national housing surplus of about 500,000 dwellings by 2002. In the former East Germany, as many as 1.1 million dwellings (14% of the stock) stood empty as a result of the unemployed having left that part of the coun-try (Deutscher Bundestag, 2003; Simons et al., 2005). Such differences in surplus levels show the regional differences that probably exist in any country.
The decline in house-building since the 1990s (Table 6.8) has consequent-ly not led to serious shortages in the housing market at the macro level (Deutscher Bundestag, 2003) except in densely populated regions, mainly in the former West Germany. Nor have we seen any dramatic rent increases in the rented sector at the national level: average rents increased by no more than inflation between 1999 and 2003.
German subsidy instruments have changed as a result of these develop-ments. The bricks-and-mortar subsidy policy has become a less important in-strument and has undergone a shift in emphasis, from new-build dwellings to the existing housing stock, for example. Furthermore, the subsidy element in the savings scheme was reduced in the owner-occupied sector (Bundesge-schäftsstelle Landesbausparkassen, 2004). Lastly, at its third attempt, the central government achieved the abolition of the Eigenheimzulage subsidy for new cases as of 31 December 2005 (Bundesministerium für Verkehr, Bau und Stadtent-wicklung, 2006a; see also Elsinga et al., 2007). The aim of these changes was to make the policy tools more efficient and effective (Deutscher Bundestag, 2003).
Rented sector policy changes made since the year 2000 have included an improved housing allowance system (Wohngeld), which took effect in 2001 (see Section 6.8.3). A new rent law also came into force in 2001. The property right aspects of this, including rent control, will be discussed in Section 6.5. A change in the system for bricks-and-mortar subsidisation came into force in 2003 (Section 6.8.1). The rate of depreciation for tax purposes for landlords was cut back with effect from 2004 (Section 6.8.2).
[ 157 ]

6.5 Rent control, tenant security and other property rights
Kirchner (2006) argues that Germany’s rented sector is relatively large because tenants and landlords are both satisfied with the situation. Landlords are al-lowed to make a competitive profit, while being regulated on rents, security of tenure and maintenance.
The rent regulation on tenant security and rent levels was last reformed in 2001 with the Rent Law Reform Law (Mietrechtsreformgesetz). The modernisation of the tenancy law was deemed necessary in order to bring it up to date with changes in society. These changes mainly concerned the increased mobility needs of tenants, new forms of cohabitation and the political goal of promoting the conservation of energy (Wurmnest, 2007). The tenancy law “has been con-verted into something of a publicly regulated social owner-and-user relation-ship” (p. 7). This occurred in a situation where from the beginning of the 1960s, although tenancy law was gradually liberalised, “the social elements of tenancy law aimed at protecting the tenant were constantly reinforced” (p. 6).
In principle, tenancy law enables tenants and landlords to draw up any contract they wish. However, changes to the rents of non-subsidised rented dwellings (Section 6.5.1) and subsidised rented dwellings (Section 6.5.2) are regulated. Tenancies are secure once there is a written contract (Section 6.5.3). A rent surcharge is available for subsidised rented dwellings in most federal states, when household income rises above limits set for subsidisation (Sec-
[ 158 ]
Table 6.8 Dwellings newly constructed in new-constructed buildings for housing, Germany, 1993-2006
YearNew buildings for housing
Buildings with 1 dwelling
Buildings with 2 dwellings
Buildings with 3 or more dwellings Hostels/shelter
1993 394,100 112,300 51,700 221,600 8,500
1994 501,700 142,500 69,900 284,300 5,100
1995 524,600 135,200 70,000 312,500 7,000
1996 485,200 126,800 62,000 292,200 4,300
1997 501,120 148,300 62,800 285,600 4,500
1998 432,200 161,200 59,400 208,400 3,200
1999 406,600 178,500 58,900 167,300 1,900
2000 368,500 176,700 53,000 136,400 2,400
2001 285,900 144,200 41,200 99,600 900
2002 253,700 135,200 37,600 79,700 1,100
2003 236,100 131,800 33,300 70,400 600
2004 247,800 144,100 33,100 69,400 1,200
2005 213,800 122,800 28,600 61,500 800
2006 220,600 124,400 25,700 69,600 1,000
Source: Statistisches Bundesamt (2007b); 1993 is the first year available

tion 6.5.4). A right to buy is not available, probably because subsidised dwell-ings are only subsidised on a temporary basis.
6.5.1 Rent control: not-subsidised dwellings
Rent control in Germany is concerned with protecting sitting tenants, not new tenants (Haffner, 2006; Haffner et al., 2008). Rents for new leases in the market rented sector can be negotiated freely, as long as they are not classified as usury rents under criminal law.59
Rent control for sitting tenants in the market rented sector can occur ac-cording to the Civil Code (Bürgerliches Gesetzbuch) by several legal means. Rent changes for sitting tenants can be based on the rents of three similar rented dwellings.
Alternatively, rent changes can be based on a Mietspiegel, a database with local reference rents. Local reference rents are non-subsidised market rents agreed to in the new contracts and also the existing contracts (with adjusted rent level) between landlords and tenants in the four years preceding the ref-erence date for the Mietspiegel. They are based on comparable quality charac-teristics for buildings and dwellings and their locations.
Of the major towns and cities with populations of over 100,000, 87% had a Mietspiegel in place on 1 October 2003 (Deutscher Bundestag, 2003). About half of municipalities with populations of over 20,000 have introduced a Mietspiegel. Less than a third of municipalities with up to 50,000 inhabitants have com-piled one.
Changes in the Rent Law of 2001 have made it possible to compile a ‘scien-tific’ Mietspiegel instead of a ‘regular’ one, which must be compiled along scien-tific lines. The advantage is that rent rises are easier to implement (Deutscher Bundestag, 2003) than with a normal Mietspiegel, especially where the rent is lower than the maximum rent according to the Mietspiegel (Bundesministerium für Verkehr, Bau- und Wohnungswesen, 2001/2002). It makes obtaining the ten-ant’s permission which is compulsory for any rent increase60 easier for the landlord, if the rent has not been changed for the past fifteen months and if the request for a rent increase is submitted after at least twelve months.
The market rents that are agreed for new contracts in the four years pre-ceding the reference date for the Mietspiegel represent the market effect on
59 Rent increases of over 50% when a home changed tenants were not out of the ordinary in the case of
the expensive new-build homes of the 1980s and 1990s (Hubert, 1998, p. 215). Such increases are in prin-
ciple regarded as illegal under German criminal law. This is a matter for the courts. According to Section
5 of economic criminal law the rule holds that rents for new contracts must not be higher than 20% above
the local reference rent (information from expert).
60 Apart from ‘normal’ rent increases, landlords are allowed to increase rents after modernisation with
11% of modernisation costs.
[ 159 ]

the rent levels in the Mietspiegel. According to the Bundesregierung (2006) this effect is relatively low, as the share of these contracts in all relevant contracts is not very high.
Next there are various elements in the (scientific) Mietspiegel that slow down the increases in market rents. Firstly, there is the maximum rent for ex-isting contracts given certain quality characteristics. Secondly, the contracts of the four years (and not for example the last year) prior to initiating the Mietspiegel will be included. In a rising market, the reference rents will lag. Thirdly, there is a correction after two years. If this is done in line with infla-tion, inflation may be lower than rent increases on the market. Finally, there is the general rule that rents may not increase by more than 20% within a three-year period (Kappungsgrenze).
Rent regulation appears to have succeeded in slowing rent increases when rents are rising. Early this century, the average rent for new contracts was around 5% higher than the average rent (Deutscher Bundestag, 2003). For sitting tenants their average rent was about 8% lower than the average rent. Table 6.9 also shows this difference: the longer the contract, the lower the rent per square meter.
Since there is less scarcity on the housing market in some parts of Ger-many, and in fact currently even more of a housing surplus than a shortage in some areas, the length of occupancy now has less effect on rents than it used to (Bundesregierung, 2006; Deutscher Bundestag, 2003; Hubert, 1998). Over-all rents (adjusted for quality) rose by more than inflation between 1997 and 1999, and by less than or about as much as inflation until 2003. Since 1983, gross rents (not adjusted for quality) have generally risen by more than infla-tion (GdW Bundesverband deutscher Wohnungsunternehmen, 2004b, p. 29).
6.5.2 Rent control: subsidised dwellings
Rent inequality has resulted from a disparity between subsidised at-cost rents, which have been and are controlled, and market rents (Van der Heijden et al., 2002). The rent level for subsidised rented dwellings was based on the total cost of construction, the subsidy scheme and other running costs, in-cluding a ‘normal’ profit. The level of ‘social’ rents and rent rises did not de-pend on that of market rents, then, so that market rents could become even lower than cost price rents. Such a difference in rent level (with no correction for quality) on average turned out to be reality in 2001 for smaller munici-palities in the former West Germany (Deutscher Bundestag, 2003, p. 16). In cities with 500,000 residents or more, the rent for subsidised rented dwellings was a maximum of €0.63 per square metre lower on average than for non-subsi-dised rented dwellings. In comparison to average rent in the former West Ger-many in Table 6.9, this meant a 10% difference. For 2005, for the former West Germany subsidised rents were on average about 9% (€0.60) lower than gross
[ 160 ]

cold rent (Brutokaltmiete; see Table 6.9 for definition) (Bundesregierung, 2006). In scarce housing markets the difference in rents between subsidised and not-subsidised dwellings, not corrected for quality differences, will be higher. But in principle, the use of cost price rents could always result in a substantial difference in rent between one subsidised dwelling and another, even in the same municipality.
Following a debate on the drawbacks of at-cost rents, such as that cost price rents provide little incentive to build and let dwellings at the lowest cost, at the end of the 1980s the national government offered the federal states an option. This option was the statutory power to opt out of the centrally pre-scribed rent control system by offering the additional possibility of making individual agreements without using the cost rent principle. This was the for-mer third subsidy regime (Kirchner, 2006).
The new bricks-and-mortar subsidy act of 2001 (Wohnraumförderungsgesetz (WoFG), 2001, Section 28), which came into force on 1 January 2002, aban-doned the at-cost rent system. The rent control system based on this prin-ciple remains in force, although for dwellings covered by the pre-2002 regime, the first subsidy regime still applies. The 2001 WoFG stipulates that the sub-sidy contract entered into by the subsidising body (the municipality) and the recipient (the landlord) must stipulate the maximum amount of rent that may be imposed on the tenant. Thus the subsidising body and the recipient can negotiate a ‘maximum rent’, taking the local rent level into account. It is not only the initial rent but also annual rent rises and other terms and condi-tions that are the subject of negotiation between the subsidising body and the recipient.
An advantage of the new rent control system, compared with the old one based on at-cost rents, is that it ties in with market rents. A possible draw-back of the new rent control system is that the risk of disproportionate rises in costs is borne by the landlord as negotiations come to an end before the subsidy is paid out.
[ 161 ]
Table 6.9 Average monthly rent (in euros) including ‘cold’ additional charges* per square metre by length of contract, the former West and East Germany, 1994, 1999 and 2004
Former West Ger many Former East Ger manyEast as % of West
Length of contract 1994 1999 20042004Index 1994 1999 2004
2004Index 2004
Up until 4 years 5.47 6.14 6.57 104 3.61 5.50 5.74 105 87
5 to 11 years 4.87 5.78 6.30 100 3.64 5.10 5.60 102 89
12 and more years 4.50 5.29 5.86 93 3.46 4.76 5.05 92 86
Average 4.94 5.78 6.30 100 3.55 5.16 5.48 100 87
Source: Bundeszentrale für politische Bildung (2006)
* Gross cold rent = basic rent plus ‘cold’ additional charges (Brutokaltmiete = Grundmiete + kalte Nebenkosten): ‘cold’ means excluding charges for heating and hot water but including those for water supply, sewerage and refuse disposal (Deutscher Bundestag, 2003, p. 19).

6.5.3 Security of tenure
Since the 1971 Act (Wohnraumkündigungsgesetz), which regulated rents and se-curity of tenure, tenure has generally taken the form of a tenancy contract for an indefinite period (Hubert, 1998; Kirchner, 2006) and this has provided fairly good protection for tenants. ‘Fixed-term lease contracts’ were only permit-ted under special circumstances. Notice periods for landlords, along with the terms of contract, were extended, from three months to one year, and con-tracts could only be terminated in very special circumstances, such as if the tenant had at least three months’ rent arrears or was causing a nuisance. If the landlord or his family needed the home themselves, there may also be grounds for terminating the contract, provided this would not cause unac-ceptable inconvenience to the tenant. The tenant is also allowed to transfer the contract to a new tenant accepted by the landlord (Wurmnest, 2007). A contract cannot be terminated if the aim is to increase the rent for the prop-erty.
After reunification, rent law and regulations were harmonised through-out the Federal Republic, with effect from 1998 (Deutscher Bundestag, 2003). It was felt that they needed to be thoroughly modernised and simplified, and a working group with members from the federal government and the federal states was set up (Bund-Länder-Arbeitsgruppe Mietrechtsvereinfachung). Its pro-posals led to the reform of the Rent Law, which came into effect on 1 Septem-ber 2001 (Mietrechtsreformgesetz). The aim of the reform was to distribute rights and responsibilities more equally between tenants and landlords. Contractual freedom was enhanced to take account of individual situations. For instance, the notice period for tenants was reduced to a maximum of three months. The length of occupancy by the tenant was prescribed to determine the no-tice period for landlords. The maximum was set at nine months. The new law also took various forms of cohabitation into account, enabling a non-married partner to take over an existing tenancy, for example.61
6.5.4 Rent surcharge
In 1981, a rent surcharge or tax, known as the Fehlbelegungsabgabe, was intro-duced for tenants living in rented dwellings subsidised through bricks-and-mortar subsidies and paying too little rent in relation to their income (Kirch-ner, 2006). Although the terms of the 2001 WoFG mean that only households
61 This reform also created the option for municipalities of compiling and keeping a scientific Mietspiegel,
strengthening the role of the Mietspiegel. Also the maximum rent increase of 30% over three years has been
reduced to 20% (Kappungsgrenze). Regulations, such as these from the Rent Level Law (Miethöhegesetz) were
integrated in the Civil Code (Kirchner, 2006).
[ 162 ]

with a residence permit from a local authority and with an income below specified limits (see Section 6.8.1) are allowed to move into a rented dwelling with a subsidised rent, there is no way to terminate the contract if their in-come subsequently rises above the set limits.
For this reason, the federal government introduced the law entitled Gesetz zum Abbau der Fehlsubventionierung im Wohnungswesen, which allows federal states to apply a rent surcharge in communities where the difference between subsidised rents and local reference rents is relatively large. The rent sur-charge is aimed at households whose income is over 20% higher than the lim-its set. All the federal states except one have introduced the rent surcharge.
With the discussion on segregation in the subsidised rented stock in the 1990s, the problem of ineffective bricks-and-mortar subsidisation was pushed more into the background. A combination of high administration costs and considerations about segregation led Berlin to discontinue the surcharge in 2002. Whitehead & Scanlon (2007, p. 18) even mention that the taxation is
“rarely” levied for fear of losing these households from the social housing es-tates.
6.6 Allocation procedures and criteria
For dwellings subsidised through the bricks-and-mortar subsidy, housing allo-cation is regulated during the subsidy period (Haffner & Hoekstra, 2004, 2006). When allocating dwellings, federal states may include a provision in the sub-sidy scheme concerning whether the municipalities that provide subsidies have a ‘right of allocation’ to house home seekers who have residence per-mits (see previous section), and if so, by what kind of allocation procedure. All the federal states have now availed themselves of this ‘right of allocation’ to regulate the allocation of subsidised rented dwellings. Municipalities can use this right to house vulnerable groups, which is one of their responsibilities (Häußermann, 1994). They can also exercise the right of allocation in cases where they subsidise housing refurbishment. If a municipality needs to house certain home seekers urgently, agreeing a right of allocation in return for ad-ditional subsidy can be a means of achieving this. Municipalities are permit-ted to use bricks-and-mortar subsidies out of their own funds.
The length of the period for the allocations rights differs, as the Förder-statistik 2006 of the Statistisches Bundesamt (2007c) shows. In 2006, the period was set at 16 to 25 years in more than half of the over 11,000 newly built sub-sidised rented dwellings. The period was 25 years or longer for a few more than 500 dwellings. For the other 4,500 dwellings the period was set at 15 years or less with two possible categories: up to ten years or up to 15 years. In the case of the subsidisation of 7,000 existing dwellings, the majority of the dwellings (almost 4,000) had allocation periods of 11-15 years, and none were
[ 163 ]

longer than 25 years. About 1,800 dwellings each had periods set at up to 10 years or 16-25 years.
There are three types of allocation rights that municipalities can negotiate with the landlords in question (2001 WoFG):1. A general right of allocation (allgemeines Belegungsrecht) – This is really more
of an agreement between the subsidising body and the recipient landlord to let a particular dwelling only to home seekers with an occupancy permit from the municipality. The landlord can then choose freely among the can-didates. This is, in effect, a right of placement that can be exercised by the landlord.
2. Right of nomination (Benennungsrecht) – This allows the subsidising body to nominate three home seekers with occupancy permits, from whom the re-cipient landlord can then choose. This is, in effect, a limited right of place-ment by the landlord.
3. Individual right of allocation (Besetzungsrecht) – This gives the municipality the right to allocate the dwelling in question to a particular home seeker with an occupancy permit. Thus the landlord has no say at all in the allo-cation of the dwelling.
In the past, municipalities exercised the individual right of allocation (type 3), resulting in whole complexes or districts with an unbalanced residential mix. For this reason, landlords have, over the years, generally been given more freedom to decide which dwellings to use and which tenants to house in each one.62 German landlords would thus seem to have a fair degree of power to allocate dwellings, since they are often allowed to choose their new tenants from among those candidates who can produce occupancy permits. When the municipality nominates potential tenants, the landlord can usually choose from a number of candidates and in many cases the landlord can de-cide which dwelling is suitable for a particular tenant. The result of the alloca-tion system, then, is that in most cases the landlord places a candidate with an occupancy permit in a dwelling: “Die Auswahl des Mieters aus dem Kreis der wohnberechtigten Personen ist grundsätzlich dem Vermieter überlassen” (Bundesministerium für Verkehr, Bau und Stadtentwicklung, 2006b). Landlords tend to select the candidate with the lowest risk (information of expert). It seems that there is not a waiting list, as such, for each municipality or landlord, where allocation is based on the length of time on the list.
In addition to the above-described rights of allocation, the 2001 WoFG al-
62 Where the right of allocation applies only to subsidised dwellings, it is referred to as unmittelbare Bele-
gung; where it applies to subsidised and certain non-subsidised dwellings it is known as verbundene Belegung;
if it applies only to certain non-subsidised dwellings it is referred to as mittelbare Belegung. Which dwellings
the right of allocation applies to is thus a matter for agreement, and are not necessarily the ones, which are
being subsidised.
[ 164 ]
lows a municipality to enter into a ‘cooperation agreement’ (Kooperationsver-trag) with landlords (Kirchner, 2006). The aim of this agreement is to keep the provision of social housing up to scratch, improve the housing situation and bring about a stable residential mix. A covenant of this kind can stipulate such things as the circumstances under which the period of rent and alloca-tion control may be extended or shortened, and it can include provisions on measures to improve quality of life. For example, in Hamburg, it is agreed that target households can also be allocated non-subsidised dwellings to create mixed neighbourhoods.
According to Droste & Knorr-Siedow (2007), municipalities have recently begun to enter into contracts with individual landlords (property owners) in order to bring more social rented housing into the housing market. These contracts determine the framework for renting to eligible households. They do not allow municipalities any influence over the management of the dwell-ing or dwellings concerned. These types of direct intervention in the housing market are a result of the fact that the federal states only provide funds to municipalities for developing housing strategies.
6.7 Regulation and supervision
In general, landlords can determine their own business strategies (Brech, 2004) and are subject to normal commercial legislation (Wirtschaftsgesetzge-bung), unless they are receiving bricks-and-mortar subsidies and they most likely will be subject to extra regulation.
The supervision of landlords differs according to the legal status of the landlord. If the market landlords are limited corporations, they are required to produce an annual report. Cooperatives with non-profit tax status are re-quired to publish an annual report. This allows the honorary supervisory board, which is elected by the members (assembly of representatives) and which appoints the Board of Directors, to control the management of the or-ganisation.
Commercial law also applies to municipal housing companies of which there may be more than one per municipality (Veser et al., 2007). They are considered private entities whose shares are in the hand of the municipalities (Droste & Knorr-Siedow, 2007). The municipalities will supervise their munici-pal housing companies in that capacity (Brech, 2004). To this end, the manag-ing director will present an annual report to the supervisory board of which political representatives are also members.
[ 165 ]

6.8 Subsidies and finance
6.8.1 Bricks-and-mortar subsidies
At the beginning of this century, housing policy was in a constant state of flux, with shifts of emphasis resulting from changes in population growth, for example (Haffner, 2005; Haffner & Hoekstra, 2004, 2006; see also Busch-Geertsema, 2004; Kofner, 2007). From 2002 onwards, bricks-and-mortar subsi-dies ceased to be targeted solely at new construction. A new federal act, the Wohnraumförderungsgesetz 2001 (WoFG), overhauled the subsidy system for rented and owner-occupied housing (Bundesministerium für Verkehr, Bau und Wohnungswesen, 2001). The 2001 WoFG replaced the 1956 law on house build-ing (Zweites Wohnungsbaugesetz). The first, second and third subsidy schemes (Förderwege) were abolished, and the federal states given the right to deter-mine the details of the subsidisation.
Busch-Geertsema (2004, p. 313) speaks of a “turning point concerning the legal basis for housing policy”. The aim was no longer to subsidise relatively broad sections of the population but rather to target the aid at those house-holds in need of support, such as low-income groups, households with child-ren, single parents, pregnant women, the elderly, the disabled, the homeless and people in need of assistance in other ways (see also Bundesregerierung, 2006). Subsidisation could be considered tenure-neutral in the sense that subsidies are and were available for rented and owner-occupied dwellings. Whitehead & Scanlon (2007, p. 18) estimate that about 20% of the population are eligible for a social dwelling.
A strong emphasis was accordingly placed on upward mobility, with fewer new dwellings being built for households on the lowest incomes (Brech, 2004). Policy is thus based on the filtering or trickle-down principle of dwellings. Subsidies for home refurbishment were also introduced. To strengthen neigh-bourhood social structures, the 2001 WoFG enabled the purchase of existing dwellings to be subsidised. Another aim was to allow the acquisition of al-location rights from existing dwellings to compensate for the decline in the social housing stock (Kirchner, 2006).
Furthermore, urban policy and housing policy were expected to reinforce each other (Brech, 2004).63 Another objective of the new act was to make policy more flexible, allowing the federal states to shape their own policies, geared to their particular needs and wishes, taking the 2001 WoFG as a basis.
63 The new name of the federal ministry from Bundesministerium für Verkehr, Bau und Wohnungswesen to
Bundesministerium für Verkehr, Bau und Stadtentwicklung confirms this development from housing to urban
development.
[ 166 ]

Details of the 2001 WoFGOnly households with a residence permit are allowed to move into a rented dwelling with a subsidised rent, and the 2001 WoFG specifies federal income limits for those households which are entitled to such a residence permit from the local authority. It is necessary to do this under one’s own initiative, as living in or moving to a subsidised rental dwelling is not considered a right (Bundesministerium für Verkehr, Bau und Stadtentwicklung, 2006b). Households have to ask a landlord to be put on their allocation lists. Special allocation rules ap-ply (see Section 6.6), although landlords have a relatively independent role here. Subsidies to landlords include loans with a lower-than-market interest rate.
Since the federal states are allowed to adjust income limits according to local circumstances, it may at this point be useful to study the subsidy rules for one federal state – North Rhine-Westphalia. This is the largest of the fed-eral states, in terms of the number of dwellings: almost 8.5 million dwellings at the end of 2006 (Statistisches Bundesamt, 2007d).
The ministry responsible for housing in North Rhine-Westphalia has con-verted the ‘new’ federal legislation in the 2001 WoFG into allocation regula-tions (Wohnraumförderbestimmungen, WFB64), which came into force on 1 Jan-uary 2003. These regulations include stipulations on the maximum initial rent in the federal state. North Rhine-Westphalia identifies two categories of households that are permitted to rent a dwelling subsidised through bricks-and-mortar subsidies. Category A tenants are subject to the maximum in-come limits laid down by the central government and the federal state. Cat-egory B tenants may have incomes that exceed these limits by up to 40%. North Rhine-Westphalia makes higher subsidies available to landlords for households on lower incomes (category A) than those on higher incomes (cat-egory B). Rents for category A households are thus to be set lower than for category B households.
The future of subsidised housing?With the 2001 WoFG, central government took a step back from the provi-sion of bricks-and-mortar subsidies (Busch-Geertsema, 2004; see also Droste & Knorr-Siedow, 2007), providing a gloomy financial picture of subsidised renting:65 “Today public funding for housing is for all intents and purposes non-existent” (Brech, 2004, p. 144). “Although communities attempt to pur-chase rights to new regulations [rent regulation and dwelling allocation], the present financial situation inhibits any meaningful results.” (p. 145). Droste & Knorr-Siedow (2007, p. 103) add: “Only a few towns and cities, often those
64 Dated 5 February 2003, last changed on 12 January 2005. See also changes as of 26 January 2006.
65 In 2000 expenditure for housing allowances for the first time surpassed expenditure for bricks-and-
mortar subsidies (Kirchner, 2006).
[ 167 ]

with highest house prices, have maintained production of new social hous-ing” Brech (2004, p. 146) also has a concern about construction activity in the absence of bricks-and-mortar subsidies for investors: “Without state support, private developers do not construct rented housing.”
Table 6.10 shows the numbers of subsidised dwellings per year in the pe-riod 2003-2006. These statistics support that the record numbers of dwellings subsidised in the early to mid-1990s, when up to 150,000 dwellings a year were being subsidised, have long since become history in the unified Germa-ny (Bundeszentrale für politische Bildung, 2004).
On 1 September 2006, legislative competence for dwellings with bricks-and-mortar subsidies passed from the federal government to the federal states (Bundesministerium für Verkehr, Bau und Stadtentwicklung, 2006b). Since 1 January 2007, no more new federal funds have been available for this sub-sidisation programme. Federal states can now set their own legislation on the basis of local needs. If federal states have not drawn up their own legislation, the 2001 WoFG remains applicable.
It is not only the subsidisation system that appears to be changing and being scaled back, but also the norms and values of ‘social renting’ according to Brech (2004, p. 155). Managers of older generations express their concern that the new generation of managers have ‘unfortunately’ separated them-selves from the social principles, which enabled the company’s success, and replaced these with ‘neo-liberal’ ideas.
6.8.2 Tax concessions for landlords
Three types of tax concessions are relevant for landlords. Tax concessions are available on capital gains and depreciation. There is also special tax status for certain cooperatives.
Capital gains taxAs far as capital gains tax is concerned, a distinction is made between corpo-ration tax and personal income tax: corporation tax is payable on the capital gain when a property is sold, but income tax is not, provided the sale does not take place in the first ten years after the acquisition of the dwelling.
[ 168 ]
Table 6.10 Subsidised dwellings in Germany, 2003-2006
2003 2004 2005 2006
Subsidised dwellings 44,500 36,800 32,700 35,300
Of which:
Rented dwellings 19,900 18,900 15,100 18,300*
New-build dwellings 29,600 25,000 22,000 21,100
Sources: Statistisches Bundesamt (www.destatis.de: diverse Förderstatistiken; e.g. Statistisches Bundesamt, 2007c)
* The total of subsidised rented dwellings consists of over 11,000 new-build rented dwellings and a little over 7,000 existing rental dwellings (see Section 6.6).

Exemption from corporation taxA little over two-thirds of the cooperatives are exempt from corporation tax. They are not permitted to engage to any substantial extent in activities other than letting (GdW Bundesverband deutscher Wohnungsunternehmen, 2004a, p. 117). This special tax status is a remnant of the special status that also applied to other non-profit landlords until 1990 (Dorn, 1997, p. 469).
Depreciation deduction in income or corporation taxThere is a difference between corporation tax and personal income tax, as far as the tax rates are concerned, but no difference between the two taxes as regards the system of deducting depreciation. A German landlord is treated in the same way as any other investor for tax purposes (Hubert, 1998, p. 219), in terms of income tax. This means that all relevant costs, including those of depreciation, are deductible from rent income (see also Kirchner, 2006; To-mann, 1990).66 This scheme was set up in 1953 (Leutner, 1990) and has contin-ued, with a few variations, ever since then.
Tax relief on depreciation applies to all rented properties, and thus also to properties subsidised by bricks-and-mortar subsidies under the 2001 WoFG (Kirchner, 2006). For properties built before 1925, the depreciation rate is 2.5% for 40 years, while for properties built after 1925, it is 2% for 50 years. Own-ers can choose between the degressive and linear depreciation systems in the case of new-build dwellings. The degressive system means that since 2004 an-nual fiscal depreciation is 4% in the first ten years, 2.5% up until year 18 and 1.25% from year 19 until year 50.
Hubert (1998) regards fiscal depreciation as a powerful subsidy tool,67 as each buyer-landlord of the property can take advantage of the depreciation facility on the basis of the historical purchase price. House price inflation alone gives landlords a strong incentive to sell off rented properties in order to build new ones.
Braun & Pfeiffer (2004), in their calculations for the Landesbausparkassen Bundesgeschäftsstelle Berlin, concluded that landlords generally receive more subsidies in the form of tax-deductible depreciation than owner-occupiers in the form of Eigenheimzulage (see Section 6.4.1 and 6.4.2) when it comes to new-build dwellings. They believe that landlords could reduce rents substan-tially if they were to pass on the tax benefits to their tenants in full (instead of regarding it as additional profit). The decrease in rents could be as much as 20% of the market rent, which would make renting more attractive than buying for housing consumers. Braun & Pfeiffer (2004) argue, on the basis of
66 For income tax, there are different rules for the former East Germany (Kirchner, 2006).
67 There can be a discussion whether cost deductions in the tax system are to be regarded as subsidy, de-
pending on the primary structure of the tax system (Leutner, 1990, p. 356; Tomann, 1990).
[ 169 ]

their assumptions, that for both types of ownership in order to receive tax-neutral treatment in the case of new-build dwellings, the rate of depreciation on acquisition costs would have to be set at a linear 3.5% and tax relief on in-vestment in maintenance would have to be abolished.68 This analysis does not take account of the mortgage interest relief that landlords enjoy. In the case of existing dwellings, the financial support provided to owners is more or less in equilibrium, in the view of Braun & Pfeiffer (2004).
The benefit to landlords will have increased since the abolition of the Eigenheimzulage on 1 January 2006, according to these calculations. However, this situation is expected to change. The federal government that took office in November 2005 planned to abolish degressive depreciation on new-build rented dwellings (Kirchner, 2006).
6.8.3 Housing allowances
The aim of housing allowances is to reduce housing costs (Kofner, 2007). The amount of benefit received is based on the number of persons in the house-hold, the year that the dwelling became available for occupation (there are currently four categories), the local rent level (currently six categories) and the household income (Bundesministerium für Verkehr, Bau und Stadtentwicklung, 2006c; Bundesministerium für Verkehr, Bau- und Wohnungswesen, 2002). Housing allowances are subject to a maximum local rent level – a notional rent – and a maximum household income, which is adjusted for the number of members of the household. Tenants (Mietzuschuss) and owner-occupiers (Lastenzuschuss) can apply for housing allowances. In that sense, housing allowances can be regarded as a tenure neutral instrument, although tenants represent the larg-est group of recipients. Housing allowances are a statutory right, provided the claimant fulfils the requirements. The scheme is thus open-ended.
As a major drawback of the housing allowance system can be regarded that adjustments for inflation and increases in income and norm rents to be subsi-dised require action by the federal parliament. This functions as a type of bud-geting (Hubert, 1998). The adjustments have been applied every five or six years, and each time have resulted in about 10% of recipients dropping out of the scheme as rents and incomes have generally continued to rise in the interim. According to Kofner (2007, p. 179), the adjustments do not seem to be based on the needs of recipients but the business cycle. Nine adjustments were made be-tween 1965 and 1991. Over the ten years before the next adjustment took place in 2001, the real value of Wohngeld was halved (Deutscher Bundestag, 2003, p. 23).
68 The subsidy aspect in the deduction of maintenance costs, Braun & Pfeiffer (2004) argue, lies in the
fact that they can deduct the cost in the year in which the work is carried out rather than over a number of
years starting in the year that the work is carried out.
[ 170 ]

With effect from 2004, the entitlements of allowance recipients in the former East Germany were brought into line with those in West Germany (Bundesministerium für Verkehr, Bau- und Wohnungswesen, 2004b). A total of 3.5 million households, that is 9% of households, were receiving housing allow-ances in 2004 (Kofner, 2007).
When the social reforms took effect in 2005 (Hartz IV, see Section 6.4.2), the caseload fell to 781,00069, a little over one fifth of the number of recipients in 2004; costs fell from €5.2 billion in 2004 to €1.2 billion (Bundesministerium für Verkehr, Bau- und Wohnungswesen, 2004c; Busch-Geertsema, 2004; Kirchner, 2006; Kofner, 2007; see also Droste & Knorr-Siedow, 2007). Housing cost al-lowances are now integrated into unemployment benefit, the Arbeitslosengeld II, instead of being applied for separately. In 2005, 3.7 million households re-ceived Arbeitslosengeld II.
Regular housing allowances can now be classified as a financial contribution to housing for households above the social minimum. Housing allowances are no longer paid to those who receive any other transfer of income, with the possible exception of the short-term jobless. According to Kofner (2007, p. 159), “housing allowances are widely seen in Germany as a relatively market-conforming instrument of social policy … with the ability to act as a substi-tute for an important part of the social housing programmes”. Nevertheless, there appears to be evidence that only about 40% to 50% of entitled house-holds claim it, mostly the working poor, the unemployed and the retired.
A new adjustment in the parameters of the housing allowances was sched-uled for 1 January 2009. The average monthly amount of rent allowance is to rise from €90 to €150, and the budget is to rise by €560 million (Bundesminis-terium für Verkehr, Bau und Stadtentwicklung, 2008). The changes include a new cost component for heating costs and an increase of 10% of standard rents.
6.9 Bridging the gap between social and market renting?
As regards the rented sector, Germany can probably be regarded as an excep-tion among the countries under consideration here. Not only is the rented sector large, accounting for about 60% of the housing stock, but it has not decreased in size, overall, during the past decades. One of the reasons for this is the system of bricks-and-mortar subsidies. It is designed as a conces-sion model, temporarily ring-fencing subsidised dwellings (now estimated at around 5-7%) from the rest of the housing market under a special regime.
69 With the new adjustments for 2009 the number of recipients is expected to rise to about 850,000
households (Bundesministerium für Verkehr, Bau und Stadtentwicklung, 2008).
[ 171 ]

When the subsidy period finishes, the dwelling no longer forms part of the special subsidy regime, but returns to the market rented sector.
There are many other reasons mentioned for the persistence of the large market rented sector in the literature, even though home ownership was en-couraged by policy makers early after World War II. These reasons include the fact that rented dwellings were not sold off as a result of the favourable tax system for landlords and a landlord-friendly rent regulation. This meant that landlords were able to make good returns on their investments by rent-ing properties. Tenants, meanwhile, were attracted to the good quality of the rented dwellings and the strong security of tenure in the rented sector. Home ownership was also relatively expensive because of relatively high house pric-es in the home ownership sector and the need to save before a dwelling could be acquired. A high proportion of multi-family dwellings also contribute to the explanation, as well as the addition of mainly rented dwellings from the housing stock of the former East Germany when Germany reunified.
The last explanation that is put forward is the fact that the rented sector apparently serves the same function in Germany – providing security of ten-ure – as the owner-occupied sector does in other countries. This situation may also explain why the cooperative rented sector is relatively large, accounting for 6% of stock. This represents a hybrid form between renting and owning with strong security of tenure because the tenant also owns some share in the property. Some forms of cooperatives allow the creation of more wealth than the required deposit.
The gap in who provides whatThe picture of differences between both rented sectors when looking at who provides what (Table 6.11) is rather mixed and unclear because of missing da-ta. The mixed picture results from no differences on the one hand for types of landlords, who are primarily motivated by profit (except for public housing companies and cooperatives), security of tenure (strong) and the right to buy (not available). On the other hand, there is a difference in another property right between the two rented tenures – the rent surcharge which is available in most federal states for households on incomes above the limit set for sub-sidised renting. Rent control also varies between the sectors. The missing data concerns the quality of the rented dwellings – said to be little different – and the rent levels, which we can expect to be different nowadays because of the link to market rents and because of bricks-and-mortar subsidisation. In the past, when rents and rent adjustments were based on cost prices, there was no guarantee that subsidised rents would turn out lower than unsubsidised rents.
The gap in government policies and outcomesThe differences between the rented sectors as far as policy is concerned can be seen relatively clearly in Table 6.12, and are connected to the temporary
[ 172 ]

distinction that is made in Germany between dwellings that receive bricks-and-mortar subsidies and those that do not. To obtain this kind of subsidy, any landlord must agree to let the property under a particular allocation sys-tem to households with a certain maximum income being households with a residence permit. There will also be an agreement on initial rent levels and rent rises, and there will be the possibility of levying a rent surcharge in most federal states if household income rises above the limits set. No bricks-and-mortar subsidy is available for market rented housing, and thus no special system of allocation is applicable; the system is demand-based. Rent setting for a market rented dwelling at the beginning of the contract is based on mar-ket rents, and rent adjustment is market-conform based on reference rents.
Other policy instruments do not seem to distinguish between the subsi-dised and the non-subsidised rented sector. The rent allowances that tenants can receive are aptly named ‘housing money’, because they are available in all sectors. Neither does the tax allowance system for landlords distinguish between subsidised and non-subsidised dwellings.
The competitive gapThe substitutability gap between subsidised and non-subsidised rented dwell-ings exists chiefly because of the allocation system and the special rent regu-lation system used for the subsidy. The possibility of levying a rent surcharge
[ 173 ]
Table 6.11 The gap between social renting and market renting in who provides what in Germany
Subsidised (social) renting Non-subsidised (market) renting
Landlord
Types All landlords
Motives About 15% of landlords possibly can be considered as having a non-profit motive: municipal housing companies, cooperatives, and a few other landlords
Accommodation
Quality of products on offer
Quality of new subsidised housing has been said to be little different from that of new market housing. Differences between renting and
owning have been said to be larger than between rented sectors
Rent levels Expected to be lower nowadays (because of subsidy but especially) since rent setting became more market-oriented and no longer is based on cost price; in cost-price situations, the subsidised rent may not necessarily have been lower than market rent
Expected to be higher?
Property rights
Rent regulation Rent setting and rent adjustment according to bricks-and-mortar subsidy contract
Market rents for new contracts; rent adjustment according to reference rents, and after the tenant has given permission
Security of tenure Strong, no difference
Rent surcharge Rent surcharge available when income is too high
Not available
Right to buy Not available

for a subsidised rented dwelling when the income of the household passes a certain threshold means that property rights for consumers vary between the two types of rented dwellings. The gap will be temporary as subsidies includ-ing the regulation are of a limited duration.
The fact that there is no difference between the two rented sectors in the formal incidence of tenant security (indefinite contract), the absence of any right to buy and the housing allowances available will affect the substitut-ability between the two rented sectors (Table 6.12). The gap in the quality of accommodation is probably also small, as may be the gap in rent levels de-pending on the location. Furthermore, where demand for subsidised hous-ing exceeds local supply, prospective tenants for a subsidised rented dwelling
[ 174 ]
Table 6.12 The gap between social renting and market renting in policy and policy instruments in Germany
Subsidised (social) renting Non-subsidised (market) renting
Purpose of housing sector To rent to households below certain income thresholds; in time, a shift away from larger sections of the population
Investment/profit
Allocation procedures According to need: households with a housing permit
Free market; waiting list per landlord
Rent control
Rent control for new contract Contract between landlord and local authority, the subsidy provider
Rent setting at the beginning of the contract is market rent; the only regulation is for usury rents
Rent control for rent adjustment
Contract between landlord and local authority, the subsidy provider
Based on reference rents
Regulation and supervision Depends on organisation type; no information has been found on possible special regulation for the landlord as an organisation when bricks-and-mortar subsidies are received
Depends on organisation type
Government support
Bricks-and-mortar subsidy Available Not available
Tax concession for landlord Available, no difference
Housing allowances Available, no difference
Outcomes
Socio-economic characteristics of tenants
Probably lower income now than in the past because of policy shift away from larger sections of the population
No recent information found
Movement between tenures No information No information, but probably also difficult to measure as subsidised dwellings become non-subsidised dwellings in due course as the subsidy periods come to an end
Competition
Substitutability Some choice for consumers likely, possibly also ‘forced’
Rivalry Some rivalry between landlords likely
may well be ‘forced’ to find a dwelling from the unsubsidised rented stock. Substitutability between acceptable dwellings in both rented sectors will probably be greater in areas where federal state income limits for subsidisa-tion are higher than the minimum federal limits. This will not be the case if these higher limits are bases on higher market rents in the first place.
Since any landlord can apply for bricks-and-mortar subsidisation for ‘so-cial’ dwellings and the fiscal non-profit status is left to some ‘inactive’ rented cooperatives with the leftover fiscal non-profit status, we can assume that there is some rivalry between landlords (Table 6.12). It is highly likely that suppliers in both rented sectors will regard themselves as rivals in offering unsubsidised dwellings, but also in obtaining bricks-and-mortar subsidies so that they can offer subsidised rented dwellings for a specific period. Subsidi-sation schemes (in the past, at least) offered ‘normal’ or at least ‘acceptable’ returns for landlords.
Bridging the gap?The ‘concession system’ of subsidisation means that any gap between a sub-sidised and a non-subsidised renting regime is temporary: ultimately, there will only be non-subsidised renting.
The relatively large gap between subsidised and non-subsidised (market) rented dwellings for rent regulation has become smaller since the introduc-tion of more extensive market-oriented rent controls for subsidised dwellings (1 January 2002). Rent control for social rented dwellings is no longer based on cost price, but on negotiations between landlords and local authorities (the subsidy providers) taking market developments into account through the sys-tem of reference rents.
The allocation system for subsidised rented housing has also become more market-oriented. In this case, this means that landlords have more say about where to house which tenant who holds a residence permit. This increase in market-orientation could be interpreted as a movement in the direction of a smaller gap between the two rented sectors.
Country experts
Karin Helbrecht, Universität Bremen.
Joachim Kirchner, IWU Institut Wohnen und Umwelt GmbH, Darmstadt.
[ 175 ]

[ 176 ]

7 Ireland
7.1 Introduction
7.1.1 National responsibilities and local provision
Housing policy in Ireland is set nationally and delivered locally. The Depart-ment of Environment, Heritage and Local Government is responsible for the formulation and implementation of policy and for the preparation of housing legislation. There is thus centralised policy making, even though the major-ity of services for which the department is responsible are delivered through local authorities. There are a total of 88 housing authorities in Ireland, made up of 29 counties, five urban districts, 49 town councils and five boroughs. Housing related welfare payments are administered by the Health Service Executive, which is responsible for the delivery of health services and social security payments. It operates through a network of local health offices. The government’s Housing Finance Agency administers the provision of capital support for social housing (O’Sullivan, 2005).
Around one million of Ireland’s 3.8 million inhabitants live in Dublin and about 40% of the population lives within 60 miles of the capital. Recent years have been characterised by rapid economic and demographic growth and Ire-land now has one the youngest and, in terms of GDP per head, most affluent populations within the European Union.
7.2 Housing stock
7.2.1 Definition and size of the rented sector
Around 11% of the housing stock in Ireland is social rented housing and about 11% is privately rented (Table 7.1). The social rented stock is owned and man-aged by local authorities and voluntary and cooperative housing associations. Social housing is intended for households on the lowest incomes who cannot afford home ownership or market renting.
7.2.2 Description of the housing stock
Home ownership has grown significantly in Ireland in the last fifty years, de-spite some reduction in recent years. This growth has been promoted by eco-nomic prosperity and government policies that have encouraged owner oc-cupation through a series of direct and indirect means. These have included financial assistance for purchasers, legislation that has eased access to cap-ital markets, the sales of local authority dwellings to tenants, and targeted support to encourage home ownership by lower-income households. Policy measures are argued to have resulted in the “institutionalisation of owner oc-
[ 177 ]

cupation as the dominant housing tenure” and its position as the most at-tractive option for the majority of households (O’Connell, 2005, pp. 21-43). The corollary of this has been a less significant and declining role for rented hous-ing. Over 35% of households rented in 1961. By 2006 this had fallen to 22%.
Social housing has predominantly been owned and managed by local au-thorities but voluntary housing associations are playing an increasing role. Irish local authorities have always charged low rents and let to disadvantaged groups but the level of residualisation has “worsened considerably over the last two decades” with an increasing proportion of tenants on very low in-comes (Norris, 2005, p. 172). Residualisation has been reinforced by the sale of council houses to relatively better off tenants and from 1984 to 1987 the use of ‘surrender grants’ to encourage tenants to move into owner occupation. It is estimated that, in 2002, 20% of the owner-occupied stock had originally been council housing (Norris, 2005, p. 180-181).
Voluntary housing associations have been formed to meet local needs. It has been estimated that there were 330 active housing associations at the end of 2001. Around 93% of associations managed less than 50 dwellings, 5% 51 to 250 dwellings and only 2% had more than 250 dwellings. However these seven organisations accounted for 44% of the housing association stock (Brooke and Clayton, 2005, p. 216-7). Many have been established by existing care associations who provide services to the elderly and people with dis-abilities. Several associations provide additional services such as meals, so-cial activities and welfare advice as well as housing (Irish Council for Social Housing, www.icsh.ie).
Market renting declined as a proportion of the housing stock until the 1990s but has subsequently experienced significant growth. Rent controls, government support for home ownership and a lack of investment incentives contributed to the decline. The recent revival of the sector can be explained by tax incentives and economic and demographic growth that, with a short-age of housing for owner occupation, have helped to boost the demand for market renting. Increases in house prices have both made home ownership more difficult and increased the attractiveness of market housing as an in-vestment. Data for 2003 suggests that around 27,000 market rented dwell-ings were owned by 17,500 landlords. Most landlords are individual investors
[ 178 ]
Table 7.1 Housing tenure (in percentages), Ireland, 1961-2006
Tenure 1961 1971 1981 1991 2002 2006Urban areas
2006Rural areas
2006
Local authority rented 18.4 15.9 12.7 9.7 6.9 7.2 9.7 3.8
Voluntary body rented 3.5 4.7 1.7
Market rented 17.2 10.9 8.1 7.0 11.1 11.4 15.2 6.3
Owner-occupied 53.6 60.7 67.9 80.2 77.4 74.7 70.4 88.2
Other 10.8 12.5 11.2 3.0 4.6
Not specified 3.2
Sources: Norris & Redmond (2005) for 1961 to 2002 data; Central Statistics Office (2007) Ireland Census, 2006 see http://www.ie/census for 2006 data
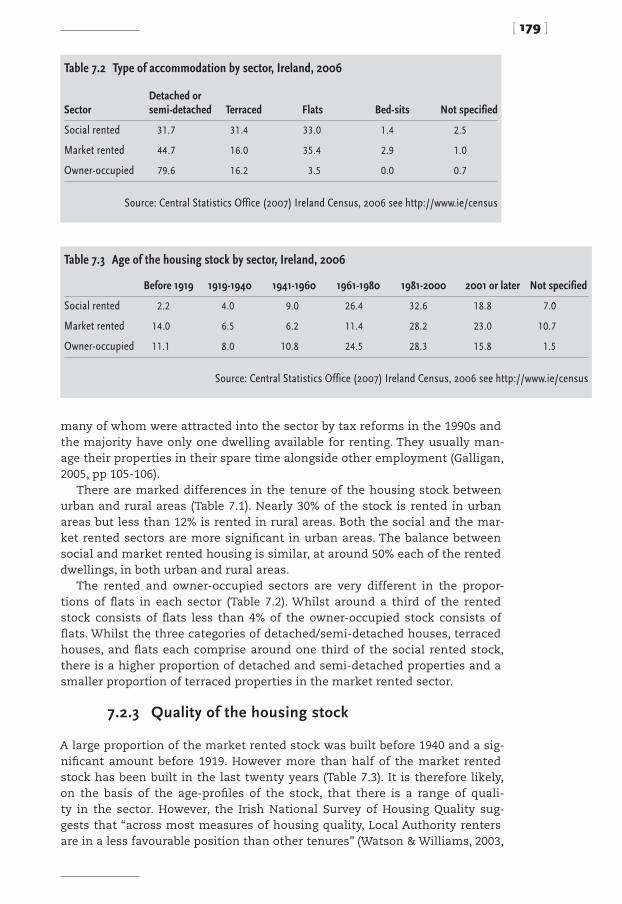
many of whom were attracted into the sector by tax reforms in the 1990s and the majority have only one dwelling available for renting. They usually man-age their properties in their spare time alongside other employment (Galligan, 2005, pp 105-106).
There are marked differences in the tenure of the housing stock between urban and rural areas (Table 7.1). Nearly 30% of the stock is rented in urban areas but less than 12% is rented in rural areas. Both the social and the mar-ket rented sectors are more significant in urban areas. The balance between social and market rented housing is similar, at around 50% each of the rented dwellings, in both urban and rural areas.
The rented and owner-occupied sectors are very different in the propor-tions of flats in each sector (Table 7.2). Whilst around a third of the rented stock consists of flats less than 4% of the owner-occupied stock consists of flats. Whilst the three categories of detached/semi-detached houses, terraced houses, and flats each comprise around one third of the social rented stock, there is a higher proportion of detached and semi-detached properties and a smaller proportion of terraced properties in the market rented sector.
7.2.3 Quality of the housing stock
A large proportion of the market rented stock was built before 1940 and a sig-nificant amount before 1919. However more than half of the market rented stock has been built in the last twenty years (Table 7.3). It is therefore likely, on the basis of the age-profiles of the stock, that there is a range of quali-ty in the sector. However, the Irish National Survey of Housing Quality sug-gests that “across most measures of housing quality, Local Authority renters are in a less favourable position than other tenures” (Watson & Williams, 2003,
[ 179 ]
Table 7.2 Type of accommodation by sector, Ireland, 2006
SectorDetached or semi-detached Terraced Flats Bed-sits Not specified
Social rented 31.7 31.4 33.0 1.4 2.5
Market rented 44.7 16.0 35.4 2.9 1.0
Owner-occupied 79.6 16.2 3.5 0.0 0.7
Source: Central Statistics Office (2007) Ireland Census, 2006 see http://www.ie/census
Table 7.3 Age of the housing stock by sector, Ireland, 2006
Before 1919 1919-1940 1941-1960 1961-1980 1981-2000 2001 or later Not specified
Social rented 2.2 4.0 9.0 26.4 32.6 18.8 7.0
Market rented 14.0 6.5 6.2 11.4 28.2 23.0 10.7
Owner-occupied 11.1 8.0 10.8 24.5 28.3 15.8 1.5
Source: Central Statistics Office (2007) Ireland Census, 2006 see http://www.ie/census

p. xii). Only 70% of local authority renters had central heating in 2001/2 com-pared with 86% of market renters. As for the overall condition of the dwell-ings, 33% of local authority renters reported problems compared with 17% in the market sector and 25% of local authority renters reported problems with the area compared with 9% of market renters (ibid.). Fitzgerald & Winston (2005, p. 235) confirm that concern about the poor quality of neighbourhoods is much higher in the local authority sector than in other tenures.
7.3 Characteristics of tenants
Local authority tenants have a lower income and a pay lower rent than mar-ket tenants. In 1999-2000, local authority tenants spent 7.4% of their income on rent compared to 21% in the market rented sector. The combination of low incomes and low rents in the local authority sector means that it plays a “key and largely unacknowledged role in combating income poverty in Ireland” (Norris, 2005, p. 180).
Incomes for both social and market renters are substantially below those of owner-occupiers with mortgages. The incomes of social renters have fallen markedly in recent years, providing further evidence of the increasing residu-alisation of the tenure (Norris & Murray, 2004; Redmond, 2001). The average disposable incomes of market renters has, in contrast, increased, reflecting the growing use of the sector by higher income households who cannot af-ford home ownership. More detail is provided in Table 7.4.
Lower-income households predominate in local authority renting, whereas the distribution of incomes in the market rented sector closely resembles that for the country as a whole. Over 52% of local authority tenants are in the low-est income quartile compared with just over 19% in the market rented sector. Only around 5% of local authority tenants are in the top income quartile com-pared to almost 25% in the market sector.
When comparing renters with owner-occupiers, the position is signifi-cantly different between owners with a mortgage and those who own out-right. Whilst those with a mortgage have a higher average income than rent-ers, outright owners have a higher average income than that of social renters but lower than that of market renters. 35% of outright owners are in the low-est income sector (Punch, 2005, p. 130-131). The income profile for the market rented sector suggests that it is a diverse sector, housing both long-term poor households and “relatively well-off households seeking temporary accommo-dation on the way to home-owning” (Galligan, 2005, p. 100).
Overall, there is a higher level of welfare dependency in the social sector than in the market sector. About 80% of local authority tenants are welfare dependent (Redmond & Norris, 2005, p. 14), compared to around 40% of pri-vately renting households who depended on a housing allowance in the form
[ 180 ]

of a ‘rent supplement’ to assist them with their housing costs in 2003 (Gal-ligan, 2005, p. 104). The market rented sector has, however, recently assumed a new role in housing low-income benefit-dependent households through the Rental Accommodation Scheme (see Section 7.8.5).
7.4 Housing policy
Housing policy has, throughout the history of the Republic of Ireland, been explicitly tenure specific with home ownership being encouraged by a variety of financial measures for a wide range of income groups and social housing promoted for those could not afford to compete in the market place. Market renting has faced a series of controls and restrictions and then, more recently, incentives and promotion to a new social role for households excluded from home ownership and social renting.
7.4.1 Home ownership
Policy measures helped to boost the owner-occupied sector from 53% of dwellings in 1946 to 80% in 1991, although by 2006 this had fallen back to around 75% (Table 7.1). Direct grants were available from the beginning of the Irish State in 1922 to support the building and purchase of dwellings for home ownership. In the late 1940s, this support was enhanced and all but the poorest households were expected to become homeowners. From the 1970s onwards, additional assistance was provided to first time buyers. It has been suggested that in the mid 1980s, around £10,000 of the £35,000 cost of a stan-dard new suburban house could be covered by state support. Since the 1930s, loans from local authorities have been available to those households who could not secure a commercial mortgage. From the mid 1950s, restrictions were eased in the lending activities of building societies who were then en-couraged to take a full part in expanding home ownership. As O’Connell (2005, p. 30) points out, tenants have been able to buy their dwellings from their lo-cal authority landlords since 1919 (before the Irish state was founded and 60 years before the Right to Buy was established in England in the 1970s; more information is given in Section 7.5.7).
Home ownership has also been promoted by a series of fiscal concessions including mortgage interest tax relief (although this has been scaled back in
[ 181 ]
Table 7.4 Index of average disposable income by household tenure, Ireland
Owned outright Mortgaged Market rentedLocal authority rented State
1980 91.6 126.1 87.4 73.4 100
1987 91.0 127.6 91.8 64.6 100
1994 - 95 88.2 129.7 87.1 57.0 100
1999 - 2000 87.1 127.5 101.2 55.6 100
Source: Punch, 2005, p. 130, using data from Irish National Statistics Office

recent years), capital gains tax exemptions for homeowners and the absence of tax on imputed rental incomes. An additional set of measures takes the form of targeted support to promote home ownership among low-income households. This includes the local authority affordable housing scheme, the mortgage allowance scheme, the shared ownership scheme and the availabil-ity of local authority loans for home purchase and improvement. Local au-thorities are expected to play a key role in extending low-income home own-ership. The local authority affordable housing scheme, introduced in 1999 provides new-build houses to first time buyers below specified income levels. The dwellings are sold at cost price and attract mortgage subsidies. The mort-gage allowance scheme gives financial assistance to social housing tenants who wish to buy a dwelling. Since 1991, the shared ownership scheme has promoted the joint acquisition of dwellings by local authorities and individual purchasers, with each initially having a half share. At the end of the purchase period, the individual buys the council’s equity and obtains full ownership. An evaluation of low-income home ownership schemes points to widespread arrears and limited success in promoting home ownership, which puts their long-tem sustainability in doubt (Norris et al., 2006).
7.4.2 Social renting
Support for social housing in Ireland since the early twentieth century has been concentrated on measures to assist the provision of rented housing by local authorities, which have been provided with low interest loans for house building. An increase in subsidies in 1948 raised local authority output ten-fold between 1948 and 1954 but during the 1960s and 1970s the tenure began to contract as building rates declined relative to the private sector and tenant sales increased. The 1966 Housing Act rationalised local authorities’ housing powers, replacing more than fifty earlier legislative provisions, and required them to deal with unfit dwellings, assess housing needs and devise build-ing programmes to meet these needs Norris (2005, p. 169). From the 1980s onwards, local authority housing became increasingly residualised and the sector has housed an increasing proportion of households on the lowest in-comes. Between 1987 and 1994, the proportion of local authority tenants with incomes below 60% of the national average grew from around 60% to nearly 75%.
7.4.3 The Plan for Social Housing
The social sector’s contribution to overall house building fell dramatically from 1980 to 1990, as shown in Table 7.5. The 1991 Plan for Social Housing in-troduced a series of reforms to the role of local authorities, giving them new facilitating and funding roles especially in relation to voluntary and cooper-
[ 182 ]

ative societies. The contribution of local authority housing to total housing production fell significantly from around 27% of the total to 5% between 1970 and 1990. Although total local authority house building increased in the 1990s, its overall contribution to output remained relatively small. This is in the con-text of a spectacular increase in market sector house building with total out-put more than quadrupling from 1990 to 2005. Table 7.5 shows the continuing rise in total housing completions and the dominant role of the market sector in housing production.
The Plan for Social Housing highlighted the need for future social house building to avoid additional large local authority estates, which were judged to contribute to social segregation. The advantages of mixed tenure develop-ments helped to drive the affordable housing requirements of Part V of the Planning and Development Acts 2000-2004. The provisions allow local authori-ties to require that up to 20 per cent of land zoned for residential develop-ments, or for a mix of residential and other uses, is reserved for social and other affordable housing needs and is provided to the local authority at exist-ing use value rather than development value. Part V applies only to planning permission for developments of five or more houses on zoned land of 0.1 hect-ares or more. It does not apply to developments by voluntary housing bodies.
As alternatives to providing land, units or sites within the proposed devel-opment, agreements with developers may include the transfer of other land; the provision of new units elsewhere; the transfer of sites to an approved housing association, the payment of money in lieu or a combination of these options. The preferred option is, however, the delivery of housing units on site to achieve integrated mixed tenure developments. Eligibility for Part V affordable housing is based on applicants being in need of accommodation and their income being insufficient to meet the mortgage repayments on a market-value house appropriate to their accommodation needs because such payments would exceed 35% of that person’s annual net income. In the case of a double income household, half the net income of any subsidiary earner is taken into account in making this assessment (Department of the Environ-
[ 183 ]
Table 7.5 Total housing completions by sector (in percentages), Ireland, 1970-2006
Local authorities
Voluntary and non-profit Market Total
1970 27.1 72.9 13,887
1980 21.5 78.5 27,785
1990 5.1 94.9 19,539
1995 9.7 3.3 87.0 30,575
2000 4.4 1.9 93.7 49,812
2005 5.2 1.7 93.1 80,957
2006 4.2 1.3 94.4 93,419
Source: Housing Statistics Database, Department of the Environment, Heritage and Local Government (www.environ.ie)

ment, Heritage and Local Government, 2006, www.environ.ie).The Plan for Social Housing announced increases in the limits to funding
under the Capital Assistance Scheme, new arrangements to fund commu-nal facilities in voluntary and cooperative estates and the establishment of a Capital Loan and Subsidy Scheme that provided ongoing management and maintenance allowances to these organisations for each dwelling provided as well as capital funding towards construction costs. To qualify for funding, vol-untary associations and cooperatives have to gain approved status from the Department of the Environment, Heritage and Local Government. The Capital Assistance Scheme has been used mainly for special-needs housing and the Capital Loan and Subsidy Scheme mainly for general-needs housing. In 1984, the Capital Assistance Scheme provided the first dedicated funding to vol-untary and cooperative providers, which had previously been funded by cen-tral and local government on an ad hoc basis. Under the Capital Assistance Scheme, voluntary housing associations access non-repayable loans (effec-tively grants) from local authorities for up to 95% of the capital cost of hous-ing that is to meet special housing needs such as those of the elderly, people with a disability, homeless, returning emigrants or smaller families. The ap-proved voluntary bodies are responsible for tenancy allocations in consulta-tion with the local authorities. A minimum of 75% of the houses in each proj-ect are reserved for persons whose applications for local authority housing have been approved by the local authority, homeless persons, or local author-ity tenants and tenant purchasers who are returning their dwellings to the local authority. The remaining houses in a project are let to people nominated by the voluntary housing body. Rents are determined on the basis of tenants’ means and the cost of managing and maintaining the dwellings. Under the Capital Loan and Subsidy Scheme, voluntary housing bodies provide general-needs housing for renting, particularly to meet the needs of low-income fami-lies.
7.4.4 Market rented policy
Policy towards market rented housing was, for most of the twentieth century, one of control or indifference. An exception was The Urban Renewal Scheme that was established in 1985 and subsequently extended to towns, villages and rural areas. This incentivised housing development in declining areas but the assistance available to landlords was much more generous than that available to homeowners. The output of market rented housing thus rose sig-nificantly and the overall quality of the private rented stock improved mark-edly.
Rent controls were in place from World War I until a measure of decontrol began in 1960 when controls on new lettings were removed. Further moves towards decontrol and market rents were introduced in 1982. There were no
[ 184 ]

fiscal incentives (and arguably some disincentives because of the adverse tax treatment of landlords compared with other businesses) for market renting until 1981, when tax relief schemes for construction, conversion and refur-bishment were introduced. From 1998 to 2001, the government actually dis-couraged investment in market renting, because of a perception that it was crowding out home ownership, by removing the deductibility of interest on borrowing by landlords for tax purposes. The Commission on the Private Rental Sector that reported in 2000, and was established because of lobbying from pressure groups concerned about the weak position of the sector and poor landlord and tenant relationships, had a remit to suggest changes that would address the problems of the sector. Specifically, it was to address the poor security of tenure of tenants whilst maintaining a balance between the rights and obligations of landlords and tenants, and suggest ways of increas-ing investment in the sector. Many of the recommendations from the Com-mission were in incorporated in the Residential Tenancies Act 2004, which is the core element of the Government’s overall programme to promote re-form and development of the market rented sector. The Act introduced im-proved security of tenure through a system of four-year tenancy cycles, new tenancy termination procedures – including longer notice periods linked to length of tenancy, establishment of a statutory Private Residential Tenancies Board (PRTB), a new system of tenancy registration with the PRTB, voluntary renunciation of the right to long-occupation equity leases, higher penalties for offences relating to standards and registration of market rented accom-modation, and the extension of local authority powers to address anti-social behaviour.
A new dispute resolution service, which operates through the PRTB rather than through the Courts, involves mediation or adjudication and tenancy tri-bunal hearings. Landlords must register with the PRTB with incentives for do-ing so and strong sanctions for non-compliance. In addition to dispute reso-lution and tenancy registration, the PRTB engages in a range of monitoring, research, information and policy-advice functions in relation to the market rented sector.
7.4.5 Current policy objectives
A policy statement from the Department of the Environment, Heritage and Local Government entitled Housing Policy Framework: Building Sustainable Communities in December 2005 summarised the purpose of housing policy by stating that a key objective was to “promote the conditions whereby the maximum number of people can access affordable accommodation through private provision” (Department of the Environment, Heritage and Local Gov-ernment, 2006, www.environ.ie). The statement acknowledged the need for the increased expansion of housing production and committed government
[ 185 ]

to a major increase in capital investment in social and affordable housing over the subsequent three years. It noted that housing output had increased substantially over the last ten years but argued that high levels of house building needed to continue to meet needs and improve affordability. The re-markably high levels of housing production are apparent in Table 7.5, which shows that total completions in 2006 were almost three times the 1995 level and, compared to population levels, and amongst the highest in the EU. The government pledged to support the infrastructure necessary to achieve high levels of housing output. The statement says that government will expand so-cial housing options by supporting 23,000 units to be provided by local au-thorities and the voluntary and cooperative sector from 2006 to 2008 and by the use of the Rental Accommodation Scheme to provide social housing in the market rented sector (see Section 7.8.5). It also states the government’s intention to involve the voluntary and cooperative sector in the Rental Ac-commodation Scheme. The statement also set out the government’s intention to improve the quality of the social housing stock through regeneration and improvement works. A commitment to extending home ownership was con-firmed by measures to extend the tenant purchase scheme to local authority flats and, on a pilot basis, to the voluntary and cooperative sector.
Currently, then, the overall objective of housing policy is to “enable every household to have available an affordable dwelling of good quality, suited to its needs, in a good environment and as far as possible at the tenure of its choice”. The general principle underpinning the housing objective is that those who can afford to provide for their housing needs should do so, either through home ownership or market rented accommodation, and that target-ed supports should be available to others in the basis of the nature of their need (Department of the Environment, Heritage and Local Government, 2006, www.environ.ie).
7.5 Rent control, tenant security and other property rights
7.5.1 Differential rents
Rent setting and security of tenure provisions vary markedly between the so-cial and market rented sectors, and within the social rented sector between local authorities and housing associations. Security of tenure is in practice strong in the social sector and rather weaker in the market sector. The in-come-related and controlled rents in the social sector contrast with the free market rents in the market sector.
Income-related local authority rents were introduced on a nationwide ba-sis in 1976. Prior to this, rents had been based on the costs of maintenance
[ 186 ]

and management. Until 1986, central government specified the method of rent setting. The consequent over-politicisation of rents from a central gov-ernment perspective led to decisions being delegated to local authorities, sub-ject to central government guidance (Coates & Norris, 2006). The most recent guidance states that:
■ rent payable should be related to income; ■ allowances should be made for dependent children; ■ a contribution towards rent should be required from subsidiary earners; ■ the adequacy of rental income to meet the cost of managing and maintain-
ing the housing stock should be taken into account; ■ the use of banded income categories and applicable rent fractions, which
creates the potential for poverty traps as well as high marginal rates of rent, should be phased out;
■ no more than 15% of any increase in old age pensions should be absorbed in rent;
■ local authorities should be mindful of policies adopted by adjacent author-ities when devising and implementing rent schemes (Department of Envi-ronment, Heritage and Local Government, 2002c).
These are only guidelines and in practice local authorities use a variety of methods to set rents. In 2005, there were seventy-six separate schemes in op-eration with local authorities interpreting the guidelines in a variety of ways. They all use a five-stage process but the implementation varied considerably between authorities. The stages are:
■ identify the principal and subsidiary earners in the relevant household; ■ identify the household income which is taken into account for the purpos-
es of rent assessment (the assessable income); ■ employ whatever formula is used by the local authority to calculate the
amount of this assessable income that should be paid in rent; ■ make any deductions from the rent for special cases, such as to take ac-
count of dependent children; ■ raise or lower this rent as appropriate if it falls below the minimum or
maximum rent stipulated by the local authority (Coates & Norris, 2006).
Coates & Norris (2006) state that in practice an outcome of the variations is that households with similar incomes can pay very different amounts in rent depending on where they live. Overall income-related, or differential, rents re-sult in local authority housing being broadly affordable. However, differential rents fail to create sufficient revenue for local authorities to cover the costs of management and maintenance. According to Coates & Norris (2006), the lack of connection between rent collected and housing expenditure by local au-thorities means that there are no incentives to achieve value for money and a combination of reforms to rent setting and increases in central government
[ 187 ]

funding are needed to ensure adequate management and maintenance fund-ing.
7.5.2 Housing association rents
Housing association accommodation supported by the Capital Loan and Sub-sidy Scheme (see Section 7.8.1) is subject to a similar rent-setting regime as that used by local authorities. Differential, income-related rents, are applied. Associations additionally receive annual management and maintenance al-lowances to help cover ongoing costs. For accommodation provided under the Capital Assistance Scheme, associations have to apply rents that take into ac-count tenants’ incomes and the cost of providing and maintaining the dwell-ings. Additionally, rent supplements can be paid to tenants who satisfy the means test applied by the Health Executive. These supplements are, however, subject to a limit that is much lower than that applied to private sector rents.
7.5.3 Market sector rents
The Residential Tenancies Act of 2004 allows all market sector rents to be de-termined freely by landlords and tenants. It states that the rent may not be greater than the open market rent and may be reviewed (upward or down-ward) only once a year unless there has been a substantial change in the na-ture of the accommodation. Tenants have to be given 28 days’ notice of new rents. Disputes about rents are to be referred to the Private Rental Tenancies Board. The Act defines market rents as follows: “‘Market rent’, in relation to the tenancy of a dwelling, means the rent which a willing tenant not already in occupation would give and a willing landlord would take for the dwelling, in each case on the basis of vacant possession being given, and having regard to (a) the other terms of the tenancy, and (b) the letting values of dwellings of a similar size, type and character to the dwelling and situated in a compara-ble area to that in which it is situated” (Private Residential Tenancies Act 2004, paragraph 24, House of the Oireachtas (Parliament) www.oireachtas.ie).
Where market sector landlords supply accommodation under the Rental Accommodation Scheme, the provisions of the 2004 Act apply but the rents are paid by the local authority according to the contract they have agreed with the landlord. Tenants then make payments to the local authority in line with the criteria in the differential rents scheme.
7.5.4 Rent levels
Rent levels are higher in the market rented sector than in the social rented sector (Table 7.6), with local authority rents much lower due to a combination of income-related rents and the low incomes of council tenants. High rents
[ 188 ]

in the market sector and high proportions of incomes devoted to rent, even after state as-sistance, when this is available, suggest that affordability problems are concentrated in market renting rather than in other sectors (Redmond & Norris, 2007, p. 123).
7.5.5 Security of tenure in the social rented sector
Legally, a local authority in Ireland can evict tenants without any reason as long as the correct procedure is followed. This means first issuing a ‘notice to quit’ and then applying to court for an order. However, in practice, local au-thorities in Ireland do not evict their tenants without reason and if they pay the rent and comply with the other conditions of the tenancy, they will nor-mally be able to stay as long as they want. In practice most evictions are for serous anti-social behaviour. Tenants are rarely evicted for rent arrears.
7.5.6 Security of tenure in the market rented sector
Market rented tenants have in the main had minimal security of tenure in Ireland, although the Residential Tenancies Act 2004 introduced some funda-mental reforms. Galligan argues that “Historically, lack of security of tenure was the greatest single reason preventing many households from viewing the market rented sector as a desirable form of housing tenure” (ibid., 2005 p. 109). Until 2004 there was a distinction, however, between the formerly rent-controlled sector where existing tenants continued to have security under the 1982 Housing Act and tenants in the remaining uncontrolled sector. The posi-tion has been modified by the 2004 legislation that bases security of tenure on four-year cycles from when the new law took effect (September 2004). Tenan-cies in existence on 1 September 2004 became ‘Part 4 tenancies’ on 1 March 2005 unless a valid Notice of Termination was served before that date. Part 4 tenancies can only be terminated by the landlord on specified grounds (in accordance with the Act) and by either party by Notice of Termination under the Act. Unless terminated, they last for four years from their commencement date or from 1 September 2004, whichever is later. The notice period required to terminate a tenancy depends on the length of the tenancy and varies, if the landlord gives notice, from 35 days for tenancies of less than a year to 112 days for tenancies of more than four years. If the tenant gives notice, the notice period varies from 35 to 56 days. If a fixed-term tenancy is due to ex-pire during the existence of a Part 4 tenancy and the tenant intends to re-main in occupation, the tenant must, during the 2nd last or 3rd last month of the fixed term, notify the landlord of that intention to continue the tenancy (Citizens Information Ireland: www.citizensinformation.ie). The landlord can
[ 189 ]
Table 7.6 Average weekly rents in euros, Ireland, 2006
Average weekly rent
Rented from a local authority 58.64
Rented from a voluntary body 158.63
Market rented unfurnished 161.48
Market rented furnished or part furnished 191.09
Source: Central Statistics Office (2007) Ireland Census 2006, see http://www.ie/census
terminate the tenancy without specifying grounds during the first six months but once a tenancy has run for six months the tenancy can only be termi-nated by the landlord if:
■ the tenant does not comply with the obligations of the tenancy; ■ the dwelling is no longer suited to the occupant’s accommodation needs
(e.g. overcrowded); ■ the landlord intends to sell the dwelling in the next three months; ■ the landlord requires the dwelling for own or family member occupation; ■ the landlord intends to refurbish the dwelling; ■ the landlord intends to change the business use of the dwelling.
This is claimed by the government to improve tenants’ security of tenure but when the conditions for ending the tenancy include the landlord requir-ing the accommodation for their family and an intention to refurbish, sell or change the use of a dwelling, the reality might well be that security is still significantly constrained.
Tenants do not need to give a reason for terminating their tenancy (Resi-dential Tenancies Act 2004: A quick guide, Department of Environment, Heri-tage and Local Government).
7.5.7 Right to buy
Unlike in the market sector, there is a right to buy in the social sector. The Tenant Purchase Scheme that added incentives to a right to buy that had existed since 1919 was introduced into rural areas in 1936 and urban areas in 1966. Further incentives boosted the popularity of the tenant purchase schemes in the 1960s and since 1973 tenants have been given discounts on the purchase price of 3% for each year of residence up to a maximum of 30% in urban areas and 45% in rural areas. Given that the acquisition cost was related to construction costs rather than market value, that first time buyers could get extra support and that local authority loans were available for 100 of the cost at a fixed rate over 30 years, it has been suggested that for many tenants “the actual cost of acquiring a dwelling was often 50% or more below market value” (O’Connell, 2005, p. 31).
When house prices fell in the 1980s, the acquisition values and discounts were changed so that they related to house prices, thereby maintaining the attractiveness of the scheme. The average value of discounts on the market value of dwellings sold under the tenant purchase scheme in Dublin in 1989 were estimated to range between 56% and 65% (study by Dublin Corporation, 1993, quoted in O’Connell, 2005, p. 33). Sales to tenants have fallen in recent years as all but the worst stock has been sold off and the sector has become increasingly residualised.
[ 190 ]

7.6 Allocation procedures and criteria
7.6.1 Local authority allocation
Local authority rented housing is allocated by local authorities and they de-cide which households are eligible; central government (the Department of the Environment, Heritage and Local Government) has no say in the matter of individual housing allocation. Central government does however lay down the statutory framework within which social housing has to be allocated in Sec-tion 11 of the 1988 Housing Act (Government of Ireland, 1988). This lays down that each local authority must draw up a ‘scheme of letting priorities’ setting out what rules apply when allocating social housing. The scheme is drawn up by the elected members of the local authority and must be approved by the Minister. The Minister will only approve it if it adequately meets the needs of certain vulnerable groups as specified in Section 9 (2) of the 1988 Housing Act (see next section).
7.6.2 The target group of the social rented sector
The vulnerable groups as specified in Section 9 (2) of the 1988 Housing Act are:
■ the homeless; ■ travellers (travelling households, often owning a mobile home); ■ households living in homes that are unfit for human habitation; ■ households in overcrowded accommodation; ■ people sharing accommodation with other people who urgently need sep-
arate accommodation (as decided by the local authorities, based on guide-lines issued by the Minister);
■ young people leaving institutional care or unable for whatever reason to live with their families;
■ people in need of accommodation for medical or social reasons; ■ the elderly; ■ the disabled; and ■ people who cannot afford to live in their current homes and do not have
the means to obtain suitable alternative accommodation (as decided by the local authorities, based on guidelines issued by the Ministry).
When it comes to allocating social housing it is the local authorities that have primary responsibility for the vulnerable groups already living in their areas, but they can, if they wish, take vulnerable groups living outside their areas into account when assessing the demand for social housing (1988 Housing Act, Section 9 (5)). To what extent they actually do this is up to the authori-ties themselves, although central government guidelines advise them not to
[ 191 ]

exclude households from their calculations on the grounds that they have not lived in the area for long enough. Authorities were also advised that appli-cants should not be excluded from the assessment solely on account of their marital status, age or failing to satisfy a requirement to have resided in a par-ticular area for a specified period of time, or on the grounds that the authority does not have suitable accommodation to cater for them (Department of En-vironment, Heritage and Local Government, 2002b).
7.6.3 Priority criteria
Local authorities are required to carry out an assessment every three years to ascertain the size of each of these vulnerable groups, so that they know what the total demand for social rented housing in their local planning area is (De-partment of Environment, Heritage and Local Government, 2002a). House-holds assessed as in need of a social rented dwelling are then automatically placed on the waiting list. In effect, then, this is a periodic review of new and existing social housing applicants so as to enable waiting lists to be updat-ed. Between 2003 and 2005, net housing need in Ireland declined by 10% with significant falls in needs due to unfit accommodation and overcrowding and rises because of requirements for housing for disabled people and affordabil-ity problems (Local Authority Assessment of Social Housing Needs, 2005, on Housing Statistics Database, www.environ.ie).
The local authorities can decide themselves what priority to give to each of the groups mentioned above in the scheme of letting priorities, but the Min-istry guidelines state that they should endeavour (a) to be fair (a social rented home coming vacant should as a rule be let to the household with the most urgent need) and (b) to give the various vulnerable groups equality of oppor-tunity in accessing local authority housing. Households accepted by the lo-cal authorities as eligible for a social rented home are placed on the waiting list. Each household on the list has a priority rating depending on personal circumstances. Priority is assigned on a points-based system, with points being awarded for the various personal circumstances. The household with the highest number of points is placed at the top of the list. Positions on the waiting list are therefore not static: any changes in households’ personal cir-cumstances result in the list being reordered (Department of Environment, Heritage and Local Government, 2001). Also, some local authorities keep sepa-rate waiting lists for different types of housing or parts of their area. Once a household is at the top of the list, it is offered the next social rented home that falls vacant, and it may only refuse this with good reason for doing so. If a household refuses a home without good reason, it may be placed lower down on the list.
[ 192 ]
7.6.4 Housing association allocation
Under the Capital Assistance Scheme, housing associations allocate tenancies in consultation with the local authorities on the basis of the following crite-ria:
■ up to 75% of the tenancy allocations can be made to persons who are eli-gible for local authority housing, of which local authorities can nominate up to 25%;
■ 25% of tenancy allocations are made at the discretion of the housing as-sociation. This can allow flexibility within a housing project in order to accommodate those persons who may not qualify for the local authority waiting list but would be in need of housing.
Allocations made by housing associations under the Capital Loan and Rent-al Subsidy System must be made to approved applicants for local authority housing. The income limit for eligibility for tenancies in accommodation pro-vided under the Rental subsidy Scheme was removed in 2001 (previously, an income limit of £12,000 applied to 75% of applicants for tenancies in a proj-ect). While no income limit applies, all households must qualify for local au-thority housing.
7.6.5 Market rental allocation
The allocation of most market rental housing is carried out according to mar-ket based demand and supply criteria. However, housing supplied under the Rental Accommodation Scheme is allocated to long-term Supplementary Wel-fare Allowance Rent Supplement recipients on the basis of need (see Section 7.8.5).
7.7 Regulation and supervision
7.7.1 Regulating social housing
The regulatory regimes for social and market rented housing are quite sepa-rate. The Plan for Social Housing raised a series of concerns about the qual-ity of housing services provided by local authorities and argued that improve-ments were necessary to protect future public investment. A more detailed analysis of the standards in local authority housing management performed by the Department of the Environment, Heritage and Local Government in 1993 raised further concerns, including a lack of adequate long-term plan-ning, insufficient management information and monitoring, and insufficient concern with value for money. Central government subsequently introduced
[ 193 ]

a number of actions that have been categorised as ‘enabling’ measures and ‘enforcement’ measures (Norris, 2005, p. 178). The enabling measures included the funding of projects to improve management efficiency and the establish-ment of the Housing Unit in 1998 (which became the Centre for Housing Re-search in 2006) to provide housing management advice and training. Enforce-ment measures have, since 2000, included instructions to local authorities to monitor performance and publish reports on the outcomes. Government has furthermore made funding conditional on detailed monitoring and evalu-ation. The amount of regulatory legislation is small and central government circulars on social housing only have advisory status so that, legally, local au-thorities can ignore them.
In order to be eligible for the receipt of public funds non-profit voluntary housing associations have to be approved by central government (or this ap-proval power can be delegated to local government). Housing association de-velopments must have the support of the local authority. It would appear that the overall regulation and supervision of the housing association sector is rel-atively light and it has been stated that “the Department of the Environment, Heritage and Local Government’s data collection appears to focus on account-ing for funding disbursed under the voluntary housing schemes, rather than on the collection of information that would be necessary to inform any moni-toring or evaluation for housing management performance” (Brooke & Clay-ton, 2005 p. 215).
7.7.2 Regulating market sector rental housing
In the market rented sector it has been claimed that “The effective regulation of standards has remained largely a foreign practice, despite the introduction of mandatory rent books, minimum notice to quit (one month) and minimum standards of accommodation in 1992. The problem lies in part in a failure to enforce these regulations and in part in a high level of non-compliance with the registration on the part of landlords” (Punch, 2005, p. 126). A degree of reg-ulation exists through the private Residential Tenancies Board that was es-tablished in 2001 but not placed on a statutory footing until 2004. The board deals with landlord and tenant disputes and the registration of landlords, which had previously been the responsibility of local authorities. It is expect-ed that the Board will effectively enforce registration that has previously been poor (Galligan, 2005, p. 117). Rented housing should comply with certain mini-mum physical standards that are supposed to be enforced by local authorities. However, Buchanan (2006) argues that the minimum standards for market rented housing introduced in 1993 are inadequate on several counts includ-ing heating and fire safety standards. But even these regulations, it is claimed, are not properly enforced and there is therefore a good deal of sub-standard accommodation in the sector. Current regulatory practices in the sector are
[ 194 ]

deemed to be poor and new mandatory certification with proper enforcement is, it is argued, essential.
7.8 Subsidies and finance
7.8.1 Support for social-sector investment
Housing production generally has been heavily subsidised in Ireland. However, social-sector house building has been and is subsidised much more heavily and explicitly than building for market renting. “Between 94 and 100 percent of the construction costs of social housing schemes in Ireland are funded di-rectly by central government, as are the costs associated with land acquisition in the case of the local authorities.” It is, however, argued that “the relative generosity of capital funding for social housing building in Ireland is coun-terbalanced by a shortage of revenue funding” (Norris, 2005, pp. 181-182). Ow-ing partly to the concentration of low-income groups, only 75% of running costs on average are covered by revenue from letting (Annual Statistics Bul-letin, Department of the Environment, Heritage and Local Government, vari-ous years). The remainder has to be funded by the local authorities, which re-ceive a grant for this purpose from central government as part of their general budget (Ditch et al. 2001). Local authority housing has been supported by the direct provision of funds from central government, and voluntary and coop-erative housing has been supported, as explained above, by the Capital Assis-tance Scheme and the Capital Loan and Subsidy Scheme, which also provide direct funding from central government. This support for house building has helped to promote high rates of construction. The relative shortage of funding for revenue support has however raised questions about the need to improve the quality of the stock and to raise standards of housing management (Nor-ris, ibid). Cross-subsidies for social housing are also provided through the Part V Housing and Development Act (2000), whereby developers support provision as a condition of planning permission. Up to 20% of dwellings or sites are to be transferred to local authorities or equivalent financial compensation is to be paid (Government of Ireland, 2000; Redmond & Norris, 2007, pp. 126-127).
7.8.2 Support for market rental investment
There has been little direct government support for market rented provision: “Apart from the mortgage tax relief available to all house purchasers (owner occupiers as well as landlords), no financial measures were taken to increase the supply of private rented housing for most of the twentieth century” (Galli-gan, 2005, p. 106). Tax incentives for new build and refurbishment introduced in 1981 had very little effect until they were combined with urban renewal
[ 195 ]

schemes in 1986. After 1986, the incentives became more generous and more geographically focussed. The tax relief took the form of a deduction of part of the cost of capital expenditures from rental income. The allowance, which reduced landlords’ tax bills, was conditional on the property being rented for ten years from the first letting. A generic reduction in the rate of capital gains tax from 40% to 20% in 1997 indirectly made market renting a more attrac-tive investment. Output increased following these incentives. Their effect may have been large, but their impact is debatable. It has been suggested that high rates of house-price inflation and low interest rates were more important, in combination with the buoyant demand from a growing economy, in boosting investment in recent years than fiscal incentives (Galligan, 2005, p. 108). How-ever, it has also been claimed that the reinstatement of interest tax relief in the 2002 Finance Act together with the tax deductibility of expenditures on fixtures and fittings and other costs “makes this form of investment very at-tractive for potential investors” (MacLaran & Williams, 2005, p. 159). Equally, it does seem that although it can be argued that in the twenty-first century the fiscal system has been changed in the landlords’ favour, in reversing some previous anomalies the changes amount to little more than putting market renting on a level playing field with other forms of investment.
7.8.3 Tax relief on market rents
In addition to tax relief being available for homeowners on their mortgage interest, tax relief is available for tenants on the rent they pay. The maximum amounts of tax relief at the standard rate of 20% on market rented accommo-dation that were available in 2006 are shown in Table 7.7.
The tax allowance amounts shown above, at the standard rate of income tax of 20%, for people under 55, equate to a tax credit of €330 per annum for single persons and €660 per annum for widowed persons and married cou-ples. For those over 55 years, this equates to a tax credit of €660 per annum for a single person and €1,320 for widowed and married persons.
7.8.4 Rent supplements
There is no overarching housing allowance scheme, but rather separate means of alleviating the burden of housing costs in each sector. Income-based rents are used to assist households in the local authority sector whilst the rent supplement component of the Supplementary Welfare Allowance (SWA) and the Rental Accommodation Scheme (RAS) provide income-related assis-tance to other tenants. Each local authority operates its own system of differ-ential rents with its own rules and values. An effect of income-related rents is that the proportion of household expenditure devoted to rent is low. Market tenants on low incomes who are assisted by the rent supplements that are
[ 196 ]

payable under the SWA scheme must first establish a tenancy. There is evi-dence, however, that a large proportion of households experience difficulty in finding a landlord who will accept SWA (Punch, 2005, p. 135).
Rent Supplement is administered by the Health Services Executive and paid to people living in market residential accommodation who cannot pro-vide for the cost of their accommodation from their own resources. Prior to 1 February 2005 there was a requirement that applicants had to be renting for six months in the preceding twelve months to qualify for Rent Supplement. This requirement has been discontinued. From 1 February 2005 applicants must currently be renting accommodation, they must have been able to afford the rent from their own resources when they started to rent and should have had a reasonable expectation that they would continue to be able to afford the rent into the future. Additionally, households deemed to be in housing need, or persons aged over 65 or in receipt of certain disability payments can be eligible. The accommodation occupied must be deemed suitable and the rent reasonable. Those in full-time employment are not eligible. The amount of Rent Supplement, calculated by the Health Service Executive Community Welfare Officer, should ensure that income, after paying rent, does not fall be-low a minimum level. Health Service Executive (HSE) area offices set a maxi-mum rent level for each area. If the actual rent is higher than the local maxi-mum, the applicant may be refused Rent Supplement entirely.
The SWA that was introduced in 1977 was intended to provide temporary income support to low-income households. However, the rent supplement component of the SWA that helped to meet housing costs (there is also a mortgage supplement for low-income homeowners) became embedded as an important source of longer-term assistance. By the late 1990s, a majority of households in receipt of rent supplement had been in the scheme for over a year and over 12% had received assistance for more than four years and data for 2003 suggests that 44% of recipients had received assistance for over a year. The SWA, although it has provided housing assistance, has been fund-ed by the Department of Social and Family Affairs and administered by local health boards. It has been criticised as a somewhat ad hoc response to hous-ing problems. The quality of accommodation has tended to be modest and disadvantaged households may have difficulty in finding a landlord who will accept them. The scheme has, however, been the only option to households in need who have been unable to access social housing especially single peo-ple. Expenditure on the SWA escalated in the 1990s and there were concerns that it was supporting low quality accommodation and giving poor value for money (Punch, 2005, p. 134-136). People in full-time employment or education are excluded from the SWA. It has supported the unemployed, people with
[ 197 ]
Table 7.7 Rental tax relief for market tenants, Ireland
AgeSingle Tax Allowance
Married/Widowed Tax Allowance
Aged under 55 years (max. relief ) € 1,650 € 3,300
Aged over 55 years (max. relief ) € 3,300 € 6,600
Source: Citizens Information Ireland: www.citizensinformation.ie

disabilities and lone parents. It has meant that “subsidised accommodation in the private rented sector has, almost by default, become a significant alter-native social housing model to direct provision by local authorities or housing associations” (Punch, 2005, p. 140).
7.8.5 Rental Accommodation Scheme
Long-term recipients of SWA are gradually being transferred to the Rental Ac-commodation Scheme (RAS) whereby they pay income-related rents similar to those paid by local authority tenants and they occupy market rented hous-ing for which the local authority has agreed long-term contracts with the landlord. The government announced this new initiative for long-term rent supplement tenants in 2004. Local authorities are now assuming responsibil-ity for meeting the needs of those who have been in receipt of SWA for 18 months or longer while the previous scheme is concentrating on shorter-term needs. The transfer of SWA recipients to the RAS is being implemented over a four-year period that began in 2005 (Department of Environment, Heritage and Local Government, 2005).
Under the RAS, local authorities set up contracts with market landlords who agree to provide accommodation that meets minimum standards. The RAS is expected to expand the amount of market rented accommodation available on a long-term basis to low-income tenants who are unable to ac-cess local authority housing. The scheme is also expected to improve the quality of the accommodation provided and increase tenant choice. Over time, local authorities are expected to build up a stock of market rented accom-modation to which they will nominate tenants. The accommodation will be available exclusively to persons in long-term housing need who have previ-ously been in receipt of SWA. The local authority makes direct payments to the provider and the tenant makes a contribution to the costs by a payment to the local authority. The level of contribution is linked to the Differential Rents Scheme (see Section 7.7.1) for local authority housing for households in similar circumstances.
The Rental Accommodation Scheme provides a bridge between the social and market rental sectors and effectively means that the market rented sector is being used for a social purpose and is directly contributing to meeting the needs of households who cannot afford market rents. The scheme provides a practical example of what Maclennan & More (1997) term a ‘state agent’ model of social housing provision. They suggest that within such a model the production and pricing of homes would be left to market producers and the ‘state agent’ would be responsible for securing market vacancies of an accept-able standard. This is the intention of the Rental Accommodation Scheme, with tenants coming from rent supplement transfers rather than a waiting list. Maclennan and More saw potential benefits in such a system with it gen-
[ 198 ]

erating market incentives and providing for the efficient targeting of subsidies. One potential problem acknowledged was that market owners may extract scarcity rents but, it was suggested, the bargaining power of the ‘state agent’ might ameliorate this. Alternatively, they suggested the ‘state agent’ and the
‘not-for-profit’ models could be combined so that the ‘state agent’ was able to allocate tenancies and make contracts with not-for-profit providers and market-sector providers. This competitive situation with market and not-for-profit providers vying for contracts from the ‘state agent’ could, it was sug-gested, provide efficiency incentives. However they noted that “no European country operates this system at present” (Maclennan & More, ibid). As Ireland expands the Rental Accommodation Scheme to embrace voluntary housing associations as well as market landlords, there is at least one country that is now operating such as system.
As yet the Rental Accommodation Scheme remains on a relatively small scale and it is still in the process of being implemented. It is however clear that this process of using the market sector to supply social housing has a growing and important part to play in the government’s policy plans. Looking to the future expansion of social provision, the government plans to use local authority, housing association and market-sector provision. It has stated that there are intentions to “Commence approximately 23,000 new social hous-ing units between 2006 and 2008 in the local authority and voluntary and co-operative housing sector…(and) Additional investment over the period 2007-2009…for the commencement/acquisition of an additional 4,000 new housing units through a combination of local authority (2,000), voluntary and co-oper-ative housing (1,000) and the Rental Accommodation Scheme (1,000); (and to) fully implement the Rental Accommodation Scheme by end 2008, benefiting up to 33,000 households in the market rented sector who have been in receipt of rent supplement for over 18 months” (Department of Social and Family Af-fairs, 2006, National Report for Ireland on Strategies for Social Protection and Social Cohesion 2006-8, www.welfare.ie).
Given that local authorities inspect accommodation before agreeing con-tracts under the Rental Accommodation Scheme, it is argued that it will help to ensure that a significant number of vulnerable households will eventually have dwellings that at least meet the minimum statutory standards. However, the actual pace of implementation of the Rental Accommodation Scheme is slow. About 60% of the 60,000 rent supplement recipients are estimated to be eligible for the RAS but from 2005 to April 2006 only 44 tenancies had actually been transferred to the RAS (Buchanan, 2006).
[ 199 ]

7.9 Bridging the gap between social and market renting?
The gap in who provides whatHistorically there has been a quite clear division in Ireland between the own-ership, regulation, financing, occupancy and functions of the social and mar-ket rented sectors. This is in a policy context where government has actively promoted home ownership for all income levels. In recent years there has been particular emphasis on expanding home ownership amongst lower-in-come households and owner occupation, at around 75% of all households, is amongst the highest in Europe.
The ownership of social and market rented housing is entirely separate. Social rented housing is mainly owned and managed by local authorities with housing associations responsible for only around 1% of the total hous-ing stock. The market rented stock is owned and managed mainly by private individuals often on a ‘part-time’ basis with the owners having other employ-ment (Table 7.8).
There are marked differences in the overall quality of accommodation be-tween the social and market sectors with the average physical standards of dwellings and the quality of neighbourhoods lower in the social sector. How-ever, the quality of the market-sector stock is quite varied with it also having a significant volume of sub-standard housing. Rents are higher in the market than in the social rented sector. The basis of rent setting is completely differ-ent in the social and market rented sectors with rents being set according to the differential rents system that takes account of incomes in the former and by market forces in the latter. Market-sector tenants, who have previously been in receipt of rent supplements, and are housed long term as households in need under the Rental Accommodation Scheme, pay income related rents to the local authority but landlords receive market rents as direct contractual payments from the local authority.
Social-sector tenants have strong security of tenure and as long as they keep to the terms of their rental contract are likely to be able to stay in their accommodation for as long as they wish. The relatively weak security of ten-ure for market tenants has been changed by the 2004 Residential Tenancies Act. Under the new arrangements, once a tenant’s contract has run for six months they effectively have a contract that can run for a further three and a half years. However, the landlord can gain vacant possession if, for example, the accommodation is required for the landlord’s family or the dwelling is to be refurbished or sold.
The gap in government policies and outcomesIn the light of the encouragement of home ownership by government, it can be argued that rented housing generally has been a tenure of last resort.
[ 200 ]

However, the occupancy of social and market rented housing has become more polarised in recent years with incomes far lower and benefit depen-dency far higher in the social than the market rented sector (Table 7.9). De-spite the higher average incomes in the market sector, there is the prospect of the composition of the sector changing with both an increase in the numbers of higher-income households in the sector and an increase in the volume of lower-income households. The number of higher-income households attract-ed to the sector has risen as prosperity has increased because house prices rose and there was a limited supply of suitable alternatives in the 1990s. This helped boost the demand and ultimately the supply of market rented hous-ing. The new role for the market sector under the post-2005 Rental Accom-modation Scheme may have the effect of increasing the function of the sector as a supplier of housing for welfare-dependent households if the new con-tracts with local authorities prove to be sufficiently attractive. This Rental Accommodation Scheme is a distinctive feature of the Irish housing system and is the key factor in blurring the boundary between the otherwise clearly demarcated social and market sectors. Allocation in the social rented sector is according to need, as determined in detail at the local level under nation-al guidelines. In most of the market rented sector, allocation is according to market forces. However, the Rental Accommodation Scheme constitutes an exception. Here, allocation is according to need with the tenants allocated by local authorities under their contracts with landlords.
The regulation of local authority housing by central government has been sharpened since 2000 following concerns about the quality of services offered to tenants. Except for the process of approval by central or local government, which is necessary for the receipt of public funds, it would appear that the regulation and supervision of housing associations is relatively light. In the market residential sector, local authorities are responsible for physical stan-dards. Furthermore, since 2004 the requirement that market landlords register
[ 201 ]
Table 7.8 The gap between social renting and market renting in who provides what in Ireland
Social renting Market renting
Landlord
Types Local authorities and voluntary and cooperative bodies
Mainly private individuals but also, companies and other organisations
Motives of landlords
Non-profit, meeting tenants’ needs Financial returns
Accommodation
Quality of products on offer
Lower quality in local authority housing
Higher quality on average in market rented housing
Rent levels Lower, income related, rents Higher, market, rents
Property rights
Security of tenure Strong Relatively weak
Rent surcharge Increases with incomes Increases according to market conditions
Right to buy Available to local authority tenants Does not apply

with the central Private Tenancies Board together with the dispute resolution function of this board have introduced a new measure of regulation. There are, however, doubts about the effectiveness of this regulation, and concerns about low-quality housing have been expressed by Threshold, a non-profit housing advice, research and lobbying organisation that focuses on needs in the market rental sector (see Buchanan, 2006).
Subsidies to encourage production in the social sector have been effec-tive in promoting both local authority and housing association construction and the government is committed to increasing levels of output, with hous-ing associations responsible for a rising share of completions. The difference between social-sector rental income and current costs is funded by local au-thorities and in turn supported by central government grants. The support for market-sector house building has been almost wholly concentrated on the
[ 202 ]
Table 7.9 The gap between social renting and market renting in policy and policy instruments in Ireland
Social renting Market renting
Purpose of housing sector
Safety net for low-income households Diverse; meeting demands of several household types
Allocation procedures According to needs. National guidelines – local implementation
Mainly free market but under the Rental Accommodation Scheme from 2005 some market housing allocated on a needs basis as a new form of “social housing”
Rent control
New contracts Rents set according to incomes Market rents
Rent adjustments Rents rises related to incomes Annually according to market conditions
Regulation and supervision
Oversight by Department of Environment, Heritage and Local Government
Regulation by local authorities and through registration with the Residential Tenancies Board
Government support
Bricks-and-mortar support
Available Not available
Tax concession for landlord
Tax concessions related to local government and voluntary body status of the main providers
Selective fiscal incentives available
Housing allowances No housing allowances – instead rents that vary with income
Rent supplements and income related rents via the Rental Accommodation SchemeTax concessions for rental payments
Outcomes
Socio-economic characteristics of tenants
Low incomes; high benefitdependency
Mean incomes more than twice those in social sectorLower benefit dependency
Movement between tenures
No evidence of any significant movement between tenures
Competition
Substitutability Low level of substitutability
Rivalry Low level of rivalry

provision of housing for home ownership including schemes to promote the supply of new affordable dwellings for owner occupation or shared ownership targeted at lower-income households. Market rented housing has, by compar-ison, received little in the way of direct supply-side incentives, although tax concessions have in recent years enhanced the attractiveness of investment in the sector.
There is no generic system of housing allowances in Ireland. Social-sec-tor tenants and lower-income market-sector tenants are, instead, helped with their housing costs by two separate routes. Social-sector tenants pay income-related rents under locally determined differential rent schemes. These schemes relate rent payments to incomes and household size and, un-der centralised guidelines, should ensure that a smaller proportion of income is required in rent from lower-income households than from higher-income households. From the tenants’ viewpoint, they should therefore have much the same impact as a housing allowance. Rent supplements are a form of housing allowance administered as part of the household welfare system for market-sector tenants. The eligibility criteria are narrow with those in full-time work excluded. Long-term recipients of rent supplement are being trans-ferred to the Rental Accommodation Scheme and will occupy market housing but pay income-related rents similar those applicable to local authority ten-ants in equivalent personal circumstances.
With the exception of the consequences of the Rental Accommodation Scheme, the policy outcome in terms of the socio-economic characteristics of tenants is a marked contrast between the low-income households in the social sector and the higher-income households in the market sector. Similar-ly, the as yet small-scale Rental Accommodation Scheme constitutes a slight change to the picture of very little movement between the sectors.
The competitive gapNeither market nor social tenants are in general likely to view accommoda-tion in the other sector as a possible substitute for their accommodation. Sig-nificant differences in rent and income levels, with both being much lower in the social sector, suggest a picture of different customers for different prod-ucts. Likewise, social and market landlords are for the most part unlikely to view each other as rivals as they will be catering for different needs and de-mands and providing different types of accommodation. The combination of low substitutability and low rivalry suggests a large competitive gap. The combination of low substitutability and low rivalry suggest a large competi-tive gap.
Bridging the gap?One aspect of events in Ireland should lead us to moderate these conclusions about low levels of substitutability and rivalry just a little. That is the devel-
[ 203 ]

opment of the Rental Accommodation Scheme, whereby the market sector is being asked to accommodate some households who might otherwise be in dwellings provided by local authorities or housing associations or, more prob-ably, who would have remained in the market sector supported by income as-sistance. From the supply side, this policy initiative is, in very limited circum-stances, creating rivalry between market and social landlords for the award of Rental Accommodation Scheme contracts.
In Ireland the rather large gap between the social and market rented hous-ing sectors may be closing just a little.
Country experts
Michelle Norris, University College Dublin.
Mary Lee Rhodes, Trinity College Dublin.
[ 204 ]

8 The Netherlands
8.1 Introduction
The Netherlands is a constitutional monarchy with a bicameral parliamenta-ry system. There are three tiers of government: the national government, the provinces and the municipalities. In 2008, the Netherlands had 12 provinces and 443 municipalities. The number of municipalities has been halved since the 1950s as a result of mergers. The aim of these mergers was scaling-up for efficiency reasons.
Dutch governments have been intervening in the housing market ever since the Housing Act first came into effect in 1901. This intervention in-creased in the post-war period when the already urgent housing shortage caused by World War II was exacerbated by rapid – by Western European stan-dards – population growth and the move away from communal family living arrangements. The result was a housing policy which accorded high (political) priority to the construction of new dwellings (Van der Heijden et al., 2002).
The government decided to speed up the rate of construction by introduc-ing bricks-and-mortar subsidies. Through its spatial planning policy and the bricks-and-mortar subsidies, it was able to exercise a strong influence on the location, quality and quantity of newly built dwellings. As the shortage was eased by a strong and prolonged concentration on the production of social rented housing, the social rented sector came to play an important role on the Dutch housing market.
Since the late 1970s a process of decentralisation has been underway. Now-adays, housing is seen less as a task of government and more a task to be carried out at the regional and local levels, with municipalities, housing as-sociations, residents and other market parties as the main players. The cen-tral government faded further into the background in the 1990s, when the bricks-and-mortar subsidies were scrapped. Crucial subsidy instruments still determined at the national level are the income-based housing allowance and mortgage relief for homeowners (Elsinga et al., 2007b). In addition to these subsidy instruments, central government also influences housing directly or indirectly in various other ways, such as spatial planning, land policy, regula-tion and supervision of housing associations, rent policy and urban renewal.
8.2 Housing stock
8.2.1 Definition of the social rented and the market rented sector
There are two categories of rented dwellings in the Netherlands: commercial (market) and non-profit. The non-profit rented dwellings fall within the so-cial rented sector and are run mainly by housing associations in the form of
[ 205 ]

private foundations or associations (Elsinga et al., 2007b). The core mission of the housing associations is to provide housing for low-income households, but many housing associations in the Netherlands do much more besides. For example, they may rent dwellings to middle-income and higher-income groups and/or develop owner-occupier dwellings. Many are also active in ur-ban renewal (Elsinga et al., 2007c). In the market rented sector, dwellings are let on a commercial basis. This sector consists of private organisations – usu-ally institutional investors – and private individuals. Market rented dwellings are often managed by estate agents.
It is important to note the difference between social and market land-lords on the one hand, and the difference between regulated and unregulat-ed dwellings on the other. The first difference concerns the type of landlord. Whereas the principal objective of a social landlord is to provide social hous-ing, the principal objective of a market landlord is to make a profit. The sec-ond difference concerns rent regulation. Whereas a regulated dwelling falls within the rent regulation regime and is subject to a limit and a maximum annual increase, a deregulated dwelling falls outside the rent regulation re-gime because the monthly rent exceeds a certain limit. There are regulated and deregulated dwellings in both the social rented sector (owned by housing associations) and the market rented sector (Elsinga et al., 2007b). About 95% of the total (social and market) rented stock is regulated. Most of the unregu-lated dwellings are owned by commercial landlords.
8.2.2 Description of the housing stock
Alongside social and market rented housing, owner occupied housing is the third tenure category within the Dutch housing stock. Table 8.1 shows the de-velopments in these categories during the period 1947-2006.
Social rented dwellings in the Netherlands are owned by housing associa-tions, which are private non-profit organisations. Many housing associations date back to the start of the twentieth century or even the second half of the nineteenth century (Prak & Priemus, 1992). Before the 1990s, there were many municipal housing companies. Almost all these housing companies have been converted into housing associations (Ouwehand & Van Daalen, 2002). Expansions through mergers have led to a fall in the number of housing asso-ciations in recent years. In 1998, 791 housing associations were active in the Netherlands. That number dropped to 492 in the period 1998-2005 (CFV, 2007; Ministerie van VROM, 2004). Initially, housing associations operated mainly at a local level, but since the mergers, they have increasingly begun to operate at regional and even national level. Many are members of Aedes, the umbrella organisation for Dutch housing associations.
After World War II, housing policy in the Netherlands was geared primarily to the construction of social rented housing co-funded by bricks-and-mortar
[ 206 ]
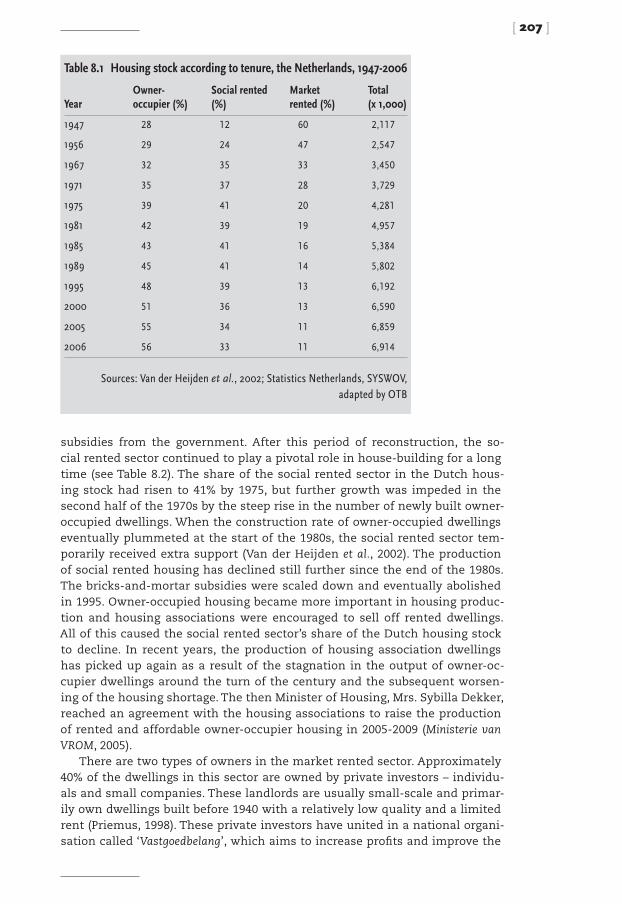
subsidies from the government. After this period of reconstruction, the so-cial rented sector continued to play a pivotal role in house-building for a long time (see Table 8.2). The share of the social rented sector in the Dutch hous-ing stock had risen to 41% by 1975, but further growth was impeded in the second half of the 1970s by the steep rise in the number of newly built owner-occupied dwellings. When the construction rate of owner-occupied dwellings eventually plummeted at the start of the 1980s, the social rented sector tem-porarily received extra support (Van der Heijden et al., 2002). The production of social rented housing has declined still further since the end of the 1980s. The bricks-and-mortar subsidies were scaled down and eventually abolished in 1995. Owner-occupied housing became more important in housing produc-tion and housing associations were encouraged to sell off rented dwellings. All of this caused the social rented sector’s share of the Dutch housing stock to decline. In recent years, the production of housing association dwellings has picked up again as a result of the stagnation in the output of owner-oc-cupier dwellings around the turn of the century and the subsequent worsen-ing of the housing shortage. The then Minister of Housing, Mrs. Sybilla Dekker, reached an agreement with the housing associations to raise the production of rented and affordable owner-occupier housing in 2005-2009 (Ministerie van VROM, 2005).
There are two types of owners in the market rented sector. Approximately 40% of the dwellings in this sector are owned by private investors – individu-als and small companies. These landlords are usually small-scale and primar-ily own dwellings built before 1940 with a relatively low quality and a limited rent (Priemus, 1998). These private investors have united in a national organi-sation called ‘Vastgoedbelang’, which aims to increase profits and improve the
[ 207 ]
Table 8.1 Housing stock according to tenure, the Netherlands, 1947-2006
YearOwner-occupier (%)
Social rented (%)
Market rented (%)
Total (x 1,000)
1947 28 12 60 2,117
1956 29 24 47 2,547
1967 32 35 33 3,450
1971 35 37 28 3,729
1975 39 41 20 4,281
1981 42 39 19 4,957
1985 43 41 16 5,384
1989 45 41 14 5,802
1995 48 39 13 6,192
2000 51 36 13 6,590
2005 55 34 11 6,859
2006 56 33 11 6,914
Sources: Van der Heijden et al., 2002; Statistics Netherlands, SYSWOV, adapted by OTB

calibre and reputation of landlords (Elsinga et al., 2007b).The other 60% of dwellings are owned by private institutions (Elsinga et al.,
2007b), mainly institutional investors (pension funds, insurance companies and listed investment funds). These institutional investors are usually larger in scale and primarily own dwellings built after 1960. Their dwellings are rela-tively new, expensive and generally of high quality (Priemus, 1998). Most of the institutional investors are member of the IVBN, the Association of Institu-tional Property Investors in the Netherlands. IVBN’s mission is to protect the shared interests of its members and to professionalise the sector.
The share of the market rented sector in the Dutch housing stock has de-clined steadily from 60% in 1947 to 11% in 2006 (Table 8.1), largely because of the steep fall in the number of dwellings owned by individuals. Many dwell-ings in this sector were sold to owner-occupiers or to municipalities and housing associations (Priemus, 1998).
Until the early 1980s, institutional investors built relatively large num-bers of mainly subsidised rented dwellings (for social and market renting the same subsidies were available), but the rate of construction fell sharply when the bricks-and-mortar subsidies became less attractive and were eventually phased out a few years later. Recently, there has been an upturn in the con-struction of market rented dwellings (see Table 8.2) as a percentage of total
[ 208 ]
Table 8.2 Housing production by tenure, the Netherlands, 1971-2006
Year Owner-occupied (%) Social rented (%) Market rented (%) Total
1971 37.5 36.6 25.9 136,595
1975 46.7 33.2 20.1 120,774
1980 56.1 34.2 9.7 113,756
1982 27.7 53.2 19.2 123,328
1985 44.2 35.3 20.6 98,131
1990 61.6 29.2 9.2 97,384
1995 69.0 25.3 5.7 93,836
1996 65.0 29.1 5.9 88,939
1997 72.0 21.5 6.5 92,315
1998 76.3 17.0 6.7 90,516
1999 77.5 16.0 6.4 78,626
2000 78.5 14.3 7.2 70,650
2001 80.7 13.0 6.3 72,958
2002 81.0 12.4 6.6 66,703
2003 78.2 14.4 7.3 59,629
2004 78.4 14.0 7.6 65,314
2005 74.8 16.4 8.8 67,016
2006 72.1 17.5 10.4 72,382
Source: Statistics Netherlands (CBS)
construction. This is the result of stagnation in the output of owner-occupier dwellings after 2002.
The home-ownership sector grew strongly in the 1970s and has been the largest ownership sector within the Dutch housing market since 1981 (see Table 8.1). An economic crisis in 1978-1982 brought a halt to the construction of new owner-occupied housing, but production picked up again when the economy took an upward turn a few years later (Table 8.2). In the 1990s, eco-nomic growth combined with low interest rates led to a further increase in home-ownership. However, economic growth came to a standstill once again at around the turn of the century. Consumer confidence declined, the prices of existing owner-occupied dwellings stagnated and dwellings took much lon-ger to sell. The demand for expensive owner-occupied dwellings fell sharply, hampering mobility. This in turn triggered a steep decline in the production of owner-occupied dwellings and hence in the overall production of housing in the Netherlands (Boelhouwer et al., 2006). Since 2004, there has been an upturn in the production of (owner-occupied) housing but it has not yet re-turned to pre-2000 levels.
8.2.3 Quality of the housing stock
If we look at the characteristics of the housing in the different tenure catego-ries (see Table 8.3), we observe that the largest differences are between rented dwellings and owner-occupier dwellings. Owner-occupier dwellings are larg-er, tend to have more rooms and within the owner-occupier sector there are relatively fewer apartments. However, within the rented sector there are also differences between social and market rented dwellings.
Dwellings with one or two rooms and dwellings with five or more rooms are more strongly represented in the market rented sector than in the social rented sector. The vast majority of dwellings in the social rented sector have three or four rooms. In general, the surface area of social rented dwellings is slightly lower than the surface area of market rented dwellings; almost 80% of social rented dwellings have a surface area of less than 100 m2, compared with just over 70% of market rented dwellings.
Among market rented dwellings, those built before 1945 make up the larg-est group, while the majority of social rented dwellings were built in the pe-riod 1945-1989. Finally, there are fewer apartments in the social rented sector than in the market rented sector.
Table 8.4 shows that the owner-occupied sector is over-represented in smaller municipalities, whereas both the social and the market rented sec-tors have a relatively strong position on the housing market of the largest municipalities.
There is also a clear difference in satisfaction levels between residents of the owner-occupied sector and those of the rented sector (see Table 8.5). No
[ 209 ]

less than 97% of owner-occupiers are satisfied with their dwellings, compared with 80% of tenants. The difference in satisfaction between tenants of a social rented dwelling and a market rented dwelling is negligible. However, more tenants in the social rented sector are dissatisfied with their living environ-
[ 210 ]
Table 8.3 Characteristics of the housing stock by tenure, the Netherlands, 2006
Owner-occupier Social rented Market rented
Number of rooms
1 or 2 rooms 2 17 24
3 rooms 12 30 30
4 rooms 31 39 26
5 or more rooms 55 14 20
Total 100 100 100
Surface area
≤ 60 m2 6 33 31
60 - 100 m2 23 46 40
100 - 150 m2 35 17 19
>150 m2 36 4 10
Total 100 100 100
Year of construction
Before 1945 23 11 35
1945 - 1969 20 34 24
1970 - 1989 34 41 29
1990 and later 23 14 12
Total 100 100 100
Type of dwelling
Single-family 87 46 37
Multi-family (apartments) 13 54 63
Total 100 100 100
Source: WoON 2006/OTB Research Institute for Housing, Urban and Mobility Studies
Table 8.4 Housing stock by size of municipality and tenure, the Netherlands, 2006
Size of municipality Owner-occupier Social rented Market rented Total
< 20,000 inhabitants 70 24 6 100
20,000 - 50,000 inhabitants 64 29 6 100
50,000 - 150,000 inhabitants 53 38 9 100
>150,000 inhabitants 38 47 15 100
Source: WoON 2006/OTB Research Institute for Housing, Urban and Mobility Studies

ment than tenants in the market rented sector.Although tenants of market rented dwellings are, on average, slightly more
satisfied with their living environment, they are more inclined to move house than tenants of social rented dwellings. Perhaps the possibility of tenants to actually move house plays a role here, especially for the relatively large group of young and single-person households in the market rented sector (see Ta-bles 8.7 and 8.8 in Section 8.3).
8.2.4 Movements between tenures
In 2005 and 2006, almost 1,130,000 households in the Netherlands moved to (other) independent accommodation. More than 240,000 of these (21%) were starters on the housing market. On a yearly basis, approximately 4.5% of all owner-occupiers moved to another independent dwelling. More than 7% of the households in the social rented sector moved house and 12% of the housholds in the market rented sector (WoON 2006, adapted by OTB). Clearly, mobility is highest among households in the market rented sector and lowest among owner-occupiers.
Starters on the housing market usually begin in the rented sector; almost 50% of new households start in a social rented dwelling and almost 20% in a market rented dwelling (Table 8.6).
The vast majority (75%) of owner-occupiers move within the sector. This also applies, albeit to a lesser extent, to tenants in social rented housing. Al-most 60% of the tenants that relocate from a social rented dwelling remain
[ 211 ]
Table 8.5 Satisfaction with current dwelling according to tenure, the Netherlands, 2006
Owner-occupier Social rented Market rented
Satisfaction with current dwelling
Satisfied 97 81 80
Neither satisfied nor dissatisfied 2 11 12
Dissatisfied 1 8 7
Total 100 100 100
Satisfaction with current living environment
Satisfied 89 78 84
Neither satisfied nor dissatisfied 7 11 10
Dissatisfied 4 11 6
Total 100 100 100
Desire to move house
None 82 71 62
Possibly 11 16 19
Definitely 7 13 19
Total 100 100 100
Source: WoON 2006/OTB Research Institute for Housing, Urban and Mobility Studies

within the social rented sector and almost one third of movers leaving a so-cial rented dwelling become owner-occupiers.
Households appear to regard the market rented sector as more of a tem-porary solution than the social rented sector. Some households in the market rented sector eventually move to the social rented sector, though a larger pro-portion moves to the owner-occupier sector.
8.3 Characteristics of tenants
As in the case of dwellings, the differences in the characteristics of tenants are greater between the owner-occupier sector and the rented sector than between the two rented sectors. This holds for household composition, age, socio-economic position and income.
Couples with and without children are over-represented in the owner-occupier sector (see Table 8.7). A relatively high percentage of single-person households and one-parent families live in a rented home. Single persons are more strongly represented in the market rented sector, whereas one-parent families usually live in the social rented sector.
Table 8.8 shows the distribution of households across the various tenure categories according to age and head of household. Young adults up to the age of 30 are over-represented in the rented sector, particularly the market rented sector. The elderly over the age of 65 are also relatively strongly repre-sented in the rented sector, but there is only a negligible difference between the social and the market rented sector.
Households with a head aged between 30 and 65 are under-represented in the rented sector. What is more, the 45-65 age group is strongly under-repre-sented in the market rented sector.
A cohort effect explains both the under-representation of the 30-65 age group and the over-representation of retired households in the rented sec-tor. The growth of home-ownership in the Netherlands really took off in the 1970s. A relatively large percentage of elderly people were unable or unwilling to make the transition.
Looking at the socio-economic position of households in the various ten-ure categories, households with no income from employment (unemployed
[ 212 ]
Table 8.6 Recently moved households (within two years) according to current and previous tenure (in percentages), the Netherlands, 2006
Previous tenure
Current tenureNot living independently (new household) Owner-occupier Social rented Market rented Total
Owner-occupier 32 75 32 38 47
Social rented 49 17 59 34 39
Market rented 19 8 8 28 14
All tenures 100 100 100 100 100
Source: WoON 2006/OTB Research Institute for Housing, Urban and Mobility Studies

and retired) are over-represented in the rented sector, particularly the social rented sector.
Table 8.10 also highlights clear differences between the income positions of the various ownership categories. The largest difference again emerges between the owner-occupied sector, where almost 75% of the households fall into the highest income group, and the rented sector, where 25% of the households fall into the highest income group.
The lower-income groups are more strongly represented in the social rent-ed sector than in the market rented sector.
Figure 8.1 shows the relationship between ownership categories and dis-posable income per income decile. The number of owner-occupied dwellings rises sharply as income increases. From the fifth decile upwards, over 50% of households are owner-occupiers. This rises to over 90% in the tenth decile.
The picture is totally different for both the social and market rented sec-tors. In addition, the social rented sector declines more steeply with a rise in disposable income than the market rented sector. In other words, the market rented sector is more evenly distributed across the income deciles than the so-cial rented sector. Even so, in all deciles except the tenth, the number of house-holds in social rented dwellings is larger than in a market rented dwelling.
[ 213 ]
Table 8.8 Housing stock according to age group (head of household) and ownership category, the Netherlands, 2006
Rented dwelling
Household type Owner-occupier Total Social rented Market rented Total
Younger than 30 6 14 12 21 10
30 - 45 34 27 26 28 31
45 - 65 43 31 33 23 37
from 65 17 29 29 28 23
Total 100 100 100 100 100
Source: WoON 2006/OTB Research Institute for Housing, Urban and Mobility Studies
Table 8.7 Housing stock according to household type and ownership category, the Netherlands, 2006
Rented dwelling
Household type Owner-occupier Total Social rented Market rented Total
Single-person household 20 49 47 55 32
Couple 35 24 24 24 30
Couple + children 41 16 17 14 30
One-parent family 4 10 11 5 7
Non-family households 1 1 1 2 1
Total 100 100 100 100 100
Source: WoON 2006/OTB Research Institute for Housing, Urban and Mobility Studies

8.4 Housing policy
8.4.1 History
In the period after World War II, housing policy focused primarily on building dwellings as rapidly as possible with the aid of government funding and bricks-and-mortar subsidies. Because of budgetary constraints, the tendency was to-wards the construction of cheap, austere dwellings in large-scale housing proj-ects. The social rented sector was regarded as more capable of executing and managing these projects than the market sector. In addition, the social rented sector offered more scope for government supervision and management.
Since the 1970s, housing policy has been targeted towards providing more of a choice for households (including low-income households) between buy-ing and renting, and by transforming the quality of both new buildings and the existing stock (urban renewal). A combined system of bricks-and-mortar subsidies and housing allowances was chosen. Bricks-and-mortar subsidies were designed to keep new social rented dwellings within reach of house-holds with (below) average incomes, while housing allowances were to widen the choice for residents with a low income.
[ 214 ]
Table 8.10 Housing stock according to income group (disposable income) and tenure, the Netherlands, 2006
Rented dwelling
Household type Owner-occupier Total Social rented Market rented Total
Less than € 12,000 4 20 20 18 11
€ 12,000 - 18,500 9 33 34 28 19
€ 18,500 - 25,000 14 22 22 21 18
More than € 25,000 73 26 24 33 52
Total 100 100 100 100 100
Source: WoON 2006/OTB Research Institute for Housing, Urban and Mobility Studies
Table 8.9 Housing stock according to socio-economic position and ownership category, the Netherlands, 2006
Rented dwelling
Household type Owner-occupier Total Social rented Market rented Total
Income from employment 77 50 48 59 65
Unemployed 1 11 12 6 5
Retired 19 31 32 29 24
Other 2 8 8 6 5
Total 100 100 100 100 100
Source: WoON 2006/OTB Research Institute for Housing, Urban and Mobility Studies

The promotion of home-ownership and cuts in the subsidies for the so-cial rented sector became important aspects of government policy at the end of the 1970s. However, when the owner-occupied market collapsed in 1978-1982, the production of new, subsidised rented accommodation was substan-tially increased (see Table 8.2). The impact of this on the budget has led to the need to economise on bricks-and-mortar subsidies since the second half of the 1980s. The climate for such measures improved in the second half of the 1980s, when the economic recovery led to an increase in the production of owner-occupied dwellings and the quantitative shortages on the housing market seemed to have been addressed, thus making management of the ex-isting stock all the more important (Van der Heijden et al., 2002).
Changing ideas about the role of central government also prompted a re-view of the existing system of regulations and subsidies. Faith in ‘social en-gineering’ gradually faded during the 1980s as more people started to believe that citizens and businesses should bear more responsibility within the hous-ing market. In the late 1980s, more attention was focused on efficiency, de-regulation and better financial management.
In 1989, E. Heerma, the then Minister of Housing, published a policy docu-ment entitled Housing in the 1990s: from building to living setting out the main lines of housing policy for the 1990s (Ministerie van VROM, 1989). The docu-ment made a case for a greater role for market forces and a more effective housing market. It advocated reallocating responsibility and financial risks among the players on the housing market and concentrating financial sup-port on the low-income groups. An underlying goal was to control and reduce government spending on housing (Boelhouwer et al., 1996).
[ 215 ]
Figure 8.1 Tenure categories per income decile, the Netherlands, 2006
owner occupied social rented private rented
0
20
40
60
80
100
10987654321
%
Source: WoON 2006/OTB Research Institute for Housing, Urban and Mobility Studies

In 1992, the existing subsidy legislation was replaced by the Decree on Dwelling-Linked Subsidies (also known by its Dutch abbreviation, BWS) with a view to deregulation and decentralisation. National government made an overall budget available and then left it to the larger municipalities and provinces to decide which dwellings would receive bricks-and-mortar subsi-dies. The subsidy was paid out as a lump sum and was no longer an annual amount which could be used to defray the operational costs.
Home ownership among the lower-income groups was (further) encour-aged by enabling the sale of social rented dwellings. Many experiments were conducted with shared ownership with the aim of finding ways to limit the risks associated with the purchase of a dwelling by lower-income households (SEV, 1994).
The policy for the social rented sector was geared to decentralisation, de-regulation and (financial) independency, which included matters such as the capacity to independently bear investment risks and greater freedom in rent setting and asset management. More freedom in asset management includ-ed expanding the possibilities for housing associations to sell social rented dwellings in order to raise profits that could be allocated into the purchase or improvement of dwellings.
In 1993, the (new) relationship between the government and the housing associations was set out in the Social Housing Management Decree (Besluit Beheer Sociale Huursector, BBSH). This decree regulates the tasks of the inde-pendent housing associations and the system of supervision (see Section 8.7). The Social Housing Management Decree awarded the municipalities more re-sponsibility in determining and assessing the performance of the housing as-sociations.
The Grossing and Balancing Act ended the financial ties between housing associations and the national government and thus completed the process of independence. On 1 January 1995 the government paid off its subsidy obliga-tions to the housing associations (emanating from the long-term subsidy ar-rangement from before 1992), mainly by means of the accelerated redemp-tion of outstanding government loans. The grossing and balancing operation was based on a number of assumptions regarding the future development of certain variables such as interest rates, inflation and rent increases (Nationale Woningraad, 1993). Essentially, this meant that, from 1 January 1995, the opera-tional risks would be borne by the housing associations rather than the govern-ment. These changes led to a decline in new construction in the social rented sector.
Meantime, housing allowances gained in importance. In 1997, a new Hous-ing Allowance Act broadened the subsidy options for lower-income groups in particular (Van der Heijden et al., 2002).
In many respects there is no difference in the treatment of the social and market rented sectors in the Netherlands. Individual housing allowances are
[ 216 ]

available in both sectors and, until the late 1980s, there were similar subsidy ar-rangements for the construction of social and market rented dwellings (Van der Heijden & Boelhouwer, 1996). In 1989, the market rented sector switched to a subsidy system consisting of five annual contributions of 2,000 guilders. In 1992, the subsidies for this sector were incorporated into the Decree on Dwelling-Linked Subsidies (see above). Since 2005, no bricks-and-mortar subsidies have been available for either the social rented sector or the market rented sector.
As indicated in Section 8.1, the Dutch housing market has been hit by re-current shortages since the end of World War II. In 1995, the government en-tered construction agreements with 26 urban regions with the aim of adding 650,000 dwellings to the housing stock between 1995 and 2004 in the expecta-tion that this would solve the remaining housing shortage in the Netherlands. The proportion of social rented dwellings in the output was reduced to a max-imum of 30%. Under these agreements, bricks-and-mortar subsidies (BWS subsidies) were granted for the last time. Besides bricks-and-mortar subsidies, the government also provided subsidies for the development of housing loca-tions. The target number of dwellings was met in 1995-2004, but the shortage was more deep-seated than had been anticipated and even worsened after 2000 (Van der Heijden et al., 2004).
In 2005, Mrs. Sybilla Dekker, the then Minister of Housing, pledged to re-duce the housing shortage to 1.5% by 2009. The overall new building require-ment (expansion and replacement) was estimated at over 420,000 dwellings for 2005-2009. This meant an annual output of 84,000 dwellings (see Table 8.11). Agreements were again reached with the urban regions. However, no bricks-and-mortar subsidies were available. The housing associations would have to produce more than 25% of the output for 2005-2009 in the form of rented and affordable housing. Because housing production did not reach the yearly production target of 84,000 dwellings, it will take at least until 2010 to reduce the housing shortage to the 1.5% shortage stipulated in the policy ob-jectives (Ministerie van VROM, 2005).
8.4.2 Recent housing policy
There has been some discussion in the Netherlands in recent years about the
[ 217 ]
Table 8.11 Development of housing shortage 1986-2010 and production target for 2005-2009, the Netherlands
1986 1990 1994 1998 2002 2005 2010 2005 - 2009
Housing shortage (number) 127,400 126,000 137,000 110,000 166,000 185,000 108,000
Housing shortage (percentage of housing stock)
2.4% 2.2% 2.2% 1.7% 2.5% 2.7% 1.5%
Production target 2005-2009 420,000
Net increase in housing stock 365,000*
Production target per year (2005-2009)
84,000
* Net increase smaller than production target due to demolition, joining, etc.Sources: Ministerie van VROM (2004, 2005)

position, role and tasks of housing associations. This discussion is, to some extent, the result of (the interpretation of) EU legislation, but it has also been prompted by factors such as the independent position and wide-ranging op-erations of the housing associations plus the substantial assets and large numbers of properties that they manage (Elsinga et al., 2008; Priemus, 2007).
At the same time, the persisting housing shortage and the high prices of owner occupied dwellings made it increasingly difficult for tenants to enter owner occupation and for young households to enter the housing market. In 2004, the Minister of Housing presented a new rent policy (Dekker, 2004) fol-lowed by a policy outline on the future of the housing associations in 2005 (Dekker, 2005).
Under the new rent policy, the proportion of the housing stock with regu-lated rents – currently 95% of all rented housing in the Netherlands – was to be reduced to around 75% (Dekker, 2004). This new rent policy was supposed to increase the number of more expensive (unregulated) rented dwellings and trigger filtering on the housing market: more movements within the rental sector and between the rental sector and the owner-occupied sector. It would also decrease the number of rent-regulated dwellings owned by housing asso-ciations. This is important because in order to make the housing associations ‘Brussels-proof’ the social activities of housing associations should be limited to the target groups (Elsinga et al., 2008).
In the policy outline on the future of the housing associations, the social activities of the housing associations would include the allocation of dwellings with regulated rents to the target groups.70 In order to prevent cross-subsidis-ation from social activities to market activities, these social activities should be clearly distinguished from competitive activities on the open market. The decrease in social (regulated) dwellings and the distinction between the social and commercial activities of housing associations were seen as essential in or-der to make the operations of the housing associations ‘Brussels-proof’.
Before Parliament could take a definitive decision on Minister Dekker’s pol-icy proposals, early elections were called, which resulted in a new government. The new government decided not to implement the rent policy proposed by its predecessor and planned instead to pursue an inflation-linked rent policy. This means that regulated rents may be increased by no more than the rate of inflation (Ministerie van VROM, 2007b). The new government also decided that no changes would be made in the tax treatment of home ownership during its term of government. This can be seen as a political compromise between the Social Democrats, who opposed the proposed rent policy, and the Chris-
70 And the management of ‘social property’, i.e., the development and management of community centres,
schools and so on - wherever a direct relationship exists with the ownership of dwellings by the housing as-
sociations.
[ 218 ]

tian Democrats who had promised their supporters that they would oppose any change in tax treatment of owner-occupiers. The consequence of this compromise was that the problems on the housing market outlined above, as well as the discussion of the interpretation of EU legislation with respect to the operation of housing associations, were not tackled.
Housing policy for the period 2007-2010 is focusing on the improvement of housing and living conditions in deprived urban areas. Forty such deprived districts and neighbourhoods have been selected for intensive support in-cluding not just housing renovation, but also measures for improving educa-tion, employment and social integration. These steps are being undertaken in close co-operation with the municipalities and housing associations. Housing associations will be required to make an extra financial contribution of €750 million a year (€2.8 billion in total) between 2007 and 2010. For this contribu-tion the minister has imposed a levy on the housing associations.
The new government also wanted to reach agreement with the housing associations on a contribution to the affordability of rented housing, invest-ments in the energy efficiency of existing dwellings, and increasing the con-struction rate of new dwellings. An agreement in principle has been reached with Aedes, the umbrella organisation for the housing associations, which states that the housing associations will realise a total of 165,000 new dwell-ings in 2007-2010.
The government has also come up with a plan to bring forward the intro-duction of corporation tax on the social housing property of housing associa-tions from the original date of 2011 to 2008 (Ministerie van Financiën, 2008). The housing associations opposed this extra (and earlier than expected) burden, estimated to amount to €500 million annually. However, Parliament approved the government proposal in November 2007.
8.5 Rent control and security of tenure
8.5.1 Rent-setting and rent control
The scope for rent-setting in the Netherlands is determined by the Rent Act (Huurprijzenwet Woonruimte) and the Rent Decree (Besluit Huurprijzen). Both pieces of legislation apply to regulated dwellings in the social and market sectors. They do not apply to deregulated dwellings, tenancy agreements con-cluded after 1994 and with a rent that exceeded the deregulation limit up to that date (Winters et al., 2007). That deregulation limit was €615.01 for 2006-2007. In 2006, approximately 5% of all rented housing stock in the Nether-lands was deregulated.
The regulated dwellings are subject to the maximum rent stipulated in the dwelling valuation system, which accords points to a dwelling on the basis of
[ 219 ]

the quality of the housing and the housing environment. A maximum rent is then set on the basis of the number of points and is applied to both newly built dwellings and vacant existing dwellings. The points system highlights the quality of the dwelling and is based partly on objectively quantifiable characteristics such as surface area and facilities. The points for the living environment are determined by rent committees, who look primarily at the accessibility of amenities such as shops, public transport, schools etc. (Win-ters et al., 2007). At present, a discussion is in progress on adaptations to the dwelling valuation system. The maximum rents for housing in popular neigh-bourhoods and urban areas with a tight housing market are regarded as too low. Arguments are being put forward to give the market value of the dwelling a place in the dwelling valuation system. This suggestion formed part of the proposed rent policy in 2005 (Dekker, 2004), but it has not been adopted by the present government (see Subsection 8.4.2).
The average rent in the social sector is 70% of the maximum rent while in the market sector it is 83% of the maximum (Elsinga et al., 2007b). The rent of most dwellings, particularly in the social rented sector, is therefore far below the maximum. This is a deliberate policy on the part of the landlords, who often work with target rents expressed as a percentage of the maximum rent. When a dwelling becomes vacant the rent for the next tenant can be deter-mined on the basis of the target rent but it is also possible to use the maxi-mum rent level.
In addition, a maximum rent increase is set every year by central govern-ment. The restrictions on the annual rent increase apply to regulated social and market rented dwellings. The current Dutch government has decided to pursue an inflation-indexed rent policy in the period 2007-2010. The maxi-mum rent increase for rent-regulated dwellings in 2007 was therefore set at 1.1%, the rate of inflation for 2006. There is one part of the rent regulation which distinguishes between social and market landlords. A maximum per-missible total annual rent increase (the rent increase for all dwellings of a housing association) is set for the social sector but not for the market sector. For 2007, the maximum rent increase for all the rents of a housing associa-tion is also the rate of inflation for 2006. This means that, starting from 1 July 2007, a housing association may increase the total rent of all its dwellings by a maximum of 1.1%. The rent increase for improved dwellings and new rent contracts is not taken into account when this percentage is determined (Mi-nisterie van VROM, 2007b).
8.5.2 Security of tenure
A tenancy agreement in the Netherlands in both the market and the social rented sector is usually for an indefinite period of time. A tenant in the Neth-erlands usually has a term of notice of one month. However, in the market
[ 220 ]
sector, tenancy agreements are often entered into for upwards of one year.A landlord can terminate a tenancy only under specific circumstances listed in the Dutch Civil Code (Elsinga et al. 2007b, p. 82):
■ The tenant does not behave in a manner befitting a tenant. ■ The contracted period has expired. This may occur in the case of a tenancy
agreement for a specific period of time. ■ The landlord urgently needs the dwelling for himself. ■ The tenant refuses the offer of a reasonable new tenancy agreement
(which may not include a change to the rent or service costs, unless the dwelling is in the deregulated sector).
■ The landlord is terminating the tenancy on the basis of a balance of inter-ests between tenant and landlord. This applies only to bedsits in private homes which are rented for longer than nine months.
The landlord cannot terminate the tenancy agreement under any other cir-cumstances.
8.6 Allocation procedures and criteria
The Housing Allocation Act (Huisvestingswet) forms the national framework for the allocation of dwellings. It is based on the freedom of people to live where they choose, but gives municipalities the scope to draw up rules for the allocation of housing. The Housing Allocation Act distinguishes between
‘housing-market access’ and ‘housing allocation’.The regulation of housing-market access gives local authorities the power
to set aside dwellings – with rents and house prices under given limits – for local residents. The authorities can exercise that power by stipulating that prospective users must have social or economic ties to the region, the munic-ipality, or the district. Local authorities can resort to such provisions if local conditions make such intervention reasonable – in other words, if the hous-ing market is particularly tight. 43% of Dutch local authorities apply such ac-cess rules to the social and the market rented sector, 44% to the owner-occu-pied sector (Directoraat-Generaal Wonen, 2003). On a national scale, the regime applies to approximately 30% of the rented stock, approximately 4% of the owner-occupied stock, and approximately 15% of the newly completed dwell-ings in the homeowner sector (Haffner & Hoekstra, 2006).
Housing allocation refers to regulations that govern the distribution of housing among home-seekers who meet the criteria for housing-market ac-cess. Owner-occupancy units are mainly sold to the highest bidder according to the principles of the free market.
There are no rules for the allocation of market rented dwellings. In practice there is a wide variation in how market landlords allocate dwellings.
[ 221 ]

One of the main tasks of the social landlords is to give priority to home-seekers on low incomes. Dwellings are allocated in many different ways in the social rented sector in the Netherlands. Several housing associations operat-ing in the same municipality may allocate dwellings separately or individually and almost every municipality has its own rules and systems. It is even pos-sible for different rules to be applied within one and the same municipality.
Home-seekers who have access to a section of the housing market and who want an affordable rented dwelling must meet the rent conditions for cheap social rented housing in the region or municipality. These conditions may differ locally. Usually, there is a link between rent and income. This is to ensure that the cheapest dwellings are reserved for the target group. Recently, people have been advocating that income-based rent conditions should be scrapped as this would give more freedom to home-seekers and prevent con-centrations of low-income households. A small number of municipalities have followed the policy of Rotterdam and started experiments whereby income re-quirements are used in the opposite way: the cheap rented dwellings in some housing complexes are deliberately not allocated to low-income households but to households with slightly higher incomes (Winters et al., 2007).
Traditionally, there are conditions regarding the size of the household. Large dwellings (with many rooms or a large surface area) are reserved for home-seekers with large families and smaller dwellings are reserved for sin-gle persons and couples. Age-related conditions may also apply – retirement dwellings or dwellings in complexes with a high proportion of elderly tenants are usually allocated to older candidates first.
Dwellings available for rent can be offered to potential tenants in a number of ways. Since the 1990s, the ‘advertisement’ model or choice-based letting model has been used almost everywhere in the Netherlands (Kullberg, 1997). Cheap vacant dwellings are advertised in a weekly or monthly housing bul-letin and/or on the Internet, complete with requirements concerning income, household size and so on. Home-seekers can then apply for the dwelling(s) that reflect their needs and preferences (Van Daalen & Van der Land, 2008).
In the current urban housing market there are more candidates than af-fordable dwellings, and the shortfall can be anything from a few to hundreds. An order of precedence is used to decide who receives first choice. Again, con-ditions can vary locally. The most common criteria are waiting time and term of residence. The waiting time is the number of months or years that a candi-date has been registered as a home-seeker with the housing associations. The dwelling is offered to the person with the longest waiting time first. Waiting time varies between dwelling types and municipalities, but can be up to 10 years in tight housing markets like Amsterdam (AFWC, 2008).
The length of residence is the number of years that an individual has lived in his/her current home. The dwelling is then offered first to the home-seek-ers with the longest term of residence. Recently, some housing associations
[ 222 ]

have been using a lottery system to determine the order of precedence (Van Daalen, Davis & Ouwehand, 2005). Lots are drawn among the candidates for every dwelling that is offered. Sometimes various criteria are combined, such as the use of waiting time and term of residence for the most popular dwell-ings and a lottery system for the less popular dwellings.
8.7 Regulation and supervision
The market rented sector is not subject to any form of government supervi-sion, but it is nevertheless bound by government policy on rent regulation (Subsection 8.5.1).
Housing associations are required to work within the framework stipulat-ed in the Social Housing Management Decree (1993), which is based on the Housing Act (1901). The Social Housing Management Decree (also known by its Dutch abbreviation, BBSH) stipulates six areas of performance for accred-ited institutions:
■ to house those who are unable to find an appropriate dwelling for them-selves;
■ to maintain a decent quality of dwelling; ■ to consult with the tenants; ■ to be a financially sound organisation; ■ to contribute to liveable neighbourhoods (added in 1997); ■ to provide housing (but not care) for the elderly and handicapped (added
in 2001);
Since 2007, housing associations have been allowed to develop and manage ‘social real estate’, meaning community centres, schools and so on – wherever a direct relationship exists with the ownership of dwellings by the housing associations.
The Social Housing Management Decree also describes the supervision structure:
■ internal supervision by an internal board; ■ performance agreements with the local authority; ■ external supervision by the Ministry.
This supervision structure implies that responsibility for monitoring the per-formance of housing associations in the Netherlands rests primarily with the social housing sector.
All housing associations have internal supervision boards. Various assess-ment reports have indicated that these boards could be run more profession-ally. Moreover, it has emerged that many of these internal boards concentrate more on the financial performance and less on the social housing perfor-
[ 223 ]

mance of the association (Haffner et al., 2005; Van Bortel & Elsinga, 2005).A housing association is expected to enter performance agreements with
the local authority on the basis of the six areas specified in the BBSH. How-ever, there are no such agreements in many municipalities, and those which do exist are not always evaluated (Kromhout & Grinsven, 2004).
The Minister of Housing is the final external supervisor of the performance of the housing associations. The supervision pertains to both the social hous-ing performance and the financial performance, and is carried out annually by the Department of Housing in order to ascertain whether housing asso-ciations are engaging in inadmissible activities. There is also a soft check to determine whether the housing association is performing adequately accord-ing to the Social Housing Management Decree or the local performance agree-ment.
The financial supervision is managed (on the Minister’s behalf) by the Cen-tral Fund for Housing (CFV). There are clear criteria for financial performance. The CFV sets a minimum solvency rate based on the features of the housing stock and the housing market. Housing associations that meet the minimum criteria are awarded ‘A’ status and become financially independent. Those which do not meet the minimum criteria are awarded a ‘B’ or a ‘C’ label. A ‘B’ label indicates that extra attention and monitoring from the CFV will occur; a
‘C’ label indicates legal restraint.The ultimate sanction for housing associations that perform very poorly
is removal from the register of social housing associations. The implications of this sanction and the sum of money to be paid to the government in such cases are unclear as in reality the situation has never arisen.
The Social Housing Management Decree offers other means whereby the Minister can intervene in the management of a housing association. The Min-ister can appoint an external supervisor or demand that the housing associa-tion draws up a plan of action. The first option – the external supervisor – has been used on several occasions, for example in connection with misappropri-ated funds.
8.8 Subsidies and finance
8.8.1 Subsidies
The construction of housing in the Netherlands has been heavily subsidised since the end of World War II. In the past, bricks-and-mortar subsidies were granted for new construction in both the market and the social rented sectors. One important underlying principle of the subsidy system was equal treat-ment for social and market landlords (Van der Schaar, 1987). Until 1992, op-erational subsidies were available for newly built affordable social and mar-
[ 224 ]
ket rented housing. From the late 1980s onwards, one-off premiums were also available for the construction of more expensive rented and owner-occupied dwellings. The Decree on Dwelling-Linked Subsidies (the Dutch abbreviation is BWS) in 1992 brought operational subsidies to an end. The BWS offered a one-off contribution. When this programme was ended in 2005, it put an end to bricks-and-mortar subsidies for both the market rented sector and the social rented sector. The government does, however, still make limited location sub-sidies available for the construction of housing in urban regions. These subsi-dies are based on agreements with urban regions about specific construction targets. They are not paid out (in full) until the targets have been met.
Though the government no longer grants general supply subsidies, there are three arrangements that are considered beneficial to the social rented sec-tor (Elsinga et al., 2007b). The first is the lowered price of land. When locations are being developed for construction, the price of land is always lowered for social rented dwellings and then cleared within the project (Groetelaers, 2004).
Another arrangement is the Guarantee Fund for Social Housing (known by its Dutch abbreviation, WSW), a private fund established by social landlords in 1983. A social landlord pays a relatively low interest rate when a loan is guaranteed by the Guarantee Fund. Together, the central government and the local authority act as a safety net and will step in if the WSW encounters fi-nancial difficulties. There is also the Central Fund for Housing (Dutch abbrevi-ation CFV), an independent public body established in 1988. The CFV supervis-es the financial affairs of the housing associations and initiates restructuring of financially weak housing associations. All housing associations pay a fee to the CFV. The CFV identifies housing associations with financial problems, draws up a reorganisation plan and provides support in the form of interest-free loans. Early detection and intervention mean that financial problems are minimised. Hence, since 1988, the WSW has never been required to pay any guarantee claim (Elsinga et al., 2004). The excellent financial soundness of the sector and the government safety-net contribute to the Triple A status of the fund and enable housing associations to take out low-interest loans for social housing objectives.
Thirdly, the housing associations themselves can grant subsidies. The housing associations finally became independent from central government in 1995. That year, the government paid off its subsidy obligations to the hous-ing associations mainly through the accelerated redemption of outstanding government loans (see Section 8.4.1). Housing associations are free to use their assets within the legal limits. One widely used mechanism is the reali-sation of ‘unprofitable investments’ in new social housing. This applies when the rents of new dwellings are set at such a low level that they do not cover the operational costs. According to a report by the CFV, the average capital costs of a dwelling (including land costs) are €146,600 (2007). The unprofitable part of this investment in low-rent dwellings is, on average, €35,300 or 24.1%
[ 225 ]
of the capital costs (CFV, 2008).Partly as a result of these arrangements, the umbrella organisation of in-
stitutional property investors, the IVBN, has recently submitted a complaint to the European Commission concerning the Dutch government’s policy on housing associations. They argue that housing associations use state support for letting ‘high-end’ housing with relatively low rents to households that do not belong or no longer belong to their primary target group (Priemus, 2007).
8.8.2 Taxation
Given that their core mission is to provide affordable housing for low-in-come households, housing associations have always played a key role in social housing. It is precisely because they performed this public duty that they were exempted from corporate tax. Changes in the housing market have prompted housing associations to broaden their range of activities in recent years by, for example, building more expensive rented and owner-occupier dwellings and investing in what is known as ‘social real estate’ (i.e. the de-velopment and management of community centres, schools and so on). They have become professional organisations with a public remit and have al-so – via economies of scale and collaboration – become powerful players on the regional housing market as a whole. Accordingly, the exemption of hous-ing associations from corporate tax has been the subject of much debate in recent years and has led to the introduction of a partial tax obligation start-ing from 1 January 2006 which includes an independent fiscal criterion for corporate tax (Ministerie van Financiën, 2008). From 1 January 2008 housing as-sociations have to pay full corporate tax.
The tax for market landlords differs according to category. For tax purposes, market landlords can be split roughly into two groups: professional landlords who pay corporate tax and landlords who rent out real estate as ‘individuals’ and who pay income tax (Elsinga et al., 2007b).
Corporate tax currently stands at 35%. Institutions which only invest (such as insurance companies and pension funds) may be exempt from corporate tax, provided they pay a dividend to the shareholders. At present, a debate is still in progress to decide what does and does not fall under (re)development for the benefit of the institutional portfolio within the untaxed regime of the investment institution (IVBN, 2006).
Individuals pay tax on three types of income: ■ income from employment and home ownership (box I) ■ income from a substantial interest (box II) ■ income from savings and investments (box III).
The profit realised by more active asset managers is taxed on the basis of box I. The rate depends on the income and reaches a ceiling at 52%. In practice, it
[ 226 ]

is the tax inspector who decides which box applies. Many market landlords are taxed on the basis of box III because the tax inspector regards them as in-vestors. The rate is 30% of a notional profit of 4% of the positive balance of as-sets less liabilities. In effect, this works out at a tax rate of 1.2%. Expenditure on maintenance is not tax-deductible (Elsinga et al., 2007b).
Finally, there is a property tax for all owner-occupier and rented dwellings which differs considerably, depending on the municipality. In all municipal-ities the tax due is based on the market value of the dwelling. The market value is basically the value of the dwelling ‘free of rent and use’ and usually works out at 20 to 24 times the annual gross rent.
8.8.3 Housing allowances
Supply subsidies are no longer granted to the rented sector, but a housing al-lowance is available for tenants on a low income. When it was introduced in 1975, the housing allowance was intended as a temporary measure for ten-ants in both the social and the market rented sector. The idea was to raise the rents to market levels and provide low-income groups with compensa-tion in the form of a housing allowance. The main objective of the measure was to safeguard affordability. A second objective – the prevention of segre-gation – was added in 1997. The levels of housing allowance were increased across the board to make new neighbourhoods and new dwellings in regener-ated urban areas accessible to low-income households both in the social and market rented sector. In 2006 the target group for housing allowance covered some 30% of Dutch households (Elsinga et al., 2007b).
The level of housing allowance depends on a household’s income, rent and composition. The system is shown in Figure 8.2. Everyone has to pay a ‘basic rent’ which is income-dependent and is set at €196 (in 2006-2007) for house-holds on the lowest incomes. There is also a quality discount limit. The differ-ence between the basic rent and the quality discount limit is 100% subsidised for all groups. For young adults up to the age of 23, the quality discount limit is also the maximum rent limit. Hence, this group receives no allowance if the rent exceeds €339. For the other groups there is a capping limit that dif-fers for small and large households. The difference between the capping lim-it and the quality discount limit is subsidised at 75%. Finally, there is also a maximum rent limit for these groups. The difference between the maximum rent limit and the capping limit is only subsidised for elderly households and single persons, who receive 50% housing allowance for this part of their rent. Housing allowances are not granted for dwellings with a rent that ex-ceeds the maximum rent limit (Priemus & Elsinga, 2008). In 2006, over 970,000 households received housing allowance. This represented 32% of tenants. In 2006 the average monthly housing allowance per recipient was €144 (WoOn 2006, adapted by OTB).
[ 227 ]

Table 8.12 shows the trends in rent and income in the social and market rented sector in 2002-2006. On average, both the rents and incomes of the tenants in the market rented sector are higher than those in the social rent-ed sector. In both sectors, the rents and the accompanying costs have risen faster than the incomes and pushed up both the rent quote and the housing expenditure quote. The percentages in the market rented sector are decidedly higher than in the social rented sector, even though average income is higher as well.
8.9 Bridging the gap between social and market renting?
The gap in who provides whatIn the Netherlands, the distinction between the social and market rented sec-tors is made mainly on the basis of the ownership of the dwellings. The rent-ed housing of the (non-profit) housing associations is included in the social rented sector, and other rented housing, which is usually let on a commercial basis, is included in the market rented sector. Although both the social and the market rented sectors alike provide both inexpensive and expensive rent-ed housing to households which range from low to high incomes, there are differences between the social and the market rented sectors in the nature and function of the rented housing (see Table 8.13).
Market landlords have commercial motives whereas housing associations are non-profit organisations with a social duty. However, housing associations are becoming increasingly market oriented and are also involved in commer-cial activities (although any profits have to be used within the housing sector).
Housing associations as well as market landlords let dwellings of a range
[ 228 ]
Figure 8.2 Housing allowance system, percentage of the rent covered by housing allowance within the set limits, the Netherlands, 2006-2007
Source: Ministerie van VROM (2006; adapted by OTB)
€615.01Housing allowance limit
€485.33 / €520.12Top-off limits
€339.08Quality discount
€ 195.89Basic rent
Lower limit 0 %
100 %
Youth
0 %
100 %
75 %
50 %
Singles
0 %
100 %
75 %
0 %
Two-person
0 %
100 %
75 %
0 %
Multi-person
0 %
100 %
75 %
50 %
Elderly

of quality, from low to high (and with corresponding rent levels), although dwellings with relatively low and high quality are more strongly represented in the market sector than in the social sector. The difference in satisfaction with the dwelling itself between tenants of a social dwelling and a market dwelling is negligible. However, more tenants in the social sector are dissatis-fied with their living environment than tenants in the market sector.
With regard to rent levels, there is a gap between the two sectors, but it is small. The average rent in the market sector is higher, partly because the average rent in the regulated part of the social sector is 70% of the maximum rent whereas it is 83% of the maximum rent in the regulated part of the mar-ket sector (Elsinga et al., 2007b). This means that dwellings in the social sector
[ 229 ]
Table 8.12 Average rents and incomes in the rented sector, the Netherlands, 2002-2006
2002 2006
Total rent Social rented Market rented Total rent Social rented Market rented
Basic rent (€ per month) 365 353 414 411 397 469
Net rent (after housing allowance) (€ per month)
325 308 395 365 344 446
Total housing costs* (€ per month)
454 437 525 542 518 639
Net income (€ per month) 21,054 20,485 23,385 20,570 19,906 23,179
Net rent quote (%) 21.6 21.1 23.9 24.2 23.5 27.0
Housing expenditure quote (%) 30.4 30.0 32.0 36.3 35.7 38.9
* Incl. utilities and taxes.Sources: WBO2002; WoON 2006
Table 8.13 The gap between social renting and market renting in who provides what in the Netherlands
Landlord Social renting Market renting
Types Housing associations Private persons and companies, institutional investors
Motives of landlords Non-profit Profit
Accommodation
Quality of products on offer
Relatively new dwellings, relatively many single-family dwellings, many medium-sized dwellings
Relatively old dwellings, many apartments, relatively many small and big dwelling
Rent levels Rent level for regulated dwellings on average 70% of maximum rent
Rent level for regulated dwellings on average 83% of maximum rent
Property rights
Security of tenure Indefinite Indefinite
Rent surcharge Not applicable Not applicable
Right to buy Not applicable Not applicable

have a more favourable average price-quality ratio.With regard to property rights, there is no difference between the two sec-
tors. Tenant security in both sectors is very strong (indefinite contracts) and tenants in both sectors have no right to buy. However, some housing associa-tions give their tenants a choice between renting or buying a dwelling. If they buy and wish to re-sell, they have to sell the dwelling back to the housing as-sociation.
The gap in government policies and outcomesIn policy terms, the social and market rented sectors in the Netherlands are treated in much the same way. In the past, both sectors were eligible for the same bricks-and-mortar subsidy schemes and both sectors operate under the same regime of security of tenure, housing allowances and rent regulation. With regard to rent regulation, dwellings in both sectors with a rent under the deregulation limit (of €615 per month in 2006/2007) are subject to the maxi-mum rent stipulated in the dwelling valuation system. Rent regulation does not apply to tenancy agreements that exceed the deregulation limit. Only 5% of all rented dwellings in the Netherlands are unregulated. The majority of these unregulated dwellings are in the market sector.
However, there are also several differences in how the government treats market landlords and social landlords. For instance the allocation system produces a large gap between the sectors (see Table 8.14). Other than the power of the municipalities to impose additional requirements on the letting of inexpensive market and social housing which stems from the Housing Al-location Act, there are no rules governing the allocation of dwellings by mar-ket landlords. Housing associations have to prioritise home seekers on low incomes. The allocation method is generally defined locally or regionally.
There are also differences between the market rented sector and the social rented sector with regard to regulation and supervision. The market rented sector has no special tasks and no government supervision. The housing as-sociations, by contrast, are covered by the Social Rental Sector Management Order, which defines six fields of performance, including the task of housing those unable to find an appropriate dwelling themselves. Since 1997, asso-ciations have also been obliged to contribute to the liveability of neighbour-hoods. The Social Rental Sector Management Order also stipulates a supervi-sion structure for housing associations.
Although bricks-and-mortar subsidies are no longer available for either sectors, housing associations can have their loans guaranteed by the Guaran-tee Fund for Social Housing, enabling them to lend on more favourable terms, and they can often buy land from local authorities at reduced prices for the purpose of building social housing. Until recently, housing associations were also exempt from corporate income tax, but as of 2008 they are fully liable. The same does not apply to some market landlords, with institutional inves-
[ 230 ]

tors exempt from corporate income tax.With regard to the (socio-economic) characteristics of tenants, there are al-
so differences between the two rental sectors. Although there are households with low and high incomes in both the social and market rented sectors, low-income households are more strongly represented in relative terms in the so-cial rented sector. The market rented sector has a far more balanced distribu-tion over the income groups. Furthermore, single-person households, young people (up to 45 years of age) and employed people are relatively strongly rep-
[ 231 ]
Table 8.14 The gap between social renting and market renting in policy and policy instruments in the Netherlands
Social renting Market renting
Purpose of housing sector
Primarily to house people who are unable to find an appropriate dwelling for themselves
Diverse; meeting demands of several household types and income groups
Allocation procedures Different allocation systems (choice-based letting, waiting lists) in different regions and municipalities
Free market. Allocation of cheap dwellings regulated in municipalities with large housing shortages
Rent control
New contracts Regulated sector: based on quality pointsUnregulated sector: market rents
Regulated sector: based on quality pointsUnregulated sector: market rents
Rent adjustments Regulated sector: annual maximum rent increase is set by governmentUnregulated sector: rent increase negotiated between landlord and tenant
Regulated sector: annual maximum rent increase is set by governmentUnregulated sector: rent increase negotiated between landlord and tenant
Regulation and supervision
Besides rent regulation, housing associations work within the Social Housing Management DecreeThe Minister is responsible for the external supervision (in practice mainly financial)
No specific supervision, rent regulation applies
Government support
Bricks-and-mortar support
Not available Not available
Tax concession for landlord
Until 2008 exemption from company tax No tax concessions for private persons or companiesExemption from company tax for institutional investors
Housing allowances Available Available
Outcomes
Socio-economic characteristics of tenants
Relatively strong in lower and middle-income deciles (compared with the market rented sector)
Relatively strong in the lowest and highest income deciles (compared to the social rented sector)
Movement between tenures
Lower mobility, particularly within the social rented sector and to the owner-occupier sector
High mobility, particularly to the owner-occupier sector and the social rented sector
Competition
Substitutability Yes, because of long waiting lists for social rented housing
Rivalry Yes, especially on the market for more expensive rented dwellings

resented in the market rented sector, while the social rented sector has rela-tively large numbers of single-parent and other families, elderly people and unemployed people.
The mobility of households in the market rented sector is greater than that of their counterparts in the social rented sector. Sixty percent of households relocating in the social rented sector move within the sector. Approximate-ly one third of the movers buy their own home. Relocating from the social rented sector to the market rented sector is relatively rare. The market rented sector is considered a source of temporary housing far more than the social rented sector. By far the majority of households relocating go to a home of their own (38%), or to social rented housing (32%).
The competitive gapIn principle, there is a high level of substitutability between the sectors, al-though a large proportion of the unregulated part of the rented sector is let by market landlords and social housing is provided by non-profit associations. In practice, many people (on low and moderate incomes) have to choose be-tween dwellings with a relatively good price-quality ratio but a long waiting time in the social sector or a market dwelling with a worse price-quality ratio which is more accessible.
Because of the shortage of affordable housing in the Netherlands, there is no rivalry between market landlords and social landlords on this sector of the market. However, market landlords consider social landlords to be rivals in the market for more expensive rented dwellings, as is demonstrated by the IVBN’s (landlord’s organisation) complaint to the European Commissioner for Competition against the Dutch government’s policy on housing associations. They argue that housing associations use state support for letting ‘high-end’ housing with relatively low rents to households that do not belong, or no lon-ger belong, to their primary target group (Priemus, 2008).
Altogether, the level of competition between market rented housing and social rented housing is rather high, although the shortage of affordable housing in large parts of the Netherlands prohibits real competition in this segment of the market.
Bridging the gap?The relatively small gap between the social and market rented sectors in the Netherlands appears to coincide with the specific task of the housing associa-tions (prioritising accommodation for low-income groups) and with the better average price-quality ratio of social housing, hence the usually long waiting lists. The market rented sector is then better accessible as a temporary solu-tion and plays a more important role in the expensive rental market. Govern-ment policy is not directed towards bridging the gap between both sectors, although creating a level playing field for both sectors was the aim of govern-
[ 232 ]

ment plans in 2005/2006. In 2005/2006, attempts were made to deregulate a much larger part of both the social and the market rented sectors but this was meant to bridge the gap between renting and owning
The relatively small gap that exists between market renting and social renting in the Netherlands is to some extent bridged by the housing associa-tions which are becoming more market oriented and becoming increasingly involved in commercial activities (although any profits have to be used within the housing sector).
Country experts
Hugo Priemus, Faculty of Technology, Policy and Management and OTB Re-search Institute for Housing, Urban and Mobility Studies, Delft University of Technology.
Marja Elsinga, OTB Research Institute for Housing, Urban and Mobility Studies, Delft University of Technology.
[ 233 ]

[ 234 ]

9 Conclusion
9.1 Introduction
This book has examined the similarities and differences between what we have called social and market rented housing. The main distinction we iden-tified between the two tenures was that market housing is allocated accord-ing to effective demand while social housing is allocated according to need, the assumption being that the market will not provide according to a socially determined level of need that is different from effective demand.
The starting point of the research project was our impression that private initiatives were increasingly being used to provide social rental dwellings in different European countries. We termed these initiatives the state agent or contract model in Chapter 2. In other words, we assumed that these initia-tives were making the boundaries between social and market renting less dis-tinct.
In order to analyse the similarities and differences between social and market rented housing, we have developed and applied the concept of a gap between the two forms of tenure. In this chapter we will summarise the exis-tence of a gap between social and market renting in the six countries studied in Chapters 3 to 8, and consider the actions that are or could be in place to reduce or bridge the gap.
Firstly, we will summarise the differences and similarities between social and market renting using the first two of the three perspectives that we de-veloped in Chapter 2:1. Differences in which actors provide rented housing and what exactly is
provided (Section 9.2).2. Differences in whom the sectors are aimed at and in government policies
towards the sectors (Section 9.3 and summarised in Section 9.4).Section 9.5 looks at the gap from the competitive point of view. This is our third perspective of the gap:
3. A lack of competition between the sectors.
In all cases, we defined ‘the’ gap as a summary measure of different aspects or dimensions. How the gap can be bridged is the topic of Section 9.6. The chapter finishes with an evaluation of our framework in Section 9.7.
9.2 A comparison of the gap in who provides what between social and market renting in six countries
In this section, we will analyse the gaps between social and market renting in the six countries in two general aspects. Firstly, Table 9.1 presents the in-formation on who provides what in social renting. Table 9.2 then presents the
[ 235 ]

same information by which we analysed the gap on who provides what, but for market dwellings: the types of landlord and their motives, the type of ac-commodation, property rights as expressed in rent control, tenancy rights and others. The extent of the differences between both types of renting is presented in Table 9.3. It evaluates the size of the gap in who provides what between social and market renting.
Types of landlords and their motivesSince we have defined ‘social renting’ as dwellings that are not allocated by the market and ‘market renting’ as dwellings allocated by the market (Section 1.2), it is useful to discuss firstly which actors provide these dwellings. The types of landlords and the motives of landlords for each type of renting – so-cial or market – are, in the main, different (represented by a large gap in Table 9.3) in each country except Germany (with no gap in Table 9.3). To begin with the exception, then, any German landlord, whether an individual or an organ-isation, can apply for bricks-and-mortar support, as Tables 9.1 and 9.2 show.
‘Social’ in Germany can be considered a synonym for ‘subsidised’ with bricks-and-mortar subsidies, which means ‘not allocated by the market’. In the case of Germany, ‘social’ is not, then, a synonym for type of landlord. There appear to be a relatively small number of landlords with a non-profit status; it is es-timated that about 15% of landlords have a social motive (mainly municipal housing companies and co-operatives).
In the other countries, the distinction between social and market rent-
[ 236 ]
Table 9.1 Who provides what in social renting?
England Flanders France Germany Ireland Nether lands
Types of landlord and motive Local authorities, housing associations; recently open to private organi sations*
Mostly accredited social housing associations; some other non-profits; some private profit landlords*
Public and private non-profit or limited-profit organi sations
All landlords Local authorities, housing associations; recently some private landlords*
Housing associations
Type of accom mo dation compared to market rent
Lower level of physical quality; but some poorer quality neighbour hoods, lower rents
Higher quality; lower rent levels
Newer, more apartments, lower rent levels
Similar quality; intended lower rent levels
Lower quality and lower rents Relatively new dwellings, relatively many single-family dwellings, many medium-sized dwellings
Property rights
Rent control Policy formula that links rents to quality and local earnings
Rents related to incomes (Flemish policy formula) with market rents as starting point
Rent setting depends on contract between government and landlord, annual rent increase is influenced by the government as well
Rent setting and rent adjustment according to subsidy contract
Rents related to incomes of individual households occupying the dwellings
Regulated part: rent-setting based on quality;annual (max.) rent increase set by government.Unregulated part: market rents; rent adjustments negotiated
Tenancy rights Indefinite security of tenure Indefinite security, after two-year trial period
Indefinite security of tenure Indefinite security of tenure Indefinite security of tenure Indefinite security of tenure
Other property rights Conditional right to buy Conditional right to buy Rent surcharge for tenants with high income
Rent surcharge Conditional right to buy in local authority sector
Not applicable
* Small-scale activities of private organisations in providing social renting. The rest of the table refers to the main landlords in a country providing social renting.

ing is generally along the lines of ownership, thus the type of landlord, and whether this is a non-profit organisation providing social rental dwellings or a profit organisation providing market rental dwellings. The distinction be-tween non-profit and social, on the one hand, and profit and market on the other, however is somewhat indistinct in all countries. In England, for exam-ple, profit-making enterprises have been able to bid for funds to develop so-cial housing since 2004, whereas these funds had previously only been avail-able to non-profit organisations (Table 9.1).
In Flanders, the distinction is by and large between non-profit accredit-ed social housing associations and profit-making private individuals (and a few firms). However, the blurring of the boundary between social and market renting is occurring to limited extent as a result of two types of initiatives. Firstly, there are the activities of the Social Rental Agencies (SRAs) which rent dwellings (just over 3,000 in 2005) from market landlords to and let them to social tenants, especially vulnerable households. Social Rental Agencies low-er the management costs for landlords, by doing unpaid work for them – for example, they are responsible for administration and minor renovation work. This means that lower than market rents – and also guaranteed rents – can then be set. Secondly, there are the 208 social dwellings that have been built or are planned or under construction in 2008 by private investors. These so-cial dwellings have been or will be constructed by private investors who are responsible for the design, construction, finance and maintenance for 27 years on land provided by a social housing association under building and
[ 237 ]
Table 9.1 Who provides what in social renting?
England Flanders France Germany Ireland Nether lands
Types of landlord and motive Local authorities, housing associations; recently open to private organi sations*
Mostly accredited social housing associations; some other non-profits; some private profit landlords*
Public and private non-profit or limited-profit organi sations
All landlords Local authorities, housing associations; recently some private landlords*
Housing associations
Type of accom mo dation compared to market rent
Lower level of physical quality; but some poorer quality neighbour hoods, lower rents
Higher quality; lower rent levels
Newer, more apartments, lower rent levels
Similar quality; intended lower rent levels
Lower quality and lower rents Relatively new dwellings, relatively many single-family dwellings, many medium-sized dwellings
Property rights
Rent control Policy formula that links rents to quality and local earnings
Rents related to incomes (Flemish policy formula) with market rents as starting point
Rent setting depends on contract between government and landlord, annual rent increase is influenced by the government as well
Rent setting and rent adjustment according to subsidy contract
Rents related to incomes of individual households occupying the dwellings
Regulated part: rent-setting based on quality;annual (max.) rent increase set by government.Unregulated part: market rents; rent adjustments negotiated
Tenancy rights Indefinite security of tenure Indefinite security, after two-year trial period
Indefinite security of tenure Indefinite security of tenure Indefinite security of tenure Indefinite security of tenure
Other property rights Conditional right to buy Conditional right to buy Rent surcharge for tenants with high income
Rent surcharge Conditional right to buy in local authority sector
Not applicable

planning rights for a period of 30 years. The private investor will receive a subsidy amounting to the difference between social and market rent plus 5% of the social rent as compensation for vacancy and non-payment risks.
A similar division can also be found in Ireland, between non-profit motives for local authorities and housing associations in the social sector, and profit motives in the market sector for mainly private individual landlords. However, the introduction of the Rental Accommodation Scheme (RAS) in 2005 has al-lowed market landlords to contract with local authorities to house social ten-ants and changed this distinction a little. The RAS means that there are now some social landlords with profit-making motives. The RAS remains small scale so far, however.
In France, there is a substantial gap between social and market renting since social rental landlords are public and private non-profit (or limited-prof-it) organisations, whereas market rental landlords are profit-oriented. Most French market rental landlords are private individuals or households. The gap between the French social rental sector and the French market rental sec-tor is partly bridged by what is called the intermediate sector. In this sector, which is excluded from Tables 9.1 to 9.3, both social and market rental land-lords are active. This intermediate sector is subject to a specific subsidisation regime.
In the Netherlands, market landlords are commercially motivated whereas housing associations are non-profit organisations with a social duty. However, housing associations also let more expensive dwellings on a limited scale and are becoming increasingly market-oriented. They are also becoming involved in commercial activities such as the development of owner-occupied dwell-ings, although all profits must be reinvested within the housing sector. This is also the case in England, where some housing associations operate within a group structure that includes profit-making elements that can cross-subsidise non-profit social housing activities.
[ 238 ]
Table 9.2 Who provides what in market renting?
England Flanders France Germany Ireland Nether lands
Types of landlord and motive Private individuals, companies and others
Commercial/profit landlords, mainly private individuals
Mostly individual households
All types of landlords Mainly private individuals, also companies and others
Private individuals and companies, institutional investors
Type of accom mo dation compared to social renting
Poor physical quality is found more frequently; higher rent levels
Lower quality; higher rent levels
Older, more single-family dwellings, higher rent levels
Similar quality; intended higher rent levels
Higher quality and higher rents on average, but also some very low-quality dwellings
Relatively old dwellings, many apartments, relatively many small and large dwellings
Property rights
Rent control Market rents; rent increases according to market conditions
Market rents for most new contracts; rent setting according to an index of inflation
Market rents for new contracts, annual rent increase on basis of index
Market rents for new contracts; rent adjustment according to reference rents
Market rents for new contracts; yearly reviews with increases possible in line with market conditions
Regulated sector: rent-setting based on quality;annual (max.) rent increase set by government.Unregulated sector: market rents; rent adjustments negotiated
Tenancy rights Typically six months security initially then two months’ rolling security
Standard length of contract is nine years, but shorter contracts are also popular
Rent contracts of three or six years
Indefinite security of tenure Four-year rolling contracts. Security initially for six months then for forty-two months
Indefinite security of tenure

Types of accommodationAs for the types of accommodation, the gap between both social and mar-ket renting in the six countries varies considerably from large to small, de-pending on whether it is the quality of the dwelling or the level of rent that is concerned. England and Ireland are the two countries where a large gap is apparent between the two tenures in terms of both quality and rent lev-els. In both countries, the quality of the two sectors diverges, but this differ-ence is complex. In England, the difference has several dimensions: (a) lower physical standards in the market sector but higher levels of satisfaction with landlords’ management of accommodation; (b) a higher proportion of social tenants than market tenants who live in poor quality neighbourhoods; but (c) there is insufficient information on how rents vary with quality to make a definitive statement about differences in the rent/quality relationship. On average, however, social sector rents are around 50% of market rents in Eng-
[ 239 ]
Table 9.3 The gap between social renting and market renting* in who provides what
England Flanders France Germany Ireland Nether lands
Types of landlord Large Large Large None Large Large
Type of accom mo dation
Large Moderate for quality, large for rent level
Moderate for quality, large for rent level
Small for quality, different for rent level per locality
Large Small for quality and rent level
Property rights Large Large Moderate None on tenure security; large on rent regulation and rent surcharge
Large None
* Social renting refers to the main landlords in a country providing social rental dwellings, not to the small-scale activities in the social sector of private landlords in England, Flanders and Ireland.
Table 9.2 Who provides what in market renting?
England Flanders France Germany Ireland Nether lands
Types of landlord and motive Private individuals, companies and others
Commercial/profit landlords, mainly private individuals
Mostly individual households
All types of landlords Mainly private individuals, also companies and others
Private individuals and companies, institutional investors
Type of accom mo dation compared to social renting
Poor physical quality is found more frequently; higher rent levels
Lower quality; higher rent levels
Older, more single-family dwellings, higher rent levels
Similar quality; intended higher rent levels
Higher quality and higher rents on average, but also some very low-quality dwellings
Relatively old dwellings, many apartments, relatively many small and large dwellings
Property rights
Rent control Market rents; rent increases according to market conditions
Market rents for most new contracts; rent setting according to an index of inflation
Market rents for new contracts, annual rent increase on basis of index
Market rents for new contracts; rent adjustment according to reference rents
Market rents for new contracts; yearly reviews with increases possible in line with market conditions
Regulated sector: rent-setting based on quality;annual (max.) rent increase set by government.Unregulated sector: market rents; rent adjustments negotiated
Tenancy rights Typically six months security initially then two months’ rolling security
Standard length of contract is nine years, but shorter contracts are also popular
Rent contracts of three or six years
Indefinite security of tenure Four-year rolling contracts. Security initially for six months then for forty-two months
Indefinite security of tenure

land. Meanwhile, in Ireland, the average quality is lower in the social sector, both in terms of the stock and the neighbourhoods where the stock is located, but there is also a significant amount of sub-standard accommodation in the market sector. Income-related rents mean that there is unlikely to be a direct relationship between rents and quality in the social sector, while a more di-rect relationship is likely in the market sector.
The multi-dimensional nature of quality appears in the other countries as well. In Flanders, the gap has been designated as moderate: the quality of so-cial rental dwellings is on average perceived to be better than that of mar-ket rental dwellings. Higher proportions of social tenants judge their housing to be of ‘good’ or ‘very good’ quality (79% to 65%), and more private tenants think that overall quality is ‘inadequate’. Only 11% of social tenants think that physical conditions are ‘bad’ or ‘very bad’ compared with 19% for mar-ket tenants. As social sector rents are on average 59% of market rents (a large gap), the price-quality relationship is much better in social renting than in market renting. As in Ireland, low rents in the social sector are related to in-comes. As they are also related to cost price there may be some direct varia-tion according to the attributes of the dwellings.
The small price-quality gaps present in Germany and the Netherlands re-flect a lack of overall price and quality differentiation between the two sec-tors. In Germany, the quality of new subsidised housing in particular is judged to be little different from new private housing and the differences between renting and owning are judged to be larger than those between the two rent-al sectors. Rents will be lower for subsidised dwellings than for unsubsidised dwellings, as a result of the subsidy, but only since rent setting has become more market-oriented, and is no longer based on cost price (since 1 January 2002). In the Netherlands, both housing associations and market landlords let dwellings which range from low to high quality, although the spread in hous-ing quality is greater in the market rental sector than in the social rental sec-tor. The difference in levels of satisfaction with the dwelling between tenants of social rented dwellings and market rented dwellings is negligible. However, more tenants in the social sector are dissatisfied with their living environment than tenants in the market sector. There are thus differences in quality, but it is not possible to make an overall judgement about one form of rental tenure being decisively preferred to the other on account of quality considerations. This is also because the gap in rent levels is small. The average rent in the market sector is higher, partly because the average rent in the regulated part of the market rented sector is 83% of the maximum rent, while this is 70% in the social sector. This means that dwellings in the social sector have, on aver-age, a more favourable price-quality ratio.
For France, evaluating the price-quality relationship is also complex. Rent levels are sufficiently different between the two sectors for a large gap to be apparent: social-sector rents are on average 64% of market rents. Detailed da-
[ 240 ]

ta also suggest significant geographical variations. For example, in Paris social rents per square metre are around 46% of those in the market sector but in small rural communities, social rents are 88% of market rents. Information on housing quality suggests that there is a moderate quality gap between the two sectors with higher quality in the social sector, where most of the dwell-ings were built after 1948. In the market rental sector, by contrast, half of the dwellings were built before 1948. In the market rental sector, 5% of dwellings ‘lack comfort’ while that figure is just 1% for social renting.
Property rightsWe have identified a large gap between both rental sectors regarding property rights in England, Flanders and Ireland, a moderate gap in France, a small gap in Germany and no gap at all in the Netherlands. There are also differences, however, between the various types of property rights: rent control, tenant security, right to buy (England, Ireland, Flanders) and rent surcharge (France, Germany).
In rent regulation, large gaps can be identified between social and market renting in England, Flanders, France, Ireland and Germany – all countries, then, except the Netherlands. In the Netherlands, the distinction is made between (1) a rent-regulated sector, which is 95% of rental stock and which consists of all social and market rented dwellings up to a certain rent level, and (2) a rent-unregulated sector where rents are not regulated, as the term indicates. The unregulated rental stock consists of market rented dwellings, though they are sometimes provided by social landlords. In the other coun-tries, rents are usually regulated for social tenants and sitting market tenants, though using different methods, while new rent contracts are not regulated. As rent regulation forms part of housing policy, more detail on rent regulation will be provided in Section 9.3 on policy instruments.
Large gaps in security of tenure are apparent between the two sectors in England, Flanders and Ireland. In England, landlord/tenant contracts dif-fer significantly between the sectors, and security of tenure varies consider-ably within these contracts, with social-sector tenants enjoying much more security. In Flanders, indefinite contracts in the social rental sector contrast with standard nine-year contracts in the market rental sector, and the also popular shorter contracts. In Ireland, despite improved security for market tenants since 2004, security of tenure is significantly higher in the social sec-tor, whereas social tenants in England effectively have lifetime tenancies. In France, tenant security in the social rental sector is better than in the mar-ket rental sector. However, since tenant security in the market rental sector is still relatively good, we have classed this gap as moderate rather than large. Tenant security in the regulated market rental sector (intermediate rental sector) is approximately equivalent to that of the ‘normal’ market rental sec-tor in France. The countries that differ on this aspect are Germany and the
[ 241 ]

Netherlands, where tenant security is exactly the same in the social sector and the market sector. For those countries shown to have indefinite security of tenure in the social sector (Table 9.1), there are no time limits on the dura-tion of tenancies, as long as they keep to the terms of their tenancy.
The existence of a right to buy for social-sector tenants in England, Flan-ders and Ireland creates a large gap on this aspect. In England, a right to buy exists for many social-sector tenants (including different, more limited, rights for housing association tenants). There is no equivalent for market tenants. In Ireland, a Tenant Purchase Scheme was in place before the scheme in Eng-land, since the early part of the last century in fact. It is available only to lo-cal authority tenants, not to the tenants of housing associations. In Flanders, there is also a right to buy in the social rental sector, provided the dwelling is not an apartment, is 15 years old or more, and the tenant has been renting it for at least five years. There is no equivalent right in the market rented sector. In both Germany, the Netherlands and France there is no right to buy in ei-ther of the rental sectors. In the Netherlands, however some housing associa-tions give their tenants a choice between renting or buying a dwelling. If they buy and subsequently choose to re-sell, they are obliged to sell the dwelling back to the housing association.
Additional property rights can affect the relative attractiveness of dwellings. A property right that exists for subsidised or social renting in France and Ger-many is the possibility of levying a rent surcharge when household income in-creases. In France, households with an income well above the income ceil-ing of the social rental dwelling concerned are required to pay a supplement on their rent in order to ‘compensate’ for their favourable financial situation. However, this only applies to a small proportion of tenants in the social rental sector. In Germany, tenancy agreements cannot be terminated, either. For this reason the federal government allows federal states to apply a rent surcharge in communities where the difference between subsidised rents and local ref-erence rents is relatively large. These rent surcharges are aimed at households with incomes of more than 20% higher than the limits set. All federal states except one have introduced the rent surcharge; one no longer applies the sur-charge. However, in practice it appears that the surcharge is rarely levied.
9.3 A comparison of the gap in policy between social and market renting in six countries
A second way of looking at the differences between social and market rent-ing is by examining the relevant housing policies, which will be the focus of this section. Firstly, Table 9.4 presents the information on policy for the so-cial sector and Table 9.5 presents the information on the market sector: al-location system, rent regulation, subsidisation and socio-economic profiles of
[ 242 ]

tenants compared to those in social renting. The extent of the differences be-tween both sectors is presented in Table 9.6. This evaluates whether the gap in policy between both tenures can be deemed large, moderate, small or non-existent. Before this, we will first discuss the purpose that social renting it is perceived to have within housing policy.
Principal policy purpose of social renting Table 9.4 sets out the principal purpose of the social rented sector within housing policy. The statements concern the provision of housing to house-holds with a certain income (England, France and Germany) and/or who can-not find or afford a market dwelling (England, France, Ireland and the Neth-erlands). In some countries, the purpose also involves the quality of the dwellings (Flanders and the Netherlands).
Such general policy statements confirm, on the one hand, that social rental housing does indeed have a special purpose within housing policy and on the housing market, which is not relevant for market landlords. How the general policy statements actually steer which types of households are housed will be discussed below.
On the other hand, such general policy statements mask the fact that in most countries a shift in the purpose of the social rented sector has taken place, from only housing objectives to wider social, economic or environ-mental policy objectives. Such goals are expressed as contributing to urban restructuring, as well as to creating a ‘good’ social mix in neighbourhoods, but also to the social cohesion of neighbourhoods. Leading physical or social neighbourhood initiatives or providing social services to tenants can also be counted among these wider goals. Other objectives can be found in the field of the environmentally friendly provision and production of housing, such as the reduction of pollution or the promotion of energy efficiency. Lastly, there is the housing of special groups, such as the elderly or public-sector workers in tight labour markets.
The country chapters provide some testimony to these broader societal goals to which social rental housing is expected to contribute. In England, so-cial renting is expected to contribute to wider social and economic objectives such as providing housing for ‘key-workers’, which is also the case in the Netherlands (under local initiatives). In the Netherlands, a broadening of the formal housing goals of social rented housing to include neighbourhood im-provement and the housing of the elderly was incorporated into the relevant Social Housing Act (BBSH) in the 1990s. Germany moved from housing policy to urban policy during approximately the same period. Urban policy has be-come increasingly important, and housing policy appears to serve urban pol-icy more than in the past, through the inclusion of more social cohesion ob-jectives for example. In Ireland, the need for new social housing development to contribute to both the physical regeneration and the social diversification
[ 243 ]

of neighbourhoods are policy reactions to run-down estates and the increas-ing residualisation of social housing. In France, social rental landlords have become very active in the urban renewal process.
Flanders seems to be the administrative area where housing policy re-mains the most closely associated with more traditional policy goals such as helping low-income groups into decent rental housing, though historically this has been more owner-occupied housing. However, Flanders does include language and citizen requirements for prospective social tenants. Vulnerable households are not only helped into housing by the Social Rental Agencies, but receive other individualised help as well.
The Flemish goal of improving housing quality mainly seems to be rele-vant to the market rented sector. A relatively extensive regulatory framework seems to have been developed to achieve this goal. as on a comparative basis an apparently elaborate system exists. As well as an administrative procedure, the Flemish Housing Inspection can also use a stronger instrument – criminal prosecution – the results of which are fines and/or prison sentences.
[ 244 ]
Table 9.4 Policy for social renting*
England Flanders France Germany Ireland Nether lands
Principal purpose of social renting
Safety net for low-income households
To build and provide social rental dwellings and to revalue the housing stock (right to decent housing)
To provide affordable housing to households on low incomes
To rent to households up to certain income limits
House those unable to afford market sector housing
To house people who are unable to find an appropriate dwelling for themselves
Allocation system According to need According to need According to need According to need According to need According to need
Rent regulation for new contracts
According to policy prescription
Rents based on tenants’ income and market rent (Flemish policy formula)
Rent setting depends on contract between government and social landlord
Contract between subsidy provider (munici pality) and landlord
Income-related rents; each council has its own scheme
Regulated sector: based on quality points.Unregulated sector: market rents
Rent regulation for rent adjustment
Policy to link rents to quality and local incomes in the longer term
Adjustments in line with household income
Influenced by the government
Contract between subsidy provider (munici pality) and landlord
Adjustments in line with household income
Regulated sector: annual maximum rent increase set by government
Regulation and supervision of landlords
By Office of Tenants and Social Landlords
Flem ish government: supervision and registra tion. Sector orga ni s a tion, VMSW: fi nance and guidance
Supervised by central government organisa-tion: MIILOS, financial supervision by Caisse des Dépôts
Depends on organis ation type By central govern ment Social Housing Management Decree for housing associations. External supervision by Minister
Bricks-and-mortar subsidies Available Available Available Available Available Not available
Tax conces sions Available; depends on legal status of landlord
Available Available Available Available; variations between local authority and housing associations
Not available as of 2008
Housing allowances Available Implicit via income-related rents
Available Available Not available Available
Socio-economic profiles of tenants compared to market renting
Lower incomes Lower incomes and weaker social profile
Relative concentra tion of low-income households
Probably relatively more lower incomes presently than in the past
Low incomes Relatively strong in lower and middle-income deciles
* Social renting refers to the main landlords in a country providing social rental dwellings, not to the small-scale activities in the social sector of private landlords in England, Flanders and Ireland.

Allocation systemFor all six countries, the allocation system – according to our definition (see Section 1.2) – produces a large gap between the sectors. Market dwellings are allocated by supply and demand on the basis of price (demand-based alloca-tion). Landlords providing market rental dwellings are thus not bound by al-location rules unless they provide dwellings for social tenants (as occurs in Flanders and Ireland, see below).
Social dwellings, on the other hand, are allocated by criteria, which means some kind of needs-based allocation in all six countries. ‘Needs-based’ usu-ally implies that income level is one of the criteria (Flanders, France, Germany, Netherlands). Usually, income level is set nationally, but put into effect locally. In Flanders this means, for instance, that if a local allocation code is drawn up, income limits may be higher than under standard allocation rules in order to maintain the liveability of a neighbourhood. In the Netherlands, where lo-cal allocation codes are also drawn up for similar reasons as the Flemish ones, income limits can be ignored totally. In Germany, federal states are allowed to
[ 245 ]
Table 9.4 Policy for social renting*
England Flanders France Germany Ireland Nether lands
Principal purpose of social renting
Safety net for low-income households
To build and provide social rental dwellings and to revalue the housing stock (right to decent housing)
To provide affordable housing to households on low incomes
To rent to households up to certain income limits
House those unable to afford market sector housing
To house people who are unable to find an appropriate dwelling for themselves
Allocation system According to need According to need According to need According to need According to need According to need
Rent regulation for new contracts
According to policy prescription
Rents based on tenants’ income and market rent (Flemish policy formula)
Rent setting depends on contract between government and social landlord
Contract between subsidy provider (munici pality) and landlord
Income-related rents; each council has its own scheme
Regulated sector: based on quality points.Unregulated sector: market rents
Rent regulation for rent adjustment
Policy to link rents to quality and local incomes in the longer term
Adjustments in line with household income
Influenced by the government
Contract between subsidy provider (munici pality) and landlord
Adjustments in line with household income
Regulated sector: annual maximum rent increase set by government
Regulation and supervision of landlords
By Office of Tenants and Social Landlords
Flem ish government: supervision and registra tion. Sector orga ni s a tion, VMSW: fi nance and guidance
Supervised by central government organisa-tion: MIILOS, financial supervision by Caisse des Dépôts
Depends on organis ation type By central govern ment Social Housing Management Decree for housing associations. External supervision by Minister
Bricks-and-mortar subsidies Available Available Available Available Available Not available
Tax conces sions Available; depends on legal status of landlord
Available Available Available Available; variations between local authority and housing associations
Not available as of 2008
Housing allowances Available Implicit via income-related rents
Available Available Not available Available
Socio-economic profiles of tenants compared to market renting
Lower incomes Lower incomes and weaker social profile
Relative concentra tion of low-income households
Probably relatively more lower incomes presently than in the past
Low incomes Relatively strong in lower and middle-income deciles
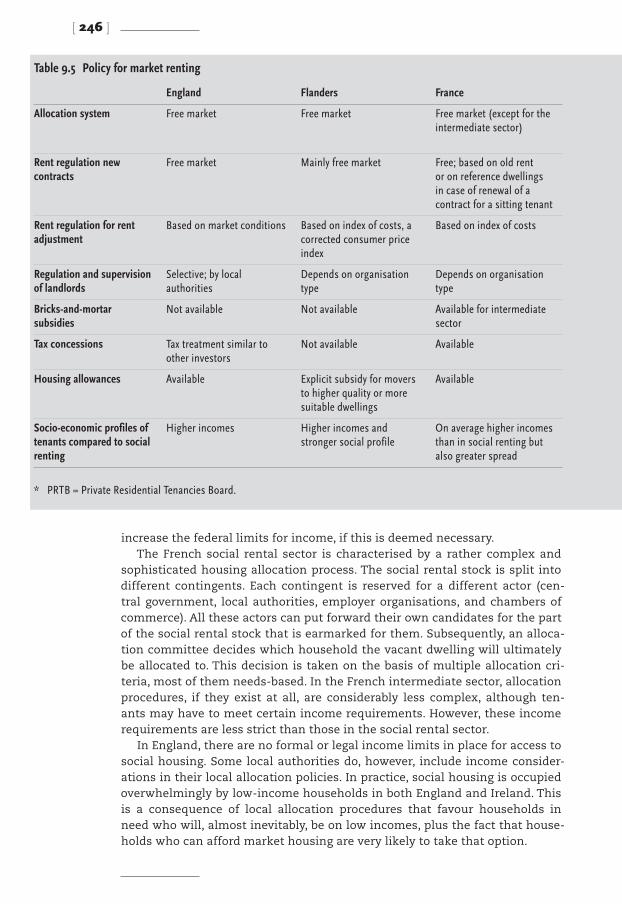
increase the federal limits for income, if this is deemed necessary.The French social rental sector is characterised by a rather complex and
sophisticated housing allocation process. The social rental stock is split into different contingents. Each contingent is reserved for a different actor (cen-tral government, local authorities, employer organisations, and chambers of commerce). All these actors can put forward their own candidates for the part of the social rental stock that is earmarked for them. Subsequently, an alloca-tion committee decides which household the vacant dwelling will ultimately be allocated to. This decision is taken on the basis of multiple allocation cri-teria, most of them needs-based. In the French intermediate sector, allocation procedures, if they exist at all, are considerably less complex, although ten-ants may have to meet certain income requirements. However, these income requirements are less strict than those in the social rental sector.
In England, there are no formal or legal income limits in place for access to social housing. Some local authorities do, however, include income consider-ations in their local allocation policies. In practice, social housing is occupied overwhelmingly by low-income households in both England and Ireland. This is a consequence of local allocation procedures that favour households in need who will, almost inevitably, be on low incomes, plus the fact that house-holds who can afford market housing are very likely to take that option.
[ 246 ]
Table 9.5 Policy for market renting
England Flanders France Germany Ireland Nether lands
Allocation system Free market Free market Free market (except for the intermediate sector)
Free market, waiting list for each landlord
Free market Allocation of cheap stock regulated in case of housing shortages
Rent regulation new contracts
Free market Mainly free market Free; based on old rent or on reference dwellings in case of renewal of a contract for a sitting tenant
Free market, unless usury rents Free market Regulated sector: based on quality points
Rent regulation for rent adjustment
Based on market conditions Based on index of costs, a corrected consumer price index
Based on index of costs Based on reference rents Annual reviews; based on market conditions
Regulated sector: annual maximum increase set by govern ment
Regulation and supervision of landlords
Selective; by local authorities
Depends on organisation type
Depends on organisation type
Depends on organis ation type By local authorities; and through statutory registration with PRTB*
Depends on organis ation type
Bricks-and-mortar subsidies
Not available Not available Available for intermediate sector
Not available Not available Not available
Tax concessions Tax treatment similar to other investors
Not available Available Available Selective fiscal incentives Exemption from corporate tax for institutional investors
Housing allowances Available Explicit subsidy for movers to higher quality or more suitable dwellings
Available Available Tax concessions for rental payments
Available
Socio-economic profiles of tenants compared to social renting
Higher incomes Higher incomes and stronger social profile
On average higher incomes than in social renting but also greater spread
No recent information found Mean incomes nearly twice social sector levels
Relatively strong in the lowest and highest income deciles
* PRTB = Private Residential Tenancies Board.

For social rental dwellings, even though there is generally a needs-based allocation system, elements of choice are sometimes also included, as is the case in choice-based letting systems in England and the Netherlands. In both countries, various allocation criteria and systems are in use. In England, it is the intended policy to have all local authorities use choice-based letting by 2010. The German system also includes an element of choice for tenants, who are able to choose their preferred landlords, with landlords having their own separate waiting lists. In Flanders, candidates on the waiting list for one so-cial landlord will be put on the waiting lists of other social landlords in the vi-cinity. The question here, however, is whether candidates will be able to wait for a dwelling offered by the landlord of their first choice. If that is indeed possible, one could speak of consumer choice in Flanders. Social housing allo-cation in Ireland and France includes no explicit element of individual choice.
Rent regulationLarge gaps can be identified between the social and market rental sectors in the rent regulation processes in England, Flanders, France, Ireland and Ger-many, thus all countries except for the Netherlands, as mentioned in the pre-vious section. The Netherlands classifies its rental stock into rent-regulated and rent-unregulated stock, regardless of whether a social or market landlord
[ 247 ]
Table 9.5 Policy for market renting
England Flanders France Germany Ireland Nether lands
Allocation system Free market Free market Free market (except for the intermediate sector)
Free market, waiting list for each landlord
Free market Allocation of cheap stock regulated in case of housing shortages
Rent regulation new contracts
Free market Mainly free market Free; based on old rent or on reference dwellings in case of renewal of a contract for a sitting tenant
Free market, unless usury rents Free market Regulated sector: based on quality points
Rent regulation for rent adjustment
Based on market conditions Based on index of costs, a corrected consumer price index
Based on index of costs Based on reference rents Annual reviews; based on market conditions
Regulated sector: annual maximum increase set by govern ment
Regulation and supervision of landlords
Selective; by local authorities
Depends on organisation type
Depends on organisation type
Depends on organis ation type By local authorities; and through statutory registration with PRTB*
Depends on organis ation type
Bricks-and-mortar subsidies
Not available Not available Available for intermediate sector
Not available Not available Not available
Tax concessions Tax treatment similar to other investors
Not available Available Available Selective fiscal incentives Exemption from corporate tax for institutional investors
Housing allowances Available Explicit subsidy for movers to higher quality or more suitable dwellings
Available Available Tax concessions for rental payments
Available
Socio-economic profiles of tenants compared to social renting
Higher incomes Higher incomes and stronger social profile
On average higher incomes than in social renting but also greater spread
No recent information found Mean incomes nearly twice social sector levels
Relatively strong in the lowest and highest income deciles

owns the dwelling. The determining feature is rent level. The other countries regulate social rents, and sometimes also market rents, but always using dif-ferent systems.
In most countries, the regulation of social rents is not based on household incomes, but on the characteristics of the dwelling and/or financing. Flanders and Ireland are the exceptions here since the cost price or market rent of the dwelling plus the income and composition of the household determine the social rent set. In Flanders, the market rent for a comparable market rental dwelling is the starting point for the calculation, while in Ireland it is cost price. So the gap between social and market renting in terms of rent regula-tion may be considered smaller in Flanders than in Ireland.
For the regulation of market rents, most countries make a distinction be-tween sitting market tenants and market tenants with a new contract. The exceptions are England and Ireland, where there is now no rent regulation at all and both new contracts and rent adjustments are negotiated according to market conditions. The other countries (Flanders, France and Germany) also have no regulation for new contracts in the main (except possibly for usury
[ 248 ]
Table 9.6 The gap between social* renting and market renting in policy and policy instruments
England Flanders France Germany Ireland Nether lands
Purpose of social or market renting
Large Large Large Large Large Large
Allocation system Large Large Large Large Large Large
Rent regulation for new contracts
Large Large Large Large Large None
Rent regulation for rent adjustment
Large Large Moderate Large Large None
Regulation and supervision of landlords
Large Large Large No information found
Large Large
Bricks-and-mortar subsidies
Large Large Large Large Large None
Tax concessions Large Large Large, except interme diate sector
None Large Small (as from 2008)
Housing allowances Very small Relatively large** None None Large None
Socio-economic profiles of tenants
Large Relatively large*** Moderate Probably, because of focus; no information found
Large Moderate
Movements between sectors
Large No informa tion found
No informa-tion found
No information found
No information found
Moderate
* Social renting refers to the main landlords in a country providing social rental dwellings, not to the small-scale activities in the social sector of private landlords in England, Flanders and Ireland.
** But some kind of allowance available in both social and market rent. *** But also group with very low incomes, especially after housing expenses are taken into account, in market rent.

regulation), and regulate existing contracts in line with inflation (Flanders), an inflation-based index (France) or in line with rents of existing and new con-tracts (Germany).
The French intermediate sector (which is not in the tables) occupies a mid-dle position between the social and market rental sectors: the initial rent set-ting is roughly comparable to the way it is done in the social rental sector, but the annual rent increase is comparable to the market rented sector.
Landlords in Ireland that supply dwellings under the RAS receive market rents under contracts with local authorities, but tenants pay income-related rents. Dwellings let via the Flemish SRAs will have lower-than-market rents, mainly because of the cost reductions that market landlords achieve by hav-ing the SRAs carry out management work. For social rental dwellings realised under Flemish public-private partnerships, social rents will be calculated as for any other social tenant.
Regulation and supervision of landlordsIt appears that the gap between social and market renting is large in all coun-tries, as far as the regime of regulation and supervision of landlords is con-cerned. In countries where there is a legal category of social landlords, which is the case in all countries except Germany, these social landlords will have to be accredited or registered.
In general, accreditation or registration implies that social rental landlords are regulated, and this focuses specifically on housing. This does not appear to be the case in Germany, apart from the regulation that occurs within the bricks-and-mortar subsidy regime. Social landlords in the other countries must meet government-imposed targets on which they are directly super-vised to some extent. In England, social landlords are obliged to undergo in-spections and audits; in the Netherlands, this is the decision of the landlord, although the umbrella organisation has recently made this a binding require-ment.
In France, the state-regulated Caisse des Dépôts is responsible for the finan-cial supervision of the social rental sector. The general performance of the so-cial rental landlords is evaluated by a central government organisation called MIILOS. This organisation can impose sanctions on social rental landlords that are not performing well.
Social housing regulation in Ireland is relatively light but performance in both the local authority and housing association sectors does have to be deemed satisfactory to justify the receipt of funding.
In the market sector, Table 9.5 mostly describes regulation as ‘depends on organisation type’. This signifies that there is no special regulation for land-lords offering market housing, just general regulation on competition, su-pervision and reporting for such organisation types (legal status), regardless of the line of business they are in. The exceptions are England and Ireland.
[ 249 ]
In England market-sector landlords can be required to obtain a licence from the local authority. This licensing is selective and means that local authori-ties can use licensing to attempt to improve housing conditions in the market sector in prescribed circumstances. For houses in multiple occupation, licens-ing is mandatory.
Bricks-and-mortar subsidies We see a large gap between the social rented sector and the market sector in most countries with regard to the availability of ‘bricks-and-mortar’ subsidies. The exception is the Netherlands, where there is no gap between the two rental sectors because bricks-and-mortar subsidies were discontinued in 1995.
In the other countries, bricks-and-mortar subsidies are primarily targeted towards the provision of social rented dwellings by social landlords. Only in Germany are subsidies available on the same terms to both non-profit land-lords and commercial landlords. With respect to bricks-and-mortar subsi-dies in Germany, then, there is a large gap between social and market rented dwellings but no gap between non-profit and for-profit landlords.
In England, Flanders, Ireland and France, we can find various initiatives to narrow the gap between the social and market rented sectors. Thus, private contractors in England have since 2004 been eligible to build and manage so-cial housing under contract to the Housing Corporation. Such contracts du-plicate the conditions followed by housing associations. These contracts have, however, been concluded with commercial developers on a limited scale, with a small number of commercial social housing developers handing over man-agement to a housing association.
In Flanders, most non-profit organisations can bid for contracts to provide social rented housing. However, the gap has closed a little since 2003 when it was made possible for private investors to obtain object subsidies to construct social dwellings. Since the subsidisation of Social Rental Agencies (accredited, non-profit organisations; 29 out of 40 receiving a subsidy) is mainly used for staff, they are not considered as receiving bricks-and-mortar subsidies.
The situation is different in Ireland, where only certain types of socially-oriented provider are eligible for subsidies and no support is available for market landlords. A large gap is narrowing somewhat in Ireland due to the ability of the private sector to offer social dwellings under the Rental Ac-commodation Scheme. Market landlords receive market rents for a specified contract period. The certainty of this flow of income is higher than for a nor-mal market rental contract (the risk of tenants defaulting or moving on is re-moved). This certainty and risk reduction can be viewed as a form of govern-ment support.
Finally, in France the gap is not narrowed by the availability of subsidies for the provision of social rented dwellings by commercial landlords, but by creating an intermediate sector ‘in between’ the social and the market rented
[ 250 ]

sectors. Both social rental landlords and commercial landlords can apply for subsidised loans to provide intermediate housing.
Tax concessionsWith the exception of Germany, where tax relief on depreciation applies to all rented properties, tax concessions are available on a much larger scale for social rented dwellings than for market rented dwellings. That was the case until 2008 at least. In January 2008, exemption from corporate tax for housing associations was abolished in the Netherlands and housing associations now have to pay full corporate tax.
In England, Flanders, France, Ireland and the Netherlands (until 2008), so-cial housing providers benefit from special tax concessions. In most countries, then, a large gap exists between the two rental sectors with respect to tax concessions, although some form of tax concession is available in the market rented sector in several countries (Ireland, France) or in a part of the market rented sector (the Netherlands).
In the Irish market rental sector, a proportion of the cost of capital expen-ditures can be deducted from rental income and in France there are several tax concessions for individual households that invest in the construction or refurbishment of market rental dwellings. In the Netherlands, institutions which only make investments (such as insurance companies or pension funds) may be exempt from corporate tax, provided they pay a dividend to the shareholders. Housing allowancesHouseholds in the rental sector can be subsidised on an individual basis in two different ways. Housing allowances can be made available explicitly, on the basis of the income, household composition and/or the rent of the dwell-ing. Alternatively, a system of implicit housing allowances can be put in place. In this case, income-based rents are charged.
In four of the six countries studied in this research (England, France, Ger-many and the Netherlands), explicit housing allowances are available to ten-ants in both the social and the market rental sectors. In these countries, there is no difference (or in the case of England hardly any difference) between the two rental sectors. This means there is no gap or a small gap between the so-cial and the market rented sectors.
In Flanders and Ireland, on the other hand, the lack of an overarching sys-tem of housing allowances for the two sectors creates a relatively large gap. In both countries there is a separate system in each sector. In Flanders, im-plicit housing allowances are achieved via differential rent setting for rental dwellings owned by social landlords. This is not the case for the some 3,000 market dwellings that are let out via the Social Rental Agencies to vulnerable households. In the market rental sector, households with limited incomes
[ 251 ]

moving to dwellings within prescribed quality limits can apply for assistance. A total of 2% of tenants receive such a subsidy. In Ireland, although there is not one unified scheme, there are income-based rents systems in the social sector (including tenants housed under the Rental Accommodation Scheme) and income-related assistance in the market sector. Market tenants also have the right to income tax concessions for rental payments.
Socio-economic profiles of tenantsLooking at the socio-economic profile of tenants, we see a larger gap between the market rented sector and the social rented sector in England, Ireland and Flanders. In these countries, social tenants have a much weaker socio-eco-nomic profile on average. and they are very different from market tenants in terms of income, benefit-dependency, age and other socio-economic charac-teristics. Younger households and single-person households are under-repre-sented within the social rented sector, whereas low-income households and welfare-dependent households are over-represented.
Flanders, with its rather large gap, may at the same time also be regarded as something of an exception. Social tenants do indeed tend to have a weaker social profile (especially in educational terms) and a lower average income than market tenants. However, a substantial group of low-income households with lower average incomes than in the social rental sector (after the deduc-tion of rent) can be found in the market rented sector. They most probably find themselves in market rented accommodation because of the small mar-ket share of social renting. Long waiting lists for social rental dwellings seem to be an indication of this.
In France and the Netherlands, the differences between social tenants and market tenants appear to be somewhat smaller than in England and Ireland, although only limited information on France was available. In the Nether-lands, both rental sectors provide housing to a broad range of income groups. The market rented sector is, however, more evenly distributed across the dif-ferent income groups than the social rented sector. For Germany, information on the socio-economic profile of the social and market rented dwellings was not found. Based on the allocation procedures for social housing in Germa-ny we can, however, assume that social tenants tend to have a weaker socio-economic profile than market tenants. We can also assume that the switch in policy away from broad layers of the population has also caused a shift towards those with a weaker socio-economic profile.
In most countries, the variation in the characteristics of dwellings as well as tenants is larger within the market rented sector than within the social rented sector. Within the market rented sector, various segments can be dis-tinguished: from low-quality, substandard dwellings to high-quality, up-mar-ket housing.
[ 252 ]

Movement between sectorsThe movement of households between different sectors may be seen as an additional indicator for the size of the gap between social and market rented housing. A large difference between the socio-economic profile of social and market tenants suggests limited movement between the tenures. As a gen-eral rule, the limited movement of households between social and market rented housing may be associated with a larger gap between the sectors and more movement is associated with a smaller gap between the sectors. With respect to the movement between tenures, only information for England and the Netherlands is available.
In the Netherlands, where we identified a relatively small gap between the two rental sectors with respect to the socio-economic profile of tenants, moving from one rented sector to another is more common than in England, where we identified a much larger socio-economic gap between tenants of so-cial and market rented dwellings. In England, 77% of social tenants and 64% of market tenants who move house, stay within the same rented sector. In the Netherlands, the corresponding figures are 60% and 27%.
Movement from the private rental sector to the social rental sector is much more common in the Netherlands (accounting for 32% of the social tenants who move) than in England (11%). However, a move from the social rental sec-tor to the private rental sector is more common in England (accounting for 16% of the social tenants who move) than in the Netherlands (8%).
In general, more people move in and out of the rental sectors in the Neth-erlands than in England and movements between both rental sectors appear to be more common in the Netherlands than in England. We may conclude, then, that the gap between the social and the market rented sector in Eng-land is larger than that in the Netherlands.
9.4 Similarities and differences in six countries summarised
Conclusions on who provides whatThe features of social and market rented dwellings that we examined in terms of who provides what indicate that on types of landlords, the distinc-tion between profit and non-profit landlords is generally clear in each coun-try except Germany where any type of landlord is able to provide subsidised dwellings (see Table 9.3). In the main, in these countries one can speak of a social sector or social tenure, consisting of social, non-profit landlords, and a market sector or market tenure, consisting of profit-oriented private per-sons and firms. The boundaries between social and market renting are rather blurred, however, as profit landlords also provide social dwellings on a small scale in England, Ireland and Flanders. A move in the opposite direction can
[ 253 ]

also be discerned in the Netherlands and England, where social landlords are becoming more market-oriented and producing market housing. In France, there is an intermediate sector which is clearly distinct from social renting, and social and market landlords provide these dwellings.
England and Ireland are the two countries where the differences between the two tenures is large in terms of all features in Table 9.3, indicating that the sectors differ as far as ‘who provides what’ is concerned. In Flanders, France, Germany and the Netherlands, the differences appear to be generally more mixed in nature than for England and Ireland, and are not large in at least one (or part of one) of the aspects discerned. The gap between both sec-tors seems to be the smallest in Germany and the Netherlands, but in differ-ent ways. In Germany there is no gap between social and market renting for landlord type and tenure security, while in the Netherlands there is no differ-ence between the tenures in terms of any of the property rights.
Conclusions on policyWith respect to policy and the use of policy instruments, the gap between so-cial renting and market renting is large for most of the features examined in England, Flanders, Ireland, and to a lesser extent in France (see Table 9.6). In Ireland, England and Flanders in particular, social renting and market renting are treated as two separate sectors by government. Each of the sectors has its own policy and policy instruments. In fact, both rental sectors have a dif-ferent function in the housing market. As a result, there is a large difference in the socio-economic profile of tenants between the two sectors. Although in France the gap between the two rental sectors is large for the majority of policy instruments, the difference in the socio-economic profile of tenants is moderate.
In Germany, the picture is less clear, though the policy gap may be consid-ered smaller rather than larger. The gap between social and market rented dwellings is large, especially in terms of bricks-and-mortar subsidies, but this gap is temporary and no distinction is made between non-profit and for-prof-it landlords when applying for these subsidies. Different types of landlords (profit as well as non-profit) can be active in both the social rented sector and the market rented sector on the same terms.
The other country, in addition to Germany, where the policy gap between social and market renting is relatively small is the Netherlands. Although there are differences, especially with regard to the purpose of the sectors, the allocation of dwellings and the regulation and supervision of landlords, most of the policy instruments are similar for both sectors.
[ 254 ]

9.5 Competitive gap between sectors
This section will describe the key features of substitutability and rivalry on a country by country basis, in order to assess the degree of competition be-tween both rented sectors on the housing market in each country.71 The key features of the substitutability between social and market rented housing are summarised in Table 2.3. The main questions from the consumer’s perspec-tive relate to the relative attractiveness of the two rented options and the possibility of choosing between them. In Table 9.7, the features identified in Table 2.3 are applied to each of the six countries in the study. On rivalry, the key features between social and market rented housing are summarised in Table 2.4. The main questions from the provider’s perspective relate to wheth-er they are supplying similar products to a similar customer base, compared with other providers; in short, whether they are ‘in the same market’. They can only be rivals if they are in the same market. In Table 9.8, the features identified in Table 2.4 are applied to each of the six countries in the study.
EnglandThe information in Table 9.7 suggests a very low level of substitutability be-tween the two rental sectors, meaning that it is unlikely for social-sector ten-ants to be able to find acceptable substitutes in the market sector. Significantly higher rent levels (social rents are about 50% of market rents) and less security of tenure in the market sector, coupled with the relatively lower incomes of social tenants mean that the vast majority of social tenants will be neither willing nor able to consider the option of market-sector renting. They would be unlikely to be able to find accommodation of a suitable quality for an af-fordable rent to satisfy their requirements in the market sector. Market-sector tenants are, on average, unlikely to be able to access the social housing be-cause their higher incomes and personal circumstances will mean that they fail to meet the needs-based allocation criteria for social housing. Needs-based allocation in the social sector contrasts with demand-based allocation in the market sector (despite choice-based letting in the social sector). Some may be willing to consider social housing as a substitute, but the realities of allocation may well exclude them from entering the sector. Differences in the quality of neighbourhoods are also likely to affect substitutability, with the higher quality of many market-sector neighbourhoods making them more attractive to households that can afford such housing so that social housing neighbourhoods appear poor substitutes. The property rights of the two sets of tenants vary markedly and security of tenure is significantly higher in the social sector, where tenants effectively have lifetime tenancies. A right to buy
71 A first version of this text was presented in Haffner et al. (2008).
[ 255 ]

exists for many social-sector tenants (including different, more limited rights for housing association tenants) but there is no equivalent for market tenants.
It might be argued that if government could successfully promote inter-mediate rented dwellings at rent levels above those of social rented housing but below market rented housing, this could constitute an effective bridge be-tween the social and market sectors. These dwellings would, however, be in-tended mainly for households who, according to policy guidance, are unable to buy as opposed to those who cannot afford to rent privately. In practice, the low level of movement between the social and market sectors suggests that the desire and opportunities for substitution are low.
Social landlords are non-profit organisations, whereas market landlords are mainly profit-making individuals or firms. The differences in motivation between profit-oriented market landlords and non-profit social landlords will in principle exclude the possibility of rivalry between the two sorts of suppli-ers. The pressure on social landlords to meet government-imposed social and economic objectives that go beyond simply housing low-income households reinforces the notion that these landlords supply different products and have different motives. The differences in the subsidisation, taxation, regulation and the characteristics of the products supplied reinforce this division between the two types of landlords. Given these factors, plus the fact that the two types of landlord will be seeking to satisfy the demands of customers with different so-cio-economic profiles, it is highly unlikely that suppliers in the two sectors will consider themselves to be rivals. In summary, then, the evidence on the mo-tives of landlords, product characteristics and the customer base resulting from different methods of allocation (Table 9.8) all suggest a low level of rivalry.
[ 256 ]
Table 9.7 The substitutability gap in six countries*
England Flanders France Germany Ireland Nether lands
Accom modation
Quality and rents Large for both quality and rent
Moderate for both quality and rent
Moderate for quality, large for rent
Small for quality; depends on locality for rent
Large for both quality and rent
Small for both quality and rent
Property rights
Rent regulation Large Large Large Large Large None
Tenant security Large Large Moderate None Large None
Right to buy Large Large None None Large None
Other: rent surcharge**
None/not applicable
None/not applicable
Large Large None/not applicable
None/not applicable
Allocation systemand choice between tenures
Large Large Large Large Large Large
Housing allowances
Small Large None None Large None
* The larger the gap the smaller the likelihood of substitution from the consumer’s perspective. ** A surcharge is levied, once income exceeds income limits.

The gap may have closed a little since 2004, as grants for social housing investment have been available to private contractors and developers, as well as housing associations. Private contractors are thus now eligible to own and manage social housing under contract to Housing Corporations. Such con-tracts duplicate the conditions followed by housing associations. This new source of potential rivalry has, however, yet to materialise on a significant scale.
Overall, there remains a low level of competition between social and market housing and a large gap between the sectors.
FlandersThe information on substitutability in Table 9.7 suggests that substitutability be-tween both social and market renting is relatively low because of the mainly larger gaps between both sectors. In the social rented sector, which is essen-tially publicly run, despite the private legal status of the majority of organisa-tions, the quality of the dwellings is perceived as better on average than that of the market rented stock. Tenants pay lower average rents than in the mar-ket rented sector. Waiting lists and needs-based points are the key features of the allocation system, as opposed to demand allocation for market dwellings. A limited right to buy is available and tenants have security for (much) longer periods than in market renting, after a trial period of two years. Rent setting is differential. In the market rented sector, rent setting is not differential, thus no implicit housing allowance is available, only a small-scale explicit allow-ance for tenants who move to a better quality or more suitable dwelling.
[ 257 ]
Table 9.8 The rivalry gap in six countries*
England Flanders France Germany Ireland Nether lands
Motives of landlord
Large Large Large Small*** Large Large
Product character istics (price and quality)
Large Moderate for quality, large for rent
Moderate Small for quality, different for rent level per locality
Large Small
Allocation system and customer base
Large Large on alloca-tion, large on customer base on average**
Large Large Large Large
Rivalry for contracts to provide social rental dwellings
Large on offering social rented dwellings, small on govern ment support
Large Large. Only in a part of the intermediate rented sector there is rivalry between social rental landlords and market rental landlords
None for rivalry for government support
Large None/not applicable
* The larger the gap the smaller the likelihood of rivalry from the landlord’s perspective. ** But also group with very low incomes in market rent. *** Legal non-profit status seems to be relatively scarce.

Substitutability between the two rented sectors can thus be considered low. Up to the income limits that apply in the social rented sector, prospective so-cial tenants can choose a private rented dwelling, but this will usually have a worse price-quality ratio than that of social rented dwellings because the social rented sector is very small and the waiting lists are long. It could there-fore be argued that there is ‘forced substitutability’. Many low-income house-holds do indeed live in market rented dwellings because they have little other choice. Their average income, after the deduction of housing expenditure, will be lower than that of social tenants because of the difference in rent levels between both tenures.
Rivalry between market and social landlords can also be considered rela-tively low, as Table 9.8 shows. This is the other side of the coin of the low level of substitutability already described. The characteristics and property rights of the housing services offered are largely different. The two sets of suppli-ers generally provide different items in different markets. The same applies to the motives of the landlords – generally profit in market renting, and non-profit in social renting. Lastly, the system of allocation also segregates house-holds that are customers of social housing providers, although long waiting lists and a relatively plentiful supply of available dwellings in the market sec-tor provide some counterweight here, as explained before.
Rivalry is not always the flip side of the substitutability coin, however, in rivalry between the two rented sectors in supplying social rental dwellings, for example. There are two types of initiatives here. Firstly there is the object subsidisation of private investors who build social rental dwellings within schemes of public-private cooperation. This initiative, which stimulates ri-valry between landlords in the supply of dwellings, is on a small scale, how-ever. Secondly, there is the work of the Social Rented Agencies, which also stimulates rivalry in the supply of dwellings. In these two situations, rivalry between landlords from the two sectors exists, and if rivalry leads to an ex-tra supply of social dwellings via a different allocation system, there will also be more choice for consumers. Overall, due to the small scale of activities of Social Rental Agencies, which also focus on vulnerable households, and the even smaller-scale of activities of public-private partnerships, the likelihood of more choice for consumers is, in practice, small. The rivalry gap in the sup-ply of social rental dwellings thus remains rather large.
In summary, despite some trends which are contributing to closing the gap between the social and market sectors, there remains a large gap and the de-gree of competition between the two sectors remains small, as Table 9.9 shows.
FranceOne can discern three types of rented dwellings. First of all, there are those dwellings that are truly ‘social’, meaning that they are aimed exclusively at lower-income segments of the population. Social rented dwellings are allocat-
[ 258 ]

ed by means of a complex and sophisticated needs-based housing allocation system. They are also subject to strictly regulated maximum rents. Immedi-ately above this social rented sector, there is an intermediate sector, in which different types of landlords (social rented landlords, commercial organisa-tions and individual households) can apply for government support. In com-pensation for this government support, intermediate dwellings are usually tied to certain regulations with regard to rent setting and the income of the tenants. Finally, there is an unsubsidised rented sector, in which there are no income limits for tenants and no policy-controlled housing allocation system.
On the topic of substitutability, Table 9.7 shows us that although social rented dwellings are generally larger and higher quality than market rented dwellings, the quality differences between the two rented sectors can be de-scribed as moderate. However, if we also take into account geographical loca-tion the substitutability gap grows considerably: social rented dwellings are mainly concentrated in the larger cities, which means that in many smaller villages there simply is no rental alternative to the private rented sector.
[ 259 ]
Table 9.9 Summarising the gap* on competition based on the applicable gaps of substitutability and rivalry
Substitution gap Rivalry gap Competition gap
Ireland Large on all dimensions, not applicable on rent surcharge
Large on all dimensions Large on most dimensions
Flanders Large on most dimensions, moderate on quality, not applicable on rent surcharge
Large on most dimensions**, moderate on quality
Large on most dimensions
England Large on most dimensions, small on housing allowances, not applicable on rent surcharge
Large on most dimensions, small on rivalry for government support
Large on most dimensions
France*** Large on rent and rent regulation and allocation system, moderate on quality and tenant security, none on right to buy and housing allowances
Large on motives, allocation system and rivalry for government support, moderate on quality
Large on most dimensions
Germany Large on rent regulation, rent surcharge and allocation system, different on rent, small on quality, none on right to buy, tenant security and housing allowances
Large on allocation system, different on rent, small on motives and rivalry for government support, none on quality
Smaller rather than larger
Netherlands Large on allocation system, small on quality, none on remaining dimensions
Large on motives and allocation system, small on product characteristics, none on rivalry for government support
Smaller rather than larger
* The larger the gap the smaller the likelihood of substitution from consumer’s perspective or rivalry from the landlord’s perspective.
** Also a group with very low incomes, especially after taking account of housing expenditure, in market rent, even though gap is large on average.
*** The French intermediate sector is not included in the table. This sector occupies a middle position between the social rental sector and the market rental sector. Consequently, it has a relatively small substitution, rivalry and competition gap with both these sectors.

With regard to rent levels, there also is a considerable substitutability gap, with social rented sector rents on average just 64% of market rents, with a larger difference in the cities than in the countryside. These differences are caused partly by the fact the rent regulation also clearly differs between the two rented sectors. The rents in the social rented sector are based essentially on loans, with the help of which the dwellings are built, whereas rents in the market rented sector are based largely on housing market conditions.
In terms of housing allocation, the substitutability gap also is large, with an extensive housing allocation system in the social rented sector and no for-mal housing allocation in the market rented sector. Tenant security is better in the social rented sector than in the market rented sector. However, since tenant security in the market rented sector is still relatively good, this gap has been described as moderate rather than large. As far as housing allow-ances are concerned, there is no gap between the two rented sectors.
Overall, we can conclude that there is a relatively large substitutability gap between the social rented sector and the market rented sector. Nevertheless, the intermediate sector appears to bridge this gap to some extent. Section 9.6.2 deals in more detail with this sector.
There is hardly any rivalry between landlords in the social rented sector and the market rented sector (see Table 9.8). Both sectors are subject to com-pletely different regulation and subsidisation mechanisms. However, rivalry is larger in the intermediate rented sector, where both social rented and private rented landlords (commercial companies) can compete for state subsidies and contracts (this does not apply to the whole of the intermediate sector but only to a part of it).
The level of competition between social and market rented housing is, tak-ing all these points together, fairly low and the gap between the sectors is large. However, the development of an intermediate sector is reducing the size of this gap and increasing the degrees of substitution and rivalry within the rented sector as a whole.
GermanyOn the subject of substitution, Table 9.7 shows that there is a large gap be-tween subsidised and non-subsidised rented dwellings. This is mainly be-cause of the subsidy system which determines the allocation system and the rent regulation system,72 as well as the possibility of a rent surcharge. The gap will be temporary as subsidies and regulation are of limited duration.
The gap for allocation comes about because a household needs a residence
72 It appears that the large gap in rent regulation between subsidised and market housing has become
slightly smaller since the introduction of more market-oriented rent controls for subsidised dwellings
(1 January 2002).
[ 260 ]

permit (under certain income limits) in order to be entitled to a subsidised rented dwelling. Allocation for households without a residence permit is de-mand-based. Each landlord has its own waiting list, regardless of whether the list is for a subsidised or non-subsidised dwelling. Below the income limits for social rented housing, there will be a relatively greater choice for tenants as dwellings in the market rented sector are alternatives as well. Up to the in-come limits that apply for a social rented dwelling, however, potential social tenants may be forced to choose a non-subsidised rented dwelling, since the number of subsidised rented dwellings has decreased.
Other aspects of substitutability deliver smaller differences between social and market renting than those related to subsidisation. The gap in the quality of accommodation is probably smaller than the gap in rent levels. The gap in rent levels is not always present at all locations as rent levels for subsidised rents were based on cost rents and cost rents are not always by definition lower than market rents. Since rent setting for subsidised rental dwellings has since recently also been based on market rents, the gap may be smaller nowadays than in the past. Overall, substitutability between both rented sec-tors can be considered relatively high, as the relatively small gaps between both types of rented dwellings indicate. There is no difference between the two rented sectors in the formal incidence of tenant security (indefinite con-tract), the non-existence of a right to buy and the housing allowances avail-able.
Substitutability between the acceptable dwellings in the two rented sec-tors will probably be larger in areas where federal state income limits for sub-sidisation are higher than the minimum federal limits, unless the difference comes into existence because local rents are relatively high already. Where demand for subsidised dwellings surpasses local supply, candidates for a sub-sidised rented dwelling may well be forced to find a dwelling in the unsubsi-dised rented stock.
Since any landlord can apply for bricks-and-mortar subsidisation for ‘so-cial’ dwellings and the fiscal non-profit status is left to some ‘inactive’ rented cooperatives, rivalry between landlords may be assumed to take place (Table 9.8). It is highly likely that the suppliers of the two rented sectors will regard themselves as rivals in offering unsubsidised dwellings, but also in attaining a subsidy in order to offer subsidised rented dwellings for a specific period. Subsidisation schemes used to and may still offer ‘normal’ or at least ‘accept-able’ returns for the landlords.
In Germany, there are greater opportunities for substitution and a greater likelihood of rivalry between suppliers than is apparent in most of the other countries. The competition between sectors is greater and the gap is smaller than in most other countries, except the Netherlands, as Table 9.9 shows. Fi-nally, and importantly, the gap caused by bricks-and-mortar subsidisation is a temporary one.
[ 261 ]

IrelandThe information on substitutability based on the items in Table 9.7 suggests a very low level of substitutability between the sectors. Neither market nor so-cial tenants are generally likely to view accommodation in the other sector as a possible substitute for their accommodation. In Ireland, average quality is lower in the social sector, both in terms of the stock and neighbourhoods, but a significant amount of sub-standard accommodation is also available in the market sector. Income-related rents mean that there is unlikely to be a direct relationship between rents and quality in the social sector, whilst a more di-rect relationship is likely in the market sector. Despite the multidimensional nature of quality, it does appear that differences in quality significantly re-strict the degree of substitutability between the two sectors. Although there has been improved security for market tenants since 2004, security of tenure is significantly higher in the social sector. The existence of a right to buy for social-sector tenants but not market tenants also significantly differentiates the bundles of property rights in the two sectors and contributes to the large gap. Differences in rent and income levels, with both much lower in the social sector, suggest a picture of different customers for different products.
Likewise, social and market landlords are for the most part unlikely to view each other as rivals (see Table 9.8), since they cater for different needs and demands and provide different types of accommodation. There is a di-vision between non-profit motives in the social sector and profit motives in the market sector. However, the introduction of the Rental Accommodation Scheme in 2005, which has allowed market landlords to contract with local authorities to house social tenants, has changed this a little so that there are now some social landlords with profit-making motives. This Scheme re-mains small scale so far, however. The new role of the market sector under the post-2005 RAS may have the effect of increasing the function of the sector as a supplier of housing for welfare-dependent households if the new con-tracts with local authorities prove to be sufficiently attractive. From the sup-ply side, this policy initiative is, in very limited circumstances, creating rivalry between market and social landlords for the award of RAS contracts. The RAS is a distinctive feature of the Irish housing system and is the key factor in blurring the boundary between the otherwise clearly demarcated social and market sectors.
The rather large gap between the social and market rented housing sectors may thus be closing just a little. However, the overall conclusion is that com-petition between social and market housing is low and the gap between the sectors remains large.
NetherlandsIn terms of substitution, it appears that the overall quality differentiation be-tween the social sector and the market sector is small, as Table 9.7 shows.
[ 262 ]

Housing associations as well as market landlords let dwellings of a variety of quality ranging from low to high (with corresponding rent levels), although dwellings with relatively low and high quality are more strongly represent-ed in the market sector than in the social sector. The difference in levels of satisfaction with the dwelling itself between tenants in social dwellings and market dwellings is negligible. However, more tenants in the social sector are dissatisfied with their living environment than tenants in the market sector. There are differences in quality, then, but it is not possible to make an overall judgement about one form of rented accommodation being preferred to the other because of quality considerations.
There is no difference in rent regulation between the social sector and the market sector. Dwellings in both sectors with a rent under the deregulation limit (of €615 per month in 2006/2007) are subject to the maximum rent stip-ulated in the dwelling valuation system.
In terms of rent levels, there is a gap between both sectors, but it is small. The average market-sector rent is higher, partly because the average rent in the regulated part of the social sector is 70% of the maximum rent, while this figure is 83% of the maximum rent in the regulated part of the market sector. This means that dwellings in the social sector have on average a more favour-able price-quality ratio.
The allocation system produces a large gap between the sectors. Housing associations are obliged to prioritise low-income home seekers. Different al-location criteria and systems are used. Market landlords are not committed to any allocation rules.
In terms of tenant security (indefinite contracts) and housing allowances, there is no difference between the two sectors. Tenants in neither sector have a right to buy.
In principle, there is a high level of substitutability between the sectors. In practice, many people (on low and moderate incomes) have to choose be-tween a dwelling in the social sector with a relatively good price-quality ratio but a long waiting time, or a market dwelling with a less favourable price-quality ratio which is more accessible.
Market landlords’ motives are commercial, whereas housing associations are non-profit organisations with a social role. However, housing associations are becoming increasingly market-oriented and they are also involved in commercial activities (although profits must be reinvested within the housing sector). The rivalry gap between both rented sectors in terms of this aspect is thus diminishing (Table 9.8).
Because of the shortage of affordable housing in the Netherlands, there is no rivalry between market landlords and social landlords in this section of the market. However, market landlords consider social landlords as rivals in the market for more expensive rented dwellings. The IVBN (the Netherlands organisation of institutional landlords) submitted a complaint to the Europe-
[ 263 ]

an Commissioner for Competition arguing that housing associations use state support for letting ‘high-end’ housing with relatively low rents to households that do not belong, or no longer belong, to their primary target group.
All in all, the level of competition between market rented housing and social rented housing is relatively high, although the shortage of affordable housing in large parts of the Netherlands prohibits real competition in this sec-tion of the market.
Conclusions on the competitive gapOur analysis of the six countries and regions identifies four contrasting sets of circumstances, as suggested in Table 9.9:1. England, Ireland and Flanders – A large gap between social and market
renting with very different suppliers and very different consumers in the two sectors.
2. France – Significant differences between social and market renting in terms of dwellings, subsidies and types of suppliers, but an intermediate sector is also present, which provides options for the consumer between the two.
3. Germany – A small gap between social and market renting as a conse-quence of the absence of any division according to the type of landlord, coupled with some substitutability from the tenants’ point of view. The gap is, however, widened by the allocation and rent regulation systems.
4. The Netherlands – A small gap between social and market renting as a consequence of significant similar substitutable options open to tenants with some overlap in choice between accommodation in the two sectors. The gap is, however, widened by the allocation system and the contrasting motives of landlords.
These sets of competitive circumstances will now be considered in more de-tail. For the first set, the evidence suggests that in England, Ireland and Flan-ders there is a significant gap and very little competition between the social and market rented sectors (Table 9.9). Different types of institutions offer dif-ferent types of products with significant differences between the characteris-tics of the dwellings and neighbourhoods on offer in both sectors and access to those dwellings being based on different principles. The probability of ten-ants viewing the offers from each sector as substitutes is low due to differ-ences in rents and quality in each sector. The probability of suppliers consid-ering themselves as rivals is also low in these countries. There is a contrast between non-profit suppliers in the social sector and the commercially moti-vated firms and individuals in the market sector.
In France, although a large part of the unregulated part of the rented sec-tor is let by market landlords and social housing is provided by non-profit as-sociations, just as in England, Ireland and Flanders, a large gap and a lack of
[ 264 ]

competition between the traditional social sector and the market sector is bridged by a significant intermediate sector that has less stringent allocation criteria than the social sector. The intermediate sector creates an opportunity for social and market-sector landlords to be rivals for subsidies and contracts to supply housing that, in its rents and other characteristics, bridges the gap.
In the Netherlands and Germany, the lack of an intermediate sector means there is less of a gap and more competition between the sectors than in Eng-land, Flanders and Ireland. The reasons for this and the nature of the com-petition are, however, different in the two countries. In the Netherlands, al-though a large part of the unregulated section of the rented sector is let by market landlords and social housing is provided by non-profit associations, the overlap in the range of housing on offer in the two sectors and the size of the social rented sector means that there are possibilities for both substitut-ability by tenants and rivalry between suppliers. The overlap relates to rent levels and quality in the two sectors. The relative attractiveness of the social sector is enhanced by favourable price-quality relationships but hindered by the length of waiting lists. In Germany, the small gap arises from the absence of the usual division between social and market renting according to the types of landlord. The range of dwellings on offer, the quality of these dwell-ings and rent levels make for a high level of consumer substitutability. The fact that any landlord can be a social supplier provided the allocation rules are complied with means there is effective rivalry between suppliers. There is more scope for competition in the supply of rented housing in Germany than in any of the other countries.
Conclusions on the substitutability gapThe final section of the comparison of competition in this section will relate the information on substitutability in each country to the diagrammatic pre-sentation shown in Chapter 2. Figure 2.1 introduced the concepts of a long-term market supply (SS) curve and a social housing offer (AB) curve. While we do not have sufficient evidence to postulate the relative positions of these curves for each country and demonstrate the alternative choices between the sectors with a high degree of accuracy, some generalisations are possible.
For England and Ireland, the SS and AB curves in Figure 2.1 are relatively far apart, given the lower rents in the social rented than in the market rented sector. This difference in rents, together with quality differences, eligibility criteria for social housing and varying security of tenure, suggest that in Eng-land and Ireland substitutability between price-quality bundles A and X (for low-income households) are unlikely and substitutions between A and Y and B and Z (for medium and higher-income households) are virtually impossible.
This analysis also applies to Flanders, but an exception is made for low-income households, for whom substitutability between A and X can be an op-tion. In this case, potential social tenants unable to choose A (on the social
[ 265 ]
offer curve) because of the small social rented sector with long waiting lists may choose a dwelling with a worse price-quality ratio in the market sector. After housing expenditure, the average disposable income of these market tenants will be lower than that of social tenants because of the differences in rent levels between both tenures.
In France, we can also postulate an AB curve below the SS curve and there is a low likelihood of substitutability between points on the two curves. How-ever, one could also imagine, in the French case, an offer curve for the inter-mediate sector, between SS and AB, which may offer further substitutable op-tions from each sector.
It seems likely that AB is closer to SS in Germany than in the other coun-tries, given the rent and quality relationships. However, there will be geo-graphical variations, with the closest relationships and possibly the greatest opportunities for substitution in those federal states with relatively high in-come limits for subsidised housing and for residence permits. In some loca-tions, below the income limits for subsidised rented housing, households will accept a market alternative because of a scarcity in the subsidised sector. This may be regarded as ‘forced’ substitution, similar to the situation in Flanders.
Given that social landlords offer housing of a wide range of quality in the Netherlands, a longer AB curve than in the other countries would reflect this. We can imagine AB ‘stretched’ to the left and right in Figure 2.1. The more favourable price-quality relationships in the social sector mean that AB will be below SS for the whole of its length. For low-income households, AX type substitutability, and for medium-income households AY substitutability may well be feasible, with households selecting the market alternative despite so-cial sector availability because of long waiting lists.
9.6 Bridging the gap between social and market renting?
In the previous sections we have shown the similarities and differences that exist between the social and market rented sectors on a number of aspects, including housing policy. In Chapter 2 we identified reductions in these dif-ferences as one of three ways of closing the gap between the two sectors. The differences have been summarised in Section 9.4. In this section, the focus is on the two other ways that we identified to narrow the gap. Section 9.6.1 discusses policy initiatives that aim to stimulate competition between both tenures through greater substitutability and rivalry. The creation of an inter-mediate sector between the two tenures is the topic of Section 9.6.2. The for-mer initiatives will lead to a reduction of differences between the two tenures, while the latter will bridge the gap between them.
[ 266 ]

9.6.1 Promoting greater competition between sectors
In general, competition in the rental market may increase when several pri-vate parties, as well as other organisations, are active in supplying social rental dwellings. Such initiatives will generally increase rivalry between land-lords. If these initiatives lead to a greater range of housing on offer to house-holds, then from a consumer’s point view there will be more choice. Here we will describe which initiatives lead to which competitive effects in the coun-tries studied. Although our aim was not to study policy reasons for introduc-ing competition, it will nevertheless be a useful exercise to end this section with some arguments about why stimulating competition may or may not be a useful policy goal.
Examples from countriesThe supply of social-sector dwellings need not be left wholly to non-profit suppliers. We have shown several examples of market-sector involvement in social provision. This is typically achieved by means of a contract, either ex-plicit or implicit, which grants a private-sector body a grant or tax conces-sion in return for supplying dwellings at sub-market rents to tenants on low incomes. This has in fact been the standard method of ensuring social sup-ply in Germany, where any sort of organisation has been eligible to engage in such contracts and effectively all types of suppliers are rivals for the conces-sions that facilitate social rented housing. We have also shown that in France, profit-oriented private landlords are letting a limited share of the regulated rental stock (the so-called intermediate rental sector) as the government en-courages private individuals and commercial companies to let dwellings for moderate rents in exchange for grants, tax concessions or low-interest loans. These long-standing and far-reaching initiatives in France and Germany have in recent years been followed by new contract schemes in other countries. We have identified contrasting initiatives of this nature which have been launched in England, Ireland and Flanders and which could potentially en-courage a degree of competition between the sectors. However, these initia-tives remain on a very small scale and they vary in their objectives and in the precise outcomes in each country.
In England, the post-2004 opening up of subsidy opportunities to market developers was partly motivated by a search for efficiency gains and bet-ter value for money for public expenditure. It has resulted in some success-ful competitive bidding by the market sector for development funds, but the management of the schemes has been handed to non-profit housing associ-ations (even though it would be possible for market providers to engage in management) which have the required experience in this sector. Little has changed from the tenants’ viewpoint, however. Without the initiative, addi-tional dwellings might have been constructed by housing associations rath-
[ 267 ]

er than private developers and the management would in either case most probably have involved a housing association. There is effectively some small-scale competition for funding rather than more choice for consumers.
In Ireland, the RAS is primarily a response to the shortage of traditional so-cial housing but it is also a method of improving the quality and affordability of market rented housing for low-income households. Although the RAS con-tracts can be awarded to landlords in the social or market sectors, the scheme is not explicitly driven by a competition imperative. From the consumer’s per-spective, it increases choice only to a very limited extent. For a small number of households, there is the opportunity to accept secure and possibly high-er-quality housing from a market landlord at an affordable rent as opposed to staying in existing (usually market) accommodation under less attractive conditions.
In Flanders, there is a very limited subsidised public/private partnership scheme for social housing. The scale is so small (only around 200 dwellings in 2008) that it is of no significance in promoting competition.
A Flemish initiative introduced in the 1980s was the Social Rental Agency scheme that results in social-sector dwellings being supplied by market land-lords. It is larger than the public/private partnership scheme for social hous-ing, but is still on a small scale with around 3,000 dwellings, representing 0.2% of households, and it focuses on vulnerable households. The agencies are es-sentially grass-roots organisations that have been adopted by government to expand social-sector supply. These accredited and subsidised organisations contract with private landlords to supply accommodation to low-income ten-ants in return for the provision of some management tasks by the agencies. Lower costs for these landlords are then passed on to tenants in the form of lower-than-market rents.
The current degree of competition between the social and market sectors in England, Ireland and Flanders is small, as indicated by the large gaps for almost all items in Tables 9.7 and 9.8. Both substitutability and rivalry are low. The prospects for more competition in these countries are slight, despite the initiatives identified. This is partly because of the small scale and limited im-pact of these schemes but also because the gulf between the sectors is very large in terms of types of customers and providers. In Ireland and Flanders, moreover, competition does not feature prominently on the social housing agenda. This is not the case in England, where the Cave (2007) review of the regulation of social housing argued for more competition, although this is within the social housing sector and not explicitly between social and market renting.
In the Netherlands, there is significant competition between social and market housing because of the country’s history of social housing provision which has resulted in a relatively large sector with a range of quality and rents, which is able to produce housing that is comparable with the market
[ 268 ]

sector. Given the equal footing of the two sectors in terms of rent control, se-curity of tenure and access to housing allowances, substitutability between sectors is a serious option for some households. Certainly, some market land-lords see social landlords as rivals for customers and this has prompted them to take their case to the EC, where they argued that they face unfair com-petition from a privileged social sector. The debate between the European Competition Commissioner and the Dutch government has focused on creat-ing a more level playing field between the sectors and effectively removing an alleged state-sponsored competitive advantage from housing associations. There has already been a reduction in the fiscal advantages enjoyed by hous-ing associations. In our framework, this effectively contributes to a reduction in the gap between the sectors and an increase in competition.
In Germany, there is a competitive relationship between the sectors as a result of a different approach to social housing provision. The absence of a distinction according to types of landlord is part of the picture. Another as-pect that contributes to a high degree of substitutability is the range of hous-ing on offer, both in terms of rents and quality, together with the comparable security of tenure in both sectors. The fusing of social and market housing in Germany is reinforced by the use of the contract model of social housing provision whereby any type of supplier (profit, non-profit or cooperative) can agree to provide housing that is social (in the sense that it is subject to so-cial allocation criteria) for a limited period of time and receive certain con-cessions in return. The consequent temporary nature of social housing adds to the blurring of the social/market distinction, in that all housing eventually returns to the market sector.
Added value of competition as a policy goalIn principle, there are four sets of reasons that might lead policy makers to encourage inter-sector competition:1. Introducing or increasing rivalry from market-sector suppliers might be
seen as a means of encouraging more efficiency in social-sector supply. The threat of the loss of subsidies or the loss of customers to the market sector may, according to the expectations of classical market competition, bring efficiency gains in terms of better value for money and possibly the need for lower levels of subsidy or a greater output for a given level of sub-sidy.
2. Increasing opportunities for tenants to find substitutable dwellings in the market sector increases consumer choice. This enhanced consumer power arguably forces up standards and enhances consumer satisfaction. This implies that tenants can act as consumers in the market place and move their custom according to the perceived benefits of alternative sets of ac-commodation.
3. Encouraging an increase in market-sector supply because of a shortage of
[ 269 ]

rented housing. If additional supply is needed, policy makers may decide that the market sector is best placed to provide more dwellings. This may be a result of capacity constraints in the social sector or a belief that mar-ket suppliers are better able to assemble and utilise the required resources.
4. An expansion of supply or an increase in the proportion of rented hous-ing supplied by the market sector may be viewed as a route to less direct political involvement in provision. Whilst local authority or housing asso-ciation supply may be, in the public mind, associated with politicians, this could be less so for market-sector landlords. Politicians may welcome the potential for a more arms-length approach that the market sector could offer as a means of ‘de-politicising’ the day-to-day provision of rental ac-commodation.
The relationship of these objectives to the competition agenda may vary. The first two are strongly linked to promoting competition. The second two are more pragmatic and less theoretically grounded. They may lead to more com-petition, but more competition is not necessarily the explicit objective. Hard evidence for (4) is missing. However it is clear that the efficiency, choice and supply objectives (1) to (3) are consistent with the initiatives we have identi-fied above in England, Flanders and Ireland, the countries where the gap be-tween the sectors is largest.
As we argue in Section 9.7, greater competition between the sectors to re-duce the gap is not necessarily an appropriate policy objective, especially if the social sector is narrowly targeted. The next section will consider another approach which, rather than trying to reduce the gap between the social and market sectors, genuinely builds a bridge between the two.
9.6.2 Building an intermediate sector
The term ‘intermediate sector’ is not a formalised housing term. It can have different meanings in different contexts and refer to both rental housing and home ownership housing. Literally, intermediate simply means ‘in between’. In housing policy, the term intermediate sector is generally used to indicate some kind of bridge between the formal tenure sectors; between the social rental sector and the market rental sector, or between the rental sector and the home ownership sector. This implies that the need for an intermediate sector is largest when the gap between the formal tenure sectors is large. In this section, we focus only on intermediate rental housing. This housing is meant to bridge the gap between the social rental sector and the market rent-al sector.
Many of the countries under consideration in this book are characterised by a substantial difference in rent levels between the social and market rent-al sectors (see also Table 9.3). These price differences tend to be largest in ar-
[ 270 ]

eas with a tight housing market, such as many urban areas. Policy makers often see this as undesirable as it may hamper mobility between the tenure sectors, resulting in a deadlocked housing market. Furthermore, a large price gap between social and market rental dwellings can cause accessibility and affordability problems for households on medium incomes. For such house-holds, the home ownership sector and the market rental sector are often too expensive, whereas their income may be too high to access the social rental sector. A significant proportion of these middle-income households consists of key workers – people whose professions are deemed essential for a smooth functioning of the urban economy and society (for example teachers, nurs-es and policemen). Providing sufficient and affordable housing for these key workers has become an important policy objective in many urban areas with a tight housing market.
The creation of an intermediate rental sector is one of the ways to meet this policy objective (although the objectives behind the intermediate rental sector may be much broader than only housing key workers). The rent level in the intermediate rental sector (and often also the quality of the housing) is higher than in the social rental sector but lower than in the market rental sector. The concept of the intermediate rental sector is most clearly visible in France and the United Kingdom.
The idea behind the French intermediate rental sector is that it fills the gap between the social rental sector and the market rental sector by offering a good alternative to tenants from both these sectors. For tenants in the so-cial rented sector with a slightly higher income, the intermediate sector could offer an opportunity to make a housing career within the rented sector. Ten-ants in the market rental sector, as well as newcomers to the housing market with a slightly higher income which limits their access to the social rental sector, will be attracted by the price-quality relationships in the intermedi-ate rental sector (also in terms of rent regulation and tenant security). These are generally better than in the market rental sector. In France, intermediate rental dwellings are concentrated particularly in regions with a tight hous-ing market, where there are large price differences between relatively ‘cheap’ social rental dwellings and relatively expensive market rental dwellings. In practice, this means that the French intermediate sector is primarily an urban phenomenon.
French intermediate rental dwellings are financed by a variety of arrange-ments. First of all, there are low-interest loans (PLS, PLI) that can be taken up by both social rental landlords and market rental landlords. Secondly, there are tax concessions and refurbishment subsidies for individual market rental landlords that agree to let their dwelling for a moderate rent. In exchange for the financial support of the government, landlords are required to meet cer-tain criteria with regard to the rent level and the income of the tenants. The financial arrangements between government and landlords apply to a fixed
[ 271 ]

period of time (typically more than seven years). Once this time period has elapsed, the dwellings concerned are again part of the market rental sector (unless they are owned by a social rental landlord). In this respect, there are many similarities with the German model of financing social housing.
On many aspects, the French intermediate rental sector genuinely occu-pies a middle position between the social rental sector and the market rental sector. The rent levels in this sector are higher than in the social rental sector but lower than in the market rental sector. Just as in the social rental sector, tenants who want to live in the intermediate rental sector generally have to meet certain income criteria, but these income restrictions are less strict than in the social rental sector. Finally, rent regulation and tenant protection in the intermediate rental sector are less strict than in the social rental sector, but stricter than in the market rental sector.
At first sight, the French intermediate rental sector may appear to have much in common with the Irish Rental Accommodation Scheme (RAS) and the Flemish Social Rental Agencies. In these schemes, too, market rental land-lords receive financial support from the government in exchange for which they are required to meet certain criteria on rent levels and the income of the tenants. However, there is one important difference. The rent levels of the dwellings provided through the RAS and the Social Rental Agencies are com-parable to rent levels in the social rental sector, and the target group for these dwellings is largely the same as the target group for the social rental sector. In both cases, the focus is on low-income households and in Flanders the most vulnerable low-income households in particular.
In the French intermediate rental sector, this is not the case. French in-termediate rental dwellings have higher rents and higher income limits than French social rental dwellings. Thus, unlike the RAS and the Flemish Social Rental Agencies, the French intermediate rental sector is not a substitute for, but a complement to, the social rental sector.
In England, the recent introduction of the intermediate rental sector is part of a larger plan that aims to make both home ownership housing and rental housing more accessible and affordable. The intermediate rental sector in England consists of dwellings that are provided at rent levels above those of the social rental sector but below those of the market rental sector. This kind of rental housing will be occupied by higher-income households than social renting. A significant proportion of intermediate rented dwellings are intend-ed for key workers. As such, the intermediate rental sector has a labour mar-ket function (ensuring that economic growth areas are attractive and acces-sible for key workers), as well as a housing market function. The intermediate rental dwellings in England are owned and managed by housing associations and the vast majority are located in the London area.
In the other countries under consideration in this book, no separate inter-mediate rental sector can be distinguished. Nevertheless, the housing alloca-
[ 272 ]

tion process is often stratified in order to prioritise the housing chances of certain target groups (age groups, income groups, professional groups such as key workers). In Amsterdam, for example, a maximum of 250 social rental dwellings may be allocated with priority to people that are working in health care, the police or education. These dwellings are not specifically labelled or regulated as intermediate dwellings or key worker dwellings (as happens in France and England) but they can be anywhere in the social rental dwelling stock.
9.7 Evaluation of framework
We suggested in Chapter 2 that the purpose of what we have called the so-cial sector can vary from country to country and this was demonstrated in the country chapters. A narrow ‘housing the poor’ objective contrasts with a broader ‘housing a variety of income groups’ objective and contrasts even more with the wide social, economic and environmental objectives that the social sector can be expected to achieve. In this book, we have examined the similarities and differences between social and market rented housing in or-der to analyse the position of social renting in the rental market. The simi-larities and differences have been explored by the use of the concept of ‘the’ gap. In Chapter 2, the concept of the gap was described in three ways. The first two perspectives provided a way of ordering information: (1) differences in who provides rented housing and what exactly is provided; (2) differences in who the sectors are for and government policies towards the sectors. The third and theoretical perspective is about the gap as the cause of a lack of competition between the sectors. In fact, we distilled the competitive (sub-stitutability and rivalry) gap from the empirical ways of describing the gap. In this section, we will evaluate our use of the concept of the gap and of the competitive framework. The framework will be evaluated particularly in rela-tion to Jim Kemeny’s framework of unitary-dual types of the rental market which inspired us to use the framework of competition.
The concept of a gapThe starting point of the research project was our impression that private initiatives were increasingly being deployed to provide social rental dwell-ings in various European countries. We call these initiatives the state agent or contract model in Chapter 2. In other words, we assumed that the bound-aries between social and market renting were becoming more blurred by these initiatives. The gap, in combination with a definition of social versus market renting based on the allocation of dwellings according to need ver-sus effective demand, became the concept we used to discover whether these initiatives were indeed blurring boundaries and whether the social and mar-
[ 273 ]

ket sectors were indeed becoming more alike than without these initiatives. Firstly, the concept of the gap allowed us to elaborate on the aspects where the two rental sectors differed, enabling us to organise and analyse the rela-tionship between social and market renting. Lastly, a different grouping of the aspects that made up the two empirical gaps on provision and policy (simply stated) allowed us to review the competition between social and market rent-ing. In short, we found the concept of the gap a useful instrument with which to compare social and market renting.
Our analysis of the six countries, as the summary in Section 9.4 suggests, identifies four different sets of circumstances, as far as the empirical gaps are concerned:1. There is a large gap between social and market renting with very different
suppliers and very different consumers in the two sectors. This is the case for England, Ireland and Flanders.
2. There are significant differences between social and market renting in terms of dwellings, subsidies and types of suppliers but an intermediate sector that provides options for the consumer between these two. This is the case for France.
3. There is a small gap between social and market renting as a consequence of an absence of a division by landlord type, coupled with some substitut-ability from the tenants’ point of view. The gap is widened, however, by the allocation and rent regulation systems, policy elements that are connected to bricks-and-mortar subsidies. This is the case for Germany.
4. There is a small gap between social and market renting as a consequence of a significant similar substitutable options open to tenants with some overlap in choice between accommodation in the two sectors. The gap is widened, however, by the allocation system and the contrasting motives of landlords. This is the case for the Netherlands.
The concept of no gapIn principle, the gap could be eliminated by not having a social rented sec-tor. Instead of using supply-side support, governments could, if they wanted to intervene on the rental market, concentrate their efforts on the demand side. For example, income supplements could be used to support low-income households and they could be free to use the extra resources towards the costs of whatever housing they wanted and were able to afford with the addi-tional assistance. Such a policy approach has not been tried in Europe but has been advocated, especially in the USA (Galster, 1997; McClure, 1998; Sard, 2001). It raises many questions about the purpose of social housing and the practical effects of the extra spending powers given to households. If income supple-ments are the only policy instrument used, this would suggest that housing problems had been diagnosed as income-distribution problems and any al-ternative social housing programmes would have the narrow purpose of sup-
[ 274 ]

porting low-income households. As we have argued at several points that the diagnosis may be much more complicated than this, and the purpose of social housing much broader. The effects of the extra income would depend on the choices made by households, the consequences for rent levels and the supply-side response. All this would be specific to a particular set of circumstances and it cannot be universally assumed that the outcomes for households would be better than the outcomes with social housing (Yates & Whitehead, 1998). The gap may be eliminated, but housing problems may well continue.
The competitive frameworkThe competitive framework used in this book has enabled us to consider a wide range of policy approaches from six European countries and regions. The concepts of substitutability and rivalry have facilitated an analysis of the gap between social and market rented dwellings and helped us to focus on identi-fying those factors essential to understanding the degree of competition that exists between the two tenure types. It has not been possible to quantify the exact degree of difference in each of the factors that contribute to substitut-ability and rivalry, and so some normative judgements have been inevitable. In some cases – when assessing the quality of housing or the characteristics of the products on offer, for example – the multidimensional nature of the concepts makes evaluation difficult. The very definition of ‘quality’ is debat-able and, for the purposes of this study we would ideally be able to capture all the components of dwellings and their locations that tenants consider impor-tant in making choices. In reality, information is inevitably limited on these factors and more evidence on the behaviour of tenants and the behaviour of suppliers in responding to and influencing tenant choices could usefully widen the scope of the analysis. Also a better distinction between the formal rules and regulations and the actual impact of them on numbers of tenants and affordability, for instance when assessing the effect of two different kinds of means-tested housing allowances in both rental sectors, may improve the analysis as well.
We then turn to two further aspects – the price-quality relationship and the geographical dimension of housing competition – where limited informa-tion has constrained the analysis. Ideally one would have detailed informa-tion about the price-quality ‘bundles’ available in the social and market sec-tors and be able to understand how consumers view various combinations and thus how substitutable they judged these bundles to be. From the con-sumer’s point of view, location is clearly important and where dwellings are will obviously influence choice. From the supplier’s point of view, alternative firms and non-profit enterprises will only be rivals if they are operating in lo-cations within which consumers are prepared to substitute one dwelling for another. We have not had sufficiently detailed information to be able to ex-plore this element of competition in depth.
[ 275 ]

The competition framework has allowed us not only to organise and anal-yse the relationship between social and market renting, but also to indicate the degree of substitutability and rivalry between the two rental sectors. The framework shows that although substitutability and rivalry sometimes go to-gether to create competition, this is not always the case. It is quite possible for governments to introduce more rivalry into rented supply by offering con-tracts and subsidies to a range of non-profit and market suppliers. This would increase the supply of dwellings, without increasing substitutability from the tenants’ point of view. The possibility of substitutability would only increase if there was an increase in the range of housing on offer and to which house-holds had access.
A question that we have not attempted to answer entirely is whether more competition is by definition better than less competition. In Section 9.6.1 pos-sible motivations were listed for introducing inter-sector competition. The definitive answer, however, would depend on the purpose of social housing as defined in housing policy. If the policy aim is that social housing should be targeted at the most vulnerable households, performing a safety-net func-tion, competition between social housing and market housing would sug-gest a policy failure. If, on the other hand, it was the policy aim to use social housing as a means to achieve broader social integration, having social land-lords house a broader spectrum of the population, including households with middle and perhaps even higher incomes, competition is more an indicator of success (Elsinga et al., 2007a).
In Chapter 2 we noted that one of the few conceptual frameworks that has previously facilitated an analysis of the relationships between social and market rented housing is based on Kemeny’s distinction between (integrated) unitary and dualist rented systems (Kemeny 1995; Kemeny et al., 2005). The main difference between these systems is the degree of competition between the tenures. Unitary/integrated rental systems are oriented towards direct competition between for-profit and non-profit renting, while dualist rental systems are based on avoiding direct competition between for-profit and non-profit rental housing. Our analysis casts doubt on whether the reality of rental markets can be captured by this simple taxonomy and questions the lack of depth in the concept of ‘competition’ as used by Kemeny. The framework we have applied shows that the relationship between profit and non-profit hous-ing suppliers and that between market and social housing provision is much more complex than is captured by the unitary/dualist distinction. In both the-ory and practice, the world is more complex than a simple division between dualist and unitary can cope with. Rather than confine certain features to one system, as in the Kemeny typology, they can be combined. For example, it is perfectly possible for the non-profit sector to perform a safety net function (as in a dualist system) but at the same time for subsidies to be available to profit and non-profit suppliers and for there to be competition for subsidies
[ 276 ]

between different types of suppliers (as in a unitary system). The benefit of a broad competitive framework is that the many facets that contribute to the substitutability of housing options from the consumer’s perspective, as well as those that contribute to the rivalry between suppliers, can be considered. This means that this framework has a better chance of capturing the com-plicated reality of rental housing provision than a simple two or three-fold typology.
While the competitive situation, as we have described it, corresponds broadly to a unitary model of rental provision, and the uncompetitive situ-ation corresponds to a dualist model, the situation is made more complex when one considers the impact of the allocation system for social renting and the types of supplier in the social and market sectors. It is useful to contrast an open allocation system with a restrictive allocation system for social hous-ing. In the former, a wide range of households are eligible for social housing while in the latter social housing is restricted to the most needy low-income households. With an open allocation system in combination with a large so-cial rental sector, there is a strong possibility of a high level of substitutability for households and greater rivalry between suppliers. There is thus likely to be more competition with an open allocation system. With a restrictive al-location system, competition can be high or low depending on the number of suppliers, the amount and types of housing on offer and the degree of choice that is available to households who are allocated social housing. While tra-ditionally the supply side may have been dominated by monopoly suppliers in some countries, it is quite possible for there to be a multiplicity of sup-pliers who may be non-profit enterprises or market-sector firms. The latter may supply social housing under a contract system under which they agree to supply housing below certain rent levels to households below certain in-come levels in return for a subsidy of some sort. Equally, non-profit firms may supply on the same basis. The segregation of the customer base as a result of a restrictive allocation system does not necessarily mean, then, that there is segregation between the type of suppliers. The situation is complicated by the possibility that firms that are formally registered as housing associations, and for the purposes of some classifications may be deemed to be part of the so-cial sector, but may in practice supply housing at market rents that competes with dwellings supplied by firms squarely in the market sector. A restrictive allocation system that underpins a dualist system could thus be quite com-patible with a high degree of competition between firms which are competing to supply social housing.
We have found a competitive framework to be a useful organisational and analytical device with which to examine the relationship between the sec-tors. We have at no point made general judgements on the pros and cons of more or less competition between social and market housing. The desirabil-ity or otherwise of competition between the sectors is outside the scope of
[ 277 ]

this study. Conclusions on this must be related to the role that the social sec-tor is expected to play. If it is to be closely targeted at households on very low incomes, and the allocation mechanism is designed to ensure that this is achieved, competition between the sectors in terms of consumer substi-tutability would be unlikely (but not necessarily in terms of supplier rivalry). If the sector has wider objectives and seeks to house some households who could afford to live in the market sector, a degree of competition is likely and appropriate.
If social housing is designed to allocate housing to those in need who can-not afford market housing of an acceptable standard, some segregation of the customer base is probable and there would arguably be a tendency towards a dualist system. Kemeny distinguishes between a non-profit and a profit sec-tor, rather than between social and market housing. He does not suggest how non-profit housing is allocated. The question of how households come to be in non-profit housing, rather than in other tenures is not explored. The al-location system is, however, the key to whether consumers are able to substi-tute between social and market housing as well as being the key to whether housing providers have access to a segregated customer base or whether they are able to house a wide spectrum of tenants. However, as we have argued, even if the customer base is segregated, competition for access to that lim-ited group of customers can be promoted by governments who are willing to use a contract approach to housing provision. Competition can be promoted between organisations, whatever their legal status, by a contract approach to the selection of social housing suppliers.
From the consumer’s point of view, as long as social housing is allocated according to need and market housing according to demand, there will be a gap between the two types of housing. A gap related to allocation may, of ne-cessity, continue to exist as a function of the definition of social housing.
[ 278 ]

References
AFWC (2008), Gemiddelde wachttijd Amsterdam in 2007 bijna 9 jaar [Average waiting time in Amsterdam in 2007 almost nine years], www.os.amsterdam.nl/feitenencijfers/30171/.
Agence Nationale de l’Habitat (2007), Rapport d’Activité 2006 [Activity report 2006], Agence Nationale de l’Habitat.
Amzallag, M. & C. Taffin (2003), Le logement social [Social Housing], Paris, Collection Politiques Locales.
Balchin, P. (ed.) (1996), Housing Policy in Europe, London, Routledge.
Ball, J. (2006), The insider/outsider thesis and its extension to social housing in France, Paper for the ENHR-conference in Llubljana, Slovenia, 2-5 July.
Ball, J. (2008), Property, altruism and welfare: how national legal conceptions affect allocation of social housing to the disadvantaged, in: Scanlon, K. & C. Whitehead (eds.), Social Housing in Europe II. A review of policies and outcomes, London, London School of Economics and Political Science, pp. 31-47.
Ball, M. (2004), The future of private renting in the UK, London, The Social Market Foundation.
Ball, M. (2008), European Housing Review 2008, London, Royal Institution of Chartered Surveyors (RICS).
Barker, K. (2004), Review of housing supply, London, Treasury/ODPM.
Barry, Norman (1993), The social market economy, Social Philosophy and Policy 10 (2), pp. 1-25.
Becker, L.C. (1977), Property Rights, London, Routledge and Kegan Paul.
Behring, Karin & Ilse Helbrecht (2002), Wohneigentum in Europa. Ursachen und Rahmenbedingungen unterschiedlicher Wohneigentümerquoten in Europa [Home owner ship in Europe], Ludwigsburg, Wüstenrot Stiftung.
Blanc, M. (2004), The changing role of the State in French housing policies: a roll-out without roll-back? European Journal of Housing Policy 4 (3), pp. 283-302.
[ 279 ]

Boccadoro, N. (2008), The impact of EU rules on the definition of social housing. in: Scanlon, K. & C. Whitehead (eds.) (2008), Social Housing in Europe II. A review of policies and outcomes, London, London School of Economics and Political Science, pp. 261-271.
Boccadoro, N. & A. Chamboredon (2004), France, in: Tenancy Law and Proce-dure in the European Union. European University Institute.
Boelhouwer, P.J. (1996), Frankrijk [France], in: Boelhouwer, P.J. (ed.) (1996), Financiering van de sociale huursector in West-Europa [Financing the social rental sector in Western Europe], Volkshuisvestingsbeleid en Bouwmarkt 27, Delft, Delftse Universitaire Pers.
Boelhouwer, P.J. & M.E.A. Haffner (2002), Subjectsubsidiëring in de huursector onder de loep [Personal subsidies in the rented sector examined], DGVH-NETHUR partnership programme. The Hague, Ministry of Housing, Spatial Planning and the Environment.
Boelhouwer, Peter J. & H.M.H. van der Heijden (1992), Housing systems in Europe: Part I. A comparative study of housing policy, Delft, Delft University Press.
Boelhouwer, P.J., H.J.F.M. Boumeester & H.M.H. van der Heijden, 2006, Stagna-tion in Dutch housing production and suggestions for a way forward, Journal of Housing and the Built Environment 21 (3), pp. 299-314.
Bougrain, F. (2004), France, in: Gruis, Vincent, & Nico Nieboer (eds.), Asset Management in the Social Rented Sector. Policy and Practice in Europe and Australia, Dordrecht/Boston/London, Kluwer Academic Publishers.
Bramley, G., M. Satsangi & G. Pryce (1998), The Supply Responsiveness of Private Rented Housing: An International Comparison, London, Department of the Environment, Transport and the Regions.
Braun, Reiner, & Ulrich Pfeiffer (2004), Mieter oder Eigentümer – wer wird stärker gefördert? Eine analyse der Folgen des Subventionsabbaus zum Jahresbeginn 2004 [Tenants or homeowners: who is more highly subsidised? An analysis of the results of phasing out subsidies at the beginning of 2004], Berlin, Empirica.
Brech, Joachim (2004), Germany, in: Gruis, Vincent, & Nico Nieboer (eds.), Asset Management in the Social Rented Sector. Policy and Practice in Europe and Australia, Dordrecht, Kluwer Academic Publishers, pp. 141-160.
[ 280 ]

Brook, S. & V. Clayton (2005), The Changing Nature of the Housing Association Sector, in: Norris, M. & D. Redmond (eds.), Housing Contemporary Ireland, Dublin, Institute of Public Administration, pp. 205-223.
Brown, T. & P. King (2005), The power to Choose: Effective Choice and Housing Policy, European Journal of Housing Policy 5 (1), pp. 59-75.
Buchanan, L. (2006), Promoting Good Standard Rental Housing; Irish Experi-ence, Paper presented at the ENHR conference Housing in an expanding Europe; theory, policy, participation and implementation, Ljubljana, Slovenia, 2-5 July.
Bundesgeschäftsstelle Landesbausparkassen (2004), Jahresbericht 2003 [Annual report 2003], Berlin, Bundesgeschäftsstelle Landesbausparkassen im Deutschen Sparkassen- und Giroverband e.V.
Bundesministerium für Raumordnung, Bauwesen und Städtebau (1995), Unter richtung durch die Bundesregierung. Stellungnahme der Bundesregie-rung zum Bericht der Expertenkommission Wohnungspolitik [Standpoint of the Federal Government on the report of the Expert Commission on Housing Policy], Drucksache 13/159, 5 May.
Bundesministerium für Verkehr, Bau und Stadtentwicklung (2006a), Tiefensee: Koalitionsvereinbarung wird umgesetzt – Familien mit Kindern im Mittelpunt der Wohneigentumsförderung [Coalition agreement about families with children being the focus of stimulation of home ownership], Berlin, Nr. 468, 29 November.
Bundesministerium für Verkehr, Bau und Stadtentwicklung (2006b), Soziale Wohnraumförderung [Social housing subsidy], Berlin, 20 November.
Bundesministerium für Verkehr, Bau und Stadtentwicklung (2006c), Wohngeld 2006. Ratschläge und Hinweise [Housing allowances 2006: recommendations and tips], Berlin, http://www.bmvbs.de/Anlage/original_949717/ Wohngeld-2006-Ratschlaege-und-Hinweise.pdf; 24 November.
Bundesministerium für Verkehr, Bau und Stadtentwicklung (2007), Roth: Woh-nungs- und Städtebauförderung geht gestärkt aus der Förderalismusreform hervor [Roth: Aid for dwelling and city construction is strengthened by federal reform], Belin, Pressemitteilung Nr. 262, 17 September.
[ 281 ]

Bundesministerium für Verkehr, Bau und Stadtentwicklung (2008), Tiefensee begrüsst Entscheidung des Kabinetts zur Wohngelderhöhung [Tiefensee welcomes decision of Cabinet to increase housing allowances], Berlin, Pressemitteilung Nr. 058, 19 März.
Bundesministerium für Verkehr, Bau- und Wohnungswesen (2001), Der soziale Wohnungsbau wird reformiert [The social housing construction reform], Bonn, Nr. 49/1, 14. März.
Bundesministerium für Verkehr, Bau- und Wohnungswesen (2001/2002), Hinweise zur Erstellung von Mietspiegeln [Tips on compiling rent databases], Brochure.
Bundesministerium für Verkehr, Bau- und Wohnungswesen (2002), Mieten-stufen der Gemeinden (Par. 8 des Wohngeldgesetzes) nach Ländern ab 1. Januar 2002 [Rent levels of communities by federal state as of 1 January 2002].
Bundesministerium für Verkehr, Bau- und Wohnungswesen (2004a), Woh-nungsgenossenschaften. Potenziale und Perspektiven. Bericht der Experten-kommission Wohnungsgenossenschaften [Housing cooperatives: potential and perspectives. Report of the Expert Commission on Housing Cooperatives], Abstract, www.bmvbw.de.
Bundesministerium für Verkehr, Bau- und Wohnungswesen (2004b), Wohngeld 2004. Ratschläge und Hinweise [Housing benefit 2004: recommendations and tips], Berlin, Februar.
Bundesministerium für Verkehr, Bau- und Wohnungswesen (2004c), Wohngeld 2005. Ratschläge und Hinweise [Housing allowances 2005: recommendations and tips], Berlin, Dezember.
Bundesregierung (2006), Wohngeld- und Mietenbericht 2006 [Housing allowances and rents report 2006], Berlin, Bundesministerium für Verkehr, Bau- und Wohnungswesen, http://www.bmvbs.de/Anlage/original_1002086/Wohngeld-und-Mietenbericht-2006.pdf.
Bundeszentrale für politische Bildung (2004), Datenreport 2004. Zahlen und Fakten über die Bundesrepublik Deutschland [Data report 2004: facts and figures on the Federal Republic of Germany], Bonn, Statistisches Bundesamt in collaboration with Wissenschaftszentrum Berlin für Sozialforschung (WZB) and Zentrum für Umfragen, Methoden und Analysen (ZUMA), Bonn, Schriftenreihe, Vol. 440.
[ 282 ]
Bundeszentrale für politische Bildung (2006), Datenreport 2006. Zahlen und Fakten über die Bundesrepublik Deutschland [Data report 2006: facts and figures on the Federal Republic of Germany], Bonn, Statistisches Bundesamt in collaboration with Wissenschaftszentrum Berlin für Sozialforschung (WZB) and Zentrum für Umfragen, Methoden und Analysen (ZUMA), Bonn, Schriftenreihe, Vol. 544.
Busch-Geertsema, Volker (2004), The Changing Role of the State in German Housing and Social Policy, European Journal of Housing Policy 4 (3), pp. 303-321.
Cave, M. (2007), Every Tenant Matters: A Review of Social Housing Regulation, London, Department for Communities and Local Government.
CECODHAS (2007), Social Housing in France, Information from the website www.cecodhas.org, March.
Central Statistical Office (2007), Ireland Census, 2006, Dublin, Central Statisti-cal Office.
CFV (2007), Jaarverslag 2006 [Annual Report 2006], Naarden, CFV.
CFV (2008), Sectorbeeld voornemens woningcorporaties, begroting 2008 [Plans of housing associations, budget 2008], Naarden, CFV.
Coates, D. & M. Norris (2006), Local Authority Rents: Equity, Affordability and Effectiveness, Administration 54 (2), pp. 3-26.
Cole, A. (2006), Decentralization in France: Central Steering, Capacity Building and Identity Construction, French Politics (4), pp. 31-57.
Crook, A., J. Henneberry, J. Hughes & P. Kemp (2000), Repair and Maintenance by Private Landlords, London, Department of the Environment, Transport and the Regions.
DCLG (2006), Delivering affordable housing, London, Department of Commu-nities and Local Government.
DCLG (2007a), English House Condition Survey 2005, Annual Report, London, Department of Communities and Local Government.
DCLG (2007b), Homes for the Future. More affordable, More Sustainable, London, Department of Communities and Local Government.
[ 283 ]

DCLG (2008), English Housing Condition Survey, 2006, Headline Report, London, Department of Communities and Local Government.
De Tijd (2008), Moeizaam pps-verhaal in sociale woningbouw [Difficulties with pps-scheme in social rented housing], 26 augustus, p. 9.
Decker, Pascal de (2001), Jammed between Housing and Property Rights: Belgian Private Renting in Perspective, European Journal of Housing Policy 1 (1), pp. 17-39.
Decker, Pascal de (2002), On the Genesis of Social Rental Agencies, Urban Studies 39 (2), pp. 297-326.
Decker, Pascal de (2007), Belgium: Between confidence and prudence, in: Elsinga, Marja, Pascal de Decker, Nóra Teller & Janneke Toussaint (eds.), Home ownership beyond asset and security. Perceptions of housing related security and insecurity in eight European countries, Amsterdam, IOS Press, pp. 29-65.
Decker, P. de, L. Goossens & I. Pannecoucke (2005), Over wortelen, stokken en preken. Naar een woonbeleid voorbij de historische opties [About carrots, sticks and sermons. Towards a housing policy that goes beyond the historic options], in: De Decker, Pascal, Luc Goossens & Isabelle Pannecoucke (eds.), Wonen aan de onderkant [Housing at the bottom], Antwerpen-Appeldoorn, Garant, pp. 473-507.
Dekker, S.M. (2004), Huurbeleid, brief van de Minister van Volkshuisvesting, Ruimtelijke Ordening en Milieubeheer [Rent Policy, letter from the Minister of Housing, Spatial Planning and the Environment], Tweede Kamer, vergaderjaar 2004-2005, 27926, nr. 39.
Dekker, S.M. (2005), Beleidsvisie toekomst van woningcorporaties [Policy outline on the future of the housing associations], letter to Parliament (DBO 2005191043), December 12, The Hague, MVROM.
Departement RWO (2008), Wegwijs in het nieuwe sociale huurbesluit [Famil-iarisation with the new Decree on Social Rent], Brussel.
Department of Environment, Heritage and Local Government (2001), Housing Information booklets, Local Authority Housing, www.environ.ie.
Department of Environment, Heritage and Local Government (2002a), Guide-lines for Local Authorities. Assessment of Need for Housing Accommodation.
[ 284 ]

Department of Environment, Heritage and Local Government (2002b), Local Authority Assessments of Social Housing Needs.
Department of Environment, Heritage and Local Government (2002c), Rents on Local Authority Dwellings, circular HRT 3/2002, Dublin, local authority circular.
Department of Environment, Heritage and Local Government (2004), Residen-tial Tenancies Act 2004: a quick guide, www.environ.ie.
Department of Environment, Heritage and Local Government (2005), Renal Accommodation Scheme: General overview of scheme, www.environ.ie.
Department of the Environment, Heritage and Local Government (2006), Housing Policy Statement, www.environ.ie.
Deutscher Bundestag (2003), Unterrichtung durch die Bundesregierung. Wohngeld- und Mietenbericht 2002 [Information from the Federal Government. Housing allowances and rents report 2002], Drucksache 15/2200, 11/12/2003, 15. Wahlperiode.
Directoraat-Generaal Wonen (2003), Evaluatie Huisvestingswet. Verslag van enquête onder gemeenten en provincies [Evaluation of the Housing Alloca-tion Act: Results of a survey of municipalities and provinces], The Hague, Ministerie van VROM.
Ditch, John, Lewis Alan & Steve Wilcox (2001), Social Housing, Tenure and Housing Allowance: An International Review, University of York, In-house report 83.
DIW Deutsches Institut für Wirtschaftsforschung (1989), Lage und Perspektiven am Wohnungsmarkt [The housing market: current situation and perspectives], Deutsches Institut für Wirtschaftsforschung 56 (24), pp. 267-274.
Doms, Kurt, Benediekt Van Damme, Sien Winters, Valentijn Bilsen & Erik Buyst (2001), Op zoek naar eigendom. Een onderzoek naar de overheidssteun voor eigenaars van woningen [In search of home ownership. A study of govern-ment support for homeowners], Leuven, Hoger Instituut voor de Arbeid.
Donner, C. (2000), Housing Policies in the European Union, Vienna, Christian Donner.
[ 285 ]

Dorn, Volker (1997), Changes in the Social Rented Sector in Germany, Housing Studies 12 (4), pp. 463-475.
Driant, J.C. (2000), A quoi servent les logements locatifs privés? [What is the use of private rental sector dwellings?], in: Pumain, D. & M.F. Mattei, Données urbaines 3, Anthropos-INSEE-CNRS, pp. 161-172.
Droste, Christiane, & Thomas Knorr-Siedow (2007), Social Housing in Germany, in: Whitehead, Christine, & Kathleen Scanlon (eds.), Social Housing in Europe, London, London School of Economics, pp. 90-104.
Droste, C., C. Lelevrier & F. Wassenberg (2008), Urban regeneration in European social housing areas, in: Scanlon, K. & C. Whitehead (eds.) (2008), Social Housing in Europe II. A review of policies and outcomes, London, London School of Economics and Political Science, pp. 163-197.
Elsinga, Marja, Peter Neuteboom, Femma den Beejen, & Johan Conijn (2004), Government Guarantees in the Rental and Owner-Occupied Sector: An inter-national Comparison 2004, Zoetermeer, WEW.
Elsinga, Marja, Marietta Haffner, Harry van der Heijden & Michael Oxley (2007a), How competitive is social rental housing in England and the Nether-lands, paper presented at ENHR International Conference Sustainable Urban Areas, Rotterdam, 25-28 June, http://www.enhr2007rotterdam.nl/documents/W16_paper_Elsinga.pdf.
Elsinga, Marja, Marietta Haffner, Joris Hoekstra, Pieter Vandenbroucke, Erik Buyst & Sien Winters (2007b), Beleid voor de private huursector: een verge-lijking van zes landen [Policies for the private rental sector in six countries], Brussel, Ministerie van de Vlaamse Gemeenschap, Departement RWO-Woon-beleid, http://www.bouwenenwonen.be/uploads/b2660_onderzoeksrapportpri-vate_huurmarkt_-_internat._vgl.112818.pdf.
Elsinga, M., M.E.A. Haffner & H.M.H. van der Heijden (2007c), Nederlandse woondiscussies in een international perspectief [The Dutch discussion on housing from an international perspective], in: Kraan, D.J. & C. Lever (eds.), In Holland staat een huis, Den Haag, Dreesforum, Wim Dreesstichting voor Openbare Financiën.
Elsinga, Marja, Marietta Haffner & Harry van der Heijden (2008), Threats to the Dutch Unitary Rental Market, European Journal of Housing Policy 8 (1), pp. 21-37.
[ 286 ]

Expertenkommission Wohnungspolitik (1995), Wohnungspolitik auf dem Prüfstand [Housing policy put to the test], Tübingen, J.C.B. Mohr (Paul Siebeck).
Federcasa, Italian Housing Federation (eds.) (2006), Housing Statistics in the European Union, Rome, Ministry of Infrastructure of the Italian Republic.
Fitzgerald, E. & N. Winson (2005), Housing Equality and Inequality, in: Norris, M. & D. Redmond (eds.), Housing Contemporary Ireland, Dublin, Institute of Public Administration, pp. 224-244.
Gallent, Nick & Mark Tewdwr-Jones (2007), Decent Homes for All: Planning’s Evolving Role in Housing Provision, London, Routledge.
Galligan, Y. (2005), The Private Rented Sector, in: Norris, M. & D. Redmond (eds.), Housing Contemporary Ireland, Dublin, Institute of Public Administration, pp. 100-118.
Galster, G. (1997), Comparing demand-side and supply-side housing policies: sub-market and spatial perspectives, Housing Studies 12 (4), pp. 561–577.
Gardiner, Karen, John Hills, Jane Falkingham, Valérie Lechene & Holly Suther-land (1995), The Effects of Differences in Housing and Health Care Systems on International Comparisons of Income Distribution, London, London School of Economics.
GdW Bundesverband deutscher Wohnungsunternehmen (2004a), Wohnungs-wirtschaftliche Daten und Trends 2004/2005. Zahlen und Analysen aus der Jahresstatistik des GdW [Housing - economic data and trends 2004-05: figures and analyses from the GdW annual statistics], Berlin, Oktober.
GdW Bundesverband deutscher Wohnungsunternehmen (2004b), Mietwoh-nungen in Deutschland – ein attraktives und wertbeständiges Marktsegment. Entwicklung, Besonderheiten und aktuelle Trends im internationalen Vergleich [Rented homes in Germany: an attractive and stable-value market. Develop-ments, peculiarities and current trends, an international comparison], Berlin, August.
GdW Bundesverband deutscher Wohnungsunternehmen (2005), Wohnungs-wirtschaftliche Daten und Trends 2005/2006. Zahlen und Analysen aus der Jahresstatistik des GdW [Housing economy data and trends 2005-06: figures and analyses from the GdW annual statistics], Berlin, Oktober.
[ 287 ]

GEWOS (1979), Wohneigentumsquote: Bestimmungsgründe der Wohn eigen-tums quote in den Ländern Belgien, Dänemark, Frankreich, Grossbrittannien, USA, Bundesrepublik Deutschland [Reasons for the shares of homeownership in various countries], Bonn (Bundesministerium für RBS), Schriftenreihe Wohnungsmarkt und Wohnungspolitik, 07.005.
Ghékière, L. (2008), Social housing as a service of general interest, in: Scanlon, K. & C. Whitehead (eds.), Social Housing in Europe II. A review of policies and outcomes, London, London School of Economics and Political Science, pp. 271-287.
Gibb, K. (2002), Trends and Changes in Social Housing Finance within the European Union, Housing Studies 17 (2), pp. 325-336.
Gibb, K. & C. Whitehead (2007), Towards a more efficient use of Housing Finance and Subsidy, Housing Studies 22 (2), pp. 183-200.
Goodchild, B., L. Bertrand & L. Sheridan (2001), France, in: Sheridan, L. (ed.) (2001), The control and promotion of housing quality in Europe. Part I Country Monographs, Housing and Urban Policy Studies 15, Delft, Delft University Press.
Goodlad, R. & R. Atkinson (2004), Sacred cows, rational debates and the politics of the right to buy after devolution, Housing Studies 19 (3), pp. 447-463.
Goossens, L. (1982), Het sociaal huisvestingsbeleid in België. Een historisch-sociologische analyse van de maatschappelijke probleemhandeling op het gebied van het wonen [Social housing policy in Belgium. A historic-sociological analysis of societal problems in housing], Leuven, Universiteit van Leuven, Faculteit der Sociale Wetenschappen, dissertation.
Government of Ireland (1988), Housing Act, www.irishstatutebook.ie.
Government of Ireland (2000), Planning and Development Act, www.irishstatutebook.ie.
Groetelaers, Danielle A. (2004), Instrumentarium locatieontwikkeling: Sturings-mogelijkheden voor gemeenten in een veranderende marktsituatie [Legal provisions to facilitate land development. Local authorities’ management opportunities in a changing market situation], Stedelijke en Regionale Ver-Stedelijke en Regionale Ver-kenningen 32, Delft, DUP.
[ 288 ]

Haffner, M.E.A. (1992), Fiscus en eigen-woningbezit in de EG, deel 2: Berekening van de woonuitgaven [Taxation and homeownership in the EC, part 2: Calculation of housing expenditure], Delft, Onderzoeksinstituut OTB, internal publication.
Haffner, M.E.A., with assistance from F.H.J. Heinen, V.H. Gruis & M.S.C. Buijs (1998), Housing Statistics in the European Union 1998, Brussels, European Commission, Directorate General V (also in French and German).
Haffner, M.E.A. (2003), Tenure Neutrality; a financial-economic interpretation, Housing Theory and Society 20 (2), pp. 72-85.
Haffner, Marietta (2005), De objectgesubsidieerde huursector in Duitsland: van dynamisch model naar concessiemodel [The bricks-and-mortar subsidised rented sector in Germany: from a dynamic model to a concession model], Rotterdam, SEV, http://www.sev.nl/nieuws/nieuwsitem.asp?id_bericht_open=1184&zoek= true&zoek _string= duitsland.
Haffner, Marietta E.A. (2006), De Duitse Mietspiegel. Marktconforme regulering van huren [German rent regulation. Market-based regulation], Rotterdam, SEV.
Haffner, Marietta & Kristof Heylen (2008), Affordability of housing. Flanders and the Netherlands compared in the short-term and long-term, paper presented at ENHR conference Shrinking Cities, Sprawling Suburbs, Changing Countrysides, Dublin, Ireland, 6-9 July.
Haffner, Marietta E.A. & Joris S.C.M. Hoekstra (2004), Woonruimteverdeling in Europese context [Housing allocation in the European context], Delft, TU Delft, commissioned report.
Haffner, Marietta E.A. & Joris S.C.M. Hoekstra (2006), Housing Allocation and Freedom of Movement: A European Comparison, TESG 77 (4), pp. 443-451.
Haffner, M.E.A. & M.J. Oxley (1999), Housing Subsidies: Definitions and Com-parisons, Housing Studies 14 (2), pp. 145-162.
Haffner, Marietta, Marja Elsinga & Joris Hoekstra (2008), Rent Regulation: The Balance between Private Landlords and Tenants in Six European Countries, European Journal of Housing Policy 8 (2), pp. 217-233.
Haffner, M., M. Elsinga & A. Wolters (2005), Het stedelijke vernieuwings-netwerk. Verkenning in theorie en praktijk [The urban renewal network. Exploration in theory and practice], Gouda, Habiforum.
[ 289 ]

Haffner, Marietta, Harry van der Heijden, Joris Hoekstra & Michael Oxley (2008), The relationship between social and market renting in several countries in Europe, paper presented at ENHR conference Shrinking Cities, Sprawling Suburbs, Changing Countrysides, Dublin, Ireland, 6-9 July.
Harloe, M. (1994), Private Rented Housing in the United States and Europe, London, Croom Helm.
Harloe, M. (1995), The People’s Home? Social Rented Housing in Europe and America, London, Blackwell.
Häußermann, Harmut (1994), Social Housing in Germany, in: Danermark, Berth & Ingemar Elander (eds.), Social Rented Housing in Europe: Policy, Tenure and Design, Delft, Delft University Press, pp. 53-75.
Hayek, F. A. (2002), Competition as a Discovery Procedure, The Quarterly Journal of Austrian Economics 5 (3), pp. 9-23 (Translation by M.S. Snow of a 1968 lecture).
Heylen, Kristof (2007), Residential mobility in Flanders: determinants of mobility and transition in housing tenure, paper presented at the ENHR International Conference Sustainable Urban Areas, Rotterdam, 25-28 June.
Heylen, Kristof, Marie Le Roy, Steven Vanden Broucke, Brecht Vandekerckhove & Sien Winters (2007), Wonen in Vlaanderen. De resultaten van de Woon-survey 2005 en de Uitwendige Woningschouwing 2005 [Living in Flanders], Brussel, Ministerie van de Vlaamse Gemeenschap, Departement RWO-Woon-RWO-Woon-beleid, http://www.bouwenenwonen.be/uploads/b2587_onderzoeksrapport-wonen_in_vlaanderen10587.pdf.
Hills, J. (2007), Ends and Means: The Future Roles of Social Housing in England, CASE report 34, London, Centre for the Analysis of Social Exclusion.
HM Treasury/ODPM (2005), Housing policy: an overview, London, HM Treasury & Office of the Deputy Prime Minister.
Housing Corporation & National Housing Federation (2004), Private Finance Monitoring Bulletin, London, Housing Corporation & National Housing Federation.
Hubert, Franz (1998), Private Rented Housing in Germany, Netherlands Journal of Housing and the Built Environment 13 (3), pp. 205-232.
[ 290 ]
IVBN (2006), Jaarverslag 2005 [Annual report 2005], Voorburg, IVBN.
Jaffe, A. J. (1996), On the role of transaction costs and property rights in housing markets, Housing Studies 11 (3), pp. 425-34.
Katz, M. L. (2005), “Schumpeterian” Competition and Antitrust policy in High-Tech markets, Competition 14, pp. 47-67.
Kemeny, J. (1995), From public housing to the social market: rental policy in comparative perspective, London, Routledge.
Kemeny, J., J. Kersloot & P. Thalman (2005), Non-profit housing, influencing, leading and dominating the unitary rental market: three case studies, Housing Studies 20 (6), pp. 855-872.
Kemp, P.A. (1997), A Comparative Study of Housing Allowances, London, H.M. Stationery Office.
Kemp, P. (2004), Private Renting in Transition, Coventry, Chartered Institute of Housing.
Kemp, Peter (2007), Housing Allowances in Comparative Perspective, Bristol, The Policy Press.
Keulen, Marino, Vlaams minister van Binnenlands Bestuur, Stedenbeleid, Wonen en Inburgering (2004), Vlaams Woonbeleid. Beleidsnota 2004-2009 [Flemish Housing Policy. Policy White Paper 2004-2009], Brussel, Administratie Kanselarij en Voorlichting.
King, P. (2006), Choice and the End of Social Housing, London, Institute of Economic Affairs.
Kirchner, Joachim (2006), Wohnunsversorgung für unterstützungsbedürftige Haushalte. Deutsche Wohnungspolitik im europäischen Vergleich [Housing provision for households that need support: German housing policy, a Euro-pean comparison], Wiesbaden, Deutscher Universitätsverlag.
Kirchner, Joachim (2007), The Declining Social Rented Sector in Germany, European Journal of Housing Policy 7 (1), pp. 85-101.
Kofner, Stefan (2007), Housing allowances in Germany, in: Kemp, Peter A. (ed.), Housing allowances in comparative perspective, Bristol, The Policy Press, pp. 159-192.
[ 291 ]

Kromhout, Steven & Anne Grinsven (2004), Prestatieovereenkomsten tussen gemeenten en woningcorporaties [Performance agreements between munici-palities and housing associations], Amsterdam, RIGO.
Kullberg, Jeanet (1997), From waiting lists to adverts: the allocation of social rental dwellings in the Netherlands, Housing Studies 12 (3), pp. 393-403.
Langsether, A. & P. Medby (2005), Rent regulation and tenancy protection in six European countries, Paper for the ENHR 2005 conference in Reykjavik, Iceland.
Leutner, Bernd (1990), Wohnungspolitiek nach dem 2. Weltkrieg [Housing policy after the Second World War], Bonn-Bad Godesberg, Bundesministerium für Raumordnung, Bauwesen und Städtebau, compiled by GEWOS Institut für Stadt-, Regional- und Wohnforschung GmbH, Hamburg.
Lévy-Vroelant, C. & C. Tutin (2007), Social Housing in France, in: Whitehead, C. & K. Scanlon, Social Housing in Europe, London, London School of Econom-ics and Political Science, pp. 70-89.
Lévy-Vroelant, C., C. Reinprecht & F. Wassenberg (2008), Learning from history: changes and path dependency in the social housing sector in Austria, France and the Netherlands (1889-2008), in: Scanlon, K. & C. Whitehead (eds.) (2008), Social Housing in Europe II. A review of policies and outcomes, London, London School of Economics and Political Science, pp. 63-83.
MacLaran, A. & B. Williams (2005), Urban Renewal and the Private Rented Sector, in: Norris, M. & D. Redmond (eds.), Housing Contemporary Ireland, Dublin, Institute of Public Administration, pp. 144-159.
Maclennan, Duncan & Alison More (1997), The Future of Social Housing; Key Economic Questions, Housing Studies 12 (4), pp. 531-547.
McClure, Kirk (1998), Housing Vouchers versus Housing production: Assessing Long-Term Costs, Housing Policy Debate 9 (2), pp. 355-371.
McNulty P.J. (1968), Economic Theory and the Meaning of Competition, Quar-terly Journal of Economics 82 (4), November, pp. 639-656.
Ministère de l’emploi, du travail et de la cohésion sociale (2004), Plan de Co-hesion Sociale [Social Cohesion Plan], Paris.
[ 292 ]
Ministère de l’emploi, de la cohésion sociale et du logement (2006a), 2005, une année d’actions pour la cohésion sociale. Principales actions du Ministère de l’emploi, de la cohésion sociale et du logement [2005, a year of action on social cohesion. The principal actions of the Ministry of Employment, Social Cohesion and Housing], www. logement.gouv.fr.
Ministère de l’emploi, de la cohésion sociale et du logement (2006b), Aides Financières au logement, [Financial support for Housing], Paris, Ministère de l’emploi, de la cohésion sociale et du logement.
Ministère du logement et de la ville (2008a), Les aides financières de l’etat au logement mars 2008 [Financial state aid for housing, March 2008], Paris, Ministère du logement et de la ville.
Ministère du logement et de la ville (2008b), Evaluation des dispositifs d’aide à l’investissement locatif [Evauation of tax incentives for the stimulation of investment in the rental sector], Paris, Ministère du logement et de la ville.
Ministerie van Financiën [Ministry of Finance] (2008), http://www.minfin.nl/nl/onderwerpen,belastingen/belastingplannen/belastingplan-2008-c-a-/belastingplan-2008/Invoering-integrale-vennootschapsbelastingplicht-w.html.
Ministerie van VROM [Ministry of Housing, Spatial Planning and the Environ-ment] (1989), Volkshuisvesting in de jaren negentig: van bouwen naar wonen [Housing in the 1990s: from building to habitation], The Hague.
Ministerie van VROM [Ministry of Housing, Spatial Planning and the Environ-ment] (2004), Cijfers over Wonen [Housing Figures], The Hague.
Ministerie van VROM [Ministry of Housing, Spatial Planning and the Environ-ment] (2005), Rijksbegroting 2006, begroting XI Volkshuisvesting Ruimtelijke Ordening en Milieubeheer [Government budget 2006 for Housing, Spatial Planning and the Environment], Den Haag, Sdu.
Ministerie van VROM [Ministry of Housing, Spatial Planning and the Environ-ment] (2007a), http://www.vrom.nl/pagina.html?id=33449.
Ministerie van VROM [Ministry of Housing, Spatial Planning and the Environ-ment] (2007b), Dossier Huurverhoging 2007 [Rent increase dossier 2007], http://www.vrom.nl/pagina.html?id=30985.
[ 293 ]

Minodier, C. (2004), Le parc locatif récent: davantage de maisons et de petits immeubles [Recent developments in the rented housing stock: more houses and small properties], INSEE Première, No. 957, April.
Minodier, C. (2005), Portrait de locataires [A portrait of tenants], INSEE Première, No. 1010, March.
National Board of Housing, Building and Planning (Sweden) & Ministry for Regional Development of the Czech Republic (2005), Housing Statistics in the European Union, 2004, Karlskrona, Boverket.
Nationale Woningraad (1993), Bruteren: per saldo beter [Grossing and balanc-ing: better on balance], Woningraad Extra, 4, Almere, Nationale Woningraad.
Norris, M. (2005), Social Housing, in: Norris, M. & D. Redmond (eds.), Housing Contemporary Ireland, Dublin, Institute of Public Administration, pp. 160-182.
Norris, M. & K. Murray (2004), National, Regional and Local Patterns in the Residualisation of the Social Rented Tenure: The Case of Ireland and Dublin, Housing Studies 19 (1), pp. 85-105.
Norris, M. & D. Redmond (eds.) (2005), Housing Contemporary Ireland, Dublin, Institute of Public Administration.
Norris, M., D. Coates & F. Kane (2006), Breaching the Limits of Owner Occupa-tion? Supporting Low-Income Buyers in the Inflated Irish Housing Market, paper presented to the Home Ownership in Europe: policy and research is-sues conference, 23rd-24th November 2006, Delft University of Technology.
O’Connell, C. (2005), The Housing Market and Owner Occupation in Ireland, in: Norris, M. & D. Redmond (eds.), Housing Contemporary Ireland, Dublin, Institute of Public Administration, pp. 21-43.
O’Sullivan, T. (2003), Local Areas and Structures, in: Callanan, H. & J. Keogan (eds.), Local Government in Ireland, Dublin, Institute of Public Administration, pp. 41-81.
Observatoire de l’habitat de Paris (2005), L’accès au logement social à Paris en 2005 [Access to social housing in Paris 2005].
ODPM (2003), Sustainable Communities Plan, London, Office of the Deputy Prime Minister.
[ 294 ]

ODPM (2005a), Housing in England 2003/04, Part 1: Tends in tenure and cross tenure topics, April, London, Office of the Deputy Prime Minister.
ODPM (2005b), Housing in England 2003/04, Part 3: Social renters and private renters, December, London, Office of the Deputy Prime Minister.
ODPM (2005c), Lessons from the past, challenges for the future for housing policy, London, Office of the Deputy Prime Minister.
ODPM (2006), Housing in England 2003/04, Part 4, London, Office of the Deputy Prime Minister London, Office of the Deputy Prime Minister.
Ouwehand, A. & G. van Daalen (2002), Dutch housing associations, a model for social housing, Delft, Delft University Press.
Oxley, Michael (2004), Economics, Planning and Housing, London, Palgrave.
Oxley, Michael, Marja Elsinga, Marietta Haffner & Harry van der Heijden (2007), Competition and social rented housing, paper presented at Comparative Housing Policy Workshop, Dublin, 20-21 April.
Oxley, Michael, Marja Elsinga, Marietta Haffner & Harry van der Heijden (2008), Competition and social housing in Europe, Economic Affairs 28 (2), pp. 31-36.
Pannecoucke, I., V. Geurts, R. van Dam, P. de Decker, L. Goossens & Bea Cantil lon (2001), Profiel van de sociale huurder en subjectieve beleving van de realisaties van de sociale huisvesting [Profile of social tenants and perceptions of the realisation of social housing], Antwerpen, UFSIA, http://www.bouwenenwonen.be/uploads/b487_ onderzoeks-rapport_ profielvan_de_sociale_huurder16279.pdf.
Parkinson, C. (2004), Taxation in France 2004. A Foreign Perspective, Guernsey, PKF Limited.
Pawson (2006), Restructuring England’s Social Housing Sector Since 1989: Undermining or Underpinning the Fundamentals of Public Housing, Housing Studies 21 (5), pp. 767-783.
Prak, N. & H. Priemus (1992), The Netherlands, in: Pooley, C. (ed.), Housing Strategies in Europe, 1880-1930, Leicester, Leicester University Press, pp. 164-189.
[ 295 ]

Priemus, H. (1998), Commercial rented housing: two sectors in the Netherlands, Netherlands Journal of Housing and the Built Environment 13 (3), pp. 255-278.
Priemus, H. (2008), Real Estate Investors and Housing Associations: A Level Playing Field? The Dutch Case, European Journal of Housing Policy 8 (1), pp. 81-96.
Priemus, Hugo & Marja Elsinga (2008), Housing allowances in the Netherlands: the struggle for budgetary controllability, in: Kemp, Peter A. (ed.), Housing allowances in comparative perspective, Bristol, Policy Press.
Punch, M. (2005), Uneven Development and the Private Rental Market: Problems and prospects for Low-Income Households, in: Norris, M. & D. Redmond (eds.), Housing Contemporary Ireland, Dublin, Institute of Public Administration, pp. 119-143.
Redmond, Declan (2001), Social Housing in Ireland: Under New Management?, European Journal of Housing Policy 1 (2), pp. 291-306.
Redmond, D. & M. Norris (2007), Social Housing in the Republic of Ireland, in: Whitehead, C. & K. Scanlon (eds.), Social Housing in Europe, London, London School of Economics, pp. 118-129.
Redmond, D. & M. Norris (2005), Setting the Scene: Transformations in Irish Housing, in: Norris, M. & D. Redmond (eds.), Housing Contemporary Ireland, Dublin, Institute of Public Administration, pp. 1-20.
Rhodes, D. (2006), The modern private rented sector, York, Joseph Rowntree Foundation.
Sard, Barbara (2001), Housing vouchers should be a major component of future housing policy for the lowest income families, Cityscape: A Journal of Policy Development and Research 5 (2), pp. 89-110.
Satsangi, M. (1998), Private rented Housing in France, Journal of Housing and the Built Environment 13 (3), pp. 301-27.
Satsangi, M. (2007), Housing allowances in France, in: Kemp, A. (ed.), Housing allowances in comparative perspective, Bristol, The Policy Press.
Scanlon, K. & C. Whitehead (2005), The profile and intentions of buy-to-let investors, London, The Council of Mortgage Lenders.
[ 296 ]

Scanlon, K. & C. Whitehead (eds.) (2008), Social Housing in Europe II. A review of policies and outcomes, London, London School of Economics and Political Science.
Schaefer, J.P. & C. Taffin (2006), L’Economie du logement locatif social [The economy of social rented housing], Revue d’Economie Financière. Revue Trimestrielle de l’association d’économie financière, No. 86.
Schaefer, J.P. (2008), The demand for and supply of social housing in France: hopes and fears. in: Scanlon, K. & C. Whitehead (eds.) (2008), Social Housing in Europe II. A review of policies and outcomes, London, London School of Economics and Political Science, pp. 95-105.
SEV, Stuurgroep Experimenten Volkshuisvesting [Steering Group for Experi-ments in Housing], (1994), Huren van de bank, kopen van de corporatie [Rent from the bank, buy from a housing association], Rotterdam, SEV.
Simons, Harald, Reiner Braun, Ulrich Pfeiffer, Markus Schmidt & Heiko Metzger (2005), Wirtschaft und Wohnen in Deutschland. Regionale Prognosen bis 2015.
Wohnungsmarktentwicklung bis 2030 [The economy and housing in Germany: regional forecasts to 2015, housing market trends to 2030], Berlin, Empirica, Forschung und Beratung.
Statistisches Bundesamt (2007a), Statistische Jahrbuch 2007 [Annual statisti-cal report], Wiesbaden.
Statistisches Bundesamt (2007b), Baugenehmigungen/Baufertigstellungen. Lange Reihen z.T. ab 1960. 2006 (endgültige Daten) [Construction permits and construction], Wiesbaden.
Statistisches Bundesamt (2007c), Förderstatistik 2006 [Bricks-and-mortar subsidy statistics], Wiesbaden.
Statistisches Bundesamt (2007d), Bautätigkeit und Wohnungen. Bestand an Wohnungen. 31. Dezember 2006 [Construction of dwellings], Wiesbaden, Fachserie 5, Reihe 3.
Stephens, M. (2005), An Assessment of the British Housing Benefit System, European Journal of Housing Policy 5 (2), pp. 111-29.
[ 297 ]

Stephens M., N. Burns & L. MacKay (2002), Social market or safety net. British social rented housing in a European context, Bristol, the Policy Press and the Joseph Rowntree Foundation.
Stephens, M., N. Burns & L. Mackay (2003), The Limits of Housing Reform: British Social Rented Housing in a European Context, Urban Studies 40 (4), pp. 767-789.
Stephens, M., C. Whitehead & M. Munro (2005), Lessons from the past, challenges for the future for housing policy: An evaluation of English housing policy 1975-2000, London, Office of the Deputy Prime Minister.
Stigler, G.J. (1972), Economic competition and Political Competition, Public Choice 13 (1), September pp. 91-106.
Tegeder, Gudrun, & Ilse Helbrecht (2007), Germany. Home ownership, a Janus-faced advantage in time of welfare restructuring, in: Elsinga, Marja, Pascal De Decker, Nóra Teller & Janneke Toussaint (eds.), Home ownership beyond asset and security. Perceptions of housing related security and insecurity in eight European countries, Housing and Urban Policy Studies 32, Amsterdam, IOS Press, pp. 101-131.
Ter Rele, Harry & Guido van Steen (2001), Housing subsidisation in the Netherlands: Measuring its distortionary and distributional effects, The Hague, CPB Netherlands Bureau for Economic Policy Analysis, CPB Discussion Paper 002.
Thalmann, P. (2007), Tenure-Neutral and Equitable Housing Taxation, Urban Studies 4 (2), pp. 275-296.
Tiset, J. (2008), Savings book reform jeopardize French social housing, Global Tenant, April, p. 6.
Tomann, Horst (1990), The Housing Market, Housing Finance and Housing Policy in West Germany: Prospects for the 1990s, Urban Studies 27 (6), pp. 919-930.
Toussaint, Janneke, Gudrun Tegeder, Marja Elsinga & Ilse Helbrecht (2007), Security and Insecurity of Home Ownership: Germany and the Netherlands, European Journal of Housing Policy 7 (2), pp. 173-192.
[ 298 ]

Tutin, C. (2008), Social Housing: another French Exception? Paper for the Central and East European Workshop on Social Housing, organised by the Metropolitan Research Institute, Budapest, 6-7 October.
Van Bortel, G. & M. Elsinga (2005), Prestaties van corporaties in de stedelijke vernieuwing, Casestudie Den Haag [Performance of housing associations in urban renewal, the case of The Hague], Delft, OTB.
Van Daalen, Gelske and Marco van der Land (2008), Next Steps in Choice-based Letting in the Dutch Social Housing Sector, European Journal of Housing Policy 8 (3), pp. 317-328.
Van Daalen, G., S. Davis & A. Ouwehand (2005), Gelijke kansen voor iedereen: het is een loterij. Evaluatie van Experimenten met loting in de woonruimte-verdeling [Equal chances for everyone: it is a lottery. Evaluation of experiments with lotteries in housing allocation], Rotterdam, SEV.
Van der Heijden, H. & P. Boelhouwer (1996), The Private Rental Sector in Western Europe: Developments since the Second World War and Prospects for the Future, Housing Studies 11 (1), pp. 13-33.
Van der Heijden, H., M.E.A. Haffner & A.A. Reitsma (2002), Ontwikkeling van de woonuitgaven in zes West-Europese landen [Trends in housing expen-diture in six West European countries], Volkshuisvestingsbeleid en Woning-Volkshuisvestingsbeleid en Woning-markt 34. Delft, DUP Science.
Van der Heijden, Harry, Harry Boumeester, Erik Louw & Paul de Vries (2004), De bouw van woningen en kantoren: Marktwerking, conjunctuur en productie [Building dwellings and offices: market, economic climate and production], Delft, Onderzoeksinstituut OTB.
Van der Schaar, J. (1987), Groei en bloei van het Nederlandse volkshuisvestings-beleid, Volkshuisvesting in Theorie en Praktijk 7, Delft, Delftse Universitaire Pers.
Vandenbroucke, Pieter, Erik Buyst, Sien Winters, Marja Elsinga, Marietta Haffner & Joris Hoekstra (2007), Naar een aanbodbeleid voor de Vlaamse private huurmarkt [Towards a supply policy in the private rental sector], Brussel, Ministerie van de Vlaamse Gemeenschap, Departement RWO-Woonbeleid, http://www.bouwenenwonen.be/uploads/b2659_onderzoeksrapportprivate_huurmarkt11271.pdf.
[ 299 ]

Vanneste, D., I. Tomas & L. Goossens (2007), Wonen en woonomgeving in België [Living and the dwelling environment in Belgium], Brussel, FOD Economie, Monografieën Socio-economische Enquête 2001.
Veser, Jürgen, Thomes Thrun & Wolfgang Jaedicke (2007), Veränderung der Anbieterstruktur im deutschen Wohnungsmarkt und wohnungspolitische Implikationen [Changes in the structure of housing providers on the German housing market and its housing policy implications], Berlin/Bonn, Bundesministerium für Verkehr, Bau und Stadtentwicklung/ Bundesamt für Bauwesen und Raumordnung.
Vickers, J. (1995), Concepts of Competition, Oxford Economic Papers 47 (1), pp. 1-23.
Vlaamse Overheid, Agentschap Inspectie RWO – Wooninspectie (2008), Rapport zes jaar Vlaamse wooninspectie. Een evaluatie. Maart 2008 [Report of six years of quality inspections. An evaluation. March 2008], Brussel.
Vlaamse Regering (2007a), Extra zuurstof voor sociale huisvesting [Extra oxygen for social housing], Persmededeling van de Vlaamse Regering, vrijdag 12 oktober.
Vlaamse Regering (2007b), Nieuwe regels voor 140.000 sociale woningen en 287.000 sociale huurders [New rules for 140,000 social dwellings and 287,000 social tenants], Persmededeling van de Vlaamse Regering, vrijdag 20 juli.
Vlaams Overleg Bewonersbelangen (VOB) (2008), VOB-Jaarrapport Vlaamse Huurdersbonden. Werkingsjaar 2007 [Annual report].
Watson, D. & J. Williams (2003), Irish National Survey of Housing Quality 2001-2002, Dublin, Economic and Social Research Institute.
Whitehead, C. (1996), Private Renting in the 1990s, Housing Studies 11 (1), pp. 7-12.
Whitehead, C. (2007), Social Housing in England in: Whitehead, C. & K. Scanlon, Social Housing in Europe, London, London School of Economics, pp. 54-69.
Whitehead, C. & K. Scanlon (eds.) (2007), Social Housing in Europe, London, London School of Economics and Political Science.
[ 300 ]

Winters, Sien (2004), Belgium-Flanders, in: Gruis, Vincent & Nico Nieboer (eds.), Asset Management in the Social Rented Sector. Policy and Practice in Europe and Australia, Dordrecht, Kluwer Academic Publishers, pp. 61-77.
Winters, Sien & Gerard van Bortel (2008), Institutional and organisational change in Flemish social housing, paper presented at the ENHR-conference, Dublin, 7-9 July.
Winters S., F. Heremans, M. Elsinga, A. Marchal, B. Vandekerckhove & G. van Steen (2004), Op weg naar een Vlaamse huursubsidie? [Towards a Flemish Rent Allowance], Leuven, Kenniscentrum voor Duurzaam Woonbeleid.
Winters, Sien, Katrien Tratsaert, Benediekt Van Damme, Marja Elsinga, Marietta Haffner, Filip Heremans & Gelske Van Daalen (2007), Op weg naar een nieuw Vlaams sociaal huurstelsel? [Towards a new Flemish social rented housing system?], Brussel, Ministerie van de Vlaamse Gemeenschap, Departement RWO-Woonbeleid, http://www.bouwenenwonen.be/uploads/b3309_onderzoeksrapportnieuw_sociaal_huurstelsel155937.pdf.
Wüpper, Thomas (2005), Das neue Monopoly. Die Privatisierung von öffent-lichem Wohnungseigentum schreitet voran [The new monopoly. The continu-ing privatisation of public housing], Kölner Stadt-Anzeiger (182), 8 August, p. 2.
Wurmnest, Wolfgang, last accessed on January 3 2007, Germany, in: Schmid, C. (ed.), Tenancy Law, http://www.eui.eu/LAW/ResearchTeaching/EuropeanPrivateLaw/ tenancyLaw.shtml.
Yates, J. & C. Whitehead (1998), In defence of Greater Agnosticism; A response to Galster’s ‘Comparing Demand-side and Supply-side Housing Policies’, Housing Studies 13 (3), pp. 415-422.
[ 301 ]

[ 302 ]

Agence Nationale de l’Habitat, 114-5, 124, 131-3, 134-7, 140
allocationof market housing, England, 51, 59; Flanders, 84; France, 122-4, 140; Germany, 174-5; Ireland, 193, 202; Netherlands, 221, 231of social housing, England 50-1, 59-60; Flanders, 84-7, 99-101; France, 116, 122-4; Germany, 163-5, 167, 173-5; Ireland, 191-3; Netherlands, 221-3, 230-1
allocation systems, 5, 17, 18, 24, 27-30, 244-50
Arms Length Management Organisation, 9, 35-6, 38, 42-3, 54
Barker Review, 46, 56
Besluit Beheer Sociale Huursector, 216, 223-4
Besluit Woninggebonden Subsidies, 216-7, 225
Cave Review, 51-2, 268
Centraal Fonds voor de Volkshuisvesting, 224-6,
choice-based lettingsEngland, 48, 50-1; Netherlands, 222, 231, 147
Comité Européen de Coordination d’habitat social, 105-6, 122
Comité Interprofessionel du Logement, 123, 136
competition, 21-32, 59, 67-8, 99-101, 140-1, 174-5, 202-3, 231-2, 255-270, 275-8
contract model, 6, 24-6, 30, 32, 269, 273, 276see also state-agent model
cooperatives,concept, 8-10, 14; Flanders, 66; France, 105, 117; Germany, 144-5, 147-51, 169, 172-3; Ireland, 177, 184-6, 201
council housing, 34-5, 178see also local authority housing
decent homes, 38, 43, 52, 54, 58
demographic indicators, 6-7
départements, 103, 115, 123, 128
dual market, 21, 31, 276-8
European Commission, 126, 136, 226, 232, 269
financeEngland, 53-55; Flanders, 60, 91-93; France, 127-130, 136; Germany, 166; Ireland, 195-6; Netherlands, 224-6see also loans
Flemish Housing Code, 64, 77-9, 88-91, 97-9
Flemish Housing Society, 64
gapdefined, 13-32; England, 57-62; Flanders, 95-101; France, 138-142; Germany, 171-5; Ireland, 200-4; Netherlands, 228-33; summary, 235-78
GdW Gesamtverband der Gemeinnützigen Wohnungsunternehmen, 146
GdW Bundesverband deutscher Wohnungsunternehmen, 146-8
governmentstructure and housing, 11, 33-5, 63, 103, 143, 177, 205
guarantee funds, 126, 225, 230
Habitations à Loyer Modéré, 105, 118, 137-8
Homes and Communities Agency, 34-8, 54
home ownershipsee owner occupation
house building see housing production
householdsmobility, and the gap, 20-1, 248, 253; England, 40, 59, 60-1; Flanders, 73-4, 99; Germany, 174; Ireland, 202; Netherlands, 211-2, 218, 231
Index
[ 303 ]

socio-economic characteristics, England, 39-41; Flanders, 70-4; France, 109-10; Germany, 151-2; Ireland, 180-1; Netherlands, 212-4
housing allowances,characteristics, 5, 17, 27; England, 42, 56-7; Flanders, 94-5, 98-100; France, 103, 110, 125, 136-7; Germany, 153-4, 157, 170-1, 174; Ireland, 180-1, 196-7; Netherlands, 202-3, 227-8
housing associationscharacteristics, 9, 14, 236-8, 240-5; England, 33-6, 38, 42-3, 48-51; Flanders, 67-8, 78-9, 81-2, 85-90, 92-101; Ireland, 177-8, 184, 188, 193-9; Netherlands, 205-8, 216-9, 222-4
housing productionall countries, 7; England, 34-5, 43, 46; Flanders, 76-7; France, 103, 112-17; Germany, 154, 157-8, 168; Ireland, 182-3, 186; Netherlands, 207-8, 217
housing stockEngland, 35-8; Flanders, 64-70; France, 104-8; Germany, 143-51; Ireland, 177-80, Netherlands, 205-211
intermediate sectorconcept, 31, 27-3, 270-3; England, 46-7, 55, 62; France, 114-6, 124, 129-30, 135, 138-41
Kemeny, J, 21, 31, 273, 276-8
key workers, 5, 46-7, 62, 149, 243, 271-3
L’allocation logement, 137
landlordsmarket, defined, 4-5; characteristics summarised, 8social, defined, 4-5; characteristics summarised, 9-10;see also Arms Length Management Organisation; housing associations; local authority housing, Habitations à Loyer Modéré;
loanssubsidised, England, 54-5; Flanders, 64, 68, 74, 88, 91-2; France, 103-4, 108, 110-5, 124-31, 139-41; Germany, 167; Ireland, 181-2, 190; Netherlands, 216, 225, 230
local authority housing, 6, 33-5, 53-4, 64, 182-4, 192-5, 198-9, 201
macroeconomic indicators, 7
Mietspiegel, 159-60, 162
Mission d’Inspection Interministérielle du Logement, 126-7, 140, 244, 249
Nationale Landmaatschappij, 75
Nationale Maatschappij voor Goedkope Woningen en Woonvertrekken, 74
Nationale Maatschappij voor de Kleine Landeigendommen, 74-5
Openbaar Centrum voor Maatschappelijk Welzijn, 64
owner occupation, 8, 37, 40-2, 64-6, 74-5, 150, 154-6, 177-8
Prêt Locatif à Usage Social, 103, 114, 123, 125, 127-132, 134, 139
Prêt Locatif Aidé d’Intégration, 103, 125, 128, 131
Prêt Locatif Intermédiaire, 124-5, 129, 130
Prêt Locatif Social, 103, 114, 124-5, 129-132, 140-1
price/quality relationships, 15, 23, 28, 100, 142, 230, 232, 240, 263-6
Prime à l’amélioration des logements locatifs sociaux, 130-1, 139-40
private landlordssee landlords, market
private rentingsee landlords, market
Private Residential Tenancies Board, 185, 246-7
[ 304 ]

property rightsconcept, 11, 13-16, 26-7; England, 47-50; Flanders, 79-84, 96-7; France, 118-22, 139; Germany, 158-62, 173-4; Ireland, 186-90, 201; Netherlands, 220-1, 229-30; overview, 236-9, 241-2, 256
refurbishment, 115, 131-5, 163, 166, 185, 195-6
regulationconcept, 17-19, 27; England, 36, 51-3, 59; Flanders, 83-4, 87-91, 97-9; France, 118-9, 124-7, 139-40; Germany, 158-61, 165, 173-5; Ireland, 193-5, 202; Netherlands, 215-6, 219-20, 223-4, 231; overview, 244-50, 256, 259
rent controlsEngland, 47-8; Flanders, 79-81; France, 118-120; Germany, 158-161, Ireland, 186-9; Netherlands, 219-20
rent surcharge, 119-20, 138-9, 158, 162-3, 172-3, 181, 242
Rental Accommodation Scheme, 196, 198-9, 238, 262, 268, 272
residence permits, 78, 163, 167, 173
right to buy, 48-50, 82, 190, 242, 255-6
rivalrydefined, 22-6, 27-8
security of tenureEngland, 48-9; Flanders, 81-83; France, 118-122; Germany, 162; Netherlands, 220-1
Social Rental Agencies, 64, 66, 78, 86-7, 97-8, 237
social rentingdefined 4-5see also landlords, social
Société d’Economie Mixte, 105-6, 125
state agent model, 198-9see also contract model
subsidiesdefined, 19-20, England 53-6; Flanders, 91-5; France, 127-138; Germany, 165-171; Ireland, 195-200; Netherlands, 224-8 see also taxation; housing allowances
substitutabilitydefined, 26-27
Supplementary Welfare Allowance, 196-8
taxationEngland, 56-7; Flanders, 93-4; France, 132-6; Germany, 168-70; Ireland, 195-7; Netherlands, 226-7
tenantssee households
Tenant Services Authority, 33, 38, 54
tenure distributionall countries, 8; England, 34; Flanders, 65; France, 105; Germany, 145; Ireland, 178; Netherlands, 207
Tussenkomst In de Leninglast, 77
Union Sociale pour l’Habitat, 106
unitary market, 21, 276-7
urbanisation, 66, 104, 106
Vereniging van Institutionele Beleggers in Vastgoed, Nederland, 208, 226, 232, 263-4
Vlaamse Huisvestingsmaatschappij, 64
Vlaamse Maatschappij voor Sociaal Wonen, 64, 67, 89
Wohnraumförderungsgesetz, 161, 166-7
[ 305 ]

[ 306 ]

Housing and Urban Policy Studies
1. Boelhouwer, P. and H. van der Heijden, Housing systems in Europe: Part I, a comparative study of housing policy 1992/298 pages/ISBN 90-6275-769-3
2. Papa, 0., Housing systems in Europe: Part II, a comparative study of housing finance 1992/210 pages/ISBN 90-6275-770-7
3. Lundqvist, L.J., Dislodging the welfare state? Housing and privatization in four European nations 1992/144 pages/ISBN 90-6275-771-5
4. Gilhuis, H. and S.Volbeda, Collective self-help housing in Brazil 1992/176 pages/ISBN 90-6275-672-7
5. Priemus, H. and G. Metselaar, Urban renewal policy in a Euro-pean perspective, an international comparative analysis 1992/68 pages/ISBN 90-6275-787-1
6. Priemus, H., M. Kleinmann, D. Maclennan and B. Turner, Euro pean monetary, economic and political union: conse quences for national housing policies 1993/57 pages/ISBN 90-6275-840-1
7. Visscher, H., Building control in five European countries1993/162 pages/ISBN 90-6275-908-4
8. Kruythoff, H., Residential environments and households in the Randstad 1993/241 pages/ISBN 90-6275-927-0
9. Danermark, B. and I. Elander, Social rented housing in Europe: policy, tenure and design 1994/182 pages/ISBN 90-6275-942-4
10. Anyumba, G., Kisumu Town: history of the built form, planning and environment: 1890-1990 1995/372 pages/ISBN 90-407-1067-8
11. Boelhouwer, P.J. and A.J. Menkveld, Housing expenditure in Western Europe: macro and micro quotas 1996/58 pages/ISBN 90-407-1327-8
12. Smith, J.E., What determines housing investment? An investi-gation into the social, economic and political determinants of housing investment in four European countries 1997/219 pages/ISBN 90-407-1420-7
13. Boelhouwer, P.J. (ed.), Financing the social rented sector in Western Europe 1997/115 pages/ISBN 90-407-1433-9

14. Lambregts, B.W. and M. Spaans, The development and financing of public real property in urban areas in Belgium, Germany, France and Great Britain 1998/126 pages/ISBN 90-407-1692-7
15. Sheridan, L. (principal author and editor), The control and promotion of housing quality in Europe. Part I Country monographs 2001/296 pages/ISBN 90-407-2148-3
16. Sheridan, L., The control and promotion of housing quality in Europe. Part II Comparative analysis 2001/184 pages/ISBN 90-407-2149-1
17. Krantsz, B., E. Oresjo and H. Priemus, Large scale housing estates in Northwest Europe: problems, interventions and experiences 1999/164 pages/ISBN 90-407-1928-4
18. Ipenburg, D. and B. Lambregts, Polynuclear urban regions in North West Europe. A survey of key actor views 2001/135 pages/ISBN 90-407-2180-7/978-90-407-2180-9
19. Sunikka, M., Policies and regulations for sustainable building. A comparative study of five European countries 2001/133 pages/ISBN 90-407-2266-8/978-90-407-2266-0
20. Spaans, M., The implementation of urban revitalization projects. An international comparison 2002/338 pages/ISBN 90-407-2256-0/978-90-407-2256-1
21. Doling, J., and J. Ford (eds.), Globalisation and home owner-ship. Experiences in eight member states of the European Union 2003/231 pages/ISBN 90-407-2425-3/978-90-407-2425-1
22. Beerepoot, M., Energy regulations for new building. In search of harmonisation in the European Union 2002/189 pages/ISBN 90-407-2325-7/978-90-407-2325-4
23. Meijer, F.M., H.J. Visscher and L. Sheridan, Building regulations in Europe. Part I A comparison of the systems of building control in eight European countries 2002/200 pages/ISBN 90-407-2373-7/978-90-407-2373-5
24. Meijer, F.M., H.J. Visscher and L. Sheridan, Building regulations in Europe. Part II A comparison of technical requirements in eight European countries 2003/280 pages/ISBN 90-407-2449-0/978-90-407-2449-7
25. Meijers, E.J., A. Romein and E.G. Hoppenbrouwer, Planning polycentric urban regions in North West Europe. Value, feasi-bility and design 2003/210 pages/ISBN 90-407-2420-2/978-90-407-2420-6
26. Lambregts, Bart, and Wil Zonneveld, Polynuclear urban regions and the transnational dimension of spatial planning. Proposals for multi-scalar planning in North West Europe 2003/109 pages/ISBN 90-407-2462-8/978-90-407-2462-6
27. Zonneveld, Wil and Jan Jacob Trip, Megacorridors in North West Europe. Investigating a new transnational planning concept 2003/92 pages/ISBN 90-407-2472-5/978-90-407-2472-5
28. Turkington, R., R. van Kempen and F. Wassenberg (eds.), High rise housing in Europe. Current trends and future prospects2004/284 pages/ISBN 90-407-2483-0/978-90-407-2483-1
29. Boelhouwer, Peter, John Doling and Marja Elsinga (eds.), Home ownership. Getting in, getting from, getting out 2005/205 pages/ISBN 90-407-2594-2/978-90-407-2594-4
30. Doling, John and Marja Elsinga (eds.), Home ownership. Getting in, getting from, getting out. Part II 2006/266 pages/ISBN 978-1-58603-634-3
31. Horsewood, Nick and Peter Neuteboom (eds.), The social limits to growth. Security and insecurity aspect of home ownership2006/202 pages/ISBN 978-1-58603-699-8
32. Elsinga, Marja, Pascal De Decker, Nóra Teller and Janneke Toussaint (eds.), Home ownership beyond asset and security. Perceptions of housing related security and insecurity in eight European countries2007/336 pages/ISBN 978-1-58603-830-4
33. Haffner, Marietta, Joris Hoekstra, Michael Oxley and Harry van der Heijden, Bridging the gap between social and market rented housing in six European countries? 2009/306 pages/ISBN 978-1-60750-035-3
Copies can be ordered at www.dupress.nl. The numbers 1 up to 13 are no longer available.

Delft University Press is an imPrint of ios Press
The once clear demarcation of funding and roles of the social and market rental sectors seems to have become blurred in a number of European countries. Social renting is no longer provided only by non-profit organisations. The extent to which a gap can be identified between the social and market rental sectors in six countries in north-west Europe (England, Flanders (Belgium), France, Germany, Ire-land and the Netherlands) is the central issue in this book. The gap depends on similarities and differences between the two rental sectors. From an empirical viewpoint it conveys who provides what in rental housing, the govern-ment policies that are relevant and the outcomes that are achieved. From a theoretical point of view the gap is about the extent to which accommodation in the two sectors can be considered as substitutes by consumers and whether landlords are rivals in attracting tenants.
otB research institUte for hoUsing, UrBan anD
moBility stUDies
Copyright © 2022 FDOKUMEN