Bridging the gap between community ecology and historical biogeography: niche conservatism and...
16
Bridging the gap between community ecology and historical biogeography: niche conservatism and community structure in emydid turtles P. R. STEPHENS* and J. J. WIENS† *Odum School of Ecology, University of Georgia, Athens, GA 30602, USA, †Department of Ecology and Evolution, Stony Brook University, Stony Brook, NY 11794-5245, USA Abstract Historical (phylogenetic) biogeography and community ecology were once integrated as part of the broader study of organismal diversity, but in recent decades have become largely separate disciplines. This is unfortunate because many patterns studied by community ecologists may originate through processes studied by historical biogeogra- phers and vice versa. In this study, we explore the causes of a geographic pattern of community structure (habitat use) in the emydid turtle assemblages of eastern North America, with more semi-terrestrial species of the subfamily Emydinae in the north and more aquatic species of Deirochelyinae in the south. Specifically, we address the factors that prevent northern emydines from invading southern communities. We test for competitive exclusion by examining patterns of range overlap, and test for the role of niche conservatism using analyses of climatic and physiological data based on a multilocus molecular phylogeny. We find no support for competitive exclusion, whereas several lines of evidence support the idea that niche conservatism has prevented northern emydines from dispersing into southern communities. Our results show how understanding the causes of patterns of historical biogeography may help explain patterns of community structure. Keywords: community ecology, Emydidae, historical biogeography, niche conservatism, phylog- eny, turtles Received 18 March 2009; revision received 14 July 2009; accepted 31 July 2009 Introduction Community ecology and historical (phylogenetic) bioge- ography were once part of a single discipline that addressed the factors responsible for the diversity and abundance of species in communities and regional bio- tas, as well as the factors responsible for the origin and spread of species and clades (reviewed in Wiens & Donoghue 2004; Lomolino et al. 2006). In recent years, they have become largely independent fields of study. This is unfortunate, because many patterns studied by community ecologists (i.e. community assembly, species richness, community structure; Morin 1999) involve processes typically studied by historical biogeographers (e.g. buildup of regional biotas through speciation and large-scale dispersal). Conversely, many patterns stud- ied by historical biogeographers (i.e. distributions of species and clades) arise through processes generally studied by ecologists (e.g. competition, dispersal, eco- physiological adaptation; Wiens & Donoghue 2004). One factor that may have contributed to the intellectual disconnect between these fields is the relative dearth of approaches that bridge the gap between the large-scale, long-term patterns with which historical biogeography is generally concerned (reviewed in Lomolino et al. 2006) and the shorter-term, local-scale processes that are often the focus of community ecology (reviewed in Morin 1999). During the past two decades, phylogenetic studies have begun to relate the ecological diversification of lin- eages to patterns of community structure (reviewed in Correspondence: Patrick R. Stephens, Fax: (706) 542-4819; E-mail: [email protected] Ó 2009 Blackwell Publishing Ltd Molecular Ecology (2009) 18, 4664–4679 doi: 10.1111/j.1365-294X.2009.04378.x
-
Upload
independent -
Category
Documents
-
view
0 -
download
0
Transcript of Bridging the gap between community ecology and historical biogeography: niche conservatism and...

Molecular Ecology (2009) 18, 4664–4679 doi: 10.1111/j.1365-294X.2009.04378.x
Bridging the gap between community ecology andhistorical biogeography: niche conservatism andcommunity structure in emydid turtles
P. R. STEPHENS* and J . J . WIENS†
*Odum School of Ecology, University of Georgia, Athens, GA 30602, USA, †Department of Ecology and Evolution, Stony Brook
University, Stony Brook, NY 11794-5245, USA
Corresponde
E-mail: prste
Abstract
Historical (phylogenetic) biogeography and community ecology were once integrated as
part of the broader study of organismal diversity, but in recent decades have become
largely separate disciplines. This is unfortunate because many patterns studied by
community ecologists may originate through processes studied by historical biogeogra-
phers and vice versa. In this study, we explore the causes of a geographic pattern of
community structure (habitat use) in the emydid turtle assemblages of eastern North
America, with more semi-terrestrial species of the subfamily Emydinae in the north and
more aquatic species of Deirochelyinae in the south. Specifically, we address the factors
that prevent northern emydines from invading southern communities. We test for
competitive exclusion by examining patterns of range overlap, and test for the role of
niche conservatism using analyses of climatic and physiological data based on a
multilocus molecular phylogeny. We find no support for competitive exclusion, whereas
several lines of evidence support the idea that niche conservatism has prevented
northern emydines from dispersing into southern communities. Our results show how
understanding the causes of patterns of historical biogeography may help explain
patterns of community structure.
Keywords: community ecology, Emydidae, historical biogeography, niche conservatism, phylog-
eny, turtles
Received 18 March 2009; revision received 14 July 2009; accepted 31 July 2009
Introduction
Community ecology and historical (phylogenetic) bioge-
ography were once part of a single discipline that
addressed the factors responsible for the diversity and
abundance of species in communities and regional bio-
tas, as well as the factors responsible for the origin and
spread of species and clades (reviewed in Wiens &
Donoghue 2004; Lomolino et al. 2006). In recent years,
they have become largely independent fields of study.
This is unfortunate, because many patterns studied by
community ecologists (i.e. community assembly, species
richness, community structure; Morin 1999) involve
processes typically studied by historical biogeographers
nce: Patrick R. Stephens, Fax: (706) 542-4819;
(e.g. buildup of regional biotas through speciation and
large-scale dispersal). Conversely, many patterns stud-
ied by historical biogeographers (i.e. distributions of
species and clades) arise through processes generally
studied by ecologists (e.g. competition, dispersal, eco-
physiological adaptation; Wiens & Donoghue 2004).
One factor that may have contributed to the intellectual
disconnect between these fields is the relative dearth of
approaches that bridge the gap between the large-scale,
long-term patterns with which historical biogeography
is generally concerned (reviewed in Lomolino et al.
2006) and the shorter-term, local-scale processes that
are often the focus of community ecology (reviewed in
Morin 1999).
During the past two decades, phylogenetic studies
have begun to relate the ecological diversification of lin-
eages to patterns of community structure (reviewed in
� 2009 Blackwell Publishing Ltd

NICHE C ONSERVATISM IN T URTLES 4 66 5
Webb et al. 2002; Emerson & Gillespie 2008; Vamosi
et al. 2009; see also Chazdon et al. 2003; Vitt et al. 2003;
Cavender-Bares et al. 2004a; Gillespie 2004), an impor-
tant step in bridging the gap between historical bioge-
ography and community ecology. There are now
numerous published examples of convergence in com-
munity structure due to convergent adaptive evolution
in different lineages in different regions (e.g. Winemiller
1991; Hertel 1994; Losos et al. 1998; Gillespie 2004;
Melville et al. 2006; Wiens et al. 2006a), as well as geo-
graphic patterns of community structure related to
phylogenetic trends in the geographic distribution and
ecological characteristics of lineages (e.g. Cadle &
Greene 1993; Price et al. 2000; Cavender-Bares et al.
2004a; Stephens & Wiens 2004). There is also a large lit-
erature concerned with the phylogenetic relatedness of
species within communities, which is used to infer pro-
cesses such as competition (e.g. Cavender-Bares et al.
2004b; Cooper et al. 2008; Webb et al. 2008). However,
phylogenetic studies of community structure have not
generally addressed the factors that limit the dispersal
of lineages between communities (but see Tofts & Sil-
vertown 2000; Cavender-Bares et al. 2004a; Prinzing
et al. 2008). If species are able to disperse freely among
all of the communities considered, geographic patterns
of community structure that are related to phylogenetic
trends in the ecological characteristics of lineages may
be blurred or disappear entirely (e.g. Stephens & Wiens
2004). Similarly, without biogeographic isolation, there
may be little selective pressure for convergent adaptive
evolution, as any given niche may tend to be filled by
the same species in each community (e.g. Schluter 2000;
Wiens et al. 2006a; but see Kozak et al. 2009).
Numerous abiotic and biotic factors may set the
geographic limits of species ranges, including limited
physiological tolerances to stressful environmental con-
ditions, competition with closely related species, limited
food resources, predators or some combination of
factors (Lomolino et al. 2006). One general factor that
has been hypothesized to limit the distribution of spe-
cies and clades is phylogenetic niche conservatism, the
tendency of species to retain ancestral ecological charac-
teristics (e.g. Peterson et al. 1999; Wiens & Graham
2005). This pattern can arise via several population-level
processes (e.g. stabilizing selection, limited genetic vari-
ation, gene flow, pleiotropy) and can exist even when
character evolution is stochastic (Blomberg et al. 2003).
Niche conservatism can lead to closely related species
having similar environmental tolerances (Wiens & Gra-
ham 2005). When this occurs, closely related species
will be affected by similar dispersal barriers (Wiens
2004), which will tend to produce distinct patterns in
the geographic distribution of lineages (Wiens &
Graham 2005). In addition, because of phylogenetic
� 2009 Blackwell Publishing Ltd
signal in other traits, geographic patterns in the distri-
bution of clades may often be related to patterns of
community structure because species of a given lineage
have similar ecological characteristics (e.g. certain die-
tary and habitat specialists may be clustered within a
particular clade, which will be restricted to a particular
geographic area because of shared environmental toler-
ances). In other words, niche conservatism can be
related to patterns of community structure both through
phylogenetic trends in the major ecological characteris-
tics of clades and in shared environmental tolerances
that limit the geographic distribution of those clades
(Webb et al. 2002).
Some disagreement exists over what patterns are evi-
dence for niche conservatism (e.g. Peterson et al. 1999;
Wiens & Graham 2005; Losos 2008a,b; Warren et al.
2008; Wiens 2008). Here, we are interested in whether
geographic patterns of community structure are related
to phylogenetic trends in traits that limit the distribu-
tion of species and clades. Such a pattern can occur
regardless of whether ecological characteristics are less
labile than expected under a Brownian motion model of
character evolution (i.e. phylogenetically conserved
sensu Losos 2008a). Showing that some ecological char-
acters have phylogenetic signal (sensu Blomberg et al.
2003; Revell et al. 2008) or that sister species have envi-
ronmental niches that are more similar than expected at
random (i.e. Warren et al. 2008) potentially supports
niche conservatism, but does not address whether niche
conservatism affects geographic patterns of community
structure. It is also necessary to show a relationship
between conserved characters and patterns in the distri-
bution of the species, and between species distributional
patterns and patterns of community structure. Similarly,
testing whether species in communities are phylogeneti-
cally ‘clustered’ or ‘even’ (sensu Webb et al. 2008) does
not directly address the causes of large-scale patterns of
community structure, unless coupled with analyses that
explore the factors that limit species distributions (e.g.
Cavender-Bares et al. 2004a).
Relatively new Geographic Information Systems
(GIS)-based methods, particularly niche modelling, are
beginning to revolutionize our understanding of the fac-
tors that control the distribution of species over large
spatial scales (e.g. Peterson et al. 1999; Peterson & Holt
2003; Martinez-Meyer et al. 2004; Smith et al. 2005;
reviewed by Graham et al. 2004a). However, to date
these approaches have not been used to address the ori-
gins of large-scale geographic patterns of community
structure. Using GIS-based climatic data to explore the
distribution of clades assumes that the climatic distribu-
tion of species is related to phylogenetically heritable
traits that they possess (e.g. physiological tolerances).
This underlying assumption also has yet to be directly

4666 P. R . STEPHENS and J . J . WIENS
tested. However, an interesting study by Edwards &
Still (2008) did examine the climatic distribution of
introduced plants on the Hawaiian Islands, and found
that C4 grasses were confined to warmer areas due lar-
gely to phylogenetically inherited traits. Here, we use
GIS-based methods to test the causes of geographic pat-
terns of community structure in emydid turtles in east-
ern North America.
Emydid turtle community structure
Emydids contain 41–47 currently recognized species
(reviewed in Stephens & Wiens 2003; Bickham et al.
2007; Uetz 2009) and are geographically widespread
and ecologically diverse (Ernst & Barbour 1989). Emy-
didae is the most species-rich turtle family in North
America, and contains many familiar species such as
the painted turtle (Chrysemys picta), red-eared slider
(Trachemys scripta) and eastern box turtle (Terrapene
carolina). In eastern North America, southern assem-
blages of emydids have a greater proportion of strictly
aquatic species than northern assemblages, whereas
northern assemblages have a greater proportion of
semi-terrestrial species (Stephens & Wiens 2004). This
pattern seems to be related to phylogenetic trends in
the ecological characteristics of the two basal emydid
clades (Deirochelyinae, Emydinae; Fig. 1), along with
patterns of endemism in those lineages (Fig. 1, see
also Stephens & Wiens 2004). Deirochelyines (Chryse-
mys, Deirochelys, Graptemys, Malaclemys, Pseudemys, Tra-
chemys) are aquatic, and in eastern North America
species either occur in both northern and southern
communities or are restricted to southern communities.
Emydines that occur in eastern North America are ter-
restrial or semi-terrestrial (i.e. habitat generalists that
utilize both aquatic and terrestrial habitats extensively),
and are either widespread in both southern and north-
ern communities (Terrapene, Clemmys) or largely
restricted to northern communities (Emydoidea, Glypte-
mys).
The latitudinal pattern in emydid habitat use occurs
because most aquatic deirochelyine species do not dis-
perse into northern communities and because most
semi-terrestrial emydine species do not disperse into
southern communities. It is generally accepted that the
northern range limits of most emydids are related to
freeze tolerance or lack of it and whether the potential
active season (i.e. the warm season) is long enough for
a given species to reproduce (reviewed in Ernst et al.
1994; Ultsch 2006). The failure of northern endemic spe-
cies to disperse into southern communities is more puz-
zling. There are no obvious dispersal barriers between
northern and southern communities, and the warm con-
ditions of southern communities would intuitively seem
to be more hospitable for large ectotherms than north-
ern communities.
Two factors that may be most important in setting
geographic range limits are competition and physiologi-
cal tolerances. Here we explore the factors that may
prevent northern semi-terrestrial emydines from dis-
persing into southern communities, using a GIS-based
approach to look for evidence of competitive exclusion
and niche conservatism. We also test for a correlation
between climatic conditions where species occur and a
seemingly relevant physiological variable (critical ther-
mal maximum, CTM) that has been measured in a
number of emydid species.
Methods
Testing for competitive exclusion
We predict that if competition with southern emydid
species limits the southward dispersal of northern spe-
cies, pairs of southern and northern species should be
closely abutting rather than broadly sympatric or allo-
patric. We tested for this pattern by comparing locality
data from northern semi-terrestrial emydines to locality
data from the remaining emydids. Locality data (lati-
tude ⁄ longitude coordinates) were obtained from Iverson
(1992). They include all museum localities and literature
records available when his survey was published, and
contain an average of 292 localities for each of the three
northern endemics. The possibility that some presence
localities were excluded cannot be ruled out. However,
such omissions are likely to be minor, given that the
geographic extent of localities reported by Iverson
(1992) are consistent with estimates of the overall geo-
graphic range of species, which have been stable for
>40 years (e.g. Conant 1958; Ernst et al. 1994; Conant &
Collins 1998).
The range of each northern species was divided into
10 bins of equal longitudinal width. Within each bin,
the southernmost locality of each northern species was
compared to the northernmost locality of each emydid
species that occurred in the same longitudinal band.
Species that occurred >100 km south or north of the
southern range limit of the focal species (averaged
across all 10 bins) were considered unlikely to be
important as agents of competitive exclusion. Species
that occurred on average >100 km north of the southern
range limit of a given species were considered broadly
sympatric, whereas those that occurred on average
>100 km south were considered allopatric. We also
repeated this analysis after pooling all locality data for
species that were not broadly sympatric, to see if the
remaining species when considered as a group might
determine the southern range limits of each northern
� 2009 Blackwell Publishing Ltd

Fig. 1 Ancestral character reconstruction of habitat and region of occurrence in emydids. Boxes to the right of the tree indicate
regions of occurrence for each species: black is northern endemic (in eastern North America), white is southern endemic, black and
white is widespread, and grey is outside of eastern North America. Shading on branches indicates parsimony reconstruction of habi-
tat, white is terrestrial, black is aquatic, and grey is semi-terrestrial. The area of shading in pie charts indicates the relative likelihoods
of the same three character states in a maximum likelihood reconstruction of habitat. Likelihood reconstructions where the likelihood
of ‘aquatic’ was >0.99 are not shown. Parsimony and likelihood reconstructions were performed with MESQUITE, using the phylogeny
based on combined Bayesian analysis of six nuclear genes.
NICHE C ONSERVATISM IN T URTLES 4 66 7
semi-terrestrial species. Ten bins was chosen somewhat
arbitrarily, but it was the greatest number of bins that
the ranges of Emydoidea and Glyptemys muhlenbergii
could be divided into without producing some bins that
contained three or fewer localities.
This method is equivalent to the ‘natural experiments’
observational approach that has often been used to infer
competitive exclusion in past studies (reviewed in Dia-
mond 1986; Lomolino et al. 2006). Showing a pattern of
range overlap consistent with competitive exclusion (i.e.
closely abutting ranges or parapatry) would not prove
� 2009 Blackwell Publishing Ltd
that such interactions occur (Diamond 1986; Morin
1999), but the absence of such a pattern would seem-
ingly preclude the importance of competition in pre-
venting semi-terrestrial emydines from dispersing into
southern communities (particularly in the case of allop-
atry). One limitation of our approach is that it cannot
detect the effects competitive interactions that change
along a gradient. For example, if the strength of compe-
tition varies along an abiotic gradient (e.g. temperature,
rainfall), the limit of a species distribution might result
from the interaction between competition and climate.

4668 P. R . STEPHENS and J . J . WIENS
However, even in the latter case, competition is not the
sole cause of a species range limits. Potential competi-
tors besides emydids were also considered (e.g. non-
emydid turtles, omnivorous mammals). However, none
showed a pattern of range overlap consistent with our
predictions for competitive exclusion, and we do not
report these results in detail (see Discussion).
Testing correlations with environmental variables
Using BIOCLIM (Busby 1991), an extension of ArcView
GIS v3.3 (Environmental Systems Research Institute),
we determined the values of climatic variables at locali-
ties where the three northern semi-terrestrial species
occur. For these analyses we used the WorldClim biocli-
matic (Bio) variables (Hijmans et al. 2004, 2005), which
consist of 19 GIS ‘layers’ (Table 1) based on monthly
temperature and rainfall data at 2.5 s resolution
(roughly 5 km2). Many of these variables are highly
correlated, given that they are derived from the same
underlying temperature and precipitation data. To
Table 1 Climatic variables in the WorldClim data set
Abbreviation Group Variable
Bio 1 A Annual mean temperature
Bio 2 Neither Mean diurnal range [mean of monthly
(max temp ) min temp)]
Bio 3 A Isothermality (Bio 2 ⁄ Bio 7) (·100)
Bio 4 A Temperature seasonality (standard
deviation · 100)
Bio 5 A Maximum temperature of warmest
month
Bio 6 A Minimum temperature of coldest
month
Bio 7 A Temperature annual range
(Bio 5–Bio 6)
Bio 8 Neither Mean temperature of wettest quarter
Bio 9 A Mean temperature of driest quarter
Bio 10 A Mean temperature of warmest
quarter
Bio 11 A Mean temperature of coldest
quarter
Bio 12 B Annual precipitation
Bio 13 A, B Precipitation of wettest month
Bio 14 B Precipitation of driest month
Bio 15 B Precipitation seasonality (coefficient of
variation)
Bio 16 B Precipitation of wettest quarter
Bio 17 B Precipitation of driest quarter
Bio 18 B Precipitation of warmest quarter
Bio 19 B Precipitation of coldest quarter
Variables in italics were used for analyses of species southern
range limits. Group refers to which of two sets of highly
correlated variables (see Methods) each climate variable fell
into. A quarter equals 3 months.
identify independent sets of climatic variables, all possi-
ble two-way comparisons of the 19 variables (across all
localities where the northern emydines occur) were
made using Spearman’s rank correlation (implemented
in JMPTM v. 3.2.1). Sets of variables with |rs| > 0.70 were
considered ‘strongly correlated’. This somewhat arbi-
trary cut-off was chosen because with so many localities
(a total of 876) even correlations that would generally
be considered weak (rs < 0.08) were statistically signifi-
cant at a = 0.05.
These comparisons identified two groups of variables
that were strongly correlated, one corresponding to
temperature and another to rainfall (Table 1). One
exemplar variable was chosen to represent each of these
sets for further analyses. Exemplars were chosen that
represented the same data throughout the range of spe-
cies considered (for example, mean temperature during
the driest quarter was not chosen because it might indi-
cate summer temperatures in some places and winter
temperatures in others), and that seemed likely to be
biologically meaningful in influencing range limits
based on previous emydid physiological literature
(reviewed in Ernst et al. 1994). We also assumed that
extreme temperatures (e.g. maximum temperature dur-
ing the warmest month) are more likely to determine
range limits than average temperatures (e.g. mean
annual temperature). Two environmental variables
(mean diurnal temperature range and mean tempera-
ture of wettest quarter) did not show strong correlations
with any other variables. Precipitation seasonality (i.e.
coefficient of monthly variation) was also included,
even though it showed a strong correlation with annual
precipitation, because variance in precipitation was not
a component of any other variable we included. For
analyses that included all emydid species (see below),
we also considered minimum temperature of the cold-
est month, even though it is inversely correlated with
the warmest temperature of the hottest month. This var-
iable was included because it is generally believed to
determine the northern range limit of many emydid
species (Ernst et al. 1994; but see Ultsch 2006).
We used logistic regression to determine which cli-
matic variables were most strongly correlated with the
presence and absence of a given species across locali-
ties, and thus might set the southern range limits of the
three northern emydine species. Identifying the impor-
tance of specific variables would be more difficult using
the composite variables created by principal compo-
nents analysis, and so this approach was not used.
Absence localities were selected immediately south of
the southern range limits of each of the three northern
emydine species. Rather than randomly selecting
absence localities, we used localities where two other
widespread emydines have been collected (Terrapene
� 2009 Blackwell Publishing Ltd

NICHE C ONSERVATISM IN T URTLES 4 66 9
carolina and Terrapene ornata), but the northern semi-
terrestrial emydines have not. Absence localities
included all Terrapene localities between 50 and 400 km
south of the southernmost range limit of each emydine
species at any given longitude that it occurred. It seems
unlikely that the true range limit of any species was
more than 50 km away from the known southernmost
locality, and 50 to 400 km covered a band similar in
latitudinal extent to the presence localities for each
species. Terrapene was chosen because it occurs through-
out the range of the northern semi-terrestrial emydines,
as well as far to the south of them.
Logistic regression (implemented in JMP) was then
used to quantify the strength of the correlation between
each of the five climate variables and the presence and
absence of a given species along its southern range
limit. After performing separate analyses of each cli-
mate variable, we investigated more complex models
incorporating multiple climate variables. Models using
all possible combinations of the five climate variables
were compared using Akaike’s Information Criterion
(AIC, Akaike 1973) implemented in R (R Development
Core Team 2008). The minimum sample size (452)
greatly exceeded the maximum number of model
parameters (five) in these comparisons, so no adjust-
ment to raw AIC scores was needed (Burnham &
Anderson 1998). The model with the lowest AIC score
was used for subsequent analyses. The spatial density
of localities varies considerably from one region to
another. To correct for this sampling bias, analyses were
repeated using one random locality per species per
county that it occurred in (for both presence and
absence data). These analyses had qualitatively identical
results to analyses using all data and are not reported.
Finally, we compared the extent to which niche mod-
els based on each of the five bioclimatic variables suc-
cessfully predicted the presence and absence of each
species along their southern range limit (following
Smith et al. 2005; Wiens et al. 2006b). Niche models for
each climatic variable were constructed for each species
in Maxent (http://www.cs.princeton.edu/~schapire/
maxent/). The general procedure followed Phillips
et al. (2006), with all settings in Maxent set to default
save that 80% of localities were used for training mod-
els and 20% were used to test models. Preliminary
analyses showed that this latter procedure greatly
increased the precision of models compared to the
default setting, which does not use any localities to test
models. We examined a range of cut-offs for ‘predicted
occurrence’; r = 0.10, 0.20, 0.30, 0.40, 0.50 and 0.60 (few
models had values of r > 0.69 in any presence or
absence locality). Using each cut-off, we calculated
the percentage of presence localities excluded (i.e. the
extent to which the model underpredicted) and the
� 2009 Blackwell Publishing Ltd
percentage of absence localities included (i.e. the extent
to which the model overpredicted). We then averaged
these two values to come up with a ‘percentage error’
for each niche model and cut-off. We repeated this anal-
ysis using niche models estimated from each climate
variable separately, as well as niche models estimated
from all variables selected by AIC from models of pres-
ence and absence localities. Note that both logistic
regression and niche modelling analyses are intended
to illustrate correlations between climate variables and
species southern range limits, so no correction for mul-
tiple comparisons was applied.
Testing environmental variables for phylogeneticconservatism
If phylogenetically conserved climatic tolerances are
important in limiting the distribution of the northern
semi-terrestrial species, then we predict three patterns.
First, relevant climatic variables should show statisti-
cally significant phylogenetic signal across the phylog-
eny of emydids (i.e. k significantly different from 0, see
below), particularly variables that seem to set the range
limits of species based on niche modelling and logistic
regression. Second, the variables that are correlated
with the southern range limits of the northern semi-
terrestrial emydines should be correlated with the range
limits of close relatives that occur in other continental
regions outside eastern North America. Finally, recon-
structions of environmental variables on the phylogeny
should show that the ancestors of the northern endemic
emydids occurred in cooler climates than the southern
endemic emydids (i.e. that the differing climatic
regimes of these clades are phylogenetically inherited).
These results would support the hypothesis that phylo-
genetic niche conservatism has limited the ability of the
three northern semi-terrestrial species to disperse into
southern communities.
Phylogenetic analyses utilized two Bayesian trees:
one based on combined nuclear DNA (six genes), mito-
chondrial DNA (two genes) and morphology; and one
based only on nuclear genes (Appendix S1; online at
the journal website). Both trees are very similar and
gave identical results for the tests of phylogenetic
conservatism. We report results using the nuclear
DNA tree as the branch lengths of this tree are likely
the most accurate. For detailed information on the data
and methods used to estimate these phylogenies,
see Appendix S1. These phylogenies were generally
strongly supported and congruent with previous phy-
logenies (e.g. Stephens & Wiens 2003, 2008, 2009). For
example, the generic-level topology based on combined
data is almost identical to that of Stephens & Wiens
(2009), and the nuclear DNA tree is congruent except

4670 P. R . STEPHENS and J . J . WIENS
for minor differences in the placement of Actinemys and
Chrysemys.
Phylogenetic signal was assessed using k (Pagel 1999;
Freckleton et al. 2002), with Continuous (M. Pagel;
http://www.evolution.reading.ac.uk/Files/Continuous
Manual.pdf). k varies between 0 (no phylogenetic sig-
nal) and 1 (expected pattern under a Brownian motion
model given the observed branch lengths and tree
topology). Measures of ‘phylogenetic signal’ such as kand Blomberg’s K (Blomberg et al. 2003) have been crit-
icized because they reveal little about the process or
rate of trait evolution (Revell et al. 2008). However,
high k should indicate that trait variation is distributed
primarily among major clades rather than within them
(Freckleton et al. 2002; Revell et al. 2008). This is the
expected pattern if niche conservatism in climatic toler-
ances determines the large-scale distribution of emydid
species and clades.
For all six environmental variables (i.e. the five used
for logistic regression plus Bio 6, lowest temperature of
the coldest month, see Table 1), we determined the aver-
age, minimum value, and maximum value for each spe-
cies and subspecies in the phylogeny based on locality
data from Iverson (1992). Localities ranged from 7 to 2423
per species (average 305.94). Raw climatic data for locali-
ties where species occur were extracted from the WORDC-
LIM data set using BIOCLIM as described above. We then
determined k and its 95% confidence interval for each of
these variables in emydids. Variables with a 95% confi-
dence interval that did not include 0 were considered to
have statistically significant phylogenetic signal.
We also repeated all of the analyses described above
under ‘Testing Correlations with Environmental Vari-
ables’ using Emys orbicularis (which occurs in Europe,
the Middle East and Northern Africa). This species is
the closest living relative of the northern semi-terrestrial
endemic Emydoidea blandingii (Stephens & Wiens 2003).
No species of emydid (or any other turtle in most of
the range) occurs between 50 and 400 km of the south-
ern range limits of E. orbicularis. We therefore sampled
environmental data using a grid of evenly spaced lati-
tude and longitude coordinates for absence localities
(every 0.25�). Absence localities in water (e.g. the Medi-
terranean Sea) were excluded.
Result of all the analyses described above indicated
that temperature variables were most likely to be
important to patterns of clade distribution, niche con-
servatism and community structure in emydids. To
assess phylogenetic patterns of variation in climatic dis-
tribution of emydids, we reconstructed the maximum
temperature of the warmest month (Bio 5) and the min-
imum temperature of the coolest month (Bio 6) for all
emydid species included in the phylogeny. If niche con-
servatism in temperature tolerance sets the southern
distributional limits of the northern emydines, they
should be members of clades in which Bio 5 and Bio 6
are ancestrally lower than in most emydids. These cli-
matic variables were reconstructed as continuous vari-
ables using the generalized least-squares method
(Martins & Hansen 1997), implemented in COMPARE ver-
sion 4.6b (Martins 2004). Reconstructions were repeated
using both averages of climate variables for each spe-
cies (i.e. an average across all localities) and the highest
and lowest temperatures observed in each species (i.e.
maximum Bio 5 and minimum Bio 6), and overall phy-
logenetic patterns were similar. However, a subsequent
analysis showed the highest temperature where a spe-
cies occurs (max Bio 5) rather than the average across
each species range is more strongly correlated with a
physiological variable (i.e. CTM) that has been mea-
sured across several species of emydids. This is the pat-
tern that would be expected if Bio 5 and CTM are
primarily important in determining species southern
range limits. As we are primarily interested in range
limits, we only report the results of reconstruction of
temperature extremes (i.e. coldest and warmest temper-
atures) for each species.
Finally, we wished to visualize the match between
the southern range limits that would be predicted based
on the temperature tolerances of the northern semi-ter-
restrial emydines and those of other emydines occur-
ring outside northeastern North America. If climatic
niches have been conserved between the northern ende-
mic species and their relatives, we would expect that
the southern range limits predicted by the climate enve-
lopes of the northern semi-terrestrial species should
match the southern range limits observed in closely
related emydines. First, we constructed a niche model
from the combined point localities of E. blandingii, Gly-
ptemys insculpta and Glyptemys muhlenbergii based on
maximum temperature of the warmest month (Bio 5)
using Maxent. We compared this to the southern range
limits observed in other emydines that are semi-
terrestrial or whose most recent ancestor seems to have
been semi-terrestrial: Emys orbicularis in Europe and the
Mediterranean region of Africa and the Middle East,
Actinemys marmorata in western North America and
Clemmys guttata in southeastern North America.
Although we made only a qualitative assessment of
whether a given species ‘matched’ its predicted south-
ern range limit, the results were sufficiently dichoto-
mous that we felt a quantitative assessment of the trend
was unnecessary (see Results).
Correlations with physiology
The analyses described above suggest that emydid spe-
cies distributions may be related to their physiological
� 2009 Blackwell Publishing Ltd

NICHE C ONSERVATISM IN T URTLES 4 67 1
tolerances to cold and ⁄ or heat. Cold tolerance has been
directly quantified in only six emydid species (Costanzo
et al. 2006), and in adults of only four (Storey & Storey
1992; see Ultsch 2006 for qualitative reports of freeze
tolerance in additional species). However, heat tolerance
has been more widely assessed, and is potentially more
relevant to understanding the southern range limits of
the northern emydines. Hutchison et al. (1966) mea-
sured CTM, the thermal point at which individuals
lose the ability to locomote effectively, for a total of 12
emydids.
To investigate the relationship between climatic distri-
bution and physiological tolerances, we regressed maxi-
mum values of Bio 5 (max. temp.) against the average
and maximum CTM. Hutchison et al. (1966) measured
CTM of some species across several populations, and we
used CTM from the population with the highest average
CTM. Hutchison et al. (1966) characterized their results
as ‘preliminary’, presumably because the number of
individuals sampled varied widely among species
(n = 1–43). To adjust for possible sampling error in spe-
cies with extremely small sample sizes, we only
included the eight species with n ‡ 5. Five was chosen
because a higher threshold would exclude at least half
the species sampled by Hutchison et al. (1966). Correla-
tions including all 12 species were in the same direction,
but were roughly halved and only marginally significant
(P-values ranged from 0.04 to 0.08), presumably due to
measurement error in poorly characterized species.
Regression analyses were performed using phyloge-
netically independent contrasts (PIC) of Bio 5 and CTM,
implemented in MESQUITE version 1.12 (Maddison &
Maddison 2006). Species-level (i.e. tips) analyses were
not performed because we wished to test for an
Table 2 Patterns of range overlap between northern emydines and
range
Number of
localities Broadly sympatric
Emydoidea blandingii 420 1, 8, 12, 14, 25*, 26, 27*
Glyptemys insculpta 331 1, 2, 8, 14*, 23*, 25
Glyptemys muhlenbergii 125 1, 2*, 8, 19*,25, 27*
*A species that is allopatric throughout most of its range but broadly
subspecies likely to represent species, see Stephens & Wiens 2003) are
localities for each species: 1. Chrysemys picta (1939), 2. Clemmys guttata
5. Graptemys caglei (15), 6. Graptemys ernsti (13), 7. Graptemys flavimacul
(46), 10. Graptemys nigrinoda (65), 11. Graptemys oculifera (22), 12. G. ou
Graptemys pseudogeographica (256), 15. Graptemys pulchra (52), 16. Grapt
alabamensis (32), 19. Pseudemys concinna (520), 20. Pseudemys gorzugi (19
23. Pseudemys rubriventris (93), 24. Pseudemys texana (210), 25. Terrapene
(1550). ‘Combined’ indicates the results when data from all species th
� 2009 Blackwell Publishing Ltd
evolutionary correlation between CTM and Bio 5
(Freckleton 2009). The tree and branch lengths used to
estimate contrasts were from a Bayesian analysis of six
nuclear genes, given that branch lengths from mito-
chondrial DNA alone seem to be distorted in some gen-
era (Appendix S1). Contrasts were estimated across all
nodes of the phylogeny, which was pruned to include
only the eight species having adequate CTM data. We
plotted the absolute value of standardized contrasts
against their standard deviations using MESQUITE and
confirmed that contrasts were adequately standardized
by the branch lengths they were estimated from. This
analysis was also repeated using phylogenetic general-
ized least squares (Martins & Hansen 1997) imple-
mented in COMPARE. The results were identical to PIC
analyses with respect to direction and statistical signifi-
cance of correlations.
Results
Testing for competitive exclusion
None of the three northern semi-terrestrial species
showed a pattern of range overlap with other emydids
that is consistent with our predictions assuming com-
petitive exclusion (Table 2). Instead of being parapatri-
cally distributed, other emydid species were either
broadly allopatric or broadly sympatric with the north-
ern emydines.
Correlations with environmental variables
All correlations between environmental variables and
the southern range limits (presence and absence) of the
other species of emydids that occur in the same longitudinal
Parapatric Broadly allopatric
None 3, 4, 5, 6, 7, 9, 10, 11, 13, 15, 16, 17, 18, 19, 20,
21, 22, 23*, 24, Combined
None 3, 4, 6, 7, 10, 11, 13*, 15, 17*, 18, 19, 21, 22, 26,
27, Combined
None 3, 4, 17*, 21, 22, 23*, Combined
sympatric in some part of its range or vice versa. Species (and
as follows, the number in parentheses is the number of
(505), 3. Deirochelys reticularia (461), 4. Graptemys barbouri (69),
ata (13), 8. Graptemys geographica (433), 9. Graptemys gibbonsi
achitensis ouachitensis (177), 13. G. ouachitensis sabinensis (9), 14.
emys versa (20), 17. Malaclemys terrapin (259), 18. Pseudemys
), 21. Pseudemys nelsoni (149), 22. Pseudemys peninsularis (220),
carolina (2424), 26. Terrapene ornate (549), 27. Trachemys scripta
at are not broadly sympatric with each species are combined.

4672 P. R . STEPHENS and J . J . WIENS
northern emydines were significant at a = 0.05. How-
ever, the maximum temperature of the warmest month
(Bio 5) consistently showed stronger correlations with
presence and absence along the southern range limits of
these species than the other environmental variables
(Table 3). Niche models based on this variable also had
consistently lower percentage error (averaged across
thresholds; Table 4). The multivariate model that
included all five environmental variables had the lowest
AIC score in all three species and explained roughly
twice as much variation in presence and absence as
bivariate analyses (Table 3). See Appendix S1 for AIC
scores, delta AIC values and r2 for all 30 models that
were assessed for each species. Multivariate niche mod-
els also had lower percentage error (averaged across all
Table 3 Correlations (r2) between environmental variable and prese
logistic regression
Presence
localities ⁄absence
localities
Mean
diurnal
temperature
range (Bio 2)
Maximum
temperature
of the warmest
month (Bio 5)
Emydoidea blandingii 420 ⁄ 771 0.220 0.345
Glyptemys insculpta 331 ⁄ 463 0.019 0.266
Glyptemys muhlenbergii 125 ⁄ 327 0.089 0.299
All correlations are significant at P < 0.001.
Table 4 Percentage error (see Methods) of climatic niche models, ave
Mean
diurnal
temperature
range (Bio 2)
Maximum
temperature
of the warmest
month (Bio 5)
Mea
tem
of t
qua
Emydoidea blandingii 37.57 28.62 37.1
Glyptemys insculpta 41.38 39.12 42.6
Glyptemys muhlenbergii 45.92 24.52 29.8
Table 5 Values of k for the mean, maximum and minimum of six
emydids
Mean
diurnal
temperature
range (Bio 2)
Maximum
temperature
of the warmest
month (Bio 5)
Minimum
temperatu
of the cold
month (Bio
Minimum 0.116 1.00* 0.340
Maximum 0.452 1.00* 0.630
Mean 0.380 1.00* 0.688
*Values that showed statistically significant phylogenetic signal (i.e. v
zero).
six thresholds for ‘predicted occurrence’) than models
based on individual climate variables (Table 4).
Testing environmental variables for phylogeneticconservatism
Three temperature variables [maximum temperature of
the warmest month (Bio 5), minimum temperature of
the coldest month (Bio 6) and mean temperature of the
wettest quarter (Bio 8)] showed higher values of k than
other environmental variables tested (Table 5), indicat-
ing greater phylogenetic signal. Logistic regression
showed that mean diurnal temperature range (Bio 2)
and maximum temperature (Bio 5) were most strongly
correlated with the southern range limits of the
nce or absence of species along southern range limit based on
Mean
temperature
of the wettest
quarter (Bio 8)
Annual
precipitation
(Bio 12)
Precipitation
seasonality
(Bio 15)
Multivariate
model
0.011 0.242 0.041 0.667
0.187 0.113 0.016 0.434
0.053 0.034 0.177 0.441
raged across six thresholds for ‘predicted occurrence’
n
perature
he wettest
rter (Bio 8)
Annual
precipitation
(Bio 12)
Precipitation
seasonality
(Bio 15)
Multivariate
model
3 30.63 46.68 24.52
8 63.25 52.59 36.02
3 46.52 25.37 12.90
environmental variables across 37 species and subspecies of
re
est
6)
Mean
temperature
of the wettest
quarter (Bio 8)
Annual
precipitation
(Bio 12)
Precipitation
seasonality
(Bio 15)
0.426* 0.915* 0.000
0.978* 0.000 0.986*
0.745 0.000 0.620
alues for which the 95% confidence interval did not include
� 2009 Blackwell Publishing Ltd

Table 6 Correlations between climatic variables and the
southern range limits of Emys, the sister to Emydoidea, based on
333 presence localities and 129 absence localities
Correlation
with presence
and absence
Average
percentage
error
Mean diurnal temperature range
(Bio 2)
0.542 17.00
Maximum temperature of the
warmest month (Bio 5)
0.452 24.94
Mean temperature of the wettest
quarter (Bio 8)
0.106 43.79
Annual precipitation (Bio 12) 0.286 36.81
Precipitation seasonality (Bio 15) 0.209 43.62
Multivariate model 0.693 39.02
Numbers in the middle column indicate correlations (r2)
between environmental variables (listed in the left column)
and presence or absence of this species along its southern
range limits, based on logistic regression. Numbers in the
right column indicate percentage error (see Methods) of
climatic niche models, averaged across six thresholds for
‘predicted occurrence’.
NICHE C ONSERVATISM IN T URTLES 4 67 3
European emydine Emys orbicularis (the sister taxon to
the northern semi-terrestrial species Emydoidea blandin-
gii), and models based on these variables overpredicted
into fewer localities than those based on other climate
variables (Table 6). The multivariate model that
included all five environmental variables had the lowest
AIC score, and multivariate regression analyses
explained more variation in presence and absence than
bivariate analyses. However, multivariate niche models
had higher percentage error than several models based
on single variables.
Phylogenetic reconstruction of maximum temperature
(Bio 5) and minimum temperature (Bio 6) showed that
the northern, semi-terrestrial emydines are members of
clades for which both variables are ancestrally lower
than in most emydids (Fig. 2). The clades that con-
tained the semi-terrestrial emydids generally showed
reconstructed values of Bio 5 of £34.3 �C and of Bio 6 of
£)12.35 �C. In contrast, within Deirochelyinae and Ter-
rapene, reconstructed values were nearly always
‡35.3 �C for Bio 5 and ‡)8.36 �C for Bio 6. Finally, a
niche model based on the values of Bio 5 from presence
localities for the three northern endemic semi-terrestrial
emydines predicted overall southern range limits that
are similar to those observed in Actinemys marmorata
and Emys orbicularis, but not Clemmys guttata (Fig. 3).
Predicted southern range limits match those observed
for Emys orbicularis with the exception of northern Tuni-
sia (Fig. 3B), and only one locality occurred further
south than the overall predicted southern range limit of
Actinemys marmorata in the Baja peninsula (Fig. 3C). In
� 2009 Blackwell Publishing Ltd
contrast, Clemmys guttata in eastern North America
occurs far to the south of the predicted range limits
based on Bio 5 (Fig. 3D).
Correlations with physiology
Although only eight species were sufficiently character-
ized to be included, contrasts of the highest value of
maximum temperature of the warmest month (i.e. max-
imum Bio 5) in each species were strongly and posi-
tively correlated with contrasts of both average and
maximum CTM (r2 = 0.652, P = 0.015 for average CTM;
r2 = 0.646, P = 0.016 for maximum CTM).
Discussion
This study illustrates how using a GIS approach in a
phylogenetic context can help bridge the gap between
historical biogeography and community ecology. Our
results suggest that niche conservatism, rather than
competitive exclusion, seems to explain patterns of
endemism in three semi-terrestrial emydines. This
pattern of endemism is in turn related to a latitudinal
pattern of community structure (Stephens & Wiens
2004), with more semi-terrestrial species in northern
communities (dominated by emydines) and more
aquatic species in southern communities (dominated
by deirochelyines). Thus, historical biogeography of
emydid clades influences geographic patterns of com-
munity structure, and phylogenetic niche conservatism
in climatic tolerances seems to explain the pattern of
historical biogeography.
Patterns of endemism in northern endemicsemi-terrestrial emydids
Phylogenetic niche conservatism with respect to climatic
temperature regime seems to be the major factor pre-
venting Emydoidea blandingii, Glyptemys insculpta and
Glyptemys muhlenbergii from invading communities in
southeastern North America. The clade that contains
these three species consists primarily of species that
occur at cooler temperatures than most emydid species
(Fig. 2), and temperature variables were also correlated
with the southern range limits of the European sister
species to Emydoidea (i.e. Emys orbicularis; Table 6).
Maximum temperatures of the warmest month (Bio 5)
were strongly correlated with the southern range limit
of each species (Table 3), niche models based on this
variable were the most accurate at predicting the south-
ern range limits of each species (Table 4), and this vari-
able has a strong phylogenetic signal in emydids in
general (Table 5). A niche model based on values of
Bio 5 from the three northeastern endemics was also

Fig. 2 Ancestral character reconstruction of maximum Bio 5 (maximum temperature of the warmest month) and minimum Bio 6
(minimum temperature of the coolest month) in degrees Celsius. Note that the scale for each variable is somewhat arbitrary, and
intended to illustrate a ‘breakpoint’ in each variable between the two basal lineages of emydids. Phylogeny is based on combined
Bayesian analysis of six nuclear genes.
4674 P. R . STEPHENS and J . J . WIENS
able to predict the southern range limits of related emy-
dines in Europe and western North America.
We acknowledge that there is considerable error in
niche models based on these climatic variables, and that
the correlations between putatively limiting climatic
variables and species absences are significant but not
perfect (Tables 3 and 4). However, there is no direct
evidence for other obvious factors that could explain
the failure of these species to disperse into southern
communities. Our results show little evidence for com-
petitive exclusion from other emydids (Table 2). Turtle
species in other families also fail to show geographic
ranges that abut those of these northern endemics (Iver-
son 1992; Ernst et al. 1994). We assume that much lar-
ger or much smaller species are unlikely to strongly
compete for the same resources utilized by the northern
� 2009 Blackwell Publishing Ltd

A
C
B
D
Fig. 3 Niche model based on maximum
temperature of the warmest month (Bio
5) at for the northern semi-terrestrial
emydines, compared to localities for (A)
Glyptemys insculpta, Glyptemys muhlen-
bergii and Emydoidea blandingii; (B) Emys
orbicularis; (C) Actinemys marmorata and
(D) Clemmys guttata.
NICHE C ONSERVATISM IN T URTLES 4 67 5
semi-terrestrial emydines. However, apart from the
turtle species mentioned above, there are no other
omnivorous ectotherms of similar body size in eastern
North America. Even if we consider omnivorous
mammals, species of similar size (e.g. skunks, raccoons,
opossums) are broadly sympatric with each of the
three semi-terrestrial emydines (Hall 1981). However,
we acknowledge that our approach does not preclude
the possibility that the range limits of the northern
semi-terrestrial species are related to competitive inter-
actions that vary along a climatic gradient.
Predation and resource limitation also seem unlikely.
Adult turtles of most species are little affected by pre-
dation, and the predators that attack adults of a few
species and nestlings (coyotes, river otters, foxes, rac-
coons, opossums, reviewed in Ernst et al. 1994; Ultsch
2006) occur widely in North America (Hall 1981). The
sole exception is the American Alligator (Alligator mis-
sissippiensis) which occurs far to the south of any of the
northern semi-terrestrial emydines (Conant & Collins
1998). Given that all three species are omnivores (Ernst
et al. 1994), it also seems unlikely that their distribu-
tions are tracking the distribution of a specific food
resource. Parasite loads are known to be heavy in both
southern and northern populations of some turtle spe-
cies (Ernst & Ernst 1977). However, parasites have not
been thoroughly studied in the three northern endem-
ics. The possibility that the distribution of a parasite
species or some interaction with climate and parasite
� 2009 Blackwell Publishing Ltd
abundance limits the southern distribution of these spe-
cies cannot be completely ruled out, although there is
no evidence for it. In contrast, we find several lines of
evidence for the influence of climatic variables on the
southern range limits of these species, particularly the
highest summer temperatures.
Given the assumption that climatic variables are the
primary factor setting the range limits of these species,
what proximate factors might explain the failure of
these species to disperse further south? Most turtle spe-
cies exhibit temperature-dependent sex determination
(Ernst & Barbour 1989), and the effects of temperature
on eggs might therefore set the southern range limits of
the northern endemics (i.e. a nest laid outside of the
normal thermal niche of a species might produce all
males or all females). However, this cannot be a factor
for G. insculpta or G. muhlenbergii, because they have
chromosomal sex determination (Ewert & Nelson 1991).
Limited overall thermal tolerances of eggs (i.e. eggs laid
in southern communities might fail to hatch at all)
cannot be ruled out.
Another possibility is limited tolerance of adults to
high temperatures. Intriguingly, only one semi-
terrestrial emydine (Clemmys guttata) extends farther
south than would be predicted based on a niche model
for the three northern endemics (Fig. 3). But unlike
other semi-terrestrial emydines, C. guttata aestivates
during most of the summer (Ernst et al. 1994), and so
is inactive during the time of year that it would
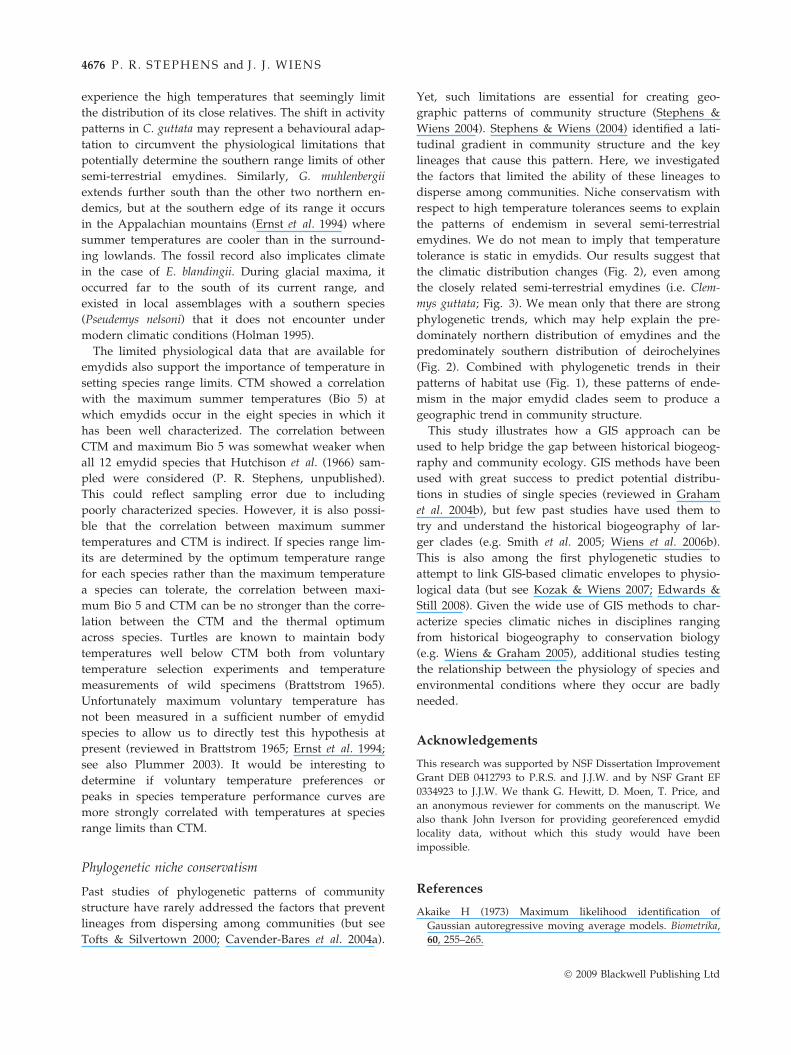
4676 P. R . STEPHENS and J . J . WIENS
experience the high temperatures that seemingly limit
the distribution of its close relatives. The shift in activity
patterns in C. guttata may represent a behavioural adap-
tation to circumvent the physiological limitations that
potentially determine the southern range limits of other
semi-terrestrial emydines. Similarly, G. muhlenbergii
extends further south than the other two northern en-
demics, but at the southern edge of its range it occurs
in the Appalachian mountains (Ernst et al. 1994) where
summer temperatures are cooler than in the surround-
ing lowlands. The fossil record also implicates climate
in the case of E. blandingii. During glacial maxima, it
occurred far to the south of its current range, and
existed in local assemblages with a southern species
(Pseudemys nelsoni) that it does not encounter under
modern climatic conditions (Holman 1995).
The limited physiological data that are available for
emydids also support the importance of temperature in
setting species range limits. CTM showed a correlation
with the maximum summer temperatures (Bio 5) at
which emydids occur in the eight species in which it
has been well characterized. The correlation between
CTM and maximum Bio 5 was somewhat weaker when
all 12 emydid species that Hutchison et al. (1966) sam-
pled were considered (P. R. Stephens, unpublished).
This could reflect sampling error due to including
poorly characterized species. However, it is also possi-
ble that the correlation between maximum summer
temperatures and CTM is indirect. If species range lim-
its are determined by the optimum temperature range
for each species rather than the maximum temperature
a species can tolerate, the correlation between maxi-
mum Bio 5 and CTM can be no stronger than the corre-
lation between the CTM and the thermal optimum
across species. Turtles are known to maintain body
temperatures well below CTM both from voluntary
temperature selection experiments and temperature
measurements of wild specimens (Brattstrom 1965).
Unfortunately maximum voluntary temperature has
not been measured in a sufficient number of emydid
species to allow us to directly test this hypothesis at
present (reviewed in Brattstrom 1965; Ernst et al. 1994;
see also Plummer 2003). It would be interesting to
determine if voluntary temperature preferences or
peaks in species temperature performance curves are
more strongly correlated with temperatures at species
range limits than CTM.
Phylogenetic niche conservatism
Past studies of phylogenetic patterns of community
structure have rarely addressed the factors that prevent
lineages from dispersing among communities (but see
Tofts & Silvertown 2000; Cavender-Bares et al. 2004a).
Yet, such limitations are essential for creating geo-
graphic patterns of community structure (Stephens &
Wiens 2004). Stephens & Wiens (2004) identified a lati-
tudinal gradient in community structure and the key
lineages that cause this pattern. Here, we investigated
the factors that limited the ability of these lineages to
disperse among communities. Niche conservatism with
respect to high temperature tolerances seems to explain
the patterns of endemism in several semi-terrestrial
emydines. We do not mean to imply that temperature
tolerance is static in emydids. Our results suggest that
the climatic distribution changes (Fig. 2), even among
the closely related semi-terrestrial emydines (i.e. Clem-
mys guttata; Fig. 3). We mean only that there are strong
phylogenetic trends, which may help explain the pre-
dominately northern distribution of emydines and the
predominately southern distribution of deirochelyines
(Fig. 2). Combined with phylogenetic trends in their
patterns of habitat use (Fig. 1), these patterns of ende-
mism in the major emydid clades seem to produce a
geographic trend in community structure.
This study illustrates how a GIS approach can be
used to help bridge the gap between historical biogeog-
raphy and community ecology. GIS methods have been
used with great success to predict potential distribu-
tions in studies of single species (reviewed in Graham
et al. 2004b), but few past studies have used them to
try and understand the historical biogeography of lar-
ger clades (e.g. Smith et al. 2005; Wiens et al. 2006b).
This is also among the first phylogenetic studies to
attempt to link GIS-based climatic envelopes to physio-
logical data (but see Kozak & Wiens 2007; Edwards &
Still 2008). Given the wide use of GIS methods to char-
acterize species climatic niches in disciplines ranging
from historical biogeography to conservation biology
(e.g. Wiens & Graham 2005), additional studies testing
the relationship between the physiology of species and
environmental conditions where they occur are badly
needed.
Acknowledgements
This research was supported by NSF Dissertation Improvement
Grant DEB 0412793 to P.R.S. and J.J.W. and by NSF Grant EF
0334923 to J.J.W. We thank G. Hewitt, D. Moen, T. Price, and
an anonymous reviewer for comments on the manuscript. We
also thank John Iverson for providing georeferenced emydid
locality data, without which this study would have been
impossible.
References
Akaike H (1973) Maximum likelihood identification of
Gaussian autoregressive moving average models. Biometrika,
60, 255–265.
� 2009 Blackwell Publishing Ltd

NICHE C ONSERVATISM IN T URTLES 4 67 7
Bickham JW, Iverson JB, Parham JF et al. (2007) An annotated
list of modern turtle terminal taxa with comments on areas
of taxonomic instability and recent change. Chelonian
Research Monographs, 4, 171–199.
Blomberg SP, Garland Jr T, Ives AR (2003) Testing for
phylogenetic signal in comparative data: behavioral traits are
more labile. Evolution, 57, 717–745.
Brattstrom BH (1965) Body temperatures of reptiles. American
Midland Naturalist, 98, 376–422.
Burnham KP, Anderson DR (1998) Model Selection and Inference:
A Practical Information-Theoretic Approach. Springer-Verlag,
New York, NY.
Busby JR (1991) BIOCLIM – a bioclimate analysis and prediction
system. In: Nature Conservation: Cost Effective Biological
Surveys and Data Analysis (eds Margules CR, Austin MP), pp.
64–68. CSIRO, Canberra, Australia.
Cadle JE, Greene HW (1993) Phylogenetic patterns,
biogeography, and the ecological structure of neotropical
snake assemblages. In: Species Diversity in Ecological
Communities: Historical and Geographical Perspectives (eds
Ricklefs RE, Schluter D), pp. 281–293. University of Chicago
Press, Chicago, IL.
Cavender-Bares J, Kitajima K, Bazzaz FA (2004a) Multiple trait
associations in relation to habitat differentiation among 17
oak species in North Central Florida. Ecological Monographs,
74, 635–662.
Cavender-Bares J, Ackerly DD, Baum DA, Bazzaz FA (2004b)
Phylogenetic overdispersion in Floridian oak communities.
American Naturalist, 163, 823–843.
Chazdon RL, Careaga S, Webb C, Vargas O (2003) Community
and phylogenetic structure of reproductive traits of wood
species in wet tropical forests. Ecological Monographs, 73, 331–
348.
Conant R (1958) A Field Guide to Reptiles and Amphibians of
United States and Canada East of the 100th Meridian. Houghton
Mifflin, Boston, Massachusetts.
Conant R, Collins JT (1998) A Field Guide to Reptiles and
Amphibians. Eastern and Central North America, 3rd edn.
Houghton Mifflin Company, Boston, MA.
Cooper N, Rodriguez J, Purvis A (2008) A common tendency
for phylogenetic overdispersion in mammalian assemblages.
Proceedings of the Royal Society of London, Series B: Biological
Sciences, 275, 2031–2037.
Costanzo JP, Baker PJ, Lee Jr RE (2006) Physiological responses
to freezing in hatchlings of freeze-tolerant and intolerant
turtles. Journal of Comparative Physiology B, 176, 697–707.
Diamond JM (1986) Overview: laboratory experiments, field
experiments, and natural experiments. In: Community Ecology
(eds Diamond JM, Case TJ), pp. 3–22. Harper Row, New
York, NY.
Edwards EJ, Still CJ (2008) Climate, phylogeny and the
ecological distribution of C4 grasses. Ecology Letters, 11, 266–
276.
Emerson BC, Gillespie RG (2008) Phylogenetic analysis of
community assembly and structure over space and time.
Trends in Ecology and Evolution, 23, 619–630.
Ernst CH, Barbour RW (1989) Turtles of the World. Smithsonian
Institution Press, Washington, DC.
Ernst EM, Ernst CH (1977) Synopsis of helminthes
endoparasitic in native turtles of the United States. Bulletin of
the Maryland Herpetological Society, 13, 1–75.
� 2009 Blackwell Publishing Ltd
Ernst CH, Lovich JE, Barbour RW (1994) Turtles of the United
States and Canada. Smithsonian Institution Press, Washington,
DC.
Ewert MA, Nelson CE (1991) Sex determination in turtles:
diverse patterns and some possible adaptive values. Copeia,
1991, 50–69.
Freckleton RP (2009) The seven deadly sins of comparative
analysis. Journal of Evolutionary Biology, 22, 1367–1375.
Freckleton RP, Harvey PH, Pagel M (2002) Phylogenetic and
comparative data: a test and review of the evidence.
American Naturalist, 160, 712–726.
Gillespie RG (2004) Community assembly through adaptive
radiation in Hawaiian spiders. Science, 303, 356–359.
Graham CH, Farrier S, Huettman F, Moritz C, Peterson AT
(2004a) New developments in museum-based informatics
and application in biodiversity analyses. Trends in Ecology
and Evolution, 19, 497–503.
Graham CH, Ron SR, Santos JC, Schneider JC, Moritz CJ
(2004b) Integrating phylogenetics and environmental niche
models to explore speciation mechanisms in dendrobatid
frogs. Evolution, 58, 1781–1783.
Hall ER (1981) The Mammals of North America, 2nd edn. John
Wiley and Sons, New York, NY.
Hertel F (1994) Diversity in body size and feeding morphology
within past and present vulture assemblages. Ecology, 75,
1074–1084.
Hijmans RJ, Cameron SE, Parra JL, Jones PG, Jarvis A (2004)
The WorldClim Interpolated Global Terrestrial Climate Surfaces,
Version 1.3. Available at: http://biogeo.berkeley.edu/
Hijmans RJ, Cameron SE, Parra JL, Jones PG, Jarvis A (2005)
Very high resolution interpolated climate surfaces for global
land areas. International Journal of Climatology, 25, 1965–1978.
Holman AJ (1995) Pleistocene Amphibians and Reptiles in North
America. Oxford University Press, New York, NY.
Hutchison VH, Vinegar A, Kosh RJ (1966) Critical thermal
maxima in turtles. Herpetologica, 22, 32–41.
Iverson JB (1992) A Revised Checklist With Distribution Maps of
the Turtles of the World. Green Nature Books, Homestead, FL.
Kozak KH, Wiens JJ (2007) Climatic zonation drives latitudinal
variation in speciation mechanisms. Proceedings of the Royal
Society of London B: Biological Sciences, 274, 2995–3003.
Kozak KH, Mendyk RW, Wiens JJ (2009) Can parallel
diversification occur in sympatry? Repeated patterns of
body-size evolution in co-existing clades of North American
salamanders Evolution, 63, 1769–1784.
Lomolino MV, Riddle BR, Brown JH (2006) Biogeography, 3rd
edn. Sinauer Associates, Sunderland, MA.
Losos JB (2008a) Phylogenetic niche conservatism, phylogenetic
signal and the relationship between phylogenetic relatedness
and ecological similarity among species. Ecology Letters, 11,
995–1003.
Losos JB (2008b) Rejoinder to Wiens (2008): phylogenetic niche
conservatism, its occurrence and importance. Ecology Letters,
11, 1005–1007.
Losos JB, Jackman TR, Larson A, de Queiroz K, Rodrıguez-
Schettino L (1998) Contingency and determinism in
replicated adaptive radiations of island lizards. Science, 279,
2115–2118.
Maddison WP, Maddison DR (2006) MESQUITE: A Modular
System for Evolutionary Analysis, Version 1.12. Available at:
http://mesquiteproject.org

4678 P. R . STEPHENS and J . J . WIENS
Martinez-Meyer E, Peterson AT, Hargroves WW (2004)
Ecological niches as stable distributional constraints on
mammal species, with implications for Pleistocene
extinctions and climate change projections for biodiversity.
Global Ecology and Biogeography, 13, 305–314.
Martins EP (2004) COMPARE, Version 4.6b. Computer Programs for
the Statistical Analysis of Comparative Data. Distributed by the
author via the WWW at http://www.indiana.edu/
~martinsl/compare/. Department of Biology, Indiana
University, Bloomington, IN.
Martins EP, Hansen TF (1997) Phylogenies and the
comparative method: a general approach to incorporating
phylogenetic information into analysis of interspecific data.
American Naturalist, 149, 646–667.
Melville J, Harmon LJ, Losos JB (2006) Intercontinental
community convergence of ecology and morphology in
desert lizards. Proceedings of the Royal Society of London, B:
Biological Sciences, 273, 557–563.
Morin PJ (1999) Community Ecology. Blackwell Science, Malden,
MA.
Pagel M (1999) Inferring the historical patterns of biological
evolution. Nature, 401, 877–884.
Peterson AT, Holt RD (2003) Niche differentiation in Mexican
birds: using point occurrences to detect ecological
innovation. Ecology Letters, 6, 774–782.
Peterson AT, Soberon J, Sanchez-Cordero V (1999) Conservatism
of ecological niches in evolutionary time. Science, 285, 1265–
1267.
Phillips SJ, Anderson RP, Schapire RE (2006) Maximum
entropy modeling of species geographic distributions.
Ecological Modeling, 190, 231–259.
Plummer MV (2003) Activity and thermal ecology of the box
turtle, Terrapene ornata, at its southwestern range limit in
Arizona. Chelonian Conservation and Biology, 4, 569–577.
Price T, Lovette IJ, Bermingham E, Gibbs HL, Richman AD
(2000) The imprint of history on communities of North
American and Asian warblers. American Naturalist, 156, 354–
367.
Prinzing A, Reiffers R, Braakhekke W et al. (2008) Less
lineages–more trait variation: phylogenetically clustered
plant communities are functionally more diverse. Ecology
Letters, 11, 809–819.
R Development Core Team (2008) R: A Language and
Environment for Statistical Computing. R Foundation for
Statistical Computing, Vienna, Austria. ISBN 3-900051-07-0,
Available at: http://www.r-project.org
Revell LJ, Harmon LJ, Collar DC (2008) Phylogenetic signal,
evolutionary process, and rate. Systematic Biology, 57, 591–
601.
Schluter D (2000) The Ecology of Adaptive Radiation. Oxford
University Press, Oxford, UK.
Smith SA, Stephens PR, Wiens JJ (2005) Phylogeny, historical
biogeography, and replicated patterns of species richness in
temperate treefrogs. Evolution, 59, 2433–2450.
Stephens PR, Wiens JJ (2003) Ecological diversification and
phylogeny of emydid turtles. Biological Journal of the Linnean
Society, 79, 577–610.
Stephens PR, Wiens JJ (2004) Convergence, divergence, and
homogenization in the ecological structure of emydid turtle
communities: the effects of phylogeny and dispersal.
American Naturalist, 164, 244–254.
Stephens PR, Wiens JJ (2008) Testing for evolutionary trade-
offs in a phylogenetic context: ecological diversification and
locomotor performance in emydid turtles. Journal of
Evolutionary Biology, 21, 77–928.
Stephens PR, Wiens JJ (2009) Evolution of sexual size
dimorphisms in emydid turtles: ecological dimorphism,
Rensch’s rule, and sympatric divergence. Evolution, 63, 910–
925.
Storey KB, Storey JM (1992) Natural freeze tolerance in
ectothermic vertebrates. Annual Review of Physiology, 54, 619–
637.
Tofts R, Silvertown J (2000) A phylogenetic approach
to community assembly from a local species pool.
Proceedings of the Royal Society of London B: Biological Sciences,
265, 363–369.
Uetz P (2009) The TIGR reptile database. http://www. reptile-
database.org. Accessed September 30 2009.
Ultsch GR (2006) The ecology of overwintering among turtles:
where turtles overwinter and its consequences. Biological
Reviews, 81, 339–367.
Vamosi SM, Heard SB, Vamosi JC, Webb CO (2009) Emerging
patterns in the comparative analysis of phylogenetic
community structure. Molecular Ecology, 18, 572–592.
Vitt LJ, Pianka ER, Cooper Jr WE, Schwenk K (2003) History
and the global ecology of squamate reptiles. American
Naturalist, 162, 44–60.
Warren DL, Glor RE, Turelli M (2008) Environmental niche
equivalency versus conservatism: quantitative approaches to
niche evolution. Evolution, 62, 2868–2883.
Webb CO, Ackerly DD, McPeek MA, Donoghue MJ (2002)
Phylogenies and community ecology. Annual Review of
Ecology and Systematics, 33, 475–505.
Webb CO, Cannon CH, Davies SJ (2008) Ecological
organization, biogeography, and the phylogenetic structure
of tropical forest tree communities. In: Tropical Forest
Community Ecology (eds Carson W, Schnitzer S), pp. 79–97.
Wiley-Blackwell, Sussex, UK.
Wiens JJ (2004) Speciation and ecology revisited: phylogenetic
niche conservatism and the origin of species. Evolution, 58,
193–197.
Wiens JJ (2008) Commentary on Losos (2008): niche
conservatism deja vu. Ecology Letters, 11, 1004–1005.
Wiens JJ, Donoghue MJ (2004) Historical biogeography,
ecology, and species richness. Trends in Ecology and Evolution,
19, 639–644.
Wiens JJ, Graham CM (2005) Niche conservatism: integrating
evolution, ecology, and conservation biology. Annual Review
Ecology, Evolution, and Systematics, 36, 519–539.
Wiens JJ, Brandley MC, Reeder TW (2006a) Why does a trait
evolve multiple times within a clade? Repeated evolution of
snake-like body form in squamate reptiles Evolution, 60, 123–
141.
Wiens JJ, Graham CH, Moen DS, Smith SA, Reeder TW (2006b)
Evolutionary and ecological causes of the latitudinal
diversity gradient in hylid frogs: treefrog trees unearth the
roots of high tropical diversity. American Naturalist, 168, 579–
596.
� 2009 Blackwell Publishing Ltd

NICHE C ONSERVATISM IN T URTLES 4 67 9
Winemiller KO (1991) Ecomorphological diversification in
lowland freshwater fish assemblages from five biotic regions.
Ecological Monographs, 61, 343–365.
P.R.S. uses phylogenetic methods to study the evolutionary
ecology of amphibians, reptiles, and mammals. He is
particularly interested in the effects of niche conservation on
modern patterns of biodiversity and community structure.
J.J.W. is interested in phylogenetic approaches to evolutionary
ecology, theoretical systematics, and the biology of amphibians
and reptiles.
� 2009 Blackwell Publishing Ltd
Supporting information
Additional supporting information may be found in the online
version of this article.
Appendix S1. Details of phylogeny estimation.
Appendix S2. AIC scores from model selection.
Please note: Wiley-Blackwell are not responsible for the content
or functionality of any supporting information supplied by the
authors. Any queries (other than missing material) should be
directed to the corresponding author for the article.