
Corporate Governance and Accounting Conservatism
282
CAPITAL UNIVERSITY OF SCIENCE AND TECHNOLOGY, ISLAMABAD Corporate Governance and Accounting Conservatism: Empirical Evidence from Emerging Markets of South Asia by Muhammad Bilal Saeed A thesis submitted in partial fulfillment for the degree of Doctor of Philosophy in the Faculty of Management & Social Sciences Department of Management Sciences 2020
-
Upload
khangminh22 -
Category
Documents
-
view
1 -
download
0
Transcript of Corporate Governance and Accounting Conservatism

CAPITAL UNIVERSITY OF SCIENCE AND
TECHNOLOGY, ISLAMABAD
Corporate Governance and
Accounting Conservatism:
Empirical Evidence from
Emerging Markets of South Asiaby
Muhammad Bilal SaeedA thesis submitted in partial fulfillment for the
degree of Doctor of Philosophy
in the
Faculty of Management & Social Sciences
Department of Management Sciences
2020

i
Corporate Governance and Accounting
Conservatism: Empirical Evidence from
Emerging Markets of South Asia
By
Muhammad Bilal Saeed
(PM 121004)
Dr. Ayoib B Che Ahmed, Professor
University Utara Malaysia, Malaysia
(Foreign Evaluator 1)
Dr. Devendra Kodwani, Professor
The Open University, UK
(Foreign Evaluator 1)
Dr. Muhammad Mazhar Iqbal
(Supervisor)
Dr. Syed Kashif Saeed
(Co-Supervisor)
Dr. Mueen Aizaz Zafar
(Head, Department of Management Sciences)
Dr. Arshad Hassan
(Dean, Faculty of Management & Social Sciences)
DEPARTMENT OF MANAGEMENT SCIENCES
CAPITAL UNIVERSITY OF SCIENCE AND TECHNOLOGY
ISLAMABAD
2020

ii
Copyright c© 2020 by Muhammad Bilal Saeed
All rights reserved. No part of this thesis may be reproduced, distributed, or
transmitted in any form or by any means, including photocopying, recording, or
other electronic or mechanical methods, by any information storage and retrieval
system without the prior written permission of the author.

iii
To all Friends and Family


vii
List of Publications
It is certified that following publication(s) have been made out of the research
work that has been carried out for this thesis:-
1. Saeed, M. B., & Saeed, S. K. (2018). Corporate Governance and Accounting
Conservatism: Moderating role of Audit Quality and Disclosure Quality.
Business & Economic Review, 10(2).
2. Saeed, M. B.,Iqbal, M. M., & Saeed, S. K. (2018). Corporate Governance
Mechanisms and Accounting Conservatism: Evidence from Pakistan. NICE
Research Journal of Social Sciences, 11(1),18-38.
3. Saeed, M. B., & Saeed, S. K. (2018). Characteristics of Shariah Supervisory
Board, Corporate Governance mechanisms and Efficiency of Islamic Banks:
Evidence from listed banks in Asia. Journal of Islamic Business and Man-
agement, 8(1), 116-138.
Muhammad Bilal Saeed
(PM121004)

viii
Acknowledgements
I would like to thank all those who helped me out during the thesis.

ix
Abstract
This study investigates the relationship between corporate governance and ac-
counting conservatism. Additionally, it investigates the moderating role of dis-
closure quality on the association between corporate governance and accounting
conservatism. It employs panel data of three hundred firms from Bangladesh, In-
dia and Pakistan for the period from 2009 to 2015. Hundred firms are selected
from each country on the basis of market capitalization as well as availability of
data. Accounting Conservatism is measured via six measures. Corporate Gov-
ernance is examined at two levels. First corporate governance mechanisms are
examined. Afterwards, a composite score of firm’s governance is developed by
employing principal component analysis and its impact is evaluated. The con-
sidered corporate governance mechanisms include audit committee independence,
board activity, board independence, board size, CEO duality, CEO turnover, gen-
der diversity on board, institutional shareholding, managerial shareholding and
type of the auditor. The empirical results show that, among the considered gover-
nance measures only institutional shareholding and CEO duality have an impact
on accounting conservatism in case of Bangladesh. In case of India, board activity
and audit committee independence are found to be associated with accounting
conservatism. In case of Pakistan, board activity, gender diversity on board and
institutional ownership are found to be associated with accounting conservatism.
A positive relationship is also found between composite score of firm governance
and accounting conservatism along side the moderating role of disclosure qual-
ity in case of three considered data sets. Some additional analyses are also the
part of this study that report mixed results. This findings of this study offer an
empirical evidence of existence of agency as well as positive accounting theory in
three emerging economies of South Asia. It has implications for policy makers,
regulators, analysts, researchers and other users of financial statements especially
in the context of emerging economies of South Asia that are the subject matter of
this study.
Key words: Accounting Conservatism, Corporate Governance, Disclo-
sure Quality.

Contents
Author’s Declaration v
Plagiarism Undertaking vi
List of Publications vii
Acknowledgements viii
Abstract ix
List of Figures xv
List of Tables xvi
Abbreviations xx
1 Introduction 1
1.1 Background of the Study . . . . . . . . . . . . . . . . . . . . . . . . 1
1.2 Research Gap . . . . . . . . . . . . . . . . . . . . . . . . . . . . . . 6
1.2.1 Absence of Theoretical and Empirical Research in SouthAsian Economies . . . . . . . . . . . . . . . . . . . . . . . . 6
1.2.2 Absence of Examination of Various Attributes of CG andDevelopment of Composite Measure for Firm’s Governance . 7
1.2.3 Absence of Direct Examination of Effect of CG on AC andEmployment of Few Measures of Firm’s Conservatism . . . . 8
1.2.4 Absence of Examination of Moderating Role of DisclosureQuality on the Association between CG and AC . . . . . . . 8
1.2.5 Summary . . . . . . . . . . . . . . . . . . . . . . . . . . . . 9
1.3 Theoretical Justification . . . . . . . . . . . . . . . . . . . . . . . . 9
1.3.1 Agency Theory . . . . . . . . . . . . . . . . . . . . . . . . . 9
1.3.2 Stewardship Theory . . . . . . . . . . . . . . . . . . . . . . 11
1.3.3 Stakeholders Theory . . . . . . . . . . . . . . . . . . . . . . 11
1.3.4 Resource Dependency Theory . . . . . . . . . . . . . . . . . 12
1.3.5 Positive Accounting Theory . . . . . . . . . . . . . . . . . . 12
1.3.6 Accounting Conservatism and Corporate Governance . . . . 13
x

xi
1.3.7 Accounting Conservatism, Corporate Governance and Dis-closure Quality . . . . . . . . . . . . . . . . . . . . . . . . . 17
1.4 Problem Statement . . . . . . . . . . . . . . . . . . . . . . . . . . . 18
1.5 Accounting Conservatism (AC) . . . . . . . . . . . . . . . . . . . . 19
1.6 Corporate Governance (CG) . . . . . . . . . . . . . . . . . . . . . . 21
1.6.1 CG in Bangladesh . . . . . . . . . . . . . . . . . . . . . . . 22
1.6.2 CG in India . . . . . . . . . . . . . . . . . . . . . . . . . . . 24
1.6.3 CG in Pakistan . . . . . . . . . . . . . . . . . . . . . . . . . 26
1.7 Disclosure Quality . . . . . . . . . . . . . . . . . . . . . . . . . . . 26
1.8 Similarities and Differences among Bangladesh, India and Pakistan 27
1.9 Research Questions . . . . . . . . . . . . . . . . . . . . . . . . . . . 29
1.10 Research Objectives for this Study . . . . . . . . . . . . . . . . . . 30
1.11 Contribution of this Study . . . . . . . . . . . . . . . . . . . . . . . 31
1.11.1 Accounting Conservatism and Corporate Governance in De-veloping Economies of South Asia . . . . . . . . . . . . . . . 31
1.11.2 Corporate Governance Attributes and Accounting Conser-vatism . . . . . . . . . . . . . . . . . . . . . . . . . . . . . . 33
1.11.3 Composite Score of Firm Governance and Accounting Con-servatism . . . . . . . . . . . . . . . . . . . . . . . . . . . . 34
1.11.4 Corporate Governance and Composite Measure of Condi-tional Conservatism . . . . . . . . . . . . . . . . . . . . . . . 34
1.11.5 Corporate Governance, Accounting Conservatism and Dis-closure Quality . . . . . . . . . . . . . . . . . . . . . . . . . 35
1.12 Significance of the Study . . . . . . . . . . . . . . . . . . . . . . . . 35
1.12.1 Addition to Literature with Respect to Estimation Proce-dures and Context . . . . . . . . . . . . . . . . . . . . . . . 35
1.12.2 Extension of Insight to Regulatory Bodies . . . . . . . . . . 36
1.12.3 Improvement in Analytical Skills of Analysts . . . . . . . . . 36
1.12.4 Aiding Investors in Making Informed Decisions . . . . . . . . 37
1.12.5 Supporting Creditors in Evaluating Firms . . . . . . . . . . 38
1.12.6 Insight to Managers and Executives . . . . . . . . . . . . . . 38
1.12.7 Summary . . . . . . . . . . . . . . . . . . . . . . . . . . . . 38
1.13 Scope of the Study . . . . . . . . . . . . . . . . . . . . . . . . . . . 38
1.14 Organization of the Study . . . . . . . . . . . . . . . . . . . . . . . 39
2 Literature Review and Hypothesis Development 40
2.1 Literature Survey . . . . . . . . . . . . . . . . . . . . . . . . . . . . 40
2.2 Hypothesis Development . . . . . . . . . . . . . . . . . . . . . . . . 46
2.2.1 Board Size and AC . . . . . . . . . . . . . . . . . . . . . . . 47
2.2.2 Board Independence and AC . . . . . . . . . . . . . . . . . . 49
2.2.3 Board Activity and AC . . . . . . . . . . . . . . . . . . . . . 50
2.2.4 Gender diversity on Board and AC . . . . . . . . . . . . . . 50
2.2.5 CEO Turnover and AC . . . . . . . . . . . . . . . . . . . . . 51
2.2.6 CEO Duality and AC . . . . . . . . . . . . . . . . . . . . . . 51
2.2.7 Institutional Ownership and AC . . . . . . . . . . . . . . . . 52

xii
2.2.8 Managerial Ownership and AC . . . . . . . . . . . . . . . . 52
2.2.9 Audit Committee Independence and AC . . . . . . . . . . . 53
2.2.10 Big Four Auditor and AC . . . . . . . . . . . . . . . . . . . 54
2.2.11 Composite Score of Firm Governance and AC . . . . . . . . 55
2.2.12 CG, AC and Disclosure Quality . . . . . . . . . . . . . . . . 57
2.2.13 Control Variables and AC . . . . . . . . . . . . . . . . . . . 58
3 Research Methodology 60
3.1 Data Description . . . . . . . . . . . . . . . . . . . . . . . . . . . . 60
3.1.1 Population . . . . . . . . . . . . . . . . . . . . . . . . . . . . 60
3.1.2 Sample and Sampling Technique . . . . . . . . . . . . . . . . 61
3.2 Model Specification . . . . . . . . . . . . . . . . . . . . . . . . . . . 61
3.3 Variable Specification . . . . . . . . . . . . . . . . . . . . . . . . . . 63
3.3.1 Sensitivity of Earnings to Bad News Relative to Sensitivityof Earnings to Good News (ACSOE) . . . . . . . . . . . . . 63
3.3.2 Coefficient of the Term D4EPSt−1*4EPSt−1 (ACCIE) . . 65
3.3.3 Averaged Accruals Multiplied by (-1) (ACACC) . . . . . . . 66
3.3.4 Coefficient of the Interaction Term DCFOi,t*CFOi,t (ACcic) 66
3.3.5 Skewness Based Measure of AC (ACSKEW) . . . . . . . . . 67
3.3.6 Composite Measure of AC of a Firm (ACCOMP) . . . . . . 68
3.3.7 Corporate Governance Mechanisms . . . . . . . . . . . . . . 68
3.3.8 Composite Measure of Firm Governance . . . . . . . . . . . 70
3.3.9 Disclosure Quality . . . . . . . . . . . . . . . . . . . . . . . 70
3.3.10 Control Variables . . . . . . . . . . . . . . . . . . . . . . . . 71
3.4 Method . . . . . . . . . . . . . . . . . . . . . . . . . . . . . . . . . 71
3.4.1 Panel Data Analysis . . . . . . . . . . . . . . . . . . . . . . 71
3.4.2 Diagnostic Tests . . . . . . . . . . . . . . . . . . . . . . . . 74
4 Results And Discussion 75
4.1 Results of Bangladesh . . . . . . . . . . . . . . . . . . . . . . . . . 75
4.1.1 Descriptive Statistics . . . . . . . . . . . . . . . . . . . . . . 75
4.1.2 Correlation Analysis . . . . . . . . . . . . . . . . . . . . . . 78
4.1.3 Diagnostic Tests . . . . . . . . . . . . . . . . . . . . . . . . 81
4.1.4 AC and CG . . . . . . . . . . . . . . . . . . . . . . . . . . . 81
4.1.5 AC, CSFG and DQ (as Moderator) . . . . . . . . . . . . . . 84
4.2 Additional Analyses for Bangladesh . . . . . . . . . . . . . . . . . . 85
4.3 Results of India . . . . . . . . . . . . . . . . . . . . . . . . . . . . . 86
4.3.1 Descriptive Statistics . . . . . . . . . . . . . . . . . . . . . . 86
4.3.2 Correlation Analysis . . . . . . . . . . . . . . . . . . . . . . 89
4.3.3 Diagnostic Tests . . . . . . . . . . . . . . . . . . . . . . . . 89
4.3.4 AC and CG . . . . . . . . . . . . . . . . . . . . . . . . . . . 92
4.3.5 AC, CSFG and DQ (as Moderator) . . . . . . . . . . . . . . 94
4.4 Additional Analyses for India . . . . . . . . . . . . . . . . . . . . . 95
4.5 Results of Pakistan . . . . . . . . . . . . . . . . . . . . . . . . . . . 96

xiii
4.5.1 Descriptive Statistics . . . . . . . . . . . . . . . . . . . . . . 96
4.5.2 Correlation Analysis . . . . . . . . . . . . . . . . . . . . . . 99
4.5.3 Diagnostic Tests . . . . . . . . . . . . . . . . . . . . . . . . 99
4.5.4 AC and CG . . . . . . . . . . . . . . . . . . . . . . . . . . . 102
4.5.5 AC, CSFG and DQ (as Moderator) . . . . . . . . . . . . . . 104
4.6 Additional Analyses for Pakistan . . . . . . . . . . . . . . . . . . . 105
4.7 Endogenity Among Variables . . . . . . . . . . . . . . . . . . . . . 106
4.8 Comparative Results for Three Countries Using Composite Measure 107
4.9 Discussion of Results of Bangladesh . . . . . . . . . . . . . . . . . . 111
4.9.1 Board Size and AC . . . . . . . . . . . . . . . . . . . . . . . 111
4.9.2 Board Independence and AC . . . . . . . . . . . . . . . . . . 111
4.9.3 Board Activity and AC . . . . . . . . . . . . . . . . . . . . . 112
4.9.4 Gender Diversity on Board and AC . . . . . . . . . . . . . . 112
4.9.5 CEO turnover and AC . . . . . . . . . . . . . . . . . . . . . 113
4.9.6 CEO Duality and AC . . . . . . . . . . . . . . . . . . . . . . 113
4.9.7 Institutional Shareholding and AC . . . . . . . . . . . . . . 114
4.9.8 Managerial Shareholding and AC . . . . . . . . . . . . . . . 114
4.9.9 Audit Committee Independence and AC . . . . . . . . . . . 115
4.9.10 Big Four Auditor and AC . . . . . . . . . . . . . . . . . . . 115
4.9.11 Composite Score of Firm’s Governance and AC . . . . . . . 116
4.9.12 CG, AC and Disclosure Quality . . . . . . . . . . . . . . . . 116
4.9.13 Firm Size and AC . . . . . . . . . . . . . . . . . . . . . . . . 116
4.9.14 Sales Growth and AC . . . . . . . . . . . . . . . . . . . . . . 117
4.9.15 Leverage and AC . . . . . . . . . . . . . . . . . . . . . . . . 117
4.9.16 Profitability and AC . . . . . . . . . . . . . . . . . . . . . . 118
4.9.17 Summary . . . . . . . . . . . . . . . . . . . . . . . . . . . . 118
4.10 Discussion of Results of India . . . . . . . . . . . . . . . . . . . . . 120
4.10.1 Board Size and AC . . . . . . . . . . . . . . . . . . . . . . . 120
4.10.2 Board Independence and AC . . . . . . . . . . . . . . . . . . 122
4.10.3 Board Activity and AC . . . . . . . . . . . . . . . . . . . . . 122
4.10.4 Gender Diversity on Board and AC . . . . . . . . . . . . . . 123
4.10.5 CEO Turnover and AC . . . . . . . . . . . . . . . . . . . . . 123
4.10.6 CEO Duality and AC . . . . . . . . . . . . . . . . . . . . . . 124
4.10.7 Institutional ownership and AC . . . . . . . . . . . . . . . . 124
4.10.8 Managerial ownership and AC . . . . . . . . . . . . . . . . . 125
4.10.9 Audit Committee Independence and AC . . . . . . . . . . . 125
4.10.10 Big Four Auditor and AC . . . . . . . . . . . . . . . . . . . 125
4.10.11 Composite Score of Firm Governance and AC . . . . . . . . 126
4.10.12 CG, AC and Disclosure Quality . . . . . . . . . . . . . . . . 126
4.10.13 Firm Size and AC . . . . . . . . . . . . . . . . . . . . . . . . 127
4.10.14 Sales Growth and AC . . . . . . . . . . . . . . . . . . . . . . 127
4.10.15 Leverage and AC . . . . . . . . . . . . . . . . . . . . . . . . 128
4.10.16 Profitability and AC . . . . . . . . . . . . . . . . . . . . . . 128
4.10.17 Summary . . . . . . . . . . . . . . . . . . . . . . . . . . . . 129

xiv
4.11 Discussion of Results of Pakistan . . . . . . . . . . . . . . . . . . . 130
4.11.1 Board Size and AC . . . . . . . . . . . . . . . . . . . . . . . 132
4.11.2 Board Independence and AC . . . . . . . . . . . . . . . . . . 132
4.11.3 Board Activity and AC . . . . . . . . . . . . . . . . . . . . . 133
4.11.4 Gender Diversity on Board and AC . . . . . . . . . . . . . . 133
4.11.5 CEO Turnover and AC . . . . . . . . . . . . . . . . . . . . . 134
4.11.6 CEO Duality and AC . . . . . . . . . . . . . . . . . . . . . . 134
4.11.7 Institutional ownership and AC . . . . . . . . . . . . . . . . 135
4.11.8 Managerial ownership and AC . . . . . . . . . . . . . . . . . 135
4.11.9 Audit Committee Independence and AC . . . . . . . . . . . 135
4.11.10 Big Four Auditor and AC . . . . . . . . . . . . . . . . . . . 136
4.11.11 Composite Score of Firm Governance and AC . . . . . . . . 136
4.11.12 CG, AC and Disclosure Quality . . . . . . . . . . . . . . . . 137
4.11.13 Firm Size and AC . . . . . . . . . . . . . . . . . . . . . . . . 137
4.11.14 Sales Growth and AC . . . . . . . . . . . . . . . . . . . . . . 137
4.11.15 Leverage and AC . . . . . . . . . . . . . . . . . . . . . . . . 138
4.11.16 Profitability and AC . . . . . . . . . . . . . . . . . . . . . . 138
4.11.17 Summary . . . . . . . . . . . . . . . . . . . . . . . . . . . . 139
5 Conclusion and Recommendation 141
5.1 Conclusion . . . . . . . . . . . . . . . . . . . . . . . . . . . . . . . . 141
5.2 Implications of the Study . . . . . . . . . . . . . . . . . . . . . . . . 143
5.2.1 Implications for Theory . . . . . . . . . . . . . . . . . . . . 143
5.2.2 Implications for Policy Makers . . . . . . . . . . . . . . . . . 145
5.2.3 Implications for Regulators . . . . . . . . . . . . . . . . . . . 146
5.2.4 Implications for Researchers . . . . . . . . . . . . . . . . . . 147
5.2.5 Implications for Financial Analysts and Investors . . . . . . 148
5.2.6 Implications for Creditors . . . . . . . . . . . . . . . . . . . 148
5.2.7 Implications for Auditors . . . . . . . . . . . . . . . . . . . . 149
5.3 Limitations of this Study . . . . . . . . . . . . . . . . . . . . . . . . 149
5.4 Future Research Direction . . . . . . . . . . . . . . . . . . . . . . . 150
Bibliography 151
Appendix 165

List of Figures
2.1 Conceptual model of the study . . . . . . . . . . . . . . . . . . . . . 47
2.2 Conceptual model on Moderaitng effect of Disclosure Quality . . . . 48
xv

List of Tables
3.1 Weights of AC Measures . . . . . . . . . . . . . . . . . . . . . . . . 69
3.2 Weights of CG Mechanisms . . . . . . . . . . . . . . . . . . . . . . 71
4.1 Descriptive Statistics . . . . . . . . . . . . . . . . . . . . . . . . . . 76
4.2 Correlation Analysis . . . . . . . . . . . . . . . . . . . . . . . . . . 79
4.3 Results of AC and CG mechanisms . . . . . . . . . . . . . . . . . . 80
4.4 Results of ACACC, CSFG and DQ . . . . . . . . . . . . . . . . . . 83
4.5 Descriptive Statistics . . . . . . . . . . . . . . . . . . . . . . . . . . 87
4.6 Correlation Analysis . . . . . . . . . . . . . . . . . . . . . . . . . . 90
4.7 Results of AC and CG mechanisms . . . . . . . . . . . . . . . . . . 91
4.8 Results of ACACC, CSFG and DQ . . . . . . . . . . . . . . . . . . 93
4.9 Descriptive Statistics . . . . . . . . . . . . . . . . . . . . . . . . . . 97
4.10 Correlation Analysis . . . . . . . . . . . . . . . . . . . . . . . . . . 100
4.11 Results of AC and CG mechanisms . . . . . . . . . . . . . . . . . . 101
4.12 Results of ACACC, CSFG and DQ . . . . . . . . . . . . . . . . . . 103
4.13 Hausman Test . . . . . . . . . . . . . . . . . . . . . . . . . . . . . . 107
4.14 Results of ACCOMP and CG mechanisms . . . . . . . . . . . . . . 108
4.15 Results of ACCOMP, CG and DQ . . . . . . . . . . . . . . . . . . . 109
4.16 Summary of Hypothesis Testing . . . . . . . . . . . . . . . . . . . . 110
4.17 Summary of Hypothesis Testing . . . . . . . . . . . . . . . . . . . . 121
4.18 Summary of Hypothesis Testing . . . . . . . . . . . . . . . . . . . . 131
5.1 Classification of Bangladeshi Firms . . . . . . . . . . . . . . . . . . 165
5.2 Names of Bangladeshi Firms . . . . . . . . . . . . . . . . . . . . . . 166
5.3 Classification of Indian Firms . . . . . . . . . . . . . . . . . . . . . 170
5.4 Names of Indian Firms . . . . . . . . . . . . . . . . . . . . . . . . . 171
5.5 Classification of Pakistani Firms . . . . . . . . . . . . . . . . . . . . 175
5.6 Names of Pakistani Firms . . . . . . . . . . . . . . . . . . . . . . . 176
5.7 Disclosure Quality Index Measurement . . . . . . . . . . . . . . . . 180
5.8 Results of ACACC and Good, Moderate and Bad CG . . . . . . . . 184
5.9 Results of ACCIC and Good, Moderate and Bad CG . . . . . . . . 185
5.10 Results of ACCIE and Good, Moderate and Bad CG . . . . . . . . 186
5.11 Results of ACSKEW and Good, Moderate and Bad CG . . . . . . . 186
5.12 Results of ACSOE and Good, Moderate and Bad CG . . . . . . . . 187
5.13 Results of ACCOMP and Good, Moderate and Bad CG . . . . . . . 188
5.14 Results of ACACCC and CG Mechanisms . . . . . . . . . . . . . . 189
xvi

xvii
5.15 Results of ACACCC and Composite Score for Firms Governance . . 190
5.16 Results of ACCICC and CG Mechanisms . . . . . . . . . . . . . . . 191
5.17 Results of ACCICC and Composite Score for Firms Governance . . 192
5.18 Results of ACCIEC and CG Mechanisms . . . . . . . . . . . . . . . 193
5.19 Results of ACCIEC and Composite Score for Firms Governance . . 194
5.20 Results of ACSKEWC and CG Mechanisms . . . . . . . . . . . . . 195
5.21 Results of ACSKEWC and Composite Score for Firms Governance . 196
5.22 Results of ACSOEC and CG Mechanisms . . . . . . . . . . . . . . . 197
5.23 Results of ACSOEC and Composite Score for Firms Governance . . 198
5.24 Results of ACCOMPC and CG Mechanisms . . . . . . . . . . . . . 199
5.25 Results of ACCOMPC and Composite Score for Firms Governance 199
5.26 Results of ACACCC, CSFG and DQ . . . . . . . . . . . . . . . . . 200
5.27 Results of ACACCC, CSFG and CSFGXDQ . . . . . . . . . . . . . 200
5.28 Results of ACCICC, CSFG and DQ . . . . . . . . . . . . . . . . . 200
5.29 Results of ACCICC, CSFG and CSFGXDQ . . . . . . . . . . . . . 201
5.30 Results of ACCIEC, CSFG and DQ . . . . . . . . . . . . . . . . . 201
5.31 Results of ACSKEWC, CSFG and DQ . . . . . . . . . . . . . . . . 201
5.32 Results of ACSKEWC, CSFG and CSFGXDQ . . . . . . . . . . . . 202
5.33 Results of ACSOEC, CSFG and DQ . . . . . . . . . . . . . . . . . 202
5.34 Results of ACSOEC, CSFG and CSFGXDQ . . . . . . . . . . . . . 202
5.35 Results of ACCOMPC, CSFG and DQ . . . . . . . . . . . . . . . . 203
5.36 Results of ACCOMPC, CSFG and CSFGXDQ . . . . . . . . . . . . 203
5.37 Summary of Additional Testing (Good, Moderate and Bad CG andAC) . . . . . . . . . . . . . . . . . . . . . . . . . . . . . . . . . . . 204
5.38 Summary of results of probit regression . . . . . . . . . . . . . . . . 205
5.39 Results of ACACC and Good, Moderate and Bad CG . . . . . . . . 206
5.40 Results of ACCIC and Good, Moderate and Bad CG . . . . . . . . 207
5.41 Results of ACCIE and Good, Moderate and Bad CG . . . . . . . . 208
5.42 Results of ACSKEW and Good, Moderate and Bad CG . . . . . . . 208
5.43 Results of ACSOE and Good, Moderate and Bad CG . . . . . . . . 209
5.44 Results of ACCOMP and Good, Moderate and Bad CG . . . . . . . 209
5.45 Results of ACACCC and CG Mechanisms . . . . . . . . . . . . . . 210
5.46 Results of ACACCC and Composite Score for Firms Governance . . 211
5.47 Results of ACCICC and CG Mechanisms . . . . . . . . . . . . . . . 212
5.48 Results of ACCICC and Composite Score for Firms Governance . . 212
5.49 Results of ACCIEC and CG Mechanisms . . . . . . . . . . . . . . . 213
5.50 Results of ACCIEC and Composite Score for Firms Governance . . 213
5.51 Results of ACSKEWC and CG Mechanisms . . . . . . . . . . . . . 214
5.52 Results of ACSKEWC and Composite Score for Firms Governance . 215
5.53 Results of ACSOEC and CG Mechanisms . . . . . . . . . . . . . . . 216
5.54 Results of ACSOE and Composite Score for Firms Governance . . . 216
5.55 Results of ACCOMPC and CG Mechanisms . . . . . . . . . . . . . 217
5.56 Results of ACCOMPC and Composite Score for Firms Governance 217
5.57 Results of ACACCC, CSFG and DQ . . . . . . . . . . . . . . . . . 218

xviii
5.58 Results of ACCICC, CSFG and DQ . . . . . . . . . . . . . . . . . 218
5.59 Results of ACCIEC, CSFG and DQ . . . . . . . . . . . . . . . . . 219
5.60 Results of ACCIEC, CSFG and CSFGXDQ . . . . . . . . . . . . . 219
5.61 Results of ACSKEWC, CSFG and DQ . . . . . . . . . . . . . . . . 220
5.62 Results of ACSOEC, CSFG and DQ . . . . . . . . . . . . . . . . . 221
5.63 Results of ACSOEC, CSFG and CSFGXDQ . . . . . . . . . . . . . 221
5.64 Results of ACCOMPC, CSFG and DQ . . . . . . . . . . . . . . . . 222
5.65 Results of ACCOMPC, CSFG and CSFGXDQ . . . . . . . . . . . . 222
5.66 Summary of Additional Testing (Good, Moderate and Bad CG andAC) . . . . . . . . . . . . . . . . . . . . . . . . . . . . . . . . . . . 224
5.67 Summary of results of probit regression . . . . . . . . . . . . . . . . 225
5.68 Results of ACACC and Good, Moderate and Bad CG . . . . . . . . 226
5.69 Results of ACCIC and Good, Moderate and Bad CG . . . . . . . . 227
5.70 Results of ACCIE and Good, Moderate and Bad CG . . . . . . . . 227
5.71 Results of ACSKEW and Good, Moderate and Bad CG . . . . . . . 228
5.72 Results of ACSOE and Good, Moderate and Bad CG . . . . . . . . 229
5.73 Results of ACCOMP and Good, Moderate and Bad CG . . . . . . . 229
5.74 Results of ACACCC and CG Mechanisms . . . . . . . . . . . . . . 230
5.75 Results of ACACCC and Composite Score for Firms Governance . . 230
5.76 Results of ACCICC and CG Mechanisms . . . . . . . . . . . . . . . 232
5.77 Results of ACCICC and Composite Score for Firms Governance . . 232
5.78 Results of ACCIEC and CG Mechanisms . . . . . . . . . . . . . . . 233
5.79 Results of ACCIEC and Composite Score for Firms Governance . . 234
5.80 Results of ACSKEWC and CG Mechanisms . . . . . . . . . . . . . 235
5.81 Results of ACSKEWC and Composite Score for Firms Governance . 235
5.82 Results of ACSOEC and CG Mechanisms . . . . . . . . . . . . . . . 236
5.83 Results of ACSOE and Composite Score for Firms Governance . . . 236
5.84 Results of ACCOMPC and CG Mechanisms . . . . . . . . . . . . . 237
5.85 Results of ACCOMPC and Composite Score for Firms Governance 238
5.86 Results of ACACCC, CSFG and DQ . . . . . . . . . . . . . . . . . 239
5.87 Results of ACACCC, CSFG and CSFGXDQ . . . . . . . . . . . . . 239
5.88 Results of ACCICC, CSFG and DQ . . . . . . . . . . . . . . . . . 240
5.89 Results of ACCIEC, CSFG and DQ . . . . . . . . . . . . . . . . . . 240
5.90 Results of ACCIEC, CSFG and CSFGXDQ . . . . . . . . . . . . . 241
5.91 Results of ACSKEWC, CSFG and DQ . . . . . . . . . . . . . . . . 242
5.92 Results of ACSKEWC, CSFG and CSFGXDQ . . . . . . . . . . . . 242
5.93 Results of ACSOEC, CSFG and DQ . . . . . . . . . . . . . . . . . 243
5.94 Results ofACCOMPC, CSFG and DQ . . . . . . . . . . . . . . . . 244
5.95 Results of ACCOMPC, CSFG and CSFGXDQ . . . . . . . . . . . . 244
5.96 Summary of Additional Testing (Good, Moderate and Bad CG andAC) . . . . . . . . . . . . . . . . . . . . . . . . . . . . . . . . . . . 246
5.97 Summary of results of probit regression . . . . . . . . . . . . . . . . 247
5.98 GMM Results of ACCOMP and CG mechanisms . . . . . . . . . . 249
5.99 GMM Results of ACCOMP, CG and DQ . . . . . . . . . . . . . . . 250

xix
5.100Results of ACCOMP and CG mechanisms . . . . . . . . . . . . . . 251
5.101Results of ACCOMP and Composite Score for Firms Governance . 252
5.102Results of ACCOMP, CSFG and DQ . . . . . . . . . . . . . . . . . 253
5.103Results of ACCOMP, CSFG and CSFGXDQ . . . . . . . . . . . . . 253
5.104Results of Principal Component Analysis for the development ofAC for Bangladesh . . . . . . . . . . . . . . . . . . . . . . . . . . . 255
5.105Results of Principal Component Analysis for the development ofCSFG for Bangladesh . . . . . . . . . . . . . . . . . . . . . . . . . . 256
5.106Results of Principal Component Analysis for the development ofAC for India . . . . . . . . . . . . . . . . . . . . . . . . . . . . . . . 257
5.107Results of Principal Component Analysis for the development ofCSFG for India . . . . . . . . . . . . . . . . . . . . . . . . . . . . . 258
5.108Results of Principal Component Analysis for the development ofAC for Pakistan . . . . . . . . . . . . . . . . . . . . . . . . . . . . . 259
5.109Results of Principal Component Analysis for the development ofCSFG for Pakistan . . . . . . . . . . . . . . . . . . . . . . . . . . . 260

Abbreviations
AC Accounting Conservatism
ACACC Accruals based first measure of AC
ACI Audit Committee Independence
ACCIC Accruals based second measure of AC
ACCIE Earnings based measure of AC
ACCOMP Composite measure of AC of a firm
ACSKEW Skewness based measure of AC
ACSOE Sensitivity of Earnings to Bad News relative to Sensitivity of
Earnings to Good News
BA Board Activity
BBVA Banco Bilbao Vizcaya Argentaria
BEI Bangladesh Enterprize Institute
BG Bad Governance
BI Board Independence
BS Board Size
BSEC Bangladesh Securities and Exchange Commission
CG Corporate Governance
CEOD CEO Duality
CEOT CEO Turnover
CSFG Composite Score for Firm’s Governance
DQ Disclosure Quality
EPS Earnings Per Share
FS Firm Size
GDB Gender Diversity on Board
xx

xxi
GG Good Governance
GROS Growth in Sales
INSO Institutional Shareholding
LEV Leverage
MANO Managerial Shareholding
MG Moderate Governance
PROF Profitability for firm
P Share price
SBP State Bank of Pakistan
SEBI Securities and Exchange Board of India
SECP Securities and Exchange Commission of Pakistan
TAUD Type of the Auditor

Chapter 1
Introduction
This chapter introduces the topic. It begins with background of the study. Next,
it discusses the research gap that paved the way for this investigation. Afterwards
this chapter overviews the theoretical explanation of the relationship between Ac-
counting Conservatism (AC) and Corporate Governance (CG). At the end, this
chapter presents the objectives of this study followed by significance and scope.
1.1 Background of the Study
Managers and shareholders are two significant piers of any firm. The success of
any firm is inherent in the strength of the bond between these piers. Greater access
to firm related information offers managers an edge over shareholders. Sharehold-
ers have to rely on financial statements that are prepared by managers to make
strategic decisions (Nasr and Ntim, 2017). These statements are prepared in con-
gruence with financial reporting standards. The inability of professional standards
to cover all aspects of financial reporting offers mangers the freedom to use their
judgment in providing accounting estimates (Chung et al., 2002). The evolution
of corporate world has paved the way for emergence of new forms of corporate
entities and altered the conventional structure of transnational firms. This has
resulted in increased interest of managerial discretion in financial reporting, thus
yielding neutral, aggressive or conservative accounting estimates. Existing litera-
ture, both empirically and theoretically supports the employment of conservative
1

Introduction 2
accounting estimates by mangers to harness the benefits of reduced agency prob-
lems. (For example, (Nasr and Ntim, 2017); (Mohammed et al., 2017); (Caskey
and Laux, 2017); (Huang and Wang, 2017); (Boussaid et al., 2015); (Elshandidy
and Hassanein, 2015); (Ahmed and Henry, 2012); (Ahmed and Duellman, 2007)
etc.)
The firms are considered to be the producers of goods and services. These firms
have specific corporate structures that help in maneuvering these corporate enti-
ties. One significant feature of these structures is the separation of ownership and
control of assets of the firm. It is a documented fact that the ownership of the
firm is spread out among many owners thus limiting them from contributing in
major decisions of the firm. The managers are responsible to manage the firms
in the light of guidance set forth by the owners. It is necessary that both own-
ers and managers remain on the same page otherwise the difference of interests
will lead to conflicts thus jeopardizing the very existence of the corporate entity.
This conflict not only weakens corporate structure of the firm but also affects the
employees, suppliers, distributors as well as all other stake holders. In order to
prevent the firms from this fatal fate, different mechanisms have been installed.
One such mechanism is CG. This mechanism is a means to reduce the conflict
of interest or in much simple words a connection that is built to bridge the gap
between owners and managers. CG is thus seen as the set of principles, rules, reg-
ulations, policies, procedures or guidelines employed to help managers understand
their responsibilities thus reducing the conflict and bridging the gap between man-
agement and stakeholders (Monks and Minow, 2001). There are no two opinions
over the matter that if a firm is unable to install effective CG, the consequences
are severe (Lavelle, 2002). One of the many consequences is the vulnerability
of firms to operational risks. This exposure can jeopardize the very existence of
firms. The investors these days are much informed. They employ various means
to evaluate the risks associated with their investment decisions. Common means
employed include; understanding the corporate structures, quality of governance,
performance etc. All these measures are employed to evaluate the true position of
the firm thus mitigating the risk inherent in their investment decisions. Besides

Introduction 3
the deployment of these mechanisms the world has to witness some huge corporate
collapse. These include the fall of WorldCom and Enron in United States, collapse
of Harris Scarface, HIH and One Tel in Australia, crumbling of Polly Peck in Eu-
rope and some other corporate failures in Asia. When investigated, it is found
that most of these corporate collapses occur as a consequence of failure of CG
mechanisms and earnings manipulation. Lavelle (2002) argues that the failure of
Enron is a consequence of poor CG structures. Later on Horwath (2003) while
investigating the reasons of corporate collapses in Australian listed firms also set
forth a similar argument.
A huge lump of evidence can be found that stress the significance of CG in ef-
ficient working of firms (For example, (Shehzad and Haan, 2015); (Adams and
Mehran, 2012); (Yeh et al., 201). If the firms are efficient so is the capital markets
thus arising opportunity for investors. In case of a corporate crumble, investors
lose huge amount of money that weakens their confidence and trust. This feeble
confidence and trust jeopardizes the capital market. In order to mitigate the fac-
tors that can erode the confidence as well as trust of the investors, the regulatory
bodies set forth new regulations continuously. These measures intend to address
the dissolution of investors confidence and prevent future fall downs (Adams and
Mehran, 2012). It is interesting to note that most of these mechanisms have failed
to address their desired goals. One reason can be the inability of these measures
to address governance problems faced by the firms. Another reason can be the
difference in capital markets structure. This is the need of the hour to better
understand governance perspective of corporate entities and set forth as well as
implement mechanisms that can improve CG.
Most of the empirical studies try to address the connection between CG and
performance of the firm only (For example, (Bhatt and Bhatt, 2017); (Lozano
et al., 2016); (Pandya, 2011)). All of these researchers have empirically examined
the impact of CG. However it is very interesting to note that these studies report
mixed results and are inconclusive in most cases. One of the possible reasons
for this failure by researchers can be the involvement of conservative accounting
practices in firms having effective CG mechanisms.

Introduction 4
AC is defined as the recognition of revenues only when they are assured of being
received whereas the recognition of expenses even when there is an uncertainty of
outcome involved (Bliss, 1924). Basu (1997) defines conservatism as the propen-
sity to demand excessive investigation for identification of good news rather than
bad news while reporting earnings. Givoly and Hayn (2000) consider conservatism
as an accounting tool that leads to faster recognition of expenses and slower recog-
nition of revenues. Conservatism is simply defined as the asymmetric timeliness
in recognizing losses versus gains (Watts, 2003). One cannot overlook the concept
of conservatism especially with reference to Accounting. The conservatism can
hence be defined in these words that, if there is a lack of conviction in any trans-
action, one should identify and record all possible losses but should not identify
and record all possible revenues.
A large number of researchers are of the view that it is the Accounting Standard
Bodies that pave the way for AC (Chung et al., 2002). They argue that Accounting
Standards are too dense thus cannot be fully comprehended by managers. This
imperfect comprehension leads to dismal flow of information about the financial
condition of a firm. The users of financial statements i.e. investors, creditors,
regulators etc. thus are sometimes confused about the true performance of the
firm. This confusion may be caused by two reasons. First is the inability of
the managers to understand the ways how they should account for major financial
affairs of the firm. Second is the permitted use of manager’s discretion in reporting
accounting estimates(Chung et al., 2002). The managerial discretion in reporting
these estimates can lead to AC (Ramanna and Watts, 2007). This demand for
conservatism is more often backed by its role in reducing information asymmetries
(LaFond and Watts, 2008).
Lu and Trabelsi (2013) argue that AC can only improve information environment
if comparatively credible or neutral information is provided. Since one of the con-
sequences of conservatism is an understatement of various accounting estimates
especially in the long run, thus paves the way for providing nonneutral information.
The regulatory bodies have taken upon themselves a responsibility to ensure the
flow of credible information. In their quest to achieve neutrality, the regulatory

Introduction 5
bodies try to limit conservatism in financial reporting (Lu and Trabelsi, 2013).
This argument is rooted in various criticisms of AC that have surfaced over time.
Hendriksen (1977) is one of the first critics on AC. He argues that the use of conser-
vative practices can lead to flow of information that is both biased and inaccurate.
Later on Belkaoui (2001) working separately also argue that conservatism results
in dissemination of misleading information. Another very interesting view point
is set forth by Penman and Zhang (2002). They claim that AC result in reducing
the earnings quality thus playing a consequential role in earnings management.
Witteveen (2013) is of the view that earnings management and accounting con-
servatism are deeply influenced by the discretion of managers over the financial
reporting. Healy and Wahlen (1999) and Stolowy and Breton (2004) are the re-
searchers who define earnings management. According to them it is simply the
altering of financial statements with a goal of misleading the users of these state-
ments and are backed by the intentions of reporting favorable outcomes of the
contracts or showing even wealth distributions. AC on the other hand as defined
by Basu (1997), deals with the recognition of bad news quickly than good news.
Simply put, conservatism is a phenomenon that involves a high degree of verifica-
tion while recognizing a good news as gains in comparison to the recognition of a
bad news as losses.
Witteveen (2013) argues that managers discretion over the measurement and re-
porting of accounting estimates empowers them to use their discretion to gener-
ating misleading accounting records. The demand for AC on the other hand can
backed by internal or external motives. By internal we mean that, managers (hav-
ing discretion) can impose upon themselves the use of conservatism because of its
advantages in contractual agreements and the benefits that they offer in case of
litigation.
The external motivators for increased demand of conservatism include the restric-
tions imposed on managers by regulatory bodies or creditors. Whatever the case
may be, the stature of governance plays a significant role in shaping reporting
environment of the firms. Ball and Shivakumar (2005) report that CG plays a
remarkable role in defining reporting practices of a firm. So it is important for

Introduction 6
the researchers, investors, fund managers, managers and policy makers as well as
regulators to understand that whether CG complements conservatism or not.
1.2 Research Gap
This section holds the discussion of gaps that prompted the need for this exami-
nation. It is divided into five sections. The first four sections hold the discussion
on research gaps and the last section summarizes the shared discussion.
1.2.1 Absence of Theoretical and Empirical Research in
South Asian Economies
The first gap is a contextual gap. Most of the studies that strive to address
the connection between AC and CG are limited to few develop and developing
economies. These studies do not address the understudy connection in South
Asian economies. For example, Mohammed et al. (2017) analyze the role of CG in
AC in Malaysia. Caskey and Laux (2017) and Elshandidy and Hassanein (2015)
attempt to analyze the impact of directors independence along side other firm’s
governance mechanisms on AC in FTSE listed firms. Rodriguez (2010) analyzes
the connection between the presence of a big auditors and conservatism in Spanish
listed firms. Shuto and Takada (2010) and Kung et al. (2010) investigate the role
of ownership structure on AC in Japanese and Chinese listed firms. Ahmed and
Duellman (2007) examine the role played by attributes of board in persuading firms
to follow conservative accounting in US listed firms. Another study that examines
the impact of composition of board on conservative accounting practices in UK
firms is carried out by Beekes et al. (2004). Hence there exists a gap regarding the
investigation of link between CG and AC in developing economies of South Asia.
The reason for the existence of this gap is the difference between CG frameworks
that exist in those economies form other countries. All the three economies that
examined and regarded as developing in South Asia differ from developed as well as
those economies or markets that are already tested or investigated with respect to

Introduction 7
the existence of connection between CG and AC. The discussion on the difference
between these economies is presented in the sections below. However, for reference
it can be written that these three economies differ in institutional framework,
inclination and awareness about CG and development of CG infrastructure in the
country. Hence, this study strives to address this issue and analyze the impact of
CG on AC in three developing economies of South Asia.
1.2.2 Absence of Examination of Various Attributes of CG
and Development of Composite Measure for Firm’s
Governance
Another compelling factor that prompted to go for this investigation is that the
literature on the connection between CG and AC is also limited to analyzing some
attributes of CG. To address this issue some of the studies included different CG
attribute in the composite score or indices developed by them. For example, Lara
et al. (2009) develop and use a composite measure of board characteristics and
analyze its impact on AC in case of Spanish firms. Two gaps are found to exist
with respect to CG attributes. The first gap is regarding the inclusion of some
new attributes of CG which have never or rarely been investigated before. The
second gap is regarding the development of composite score for firm governance.
As far as this measure is concerned there are three problems that can be addressed
to fill the gap.
The first problem is that most of the composite scores or indices are developed by
taking weighted average of some CG attributes. These weights are mostly assigned
on the basis of subjective criteria i.e. mostly by asking financial experts or fund
managers about the importance of a certain factor in CG. Second these composite
scores and indices are developed by considering only some CG factors mostly
depending upon the discretion of the researcher. A few studies attempt to address
this issue by developing the index or composite score by using factors loadings
for every major factor calculated by employing principal component analysis. But
still there exist a gap as these studies mostly address the financial sectors and

Introduction 8
developed economies only. No single study has yet developed the composite score
or index for CG for emerging economies in South Asia.
1.2.3 Absence of Direct Examination of Effect of CG on
AC and Employment of Few Measures of Firm’s Con-
servatism
A prompting factor for this investigation is indirect estimation of relationship be-
tween CG and AC and employment of limited measures of AC. Nasr and Ntim
(2017), Mohammed et al. (2017), Elshandidy and Hassanein (2015), Ahmed and
Henry (2012), Lim (2011), Lara et al. (2009) and Ahmed and Duellman (2007)
are a few who examine the impact of corporate governance on accounting conser-
vatism but they all employ indirect estimation procedure. By indirect estimation
procedure, it is meant that the AC variable is not measured only its effect is ex-
amined. The approach that is followed is found in the literature with the name of,
”reverse regression” and is based on Basu (1997) model. Moreover these studies
are also limited to earnings based and accruals based measures. These two gaps
are addressed in this study as the connection is studied via direct approach and
all existing measures i.e. earnings based, accruals based, skewness based and also
some composite measures are employed.
1.2.4 Absence of Examination of Moderating Role of Dis-
closure Quality on the Association between CG and
AC
Last but not the least, the role of disclosure quality in moderating the relationship
between CG and AC has never been explored before. Existing studies are limited
to exploring the relationship only and do not involve any moderator even though
the theoretical justification exist for its investigation.
For example, Aburaya (2012), Khodadadi et al. (2010) Soheilyfar et al. (2014),
Belkaoui (2012) and Sajadi et al. (2009) are among the few who have investigated

Introduction 9
the role of CG in improving disclosure quality of firms listed in different countries
across the globe. All these studies are limited to only exploring the existence of
relationship but never attempted to explore the nature of this relationship. Hence
there exists a gap to explore the role of disclosure quality as a weakening factor
in the relationship between CG and AC.
1.2.5 Summary
This study address four gaps. These gaps are found to exist by reviewing the
existing literature. First this study attempts to examine the role of governance
mechanism of firms that are listed in three emerging economies of South Asia
namely Bangladesh, India and Pakistan on the level of conservatism employed
by them. Second, this investigation explores the effect of CEO turnover on firms
conservatism. Third gap is related to estimation procedure that is being employed
by existing studies to explore the role of governance mechanisms of conservatism.
Lastly, this study attempts to explore the moderating role of disclosure quality on
the relationship between AC and CG.
1.3 Theoretical Justification
This section encompasses two things. First is the account of relevant theories and
second is the discussion on link between CG and AC.
1.3.1 Agency Theory
Agency theory is considered to be a surmise in explaining the relationship between
principals and agents. This theory deals with addressing the issues or problems
that exist in case of principal agent relationship. The principal agent relationship
is of much importance the owners who are actually the principals sit outside of
the organizations. On the other hand the agents are managers who run the firms
on behalf of owners. The agency viewpoint talks about the conflict of interest
between the two parties.

Introduction 10
According to this theory this disagreement may be because of two reasons. First
the owners and agents can have different directions. One can say that the agent
is the driver of the car named as firm. The principal is the owner of the car and is
also sitting in the back seat or is virtually present with the driver at all times. The
problem can arise if the driver i.e. the manager and the owner have two different
destinations in mind. The second factor that might contribute to the fire that
already exists is the difference in risk approaches of the two parties. This type of
conflict arises whenever the principal hires an agent to stir in his place.
One can argue that the disagreement on the direction as well as the level of risk
exposure can arise because of inadequate exchange of information between them.
Whenever the type of relationships that exists in any firm are discussed, two
important forms of relationships that exists in any corporate entity sprung in
mind. These include the relationships between managers and stakeholders and
the relationships between managers and creditors. This argument which we today
known as, Agency Theory was set forth by Jensen and Meckling (1976).
The assumption upon which the foundations of this theory are built is that the
agents may not act in accordance of the wills of the principals hence paving the
way for conflicts. Despite lack of sharing of complete information between agents
and principals, sometimes the uncertainty is also regarded as the cause of agent
principal conflict or disagreement (Subramaniam, 1978). One of the possible solu-
tions whose ability in resolving this conflict is being tested in developed economies
is the development and implementation of effective structural as well as regulatory
frameworks in the firms working in developing economies.
Most of the research studies conducted to address the issues of governance in firms
hold agency theory at their base (Abdullah, 2006). There are no two opinions over
the matter that whenever a principal or the owner hires a manager or in much
better words the agent, both the parties i.e. the managing end and the controling
end, indulge themselves in the creation of the agency relationship and the strength
of this relationship is determined by the actions of both parties. The CG keep
these actions in check and pave the way for reducing conflicts between the two
parties (Subramaniam, 1978).

Introduction 11
1.3.2 Stewardship Theory
Stewardship theory offers alternative approach to principal-agent relationship as
discussed by Agency Theory. This theory was proposed by Donaldson and Davis
(1989). According to this theory, a manager is not an opportunist rather he is a
steward. And like most of the stewards, the manager is just a person who wants to
do his job in an excellent manner. The manager is actually a steward having inner
feeling towards the firms to protect and safeguards the interests of its shareholders.
These people feel themselves accountable and work to maximize the wealth of
shareholders. These stewards are motivated by organizational performance and
so this viewpoint focuses on delegating more authority to the managers. If the
stewards feel more autonomous they are more likely to contribute more towards
the organizational success because of trustworthy moral behavior towards the firms
and its shareholders (Davis et al., 2007). Davis et al. (1997) also argue that a
steward is motivated intrinsically to achieve organizational goals hence is bound
to add values to the firms they are serving in. .
1.3.3 Stakeholders Theory
The shareholders theory addresses the impact of various actions of corporations on
her stakeholders. Freeman (2010) argue that it is the companys stakeholders who
actually pull the weight of the firms. These stakeholders can be categorized into
internal and external. The internal stakeholders include directors, employees and
all those who are actually involved in framing governance structure of the firm.
The external stakeholders include creditors (both individual and institutional),
customers, suppliers, whole sellers, retailers, distributors, regulatory bodies, coun-
trys government and other participants that shape the working environment of the
firms. According to this theory, it is the responsibility of the governance end to
take into account the interests of its stakeholders. The stakeholders comprise of
those entities who influence or are influence by governance structures installed in
firms. This influence has its roots in the expectations of stakeholders who look to
the firms as the units that create value for them and hence to keep them satisfied

Introduction 12
is important for successful working of firms. Freeman (2010) is a strong believer
that if a firm needs to be healthy, it surely has to keep a keen sight of interests of
its stakeholders. The inability of any firm in safeguarding the interests of its stake-
holders ultimately opens a doorway to its own doom. In a nutshell, the firm is like
a boat with all its stakeholders as its boatmen. If they fail to row or paddle the
boat together, the boat will not be able to come ashore safe and sound. Hence to
row the ever angry waters of competitive business environment, the stakeholders
concerns need to be addressed by those who are steering the firms.
1.3.4 Resource Dependency Theory
This theory addresses the role of governing end of firm in generating adequate
resources for firms. It was set forth by Pfeffer and Salancik (1978) and argues that
firms require resources and these resources are to be generated from the environ-
ment they operate. The external environment encompasses all those entities who
have the resources needed by firms. These resource providers more often enjoy
power over the firms and it is the responsibility of managers to deal with such
issues. It can hence be stated that if the managers have strong linkages with re-
source providers they can access resources well in time and play a significant role
in improving performance of the firm.
1.3.5 Positive Accounting Theory
Positive accounting theory deals with the importance or significance of Account-
ing in a firm. This theory is an attempt to describe as well as anticipate the
use of a particular accounting method in a firm. It is interesting to note that
this theory does not provide complete insight to which accounting method should
be employed in a firm (Watts and J., 1986). One cannot deny the fact that ev-
ery organization either profitable or not, is a nexus of contracts. Most of these
contracts are done to reduce the agency costs. The cost of contract as well as
the agency costs is determined on the basis of accounting numbers (Watts and
J., 1986). It is often argued that the managers can make use of such accounting

Introduction 13
procedures to calculate the accounting number that will overstate the accounting
profits with an intention of reward thus jeopardizing the very function of account-
ing as a procedure to report the current stature of the firm. If this case exists, the
managerial decisions have to face the wrath of agency conflict hence the concept of
AC emerges as a mechanism to restrict the opportunistic behavior of the managers
(Lara et al., 2009). Though this theory is of western origin its application is same
in case of developing economies. A significant problem in developing economies
is the existence of concentrated ownership i.e. some participants or groups have
more power than others. This tug of war between the concentrated owners and
managers sometimes persuade the managers to indulge in such procedures so as to
manipulate the earnings and show a good picture of the firm. The conservatism
is thus a tool that prevents the right of the shareholders by limiting the use of
income increasing accounting policies.
1.3.6 Accounting Conservatism and Corporate Governance
The link between CG and AC can be explained in the light of five theories i.e.
the agency theory, the stewardship theory, the stakeholders theory, the resource
dependency theory and the positive accounting theory.
There are no two opinions over the matter that the managers are acting as agents
on behalf of the owners who hold the principal position in firms. The owners re-
quire the managers to act in accordance with their interests. To ensure that their
interests are safeguarded properly certain rules, procedures, guidelines etc. are set
forth. These rules, policies, procedures etc. provide guidelines to the managers
to act in line with the interest of the owners and limit them to act in their own
interest. The managers are the ones who are running the firms. The investors are
sitting outside of the firms but require complete information. This need of the in-
vestors to remain informed compel them to set forth such guidelines or install such
mechanisms that support conservatism (Ahmed and Henry, 2012). LaFond and
Watts (2008) discuss that the use of conservative accounting reduces the informa-
tion asymmetry between the managers and investors. They argue that if proper
procedures are installed, the managers recognize the losses timely hence improving

Introduction 14
the reliability of the financial reporting process. Pope and Walker (1999) also list
the advantages of employing conservative accounting practices in firms. this view
point links CG and AC in the light of contractual agreement between owners and
management. The owners in their quest to limit the opportunistic behavior of
managers install such mechanisms that pave the way for more conservatism. The
managers are inclined to show their loyalties to the owners as well. Thus, they
employ conservatism to avoid losses that can deprive them of their compensations
that are based on their performance.
The link between AC and CG can be addresses in the light of stewardship Theory.
This theory strives to align the principals and agent within a contractual setting
but unlike other contracts that are backed by opportunistic motives this contract
is a psychological one. The steward, feels a close connection or bond with the or-
ganization and indulge in those efforts that would ultimately add value to the firm.
The existence of this psychological contract reduces the problems of less motiva-
tion at the governing end. This also motivates the managers to recognize the losses
as early as possible so that the firm might not get hurt and it is this motivation
that compels the managers to go for employing accounting conservatism.
According to the Stakeholder theory perspective, AC and CG can be linked with
each other as a consequence of increased demand of AC by the stakeholders. The
dynamic business environment has increased the need to address concers of stake-
holder as these are the entities who are directly or indirectly affected by the affairs
of the firms. Chi et al. (2009) state that conservatism is an effective way to deal
with problems that may arise because of dissemination of asymmetric information.
LaFond and Watts (2008) are of the view that escalated demand of the stakehold-
ers to know more compels the governing end to employ more AC. One can state
that the focus of managers to make such decisions that adhere to the interests of
stakeholders alongside the raised demand of more information from stakeholders
escalate the employment of AC. The connection between AC and CG can also be
explained in the light of Resource Depending Theory especially in the context of
developing economies (Ren, 2014). According to this theory the managers play
a significant role in generating resources. It is the responsibility of the manager

Introduction 15
to bring both tangible and intangible resources to the firm. The resources are
to be generated from external sources and more often these resource providers
enjoy power over the firms. The reliance of firms on these resource providers in
conjunction with the role of managers compels the firms to employ AC.
Another viewpoint that tries to address the link between CG and AC is the positive
accounting theory. This perspective is linked with the importance of Accounting
in any firm. No one can deny that there are numerous contracts in a firm. The
first and the foremost contract is between the managers and the owners. The
owners require complete information and Accounting is a way to provide them
with this information. The owners evaluate the performance of the managers on
the basis of accounting numbers and then decide about the compensation that
should be offered to them. In the absence of AC the managers can overestimate
the profits and assets thus concealing the true picture and attempt to demand more
compensation. The owners via the board of directors try to limit the creation of
such agency conflict by demanding conservatism (Deegan, 2009). It is also a fact
that the tenure of any managers is limited and the managers hold more information
about the firm than the owners. This advantage of the managers can allow them to
manipulate the earnings in their favor. The use of conservative accounting limits
the manager from doing so, hence reducing the causes that could lead to agency
conflict and thus prevents jeopardizing the efficient working of firms (Lara et al.,
2009).
Another very important type of contracts is debt contracts. The debt holders are
always concerned about the efficient working of the firms. The reason is obvious.
To a debt holder the firm is its investment. If the firm fails to meet its obligation
the debt holder can be at risk. Debt is an essential part of the capital structure
of a firm. To keep the debt holders satisfied such mechanisms are set in place
that support conservatism. To summarize the above discussion and report the
missing link between AC and CG, it can be stated that the need to practice
conservatism can arise form employment contract or governance reasons. The
stimulus for managers to suppress the losses can arise from their fear of being
fired from employment even before the completion of their tenure. The manages

Introduction 16
are also frightened that if they admit the losses and that they have invested in
negative NPV projects this can lead to their banishment. The AC speeds up
the recognition of losses and compels the board of directors and shareholders to
investigate the reasons for those losses. The consequence of such an investigation
can be the dismissal of the manager from his office and elimination of negative
NPV projects. The motivation of manager to report positive NPV projects paves
the way for conservatism (Garcia et al., 2007).
Another stimulus can be regarded as an internal one. The managers can be in-
ternally motivated to do a good job for the firm. This internal/psychological mo-
tivation can compel the managers to recognize losses early in order to strengthen
the firm performance and increase its value (Davis et al., 2007). Another expla-
nation for this study is inherent in the role that is to be played by the managers
in satisfying the stakeholders. The contended stakeholders are significant for the
efficent working of the firms. The managers to keep the stakeholders in check are
motivated to employ AC LaFond and Watts (2008).
In case of emerging economies, (like the ones considered for this empirical exami-
nation) the managers role as information disseminator and bridge maker between
resource providers and firms also supports the argument of looking into the role
of CG in AC. This argument is inline with that theoretical justification that talks
ablout the dependence of the firms on resources. Last but not the least the signif-
icant role of governance in Accounting paves the way for this investigation. This
role is important to be understood and discussed as it shapes the path of the
firms towards efficiency. It is also interesting to note that if there is weak gov-
ernance framework in a firm, the mangers are reluctant to disclosure transparent
information to the shareholders and go for employing conservatism so that the
information symmetry could be maintained to reduce agency conflict. Though
this view point is not entirely incorrect but is slightly short term. If the manager
of the firm is clocking the weaknesses by employing more conservative accounting
estimates while reporting accounting estimates, the improved disclosure quality
helps to mitigate the agency conflict in the long run. Hence, the role of DQ in
impacting the AC-CG relationship needs to be examined.

Introduction 17
1.3.7 Accounting Conservatism, Corporate Governance and
Disclosure Quality
The motivation for examining the role of DQ as moderator in CG-AC relationship
is backed by the empirical evidence set forth by Lam and Lee (2012) and Cho
and Kim (2007). These studies argument and then empirically prove that the
existence of some mechanism in the firms actually reduce the effectives of corporate
governance. For example, Lam and Lee (2012) set forth their argument that if the
ownership of the government of the state or a country is more in a firm, it should
compel the firm to install such CG mechanisms that can improve its performance
rather it is empirically found that the existence of such motivators reduce the
effectiveness of CG in improving performance thus playing the role of moderator in
weakening the beneficial role of CG. Agency theory theorizes that the managers are
running the firms on behalf of owners. The owners demand symmetric information
and this demand paves the way for conservatism. However, it can also happen that
the agents employ more and more conservatism in reporting by themselves because
they know that their benefits and compensations are linked with the information
they share with the owners. This opportunistic behavior of the managers need to
be checked. If the disclosure quality is held up than the effectives of CG in giving
away conservative information can be kept in check. Thus, it can be inferred
that disclosure quality can moderate the CG-AC relationship. Furthermore, the
stewardship theory considers managers to be the stewards. These people thus are
always internally motivated to do good for the owners. There is a chance that this
internal motivation of the managers becomes so strong that they unintentionally
indulge in employing AC. The use of disclosures can limit this, always doing good
behavior of the managers while acting as internally motivated stewards. Moreover,
the demand of the shareholders to have a symmetric information paves the way for
the installation of such CG mechanisms that pushes the firms towards employing
conservatism. The improved disclosure quality can be used as a tool to reduce
the efficacy of corporate governance in paving the way for AC. The dependence
of firms on external sources for resources also paves the way for conservatism and
the improved DQ can limit the use of CG to effectively pave the way for flowing

Introduction 18
symmetric information to the resource providers. Lastly, the importance of AC in
contracting cannot be overlooked. The firms in order to reap the benefits related to
accounting in case of contracts employ more conservatism. The disclosure quality
if improved can limit this role of CG in deploying AC.
1.4 Problem Statement
Reporting conservative accounting estimates has become a general practice in
many firms. This behavior deviates their financial reporting process from neu-
trality. However, it also offers certain benefits like reduction in moral hazard
problems and improved firm value. This gain-loss situation of firms require more
comprehension. There is a need to examine those factors that compel the firms
to report conservative accounting estimates. Existing literature shows that vari-
ous mechanism are being employed to govern the firms. These mechanisms can
be categorized into characteristics of the board, CEO characteristics, ownership
structure, audit quality and disclosure quality. The stature of governance is found
to be affected by size, activity, independence and gender diversity of the board,
separation of CEO and chairman, CEO turnover, percentage of shares held by
institutions and managers, independent audit committees, engagement of big au-
ditor and installation of adequate measures to improve disclosures. Evidence show
that these governance mechanisms have a strong impact on the extent of conser-
vatism employed by firms. This might be because of the use of these mechanisms
to manage agency conflicts. Besides this, some external as well as internal motiva-
tors also compel the managers to employ conservative accounting practices. The
empirical evidence is scarce in emerging economies. Though there are some studies
who try to address the relevance of governance stature of the firms in employing
conservatism but are limited to emerging economies of South Asia. Moreover,
the existing studies are also limited to exploring the impact of a few governance
mechanisms. So far, no study has examined the role of major governance mech-
anisms in shaping conservative accounting practices especially in contest of three
emerging economies of South Asia namely Bangladesh, India and Pakistan.

Introduction 19
Some studies report that board size, independence and number of meeting held
and attended by board members impact conservatism. But again the literature
is limited with respect to role played by the presence of female members on the
board in shaping reporting practices of firms especially with reference to emerging
economies of South Asia. Most of the existing studies attempt to examine the
impact of governance mechanisms on the level of conservatism by employing Basu
(1997) reverse regression approach. This approach limits the direct examination of
impact of CG on AC. A few studies, though try to address this issue by employing
other measures like skewness based measures. Yet again, one cannot find any study
that can address all existing approaches to measuring conservatism and afterwards
quantifying its impact in case of the considered set of markets.
Furthermore, it is interesting to note that in case of South Asia, the stature of
governance is considered to be weak in comparison to developed markets across the
globe. One of the reason is the existence of controlling shareholders. Even than a
better understanding of those factors that compel the firms to employ conservatism
is required. The role played by regulatory bodies in limiting the employment
of conservatism by introducing strict disclosure practices in firms alongside the
governance practices compel to look for the moderating role of improved disclosures
on the relationship between governance and conservatism. Exploring the role of
various governance mechanisms in conservatism can help to better understand
and comprehend corporate governance theories and also offer assistance to other
users of financial statements like regulatory bodies, financial analysts etc. This
study aims to explore the impact of stature of corporate governance of a firm on
the level of conservatism employed by firms listed in three emerging economies of
South Asia. Also, the moderating role played by the disclosure quality in shaping
the governance-conservatism relationship is the subject matter of this study.
1.5 Accounting Conservatism (AC)
Bliss (1924) is considered to be the first one who defines the term, Accounting
Conservatism. According to him, AC is a mechanism that involves prolepsis of

Introduction 20
all losses but prolepsis of no profits. Basu (1997) has on his credit the interpre-
tation of this definition. Basu (1997) also recognizes that conservatism exists in
two forms. It would either be conditional or unconditional conservatism. Con-
ditional conservatism is defined as the identification of anticipated losses but not
gains whereas unconditional conservatism is the asymmetric timely identification
of actual losses and gains. It is interesting to note that most of the studies that try
to study conservatism consider conditional conservatism only. One reason could
be the very concept of conditional conservatism. This type of conservatism is also
sometimes referred to as the news based conservatism. It is called so because it
involves timelier recognition of losses as compared to gains thus providing new
information.
Various approaches are employed to capture conditional conservatism. As far as
the subject matter of this study is concerned it focuses on conditional conser-
vatism. The reason that only conditional conservatism is considered in this study
is presented by Ball and Shivakumar (2005). They assert the fact that it is only
the conditional conservatism that plays a role in contracting and not the uncon-
ditional conservatism. Hence, this study only considers conditional conservatism.
The foremost contract in corporate world is between owners and managers. The
role of conditional conservatism in reducing the agency problems is important to
be discussed.
Watts (2003) also discusses that conditional conservatism plays a significant role
in preventing corporate collapse. He supports his argument by stating that if the
losses are identified timely it provides an opportunity to stakeholders i.e. share-
holders, debt holders, top management, board members etc. to take necessary
actions and prevent further losses. In order to understand the view point, con-
sider an example of a firm that is indulged in a negative NPV project. Now if
the loss is timely recognized the owners can advise to replace or bring to an end
this project thus preventing further losses. The debt holders can also evaluate the
firm and if they seem necessary can limit the firm from taking more debt. This
significant role of conditional conservatism prompts to investigate further in this
paradigm therefore this study only takes into account conditional conservatism.

Introduction 21
1.6 Corporate Governance (CG)
CG is a term that stands for the structural as well as relational stature of the
corporate entity. This structural and relational framework sets the direction of
the firm and is also responsible for its performance. The board of director lies at
the base of this framework. The association and interaction of this board with all
the stakeholders i.e. the employees, suppliers, customers, competitors etc. play a
consequential role in determining the way the corporate entity works. There are no
two opinions over the matter that this framework is developed and depend upon
the environment in which the firm works. According to Blair (1995) the governance
of a firm is a tricky task as it involves the collection of cultural, institutional and
legal frameworks positioned in such a way so as to direct the firm or corporate
entity. This set also determines the right to control or manage along with the
power to make strategic decisions in the organization. Another definition that
exists in literature, focus on the salient features of CG in directing the corporate
entity to a particular path thus making it a milestone in accomplishing goals of
the firm (Monks and Minow, 2001).
It is interesting to note that some critics are of the view that whether gathering
intelligent manpower and making them act as one unit in the form of the board
will suffice i.e. will it be enough to meet the goals of the firms or there is a need
of some other framework as well. The answer to this critics view is also present in
literature. These mechanisms are set into motion to help the firms manage their
scarce resources more efficiently by keeping the managers accountable for these
resources. These mechanisms will keep in check that the participants present
on three sides of the corporate environment remain on the same page i.e. the
corporate entities, individuals and society (Cadbury, 1992).
Over time CG has emerged as a vast field of knowledge. One of the probable
reasons is its significance in managing the firms by assisting the managers in
understanding the ways they should employ the organizational policies and proce-
dures. One of the many implications is from the view point of financial analysts.
They consider CG to be a means of enhancing financial performance of a firm.

Introduction 22
Financial analysts are of the view that since this structural as well as regulatory
framework shapes the managers behavior, it is central to earning more returns
(Mathiesen, 2002). A common term that surfaces in the literature very often is,
Agents. It is largely argued that managers are agents who are working on behalf
of the owners. These owners are called, Principals. One way to understand CG
is to look at it as a set of procedures, processes or methods used to guide the
agents to manage the corporate entities in the interests of stakeholders. The term
stakeholder stands for all those who are directly or indirectly affected by the affairs
of the firms. The most important stakeholder is the owners. Other stakeholders
include corporate partners, employees, distributors, suppliers, retailers, customers
etc. These processes once installed are thought to safeguard the interests of all the
stakeholders of the firms. In essence the term stands for the way the organizations
are being governed, managed or simply orchestrated. Another significant aspect
that needs attention is the role of such mechanisms in bridging the gap between
various stakeholders. The literature focuses on the ability of this framework in
mitigating the gap between agents and principals (Baker and Anderson, 2011).
CG is a way or mode that is employed to bridge the gap between managers and
owners thus playing a significant role in reducing agency conflict (Goergen, 2012).
1.6.1 CG in Bangladesh
Bangladesh, a developing economy standing among the emerging economies of
South Asia houses the second largest textile industry in the world. During the
last two decades the country has shown exponential growth in pharmaceutical,
lathers and shipbuilding industries. It is interesting to note that the stature of
CG in Bangladesh is relatively weak. It can also be stated that this country is
far behind even when compared to its nearest neighbors, in developing as well as
implementing governance mechanisms at the corporate level (Gillibrand, 2004).
One of the possible reasons for not being motivated towards the implementation
of these structural as well as relational frameworks might be the existence of many
family owned businesses. Another factor might be the lack of motivation at the
corporate level to share information as well as install governance mechanisms.

Introduction 23
Due to lack of motivation no legal or regulatory framework exist to address all the
stakeholders. Hence, one can say that the corporate world of Bangladesh offers
weak governance framework.
It is interesting to note that the economy of Bangladesh was made aware of the
regulatory framework in 1982 when the ownership reforms were initiated in the
financial sector. One can easily state that it the financial sector i.e. mostly the
banks that introduced some governance procedures in the country. The denation-
alization of two major banks and entry of commercial banks in the country is
seen as the milestone in moving towards the introduction of proper mechanism for
governing the corporate bodies.
The story of introduction of corporate reforms can be traced back to 2003. The
reports compiled and then made public by BEI in 2003 criticized the quality of
exiting governance in firms especially those that are listed in non-financial sector.
Most of the non-financial firms are family owned and hold little inclination towards
the introduction of CG mechanisms in their firms. The lack of motivation along
with the difference in regulatory and legal frameworks drives the need to investigate
in the paradigm of CG.
Mahtab and Islam (2015) while describing the state of CG in Bangladesh em-
phasize the need to understand as well as implement the governance mechanisms
that are proven to improve the efficiency of firms. They also argue that, it is
these set of principles that guide firms regarding the disclosure of information to
stakeholders. Most of the companies listed in two major stock exchange markets
in the country i.e. Dhaka Stock Exchange and Chittagong Stock Exchange are
family owned enterprises. This concentration of ownership with the family creates
hindrance in the installation of fair, accountable and transparent mechanisms in
the corporate bodies (Karim et al., 2010). One of the possible reasons might be
the fact that family members are dominating the boards and are also actively par-
ticipating in the management of the business (Ahmed et al., 2008). The existence
of those directors on the board that call themselves independent or non-executive
is only symbolical or a need for some licensing activity. These so called indepen-
dent directors are far from protecting the interests of the shareholders (Bangladesh

Introduction 24
Enterprise Institute 2003). The enforcement of rules and regulations set forth for
the directors, managers and employees is also very weak thus paying the way for
need to develop structural mechanisms for improvement of regulatory framework
within the corporate bodies (Ahmed et al., 2008).
It is also very interesting to note that the firms listed in the country focus on
the disclosure of some items more than the rest e.g. the disclosures are more
concerned to the compensation or remuneration offered to the committees while
less importance is extended to the disclosure of some items (Sarkar and Ahmed,
2007). The motivation of the companies to comply with the governance principles
is also less in case of Bangladesh as evident form noncompliance of most of the
firms with SECs guidelines (Sarkar et al., 2007).
Existence of weak regulatory framework is also regarded as a hurdle in the imple-
mentation of guidelines set forth with the intention of good governance of a firm
(Bangladesh Enterprise Institute 2003). The committees on the board that are
thought to improve the effectiveness of operations are also absent in most of the
firms especially the remuneration or nomination committees (Bangladesh Enter-
prise Institute 2003). The code of governance has been developed and attempts
are made to implement it in true letter and spirit. However, there are some dif-
ficulties in its implementation because of the ownership structure of listed firms,
weak regulatory mechanisms and the like. It is not difficult to visualize the stature
of CG in Bangladesh in the light of the discussion provided. Hence it is necessary
to examine the relationship between CG and AC in case of Bangladesh.
1.6.2 CG in India
India with its title head of, Newly Industrialized Country is an emerging economy
of South Asia. It is again very interesting to know that this country also has shown
very less interest for governance frameworks for the corporate entities till 2012. It
was in December 2012 when Lok Sabha, the lower house of the constituted system
passed the Companies Bill 2012. This bill includes new provisions to address the
issue of improvement of regulatory framework for the firms working in the country.

Introduction 25
An interesting thing that might pop up whenever someone try to trace back the
development of regulatory framework in the country is that this framework has
its roots in the Anglo Saxon model that was set forth to address the governance
issues in the United Kingdom. A major difference between corporate environment
in two countries i.e. India and United Kingdom is the existence of concentrated
ownership. In case of India the ownership is concentrated with families and with
the government whereas in case of United Kingdom the ownership is relatively
dispersed. The evidence of the existance of such type of ownership structure can
be found by looking at the number of shares held by family members as well as
government in many profitable firms. Even in the presence of this distinction, the
structural as well as regulatory framework for companies working in the country
seemed to have been adopted form United Kingdom. A lot many questions are
raised about this issue.
The regulatory body of Indian market known as the Securities and Exchange
Board of India also came into play and also encouraged the proponents of CG
to debate over the issue of establishment of sound governance mechanism for the
Indian market. This board of India seems confident that it will not only be able
to explore but also implement those legal as well as institutional mechanisms that
will strengthen the governance stature of the market as a whole. The major issues
this board wants to address are related to the appointment of directors, their
trainings and remunerations and the like. However the board is clear that the
country cannot base its CG principles on Anglo Saxon model.
One of the reasons is the motivation to attract foreign investment that will flow
more in that economy having strong CG stature. As far as the current status of CG
is concerned the Indian market is in a transition phase as the central government
with the consent of SEBI is looking forward to establish such institutions that
can make sure that proper regulatory frameworks/mechanisms are developed and
installed to boast the confidence of local as well as foreign investors. However, the
comparison of CG in India with a developed economy i.e. USA has been discussed
in the preceding sections that will help to understand better the context of CG in
India and its distinctions form other economies.

Introduction 26
1.6.3 CG in Pakistan
CG matters for the financial development of country since it increases the flow of
capital to the market. The fact that draws the attention of a large number of re-
searchers towards significance of CG with special reference to developing economies
like that of Pakistan is the East Asian financial crisis. A milestone in the history
of development of corporate policies and procedures is a set of principles set forth
by Organization for Economic Corporation and Development (OECD) in 1999.
This inscription now lies at the foundation of the CG statue in Pakistan. Same
as the case with Bangladesh, the banking industry of Pakistan is thought to be
the first one in developing governance mechanisms for corporations working in the
country. In this regard the role played by State Bank of Pakistan (SBP) must be
highly appreciated. SBP not only acted as a regulator of banking industry but
also played its active role in developing as well as deploying legal and regulatory
frameworks in commercial banks in the country (Khalid and Hanif, 2005).
Though the role is significant the outcomes are still in progress. It is still to be
seen that how these regulatory mechanisms can reduce default risks for firms. As
a continuum on the path of introduction of regulations, SECP issued the Code of
CG in 2002. This code actually restructured the state of governance in Pakistani
listed firms. It is also considered as a significant step towards introducing gover-
nance reforms in the corporate entities working in the country. This code provides
guidelines to the listed firms on the subject matters like the board, disclosures,
audits etc. To go further down the road another code was issued in 2012. Some
new policies, rules and procedures were set forth in this document to help the
organizations working in the country understand governance mechanisms in much
better way and use these principles as their guiding beacon.
1.7 Disclosure Quality
Disclosure is defined as the process whereby the companies release all information
related to the company. This information is taken into consideration by users of

Introduction 27
financial decisions in making informed decisions. The regulatory bodies in almost
all the countries of the world have developed mechanisms to guide companies
to disclose all relevant information in an organized manner. Many studies have
examined the association between quality of disclosures and governance structures
of the firms. The developers or reporting requirements setters pave the way for
the development of transparent financial records. It is interesting to note that if
there are better governance structures in place in firms, the efficiency is increased,
the access to capital is improved and risks are mitigated. But all these benefits of
improved firm’s governance cannot be accounted for if the financial records lack
transparency. Hence the role of improved disclosure quality cannot be overlooked.
Wallace and Naser (1995) defines disclosure as the medium of comprehension and
transference of economic, financial, quantitative and any other form of firm related
information to the users of financial statements in a transparent and symmetric
manner. According to Wallace and Naser (1995), the disclosure can be voluntary
or involuntary in nature. He further explains that whenever the firms disclose
information in the absence of any regulators, rules and procedures, the process
is recognized as voluntary disclosure and when the information is disclosed under
the umbrella of some redefined regulations and rules, the disclosure is regarded
as involuntary. This study attempts to analyze the role of disclosure quality in
moderating the relationship between CG and AC.
1.8 Similarities and Differences among Bangladesh,
India and Pakistan
This section discusses certain similarities and differences among the three economies
that are the subject matter of this study. It is these similarities and differences
that shape the course of this study.
First the similarities among the three economies are discussed. For one, all the
three are emerging or developing economies. This status is extended to them
by BBVA (Banco Bilbao Vizcaya Argentaria) institute. Based on the fact of

Introduction 28
being developing, these economies are different from developed economies like
US etc. Second, these economies are similar with respect to the fact that the
listed companies are governed by laws formulated by central/federal government.
Unlike in many developed and developing economies where the states or provinces
or autonomous units within a country formulate separate laws to govern the firms.
Third, in all three countries the reporting requirements are set by government
agencies unlike in other economies where the reporting requirements are set by
private bodes for example by FASB in the US.
The considered three economies, though having similarities are quite different from
one another in many aspects. As stated earlier all three are emerging economies
but their pace of emergence is very different from one another. Out of the three,
India secures the first position in economic development followed by Bangladesh
who now has reported more economic growth as compared to Pakistan. This can
better be understood by looking at the industrial development in these economies.
For example, Bangladesh has shown exceptional growth in its textile and leather
sectors over the past few years. Similarly, India also has shown tremendous growth
in telecommunication, automobile and pharmaceutical sectors. However, signifi-
cant growth is not seen in various economy driving sectors (e.g. textile) in case of
Pakistan over the past few years.
It is also worth mentioning that though the companies in these economies are
governed by laws set forth by their respective central/federal governments (For
example, by company rule in India, the companys act (1994) in Bangladesh and
companies act 2017 in Pakistan), there is still a huge difference in their institutional
framework. The laws, rules and regulations set forth by the federal governments
of each country are significantly different from one another. This difference can
be more evident by deeply analyzing these acts/ordinances.
Lastly, though the reporting requirements are set forth by government agencies
and not by private agencies in these economies, the reporting requirements are
far apart. This distinction can be explained by looking at the reporting practices
that are followed in the considered three economies. In case of Pakistan, SECP
under the companies act 2017 set froths the accounting requirements for registered

Introduction 29
companies. Pakistan has partially adopted the International Financial Reporting
Standards (IFRSs). In case of India the Indian Accounting Standards (Ind AS)
are employed where as in case of Bangladesh, the Bangladesh Financial Reporting
Standards (BFRS) are followed. There is a huge difference with respect to many
factors that are the part of mandatory and non-mandatory disclosures under each
financial reporting framework.
1.9 Research Questions
The questions which this study strives to answer are presented as follows:
1. Does the Corporate Governance impact Accounting Conservatism?
2. Does Disclosure Quality moderate the relationship between Corproate Gover-
nane and Accounting Conservatism?
However the above stated question can be classified into few themes and are as
follows:
Characteristics of the Board
1. Does the Board Size influence Conservative Accounting?
2. Does the Board Activity impact Conservative Accounting?
3. What is the relationship between Board Independence and Conservative Ac-
counting?
4. Does the Gender Diversity on Board influence AC?
CEO Characteristics
5. Does CEO Turnover influence Conservative Accounting?
6. Does CEO Duality influence Conservative Accounting?
Ownership Structure
7. Does the Institutional Ownership impact Conservative Accounting?
8. Does the Managerial Ownership influence AC?

Introduction 30
Audit Quality
9. Does the Audit Committee Independence influence AC?
10. What is the relationship between Big Four Auditor and Conservative Account-
ing?
Corporate Governance
11. Does the Composite Governance score for a firm influence Conservative Ac-
counting?
Disclosure Quality
12. Does the quality of disclosure moderates the connection between CG and AC?
1.10 Research Objectives for this Study
The major objective of this study is to examine the impact of corporate governance
on accounitng conservatism alnog side the exploration of existance of moderating
role of disclsoure quality on the connection between CG and AC.
The above stated objective can be structured down as follows:
Research objective 1
To examine the impact of Board Size on AC.
Research objective 2
To explore the impact of Board Activity on AC.
Research objective 3
To explore the effect of Board Independence on Conservative Accounting.
Research objective 4 To examine the influence of Gender Diversity on AC.
Research objective 5 To explore the effect of CEO Turnover on Conservative
Accounting.
Research objective 6 To inspect the effect of CEO Duality on Conservative
Accounting.

Introduction 31
Research objective 7 To investigate the impact of Institutional Ownership on
AC.
Research objective 8 To investigate the effect of Managerial Ownership on
Conservative Accounting.
Research objective 9 To explore the effect of Audit Committee Independence
on Conservative Accounting.
Research objective 10 To investigate the impact of Big Four Auditor on AC.
Research objective 11 To analyze the relationship between Composite Gover-
nance Score for a firm and AC.
Research objective 12 To examine the moderating role of disclosure quality on
the relationship between CG and AC.
1.11 Contribution of this Study
The pursuance of this empirical examination is motivated by several contributions
offered by this study. These contributions can be listed down as follow:
1.11.1 Accounting Conservatism and Corporate Governance
in Developing Economies of South Asia
As stated, one of the objectives of this investigation is to test the existence of
connection between AC and CG in the firms listed in three emerging economies of
South Asia. This section strives to address the importance of understanding the
need to study the relationship in case of emerging economies of South Asia. A lump
of literature can be piled that investigates the connection between CG and AC in
developed economies i.e. in USA, UK, France etc. Some evidence can also be found
that address this relationship in developing economies like Iran, Jordan, Malaysia
etc. but this relationship has never been tested for developing economies of South
Asia. One cannot undermine the importance of these economies as the economies
therein are among the fastest emerging economies in the world. The following

Introduction 32
section describes the contextual difference between CG in emerging economies of
South Asia and the developed economies of the world that paves the way for the
this investigation.
The discussion on the contextual difference between Bangladesh, India, Pakistan
and the developed economy like US can be built on the difference in the institu-
tional framework of the two sets. In USA, the companys law is governed by indi-
vidual state laws that are different for each state whereas in case of Bangladesh,
India and Pakistan the companies are governed by the central government law
i.e. Companies Act of 1994, Act of Companies 1956 and Companies Act 2017
respectively. The government owned companies are not publically traded where
are in case of the three developing economies of South Asia under discussion those
corporations having huge ownership of government are traded publically. Well
defined regulations for stock exchanges issued by Securities and Exchange Com-
mission since 1934 are in place in USA. There exists a long history of regulations as
compared to the Bangladesh Securities and Exchange Commission established in
1993, Securities and Exchange Board of India in 1992 and Securities and Exchange
Commission of Pakistan established in 1999.
Another important context of CG that differentiates USA from that of the emerg-
ing economies under discussion is the ownership structure. Most of the listed
corporations in the United States have very little share of founders or owners
in their ownership structure where as in case of Bangladesh, India and Pakistan
the businesses are mostly family owned and even if some are not there ownership
structures are mostly dominated by certain groups. Provisions of litigation are
also another aspect that differentiates most of the developing economies from that
of the developed ones. As in case of USA litigations provisions are well defined
and are in practice whereas in case of three developing economies in South Asia
there is no provision for litigation. In case of Companies listed in USA, only two
types of directors exists i.e. independent and non-independent whereas in case of
the economies focused in this study three types of directors exist i.e. Executive,
nonexecutive, or independent. The last aspect of institutional framework that
differ the two groups under discussion in this section is the setting of Accounting

Introduction 33
Standards. In USA the Accounting Standards are set by private sector i.e. by
FASB whereas in case of Bangladesh, India and Pakistan the government set Ac-
counting Standards via the BSEC, SEBI and SECP. Because of the facts presented
above we can conclude that the stature of CG in the three economies of South
Asia varies from that of developing countries hence offering a chance to investigate
the relationship in this new setting.
1.11.2 Corporate Governance Attributes and Accounting
Conservatism
Most of the attributes of CG are already discussed with respect to their rela-
tionship with AC. A significant contribution of this study is the investigation of
relationship between CEO Turnover and AC. No one can deny the fact that CEO
turnover offers a new paradigm for AC. The reason is simple. Both the incoming
and departing CEOs have their own perceptions as well as motivations for the use
of conservatism. No study has yet tested this relationship. Some studies try to
investigate the association between earnings management and CEO turnover (e.g.
Choi et al. (2012)) but this variable has never been tested before with respect to
its relationship with AC. Another contribution of this study is the investigation of
relationship between gender diversity on the board and AC. Though this connec-
tion has been investigated by Boussaid et al. (2015) for French listed firms there is
still a lot of room for testing of the existence of this relationship in both developed
as well as developing economies. They based the argument of their investigation
on the fact that the female presence on the board improves monitoring efficiency
of the boards thus impacting the demand for conservatism. The need to verify the
existence of such relationship in developing economies setting is important. All the
major characteristics of female directors as discussed in literature i.e. risk aversive
behavior, reduced proneness to overconfidence while making decisions, indepen-
dent thinking, trust building leadership style etc. that contribute to increasing
effectiveness of the board vary with cultural, social as well as the economic fabric
of a country. It is therefore important to investigate the impact of gender diversity
on the board on AC.

Introduction 34
1.11.3 Composite Score of Firm Governance and Account-
ing Conservatism
As mentioned in the previous section two new attributes of CG are tested with
respect to their relationship with AC. The inclusion of these two new attributes
in CG score of a firm marks another viable contribution as this addition creates a
new composite score of firm governance that is different from previously developed
versions. It has long been argued that the need of the development of an index or a
composite score arise from the limitation of using any single measure of governance
of a firm. Most of the prior studies that try to develop this index are limited by
two things. First with respect to the weights that are assigned to individual factors
and the second with respect to the inclusion of relevant factors in the index. The
method employed to develop a composite score to represent governance in a firm
in this study also marks a signature of contribution. The reason of such a strong
belief is that this measure involves new attributes and proper assignment of weights
via principal component analysis. Thus this study significantly adds to the theory
as well as methodology for the development of composite score.
1.11.4 Corporate Governance and Composite Measure of
Conditional Conservatism
The fourth contribution of this study is the development of a composite measure
of AC. One must be thinking that why there is a need to develop the composite
measure and if developed, is this measure different from the composite measures
already developed. The answer to the first question is set forth by Donovan et al.
(2015) in their study that is published in the Accounting Review Journal. They
argue that there is a lack of consensus among the researchers on the issue of mea-
sure of conservatism hence it would be better to develop an empirical measure
that could capture conditional conservatism. They are not the only ones to de-
velop the composite measures some other researchers have also developed it. The
answer to the second question i.e. how the measure developed for this study is
different from others is that it includes some factors that are not the part of the

Introduction 35
composite measures developed earlier. The discussion on the development of this
new measure is presented in the methodology section.
1.11.5 Corporate Governance, Accounting Conservatism
and Disclosure Quality
The fifth contribution of this study is the examination of moderating role of dis-
closure quality on the relationship between CG and AC. Soheilyfar et al. (2014),
Belkaoui (2012) and Sajadi et al. (2009) are a few who examine the association be-
tween CG mechanisms and disclosure quality in different markets. Some of them
report an existence of significant positive relationship between various governance
attributes and the quality of diclosed information. A significant contribution of
this study is that it examines the moderating role of disclosure quality in three
emerging economies of South Asia.
1.12 Significance of the Study
This section discusses the significance of existing study. It is divided into various
sections. Each section enlists the significance of this study with respect to various
users of financial statement.
1.12.1 Addition to Literature with Respect to Estimation
Procedures and Context
This study expands the literature that addresses the influence of governance mech-
anisms installed in the firms with the extent of conservatism exercised in reporting
accounting records. This study provides implications for emerging economies of
South Asia.
A significant feature of this study is the discussion on various governance attributes
and afterwards their inclusion in the development of an index or a composite
score. This study is helpful for the researchers in understanding theories that are

Introduction 36
discussed above in this study with special reference to the interaction between
governance mechanisms installed in the firms and the conservatism they practice
especially in the context of developing economies. A significant outcome of this
study is unveiling of the fact that whether the installation of effective governance
mechanisms or procedures in a firm supports the use of conservative accounting
estimates or not. This study tests two arguments. First, whether the governance
at the corporate level is linked with conservatism or not especially in case of de-
veloping economies of South Asia. Second, if the firms listed in these economies
can employ conservatism as a tool to mitigate agency conflict or not. The explo-
ration of the current state of governance in a firm is also a signifying aspect of
this study. Some prior studies conducted in this regard employ short data sets.
The advantage of using panel data, as in this case renders a chance to create more
generalizable results thus providing meaningful implications.
1.12.2 Extension of Insight to Regulatory Bodies
The findings of this study offer deep insight to the regulatory bodies working in
Bangladesh, India and Pakistan to formulate policies and procedures in the very
best interests of the firms working in these economies. These regulatory bodies
include central banks (in case of Bangladesh), securities and exchange boards as
well as the CG institutes (in case of India and Pakistan) established to develop
as well as implement structural frameworks for the better governance of the firms
so that the goal of prevention of interest of the stakeholders could be met. This
study helps these regulatory bodies to revisit the listing requirements, disclosure
reports etc.
1.12.3 Improvement in Analytical Skills of Analysts
As stated, a very important set of users is the analysts. This study offers the
analysts an insight to improve their analytical and examination skills. Financial
analysts are the ones who evaluate the firms and tag them to be fit for investment.
A large number of stakeholders rely their investment decisions on the evaluations

Introduction 37
that are made by these analysts becasue they consider them to be more suitable for
analyzing the firms. The findings of this study can help the analysts to understand
how CG supports the use of conservatism in firms, how they should evaluate them,
what the extent of this influence is and how the true picture of the accounting
estimates can be seen in the presence of specific governance mechanisms that are
installed in the firms.
The justification for this contribution is hidden in the fact that finanical analysts
mainly rely on financial statements along side other firm specific specific informa-
tion while evaluating the firms. They must have a clear idea that if CG compels
the firms to employ more conservatism or not. This is becasue, if the accounting
estimates are reported in a conservative manner becasue of the CG stature, it could
lead to misleading users and also affect the confidence of the investors. Therefore,
it is important for the analysts to have a clear idea about those mechanisms of
CG that can impact AC.
1.12.4 Aiding Investors in Making Informed Decisions
This study offers aid to investors as well. Being a significant user of financial state-
ments, they are always concerned about the efficiency of firm as well as accounting
information that is delivered to them. The findings of this can study help them
unveil the role played by governance stature in reporting conservative estimates
thus helping them make informed investment decisions. Investors employ company
specific information that is readily avaibale in the form of financial statements and
other reports that are issued by the firms time to time. This accuracy of this in-
formation has deep imprints on the investment decision of investors. There are
no two opinions over the matter that if there is an opportunistic management of
earnings, this could lead to misleading the users of financial statements. This be-
havior has dark implications on the confidence of investors. Conservatism is seen
as a tool that limits this opportunistic earnings management thus ensuring the
flow of reliable and accurate infromation and it is important for the investors to
understand those factors that impact the AC employed by firms to make informed
investment decisions.

Introduction 38
1.12.5 Supporting Creditors in Evaluating Firms
It offers insight to creditors. The creditors are the entities that extent funds to the
firms. The findings of this study can help them understand that how they should
evaluate the firms before extending capital to them.
1.12.6 Insight to Managers and Executives
This study pronounces to help managers in comprehending the governance proce-
dures that compel them to exercise conservatism. This study is also helpful for
executives in many ways. Frist it helps them understand conservatism. Secondly
it helps them analyze the influence of governance mechanisms on conservatism.
Third, they can better understand that if the firms are employing conservatism or
not.
1.12.7 Summary
This study is intended to equip the users of financial statements with more insight
with special reference to the emerging economies of South Asia. This study adds
to the academic literature with respect to context as well as estimation procedures
both for AC and CG. This study offers insight to regulatory bodies with respect
to procedures. It helps analysts in improving their skills and also other users of
financial statements while evaluting firms for various purposes.
1.13 Scope of the Study
The scope of this study is limited to emerging economies of South Asia. According
to the list issued by BBVA Group only three counties qualifies to be emerging in
this region. These include Bangladesh, India and Pakistan. This study is limited
to these economies only. The reason is that the fund managers and investors who
want to diversify their investments at a global scale are more concerned about
developing economies. If any of these investors is looking at South Asia, the

Introduction 39
considered three economies qualify to be emerging. Moreover the understudy re-
lationship is limited to non-financial sector. This limitation is imposed because of
the difference in reporting between financial and non-financial sectors. The time
period of this study is limited to 2009 to 2015. The reason for this limitation is
the availability of annual reports of the companies listed at three stock exchanges.
It is quite interesting that initially this study started off with the intention of
comparing three economies. But later on, the understanding of similarities and
differences among these economies compel to impose a limitation on this study.
This study is not a comparative study, rather it examines the problem understudy
in each country separately. The motivation for imposing this limitation is rooted
in the similarities and differences among the considered set of countries. This dis-
cussion is presented in a separate section i.e. section 1.6 just before the theoretical
justification section of this study.
1.14 Organization of the Study
This study is divided into five section. Followed by the first section of introduction
is the review of literature that addresses two things. One the account of work
done and other the development of hypotheses. This second section is followed by
methodology of research that encompasses the details of methods applied for this
investigation. The next section is of results and discussion. Last is the section
of conclusion and recommendations that not only concludes this study but also
offers concrete recommendations to the major users of financial statements that
are followed by future research directions.

Chapter 2
Literature Review and
Hypothesis Development
This section encompasses two things. First is the review of previous work done
on the subject matter of AC and CG. Second, the hypothesis development is
presented.
2.1 Literature Survey
The literature survey is structured in a way that it first presents the discussion
of works on AC and afterwards it moves to linking CG with AC. Afterwards the
account of those stuides that examines the role of various mechanisms on of CG
in AC is presented. Existing literature on AC is ladden with the duscussion on
significance of its use. It is argued that the use of AC produces more reliable
accounting statements thus reduces information asymmetry. This reduction in
asymmetry help the firms in securing debts easily because of improved credit rat-
ings by creditors. Beneish (1998) and Ahmed et al. (2002) support this viewpoint.
Watts (2003) also supports the argument of improved information symmetry but
he discusses it with respect to the importance of employing AC in compensation
contracts. Karamanou and Vafeas (2005) support the Watts idea by stating that
mangers in case of profitable projects employ more conservatism. Zhang (2008)
40

Literature Review and Hypothesis Development 41
also supports the idea of significance of AC in debt contracts. The viewpoints of
Lara et al. (2009), Chi et al. (2009), Iyengar and Zampelli (2010), Sun and Liu
(2011), Kung et al. (2010) support the role of AC in reducing asymmetry and its
importance in contracting. The first mile stone on the road to understanding con-
servatism is set by Beneish (1998). They report that creditors favor conservatism
especially in case of debt contracts. Shleifer and Vishny (1986) state that in order
to better understand CG, one should look at it as the method via the firms can
make sure of their return on the finances supplied to them.
Another explanation for the employment of AC is related to its significance with
respect to reporting earnings. Kim and Jung (2007) argue that the conservative
accounting estimates improve the predictability or forecasting power of the earn-
ings. Dalton and Daily (1999), Brown et al. (2006), support this argument by
stating that AC improves value relevance of earnings. However, Ahmed et al.
(2006) do not support this viewpoint. They state that AC has no role in improv-
ing predictor or forecasting power of earnings.Kung et al. (2010) are of the view
that AC reduces earnings informativeness. The studies who try to address the
connection between AC and CG renders mixed results thus paves the way for this
investigation.
CG assumes that there is always a difference in the thinking patters of managers
and shareholders Jensen and Meckling (1976). According to John and Senbet
(1998), the owners shape the behavior of managers by using CG. This view point
is in line with the OECDs concept of CG. Graham et al. (2002) look upon CG as a
protective measure having a well define list of rules and procedures. Ahmed et al.
(2002) prove that conservatism is important because the firms using conservative
accounting are ranked higher whenever it comes to debt ratings. The importance
of conservatism is also evident from a survey by Graham et al. (2002). One of the
outcomes of that survey is that whenever the conservative accounting is employed,
the financial reports look better because the use of such a phenomenon renders
somewhat clean accounting estimates thus making the statements look better.
The significance of conservatism can be discussed as a governance tool, especially in
case of debt and managerial compensation contracts (Watts, 2003). It is interesting

Literature Review and Hypothesis Development 42
to note that if a firm is filing for liquidation than in that case the conservative
measures are used. The reason is the need to determine the value of net assets of
the firm by considering all possible losses and leaving out the gains (Watts, 2003).
The significance of conservatism in managerial compensation is understandable.
If the decision of the managers lead to potential losses this decision is visible in
accounting reports thus, preventing extension of compensation to the managers
(Watts, 2003).
Beekes et al. (2004) demonstrate that it is the configuration of the board and
ownership pattern that notably influence the extent of conservatism. They show
that the extent of AC employed by firms is significantly affected by the structure
of the board as well as the percentage of shares held by managers. This evidence
is similar to that is set forth by many other researchers thus again supporting the
idea of existence of a positive connection between CG and AC. AC prevents the
firms from reducing their value by refraining excessive payments to the mangers
and indulging in negative NPV projects. These potential benefits are one of the
reasons for the existence of empirical evidences supporting the existence of positive
relationship between AC and CG. Many empirical studies show that CG mecha-
nisms have a detrimental role in shaping the information environment of the firms
(Ball and Shivakumar, 2005)
Lin (2006) shows that conservatism is a valid tool in divulgence of important
information whenever a project undertaken by the firm is evaluated. This study
argues that in case of a good project the manager employ conservatism with the
intention of earning more compensation whenever the project earns positive cash
flows. If the case is opposite i.e. the manager has accepted a bad project he will
hesitate to use conservatism because it reveals the true status thus depriving the
manager from earning more compensations. Brown et al. (2006) discuss another
view point. According to them the value relevance of earnings is limited. The
reason stated by them is simple. They say that if the managers in a firm are
indulged in selecting those accounting choices that could offer those benefits than
this opportunistic behavior of managers can reduce the earnings value relevance.
It is further stated that conservatism is applied as a tool to limit such behavior of

Literature Review and Hypothesis Development 43
managers. Kim and Jung (2007) set forth their argument that if the bad news is
recognized timely while reporting earnings, this may affect the ability of the firm
to generate future cash flows. To test their claim they divide the firms into two
groups. The first group contains the firms that belong to those industries in which
the conservatism is used very often and the second group contains those firms that
belong to those industries in which the employment of conservatism is less. Their
findings show that the descriptive ability of the earnings of the firms to forecast
future cash flow is enhanced in case of the former group than later group. On the
basis of their argument it can be concluded that the use of conservatism improves
the predictors ability of future cash flows.
Chen and Hsu (2009) are also of the view point that the use of conservatism
mitigates the managers power to manipulate earnings. According to them the
managers indulge themselves in earnings manipulation in order to meet the in-
vestors expectations as well as to reduce the adverse effects of any kind on the
share price of the firms. Rutherford et al. (2007) contradicts this viewpoint. They
argue that there is no role of AC in improving symmetry of information especially
when it is employed in case of contracting.
Ball et al. (2008) investigate that IPO firms have more tendency to go for con-
servatism. The reason is understandable. The demand for timely recognition of
losses is more in case of these firms as these firms are going public for the first time.
Another view point regarding the relevance of conservatism in debt contracts is of
Zhang (2008). He shows that the use of conservatism offer benefits to the lender
as the signal of debt contract violation can be early recognized.
There are no two opinions over the matter that the tenure of the managers is
limited therefore they sometimes consider themselves to be less accountable and
go for making weak decisions thus jeopardizing the goal of maximizing the wealth
of stakeholders (Lafond and Roychowdhury, 2008). Some firms however try to
limit this behaviour by employing various mechanisms.Mashayekhia and Bazazb
(2008) while examining the Iranian firms, report that out of the considered CG
factors like board size, leadership, independence and institutional shareholding,
only board independence effect the efficient working of firms.

Literature Review and Hypothesis Development 44
Lara et al. (2009) prove that the wealth of stakeholders is at stake if the oppor-
tunistic behavior of its managers is not mitigated in due time. They set forth this
argument by examining the behavior of bankrupt firm in the United Kingdom and
further state that these firms employ less conservative and more aggressive earning
management strategies before filing for bankruptcy. Chi et al. (2009) report that
AC is a tool employed to diminish unpredictability and asymmetry of information
as a replacement of internal governance mechanisms. They therefore support the
viewpoint that conservatism can be employed to reduce the agency conflicts be-
tween the participants in a firm. They support the view that if a firm has a weak
governance structure, it employs more conservatism. Their belief is rooted in the
argument that AC reduces informational uncertainty and can offer considerable
other benefits.
Iyengar and Zampelli (2010) prove that use of conservatism is tied to producing
more accurate and reliable financial reports. A very interesting fact is shared by
Francis and Martin (2010). They find that if the firm is indulged in profitable
investment projects, its financial statements are more conservative. They prove
that the indulgence of a firm in good project is evidenced by the returns as well
as the performance of the firm meaning that the conservatism can be used by
managers as it encourages wealth maximization.
The demand for increased AC can to be backed by the desire of having more reli-
able and quality financial reports so that the monitoring and overseeing the affairs
of firms can be improved (Mohammed et al., 2017). The literature though supports
the use of AC but is limited with respect to those firms who face serve agency con-
flicts and where there are large number of minority shareholders involved. Sun and
Liu (2011) report that firms employ more conservative mechanisms when they are
closely observed by financial analysts. Lim (2011) conducts a comparative study
of Australian firms for the periods 1998 and 2002. He analyzes the role of various
governance mechanisms like size of the board, presence of independent directors,
CEO duality and presence of Big four auditor in determining AC. Lim report that
there is no relationship between the considered governance variables and condi-
tional conservatism. Ahmed and Henry (2012) also analyzing the Australian listed

Literature Review and Hypothesis Development 45
firms from 1992 to 2002 report the existence of association between board size,
independent directors and audit committee characteristics. Most of the literature
stands with the view point that CG is a success factor for the firms. If the firms
can deploy efficient mechanism, they can attract local as well as foreign investors
and thus enhance their efficiency (Subramaniam, 1978). For example, Gou and
Kumar (2012) while analyzing the impact of CG on performance of firm in case
of Sir Lanka report similar results. To dig deeper, many studies examine the role
of various aspects of CG.
Elshandidy and Hassanein (2015) study the role of board size, board independence
and CEO duality in AC in UK listed firms. They fail to find any significant
relationship of size of the board with conservatism. However they report the
existence of weak positive impact of board independence and CEO duality with
conservatism.
Huang and Wang (2017) investigates the relationship between board gender diver-
sity alongside other governance variables and conditional AC in case of Finland.
They argue that the global shift of focus on female involvement in strategic deci-
sions has affected the corporations. The increase in female directorships and their
role in various board committees has shaped many significant decisions of the firm
thus affecting conservatism. On the other hand, Berardino (2016) report that it
is the ownership structure of the firm that plays a pivotal position in enhancing
the performance of the firms. Berardino (2016), while conducting a comparative
discussion on the CG practices of different countries in South Asia report that the
literature is relatively rich with respect to certain developed and European markets
and is relatively thin for Asian economies. But still the role of CG is significant
in shaping the working environment of the firms. Shahwan (2016) is of the view
that one of the measures of quality of CG is the disclosure of financial statements
by the firms. The reports, if properly audited can render a rather significant set
of information for all the users.
Caskey and Laux (2017) develop a unique model to analyze how CG affects finan-
cial reporting choices of firms as well as intentions of managers in manipulating
accounting reports. They support the argument of many researchers that it is

Literature Review and Hypothesis Development 46
the CG itself that paves the way for conservative accounting estimates. Most of
the studies that attempt to understand the significance of CG render the result
that CG improves the performance of firms (Chauhan et al., 2016). But it is not
always the case. Mostly when the role is examined in developing economies, the
argument of Chauhan et al. (2016) does hold. Hooy and Hooy (2017) render the
results that reinforce the positive role of disclosure quality in improving efficiency
of firms. Mohammed et al. (2017), while examining the relationship between AC
and CG in Malaysia employed various measures of conservatism. They report
that various board characteristics like board size and independence has a positive
association with conservatism. However, the managerial ownership is negatively
related with AC. (Nasr and Ntim, 2017) investigate the impact of CG mechanisms
like board size, board independence, separation of chairman and chief executive
officer (CEO) and external auditor type on the level of AC in case of Egypt. They
report that board independence is positively associated with accounting conser-
vatism whereas board size and auditor type are negatively associated with AC.
According to them separating the chairperson and CEO roles has no significant
impact on AC. The significance of this study is inherent in the fact that it is the
first study that attempts to analyze the relationship between CG and AC in a
developing economy i.e. Eqypt. Nakpodia and Adegbite (2018) argue that CG is
linked with agency theory and it offers such mechanisms that guides and control
the firms. The impact of disclosure quality on the performance of firms is evident
from the fact that most of the listed companies try to implement sound disclosure
practices.
2.2 Hypothesis Development
This section encompasses the conceptual framework followed by the debate on hy-
potheses formulated in the light of the discussion presented above. The conceptual
models are presented in figure 2.1 and 2.2 as follows:
There are twelve hypotheses that are developed for this study. It is worth men-
tioning here that all the hypothesis that are developed below are directional in

Literature Review and Hypothesis Development 47
CHARACTERISTICS OF THE BOARD
Board Size (H1)
Board Activity (H2)
Board Independence (H3)
Gender Diversity on Board (H4)
CEO CHARACTERISTICS
CEO Turnover (H5)
CEO Duality (H6)
OWNERSHIP STRUCTURE
Institutional Ownership (H7)
Managerial Ownership (H8)
AUDIT QUALITY
Audit Committee Independence (H9)
Existence of Big Four Auditor (H10)
Independent Variables
Firm Size
Leverage
Profitability
Growth in Sales
Control Variables
Dependent Variable
ACCOUNTING
CONSERVATISM
Figure 2.1: Conceptual model of the study
nature. The reason is simple. All these hypothesis are predictions that are made
regarding positive or negative change or relationship between two variables of a
specific population. These predictions are based on past studies that are presented
above in the review of literature review section.
2.2.1 Board Size and AC
It is being argued by many researcher that large boards take more time in mak-
ing decisions and rather not discuss much about the performance of these boards.

Literature Review and Hypothesis Development 48
COMPOSITE SCORE OF FIRM
GOVERNANCE
Independent Variables
Firm Size
Leverage
Profitability
Growth in Sales
Control Variables
Dependent Variable
ACCOUNTING
CONSERVATISM
Moderating Variable
DISCLOSURE
QUALITY
Figure 2.2: Conceptual model on Moderaitng effect of Disclosure Quality
However, they are also of the view point that large boards do possess more ex-
pertise. But still some costs arise because of the problems associated with large
boards (Yermack, 1996). Lipton and Lorsch (1992) indicate a common problem
with large boards. They argue that if the board is comprised of more than ten per-
sons, the members are found to be indulged in expressing their own ideas instead
of discussing those opinions that can be beneficial for the firms in board meetings.
This attitude reduces the managerial inclination to employ conservatism. Based
on agency theory and following Mohammed et al. (2017), this study argues that,
greater the size of the board, less is the efficiency. Though it is sometimes argued
that larger boards have a pool of expertise and knowledge but the problems like

Literature Review and Hypothesis Development 49
delayed decision making, existence of free riders etc. reduce the efficiency of large
boards. Such a type of board is less likely to look into the decision making process
carried out by top managers hence does not demand conservatism. On the basis
of this argument a large number of researchers have empirically proved that there
exists a negative association between size of the board and AC.
H1:There is a negative relationship between board size and AC.
2.2.2 Board Independence and AC
Hermalin and Weisbach (2003) consider board independence important and discuss
its effectiveness in decision making of the firm. While examining the firms listed
in Hong Kong, Jaggi et al. (2009) report that there exist a positive association
between independence of board and AC. It is interesting to note that after two
years i.e. in 2011 Kung et al. (2010), while inspecting Chinese listed firms for the
period from 2007 to 2009 also report the existence of similar association. Beekes
et al. (2004) and later on Ahmed and Duellman (2007) also set forth the argument
that having more independent directors on the board result in increased levels of
AC. Mohammed et al. (2017) and Nasr and Ntim (2017) argue that greater the
number of independent directors on the board, greater is the efficiency of the board.
This increased efficiency may be because of the fact that these directors are more
experienced and possess understanding as well as knowledge to judge the decisions
of the board from various dimensions. The reason of having this confident in the
expertise of these directors is hidden in the fact that being the part of various
boards alongside being independent offers them the will and freedom to pinpoint
any discrepency in the operations of the firms. It is less likely a chance that
these directors are unaware of the benefits offered by conservatism. Hence they
demand more conservatism while reporting accounting estimates. On the basis of
this argument a large number of researchers have empirically proved that there
exists a positive association between board independence of the firm and AC.
H2: There is a positive relationship between board independence and
AC.

Literature Review and Hypothesis Development 50
2.2.3 Board Activity and AC
Adams and Mehran (2012) alongside other researchers argue that attendance of
board members in board meetings is an undoubtable indicator of diligence of the
directors. The directors can have timely and regular access to information thus of-
fering them a chance to monitor the managerial activities timely and closely. This
close monitoring compel the managers to employ more conservatism. Boussaid
et al. (2015) argue that active boards improve efficiency. This increased efficiency
is because of the fact that the directors review the affairs of the firm periodically
in board meetings. Hence the demand for conservatism will be more. On the basis
of this argument a large number of researchers have empirically proved that there
exists a positive association between board independence and AC.
H3: There is a positive relationship between board activity and AC.
2.2.4 Gender diversity on Board and AC
Campbell and Minguezvera (2008), Adams and Mehran (2012), Srinidhi et al.
(2011) and Huang and Wang (2017) are all those who argue that the presence of
female on the board improves efficacy. Most of them have argued that the female
presence result in more powerful boards and bold decisions as female directors tend
to pay more attention to monitoring the performance of the firm as compared to
their male counter parts. This innate ability of female directors compel managers
to go for conservative accounting practices. Boussaid et al. (2015) also support
this argument and state that greater the presence of female on the board, greater is
the efficiency and monitoring performance of the board. According to literature,
the reason for this improved efficiency is that the female are more risk averse,
less prone to over confidence bias as compared to males, are independent thinkers
especially in case of decision making and focus on trust building leadership style
thus improves the efficiency and monitoring capabilities of the board. On the
basis of this argument only a few studies test the link between gender diversity
on board and conservatism in accounting. The existing study is one such attempt
and formulates the following hypothesis:

Literature Review and Hypothesis Development 51
H4: There is a positive relationship between gender diversity on board
and AC.
2.2.5 CEO Turnover and AC
No single study has yet formulated nor tested this type of hypothesis. There
are no two opinions over the matter that departing and coming CEOs different
preferences over the matter of conservatism that should be practiced. However
one can agree that if CEO Turnover is more, the more is the conservatism. The
justification of such thinking is simple. The CEOs are not changed frequently
meaning that the CEO who has departed is most likely to have been working for
some time with the firm hence on the basis of his skills and expertise will be aware
of the benefits of conservatism and will be inclined towards it. On the other hand
the incoming CEO will want to send positive signals to the stakeholders thus will
demand conservatism. On the basis of this argument the following hypothesis can
be developed.
H5: There is a positive relationship between CEO Turnover and AC.
2.2.6 CEO Duality and AC
The idea behind CEO duality is the mere separation between ownership and con-
trol of the firm (Brickley et al., 1997). It is argued in literature that both the ends
i.e. owners and controllers have their own agendas and motives. It is very interest-
ing to note that most of the researchers are of the view point that the demarcation
between control and ownership, though increases the costs but these costs are far
less than the benefits it offers. For example, Wei (2007) argues that CEO dual-
ity reduces the observatory capabilities of the directors. Yeh et al. (201) indicate
that CEO duality has no role in the firm’s exposure of fraud. They present this
argument after analyzing 39 set of firms that are matched to be fraudulent and
non-fraudulent. Krishnan and Visvanathan (2008) are among those researchers
who show the separation of CEO and chairman of the board pave the way for the
employment of more conservatism.

Literature Review and Hypothesis Development 52
Boussaid et al. (2015), Mohammed et al. (2017) and (Nasr and Ntim, 2017) argue
that if a CEO also holds the position of chairman of the board, less conservatism
is demanded. The reason is obvious. Holding the two positions means more
power in the hands of a single person. The board loses its effectiveness so as
the benefits attached thus demanding less conservatism. Another viewpoint is
that, the Chairman of the Boards sometimes close their eyes on the matter of
manipulating accounting estimates in positive or upward direction to gain the
benefit of increased compensation as CEO. On the basis of these arguments a
large number of researchers have empirically proved that there exists a negative
relationship between CEO Duality and AC.
H6: There is a negative relationship between CEO Duality and AC
2.2.7 Institutional Ownership and AC
Kim and Jung (2007) argue that if the ownership of the firm is not dispersed
among outsiders, this reduces the quality of financial reporting which in turn has
adverse effects of firm’s efficiency and performance. Lin et al. (2014) and later on
Mohammed et al. (2017) while addressing the role of ownership with respect to
the level of conservatism in listed firms, argue that greater the number of shares
held by the outsiders (i.e. by institutions, foreign investors etc.), greater is the
demand for quality in financial reporting. This demand compels the managers
to go for conservative accounting estimates. On the basis of this argument a
large number of researchers have empirically proved that there exists a positive
association between institutional, foreign and family ownership and AC.
H7: There is a positive relationship between Institutional ownership
and AC.
2.2.8 Managerial Ownership and AC
Ding et al. (2007) report that the owners manage earnings in upward direction.
Young et al. (2008) empirically prove that ownership structure is negatively re-
lated to conservatism. Kung et al. (2010) examine listed companies in China and

Literature Review and Hypothesis Development 53
report that, firms with concentrated owners deploy less conservatism in reporting
accounting information. The reason is that the owners can solve conflicts of in-
terest personally hence reduced conflict of interests means reduced agency conflict
and hence decreased conservatism.
Lafond and Roychowdhury (2008) set forth the evidence of existence of a negative
association between conservatism and management ownership. Their argument
is simple. They say that if the managerial interest is not aligned with that of
shareholders, the demand for conservatism is increased. Mohammed et al. (2017)
argue that, greater the number of shares held by the managers in a firm, lower is the
demand for conservatism. The reason is simple. The managers are more informed
about the resources as well as position of the firm. They can use this information
to gain personal benefits through inefficient allocation of scarce resources available
to the firms. Hence they demand less conservatism. Another viewpoint is that
in case of more managerial ownership the agency conflict is less thus there is
no need of using conservatism. On the basis of this argument a large number
of researchers have empirically proved that there exists a negative relationship
between managerial ownership and AC.
H8: There is a negative relationship between Managerial Ownership
and AC.
2.2.9 Audit Committee Independence and AC
There is a lot of evidence that audit committee independence plays an important
role in maintaining high quality financial reporting. For example, prior research
shows that an independent audit committee is important in preventing oppor-
tunistic earnings management (Klein (2002);Yang and Krishnan (2005); Davidson
et al. (2005)). Most of the empirical studies suggest that audit committee inde-
pendence intensify the virtue of financial reports. Zain and Subramaniam (2007)
set forth their arguments that the internal auditors consider independent direc-
tors as more knowledgeable and look to them for council. This thinking compel
the auditors to put more trust in independent directors that they can themselves

Literature Review and Hypothesis Development 54
indicate any problem in the financial reporting process. One of the implications
discussed by that study is that the presence of independent auditor on the com-
mittee is a symbol of more reliable accounting reporting process (Rose and Rose,
2008). Rosilda (2009) proves empirically the positive role of independent audit
committee in following conservative accounting practices. Greater the number of
independent members on the audit committee greater is the demand for conser-
vatism. The reason is very simple. Independent audit committee is more effective
in monitoring the managers as well as concerned about the quality of financial
reporting process hence demand more conservatism. On the basis of these argu-
ments a large number of researchers have empirically proved that there exists a
positive relationship between Audit Committee Independence and AC.
H9: There is a positive relationship between Audit Committee Inde-
pendence and AC
2.2.10 Big Four Auditor and AC
Huang and Wang (2017) find that fourth quarter earnings are more conservative
than earlier quarter earnings and the difference in conservatism between the fourth
and earlier quarters is higher in periods of high auditor liability. This result is
consistent with the idea of auditors adopting conservatism to reduce litigation
costs. It is assumed that the assurance is more credible if it comes from big
accounting firms because they need to maintain their reputation, are subject to
greater public scrutiny and have high litigation risks (Chung et al., 2002). Previous
studies show that large auditing firms are more effective in curbing opportunistic
earnings management and are more conservative than small auditing firms.
Huang and Wang (2017) and Chung et al. (2002) find that earnings of those firms
that employ big four auditors reflect bad news earlier than good news (Chung
et al., 2002). They find that the big four auditors are more effective than the non-
big four auditors in monitoring income increasing accruals choices but are less
effective than the non- big four auditors in monitoring income decreasing accruals
choices. This result suggests that the big four auditors are more conservative than

Literature Review and Hypothesis Development 55
their non- big four counterparts. (Nasr and Ntim, 2017) support the agency theory
view point in this regard. Their argument is similar to that of many researchers
like Ramanna and Watts (2007) who state that the big auditor offers more cred-
itability and this need of confided assurance increase demand for conservatism.
This link can be explained by a simple argument. The auditors are motivated
to employ conservatism to mitigate litigation costs. One can find a huge lump
of literature discussing the influence of auditor on the financial reporting process.
For example, (Subramaniam, 1978) offered an empirical evidance that firms with
big auditors employ more conservatism. The reason is simple. The big auditors
demand more conservatism becasue they have a risk of losing their reputation
or a legal action in case of any audit failure. On the basis of this argument a
large number of researchers have empirically proved that there exists a positive
relationship between Big Four auditor as the external auditor and AC.
H10: There is a positive relationship between the existence of Big
Four Auditor and AC.
2.2.11 Composite Score of Firm Governance and AC
CG complements conservatism in facilitating contracting. The reason is that it
is not possible for any corporate entity to enforce any contract in complete spirit
and the use of conservative accounting estimates provides them with a small edge
to clear their position as the managers hold enough information and power to
manipulate accounting numbers (Fama and Jensen, 1983). Hart (1995) provides
a theoretical model that shows CG is required when contracts are incomplete and
agency problems exist. Lara et al. (2009) examine the understudy association in
Spanish context. They employ the data of sixty nine non-financial Spanish listed
firms from 1997 to 2002. They use a composite measure of CG by aggregating
some major governance factors in the formation of index. The governance factors
that are considered include denominations of directors, size of the board, pro-
portion of non-executive directors as compared to total board members, number
of independent directors, board meetings held and attended by members, CEO
duality, the existence of audit committee as well as nomination or remuneration

Literature Review and Hypothesis Development 56
committees. They empirically prove that the firms with strong boards deploy
conservative accounting as a governance tool.
Suleiman and Anifowose (2014) examine the effect of CG mechanisms on con-
ditional conservatism. They develop and use a composite measure or score of
CG composing four internal governance proxies namely the CEO/Chairmanship
separation the size of the board its board composition along with the directors
shareholding and presence of an audit committee. They infer that firms having
sound and consistent governance mechanisms significantly improve implementa-
tion of conservatism in financial reporting.
More effective the stature of governance in a firm, the greater is the demand for
conservatism. This relationship is in line with the theoretical justifications set
forth to link CG with AC. The agency theory perspective considers conservatism
as a tool that can be employed to reduce agency conflict. Thus the managers
are motivated by structural as well as relational mechanism within the firms to
demand conservatism.
The positive accounting theory perspective considers conservatism as an effective
accounting tool that can be employed to gain the benefits in case of contracts.
Thus the managers while engaging into contracts are persuaded by governance
frameworks installed within the organizations to demand more conservatism be-
cause of its significance in accounting.
The resource dependence perspective considers conservatism as a tool that sends a
positive signal to other organizations regarding the efficient monitoring of the firm
thus is helpful in obtaining resources. The managers are thus compelled to demand
more conservatism. The stewardship theory perspective considers conservatism as
an obligation of the steward. The manager if acting as steward is compelled to
go for conservative accounting. On the basis of this argument a large number of
researchers have empirically proved that there exists a positive association between
CG and AC.
H11: There is a positive relationship between composite score of firm
governance and AC.

Literature Review and Hypothesis Development 57
2.2.12 CG, AC and Disclosure Quality
Brown et al. (2006) examine the relationship between disclosure quality and AC.
They report a negative relationship between conditional conservatism and disclo-
sure quality. They argue that if the disclosure quality is better, the information
asymmetry is less. LaFond and Watts (2008) argue that it is the information
asymmetry between notified and non-notified investors that lead to conservatism.
They empirically prove that if quality of disclosed information is improved, more
and more investors switch to the notified investors side thus reducing the level of
conservatism. This improvement in disclosure quality is tied to the governance
stature of firms.
Artiach and Clarkson (2013) study the relationship between AC and cost of equity
in two sub samples. These sub samples include firms with high disclosure qual-
ity and firms with low disclosure quality. They find that there exist a negative
relationship between the level of conservatism and cost of equity in case of firms
having high disclosure quality. Nvrvsh and Hosseini (2009) investigate the rela-
tionship between disclosure quality and earnings management. They show that
there is a significant but negative relationship between disclosure quality and earn-
ings management. Following them, Chen et al. (2013) examine the relationship
between disclosure quality, earnings management, conditional and unconditional
conservatism. They report a positive significant relationship between disclosure
quality and conditional conservatism and a negative significant relationship be-
tween disclosure quality and unconditional conservatism.
In the countries like Pakistan and Bangladesh, the ownership is concentrated and
the line between ownership and control is thin. The managerial end in order to
save their skin employ conservatism. The level of conservatism employed can be
reduce by improving disclosure quality. The following hypothesis can hence be
formulated.
H12: There is a moderating effect of Disclosure quality on the posi-
tive relationship between Governance of firm and accounting conser-
vatism.

Literature Review and Hypothesis Development 58
2.2.13 Control Variables and AC
Four control variables are also the part of this study. These include; Firm Size,
Leverage, Growth in Sales and Profitability. According to Watts and J. (1986),
the greater the size of the firm, the greater is its exposition to various costs and
thus adopts more conservatism. It is interesting to note that these costs many
vary in firms. In some cases these might be just political costs that are sujbect
to information asymmetric effects. LaFond and Watts (2008) are of the view that
if the size of the firm is greater, it will disseminate more public information as
compared to its smaller counterparts thus there will be less information asymmetry.
It can hence be concluded that larger firms have less information asymmetries and
are exposed to lower political costs therefore the need for deploying conservatism
in accounting is less. Thus, a negative relationship is expected to exist between
firm size and conservatism.
There are no two opinions over the matter that the demand for conservatism is
backed by the extent of debt contracts in a firm (Ahmed and Duellman, 2007).
The reason is simple. Those firms that are highly levered may employ more conser-
vatism in order to reduce the conflict of interest between the creditors and owners.
Ahmed and Duellman (2007) are also of the view that some firms use conservatism
as a tool to reduce the conflicts in the firms thus reducing the costs of debt. Thus,
a positive relationship is expected to exist between leverage and conservatism.
Ahmed et al. (2002) set forth his argument that the growth in sales affects the
accruals based measures of conservatism. This affect can be becasue of the role
of growth in sales in changing accruals especially inventories and receiveables. If
the sales of the firm are declining it is expected that such a firm will employ more
conservatism. Thus a negative association is expected between growth in sales and
conservatism.
Lastly, profitability is employed as a control variable. The reason for consider-
ing this variable is rooted in the argument of Ahmed et al. (2002), Ahmed and
Duellman (2007) and Krishnan and Visvanathan (2008). They report that less
profitable firms are less likely to adopt conservatism as they cannot afford the

Literature Review and Hypothesis Development 59
costs of the conservative choices they make. Ren (2014) and Yunos (2011) have
empirically proved that there exist a positive relaitonship between profitability of
the firm and level of conservatism it employs. Hence, one can state that in case of
profitable firms, the reduction in profits becasue of employed conservatism will be
relatively cheap. Therefore, a positive association is expected between profitability
and conservatism.

Chapter 3
Research Methodology
This chapter includes four things. First the data description is presented. After-
wards the variable specification followed by a section on models of this study is
presented. At the end of this chapter is the section that entails the method that
is used for estimation and analyzing the subject under discussion.
3.1 Data Description
3.1.1 Population
Since this investigation is spanned over three countries, the data is collected from
each country and estimated separately. The reason is simple. All the three mar-
kets are different in market mechanisms, currencies and frameworks, hence there
is a need to analyze these three markets separately. The population thus encom-
passes the listed firms in these economies. The discussion on population is divided
into three parts. First the discussion on firm listed in Bombay Stock Exchange is
presented. Afterwards the acoount of listed firms in Dhaka Stock Exchange and
Pakistan Stock Exchange is placed. There are 7757 companies listed on Bom-
bay Stock exchange as per the information collected at the time of this study.
Out of these listed companies 4310 enjoy the active status whereas all remain-
ing companies have either been delisted or suspended. These 4310 companies are
60

Research Methodology 61
classified into 125 industries. There are 559 companies listed on Dhaka Stock
Exchange as per the information collected at the time of study. These compa-
nies are categorized into 22 different industries and include 194 non-financial and
365 financial firms.There are 883 companies listed on Pakistan Stock Exchange
(former Karachi Stock Exchange) as per the information collected at the time of
study. These companies are categorized into 39 different industries and include
446 non-financial firms and 436 financial firms. The names as well as classification
of firms from each of the countries from whom the sample is taken is presented in
appendix.
3.1.2 Sample and Sampling Technique
Three samples each having 100 firms are taken from each country. Each of these
samples is taken from non-financial listed firms. The reason of collecting data from
non-financial sector is that there is a significant difference between the structures
and accounting practices of financial and non-financial companies (Wei, 2007).
The time period of this study is from 2009 to 2015. Only those firms are made
the part of the sample whose market capitalization is high and whose data is
available for the period under study. Secondary data is employed for the purpose
of estimation and is collected from the annual reports of the individual firms.
However some missing data set is also collected from companys websites and other
published reports.
3.2 Model Specification
As stated, this study inspects the connection between CG and AC that exists in
the firms listed in three emerging economies of South Asia followed by the mod-
erating role of disclosure quality on this relationship. The significant feature of
this investigation is that it takes into account major CG attributes that are dis-
cussed earlier with reference to their relationship with AC and also a new variable
i.e. CEO turnover. A composite score of firm governance is developed. Thus the

Research Methodology 62
relationship that is to be tested can be written down as follows:
ACi,t = β0 + β1BSi,t +β2BAi,t +β3BIi,t +β4GDBi,t +β5CEODi,t +
β6INSOi,t +β7MANOi,t +β8ACIi,t +β9TAUDi,t +β10CEOTi,t +
β11FSi,t +β12LEVi,t +β13GROSi,t +β14PROFi,t +εi,t
(3.1)
Where:
ACi,t = AC Measure for firm i in year t
BSi,t = Size of the Corporate Board for firm i in year t
BAi,t = Activity of the Corporate Board for firm i in year t
BIi,t = Independence of Corporate Board for firm i in year t
GDBi,t = Gender Diveristy of Board for firm i in year t
CEOi,t = CEO Duality for firm i in year t
INSOi,t = Institutional Ownership for firm i in year t
MANOi,t = Managerial Ownership for firm i in year t
ACIi,t = Audit Committee Independence for firm i in year t
TAUDi,t = Auditor Type for firm i in year t
CEOTi,t = CEO Turnover for firm i in year t
FSi,t = Size of the firm for firm i in year t
LEVi,t = Leverage for firm i in year t
GROSi,t = Growth in Sales for firm i in year t
PROFi,t = Profitability for firm i in year t
ACi,t = β0 + β1CSFGi,t +β2DQi,t +β3FSi,t +β4LEVi,t +β5GROSi,t +
β6PROFi,t +εi,t
(3.2)
ACi,t = β0 + β1CSFGi,t +β2DQi,t +β3CSFGXDQi,t +β4FSi,t +
β5LEVi,t +β6GROSi,t +β7PROFi,t +εi,t
(3.3)

Research Methodology 63
Where:
CSFGi,t = Composite Score of Firm Governance for firm i in year t
DQi,t = Disclosure Quality for firm i in year t
FSi,t = Size of the firm for firm i in year t
LEVi,t = Leverage for firm i in year t
GROSi,t = Growth in Sales for firm i in year t
PROFi,t = Profitability for firm i in year t
3.3 Variable Specification
This section describes the variables employed. As the above models indicate, AC
is the dependent variable in this study. It is interesting to note that different
types of measures are employed by researchers to assess conditional conservatism
in Accounting. These measures can be categorized into Earnings based Measures,
Accrual based Measures, Skewness based measures and a composite measure of
firms conservatism. Following Donovan et al. (2015), the measures of conditional
conservatism as developed by Zhang (2008) and based on Basu (1997) are used.
The reason is that most of the existing studies that try to examine the understudy
relationship in different economies by employing different measures of conservatism
render differernt results. Hence, it is decided that various measures of conservatism
are to be considered for this study. The calculation of measures is presented in
the following sections.
3.3.1 Sensitivity of Earnings to Bad News Relative to Sen-
sitivity of Earnings to Good News (ACSOE)
The first measure out of the two earnings based measures employed is based on
the idea of Basu (1997). He defines conservatism as the unevenness in verification
of gains versus losses. Basu (1997) is the first one to use the asymmetric timeliness
measure of conservatism. His argument is simple. He states that, if the unexpected

Research Methodology 64
returns of a firm are positive, this represents good news and if the unexpected
returns are negative this is an indication of bad news. It means that earnings of a
firm are more susceptible to negative unexpected return as compared to positive
returns thus the earnings returns model can be employed to gauge AC. The model
that is set forth by Basu (1997) is presented as follows:
EPSt/Pt = β0 + β1NEGt + β2RETt + β3NEG ∗RETt + εt (3.4)
where
EPSt = Earnings per share for firm
Pt= Beginning period stock price for firm
NEGt = Dummy variable that is equal to 1 if RET is negative and 0 otherwise
RETt = Return on the firm from 9 months before fiscal year end to three months
after fiscal year end
ACsoe is the first measure of AC employed for the investigation of relationship
understudy. This measure is calculated as follow:
ACSOE = Sensitivity of Earnings to bad news/Sensitivity of Earnings to good
news
ACSOE = (β2 + β3)/β2
ACSOE is computed by following the steps as given below.
1. Run the regression equation 3.5
2. Estimate β2 and β3, since the first coefficient i.e. β2 written here repre-
sents sensitivity of earnings of a firm to good news whereas the sum of two
coefficients i.e. β2 and β3 shows sensitivity of earnings of a firm to bad news.
3. Compute ACSOE by using above equation as (β2 and β3)/β2. This estimate
represents sensitivity of earnings to bad news relative to good news hence

Research Methodology 65
capturing conservatism. If this estimate is high the more is the conservatism
employed by the firm.
3.3.2 Coefficient of the Term D4EPSt−1*4EPSt−1 (AC-
CIE)
The limitation of above presented model is that returns can be affected by disclo-
sure as well as other factors, for example discretion of managers hence cannot fully
capture economic income . However, Beaver and Ryan (2000) and Lai and Taylor
(2008) argue that contemporaneous return is still the best measure of economic
income than the other two alternative models that use earnings changes and cash
flows. Ball et al. (2000) set forth their own views about the impact of earnings
on returns. According to them there exists a chance that the stock returns of a
firm might be affected by earnings but even if this phenomenon exists the effect
is not significant in nature. The model presented in above equation is termed as
the Earnings Returns model. Basu (1997) present another model to supplement
his first model. This new model estimate conservatism on the basis of changes in
earnings. This model is as follows:
4EPSt = β0 + β1D4EPSt−1 + β24EPSt−1 + β3D4EPSt−1 ∗ 4EPSt−1 + εt
(3.5)
where:
4EPSt = Change in earnings per share for firm
4EPSt−1 = Change in earnings per share for firm
D4EPSt−1 = 1 if 4EPSi,t−1 is negative (less than 0) and 0 otherwise.
The coefficient of Dummy variable that takes the value of 1 if4EPSt−1 is negative
and 0 otherwise is expected to be negative meaning that the economic losses that
are to be faced by a firm are recognized timelier than the gains that are to be
received by the firm. ACcie is the third measure of AC employed for the investiga-
tion of relationship understudy. This measure is calculated by using the measure

Research Methodology 66
that was set forth by him in 1997. The steps in its calculation are summarized
below.
1. Run the regression equation 3.6.
2. Compute ACCIE from the above equation as the coefficient of the interaction
term i.e. β3 in this case. This estimate represents the extent to which
economic losses are recognized timelier than economic gains hence captures
conservatism. If this estimate is high the more is the conservatism employed
by the firm.
3.3.3 Averaged Accruals Multiplied by (-1) (ACACC)
This mesure is the first out of the two measures that are based on accruals. It is
set forth by Givoly and Hayn (2000) and is based on the argument that the years
in which net income of a firm exceeds the amount of cash flow from operations.
If it is expected that negative accruals incur in the following years, the firms as it
might have been known cover their negative accruals generated in any year with
the cash flows from operations in the subsequent years. Therefore if a firms is
consistent in generating negative accruals it might be taken as an indicator of
conservatism.
ACACC is the fourth measure of AC employed for the investigation of relationship
understudy and is estimated as follows:
Accruals = (Income + Depreciation expense - Operating Cash Flows)/Total Assets
Accruals = (Accruals averaged over 3years) x (-1)
3.3.4 Coefficient of the Interaction Term DCFOi,t*CFOi,t
(ACcic)
The second measure based on accruals is derived from Ball and Shivakumar (2005)
work. ACcic is the fourth measure of AC employed for the investigation of rela-
tionship understudy. This measure is calculated by using the model that is set

Research Methodology 67
forth by Ball and Shivakumar in 2005 as follows:
Accrualst = β0 + β1DCFOt − 1 + β2CFOt + β3DCFOt ∗ CFOt + εi,t (3.6)
Where:
Where Accrualst = Accruals for firm i in year t
CFOt = Cash flow from operations for firm i in year t
DCFOt = Dummy variable that takes the value of 1 if CFOit is negative and 0
otherwise.
The coefficient of the interaction term DCFOt*CFOt measures conservatism. The
steps in its calculation are summarized below.
1. Run the regression equation 3.7
2. Compute ACcic from the above equation as the coefficient of the interaction
term i.e. β3 in this case. This estimate represents extent to which accruals
generated in a firm during a certain time period are timely in capturing cash
flows. According to them conservatism simply means earlier identification
of positive cash flows as compared to negative cash flows. Negative cash
flows are recognized earlier than positive cash flows gains hence captures
conservatism. If this estimate is high the more is the conservatism employed
by the firm.
3.3.5 Skewness Based Measure of AC (ACSKEW)
ACskew is the third measure of AC employed for the investigation of relationship
understudy. It captures the difference between the skewness of operating cash flows
and earnings, following Beatty et al. (2008). At least three annual observations
are required to compute Skewness. When bad news is recognized in earnings more
quickly than good news, earnings will be negatively skewed in relative to the cash
flows of the firm. Greater the level of Skewness the more conservative a firm is.

Research Methodology 68
The reason for employing this measure is inherent in the idea of Beatty et al.
(2008). According to them the use of income escalators are associated with the
extent to which the firm will employ conservatism. Hence, the skewess or oprating
cash flows and earnings can be used to guage conservatism.
3.3.6 Composite Measure of AC of a Firm (ACCOMP)
ACcomp is the fourth measure of AC employed for this investigation. Following
the argument set forth by Donovan et al. (2015) that there is a lack of consensus
in the empirical literature especially with reference to the measure of conditional
conservatism, this study first employs specific conservatism measures and then
develops a composite measure to capture conditional conservatism. This composite
measure is developed by calculating the weighted average of all the measures. The
weights are being assigned by principal component analysis. The reson for using
principal component analysis is rooted in the fact that it is considered as one
of the tools used to reduce the multidimensional data to lower dimensions while
keeping most of the information that the data represents. The composite measure
is estimated as follows:
ACcompi,t = σ(w1ACacci,t +w2ACcici,t +w3ACciei,t +w4ACsoei,t +w1ACskewi,t )
A high value of all these measures depict more conservatism. The weights that are
being assigned to each reported measure and calculated by employing principal
component analysis are given in Table 3.1.
3.3.7 Corporate Governance Mechanisms
Ten CG mechanisms are employed as IVs in this study. These are Board size
(BSi,t), Board Independence (BIi,t), Board Activity (BAi,t), Gender Diversity on
board (GDi,t), CEO Duality (CEODi,t), CEO Turnover (CEOTi,t), Institutional
Ownership (INSOi,t), Managerial Ownership (MANOi,t), Audit Committee In-
dependence (ACIi,t) and Type of the Auditor (TAUDi,t). These variables are

Research Methodology 69
Table 3.1: Weights of AC Measures
Bangladesh India Pakistan
Variables Weightss Weights Weights
ACacc 0.566 -0.089 0.684
ACcic 0.619 0.692 -0.169
ACcie 0.535 0.704 -0.069
ACsoe 0.091 0.124 0.684
Acskew -0.021 0.015 0.169
measured by using the proxies employed by Nasr and Ntim (2017), Mohammed
et al. (2017), Huang and Wang (2017), Elshandidy and Hassanein (2015), Ahmed
and Henry (2012), Lim (2011), Chi et al. (2009) and Ahmed and Duellman (2007).
Board Size is captured as the number of members on the board of the firm. The
Board Independence is captured by calculating a ratio of Independent directors to
total directors in the board. The Board activity is calculated by the percentage
of attendance of board members in the board meetings. The gender diversity is
calculated by using a ratio of number of female members on the board to total
board members. CEO turnover is represented by a dummy variable that takes the
value of 1 if the turnover takes place and 0 otherwise. A dummy variable is used
to capture CEO Duality. This dummy takes the value of, 1 if CEO and Chairman
are same and, 0 otherwise.
The institutional ownership is the ratio of number of shares held by the institutions
to total number of shares of a firm. The managerial ownership is captured by using
a ratio. This ratio is estimated by dividing the number of shares held by directors
on the board to total number of firms shares. The audit committee independence
is also captured by calculating a ratio of number of independent directors on the
audit committee to total number of audit committee members. At last the type
of auditor is also captured by Dummy that takes the value of, 1 if the external
auditor is among the Big Four and, 0 otherwise. All of these proxies are also
employed by Nasr and Ntim (2017), Mohammed et al. (2017), Huang and Wang
(2017), Elshandidy and Hassanein (2015), Ahmed and Henry (2012), Lim (2011),
Chi et al. (2009) and Ahmed and Duellman (2007).

Research Methodology 70
3.3.8 Composite Measure of Firm Governance
The composite score of firm governance is also employed as IV. The development
of CG Index or composite score is a significant feature of this study. Most of the
studies conducted in this regard developed the index or scores to capture CG. As
mentioned earlier these measures have two problems. First is that most of the
measures are developed by taking the weighted average of different CG indicators.
The problem is not with the method but with the assignment of weights. Mostly
the weights are assigned by using the subjective criteria. These criteria include
the judgment of a financial expert, an old board member, experienced broker or a
regulatory authority official. Second problem is with the selection of CG indicators
that are to be made the part of the index or score. Till date the issue of which
CG indicator should be made the part of the index is addressed by the will of the
researcher as most of the studies take into account only a limited number of CG
indicators. This study is an attempt to address this problem. The CG indicators
employed in this study have been derived from OECD Principles that act as the
basic framework for providing guidelines to CG code setters. The weighted average
of these indicators is used to capture the effect of CG but the weights are assigned
by using principal component analysis. The CG index is developed as follows:
CSFGi,t = Σ(w1ACIi,t +w2BAi,t +w3BIi,t +w4BSi,t +w5CEODi,t +w6CEOTi,t
+ w7GDBi,t +w8INSOi,t +w9MANOi,t +w10TAUDi,t )
The weights in the above equation are calculated by employing principal compo-
nent analysis and are presented in Table 3.2.
3.3.9 Disclosure Quality
Following Cheung et al. (2010), we develop a disclosure index and use it as a proxy
for disclosure quality. The maximum score that a company can obtained on this
index is 1. The score estimation is divided into five aspects which are combined
to make an aggregate score for each company. These aspects are presented in
appendix.

Research Methodology 71
Table 3.2: Weights of CG Mechanisms
Bangladesh India Pakistan
Variables Weightss Weights Weights
ACI -0.085 0.587 -0.135
BA -0.119 0.186 0.275
BI 0.498 0.533 0.411
BS 0.083 -0.211 0.459
CEOD 0.316 0.028 -0.529
CEOT 0.154 0.443 -0.005
GDB 0.154 0.451 0.188
INSO 0.172 0.041 0.180
MANO -0.393 0.094 0.094
TAUD 0.624 0.412 0.412
3.3.10 Control Variables
Four control variables are employed in this study. These include Firm Size (FSi,t),
Growth in Sales (GROSi,t), Leverage (LEVi,t) and Profitability (PROFi,t). The
firm size is calculated by taking natural logarithm of total assets. The growth in
sales is measured by estimating sales growth. The leverage is calculated by divid-
ing total debt by total equity of the firm. Last but not the least the profitability
is measured by calculating Return on Assets of the firm. Ren (2014) and Yunos
(2011) are of the view that Return on Assets is a more appropriate measure of
proftability and this is the reason that this proxy is employed. Most of these vari-
ables are measured in the same manner as measured by many studies mentioned
earlier who examine similar relationships.
3.4 Method
3.4.1 Panel Data Analysis
This study is an attempt to investigate the extant of relationship therefore regres-
sion analysis is employed. However the nature of the data supports the use of

Research Methodology 72
panel data regression as the method for estimating the existence of relationship
understudy. It is not unique to say that panel data analysis is a method that has
produced propounding results in the studies conducted by many social scientists
across the globe.
One of the many reasons for this profound significance is the ability of this esti-
mation procedure in taking into account the data involving different cross sections
as well as time periods. The panel data consists of a set of different time series for
each cross section element present in the data. Ahmed and Duellman (2007) and
Watt in 2007, Ming and Gee (2002), Yunos (2011) are a few researchers who have
employed Panel data methodology for the purpose of similar analyses.
One of the motivating factors to employ panel data is hidden in its ability to
account for both subject as well as time invariant variables in it. Besides this
another reason that persuades the researches to go for using panel data is its abil-
ity to handle the problem of omitted variables Wooldridge (2002). The simple
OLS regression presumes that the firms that are made the part of the sample
are homogenous in nature so it does not address the heterogeneity involved. This
problem could only be solved by employing panel or pooled regression. A support-
ing argument is set forth by Jager (2008). He empirically proves that the results
estimated by employing simple OLS and Panel regression on the same data set
yield significantly different results. Hence concluding that if a researcher whose
data nature supports the employment of panel regression if go for employing sim-
ple OLS is at the losing end since this leads to making false claims. Panel data
observations cannot presume to be independently distributed across time. The
reason is the existence of such factors that do not change over time. So, it is clear
that a simple regression that assumes homogeneity if employed on panel data leads
to misleading conclusions (Wooldridge, 2002).
The panel data regression models are classified into common effect models, fixed
effect models and random effect models. In case of common effect model a single
intercept is estimated for all cross sections. One can argue that having the constant
intercept means that there is no distinction between different cross sections. It is
interesting to note that such a type of estimation is helpful in the case if the data

Research Methodology 73
set has homogeneity in it (Wooldridge, 2002). In case of fixed effect model the
intercept is group specific. It means that this model sets forth different intercepts
for each group. Least squares dummy variable is the name that is also sometimes
granted for the estimator of this model. This name is not unique as this model
offers a dummy variable for each group. The selection of the model requires an F
test. In case of F test the null hypothesis that all the intercepts are same is tested.
If the F estimates is greater than F critical, the null hypothesis is rejected. An
important characteristic of this type of model is its ability to capture the effects
that are specific and do not change over time. It means that if there is a panel
of firms, this model accounts for things like operating income, expenditures etc.
that change with each firm and not over time.
One of the limitations associated with this model is set forth by Wooldridge (2002).
He argues that fixed effect model is impractical in case if there are many cross sec-
tions involved. Later on Allison (2009) set forth his argument that it sometimes
becomes difficult for the available accounting software to properly estimate this
model, thus posing an estimation limitation. The precedence being given to em-
ploying random effects model instead of fixed effects model is because of the fact
that the former model offers an intercept that is not fixed for each groups instead
it is a random number. There are two advantages of employing this model. The
first one is that this method involves estimation of fewer parameters as compared
to fixed model. The second advantage of using this model is its ability to allow
the inclusion of dummies.
One of the limitations of employing this model is the creation of assumptions
regarding the distribution of random component. In order to understand the
difference between fixed and random effect models consider the example of different
firms that are part of the data set. In former case it is presumed that the firm varies
in its intercept whereas in later case it is presumed that each firm varies in its error
term. In order to make a choice that which model should be employed out of fixed
or random models, the Hausman Test is employed. As stated by Greene (2008)
the distinction between fixed and random effect model is that whether the error
term is correlated with independent variables or not. In case of Hausman Test the

Research Methodology 74
null hypothesis that unobserved effect is correlated with independent variables is
tested against the alternative that there does not exist any such correlation. The
Hausman test is then run and the p-value is estimated. If the p-value is significant
than the null hypothesis stating correlation is rejected indicating that fixed effect
model should be employed.
3.4.2 Diagnostic Tests
Before proceeding to the estimation stage some diagnostic tests are performed.
These tests include examining the normality, existence of multicolinearity, auto-
correlation, cross sectional dependence and heteroskedasticity. Skewness, kurtosis
and jarque bera are among the common tests for normality. However a few econo-
metricians have ruled out these techniques to be sufficient especially in case of large
data sets like the one employed in this study. The answer to these critics lies in
the development of a normal probability distribution plot. To check the normality
of the data skewness, kurtosis and jarque bera are estimated along side the normal
probability plot. To check the exitance of multicolinearity in our three data sets,
Pearson correlations are estimated. To test the existence of cross sectional depen-
dence also known as contemporaneous correlation for panel data are employed.
These include Breusch-Pagan LM test, Pesaran scaled LM test, bias-corrected
scaled LM test and Pesaran CD test. Baltagi (2008) argue that the presence of
heteroskedasticity could result in consistent but inefficient estimates. The existing
study employs modified Wald statistic by using relevant syntax in STATA. Lastly
to check the existence of serial correlation also known as autocorrelation relevant
syntax in STATA is employed.

Chapter 4
Results And Discussion
This chapter encompasses two parts. The first portion presents the results of
econometric techniques employed for three countries separately. The sections than
follow are of the discussion of these results again specified by country. Afterwards
separate sections are added under each country that entails summary of the ad-
ditional analyses performed. The detailed results and discussion of additional
analyses are however presented in appendices.
4.1 Results of Bangladesh
The following section presents descriptive statistics, correlation matrix as well as
multivariate regression analyses for Bangladesh.
4.1.1 Descriptive Statistics
Table 4.1 reports descriptive statistics for a sample of 100 companies from the first
data set i.e. Bangladesh and comprising a total of 700 observations.
It is evident from table 4.1 that the mean ACCOMP is -1.030 which is far less than
the values reported by Nasr and Ntim (2017), Mohammed et al. (2017), Caskey
and Laux (2017), Huang and Wang (2017), Elshandidy and Hassanein (2015),
Ren (2014), Yunos (2011), Krishnan and Visvanathan (2008) and Ahmed and
75

Results and Discussions 76
Table 4.1: Descriptive Statistics
Variables Mean Maximum Minimum Std. dev
ACACC 0.046 1.701 -1.589 0.601
ACCIC -1.871 0.698 -4.518 0.936
ACCIE -0.005 2.059 -2.098 0.759
ACSOE -0.023 2.065 -2.138 0.714
ACSKEW 0.020 1.221 -1.122 0.452
ACCOMP -1.030 1.460 -3.782 0.931
ACI 0.377 0.967 0.000 0.227
BA 0.696 1.000 0.155 0.199
BI 0.242 1.000 0.000 0.157
BS 7.613 11.000 5.000 1.740
CEOD 0.181 1.000 0.000 0.355
CEOT 0.097 1.000 0.000 0.277
DQ 0.497 0.840 0.165 0.124
GDB 0.117 0.600 0.000 0.122
INSO 0.187 0.750 0.000 0.134
MANO 0.260 0.690 0.000 0.175
TAUD 0.234 1.000 0.000 0.401
CSFG 0.804 1.705 0.177 0.358
FS 3.305 5.131 1.724 0.654
GROS 0.069 0.369 -0.228 0.120
LEV 0.604 1.608 0.001 0.340
PROF 0.064 0.213 -0.086 0.056
ACACC = Accruals based first measure of AC, ACCIC = Accruals based second measure ofAC, ACCIE = Earnings based measure of AC, ACSOE = Sensitivity of Earnings to Bad Newsrelative to Sensitivity of Earnings to Good News, ACSKEW = Skewness based measure of AC,ACCOMP = Composite measure of AC of a firm, ACI = Audit Committee Independence, BA= Board Activity, BI = Board Independence, BS = Board Size, CEOD = CEO Duality, CEOT= CEO Turnover, DQ = Disclosure Quality, GDB = Gender Diversity on Board , INSO =Institutional Shareholding , MANO = Managerial Shareholding, TAUD = Type of the Auditor, CSFG = Composite Score for Firms Governance, FS = Firm Size, GROS = Sales Growth,LEV = Leverage, PROF = Profitability
Duellman (2007). Ahmed and Duellman (2007) and Krishnan and Visvanathan
(2008) report a mean value of 0.010 for US market where as Yunos (2011) and Ren
(2014) present the mean values of accrual based conservatism measures of -0.006
and -0.014 for Malaysian and Chinese markets respectively. It may be inferred

Results and Discussions 77
that the firms listed in Bangladesh employ less conservatism as compared to the
firms listed in US, China and Malaysia. Nasr and Ntim (2017) report the value of
conservatism to be -0.018 in case of Egypt.
The mean values of ACACC, ACCIC, ACCIE, ACSKEW and ACSOE are 0.046,
-1.871, -0.005, 0.020 and -0.023 respectively. Again by looking at most of these
values, it is clear that firms in Bangladesh employ less conservatism. However,
some of the means are more than that of US, China and Malaysia. Because of
the confusion that might arise as a consequence of estimation of various measures,
a composite measure is developed and by evaluating its mean, the less level of
conservatism employed by non-financial firms listed in Bangladesh is evident.
The mean audit committee independence is 0.377 meaning that 37 percent of
the audit committee is composed of independent directors. The results are far
less than that are reported by Mohammed et al. (2017), Ren (2014) and Yunos
(2011). Mohammed et al. (2017) and Yunos (2011) report that 70 percent of the
audit committee is composed of independent members in case of firms listed in
Malaysia.
The mean board activity is 0.696 meaning that 69 percent of the meetings are
attended by at least 80 percent of the board members. This value is similar to
many reported values. For example, Lim (2011) and Chi et al. (2009) also report
approximately similar values.
The mean value of 0.242 represents that 24 percent of the board on average is
comprised of independent directors. This value is far less than that is reported
by Nasr and Ntim (2017), Mohammed et al. (2017), Ren (2014), Elshandidy and
Hassanein (2015), Ahmed and Henry (2012), Yunos (2011),Lim (2011) while ex-
amining various developed and developing markets.
The average board size found is eight. This number is in line with many stud-
ies conducted in developing markets for example by Nasr and Ntim (2017), Mo-
hammed et al. (2017), Rahman and Ali (2006) and Haniffa and Hudaib (2006)
who report similar values while analyzing developing economies.

Results and Discussions 78
It is found that approximately 18 percent of the board are those where the respon-
sibilities of CEO and the office of the chairman are held by same person. This
number is also fairly high than 4.8 percent as reported by Mohammed et al. (2017)
and Yunos (2011) for Malaysian firms.
The average of CEOT is 0.09 and of GDB is 0.117. The later shows that on
average only 11.7 percent of the board is comprised of female directors. This value
is also less than the values of gender diversity on board as reported by Boussaid
et al. (2015) and Huang and Wang (2017). They both report a female presence of
around twenty percent in the economies they examined.
The institutional ownership and managerial ownership on average is 18 percent
and 26 percent respectively. This shareholding patter implies that the ownership
is dispersed as stated by Claessens et al. (1999) that the shareholding around
20 percent can be regarded as a symbol of dispersed ownership as is the case in
Bangladesh.
The values of institutional and managerial ownership are very much similar to
that are reported by Nasr and Ntim (2017), Mohammed et al. (2017) and some
other researchers who also examine developing or emerging economies.
About 23.4 percent of the sample is found to be audited by big four auditors. This
number is less than that is reported by Mohammed et al. (2017), Ren (2014), Yunos
(2011) and Yatim et al. (2006) and for some emerging economies like Malaysian
and some developed economies like China.
The mean of the composite measure for firm governance is 0.804. These values
are also different from those reported by Mohammed et al. (2017), Ren (2014)
and Yunos (2011). The reason is that they have mostly examined the developed
economies.
4.1.2 Correlation Analysis
Table 4.2 presents the correlation matrix and is evident that there does not exist
any problem of multicolinearity between the explanatory variables.

Resu
ltsan
dD
iscussion
s79
Table 4.2: Correlation Analysis
Variables 1 2 3 4 5 6 7 8 9 10 11 12 13 14 15
ACI 1
BA 0.025 1
BI 0.051 0.012 1
BS -0.068 0.065 0.045 1
CEOD 0.135 0.043 -0.014 -0.160 1
CEOT -0.031 0.001 0.039 0.041 -0.050 1
DQ 0.056 -0.049 -0.486 -0.033 0.053 -0.059 1
FS 0.017 -0.020 0.046 0.173 -0.139 -0.026 -0.011 1
GDB 0.105 -0.043 0.335 0.003 0.046 -0.031 0.661 0.028 1
GROS 0.063 -0.034 0.035 -0.057 0.124 -0.021 0.096 -0.001 0.134 1
INSO 0.026 -0.028 0.080 -0.120 0.040 0.064 0.050 -0.132 0.123 -0.051 1
LEV 0.006 0.169 -0.136 -0.004 0.150 0.008 -0.017 -0.037 -0.135 0.017 0.046 1
MANO 0.088 0.105 -0.028 -0.030 0.256 -0.103 0.275 -0.096 0.272 0.002 -0.017 -0.078 1
PROF 0.039 -0.045 -0.090 -0.130 0.089 -0.014 0.045 0.108 -0.029 0.177 0.031 0.040 0.042 1
TAUD -0.034 -0.055 0.477 -0.008 0.177 0.051 -0.291 -0.017 0.096 -0.008 0.126 -0.104 -0.333 -0.005 1

Resu
ltsan
dD
iscussion
s80
Table 4.3: Results of AC and CG mechanisms
ACACC ACCIC ACCIE ACSKEW ACSOE ACCOMP
Variables Coeff t- Stat Coeff t- Stat Coeff t- Stat Coeff t- Stat Coeff t- Stat Coeff t- Stat
Constant 0.842 0.863 -1.641 -2.521** 0.428 0.75 0.005 0.011 -0.864 -0.73 0.117 0.116
ACI 0.191 1.791* 0.101 1.021 -0.124 -1.617 0.023 0.317 0.039 0.247 0.107 1.238
BA 0.047 0.217 -0.142 -0.69 0.17 1.215 0.003 0.017 -0.1 -0.296 0.049 0.216
BI -0.217 -0.918 -0.312 -1.188 -0.142 -0.542 -0.14 -0.498 -0.447 -1.158 -0.217 -0.728
BS 0.061 1.727* -0.012 -0.352 -0.036 -0.974 0.034 1.318 -0.032 -0.493 0.023 0.519
CEOD 0.235 2.627** 0.261 2.702*** 0.066 0.58 -0.052 -0.951 0.12 0.97 0.249 2.001**
CEOT -0.022 -0.311 0.013 0.155 -0.061 -0.773 0.145 3.205*** -0.199 -1.52 0.059 0.649
GDB 0.029 0.049 1.159 1.678* 0.804 2.095** -0.616 -1.394 0.577 0.622 0.656 0.859
INSO 0.281 0.611 1.677 6.998*** 0.245 1.491 0.509 1.679* -0.121 -0.332 1.239 3.569***
MANO 0.801 1.18 0.825 1.624 -0.826 -1.132 0.818 1.152 1.25 1.089 0.372 0.458
TAUD -0.035 -0.233 0.139 1.701* 0.178 1.545 -0.051 -0.513 -0.224 -1.212 0.218 1.212
FS -0.46 -1.680* -0.169 -0.9 -0.037 -0.274 -0.131 -1.046 0.202 0.662 -0.479 -1.771*
GROS 0.174 0.658 -0.054 -0.348 -0.103 -0.49 -0.157 -1.187 -0.048 -0.153 0.012 0.055
LEV -0.054 -0.587 -0.134 -1.488 -0.072 -0.851 -0.031 -0.491 0.263 1.722* 0.153 2.277**
PROF -1.119 -1.508 -1.672 -2.502** 0.05 0.069 0.242 0.556 1.588 2.114** 2.138 4.035***
Adj R2 0.439 0.731 0.646 0.442 0.044 0.641
F-Statistic 5.839*** 17.832*** 12.293*** 5.900*** 1.287*** 12.046***
*,**,*** = statistically significant at less than 0.10, 0.05 and 0.01ACACC = Accruals based first measure of AC,ACCIC = Accruals based second measure of AC, ACCIE = Earnings based measure of AC, ACSKEW =
Skewness based measure of AC, ACSOE = Sensitivity of Earnings to Bad News relative to Sensitivity of Earnings to Good News, ACCOMP = Compositemeasure of AC of a firm, ACI = Audit Committee Independence, BA = Board Activity, BI = Board Independence, BS = Board Size, CEOD = CEO Duality,CEOT = CEO Turnover, GDB = Gender Diversity on Board, INSO = Institutional Shareholding, MANO = Managerial Shareholding, TAUD = Type of theAuditor, FS = Firm Size, GROS = Sales Growth, LEV = Leverage, PROF = Profitability

Results and Discussions 81
4.1.3 Diagnostic Tests
The estimates of normality tests and normal probability plots for Bangladeshs data
set indicate slight deviations from normality. This slight deviation is negligible
and may not distort the results of this study as Haier et al. (2006) state that if
the data sets are large like the ones considered in this study, slight deviation
may not distort the results. The correlation matrix show no evidence of the
existence of the multicolinearity problem in the data.The results of Breusch-Pagan
LM test, Pesaran scaled LM test, bias-corrected scaled LM test and Pesaran CD
test show the presence of cross sectional dependence. The test results of modified
Wald statistic confirm the presence of heteroskedasticity. The test results for the
detection of autocorrelation show its existence. The literature also supports the
employment of the used tests as appropriate procedures to check various issues
related to data.
In a nut shell, the diagnostic tests detect the presence of cross sectional depen-
dence, heteroskedasticity and serial correlation in all the models estimated. In
order to produce robust standard errors the contemporaneous correlation and het-
eroskedasticity are corrected by employing cross-section SUR(PCSE) coefficient
covariance method. Following Abbott et al. (2007) and Yunos (2011), this study
employs firm fixed effects models to produce estimators that are robust to cross
sectional dependence and heteroskedasticity.
4.1.4 AC and CG
The first two columns of Table 4.3 shows the results of fixed effect regression for
ACACC with CG mechanisms. The adjusted R squared is 0.439 meaning that
43.9 percent of the variation in dependent variable is because of the considered
independent variables. The F-statistic is also significant meaning that the model
is a good fit. Out of the ten considered CG variables only ACI, BS and CEOD
are significant with sign of ACI that is hypothesized.
The next two columns show the results of fixed effect regression for ACCIC with
CG mechanisms. The adjusted R squared is 0.731 meaning that 73.1 percent of the

Results and Discussions 82
variation in dependent variable is because of the considered independent variables.
The F-statistic is also significant meaning that the model is a good fit. Out of the
ten considered CG variables only CEOD, GDB, INSO and TAUD are significant
with signs of GDB, INSO and TAUD that are hypothesized.
The next two columns show the results of fixed effect regression for ACCIE with
CG mechanisms. The adjusted R squared is 0.646 meaning that 64.6 percent
of the variation in dependent variable is because of the considered independent
variables. The F-statistic is also significant meaning that the model is a good fit.
Out of the ten considered CG variables only GDB is significant with sign that is
hypothesized.
The next two columns show the results of fixed effect regression for ACSKEW
with CG mechanisms. The adjusted R squared is 0.442 meaning that 44.2 percent
of the variation in dependent variable is because of the considered independent
variables. The F-statistic is also significant meaning that the model is a good fit.
Out of the ten considered CG variables only CEOT and INSO are significant with
signs that are hypothesized.
The next two columns show the results of fixed effect regression for ACSOE with
CG mechanisms. The adjusted R squared is 0.318 meaning that 31.8 percent
of the variation in dependent variable is because of the considered independent
variables. The F-statistic is also significant meaning that the model is a good fit.
Out of the ten considered CG variables only ACI, BA, CEOD, INSO and TAUD
are significant with signs of BA, CEOD, INSO and TAUD that are hypothesized.
The last two columns of Table 4.3 show the results of fixed effect regression for
ACCOMP with CG mechanisms. The adjusted R squared is 0.642 meaning that
64.2 percent of the variation in dependent variable is because of the considered
independent variables. Since the dependent variable is a composite measure of AC,
it can be stated that the overall level of conservatism can be adequately explained
by the considered independent variables.
The F-statistic is also significant meaning that the model is a good fit. Out of the
ten considered CG variables only CEOD and INSO are significant with signs of
INSO that are hypothesized.

Resu
ltsan
dD
iscussion
s83
Table 4.4: Results of ACACC, CSFG and DQ
ACACC ACCIC ACCIE ACSKEW ACSOE ACCOMPVariables Coeff t- Stat Coeff t- Stat Coeff t- Stat Coeff t- Stat Coeff t- Stat Coeff t- StatStep 1Constant 1.536 1.879* -2.334 -3.250*** -0.234 -0.412 0.077 0.125 -0.684 -0.687 -0.472 -0.552CSFG 0.188 1.042 0.385 2.538** 0.169 1.038 0.048 0.372 -0.279 -1.27 0.495 2.268**DQ 0.424 0.742 1.289 2.476** 0.768 1.297 -0.055 -0.115 0.847 1.173 0.982 1.318FS -0.512 -1.949* -0.005 -0.024 -0.012 -0.08 -0.023 -0.144 0.124 0.421 -0.355 -1.374GROS 0.227 0.804 -0.058 -0.343 -0.081 -0.394 -0.222 -1.642* 0.036 0.124 0.021 0.084LEV -0.005 -0.05 -0.061 -0.627 -0.073 -1.046 -0.023 -0.387 0.289 1.988** 0.172 2.585***PROF -0.945 -1.308 -1.436 -2.316** 0.03 0.042 0.366 0.867 1.586 2.157** 1.901 3.765***
Adj R2 0.426 0.71 0.645 0.421 0.046 0.632F-Statistic 5.946*** 17.306*** 13.122*** 5.845*** 1.319*** 12.429***Step 2Constant -3.757 -4.711*** -1.897 -2.216**CSFG 1.933 3.581*** 2.044 2.901***DQ 7.132 3.755*** 6.826 2.624***CSFGXDQ -6.059 -3.576*** -6.062 -2.702***FS -0.032 -0.169 -0.384 -1.476GROS -0.071 -0.444 0.005 0.025LEV -0.069 -0.717 0.171 2.489**PROF -1.553 -2.441** 2.019 3.878***
Adj R2 0.716 0.637F-Statistic 17.642*** 12.622***
*,**,*** = statistically significant at less than 0.10, 0.05 and 0.01ACACC = Accruals based first measure of AC,ACCIC = Accruals based second measure of AC, ACCIE = Earnings based measure of AC, ACSKEW =
Skewness based measure of AC, ACSOE = Sensitivity of Earnings to Bad News relative to Sensitivity of Earnings to Good News, ACCOMP = Compositemeasure of AC of a firm, DQ = Disclosure Quality, CSFG = Composite Score of Firm Governance, FS = Firm Size, GROS = Sales Growth, LEV =Leverage, PROF = Profitability

Results and Discussions 84
4.1.5 AC, CSFG and DQ (as Moderator)
The first two columns of Table 4.4 shows the results of fixed effect regression
for ACACC and DQ with CSFG. The adjusted R squared is 0.436 meaning that
43.6 percent of the variation in dependent variable is because of the considered
independent variables. The F-statistic is also significant meaning that the model
is a good fit. The CSFG is insignificant with sign that is hypothesized so step 2
is not estimated.
The next two columns shows the results of fixed effect regression for ACCIC and
DQ with CSFG. The adjusted R squared is 0.707 meaning that 70.7 percent of the
variation in dependent variable is because of the considered independent variables.
The F-statistic is also significant meaning that the model is a good fit. The
CSFG is significant with sign that is hypothesized so step 2 is estimated. This
column also shows the results of fixed effect regression for ACACC and CSFG with
moderating role of DQ. The adjusted R squared is 0.709 meaning that 70.9 percent
of the variation in dependent variable is because of the considered independent
variables. The F-statistic is also significant meaning that the model is a good
fit. The CSFGXDQ is significant with sign that is hypothesized. The next two
columns shows the results of fixed effect regression for ACCIE and DQ with CSFG.
The adjusted R squared is 0.645 meaning that 64.5 percent of the variation in
dependent variable is because of the considered independent variables. The F-
statistic is also significant meaning that the model is a good fit. The CSFG is
insignificant with sign that is hypothesized so step 2 is not estimated.
The next two columns shows the results of fixed effect regression for ACSKEW
and DQ with CSFG. The adjusted R squared is 0.421 meaning that 42.1 percent
of the variation in dependent variable is because of the considered independent
variables. The F-statistic is also significant meaning that the model is a good fit.
The CSFG is insignificant with sign that is hypothesized so step 2 is not estimated.
The next two columns shows the results of fixed effect regression for ACSKEW and
DQ with CSFG. The adjusted R squared is 0.048 meaning that only 4.8 percent
of the variation in dependent variable is because of the considered independent
variables. The F-statistic is also significant meaning that the model is a good

Results and Discussions 85
fit. The CSFG is insignificant with sign that is hypothesized so step 2 is not
estimated. The last two columns of the Table 4.4 shows the results of fixed effect
regression for ACCOMP and DQ with CSFG. The adjusted R squared is 0.628
meaning that 62.8 percent of the variation in dependent variable is because of the
considered independent variables. The F-statistic is also significant meaning that
the model is a good fit. The CSFG is significant with sign that is hypothesized so
step 2 is estimated. This column also shows the results of fixed effect regression
for ACCOMP and CSFG with moderating role of DQ. The adjusted R squared is
0.629 meaning that 62.9 percent of the variation in dependent variable is because of
the considered independent variables. The F-statistic is also significant meaning
that the model is a good fit. The CSFGXDQ is insignificant with sign that is
hypothesized.
4.2 Additional Analyses for Bangladesh
Two additional analyses are being performed for Bangladesh. The results along
with their discussion are presented in appendices. The first portion encompasses
the examination of impact of good, bad and moderate CG on AC. Panel regression
is employed as the econometric procedure. Each of the measures of AC are tested
to show the presence of any relationship with categorical forms of CG. Following
Shah (2007) the dummies are created for good, bad and moderate CG by employ-
ing normal curve methodology on composite score of firms governance for each
country separately. The second portion encompasses the results of impact of CG
on categorical form of AC. AC is converted into the form: highly conservative,
moderately conservative and less conservative.
It is interesting to note that in this case these three options follow a natural
ordering of the alternatives. The reason of this ordering is that it starts with
highest and goes to the weakest or lowest. Highly conservative measns that high
AC is employed and is clearly different than moderately conservative and this in
turn is different than less conservative. Hence, in this case ordered probit model
is employed to obtain appropriate estimates. Here it is important to understand

Results and Discussions 86
the difference between logit and probit models. Though both of the econometirc
procedures rarely produce different results, the probit model is considered to be
better while addressing the situations like that is at hand. The reason is that
probit model examines the variables through cummulative normal distribution
and since natural ordering of categories is involved, orderd probit is employed as
the estimation procedure. The results are presented in appendix.
4.3 Results of India
The following section presents descriptive statistics, correlation matrix as well as
regression analyses for India.
4.3.1 Descriptive Statistics
Table 4.5 reports descriptive statistics for the sample of 100 companies from India
and comprising a total of 700 observations.
It is evident from table 4.5 that the mean ACCOMP (composite measure of AC)
is -0.224 which is far less than the values reported by Nasr and Ntim (2017),
Mohammed et al. (2017), Caskey and Laux (2017), Huang and Wang (2017),
Elshandidy and Hassanein (2015), Ren (2014), Yunos (2011), Krishnan and Vis-
vanathan (2008) and Ahmed and Duellman (2007). Ahmed and Duellman (2007)
and Krishnan and Visvanathan (2008) report a mean value of 0.010 for US market
where as Yunos (2011) and Ren (2014) present the mean values of accrual based
conservatism measures of -0.006 and -0.014 for Malaysian and Chinese markets
respectively. It may be inferred that the firms listed in India employ less conser-
vatism as compared to the firms listed in US, China and Malaysia. Nasr and Ntim
(2017) report the value of conservatism to be -0.018 in case of Egypt.
The mean values of ACACC, ACCIC, ACCIE, ACSKEW and ACSOE are -0.128,
-0.338, 0.035, 0.124 and -2.095 respectively. Again by looking at most of these val-
ues, it is clear that firms in India employ less conservatism. However, some of the
means are more than that of US, China and Malaysia. Because of the confusion

Results and Discussions 87
Table 4.5: Descriptive Statistics
Variables Mean Maximum Minimum Std. dev
ACACC -0.128 1.256 -1.45 0.486
ACCIC -0.338 0.209 -0.854 0.211
ACCIE 0.035 2.061 -2.066 0.838
ACSOE -2.095 4.569 -6.969 1.795
ACSKEW 0.124 1.608 -1.474 0.596
ACCOMP -0.224 1.452 -1.721 0.583
ACI 0.361 0.800 0.000 0.153
BA 0.648 1.000 0.260 0.120
BI 0.458 0.864 0.121 0.118
BS 8.150 12.000 5.000 1.272
CEOD 0.396 1.000 0.000 0.489
CEOT 0.184 1.000 0.000 0.388
DQ 0.648 0.992 0.285 0.109
GDB 0.076 0.280 0.000 0.07
INSO 0.186 0.785 0.000 0.151
MANO 0.159 0.397 0.000 0.092
TAUD 0.631 1.000 0.000 0.483
CSFG 2.690 3.445 1.999 0.224
FS 3.965 7.045 2.017 1.055
GROS 0.268 33.388 -0.999 1.624
LEV 0.434 3.071 -0.3 0.307
PROF 0.102 0.574 -0.202 0.104ACACC = Accruals based first measure of AC, ACCIC = Accruals based second measure ofAC, ACCIE = Earnings based measure of AC, ACSOE = Sensitivity of Earnings to Bad Newsrelative to Sensitivity of Earnings to Good News, ACSKEW = Skewness based measure of AC,ACCOMP = Composite measure of AC of a firm, ACI = Audit Committee Independence, BA= Board Activity, BI = Board Independence, BS = Board Size, CEOD = CEO Duality, CEOT= CEO Turnover, DQ = Disclosure Quality, GDB = Gender Diversity on Board , INSO =Institutional Shareholding , MANO = Managerial Shareholding, TAUD = Type of the Auditor, CSFG = Composite Score for Firms Governance, FS = Firm Size, GROS = Sales Growth,LEV = Leverage, PROF = Profitability
that might arise as a consequence of estimation of various measures, a composite
measure is developed and by evaluating its mean, the less level of conservatism em-
ployed by non-financial firms listed in India is evident. The mean audit committee
independence is 0.361 meaning that 36 percent of the audit committee is composed
of independent directors. The results are far less than that are reported by Mo-
hammed et al. (2017), Ren (2014) and Yunos (2011). Mohammed et al. (2017)

Results and Discussions 88
and Yunos (2011) report that 70 percent of the audit committee is composed of
independent members in case of firms listed in Malaysia. The mean board activity
is 0.648 meaning that approximately 65 percent of the meetings are attended by
at least 80 percent of the board members. This value is similar to many reported
values. For example, Lim (2011) and Chi et al. (2009) also report approximately
similar values. The mean value of 0.458 represents that 46 percent of the board
on average is comprised of independent directors. This value is near to the value
that are reported by Nasr and Ntim (2017), Mohammed et al. (2017), Ren (2014),
Elshandidy and Hassanein (2015), Ahmed and Henry (2012), Yunos (2011), Lim
(2011) while examining various developed and developing markets. The average
board size found is eight. This number is in line with many studies conducted
in developing markets for example by Nasr and Ntim (2017), Mohammed et al.
(2017), Rahman and Ali (2006) and Haniffa and Hudaib (2006) who report similar
values while analyzing developing economies.
It is found that approximately 40 percent of the board are those where the re-
sponsibilities of CEO and the office of the chairman are held by same person.
This number is also fairly high than 4.8 percent as reported by Mohammed et al.
(2017) and Yunos (2011) for Malaysian firms. The average of CEOT is 0.184
and of GDB is 0.076. The later shows that on average only 7.6 percent of the
board is comprised of female directors. This value is also less than the values of
gender diversity on board as reported by Boussaid et al. (2015) and Huang and
Wang (2017). They both report a female presence of around twenty percent in the
economies they examined.
The institutional ownership and managerial ownership on average is 18 percent
and 16 percent respectively. This shareholding patter implies that the ownership
is dispersed as stated by Claessens et al. (1999) that the shareholding around 15
to 20 percent can be regarded as a symbol of dispersed ownership as is the case in
India. The values of institutional and managerial ownership are very much similar
to that are reported by Nasr and Ntim (2017), Mohammed et al. (2017) and some
other researchers who also examine developing or emerging economies. About 63.1
percent of the sample is found to be audited by big four auditors. This number

Results and Discussions 89
is in line with that are reported by Mohammed et al. (2017), Ren (2014), Yunos
(2011) and Yatim et al. (2006) for some emerging economies like Malaysian and
some developed economies like China. The mean of the composite measure for
firm governance is 2.690. This means that the CG stature is far better in India as
compared to many other South Asian economies.
4.3.2 Correlation Analysis
Table 4.6 presents the correlation matrix and is evident that there does not exist
any problem of multicolinearity between the explanatory variables.
4.3.3 Diagnostic Tests
The estimates of normality tests and normal probability plots for Indias data set
indicate slight deviations from normality. This slight deviation is negligible and
may not distort the results of this study as Haier et al. (2006) state that if the
data sets are large like the ones considered in this study, slight deviation may not
distort the results.
The correlation matrix show no evidence of the existence of the multicolinearity
problem in the data.The results of Breusch-Pagan LM test, Pesaran scaled LM
test, bias-corrected scaled LM test and Pesaran CD test show the presence of
cross sectional dependence. The test results of modified Wald statistic confirm the
presence of heteroskedasticity. The test results for the detection of autocorrelation
show its existence.
In a nut shell, the diagnostic tests detect the presence of cross sectional depen-
dence, heteroskedasticity and serial correlation in all the models estimated. In
order to produce robust standard errors the contemporaneous correlation and het-
eroskedasticity are corrected by employing cross-section SUR(PCSE) coefficient
covariance method. It is one of the methods presented in literature that can ad-
dress the issue at hand. Following Abbott et al. (2007) and Yunos (2011), this
study employs firm fixed effects models to produce estimators that are robust to
cross sectional dependence and heteroskedasticity.

Resu
ltsan
dD
iscussion
s90
Table 4.6: Correlation Analysis
Variables 1 2 3 4 5 6 7 8 9 10 11 12 13 14 15
ACI 1.000
BA 0.144 1.000
BI 0.447 0.113 1.000
BS 0.056 0.032 0.005 1.000
CEOD -0.097 -0.067 -0.150 -0.194 1.000
CEOT 0.023 -0.009 0.016 0.022 -0.038 1.000
DQ -0.035 0.014 -0.099 -0.081 0.030 -0.053 1.000
FS -0.073 0.044 -0.079 -0.017 0.090 -0.016 0.737 1.000
GDB 0.373 -0.009 0.197 -0.072 -0.022 -0.034 0.033 -0.023 1.000
GROS -0.017 -0.129 -0.040 -0.072 0.006 -0.064 -0.074 -0.039 0.079 1.000
INSO 0.079 -0.021 0.194 -0.093 -0.147 0.108 -0.075 -0.129 0.114 -0.059 1.000
LEV 0.012 0.068 -0.112 -0.008 -0.145 -0.043 0.364 0.293 -0.035 -0.011 -0.040 1.000
MANO -0.017 -0.033 0.008 -0.077 0.197 -0.098 -0.090 -0.081 0.254 0.062 -0.065 0.030 1.000
PROF -0.218 -0.066 0.012 0.016 0.066 0.080 -0.531 0.062 -0.151 0.064 0.005 -0.264 -0.036 1.000
TAUD 0.187 0.071 0.010 -0.136 0.067 -0.080 0.185 0.124 0.076 -0.039 -0.040 0.147 -0.014 -0.144 1.000

Resu
ltsan
dD
iscussion
s91
Table 4.7: Results of AC and CG mechanisms
ACACC ACCIC ACCIE ACSKEW ACSOE ACCOMP
Variables Coeff t- Stat Coeff t- Stat Coeff t- Stat Coeff t- Stat Coeff t- Stat Coeff t- Stat
Constant 1.126 2.748*** -0.351 -3.423*** -2.682 -3.254** -1.576 -2.071** -1.217 -0.382 -2.341 -3.722**
ACI 0.278 0.852 0.121 1.407 1.179 2.006** 0.661 1.959** -0.87 -1.015 0.99 2.418**
BA 0.178 0.538 0.06 1.13 0.711 1.977** 0.195 0.524 1.009 1.099 0.585 2.065**
BI 0.008 0.046 -0.12 -1.391 0.193 0.549 -0.106 -0.306 1.705 1.782* 0.072 0.254
BS -0.023 -1.024 -0.01 -1.384 0.021 0.576 -0.077 -2.345** -0.023 -0.216 -0.003 -0.103
CEOD 0.065 1.424 -0.003 -0.203 0.087 1.433 -0.078 -1.104 -0.046 -0.203 0.05 1.118
CEOT -0.006 -0.117 -0.001 -0.091 -0.025 -0.36 0.071 1.006 0.433 1.745* -0.003 -0.058
GDB 1.286 2.223** 0.323 2.642*** 0.743 1.045 0.255 0.284 0.791 0.285 0.795 1.463
INSO 0.087 0.333 0.105 2.470** 0.343 1.174 0.222 0.686 0.216 0.237 0.348 1.576
MANO 0.848 1.597 0.403 2.396** 0.1 0.144 0.546 0.802 0.108 0.045 0.441 0.933
TAUD 0.192 0.822 -0.099 -1.806* -0.249 -0.758 0.056 0.086 0.73 0.853 -0.224 -0.745
FS -0.409 -4.019*** 0.001 0.059 0.421 3.273** 0.45 2.553** -0.553 -0.814 0.342 3.254**
GROS 0.681 2.297** -0.187 -1.605* 0.551 1.672* -0.646 -1.426 1.874 1.397 0.222 0.786
LEV -0.005 -0.124 -0.009 -1.033 0.1 2.447** -0.072 -1.02 0.429 2.835*** 0.061 1.752*
PROF 0.055 1.121 0.002 0.18 0.221 4.483*** -0.006 -0.097 0.383 1.515 0.162 4.385***
Adj R2 0.43 0.664 0.691 0.093 0.213 0.611
F-Statistic 5.661*** 13.212*** 14.824*** 1.636*** 2.669*** 10.732***
*,**,*** = statistically significant at less than 0.10, 0.05 and 0.01ACACC = Accruals based first measure of AC,ACCIC = Accruals based second measure of AC, ACCIE = Earnings based measure of AC, ACSKEW =
Skewness based measure of AC, ACSOE = Sensitivity of Earnings to Bad News relative to Sensitivity of Earnings to Good News, ACCOMP = Compositemeasure of AC of a firm, ACI = Audit Committee Independence, BA = Board Activity, BI = Board Independence, BS = Board Size, CEOD = CEO Duality,CEOT = CEO Turnover, GDB = Gender Diversity on Board, INSO = Institutional Shareholding, MANO = Managerial Shareholding, TAUD = Type of theAuditor, FS = Firm Size, GROS = Sales Growth, LEV = Leverage, PROF = Profitability

Results and Discussions 92
4.3.4 AC and CG
The first two columns of Table 4.7 show the results of fixed effect regression for
ACACC with CG mechanisms. The adjusted R squared is 0.430 meaning that
43 percent of the variation in dependent variable is because of the considered
independent variables. The F-statistic is also significant meaning that the model
is a good fit. Out of the ten considered CG variables only GDB is significant with
sign similar to that is hypothesized. The next two columns show the results of
fixed effect regression for ACCIC with CG mechanisms. The adjusted R squared is
0.664 meaning that 66.4 percent of the variation in dependent variable is because
of the considered independent variables. The F-statistic is also significant meaning
that the model is a good fit. Out of the ten considered CG variables only GDB,
INSO, MANO and TAUD are significant with signs of GDB and INSO that are
hypothesized. The next two columns show the results of fixed effect regression
for ACCIE with CG mechanisms. The adjusted R squared is 0.691. Out of the
ten considered CG variables only ACI and BA are significant with signs that
are hypothesized. The next two columns show shows the results of fixed effect
regression for ACSKEW with CG mechanisms. The adjusted R squared is 0.093
meaning that 9.3 percent of the variation in dependent variable is because of the
considered independent variables. The F-statistic is also significant meaning that
the model is a good fit. Out of the ten considered CG variables only ACI and BS
are significant with signs that are hypothesized. The next two columns show the
results of fixed effect regression for ACSOEP with CG mechanisms. The adjusted
R squared is 0.213 meaning that 21.3 percent of the variation in dependent variable
is because of the considered independent variables. Out of the ten considered CG
variables only BI and CEOT are significant with signs that are hypothesized.
The last two columns of Table 4.7 shows the results of fixed effect regression for
ACCOMP with CG mechanisms. The adjusted R squared is 0.611 meaning that
61.1 percent of the variation in dependent variable is because of the considered
independent variables. The F-statistic is also significant meaning that the model is
a good fit. Out of the ten considered CG variables only ACI and BA are significant
with signs similar to that are hypothesized.

Resu
ltsan
dD
iscussion
s93
Table 4.8: Results of ACACC, CSFG and DQ
ACACC ACCIC ACCIE ACSKEW ACSOE ACCOMPVariables Coeff t- Stat Coeff t- Stat Coeff t- Stat Coeff t- Stat Coeff t- Stat Coeff t- StatStep 1Constant 1.48 3.351*** -0.505 -6.643*** -1.917 -3.209*** -2.009 -3.657*** -0.01 -0.003 -1.935 -4.061***CSFG 0.049 0.276 0.083 1.885* 0.403 1.485 0.471 1.884** 0.808 0.707 0.414 2.009**DQ 0.182 1.924** 0.12 2.412** 0.193 1.199 -0.128 -0.54 0.716 1.445 0.205 1.592FS -0.465 -4.077*** -0.021 -0.626 0.378 2.778*** 0.489 2.504** -0.867 -1.288 0.299 2.580**GROS 0.727 2.399** -0.17 -1.535 0.567 1.834** -0.624 -1.38 1.815 1.373 0.247 0.946LEV -0.028 -0.808 -0.013 -1.545 0.059 1.374 -0.077 -1.154 0.406 2.586** 0.028 0.789PROF 0.111 2.332** 0.043 2.389** 0.286 3.718*** -0.059 -0.567 0.656 2.124** 0.23 3.917***
Adj R2 0.427 0.661 0.683 0.094 0.212 0.601F-Statistic 5.958*** 13.968*** 15.352*** 1.690*** 2.795*** 11.013***Step 2Constant -0.491 -5.149*** -2.7 -4.159*** -2.163 -3.996***CSFG 0.06 0.549 1.545 2.318** 0.768 2.471**DQ 0.11 1.46 0.364 0.876 0.367 2.440**CSFGXDQ 0.015 0.215 -0.697 -1.654* -0.23 -1.677*FS -0.02 -0.611 0.473 2.395 0.294 2.554**GROS -0.171 -1.553 -0.577 -1.334 0.262 1.012LEV -0.013 -1.508 -0.07 -1.087 0.03 0.849PROF 0.043 2.376** -0.057 -0.535 0.231 3.954***
Adj R2 0.66 0.098 0.601F-Statistic 13.814*** 1.714*** 10.915***
*,**,*** = statistically significant at less than 0.10, 0.05 and 0.01ACACC = Accruals based first measure of AC,ACCIC = Accruals based second measure of AC, ACCIE = Earnings based measure of AC, ACSKEW =
Skewness based measure of AC, ACSOE = Sensitivity of Earnings to Bad News relative to Sensitivity of Earnings to Good News, ACCOMP = Compositemeasure of AC of a firm, DQ = Disclosure Quality, CSFG = Composite Score of Firm Governance, FS = Firm Size, GROS = Sales Growth, LEV =Leverage, PROF = Profitability

Results and Discussions 94
4.3.5 AC, CSFG and DQ (as Moderator)
The first wo columns of Table 4.8 show the results of fixed effect regression for
ACACC and CSFG with DQ as independent variable. The adjusted R squared is
0.427 meaning that 42.7 percent of the variation in dependent variable is because
of the considered independent variables. The F-statistic is also significant meaning
that the model is a good fit. The CSFG is insignificant with sign that is hypoth-
esized so step 2 is not eatimated. The next two columns show the results of fixed
effect regression for ACCIC and CSFG with DQ as independent variable. The
adjusted R squared is 0.661 meaning that 66.1 percent of the variation in depen-
dent variable is because of the considered independent variables. The F-statistic
is also significant meaning that the model is a good fit. The CSFG is significant
with sign that is hypothesized so step 2 is estimated. The same two columns show
the results of fixed effect regression for ACCIC and CSFG with moderating role
of DQ. The adjusted R squared is 0.660 meaning that 66 percent of the variation
in dependent variable is because of the considered independent variables. The F-
statistic is also significant meaning that the model is a good fit. The CSFGXDQ
is insignificant with sign similar to that is hypothesized so step 2 is not estimated.
The next two columns show the results of fixed effect regression for ACCIE and
CSFG with DQ as independent variable. The adjusted R squared is 0.683 meaning
that 68.3 percent of the variation in dependent variable is because of the considered
independent variables. The F-statistic is also significant meaning that the model
is a good fit. The CSFG is insignificant with sign that is hypothesized so step 2 is
not estimated. The next two columns show the results of fixed effect regression for
ACSKEW and CSFG with DQ as independent variable. The adjusted R squared
is 0.094 meaning that 9.4 percent of the variation in dependent variable is because
of the considered independent variables. The F-statistic is also significant meaning
that the model is a good fit. The CSFG is significant with sign that is hypothesized
so step 2 is estimated. The same two columns show the results of fixed effect
regression for ACSKEW and CSFG with moderating role of DQ. The adjusted R
squared is 0.098 meaning that 9.8 percent of the variation in dependent variable is
because of the considered independent variables. The F-statistic is also significant

Results and Discussions 95
meaning that the model is a good fit. The CSFGXDQ is significant with sign that
is hypothesized.
The next two columns show the results of fixed effect regression for ACSOE and
CSFG with DQ as independent variable. The adjusted R squared is 0.212 mean-
ing that only 21.2 percent of the variation in dependent variable is because of the
considered independent variables. The F-statistic is also significant meaning that
the model is a good fit. The CSFG is insignificant with sign that is hypothesized
so step 2 is not estimated. The next two columns show the results of fixed effect
regression for ACCOMP and CSFG with DQ as independent variable. The ad-
justed R squared is 0.601 meaning that 60.1 percent of the variation in dependent
variable is because of the considered independent variables. The F-statistic is also
significant meaning that the model is a good fit. The CSFG is significant with
sign that is hypothesized so step 2 is estimated. The same two columns show the
results of fixed effect regression for ACCOMP and CSFG with moderating role of
DQ. The adjusted R squared is 0.601 meaning that 60.1 percent of the variation
in dependent variable is because of the considered independent variables. The F-
statistic is also significant meaning that the model is a good fit. The CSFGXDQ
is significant with sign that is hypothesized.
4.4 Additional Analyses for India
Two additional analyses are being performed for India. The results along with
their discussion are presented in appendices. The first portion encompasses the
examination of impact of good, bad and moderate CG on AC. Panel regression is
employed as the econometric procedure. Each of the measures of AC are tested
to show the presence of any relationship with categorical forms of CG. Following
Shah (2007) the dummies are created for good, bad and moderate CG by employ-
ing normal curve methodology on composite score of firms governance for each
country separately. The second portion encompasses the results of impact of CG
on categorical form of AC. AC is converted into the form: highly conservative,
moderately conservative and less conservative. It is interesting to note that in this

Results and Discussions 96
case these three options follow a natural ordering of the alternatives. The reason of
this ordering is that it starts with highest and goes to the weakest or lowest. Highly
conservative measns that high AC is employed and is clearly different than mod-
erately conservative and this in turn is different than less conservative. Hence, in
this case ordered probit model is employed to obtain appropriate estimates. Here
it is important to understand the difference between logit and probit models. The
probit model is considered to be better while addressing the situations like that is
at hand becasue it examines the variables through cummulative normal distribu-
tion and since natural ordering of categories is involved, orderd probit is employed
as the estimation procedure. The results are presented in appendix.
4.5 Results of Pakistan
The following section presents descriptive statistics, correlation matrix as well as
regression analyses for Pakistan.
4.5.1 Descriptive Statistics
Table 4.9 reports descriptive statistics for the sample of 100 companies from Pak-
istan and comprising a total of 700 observations.
It is evident from table 4.9 that the mean ACCOMP (composite measure of AC)
is 0.169 which is far greater than the values reported by Nasr and Ntim (2017),
Mohammed et al. (2017), Caskey and Laux (2017), Huang and Wang (2017),
Elshandidy and Hassanein (2015), Ren (2014), Yunos (2011), Krishnan and Vis-
vanathan (2008) and Ahmed and Duellman (2007). Ahmed and Duellman (2007)
and Krishnan and Visvanathan (2008) report a mean value of 0.010 for US market
where as Yunos (2011) and Ren (2014) present the mean values of accrual based
conservatism measures of -0.006 and -0.014 for Malaysian and Chinese markets
respectively. It may be inferred that the firms listed in Pakistan employ more
conservatism as compared to the firms listed in US, China and Malaysia. Nasr
and Ntim (2017) report the value of conservatism to be -0.018 in case of Egypt.

Results and Discussions 97
Table 4.9: Descriptive Statistics
Variables Mean Maximum Minimum Std. dev
ACACC 0.058 1.243 -1.123 0.469
ACCIC -0.170 1.825 -2.092 0.714
ACCIE 0.080 2.149 -2.161 0.797
ACSOE 0.393 1.010 -0.794 0.445
ACSKEW 0.059 1.243 -1.123 0.470
ACCOMP 0.169 1.860 -1.638 0.0.686
ACI 0.320 0.822 0.056 0.181
BA 0.605 1.000 0.265 0.122
BI 0.667 0.929 0.125 0.185
BS 8.357 14.000 5.000 1.673
CEOD 0.236 1.000 0.000 0.425
CEOT 0.076 1.000 0.000 0.265
DQ 0.497 0.738 0.300 0.092
GDB 0.051 0.670 0.000 0.115
INSO 0.184 0.820 0.000 0.255
MANO 0.065 0.156 0.000 0.060
TAUD 0.496 1.000 0.000 0.500
CSFG 2.952 5.021 1.423 0.613
FS 3.013 4.111 0.693 0.643
GROS 0.065 0.921 -0.793 0.322
LEV 0.641 2.030 0.000 0.441
PROF 0.111 0.497 -0.290 0.103ACACC = Accruals based first measure of AC, ACCIC = Accruals based second measure ofAC, ACCIE = Earnings based measure of AC, ACSOE = Sensitivity of Earnings to Bad Newsrelative to Sensitivity of Earnings to Good News, ACSKEW = Skewness based measure of AC,ACCOMP = Composite measure of AC of a firm, ACI = Audit Committee Independence, BA= Board Activity, BI = Board Independence, BS = Board Size, CEOD = CEO Duality, CEOT= CEO Turnover, DQ = Disclosure Quality, GDB = Gender Diversity on Board , INSO =Institutional Shareholding , MANO = Managerial Shareholding, TAUD = Type of the Auditor, CSFG = Composite Score for Firms Governance, FS = Firm Size, GROS = Sales Growth,LEV = Leverage, PROF = Profitability
The mean values of ACACC, ACCIC, ACCIE, ACSKEW and ACSOE are 0.058,
-0.170, 0.080, 0.059 and 0.393 respectively. Again by looking at most of these val-
ues, it is clear that firms in Pakistan employ more conservatism. However, some of
the means are less than that of US, China and Malaysia. Because of the confusion
that might arise as a consequence of estimation of various measures, a composite

Results and Discussions 98
measure is developed and by evaluating its mean, the greater level of conservatism
employed by non-financial firms listed in Pakistan is evident. The mean audit
committee independence is 0.320 meaning that 32 percent of the audit commit-
tee is composed of independent directors. The results are far less than that are
reported by Mohammed et al. (2017), Ren (2014) and Yunos (2011). Mohammed
et al. (2017) and Yunos (2011) report that 70 percent of the audit committee is
composed of independent members in case of firms listed in Malaysia. The mean
board activity is 0.605 meaning that approximately 61 percent of the meetings
are attended by at least 80 percent of the board members. This value is similar
to many reported values. For example, Lim (2011) and Chi et al. (2009) also
report approximately similar values. The mean value of 0.667 represents that 67
percent of the board on average is comprised of independent directors. This value
is near to the value that are reported by Nasr and Ntim (2017), Mohammed et al.
(2017), Ren (2014), Elshandidy and Hassanein (2015), Ahmed and Henry (2012),
Yunos (2011), Lim (2011) while examining various developed and developing mar-
kets. The average board size found is eight. This number is in line with many
studies conducted in developing markets for example by Nasr and Ntim (2017),
Mohammed et al. (2017), Rahman and Ali (2006) and Haniffa and Hudaib (2006)
who report similar values while analyzing developing economies. It is found that
approximately 24 percent of the board are those where the responsibilities of CEO
and the office of the chairman are held by same person. This number is also fairly
high in comparison to what is reported by Mohammed et al. (2017) and Yunos
(2011) for Malaysian firms. The average of CEOT is 0.076 and of GDB is 0.051.
The later shows that on average only 5.1 percent of the board is comprised of
female directors. This value is also less than the values of gender diversity on
board as reported by Boussaid et al. (2015) and Huang and Wang (2017). They
both report a female presence of around twenty percent in the economies they
examined. The institutional ownership and managerial ownership on average is 18
percent and 7 percent respectively. This shareholding patter implies that the own-
ership is dispersed as stated by Claessens et al. (1999). The values of institutional
are very much similar to that are reported by Nasr and Ntim (2017), Mohammed

Results and Discussions 99
et al. (2017) and some other researchers who also examine developing or emerging
economies. About 50 percent of the sample is found to be audited by big four au-
ditors. This number is in line with that are reported by Mohammed et al. (2017),
Ren (2014), Yunos (2011) and Yatim et al. (2006) for some emerging economies
like Malaysian and some developed economies like China. The mean of the com-
posite measure for firm governance is 2.952. This means that the CG stature is
far better in Pakistan as compared to many other South Asian economies.
4.5.2 Correlation Analysis
Table 4.10 presents the correlation matrix and is evident that there does not exist
any problem of multicolinearity between the explanatory variables.
4.5.3 Diagnostic Tests
The estimates of normality tests and normal probability plots for Pakistans data
set indicate slight deviations from normality. This slight deviation is negligible
and may not distort the results of this study as Haier et al. (2006) state that if
the data sets are large like the ones considered in this study, slight deviation may
not distort the results. The correlation matrix show no evidence of the existence
of the multicolinearity problem in the data.The results of Breusch-Pagan LM test,
Pesaran scaled LM test, bias-corrected scaled LM test and Pesaran CD test show
the presence of cross sectional dependence. The test results of modified Wald
statistic confirm the presence of heteroskedasticity. The test results for the detec-
tion of autocorrelation show its existence. In a nut shell, the diagnostic tests detect
the presence of cross sectional dependence, heteroskedasticity and serial correla-
tion in all the models estimated. In order to produce robust standard errors the
contemporaneous correlation and heteroskedasticity are corrected by employing
cross-section SUR(PCSE) coefficient covariance method. Following Abbott et al.
(2007) and Yunos (2011), this study employs firm fixed effects models to produce
estimators that are robust to cross sectional dependence and heteroskedasticity.

Resu
ltsan
dD
iscussion
s100
Table 4.10: Correlation Analysis
Variables 1 2 3 4 5 6 7 8 9 10 11 12 13 14 15
ACI 1.000
BA 0.025 1.000
BI -0.030 0.098 1.000
BS -0.042 0.056 0.130 1.000
CEOD -0.038 -0.017 -0.286 -0.153 1.000
CEOT 0.001 -0.006 -0.076 0.055 -0.019 1.000
DQ 0.823 -0.040 -0.052 -0.237 0.056 -0.008 1.000
FS 0.032 0.110 0.155 0.045 0.023 0.044 -0.011 1.000
GDB 0.104 -0.026 -0.083 0.140 -0.055 -0.011 -0.027 -0.053 1.000
GROS -0.019 0.032 0.023 -0.080 -0.009 0.057 0.003 0.066 -0.013 1.000
INSO -0.040 -0.086 0.130 0.027 -0.178 0.001 -0.062 -0.145 0.096 -0.020 1.000
LEV 0.033 0.043 -0.057 0.023 0.014 0.015 0.075 -0.091 -0.081 -0.030 0.076 1.000
MANO 0.102 0.009 0.071 -0.001 -0.068 -0.014 0.051 -0.024 0.093 -0.027 -0.027 0.070 1.000
PROF 0.063 0.137 0.157 0.024 0.043 -0.023 0.054 0.056 -0.049 -0.007 0.020 0.156 0.015 1.000
TAUD -0.038 0.215 -0.194 -0.014 -0.071 0.081 0.117 0.080 -0.125 -0.108 -0.022 -0.049 -0.022 -0.049 1.000

Resu
ltsan
dD
iscussion
s101
Table 4.11: Results of AC and CG mechanisms
ACACC ACCIC ACCIE ACSKEW ACSOE ACCOMP
Variables Coeff t- Stat Coeff t- Stat Coeff t- Stat Coeff t- Stat Coeff t- Stat Coeff t- Stat
Constant 0.137 0.608 -0.422 -1.086 -0.178 -0.642 0.168 0.736 0.517 2.383** 0.379 1.266
ACI -0.054 -0.641 0.148 1.177 0.25 2.090** -0.065 -0.759 -0.102 -1.403 -0.14 -1.128
BA -0.415 -1.755* 0.45 1.455 -0.683 -2.147** -0.427 -1.787* -0.356 -1.714* -0.666 -2.076**
BI 0.172 1.761* 0.26 1.802* 0.101 0.6 0.154 1.541 -0.09 -1.006 0.157 1.074
BS 0.023 1.503 0.035 1.169 0.025 1.178 0.021 1.404 -0.002 -0.187 0.022 1.141
CEOD 0.043 0.933 0.162 2.218** -0.061 -0.656 0.047 1.024 0.136 1.961* 0.062 0.982
CEOT -0.022 -0.317 -0.026 -0.214 0.084 1.322 -0.014 -0.202 -0.009 -0.105 -0.028 -0.273
GDB -0.371 -1.864* 0.521 2.609*** 0.329 1.285 -0.363 -1.835** 0.643 2.581*** -0.504 -1.926**
INSO 0.308 3.069*** -0.66 -4.217** -0.01 -0.093 0.308 3.076*** 0.895 7.647*** 0.685 4.275***
MANO 0.451 1.903** 0.564 1.537 0.362 1.135 0.439 1.845* -0.066 -0.294 0.478 1.39
TAUD 0.04 0.349 -0.293 -2.201** 0.351 1.811* 0.04 0.354 -0.29 -3.505** 0.031 0.22
FS -0.068 -1.805* -0.096 -1.687* 0.004 0.064 -0.066 -1.783* 0.041 2.184** -0.069 -1.213
GROS -0.045 -0.96 0.023 0.253 0.093 1.122 -0.046 -0.972 -0.04 -1.126 -0.079 -1.261
LEV -0.044 -1.385 -0.159 -2.239* 0.111 2.297** -0.041 -1.258 -0.021 -0.611 -0.042 -0.906
PROF 0.245 1.264 0.199 1.051 0.195 0.902 0.221 1.14 0.1 1.205 0.289 1.054
Adj R2 0.425 0.454 0.613 0.426 0.466 0.434
F-Statistic 5.576*** 6.141*** 10.791*** 5.589*** 6.404*** 5.743***
*,**,*** = statistically significant at less than 0.10, 0.05 and 0.01ACACC = Accruals based first measure of AC,ACCIC = Accruals based second measure of AC, ACCIE = Earnings based measure of AC, ACSKEW =
Skewness based measure of AC, ACSOE = Sensitivity of Earnings to Bad News relative to Sensitivity of Earnings to Good News, ACCOMP = Compositemeasure of AC of a firm, ACI = Audit Committee Independence, BA = Board Activity, BI = Board Independence, BS = Board Size, CEOD = CEO Duality,CEOT = CEO Turnover, GDB = Gender Diversity on Board, INSO = Institutional Shareholding, MANO = Managerial Shareholding, TAUD = Type ofthe Auditor, FS = Firm Size, GROS = Sales Growth, LEV = Leverage, PROF = Profitability

Results and Discussions 102
4.5.4 AC and CG
The first two columns of Table 4.11 show the results of fixed effect regression for
ACACC with CG mechanisms. The adjusted R squared is 0.425 meaning that
42.5 percent of the variation in dependent variable is because of the considered
independent variables. The F-statistic is also significant meaning that the model
is a good fit. Out of the ten considered CG variables only BA, BI, GDB, INSO
and MANO are significant with signs of BI and INSO that is hypothesized. The
next two columns show the results of fixed effect regression for ACCIC with CG
mechanisms. The adjusted R squared is 0.454 meaning that 45.4 percent of the
variation in dependent variable is because of the considered independent variables.
The F-statistic is also significant meaning that the model is a good fit. Out of
the ten considered CG variables only BI, CEOD, GDB, INSO and TAUD are
significant with signs of BI and GDB that are hypothesized. The next two columns
show the results of fixed effect regression for ACCIE with CG mechanisms.
The adjusted R squared is 0.613 meaning that 61.3 percent of the variation in
dependent variable is because of the considered independent variables. The F-
statistic is also significant meaning that the model is a good fit. Out of the ten
considered CG variables only ACI, BA and TAUD are significant with signs of ACI
and TAUD that are hypothesized.The next two columns show the results of fixed
effect regression for ACCOMP with CG mechanisms. The adjusted R squared is
0.467 meaning that 46.7 percent of the variation in dependent variable is because
of the considered independent variables. The F-statistic is also significant meaning
that the model is a good fit. Out of the ten considered CG variables only BA,
CEOD, GDB, INSO and TAUD are significant with signs of GDB and INSO that
are hypothesized.
The last two columns of Table 4.11 show the results of fixed effect regression for
ACCOMP with CG mechanisms. The adjusted R squared is 0.434 meaning that
43.4 percent of the variation in dependent variable is because of the considered
independent variables. The F-statistic is also significant meaning that the model
is a good fit. Out of the ten considered CG variables only BA, GDB and INSO
are significant with sign of INSO that is hypothesized.

Resu
ltsan
dD
iscussion
s103
Table 4.12: Results of ACACC, CSFG and DQ
ACACC ACCIC ACCIE ACSKEW ACSOE ACCOMPVariables Coeff t- Stat Coeff t- Stat Coeff t- Stat Coeff t- Stat Coeff t- Stat Coeff t- StatStep 1Constant -0.03 -0.227 0.159 0.504 -0.595 -2.277** -0.015 -0.109 -0.258 -0.94 -0.061 -0.29CSFG 0.077 2.293** 0.032 0.482 0.067 1.04 0.074 2.196** 0.117 2.642*** 0.113 2.579**DQ 0.153 0.755 -0.255 -0.757 0.692 2.476** 0.135 0.67 0.569 2.388** 0.29 0.953FS -0.068 -1.909* -0.082 -1.613* 0.014 0.274 -0.066 -1.890** 0.015 0.721 -0.076 -1.402GROS -0.016 -0.328 -0.036 -0.47 0.095 1.125 -0.017 -0.349 0.028 0.73 -0.018 -0.262LEV -0.052 -1.686* -0.125 -1.950* 0.108 2.266** -0.05 -1.56 -0.054 -1.652* -0.065 -1.412PROF 0.214 1.174 0.308 1.923** 0.144 0.703 0.191 1.05 0.099 0.926 0.232 0.889
Adj R2 0.411 0.421 0.611 0.412 0.333 0.405F-Statistic 5.644*** 5.842 11.447*** 5.661*** 4.318*** 5.530***Step 2Constant -1.083 -2.147** -1.066 -2.123** -1.951 -2.448** -1.52 -2.027**CSFG 0.447 3.023*** 0.444 3.011*** 0.713 2.820*** 0.626 2.747***DQ 2.51 2.348** 2.491 2.343** 4.36 2.835*** 3.557 2.226**CSFGXDQ -0.82 -2.386** -0.82 -2.391** -1.319 -2.673*** -1.137 -2.225**FS -0.074 -2.086** -0.072 -2.072** 0.005 0.249 -0.085 -1.544GROS -0.024 -0.49 -0.025 -0.51 0.015 0.412 -0.029 -0.423LEV -0.054 -1.766* -0.053 -1.637 -0.057 -1.696* -0.068 -1.475PROF 0.231 1.233 0.208 1.112 0.125 1.1 0.255 0.955
Adj R2 0.414 0.415 0.343 0.408F-Statistic 5.658*** 5.674 4.442*** 5.536***
*,**,*** = statistically significant at less than 0.10, 0.05 and 0.01ACACC = Accruals based first measure of AC,ACCIC = Accruals based second measure of AC, ACCIE = Earnings based measure of AC, ACSKEW =
Skewness based measure of AC, ACSOE = Sensitivity of Earnings to Bad News relative to Sensitivity of Earnings to Good News, ACCOMP = Compositemeasure of AC of a firm, DQ = Disclosure Quality, CSFG = Composite Score of Firm Governance, FS = Firm Size, GROS = Sales Growth, LEV = Leverage,PROF = Profitability

Results and Discussions 104
4.5.5 AC, CSFG and DQ (as Moderator)
The first two columns of Table 4.12 show the results of fixed effect regression for
ACACC and CSFG with DQ as independent variable. The adjusted R squared
is 0.411 meaning that 41.1 percent of the variation in dependent variable is be-
cause of the considered independent variables. The F-statistic is also significant
meaning that the model is a good fit. The CSFG is significant with sign that is
hypothesized so step 2 is estimated. The same two columns also show the results
of fixed effect regression for ACACC and CSFG with moderating role of DQ. The
adjusted R squared is 0.709 meaning that 70.9 percent of the variation in depen-
dent variable is because of the considered independent variables. The F-statistic is
also significant meaning that the model is a good fit. The CSFGXDQ is significant
with sign that is hypothesized. The next two columns show the results of fixed
effect regression for ACCIC and CSFG with DQ as independent variable. The ad-
justed R squared is 0.421 meaning that 42.1 percent of the variation in dependent
variable is because of the considered independent variables. The F-statistic is also
significant meaning that the model is a good fit. The CSFG is insignificant with
sign that is hypothesized so step 2 is not estimated.
The next two columns show the results of fixed effect regression for ACCIE and
CSFG with DQ as independent variable. The adjusted R squared is 0.611 meaning
that 61.1 percent of the variation in dependent variable is because of the considered
independent variables. The F-statistic is also significant meaning that the model is
a good fit. The CSFG is insignificant with sign that is hypothesized so model 2 is
not estimated. The next two columns show the results of fixed effect regression for
ACSKEW and CSFG with DQ as independent variable. The adjusted R squared
is 0.412 meaning that 41.2 percent of the variation in dependent variable is because
of the considered independent variables. The F-statistic is also significant meaning
that the model is a good fit. The CSFG is significant with sign that is hypothesized
so step 2 is estimated. The same two columns also show the results of fixed effect
regression for ACACC and CSFG with moderating role of DQ. The adjusted R
squared is 0.415 meaning that 41.5 percent of the variation in dependent variable is
because of the considered independent variables. The F-statistic is also significant

Results and Discussions 105
meaning that the model is a good fit. The CSFGXDQ is significant with sign that
is hypothesized. The next two columns show the results of fixed effect regression
for ACSOE and CSFG with DQ as independent variable. The adjusted R squared
is 0.333 meaning that only 33.3 percent of the variation in dependent variable is
because of the considered independent variables. The F-statistic is also significant
meaning that the model is a good fit. The CSFG is significant with sign that is
hypothesized so step 2 is estimated.
The same two columns also show the results of fixed effect regression for ACSOE
and CSFG with moderating role of DQ. The adjusted R squared is 0.343 meaning
that 34.4 percent of the variation in dependent variable is because of the considered
independent variables. The F-statistic is also significant meaning that the model is
a good fit. The CSFGXDQ is significant with sign that is hypothesized. The last
two columns of Table 4.12 show the results of fixed effect regression for ACCOMP
and CSFG with DQ as independent variable. The adjusted R squared is 0.405
meaning that 40.5 percent of the variation in dependent variable is because of the
considered independent variables. The F-statistic is also significant meaning that
the model is a good fit. The CSFG is significant with sign that is hypothesized
so step 2 is estimated. The same two columns also show the results of fixed effect
regression for ACCOMP and CSFG with moderating role of DQ. The adjusted R
squared is 0.408 meaning that 40.8 percent of the variation in dependent variable is
because of the considered independent variables. The F-statistic is also significant
meaning that the model is a good fit. The CSFGXDQ is significant with sign that
is hypothesized.
4.6 Additional Analyses for Pakistan
Two additional analyses are being performed for Pakistan. The results along with
their discussion are presented in appendices. The first portion encompasses the
examination of impact of good, bad and moderate CG on AC. Panel regression is
employed as the econometric procedure. Each of the measures of AC are tested
to show the presence of any relationship with categorical forms of CG. Following

Results and Discussions 106
Shah (2007) the dummies are created for good, bad and moderate CG by employ-
ing normal curve methodology on composite score of firms governance for each
country separately. The second portion encompasses the results of impact of CG
on categorical form of AC. AC is converted into the form: highly conservative,
moderately conservative and less conservative. It is interesting to note that in this
case these three options follow a natural ordering of the alternatives. The reason of
this ordering is that it starts with highest and goes to the weakest or lowest. Highly
conservative measns that high AC is employed and is clearly different than mod-
erately conservative and this in turn is different than less conservative. Hence,
in this case ordered probit model is employed to obtain appropriate estimates.
Here it is important to understand the difference between logit and probit models.
Though both of the econometirc procedures rarely produce different results, the
probit model is considered to be better while addressing the situations like that
is at hand. The reason is that probit model examines the variables through cum-
mulative normal distribution and since natural ordering of categories is involved,
orderd probit is employed as the estimation procedure. The results are presented
in appendix.
4.7 Endogenity Among Variables
Rosilda (2009) is of the view that examination of various factors of AC may be
infected with endogenity bias. This is becasue more often the factors that are
considered to be related to AC have a bi-directional relationship. Few researchers
have presented their theoretical argument that AC and profitability can have a
bi-directional relationship. It is however very interesting to note that most of the
empirical literature only supports the existance of positive relationship between
AC and profitability (For example, Ahmed et al. (2008) and Ahmed and Duellman
(2007)). It is also theoretically presented that AC has a bi-directional relationship
with DQ (Disclosure Quality taken as moderator in this study). In order to be
sure that no such relationships exist between the considered variables, this study
employs Hausman Test. Hausman test qualifies to be an appropriate test to check

Results and Discussions 107
the existance of endogenity. This test is employed by using the three distinct data
sets each comprising 100 companies from Bangladesh, India and Pakistan. First
the PROF is examined as regressor and afterwards DQ is examined as regressor.
The results of Hausman Test for each country are presented in Table 4.16. The
results show that all three data sets that are employed for this study are free
from endogenic bias. The Hausman Test Statistics are insignificacnt in all three
countries and for both the testings meaning that bi-directional rlationships be-
tween AC and PROF and AC and DQ do not exist. These results forbade to go
for employing GMM (Generalized method of Moments), however following some
previous studies this study employs GMM. The only reason for the application of
GMM is that few researchers are of the view that in order to check the rubustness
of the results various techniques can be employed. The results are presented in
appendix.
Table 4.13: Hausman Test
Bangladesh India Pakistan
RegressorTestedwith AC
Prof Prof Prof
HausmanTestStatistic
0.859 0.011 0.376
RegressorTestedwith AC
PROF & DQ PROF & DQ PROF & DQ
HausmanTestStatistic
1.093 4.292 5.783
4.8 Comparative Results for Three Countries Us-
ing Composite Measure
Tables 4.17 and 4.18 show the results of all three countries where in the composite
measures of AC i.e. ACCOMP and CG i.e. CSFG are presented.

Resu
ltsan
dD
iscussion
s108
Table 4.14: Results of ACCOMP and CG mechanisms
Bangladesh India Pakistan
Variables Coefficient t- Stat Coefficient t- Stat Coefficient t- Stat
Constant -0.117 -0.116 -2.341 -3.722** 0.379 1.266
ACI 0.108 1.239 0.990 2.418** -0.140 -1.128
BA 0.050 0.216 0.585 2.065** -0.666 -2.076**
BI -0.217 -0.729 0.072 0.254 0.157 1.074
BS 0.024 0.520 -0.003 -0.103 0.022 1.141
CEOD 0.249 2.000** 0.050 1.118 0.062 0.982
CEOT 0.059 0.649 -0.003 -0.058 -0.028 -0.273
GDB 0.656 0.860 0.795 1.463 -0.504 -1.926**
INSO 1.240 3.569*** 0.348 1.576 0.685 4.275***
MANO 0.372 0.458 0.441 0.933 0.478 1.390
TAUD 0.218 1.212 -0.224 -0.745 0.031 0.220
FS -0.479 -1.771* 0.342 3.254** -0.069 -1.213
GROS 0.012 0.055 0.222 0.786 -0.079 -1.261
LEV 0.153 2.277** 0.061 1.752* -0.042 -0.906
PROF 2.138 4.035*** 0.162 4.385*** 0.289 1.054
Adj R2 0.642 0.611 0.434
F-Statistic 12.042*** 10.732*** 5.743***
*,**,*** = statistically significant at less than 0.10, 0.05 and 0.01ACCOMP = Composite measure of AC of a firm, ACI = Audit Committee Independence, BA = Board Activity, BI = Board Independence, BS = Board
Size, CEOD = CEO Duality, CEOT = CEO Turnover, GDB = Gender Diversity on Board, INSO = Institutional Shareholding, MANO = ManagerialShareholding, TAUD = Type of the Auditor, FS = Firm Size, GROS = Sales Growth, LEV = Leverage, PROF = Profitability

Resu
ltsan
dD
iscussion
s109
Table 4.15: Results of ACCOMP, CG and DQ
Bangladesh India Pakistan
Variables Coefficient t- Stat Coefficient t- Stat Coefficient t- Stat
Step 1
Constant -0.472 -0.552 -1.935 -4.061*** -0.061 -0.29
CSFG 0.495 2.268** 0.414 2.009** 0.113 2.579**
DQ 0.982 1.318 0.205 1.592 0.29 0.953
FS -0.355 -1.374 0.299 2.580** -0.076 -1.402
GROS 0.021 0.084 0.247 0.946 -0.018 -0.262
LEV 0.172 2.585*** 0.028 0.789 -0.065 -1.412
PROF 1.901 3.765*** 0.23 3.917*** 0.232 0.889
Adj R2 0.632 0.601 0.405
F-Statistic 12.429*** 11.013*** 5.530***
Step 2
Constant -1.897 -2.216 -2.163 -3.996*** -1.52 -2.027**
CSFG 2.044 2.901 0.768 2.471** 0.626 2.747***
DQ 6.826 2.624 0.367 2.440** 3.557 2.226**
CSFGXDQ -6.062 -2.702 -0.23 -1.677* -1.137 -2.225**
FS -0.384 -1.476 0.294 2.554** -0.085 -1.544
GROS 0.005 0.025 0.262 1.012 -0.029 -0.423
LEV 0.171 2.489 0.03 0.849 -0.068 -1.475
PROF 2.019 3.878 0.231 3.954*** 0.255 0.955
Adj R2 0.638 0.601 0.408
F-Statistic 12.622*** 10.915*** 5.536***
*,**,*** = statistically significant at less than 0.10, 0.05 and 0.01ACCOMP = Composite measure of AC of a firm, DQ = Disclosure Quality, CSFG = Composite Score of Firm Governance, FS = Firm Size, GROS =
Sales Growth, LEV = Leverage, PROF = Profitability

Resu
ltsan
dD
iscussion
s110
Table 4.16: Summary of Hypothesis Testing
Hypothesis ACACC ACCIC ACCIE ACSKEW ACSOE ACCOMP
H1 There is a negative relationship between + - - - + +
board size and AC (S) (NS) (NS) (NS) (NS) (NS)
H2 There is a positive relationship between - - - - + -
board independence and AC (NS) (NS) (NS) (NS) (NS) (NS)
H3 There is a positive relationship between + - + + + +
board activity and AC (NS) (NS) (NS) (NS) (S) (NS)
H4 There is a positive relationship between gender + + + - - +
diversity on board and AC (NS) (S) (S) (NS) (NS) (NS)
H5 There is a positive relationship between CEO - + - + + -
Turnover and AC (NS) (NS) (NS) (S) (NS) (NS)
H6 There is a negative relationship between + + + - - +
CEO Duality and AC (S) (S) (NS) (NS) (S) (S)
H7 There is a positive relationship between Instit- + + + + + +
utional ownership and AC (NS) (S) (NS) (S) (S) (S)
H8 There is a negative relationship between Mana- + + - + - +
gerial ownership and AC (NS) (NS) (NS) (NS) (NS) (NS)
H9 There is a positive relationship between Audit Comm- + + - + - +
ittee Independence and AC (S) (NS) (NS) (NS) (S) (NS)
H10 There is a positive relationship between existence - + + - + +
of Big Four Auditor and AC (NS) (S) (NS) (NS) (S) (NS)
H11 There is a positive relationship between composite + + + + + +
score of firm governance and AC (NS) (S) (NS) (NS) (S) (S)
H12 High disclosure quality moderates the association between - -
CG and AC (NA) (S) (NA) (NA) (NA) (S)
NS = Not Supported, S = Supported and NA=Estimation Not Applicable

Results and Discussions 111
4.9 Discussion of Results of Bangladesh
This section discusses the results of Bangladesh. Table 4.16 shows the summary
of results of Panel regression analysis.
4.9.1 Board Size and AC
The results show that board size does not play any role in determining the level of
conservatism employed by firms in Bangladesh. These findings are consistent with
that of Elshandidy and Hassanein (2015), Lim (2011) and Ahmed and Duellman
(2007). They all report similar results while examining various markets. One of
the possible reasons for the absence of such relationship could be the focus of every
firm to keep board size adequate, as it is seen as the first step towards creating
strong investor protection stature. The findings are inconsistent with two sets of
findings in literature. The first set is comprised of two studies by Mohammed
et al. (2017) and Ahmed and Henry (2012). They report a positive impact of
board size on AC. The reason for the existence of such a relationship is inherent in
a relatively good stature of CG and strong investor protection environment in the
markets examined. The second set also encompass two studies i.e. of Nasr and
Ntim (2017) and Chi et al. (2009) who report the existence of negative relationship
between board size and AC. The reason could be the poor investor protection laws
and weak CG stature in the markets examined.
4.9.2 Board Independence and AC
The results show that board independence does not determine conservatism prac-
tices in Bangladesh. The findings are inconsistent with those of Nasr and Ntim
(2017), Mohammed et al. (2017), Ahmed and Duellman (2007) and Beekes et al.
(2004) who report the existence of negative association between board indepen-
dence and AC. They argue that greater the presence of independent directors on
board, greater is the effectiveness of board and less is the chance of occurrence
of asymmetry in information. The results are also not in consistent with that of

Results and Discussions 112
Beasley and Salterio (2001) who argue that the presence of outside directors on
board reduce the tendency to manage earnings and accruals thus reducing the
chances of accounting numbers frauds and improve audit quality. However, the
results of existing study are consistent with that of Lim (2011), Rahman and Ali
(2006) and Abdullah (2004) who argue that the existence of outside directors does
not necessarily imply that they possess skills and expertise that limit the firms
from employing financial reporting manipulation practices hence the existence of
no relationship between the number of outside directors on board and level of AC
is justifiable.
4.9.3 Board Activity and AC
The results show that good attendence ot board meetings does not improve quality
of financial statements in Bangladesh. The results that BA is not related to
the level of conservatism employed by firms is consistent with that of Krishnan
and Visvanathan (2008) and Ismail et al. (2008), who also report the absence of
empirical evidence on the relationship between frequency of meetings and quality
of financial reporting. However the results are not in harmony with that of Abbott
et al. (2007) who show that frequency of meetings improve the quality of financial
reporting process. Boussaid et al. (2015) also report the greater board activity
leads to employment of more conservatism. The results of this study are not
consistent with that recent study as well.
4.9.4 Gender Diversity on Board and AC
The results show that the presence of more female members on the board has no
effect on the level of conservatism employed by firms in Bangladesh. These results
are not consistent with that of Boussaid et al. (2015) who report that greater the
number of female members more is the conservatism. According to them there
are three reasons for the existence of such a relationship. First the risk-averse and
less overconfident nature of female directors Krishnan and Visvanathan (2008).
Second, their ability to think independently (Hillman and Dalziel, 2003). Third

Results and Discussions 113
is their trust-building leadership style (Cohen et al., 2005). All these attributes
make female members more tolerant and hence pave the way for increasing boards
effectiveness. Moreover, Srinidhi et al. (2011) also find that the firm having higher
percentage of female directors exhibit more earnings quality and this might just be
the reason that this study is failed to find the existence of any such relationship.
The proportion of female members on the board is relatively less in the country
understudy alongside their minimal role in strategic decisions of the firms thus
making their presence to go without a significant effect on strategic decisions of
the firm.
4.9.5 CEO turnover and AC
The results show that the CEO turnover fails to effect the level of conservatism
employed by firms. It is interesting to note that the results are consistent with
that of Hazarika et al. (2012) who also report that if there is a voluntary CEO
turnover there is no significant change in the way the firms are being governed
hence there is no effect on financial reporting practices. But there is another side
of this coin, the three mentioned researchers also report that if the CEO turnover
is a forced one, it has impacts of strategic decisions of the firms and hence also
go for managing earnings. Since in this study most of the information is collected
from annual reports and news archives no significant proofs are found of forced
turnovers in case of Bangladeshi sample firms.
4.9.6 CEO Duality and AC
The results show that in case of Bangladesh CEO Duality has a positive association
with the level of conservatism employed by firm. The results are consitent with
those of Nasr and Ntim (2017), Elshandidy and Hassanein (2015) and Chi et al.
(2009). They report the existence of a potive impact of CEO Duality on AC.
The reason is that if both the offices i.e. head of the board and chief executive
office are being held by single person, the need to report managed accounting
estimates is increased. Hence CEO duliaty paves the way for more conservatism.

Results and Discussions 114
These results are also not consistent with that of Ahmed and Duellman (2007)
who report insignificant results of CEO duality with AC. The results are also not
consistent with that of Abdullah (2006) and Dahya, gracia et al. (2009) who also
report the inexistence of any significant impact of separation between the role of
CEO and Chairman of the board on financial reporting.
One of the possible reasons of existence of such an association might be the grey
area between separation and control. Since most of the firms are family controlled
where the family members have assured greater proportion of board to them-
selves, the existence of such a relationship is explainable. The results are also not
consistent with those of Mohammed et al. (2017), Ahmed and Henry (2012) and
Lim (2011). They all report a negative association between the variables under
discussion here.
4.9.7 Institutional Shareholding and AC
The results show that greater the percentage of shares held by institutions greater
is the level of conservatism employed by firms. The existence of such a rela-
tionship is logical. The institutional shareholders demand more transparent and
quality accounting information. This need drags the firms to install such gov-
ernance mechanisms that employ more conservatism. The results are consistent
with that of Yeo et al. (2002), Ahmed and Duellman (2007) and Yunos (2011)
who also report that substantial outsider shareholders do play a role in improving
accounting estimates informativeness by employing more conservatism. In case of
Bangladesh, the institutional shareholding is in significant proportion hence the
existence of such a relationship is not unique.
4.9.8 Managerial Shareholding and AC
The results show that there is no relationship between the managerial ownership
and level of AC employed by firms. The results are not consistent with that of
Yunos (2011) and Lafond and Roychowdhury (2008) who state that the manage-
rial ownership is one of the ways to mitigate agency conflict by restricting the

Results and Discussions 115
opportunistic behavior of the managers. They report that if the managerial own-
ership is more the level of AC employed by the firms is decreased. One of the
reasons for the inexistence of such a relationship in case of Bangladesh could be
the Haniffa and Hudaib (2006) argument that in case of developing countries too
much managerial ownership is unsuitable for business environment because of its
role in increasing the risk of misallocating resources.
4.9.9 Audit Committee Independence and AC
The results show that percentage of independent directors on audit committee is
not related to the level of conservatism employed by firms. The results are not
consistent with those of Yunos (2011) and Abdullah (2006) who report that there
exist an inverse relationship between independent members on the audit committee
and AC.
The results of this study can be explained in the light of the argument of Zain and
Subramaniam (2007) who state that sometimes it so happen that those indepen-
dent members are made the part of the audit committee whose knowledge about
the firms business is limited thus cannot pave the way for employing conservatism.
4.9.10 Big Four Auditor and AC
The results show that presence of big auditor does not improve the level of con-
servatism employed by firms listed in Bangladesh. The results are not consistent
with that of Nasr and Ntim (2017) and Mohammed et al. (2017) who report the
existence of a negative relationship between big five auditor and AC.
The results are not consistent with that of Rodriguez (2010) who report that in
case of conditional conservatism, the presence of big auditor has a positive impact
on AC. His argument is based on the contracting view of AC. This study fails to
find any such relationship. The reason of inexistence of such a relationship in case
of a Bangladesh is that relatively small number of firms are inclined to hire big
auditor to access the quality of financial reporting of the firms that are considered
fro this study.

Results and Discussions 116
4.9.11 Composite Score of Firm’s Governance and AC
The results show that the stature of CG in a firm has an impact on the level of
conservatism employed by the firms. The results are consistent with many studies
who try to analyze the impact of CG on AC. Ren (2014), Yunos (2011), Rosilda
(2009) are a few who have presented the same argument that CG does have a say in
deciding the level of AC that is employed by firms. Abdullah (2006), Haniffa and
Hudaib (2006) and Ahmed and Duellman (2007) are among those researchers who
have examined individual CG mechanisms and conclude that the CG positively
impact conservatism.
4.9.12 CG, AC and Disclosure Quality
The results show that the estimation of equation 3.3 is possible as the equation 3.2
reports a significant relationship between CG and AC in the presence of disclosure
quality as the independent variable (i.e. the first condition to go for moderation
analysis is fulfilled hence proceeded to step 2).
The results show that there exist a moderating role of disclosure quality on the
relationship between CG and AC. This relationship is also explainable. If there
exist a relationship between CG and AC or we can say if the governance statures
demand more conservatism, the more disclosure requirements could limit this be-
havior thus weakening the relationship between CG and AC.
4.9.13 Firm Size and AC
FS (Firm Size) is employed as one of the control variables in each of the three
equations estimated. Among these three equations, the first one examines the
role of CG mechanisms on AC where as the second equation explores the role of
CSFG on AC in the presence of a moderator. The third equation examines the
moderating role of DQ on CG-AC relationship. The results of first equation when
estimated for Bangladesh show that the existance of negative relationship with
AC. However, FS becomes insignificant in later two equations.

Results and Discussions 117
It is intersting to note that though FS in insignificant in last two equations, the
signs are negative as hypothesized. So it can be stated that there exist a negative
impact of FS on AC. These results are inline with those of Rahman and Ali (2006)
and Krishnan and Visvanathan (2008) who also report the existance of negative
relationship of FS with AC. The reason is simple. If the size of the firm is large,
it is more exposed to political costs and adopts more conservatism. LaFond and
Watts (2008) also supports this argument.
4.9.14 Sales Growth and AC
GROS (Sales Growth) is also employed as one of the control variables in each of the
three equations estimated. Among these three equations, the first one examines
the role of CG mechanisms on AC where as the second equation explores the role
of CSFG on AC in the presence of a moderator. The third equation examines the
moderating role of DQ on CG-AC relationship. The results of all three equations
when estimated for Bangladesh show that there does not exist any relationship of
GROS with AC.
4.9.15 Leverage and AC
LEV (Profitability) is used as a control variable in each of the three equations
estimated. The first equation as stated earlier examines the role of CG mechanisms
on AC where as the second equation explores the role of CSFG on AC in the
presence of a moderator. The third equation examines the moderating role of DQ
on CG-AC relationship.
The results of all three equations when estimated for Bangladesh show that the
existance of positive relationship with AC. The results are in line with those of
Ahmed and Duellman (2007) and Krishnan and Visvanathan (2008). All of these
studies also report a positive impact of leverage on AC. The existance of such
a relationship can be defended by this argument that highly levered firms may
employ more conservatism to reduce the conflicts between the stakeholders and
creditors.

Results and Discussions 118
4.9.16 Profitability and AC
PROF (Profitability) is employed as the control variable in each of the three
equations estimated. The first equation examines the role of CG mechanisms on
AC where as the second equation explores the role of CSFG on AC in the presence
of a moderator. The third equation examines the moderating role of DQ on CG-
AC relationship. The results of all three equations when estimated for Bangladesh
show that the existance of positive relationship with AC. The results are in line
with those of Ahmed et al. (2002), Ahmed and Duellman (2007), Krishnan and
Visvanathan (2008), Yunos (2011) and Ren (2014). All of these studies also report
a positive impact of profitability on AC. The existance of such a relationship can
be defended by this argument that unprofitable firms are less prone to employ
conservatism as it can deteriorate its profits thus if the profitability is more the
firms are prone to employing conservatism becasue they can affort the cost of
emplying conservatism.
4.9.17 Summary
In case of Bangladesh, board size i.e. number of board members is found to
have an insignificant relationship with all earnings based conservatism measures
as well as skewness based measure. However, this study also a found a significant
relationship with one of the two accruals based measures employed in this study.
The relationship with composite measure is insignificant therefore it is concluded
that change in the number of board members cannot effect the level of conservatism
employed by firms listed in Bangladesh. Presence of more independent directors
on board is also found to have an insignificant relationship with all the measures
of AC i.e. accruals based, earnings based, skewness based and composite measure.
Therefore, it is concluded that in case of Bangladeshi firms there does not exist
any relationship between presences of more independent directors on board and
AC.
Board activity i.e. number of meetings attended by a significantly higher number of
board members is also found to be insignificant indicating no relationship between

Results and Discussions 119
board activity and level of conservatism employed by firms in Bangladesh. A new
dimension of CG i.e. the presence of female directors on board is found to have no
significant impact on a composite measure of AC. However, this gender diversity
is significantly related to one of the two accrual based measures and one of the two
earnings based measures of AC employed. It can hence be concluded that greater
presence of female directors on board does not pave the way for AC.
CEO turnover is also examined as a new CG mechanism in this study. This
variable also fails to show any relationship with accruals based, earnings based
and composite measure of AC. However, CEO turnover is related to skewness
based measure. It is therefore concluded that the change of CEO does not affect
the conservative accounting practices that are already installed in Bangladeshi
firms. CEO duality i.e. a situation in which CEO holds two offices i.e. one of
CEO and the other of chairman of the board is found to be significantly related
with composite as well as accruals based measure of AC and no relationship with
earnings based as well as skewness based measures. It is therefore concluded
that CEO duality is related to the level of conservatism employed by firms in
Bangladesh.
Greater the percentage of shares held by institutions in a firm greater is the level
of conservatism employed. It is evident by the existence of significant relationship
between institutional shareholding and composite measure, skewness based mea-
sure and one of the two accruals based measure of AC. Percentage of shares held by
managers in a firm is not related to accruals based, earnings based, skewness based
and composite measure of AC. It is therefore concluded that managerial ownership
is not related to AC in case of Bangladesh. Audit committee independence i.e.
percentage of independent directors on the audit committee also fail to show any
relationship with a composite measure, both earnings based measures, skewness
based measure and one of the two accruals based measures. It is concluded that
audit committee independence has no relationship with the level of AC employed
by firms. Appointment of big auditor as the firms auditor is also not related to
earnings based measures, skewness based measures and composite measure of AC.
However, there exists a relationship between presence of big auditor and one of

Results and Discussions 120
the two accruals based measures. Hence it is concluded that big auditor does not
verify the employment of AC employed by firms in Bangladesh.
The composite measure of firms governance is related to composite measure of AC.
This composite measure is also related to one of the two accruals based measure
of AC. It is therefore concluded that CG effect AC. As far as the moderating
role of disclosure quality is concerned in Bangladesh, the estimation can only be
performed with composite measure as well as one of the two accruals based measure
of AC. Disclosure quality is found to weaken the relationship between CG and AC.
Hence, it is concluded that in case of Bangladesh, there exists a moderating role
of disclosure quality on the relationship between CG on AC.
4.10 Discussion of Results of India
This section discusses the results of India. Table 4.17 shows the summary of results
of Panel regression analysis.
4.10.1 Board Size and AC
The results show that board size does not play any role in determining the level of
conservatism employed by firms in India. These findings are consistent with that of
Elshandidy and Hassanein (2015), Lim (2011) and Ahmed and Duellman (2007).
They all report similar results while examining various markets. Existing study
also report similar results for Bangladesh. The reason could be the significance
of board size as a means to improve CG stature. The findings are inconsistent
with those of Mohammed et al. (2017) and Ahmed and Henry (2012) who report
a positive impact of board size on AC. The reason for the existence of such a
relationship is inherent is a relatively good stature of CG and strong investor
protection environment in the markets examined. The findings are inconsistent
with those of Nasr and Ntim (2017) and Chi et al. (2009) who report the existence
of negative relationship between board size and AC. The reason could be the poor
investor protection laws and weak CG stature in the markets examined.

Resu
ltsan
dD
iscussion
s121
Table 4.17: Summary of Hypothesis Testing
Hypothesis ACACC ACCIC ACCIE ACSKEW ACSOE ACCOMP
H1 There is a negative relationship between - - + - - -
board size and AC (NS) (NS) (NS) (S) (NS) (NS)
H2 There is a positive relationship between + - + - + +
board independence and AC (NS) (NS) (NS) (NS) (S) (NS)
H3 There is a positive relationship between + + + + + +
board activity and AC (NS) (NS) (S) (NS) (NS) (S)
H4 There is a positive relationship between gender + + + + + +
diversity on board and AC (S) (S) (NS) (NS) (NS) (NS)
H5 There is a positive relationship between CEO - - - + + -
Turnover and AC (NS) (NS) (NS) (NS) (S) (NS)
H6 There is a negative relationship between + - + - - +
CEO Duality and AC (NS) (NS) (NS) (NS) (NS) (NS)
H7 There is a positive relationship between Instit- + - - + + +
utional ownership and AC (NS) (S) (NS) (NS) (NS) (NS)
H8 There is a negative relationship between Mana- + + + + + +
gerial ownership and AC (NS) (S) (NS) (NS) (NS) (NS)
H9 There is a positive relationship between Audit Comm- + + + + - +
ittee Independence and AC (NS) (NS) (S) (S) (NS) (S)
H10 There is a positive relationship between existence + - - + + -
of Big Four Auditor and AC (NS) (S) (NS) (NS) (NS) (NS)
H11 There is a positive relationship between composite + + + + + +
score of firm governance and AC (NS) (S) (NS) (S) (NS) (S)
H12 High disclosure quality moderates the association between - - -
CG and AC (NA) (NS) (NA) (S) (NA) (S)
NS = Not Supported, S = Supported and NA=Estimation Not Applicable

Results and Discussions 122
4.10.2 Board Independence and AC
The results show that board independence does not determine conservatism prac-
tices in India. The findings are inconsistent with those of Nasr and Ntim (2017),
Mohammed et al. (2017), Ahmed and Duellman (2007) and Beekes et al. (2004)
who report the existence of negative association between board independence and
AC. They argue that greater the presence of independent directors on board,
greater is the effectiveness of board and less is the chance of occurrence of asym-
metry in information.
The results are also not in consistent with that of Beasley and Salterio (2001)
who argue that the presence of outside directors on board reduce the tendency to
manage earnings and accruals thus reducing the chances of accounting numbers
frauds and improve audit quality. However, the results of existing study are con-
sistent with that of Lim (2011), Rahman and Ali (2006) and Abdullah (2006) who
argue that the existence of outside directors does not necessarily imply that they
possess skills and expertise that limit the firms from employing financial reporting
manipulation practices hence the existence of no relationship between the number
of outside directors on board and level of AC is justifiable in case of the considered
data sets from three emerging economies of South Asia.
4.10.3 Board Activity and AC
The results show that the frequency of meetings improve quality of financial state-
ments in India. The results that frequency of meetings is related to the level of
conservatism employed by firms is not consistent with that of Krishnan and Vis-
vanathan (2008) who report the absence of empirical evidence on the relationship
between frequency of meetings and quality of financial reporting. However the
results are consistent with that of Abbott et al. (2007) who show that frequency
of meetings improve the quality of financial reporting process.
The results of this study are also consistent with that of Boussaid et al. (2015)
who report that greater board activity leads to employment of more conservatism
meaning that if the board activity is more the conservatism is more.

Results and Discussions 123
4.10.4 Gender Diversity on Board and AC
The results show that the presence of more female members on the board has
no effect on the level of conservatism employed by firms. These results are not
consistent with that of Boussaid et al. (2015) who report that greater the number
of female members more is the conservatism. According to them there are three
reasons for the existence of such a relationship. First the risk-averse and less
overconfident nature of female directors (Riley and Chow, 1992; Ambrose and
Schminke, 1999 and Krishnan and Visvanathan (2008)). Second, their ability to
think independently (Hillman and Dalziel, 2003). Third is their trust-building
leadership style. All these attributes make female members more tolerant and
hence pave the way for increasing boards effectiveness.
Moreover, Srinidhi et al. (2011) also find that the firm having higher percentage
of female directors exhibit more earnings quality and this might just be the reason
that this study is failed to find the existence of any such relationship. The percent-
age of female members on the board is relatively less in the country understudy
alongside their minimal role in strategic decisions of the firms thus making their
presence to go without a significant effect on strategic decisions of the firm.
4.10.5 CEO Turnover and AC
The results show that the CEO turnover fail to effect the level of conservatism
employed by firms. It is interesting to note that the results are consistent with
that of Khodadadi et al. (2010) who also report that if there is a voluntary CEO
turnover there is no significant change in the way the firms are being governed
hence there is no effect on financial reporting practices. But there is another side
of this coin, the three mentioned researchers also report that if the CEO turnover
is a forced one, it has impacts of strategic decisions of the firms and hence also go
for managing earnings.
Since in this study most of the information is collected from annual reports and
news archives no significant proofs are found of forced turnovers in case of Indian
sample firms.

Results and Discussions 124
4.10.6 CEO Duality and AC
The results show that in case of India CEO Duality has no association with the
level of conservatism employed by firms. These results are consistent with that of
Ahmed and Duellman (2007) who report insignificant results of CEO duality with
AC. The results are also consistent with that of Abdullah (2006) who also report
the inexistence of any significant impact of separation between the role of CEO
and Chairman of the board on financial reporting. One of the possible reasons of
existence of such an association might be the grey area between separation and
control.
Since most of the firms are family controlled where the family members have
assured greater proportion of board to themselves, the existence of such a rela-
tionship is explainable. The results are not consitent with those of Nasr and Ntim
(2017), Elshandidy and Hassanein (2015) and Chi et al. (2009). They report the
existence of positive impact of CEO Duality on AC. The reason is that if both the
offices i.e. head of the board and chief executive office are being held by single
person, the need to report managed accounting estimates is increased. Hence CEO
duliaty paves the way for more conservatism. The results are also not consistent
with those of Mohammed et al. (2017), Ahmed and Henry (2012) and Lim (2011).
They all report a negative association between the variables under discussion here.
4.10.7 Institutional ownership and AC
The results show that there is no effect of greater percentage of shares held by
institutions on the level of conservatism employed by firms in case of India. These
results are not consistent with those of Mohammed et al. (2017), Chi et al. (2009),
Yunos (2011) and Ahmed and Duellman (2007) who report that substantial out-
sider shareholders do play a role in improving accounting estimates’ informative-
ness by employing more conservatism.
The existence of such a relationship is logical. The institutional shareholders
demand more transparent and quality accounting information. This need drags
the firms to install such governance mechanisms that employ more conservatism.

Results and Discussions 125
4.10.8 Managerial ownership and AC
The results show that there is no relationship between the managerial ownership
and level of AC employed by firms. The results are not consistent with that of
Mohammed et al. (2017), Yunos (2011) and Lafond and Roychowdhury (2008)
who state that the managerial ownership is one of the ways to mitigate agency
conflict by restricting the opportunistic behavior of the managers. They report
that if the managerial ownership is more the level of AC employed by the firms is
decreased.
One of the reasons for the inexistence of such a relationship in case of India could
be the Haniffa and Hudaib (2006) argument that in case of developing countries
too much managerial ownership is unsuitable for business environment because of
its role in increasing the risk of misallocating resources.
4.10.9 Audit Committee Independence and AC
The results show that percentage of independent directors on audit committee is
related to the level of conservatism employed by firms. The results are consistent
with those of Mohammed et al. (2017), Yunos (2011) and Abdullah (2006) who
report that there exist a relationship between independent members on the audit
committee and AC.
The results of this study can be explained in the light of the argument of Mo-
hammed et al. (2017) who state that independent members who are made the
part of the audit committee possess vast expertise and knowledge about the firms
business thus pave the way for employing conservatism.
4.10.10 Big Four Auditor and AC
The results show that presence of big auditor does not improve the level of con-
servatism employed by firms listed in India. The results are not consistent with
that of Nasr and Ntim (2017) and Mohammed et al. (2017) who report the exis-
tence of a negative relationship between big five auditor and AC. The results are

Results and Discussions 126
not consistent with that of Rodriguez (2010) who report that in case of condi-
tional conservatism, the presence of big auditor has a positive impact on AC. His
argument is based on the contracting view of AC.
This study fails to find any such relationship. The reason of inexistence of such
a relationship in case of a India is that no regulatory requirement exists for the
firms to hire big auditor to access the quality of financial reporting.
4.10.11 Composite Score of Firm Governance and AC
The results show that the stature of CG in a firm do have an impact on the level of
conservatism employed by the firms. The results are consistent with many studies
who try to analyze the impact of CG on AC. Ren (2014), Yunos (2011), Rosilda
(2009) are a few who have presented the same argument that CG does have a
say in deciding the level of AC that is employed by the firms. Abdullah (2006),
Haniffa and Hudaib (2006) and Ahmed and Duellman (2007) are among those
researchers who have examined individual CG mechanisms and conclude that the
CG positively impact conservatism.
4.10.12 CG, AC and Disclosure Quality
The results show that, in most of the cases above, the estimation of equation
3.3 is not possible as the equation 3.2 fails to report a significant relationship
between CG and AC in the presence of disclosure quality as the IV (i.e. the first
condition to go for moderation analysis is not fulfilled). However, the above stated
condition is met when AC is proxied by ACCOMP (i.e. the composite measure of
conservatism) therefore the results of step 2 of moderation analysis as shown by
equation 3.3 are estimated.
The results of this study show that there exist a moderating role of disclosure qual-
ity on the relationship between CG and AC. This relationship is also explainable.
If there exist a relationship between CG and AC or we can say if the governance
statures demand more conservatism, the more disclosure requirements could limit
this behavior thus weakening the relationship between CG and AC.

Results and Discussions 127
4.10.13 Firm Size and AC
FS (Firm Size) is employed as one of the control variables in each of the three
equations estimated. Among these three equations, the first one examines the
role of CG mechanisms on AC where as the second equation explores the role of
CSFG on AC in the presence of a moderator. The third equation examines the
moderating role of DQ on CG-AC relationship.
The results of all three equations when estimated for India show that the exis-
tance of positive relationship with AC. These results are not inline with those of
Rahman and Ali (2006) and Krishnan and Visvanathan (2008) who report the
existance of negative relationship of FS with AC. The reason for the existance of
such a relationship is hidden in the fact stated by Givoly and Hayn (2000). They
state that asymmetirc timeliness of earnings of larger firms is smaller than smaller
firms. But this relationship can only hold if the market has a way of recognizing
asymmetirc timeliness of earnings and normally large firms have this ability quiet
often. Therefore more often large firms are found to employ less conservatism.
In case of India however, there are many firms that are in their growth stage and
leaning towards maturity. Becasue of this tilt, these firms have found the ways to
recognize asymmetric timeliness of earnings hence reducing conservatism.
4.10.14 Sales Growth and AC
GROS (Sales Growth) is also employed as one of the control variables in each of the
three equations estimated. Among these three equations, the first one examines
the role of CG mechanisms on AC where as the second equation explores the role
of CSFG (Composite measure of firm governance) on AC in the presence of a
moderator. The third equation examines the moderating role of DQ on CG-AC
relationship.
The results of all three equations when estimated for India show that there does
not exist any relationship of GROS (measured by growth in sales) with AC. The
possible reason for inexistance of such a relationship is that the reporting practices
restrict the accruals from affecting thus no contribution towards conservatism.

Results and Discussions 128
4.10.15 Leverage and AC
LEV (Leverage) is used as a control variable in each of the three equations esti-
mated. The first equation as stated earlier examines the role of CG mechanisms
on AC where as the second equation explores the role of CSFG on AC in the pres-
ence of a moderator. The third equation examines the moderating role of DQ on
CG-AC relationship. The results of first equation when estimated for India show
the existance of positive relationship with AC however the results of remaining
two equations fail to report the existance of any relationship.
It is again intersting to note that the signs are inline with that of the expectations.
It can be said that there exist a positive relationship between the level of leverage
and AC. The results are in line with those of Ahmed and Duellman (2007) and
Krishnan and Visvanathan (2008). All of these studies also report a positive
impact of leverage on AC. The existance of such a relationship can be defended by
this argument that highly levered firms may employ more conservatism to reduce
the conflicts between the stakeholders and creditors.
4.10.16 Profitability and AC
PROF (Profitability) is employed as the control variable in each of the three
equations estimated. The first equation examines the role of CG mechanisms on
AC where as the second equation explores the role of CSFG on AC in the presence
of a moderator. The third equation examines the moderating role of DQ on CG-
AC relationship. The results of all three equations when estimated for India show
the existance of a positive relationship with AC.
The results are in line with those of Ahmed et al. (2002), Ahmed and Duellman
(2007), Krishnan and Visvanathan (2008), Yunos (2011) and Ren (2014). All of
these studies also report a positive impact of profitability on AC. The existance
of such a relationship can be defended by this argument that unprofitable firms
are less prone to employ conservatism as it can deteriorate its profits thus if the
profitability is more the firms are prone to employing conservatism becasue they
can affort the cost of emplying conservatism.

Results and Discussions 129
4.10.17 Summary
In case of India, size of the board i.e. number of board members show no re-
lationship with composite measure, earnings based measures and accruals based
measures. However, there exist a relationship between board size and skewness
based measure of AC. It is concluded that there does not exist any relationship
between number of board members and level of AC employed by firms in India.
Board independence i.e. percentage of independent directors on board also show
no relationship with composite and accruals based measures. However, there ex-
ist a relationship between board independence and one of the two earnings based
measures of AC. It is therefore concluded that there does not exist any relationship
between board independence and AC in case of Indian listed firms.
Board activity show a significant relationship with composite as well as one of
the two earnings based measures of AC. Therefore, it is concluded that board
activity has a significant relationship with AC. Gender diversity on board i.e. the
percentage of female directors on board show a significant relationship between
with only one of the two accruals based measures. However gender diversity does
not show a significant relationship with any of the other measures of AC. It is
therefore concluded that gender diversity on board is not related to the level of
AC in Indian listed firms.
CEO turnover show no relationship with composite measure as well as accruals
based and skewness based measures. However there exist a relationship between
CEO turnover and one of the two earnings based measures. It can hence be
concluded that CEO turnover has no relationship with AC. CEO duality i.e. the
existence of CEOs office as well as chairman of the boards office with the same per-
son show no relationship with any of the accruals based, earnings based, skewness
based and composite measure of AC.
The institutional shareholding i.e. percentage of shares held by institutions show
no relationship with composite measure, earnings based as well as skewness based
measures. However, institutional shareholdings show a significant relationship
with only one of the two accruals based measures. It is therefore concluded that

Results and Discussions 130
institutional shareholding has no impact on the level of conservatism employed by
firms. Percentage of shares held by insiders i.e. managers also show no relation-
ship with composite measure, earnings based as well as skewness based measures.
However, there exist a significant relationship of managerial ownership with one
of the two accruals based measures of conservatism. It can hence be concluded
that the managerial ownership does not affect AC in case of firms listed in India.
The audit committee independence i.e. percentage of independent directors on
the audit quality show a significant relationship with composite measure, skew-
ness based measure and one of the two earnings based measures of AC. However,
there does not exist any relationship of audit committee independence with accru-
als based as well as one of the two earnings based measure of AC. It is concluded
that audit committee independence has a significant relationship with AC. The
presence of big auditor also show no significant relationship with composite mea-
sure, skewness based, and earnings based as well as one of the two accruals based
measure of AC. However, the existence of big auditor impact one of the two accru-
als based measures of AC. It can hence be concluded that type of the auditor plays
no role in determining the level of AC employed by firms in India. The composite
measure of firms governance show a significant relationship with composite mea-
sure, skewness based as well as one of the two accruals based measures. However,
this measure of CG does not show any relationship with earnings based measures.
It is therefore concluded that CG has an impact on AC in case of India. The mod-
erating role of disclosure quality on the relationship between CG and AC is also
evident from the results. Disclosure quality is found to weaken the relationship
between CG and composite measure as well as skewness based and accruals based
measures of AC. It can hence be concluded that the disclosure quality moderates
the relationship between CG and AC in case of Indian listed firms.
4.11 Discussion of Results of Pakistan
This section discusses the results of Pakistan. Table 4.18 shows the summary of
results of Panel regression analysis.

Resu
ltsan
dD
iscussion
s131
Table 4.18: Summary of Hypothesis Testing
Hypothesis ACACC ACCIC ACCIE ACSKEW ACSOE ACCOMP
H1 There is a negative relationship between + + + + - +
board size and AC (NS) (NS) (NS) (NS) (NS) (NS)
H2 There is a positive relationship between + + + + - +
board independence and AC (S) (S) (NS) (NS) (NS) (NS)
H3 There is a positive relationship between - + - - - -
board activity and AC (S) (NS) (S) (S) (S) (S)
H4 There is a positive relationship between gender - + + - + -
diversity on board and AC (S) (S) (NS) (S) (S) (S)
H5 There is a positive relationship between CEO - - + - - -
Turnover and AC (NS) (NS) (NS) (NS) (NS) (NS)
H6 There is a negative relationship between + + - + + +
CEO Duality and AC (NS) (S) (NS) (NS) (S) (NS)
H7 There is a positive relationship between Instit- + - - + + +
utional ownership and AC (S) (S) (NS) (S) (S) (S)
H8 There is a negative relationship between Mana- + + + + - +
gerial ownership and AC (S) (NS) (NS) (S) (NS) (NS)
H9 There is a positive relationship between Audit Comm- - + + - - -
ittee Independence and AC (NS) (NS) (S) (NS) (NS) (NS)
H10 There is a positive relationship between existence + - + + - +
of Big Four Auditor and AC (NS) (S) (S) (NS) (S) (NS)
H11 There is a positive relationship between composite + + + + + +
score of firm governance and AC (S) (NS) (NS) (S) (S) (S)
H12 High disclosure quality moderates the association between - - - -
CG and AC (S) (NA) (NA) (S) (S) (S)
NS = Not Supported, S = Supported and NA=Estimation Not Applicable

Results and Discussions 132
4.11.1 Board Size and AC
The results show that board size does not play any role in determining the level
of conservatism employed by firms in Pakistan. These findings are consistent with
that of Elshandidy and Hassanein (2015), Lim (2011) and Ahmed and Duellman
(2007). They all report similar results while examining various markets. Existing
study also report similar results for Bangladesh and India. The reason could be
the use of board size as a means to improve CG stature by firms.
The findings are inconsistent with those of Mohammed et al. (2017) and Ahmed
and Henry (2012) who report a positive impact of board size on AC. The reason
for the existence of such a relationship is inherent is a relatively good stature of
CG and strong investor protection environment in the markets examined. The
findings are inconsistent with those of Nasr and Ntim (2017) and Chi et al. (2009)
who report the existence of negative relationship between board size and AC. The
reason could be the poor investor protection laws and weak CG stature in the
markets examined.
4.11.2 Board Independence and AC
The results show that board independence does not determine conservatism prac-
tices in Pakistan. These findings are consitent with those of Lim (2011) who also
report the absence of such a relationship in his study. The findings are inconsis-
tent with those of Nasr and Ntim (2017), Mohammed et al. (2017), Ahmed and
Duellman (2007) and Beekes et al. (2004) who report the existence of negative
association between board independence and AC. They argue that greater the
presence of independent directors on board, greater is the effectiveness of board
and less is the chance of occurrence of asymmetry in information.
The results are also not in consistent with that of Beasley and Salterio (2001)
who argue that the presence of outside directors on board reduce the tendency
to manage earnings and accruals thus reducing the chances of accounting num-
bers frauds and improve audit quality.However, the results of existing study are
consistent with that of Abdullah (2006) and Rahman and Ali (2006) who argue

Results and Discussions 133
that the existence of outside directors does not necessarily imply that they pos-
sess skills and expertise that limit the firms from employing financial reporting
manipulation practices hence the existence of no relationship between the number
of outside directors on board and level of AC is justifiable.
4.11.3 Board Activity and AC
The results show that greater attendence of board members negatively affect the
level of conservatism employed by firms in Pakistan. This is consistent with that
of Krishnan and Visvanathan (2008). However the results are not consistent with
that of Abbott et al. (2007) who show that frequency of meetings improve the
quality of financial reporting process. The results of this study are also not con-
sistent with that of Boussaid et al. (2015) who report that greater board activity
leads to employment of more conservatism.
4.11.4 Gender Diversity on Board and AC
The results show that the presence of more female members on the board nega-
tively effect the level of conservatism employed by firms. These results are not
consistent with that of Boussaid et al. (2015) who report that greater the num-
ber of female members more is the conservatism. According to them there are
three reasons for the existence of such a relationship. First the risk-averse and
less overconfident nature of female directors (Riley and Chow, 1992; Ambrose and
Schminke, 1999 and Krishnan and Visvanathan (2008)). Second, their ability to
think independently (Hillman and Dalziel, 2003). Third is their trust-building
leadership style. All these attributes make female members more tolerant and
hence pave the way for increasing boards effectiveness.
Moreover, Srinidhi et al. (2011) also find that the firm having higher percentage
of female directors exhibit more earnings quality and since the number of female
members on the board is less in Pakistan becasue of many environmental issues.
This might be the reason that this study has found the existence of a negative
relationship.

Results and Discussions 134
4.11.5 CEO Turnover and AC
The results show that the CEO turnover fail to effect the level of conservatism
employed by firms. It is interesting to note that the results are consistent with
that of Hazarika et al. (2012) who also report that if there is a voluntary CEO
turnover there is no significant change in the way the firms are being governed
hence there is no effect on financial reporting practices. But there is another side
of this coin, the three mentioned researchers also report that if the CEO turnover
is a forced one, it has impacts on strategic decisions of the firms and hence also
go for managing earnings. Since in this study most of the information is collected
from annual reports and news archives no significant proofs are found of forced
turnovers in case of Pakistani sample firms.
4.11.6 CEO Duality and AC
The results show that in case of Pakistan, CEO Duality has no association with the
level of conservatism employed by firms. These results are consistent with that of
Ahmed and Duellman (2007) who report insignificant results of CEO duality with
AC. The results are also consistent with that of Abdullah (2006) who also report
the inexistence of any significant impact of separation between the role of CEO
and Chairman of the board on financial reporting. One of the possible reasons of
existence of such an association might be the grey area between separation and
control. Since most of the firms are family controlled where the family members
have assured greater proportion of board to themselves, the existence of such a
relationship is explainable.The results are not consitent with those of Nasr and
Ntim (2017), Elshandidy and Hassanein (2015) and Chi et al. (2009). They report
the existence of positive impact of CEO Duality on AC. The reason is that if both
the offices i.e. head of the board and chief executive office are being held by single
person, the need to report managed accounting estimates is increased. Hence CEO
duliaty paves the way for more conservatism. The results are also not consistent
with those of Mohammed et al. (2017), Ahmed and Henry (2012) and Lim (2011).
They all report a negative association between the variables under discussion here.

Results and Discussions 135
4.11.7 Institutional ownership and AC
The results show that greater the percentage of shares held by institutions greater
is the level of conservatism employed by firms. These results are consistent with
those of Mohammed et al. (2017), Chi et al. (2009), Yunos (2011) and Ahmed
and Duellman (2007) who also report that substantial outsider shareholders do
play a role in improving accounting estimates’ informativeness by employing more
conservatism.
The existence of such a relationship is logical. The institutional shareholders
demand more transparent and quality accounting information. This need drags
the firms to install such governance mechanisms that employ more conservatism.
In case of Pakistan, the institutional shareholding is in significant proportion hence
the existence of such a relationship is not unique.
4.11.8 Managerial ownership and AC
The results show that there is no relationship between the managerial ownership
and level of AC employed by firms. The results are not consistent with that of
Mohammed et al. (2017), Yunos (2011) and Lafond and Roychowdhury (2008)
who state that the managerial ownership is one of the ways to mitigate agency
conflict by restricting the opportunistic behavior of the managers. They report
that if the managerial ownership is more the level of AC employed by the firms is
decreased.
One of the reasons for the inexistence of such a relationship in case of Pakistan
could be the Haniffa and Hudaib (2006) argument that in case of developing coun-
tries too much managerial ownership is unsuitable for business environment be-
cause of its role in increasing the risk of misallocating resources.
4.11.9 Audit Committee Independence and AC
The results show that percentage of independent directors on audit committee
is not related to the level of conservatism employed by firms. The results are

Results and Discussions 136
not consistent with those of Mohammed et al. (2017) and Abdullah (2006) who
report that there exist a relationship between independent members on the audit
committee and AC.
The results of this study can be explained in the light of the argument of Zain and
Subramaniam (2007) who stated that sometimes it so happen that those indepen-
dent members are made the part of the audit committee whose knowledge about
the firms business is limited thus cannot pave the way for employing conservatism.
4.11.10 Big Four Auditor and AC
The results show that presence of big auditor does not improve the level of con-
servatism employed by firms listed in Pakistan. The results are not consistent
with that of Nasr and Ntim (2017) and Mohammed et al. (2017) who report the
existence of a negative relationship between big five auditor and AC.
The results are not consistent with that of Rodriguez (2010) who report that in
case of conditional conservatism, the presence of big auditor has a positive impact
on AC. His argument is based on the contracting view of AC. This study fails
to find any such relationship. The reason of inexistence of such a relationship in
case of Pakistan is that no regulatory requirement exists for the firms to hire big
auditor to access the quality of financial reporting.
4.11.11 Composite Score of Firm Governance and AC
The results show that the stature of CG in a firm do have an impact on the level of
conservatism employed by the firms. The results are consistent with many studies
who try to analyze the impact of CG on AC.
Ren (2014), Yunos (2011), Rosilda (2009) are a few who have presented the same
argument that CG does have a say in deciding the level of AC that is employed by
the firms. Abdullah (2006), Haniffa and Hudaib (2006) and Ahmed and Duellman
(2007) are among those researchers who have examined individual CG mechanisms
and conclude that the CG positively impact conservatism.

Results and Discussions 137
4.11.12 CG, AC and Disclosure Quality
The results show that the estimation of equation 3.4 is not possible as the equation
3.3 fails to report a significant relationship between CG and AC in the presence of
disclosure quality as the IV (i.e. the first condition to go for moderation analysis
is not fulfilled). However the results show that there exist a moderating role of
disclosure quality on the relationship between CG and AC. This relationship is also
explainable. If there exist a relationship between CG and AC or we can say if the
governance statures demand more conservatism, the more disclosure requirements
could limit this behavior thus weakening the relationship between CG and AC.
4.11.13 Firm Size and AC
FS (Firm Size) is employed as one of the control variables in each of the three
equations estimated. Among these three equations, the first one examines the
role of CG mechanisms on AC where as the second equation explores the role of
CSFG on AC in the presence of a moderator. The third equation examines the
moderating role of DQ on CG-AC relationship.
The results of all three equations when estimated forPakistan fail to show the
existance of any relationship with AC. However the signs are negative. The in-
existance of a significacnt relationship can be explained by the fact that the data
is collected from top market capitalization firms. Since most of these firms are in
their growth stage their ability to recognize asymmetirc timeliness of earning is
not just affected by their size, hence no relationship is found in case of the data
set employed for this study. These results are not inline with those of Rahman
and Ali (2006) and Krishnan and Visvanathan (2008) who report the existance of
negative relationship of FS with AC.
4.11.14 Sales Growth and AC
GROS (Sales Growth) is also employed as one of the control variables in each of the
three equations estimated. Among these three equations, the first one examines

Results and Discussions 138
the role of CG mechanisms on AC where as the second equation explores the role
of CSFG on AC in the presence of a moderator. The third equation examines the
moderating role of DQ on CG-AC relationship. The results of all three equations
when estimated for Pakistan show that there does not exist any relationship of
GROS with AC. The possible reason for inexistance of such a relationship is that
the reporting practices restrict the accruals from affecting thus no contribution
towards conservatism.
4.11.15 Leverage and AC
LEV (Leverage) is used as a control variable in each of the three equations esti-
mated. The first equation as stated earlier examines the role of CG mechanisms
on AC where as the second equation explores the role of CSFG on AC in the
presence of a moderator. The third equation examines the moderating role of DQ
on CG-AC relationship. The results of all equation when estimated for Pakistan
do not show the existance of relationship with AC. The results are not in line with
those of Ahmed and Duellman (2007) and Krishnan and Visvanathan (2008). All
of these studies also report a positive impact of leverage on AC. The inexistance
of such a relationship can be defended by this argument that highly levered firms
who may employ more conservatism do not constitute major part of our data set
in case of Pakistan.
4.11.16 Profitability and AC
PROF (Profitability) is also employed as the control variable in each of the three
equations estimated. The first equation examines the role of CG mechanisms on
AC where as the second equation explores the role of CSFG on AC in the presence
of a moderator. The third equation examines the moderating role of DQ on CG-
AC relationship. The results of all three equations when estimated for Pakistan
do not show the existance of any relationship with AC. The results are not in line
with those of Ahmed et al. (2002), Ahmed and Duellman (2007), Krishnan and
Visvanathan (2008), Yunos (2011) and Ren (2014). All of these studies report a

Results and Discussions 139
positive impact of profitability on AC. The inexistance of such a relationship can
be defended by this argument that in case of Pakistan, even profitable firms tend
to reduce the costs that may incur becasue of the employment of conservatism.
4.11.17 Summary
Taking of Pakistan, the size of the board show no relationship with any of the
measures of AC hence concluding that board size does not affect the level of
conservatism employed by firms. Percentage of independent directors on board
also show no relationship with composite, skewness based as well as earnings based
measures of conservatism. However, there exists a significant relationship between
accruals based measures and AC. It is therefore concluded that board independence
does not affect AC. Board activity i.e. the number of board meetings attended
by a significant number of board members show a significant relationship with
composite, skewness based, accruals based as well as one of the two earnings
based measures. It can hence be concluded that board activity affects the level of
conservatism employed by listed firms in Pakistan. Again, the gender activity on
board i.e. percentage of female directors on board show a significant relationship
with composite, skewness based, accruals based as well as one of the two earnings
based measures. It is therefore concluded that gender diversity on board has a
significant relationship with AC. CEO turnover show no relationship with any of
the employed measures of AC. It is concluded that CEO turnover has no impact
on the level of conservatism employed by listed firms in Pakistan. CEO duality
i.e. if the CEO is aslo holding the position of chairman of the board show no
significant relationship with composite, skewness based, one of the two earnings
based and one of the two accruals based measures. Hence, it is concluded that
CEO duality has no role in determining the extent of AC employed by Pakistani
firms. Institutional shareholding i.e. percentage of shares held by institutions
show a significant relationship with composite, skewness based, accruals based
and one of the two earnings based measures. It is therefore concluded that the
institutional shareholding affects AC. The managerial shareholding i.e. Percentage
of shares held by insiders does not show any relationship with composite, one of

Results and Discussions 140
the two accruals based and one of the two earnings based measures of AC. However
there exist a relationship with skewness based and one of the two accruals based
as well as one of the two earnings based measures. It is therefore concluded that
the managerial shareholding does not affect the level of conservatism employed
by firms listed in Pakistan. Audit committee independence show a significant
relationship with only one of the two earnings based measures and does not show
any relationship with all other measures. It is concluded that audit committee
independence does not contributes to AC. Presence of big auditor only affects the
earnings based and one of the two accruals based measures and does not impact any
of the remaining measures of AC employed in this study. It is therefore concluded
that type of the auditor is not related to AC in Pakistan. The composite score
of firms governance is significantly related to composite, skewness based, one of
the two accruals based and one of the two earnings based measures of AC. Hence
it is concluded that CG has an impact on AC in case of Pakistan. The role of
disclosure quality as moderator is also evident from the results. Disclosure quality
is found to weaken the relationship between CG and composite, skewness based,
one of the two accruals based and one of the two earnings based measures of AC.
It is therefore concluded that disclosure quality does play the moderating role in
the relationship between CG and AC in case of Pakistan.

Chapter 5
Conclusion and Recommendation
This chapter encompasses four parts. First is the conclusion, followed by implica-
tions of this study. The section than follows is of limitations of the study. At the
end are the future research directions.
5.1 Conclusion
This study explores the impact of CG on AC and also the moderating role of
disclosure quality on this relationship in three emerging economies of South Asia.
This investigation is carried out by taking into account various CG mechanisms
as well as a composite measure of firms governance. It is interesting to note that
the results of three data sets vary in case of individual CG mechanisms, however
show similar results in case of composite measure. For example, institutional
shareholding and CEO duality has an impact on AC in case of Bangladesh, in
case of India board activity and audit committee independence are found to be
significantly related to AC and in case of Pakistan, board activity, gender diversity
on board and institutional ownership are found to be related with AC.
This study has found that AC is employed as a efficacious contraption in monitor-
ing the controlling shareholders because the firms choose to apply more conserva-
tive practices to reduce information asymmetry. Based on a composite measure
of AC that is developed from three distinct set of measures i.e. Accruals based,
141

Conclusion and Recommendations 142
Earnings based and skewness based measures, it is revealed that the CG itself
paves the way for higher conservatism in all three emerging economies of South
Asia. Moreover, disclosure quality is found to weaken the relationship between
CG and AC in all three data sets examined.
This study found that the percentage of shares held by institutions affects the level
of AC employed by firms listed in Bangladesh and Pakistan. However, this effect
is not visible in case of India. For those non-financial companies that are working
in Bangladesh and Pakistan, one can argue that greater the percentage of shares
held by institutions greater is the level of AC. The explanation of existence of
such a relationship is resided in Stakeholders theory and Positive Accounting The-
ory. The shareholders being the significant stakeholders and occupying a chunk in
ownership structure of the firms demand more transparent and quality informa-
tion. This demand compel the firms to employ more conservatism. The argument
is consistent with that of Yeo et. al. (2012), Ahmed and Duellman (2007) and
Yunos (2011). CEO duality is found to be impacting AC in case of Bangladesh
only. A simple argument can be presented to support the existence of this rela-
tionship. If the CEO hold the offices of CEO and chairman of the board, the need
to report managed conservative estimates is increased. This argument is in line
with Agency Theory as the CEO working as an agent will try to reduce agency
conflict hence employ more conservatism. This argument is consistent with that
of Nasr and Ntim (2017), Elshandidy and Hassanein (2015) and Chi et al. (2009).
It is found that the improved attendance of board members in the board meetings
affects the level of AC employed by firms working in India and Pakistan. One
reason of existence of such a relationship is the role of presence of more board
members in board meetings on the quality of financial reporting. This argument is
in line with Stewardship Theory. The managers working as stewards and internally
motivated act in the best interest of firms and hence employ more conservatism.
This particular finding is consistent with that of Abbott et al. (2007) who report
that improved attendance in board meetings improve the quality of financial re-
porting process. The percentage of independent directors on the audit committee
is also found to be related to the employed level of conservatism in case of India

Conclusion and Recommendations 143
only. The argument for the existence of such a relationship is simple. The inde-
pendent members possess more expertise and knowledge and it is this knowledge
that compels them to demand more conservatism. These findings are in line with
those of Mohammed et al. (2017) who also report the existence of such a relation-
ship. The presence of more female members on board also has an effect on the
level of conservatism in case of Pakistan. The argument for the existence of such a
relationship is also hidden in the stewardship theory. Boussaid et al. (2015) argue
that the risk-averse and less confident nature, independent thinking ability and
trust building leadership styles are three qualities of female directors that prompts
the increased use of AC.
5.2 Implications of the Study
This investigation renders concrete implications for all major users of financial
statements. The detailed implications are discussed as follows:
5.2.1 Implications for Theory
This study pronounces that both the theories i.e. agency theory and positive ac-
counting theory hold in case of three emerging economies of South Asia that are
being examined in this study. The CG stature somehow is designed to demand
more conservatism so that the information asymmetry could be reduced. More-
over increased disclosure quality reduces the demand for more conservatism in the
presence of concrete CG framework. In case of Bangladesh, CEOs having two
offices try to prove their abilities to monitor the firms to the stakeholders by em-
ploying more conservative accounting practices. Also the increased institutional
shareholding also demand more information from the firms thus compelling the
firms to employ more and more conservatism. The findings for Bangladesh sup-
port the agency theory perspective and also the positive accounting theory as it
is being empirically proved that the governance stature in listed firms persuade
them to go for employing conservative practices to reduce agency conflict by re-
ducing information asymmetry. Results also suggest that in order to maintain a

Conclusion and Recommendations 144
check on healthy governance-conservatism relationship the disclosure quality can
be employed as an effective tool.
In case of India, attendance of board members in board meetings that is marked as
a symbol of board effectiveness compels the board to employ more conservatism.
It is interesting to note that more effective the board, more is its tendency for
conservative financial reporting. Thus, the support for agency theory existence
in India is being documented empirically. Moreover, the presence of more inde-
pendent members on the audit committee is viewed as one of the mechanisms to
improve transparency. Hence, the existence of relationship between audit com-
mittee independence and AC represents empirical evidence in support of positive
accounting theory. The role played by disclosure quality in weakening the rela-
tionship between CG and AC is one of the mechanisms that can be installed to
keep in check the misuse of firms governance structures in manipulating financial
records.
In case of Pakistan, the significant effect of board activity again supports the
agency theory perspective where the boards that are considered to be more effec-
tive employ more conservatism with an intention to mitigate the agency conflicts.
Gender diversity on the board i.e. the presence of female directors on board show-
ing significant effects also marks the empirical hallmark for the existence of both
agency theory and positive accounting theory. The idea is simple i.e. the female
presence is thought to improve effectiveness of corporate boards hence help in re-
ducing agency conflicts and offering more accurate accounting estimates. Results
further suggest that the desired benefits that firms thought to take by employing
more conservative practices can only be realized if this employment is kept under
the radar and one such mechanism is improvement of disclosure quality.
It can hence be stated that in case of emerging economies of South Asia i.e.
Bangladesh, India and Pakistan, the results supports agency theory as well as
positive accounting theory in order to empirically address the relationship between
CG and AC. Moreover, in all the three economies, the improvement in disclosure
quality will actually help to uphold the existence of both the theories in their true
sense and spirit.

Conclusion and Recommendations 145
5.2.2 Implications for Policy Makers
The findings of this study suggest that the policy makers in emerging economies
should focus their efforts in identifying and implementing such practices or mech-
anisms that could limit the firms governance structures to go for employing un-
necessary conservatism while disclosing financial information to the stakeholders
and also improve the disclosure quality thus weakening the adverse effects of the
understudy relationship.
In case of Bangladesh, the policy makers should develop such policies that could
reduce CEOs intensions of holding two offices alongside setting forth concrete re-
porting requirements for institutional shareholders so that the fear of the firms
that compels them to employ conservative accounting practices could be over-
come. Due importance should be paid to the development and installation of such
mechanisms that could improve disclosure quality of the financial records that
used by most of the stakeholders as a means to inform themselves of the current
stature of the firms.
In case of India, the results suggest that the policy makers should consider those
means that could help the firms to identity the minimum level of attendance in
board meetings so that the effectiveness of the board could be improved without
employing more conservatism. Moreover, the number of independent members on
the audit committee should be suggested so that the adverse effects of employing
more conservatism as a consequence of increased independent directors presence
could be reduced. The policy makes should set forth concrete framework to step
wise improve disclosure quality in firms listed in India.
In case of Pakistan, the policy makers should try to set forth such mechanisms that
could suggest minimum percentage of members that should be present in a board
meeting followed by the maximum number of female directors on the board. Also
the reporting requirements for outsider shareholder should be made more detailed
instead of being vague so that the firms intention of offering controlled information
to outsider shareholders should be addressed. Moreover, such policies/rules and
procedures should be introduced that could improve disclosure quality.

Conclusion and Recommendations 146
5.2.3 Implications for Regulators
This results suggest that regulators in three emerging economies should pay atten-
tion to the installation of such mechanisms that could limit the CG mechanisms
from employing AC. Moreover these regulators show set forth more concrete frame-
work for the disclosure practices in the firms listed in these countries so that the
role of CG in AC should be reduced.
In case of Bangladesh, the role of CEO as chairman of the board as well should be
restrained so that this governance mechanism could not contribute to employing
more conservative accounting records. Moreover the maximum limit should be
imposed by the regulators on holding the number of shares by the institutions as
more the institutional shareholding more is the chance of conservatism. Lastly, as
stated earlier the regulators should set forth a detailed framework for timely and
item wise disclosure of each of the financial assets and obligations of the firms.
In case of India, the regulators should be more concerned about directing the firms
that more attendance in the board meeting is not the only thing that enhances
effectives of the board as it also contributes to increasing conservatism. The reg-
ulators should also set forth the limit on the presence of independent directors on
the audit committee as if more members are there they will though increase effec-
tiveness of the committee but at the expense of greater conservative accounting
estimates. Lastly the regulators should present the firms with detailed description
on the items that should be there in the financial statements and also the proce-
dures to properly disclose the existing items. All this should be done to enhance
the disclosure quality so that the relationship between CG and AC could be mod-
erated. In case of Pakistan, the regulators should pay attention to making the
firms aware of this reality that making sure of the attendance of board members
in meetings can though increase effectiveness of the board but cannot guarantee
the reduction in conservative accounting practices. Regulators in Pakistan are also
to address the issue of proportion of female participation in the boards so that
the issue of more conservatism because of more gendr diversity of board could
be addressed. Again like India, the regulators in Pakistan should set forth the
maximum limit on the purchase of shares by institutions in the firms. Lastly, the

Conclusion and Recommendations 147
regulators should set forth concrete rules for the disclosure of financial information
in accounting records so that the disclosure quality could be improved.
5.2.4 Implications for Researchers
This study offers the researchers a new sense to look into various phenomenon.
First it offers a chance to understand that how the results could change when a
new approach is employed to explore the already explained relationship as this
study employs a direct estimation approach for the exanimation of impacts of CG
on AC in three emerging economies of South Asia. Second this study also offers
the researchers a chance to understand the role of introduction of new attributes
of a single phenomenon in explaining AC as this study employs two new attributes
of CG and then examine their relationship with conservatism. Third, this study
also provide an insight to the researches that how the results could change if a
composite measure is employed to examine the relationship instead of only consid-
ering individual aspects both of CG and AC. Forth it also offers the explanation
on the subject matter of employing various measures of AC instead of using only
a single measure to evaluate AC. Last but not the least it helps the researches
to understand the role of disclosure quality in improving the relationship between
CG and AC in three contextually different but developing economies.
For the researchers who want to explore the impacts of CG on various strategic
decisions, the CEO duality and institutional ownership is especially to be addressed
because of their role in enhancing conservatism.
For the researchers who want to examine strategic decisions of firms and the role
of governance mechanisms should pay attention to including board activity and
audit committee independence as determinants of CG because of their contribution
towards improving the level of conservatism employed by firms.
For the researchers who intend to analyze various aspects of financial decision
making in the firms due diligence should be paid to addressing board activity,
gender diversity on board and institutional shareholding as the CG mechanisms
as their presence could alter the results of their investigations.

Conclusion and Recommendations 148
5.2.5 Implications for Financial Analysts and Investors
Financial analysts, fund managers and investors can make use of the results of this
study. First of all those analysts, fund managers and investors who have invested
or intend to invest in firms listed in Bangladesh should pay attention to investing
in those firms where CED duality is absent and institutional shareholding is not
much. If not there might be a chance that they will invest in those firms whose
position seem to be fine but have employed conservative accounting practices thus
increasing a chance of uncertainty in the returns that are to be offered by the
firms.
Secondly, those analysts, fund managers and investors who are thinking of invest-
ing in Indian listed firms should take into consideration the extent of board activity
and audit committee independence. Third, those investors who are interested to
purchase shares of firms that are listed in Pakistan should pay much attention to
making only those firms part of their portfolios in which gender diversity on board
as well as institutional ownership is not much otherwise there might be a chance
of investing in those firms who have employed more conservatism.
Lastly while diversifying the investments the analysts and the investors should
take a deep insight of both the CG stature as well as the disclosure practices
installed in these countries (i.e. emerging economies of South Asia) and should
not only stick to the information set forth by the firms via financial statements
and other periodic reports.
5.2.6 Implications for Creditors
Creditors can make use of the results of this study as well. This study offers
the creditors with a recommendation that they should never evaluate the firms
listed in Bangladesh, India and Pakistan by using the information presented in
their accounting records. Rather, they should ask the firms to prove additional
information especially regarding their governance statures and financial reporting
processes. This should be done because there is a chance that firms have employed
conservative accounting practices.

Conclusion and Recommendations 149
5.2.7 Implications for Auditors
Auditors should know that their assumption of high quality financial statements
if they are being closely monitored by board and internal auditing mechanism
is shattered by the results of this study. This study suggests that the auditors
should identify those CG mechanism that contribute to employing more conser-
vatism. Moreover, the auditors because of the difference in financial reporting
practices, CG statures and disclosure mechanism in three economies should pay
more attention in identifying those individual firm specific as well as economy or
market specific factors that can affect conservatism.
5.3 Limitations of this Study
This study contributes significantly to the body of knowledge. However, like any
research there are certain limitations of this study. These are as follows:
1. The sample in this study excludes all financial firms that are listed in three
economies understudy because of the difference in financial reporting prac-
tices. Hence the findings cannot be generalized to financial sectors of these
countries.
2. The study only examines the impact of internal governance mechanisms on
the level of AC. It might be possible that there could be some external or
country specific governance mechanisms that could also affect conservative
accounting practices.
3. The study considers only those internal CG mechanism whose quantitative
data is available from annual reports or other sources of the firm. No such
attribute that could reflect the personality of CEOs, CFOs or other man-
agers that could be gauged by conducting structured interviews is considered.
Hence this study can offer insight on the internal CG mechanism only and
not in any way on the decision making abilities of major pillars of governance
structure of the firms.

Conclusion and Recommendations 150
5.4 Future Research Direction
This study can be extended in the following ways:
1. This study can be replicated by considering the financial firms that are listed
in these economies. It is interesting to note that the financial firms include
commercial banks, investment banks, asset management companies, mutual
funds etc. The replication of this study for financial firms requires special
attention as the regulatory requirements in some countries vary with respect
to commercial banks and mutual funds. Exploring the same issue in financial
listed firms would be a challenge and if met could lead to setting forth
concrete recommendations for the firms listed in those sectors.
2. This study can also be extended by considering both the internal and external
governance mechanism that are thought to affect strategic decisions of the
firms. One such attempt could be to consider not only internal ESG factors
but also external ESG factors. ESG stands for environmental, social and
governance factors. Much attention is being paid to analyze the impact of
these factors from the view point of the firms. However there is still a gap
in analyzing both internal and external ESG factors.
3. Some qualitative measures of CG like personality and other traits of CEO,
CFO and managers that could alter their abilities in handling strategic de-
cisions of the firms can also be made the part of this study. This study
can also be extended by considering more traits of the managers like ethnic-
ity, religious inclination, work-family conflict managerial skill, stress bearing
capacity, job satisfaction etc.
4. Since its a contextual study the national culture of the country, adoption of
IFRS, judicial efficacy and other similar phenomenon could also be consid-
ered to better analyze the factors that could add fuel to the fire of conser-
vative accounting estimates.

Bibliography
Abbott, L. J., Parker, S., Peters, G. F., and Rama, D. V. (2007). Corporate
governance, audit quality, and the sarbanes-oxley act: Evidence from internal
audit outsourcing. Accounting Review, 82(4):803–823.
Abdullah, S. N. (2004). Board composition, ceo duality and performance among
malaysian listed companies. Corporate Governance, 4(4):47–61.
Abdullah, S. N. (2006). Directors’ remuneration, firm’s performance and corporate
governance in malaysia among distressed companies. Corporate Governance,
6(2):162–174.
Aburaya, R. (2012). The Relationship Between Corporate Governance And En-
vironmental Disclosure: UK Evidence. Doctoral thesis, Dhurham University,
UK.
Adams, R. and Mehran, H. (2012). Bank board structure and performance: Ev-
idence for large bank holding companies. Journal of Financial Intermediation,
21(2):243–267.
Ahmed, A. S., Billings, B. K., Morton, R. M., and Stanford, Harris, M. (2002).
The role of accounting conservatism in mitigating bondholder-shareholder con-
flicts over dividend policy and in reducing debt costs. The Accounting Review,
77(4):867–890.
Ahmed, A. S. and Duellman, S. (2007). Accounting conservatism and board of
director characteristics: An empirical analysis. Journal of Accounting and Eco-
nomics, 43(3):411–437.
151

Bibliography 152
Ahmed, H. L., Alam, M. J., Jafar, S. A., and Zaman, S. H. (2008). A conceptual
review on corporate governance and its effect on firms performance: Bangladesh
perspective. Econ Working Paper Series.
Ahmed, K. and Henry, D. (2012). Accounting conservatism and voluntary cor-
porate governance mechanisms by australian firms. Accounting & Finance,
52(3):631–662.
Ahmed, K., Hossain, M., and Adams, M. B. (2006). The effects of board com-
position and board size on the informativeness of annual accounting earnings.
Corporate Governance: An International Review, 14(5):418–431.
Artiach, T. and Clarkson, P. (2013). Conservatism disclosure and cost of equity
capita. Australian Journal of Management, 39(2):293–314.
Baker, H. K. and Anderson, R. (2011). Corporate governance: A synthesis of
theory research and practice. Working Paper.
Ball, R., Kothari, S., and Robin, A. (2000). The effect of international institu-
tional factors on properties of accounting earnings. Journal of Accounting and
Economics, 29(1):1–51.
Ball, R., Robin, A., and Sadka, G. (2008). Is financial reporting shaped by equity
markets or by debt markets? an international study of timeliness and conser-
vatism. Review of Accounting Studies, 13(2):168–205.
Ball, R. and Shivakumar, L. (2005). Earnings quality in uk private firms: compara-
tive loss recognition timeliness. Journal of Accounting and Economics, 39(1):83–
128.
Baltagi, B. H. (2008). Econometric analysis of panel data. Data Publications, NY,
USA.
Basu, S. (1997). The conservatism principle and the asymmetric timeliness of
earnings. Journal of Accounting and Economics, 24(1):3–37.

Bibliography 153
Beasley, M. S. and Salterio, S. E. (2001). The relationship between board char-
acteristics and voluntary improvements in audit committee composition and
experience. Contemporary Accounting Research, 18(4):539–570.
Beatty, A., Weber, J., and Yu, J. J. (2008). Conservatism and debt. Journal of
Accounting & Economics, 45(2):154–174.
Beaver, W. H. and Ryan, S. (2000). Biases and lags in book value and their effects
on the ability of the book-to-market ratio to predict book return on equity.
Journal of accounting research, 38(1):127–148.
Beekes, W., Pope, P., and Young, S. (2004). The link between earnings timeliness,
earnings conservatism and board composition: evidence from the uk. Corporate
Governance: An International Review, 12(1):47–59.
Belkaoui, A. (2001). Accounting theory, volume 2. Harcourt Brace Jovanovich,
Orlando, Florida, USA.
Belkaoui, A. (2012). Disclosure Quality Determinants and Consequences. Doctoral
thesis, Durham University, UK.
Beneish, M. (1998). A call for paper: Earnings management. Journal of Accounting
and Public Policy, 17(1):85–88.
Berardino, D. (2016). Corporate governance and firm performance in new tech-
nology ventures. Procedia Economics and Finance, 39(2):412–421.
Bhatt, P. and Bhatt, R. R. (2017). Corporate governance and firm performance in
malaysia. Corporate Governance International Journal of Business in Society,
17(1):123–154.
Blair, M. (1995). Ownership and control: rethinking corporate governance for the
twenty-first century. Brookings Institution, Washington DC, USA.
Bliss, J. H. (1924). Management through accounts, volume 1. The Ronald Press
Co., NY.

Bibliography 154
Boussaid, N., Hamza, Taher, T., and Sougne, D. (2015). Corporate board at-
tributes and conditional accounting conservatism: Evidence from french firms.
Journal of Applied Business Research, 31(3):1–20.
Brickley, J. A., Coles, J. L., and Jarrell, G. (1997). Leadership structure: Sep-
arating the ceo and chairman of the board. Journal of Corporate Finance,
3(3):189–220.
Brown, W. D., He, H., and Teitel, K. (2006). Conditional conservatism and the
value relevance of accounting earnings: An international study. European Ac-
counting Review, 15(4):605–626.
Cadbury, A. (1992). The Financial Aspects of Corporate Governance. Gee and
Co. Ltd., London, UK.
Campbell, K. and Minguezvera, A. (2008). Gender diversity in the boardroom
and firm financial performance. Journal of Business Ethics, 83(3):435–451.
Caskey, J. and Laux, V. (2017). Corporate governance, accounting conservatism,
and manipulation. Management Science, 63(2):424–437.
Chauhan, Y., Lakshmi, K. R., and Dey, D. K. (2016). Corporate governance
practices, self-dealings, and firm performance: Evidence from india. Corporate
Governance: The international journal of business in society, 12(3):274–289.
Chen, H. L. and Hsu, W. T. (2009). Family ownership, board independence, and
r & d investment. Family business review, 22(4):347–362.
Chen, L. H., Folsom, D. M., Paek, W., and Sami, H. (2013). Accounting con-
servatism, earnings persistence, and pricing multiples on earnings. Accounting
Horizons, 28(2):233–260.
Cheung, Y., Jiang, P., and Tan, W. (2010). A transparency disclosure index
measuring disclosures: Chinese listed companies. Journal of Accounting and
Public Policy, 29(3):259–280.

Bibliography 155
Chi, W., Liu, C., and Wang, T. (2009). What affects accounting conservatism:
A corporate governance perspective. Journal of Contemporary Accounting &
Economics, 5(1):47–59.
Cho, D. and Kim, J. (2007). Outside directors, ownership structure and firm prof-
itability in korea. Corporate Governance: An International Review, 15(2):239–
250.
Choi, J., Kwak, Y., and Choe, C. (2012). Earnings management surrounding ceo
turnover: Evidence from korea. Abacus, 50(1):1–36.
Chung, R., Firth, M., and Kim, J.-B. (2002). Institutional monitoring and oppor-
tunistic earnings management. Journal of Corporate Finance, 8(1):29–48.
Claessens, S., Djankov, S., Fan, J. P. H., and Lang, L. H. P. (1999). Expropriation
of minority shareholders: Evidence from east asia. World Bank Policy Research
Working Papers.
Cohen, D., Dey, A., and Lys, T. (2005). Trends in earnings management and
informativeness of earnings announcements in the pre- and post-sarbanes-oxley
periods. Working Paper.
Dalton, D. and Daily, C. (1999). Whats wrong with having friends on the board?
Across the Board, 2(1):28–32.
Davidson, R., Goodwinstewart, J., and Kent, P. (2005). Internal governance struc-
tures and earnings management. Accounting & Finance, 45(2):241–267.
Davis, J., Frankforter, S., Vollrath, D., and Hill, V. (2007). An empirical test of
stewardship theory. Journal of Business & Leadership, 3(1):4–50.
Davis, J. H., Schoorman, F. D., and Donaldson, L. (1997). Davis, schoorman, and
donaldson reply: The distinctiveness of agency theory and stewardship theory.
Academy of Management Review, 22(3):611–613.
Deegan, C. (2009). Financial accounting theory, volume 3. McGraw-Hill Australia
Pty Ltd., New South Wales, Australia.

Bibliography 156
Ding, Y., Zhang, H., and Zhang, J. (2007). Private vs state ownership and earnings
management: Evidence from chinese listed companies. Corporate Governance:
An International Review, 15(2):223–238.
Donaldson, L. and Davis, J. (1989). Ceo governance and shareholder returns:
Agency theory or stewardship theory. Academy of Management, 1(1):49–64.
Donovan, J., Frankel, R. M., and Martin, X. (2015). Accounting conservatism and
creditor recovery rate. The Accounting Review, 90(6):2267–2303.
Elshandidy, T. and Hassanein, A. (2015). Do ifrs and board of directors in-
dependence affect accounting conservatism? Applied Financial Economics,
24(16):1091–1102.
Fama, E. F. and Jensen, M. C. (1983). Separation of ownership and control.
Journal of Law & Economics, 26(2):301–326.
Francis, J. R. and Martin, X. (2010). Acquisition profitability and timely loss
recognition. Journal of Accounting & Economics, 49(2):161–178.
Freeman, R. D. (2010). Strategic Management: A Stakeholder Approach. Cam-
bridge University Press, NY, USA.
Garcia, L. J. M., Garcia, O. B., and Penalva, F. (2007). Accounting conservatism
and corporate governance. Review of Accounting Studies, 14(1):161–201.
Gillibrand, M. (2004). Corporate management essential for industrialization. The
Bangladesh Observer, Bangladesh.
Givoly, D. and Hayn, C. (2000). The changing time-series properties of earnings,
cash flows and accruals: Has financial reporting become more conservative?
Journal of Accounting and Economics, 29(3):287–320.
Goergen, M. (2012). International Corporate Governance. John Wiley & Sons,
Inc.

Bibliography 157
Graham, C. M., Cannice, M. V., and Sayre, T. L. (2002). Analyzing financial ana-
lysts: What they look for in financial reports and how they determine earnings’
quality. Journal of Management Research, 2(2):63–72.
Haniffa, R. and Hudaib, M. (2006). Corporate governance structure and perfor-
mance of malaysian listed companies. Journal of Business Finance & Account-
ing, 33(8):1034–1062.
Hazarika, S., Karpoff, J., and Nahata, R. (2012). Internal corporate governance,
ceo turnover, and earnings management. Journal of Financial Economics,
104(1):44–69.
Healy, P. and Wahlen, J. (1999). A review of the earnings management literature
and its implications for standard setters. Accounting Horizons, 13(2):365–383.
Hendriksen, E. S. (1977). Accounting Theory, volume 1. Irwin, Inc.
Hermalin, B. E. and Weisbach, M. S. (2003). Boards of directors as an endoge-
nously determined institution: a survey of the economic literature. Economic
Policy Review, 9(1):7–26.
Hillman, A. J. and Dalziel, T. (2003). Boards of directors and firm performance:
Integrating agency and resource dependence perspectives. Academy of Manage-
ment review, 28(3):383–424.
Hooy, C. W. and Hooy, G. K. (2017). The impact of corporate governance re-
form on firms control mechanisms and performance: Evidences from malaysia.
International Journal of Economics and Management, 11(1):205–224.
Horwath (2003). Corporate Governance Report (Sydney Australia: Horwath
(NSW), volume 1. Pty Limited, USA.
Huang, Y. S. and Wang, C.-J. (2017). Corporate governance and risk-taking of
chinese firms: The role of board size. International Review of Economics &
Finance, 37(2):96–113.
Ismail, H., Iskandar, T., and Rahmat, M. M. (2008). Corporate reporting quality,
audit committee and quality of audit. Malaysian Accounting Review, 7(1):21–43.

Bibliography 158
Iyengar, R. J. and Zampelli, E. M. (2010). Does accounting conservatism pay?
Accounting and Finance, 50(1):121–142.
Jaggi, B., Leung, S., and Gul, F. (2009). Family control, board independence
and earnings management: Evidence based on hong kong firms. Journal of
Accounting and Public Policy, 28(4):281–300.
Jensen, M. C. and Meckling, W. H. (1976). Theory of the firm: Managerial be-
havior, agency costs and ownership structure. Journal of Financial Economics,
3(4):305–360.
John, K. and Senbet, L. (1998). Corporate governance and board effectiveness.
Journal of Banking & Finance, 22(3):371–403.
Karamanou, I. and Vafeas, N. (2005). The association between corporate boards,
audit committees, and management earnings forecasts: An empirical analysis.
Journal of Accounting Research, 43(2):453–486.
Karim, R., Sarkar, J. B., and Fowzia, R. (2010). Corporate governance prac-
tices in bangladesh with reference to sec corporate governance guidelines. ASA
University Review, 4(2):124–179.
Khalid, A. M. and Hanif, M., N. (2005). Corporate governance for banks in pak-
istan: Recent developments and regional comparisons. CMER Working Paper.
Khodadadi, V., Khazami, S., and Aflatooni, A. (2010). The effect of corporate
governance structure on the extent of voluntary disclosure in iran. Business
Intelligence Journal, 3(2):151–164.
Kim, B. and Jung, K. (2007). The influence of tax costs on accounting conser-
vatism. KAIST, Business School Working Paper Series Index.
Klein, A. (2002). Audit committee, board of director characteristics, and earnings
management. Journal of Accounting and Economics, 33(3):375–400.
Krishnan, G. V. and Visvanathan, G. (2008). Does the sox definition of an ac-
counting expert matter? the association between audit committee directors’

Bibliography 159
accounting expertise and accounting conservatism. Contemporary Accounting
Research, 25(3):827–857.
Kung, F., Cheng, L., and James, K. (2010). Effects of corporate ownership struc-
ture on earnings conservatism. Asian Journal of Finance & Accounting, 2(1):46–
67.
Lafond, R. and Roychowdhury, S. (2008). Managerial ownership and accounting
conservatism. Journal of Accounting Research, 46(1):101–135.
LaFond, R. and Watts, R. L. (2008). The information role of conservatism. Ac-
counting Review, 83(2):447–478.
Lai, C. and Taylor, S. (2008). Estimating and validating a firm-year-specific mea-
sure of conservatism: Australian evidence. Working Paper, UNSW, AUS.
Lam, T. and Lee, S. (2012). Family ownership, board committees and firm per-
formance: Evidence from hong kong. Corporate Governance, 12(2):353–366.
Lara, J. M. G., Osma, B. G., and Neophytou, E. (2009). Earnings quality in
expost failed firms. Accounting and Business Research, 39(2):119–138.
Lavelle, L. (2002). Enron: How governance rules failed. Business Week, 21(3):28–
29.
Lim, R. (2011). Are corporate governance attributes associated with accounting
conservatism? Accounting & Finance, 51(4):1007–1030.
Lin, F., Wu, C. M., Fang, T. Y., and Wun, J. C. (2014). The relations among ac-
counting conservatism, institutional investors and earnings manipulation. Eco-
nomic Modelling, 37(1):164–174.
Lin, H. (2006). Accounting discretion and managerial conservatism: An intertem-
poral analysis. Contemporary Accounting Research, 23(4):1017–1041.
Lipton, M. and Lorsch, J. W. (1992). Modest proposal for improved corporate
governance. Journal of Business and Law, 1(1):48–59.

Bibliography 160
Lozano, M. B., Martinez, B., and Pindado, J. (2016). Corporate governance,
ownership and firm value: Drivers of ownership as a good corporate governance
mechanism. International Business Review, 25(6):1333–1343.
Lu, X. and Trabelsi, S. (2013). Information asymmetry and accounting conser-
vatism under ifrs adoption. SSRN Electronic Journal, 13(1):1–51.
Mahtab, N. and Islam, M., N. (2015). Corporate governance: A preliminary
study on current situation in bangladeshi companies and the need for corporate
governance. Research Journal of Finance and Accounting, 6(6):43–58.
Mashayekhia, B. and Bazazb, M. S. (2008). Corporate governance and firm perfor-
mance in iran. Journal of Contemporary Accounting & Economics, 4(2):156–172.
Mathiesen, H. (2002). Managerial ownership and financial performance. Ph.D.
Thesis Copenhagen Business School, Denmark, DK.
Ming, T. C. and Gee, C. S. (2002). The influence of ownership structure on the
corporate performance of malaysian public listed companies. ASEAN Economic
Bulletin, 25(2):195–208.
Mohammed, N., Ahmed, K., and Ji, X. (2017). Accounting conservatism, cor-
porate governance and political connections. Asian Review of Accounting,
25(2):288–318.
Monks, R. and Minow, N. (2001). Corporate Governance, volume 51. Prentice-Hall
Englewood Cliffs, NJ.
Nakpodia, F. and Adegbite, E. (2018). Corporate governance and elites. Account-
ing Forum, 42(1):17–31.
Nasr, M. and Ntim, C. (2017). Corporate governance mechanisms and accounting
conservatism: Evidence from egypt. Corporate Governance, 12(1):12–24.
Nvrvsh, I. and Hosseini, A. (2009). The relationship between disclosure quality
(availability and timeliness of disclosure) and earnings management. Journal of
Accounting and Auditing, 16(55):117–134.

Bibliography 161
Pandya, H. (2011). Corporate governance structures and financial performance of
selected indian banks. Journal of Management & Public Policy, 2(2):4–21.
Penman, S. H. and Zhang, X. J. (2002). Accounting conservatism, the quality of
earnings, and stock returnsy. The Accounting Review, 77(2):237–264.
Pfeffer, J. and Salancik, G. R. (1978). The External Control of Organizations: A
Resource Dependence Perspective. Harper and Row, NY, USA.
Pope, P. and Walker, M. (1999). International differences in the timeliness, conser-
vatism, and classification of earnings. Journal of Accounting Research, 37(1):53–
87.
Rahman, R. A. and Ali, F. H. M. (2006). Board, audit committee, culture
and earnings management: Malaysian evidence. Managerial Auditing Journal,
21(7):783–804.
Ramanna, K. and Watts, R. L. (2007). Evidence on the effects of unverifiable
fair-value accounting. Harvard Business School Working Paper, 8(1):1–53.
Ren, Y. (2014). Corporate governance, conservatism and firmperformance: Evi-
dence from China. Doctoral thesis, Edith Cowan University, Joondalup, AUS.
Rodriguez, M. (2010). Big auditors, private firms and accounting conservatism:
Spanish evidence. European Accounting Review, 19(1):131–159.
Rose, A. M. and Rose, J. M. (2008). Management attempts to avoid accounting
disclosure oversight: The effects of trust and knowledge on corporate directors
governance ability. Journal of business ethics, 83(2):193–205.
Rosilda, R. (2009). The relationship between Corporate Governance and Account-
ing Conservatism. Doctoral thesis, UNSW, AUS.
Rutherford, M. A., Buchholtz, A. K., and Brown, J. A. (2007). Examining the re-
lationships between monitoring and incentives in corporate governance. Journal
of Management Studies, 44(3):414–430.

Bibliography 162
Sajadi, H., Zaranejad, M., and Jafari, A. (2009). The effective non-financial char-
acteristics on the quality of financial reporting on accepted corporates on tehran
stocks exchange. Iranian Accounting and Auditing Reviews, 16(57):51–68.
Sarkar, J. B., Khan, S. R., and Alam, I. K. (2007). Compliance status of corporate
governance guidelines-public listed companies of bangladesh. The Chartered
Secretary, 1(1):1–23.
Shahwan, T. (2016). The effects of corporate governance on financial performance
and financial distress: evidence from egypt. Corporate Governance: The inter-
national journal of business in society, 15(1):641–662.
Shehzad, C. and Haan, J. (2015). Supervisory powers and bank risk taking. Jour-
nal of International Financial Markets, Institutions and Money, 6(2):1–39.
Shleifer, A. and Vishny, R. W. (1986). Large shareholders and corporate control.
The Journal of Political Economy, 1(1):461–488.
Shuto, A. and Takada, T. (2010). Managerial ownership and accounting conser-
vatism in japan: A test of management entrenchment effect. Journal of Business
Finance & Accounting, 37(8):815–840.
Soheilyfar, F., Tamimi, M., Ahmadi, M., and Takhtaei, N. (2014). Disclosure
quality and corporate governance: Evidence from iran. Asian Journal of Finance
& Accountingl, 6(1):1–75.
Srinidhi, B., Gul, F. A., and Tusi, J. (2011). Female directors and earnings quality.
Contemporary Accounting Research, 28(5):1610–1644.
Stolowy, H. and Breton, G. (2004). Accounts manipulation: A literature review
and proposed conceptual framework. Review of Accounting and Finance, 3(1):5–
92.
Subramaniam, N. (1978). Agency theory and accounting research: an overview
of some conceptual and empirical issues, in Methodological issues in accounting
research: theories and methods. Spiramus Press, London, UK.

Bibliography 163
Suleiman, S. and Anifowose, M. A. (2014). Corporate governance and conditional
accounting conservatism in nigeria listed food and beverages firmsl. Corporate
Governance, 1(1):1–24.
Sun, J. and Liu, G. (2011). The effect of analyst coverage on accounting conser-
vatism. Managerial Finance, 37(1):5–20.
Wallace, R. S. O. and Naser, K. (1995). Firm-specific determinants of the com-
prehensiveness of mandatory disclosure in the corporate annual reports of firms
listed on the stock exchange of hong kong. Journal of Accounting and Public
Policy, 14(4):311–368.
Watts, R. and J., Z. (1986). Positive Accounting Theory. Englewood Cliffs, NJ:
Prentice-Hall.
Watts, R. L. (2003). Conservatism in accounting part i: Explanations and impli-
cations. Accounting horizons, 17(3):207–221.
Wei, G. (2007). Ownership structure, corporate governance and company perfor-
mance in china. Asia Pacific business review, 13(4):519–545.
Witteveen, S. (2013). Earnings Management and Accounting conservatism. Mas-
ters thesis, Erasmus School of Economics, Erasmus University Rotterdam
Netherlands.
Wooldridge, J. (2002). Econometric Analysis of Cross Section and Panel Data.
MIT Press, USA.
Yang, J. S. and Krishnan, J. (2005). Audit committees and quarterly earnings
management. International Journal of Auditing, 9(2):201–219.
Yatim, P., Kent, P., and Clarkson, P. (2006). Governance structures, ethnicity, and
audit fees of malaysian listed firms. Managerial Auditing Journal, 21(7):757–
782.
Yeh, Y.-H., Chung, H., and Liu, C.-L. (201). Committee independence and
financial institution performance during the 200708 credit crunch: Evidence

Bibliography 164
from a multi-country study. Corporate Governance: An International Review,
19(5):437–458.
Yermack, D. (1996). Higher valuation of companies with small board of directors.
Journal of Financial Economics, 40(2):185–211.
Young, M. N., Peng, M. W., Ahlstrom, D., Bruton, G. D., and Jiang, Y. (2008).
Corporate governance in emerging economies: A review of the principalprincipal
perspective. Journal of management studies, 45(1):196–220.
Yunos, M. R. (2011). The effect of ownership concentration, board of directors,
audit committee and ethnicity on conservative accounting: Malaysian evidence.
Unpublished doctoral thesis, Edith Cowan University, Perth, AUS.
Zain, M. M. and Subramaniam, N. (2007). Internal auditor perceptions on audit
committee interactions: A qualitative study in malaysian public corporations.
Corporate Governance, 15(5):894–908.
Zhang, J. (2008). The contracting benefits of accounting conservatism to lenders
and borrowers. Journal of Accounting & Economics, 45(1):27–54.

Appendix
APPENDIX I
Classification of Sample Firms
Table 5.1: Classification of Bangladeshi Firms
Industry No of Firms
Cement 5
Ceramics Sector 4
Engineering 15
Food & Allied 9
Fuel & Power 12
IT Sector 3
Jute 2
Miscellaneous 7
Paper & Printing 1
Pharmaceuticals & Chemicals 16
Services & Real Estate 3
Tannery Industries 3
Telecommunication 2
Textile 18
Travel & Leisure 0
Total Companies 100
Source: Dhaka Stock Exchange
165

Annexure 166
Table 5.2: Names of Bangladeshi Firms
Names of Firms
1 ACI (ACI Limited)
2 ACIFORMULA (ACI Formulations Limited)
3 AFTABAUTO (Aftab Automobiles Limited)
4 AGNISYSL (Agni Systems Ltd.)
5 AL-HAJTEX (Al-Haj Textile Mills Limited)
6 ALLTEX (Alltex Industries Ltd.)
7 AMBEEPHA (Ambee Pharmaceuticals Ltd.)
8 AMCL (PRAN) (Agricultural Marketing Company Ltd. (Pran)
9 ANLIMAYARN (Anlimayarn Deying Ltd.)
10 ANWARGALV (Anwar Galvanizing Ltd.)
11 APEXFOODS (Apex Foods Limited)
12 APEXFOOT (Apex Footwear Limited.)
13 APEXSPINN (Apex Spinning & Knitting Mills Limited)
14 APEXTANRY (Apex Tannery Limited)
15 ARAMIT (Aramit Limited)
16 ARAMITCEM (Aramit Cement Limited)
17 ATLASBANG (Atlas Bangladesh Ltd.)
18 BANGAS (Bangas Ltd.)
19 BATASHOE (Bata Shoe Company (Bangladesh) Limited)
20 BATBC (British American Tobacco bangladesh Company Limited)
21 BDCOM (BDCOM Online Ltd.)
22 BDLAMPS (Bangladesh Lamps Limited)
23 BDTHAI (Bd.Thai Aluminium Ltd.)
24 BERGERPBL (Berger Paints Bangladesh Ltd.)
25 BEXIMCO (Bangladesh Export Import Company Ltd.)
26 BSC (Bangladesh Shipping Corporation)
27 BSCCL (Bangladesh Submarine Cable Company Limited)
28 BSRMSTEEL (BSRM Steels Limited)
29 BXPHARMA (Beximco Pharmaceuticals Ltd.)

Annexure 167
30 BXSYNTH (Beximco Synthetics Ltd.)
31 CONFIDCEM (Confidence Cement Ltd.)
32 CVOPRL (CVO Petrochemical Refinery Limited)
33 DACCADYE (The Dacca Dyeing & Manufacturing Co.Ltd.)
34 DAFODILCOM (Daffodil Computers Ltd.)
35 DESCO (Dhaka Electric Supply Company Ltd.)
36 EASTRNLUB (Eastern Lubricants Ltd.)
37 ECABLES (Eastern Cables Ltd.)
38 EHL (Eastern Housing Limited)
39 FUWANGCER (Fu-Wang Ceramic Industries Ltd.)
40 FUWANGFOOD (Fu Wang Food Ltd.)
41 GEMINISEA (Gemini Sea Food Ltd.)
42 GLAXOSMITH (GlaxoSmithKline (GSK) Bangladesh Ltd.)
43 GOLDENSON (Golden Son Ltd.)
44 GP (Grameenphone Ltd.)
45 GQBALLPEN (GQ Ball Pen Industries Ltd.)
46 HAKKANIPUL (Hakkani Pulp & Paper Mills Ltd.)
47 HEIDELBCEM (Heidelberg Cement Bangladesh Ltd.)
48 HRTEX (H.R.Textile Ltd.)
49 IBNSINA (The IBN SINA Pharmaceutical Industry Ltd.)
50 JAMUNAOIL (Jamuna Oil Company Limited)
51 KEYACOSMET (Keya Cosmetics Ltd.)
52 KOHINOOR (Kohinoor Chemicals Company (Bangladesh) Ltd.)
53 KPCL (Khulna Power Company Limited)
54 LIBRAINFU (Libra Infusions Limited)
55 LINDEBD (Linde Bangladesh Limited)
56 MAKSONSPIN (Maksons Spinning Mills Limite )
57 MALEKSPIN (Malek Spinning Mills Ltd.)
58 MARICO (Marico Bangladesh Limited)
59 MEGHNACEM (Meghna Cement Mills Ltd.)
60 METROSPIN (Metro Spinning Ltd.)

Annexure 168
61 MIRACLEIND (Miracle Industries Ltd.)
62 MITHUNKNIT (Mithun Knitting and Dyeing Ltd.)
63 MONNOCERA (Monno Ceramic Industries Ltd.)
64 MPETROLEUM (Meghna Petroleum Limited)
65 NORTHERN (Northern Jute Manufacturing Co. Ltd.)
66 NPOLYMAR (National Polymer Industries Ltd.)
67 NTC (National Tea Company Ltd.)
68 NTLTUBES (National Tubes Limited)
69 OAL (Olympic Accessories Limited)
70 ORIONINFU (Orion Infusion Ltd.)
71 ORIONPHARM (Orion Pharma Ltd.)
72 PADMAOIL (Padma Oil Co. Ltd.)
73 PHARMAID (Pharma Aids)
74 POWERGRID (Power Grid Company of Bangladesh Ltd.)
75 PRIMETEX (Prime Textile Spinning Mills Limited)
76 QUASEMIND (Quasem Industries Ltd.)
77 RAHIMTEXT (Rahim Textile Mills Ltd.)
78 RAKCERAMIC (RAK Ceramics (Bangladesh) Limited)
79 RANFOUNDRY (Rangpur Foundry Ltd. )
80 RECKITTBEN (Reckitt Benckiser (Bd.)Ltd. )
81 REGENTTEX (Regent Textile Mills Limited)
82 RENATA (Renata Ltd.)
83 RENWICKJA (Renwick Jajneswar& Co (Bd) Ltd.)
84 RNSPIN (R.N. Spinning Mills Limited)
85 RSRMSTEEL (Ratanpur Steel Re-Rolling Mills Limited)
86 SAIHAMCOT (Saiham Cotton Mills Limited)
87 SAIHAMTEX (Saiham Textile Mills Ltd.)
88 SALAMCRST (S. Alam Cold Rolled Steels Ltd.)
89 SAMORITA (Samorita Hospital Limited)
90 SAPORTL (Summit Alliance Port Limited)
91 SINGERBD (Singer Bangladesh Limited)

Annexure 169
92 SINOBANGLA (Sinobangla Industries Ltd.)
93 SPCERAMICS (Shinepukur Ceramics Limited)
94 SPCL (Shahjibazar Power Co. Ltd.)
95 SQUARETEXT (Square Textile Ltd.)
96 STANCERAM (Standard Ceramic Industries Ltd.
97 TALLUSPIN (Tallu Spinning Mills Ltd.
98 TITASGAS (Titas Gas Transmission & Dist. Co. Ltd.
99 USMANIAGL (Usmania Glass Sheet Factory Limited
100 ZEALBANGLA (Zeal Bangla Sugar Mills Ltd.)
Source: Dhaka Stock Exchange

Annexure 170
Table 5.3: Classification of Indian Firms
Industry No of Firms
2/3 Wheelers 3
Agrochemicals 5
Aluminium 2
Auto Parts & Equipment 2
Auto Tyres & Rubber Products 4
Broadcasting & Cable TV 1
Cars & Utility Vehicles 2
Cement & Cement Products 7
Cigarettes-Tobacco Products 1
Commercial Vehicles 3
Commodity Chemicals 2
Consumer Electronics 2
Electric Utilities 6
Exploration & Production 2
Fertilizers 1
Forest Products 1
Furniture-Furnishing-Paints 3
Heavy Electrical Equipment 3
Hotels 1
Household Appliances 1
Industrial Machinery 2
Integrated Oil & Gas 1
Iron & Steel/Interm.Products 4
Oil Marketing & Distribution 3
Other Apparels & Accessories 1
Other Elect.Equip./ Prod. 3
Packaged Foods 3
Personal Products 6
Pharmaceuticals 10
Plastic Products 2
Refineries/ Petro-Products 3
Sugar 2
Tea & Coffee 1
Telecom Cables 1
Textiles 6
Total Companies 100
Source: Bombay Stock Exchnage

Annexure 171
Table 5.4: Names of Indian Firms
Names of Firms
1 ABAN (ABAN OFFSHORE LTD)
2 ABB (ABB India Limited)
3 ACC (ACC LTD)
4 ADANIENT (ADANI ENTERPRISES LTD)
5 AMAL (AMAL LTD)
6 AMARAJABAT (AMARA RAJA BATTERIES LTD)
7 AMBUJACEM (AMBUJACEM)
8 AMTEKAUTO (AMTEK AUTO LTD)
9 APOLLOHOSP (APOLLO HOSPITALS ENTERPRISE LTD)
10 APOLLOTYRE (APOLLO TYRES LTD)
11 ASHOKLEY (ASHOK LEYLAND LTD)
12 ASIANPAINT (ASIAN PAINTS LTD)
13 ATUL (ATUL LTD)
14 BAJAJELEC (BAJAJ ELECTRICALS LTD)
15 BALKRISIND (BALKRISHNA INDUSTRIES LTD.)
16 BATAINDIA (BATA INDIA LTD.)
17 BAYERCROP (BAYER CROPSCIENCE LTD)
18 BEL (BHARAT ELECTRONICS LTD)
19 BEML (BEML LTD)
20 BERGEPAINT (BERGER PAINTS INDIA LTD)
21 BHARATFORG (BHARAT FORGE LTD)
22 BHEL (BHARAT HEAVY ELECTRICALS LTD)
23 BOSCHLTD (BOSCH LTD)
24 BRITANNIA (BRITANNIA INDUSTRIES LTD)
25 CASTROLIND (CASTROL INDIA LTD)
26 CEATLTD (CEAT LTD)
27 CENTURYTEX (CENTURY TEXTILES & INDUSTRIES LTD)
28 CESC (CESC LTD)
29 COROMANDEL (COROMANDEL INTERNATIONAL LTD)

Annexure 172
30 CROMP (Crompton Greaves Consumer Electricals Ltd)
31 CUMMINSIND (CUMMINS INDIA LTD)
32 CYIENT (Cyient Limited)
33 EICHERMOT (EICHER MOTORS LTD)
34 ENGINERSIN (ENGINEERS INDIA LTD)
35 ESCORTS (ESCORTS LTD.)
36 EXIDEIND (EXIDE INDUSTRIES LTD)
37 FINCABLES (FINOLEX CABLES LTD)
38 GET& D (GE T& D India Ltd)
39 GMDCLTD (GUJARAT MINERAL DEVELOPMENT CORPORA-
TION LTD)
40 GODREJIND (GODREJ INDUSTRIES LTD)
41 GSFC (GUJARAT STATE FERTILIZERS & CHEMICALS LTD)
42 GSKCONS (GSKCONS)
43 HAVELLS (HAVELLS INDIA LTD)
44 HCC (HINDUSTAN CONSTRUCTION CO.LTD)
45 HEROMOTOCO (HERO MOTOCORP LTD.)
46 HEXAWARE (HEXAWARE TECHNOLOGIES LTD)
47 HINDALCO (HINDALCO INDUSTRIES LTD)
48 ”HINDCOPPER (HINDUSTAN COPPER LTD.) ”
49 INDHOTEL (INDIAN HOTELS CO.LTD)
50 INDIACEM (INDIA CEMENTS LTD)
51 INFY (INFOSYS LTD)
52 IOC
53 ITC (ITC)
54 JKLAKSHMI (JK LAKSHMI CEMENT LTD)
55 JKTYRE (JK TYRE & INDUSTRIES LTD)
56 JSWSTEEL (JSW STEEL LTD)
57 KAJARIACER (KAJARIA CERAMICS LTD)
58 KANSAINER (KANSAI NEROLAC PAINTS LTD)
59 LAXMIMACH (LAKSHMI MACHINE WORKS LTD)

Annexure 173
60 LT (LARSEN & TOUBRO LTD.)
61 MARP (MANGALORE REFINERY & PETROCHEMICALS LTD)
62 MONSANTO (MONSANTO INDIA LTD)
63 MOTHERSUMI (MOTHERSON SUMI SYSTEMS LTD)
64 MPHASIS (MPHASIS LTD)
65 MRF (MRF LTD)
66 NATIONALUM (NATIONAL ALUMINIUM CO.LTD)
67 NCC (NCC Limited)
68 NESTLEIND (NESTLE INDIA LTD.)
69 NLCINDIA (NLC India Ltd)
70 ONGC (OIL AND NATURAL GAS CORPORATION LTD)
71 PETRONET (PETRONET LNG LTD)
72 PIIND (PI Industries Ltd)
73 POLYCHEM (POLYCHEM LTD)
74 RAJESHEXPO (RAJESH EXPORTS LTD)
75 RALLIS (RALLIS INDIA LTD)
76 RAMCOCEM (The Ramco Cements Limited)
77 RELIANCE (RELIANCE INDUSTRIES LTD)
78 RELINFRA (RELIANCE INFRASTRUCTURE LTD)
79 SAIL 9STEEL AUTHORITY OF INDIA LTD)
80 SHREECEM (SHREE CEMENT LTD)
81 SIEMENS (SIEMENS LTD)
82 SKFINDIA (SKF India Ltd)
83 TATACHEM (TATA CHEMICALS LTD)
84 TATAELXSI (TATA ELXSI LTD)
85 TATAMOTORS (TATA MOTORS LTD)
86 TATAPOWER (TATA POWER CO.LTD)
87 TATASTEEL (TATA STEEL LTD)
88 THERMAX (THERMAX LTD)
89 TITAN (Titan Company Limited)
90 TRENT (TRENT LTD)

Annexure 174
91 TTKPRESTIG (TTK PRESTIGE LTD)
92 TNSTLTU (AMILNADU STEEL TUBES LTD)
93 TVSMOTOR (TVS MOTOR COMPANY LTD)
94 UPL (UPL Limited)
95 VEDL (Vedanta Limited)
96 VIDEOIND (VIDEOCON INDUSTRIES LTD)
97 VOLTAS (VOLTAS LTD)
98 WELCORP (Welspun Corp Limited)
99 WIPRO (WIPRO LTD)
100 ZEEL (ZEE ENTERTAINMENT ENTERPRISES LTD)
Source: Bombay Stock Exchange

Annexure 175
Table 5.5: Classification of Pakistani Firms
Industry No of Firms
Automobile assembler 8
Automobile parts and Accessories 5
Cable and electrical goods 4
Cement 11
Chemical 11
Engineering 5
Fertilizer 2
Food and personal care products 6
Glass and ceramics 4
Jute 0
Leather and tanneries 1
Media 0
Miscellaneous 0
Oil and gas exploration companies 1
Oil and gas marketing companies 3
Paper and board 3
Pharmaceuticals 6
Power generation and distribution 3
Refinery 3
Sugar and allied industries 7
Synthetic and rayon 2
Technology and Communication 0
Textile composite 8
Textile spinning 4
Textile weaving 2
Tobacco 1
Transport 0
Vanaspati and allied industries 0
Woolen 0
Total Companies 100
Source: Pakistan Stock Exchange (Former Karachi Stock Exchnage)

Annexure 176
Table 5.6: Names of Pakistani Firms
Names of Firms
1 AABS (Al-Abbas Sugar Mills Limited)
2 ABOT (Abbot Laboatories (Pakistan) Limited)
3 ACPL (Attock Cement (Pakistan) Limited)
4 APL (Attock Petroleum Limited)
5 ARPL (Archroma Pakistan Limited)
6 ASHT (Ashfaq Textile Mills Limited)
7 ATBA (Atlas Battery Limited)
8 ATLH (Atlas Honda Limited)
9 ATRL (Attock Refinery Limited)
10 BATA (Bata Pakistan Limited)
11 BERG (Berger Paints Pakistan Limited)
12 BGL (Baluchistan Glass Limited)
13 BIFO (Biafo Industries Limited)
14 BTL (Blessed Textile Mills Limited)
15 BUXL (Buxly Paints Limited)
16 BWCL (Bestway Cement Limited)
17 CEPB (Century Paper and Board Mills Limited)
18 CFL (Crescent Fibres Limited)
19 CHCC (Cherat Cement Company Limited)
20 CLOV (Clover Pakistan Limited)
21 COLG (Colgate Palmolive (Pakistan) Limited)
22 COST ((Colony) Sarhad Textile Mills Limited)
23 CRTM (Crescent Textile Mills Limited)
24 CSAP (Crescent Steel & Allied Products Limited)
25 CTM (Colony Textile Mills Limited)
26 DBCI (Dadabhoy Cement Industries Limited)
27 DCL (Dewan Cement Limited)
28 DGKC (D.G. Khan Cement Company Limited)
29 DLL (Dawood Lawrancepur Limited)

Annexure 177
30 DWSM (Dewan Sugar Mills Limited)
31 DYNO (Dynea Pakistan Limited)
32 EMCO (Emco Industries Limited)
33 ENGRO (Engro Corporation Limited)
34 EXIDE (Exide Pakistan Limited)
35 FASM (Faisal Spinning Mills Limited)
36 FEROZ (Ferozsons Laboratories Limited)
37 FFBL (Fauji Fertilizer Bin Qasim Limited)
38 FFC (Fauji Fertilizer Company Limited)
39 GHNI (Ghandhara Industries Limited)
40 GTYR (General Tyre and Rubber Co. of Pakistan Limited)
41 GWLC (Gharibwal Cement Limited)
42 HABSM (Habib Sugar Mills Limited)
43 HCAR (Honda Atlas Cars (Pakistan) Limited)
44 HINO (HinoPak Motors Limited)
45 HINOON (Highnoon Laboratories Limited)
46 HSPI (Huffaz Seamless Pipe Industries Limited)
47 HUBC (Hub Power Company Limited)
48 ICI (I.C.I. Pakistan Limited)
49 ICL (Ittehad Chemical Limited)
50 INDU (Indus Motor Company Limited)
51 ISIL (Ismail Industries Limited)
52 JPGL (Japan Power Generation Limited)
53 KML (Kohinoor Mills Limited)
54 KOHC (Kohat Cement Limited)
55 KOHTM (Kohat Textile Mills Limited)
56 KASB (K.S.B. Pumps Co. Limited)
57 KTML (Kohinoor Textile Mills Limited)
58 LOTCHEM (Lotte Chemical Pakistan Limited)
59 LUCK (Lucky Cement Limited)
60 MARI (Mari Petroleum Company Limited)

Annexure 178
61 MEHT (Mehmood Textile Mills Limited)
62 MIRKS (Mirpurkhas Sugar Mills Limited)
63 MLCP (Maple Leaf Cement Factory Limited)
64 MRNS (Mehran Sugar Mills Limited)
65 MSOT (Masood Textile Mills Limited)
66 MTL (Millat Tractors Limited)
67 NATF (National Foods Limited)
68 NCL (Nishat Chunian Limited)
69 NESTLE (Nestle Pakistan Limited)
70 NML (Nishat Mills Limited)
71 NONS (Noon Sugar Mills Limited)
72 NRL (National Refinery Limited)
73 OGDC (Oil and Gas Development Company Limited)
74 PAKT (Pakistan Tobacco Company Limited)
75 PCAL (Pakistan Cables Limited)
76 PELPS (Pak Elektron(Pref))
77 PIOC (Pioneer Cement Limited)
78 PKGS (Packages Limited)
79 PNSC (Pakistan National Shipping Corporation Limited)
80 POL (Pakistan Oilfields Limited)
81 PPL (Pakistan Petroleum Limited)
82 PRL (Pakistan Refinery Limited)
83 PSO (Pakistan State Oil Company Limited)
84 PTC (Pakistan Telecommunication Company Limited)
85 QUET (Quetta Textile Mills Limited)
86 RUPL (Rupali Polyester Limited)
87 SAPL (Sanofi-Aventis Pakistan Limited)
88 SAZEW (Sazgar Engineering Works Limited)
89 SEARL (The Searle Company Limited)
90 STCL (Shabbir Tiles and Ceramics Limited)
91 SEPL (Security Paper Limited)

Annexure 179
92 SHEL (Shell Pakistan Limited)
93 SIEM (Siemens Pakistan Engineering Co. Limited)
94 SITM (Sitara Chemical Industries Limited)
95 SNGP (Sui Northern Gas Pipelines Limited)
96 TGL (Tariq Glass Industries Limited)
97 UPFL (Unilever Pakistan Foods Limited)
98 WTL (WorldCall Telecom Limited)
99 WYETH (Wyeth Pakistan Limited)
100 ZIL (ZIL Limited)
Source: Pakistan Stock Exchange
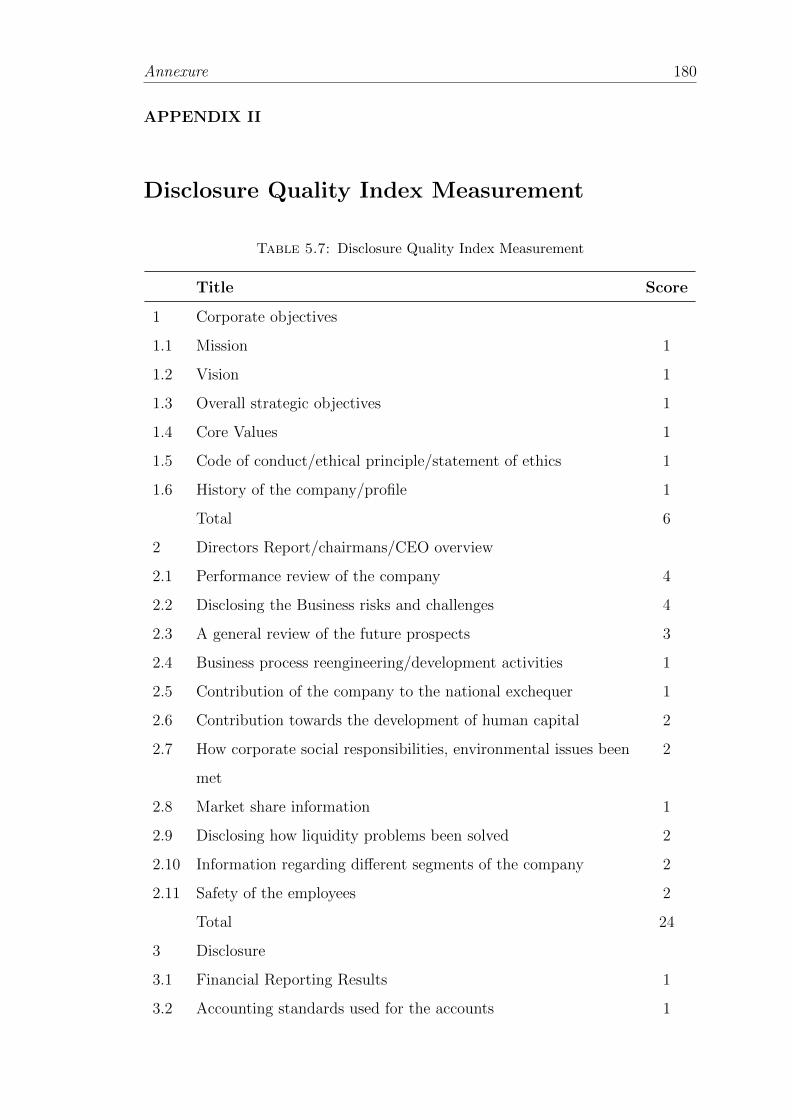
Annexure 180
APPENDIX II
Disclosure Quality Index Measurement
Table 5.7: Disclosure Quality Index Measurement
Title Score
1 Corporate objectives
1.1 Mission 1
1.2 Vision 1
1.3 Overall strategic objectives 1
1.4 Core Values 1
1.5 Code of conduct/ethical principle/statement of ethics 1
1.6 History of the company/profile 1
Total 6
2 Directors Report/chairmans/CEO overview
2.1 Performance review of the company 4
2.2 Disclosing the Business risks and challenges 4
2.3 A general review of the future prospects 3
2.4 Business process reengineering/development activities 1
2.5 Contribution of the company to the national exchequer 1
2.6 Contribution towards the development of human capital 2
2.7 How corporate social responsibilities, environmental issues been
met
2
2.8 Market share information 1
2.9 Disclosing how liquidity problems been solved 2
2.10 Information regarding different segments of the company 2
2.11 Safety of the employees 2
Total 24
3 Disclosure
3.1 Financial Reporting Results 1
3.2 Accounting standards used for the accounts 1

Annexure 181
3.3 Comprehensive related party disclosure 1
3.4 Disclosure of all changes in corresponding figures 1
3.5 Adequate disclosure of significant judgment and estimates 1
3.6 Detailed disclosure of Financial instruments 1
3.7 Further disclosure of facilities provided to CEO and Directors 1
3.8 Detailed disclosure of all contingencies and commitments 1
3.9 Adequate disclosure of new accounting standard 1
3.1 Detailed capacity disclosure 1
3.11 Segmental analysis 1
3.12 Cash flow statement based on direct method 1
3.13 Disclosure of fair value of property, plant and equipment 1
3.14 Adequate disclosure of change in accounting policy 1
3.15 Expenditure on Research and development 1
3.16 Information on Auditors 1
3.17 Disclosure of how much is paid to Auditors 1
3.18 Number of employees 1
Total 18
4 Stake holders Information
Information relevant for users of financial statements
4.1 Investor information for 6 years 10
1 Gross profit ratio 0.4
2 EBITDA Margin to sales 0.4
3 Net profit to sales 0.4
4 Return on equity 0.4
5 Return on capital employed 0.4
6 Weighted average cost of debt 0.4
7 Inventory turnover ratio/No of days in inventory 0.4
8 Debtor turnover ratio/ No of days in receivable 0.4
9 Creditor turnover ratio/ No of days in payables 0.4
10 Operating cycle 0.4
11 Total assets turnover ratio/ Fixed assets turnover ratio 0.4

Annexure 182
12 Current ratio 0.4
13 Quick / Acid test ratio 0.4
14 Price earnings ratio 0.4
15 Cash dividend per share 0.4
16 Bonus shares issued 0.4
17 Dividend yield ratio 0.4
18 Dividend payout ratio 0.4
19 Dividend cover ratio 0.4
20 Debt: equity ratio 0.4
21 Interest cover ratio 0.4
22 Breakup value per share without surplus effect 0.4
23 Breakup value per share including surplus effect 0.4
24 Market value per share at the end of the year 0.4
25 EBTIDA 0.4
Total 10
4.2 Summary of cash flow statements for six year 1
Shareholders information
4.3 Shares held by sponsors / directors/ executive 1
4.4 Vertical horizontal analysis for 6 years 4
4.5 Statement of value added distributed to stakeholders 4
Total 20
5 Corporate Governance Disclosures
5.1 Date of authorization of financial statements by the Board 10
Within 45 days (10 marks)
Within 60 days (7 marks)
Within 75 days (4 marks)
5.2 Statement of compliance with code of corporate governance 1
5.3 The board structure and its committees 1
5.4 Chairman of the board other than CEO 1
5.5 Information on the Board committees
A Information on the Board committees

Annexure 183
B Terms of references
C Number of meetings held
5.6 Role and function of the board of directors 2
5.7 Salient features of the audit committee charter 1
5.8 Name of independent Directors to be disclosed 1
5.9 Disclose for all members of board of directors 2
A Profile of each director
B Involvement /engagement of each director
5.1 Non executive directors on the audit committee 2
5.11 Name list of board attendance 2
5.12 Training and development activities for directors 2
5.13 Organizational chart 1
5.14 Disclosure of criteria to evaluate Board performance 1
5.15 CEO performance review 1
5.16 Event Calendar 1
Total 32
Grand Total 100

Annexure 184
APPENDIX III
Additional Analyses for Bangladesh
Two additional analyses are being performed. The first set of following section
reports the results of panel data regression analysis involving CG as the categorical
variables i.e. converted into good, bad and moderate governance. The second
section reports the results of ordered probit regression analysis involving AC as
the categorical variable.
Table 5.8: Results of ACACC and Good, Moderate and Bad CG
Variables Predicted Sign Coefficients t- Statistic
Constant 1.262 1.292
GG + 0.324 2.014**
MG - 0.474 2.208**
BG - 0.803 2.453**
FS - -0.469 -1.732*
GROS - 0.183 0.63
LEV + -0.009 -0.096
PROF + -0.988 -1.38
Adj R2 0.432
F-Statistic 6.014***
*,**,*** = statistically significant at less than 0.10, 0.05 and 0.01ACACC = Accruals based first measure of AC, GG = Good Governance, BG = Bad Governance,
MG = Moderate Governance, FS = Firm Size, GROS= Sales Growth, PROF = Profitability
ACACC and Good, Moderate and Bad CG
Table 5.8 shows the results of fixed effect regression for ACACC and proxies for
GG, MG and BG. The adjusted R squared is 0.434 meaning that 43.4 percent
of the variation in dependent variable is because of the considered independent
variables. The F-statistic is also significant meaning that the model is a good fit.
The GG and MG are significant. The results are consistent with many studies
that are there in the literature as both GG and MG are found to be significanlty
related to AC. These results also pave the way for the investigation with other AC
proxies.

Annexure 185
Table 5.9: Results of ACCIC and Good, Moderate and Bad CG
Variables Predicted Sign Coefficients t- Statistic
Constant -2.267 -3.179***
GG + 0.408 2.759***
MG - 0.526 2.529**
BG - 0.652 2.324**
FS - 0.038 0.204
GROS - -0.084 -0.504
LEV + -0.059 -0.599
PROF + -1.461 -2.323**
Adj R2 0.707
F-Statistic 16.935***
*,**,*** = statistically significant at less than 0.10, 0.05 and 0.01ACCIC = Accruals based second measure of AC, GG = Good Governance, BG = Bad Gover-
nance, MG = Moderate Governance, FS = Firm Size, GROS= Sales Growth, PROF = Prof-itability
ACCIC and Good, Moderate and Bad CG
Table 5.9 shows the results of fixed effect regression for ACCIC and proxies for
GG, MG and BG. The adjusted R squared is 0.707 meaning that 70.7 percent
of the variation in dependent variable is because of the considered independent
variables. The F-statistic is also significant meaning that the model is a good fit.
The GG, MG and BG all are significant. The results are consistent with many
studies that are there in the literature as all GG, MG and BG are found to be
significanlty related to AC.
ACCIE and Good, Moderate and Bad CG
Table 5.10 shows the results of fixed effect regression for ACCIE and proxies for
GG, MG and BG. The adjusted R squared is 0.649 meaning that 64.9 percent
of the variation in dependent variable is because of the considered independent
variables. The F-statistic is also significant meaning that the model is a good fit.
The MG is significant. The results are consistent with many studies that are there
in the literature as MG is found to be significanlty related to AC.

Annexure 186
Table 5.10: Results of ACCIE and Good, Moderate and Bad CG
Variables Predicted Sign Coefficients t- Statistic
Constant 0.273 0.512
GG + 0.014 0.097
MG - -0.298 -1.658*
BG - -0.288 -1.321
FS - -0.035 -0.248
GROS - -0.02 -0.094
LEV + -0.048 -0.674
PROF + 0.045 0.063
Adj R2 0.649
F-Statistic 13.191***
*,**,*** = statistically significant at less than 0.10, 0.05 and 0.01ACCIE = Earnings based measure of AC, GG = Good Governance, BG = Bad Governance,
MG = Moderate Governance, FS = Firm Size, GROS= Sales Growth, PROF = Profitability
Table 5.11: Results of ACSKEW and Good, Moderate and Bad CG
Variables Predicted Sign Coefficients t- Statistic
Constant -0.043 -0.073
GG + 0.082 0.576
MG - 0.219 1.207
BG - 0.144 0.626
FS - -0.012 -0.078
GROS - -0.245 -1.795*
LEV + -0.032 -0.552
PROF + 0.365 0.847
Adj R2 0.424
F-Statistic 5.862***
*,**,*** = statistically significant at less than 0.10, 0.05 and 0.01ACSKEW = Skewness based measure of AC, GG = Good Governance, BG = Bad Governance,
MG = Moderate Governance, FS = Firm Size, GROS= Sales Growth, PROF = Profitability
ACSKEW and Good, Moderate and Bad CG
Table 5.11 shows the results of fixed effect regression for ACSKEW and proxies
for GG, MG and BG. The adjusted R squared is 0.424 meaning that 42.4 percent
of the variation in dependent variable is because of the considered independent
variables. The F-statistic is also significant meaning that the model is a good fit.

Annexure 187
All the three caegorical variables i.e. GG, MG and BG are insignificant. The
results are consistent with many studies that are there in the literature as GG,
MG and BG are found to be not significanlty related to AC. These results also
pave the way for the investigation with other AC proxies.
Table 5.12: Results of ACSOE and Good, Moderate and Bad CG
Variables Predicted Sign Coefficients t- Statistic
Constant -0.741 -0.744
GG + -0.227 -0.943
MG - -0.071 -0.233
BG - 0.034 0.085
FS - 0.162 0.559
GROS - 0.002 0.008
LEV + 0.286 1.928**
PROF + 1.563 2.128**
Adj R2 0.044
F-Statistic 1.301***
*,**,*** = statistically significant at less than 0.10, 0.05 and 0.01ACSOE = Sensitivity of earnings to bad news relative to sensitivity of earnings to good news,
GG = Good Governance, BG = Bad Governance, MG = Moderate Governance, FS = FirmSize, GROS= Sales Growth, PROF = Profitability
ACSOE and Good, Moderate and Bad CG
Table 5.12 shows the results of fixed effect regression for ACSOE and proxies for
GG, MG and BG. The adjusted R squared is 0.044 meaning that 4.4 percent of the
variation in dependent variable is because of the considered independent variables.
The F-statistic is also significant meaning that the model is a good fit. All the
three caegorical variables i.e. GG, MG and BG are insignificant.
ACCOMP and Good, Moderate and Bad CG
Table 5.13 shows the results of fixed effect regression for ACCOMP and proxies
for GG, MG and BG. The adjusted R squared is 0.629 meaning that 62.9 percent
of the variation in dependent variable is because of the considered independent

Annexure 188
Table 5.13: Results of ACCOMP and Good, Moderate and Bad CG
Variables Predicted Sign Coefficients t- Statistic
Constant -0.176 -0.182
GG + 0.515 2.690***
MG - 0.503 2.026**
BG - 0.74 2.219
FS - -0.332 -1.256
GROS - 0.027 0.11
LEV + -0.151 -1.227
PROF + -1.853 -3.683***
Adj R2 0.629
F-Statistic 12.201***
*,**,*** = statistically significant at less than 0.10, 0.05 and 0.01ACCOMP = Composite measure of AC, GG = Good Governance, BG = Bad Governance, MG
= Moderate Governance, FS = Firm Size, GROS= Sales Growth, PROF = Profitability
variables. The F-statistic is also significant meaning that the model is a good fit.
The GG and MG are significant. The results are consistent with many studies
that are there in the literature as both GG and MG are found to be significanlty
related to AC.
ACACCC and CG (where AC is Categorical)
This section encompasses the results of those regression models that are employed
to test the effect of CG on AC but with a change in the nature of dependent
variable. The dependent variable i.e. AC is converted into the categorical variable
and hence logistic regression models are estimated. Table 5.14 shows the results of
ordered probit regression for ACACCC (Categorical variable for ACACC) and CG
Mechanisms. The Pseudo R squared is 0.040 and LR Statistic is also significant.
Out of the considered CG variables BS, CEOD, INSO and MANO are significant
with signs of INSO and MANO similar to that was hypothesized. Table 5.15
shows the results of ordered probit regression for ACACCC (Categorical variable
for ACACC) and CSFG. The Pseudo R squared is 0.019 and LR Statistic is also
significant. The CSFG is significant with sign similar to that was hypothesized.

Annexure 189
Table 5.14: Results of ACACCC and CG Mechanisms
Variables Predicted Sign Coefficients t- Statistic
ACI + 0.053 0.28
BA + 0.064 0.293
BI + 0.121 0.365
BS - 0.097 3.798***
CEOD - 0.235 1.795*
CEOT + -0.025 -0.158
GDB + -0.175 -0.437
INSO + -0.917 -2.793***
MANO - -1.113 -3.845***
TAUD + 0.203 1.535
FS - 0.046 0.676
GROS - 0.814 2.213**
LEV + -0.095 -0.718
PROF + -0.28 -0.355
Pseudo R2 0.040
LR-Statistic 59.593***
*,**,*** = statistically significant at less than 0.10, 0.05 and 0.01ACACCC = Catagorical form of Accruals based first measure of AC, ACI = Audit Committee
Independence, BA = Board Activity, BI = Board Independence, BS = Board Size, CEOD= CEO Duality, CEOT = CEO Turnover, GDB = Gender Diversity on Board , INSO =Institutional Shareholding , MANO = Managerial Shareholding, TAUD = Type of the Auditor,FS = Firm Size, GROS = Sales Growth, LEV = Leverage, PROF = Profitability
The results are consistent with many studies that are there in the literature as
catagorical form of considered AC proxy is found to be significanlty related with
CG.
ACCICC and CG (where AC is Catagorical)
Table 5.16 shows the results of ordered probit regression for ACCICC (Categorical
variable for ACCIC) and CG Mechanisms. The Pseudo R squared is 0.081 and LR
Statistic is also significant. Out of the considered CG variables BA, BS, CEOD,
CEOT, INSO and TAUD are significant with signs of BS, CEOD, INSO and TAUD
similar to that was hypothesized. Table 5.17 shows the results of ordered probit
regression for ACCICC (Categorical variable for ACCIC) and CSFG. The Pseudo

Annexure 190
Table 5.15: Results of ACACCC and Composite Score for Firms Governance
Variables Predicted Sign Coefficients t- Statistic
CSFG + 0.522 4.382***
FS - 0.115 1.764*
GROS - 0.815 2.274**
LEV + -0.014 -0.108
PROF + -0.489 -0.637
Pseudo R2 0.019
LR-Statistic 28.473***
*,**,*** = statistically significant at less than 0.10, 0.05 and 0.01ACACCC = Catagorical form of Accruals based first measure of AC, CSFG = Composite Score
for Firms Governance, FS = Firm Size measured by log of total assets, GROS = Sales Growthmeasured by growth in sales, LEV = Leverage of the firm measured by debt to equity ratio,PROF = Profitability of the firm measured by return on assets
R squared is 0.035 and LR Statistic is also significant. The CSFG is significant
with sign similar to that was hypothesized.
ACCIEC and CG (where AC is Catagorical)
Table 5.18 shows the results of ordered probit regression for ACCIEC (Categorical
variable for ACCIE) and CG Mechanisms. The Pseudo R squared is 0.051 and
LR Statistic is also significant. Out of the considered CG variables BI, BS,INSO,
MANO and TAUD are significant with signs of BI, BS and TAUD similar to that
was hypothesized. Table 5.19 shows the results of ordered probit regression for
ACCIEC (Categorical variable for ACCIE) and CSFG. The Pseudo R squared is
0.009 and LR Statistic is also significant. The CSFG is insignificant with sign
similar to that was hypothesized.
ACSKEWC and CG (where AC is Categorical)
Table 5.20 shows the results of ordered probit regression for ACSKEWC (Cate-
gorical variable for ACSKEW) and CG Mechanisms. The Pseudo R squared is
0.042 and LR Statistic is also significant. Out of the considered CG variables BI,
CEOD, MANO and TAUD are significant with signs of CEOD and MANO are

Annexure 191
Table 5.16: Results of ACCICC and CG Mechanisms
Variables Predicted Sign Coefficients t- Statistic
ACI + -0.217 -1.123
BA + 0.976 4.297***
BI + -0.402 -1.202
BS - 0.131 4.997***
CEOD - 0.292 2.187**
CEOT + 0.283 1.796*
GDB + -0.596 -1.473
INSO + -1.007 -3.021***
MANO - -0.451 -1.539
TAUD + 0.334 2.476**
FS - -0.013 -0.192
GROS - 1.146 3.049***
LEV + -0.026 -0.197
PROF + -4.356 -5.336***
Pseudo R2 0.081
LR-Statistic 115.741***
*,**,*** = statistically significant at less than 0.10, 0.05 and 0.01ACCICC = Catagorical form of Accruals based second measure of AC, ACCIEC = Catagorical
form ofEarnings based measure of AC, ACSOEC = Catagorical form of Sensitivity of Earningsto Bad News relative to Sensitivity of Earnings to Good News, ACSKEWC = Catagorical form ofSkewness based measure of AC, ACCOMPC = Catagorical form of Composite measure of AC ofa firm, ACI = Audit Committee Independence, BA = Board Activity, BI = Board Independence,BS = Board Size, CEOD = CEO Duality, CEOT = CEO Turnover, GDB = Gender Diversityon Board , INSO = Institutional Shareholding , MANO = Managerial Shareholding, TAUD= Type of the Auditor, FS = Firm Size which is measured by log of total assets, GROS =Sales Growth of the firm measured by growth in sales of the firm, LEV = Leverage of the firmmeasured by debt to equity ratio, PROF = Profitability of the firm measured by retrun on assets
similar to that was hypothesized. The results are consistent with many studies
that are there in the literature as catagorical form of considered AC proxy is found
to be significanlty related with a few CG mechanisms. The results are consistent
with many studies that are there in the literature as catagorical form of considered
AC proxy is found to be significanlty related with CG mechanisms. Table 5.21
shows the results of ordered probit regression for ACSKEWC (Categorical variable
for ACSKEW) and CSFG. The Pseudo R squared is 0.016 and LR Statistic is also
significant. The CSFG is significant with sign opposite to that was hypothesized.

Annexure 192
Table 5.17: Results of ACCICC and Composite Score for Firms Governance
Variables Predicted Sign Coefficients t- Statistic
CSFG + 0.426 3.571***
FS - 0.039 0.595
GROS - 0.934 2.579**
LEV + 0.156 1.232
PROF + -4.466 -5.675***
Pseudo R2 0.035
LR-Statistic 49.785***
*,**,*** = statistically significant at less than 0.10, 0.05 and 0.01ACCICC = Catagorical form of Accruals based second measure of AC, CSFG = Composite
Score for Firms Governance, FS = Firm Size, GROS = Sales Growth, LEV = Leverage, PROF= Profitability
ACSOEC and CG (where AC is Categorical)
Table 5.22 shows the results of ordered probit regression for ACSOEC (Categorical
variable for ACSOE) and CG Mechanisms. The Pseudo R squared is 0.019 and
LR Statistic is also significant. Out of the considered CG variables ACI, GDB
and MANO are significant with signs of ACI, GDB and MANO similar to that
was hypothesized. Table 5.23 shows the results of ordered probit regression for
ACSOEC (Categorical variable for ACSOE) and CSFG. The Pseudo R squared
is 0.006 and LR Statistic is also significant. The CSFG is significant with sign
opposite to that was hypothesized.
ACCOMPC and CG (where AC is Categorical)
Table 5.24 shows the results of ordered probit regression for ACCOMPC (Cate-
gorical variable for ACCOMP) and CG Mechanisms. The Pseudo R squared is
0.070 and LR Statistic is also significant. Out of the considered CG variables BS,
CEOD, INSO and TAUD are significant with signs of BA and TAUD similar to
that was hypothesized. Table 5.25 shows the results of ordered probit regression
for ACCOMPC (Categorical variable for ACCOMP) and CSFG. The Pseudo R
squared is 0.033 and LR Statistic is also significant. The CSFG is significant with
sign similar to that was hypothesized.

Annexure 193
Table 5.18: Results of ACCIEC and CG Mechanisms
Variables Predicted Sign Coefficients t- Statistic
ACI + -0.188 -0.973
BA + 0.283 1.277
BI + 0.669 2.020**
BS - -0.074 -2.875***
CEOD - -0.053 -0.402
CEOT + -0.025 -0.16
GDB + 0.329 0.815
INSO + -1.586 -4.731***
MANO - 1.157 4.021***
TAUD + 0.296 2.236**
FS - 0.119 1.732*
GROS - 0.369 0.992
LEV + 0.036 0.27
PROF + -2.259 -2.830***
Pseudo R2 0.051
LR-Statistic 74.406***
*,**,*** = statistically significant at less than 0.10, 0.05 and 0.01ACCIEC = Catagorical form ofEarnings based measure of AC, ACSOEC = Catagorical form
of Sensitivity of Earnings to Bad News relative to Sensitivity of Earnings to Good News,ACSKEWC = Catagorical form of Skewness based measure of AC, ACCOMPC = Catagori-cal form of Composite measure of AC of a firm, ACI = Audit Committee Independence, BA =Board Activity, BI = Board Independence, BS = Board Size, CEOD = CEO Duality, CEOT= CEO Turnover, GDB = Gender Diversity on Board , INSO = Institutional Shareholding ,MANO = Managerial Shareholding, TAUD = Type of the Auditor, FS = Firm Size which ismeasured by log of total assets, GROS = Sales Growth of the firm measured by growth in salesof the firm, LEV = Leverage of the firm measured by debt to equity ratio, PROF = Profitabilityof the firm measured by retrun on assets
ACACCC, CSFG and DQ (where AC is Categorical and
DQ is Moderator)
Table 5.26 shows the results of ordered probit regression for ACACCC (Categor-
ical variable for ACACC) and CG with DQ present as independent variable as
well. The CSFG is significant with sign similar to that was hypothesized. Table
5.27 shows the results of ordered probit regression for ACACCC (Categorical vari-
able for ACACC) and CG with DQ as moderating variable. The CSFGXDQ is
insignificant with sign similar to that was hypothesized.

Annexure 194
Table 5.19: Results of ACCIEC and Composite Score for Firms Governance
Variables Predicted Sign Coefficients t- Statistic
CSFG + 0.019 0.158
FS - 0.098 1.503
GROS - 0.526 1.464
LEV + -0.112 -0.892
PROF + -2.43 -3.140**
Pseudo R2 0.009
LR-Statistic 13.28***
*,**,*** = statistically significant at less than 0.10, 0.05 and 0.01ACCIEC = Catagorical form ofEarnings based measure of AC, CSFG = Composite Score for
Firms Governance, FS = Firm Size which is measured by log of total assets, GROS = SalesGrowth of the firm measured by growth in sales of the firm, LEV = Leverage of the firm measuredby debt to equity ratio, PROF = Profitability of the firm measured by retrun on assets
ACCICC, CSFG and DQ (where AC is Categorical and DQ
is Moderator)
Table 5.28 shows the results of ordered probit regression for ACCICC (Categorical
variable for ACCIC) and CG with DQ present as independent variable as well. The
Pseudo R squared is 0.035 and LR Statistic is also significant. The CSFGXDQ is
insignificant with sign similar to that was hypothesized.
Table 5.29 shows the results of ordered probit regression for ACCICC (Categorical
variable for ACCIC) and CG with DQ as moderating variable. The Pseudo R
squared is 0.044 and LR Statistic is also significant. The CSFGXDQ is significant
with sign opposite to that was hypothesized.
ACCIEC, CSFG and DQ (where AC is Categorical and DQ
is Moderator)
Table 5.30 shows the results of ordered probit regression for ACCIEC (Categorical
variable for ACCIE) and CG with DQ present as independent variable as well.
The Pseudo R squared is 0.009 and LR Statistic is also significant. The CSFG is
insignificant with sign similar to that was hypothesized. The results are consistent

Annexure 195
Table 5.20: Results of ACSKEWC and CG Mechanisms
Variables Predicted Sign Coefficients t- Statistic
ACI + 0.084 0.437
BA + -0.273 -1.242
BI + -0.971 -2.909***
BS - 0.013 0.49
CEOD - -0.424 -3.200***
CEOT + 0.115 0.74
GDB + 0.102 0.256
INSO + 0.038 0.114
MANO - -0.715 -2.488**
TAUD + -0.363 -2.737***
FS - 0.107 1.55
GROS - -0.027 -0.073
LEV + 0.14 1.055
PROF + 1.292 1.636
Pseudo R2 0.042
LR-Statistic 60.521***
*,**,*** = statistically significant at less than 0.10, 0.05 and 0.01ACSKEWC = Catagorical form of Skewness based measure of AC, ACCOMPC = Catagorical
form of Composite measure of AC of a firm, ACI = Audit Committee Independence, BA =Board Activity, BI = Board Independence, BS = Board Size, CEOD = CEO Duality, CEOT= CEO Turnover, GDB = Gender Diversity on Board , INSO = Institutional Shareholding ,MANO = Managerial Shareholding, TAUD = Type of the Auditor, FS = Firm Size, GROS =Sales Growth, LEV = Leverage, PROF = Profitability
with many studies that are there in the literature as the considered AC proxy is
not found to be significanlty related with CG.
ACSKEWC, CSFG and DQ (where AC is Categorical and
DQ is Moderator)
Table 5.31 shows the results of ordered probit regression for ACSKEWC (Cate-
gorical variable for ACSKEW) and CG with DQ present as independent variable
as well. The Pseudo R squared is 0.016 and LR Statistic is also significant. The
CSFG is significant with sign similar to that was hypothesized. The results are
consistent with many studies in literature who also report the significant role of

Annexure 196
Table 5.21: Results of ACSKEWC and Composite Score for Firms Governance
Variables Predicted Sign Coefficients t- Statistic
CSFG + -0.416 -3.480***
FS - 0.16 2.438**
GROS - -0.172 -0.479
LEV + 0.148 1.186
PROF + 1.204 1.566
Pseudo R2 0.016
LR-Statistic 23.149***
*,**,*** = statistically significant at less than 0.10, 0.05 and 0.01ACSKEWC = Catagorical form of Skewness based measure of AC, CSFG = Composite Score
for Firms Governance, FS = Firm Size, GROS = Sales Growth, LEV = Leverage, PROF =Profitability
CG in determining AC. Since the first condition is met thus proceeding to testing
of DQ as moderator. Table 5.32 shows the results of ordered probit regression for
ACSKEWC (Categorical variable for ACSKEW) and CG with DQ as moderating
variable. The Pseudo R squared is 0.017 and LR Statistic is also significant. The
CSFGXDQ is insignificant with sign opposite to that was hypothesized.
ACSOEC, CSFG and DQ (where AC is Categorical and DQ
is Moderator)
Table 5.33 shows the results of ordered probit regression for ACSOEC (Categor-
ical variable for ACSOE) and CG with DQ present as independent variable as
well. The Pseudo R squared is 0.009 and LR Statistic is also significant. The
CSFG is significant with sign opposite to that was hypothesized. The results are
consistent with many studies in literature who also report the significant role of
CG in determining AC. Since the first condition is met, the analysis can proceed
to second stage of testing of DQ as moderator. Table 5.34 shows the results of
ordered probit regression for ACSOEC (Categorical variable for ACSOE) and CG
with DQ as moderating variable. The Pseudo R squared is 0.035 and LR Statistic
is also significant. The CSFGXDQ is insignificant with sign similar to that was
hypothesized.

Annexure 197
Table 5.22: Results of ACSOEC and CG Mechanisms
Variables Predicted Sign Coefficients t- Statistic
ACI + 0.307 1.607*
BA + -0.104 -0.475
BI + -0.095 -0.289
BS - -0.018 -0.723
CEOD - 0.031 0.239
CEOT + -0.216 -1.394
GDB + 0.799 2.005**
INSO + 0.105 0.319
MANO - 0.487 1.702*
TAUD + -0.206 -1.565
FS - 0.01 0.151
GROS - -0.122 -0.331
LEV + 0.163 1.237
PROF + -0.564 -0.717
Pseudo R2 0.019
LR-Statistic 27.537***
*,**,*** = statistically significant at less than 0.10, 0.05 and 0.01ACSOEC = Catagorical form of Sensitivity of Earnings to Bad News relative to Sensitivity
of Earnings to Good News, ACI = Audit Committee Independence, BA = Board Activity, BI= Board Independence, BS = Board Size, CEOD = CEO Duality, CEOT = CEO Turnover,GDB = Gender Diversity on Board , INSO = Institutional Shareholding , MANO = ManagerialShareholding, TAUD = Type of the Auditor, FS = Firm Size, GROS = Sales Growth, LEV =Leverage, PROF = Profitability
ACCOMPC, CSFG and DQ (where AC is Categorical and
DQ is Moderator)
Table 5.35 shows the results of ordered probit regression for ACCOMPC (Cate-
gorical variable for ACCOMP) and CG with DQ present as independent variable
as well. The Pseudo R squared is 0.036 and LR Statistic is also significant. The
CSFG is significant with sign similar to that was hypothesized. Table 5.36 shows
the results of ordered probit regression for ACCOMPC (Categorical variable for
ACCOMP) and CG with DQ as moderating variable. The Pseudo R squared is
0.036 and LR Statistic is also significant. The CSFGXDQ is insignificant with
sign opposite to that was hypothesized.

Annexure 198
Table 5.23: Results of ACSOEC and Composite Score for Firms Governance
Variables Predicted Sign Coefficients t- Statistic
CSFG + -0.328 -2.754***
FS - -0.001 -0.01
GROS - 0.083 0.229
LEV + 0.107 0.858
PROF + -0.59 -0.768
Pseudo R2 0.006
LR-Statistic 8.996*
*,**,*** = statistically significant at less than 0.10, 0.05 and 0.01ACSOEC = Catagorical form of Sensitivity of Earnings to Bad News relative to Sensitivity of
Earnings to Good News, CSFG = Composite Score for Firms Governance, FS = Firm Size,GROS = Sales Growth, LEV = Leverage, PROF = Profitability
Discussion of Additional Results of Bangladesh
Good, Moderate and Bad CG and AC
The summary of results of multivariate regression analysis involving CG as categor-
ical variable is presented in Table 5.37. The results show that good and moderate
CG practices do impact AC in case of firms listed in Bangladesh. It is interesting
to note that this relationship is in line with our previous argument that CG do
have an impact on the level of AC employed by the firms.
CG, AC and Disclosure Quality with AC as Categorical
Variable
Table 5.38 shows the summary of results of probit regression. The results show
that board activity, CEO Duality and Type of the auditor do have an impact
on the level of conservatism employed by firms. It is interesting to note that
the results of panel regression analysis regarding the composite score of firm’s
governance are endorsed in the additional analysis as well. The results show that
CSFG plays a significant role in determining accounting conservatism. However
the role of disclosure quality in moderating the relationship between CG and AC
is not found in case of additional analysis.

Annexure 199
Table 5.24: Results of ACCOMPC and CG Mechanisms
Variables Predicted Sign Coefficients t- Statistic
ACI + -0.140 -0.726
BA + 0.946 4.230***
BI + 0.434 1.285
BS - 0.092 3.560***
CEOD - 0.235 1.767*
CEOT + 0.002 0.014
GDB + -0.518 -1.293
INSO + -1.374 -4.110***
MANO - -0.092 -0.316
TAUD + 0.426 3.158***
FS - 0.137 1.969**
GROS - 1.051 2.809***
LEV + 0.015 0.111
PROF + -2.913 -3.618***
Pseudo R2 0.07
LR-Statistic 101.52***
*,**,*** = statistically significant at less than 0.10, 0.05 and 0.01ACCOMPC = Catagorical form of Composite measure of AC of a firm, ACI = Audit Committee
Independence, BA = Board Activity, BI = Board Independence, BS = Board Size, CEOD= CEO Duality, CEOT = CEO Turnover, GDB = Gender Diversity on Board , INSO =Institutional Shareholding , MANO = Managerial Shareholding, TAUD = Type of the Auditor,FS = Firm Size, GROS = Sales Growth, LEV = Leverage of the firm, PROF = Profitability ofthe firm
Table 5.25: Results of ACCOMPC and Composite Score for Firms Governance
Variables Predicted Sign Coefficients t- Statistic
CSFG + 0.533 4.451***
FS - 0.182 2.754***
GROS - 0.965 2.644***
LEV + 0.107 0.852
PROF + -3.248 -4.166***
Pseudo R2 0.033
LR-Statistic 48.200***
*,**,*** = statistically significant at less than 0.10, 0.05 and 0.01ACCOMPC = Catagorical form of Composite measure of AC of a firm, CSFG = Composite
Score for Firms Governance, FS = Firm Size which is measured by log of total assets, GROS =Sales Growth of the firm measured by growth in sales of the firm, LEV = Leverage of the firmmeasured by debt to equity ratio, PROF = Profitability of the firm measured by retrun on assets

Annexure 200
Table 5.26: Results of ACACCC, CSFG and DQ
Variables Predicted Sign Coefficients t- Statistic
CSFG + 0.479 3.794***
DQ - -0.597 -1.04
FS - 0.11475 1.76166*
GROS - 0.85449 2.36989**
LEV + -0.0187 -0.1492
PROF + -0.4758 -0.619
Pseudo R2 0.020
LR-Statistic 29.556***
*,**,*** = statistically significant at less than 0.10, 0.05 and 0.01ACACCC = Catagorical form of Accruals based first measure of AC, CSFG = Composite Score
for Firms Governance, FS = Firm Size, GROS = Sales Growth, Lev = Leverage
Table 5.27: Results of ACACCC, CSFG and CSFGXDQ
Variables Predicted Sign Coefficients t- Statistic
CSFG + 0.025 0.649
DQ - -1.421 -0.981
CSFGXDQ - 1.115 0.620
FS - 0.111 1.706*
GROS - 0.871 2.409
LEV + -0.033 -0.263
PROF + -0.451 -0.585
Pseudo R2 0.020
LR-Statistic 29.941***
*,**,*** = statistically significant at less than 0.10, 0.05 and 0.01ACACCC = Catagorical form of Accruals based first measure of AC, CSFG = Composite
Score for Firms Governance, FS = Firm Size, GROS = Sales Growth, Lev = Leverage, PROF= Profitability
Table 5.28: Results of ACCICC, CSFG and DQ
Variables Predicted Sign Coefficients t- Statistic
CSFG + 0.382 3.343***
DQ - -0.609 -1.107
FS - 0.039 0.568***
GROS - 0.974 2.779
LEV + 0.150 1.168
PROF + -4.458 -5.892***
Pseudo R2 0.035
LR-Statistic 50.909***
*,**,*** = statistically significant at less than 0.10, 0.05 and 0.01ACCICC = Catagorical form of Accruals based second measure of AC, CSFG = Composite
Score for Firms Governance, DQ = Disclosure Quality, FS = Firm Size, GROS = Sales Growth,Lev = Leverage, PROF = Profitability

Annexure 201
Table 5.29: Results of ACCICC, CSFG and CSFGXDQ
Variables Predicted Sign Coefficients t- Statistic
CSFG + -0.921 -2.372**
DQ - -5.342 -3.670***
CSFGXDQ - 6.431 3.545***
FS - 0.022 0.340
GROS - 1.076 2.938***
LEV + 0.063 0.491
PROF + -4.365 -5.528***
Pseudo R2 0.044
LR-Statistic 63.519***
*,**,*** = statistically significant at less than 0.10, 0.05 and 0.01ACCICC = Catagorical form of Accruals based second measure of AC, CSFG = Composite
Score for Firms Governance
Table 5.30: Results of ACCIEC, CSFG and DQ
Variables Predicted Sign Coefficients t- Statistic
CSFG + 0.003 0.022
DQ - -0.223 -0.363
FS - 0.098 1.553
GROS - 0.540 1.423
LEV + -0.114 -0.873
PROF + -2.425 -2.997***
Pseudo R2 0.009
LR-Statistic 13.432***
*,**,*** = statistically significant at less than 0.10, 0.05 and 0.01ACCIEC = Catagorical form ofEarnings based measure of AC, CSFG = Composite Score
for Firms Governance, FS = Firm Size, GROS = Sales Growth, Lev = Leverage, PROF =Profitability
Table 5.31: Results of ACSKEWC, CSFG and DQ
Variables Predicted Sign Coefficients t- Statistic
CSFG + -0.380 -2.914***
DQ - 0.503 0.898
FS - 0.160 2.363***
GROS - -0.205 -0.585
LEV + 0.153 1.246
PROF + 1.193 1.663***
Pseudo R2 0.016
LR-Statistic 23.925***
*,**,*** = statistically significant at less than 0.10, 0.05 and 0.01ACSKEWC = Catagorical form of Skewness based measure of AC, CSFG = Composite Score
for Firms Governance, FS = Firm Size, GROS = Sales Growth, Lev = Leverage, PROF =Profitability

Annexure 202
Table 5.32: Results of ACSKEWC, CSFG and CSFGXDQ
Variables Predicted Sign Coefficients t- Statistic
CSFG + -0.676 -1.749*
DQ - -0.567 -0.395
CSFGXDQ - 1.451 0.812
FS - 0.156 2.376**
GROS - -0.185 -0.511
LEV + 0.134 1.050
PROF + 1.228 1.595
Pseudo R2 0.017
LR-Statistic 24.585***
*,**,*** = statistically significant at less than 0.10, 0.05 and 0.01ACSKEWC = Catagorical form of Skewness based measure of AC
Table 5.33: Results of ACSOEC, CSFG and DQ
Variables Predicted Sign Coefficients t- Statistic
CSFG + -0.2364 -1.8098**
DQ - 1.25673 2.28708**
FS - -0.0006 -0.0098
GROS - 0.00177 0.00459
LEV + 0.11964 0.96235
PROF + -0.6199 -0.7883
Pseudo R2 0.009
LR-Statistic 13.813***
*,**,*** = statistically significant at less than 0.10, 0.05 and 0.01ACSOEC = Catagorical form of Sensitivity of Earnings to Bad News relative to Sensitivity of
Earnings to Good News, CSFG = Composite Score for Firms Governance
Table 5.34: Results of ACSOEC, CSFG and CSFGXDQ
Variables Predicted Sign Coefficients t- Statistic
CSFG + 0.038 0.102
DQ - 2.247 1.739*
CSFGXDQ - -1.346 -0.804
FS - 0.003 0.052
GROS - -0.017 -0.045
LEV + 0.137 1.094
PROF + -0.651 -0.830
Pseudo R2 0.010
LR-Statistic 14.376***
*,**,*** = statistically significant at less than 0.10, 0.05 and 0.01ACSOEC = Catagorical form of Sensitivity of Earnings to Bad News relative to Sensitivity of
Earnings to Good News, CSFG = Composite Score for Firms Governance

Annexure 203
Table 5.35: Results of ACCOMPC, CSFG and DQ
Variables Predicted Sign Coefficients t- Statistic
CSFG + 0.450 3.918***
DQ - -1.170 -2.326**
FS - 0.181 2.764***
GROS - 1.047 2.874***
LEV + 0.097 0.741
PROF + -3.231 -4.019***
CSFG + 0.217 0.622
DQ - -2.006 -1.570
CSFGXDQ - 1.145 0.678
FS - 0.178 2.710***
GROS - 1.064 2.929***
LEV + 0.081 0.606
PROF + -3.208 -3.990***
Pseudo R2 0.036
LR-Statistic 52.417***
*,**,*** = statistically significant at less than 0.10, 0.05 and 0.01ACCOMPC = Catagorical form of Composite measure of AC of a firm, CSFG = Composite
Score for Firms Governance
Table 5.36: Results of ACCOMPC, CSFG and CSFGXDQ
Variables Predicted Sign Coefficients t- Statistic
CSFG + 0.217 0.622
DQ - -2.006 -1.570
CSFGXDQ - 1.145 0.678
FS - 0.178 2.710***
GROS - 1.064 2.929***
LEV + 0.081 0.606
PROF + -3.208 -3.990***
CSFG + 0.450 3.918***
DQ - -1.170 -2.326**
FS - 0.181 2.764***
GROS - 1.047 2.874***
LEV + 0.097 0.741
PROF + -3.231 -4.019***
Pseudo R2 0.036
LR-Statistic 52.818***
*,**,*** = statistically significant at less than 0.10, 0.05 and 0.01ACCOMPC = Catagorical form of Composite measure of AC of a firm, CSFG = Composite
Score for Firms Governance

An
nexu
re204
Table 5.37: Summary of Additional Testing (Good, Moderate and Bad CG and AC)
Assumptions ACACC ACCIC ACCIE ACSKEW ACSOE ACCOMP
A1 Good CG practices + + + + - +
effects AC (S) (S) (NS) (NS) (NS) (S)
A2 Moderate CG practices + + - + - +
practices effects AC (S) (S) (S) (NS) (NS) (S)
A3 Bad CG practices + + - + + +
practices effects AC (S) (S) (NS) (NS) (NS) (NS)
(NS) = Not Supported and (S) = Supported

An
nexu
re205
Table 5.38: Summary of results of probit regression
Hypothesis ACACC ACCIC ACCIE ACSKEW ACSOE ACCOMP
H1 There is a negative relationship between - - - - - -
board size and AC (S) (NS) (NS) (NS) (NS) (NS)
H2 There is a positive relationship between - - - - - -
board independence and AC (NS) (NS) (NS) (NS) (NS) (NS)
H3 There is a positive relationship between + + + - + +
board activity and AC (NS) (NS) (NS) (NS) (NS) (NS)
H4 There is a positive relationship between gender + + + + - +
diversity on board and AC (NS) (S) (S) (NS) (NS) (NS)
H5 There is a positive relationship between CEO - + - - + +
Turnover and AC (NS) (NS) (NS) (NS) (S) (NS)
H6 There is a negative relationship between + + + - + +
CEO Duality and AC (S) (S) (NS) (NS) (S) (S)
H7 There is a positive relationship between Instit- + + + - + +
utional ownership and AC (S) (NS) (NS) (NS) (NS) (NS)
H8 There is a negative relationship between Mana- + + - + + +
gerial ownership and AC (NS) (NS) (NS) (NS) (NS) (NS)
H9 There is a positive relationship between Audit Comm- + + - + + +
ittee Independence and AC (S) (NS) (NS) (NS) (NS) (NS)
H10 There is a positive relationship between existence - + + - - +
of Big Four Auditor and AC (NS) (S) (NS) (NS) (NS) (NS)
H11 There is a positive relationship between composite + + + - - +
score of firm governance and AC (NS) (S) (NS) (NS) (NS) (S)
H12 High disclosure quality moderates the association between - -
CG and AC (NA) (S) (NA) (NA) (NA) (S)
NS = Not Supported, S = Supported and NA=Estimation Not Applicable

Annexure 206
APPENDIX IV
Additional Analyses for India
Two additional analyses are being performed. The first set of following section
reports the results of panel data regression analysis involving CG as the categorical
variables i.e. converted into good, bad and moderate governance. The second
section reports the results of ordered probit regression analysis involving AC as
the categorical variable. This section encompasses the results of those regression
models that are employed to test the effect of good, moderate and bad CG on AC.
Following Shah (2007) the dummies are created for good, bad and moderate CG
by employing normal curve methodology on composite score of firms governance.
Table 5.39: Results of ACACC and Good, Moderate and Bad CG
Variables Predicted Sign Coefficients t- Statistic
Constant 1.611 3.678***
GG + 0.046 0.217
MG - -0.077 -0.313
BG - -0.081 -0.218
FS - -0.415 -3.837***
GROS - 0.71 2.303**
LEV + -0.02 -0.59
PROF + 0.052 1.071
Adj R2 0.427
F-Statistic 5.914***
*,**,*** = statistically significant at less than 0.10, 0.05 and 0.01ACACC = Accruals based first measure of AC, GG = Good Governance, BG = Bad Governance,
MG = Moderate Governance, FS = Firm Size, GROS= Sales Growth, PROF = Profitability
ACACC and Good, Moderate and Bad CG
Table 5.39 shows the results of fixed effect regression for ACACC and proxies for
GG, MG and BG. The adjusted R squared is 0.427 meaning that 42.7 percent
of the variation in dependent variable is because of the considered independent
variables. The F-statistic is also significant meaning that the model is a good fit.
The GG, MG and BG all are insignificant.

Annexure 207
Table 5.40: Results of ACCIC and Good, Moderate and Bad CG
Variables Predicted Sign Coefficients t- Statistic
Constant -0.495 -6.611***
GG + 0.126 1.941**
MG - 0.123 1.643
BG - 0.197 1.508
FS - 0.012 0.456
GROS - -0.179 -1.526
LEV + -0.013 -1.482
PROF + 0.002 0.134
Adj R2 0.659
F-Statistic 13.725***
*,**,*** = statistically significant at less than 0.10, 0.05 and 0.01ACCIC = Accruals based second measure of AC, GG = Good Governance, BG = Bad Gover-
nance, MG = Moderate Governance, FS = Firm Size, GROS= Sales Growth, PROF = Prof-itability
ACCIC and Good, Moderate and Bad CG
Table 5.40 shows the results of fixed effect regression for ACCIC and proxies for
GG, MG and BG. The adjusted R squared is 0.659 meaning that 65.9 percent
of the variation in dependent variable is because of the considered independent
variables. The F-statistic is also significant meaning that the model is a good fit.
The GG is significant. The results are consistent to those of many studies in the
literature as one of the categories of CG is found to be significantly related with
AC. It means that there exist a relationship between CG and AC even when the
CG is examined in catagorical form.
ACCIE and Good, Moderate and Bad CG
Table 5.41 shows the results of fixed effect regression for ACCIE and proxies for
GG, MG and BG. The adjusted R squared is 0.683 meaning that 68.3 percent
of the variation in dependent variable is because of the considered independent
variables. The F-statistic is also significant meaning that the model is a good fit.
The MG is insignificant. The results are consistent to those of many studies in the
literature as one of the categories of CG is found to be significantly related with
AC.

Annexure 208
Table 5.41: Results of ACCIE and Good, Moderate and Bad CG
Variables Predicted Sign Coefficients t- Statistic
Constant -1.922 -3.159***
GG + 0.389 1.375
MG - 0.491 1.730*
BG - 0.491 1.251
FS - 0.439 3.227***
GROS - 0.548 1.769*
LEV + 0.054 1.254
PROF + 0.214 4.599***
Adj R2 0.683
F-Statistic 15.184***
*,**,*** = statistically significant at less than 0.10, 0.05 and 0.01ACCIE = Earnings based measure of AC, GG = Good Governance, BG = Bad Governance,
MG = Moderate Governance, FS = Firm Size measured by log of total assets, GROS= SalesGrowth measured by growth in sales, PROF = Profitability of the firm measured by retrun onassets
Table 5.42: Results of ACSKEW and Good, Moderate and Bad CG
Variables Predicted Sign Coefficients t- Statistic
Constant -1.829 -3.236***
GG + 0.296 1.093
MG - 0.113 0.381
BG - -0.178 -0.444
FS - 0.457 2.820***
GROS - -0.618 -1.396
LEV + -0.065 -0.965
PROF + -0.011 -0.173
Adj R2 0.097
F-Statistic 1.706***
*,**,*** = statistically significant at less than 0.10, 0.05 and 0.01ACSKEW = Skewness based measure of AC, GG = Good Governance, BG = Bad Governance,
MG = Moderate Governance, FS = Firm Size measured by log of total assets, GROS= SalesGrowth measured by growth in sales, PROF = Profitability of the firm
ACSKEW and Good, Moderate and Bad CG
Table 5.42 shows the results of fixed effect regression for ACSKEW and proxies
for GG, MG and BG. The adjusted R squared is 0.097 meaning that 9.7 percent
of the variation in dependent variable is because of the considered independent
variables. The F-statistic is also significant meaning that the model is a good fit.
The GG, MG and BG all are insignificant.

Annexure 209
Table 5.43: Results of ACSOE and Good, Moderate and Bad CG
Variables Predicted Sign Coefficients t- Statistic
Constant 0.178 0.055
GG + 0.731 0.655
MG - 0.807 0.772
BG - 0.742 0.599
FS - -0.648 -0.911
GROS - 1.745 1.317
LEV + 0.408 2.587***
PROF + 0.4 1.652*
Adj R2 0.209
F-Statistic 2.747***
*,**,*** = statistically significant at less than 0.10, 0.05 and 0.01ACSOE = Sensitivity of earnings to bad news relative to sensitivity of earnings to good news,
GG = Good Governance, BG = Bad Governance, MG = Moderate Governance, FS = FirmSize, GROS= Sales Growth, PROF = Profitability
ACSOE and Good, Moderate and Bad CG
Table 5.43 shows the results of fixed effect regression for ACACC and proxies for
GG, MG and BG. The adjusted R squared is 0.209 meaning that 20.9 percent
of the variation in dependent variable is because of the considered independent
variables. The F-statistic is also significant meaning that the model is a good fit.
The GG, MG and BG all are insignificant. The results are consistent to those of
many studies in the literature.
Table 5.44: Results of ACCOMP and Good, Moderate and Bad CG
Variables Predicted Sign Coefficients t- Statistic
Constant -1.905 -4.079***
GG + 0.41 1.956**
MG - 0.453 2.162**
BG - 0.465 1.597
FS - 0.361 3.204***
GROS - 0.227 0.859
LEV + 0.027 0.772
PROF + 0.156 4.467***
Adj R2 0.599
F-Statistic 10.846***
*,**,*** = statistically significant at less than 0.10, 0.05 and 0.01ACCOMP = Composite measure of AC, GG = Good Governance, BG = Bad Governance, MG
= Moderate Governance, FS = Firm Size, GROS= Sales Growth, PROF = Profitability

Annexure 210
ACCOMP and Good, Moderate and Bad CG
Table 5.44 shows the results of fixed effect regression for ACCOMP and proxies
for GG, MG and BG. The adjusted R squared is 0.599 meaning that 59.9 percent
of the variation in dependent variable is because of the considered independent
variables. The F-statistic is also significant meaning that the model is a good fit.
The GG and MG are significant.
ACACCC and CG (where AC is Categorical)
This section encompasses the results of those regression models that are employed
to test the effect of CG on AC but with a change in the nature of dependent
variable. The dependent variable i.e. AC is converted into the categorical variable
and hence logistic regression models are estimated.
Table 5.45: Results of ACACCC and CG Mechanisms
Variables Predicted Sign Coefficients t- Statistic
ACI + -0.207 -0.598
BA + -0.178 -0.494
BI + 0.744 1.780**
BS - 0.056 1.598
CEOD - -0.024 -0.25
CEOT + -0.157 -1.409
GDB + -0.523 -0.749
INSO + -0.31 -1.049
MANO - 0.674 1.357
TAUD + 0.105 1.133
FS - 0.126 2.667**
GROS - 0.379 0.495
LEV + -0.033 -0.522
PROF + -0.006 -0.093
Pseudo R2 0.014
LR-Statistic 20.549*
*,**,*** = statistically significant at less than 0.10, 0.05 and 0.01ACACCC = Categorical form of Accruals based first measure of AC, ACI = Audit Committee
Independence, BA = Board Activity, BI = Board Independence, BS = Board Size, CEOD= CEO Duality, CEOT = CEO Turnover, GDB = Gender Diversity on Board , INSO =Institutional Shareholding , MANO = Managerial Shareholding, TAUD = Type of the Auditor,FS = Firm Size measured by log of total assets, GROS= Sales Growth measured by growth insales, PROF = Profitability of the firm measured by retrun on assets

Annexure 211
Table 5.46: Results of ACACCC and Composite Score for Firms Governance
Variables Predicted Sign Coefficients t- Statistic
CSFG + 0.058 0.303
FS - 0.125 2.723***
GROS - 0.39 0.52
LEV + -0.027 -0.45
PROF + -0.001 -0.011
Pseudo R2 0.005
LR-Statistic 7.870***
*,**,*** = statistically significant at less than 0.10, 0.05 and 0.01ACACCC = Categorical form of Accruals based first measure of AC, CSFG = Composite Score
for Firms Governance, FS = Firm Size measured by log of total assets, GROS= Sales Growthmeasured by growth in sales, PROF = Profitability of the firm measured by retrun on assets
Table 5.45 shows the results of ordered probit regression for ACACCC (Categorical
variable for ACACC) and CG Mechanisms. The Pseudo R squared is 0.014 and
LR Statistic is also significant. Out of the considered CG variables only BI is
significant with sign similar to that is hypothesized. Table 5.46 shows the results
of ordered probit regression for ACACCC (Categorical variable for ACACC) and
CSFG. The Pseudo R squared is 0.005 and LR Statistic is also significant. The
CSFG is insignificant with sign similar to that is hypothesized.
ACCICC and CG (where AC is Catagorical)
Table 5.47 shows the results of ordered probit regression for ACCICC (Categorical
variable for ACCIC) and CG Mechanisms. The Pseudo R squared is 0.048 and
LR Statistic is also significant. Out of the considered CG variables ACI, BA, BS,
CEOD, INSO and MANO are significant with signs of ACI, BA and INSO are sim-
ilar to that are hypothesized. The results are consistent to those of many studies
in the literature as one of the categories of CG is found to be significantly related
with AC.Table 5.48 shows the results of ordered probit regression for ACCICC
(Categorical variable for ACCIC) and CSFG. The Pseudo R squared is 0.014 and
LR Statistic is also significant. The CSFG is insignificant with sign similar to
that is hypothesized. The results are consistent to those of many studies in the
literature as one of the categories of CG is found to be significantly related with
AC.

Annexure 212
Table 5.47: Results of ACCICC and CG Mechanisms
Variables Predicted Sign Coefficients t- Statistic
ACI + 0.893 2.558**
BA + 0.611 1.671*
BI + -0.922 -2.180**
BS - -0.167 -4.654***
CEOD - 0.074 0.777
CEOT + 0.068 0.612
GDB + 0.125 0.178
INSO + 0.9 3.005***
MANO - 1.161 2.303**
TAUD + -0.099 -1.057
FS - -0.113 -2.376**
GROS - -1.357 -1.762*
LEV + -0.068 -1.088
PROF + 0.182 2.733**
Pseudo R2 0.049
LR-Statistic 71.577***
*,**,*** = statistically significant at less than 0.10, 0.05 and 0.01ACCICC = Categorical form of Accruals based second measure of AC, ACCIEC = Categorical
form of Earnings based measure of AC, ACSOEC = Categorical form of Sensitivity of Earningsto Bad News relative to Sensitivity of Earnings to Good News, ACSKEWC = Categorical form ofSkewness based measure of AC, ACCOMPC = Categorical form of Composite measure of AC ofa firm, ACI = Audit Committee Independence, BA = Board Activity, BI = Board Independence,BS = Board Size, CEOD = CEO Duality, CEOT = CEO Turnover, GDB = Gender Diversityon Board , INSO = Institutional Shareholding , MANO = Managerial Shareholding, TAUD =Type of the Auditor, FS = Firm Size measured by log of total assets, GROS= Sales Growthmeasured by growth in sales, PROF = Profitability of the firm measured by retrun on assets
Table 5.48: Results of ACCICC and Composite Score for Firms Governance
Variables Predicted Sign Coefficients t- Statistic
CSFG + 0.189 0.982
FS - -0.127 -2.742***
GROS - -1.135 -1.511
LEV + -0.068 -1.133
PROF + 0.14 2.197**
Pseudo R2 0.014
LR-Statistic 20.396***
*,**,*** = statistically significant at less than 0.10, 0.05 and 0.01ACCICC = Categorical form of Accruals based second measure of AC, CSFG = Composite
Score for Firms Governance, FS = Firm Size measured by log of total assets, GROS= SalesGrowth measured by growth in sales, PROF = Profitability of the firm measured by retrun onassets, FS = Firm Size measured by log of total assets, GROS= Sales Growth measured bygrowth in sales, PROF = Profitability of the firm measured by retrun on assets

Annexure 213
Table 5.49: Results of ACCIEC and CG Mechanisms
Variables Predicted Sign Coefficients t- Statistic
ACI + -1.297 -3.683***
BA + -0.267 -0.733
BI + -0.357 -0.849
BS - 0.048 1.353
CEOD - -0.158 -1.668*
CEOT + 0.112 0.994
GDB + 1.155 1.651*
INSO + 0.368 1.222
MANO - -1.242 -2.472**
TAUD + 0.222 2.368**
FS - -0.144 -3.003***
GROS - -0.481 -0.623
LEV + 0.178 2.847***
PROF + 0.261 3.875***
Pseudo R2 0.043
LR-Statistic 62.402***
*,**,*** = statistically significant at less than 0.10, 0.05 and 0.01ACCIEC = Categorical form of Earnings based measure of AC, ACSOEC = Categorical form
of Sensitivity of Earnings to Bad News relative to Sensitivity of Earnings to Good News,ACSKEWC = Categorical form of Skewness based measure of AC, ACCOMPC = Categori-cal form of Composite measure of AC of a firm, ACI = Audit Committee Independence, BA =Board Activity, BI = Board Independence, BS = Board Size, CEOD = CEO Duality, CEOT= CEO Turnover, GDB = Gender Diversity on Board , INSO = Institutional Shareholding ,MANO = Managerial Shareholding, TAUD = Type of the Auditor, FS = Firm Size, GROS =Sales Growth, LEV = Leverage, PROF = Profitability
Table 5.50: Results of ACCIEC and Composite Score for Firms Governance
Variables Predicted Sign Coefficients t- Statistic
CSFG + -0.060 -0.310
FS - -0.125 -2.719***
GROS - -0.603 -0.802
LEV + 0.196 3.265***
PROF + 0.284 4.378***
Pseudo R2 0.018
LR-Statistic 26.428***
*,**,*** = statistically significant at less than 0.10, 0.05 and 0.01ACCIEC = Categorical form ofEarnings based measure of AC, CSFG = Composite Score for
Firms Governance, FS = Firm Size, GROS = Sales Growth, LEV = Leverage, PROF = Prof-itability
ACCIEC and CG (where AC is Catagorical)
Table 5.49 shows the results of ordered probit regression for ACCIEC (Categorical
variable for ACCIE) and CG Mechanisms. The Pseudo R squared is 0.043 and LR

Annexure 214
Statistic is also significant. Out of the considered CG variables ACI, CEOD, GDB,
MANO and TAUD are significant with signs of CEOD, GDB, MANO and TAUD
similar to that are hypothesized. Table 5.50 shows the results of ordered probit
regression for ACCIEC (Categorical variable for ACCIE) and CSFG. The Pseudo
R squared is 0.018 and LR Statistic is also significant. The CSFG is insignificant
with sign similar to that is hypothesized. The results are also in consistent with
many studies in the literature.
Table 5.51: Results of ACSKEWC and CG Mechanisms
Variables Predicted Sign Coefficients t- Statistic
ACI + 0.763 2.195**
BA + -0.379 -1.046
BI + -1.268 -3.025***
BS - -0.112 -3.210***
CEOD - -0.052 -0.555
CEOT + 0.107 0.967
GDB + 0.42 0.601
INSO + -0.053 -0.179
MANO - 0.095 0.191
TAUD + 0.118 1.271
FS - -0.018 -0.379
GROS - -0.569 -0.74
LEV + -0.067 -1.084
PROF + 0.008 0.121
Pseudo R2 0.019
LR-Statistic 28.267*
*,**,*** = statistically significant at less than 0.10, 0.05 and 0.01ACSKEWC = Categorical form of Skewness based measure of AC, ACCOMPC = Categorical
form of Composite measure of AC of a firm, ACI = Audit Committee Independence, BA =Board Activity, BI = Board Independence, BS = Board Size, CEOD = CEO Duality, CEOT= CEO Turnover, GDB = Gender Diversity on Board , INSO = Institutional Shareholding ,MANO = Managerial Shareholding, TAUD = Type of the Auditor, FS = Firm Size, GROS =Sales Growth, LEV = Leverage, PROF = Profitability
ACSKEWC and CG (where AC is Categorical)
Table 5.51 shows the results of ordered probit regression for ACSKEWC (Categor-
ical variable for ACSKEW) and CG Mechanisms. The Pseudo R squared is 0.019
and LR Statistic is also significant. Out of the considered CG variables ACI, BI

Annexure 215
Table 5.52: Results of ACSKEWC and Composite Score for Firms Governance
Variables Predicted Sign Coefficients t- Statistic
CSFG + 0.041 0.215
FS - -0.01 -0.216
GROS - -0.176 -0.235
LEV + -0.049 -0.814
PROF + -0.04 -0.631
Pseudo R2 0.001
LR-Statistic 1.274
*,**,*** = statistically significant at less than 0.10, 0.05 and 0.01ACSKEWC = Categorical form of Skewness based measure of AC, CSFG = Composite Score
for Firms Governance, FS = Firm Size, GROS = Sales Growth, LEV = Leverage, PROF =Profitability
and BS are significant with signs of ACI and BS similar to that is hypothesized.
Table 5.52 shows the results of ordered probit regression for ACSKEWC (Cate-
gorical variable for ACSKEW) and CSFG. The Pseudo R squared is 0.001 and LR
Statistic is also significant. The CSFG is insignificant with sign similar to that
was hypothesized.
ACSOEC and CG (where AC is Categorical)
Table 5.53 shows the results of ordered probit regression for ACSOEC (Categorical
variable for ACSOE) and CG Mechanisms. The Pseudo R squared is 0.029 and LR
Statistic is also significant. Out of the considered CG variables ACI, BA, BI and
GDB are significant with signs of BA, BI and GDB similar to that is hypothesized.
Table 5.54 shows the results of ordered probit regression for ACSOEC (Categorical
variable for ACSOE) and CSFG. The Pseudo R squared is 0.010 and LR Statistic is
also significant. The CSFG is significant with sign similar to that is hypothesized.
ACCOMPC and CG (where AC is Categorical)
Table 5.55 shows the results of ordered probit regression for ACCOMPC (Cate-
gorical variable for ACCOMP) and CG Mechanisms. Out of the considered CG
variables ACI, and CEOD are significant with sign of CEOD similar to that is

Annexure 216
Table 5.53: Results of ACSOEC and CG Mechanisms
Variables Predicted Sign Coefficients t- Statistic
ACI + -0.594 -1.672*
BA + 0.82 2.187**
BI + 1.301 3.020***
BS - -0.046 -1.291
CEOD - -0.131 -1.345
CEOT + 0.127 1.117
GDB + 2.157 2.994***
INSO + -0.204 -0.673
MANO - 0.172 0.336
TAUD + -0.006 -0.058
FS - 0.054 1.123
GROS - 1.329 1.681*
LEV + 0.052 0.814
PROF + 0.053 0.787
Pseudo R2 0.029
LR-Statistic 37.153***
*,**,*** = statistically significant at less than 0.10, 0.05 and 0.01ACSOEC = Categorical form of Sensitivity of Earnings to Bad News relative to Sensitivity
of Earnings to Good News, ACI = Audit Committee Independence, BA = Board Activity, BI= Board Independence, BS = Board Size, CEOD = CEO Duality, CEOT = CEO Turnover,GDB = Gender Diversity on Board , INSO = Institutional Shareholding , MANO = ManagerialShareholding, TAUD = Type of the Auditor, FS = Firm Size, GROS = Sales Growth, LEV =Leverage, PROF = Profitability
Table 5.54: Results of ACSOE and Composite Score for Firms Governance
Variables Predicted Sign Coefficients t- Statistic
CSFG + 0.539 2.728***
FS - 0.062 1.312
GROS - 1.397 1.812**
LEV + 0.027 0.440
PROF + 0.060 0.919
Pseudo R2 0.010
LR-Statistic 12.483**
*,**,*** = statistically significant at less than 0.10, 0.05 and 0.01ACSOEC = Categorical form of Sensitivity of Earnings to Bad News relative to Sensitivity of
Earnings to Good News, CSFG = Composite Score for Firms Governance, FS = Firm Size,GROS = Sales Growth, LEV = Leverage, PROF = Profitability
hypothesized. Table 5.56 shows the results of ordered probit regression for AC-
COMPC (Categorical variable for ACCOMP) and CSFG. The CSFG is insignifi-
cant with sign opposite to that is hypothesized.

Annexure 217
Table 5.55: Results of ACCOMPC and CG Mechanisms
Variables Predicted Sign Coefficients t- Statistic
ACI + -0.893 -2.536**
BA + -0.191 -0.522
BI + -0.631 -1.5
BS - -0.021 -0.606
CEOD - -0.155 -1.629*
CEOT + 0.167 1.487
GDB + 0.7 0.998
INSO + 0.194 0.647
MANO - -0.474 -0.939
TAUD + 0.24 2.561*
FS - -0.189 -3.921***
GROS - -0.361 -0.467
LEV + 0.179 2.862***
PROF + 0.256 3.807***
Pseudo R2 0.038
LR-Statistic 53.829***
*,**,*** = statistically significant at less than 0.10, 0.05 and 0.01ACCOMPC = Categorical form of Composite measure of AC of a firm, ACI = Audit Committee
Independence, BA = Board Activity, BI = Board Independence, BS = Board Size, CEOD= CEO Duality, CEOT = CEO Turnover, GDB = Gender Diversity on Board , INSO =Institutional Shareholding , MANO = Managerial Shareholding, TAUD = Type of the Auditor,FS = Firm Size, GROS = Sales Growth, LEV = Leverage, PROF = Profitability
Table 5.56: Results of ACCOMPC and Composite Score for Firms Governance
Variables Predicted Sign Coefficients t- Statistic
CSFG + -0.084 -0.432
FS - -0.173 -3.721***
GROS - -0.359 -0.475
LEV + 0.21 3.488***
PROF + 0.266 4.091***
Pseudo R2 0.021
LR-Statistic 29.361***
*,**,*** = statistically significant at less than 0.10, 0.05 and 0.01ACCOMPC = Categorical form of Composite measure of AC of a firm, CSFG = Composite
Score for Firms Governance, FS = Firm Size, GROS = Sales Growth, LEV = Leverage, PROF= Profitability
ACACCC, CSFG and DQ (where AC is Categorical and
DQ is Moderator)
Table 5.57 shows the results of ordered probit regression for ACACCC (Categorical
variable for ACACC) and CG with DQ present as independent variable as well.

Annexure 218
Table 5.57: Results of ACACCC, CSFG and DQ
Variables Predicted Sign Coefficients t- Statistic
CSFG + 0.040 0.207
DQ - -0.217 -0.729
FS - 0.195 1.83192*
GROS - 0.375 0.500
LEV + -0.029 -0.480
PROF + -0.075 -0.624
Pseudo R2 0.006
LR-Statistic 8.401
*,**,*** = statistically significant at less than 0.10, 0.05 and 0.01ACACCC = Categorical form of Accruals based first measure of AC, CSFG = Composite Score
for Firms Governance, DQ = Disclosure Quality, FS = Firm Size, GROS = Sales Growth,LEV = Leverage, PROF = Profitability
The Pseudo R squared is 0.006 and LR Statistic is also significant. The CSFG is
insignificant with sign similar to that is hypothesized.
Table 5.58: Results of ACCICC, CSFG and DQ
Variables Predicted Sign Coefficients t- Statistic
CSFG + 0.245 1.258
DQ - 0.614 2.05697**
FS - -0.325 -3.0377***
GROS - -1.098 -1.461
LEV + -0.063 -1.054
PROF + 0.353 2.90495***
Pseudo R2 0.017
LR-Statistic 24.630
*,**,*** = statistically significant at less than 0.10, 0.05 and 0.01ACCICC = Categorical form of Accruals based second measure of AC, CSFG = Composite Score
for Firms Governance, DQ = Disclosure Quality, FS = Firm Size, GROS = Sales Growth, LEV= Leverage, PROF = Profitability
ACCICC, CSFG and DQ (where AC is Categorical and DQ
is Moderator)
Table 5.58 shows the results of ordered probit regression for ACCICC (Categorical
variable for ACCIC) and CG with DQ present as independent variable as well.
The Pseudo R squared is 0.017 and LR Statistic is also significant. The CSFG is
insignificant with sign similar to that is hypothesized.

Annexure 219
Table 5.59: Results of ACCIEC, CSFG and DQ
Variables Predicted Sign Coefficients t- Statistic
CSFG + 0.782 2.89777***
DQ - 2.698 4.52518***
FS - -1.982 -4.7968***
GROS - -0.624 -0.827
LEV + 0.173 2.86872***
PROF + 2.049 5.17756***
Pseudo R2 0.032
LR-Statistic 47.111
*,**,*** = statistically significant at less than 0.10, 0.05 and 0.01ACCIEC = Categorical form ofEarnings based measure of AC, CSFG = Composite Score for
Firms Governance, DQ = Disclosure Quality, FS = Firm Size, GROS = Sales Growth, LEV= Leverage, PROF = Profitability
Table 5.60: Results of ACCIEC, CSFG and CSFGXDQ
Variables Predicted Sign Coefficients t- Statistic
CSFG + 1.964 3.09987***
DQ - 3.119 4.92712***
CSFGXDQ - -0.505 -2.0637**
FS - -2.041 -4.9072***
GROS - -0.611 -0.810
LEV + 0.168 2.7811***
PROF + 2.123 5.32271***
Pseudo R2 0.035
LR-Statistic 51.390
*,**,*** = statistically significant at less than 0.10, 0.05 and 0.01ACCIEC = Categorical form ofEarnings based measure of AC, CSFG = Composite Score for
Firms Governance, DQ = Disclosure Quality, FS = Firm Size, GROS = Sales Growth, LEV= Leverage, PROF = Profitability
ACCIEC, CSFG and DQ (where AC is Categorical and DQ
is Moderator)
Table 5.59 shows the results of ordered probit regression for ACCIEC (Categorical
variable for ACCIE) and CG with DQ present as independent variable as well.
The Pseudo R squared is 0.032 and LR Statistic is also significant. The CSFG
is significant with sign similar to that is hypothesized. The results are consistent
with many studies present in the literature that also proposes the existance of
a significant relationship between AC and CG. Table 5.60 shows the results of

Annexure 220
ordered probit regression for ACCIEC (Categorical variable for ACCIE) and CG
with DQ as moderating variable. The Pseudo R squared is 0.035 and LR Statis-
tic is also significant. The CSFGXDQ is significant with sign similar to that is
hypothesized.
Table 5.61: Results of ACSKEWC, CSFG and DQ
Variables Predicted Sign Coefficients t- Statistic
CSFG + 0.039 0.200
DQ - -0.028 -0.094
FS - -0.001 -0.009
GROS - -0.178 -0.237
LEV + -0.049 -0.817
PROF + -0.050 -0.414
Pseudo R2 0.001
LR-Statistic 1.283
*,**,*** = statistically significant at less than 0.10, 0.05 and 0.01ACSKEWC = Categorical form of Skewness based measure of AC, CSFG = Composite Score
for Firms Governance, DQ = Disclosure Quality, FS = Firm Size, GROS = Sales Growth,LEV = Leverage, PROF = Profitability
ACSKEWC, CSFG and DQ (where AC is Categorical and
DQ is Moderator)
Table 5.61 shows the results of ordered probit regression for ACSKEWC (Cate-
gorical variable for ACSKEW) and CG with DQ present as independent variable
as well. The Pseudo R squared is 0.001 and LR Statistic is also significant. The
CSFG is insignificant with sign similar to that is hypothesized.
ACSOEC, CSFG and DQ (where AC is Categorical and DQ
is Moderator)
Table 5.62 shows the results of ordered probit regression for ACSOEC and CG
with DQ present as independent variable. The CSFG is significant. Table 5.63
shows the results of ordered probit regression for ACSOEC and CG with DQ as
moderating variable. The CSFGXDQ is insignificant with sign similar to that is
hypothesized.

Annexure 221
Table 5.62: Results of ACSOEC, CSFG and DQ
Variables Predicted Sign Coefficients t- Statistic
CSFG + 0.581 2.91007***
DQ - 0.465 1.520
FS - -0.088 -0.808
GROS - 1.432 1.85597*
LEV + 0.031 0.503
PROF + 0.220 1.77541*
Pseudo R2 0.011
LR-Statistic 14.796
*,**,*** = statistically significant at less than 0.10, 0.05 and 0.01ACSOEC = Categorical form of Sensitivity of Earnings to Bad News relative to Sensitivity of
Earnings to Good News, CSFG = Composite Score for Firms Governance, DQ = DisclosureQuality, FS = Firm Size, GROS = Sales Growth, LEV = Leverage, PROF = Profitability
Table 5.63: Results of ACSOEC, CSFG and CSFGXDQ
Variables Predicted Sign Coefficients t- Statistic
CSFG + 0.145 0.204
DQ - 0.270 0.627
CSFGXDQ - 0.300 0.641
FS - -0.090 -0.821
GROS - 1.432 1.85565*
LEV + 0.031 0.512
PROF + 0.216 1.73582*
Pseudo R2 0.012
LR-Statistic 15.207
*,**,*** = statistically significant at less than 0.10, 0.05 and 0.01ACSOEC = Categorical form of Sensitivity of Earnings to Bad News relative to Sensitivity of
Earnings to Good News, CSFG = Composite Score for Firms Governance, DQ = DisclosureQuality, FS = Firm Size, GROS = Sales Growth, LEV = Leverage, PROF = Profitability
ACCOMPC, CSFG and DQ (where AC is Categorical and
DQ is Moderator)
Table 5.64 shows the results of ordered probit regression for ACCOMPC (Cate-
gorical variable for ACCOMP) and CG with DQ present as independent variable
as well. The CSFG is significant with sign similar to that is hypothesized. Table
5.65 shows the results of ordered probit regression for ACCOMPC (Categorical
variable for ACCOMP) and CG with DQ as moderating variable. The Pseudo R
squared is 0.031 and LR Statistic is also significant. The CSFGXDQ is significant.
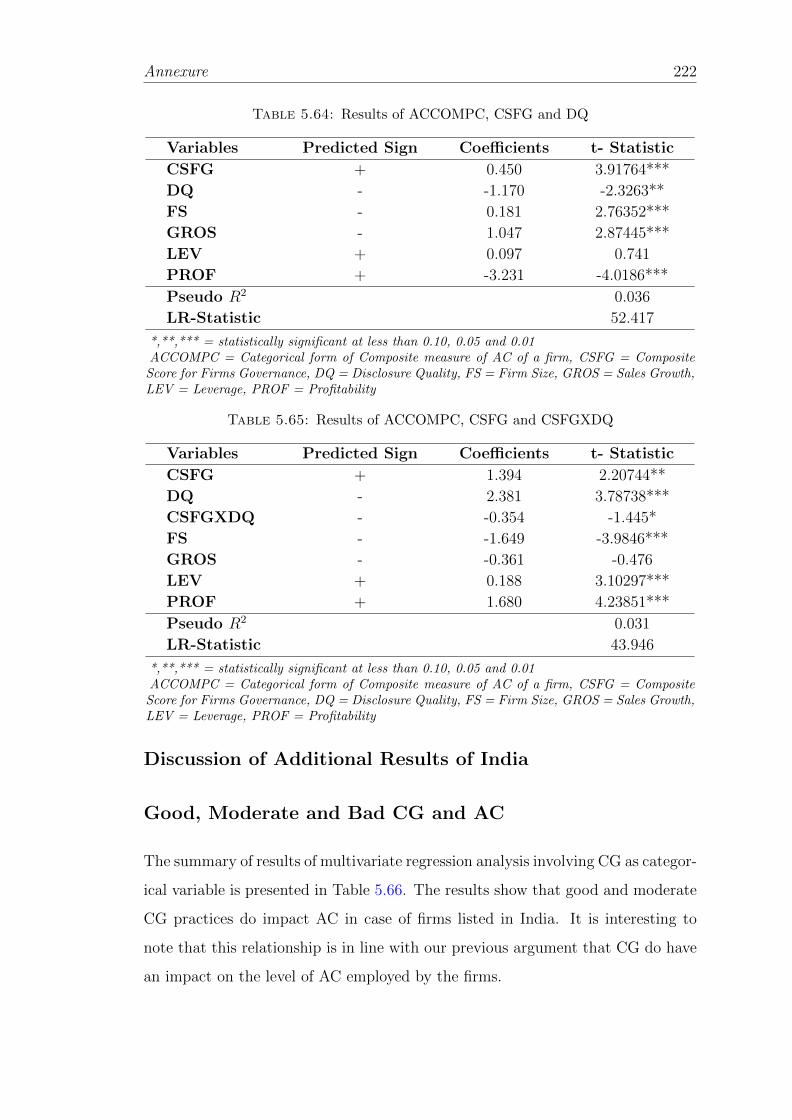
Annexure 222
Table 5.64: Results of ACCOMPC, CSFG and DQ
Variables Predicted Sign Coefficients t- Statistic
CSFG + 0.450 3.91764***
DQ - -1.170 -2.3263**
FS - 0.181 2.76352***
GROS - 1.047 2.87445***
LEV + 0.097 0.741
PROF + -3.231 -4.0186***
Pseudo R2 0.036
LR-Statistic 52.417
*,**,*** = statistically significant at less than 0.10, 0.05 and 0.01ACCOMPC = Categorical form of Composite measure of AC of a firm, CSFG = Composite
Score for Firms Governance, DQ = Disclosure Quality, FS = Firm Size, GROS = Sales Growth,LEV = Leverage, PROF = Profitability
Table 5.65: Results of ACCOMPC, CSFG and CSFGXDQ
Variables Predicted Sign Coefficients t- Statistic
CSFG + 1.394 2.20744**
DQ - 2.381 3.78738***
CSFGXDQ - -0.354 -1.445*
FS - -1.649 -3.9846***
GROS - -0.361 -0.476
LEV + 0.188 3.10297***
PROF + 1.680 4.23851***
Pseudo R2 0.031
LR-Statistic 43.946
*,**,*** = statistically significant at less than 0.10, 0.05 and 0.01ACCOMPC = Categorical form of Composite measure of AC of a firm, CSFG = Composite
Score for Firms Governance, DQ = Disclosure Quality, FS = Firm Size, GROS = Sales Growth,LEV = Leverage, PROF = Profitability
Discussion of Additional Results of India
Good, Moderate and Bad CG and AC
The summary of results of multivariate regression analysis involving CG as categor-
ical variable is presented in Table 5.66. The results show that good and moderate
CG practices do impact AC in case of firms listed in India. It is interesting to
note that this relationship is in line with our previous argument that CG do have
an impact on the level of AC employed by the firms.

Annexure 223
CG, AC and Disclosure Quality with AC as Categorical
Variable
Table 5.67 shows the summary of results of probit regression that is employed
as an additional analytical technique. The results show that ACI, CEO Duality
and Type of the auditor do have an impact on the level of conservatism employed
by firms. It is interesting to note that the results of panel regression analysis
regarding the composite score of firm’s governance are not endorsed in additional
analysis. The results show that CSFG does not play a significant role in determin-
ing accounting conservatism if the nature of the dependent variable is categorical.
However the role of disclosure quality in moderating the relationship between CG
and AC is found in case of additional analysis.

An
nexu
re224
Table 5.66: Summary of Additional Testing (Good, Moderate and Bad CG and AC)
Assumptions ACACC ACCIC ACCIE ACSKEW ACSOE ACCOMP
A1 Good CG practices + + + + + +
effects AC (NS) (S) (NS) (NS) (NS) (S)
A2 Moderate CG practices - + + + + +
practices effects AC (NS) (NS) (S) (NS) (NS) (S)
A3 Bad CG practices - + + - + +
practices effects AC (NS) (NS) (NS) (NS) (NS) (NS)
(NS) = Not Supported and (S) = Supported

An
nexu
re225
Table 5.67: Summary of results of probit regression
Hypothesis ACACC ACCIC ACCIE ACSKEW ACSOE ACCOMP
H1 There is a negative relationship between + - + - - -
board size and AC (NS) (S) (NS) (S) (NS) (NS)
H2 There is a positive relationship between + - - - + -
board independence and AC (S) (S) (NS) (S) (S) (NS)
H3 There is a positive relationship between - + - - + -
board activity and AC (NS) (S) (NS) (NS) (S) (NS)
H4 There is a positive relationship between gender - + + + + +
diversity on board and AC (NS) (NS) (S) (NS) (S) (NS)
H5 There is a positive relationship between CEO - + + + + +
Turnover and AC (NS) (NS) (NS) (NS) (NS) (NS)
H6 There is a negative relationship between - + - - - -
CEO Duality and AC (NS) (NS) (S) (NS) (NS) (S)
H7 There is a positive relationship between Instit- - + + - - +
utional ownership and AC (NS) (S) (NS) (NS) (NS) (NS)
H8 There is a negative relationship between Mana- + + - + + -
gerial ownership and AC (NS) (S) (S) (NS) (NS) (NS)
H9 There is a positive relationship between Audit Comm- - + - + - -
ittee Independence and AC (NS) (S) (S) (S) (S) (S)
H10 There is a positive relationship between existence + - + + - +
of Big Four Auditor and AC (NS) (NS) (S) (NS) (NS) (S)
H11 There is a positive relationship between composite + + - + + +
score of firm governance and AC (NS) (NS) (NS) (NS) (S) (NS)
H12 High disclosure quality moderates the association between - + -
CG and AC (NA) (NA) (S) (NA) (NS) (S)
NS = Not Supported, S = Supported and NA=Estimation Not Applicable

Annexure 226
APPENDIX V
Additional Analyses for Pakistan
Two additional analyses are being performed. The first set of following section
reports the results of panel data regression analysis involving CG as the categorical
variables i.e. converted into good, bad and moderate governance. The second
section reports the results of ordered probit regression analysis involving AC as
the categorical variable. This section encompasses the results of those regression
models that are employed to test the effect of good, moderate and bad CG on AC.
Following Shah (2007) the dummies are created for good, bad and moderate CG
by employing normal curve methodology on composite score of firms governance.
Table 5.68: Results of ACACC and Good, Moderate and Bad CG
Variables Predicted Sign Coefficients t- Statistic
Constant 0.000 -0.003
GG + 0.090 1.774*
MG - 0.092 1.394
BG - 0.103 1.282
FS - -0.070 -1.964**
GROS - -0.014 -0.288
LEV + -0.052 -1.681
PROF + 0.219 1.211
Adj R2 0.410
F-Statistic 5.579***
*,**,*** = statistically significant at less than 0.10, 0.05 and 0.01ACACC = Accruals based first measure of AC, GG = Good Governance, BG = Bad Governance,
MG = Moderate Governance, FS = Firm Size, GROS= Sales Growth, PROF = Profitability
ACACC and Good, Moderate and Bad CG
Table 5.68 shows the results of fixed effect regression for ACACC and proxies for
GG, MG and BG. The adjusted R squared is 0.410 meaning that 41 percent of the
variation in dependent variable is because of the considered independent variables.
The F-statistic is also significant meaning that the model is a good fit. The GG
is significant.

Annexure 227
Table 5.69: Results of ACCIC and Good, Moderate and Bad CG
Variables Predicted Sign Coefficients t- Statistic
Constant 0.16 0.495
GG + 0.024 0.323
MG - -0.025 -0.28
BG - 0.023 0.207
FS - -0.093 -1.830*
GROS - -0.021 -0.256
LEV + -0.129 -2.068*
PROF + 0.308 1.874*
Adj R2 0.426
F-Statistic 5.888***
*,**,*** = statistically significant at less than 0.10, 0.05 and 0.01ACCIC = Accruals based second measure of AC, GG = Good Governance, BG = Bad Gover-
nance, MG = Moderate Governance, FS = Firm Size, GROS= Sales Growth, PROF = Prof-itability
ACCIC and Good, Moderate and Bad CG
Table 5.69 shows the results of fixed effect regression for ACCIC and proxies for
GG, MG and BG. The adjusted R squared is 0.426 meaning that 42.6 percent
of the variation in dependent variable is because of the considered independent
variables. The F-statistic is also significant meaning that the model is a good fit.
The GG, MG and BG all are insignificant. The results are consistent to those of
many studies in the literature.
Table 5.70: Results of ACCIE and Good, Moderate and Bad CG
Variables Predicted Sign Coefficients t- Statistic
Constant -0.100 -0.256
GG + 0.027 0.320
MG - 0.014 0.127
BG - -0.007 -0.051
FS - 0.017 0.330
GROS - 0.097 1.136
LEV + 0.113 2.243**
PROF + 0.140 0.695
Adj R2 0.610
F-Statistic 11.228***
*,**,*** = statistically significant at less than 0.10, 0.05 and 0.01ACCIE = Earnings based measure of AC, GG = Good Governance, BG = Bad Governance,
MG = Moderate Governance, FS = Firm Size, GROS= Sales Growth, PROF = Profitability

Annexure 228
ACCIE and Good, Moderate and Bad CG
Table 5.70 shows the results of fixed effect regression for ACCIE and proxies for
GG, MG and BG. The adjusted R squared is 0.610 meaning that 61 percent of the
variation in dependent variable is because of the considered independent variables.
The F-statistic is also significant meaning that the model is a good fit. The GG,
MG and BG all are insignificant.
Table 5.71: Results of ACSKEW and Good, Moderate and Bad CG
Variables Predicted Sign Coefficients t- Statistic
Constant 0.008 0.049
GG + 0.086 1.685*
MG - 0.089 1.325
BG - 0.099 1.222
FS - -0.068 -1.947**
GROS - -0.015 -0.314
LEV + -0.050 -1.550
PROF + 0.196 1.086
Adj R2 0.411
F-Statistic 5.597***
*,**,*** = statistically significant at less than 0.10, 0.05 and 0.01ACSKEW = Skewness based measure of AC, GG = Good Governance, BG = Bad Governance,
MG = Moderate Governance, FS = Firm Size, GROS= Sales Growth, PROF = Profitability
ACSKEW and Good, Moderate and Bad CG
Table 5.71 shows the results of fixed effect regression for ACSKEW and proxies
for GG, MG and BG. The adjusted R squared is 0.411 meaning that 41.1 percent
of the variation in dependent variable is because of the considered independent
variables. The F-statistic is also significant meaning that the model is a good fit.
The GG is significant.
ACSOE and Good, Moderate and Bad CG
Table 5.72 shows the results of fixed effect regression for ACSOE and proxies for
GG, MG and BG. The adjusted R squared is 0.333 meaning that 33.3 percent

Annexure 229
Table 5.72: Results of ACSOE and Good, Moderate and Bad CG
Variables Predicted Sign Coefficients t- Statistic
Constant 0.240 1.338
GG + 0.052 1.124
MG - 0.046 0.836
BG - -0.009 -0.14
FS - 0.024 1.03
GROS - 0.023 0.628
LEV + -0.048 -1.483
PROF + 0.085 0.836
Adj R2 0.333
F-Statistic 4.294***
*,**,*** = statistically significant at less than 0.10, 0.05 and 0.01ACSOE = Sensitivity of earnings to bad news relative to sensitivity of earnings to good news,
GG = Good Governance, BG = Bad Governance, MG = Moderate Governance, FS = FirmSize, GROS= Sales Growth, PROF = Profitability
of the variation in dependent variable is because of the considered independent
variables. The F-statistic is also significant meaning that the model is a good fit.
The GG, MG and BG all are insignificant.
Table 5.73: Results of ACCOMP and Good, Moderate and Bad CG
Variables Predicted Sign Coefficients t- Statistic
Constant 0.025 0.106
GG + 0.123 1.907**
MG - 0.135 1.526
BG - 0.133 1.259
FS - -0.076 -1.423
GROS - -0.019 -0.278
LEV + -0.064 -1.369
PROF + 0.237 0.910
Adj R2 0.404
F-Statistic 5.461***
*,**,*** = statistically significant at less than 0.10, 0.05 and 0.01ACCOMP = Composite measure of AC, GG = Good Governance, BG = Bad Governance, MG
= Moderate Governance, FS = Firm Size, GROS= Sales Growth, PROF = Profitability
ACCOMP and Good, Moderate and Bad CG
Table 5.73 shows the results of fixed effect regression for ACCOMP and proxies
for GG, MG and BG. The adjusted R squared is 0.404 meaning that 40.4 percent

Annexure 230
of the variation in dependent variable is because of the considered independent
variables. The F-statistic is also significant meaning that the model is a good fit.
The GG is significant.
Table 5.74: Results of ACACCC and CG Mechanisms
Variables Predicted Sign Coefficients t- Statistic
ACI + 0.154 0.645
BA + -0.064 -0.176
BI + 0.438 1.707*
BS - 0.113 4.141*
CEOD - 0.185 1.688*
CEOT + -0.222 -1.369
GDB + 0.084 0.22
INSO + -0.33 -1.866*
MANO - -0.398 -0.552
TAUD + -0.072 -0.766
FS - -0.034 -0.488
GROS - 0.077 0.576
LEV + -0.196 -1.968**
PROF + -0.749 -1.742*
Pseudo R2 0.024
LR-Statistic 35.312***
*,**,*** = statistically significant at less than 0.10, 0.05 and 0.01ACACCC = Categorical form of Accruals based first measure of AC, ACI = Audit Committee
Independence, BA = Board Activity, BI = Board Independence, BS = Board Size, CEOD= CEO Duality, CEOT = CEO Turnover, GDB = Gender Diversity on Board , INSO =Institutional Shareholding , MANO = Managerial Shareholding, TAUD = Type of the Auditor,FS = Firm Size measured by log of total assets, GROS= Sales Growth measured by growth insales, PROF = Profitability of the firm measured by retrun on assets
Table 5.75: Results of ACACCC and Composite Score for Firms Governance
Variables Predicted Sign Coefficients t- Statistic
CSFG + 0.242 3.484***
FS - 0.007 0.102
GROS - 0.052 0.391
LEV + -0.219 -2.247*
PROF + -0.547 -1.315
Pseudo R2 0.013
LR-Statistic 19.383***
*,**,*** = statistically significant at less than 0.10, 0.05 and 0.01ACACCC = Categorical form of Accruals based first measure of AC, CSFG = Composite Score
for Firms Governance, FS = Firm Size measured by log of total assets, GROS= Sales Growthmeasured by growth in sales, PROF = Profitability of the firm measured by retrun on assets

Annexure 231
ACACCC and CG (where AC is Categorical)
This section encompasses the results of those regression models that are employed
to test the effect of CG on AC but with a change in the nature of dependent
variable. The dependent variable i.e. AC is converted into the categorical variable
and hence logistic regression models are estimated. Table 5.74 shows the results of
ordered probit regression for ACACCC (Categorical variable for ACACC) and CG
Mechanisms. The Pseudo R squared is 0.024 and LR Statistic is also significant.
Out of the considered CG variables BI, BS, CEOD and INSO are significant with
sign of BI similar to that is hypothesized. The results are consistent to those
of many studies in the literature as one of the categories of CG is found to be
significantly related with AC. It means that there exist a relationship between
CG and AC even when the CG is examined in catagorical form.Table 5.75 shows
the results of ordered probit regression for ACACCC (Categorical variable for
ACACC) and CSFG. The Pseudo R squared is 0.013 and LR Statistic is also
significant. The CSFG is significant with sign similar to that is hypothesized.
The results are consistent to those of many studies in the literature as one of
the categories of CG is found to be significantly related with AC. It means that
there exist a relationship between CG and AC even when the CG is examined in
catagorical form.
ACCICC and CG (where AC is Catagorical)
Table 5.76 shows the results of ordered probit regression for ACCIC (Categorical
variable for ACCIC) and CG Mechanisms. The Pseudo R squared is 0.021 and
LR Statistic is also significant. Out of the considered CG variables BS, CEOD
and INSO are significant. The results are consistent to those of many studies in
the literature as one of the categories of CG is found to be significantly related
with AC. It means that there exist a relationship between CG and AC even when
the CG is examined in catagorical form.Table 5.77 shows the results of ordered
probit regression for ACCICC (Categorical variable for ACCIC) and CSFG. The
Pseudo R squared is 0.010 and LR Statistic is also significant. The CSFG is

Annexure 232
Table 5.76: Results of ACCICC and CG Mechanisms
Variables Predicted Sign Coefficients t- Statistic
ACI + 0.076 0.321
BA + -0.24 -0.657
BI + 0.156 0.611
BS - 0.051 1.880*
CEOD - 0.224 2.047**
CEOT + 0.082 0.507
GDB + -0.244 -0.635
INSO + -0.444 -2.524*
MANO - 0.857 1.192
TAUD + 0.058 0.613
FS - -0.05 -0.722
GROS - 0.062 0.463
LEV + -0.064 -0.641
PROF + 1.468 3.393***
Pseudo R2 0.021
LR-Statistic 31.103***
*,**,*** = statistically significant at less than 0.10, 0.05 and 0.01ACCICC = Categorical form of Accruals based second measure of AC, ACCIEC = Categorical
form of Earnings based measure of AC, ACSOEC = Categorical form of Sensitivity of Earningsto Bad News relative to Sensitivity of Earnings to Good News, ACSKEWC = Categorical form ofSkewness based measure of AC, ACCOMPC = Categorical form of Composite measure of AC ofa firm, ACI = Audit Committee Independence, BA = Board Activity, BI = Board Independence,BS = Board Size, CEOD = CEO Duality, CEOT = CEO Turnover, GDB = Gender Diversityon Board , INSO = Institutional Shareholding , MANO = Managerial Shareholding, TAUD =Type of the Auditor, FS = Firm Size measured by log of total assets, GROS= Sales Growthmeasured by growth in sales, PROF = Profitability of the firm measured by retrun on assets
Table 5.77: Results of ACCICC and Composite Score for Firms Governance
Variables Predicted Sign Coefficients t- Statistic
CSFG + 0.096 1.377
FS - -0.009 -0.131
GROS - 0.058 0.442
LEV + -0.076 -0.775
PROF + 1.488 3.547***
Pseudo R2 0.010
LR-Statistic 14.752***
*,**,*** = statistically significant at less than 0.10, 0.05 and 0.01ACCICC = Categorical form of Accruals based second measure of AC, CSFG = Composite
Score for Firms Governance, FS = Firm Size measured by log of total assets, GROS= SalesGrowth measured by growth in sales, PROF = Profitability of the firm measured by retrun onAssets.

Annexure 233
insignificant with sign similar to that is hypothesized. The results are consistent
to those of many studies in the literature as one of the categories of CG is found to
be significantly related with AC. It means that there exist a relationship between
CG and AC even when the CG is examined in catagorical form.
Table 5.78: Results of ACCIEC and CG Mechanisms
Variables Predicted Sign Coefficients t- Statistic
ACI + -0.191 -0.8
BA + 0.236 0.65
BI + -0.463 -1.805*
BS - 0.104 3.852**
CEOD - 0.254 2.296**
CEOT + 0.03 0.187
GDB + -0.147 -0.383
INSO + -0.346 -1.976*
MANO - -0.077 -0.107
TAUD + -0.009 -0.099
FS - 0.098 1.436
GROS - 0.295 2.209*
LEV + -0.013 -0.13
PROF + 0.342 0.796
Pseudo R2 0.027
LR-Statistic 40.245**
*,**,*** = statistically significant at less than 0.10, 0.05 and 0.01ACCIEC = Categorical form of Earnings based measure of AC, ACSOEC = Categorical form
of Sensitivity of Earnings to Bad News relative to Sensitivity of Earnings to Good News,ACSKEWC = Categorical form of Skewness based measure of AC, ACCOMPC = Categori-cal form of Composite measure of AC of a firm, ACI = Audit Committee Independence, BA =Board Activity, BI = Board Independence, BS = Board Size, CEOD = CEO Duality, CEOT= CEO Turnover, GDB = Gender Diversity on Board , INSO = Institutional Shareholding ,MANO = Managerial Shareholding, TAUD = Type of the Auditor, FS = Firm Size, GROS =Sales Growth, LEV = Leverage, PROF = Profitability
ACCIEC and CG (where AC is Catagorical)
Table 5.78 shows the results of ordered probit regression for ACCIEC (Categorical
variable for ACCIE) and CG Mechanisms. The Pseudo R squared is 0.027 and LR
Statistic is also significant. Out of the considered CG variables BI, BS, CEOD and
INSO are significant. Table 5.79 shows the results of ordered probit regression for
ACCIEC (Categorical variable for ACCIC) and CSFG. The Pseudo R squared is

Annexure 234
Table 5.79: Results of ACCIEC and Composite Score for Firms Governance
Variables Predicted Sign Coefficients t- Statistic
CSFG + 0.228 3.283***
FS - 0.116 1.752*
GROS - 0.281 2.131**
LEV + -0.009 -0.095
PROF + 0.26 0.626
Pseudo R2 0.013
LR-Statistic 18.442***
*,**,*** = statistically significant at less than 0.10, 0.05 and 0.01ACCIEC = Categorical form ofEarnings based measure of AC, CSFG = Composite Score for
Firms Governance, FS = Firm Size, GROS = Sales Growth, LEV = Leverage, PROF = Prof-itability
0.013 and LR Statistic is also significant. The CSFG is significant with sign similar
to that is hypothesized. The results are consistent to those of many studies in the
literature as one of the categories of CG is found to be significantly related with
AC. It means that there exist a relationship between CG and AC even when the
CG is examined in catagorical form.
ACSKEWC and CG (where AC is Categorical)
Table 5.80 shows the results of ordered probit regression for ACSKEWC (Categor-
ical variable for ACSKEW) and CG Mechanisms. The Pseudo R squared is 0.023
and LR Statistic is also significant. Out of the considered CG variables BS, CEOD
and INSO are significant. The results are consistent to those of many studies in
the literature as one of the categories of CG is found to be significantly related
with AC. It means that there exist a relationship between CG and AC even when
the CG is examined in catagorical form. Table 5.81 shows the results of ordered
probit regression for ACSKEWC (Categorical variable for ACSKEW) and CSFG.
The Pseudo R squared is 0.013 and LR Statistic is also significant. The CSFG is
significant with sign similar to that was hypothesized. The results are consistent
to those of many studies in the literature as one of the categories of CG is found to
be significantly related with AC. It means that there exist a relationship between
CG and AC even when the CG is examined in catagorical form.

Annexure 235
Table 5.80: Results of ACSKEWC and CG Mechanisms
Variables Predicted Sign Coefficients t- Statistic
ACI + 0.164 0.686
BA + -0.071 -0.194
BI + 0.388 1.511
BS - 0.112 4.134**
CEOD - 0.199 1.820*
CEOT + -0.195 -1.202
GDB + 0.077 0.201
INSO + -0.327 -1.850*
MANO - -0.482 -0.67
TAUD + -0.075 -0.796
FS - -0.029 -0.425
GROS - 0.083 0.621
LEV + -0.192 -1.928*
PROF + -0.781 -1.817*
Pseudo R2 0.024
LR-Statistic 34.799***
*,**,*** = statistically significant at less than 0.10, 0.05 and 0.01ACSKEWC = Categorical form of Skewness based measure of AC, ACCOMPC = Categorical
form of Composite measure of AC of a firm, ACI = Audit Committee Independence, BA =Board Activity, BI = Board Independence, BS = Board Size, CEOD = CEO Duality, CEOT= CEO Turnover, GDB = Gender Diversity on Board , INSO = Institutional Shareholding ,MANO = Managerial Shareholding, TAUD = Type of the Auditor, FS = Firm Size, GROS =Sales Growth, LEV = Leverage, PROF = Profitability
Table 5.81: Results of ACSKEWC and Composite Score for Firms Governance
Variables Predicted Sign Coefficients t- Statistic
CSFG + 0.240 3.452***
FS - 0.01 0.146
GROS - 0.058 0.438
LEV + -0.213 -2.186**
PROF + -0.592 -1.422
Pseudo R2 0.013
LR-Statistic 19.302***
*,**,*** = statistically significant at less than 0.10, 0.05 and 0.01ACSKEWC = Categorical form of Skewness based measure of AC, CSFG = Composite Score
for Firms Governance, FS = Firm Size, GROS = Sales Growth, LEV = Leverage, PROF =Profitability
ACSOEC and CG (where AC is Categorical)
Table 5.82 shows the results of ordered probit regression for ACSOEC (Categorical
variable for ACSOE) and CG Mechanisms. The Pseudo R squared is 0.036 and

Annexure 236
Table 5.82: Results of ACSOEC and CG Mechanisms
Variables Predicted Sign Coefficients t- Statistic
ACI + -0.526 -2.168**
BA + -0.6 -1.614*
BI + 0.257 0.987
BS - 0.009 0.344
CEOD - 0.335 2.982**
CEOT + -0.021 -0.129
GDB + 0.695 1.780**
INSO + 0.99 5.429***
MANO - 0.23 0.315
TAUD + 0.01 0.106
FS - 0.055 0.789
GROS - 0.117 0.86
LEV + -0.195 -1.919*
PROF + 0.168 0.389
Pseudo R2 0.036
LR-Statistic 55.504***
*,**,*** = statistically significant at less than 0.10, 0.05 and 0.01ACSOEC = Categorical form of Sensitivity of Earnings to Bad News relative to Sensitivity
of Earnings to Good News, ACI = Audit Committee Independence, BA = Board Activity, BI= Board Independence, BS = Board Size, CEOD = CEO Duality, CEOT = CEO Turnover,GDB = Gender Diversity on Board , INSO = Institutional Shareholding , MANO = ManagerialShareholding, TAUD = Type of the Auditor, FS = Firm Size, GROS = Sales Growth, LEV =Leverage, PROF = Profitability
Table 5.83: Results of ACSOE and Composite Score for Firms Governance
Variables Predicted Sign Coefficients t- Statistic
CSFG + 0.069 0.988
FS - -0.007 -0.106
GROS - 0.103 0.771
LEV + -0.188 -1.902*
PROF + 0.177 0.421
Pseudo R2 0.003
LR-Statistic 5.018ns
*,**,*** = statistically significant at less than 0.10, 0.05 and 0.01ACSOEC = Categorical form of Sensitivity of Earnings to Bad News relative to Sensitivity of
Earnings to Good News, CSFG = Composite Score for Firms Governance, FS = Firm Size,GROS = Sales Growth, LEV = Leverage, PROF = Profitability
LR Statistic is also significant. Out of the considered CG variables CEOD, GDB
and INSO are significant with signs of GDB and INSO are similar to that are
hypothesized. The results are consistent to those of many studies in the literature

Annexure 237
as one of the categories of CG is found to be significantly related with AC. It means
that there exist a relationship between CG and AC even when the CG is examined
in catagorical form.Table 5.83 shows the results of ordered probit regression for
ACSOEC (Categorical variable for ACSOE) and CSFG. The Pseudo R squared
is 0.003 and LR Statistic is also significant. The CSFG is insignificant with sign
similar to that is hypothesized. The results are consistent to those of many studies
in the literature as one of the categories of CG is found to be significantly related
with AC. It means that there exist a relationship between CG and AC even when
the CG is examined in catagorical form.
Table 5.84: Results of ACCOMPC and CG Mechanisms
Variables Predicted Sign Coefficients t- Statistic
ACI + 0.048 0.203
BA + -0.052 -0.142
BI + 0.444 1.736*
BS - 0.088 3.268**
CEOD - 0.149 1.365
CEOT + -0.112 -0.697
GDB + 0.046 0.12
INSO + 0.099 0.563
MANO - -0.654 -0.911
TAUD + -0.067 -0.709
FS - 0.024 0.345
GROS - 0.042 0.314
LEV + -0.055 -0.553
PROF + -1.096 -2.555
Pseudo R2 0.016
LR-Statistic 23.549**
*,**,*** = statistically significant at less than 0.10, 0.05 and 0.01ACCOMPC = Categorical form of Composite measure of AC of a firm, ACI = Audit Committee
Independence, BA = Board Activity, BI = Board Independence, BS = Board Size, CEOD= CEO Duality, CEOT = CEO Turnover, GDB = Gender Diversity on Board , INSO =Institutional Shareholding , MANO = Managerial Shareholding, TAUD = Type of the Auditor,FS = Firm Size, GROS = Sales Growth, LEV = Leverage, PROF = Profitability
ACCOMPC and CG (where AC is Categorical)
Table 5.84 shows the results of ordered probit regression for ACCOMPC (Cate-
gorical variable for ACCOMP) and CG Mechanisms. The Pseudo R squared is

Annexure 238
Table 5.85: Results of ACCOMPC and Composite Score for Firms Governance
Variables Predicted Sign Coefficients t- Statistic
CSFG + 0.211 3.053***
FS - 0.039 0.594
GROS - 0.027 0.206
LEV + -0.068 -0.694
PROF + -0.901 -2.164*
Pseudo R2 0.010
LR-Statistic 15.147***
*,**,*** = statistically significant at less than 0.10, 0.05 and 0.01ACCOMPC = Categorical form of Composite measure of AC of a firm, CSFG = Composite
Score for Firms Governance, FS = Firm Size, GROS = Sales Growth, LEV = Leverage, PROF= Profitability
0.016 and LR Statistic is also significant. Out of the considered CG variables BI
and BS are significant with sign of BI similar to that is hypothesized. The results
are consistent to those of many studies in the literature as one of the categories
of CG is found to be significantly related with AC. It means that there exist a
relationship between CG and AC even when the CG is examined in catagorical
form.Table 5.85 shows the results of ordered probit regression for ACCOMPC
(Categorical variable for ACCOMP) and CSFG. The Pseudo R squared is 0.010
and LR Statistic is also significant. The CSFG is significant with sign similar to
that is hypothesized. The results are consistent to those of many studies in the
literature as one of the categories of CG is found to be significantly related with
AC. It means that there exist a relationship between CG and AC even when the
CG is examined in catagorical form.
ACACCC, CSFG and DQ (where AC is Categorical and
DQ is Moderator)
Table 5.86 shows the results of ordered probit regression for ACACCC (Categorical
variable for ACACC) and CG with DQ present as independent variable as well.
The Pseudo R squared is 0.013 and LR Statistic is also significant. The CSFG is
significant with sign similar to that is hypothesized. The results are consistent to
those of many studies in the literature as one of the categories of CG is found to

Annexure 239
Table 5.86: Results of ACACCC, CSFG and DQ
Variables Predicted Sign Coefficients t- Statistic
CSFG + 0.244 3.43043***
DQ - 0.045 0.095
FS - 0.007 0.102
GROS - 0.052 0.392
LEV + -0.220 -2.2475**
PROF + -0.549 -1.318
Pseudo R2 0.013
LR-Statistic 19.392
*,**,*** = statistically significant at less than 0.10, 0.05 and 0.01ACACCC = Categorical form of Accruals based first measure of AC, CSFG = Composite Score
for Firms Governance, DQ = Disclosure Quality, FS = Firm Size, GROS = Sales Growth,LEV = Leverage, PROF = Profitability
Table 5.87: Results of ACACCC, CSFG and CSFGXDQ
Variables Predicted Sign Coefficients t- Statistic
CSFG + 0.908 2.39374**
DQ - 4.362 1.76976*
CSFGXDQ - -1.436 -1.7844*
FS - 0.002 0.032
GROS - 0.040 0.303
LEV + -0.218 -2.2248**
PROF + -0.523 -1.253
Pseudo R2 0.015
LR-Statistic 22.585
*,**,*** = statistically significant at less than 0.10, 0.05 and 0.01ACACCC = Categorical form of Accruals based first measure of AC, CSFG = Composite Score
for Firms Governance, DQ = Disclosure Quality, FS = Firm Size, GROS = Sales Growth,LEV = Leverage, PROF = Profitability
be significantly related with AC. It means that there exist a relationship between
CG and AC even when the CG is examined in catagorical form.
Table 5.87 shows the results of ordered probit regression for ACACCC (Categorical
variable for ACACC) and CG with DQ as moderating variable. The Pseudo R
squared is 0.015 and LR Statistic is also significant. The CSFGXDQ is significant
with sign similar to that is hypothesized. The results are consistent to those
of many studies in the literature as one of the categories of CG is found to be
significantly related with AC. It means that there exist a relationship between CG
and AC even when the CG is examined in catagorical form.

Annexure 240
Table 5.88: Results of ACCICC, CSFG and DQ
Variables Predicted Sign Coefficients t- Statistic
CSFG + 0.102 1.442
DQ - 0.220 0.469
FS - -0.009 -0.129
GROS - 0.059 0.447
LEV + -0.079 -0.807
PROF + 1.478 3.51814***
Pseudo R2 0.010
LR-Statistic 14.972
*,**,*** = statistically significant at less than 0.10, 0.05 and 0.01ACCICC = Categorical form of Accruals based second measure of AC, CSFG = Composite Score
for Firms Governance, DQ = Disclosure Quality, FS = Firm Size, GROS = Sales Growth, LEV= Leverage, PROF = Profitability
ACCICC, CSFG and DQ (where AC is Categorical and DQ
is Moderator)
Table 5.88 shows the results of ordered probit regression for ACCICC (Categorical
variable for ACCIC) and CG with DQ present as independent variable as well.
The Pseudo R squared is 0.010 and LR Statistic is also significant. The CSFG is
insignificant. The results are consistent to those of many studies in the literature
as one of the categories of CG is found to be significantly related with AC. It
means that there exist a relationship between CG and AC even when the CG is
examined in catagorical form.
Table 5.89: Results of ACCIEC, CSFG and DQ
Variables Predicted Sign Coefficients t- Statistic
CSFG + 0.229 3.22161***
DQ - 0.028 0.059
FS - 0.116 1.75215*
GROS - 0.281 2.13115**
LEV + -0.010 -0.099
PROF + 0.259 0.623
Pseudo R2 0.013
LR-Statistic 18.445
*,**,*** = statistically significant at less than 0.10, 0.05 and 0.01ACCIEC = Categorical form ofEarnings based measure of AC, CSFG = Composite Score for
Firms Governance, DQ = Disclosure Quality, FS = Firm Size, GROS = Sales Growth, LEV= Leverage, PROF = Profitability

Annexure 241
Table 5.90: Results of ACCIEC, CSFG and CSFGXDQ
Variables Predicted Sign Coefficients t- Statistic
CSFG + -0.243 -0.651
DQ - -3.046 -1.250
CSFGXDQ - 1.021 1.286
FS - 0.120 1.80849*
GROS - 0.289 2.18795**
LEV + -0.013 -0.132
PROF + 0.245 0.587
Pseudo R2 0.014
LR-Statistic 20.098
*,**,*** = statistically significant at less than 0.10, 0.05 and 0.01ACCIEC = Categorical form ofEarnings based measure of AC, CSFG = Composite Score for
Firms Governance, DQ = Disclosure Quality, FS = Firm Size, GROS = Sales Growth, LEV= Leverage, PROF = Profitability
ACCIEC, CSFG and DQ (where AC is Categorical and DQ
is Moderator)
Table 5.89 shows the results of ordered probit regression for ACCIEC (Categorical
variable for ACCIE) and CG with DQ present as independent variable as well.
The Pseudo R squared is 0.013 and LR Statistic is also significant. The CSFG is
significant with sign similar to that is hypothesized.
Table 5.90 shows the results of ordered probit regression for ACCIEC (Categorical
variable for ACCIE) and CG with DQ as moderating variable. The Pseudo R
squared is 0.035 and LR Statistic is also significant. The CSFGXDQ is insignifi-
cant. The results are consistent to those of many studies in the literature as one
of the categories of CG is found to be significantly related with AC. It means that
there exist a relationship between CG and AC even when the CG is examined in
catagorical form.
ACSKEWC, CSFG and DQ (where AC is Categorical and
DQ is Moderator)
Table 5.91 shows the results of ordered probit regression for ACSKEWC (Cate-
gorical variable for ACSKEW) and CG with DQ present as independent variable

Annexure 242
Table 5.91: Results of ACSKEWC, CSFG and DQ
Variables Predicted Sign Coefficients t- Statistic
CSFG + 0.241 3.38994***
DQ - 0.023 0.049
FS - 0.010 0.146
GROS - 0.058 0.438
LEV + -0.214 -2.1827**
PROF + -0.593 -1.423
Pseudo R2 0.013
LR-Statistic 19.304
*,**,*** = statistically significant at less than 0.10, 0.05 and 0.01ACSKEWC = Categorical form of Skewness based measure of AC, CSFG = Composite Score
for Firms Governance, DQ = Disclosure Quality, FS = Firm Size, GROS = Sales Growth,LEV = Leverage, PROF = Profitability
Table 5.92: Results of ACSKEWC, CSFG and CSFGXDQ
Variables Predicted Sign Coefficients t- Statistic
CSFG + 0.886 2.33778**
DQ - 4.218 1.71236*
CSFGXDQ - -1.396 -1.7349*
FS - 0.005 0.077
GROS - 0.047 0.351
LEV + -0.212 -2.1605**
PROF + -0.567 -1.359
Pseudo R2 0.015
LR-Statistic 22.323
*,**,*** = statistically significant at less than 0.10, 0.05 and 0.01ACSKEWC = Categorical form of Skewness based measure of AC, CSFG = Composite Score
for Firms Governance, DQ = Disclosure Quality, FS = Firm Size, GROS = Sales Growth,LEV = Leverage, PROF = Profitability
as well. The Pseudo R squared is 0.013 and LR Statistic is also significant. The
CSFG is significant with sign similar to that is hypothesized. The results are con-
sistent to those of many studies in the literature as one of the categories of CG is
found to be significantly related with AC. It means that there exist a relationship
between CG and AC even when the CG is examined in catagorical form.
Table 5.92 shows the results of ordered probit regression for ACSKEWC (Cat-
egorical variable for ACSKEW) and CG with DQ as moderating variable. The
Pseudo R squared is 0.015 and LR Statistic is also significant. The CSFGXDQ is
significant with sign of similar to that is hypothesized. The results are consistent

Annexure 243
to those of many studies in the literature as one of the categories of CG is found to
be significantly related with AC. It means that there exist a relationship between
CG and AC even when the CG is examined in catagorical form.
Table 5.93: Results of ACSOEC, CSFG and DQ
Variables Predicted Sign Coefficients t- Statistic
CSFG + 0.080 1.115
DQ - 0.360 0.755
FS - -0.007 -0.107
GROS - 0.103 0.777
LEV + -0.194 -1.9546*
PROF + 0.165 0.394
Pseudo R2 0.004
LR-Statistic 5.588
*,**,*** = statistically significant at less than 0.10, 0.05 and 0.01ACSOEC = Categorical form of Sensitivity of Earnings to Bad News relative to Sensitivity of
Earnings to Good News, CSFG = Composite Score for Firms Governance, DQ = DisclosureQuality, FS = Firm Size, GROS = Sales Growth, LEV = Leverage, PROF = Profitability
ACSOEC, CSFG and DQ (where AC is Categorical and DQ
is Moderator)
Table 5.93 shows the results of ordered probit regression for ACSOEC (Categorical
variable for ACSOE) and CG with DQ present as independent variable as well.
The Pseudo R squared is 0.004 and LR Statistic is also significant. The CSFG is
insignificant. The results are consistent to those of many studies in the literature
as one of the categories of CG is found to be significantly related with AC. It
means that there exist a relationship between CG and AC even when the CG is
examined in catagorical form.
ACCOMPC, CSFG and DQ (where AC is Categorical and
DQ is Moderator)
Table 5.94 shows the results of ordered probit regression for ACCOMPC (Cate-
gorical variable for ACCOMP) and CG with DQ present as independent variable

Annexure 244
Table 5.94: Results ofACCOMPC, CSFG and DQ
Variables Predicted Sign Coefficients t- Statistic
CSFG + 0.209 2.95616***
DQ - -0.074 -0.157
FS - 0.039 0.594
GROS - 0.027 0.204
LEV + -0.067 -0.680
PROF + -0.898 -2.1546**
Pseudo R2 0.010
LR-Statistic 15.171
*,**,*** = statistically significant at less than 0.10, 0.05 and 0.01ACCOMPC = Categorical form of Composite measure of AC of a firm, CSFG = Composite
Score for Firms Governance, DQ = Disclosure Quality, FS = Firm Size, GROS = Sales Growth,LEV = Leverage, PROF = Profitability
Table 5.95: Results of ACCOMPC, CSFG and CSFGXDQ
Variables Predicted Sign Coefficients t- Statistic
CSFG + 0.952 2.51945**
DQ - 4.758 1.93577**
CSFGXDQ - -1.608 -2.0028**
FS - 0.035 0.524
GROS - 0.014 0.106
LEV + -0.063 -0.643
PROF + -0.871 -2.0881**
Pseudo R2 0.013
LR-Statistic 19.195
*,**,*** = statistically significant at less than 0.10, 0.05 and 0.01ACCOMPC = Categorical form of Composite measure of AC of a firm, CSFG = Composite
Score for Firms Governance, DQ = Disclosure Quality, FS = Firm Size, GROS = Sales Growth,LEV = Leverage, PROF = Profitability
as well. The Pseudo R squared is 0.010 and LR Statistic is also significant. The
CSFG is significant with similar to that is hypothesized. The results are consistent
to those of many studies in the literature as one of the categories of CG is found to
be significantly related with AC. It means that there exist a relationship between
CG and AC even when the CG is examined in catagorical form.
Table 5.95 shows the results of ordered probit regression for ACCOMPC (Cat-
egorical variable forACCOMP) and CG with DQ as moderating variable. The
Pseudo R squared is 0.013 and LR Statistic is also significant. The CSFGXDQ is

Annexure 245
significant with sign similar to that is hypothesized. The results are consistent to
those of many studies in the literature as one of the categories of CG is found to
be significantly related with AC. It means that there exist a relationship between
CG and AC even when the CG is examined in catagorical form.
Discussion of Additional Results of Pakistan
Good, Moderate and Bad CG and AC
The summary of results of multivariate regression analysis involving CG as categor-
ical variable is presented in Table 5.96. The results show that good and moderate
CG practices do impact AC in case of firms listed in Pakistan. It is interesting to
note that this relationship is in line with our previous argument that CG do have
an impact on the level of AC employed by the firms.
CG, AC and Disclosure Quality with AC as Categorical
Variable
Table 5.97 shows the summary of results of probit regression that is employed
as an additional analytical technique. The results show that BI and BS do have
an impact on the level of conservatism employed by firms. It is interesting to
note that the results of panel regression analysis regarding the composite score
of firm’s governance are endorsed in additional analysis. The results show that
CSFG plays a significant role in determining accounting conservatism if the nature
of the dependent variable is categorical. However the role of disclosure quality in
moderating the relationship between CG and AC is found in case of additional
analysis.

An
nexu
re246
Table 5.96: Summary of Additional Testing (Good, Moderate and Bad CG and AC)
Assumptions ACACC ACCIC ACCIE ACSKEW ACSOE ACCOMP
A1 Good CG practices + + + + + +
effects AC (S) (NS) (NS) (S) (NS) (S)
A2 Moderate CG practices + - + + + +
practices effects AC (NS) (NS) (NS) (NS) (NS) (NS)
A3 Bad CG practices + + - + - +
practices effects AC (NS) (NS) (NS) (NS) (NS) (NS)
(NS) = Not Supported and (S) = Supported

An
nexu
re247
Table 5.97: Summary of results of probit regression
Hypothesis ACACC ACCIC ACCIE ACSKEW ACSOE ACCOMP
H1 There is a negative relationship between + + + + + +
board size and AC (S) (S) (S) (S) (NS) (S)
H2 There is a positive relationship between + + - + + +
board independence and AC (S) (NS) (S) (NS) (NS) (S)
H3 There is a positive relationship between - - + - - -
board activity and AC (NS) (NS) (NS) (NS) (S) (NS)
H4 There is a positive relationship between gender + - - + + +
diversity on board and AC (NS) (NS) (NS) (NS) (S) (NS)
H5 There is a positive relationship between CEO - + + - - -
Turnover and AC (NS) (NS) (NS) (NS) (NS) (NS)
H6 There is a negative relationship between + + + + + +
CEO Duality and AC (S) (S) (S) (S) (S) (NS)
H7 There is a positive relationship between Instit- - - - - + +
utional ownership and AC (S) (S) (S) (S) (S) (NS)
H8 There is a negative relationship between Mana- - + - - + -
gerial ownership and AC (NS) (NS) (NS) (NS) (NS) (NS)
H9 There is a positive relationship between Audit Comm- + + - + - +
ittee Independence and AC (NS) (NS) (NS) (NS) (S) (NS)
H10 There is a positive relationship between existence - + - - + -
of Big Four Auditor and AC (NS) (NS) (NS) (NS) (NS) (NS)
H11 There is a positive relationship between composite + + + + + +
score of firm governance and AC (S) (NS) (S) (S) (NS) (S)
H12 High disclosure quality moderates the association between - - - + -
CG and accounting conservatism (S) (NA) (NS) (S) (NS) (S)
NS = Not Supported, S = Supported and NA=Estimation Not Applicable

Annexure 248
APPENDIX VI
Results of GMM
Table 5.98 shows the results of GMM for a sample of 100 companies from Bangladesh,
India and Pakistan.
Table 5.99 shows the results of GMM for a sample of 100 companies from Bangladesh,
India and Pakistan.

An
nexu
re249
Table 5.98: GMM Results of ACCOMP and CG mechanisms
Bangladesh India Pakistan
Variables Coefficient t- Stat Coefficient t- Stat Coefficient t- Stat
Constant -0.603 -0.964 -3.834 -3.539 -0.761 -0.565
ACI 0.089 0.705 1.111 2.061** 0.108 0.144
BA 0.009 0.037 0.550 1.260 -1.032 -0.748
BI -0.186 -0.693 -0.273 -0.638 -0.225 -0.316
BS 0.025 0.581 -0.067 -1.354 0.151 1.393
CEOD 0.220 2.16733** 0.082 1.004 -1.065 -1.681
CEOT 0.031 0.334 -0.080 -0.877 0.193 0.777
GDB 0.813 1.123 2.531 2.284** -2.411 -2.454
INSTO 1.234 4.148*** 0.232 0.737 1.243 2.226**
MANO 0.336 0.367 -0.346 -0.397 2.408 1.221
TAUD 0.229 1.742 0.756 1.033 -0.700 -0.826
FS -0.403 -2.507** 0.773 2.519*** -0.479 -1.821
LEV 0.122 1.237 0.301 1.988** -0.028 -0.072
GROS 0.006 0.157 -0.217 -0.501 -1.422 -0.998
PROF 0.012 0.529 1.517 2.042** 27.912 2.461**
No of instruments 18 18 19
J-Statistic 6.634* 20.964*** 14.716***
*,**,*** = statistically significant at less than 0.10, 0.05 and 0.01ACCOMP = Composite measure of AC of a firm, ACI = Audit Committee Independence, BA = Board Activity, BI = Board Independence, BS = Board
Size, CEOD = CEO Duality, CEOT = CEO Turnover, GDB = Gender Diversity on Board, INSO = Institutional Shareholding, MANO = ManagerialShareholding, TAUD = Type of the Auditor, FS = Firm Size, GROS = Sales Growth, LEV = Leverage, PROF = Profitability

An
nexu
re250
Table 5.99: GMM Results of ACCOMP, CG and DQ
Bangladesh India Pakistan
Variables Coefficient t- Stat Coefficient t- Stat Coefficient t- Stat
Step 1
Constant -0.816 -1.420 1.387 0.523 -0.610 -1.576
CSFG 0.442 2.383** 0.499 2.193** 0.181 2.308**
DQ 0.857 0.657 -0.092 -0.116 0.260 0.471
FS -0.238 -1.601 -0.630 -0.690 -0.171 -2.863
GROS 0.000 -0.002 0.044 0.528 0.019 0.152
LEV 0.191 1.923** -6.470 -1.566 -0.298 -2.858
PROF -0.009 -0.390 0.068 0.255 7.422 3.250**
No of instruments 10.000 16.000 17.000
J-statistic 4.268*** 35.338*** 24.237***
Step 2
Constant -4.719 -1.447 -2.926 -1.847 -24.130 -3.001
CSFG 8.066 2.114** 3.198 1.881 8.399 3.042**
DQ 11.839 1.719* 1.414 1.889 53.156 3.074**
CSFGXDQ -33.659 -1.929 -1.758 -1.705 -18.226 -3.050
FS 0.260 0.450 0.063 0.197 -0.282 -3.299
GROS -0.592 -0.141 0.044 1.170 -0.169 -1.029
LEV -2.391 -1.217 0.300 1.111 -0.297 -2.846
PROF 0.106 2.595*** 0.182 1.925 6.105 2.491**
No of instruments 13.000 18.000 19.000
J-statistic 35.084*** 70.845*** 16.723***
*,**,*** = statistically significant at less than 0.10, 0.05 and 0.01ACCOMP = Composite measure of AC of a firm, DQ = Disclosure Quality, CSFG = Composite Score of Firm Governance, FS = Firm Size, GROS =
Sales Growth, LEV = Leverage, PROF = Profitability

Annexure 251
APPENDIX VII
Results of Combined Data Set
Table 5.100 shows the results of fixed effect regression for ACCOMP with CG
mechanisms. The adjusted R squared is 0.583 meaning that 58.3 percent of the
variation in dependent variable is because of the considered independent variables.
The F-statistic is also significant meaning that the model is a good fit. Out of
the ten considered CG variables only CEOT, GDB and INSO are significant with
signs of CEOT, GDB and INSO that are hypothesized.
Table 5.100: Results of ACCOMP and CG mechanisms
Variables Predicted Sign Coefficients t- Statistic
Constant -0.7391 -2.8508**
ACI + 0.0256 0.2549
BA + 0.0379 0.2161
BI + 0.0491 0.3265
BS - -0.0088 -0.4779
CEOD - 0.0775 1.4945
CEOT + 0.0904 2.0022**
GDB + 0.6405 1.7595*
INSO + 0.2459 2.2184**
MANO - 0.3313 0.9259
TAUD + -0.0283 -0.2362
FS - -0.0390 -0.7974
GROS - -0.0004 -0.0057
LEV + 0.1029 2.6522***
PROF + 0.2082 3.4757 ***
Adj R2 .583
F-Statistic 10.348***
*,**,*** = statistically significant at less than 0.10, 0.05 and 0.01ACCOMP = Composite measure of Accounting Conservatism of a firm, ACI = Audit Committee
Independence, BA = Board Activity, BI = Board Independence, BS = Board Size, CEOD = CEODuality, CEOT = CEO Turnover, GDB = Gender Diversity on Board , INSO = InstitutionalShareholding , MANO = Managerial Shareholding, TAUD = Type of the Auditor, FS = FirmSize, GROS = Sales Growth, LEV = Leverage, PROF = Profitability
Table 5.101 shows the results of fixed effect regression for ACCOMP with CSFG.
The adjusted R squared is 0.582 meaning that 58.2 percent of the variation in

Annexure 252
dependent variable is because of the considered independent variables. The F-
statistic is also significant meaning that the model is a good fit. The CSFG is
significant with sign that is hypothesized.
Table 5.101: Results of ACCOMP and Composite Score for Firms Governance
Variables Predicted Sign Coefficients t- Statistic
Constant -0.6242 -3.7490***
CSFG + 0.4129 3.2714**
FS - -0.0445 -0.9202
GROS - 0.0079 0.1032
LEV + 0.1018 2.6317**
PROF + 0.2069 3.4656***
Adj R2 .582
F-Statistic 10.648***
*,**,*** = statistically significant at less than 0.10, 0.05 and 0.01ACCOMP = Composite measure of Accounting Conservatism of a firm, CSFG = Composite
Score of Firm Governance, FS = Firm Size, GROS = Sales Growth, LEV = Leverage, PROF= Profitability
ACCOMP, CSFG and DQ (as Moderator)
Table 5.102 shows the results of fixed effect regression for ACCOMP and DQ with
CSFG. The adjusted R squared is 0.628 meaning that 62.8 percent of the variation
in dependent variable is because of the considered independent variables. The F-
statistic is also significant meaning that the model is a good fit. The CSFG is
significant with sign that is hypothesized.
Table 5.103 shows the results of fixed effect regression for ACCOMP and CSFG
with moderating role of DQ. The adjusted R squared is 0.629 meaning that 62.9
percent of the variation in dependent variable is because of the considered inde-
pendent variables. The F-statistic is also significant meaning that the model is a
good fit. The CSFGXDQ is insignificant with sign that is hypothesized.
Discussion of Results of Combined Data Set
Four models are being estimated by combining the data of three countries into a
single set. First of all the impact of CG measures on Composite measure of AC is

Annexure 253
Table 5.102: Results of ACCOMP, CSFG and DQ
Variables Predicted Sign Coefficients t- Statistic
Constant -0.7713 -3.8979***
CSFG + 0.4108 3.2555***
DQ + 0.3528 1.3746
FS - -0.0475 -0.9816
GROS - 0.0073 0.0950
LEV + 0.1020 2.6369***
PROF + 0.2047 3.4288***
Adj R2 0.583
F-Statistic 10.625***
*,**,*** = statistically significant at less than 0.10, 0.05 and 0.01ACCOMP = Composite measure of AC of a firm, CSFG = Composite Score for Firms Gov-
ernance, DQ = Disclosure Quality, FS = Firm Size, GROS = Sales Growth, LEV = Leverage,PROF = Profitability
Table 5.103: Results of ACCOMP, CSFG and CSFGXDQ
Variables Predicted Sign Coefficients t- Statistic
Constant -0.7727 -3.9014***
CSFG + 0.4143 3.2504***
DQ - 0.3897 1.2240
CSFGXDQ - -0.0227 -0.1958
FS - -0.0474 -0.9792
GROS - 0.0062 0.0798
LEV + 0.1024 2.6430***
PROF + 0.2046 3.4259***
Adj R2 0.582
F-Statistic 10.584***
*,**,*** = statistically significant at less than 0.10, 0.05 and 0.01ACCOMP = Composite measure of AC of a firm, CSFG = Composite Score for Firms Gover-
nance, DQ = Disclosure Quality, FS = Firm Size, GROS = Sales Growth, LEV = Leverage,PROF = Profitability
examined. Afterwards the effect of composite score of firm governance’ s impact is
determined on AC. Lastly the moderating role of DQ on the relationship between
CG and AC is examined. The results show that CEOT, GDB and INSTO impact
the level of conservatism emploed by firms in emerging economies of South Asia.
The overall level of CG also impacts AC. However, it is interesting to note that DQ
does not moderate the positive relationship between CG and AC. The results have
actually made the separate results for each country robust. However, because of
differences the results cannot be used to devise implications for various countries.

Annexure 254
APPENDIX VIII
Results of Principal Component Analysis
Table 5.104 shows the results of principal component analysis employed for the
development of a composite measure of AC in case of Bangladesh.
Table 5.105 shows the results of principal component analysis employed for the
development of a composite measure of CSFG in case of Bangladesh.
Table 5.106 shows the results of principal component analysis employed for the
development of a composite measure of AC in case of India.
Table 5.107 shows the results of principal component analysis employed for the
development of a composite measure of CSFG in case of India.
Table 5.108 shows the results of principal component analysis employed for the
development of a composite measure of AC in case of Pakistan.
Table 5.109 shows the results of principal component analysis employed for the
development of a composite measure of CSFG in case of Pakistan.

An
nexu
re255
Table 5.104: Results of Principal Component Analysis for the development of AC for Bangladesh
Eigenvalues
Number Value Difference Proportion CumulativeValue
CumulativeProportion
1.000 1.471 0.432 0.294 1.471 0.294
2.000 1.039 0.036 0.208 2.509 0.502
3.000 1.003 0.211 0.201 3.513 0.703
4.000 0.792 0.097 0.159 4.305 0.861
5.000 0.695 — 0.139 5.000 1.000
Eigenvectors(loadings)
Variable PC 1 PC 2 PC 3 PC 4 PC 5
ACACC 0.566 0.260 -0.016 -0.582 0.522
ACCIC 0.620 -0.024 0.140 -0.098 -0.766
ACCIE 0.535 -0.322 0.006 0.695 0.356
ACSKEW 0.090 0.609 -0.729 0.277 -0.115
ACSOE -0.023 0.676 0.670 0.302 0.044
ACACC = Accruals based first measure of AC,ACCIC = Accruals based second measure of AC, ACCIE = Earnings based measure of AC, ACSKEW =Skewness based measure of AC, ACSOE = Sensitivity of Earnings to Bad News relative to Sensitivity of Earnings to Good News

An
nexu
re256
Table 5.105: Results of Principal Component Analysis for the development of CSFG for Bangladesh
Eigenvalues: (Sum = 5,Average = 1)Number Value Difference Proportion Cumulative
ValueCumulativeProportion
1.000 1.767 0.179 0.177 1.767 0.1772.000 1.588 0.412 0.159 3.355 0.3363.000 1.176 0.157 0.118 4.531 0.4534.000 1.020 0.042 0.102 5.551 0.5555.000 0.978 0.051 0.098 6.529 0.6536.000 0.927 0.078 0.093 7.455 0.7467.000 0.849 0.093 0.085 8.304 0.8308.000 0.756 0.234 0.076 9.060 0.9069.000 0.522 0.104 0.052 9.582 0.95810.000 0.418 — 0.042 10.000 1.000
Eigenvectors (loadings)Variable PC 1 PC 2 PC 3 PC 4 PC 5ACI -0.086 0.318 -0.107 0.062 0.479BA -0.120 0.050 0.373 0.564 0.514BI 0.499 0.381 0.192 -0.015 0.123BS 0.083 -0.175 0.673 0.074 -0.180CEOD -0.316 0.360 -0.221 0.133 0.144CEOT 0.156 -0.112 -0.080 0.732 -0.368GDB 0.154 0.568 0.221 -0.123 -0.333INSTO 0.173 0.230 -0.438 0.319 -0.255MANO -0.394 0.446 0.244 0.007 -0.262TAUD 0.624 0.060 -0.058 -0.051 0.242
ACI = Audit Committee Independence, BA = Board Activity, BI = Board Independence, BS = Board Size, CEOD = CEO Duality, CEOT = CEO Turnover,GDB = Gender Diversity on Board, INSO = Institutional Shareholding, MANO = Managerial Shareholding, TAUD = Type of the Auditor

An
nexu
re257
Table 5.106: Results of Principal Component Analysis for the development of AC for India
Eigenvalues:(Sum = 5,Average = 1)
Number Value Difference Proportion CumulativeValue
CumulativeProportion
1.000 1.221 0.134 0.244 1.221 0.244
2.000 1.087 0.059 0.218 2.309 0.462
3.000 1.028 0.106 0.206 3.337 0.667
4.000 0.922 0.180 0.184 4.258 0.852
5.000 0.742 — 0.148 5.000 1.000
Eigenvectors(loadings)
Variable PC 1 PC 2 PC 3 PC 4 PC 5
ACACC 0.135 0.538 0.647 -0.089 0.329
ACCIC 0.687 -0.225 -0.156 0.692 0.642
ACCIE -0.700 -0.162 0.107 0.704 0.642
ACSKEW 0.134 -0.408 0.733 0.124 -0.255
ACSOE 0.034 0.684 -0.097 0.015 -0.049
ACACC = Accruals based first measure of AC,ACCIC = Accruals based second measure of AC, ACCIE = Earnings based measure of AC, ACSKEW =Skewness based measure of AC, ACSOE = Sensitivity of Earnings to Bad News relative to Sensitivity of Earnings to Good News

An
nexu
re258
Table 5.107: Results of Principal Component Analysis for the development of CSFG for India
Eigenvalues: (Sum = 5,Average = 1)Number Value Difference Proportion Cumulative
ValueCumulativeProportion
1.000 1.854 0.372 0.185 1.854 0.1852.000 1.481 0.314 0.148 3.335 0.3343.000 1.167 0.065 0.117 4.502 0.4504.000 1.101 0.161 0.110 5.603 0.5605.000 0.941 0.039 0.094 6.544 0.6546.000 0.902 0.117 0.090 7.446 0.7457.000 0.785 0.093 0.079 8.231 0.8238.000 0.692 0.046 0.069 8.923 0.8929.000 0.646 0.215 0.065 9.569 0.95710.000 0.431 — 0.043 10.000 1.000
Eigenvectors (loadings)Variable PC 1 PC 2 PC 3 PC 4 PC 5ACI 0.587 0.035 -0.170 0.013 0.098BA 0.186 -0.096 -0.488 -0.139 0.422BI 0.533 -0.090 0.040 0.034 0.006BS -0.211 -0.397 -0.284 0.568 0.072CEOD 0.028 0.511 0.036 -0.119 0.361CEOT 0.443 -0.275 0.371 -0.205 0.753GDB 0.451 0.323 0.180 0.249 -0.017INSTO 0.041 -0.185 0.547 -0.267 -0.240MANO 0.094 0.521 0.164 0.448 0.173TAUD 0.412 0.278 -0.391 -0.517 -0.146
ACI = Audit Committee Independence, BA = Board Activity, BI = Board Independence, BS = Board Size, CEOD = CEO Duality, CEOT = CEO Turnover,GDB = Gender Diversity on Board, INSO = Institutional Shareholding, MANO = Managerial Shareholding, TAUD = Type of the Auditor

An
nexu
re259
Table 5.108: Results of Principal Component Analysis for the development of AC for Pakistan
Eigenvalues:(Sum = 5,Average = 1)
Number Value Difference Proportion CumulativeValue
CumulativeProportion
1.000 2.066 0.974 0.413 2.066 0.413
2.000 1.092 0.134 0.218 3.158 0.632
3.000 0.959 0.077 0.192 4.117 0.823
4.000 0.882 0.881 0.176 4.999 1.000
5.000 0.001 — 0.000 5.000 1.000
Eigenvectors(loadings)
Variable PC 1 PC 2 PC 3 PC 4 PC 5
ACACC 0.685 -0.079 0.146 -0.056 -0.707
ACCIC -0.169 0.270 0.947 0.024 0.000
ACCIE -0.068 -0.724 0.178 0.663 0.000
ACSKEW 0.685 -0.080 0.146 -0.056 0.707
ACSOE 0.169 0.625 -0.167 0.744 0.001
ACACC = Accruals based first measure of AC,ACCIC = Accruals based second measure of AC, ACCIE = Earnings based measure of AC, ACSKEW =Skewness based measure of AC, ACSOE = Sensitivity of Earnings to Bad News relative to Sensitivity of Earnings to Good News

An
nexu
re260
Table 5.109: Results of Principal Component Analysis for the development of CSFG for Pakistan
Eigenvalues: (Sum = 5,Average = 1)Number Value Difference Proportion Cumulative
ValueCumulativeProportion
1.000 1.600 0.265 0.160 1.600 0.1602.000 1.335 0.137 0.134 2.936 0.2943.000 1.199 0.084 0.120 4.134 0.4134.000 1.115 0.118 0.112 5.249 0.5255.000 0.997 0.084 0.100 6.246 0.6256.000 0.913 0.070 0.091 7.160 0.7167.000 0.843 0.046 0.084 8.002 0.8008.000 0.797 0.129 0.080 8.800 0.8809.000 0.668 0.136 0.067 9.468 0.94710.000 0.532 — 0.053 10.000 1.000
Eigenvectors (loadings)Variable PC 1 PC 2 PC 3 PC 4 PC 5ACI 0.055 -0.135 0.509 0.368 0.183BA 0.270 0.275 -0.301 0.291 0.062BI 0.387 0.411 -0.285 0.326 0.085BS 0.456 0.459 -0.019 -0.356 -0.005CEOD -0.534 -0.529 0.010 -0.029 -0.125CEOT -0.010 -0.005 0.058 -0.413 0.870GDB 0.230 0.189 0.608 -0.272 -0.312INSTO 0.161 0.180 0.121 -0.255 -0.130MANO 0.132 0.094 0.416 0.477 0.231TAUD 0.430 0.412 -0.084 -0.097 -0.123
ACI = Audit Committee Independence, BA = Board Activity, BI = Board Independence, BS = Board Size, CEOD = CEO Duality, CEOT = CEO Turnover,GDB = Gender Diversity on Board, INSO = Institutional Shareholding, MANO = Managerial Shareholding, TAUD = Type of the Auditor