U.S. HOUSING MARKET CONDITIONS 4th QUARTER 2010
98
February 2011 U.S. Department of Housing and Urban Development Office of Policy Development and Research SUMMARY Housing data for the fourth quarter of 2010 indicated that the recovery in the housing market continues to remain fragile. In the production sector, single-family housing permits increased and starts remained steady, although completions fell. Multifamily housing permits, starts, and completions all fell, although permits and completions were down only slightly. In the marketing sector, sales of both new and existing homes rose, while median sales prices for new homes remained steady and those for existing homes fell slightly from year-earlier levels. The Standard and Poor’s Case-Shiller ® national seasonally adjusted (SA) repeat-sales house-price index, which is reported with a lag, recorded a 3.4-percent decline in the value of homes in the third quarter of 2010, after having increased 2.6 percent in the second quarter, and a 1.6-percent decline over year-earlier levels. The less volatile Federal Housing Finance Agency’s (FHFA) purchase-only repeat-sales index, also reported on a lagged basis, estimated a 1.6-percent (SA) decrease in home values in the third quarter compared with the second quarter and a 3.2-percent decline from year-earlier levels. Inventories of available homes at the current sales rate decreased in the fourth quarter of 2010, reaching an average rate of 8.0 months’ supply of new homes and 9.4 months’ supply of existing homes, down from rates of 8.5 and 11.7 months’ supply, respectively, in the previous quarter. The national homeownership rate declined in the fourth quarter of 2010, as did the homeownership rate for minorities. According to the Mortgage Bankers Association (MBA), the percentage of delinquencies for mortgage loans fell in the third quarter, while newly initiated foreclosures increased (the data are reported with a 2-month lag). The percentage of newly initiated foreclosures rose for both prime and subprime loans. The advance estimate of overall real growth in the national economy for the fourth quarter was a 3.2-percent increase at a seasonally adjusted annual rate (SAAR), following a 2.6-percent expansion in the third quarter, according to the Bureau of Economic Analysis. Residential invest- ment increased by 3.4 percent in the fourth quarter compared with a decline of 27.3 percent in the third quarter of 2010. 4th Quarter 2010 Contents ................................... 2 2010 Annual Data ................... 5 What Do We Know About Single-Family Rental Properties? ................................ 6 National Data......................... 17 Regional Activity ................... 33 Historical Data ....................... 68 I n s i d e Housing Production Housing production indicators were mixed in the fourth quarter of 2010. The number of single-family housing permits rose and starts remained steady, but comple- tions fell. In the multifamily sector (apartments and condominiums), the number of permits, starts, and completions all fell, although the decline in permits and completions was small. Shipments of manufactured housing dropped in the fourth quarter. ■ Builders took out permits for new housing at a pace of 574,000 (SAAR) units during the fourth quarter, which was 3 percent higher than the previous quarter but 8 percent lower than a year earlier. Single-family building permits were issued for 421,000 (SAAR) housing units, an increase of 4 percent from the third quarter but a decrease of 14 percent from year-earlier levels. Single-family permits have increased in 5 of the last 7 quarters, after having declined for 14 con- secutive quarters, ending the second quarter of 2009. ■ During the fourth quarter, builders started construc- tion on 538,000 new housing units (SAAR), down 8 percent from the third quarter and 5 percent from a year earlier. Single-family housing starts totaled 436,000 (SAAR) housing units, virtually unchanged
-
Upload
khangminh22 -
Category
Documents
-
view
1 -
download
0
Transcript of U.S. HOUSING MARKET CONDITIONS 4th QUARTER 2010

February 2011
U.S. Department of Housing and Urban Development Office of Policy Development and Research
SummaryHousing data for the fourth quarter of 2010 indicated that the recovery in the housing market continues to remain fragile. In the production sector, single-family housing permits increased and starts remained steady, although completions fell. Multifamily housing permits, starts, and completions all fell, although permits and completions were down only slightly. In the marketing sector, sales of both new and existing homes rose, while median sales prices for new homes remained steady and those for existing homes fell slightly from year-earlier levels. The Standard and Poor’s Case-Shiller® national seasonally adjusted (SA) repeat-sales house-price index, which is reported with a lag, recorded a 3.4-percent decline in the value of homes in the third quarter of 2010, after having increased 2.6 percent in the second quarter, and a 1.6-percent decline over year-earlier levels. The less volatile Federal Housing Finance Agency’s (FHFA) purchase-only repeat-sales index, also reported on a lagged basis, estimated a 1.6-percent (SA) decrease in home values in the third quarter compared with the second quarter and a 3.2-percent decline from year-earlier levels. Inventories of available homes at the current sales rate decreased in the fourth quarter of 2010, reaching an average rate of 8.0 months’ supply of new homes and 9.4 months’ supply of existing homes, down from rates of 8.5 and 11.7 months’ supply, respectively, in the previous quarter.
The national homeownership rate declined in the fourth quarter of 2010, as did the homeownership rate for minorities. According to the Mortgage Bankers Association (MBA), the percentage of delinquencies for mortgage loans fell in the third quarter, while newly initiated foreclosures increased (the data are reported with a 2-month lag). The percentage of newly initiated foreclosures rose for both prime and subprime loans. The advance estimate of overall real growth in the national economy for the fourth quarter was a 3.2-percent increase at a seasonally adjusted annual rate (SAAR), following a 2.6-percent expansion in the third quarter, according to the Bureau of Economic Analysis. Residential invest-ment increased by 3.4 percent in the fourth quarter compared with a decline of 27.3 percent in the third quarter of 2010.
4th Quarter 2010
Contents ................................... 2
2010 Annual Data ................... 5
What Do We Know About Single-Family Rental Properties? ................................ 6
Na tion al Data ......................... 17
Regional Activity ................... 33
Historical Data ....................... 68
I n s i d e
Housing ProductionHousing production indicators were mixed in the fourth quarter of 2010. The number of single-family housing permits rose and starts remained steady, but comple-tions fell. In the multifamily sector (apartments and condominiums), the number of permits, starts, and completions all fell, although the decline in permits and completions was small. Shipments of manufactured housing dropped in the fourth quarter.
■ Builders took out permits for new housing at a pace of 574,000 (SAAR) units during the fourth quarter, which was 3 percent higher than the previous quarter but 8 percent lower than a year earlier. Single-family building permits were issued for 421,000 (SAAR) housing units, an increase of 4 percent from the third quarter but a decrease of 14 percent from year-earlier levels. Single-family permits have increased in 5 of the last 7 quarters, after having declined for 14 con-secutive quarters, ending the second quarter of 2009.
■ During the fourth quarter, builders started construc-tion on 538,000 new housing units (SAAR), down 8 percent from the third quarter and 5 percent from a year earlier. Single-family housing starts totaled 436,000 (SAAR) housing units, virtually unchanged
Summary 2
Exhibit 13 Builders’ Views of Housing Market Activity: 1979–Present ........................80 Exhibit 14 Mortgage Interest Rates, Average Commitment Rates, and Points: 1973–Present ........................................81 Exhibit 15 Mortgage Interest Rates, Fees, Effective Rates, and Average Term to Maturity on Conventional Loans Closed: 1982–Present ......................... 82 Exhibit 16 FHA Market Share of 1- to 4-Family Mortgages: 2001–Present .....................83 Exhibit 17 FHA, VA, and PMI 1- to 4-Family Mortgage Insurance Activity: 1971–Present ........................................84 Exhibit 18 FHA Unassisted Multifamily Mortgage Insurance Activity: 1980–Present ........................................85 Exhibit 19 Mortgage De lin quen cies and Foreclosures Started: 1986–Present .....86 Exhibit 20 Value of New Construction Put in Place, Private Residential Buildings: 1974–Present .......................................88 Exhibit 21 Gross Domestic Product and Residential Fixed Investment: 1960–Present ........................................89 Exhibit 22 Net Change in Number of House- holds by Age of Householder: 1971–Present .........................................90 Exhibit 23 Net Change in Number of House- holds by Type of Household: 1971–Present ........................................91 Exhibit 24 Net Change in Number of House- holds by Race and Ethnicity of Householder: 1971–Present ................ 92 Exhibit 25 Total U.S. Housing Stock: 1970–Present ...................................... 93 Exhibit 26 Rental Vacancy Rates: 1979–Present ...........................................94 Exhibit 27 Homeownership Rates by Age of House hold er: 1982–Present ............ 95 Exhibit 28 Homeownership Rates by Region and Metropolitan Status: 1983–Present .....96 Exhibit 29 Homeownership Rates by Race and Ethnicity: 1983–Present .......................97 Exhibit 30 Homeownership Rates by Household Type: 1983–Present ..............................98
ContentsSummary ......................................................1 Housing Production ..................................1 Marketing of Housing ...............................3 Affordability, Homeownership, and
Foreclosures ...........................................4 Multifamily Housing ................................5
2010 Annual Data ........................................5
What Do We Know About Single-Family Rental Properties? .................................. 6Introduction ...............................................6AHS Data––Property and Renter
Characteristics ........................................6Financing and Mortgage Performance .....9Single-Family Mortgage Purchases by
Fannie Mae and Freddie Mac ...............12Distribution of U.S. Rental Structures ..15Conclusion ...............................................16Notes ........................................................16Glossary ...................................................16
National Data .....................................17Housing Production ...................................17 Permits .....................................................17 Starts ........................................................18 Under Construction ................................18 Completions............................................19 Manufactured (Mobile) Home Shipments ............................................19
Marketing of Housing ................................20 Home Sales ..............................................20 Home Prices ............................................21 Repeat Sales Price Index .........................22 Housing Affordability .............................22 Absorption of New Multifamily Units ..23 Manufactured (Mobile) Home Placements ............................................24 Builders’ Views of Housing Market Activity ...................................25
Housing Finance ........................................26 Mortgage Interest Rates ..........................26 FHA Market Share of 1- to 4-Family Mortgages ..............................................27 FHA 1- to 4-Family Mortgage Insurance ..............................................28 PMI and VA Activity ..............................28 Delinquencies and Foreclosures .............29
Housing Investment ..................................30 Residential Fixed Investment and Gross Domestic Product ......................30
Housing Inventory .....................................31 Housing Stock .........................................31 Vacancy Rates ..........................................32 Homeownership Rates ............................32
Regional Activity .............................33Regional Reports........................................34 New England, HUD Region I .................34 New York/New Jersey, HUD Region II...36 Mid-Atlantic, HUD Region III ...............37 Southeast/Caribbean, HUD Region IV ..39 Midwest, HUD Region V .......................41 Southwest, HUD Region VI ...................42 Great Plains, HUD Region VII ...............44 Rocky Mountain, HUD Region VIII ......46
Pacific, HUD Region IX ..........................48 Northwest, HUD Region X ....................49
Housing Market Profiles ...........................52Burlington-South Burlington, Vermont...52Cincinnati-Middletown, Ohio-
Kentucky-Indiana .................................53Dallas-Plano-Irving, Texas ......................54Grand Rapids, Michigan .........................55Honolulu, Hawaii ....................................56Louisville-Jefferson, Kentucky-Indiana ..57Miami-Miami Beach-Kendall, Florida....58Milwaukee-Waukesha-West Allis,
Wisconsin .............................................59Missoula, Montana .................................60New York City, New York .....................61Pittsburgh, Pennsylvania ........................62West Palm Beach-Boca Raton-Boynton
Beach, Florida .......................................64
Units Authorized by Building Permits, Year to Date: HUD Regions and States .................................................66
Units Authorized by Building Permits, Year to Date: 50 Most Active Core Based Statistical Areas (Listed by Total Building Permits) ..........................67
Historical Data ..................................68
Exhibit 1 New Privately Owned Hous ing Units Authorized: 1967–Present .........68 Exhibit 2 New Privately Owned Housing Units Started: 1967–Present ................69 Exhibit 3 New Privately Owned Housing Units Under Construction: 1970–Present .....70 Exhibit 4 New Privately Owned Housing Units Completed: 1970–Present ..........71 Exhibit 5 Manufactured (Mobile) Home Shipments, Residential Placements, Average Prices, and Units for Sale: 1977–Present ........................................72 Exhibit 6 New Single-Family Home Sales: 1970–Present ........................................73 Exhibit 7 Existing Home Sales: 1969–Present ....74 Exhibit 8 New Single-Family Home Prices: 1964–Present ......................................... 75 Exhibit 9 Existing Home Prices: 1969–Present ...76 Exhibit 10 Repeat Sales House Price Index: 1991–Present ...........................................77 Exhibit 11 Housing Affordability Index: 1973–Present ...........................................78 Exhibit 12 Market Ab sorp tion of New Rental Units and Median Asking Rent: 1970–Present ........................................79
For readers incorporating portions of the content from this publication in their own printed or electronic work, please provide full attribution to the U.S. Department of Housing and Urban Development's Office of Policy Development and Research.

3 Summary
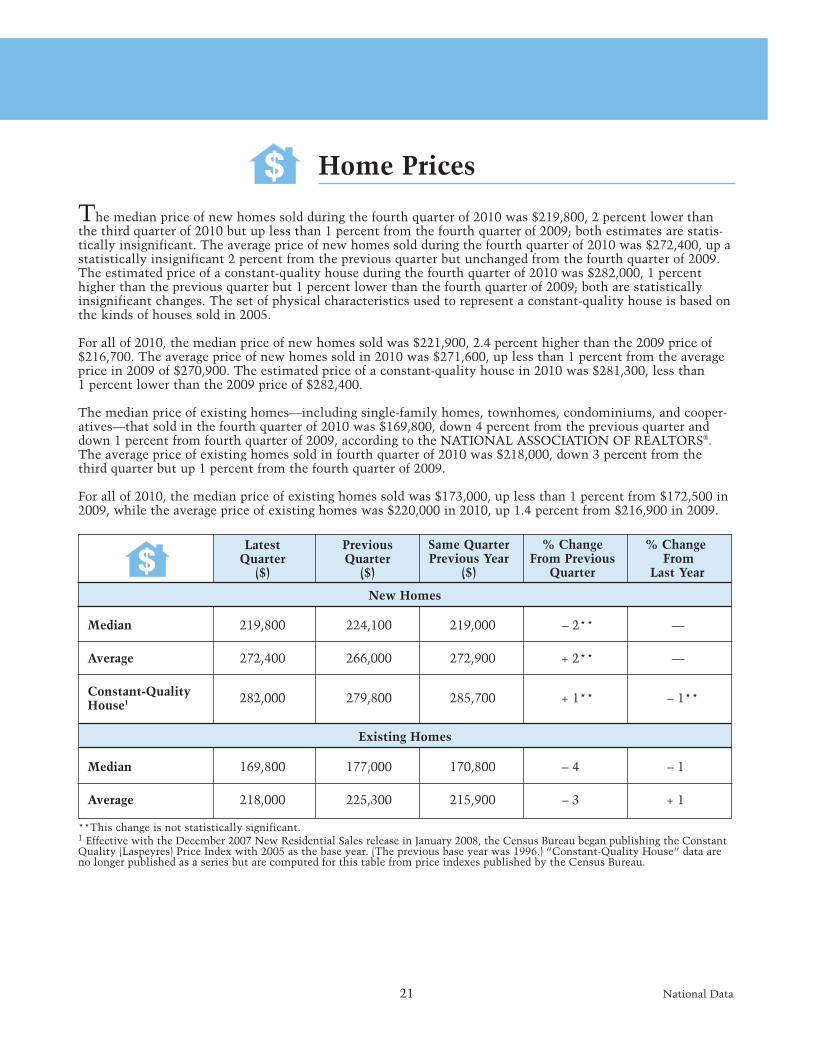
■ The median price of new homes sold in the fourth quarter was $219,800, down 2 percent from the pre vious quarter and virtually the same over the previous four quarters. The average price of new homes sold was $272,400, up 2 percent from the previous quarter and nearly the same as a year ear-lier. A constant-quality house would have sold for $282,000, up 1 percent from the previous quarter but down 1 percent from a year earlier.
■ NAR reported that the median price of existing homes sold was $169,800 in the fourth quarter, down 4 percent from the third quarter and 1 percent from a year earlier. The average price of existing homes sold in the fourth quarter was $218,000, 3 percent lower than the previous quarter but 1 percent higher than the fourth quarter of 2009. According to a NAR practitioner survey, distressed sales (foreclosures and short sales) represented 34 percent of all home sales in the fourth quarter, the same as in the third quarter. Distressed sales prices are typically 15 to 20 percent below normal market prices.
■ S&P/Case-Shiller® and the FHFA both produce repeat-sales house price indices that are reported with a 2-month lag. The Case-Shiller® national index estimated that (SA) home prices in the third quarter of 2010 were down 3.5 percent from the previous quarter and 1.6 percent from a year earlier. The FHFA purchase-only national index estimated that (SA) home prices in the third quarter were down 1.6 percent from the previous quarter and 3.2 percent from a year earlier. The FHFA index is based on sales financed with mortgages that have been sold to or guaranteed by Fannie Mae and Freddie Mac and tends to show less volatility than the S&P Case-Shiller® index. The lower volatility occurs mainly because the FHFA index excludes sales transactions associated with subprime and some “jumbo” loans and because it is transaction weighted instead of value weighted.
■ During the fourth quarter of 2010, the average inventory of new homes for sale was 195,000 units, down 5 percent from the third quarter and 17 percent from a year earlier. That inventory would support 8.0 months of sales at the current sales pace, down 0.5 month from the third quarter but up 0.4 month from a year earlier. The average inventory of existing homes for sale in the fourth quarter was 3.713 million units, down 8 percent from the third quarter but up 7 percent over the four-quarter period. That inventory would support 9.4 months of sales at the current sales pace, down 2.3 months from the third quarter but up 2.4 months from a year earlier. Of concern is the “shadow inventory” of homes as a result of the high rate of delinquencies and foreclosures, which has the potential to increase the supply of homes for sale and further depress home prices.
from the third quarter but down 11 percent from year-earlier levels. Single-family starts have risen or remained steady in 4 of the last 7 quarters, after having fallen for 12 consecutive quarters, ending the second of 2009. Builders completed 583,000 (SAAR) new housing units in the fourth quarter, down 4 percent from the third quarter and 26 percent over the four-quarter period. Single-family home completions totaled 461,000 (SAAR) units, down 4 percent from the previous quarter and 13 percent from a year earlier. Completions have increased in 2 of the last 5 quarters, after having declined for 14 consecutive quarters, ending the fourth quarter of 2009.
■ Manufactured housing shipments totaled 42,000 (SAAR) units in the fourth quarter, down 15 percent from the third quarter and 14 percent over the four-quarter period. Onsite placements of manufactured housing, which are reported with a lag, reached 49,000 units in the third quarter, down 15 percent from the previous quarter but up 3 percent from a year earlier. Manufactured housing shipments have increased in 2 of the last 4 quarters, following a downward trend that began after the hurricane-induced sales-order increases of late 2005.
Marketing of Housing Data on the housing marketing sector improved in the fourth quarter of 2010. The number of both new and existing homes sold rose, while the median sales prices of new homes was unchanged and those of existing homes sold fell slightly from a year ago. The S&P Case-Shiller® and FHFA repeat sales house price indices, which are reported with a lag, estimated that house prices were down in the third quarter from both the second quarter of 2010 and the third quarter of 2009. The average months’ supply of homes for sale in the fourth quarter fell for both new and existing homes. Home builders’ confidence, as measured by the National Association of Home Builders (NAHB)/Wells Fargo Housing Market Index, increased in the fourth quarter.
■ During the fourth quarter of 2010, 296,000 (SAAR) new single-family homes were sold, up 2 percent from the 291,000 (SAAR) homes sold in the third quarter but down 21 percent from a year earlier.
■ The NATIONAL ASSOCIATION OF REALTORS® (NAR) reported that 4.803 million (SAAR) exist-ing homes—including single-family, townhomes, condominiums, and cooperatives—were sold in the fourth quarter, up 15 percent from the previous quarter but down 20 percent from year-earlier lev-els. According to a NAR practitioner survey, sales to first-time homebuyers accounted for 32 percent of all home sales transactions in the fourth quarter, down from 34 percent in the previous quarter.

Summary 4
■ The Federal Housing Administration’s (FHA) share of the mortgage market, which is reported with a 2-month lag, increased only for refinance loans in the third quarter of 2010. Based on loan origination data, the FHA’s dollar volume share of the mortgage market was 16.8 percent, down from 19.0 percent in the second quarter and 18.2 percent a year earlier. For home purchase loans, the FHA’s dollar volume share was 35.3 percent, down from 36.5 percent in the second quarter and 26.0 percent a year earlier. For refinance loans, the FHA’s dollar volume share was 10.4 percent in the third quarter, up 7.3 percent from the previous quarter but down from 12.3 percent a year earlier. Based on the number of loans origi-nated, the FHA’s share of the mortgage market was 19.2 percent in the fourth quarter, down from 22.7 percent in the previous quarter and 21.6 percent a year earlier. For home purchase loans, the FHA’s share of the number of new mortgage loans was 40.9 percent, down from 42.4 percent in the previous quarter but up from 30.3 percent a year earlier. The FHA’s share of the number of new refinance loans was 11.1 percent in the third quarter, up from 8.4 percent in the previ-ous quarter but down from 14.5 percent a year earlier.
■ Home builders’ optimism rose in the fourth quarter of 2010. The NAHB/Wells Fargo composite Hous-ing Market Index was 16, up 3 points from the third quarter but down 1 point from a year earlier. The index for expected future sales increased from 19 to 24 points. The composite index is based on three components—current market activity, future sales expectations, and prospective buyer traffic—and ranges from 0 to 100.
Affordability, Homeownership, and Foreclosures Housing affordability, as measured by the NAR Housing Affordability Index, increased in the fourth quarter of 2010. The NAR composite index estimates that a family earning the median income had 185.0 percent of the income needed to purchase a median-priced, existing single-family home, using standard lending guidelines. That value is up 11.9 percentage points over the previous quarter and 11.3 percentage points over the four-quarter period. The increase in affordability is attributed to a 0.7-percent increase in median family income, a 4-percent decrease in the median sales price of existing single-family homes, and a 16-basis-point decrease in mortgage interest rates.
Estimates from the MBA’s quarterly National Delinquency Survey, which is reported with a 2-month lag, showed that the overall, short-term, and serious delinquency rates for mortgages on 1- to 4-family homes all fell
during the third quarter of 2010. These delinquency rates decreased for prime, subprime, and FHA loans. The percentage of mortgage holders seriously delinquent on their mortgages (90 or more days past due or in the foreclosure process) fell for the third consecutive quarter; the rate had been rising since the third quarter of 2006. The percentage of newly initiated foreclosures (foreclo-sure starts), in contrast, increased for prime, subprime, and FHA loans.
According to the MBA, the (SA) delinquency rate for all mortgage loans in the third quarter of 2010 was 9.13 percent, down from 9.85 percent in the second quarter and 9.64 percent a year earlier. The (SA) delinquency rate for prime mortgages was 6.29 percent in the third quarter, down from 7.10 percent in the second quarter and 6.84 percent a year earlier. The (SA) delinquency rate for subprime mortgage loans was 26.23 percent in the third quarter, down from 27.02 percent in the second quarter and 26.42 percent a year earlier. For FHA loans in the MBA survey, the (SA) delinquency rate was 12.62 percent in the third quarter, down from 13.29 percent in the second quarter and 14.36 percent a year earlier.
Newly initiated foreclosures represented 1.34 percent of all mortgage loans in the third quarter, up from 1.11 percent in the second quarter but down from 1.42 percent a year earlier. The rate of newly initiated foreclosures on prime loans was 1.12 percent in the third quarter, up from 0.91 percent in the second quarter but down from 1.14 percent a year earlier. Foreclosures started on subprime loans rose to 3.31, after having fallen for five consecu-tive quarters. Newly initiated foreclosures on subprime loans were up from 2.83 percent in the second quarter but down from 3.76 percent a year earlier. Not all newly initiated foreclosures end in foreclosure completions. Before the recent slowdown in the processing of fore - closures, approximately 52 percent of newly initiated foreclosures were completed 6 months later, which was the approximate average length of time for processing foreclosures.
The national homeownership rate was 66.5 percent in the fourth quarter of 2010, down from 66.9 percent in the third quarter and 67.2 percent a year earlier. The national homeownership rate has not been this low since 1998. The homeownership rate for minority house - holds decreased to 48.5 percent in the fourth quarter, down from 48.6 percent in the previous quarter and 49.8 percent a year earlier. The decline in homeowner-ship reflects the subprime lending crisis, the high rates of unemployment, and the recent severe recession. Servicer emphasis on home retention actions, including those actions under the Making Home Affordable Program, are helping to keep the number of newly initiated and completed foreclosures down, despite high rates of mortgage delinquency. Foreclosure activity
5 Summary
has also declined recently as lenders review internal procedures related to the foreclosure process. This de - cline is likely to be temporary, however, and loan modi- fication programs cannot help all delinquent borrowers. In this regard, servicers have indicated that completed foreclosures are likely to increase as alternatives for seriously delinquent borrowers are exhausted.
Multifamily HousingPerformance in the multifamily housing sector (five or more units) was mixed in the fourth quarter of 2010. In the production sector, the number of building permits, starts, and completions all fell, although the decline in permits and completions was small. The absorption rate for multifamily apartments increased, while the rental vacancy rate declined. The absorption rate for condominiums and cooperatives also increased in the fourth quarter.
■ During the fourth quarter of 2010, builders took out permits for 131,000 (SAAR) new multifamily units, down 3 percent from the third quarter but up 14 percent from a year earlier.
■ Builders started construction on 90,000 (SAAR) new multifamily units in the fourth quarter, down 35 percent from 140,000 units in the third quarter but up 33 percent from 68,000 units a year earlier. Builders completed 114,000 (SAAR) multifamily units in the fourth quarter, down 1 percent from the previous quarter and 52 percent from year-earlier levels.
■ Market absorption of new multifamily units in-creased for apartments and for condos and co-ops in the fourth quarter of 2010. Of the total number of new apartments completed in the third quarter, 62 percent were leased in the first 3 months after com-pletion, up from 56 percent in the third quarter and 10 percentage points higher than year-earlier levels. Of the total number of new condos and co-ops com-pleted in the third quarter of 2010, 40 percent were sold in the fourth quarter, up 2 percentage points from the third quarter but down 6 percentage points from a year earlier.
■ The multifamily rental vacancy rate reported by the Census Bureau was 10.4 percent in the fourth quarter of 2010, down from 11.8 percent in the third quarter and 12.5 percent a year earlier.
2010 annual DataHousing production indicators improved in 2010. In both the single-family and multifamily sectors, permits and starts increased, although completions declined. Shipments of manufactured homes increased 0.4 percent in 2010, the first increase in annual shipments since 2005. The marketing sector performed less well, with both new and existing home sales declining during the past year. The median price of new homes sold rose during 2010, while remaining steady for existing homes sold. Housing affordability improved during 2010, although homeownership rates for the nation and for most groups declined. The housing sector component of GDP (residential fixed investment) declined in 2010, but by a much slower rate than in 2009.
■ Builders took out permits for 447,100 new single-family homes in 2010, an increase of 3 percent from 2009. Multifamily permits were issued for 131,000 new units in 2010, up 11 percent from 2009.
■ Single-family housing starts totaled 471,000 units in 2010, up 6 percent from 2009, while multifamily housing starts totaled 105,000 units, up 8 percent from the previous year.
■ In 2010, construction was completed on 497,000 new single-family housing units, 4 percent fewer than in 2009. A total of 148,000 new multifamily units were ready for occupancy in 2010, down 43 percent from 2009.
■ Builders sold 321,000 new single-family homes in 2010, down 14 percent from the 375,000 homes they sold in 2009. For all of 2010, the median price of new homes sold was $221,900, up 2.4 percent from 2009.
■ NAR reported that 4.908 million existing single-family homes were sold in 2010, a 5-percent decrease from the 5.165 million sold in 2009. For all of 2010, the median price of existing homes sold was $173,000, nearly the same as in 2009.
■ Builders were just slightly more optimistic in 2010 than they were in 2009. The NAHB/Wells Fargo composite Housing Market Index averaged 16 points in 2010, up 1 point from 2009. The 2009 value was the lowest annual value in the 25-year history of this attitude survey.
■ The average interest rate for 30-year, fixed-rate mort -gages in 2010, as reported by Freddie Mac’s Primary Mortgage Market Survey, was 4.69 percent, 35 basis points below the 2009 annual average rate, which set a record low.

Summary 6
■ According to the NAR Housing Affordability Index, the affordability of housing improved in 2010, increas-ing by 5.2 percentage points from 2009. A family earning the median level of income ($61,583) had 174.6 percent of the income needed to purchase the median-priced existing home ($173,200), while mortgage interest rates declined 25 basis points to 4.89 in 2010. The increase in housing affordability is attributed to falling interest rates and a 0.8-percent increase in median family income, which more than offset a 0.6-percent increase in the median sales price.
■ The FHA guaranteed 1.625 million mortgages in 2010, down 20 percent from 2009. Private insur-ance on mortgages decreased 28 percent in 2010 to 317,037 loans.
■ Based on the Housing Vacancy supplement to the Current Population Survey, the proportion of Ameri-can households that owned their homes in 2010 declined to 66.9 percent from 67.4 percent in 2009. The homeownership rate for White non-Hispanic households was 74.4 percent in 2010, down from 74.8 percent in 2009; the homeownership rate for African-American households was 45.9 percent in 2010, down from 46.6 percent in 2009; and the home ownership rate for Hispanic households was 47.5 percent, down from 48.4 percent in 2009.
■ The rental vacancy rate declined, while the absorp-tion of new apartments rose in 2010. The vacancy rate for multifamily rental units fell to 11.6 percent in 2010, down from 12.3 percent in 2009. The average lease rate for newly completed apartments rented within 3 months of their completion was 55 percent in 2010 compared with 50 percent for all of 2009.
■ The housing component of GDP (residential fixed investment) declined 3.0 percent in 2010 compared with a decline of 22.9 percent in 2009.
What Do We KnoW about Single-Family rental ProPertieS?IntroductionThe 2009 American Housing Survey1 (AHS) identified 130.1 million housing units in the United States, 77 percent (99.7 million) of which were one- to four-unit buildings,2 with the remaining 23 percent being multi-family buildings with five or more units. While most housing discussions focus on homeownership of single-family buildings and rental housing within multifamily buildings, 21 percent (20.6 million) of one- to four-unit buildings provide rental housing. The 2009 AHS found that 27 percent of rental housing units were in single-family-detached structures, 6 percent were located in single-family-attached structures (for example, row-houses sharing one or more common walls on individu-ally owned or leased lots), 20 percent were in two- to four-unit structures (for example, a duplex on a single lot), and 48 percent were located in buildings with five or more units. These figures illustrate that, despite the focus on multifamily rental housing, the U.S. rental housing stock is split nearly down the middle, 52 to 48 percent, between one- to four-unit, single-family, and five or more unit, multifamily, structures . In the wake of the buildup of single-family homes during 2004 through 2006, the housing bust of 2007 through 2010, and the dramatic rise in foreclosures and vacancies in single-family homes, the one- to four-unit share of rental housing is poised to increase further in 2011 and 2012. Given the significant contribution of one- to four-unit structures to the rental housing market, it is important to examine and understand the characteris-tics of single-family rental structures, their residents, their owners, their financing, and their distribution across the United States.
AHS Data—Property and Renter CharacteristicsTable 1 shows the number of bedrooms per unit and the age (year built) of rental buildings with one unit, two to four units, and five or more units in the United States as reported in the 2009 AHS. The top half of Table 1 shows that the largest share of units in multifamily buildings (buildings with five or more units) have one- bedroom while two-bedroom units account for the largest share of units in two- to four-unit buildings, and three-bedroom units account for the largest share of units in one-unit buildings (single-family detached or attached).

7 Summary
Thus, one-unit and two- to four-unit buildings provide more bedrooms and may be better able to accommodate larger families than the average rental unit in a multi-family property. The lower half of Table 1 shows the age distribution of rental buildings. In general, one-unit and two- to four-unit buildings tend to be older, and buildings with five or more units tend to be younger. For example, 19.6 percent of buildings with five or more units were built after 1990 versus 16 and 9.7 percent for one-unit and two- to four-unit buildings, respectively. Similarly, 22.4 percent of buildings with five or more
units were built before 1960 versus 48.1 and 49.2 percent for one-unit and two- to four-unit buildings.
Whereas Table 1 presents rental building character-istics, Tables 2 and 3 present characteristics of rental housing residents. Table 2 shows the age distribution and race and ethnicity of renters; Table 3 shows the relative income and housing costs of rental housing residents. The top half of Table 2 shows that buildings with five or more units have a greater percent share of younger (less than 35) or older (greater than 75) residents,
Table 1. Bedrooms Per Unit and Building Age of U.S. Rental Housing Stock by Structure Type
Structure Type
1 unit (%) 2–4 units (%) 5+ units (%) Total (%)
Sources: American Housing Survey; U.S. Department of Housing and Urban Development
Studio 0.5 1.2 4.2 2.31 bedroom 6.6 26.9 44.5 27.92 bedrooms 31.3 54.6 43.9 41.83 bedrooms 45.5 15.3 6.4 21.74 bedrooms+ 16.1 2.0 0.9 6.4Total 100.0 100.0 100.0 100.0
Pre-1940 23.1 33.7 13.4 20.91940–1959 25.0 15.5 9.0 15.91960–1979 27.9 31.0 39.7 33.81980–1989 8.0 10.1 18.3 13.11990–1999 6.4 5.3 9.3 7.52000–2009 9.6 4.4 10.3 8.8Total 100.0 100.0 100.0 100.0
Building Age by Year Built
Bedrooms per Unit
Table 2. Age and Race/Ethnicity of U.S. Rental Housing Residents
Sources: American Housing Survey; U.S. Department of Housing and Urban Development
Under 25 years 10.7 14.1 17.3 14.325 to 29 13.5 17.1 16.6 15.630 to 34 14.5 12.8 13.6 13.835 to 44 24.9 21.4 16.4 20.545 to 54 18.5 14.9 14.6 16.155 to 64 9.9 10.6 9.2 9.765 to 74 4.6 5.0 4.9 4.875 years and over 3.5 4.2 7.4 5.3Total 100.0 100.0 100.0 100.0
Non-Hispanic White 61.8 55.9 51.6 56.1Non-Hispanic Black 16.8 18.5 19.6 18.4Hispanic (of any race) 16.5 18.9 20.1 18.6Other 5.0 6.7 8.8 7.0Total 100.0 100.0 100.0 100.0
Householder Race/Ethnicity
Householder Age
Structure Type
1 unit (%) 2–4 units (%) 5+ units (%) Total (%)

Summary 8
whereas, one-unit buildings, and to a lesser extent two- to four-unit rental buildings, have a greater percent share of residents from the middle of the age distribution (35 to 54 years old). The split in residents in buildings with five units or more may be due to (1) younger households seeking low-maintenance housing and communities before making the transition into homeownership and (2) older households seeking low-maintenance housing and communities as they make the transition out of single-family homeownership. The lower half of Table 2 shows that a higher percent share of non-Hispanic White renters reside in one-unit rental buildings and that a higher percent share of non-Hispanic Black, Hispanic, and other minority renters reside in rental buildings with two to four units and five or more units. The Home Mortgage Disclosure Act (HMDA) provides data on the race and ethnicity of the owners of one- to four-unit rental properties. In 2009, one- to four-unit rental mortgage originations were divided at 65.6, 2.7, 6.1, and 25.6 percent among the categories of non-His-panic White, non-Hispanic Black, Hispanic, and other. The high share for “other” is due, in part, to corporate or nonprofit purchases and refinances in addition to other minorities. Race and ethnicity origination shares remained relatively constant from 2004 through 2009, with the notable exception of the non-Hispanic Black share, which declined from 6.02 to 2.70 percent, while the other share increased from 18.7 to 25.6 percent.
Table 3 shows rental household income and rental housing costs relative to the Area Median Income
(AMI). The top half of Table 3 shows the percentage of renters by structure size that falls into each relative income category. Note that the table contains only data on renter households (families and unrelated individuals), while AMI estimates are based on all families, including homeowners, but exclude unrelated individuals. The table shows that residents with the lowest income relative to AMI (less than or equal to 30 percent of AMI) are disproportionately in two- to four-unit buildings and, to a lesser extent, in buildings with five or more units. Similarly, residents with the highest income relative to AMI (greater than or equal to 100 percent AMI) disproportionately choose to live in one-unit rental buildings. The lower half of Table 3 shows the percent of AMI that a household would have to earn to be able to afford a particular rental housing unit. Two- to four-unit buildings have the highest inci - dence of affordability in the two most affordable categories (below 30 percent of AMI and 30 to 50 percent of AMI), which probably reflects that two- to four-unit buildings have a greater share of older buildings, as shown in Table 1. The highest share for one-unit buildings and for buildings with five or more units is within the 60- to 80-percent AMI category. The share of rental units requiring income equal to 80 percent of AMI or greater to be affordable is the highest for one-unit buildings and buildings with five or more units, probably because of the fact that these property types have a greater share of newer buildings, and one-unit buildings have a greater share of units with three or more bedrooms, as shown in Table 1.
Table 3. Household Income and Housing Costs Relative to Area Median Income
AMI = Area Median Income.Sources: American Housing Survey; U.S. Department of Housing and Urban Development
Structure Type
1 unit (%) 2–4 units (%) 5+ units (%) Total (%)
< 30% AMI 5.5 5.9 4.8 5.330–50% AMI 25.4 35.5 26.4 28.051–60% AMI 17.9 22.1 23.1 21.161–80% AMI 26.8 24.0 27.2 26.481–100% AMI 12.9 5.7 7.7 9.1101–120% AMI 6.5 3.4 4.3 4.8>120% AMI 5.0 3.5 6.5 5.4Total 100.0 100.0 100.0 100
Rent Affordability (% AMI Required To Afford a Particular Housing Unit)
Percent of Renters by Building Type in Each Income Category
< 30% AMI 17.8 25.1 21.9 21.130–50% AMI 18.4 20.8 21.1 20.151–60% AMI 8.4 8.2 8.7 8.561–80% AMI 14.6 13.7 13.3 13.881–100% AMI 10.4 9.6 9.3 9.8101–120% AMI 9.1 7.8 8.6 8.6>120% AMI 21.4 14.8 17.0 18.1Total 100.0 100.0 100.0 100.0

9 Summary
Financing and Mortgage PerformanceBecause rental properties are purchased solely for invest ment purposes and owner-occupant properties are pur chased for both the provision of shelter and economic returns, it is often hypothesized that pay-ment and default behaviors differ substantially based on occupancy and that mortgages on one- to four-unit rental properties underperform the mortgages of owner-occupants. Figure 1 and Tables 4 and 5 use LPS Applied Analytics Mortgage Performance Data to compare first-lien mortgage performance for rental property investors and owner-occupants over time.3
Figure 1 shows the share of active first-lien mortgages that were noncurrent (30 or more days delinquent or in foreclosure) as of December 31st in each year from 2005 through 2010––broken out by units in structure (one unit versus two to four units) and occupancy status of the property owner (primary residence, second home, or rental property). From 2005 through 2010, default rates were lowest for one-unit second homes and high-est for two- to four-unit primary residences (meaning the owner lives in one of the units), while one-unit rentals, two- to four-unit rentals, and one-unit primary residences were bound by a range in the center, with rental properties showing slightly lower default rates than one-unit primary residence mortgages, with the exception of 2008, when one-unit rental defaults slightly exceeded the default rate for one-unit primary residences.
Table 4 (Table 5) shows mortgage performance for one- unit (two- to four-unit) primary residence and rental properties over the period from 2005 through 2010 by origination year. The left-hand side of the table contains performance for primary residences and the right-hand side contains performance for rental properties. The
first section presents performance for all originations years, with the subsequent six sections containing per-formance for origination years 2005 to 2010; the final section contains performance for mortgages originated before 2005. For each property type, the table shows (1) active loan count, (2) share of loans in foreclosure, and (3) total noncurrent share of loans.
Table 4 shows that the trends for both primary residences and rental properties have moved in tandem; that is, for the all origination year groups, the share of mortgages that are in foreclosure and noncurrent has increased for both primary residences and rental properties over time from 2005 to 2010. The table shows that, across origination years, foreclosure and noncurrent shares of more recent vintages (for example, 2010, 2009, 2008) performed better in the first, second, and third years after origination than vintages at the peak of the hous-ing market in 2006 and 2007. Looking at all origination years, the noncurrent share for mortgages on one-unit rental properties was less than the noncurrent share on one-unit primary residences on December 31st of each year from 2005 through 2010, with the exception of December 2008. The table shows that, for individual origination years, the rental noncurrent share is less than the share for primary residences at all points in time, for all origination years, with the exception of the 2005 origination year in December 2008, at which point the noncurrent share for rental properties exceeded the noncurrent share for primary residences. Conversely, the rental foreclosure share exceeds the primary resi-dence foreclosure share in nearly every case. The fact that the noncurrent share is lower but the foreclosure share is higher for one-unit rental properties compared with one-unit primary residences may indicate a greater willingness by lenders to work with delinquent one-unit, owner-occupant borrowers to avoid foreclosure relative to nonowner-occupant borrowers.
Figure 1. Percent Share Noncurrent by Occupancy and Structure Type
Sources: LPS Applied Analytics Mortgage Performance Data; U.S. Department of Housing and Urban Development
December2005
Primary (1 unit)Primary (2–4 units)
Second Property (1 unit)Second Property (2–4 units)
Rental (1 unit)Rental (2–4 units)
20%18%16%14%12%10%
8%6%4%2%0%
December2006
December2007
December2008
December2009
December2010

Summary 10
Table 4. One-Unit Primary Residence and Rental Mortgage Performance by Origination Year
All origination years2005 18,094,560 .43 4.99 766,362 .47 3.542006 19,178,465 .62 5.52 872,806 .81 4.532007 21,814,454 1.16 7.10 999,095 1.73 6.662008 26,052,739 1.74 9.93 1,292,266 3.52 10.592009 22,611,288 3.13 13.54 1,121,994 5.31 13.472010 25,353,804 3.49 11.84 1,330,817 5.00 11.01
2010 originations2010 3,353,221 .04 .92 142,449 .05 .52
2009 originations2009 3,335,705 .07 1.65 90,002 .08 .792010 3,756,606 .53 3.88 118,615 .42 1.51
2008 originations2008 2,934,941 .24 3.85 154,858 .55 2.882009 1,950,230 1.83 11.17 118,951 2.30 7.132010 1,926,049 3.92 14.59 137,740 3.57 7.91
2007 originations2007 3,124,720 .55 5.11 189,595 .74 4.152008 3,546,363 2.42 13.89 216,917 4.74 13.642009 2,521,625 6.02 24.81 173,104 8.50 19.662010 2,307,898 8.52 24.39 171,846 9.44 18.78
2006 originations2006 3,295,294 .51 5.14 210,251 .62 4.292007 3,437,312 2.73 12.28 207,153 3.32 10.362008 3,421,929 4.72 19.33 212,554 7.23 18.802009 2,529,104 8.76 29.57 170,865 10.94 23.932010 2,229,769 9.89 27.63 165,133 11.02 21.74
2005 originations2005 3,770,140 .19 3.25 221,992 .22 2.962006 3,581,358 .92 6.42 201,950 1.19 4.982007 3,391,028 1.86 9.18 184,174 2.69 8.262008 3,565,558 2.70 12.52 201,117 5.14 13.882009 2,767,412 5.03 18.82 164,937 7.74 17.852010 2,556,039 5.95 18.35 169,895 7.62 16.11
Origination before 20052005 14,324,420 .49 5.45 544,370 .57 3.782006 12,301,813 .57 5.36 460,605 .74 4.442007 11,861,394 .66 5.53 418,173 .98 5.252008 12,583,948 .82 6.94 506,820 1.70 6.892009 9,507,212 1.66 9.40 404,135 2.63 9.312010 9,224,222 2.38 9.71 425,139 3.22 8.83
Origination Year and Date
1 Unit—Primary Residence 1 Unit—Rental
Active Loan Count (#)
Foreclosure Presale (%)
Total Non-current (%)
Active Loan Count (#)
Foreclosure Presale (%)
Total Non-current (%)
Sources: LPS Applied Analytics Mortgage Performance Data; U.S. Department of Housing and Urban Development
Table 5 presents performance metrics for two- to four- unit structures comparable to those shown in Table 4 for one-unit structures. While Table 4 depicts a split in mortgage performance between one-unit primary residences and rentals across origination years (primary residences had lower foreclosures, but rentals had lower delinquencies), the results in Table 5 show that two-
to four-unit rental properties had superior performance across all metrics (foreclosures and noncurrent share), at all points in time, and across all vintages. Looking across all origination years, the average two- to four-unit primary residence foreclosure and noncurrent shares are 54 and 69 percent higher, respectively, than the respective average foreclosure and noncurrent rental

11 Summary
Origination Year and Date
2–4 Unit—Primary Residence 2–4 Unit—Rental
Active Loan Count (#)
Foreclosure Presale (%)
Total Non-current (%)
Active Loan Count (#)
Foreclosure Presale (%)
Total Non-current (%)
building shares. The largest differences occur in the most recent vintages, 2008 through 2010, in which the average difference between primary residences and rental structures is 121 and 180 percent for foreclosures and noncurrent shares, respectively. One possible explanation for this result could be that underwriting
for rental property investors was more conservative and that the pool of two- to four-family primary residence borrowers may have contained a larger share of margin-ally qualified or less financially capable candidates who planned to use rental income to make payments that did not materialize or were less than anticipated.
Table 5. Two- to Four-Unit Primary Residence and Rental Mortgage Performance by Origination Year
All origination years2005 328,091 .69 5.38 197,715 .44 3.212006 359,005 1.24 6.58 226,562 .69 3.452007 404,913 2.52 9.36 253,807 1.36 5.202008 420,401 3.86 14.38 262,055 2.58 9.022009 420,364 6.19 19.89 254,600 4.99 12.302010 499,890 6.84 17.36 276,622 5.39 11.37
2010 originations2010 44,292 .06 1.23 24,750 .03 .48
2009 originations2009 44,438 .30 2.85 13,682 .14 .932010 54,319 1.34 5.64 15,204 .63 1.60
2008 originations2008 45,288 .72 5.99 25,434 .26 2.362009 37,899 5.17 17.96 24,015 2.44 6.842010 42,662 8.58 20.38 24,555 4.16 8.34
2007 originations2007 72,942 1.36 6.83 49,100 .51 3.242008 68,963 4.95 19.09 46,330 2.76 10.652009 59,847 10.03 32.61 42,027 7.12 17.462010 62,012 13.61 31.13 39,587 9.54 19.03
2006 originations2006 83,886 1.12 7.08 55,708 .49 3.532007 85,555 6.06 17.35 53,074 2.62 8.872008 74,890 9.90 28.60 47,207 5.64 17.192009 65,997 14.79 39.63 41,878 10.36 22.622010 63,700 15.63 35.94 38,353 11.06 21.85
2005 originations2005 82,402 .40 4.25 59,063 .19 2.972006 72,691 2.06 8.43 53,607 1.04 4.382007 63,548 3.38 11.63 46,211 2.12 7.172008 58,819 4.73 16.91 42,789 3.92 12.322009 53,778 7.86 24.27 39,057 7.21 16.842010 57,016 9.29 23.69 38,483 8.22 17.23
Origination before 20052005 245,689 .78 5.76 138,652 .55 3.312006 202,428 1.00 5.71 117,247 .63 2.982007 182,868 1.02 5.85 105,422 .78 3.392008 172,441 1.33 7.66 100,295 1.06 4.692009 158,405 2.47 10.62 93,941 2.08 6.552010 175,889 3.46 10.67 95,690 2.73 6.79
Sources: LPS Applied Analytics Mortgage Performance Data; U.S. Department of Housing and Urban Development
Summary 12
Single-Family Mortgage Purchases by Fannie Mae and Freddie MacThroughout the recession and since house prices peaked in the second quarter of 2007 (Federal Housing Finance Agency House Price Index), credit availability has tight-ened and lending has been curtailed by nearly all mort-gage funding sources. Secondary mortgage markets for private-label mortgage backed securities (MBS) saw a 93-percent decline in volume in 2007 and a contraction in private MBS debt outstanding in 2008, 2009, and the first three quarters of 2010. Conversely, mortgage pools backed by the government-sponsored enterprises (GSEs) increased from 2007 through the third quarter of 2010, providing the primary source of liquidity for owner occupants, single-family rental property owners, and multifamily property owners. Tables 6 through 9 compare one- to four-unit owner-occupied and investor lending by Fannie Mae and Freddie Mac in 2008 and 2009, the time period during which private-label MBS issuance contracted by $647.1 billion (Federal Reserve Board, Flow of Funds Accounts) on net.
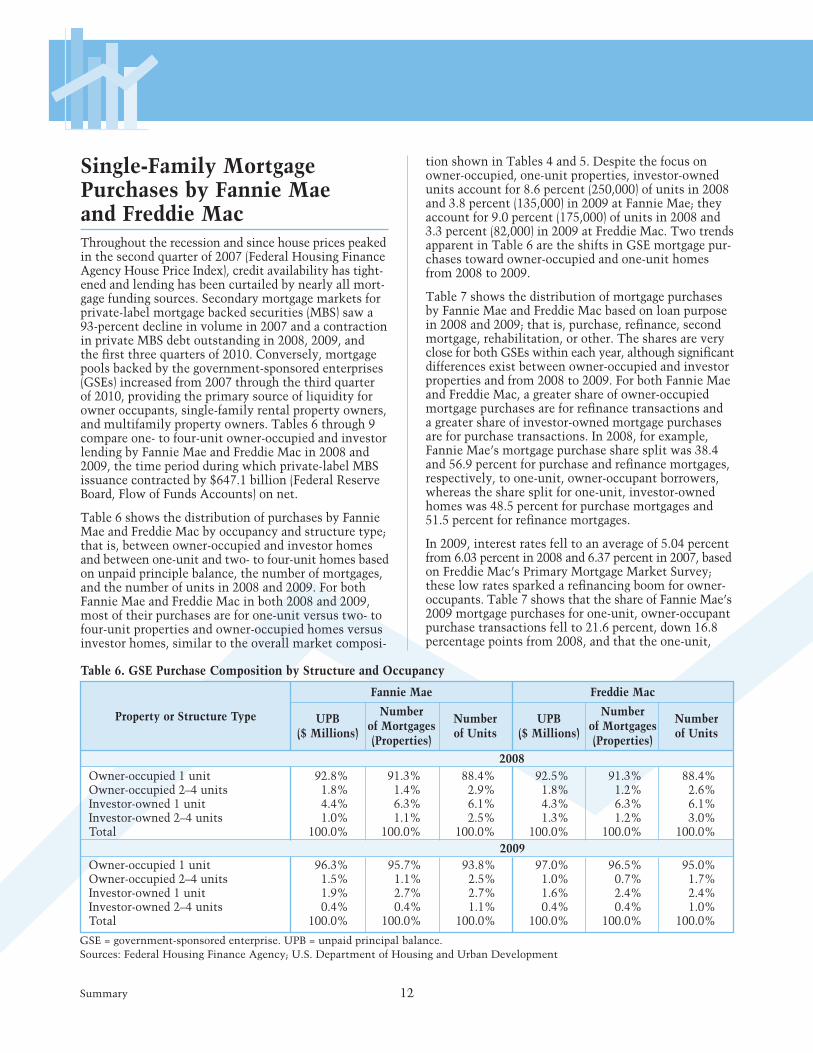
Table 6 shows the distribution of purchases by Fannie Mae and Freddie Mac by occupancy and structure type; that is, between owner-occupied and investor homes and between one-unit and two- to four-unit homes based on unpaid principle balance, the number of mortgages, and the number of units in 2008 and 2009. For both Fannie Mae and Freddie Mac in both 2008 and 2009, most of their purchases are for one-unit versus two- to four-unit properties and owner-occupied homes versus investor homes, similar to the overall market composi-
tion shown in Tables 4 and 5. Despite the focus on owner-occupied, one-unit properties, investor-owned units account for 8.6 percent (250,000) of units in 2008 and 3.8 percent (135,000) in 2009 at Fannie Mae; they account for 9.0 percent (175,000) of units in 2008 and 3.3 percent (82,000) in 2009 at Freddie Mac. Two trends apparent in Table 6 are the shifts in GSE mortgage pur - chases toward owner-occupied and one-unit homes from 2008 to 2009.
Table 7 shows the distribution of mortgage purchases by Fannie Mae and Freddie Mac based on loan purpose in 2008 and 2009; that is, purchase, refinance, second mortgage, rehabilitation, or other. The shares are very close for both GSEs within each year, although significant differences exist between owner-occupied and investor properties and from 2008 to 2009. For both Fannie Mae and Freddie Mac, a greater share of owner-occupied mortgage purchases are for refinance transactions and a greater share of investor-owned mortgage purchases are for purchase transactions. In 2008, for example, Fannie Mae’s mortgage purchase share split was 38.4 and 56.9 percent for purchase and refinance mortgages, respectively, to one-unit, owner-occupant borrowers, whereas the share split for one-unit, investor-owned homes was 48.5 percent for purchase mortgages and 51.5 percent for refinance mortgages.
In 2009, interest rates fell to an average of 5.04 percent from 6.03 percent in 2008 and 6.37 percent in 2007, based on Freddie Mac’s Primary Mortgage Market Survey; these low rates sparked a refinancing boom for owner-occupants. Table 7 shows that the share of Fannie Mae’s 2009 mortgage purchases for one-unit, owner-occupant purchase transactions fell to 21.6 percent, down 16.8 percentage points from 2008, and that the one-unit,
Property or Structure Type
Fannie Mae Freddie Mac
UPB ($ Millions)
Number of Mortgages (Properties)
Number of Units
UPB ($ Millions)
Number of Mortgages (Properties)
Number of Units
Table 6. GSE Purchase Composition by Structure and Occupancy
Owner-occupied 1 unit 92.8% 91.3% 88.4% 92.5% 91.3% 88.4%Owner-occupied 2–4 units 1.8% 1.4% 2.9% 1.8% 1.2% 2.6%Investor-owned 1 unit 4.4% 6.3% 6.1% 4.3% 6.3% 6.1%Investor-owned 2–4 units 1.0% 1.1% 2.5% 1.3% 1.2% 3.0%Total 100.0% 100.0% 100.0% 100.0% 100.0% 100.0%
Owner-occupied 1 unit 96.3% 95.7% 93.8% 97.0% 96.5% 95.0%Owner-occupied 2–4 units 1.5% 1.1% 2.5% 1.0% 0.7% 1.7%Investor-owned 1 unit 1.9% 2.7% 2.7% 1.6% 2.4% 2.4%Investor-owned 2–4 units 0.4% 0.4% 1.1% 0.4% 0.4% 1.0%Total 100.0% 100.0% 100.0% 100.0% 100.0% 100.0%
GSE = government-sponsored enterprise. UPB = unpaid principal balance.Sources: Federal Housing Finance Agency; U.S. Department of Housing and Urban Development
2008
2009

13 Summary
owner-occupant refinance share increased 19.7 percent-age points to 76.6 percent. The lower mortgage rates had less of an effect on the investor market as Fannie Mae’s 2009 purchase and refinance shares for one-unit, investor-owned homes were 47.1 and 52.8 percent, respectively––down 1.4 percentage points and up 1.3 percentage points, respectively, from 2008.
In both 2008 and 2009, GSE purchases of investor pur - chase and refinance mortgages were approximately equal, while GSE purchases of owner-occupant mortgages shifted towards refinances as interest rates declined in 2009. In the presence of the declining purchase share for owner-occupants, the consistency of the investor purchase share likely helped stabilize housing prices, by reducing the glut of unsold properties.
Tables 8 and 9 show the extent to which GSE mortgage purchases supported affordable rental properties and the extension of credit in underserved areas. Table 8 shows that a significant share of Fannie Mae’s and Freddie Mac’s mortgage purchases of one-unit, investor-owned homes and two- to four-unit structures have rents that are affordable4 at or below 80 percent of AMI and that the percent shares remained relatively constant in 2008 and 2009. In 2008, for example, 87.7, 53.6, and 73.7 per - cent of Freddie Mac’s two- to four-unit owner-occupied,
one-unit investor-owned, and two- to four-unit investor-owned purchases, respectively, had rents that were affordable at or below 80 percent of AMI, and, in 2009, the shares were 82.6, 64.7, and 79.6 percent, respectively.
Table 9 shows GSE mortgage purchases in underserved areas by structure and occupancy type. In 2008, one-unit, owner-occupied homes financed by Fannie Mae and Freddie Mac had the lowest percent share in under-served areas, at 31.3 and 31.1 percent, respectively, and two- to four-unit, owner-occupied homes had the highest percent share, 73.8 and 71.5 percent, respectively. From 2008 to 2009, the share of mortgage purchases in under- served areas decreased for all structure and occupancy types, although the rank order (highest percent share to lowest percent share) remained the same across structure and occupancy types, with Fannie Mae (Freddie Mac) underserved area purchases being 67.5 percent (64.6 percent) for two- to four-unit, owner-occupied buildings; 66.3 percent (63.0 percent) for two- to four- unit, investor-owned buildings; 45.9 percent (43.3 percent) for one-unit, investor-owned homes; and 24.6 percent (22.5 percent) for one-unit, owner-occupied homes. Thus, the GSEs’ single-family rental mortgage pur-chase programs disproportionately increased lending in underserved areas compared with their one-unit, owner-occupant mortgage purchases.
Table 7. GSE Purchase Composition by Loan Purpose
Purchase 38.4 29.4 48.5 39.4 39.3 35.6 43.9 38.9Refinance 56.9 63.9 51.5 60.5 60.7 64.4 56.1 61.12nd mortgage 0.0 0.0 0.0 0.0 0.0 0.0 0.0 0.0Rehabilitation 0.0 0.1 0.0 0.1 0.0 0.0 0.0 0.0NA 4.7 6.7 0.0 0.0 0.0 0.0 0.0 0.0Total 100.0 100.0 100.0 100.0 100.0 100.0 100.0 100.0
Purchase 21.6 23.8 47.1 44.4 21.1 24.7 46.5 39.2Refinance 76.6 71.7 52.8 55.3 78.9 75.3 53.5 60.82nd mortgage 0.0 0.0 0.0 0.0 0.0 0.0 0.0 0.0Rehabilitation 0.0 0.1 0.1 0.3 0.0 0.0 0.0 0.0NA 1.8 4.5 0.0 0.0 0.0 0.0 0.0 0.0Total 100.0 100.0 100.0 100.0 100.0 100.0 100 100
Loan Purpose
Fannie Mae Freddie Mac
Property or Structure Type Property or Structure Type
Owner-Occupied
1 Unit
Owner-Occupied 2–4 Units
Investor-Owned 1 Unit
Investor-Owned
2–4 Units
Owner-Occupied
1 Unit
Owner-Occupied 2–4 Units
Investor-Owned 1 Unit
Investor-Owned
2–4 Units (%) (%) (%) (%) (%) (%) (%) (%)
GSE = government-sponsored enterprise. NA = not applicable or unknown.Sources: Federal Housing Finance Agency; U.S. Department of Housing and Urban Development
2008
2009

Summary 14
Table 8. GSE Purchase Composition––Rent Affordability
>100% of area median 0.0 7.6 15.3 7.8 0.0 6.1 14.4 9.281% to 100% of area median 0.0 8.6 16.3 11.5 0.0 5.0 13.2 10.551% to 80% of area median 0.0 17.4 36.0 46.3 0.0 28.1 31.5 40.9≤50% area median 0.0 7.5 18.9 27.7 0.0 59.6 22.1 32.80% or missing data 100.0 58.9 13.6 6.7 100.0 1.2 18.8 6.6Total 100.0 100.0 100.0 100.0 100.0 100.0 100.0 100.0
>100% of area median 0.0 5.5 17.3 8.0 0.0 9.1 14.4 7.781% to 100% of area median 0.0 7.3 17.0 11.8 0.0 7.3 16.1 10.651% to 80% of area median 0.0 16.8 37.1 46.6 0.0 34.5 39.4 44.1≤50% area median 0.0 8.0 17.0 27.5 0.0 48.1 25.3 35.50% or missing data 100.0 62.4 11.6 6.2 100.0 1.0 4.8 2.0Total 100.0 100.0 100.0 100.0 100.0 100.0 100.0 100.0
Rent Affordability*
Fannie Mae Freddie Mac
Property or Structure Type Property or Structure Type
Owner-Occupied
1 Unit
Owner-Occupied 2–4 Units
Investor-Owned 1 Unit
Investor-Owned
2–4 Units
Owner-Occupied
1 Unit
Owner-Occupied 2–4 Units
Investor-Owned 1 Unit
Investor-Owned
2–4 Units (%) (%) (%) (%) (%) (%) (%) (%)
*Rent to median tract income ratio.Sources: Federal Housing Finance Agency; U.S. Department of Housing and Urban Development
2008
2009
Table 9. GSE Purchase Composition in Underserved Areas
Served 68.6 26.1 48.4 31.7 68.8 28.4 47.8 31.8Underserved 31.3 73.8 51.5 68.1 31.1 71.5 52.1 68.1Bad GEOCODE/NA 0.1 0.1 0.1 0.2 0.1 0.1 0.1 0.1Total 100.0 100.0 100.0 100.0 100.0 100.0 100.0 100.0
Served 75.3 32.4 54.0 33.6 77.3 35.2 56.5 36.8Underserved 24.6 67.5 45.9 66.3 22.5 64.6 43.3 63.0Bad GEOCODE/NA 0.1 0.1 0.1 0.1 0.2 0.2 0.2 0.2Total 100.0 100.0 100.0 100.0 100.0 100.0 100.0 100.0
Fannie Mae Freddie Mac
Property or Structure Type Property or Structure Type
Owner-Occupied
1 Unit
Owner-Occupied 2–4 Units
Investor-Owned 1 Unit
Investor-Owned
2–4 Units
Owner-Occupied
1 Unit
Owner-Occupied 2–4 Units
Investor-Owned 1 Unit
Investor-Owned
2–4 Units (%) (%) (%) (%) (%) (%) (%) (%)
NA = not available.Sources: Federal Housing Finance Agency; U.S. Department of Housing and Urban Development
2008
2009

15 Summary
Distribution of U.S. Rental StructuresTables 10 and 11 present data on the geographic distribu-tion of U.S. rental properties. The top half of Table 10 shows that 1-unit rental properties are most heavily concentrated in the suburbs, while all other property types (from 2- to 4-unit buildings up to properties with 50 or more units) are most heavily concentrated in central cities. The lower half of Table 10 shows that, on a regional basis, 1-unit properties are most heavily concentrated in the South and West. Properties with 2 to 4 units are more evenly distributed, with slightly higher concentrations in the Northeast and South. Similar to 1-unit properties, properties of 5 to 49 units are most heavily concentrated in the South and West, while concentrations of properties with 50 or more units align more closely with 2- to 4-unit property concentrations in the Northeast and South.
Table 11 shows the distribution of one-unit rental pro perties relative to one-unit primary residences in the 50 states and the District of Columbia, based on the Lender Processing Services Mortgage Performance Data at the end of 2010. Although California, Florida, and Texas have the greatest number of one-unit rental properties, only Florida (ranked 7th) is within the top-10 list of states by relative one-unit rental share. Table 11 lists states ordered by the ratio of the “percent of one- unit rental properties” to the “percent of one-unit pri mary residences” for each state. This ratio gives an indica-tion of which states have a disproportionate share of one-unit rental properties (ratio is greater than 1) and which states may have a shortage of one-unit rental properties or an envi ronment that does not lend itself to one-unit rentals (ratio is less than 1), relative to primary residences. The five highest one-unit rental to primary residence ratios are in Hawaii, Nevada, the District of Columbia, Arizona, and Idaho. The five lowest ratios are in Connecticut, North Dakota, Iowa, New York, and Massachusetts.
Structure Type
Single Family 2–4 Units 5–19 Units 20–49 Units 50+ Units Total
Table 10. Regional and Urban Distribution of U.S. Rental Structures
Central city 33.7% 48.7% 47.0% 54.8% 67.2% 45.2%Suburb 43.3% 35.3% 44.3% 37.5% 29.8% 40.2%Nonmetro 23.0% 16.0% 8.8% 7.7% 3.0% 14.6%Total units (#) 10,896,007 6,679,178 8,514,613 3,007,953 2,740,682 31,838,432
Midwest 20.4% 23.6% 20.6% 18.6% 19.1% 20.8%Northeast 12.0% 28.1% 15.8% 21.4% 31.4% 19.0%South 40.8% 26.0% 38.1% 31.8% 26.2% 34.8%West 26.8% 22.4% 25.6% 28.2% 23.4% 25.4%Total units (#) 10,896,007 6,679,178 8,514,613 3,007,953 2,740,682 31,838,432
Sources: American Housing Survey; U.S. Department of Housing and Urban Development
City/Suburban Status
Region
Table 11. Relative Distribution of One-Unit Rental Homes
HI 1.8 CA 1.3 ME 1.0 IN 0.9 IL 0.7NV 1.7 DE 1.3 MO 1.0 RI 0.9 NH 0.6DC 1.6 SC 1.2 WY 1.0 KY 0.9 MN 0.6AZ 1.6 WA 1.2 TX 0.9 AR 0.8 NE 0.6ID 1.6 VA 1.1 AL 0.9 LA 0.8 SD 0.6OR 1.5 GA 1.1 MS 0.9 MI 0.8 NJ 0.6FL 1.4 MT 1.1 KS 0.9 PA 0.7 MA 0.6CO 1.4 UT 1.1 OH 0.9 WV 0.7 NY 0.6NM 1.4 OK 1.1 TN 0.9 WI 0.7 IA 0.5NC 1.3 VA 1.0 MD 0.9 AK 0.7 ND 0.5
CT 0.5
1-Unit Rentals and Rental-to-Primary Residence Ratio
State Ratio State Ratio State Ratio State Ratio State Ratio
Sources: LPS Applied Analytics Mortgage Performance Data; U.S. Department of Housing and Urban Development

Summary 16
ConclusionAlthough housing discussions traditionally focus on homeownership in single-family properties and rental housing within multifamily properties, 21 percent of single-family, one- to four-unit buildings are used as rental properties, and 2009 AHS data show that U.S. rental housing is split nearly down the middle, 52 to 48 percent, between one- to four-unit, single-family dwellings and multifamily buildings with five or more units. The characteristics of rental units vary signifi - cantly in terms of size (number of bedrooms), structure type, age, and geography. At the same time, the residents of different kinds of rental housing vary significantly in age, race and ethnicity, and income. Analysis of mortgage data for owner-occupied and rental properties indicates that, with sound underwriting, mortgages on rental properties perform at least as well as owner-occupant mortgages such that reluctance to extend credit to rental property investors because of the perception of elevated risk may be unwarranted. Revisiting lending to rental property investors could assist housing markets in working through the glut of vacant single-family properties and help victims of the foreclosure crisis by providing additional rental housing opportunities.
Notes1 The American Housing Survey is conducted by the Cen-sus Bureau for the U.S. Department of Housing and Urban Development (HUD).
2 Although it is common to think of rental “properties” as meaning one or more buildings under common manage-ment and financing, most federal government surveys actually collect information on individual buildings, not properties; exceptions are the Property Owners and Managers Survey of 1996 and the Residential Finance Surveys of 2001 and earlier. HUD and the Census Bureau are currently developing a Rental Housing Finance Survey that will also attempt to survey properties rather than individual buildings. On the other hand, private-sector financing data is more likely to be for properties than for individual buildings.
3 This comparison may exclude financing for some one- to four-unit structures that are part of properties with five or more units.
4 In Table 8, affordability is defined as the share of rental units that have rents less than or equal to a given share of AMI. For example, in 2009, 17.0 percent of Fannie Mae’s one-unit, investor property mortgage purchases had rents equal to less than 50 percent of AMI.
Glossaryactive loan. Mortgage actively being serviced by a mortgage servicer.
in foreclosure. Mortgage that has been referred to an attorney to begin foreclosure proceedings, but for which the foreclosure sale or auction has not yet happened.
noncurrent. Mortgage that is either 30 or more days delinquent or is in foreclosure.

17 NationalData
Permits*
Housing Production
*Componentsmaynotaddtototalsbecauseofrounding.Unitsinthousands.**Thischangeisnotstatisticallysignificant.Source:CensusBureau,DepartmentofCommerce
Latest Previous Quarter Quarter
Same Quarter % Change % Change Previous From Previous From Year Quarter Last Year
Total 574 559 626 +3** –8
One Unit 421 404 491 +4 –14
Two to Four 23 21 20 +10** +11**
Five Plus 131 135 114 –3** +14
NationalData
Permitsfortheconstructionofnewhousingunitswereupastatisticallyinsignificant3percentinthefourthquarterof2010,ataSAARof574,000unitsbutweredown8percentfromthefourthquarterof2009.Single-familypermits,at421,000units,wereup4percentfromthelevelofthepreviousquarterbutdown14percentfromayearearlier.Multifamilypermits(5ormoreunitsinstructure),at131,000units,wereastatisticallyinsignificant3percentbelowthethirdquarterof2010but14percentabovethefourthquarterof2009.
Builderstookout598,000permitsin2010,anincreaseof5percentover2009.Ofthese,447,000wereforsingle-familystructures,anincreaseof3percent.Thenumberofmultifamilypermitsincreasedby11percent,to131,000units.

NationalData 18
*Componentsmaynotaddtototalsbecauseofrounding.Unitsinthousands.**Thischangeisnotstatisticallysignificant. Sources:CensusBureau,DepartmentofCommerce;OfficeofPolicyDevelopmentandResearch,DepartmentofHousingandUrbanDevelopment
Latest Previous Quarter Quarter
Same Quarter % Change % Change Previous From Previous From Year Quarter Last Year
Latest Previous Quarter Quarter
Under Construction*
Starts*
Constructionstartsofnewhousingunitsinthefourthquarterof2010totaled538,000unitsataSAAR,astatisticallyinsignificant8percentbelowthethirdquarterof2010andastatisticallyinsignificant5percentbelowthefourthquarterof2009.Single-familystarts,at436,000units,wereunchangedfromthepreviousquarterbutwereastatisticallyinsignificant11percentlowerthanthefourthquarterlevelof2009.Multi-familystartstotaled90,000units,astatisticallyinsignificant35percentbelowthepreviousquarterbutastatisticallyinsignificant33percentabovethesamequarterin2009.
In2010,buildersstarted588,000housingunits,anincreaseof6percentover2009.Ofthese,471,000weresingle-familystarts,up6percentfromthepreviousyear.Multifamilystartstotaled105,000units,up8percentover2009.
*Componentsmaynotaddtototalsbecauseofrounding.Unitsinthousands.**Thischangeisnotstatisticallysignificant.Source:CensusBureau,DepartmentofCommerce
Housingunitsunderconstructionattheendofthefourthquarterof2010wereataSAARof428,000units,astatisticallyinsignificant2percentbelowthepreviousquarterand17percentbelowthefourthquarterof2009.Single-familyunitsstoodat261,000,astatisticallyinsignificant3percentbelowthepreviousquarterand12percentbelowthefourthquarterof2009.Multifamilyunitswereat156,000,downastatisticallyinsignificant2percentfromthepreviousquarteranddown24percentfromthefourthquarterof2009.
Atotalof413,000housingunitswereunderconstructionattheendof2010,adecreaseof17percentfromtheendof2009.Ofthese,247,000weresingle-familyunits,down13percentfromthepreviousyear.Multifamilyunitsunderconstructionattheendof2010totaled155,000units,23percentlessthanattheendof2009.
Same Quarter % Change % Change Previous From Previous From Year Quarter Last Year
Total 428 438 514 –2** –17
One Unit 261 269 298 –3** –12
Five Plus 156 159 204 –2** –24
Total 538 588 565 –8** –5**
One Unit 436 435 488 — –11**
Five Plus 90 140 68 –35** +33**

19 NationalData
Shipmentsofnewmanufactured(mobile)homeswereataSAARof42,000unitsinthefourthquarterof2010,whichis15percentbelowthepreviousquarterand14percentbelowtherateofthefourthquarterof2009.
In2010,manufacturersshipped50,000manufactured(mobile)homes.Thisrateis0.4percentabovetherateof2009.Thisisthefirstincreaseinannualshipmentssince2005.
*Unitsinthousands.TheseshipmentsareforHUD-codehomesonlyanddonotincludemanufacturedhousingunitsbuilttomeetlocalbuildingcodes,whichareincludedinhousingstartsfigures.Source:NationalConferenceofStatesonBuildingCodesandStandards
Completions*
Latest Previous Quarter Quarter
Manufacturers’ Shipments
*Componentsmaynotaddtototalsbecauseofrounding.Unitsinthousands.**Thischangeisnotstatisticallysignificant.Sources:CensusBureau,DepartmentofCommerce;OfficeofPolicyDevelopmentandResearch,DepartmentofHousingandUrbanDevelopment
Latest Previous Quarter Quarter
Same Quarter % Change % Change Previous From Previous From Year Quarter Last Year
Same Quarter % Change % Change Previous From Previous From Year Quarter Last Year
Total 583 604 784 –4** –26
One Unit 461 480 529 –4** –13
Five Plus 114 116 238 –1** –52
42.0 49.7 49.0 –15 –14
Housingunitscompletedinthefourthquarterof2010,ataSAARof583,000units,weredownastatisticallyinsignificant4percentfromthepreviousquarteranddown26percentfromthesamequarterof2009.Single-familycompletions,at461,000units,weredownastatisticallyinsignificant4percentfromthepreviousquarteranddown13percentfromtherateofayearearlier.Multifamilycompletions,at114,000units,wereastatisticallyinsignificant1percentbelowthepreviousquarterand52percentbelowthesamequarterof2009.
In2010,654,000housingunitswerecompleted,down18percentfrom2009.Single-familycompletionstotaled497,000units,4percentbelowthepreviousyear.Multifamilycompletionsin2010,at148,000units,weredown43percentfrom2009.
Manufactured (Mobile) Home Shipments*

NationalData 20
Same Quarter % Change % Change Previous From Previous From Year Quarter Last Year
New Homes
Existing Homes
*Unitsinthousands.**Thischangeisnotstatisticallysignificant.Sources:NewHomes—CensusBureau,DepartmentofCommerce;OfficeofPolicyDevelopmentandResearch,DepartmentofHousingandUrbanDevelopment;ExistingHomes—NATIONALASSOCIATIONOFREALTORS®
Latest Previous Quarter Quarter
Home Sales*
Marketing of Housing
Salesofnewsingle-familyhomestotaled296,000(SAAR)unitsinthefourthquarterof2010,upastatisticallyinsignificant2percentfromthepreviousquarterbutdown21percentfromthefourthquarterof2009.Theaver-agemonthlyinventoryofnewhomesforsaleduringthefourthquarterof2010was195,000units,astatisticallyinsignificant5percentbelowthepreviousquarterand17percentbelowthefourthquarteroflastyear.Theaver-agemonths’supplyofunsoldnewhomes,basedonmonthlyinventoriesandsalesratesforthefourthquarterof2010,was8.0months,downastatisticallyinsignificant7percentfromthepreviousquarterbutastatisticallyinsignificant5percentabovethefourthquarterof2009.Forallof2010,321,000newsingle-familyhomesweresold,a14-percentdeclinefromthe2009levelof375,000.
Salesofexistinghomes––includingsingle-familyhomes,townhomes,condominiums,andco-operatives––asreportedbytheNATIONALASSOCIATIONOFREALTORS®,totaled4,803,000(SAAR)inthefourthquarterof2010,up15percentfromthepreviousquarterbutdown20percentfromthefourthquarterof2009.Theaveragemonthlyinventoryofunitsforsaleduringthefourthquarterof2010was3,713,000,down8percentfromthepreviousquarterbutup7percentfromthefourthquarterof2010.Theaveragemonths’supplyofunsoldunitsforthefourthquarterof2010was9.4months,down20percentfromthirdquarterof2010butup34percentfromthefourthquarteroflastyear.Forallof2010,salesofexistinghomesfellto4,908,000,down5percentfromthe2009levelof5,165,000.
New Homes Sold 296 291 373 +2** –21
For Sale 195 206 236 –5** –17
Months’ Supply 8.0 8.5 7.6 –7** +5**
Existing 4,803 4,163 5,970 +15 –20Homes Sold
For Sale 3,713 4,041 3,456 –8 +7
Months’ Supply 9.4 11.7 7.0 –20 +34
21 NationalData
Home Prices
Latest Previous Quarter Quarter ($) ($)
Same Quarter % Change % Change Previous Year From Previous From ($) Quarter Last Year
New Homes
Existing Homes
**Thischangeisnotstatisticallysignificant.1EffectivewiththeDecember2007NewResidentialSalesreleaseinJanuary2008,theCensusBureaubeganpublishingtheConstantQuality(Laspeyres)PriceIndexwith2005asthebaseyear.(Thepreviousbaseyearwas1996.)“Constant-QualityHouse”dataarenolongerpublishedasaseriesbutarecomputedforthistablefrompriceindexespublishedbytheCensusBureau.
Median 219,800 224,100 219,000 –2** —
Average 272,400 266,000 272,900 +2** —
Constant-Quality 282,000 279,800 285,700 +1** –1**House1
Median 169,800 177,000 170,800 –4 –1
Average 218,000 225,300 215,900 –3 +1
Themedianpriceofnewhomessoldduringthefourthquarterof2010was$219,800,2percentlowerthanthethirdquarterof2010butuplessthan1percentfromthefourthquarterof2009;bothestimatesarestatis-ticallyinsignificant.Theaveragepriceofnewhomessoldduringthefourthquarterof2010was$272,400,upastatisticallyinsignificant2percentfromthepreviousquarterbutunchangedfromthefourthquarterof2009.Theestimatedpriceofaconstant-qualityhouseduringthefourthquarterof2010was$282,000,1percenthigherthanthepreviousquarterbut1percentlowerthanthefourthquarterof2009;botharestatisticallyinsignificantchanges.Thesetofphysicalcharacteristicsusedtorepresentaconstant-qualityhouseisbasedonthekindsofhousessoldin2005.
Forallof2010,themedianpriceofnewhomessoldwas$221,900,2.4percenthigherthanthe2009priceof$216,700.Theaveragepriceofnewhomessoldin2010was$271,600,uplessthan1percentfromtheaveragepricein2009of$270,900.Theestimatedpriceofaconstant-qualityhousein2010was$281,300,lessthan1percentlowerthanthe2009priceof$282,400.
Themedianpriceofexistinghomes––includingsingle-familyhomes,townhomes,condominiums,andcooper-atives––thatsoldinthefourthquarterof2010was$169,800,down4percentfromthepreviousquarteranddown1percentfromfourthquarterof2009,accordingtotheNATIONALASSOCIATIONOFREALTORS®.Theaveragepriceofexistinghomessoldinfourthquarterof2010was$218,000,down3percentfromthethirdquarterbutup1percentfromthefourthquarterof2009.
Forallof2010,themedianpriceofexistinghomessoldwas$173,000,uplessthan1percentfrom$172,500in2009,whiletheaveragepriceofexistinghomeswas$220,000in2010,up1.4percentfrom$216,900in2009.

NationalData 22
NA=Dataarenotavailable.Note:Adjustable-ratemortgage(ARM)affordabilityindexeswerenotderivedbecausedataonARMrateswerenotavailable.Source:NATIONALASSOCIATIONOFREALTORS®
Housing Affordability
Housingaffordabilityistheratioofmedianfamilyincometotheincomeneededtopurchasethemedian-pricedhomebasedoncurrentinterestratesandunderwritingstandards,expressedasanindex.TheNATIONALASSOCIATIONOFREALTORS®compositeindexofhousingaffordabilityforthefourthquarterof2010showsthatfamiliesearningthemedianincomehave185percentoftheincomeneededtopurchasethemedian-pricedexistingsingle-familyhome.Thisfigureis7percenthigherthanboththethirdquarterof2010andthefourthquarterof2009.
Theincreaseinthehousingaffordabilityindexinthefourthquarterof2010reflectschangesinthemarketplace.Themedianfamilyincomerose0.7percentfromthepreviousquarterto$62,240.Themediansalespriceofexistingsingle-familyhomesinthefourthquarterof2010decreasedto$170,600,whichwas4percentlowerthanthepreviousquarter.Thenationalaveragehomemortgageinterestrateof4.62inthefourthquarterof2010is16basispointslowerthanthepreviousquarter.Thedeclineinthemortgagerate,thedecreaseinthemediansalesprice,andtheincreaseinthemedianfamilyincomeallcontributedtoanincreaseinhousingaffordability.
Forallof2010,thecompositehousingaffordabilityindexaveraged174.6,a3-percentincreasefrom2009.Thenationalaveragehomemortgageinterestratefor2010was4.89,25basispointsbelowthe2009rate.Themediansalespriceofexistingsingle-familyhomesfor2010was$173,200,0.6percenthigherthanthepreviousyear,andthemedianfamilyincomewas$61,583,0.8percenthigherthanthe2009levelof$61,082.Theincreaseinhousingaffordabilityisattributedtothedeclineinmortgageinterestratesandtheincreaseinmedianfamilyincome,whichmorethanoffsettheincreaseinsalesprices.
Latest Previous Quarter Quarter
Same Quarter % Change From % Change From Previous Year Previous Quarter Last Year
Composite Index 185.0 173.1 173.7 +7 +7Fixed-Rate Index 184.1 172.4 172.8 +7 +7Adjustable-Rate Index NA NA NA — —
Repeat Sales Price IndexTheFederalHousingFinanceAgency’spurchase-onlyHousePriceIndex(FHFAHPI)stoodat190.6onasea-sonallyadjusted(SA)basisinthethirdquarterof2010,1.6percentbelowthepreviousquarterand3.2percentbelowthethirdquarterof2009.ThenationalCase-Shiller®HomePriceIndexwas133.2(SA)inthethirdquarterof2010,down3.5percentfromthepreviousquarteranddown1.6percentfromthethirdquarterof2009.
Current Quarter
Previous Quarter
Same Quarter Previous Year
% Change From Previous Quarter
% Change From Last Year
FHFA HPI1
Case-Shiller® HPI2
190.6 193.7 196.9 –1.6 –3.2
133.2 138.0 135.4 –3.4 –1.61Firstquarter1991equals100.2Firstquarter2000equals100.Sources:FederalHousingFinanceAgency;S&P/Case-Shiller®NationalHomePriceIndex

23 NationalData
Absorption of New Multifamily UnitsInthethirdquarterof2010,16,900new,unsubsidized,unfurnished,multifamily(fiveormoreunitsinstruc-ture)rentalapartmentswerecompleted,down44percentfromthepreviousquarteranddown64percentfromthethirdquarterof2009.Oftheapartmentscompletedinthethirdquarterof2010,62percentwererentedwithin3months.Thisabsorptionrateis6percentagepointshigherthanthepreviousquarterandisup10per-centagepointsfromthethirdquarterof2009.Themedianaskingrentforapartmentscompletedinthethirdquarterof2010was$1,032,adecreaseof12percentfromthepreviousquarterbutastatisticallyinsignificantdecreaseof1percentfromthethirdquarterof2009.
Inthethirdquarterof2010,5,700newcondominiumorcooperativeunitswerecompleted,unchangedfromthepreviousquarterbutdown35percentfromunitscompletedinthethirdquarterof2009.Ofthese,40percentweresoldwithin3months.Thisabsorptionrateinthethirdquarterof2010isastatisticallyinsignificant2per-centagepointshigherthaninthepreviousquarterbut6percentagepointslowerthanthethirdquarterof2009.
Latest Previous Quarter Quarter
Same Quarter % Change % Change Previous From Previous From Year Quarter Last Year
Apartments Completed* 16.9 30.3 47.3 –44 –64
Percent Absorbed Next Quarter 62 56 52 +11 +19
Median Asking Rent $1,032 $1,179 $1,042 –12 –1**
Condos and Co-ops Completed 5.7 5.7 8.8 — –35
Percent Absorbed Next Quarter 40 38 46 +5** –13
*Unitsinthousands. **Thischangeisnotstatisticallysignificant.Note:DataarefromtheSurveyofMarketAbsorption,whichsamplesnonsubsidized,privatelyfinanced,unfurnishedapartmentsinbuildingsoffiveormoreunits.Sources:CensusBureau,DepartmentofCommerce;OfficeofPolicyDevelopmentandResearch,DepartmentofHousingandUrbanDevelopment
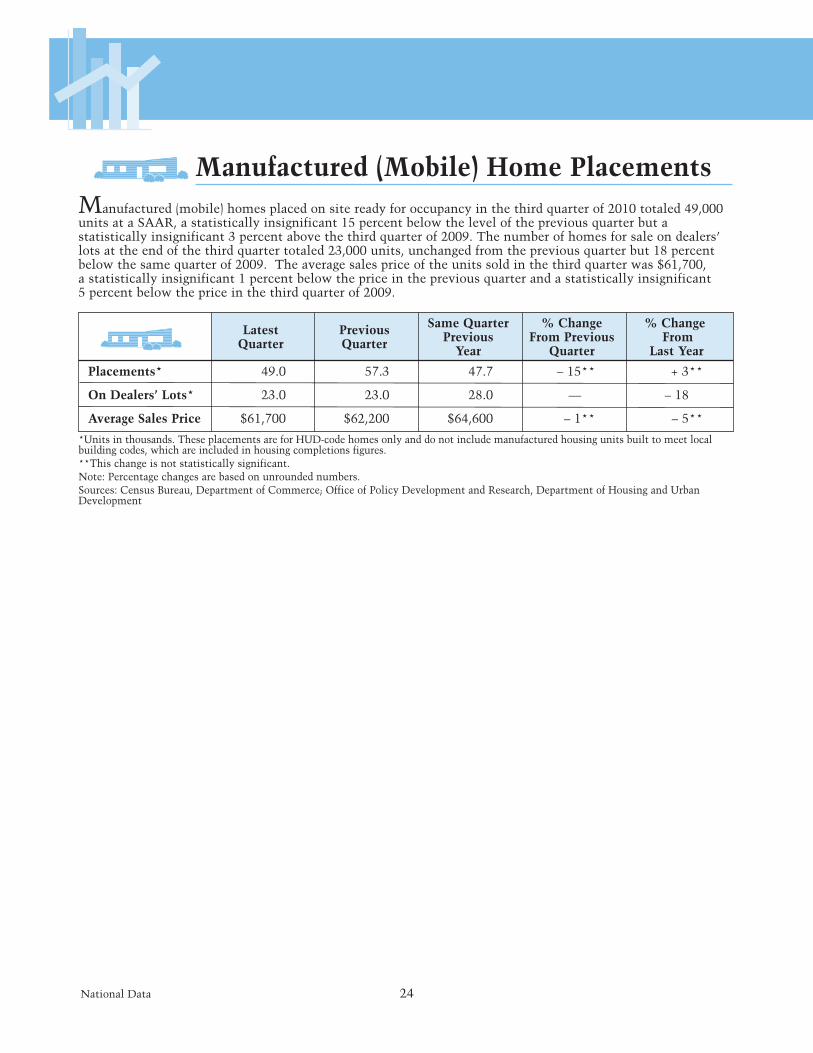
NationalData 24
*Unitsinthousands.TheseplacementsareforHUD-codehomesonlyanddonotincludemanufacturedhousingunitsbuilttomeetlocalbuildingcodes,whichareincludedinhousingcompletionsfigures.**Thischangeisnotstatisticallysignificant.Note:Percentagechangesarebasedonunroundednumbers.Sources:CensusBureau,DepartmentofCommerce;OfficeofPolicyDevelopmentandResearch,DepartmentofHousingandUrbanDevelopment
Manufactured(mobile)homesplacedonsitereadyforoccupancyinthethirdquarterof2010totaled49,000unitsataSAAR,astatisticallyinsignificant15percentbelowthelevelofthepreviousquarterbutastatisticallyinsignificant3percentabovethethirdquarterof2009.Thenumberofhomesforsaleondealers’lotsattheendofthethirdquartertotaled23,000units,unchangedfromthepreviousquarterbut18percentbelowthesamequarterof2009.Theaveragesalespriceoftheunitssoldinthethirdquarterwas$61,700,astatisticallyinsignificant1percentbelowthepriceinthepreviousquarterandastatisticallyinsignificant5percentbelowthepriceinthethirdquarterof2009.
Manufactured (Mobile) Home Placements
Latest Previous Quarter Quarter
Same Quarter % Change % Change Previous From Previous From Year Quarter Last Year
Placements* 49.0 57.3 47.7 –15** +3**
On Dealers’ Lots* 23.0 23.0 28.0 — –18
Average Sales Price $61,700 $62,200 $64,600 –1** –5**

25 NationalData
Builders’ Views of Housing Market Activity
TheNationalAssociationofHomeBuilders(NAHB)/WellsFargoconductsamonthlysurveyfocusingonbuilders’viewsofthelevelofsalesactivityandtheirexpectationsforthenearfuture.NAHBusesthesesurveyresponsestoconstructindicesofhousingmarketactivity.(Theindexvaluesrangefrom0to100.)Forthefourthquarterof2010,thecurrentmarketactivityindexforsingle-familydetachedhousesstoodat16,up2pointsfromthepreviousquarterbutdown1pointfromthefourthquarterof2009.Theindexforexpectedfuturesalesexpectationsstoodat24,up5pointsfromthethirdquarterof2010butdown3pointsfromthefourthquarteroflastyear.Prospectivebuyertraffichadanindexvalueof11,whichisup1pointfromthepreviousquarterbutdown2pointsfromthefourthquarteroflastyear.NAHBcombinestheseseparateindicesintoasinglehousingmarketindexthatmirrorsthethreecomponentsquiteclosely.Forthefourthquarterof2010,thisindexincreasedto16,up3pointsfromthethirdquarterof2010butdown1pointfromthefourthquarteroflastyear.
Forallof2010,thecurrentsalesindexaveraged16,up2pointsfrom2009.Theaveragefuturesalesexpecta-tionsindexwas23,1pointlowerthanforthepreviousyear.Theprospectivesalesindexaveraged12,down1pointfrom2009.Thecompositeindexfor2010was16,anincreaseof1pointfromthepreviousyear.
Source:BuildersEconomicCouncilSurvey,NationalAssociationofHomeBuilders
Latest Previous Quarter Quarter
Same Quarter % Change % Change Previous From Previous From Year Quarter Last Year
Prospective BuyerTraffic
Housing Market 16 13 17 +23 –6Index
Current Sales Activity— 16 14 17 +15 –6Single-Family Detached
Future Sales Expectations— 24 19 27 +26 –11Single-Family Detached
11 10 13 +10 –15

NationalData 26
Same Quarter % Change % Change Previous From Previous From Year Quarter Last Year
Housing Finance
Mortgage Interest Rates
Source:FreddieMac
Latest Previous Quarter Quarter
Conventional,Fixed-Rate, 4.41 4.45 4.92 –1 –1030-Year
Conventional ARMs 3.31 3.57 4.42 –7 –25
Conventional,Fixed-Rate, 3.80 3.92 4.37 –3 –1315-Year
Thecontractmortgageinterestratefor30-year,fixed-rate,conventionalmortgagesreportedbyFreddieMacdecreasedto4.41percentinthefourthquarterof2010,4basispointsbelowthepreviousquarterand51basispointslowerthanthefourthquarterof2009.Adjustable-ratemortgages(ARMs)inthefourthquarterof2010weregoingfor3.31percent,26basispointslowerthanthepreviousquarterand111basispointsbelowthefourthquarterof2009.Fixed-rate15-yearmortgages,at3.80percent,weredown12basispointsfromthepreviousquarteranddown57basispointsfromthefourthquarterof2009.
The2010averageannualratefor30-year,fixed-rate,conventionalmortgageswas4.69percent,down35basispointsfromthe2009annualrate.

27 NationalData
TheFederalHousingAdministration’s(FHA’s)dollarvolumeshareofthe1-to4-familymortgagemarketwas16.8percentinthethirdquarterof2010,down4.5percentagepointsfromthesecondquarter2010anddown1.4percentagepointsfromthethirdquarterof2009.Forhomepurchaseloans,FHA’sdollarvolumesharewas35.3percentinthethirdquarterof2010,down5.7percentagepointsfromthesecondquarterof2010butup9.3percentagepointsfromthethirdquarterof2009.Formortgagerefinanceloans,FHA’sdollarvolumesharewas10.4percentinthethirdquarterof2010,up2.2percentagepointsfromthesecondquarterof2010butdown1.9percentagepointsfromthethirdquarterof2009.
FHA’sshareofthe1-to4-familymortgagemarketbyloancountwas19.2percentinthethirdquarterof2010,down6.2percentagepointsfromthesecondquarterof2010anddown2.4percentagepointsfromthethirdquarterof2009.Forhomepurchaseloans,FHA’smarketsharebyloancountwas40.9percentinthethirdquarterof2010,down6.2percentagepointsfromthesecondquarterof2010butup10.6percentagepointsfromthethirdquarterof2009.Formortgagerefinanceloans,FHA’smarketsharebyloancountwas11.1percentinthethirdquarterof2010,up1.7percentagepointsfromthesecondquarterof2010butdown3.3percentagepointsfromthethirdquarterof2009.
FHA Market Share of 1- to 4-Family Mortgages*
Latest Previous Quarter Quarter
*Thisanalysisincludesfirst-lienmortgagesoriginatedineachtimeperiod.TheamountsrepresentedherearebasedondateofloanoriginationandthuswillvaryfromwhatareshowninreportsthatsummarizeFHAinsuranceactivitybyinsuranceendorsementdate.Sources:U.S.DepartmentofHousingandUrbanDevelopment;datafromFHA,MortgageBankersAssociation“MBAMortgageFinanceForecast”report;andLoanPerformanceTrueStandingsServicingdatasystem
Same Quarter % Change % Change Previous From Previous From Year Quarter Last Year
Mortgage Market Share by Dollar Volume (%)
All Loans 16.8 21.3 18.2 –21 –8
Purchase 35.3 40.9 26.0 –14 36
Refinance 10.4 8.2 12.3 27 –16
Mortgage Market Share by Loan Count (%)
All Loans 19.2 25.4 21.6 –24 –11
Purchase 40.9 47.0 30.3 –13 35
Refinance 11.1 9.5 14.5 18 –23

NationalData 28
PMI and VA Activity*
*Unitsinthousandsofproperties.PMI=Privatemortgageinsurance.Sources:PMI—MortgageInsuranceCompaniesofAmerica;VA—DepartmentofVeteransAffairs
Total PMI Certificates 96.9 91.0 66.2 +6 +46
Total VAGuaranties 95.0 88.1 81.1 +8 +17
Privatemortgageinsurersissued96,900policiesorcertificatesofinsuranceonconventionalmortgageloansduringthefourthquarterof2010,up6percentfromthethirdquarterof2010and46percenthigherthanthefourthquarterof2009.TheDepartmentofVeteransAffairs(VA)reportedtheissuanceofmortgageloanguarantieson95,000single-familypropertiesinthefourthquarterof2010,up8percentfromthepreviousquarterandup17percentfromthefourthquarterof2009.Thesenumbersarenotseasonallyadjusted.
In2010,privateinsurersissued317,037certificatesofinsurance,adecreaseof28percentfrom2009.TotalVAmortgageloanguarantiesdecreased8percentto327,836from2009to2010.
LatestQuarter
PreviousQuarter
Same Quarter Previous
Year
% ChangeFrom Previous
Quarter
% ChangeFrom
Last Year
FHA 1- to 4-Family Mortgage Insurance*
*Unitsinthousandsofproperties.Source:OfficeofHousing,DepartmentofHousingandUrbanDevelopment
Latest Previous Quarter Quarter
Same Quarter % Change % Change Previous From Previous From Year Quarter Last Year
Applications Received 429.1 629.9 601.1 –32 –29
Total Endorsements 390.1 409.9 512.6 –5 –24
Purchase Endorsements 196.8 269.1 305.0 –27 –35
Refinancing Endorsements 193.2 140.8 207.6 +37 –7
ApplicationsforFHAmortgageinsuranceon1-to4-familyhomeswerereceivedfor429,100propertiesinthefourthquarterof2010,adecreaseof32percentfromthethirdquarterof2010and29percentbelowthefourthquarterof2009.Totalendorsementsorinsurancepoliciesissuedtotaled390,100,down5percentfromthepre-viousquarteranddown24percentfromthefourthquarterof2009.Purchaseendorsements,at196,800,weredown27percentfromthethirdquarterof2010anddown35percentfromthefourthquarterof2009.Endorse-mentsforrefinancingincreasedto193,200,up37percentfromthethirdquarterof2010butdown7percentfromthefourthquarterof2009.Thesenumbersarenotseasonallyadjusted.
ThetotalnumberofFHAapplicationsreceivedin2010was2,162,700,a24-percentdecreasefrom2009.Totalendorsementswere1,624,800,adecreaseof20percentfromlastyear.Purchaseendorsements,at1,002,000,decreased4percentfrom2009,andthe622,900refinancingendorsementswere37percentbelowthepreviousyear.

29 NationalData
Same Quarter % Change % Change Previous From Previous From Year Quarter Last Year
Latest Previous Quarter Quarter
Delinquencies and Foreclosures
Totaldelinquenciesforallloanspastduewereat9.13percentinthethirdquarterof2010,down7percentfromthesecondquarterof2010anddown5percentfromthethirdquarterof2009.Delinquenciesforpastdueconventionalsubprimeloanswereat26.23percent,down3percentfromthesecondquarterof2010anddown1percentfromthethirdquarterofthepreviousyear.Conventionalsubprimeadjustableratemortgage(ARM)loansthatwerepastduestoodat29.8percentinthethirdquarterof2010,up1percentfromthesecondquarterof2010andup6percentfromthethirdquarterof2009.
Inthethirdquarterof2010,90-daydelinquenciesforallloanswereat4.34percent,down10percentfromthesecondquarterof2010anddown2percentfromthethirdquarterayearago.Conventionalsubprimeloansthatwere90dayspastduestoodat14.17percentinthethirdquarterof2010,down4percentfromthepreviousquarterbutup3percentfromthethirdquarterof2009.ConventionalsubprimeARMloansthatwere90dayspastduewereat19.1percentinthethirdquarterof2010,up4percentfromsecondquarterof2010andup15percentfromthethirdquarterof2009.
Duringthethirdquarterof2010,1.34percentofallloansenteredforeclosure,up21percentfromthesecondquarterof2010butdown6percentfromthethirdquarterofthepreviousyear.Intheconventionalsubprimecategory,3.31percentofloansenteredforeclosureinthethirdquarterof2010,anincreaseof17percentfromthesecondquarterof2010butadecreaseof12percentfromthethirdquarterof2009.IntheconventionalsubprimeARMscategory,4.09percentofloanswentintoforeclosureinthethirdquarterof2010,anincreaseof21percentfromthesecondquarterof2010butadecreaseof17percentfromthethirdquarterof2009.
Source:NationalDelinquencySurvey,MortgageBankersAssociation
Total Past Due (%)
All Loans 9.13 9.85 9.64 –7 –5
Conventional Subprime Loans 26.23 27.02 26.42 –3 –1
Conventional Subprime ARMs 29.8 29.5 28.23 +1 +6
90 DaysPast Due (%)
All Loans 4.34 4.82 4.41 –10 –2
Conventional Subprime Loans 14.17 14.7 13.70 –4 +3
Conventional Subprime ARMs 19.1 18.29 16.60 +4 +15
Foreclosures Started (%)
All Loans 1.34 1.11 1.42 +21 –6
Conventional Subprime Loans 3.31 2.83 3.76 +17 –12
Conventional Subprime ARMs 4.09 3.39 4.92 +21 –17

NationalData 30
Housing Investment
Residential Fixed Investment and Gross Domestic Product*
ResidentialFixedInvestment(RFI)forthefourthquarterof2010wasataSAARof$334.3billion,1percentabovethevaluefromthethirdquarterof2010but5percentbelowthefourthquarterof2009.AsapercentageoftheGrossDomesticProduct(GDP),RFIforthefourthquarterof2010was2.2percent,unchangedfromthepreviousquarterbut0.3percentagepointbelowthesamequarterayearago.
In2010,RFIwas$340.4billion,3percentlowerthanin2009.The2010RFIwas2.3percentofGDP,adecreaseof0.2percentagepointfromthepreviousyear.
*Billionsofdollars.Source:BureauofEconomicAnalysis,DepartmentofCommerce
Latest Previous Quarter Quarter
Same Quarter % Change % Change Previous From Previous From Year Quarter Last Year
GDP 14,870.4 14,745.1 14,277.3 +1 +4
RFI 334.3 329.8 351.0 +1 –5
RFI/GDP (%) 2.2 2.2 2.5 — –12

31 NationalData
Housing Inventory
*Componentsmaynotaddtototalsbecauseofrounding.Unitsinthousands.**Thischangeisnotstatisticallysignificant.Source:CensusBureau,DepartmentofCommerce
Attheendofthefourthquarterof2010theestimateofthetotalhousingstock,130,845,000units,wasupastatisticallyinsignificant0.1percentfromthethirdquarterof2010andupastatisticallyinsignificant0.5percentfromthefourthquarterof2009.Thenumberofalloccupiedunitsincreasedbyastatisticallyinsignificant0.5percentfromthethirdquarterof2010andincreasedastatisticallyinsignificant1.0percentfromthefourthquarterayearago.Thenumberofowner-occupiedunitsdecreasedbyastatisticallyinsignificant0.1percentfromthethirdquarterof2010butisessentiallyunchangedfromthefourthquarterayearago.Inthefourthquarterof2010,renter-occupiedunitsincreasedastatisticallyinsignificant1.7percentfromthepreviousquarterandincreasedastatisticallyinsignificant3.0percentfromthefourthquarterof2009.Vacantunitsinthefourthquarterof2010weredown2.0percentfromlastquarteranddecreased2.3percentfromthefourthquarterof2009.
Latest Previous Quarter Quarter
Same Quarter % Change % Change Previous From Previous From Year Quarter Last Year
All Housing Units 130,845 130,681 130,189 +0.1** +0.5**
Occupied Units 112,451 111,914 111,370 +0.5** +1.0**
Owner Occupied 74,782 74,874 74,812 –0.1** ––
Renter Occupied 37,669 37,040 36,558 +1.7** +3.0**
Vacant Units 18,394 18,767 18,821 –2.0 –2.3
Housing Stock*

NationalData 32
Thehomeownervacancyrateforthefourthquarterof2010,at2.7percent,was0.2percentagepointhigherthanthethirdquarterof2010butessentiallyunchangedfromthefourthquarterof2009.The2010fourthquarternationalrentalvacancyrate,at9.4percent,was0.9percentagepointlowerthanthepreviousquarterand1.3percentagepointslowerthanthefourthquarterof2009.
Thehomeownervacancyratefor2010was2.6percent,essentiallyunchangedfrom2009.Theannualrentalvacancyratefor2010was10.2percent,astatisticallyinsignificant0.4percentagepointlowerthanin2009.
**Thischangeisnotstatisticallysignificant.Source:CensusBureau,DepartmentofCommerce
Source:CensusBureau,DepartmentofCommerce
Latest Previous Quarter Quarter
Same Quarter % Change % Change Previous From Previous From Year Quarter Last Year
Latest Previous Quarter Quarter
Same Quarter % Change % Change Previous From Previous From Year Quarter Last Year
All 66.5 66.9 67.2 –0.6 –1.0Households
Minority 48.5 48.6 49.8 –0.2** –2.6Households
Young Married-Couple 57.9 58.6 60.4 –1.2** –4.1Households
Vacancy Rates
Homeownership Rates
HomeownerRate
Rental Rate
2.7 2.5 2.7 +8 ––
9.4 10.3 10.7 –9 –12
Thenationalhomeownershiprateforallhouseholdswas66.5percentinthefourthquarterof2010,down0.4percentagepointfromthepreviousquarteranddown0.7percentagepointfromthefourthquarterof2009.Thehomeownershiprateforminorityhouseholds,at48.5percent,decreasedastatisticallyinsignifi-cant0.1percentagepointfromthethirdquarterof2010andwasdown1.3percentagepointsfromthefourthquarterof2009.Thehomeownershiprateinthefourthquarterof2010foryoungmarried-couplehouseholdswas57.9percent,downastatisticallyinsignificant0.7percentagepointfromthepreviousquarteranddown2.5percentagepointsfromthefourthquarterof2009.
Theannualnationalhomeownershipratewas66.9percentin2010,down0.5percentagepointfrom2009.Theannualhomeownershiprateforminorityhouseholdswas48.9percent,down0.8percentagepointfromthepreviousyear.Theannualhomeownershiprateforyoungmarried-couplehouseholds,at58.3percent,wasdown1.5percentagepointsfrom2009.

Regional Activity33
Regional Ac tiv i ty
T he following summaries of housing mar ket con di tions and activities have been prepared by economists in the U.S. De part ment of Hous ing and Ur ban De vel op ment’s (HUD’s) field of fic es. The re ports pro vide over views of eco nom ic and hous ing mar ket trends within each region of HUD management. Also in cluded are profiles of selected local housing mar ket areas that pro vide a per spec tive of cur rent eco nom ic con di tions and their im pact on the housing mar ket. The reports and profiles are based on in for ma tion ob tained by HUD econ o mists from state and lo cal gov ern ments, from hous ing industry sourc es, and from their ongoing in ves ti ga tions of housing mar ket conditions car ried out in support of HUD’s programs.

Regional Activity 34
Regional Reports
The economic decline, which began in the third quarter of 2008, slowed in the New England region during 2010, with nonfarm payrolls averaging 6.8 million jobs, down only 17,000, or 0.3 percent, compared with the loss of 266,500 jobs, or 3.8 percent, during 2009. Job losses dur-ing the past 3 years exceeded by nearly 50 percent the 192,400 jobs added in the region between 2004 and 2007. During 2010, the service-providing sectors of education and health services and leisure and hospitality posted the most significant job gains, with increases of 23,600 and 9,400 jobs, or 1.8 and 1.5 percent, respectively. As of 2010, education and health services employment repre-sents more than 20 percent of the nonfarm payroll jobs in the region, up from 15 percent in 2000. In 2010, the manufacturing and construction sectors accounted for the loss of 13,900 and 13,000 jobs, or 5.3 and 2.2 percent, respectively. Major losses in service-providing sectors were recorded in the financial activities and retail and wholesale trade sectors, which lost 10,500 and 9,900 jobs, or 2.3 and 2.4 percent, respectively, compared with the number of jobs recorded during 2009.
Nonfarm payroll gains were reported only in New Hamp-shire and Massachusetts during 2010. New Hampshire added 7,500 jobs, or 1.2 percent, including increases of 2,000 jobs, or 3.1 percent, in the professional business services sector and 2,000 jobs, or 3.3 percent, in the leisure and hospitality sector. The level of nonfarm payrolls in Massachusetts in 2010 remained virtually unchanged with a gain of only 1,300 jobs, to 3.2 million jobs. Job gains in the education and health services and the professional and business services sectors of 14,300 jobs, or 2.2 percent, and 3,400 jobs, or 0.7 percent, re-spectively, were partially offset by losses of 5,400 jobs, or 2.1 percent, and 5,300 jobs, or 4.8 percent, in the manufacturing and construction sectors, respectively. Connecticut lost 11,500 jobs, which was a 0.7-percent decline, including 4,700 manufacturing jobs, 3,900 con- struction jobs, and 3,700 financial activities jobs, decreases of 2.7, 7.1, and 2.7 percent, respectively. Rhode Island’s loss of 7,800 jobs, or 1.7 percent, was a significant improve- ment compared with the 22,900 jobs, or 4.8 percent, lost in 2009. In 2010, Maine and Vermont had small losses of 0.7 percent each, down 4,500 and 1,900 jobs, respectively.
During 2010, the unemployment rate in the New England region averaged 8.6 percent, up from 8.3 percent in 2009, but it was below the national average of 9.6 percent. Average unemployment rates for the states in the region ranged from 6.1 percent in New Hampshire and Vermont to 11.9 percent in Rhode Island.
Despite moderating employment declines and contin-ued lower interest rates during the second half of 2010, expiration of the homebuyer tax credit programs led to reduced home sales totals in all states compared with the number of homes sold during 2009. According to the Massachusetts Association of REALTORS® (MAR), during 2010, existing home sales were down 1 percent from the 35,570 sales in 2009. In 2010, the median sales price was up 4 percent, to $302,500, from $290,000 in 2009, but was down 3 percent compared with the $311,000 median sales price in 2008. In 2010, the inventory of homes on the market increased 11 percent, to 24,100, an 8-month supply, compared with a 7-month supply of homes in 2009. The Rhode Island Association of REALTORS® (RIAR) reported that, in 2010, existing home sales totaled 6,830 homes, representing a decrease of 12 percent compared with the number of homes sold during 2009, but up 3 percent from 2008. The median sales price increased 5 percent, to $210,000, but was 11 percent lower than the median sales price in 2008.
The Maine Real Estate Information System, Inc., reported that, during 2010, existing home sales in Maine decreased by 3 percent, to 1,210 homes. The median sales price increased 3 percent to $168,750 but was down 6 percent from the $180,000 median sales price in 2008. Accord-ing to the Northern New England Real Estate Network (NNEREN), in 2010, the number of new and existing homes sold in New Hampshire decreased 3 percent, to 10,530, compared with a gain of 6 percent in 2009. In 2010, the median sales price was up slightly by 1 percent, to $215,000, but down 9 percent from the median sales price of $235,000 in 2008. The Vermont Department of Taxes reported that, during 2010, new and existing home sales in Vermont totaled 4,450, an increase of 15 percent compared with the number of sales recorded during 2009 and matching the total number of sales in 2008. The 2010 median sales price of $187,000 was up 1 percent compared with the price during 2009 and down 6 percent from the $199,000 price in 2008. The Warren Group reported that, in Connecticut, during 2010, about 24,270 existing homes were sold, a decrease of less than 1 percent compared with the 24,400 homes sold in 2009. The median sales price for 2010 was $250,000, up 4 percent from 2009.
According to the Federal Housing Finance Agency, in November 2010, home prices in the New England census region decreased slightly by 1 percent compared with prices during November 2009, representing (along with the West South Central region) the smallest price decline of the nine census regions. The comparable decline
New eNglaNd
HUD Region I*
*For an explanation of HUD’s regions, please turn to page 47 at the end of the Regional Reports section.

Regional Activity35
for the nation was 4 percent. According to the Lender Processing Services Mortgage Performance Data, in December 2010, the number of loans 90 or more days de-linquent, in foreclosure, or in REO (Real Estate Owned) decreased by 11 percent to 100,975 loans compared with the 113,130 reported in December 2009. This December 2010 level represents 6.4 percent of all home loans in the region, down from 7.0 percent in December 2009. This rate declined for all states in the region and ranged from 8.5 percent in Rhode Island to 4.3 in Vermont, one of the lowest in the nation. The national rate in December 2010 was 8.3 percent.
Condominium sales in the New England region were down, particularly in the second half of 2010, but median prices were up. According to MAR, during 2010, in Mas-sachusetts, condominium sales were down less than 1 percent to 15,180 compared with the number sold during 2009; the median sales price was up 6 percent to $268,000. In Rhode Island, during 2010, RIAR reported that condominium sales were down 5 percent, to 1,145 units, but the median sales price was up 4 percent, to $187,000. The Warren Group reported that, in Connecti-cut, during 2010, condominium sales totaled 6,825 units, down 7 percent from 2009, but the median sales price was up 2 percent, to $182,250. According to NNEREN, in New Hampshire, during 2010, condominium sales totaled 2,635 units, a decline of 4 percent, and the median sales price was unchanged at $165,000.
Because of strong sales during the first half of 2010 and generally increasing prices, single-family homebuilding activity, as measured by the number of homes permit-ted, increased significantly in the New England region. During 2010, based on preliminary data, the number of homes permitted increased more than 17 percent, to 11,680 homes, the highest regional percentage increase in the nation and nearly 8 times the national average increase of 2 percent. During 2009, single-family home production was down 17 percent compared with produc-tion in 2008. All states posted increases in single-family permits in 2010. The largest absolute increase occurred in Massachusetts, where permits increased 18 percent, to 4,815 homes, from 4,055 homes permitted in 2009. Connecticut, Vermont, and New Hampshire increased permits issued by 22, 23, and 19 percent, to 2,260, 590, and 1,560 homes, respectively, compared with the number of homes permitted in 2009. Maine and Rhode Island had smaller increases of 9 and 6 percent, to 1,720 and 740 homes, respectively. Among the metropolitan areas that had the most significant increases in single-family construction were the Boston-Cambridge-Quincy, Massachusetts-New Hampshire metropolitan area, in-creasing 21 percent, to 3,710 homes, and the Bridgeport-Stamford-Norwalk, Connecticut metropolitan area, which increased 39 percent, to 540 homes.
Bolstered by higher production levels in Massachusetts and New Hampshire, the level of multifamily construc-tion in the region, as measured by the number of units permitted, increased by 13 percent, to 5,825 units, in 2010. Based on preliminary data, the number of units permitted in Massachusetts increased by 30 percent, to 3,170 units, in 2010 compared with the number permitted during 2009. Multifamily units permitted in New Hamp-shire were up 33 percent, to 745 units. In Maine and Rhode Island, multifamily units permitted were down 22 and 20 percent, to 175 and 205 units, respectively. In Connecticut and Vermont, multifamily units permitted were down 6 and 11 percent, to 1,220 and 315 units, respectively. Cities and towns in the Boston-Cambridge-Quincy metropolitan area issued permits for 2,740 units, an increase of 13 percent compared with the number permitted during 2009, representing 47 percent of the total of multifamily units permitted in the region.
Conditions in most New England rental markets are balanced, but they continue to tighten as vacancy rates decline and rents rise. According to REIS, Inc., in 2010, rental production in the Boston metropolitan area was down 75 percent to slightly more than 1,000 units com-pared with the previous 5-year annual average of about 4,200 units. Recent increases in nonfarm payrolls in the metropolitan area have stimulated demand for new apart- ments, lowering the apartment vacancy rate to 5.1 percent in the fourth quarter of 2010, down from 6.4 percent a year earlier. Average market rent increased nearly 3 percent, to $1,748, during the same period. In Connecticut, the Hartford and New Haven metropolitan area markets tightened significantly, and conditions are tight in both markets. With only a few new units added to the inventory in 2010, apartment vacancy rates are 4.7 and 2.2 percent in the fourth quarter of 2010, down from 6.2 and 3.0 per - cent, respectively, from the fourth quarter of 2009. Average market rents have increased nearly 2 percent in both markets, to $980 in Hartford and $1,110 in New Haven during the past year. In Fairfield County, where conditions are balanced, the addition of approximately 1,120 units during 2010 resulted in an increased apartment vacancy rate of 6.0 percent, up from 5.5 percent a year earlier, but the average rent increased more than 4 percent, to $1,814. The Providence metropolitan area market, which is balanced, had virtually no additions to the rental inven-tory during 2010. The apartment vacancy rate declined to 6.0 percent from 8.5 percent a year earlier, and the average rent was virtually unchanged, at $1,205. The Manchester-Nashua, New Hampshire-Massachusetts metropolitan area market tightened during 2010, and conditions are currently tight, with the apartment vacancy rate decreasing to 3.8 percent from 4.2 percent, and average rents are virtually unchanged, at $1,069. In the Portland, Maine metropolitan area, conditions are tight as the apartment vacancy rate declined to 2.8 percent from 4.2 percent, and the average rent increased nearly 3 percent during the past year.

Regional Activity 36
was 8.7 percent in 2010, which is unchanged from 2009. The average unemployment rate remained constant at 8.4 percent in New York but increased from 9.2 to 9.5 percent in New Jersey.
Throughout most of the New York/New Jersey region, sales housing market conditions remain slightly soft, but are improving slowly, as trends in the data for prices and home sales were mixed. According to the NATIONAL ASSOCIATION OF REALTORS®, during the third quarter of 2010 (the latest information available), home sales declined by 101,600 homes, or 25 percent, from a year earlier to a seasonally adjusted annual rate of 296,600 homes sold. According to Lender Processing Services Mortgage Performance Data, as of December 2010, 8.7 percent of total loans in the region were 90 days or more delinquent, in foreclosure, or in REO (Real Estate Owned), up from 8.2 percent a year earlier. This level is comparable to the 8.3-percent rate for the nation as of December 2010.
According to data from the New York State Association of REALTORS®, during 2010, the number of existing single-family home sales in New York (excluding parts of New York City) decreased nearly 4 percent, to 74,600 homes, compared with the number sold during 2009. The median price of an existing home increased more than 7 percent from $205,000 in 2009 to $219,900 in 2010. For the Rochester metropolitan area, during 2010, the Greater Rochester Association of REALTORS® reported a 6-percent decrease in home sales, down to 10,100 homes sold, but the median sales price increased 5 percent to $119,500. The Greater Capital Association of REALTORS®, Inc., reported that, during 2010, in the Albany-Schenectady- Troy metropolitan area, existing home sales decreased by 8 percent, down to approximately 7,425 homes sold, but the median sales price rose 3 percent to $188,000. During the 12 months ending December 2010, the Buffalo Niagara Association of REALTORS® reported that sales of single-family homes declined 15 percent, to less than 8,550 homes sold, but the median sales price increased 11 percent, to $116,500.
The New York City home sales market, which remains slightly soft, strengthened during 2010. Prudential Douglas Elliman Real Estate reported that, in Manhattan, Brooklyn, and Queens, during 2010, existing condominium and cooperative unit sales increased 20 percent to 29,900 units compared with the number sold during 2009. During 2010, the average sales price rose by 9 percent, from $727,100 to $791,300, but the average number of days a home remained on the market declined by 33 days to 113 days. In Queens, home sales increased more than 15 percent to 12,700 homes, and the median sales price increased more than 5 percent to $369,000. In Brooklyn, home sales in-creased 9 percent to 7,140 homes, and the median sales price increased 6 percent, to $475,000. During 2010, home sales in Manhattan totaled nearly 10,100 homes, a 36-percent increase compared with the 7,430 homes sold during 2009. Although the 2010 sales level in Manhattan is 25 percent below the peak that occurred
Economic conditions in the New York/New Jersey region showed signs of improving in 2010, as job losses slowed compared with the conditions during 2009, the beginning of the job decline. During 2010, nonfarm payrolls in the region averaged approximately 12.4 mil-lion jobs, down by 87,600 jobs, or 0.7 percent, which is significantly less than the loss of 393,700 jobs, or 3.1 percent, which occurred during 2009. Total payroll losses in the region were divided almost equally between the two states. In New Jersey, nonfarm payrolls declined by 44,700 jobs, or 1.1 percent, to 3.8 million. New York State registered a loss of 43,000 jobs, or 0.5 percent, resulting in an average of 8.5 million jobs. In New York City, nonfarm payrolls decreased by 10,400, or 0.3 percent, to nearly 3.7 million jobs.
During 2010, the largest job declines in the New York/New Jersey region occurred in the government, construc-tion, and manufacturing sectors. The region lost 39,900 jobs in the government sector, a 1.8-percent decrease, with declines at both the state and local levels because of budget cuts. New York State accounted for nearly 80 percent of the losses in the government sector, record-ing a decline of 31,300 jobs, or 2.1 percent, while New Jersey registered a loss of 8,600 jobs, or 1.3 percent. The construction sector lost 27,100 jobs, or 5.8 percent, through-out the region. Construction job losses totaled 13,600, or 4.2 percent, in New York State and 13,400, or 9.7 percent, in New Jersey. The manufacturing sector in the region continued to contract during 2010; however, job losses slowed to 26,100, or 3.5 percent, compared with the de-cline of 86,300 jobs, or 10.4 percent, in 2009. Manufac-turing payrolls decreased by 15,800 jobs, or 3.3 percent, in New York State, and by 10,300 jobs, or 3.9 percent, in New Jersey.
Two sectors added jobs in the New York/New Jersey region in 2010: the education and health services and the leisure and hospitality sectors. The education and health services sector recorded an increase of 29,600 jobs, or 1.3 percent, with gains of more than 25,500 jobs, or 1.8 percent, in New York State and nearly 5,000 jobs, or 0.7 percent, in New Jersey. The leisure and hospitality sector expanded by 14,500 jobs, a 1.4-percent increase, with additions of 12,500 and 2,025 jobs, or increases of 1.8 and 0.6 percent, in New York State and New Jersey, respectively. In New York City, in 2010, the number of leisure travelers to the city increased by nearly 7 percent, to 48.7 million; as a result, the leisure and hospitality sector increased by 7,900 jobs, or 2.6 percent. The un-employment rate in the New York/New Jersey region
New York/ New JerseY
HUD Region II

Regional Activity37
in 2007, home sales are within 3 percent of the 2008 level of 10,400 homes. In 2010, the median sales price in Manhattan was $845,000, up more than 4 percent from a year earlier.
In New Jersey, home sales markets are slightly soft. Home sales increased, continuing the trend that began in 2009, but home prices remain relatively flat in most areas. According to data from the New Jersey Association of REALTORS®, during the 12 months ending September 2010 (the latest information available), the number of existing homes sold rose by nearly 12,700, or 12 percent, to 119,400 homes sold. During the 12 months ending September 2010, the median sales price declined by 1 percent, to $316,700, which is 17 percent below the peak of $381,400 recorded in September 2007. For the 12 months ending September 2010, Northern New Jersey reported the largest increase in home sales, up 15 percent to 57,900 homes, with the median price declining by less than 1 percent to $387,500. In Central New Jersey, home sales rose 12 percent, to 31,200 homes, and the median price increased 2 percent, to $326,600. In Southern New Jersey, existing single-family homes sales increased 6 per- cent, to 30,300, and the median price increased 1 percent, to $213,700.
As economic conditions in the New York/New Jersey region showed signs of improving, builders increased construction of single-family homes and multifamily units. During the 12 months ending December 2010, based on preliminary data, the number of single-family homes permitted increased 7 percent to 17,750 homes compared with a 25-percent decline recorded during the same period a year earlier. Single-family home construc-tion rose by 260 homes, or 4 percent, to 7,400 homes in New Jersey and by 900 homes, or nearly 10 percent, to 10,350 homes in New York. In the region, multifamily building activity, as measured by the number of units permitted, increased by 21 percent, to 15,775 units, com-pared with a 74-percent decrease during the 12 months ending December 2009. In New Jersey, the number of multifamily units permitted increased by 820, to 5,925 units permitted, which was a 16-percent increase from a year earlier. In New York, the number of multifamily units permitted increased by more than 1,925 units, or 24 percent, to 9,850 units, which is a significant improve-ment compared with the 80-percent decline that oc-curred during the 12 months ending December 2009. For comparison, between 2006 and 2008, the number of multifamily units permitted annually averaged 36,750 units in New York and 12,900 units in New Jersey.
Rental markets in the New York/New Jersey region remained balanced during the fourth quarter of 2010, although conditions in most markets have tightened from a year earlier, with several markets in Upstate New York and New Jersey recording declines in vacancies. The market in the Buffalo metropolitan area tightened, with the vacancy rate dropping 1 percentage point to 4.4 percent and the average rent increasing by 1 percent
to nearly $740. The Rochester apartment market became tighter: the vacancy rate declined from 4.7 to 4.2 percent, and the average rent increased nearly 3 percent, to approxi-mately $770. In the Syracuse metropolitan area, the vacancy rate decreased from 4.4 to 4.0 percent, and the average rent increased 2 percent, to $700. For the fourth quarter of 2010, in Northern New Jersey, the vacancy rate decreased from 5.2 to 4.9 percent, and the average rent rose to $1,510, which was a 2-percent increase. In Central New Jersey, the vacancy rate remained unchanged at 3.9 percent, and the average rent increased 1 percent, to $1,160.
Although vacancies increased in New York City, the rental market is one of the tightest in the nation. Ac-cording to Reis, Inc., in the fourth quarter of 2010, the apartment vacancy rate in New York City increased from 2.9 to 3.2 percent. Despite the increase in vacancies, which occurred because of a slight lessening of demand with the slower economy, the average asking rent in-creased by nearly 5 percent to $2,870. Conditions con-tinued to be tight in the Long Island market, where rents increased more than 2 percent, to $1,550, although the vacancy rate increased slightly from 3.6 to 3.8 percent. The Westchester market tightened as the vacancy rate declined from 5.2 to 3.7 percent, with the absorption of 1,250 apartment units completed in 2008 and 2009, but rents declined by slightly less than 1 percent to $1,860.
During 2010, nonfarm payrolls remained relatively stable in the Mid-Atlantic region, declining by only 11,000 jobs compared with the loss of 434,900 jobs, or 3 percent, during 2009. During 2010, nonfarm payrolls averaged 13.6 million jobs in the region. After reporting declines for 22 months, the professional and business services sector added 20,000 jobs in 2010, which was an increase of 1 percent from 2009. The education and health services and the leisure and hospitality sectors grew by 36,300 and 23,100 jobs, or 1.7 and 1.9 percent, respectively. Gains of 28,200, or 4.5 percent, in the federal government subsector offset losses of 12,900 jobs in the state and local government subsectors, to produce a 0.6-percent increase, or nearly 13,200 additional jobs, in the total government sector. With the exception of the addition of 1,160 jobs, a 0.2-percent increase, in the other services sector, all remaining sectors experienced net losses during 2010.
The manufacturing sector continued a two-decade-long loss and declined by 31,700 jobs, or 3 percent, during 2010.
Mid-atlaNtic
HUD Region III

Regional Activity 38
As 2010 ended, the markets in the rest of the region, in general, remained soft, with price declines still required to stimulate sales. During the 12 months ending September 2010, sales volume declined in Pennsylvania, West Vir-ginia, and Delaware, after an increase in sales during the 12 months ending September 2009 that was stimulated by both declines in prices and the availability of tax cred-its. According to the NATIONAL ASSOCIATION OF REALTORS®, during the third quarter of 2010 (the most recent data available), homes were sold at an annual rate of 135,200 in Pennsylvania, 24,400 in West Virginia, and 8,800 in Delaware, which indicates decreases of 27, 15, and 31 percent, respectively, compared with the number of homes sold in the third quarter of 2009. The market became balanced in the District of Columbia during 2010. According to MRIS®, the District of Columbia reported 6,200 homes sold during the year, a 4-percent increase from the volume reported during 2009, with a 5-percent increase in average price to $512,700.
According to Lender Processing Services Mortgage Perfor-mance Data, in December 2010, the number of home loans that were 90 or more days delinquent, in foreclosure, or in REO (Real Estate Owned) in the region decreased by 8.6 percent to approximately 219,400 loans compared with the number recorded during December 2009. The current rate of all loans recorded in the region is 6.2 percent compared with 6.8 percent in December 2009 and is less than the current 8.3-percent national rate.
Despite mixed conditions in the existing home sales market, new home construction activity, as measured by the number of homes permitted, increased. Based on preliminary data, during 2010, new single-family home construction increased by nearly 5 percent to 38,400 homes permitted. Production in Pennsylvania increased by 11 percent, with 12,200 homes permitted. In Maryland, permits increased by 4 percent to 7,890 homes and, in Virginia, permits were issued for 14,300 homes, nearly 3 percent more than the number issued during 2009. New home construction increased less than 1 percent in Delaware, to 2,670 homes. In West Virginia, production declined by nearly 9 percent, to 1,290 homes, and, in the District of Columbia, production declined from 160 homes in 2009 to 120 homes in 2010. During 2010, all major metropolitan areas in the region reported increases in new home construction. The number of building permits issued for single-family homes increased 8 percent to 4,860 homes in the Philadelphia metropolitan area, 15 percent to 3,110 homes in the Baltimore metropolitan area, and nearly 4 percent to 9,010 homes in the Wash-ington, D.C. metropolitan area.
During 2010, multifamily construction activity, as mea-sured by the number of units permitted, was relatively unchanged in the Mid-Atlantic region. According to pre-liminary data for the period, the number of multifamily units permitted decreased by 120 units, or 1 percent, to nearly 11,400 units. Only Maryland and West Virginia increased production over 2009, issuing permits for 3,340
Pennsylvania lost 14,725 jobs, or nearly 3 percent, in the manufacturing sector, accounting for 46 percent of all losses in the sector in the region. The construction sector lost 28,800 jobs, or nearly 5 percent, in the region. Losses in the construction sector began in 2007, peaked during 2009, and have continued declining but at a slower pace through 2010. Virginia’s loss of 11,400 jobs in the sector in 2010, a decline of 6 percent from 2009, represents 40 percent of all construction jobs lost in the region. Every state in the region reported a net job loss except the District of Columbia, which added 9,300 federal government jobs and 5,700 professional and busi-ness services jobs, resulting in a net gain of 11,900 jobs, or a 1.7-percent increase over 2009. During 2010, the average unemployment rate in the Mid-Atlantic region increased from 7.5 to 8.1 percent. Unemployment rates among the states in the region ranged from 7.0 percent in Virginia to 9.2 percent in West Virginia. The District of Columbia reported the highest unemployment rate in the region at 10.3 percent.
At the close of 2010, conditions in the home sales markets in the Mid-Atlantic region were mixed. During the fourth quarter of 2010, the market in Maryland was balanced as home sales increased, partly because of home price declines, and inventories stabilized. According to the Maryland Association of REALTORS®, 50,880 existing homes were sold in Maryland during 2010 compared with the 49,530 homes sold during 2009, an increase of nearly 3 percent. The increase in sales was not as great as the 11-percent improvement in 2009 over 2008 sales, but it continued a positive trend. The inventory declined by less than 1 percent to an average of 43,800 homes on the market, slightly more than 10 months of supply compared with 44,100 homes and nearly 11 months of supply a year earlier. During 2010, the average home sales price declined 3 percent, to $294,000, from the $302,340 reported a year earlier. Nearly 21,450 homes were sold in the Baltimore metropolitan area during 2010, according to Metropolitan Regional Information Systems, Inc. (MRIS®), down 3 percent from the number sold in 2009. Prices in Baltimore, which averaged $279,800, remained relatively flat. In the Maryland suburbs of the Washington, D.C. metropolitan area, sales volume increased 17 percent to 9,960 homes, but prices declined 12 percent to $217,400.
The sales market was soft in Virginia during the fourth quarter of 2010. The Virginia Association of REALTORS® reported that 18,130 homes were sold during the fourth quarter compared with nearly 22,800 sold during the same quarter in 2009, a decline of more than 20 percent. The median sales price increased 4 percent from $225,750 in the fourth quarter of 2009 to $234,600 currently. In the Northern Virginia suburbs of the Washington, D.C. metro - politan area, expiration of the first-time homebuyers tax credit contributed to a decrease of 10 percent in sales volume to nearly 34,000 homes, but the market showed recovery with prices increasing 11 percent to $388,200 and days on the market declining to 56 from 77 a year earlier.

Regional Activity39
and 160 units, or increases of 32 and 29 percent, re-spectively. The number of multifamily units permitted decreased in Pennsylvania and Virginia during 2010 by 8 and 6 percent to a total of 2,240 and 4,660 units, respectively. Reductions in multifamily production oc-curred in Delaware and the District of Columbia, which recorded decreases of 17 and 44 percent to totals of 400 and 550 units permitted, respectively. Multifamily building activity was mixed in the largest metropoli-tan areas in the region. During 2010, the Washington, D.C. metropolitan area reported 3,110 units permitted, 16 percent more than were permitted in 2009, and the Baltimore metropolitan area reported 1,940 multifamily units permitted, an increase of 7 percent. In the Phila-delphia metropolitan area, the number of multifamily units permitted decreased by 12 percent, to 2,100 units.
Rental market conditions in the three largest metropolitan areas in the region were mixed during the fourth quarter of 2010. In the Baltimore metropolitan area, rental market conditions were soft. According to data from Delta As-sociates, during 2010, vacancy rates increased from 7.4 to 9.1 percent, primarily due to 1,450 newly constructed apartments in leasing in the northern suburbs and in Baltimore City. Average rents in the Baltimore metro-politan area increased by 7 percent to $1,440. Limited additions to the apartment supply during 2010 resulted in a tighter market in the Philadelphia metropolitan area as vacancies declined and rents increased. According to Delta Associates, during 2010, vacancy rates decreased from 8.5 to 3.2 percent, but the average rent increased more than 8 percent, to $1,550. During 2010, average rents in the suburbs increased by more than 5 percent, to $1,360. In Center City Philadelphia, average rents increased by 17 percent, to $2,100, while concessions in the city declined from 7.6 to 2.5 percent. The rental market in the Washington, D.C. metropolitan area, in general, was soft, resulting from higher vacancy rates in the market for midrise and highrise apartments that outweighed the balanced conditions in the market for garden apartments. According to Delta Associates, vacancy rates in midrise and highrise apartments during 2010 decreased from 10.7 to 7.1 percent in Northern Virginia but increased in both the District of Columbia and the Maryland suburbs from 10.8 to 12.3 percent and from 10.4 to 12.1 percent, respectively. In December 2010, rents for midrise and highrise apartments averaged $2,450 in the District of Columbia, $2,100 in suburban Maryland, and $2,180 in Northern Virginia, up 6, 7, and nearly 8 percent, respectively, from December 2009. Vacancy rates for Class A garden apartments increased to 6.6 percent from 5.4 percent a year earlier. During 2010, rents in garden apartments rose nearly 9 percent in both the Maryland and Northern Virginia suburbs surrounding the District of Columbia to average $1,610 from $1,490 a year earlier, but concessions declined to 2.5 from 5.4 percent.
Employment in the Southeast/Caribbean region declined in 2010 for the third consecutive year, but the rate of job losses slowed compared with losses recorded in 2008 and 2009. In 2010, nonfarm payrolls averaged 25.1 million, a decrease of 200,300 jobs, or 0.8 percent, compared with the number of jobs recorded during 2009. Job losses totaled 428,400, or 1.6 percent, in 2008 and almost 1.5 million, or 5.5 percent, in 2009. During 2010, payrolls decreased in every major sector except the education and health services sector, which increased by 67,400 jobs, or 2 percent; the professional and business services sector, which added 34,500 jobs, or 1.1 percent; and the government sector, which recorded a minimal gain of 9,500 jobs. The largest declines occurred in the construction, manufacturing, and financial activities sectors, with decreases of 97,100, 79,800, and 44,100 jobs, or 9.2, 3.4, and 3.1 percent, re-spectively. During 2010, total nonfarm payrolls fell in Puerto Rico and in six of the eight states in the region; they remained relatively unchanged from 2009 levels in Kentucky, South Carolina, and the Virgin Islands. Job losses of 60,000 in Georgia, 54,800 in Florida, and 33,500 in Puerto Rico accounted for 74 percent of the job losses in the region. During 2010, the unemployment rate in the region averaged 11 percent, up slightly from the average rate of 10.6 percent recorded during 2009. The unemployment rate ranged from 9.9 percent in both Alabama and Tennessee to 16.1 percent in Puerto Rico. The largest increase in the unemployment rate occurred in Florida, where the rate increased by 1.4 percentage points to 11.9 percent. Mississippi and Puerto Rico re-corded 1.1-percentage point increases, but the remaining states in the region reported rates that were relatively unchanged from the 2009 levels.
Most local housing markets in the Southeast/Caribbean region are soft because of weak economic conditions, lenders’ tight credit standards, and the large number of distressed properties. According to Lender Processing Services Mortgage Performance Data, in December 2010, 11.5 percent of home loans in the region were 90 or more days delinquent, in foreclosure, or in REO (Real Estate Owned), down slightly from 12.2 percent in December 2009. The rate of distressed properties declined for all states in the region. Florida reported the highest distressed-property rate in the region, at 18.6 percent, down from 19.1 percent in December 2009. The lower rate of dis - tressed properties in Florida was due to an increase in home sales activity. Although markets in Florida remained soft during the past year, lower prices induced higher
southeast/ caribbeaN
HUD Region IV

Regional Activity 40
sold during 2010, decreases of 2 and 4 percent, respectively, compared with the number sold during 2009. During 2010, the median prices of single-family homes and condo-miniums sold increased by 4 percent to $140,000 and 5 percent to $124,500, respectively, compared with the prices recorded during 2009. The Lexington Bluegrass Association of REALTORS®, reporting data for new and existing homes, recorded that, during 2010, 6,700 homes were sold, a decrease of 9 percent from 2009. From 2009 to 2010, the median price of a home sold increased 1 per-cent, to $141,500. About 550 condominiums or townhomes sold, down 16 percent from 2009. From 2009 to 2010, the median price of a condominium or townhome sold increased 2 percent, to $119,500. During 2010, the Greater Nashville Association of REALTORS® reported sales of new and existing single-family homes and condominiums decreased 4 and 10 percent, respectively, to approximately 16,900 and 2,350 units. From December 2009 to December 2010, the monthly median sales price increased 6 percent to $174,500 for a single-family home and decreased 7 percent to $140,000 for a condominium unit. According to the Knoxville Area Association of REALTORS®, during 2010, 9,050 single-family homes were sold, a decrease of 3 per - cent, and the average price remained relatively unchanged at $172,600. During the same period, 990 condominium units were sold, a decrease of 3 percent, and the average price declined by 4 percent to $154,700. During 2010, the Memphis Area Association of REALTORS® reported that new and existing sales decreased by 11 percent to 10,000 single-family homes and by 14 percent to 380 condomin-ium units. The average price of a single-family home decreased by less than 1 percent to $143,000, but the average price of a condominium increased by 8 percent to $144,800.
In the Southeast/Caribbean region, during 2010, single-family home construction activity, as measured by the number of building permits issued, increased by 2 percent to 105,300 homes relative to 2009. Despite the increase, home construction remained well below the average of 438,100 single-family homes that were permitted annually between 2004 and 2007. During 2010, home construction activity increased in four states. In Florida, North Caro-lina, and Georgia, permits increased by 3,525, 725, and 460 homes, respectively, to 29,650, 24,350, and 12,600 homes. In Kentucky, permits increased by less than 1 per- cent to 5,175 homes. In 2010, multifamily construction in the region continued to decline but at a much lower rate compared with the rate of decline during 2009. During 2010, 28,100 multifamily units were permitted, a decline of 1,975 units, or 7 percent, compared with the number permitted during 2009. In contrast, between 2004 and 2007, an average of 121,300 multifamily units were permitted annually in the region. Multifamily con-struction declined in all but three states in the region for the period. Multifamily unit permits increased by 1,700 units, or 62 percent, to 4,450 units in Tennessee; by 350 units, or 33 percent, to 1,400 units in Kentucky; and by 285 units, or 3 percent, to 8,650 units in Florida.
sales activity for both single-family homes and condo-miniums. According to data available from Florida Realtors®, during 2010, 170,900 existing homes were sold statewide, a 5-percent increase compared with the number sold in 2009 and 38 percent higher than the number sold in 2008, but still below the average of 187,500 homes that were sold annually between 2005 and 2007. In Florida, during 2010, the median price of an existing single-family home sold declined by 4 percent to $136,500, down from $142,500 in 2009. In 2010, sales of existing condominiums increased by 29 percent to 72,050 units, nearly doubling the number sold in 2008. In 2010, the median price of an existing condominium sold was $91,300, 15 percent less than the price a year earlier. In Miami, single-family home sales increased by 9 percent to 7,300 homes, but the median price de-creased by 3 percent to $189,400. Condominium sales in Miami increased 43 percent to 9,775 units, but the median price declined by 18 percent to $116,900.
In Alabama, according to the Alabama Center for Real Estate, during 2010, approximately 36,250 new and ex-isting homes and condominiums were sold, a 4-percent decline compared with the 37,900 homes and condo-miniums sold during 2009. During 2010, the average inventory of unsold homes was unchanged from the 2009 level of 40,300, which represents approximately a 13-month supply. The average number of days that a home remained on the market was also relatively unchanged at 149 days, and the average price increased by less than 1 percent to $145,500. Data from South Carolina REALTORS® indicate that, during 2010, the number of existing homes sold in the state increased by less than 0.5 percent to 47,050. Sales decreased in 8 of 15 reported areas of the state. Declines in sales ranged from more than 5 percent in Columbia to 23 percent in Myrtle Beach. From 2009 to 2010, the median home price increased nearly 1 percent statewide, to $150,000. The median price increased in 10 of 15 reported areas, ranging from slightly more than 1 percent in Columbia to 8 percent in Greenwood. According to data from the North Carolina Association of REALTORS®, in 2010, the number of existing homes sold statewide decreased to 80,500, a decline of 650 homes, or 1 percent. The number of homes sold decreased in 9 of 21 reported areas, including Raleigh, where sales decreased by 3 percent to 20,250 homes. Sales volumes were virtually unchanged in the other two largest metropolitan areas in the state, Charlotte and Greensboro, at 22,150 and 10,850 homes, respectively. In North Carolina, the average price of an existing home sold increased by $2,400, or 1 percent, to $203,100. Aver-age prices decreased in 12 of 21 reported areas, including Greensboro, where the average price of a home decreased by 2 percent to $155,900. In Charlotte and Raleigh, average prices increased by 3 percent to $207,000 and $229,100, respectively.
According to the Greater Louisville Association of RE-ALTORS®, reporting data for new and existing homes, about 10,200 single-family homes and 1,200 condominiums

Regional Activity41
Limited construction of new apartments and stabilizing labor markets during 2010 contributed to both declining vacancy rates in the Southeast/Caribbean and a mix of soft, balanced, and near-balanced apartment markets. For the second consecutive quarter, all 20 primary market areas surveyed by Reis, Inc., recorded vacancy rate decreases compared with rates recorded for the same quarter last year. During the fourth quarter of 2010, apartment vacancy rates ranged from 5.3 percent in Louisville to 11.4 percent in Memphis. During the past year, markets with the largest declines in vacancy rates included the South Carolina markets of Columbia, Charleston, and Greenville, where 3- to 4-percentage point decreases were recorded; the rates fell to 9.1, 8.2, and 7.7 percent, respectively. In Jacksonville, the vacancy rate declined by 3.5 percentage points to 10.9 percent, and, in Atlanta, the rate decreased by 2 percentage points to 9.7 percent, although soft conditions persisted in both areas. During 2010, improved occupancy enabled property owners to increase rents in some markets. Average asking rents increased by 2 percent or less in 17 markets. In Green-ville, South Carolina, the average asking rent increased by nearly 4 percent to $645, the largest rate of increase recorded in the region.
Economic conditions in the Midwest remained weak during 2010, continuing a 3-year trend. During the past year, nonfarm payrolls decreased by 154,200, or 0.7 per-cent, to an average of 22.6 million jobs, which was much less than the loss of 1.3 million jobs, or 5.3 percent, during 2009 and was the smallest decline since the 12 months ending September 2008. Employment increased in three sectors, led by the education and health services sector, which gained 46,100 jobs, or 1.3 percent. The two other sectors with job gains were the professional and business services sector and the mining and logging sector, up 34,400 and 800 jobs, or 1.3 and 0.5 percent, respectively. During 2010, all other sectors reported job losses, led by the construction sector, which lost 61,300 jobs, or 7.3 percent, and the financial activities and manufacturing sectors, which were down 38,500 and 34,800 jobs, or 2.9 and 1.2 percent, respectively.
All six states in the region recorded decreases in nonfarm payrolls in 2010. Illinois reported the largest decline, down 83,000 jobs, or 1.5 percent. Ohio, Michigan, and Wisconsin registered declines of 73,500, 51,500, and 37,600, or losses of 1.4, 1.3, and 1.4 percent, respectively. Minnesota and Indiana both recorded job losses of less than 1 percent,
with a decrease of 9,900, or 0.4 percent, in Minnesota and 8,500, or 0.3 percent, in Indiana. The average un-employment rate for the region declined slightly, from 10.3 percent in 2009 to 10.2 percent in 2010. Four states recorded lower unemployment rates, with Michigan reporting an unemployment rate of 13.1 percent, the highest in the region, although it was down from the 13.6-percent rate recorded in 2009. In Minnesota, from 2009 to 2010, the unemployment rate fell from 8.0 to 7.1 percent, in Wisconsin the rate dropped from 8.5 to 8.1 percent, and in Indiana it dropped from 10.1 to 9.9 percent. The unemployment rate rose in Illinois and Ohio, from 10.1 to 10.4 percent and from 10.2 to 10.3 percent, respectively.
The slow economy continues to disrupt home sales markets in the Midwest region. Although data on home sales and prices vary, market conditions remain slightly soft throughout most of the region. According to data from the Michigan Association of REALTORS®, in Michigan, during the 12 months ending November 2010, new and existing home sales rose approximately 7 percent, to 120,300 homes compared with the number sold during the previous 12 months; the sales level was about the same as the annual average for 2004 through 2008. For the 12-months ending November 2010, the average price increased 7 percent to $106,100. In Illinois, the home sales market is soft, with approximately 103,700 homes sold, down 4 percent from the 2009 total of 107,800 home sales, according to the Illinois Association of REALTORS®. The median sales price reported in Illinois was also down, approximately 3 percent, to $152,000. In the Chicago metropolitan area during 2010, new and existing home sales declined by approximately 1 percent, to 69,000 homes sold, and the median sales price declined almost 6 percent, to $185,000.
According to the Indiana Association of REALTORS®, in 2010, new and existing home sales in Indiana were down almost 7 percent from 2009, to 57,750 homes sold, but the average sales price increased 4 percent, to $133,000. The Ohio Association of REALTORS® reported that, in 2010, new and existing home sales decreased 4 percent compared with sales during 2009, down to 101,000 homes sold, but the average sales price increased almost 3 percent, to $132,700. In Minnesota, the Minnesota Association of REALTORS® reported an 11-percent decline in home sales, down to 66,050 sold, but a stable median sales price of $150,000. In Wisconsin, the Milwaukee-Waukesha- West Allis metropolitan area, including four counties, reported 11,500 new and existing home sales, a decrease of 13 percent from the 13,250 homes sold in 2009, according to the Greater Milwaukee Association of REALTORS®, while the median sales price increased one percent, to $176,000. According to Lender Processing Services Mort-gage Performance Data, in December 2010, the number of home loans 90 or more days delinquent, in foreclosure, or in REO (Real Estate Owned) in the region decreased to approximately 496,100, or 8.5 percent of all loans recorded
MidwestHUD Region V
Regional Activity 42
southwestHUD Region VI
in the region. These figures show an improvement from the 9.1-percent rate recorded in December 2009, although it is still higher than the current 8.3-percent rate for the nation.
Despite generally soft sales market conditions, single-family construction activity, as measured by the number of building permits issued, increased in the Midwest region during 2010. According to preliminary data, in 2010, 42,000 single-family permits were issued in the region, 4 percent above the number of permits issued in 2009 but 20 percent below the number issued in 2008. From 2003 through 2007 in the region, an average of 186,600 permits for single-family homes was issued annually. In 2010, all states in the region except Michi-gan reported single-family construction activity within 2 percent of 2009 totals, according to preliminary data. In Indiana, in 2010, construction was up 2 percent to 8,750, and, in Ohio, home construction gained 1 percent, to 9,125 homes. The construction level in Wisconsin during 2010 remained unchanged at 6,225, but in Illinois and Minnesota, home construction fell 1 and 2 percent, to 5,875 and 5,900, respectively. In Michigan, during 2010, the increase in single-family homes permitted rose 28 percent, to 6,100, but the number remains far below the 33,900 single-family homes permitted, on average, from 2003 through 2007.
Multifamily building activity, as measured by the number of units permitted, also increased in the Midwest region because of generally balanced rental market conditions in most states. In 2010, according to preliminary data, approximately 16,250 multifamily units were permitted, 36 percent more than the 11,900 units permitted in 2009, but 39 percent below the 26,550 multifamily units per-mitted in 2008. From 2003 through 2007, the number of multifamily units permitted averaged 54,500 annually in the region. From 2009 to 2010, all six states in the region recorded increases in multifamily units permitted, ranging from 17 percent in Wisconsin, or an increase of 2,800 units, to 124 percent in Michigan, where multifamily units permitted increased from 575 to 1,275, according to pre - liminary data. In Indiana, from 2009 to 2010, the number of multifamily units permitted rose 21 percent, from 2,525 to 3,050, and, in Ohio, the number of units permitted increased 29 percent, to 2,775. In Illinois and Minnesota during 2010, the increases in multifamily units permit-ted were 45 and 54 percent, to 3,650 and 2,700 units, respectively.
Apartment market conditions in major metropolitan areas in the Midwest region were mixed, but signs of strengthening were evident in the fourth quarter of 2010. According to Reis, Inc., in Chicago, for the fourth quarter of 2010, the apartment vacancy rate was 6 percent, down from 7 percent in 2009, but the average rent increased almost 2 percent, to $1,075, reflective of a balanced market. In Ohio, all three major metropolitan areas recorded stable or decreasing vacancy rates and increasing rents. In Columbus, the apartment market remains somewhat
soft, with an estimated vacancy rate of 9 percent, the same rate recorded in 2009, and the average rent increased less than 1 percent, to $690. In Cincinnati and Cleveland, during 2010, markets were generally balanced, with apartment vacancy rates of 7 and 6 percent, respectively, down from 8 and 7 percent in 2009, but both metropolitan areas recorded increased average rents, up 1 percent, to $710 in Cincinnati and $720 in Cleveland. From the fourth quarter of 2009 to the fourth quarter of 2010, in Michigan, the apartment vacancy rate in Detroit was generally balanced, declining from 8 to 7 percent. At the same time, the average rent increased by less than 1 per - cent, to $830, according to Reis, Inc. In Indianapolis, for the fourth quarter of 2010, the apartment market was slightly soft, with a vacancy rate of 8 percent, down from 10 percent in 2009, and the average rent increased almost 2 percent, to $680. Milwaukee and Minneapolis both had tight markets with declining vacancy rates, down to 5 and 4 percent, respectively, but increasing rents of 1 percent each, to $840 in Milwaukee and $960 in Minneapolis.
Economic conditions in the Southwest region turned positive in the fourth quarter of 2010, the first 12-month increase in nonfarm payroll jobs in nearly 2 years. During the 12 months ending December 2010, average nonfarm payrolls increased by 0.1 percent, or 23,000 jobs, to 15.7 million jobs. By comparison, average nonfarm payrolls declined by 2.8 percent, or 460,000 jobs, for the 12 months ending December 2009. The education and health services sector recorded the largest growth during the 12 months ending December 2010, adding 80,100 jobs, an increase of 3.8 percent. The government sector increased by 23,400 jobs, or 0.8 percent, despite Louisiana and Oklahoma’s combined losses of 4,400 jobs in the sector. The leisure and hospitality sector recorded gains for the second con - secutive quarter, with an increase of 13,900 jobs, or 0.9 percent. Significant declines continued from the previous quarter in the construction sector as soft housing and commercial property markets contributed to a decrease of 37,800 jobs, or 4.2 percent, compared with a decrease of 103,400 jobs, or 10.4 percent, during the 12 months ending December 2009. The manufacturing sector, which recorded declines in all states in the region, except New Mexico, lost 19,800 jobs, or 1.5 percent, during the 12 months ending December 2010.
During the fourth quarter of 2010, job losses in Arkansas, Louisiana, New Mexico, and Oklahoma were offset by the largest nonfarm payroll gains recorded in Texas since

Regional Activity43
the second quarter of 2009. During the 12 months ending December 2010, Texas gained 42,100 jobs, or 0.4 percent, led by an increase of 52,800 jobs, or 4 percent, in the edu cation and health services sector. In Oklahoma, non-farm payrolls decreased by 5,600 jobs, or 0.4 percent, led by losses of 6,000 jobs in the manufacturing sector and 3,800 jobs in the government sector, or 4.6 and 1.1 percent, respectively. Nonfarm payroll losses in Louisiana appear to have bottomed out with only a small decrease of 100 jobs, as combined gains of more than 12,900 jobs in the leisure and hospitality and the education and health ser-vices sectors were partially offset by combined losses of 12,000 jobs in the construction, manufacturing, and financial activities sectors. Nonfarm payrolls in New Mexico declined by 10,000 jobs, or 1.2 percent, for the 12 months ending December 2010. In Arkansas, nonfarm payrolls declined by 3,500 jobs, or 0.3 percent, with declines in the manufacturing, trade, and leisure and hospitality sectors accounting for nearly 70 percent of the total loss. For the 12 months ending December 2010, the unemploy-ment rate in the region increased to 8 percent from the 7.4-percent rate for the previous 12 months. The average unemployment rates ranged from a low of 6.8 percent in Oklahoma to a high of 8.4 percent in New Mexico; Loui-siana, Arkansas, and Texas recorded rates of 7.4, 7.7, and 8.2 percent, respectively.
Sales housing market conditions in the Southwest region remained slightly soft during the 12 months end-ing December 2010 because of continued job losses in most states in the region. During the 12 months ending December 2010, approximately 202,900 homes sold in Texas, down nearly 5 percent compared with the num-ber sold during the previous 12 months and 13 percent below the number sold during the 12 months ending December 2008, according to the Real Estate Center at Texas A&M University. The inventory of unsold homes was at a 7-month supply for the 12-month period ending December 2010, relatively unchanged from the previous year but well above the 5-month average supply recorded between 2006 and 2008. During the 12 months ending December 2010, the number of homes sold declined in most major metropolitan areas in Texas, with declines ranging from 2 percent in San Antonio to 8 percent in Dallas. Much of the recent sales activity in the Dallas area has occurred in Collin County, where the average sales price of $246,500 for 2010 was approximately 28 percent above the state average. The average home sales price in Texas increased 4 percent to $192,900 during the 12 months ending December 2010 compared with the average price during the previous 12 months but still re-mains approximately 1 percent below the level recorded during the 12 months ending December 2008. Home sales price increases among major metropolitan areas in Texas ranged from 3 percent in San Antonio to 7 percent in Dallas.
Home sales declined in a number of markets in states elsewhere in the region during the 12 months ending Dec-ember 2010. According to the New Orleans Metro politan
Association of REALTORS® and Gulf South Real Estate Information Network, Inc., new and existing single-family home sales in New Orleans were down 9 percent to 6,925 homes during the 12 months ending December 2010, but the median sales price increased 4 percent. In Baton Rouge, the number of home sales declined 8 percent to 6,375 homes, based on data from the Greater Baton Rouge Association of REALTORS®, but the average home sales price increased 2 percent to $195,700, although the price still remains nearly 3 percent below the level recorded during the 12 months ending December 2008. During the 12 months ending December 2010, The Greater Albuquerque Association of REALTORS® reported that the number of home sales was down 5 percent in Albu-querque to 6,475 homes compared with the number sold during the previous 12-month period. The average home sales price in Albuquerque was relatively unchanged at $216,000 during the 12 months ending December 2010. According to the Oklahoma Association of REALTORS®, the number of homes sold in Oklahoma was down 4,300 or 10 percent during the 12 months ending December 2010, at 40,500 home sold, but the average home sales price increased by approximately 1 percent to $147,700. According to the Arkansas REALTORS® Association, during the 12 months ending December 2010, the number of home sales for the state declined by 7 percent to 22,750 homes, but the average home sales price remained rela-tively unchanged at $145,200.
Builders in the Southwest region responded to declining home sales by reducing single-family construction activ-ity, as measured by the number of single-family building permits issued. During the 12 months ending December 2010, the total number of single-family homes permitted in the region was 86,400, a decline of 1,475 homes, or 2 percent, compared with the number permitted during the previous 12 months, based on preliminary data. The number of permits issued during the 12 months ending December 2010 was 16 percent below the levels recorded during the 12 months ending December 2008. For the 12 months ending December 2010, Texas recorded a 1-percent decrease in the number of single-family homes permitted, down 620, to 63,000 homes. Other states in the region experienced changes in the number of single-family homes permitted, ranging from a decline of 6 percent in Oklahoma to an increase of 3 percent in Arkansas. Louisiana and New Mexico each recorded declines of 4 percent in the number of single-family homes permitted during the 12 months ending December 2010.
Rental housing market conditions in the largest metro-politan areas in Texas are soft but have improved slightly during the 12 months ending December 2010 as builders responded to soft market conditions by reducing multi-family construction activity. Austin remained the only major Texas market with an apartment vacancy rate under 10 percent. According to ALN Systems, Inc., the apartment vacancy rate in Austin was 8.7 percent for the 12 months ending December 2010, down from 11.5 per-cent during the previous 12 months, and the average

Regional Activity 44
rent declined 2 percent to $840. In San Antonio, the apartment vacancy rate declined slightly from 11.9 to 10.2 percent during the 12 months ending December 2010, and the average rent remained unchanged at $730. Rental markets in Fort Worth and Houston remained very soft, with vacancy rates of 11.4 and 13.8 percent, respectively, during the 12 months ending December 2010. The average rent in Fort Worth declined by 3 per-cent to $700 during the 12 months ending December 2010. During the same period, the average rent in Houston remained unchanged at $790, the first 12-month period since 2005 in which average rents have not increased. In Dallas, during the 12 months ending December 2010, the vacancy rate declined to 10.9 percent from the 12-percent rate recorded during the 12-month period ending December 2009, and the average rent declined 2 percent to $800.
Rental housing market conditions were mixed in large metropolitan areas in other states throughout the South-west region during the fourth quarter of 2010. Rental markets in Albuquerque and Little Rock are currently balanced. According to Reis, Inc., the apartment vacancy rate in Albuquerque was 5 percent in the fourth quarter of 2010, down from 6.9 percent a year earlier, and the average rent increased 2 percent to $720. In Little Rock, during the fourth quarter of 2010, the apartment vacancy rate was 7.3 percent, down from 8.4 percent a year earlier, and the average rent increased approximately 2 percent to $660. Rental markets in the largest metropolitan areas in Oklahoma were slightly soft during the fourth quarter of 2010. In Oklahoma City, the apartment vacancy rate declined slightly from 10 percent in the fourth quarter of 2009 to 8 percent in the fourth quarter of 2010, and the average rent increased 3 percent to $560. In Tulsa, the vacancy rate declined slightly from 9.2 percent in the fourth quarter of 2009 to 8.8 percent during the same period in 2010, and the average rent increased 1 percent to $580. Rental market conditions in New Orleans remained soft as the apartment rental vacancy rate fell to 9.3 percent during the fourth quarter of 2010, down from the 11-percent rate recorded a year earlier, and the average rent increased 2 percent to $870.
Despite soft apartment rental markets in many large metropolitan areas, multifamily construction activity, as measured by the number of units permitted, increased in the Southwest region during the 12 months ending December 2010, based on preliminary data. The 24,000 units permitted during the 12 months ending December 2010 reflect a 7-percent increase compared with the number of units permitted during the previous 12 months. Multi - family permitting levels remain approximately 61 percent below the levels recorded during the 12 months ending December 2008. During the 12 months ending December 2010, the number of multifamily units permitted in Texas grew by 13 percent, or 2,175 units, from the previous year to 18,700 units. Louisiana and Oklahoma recorded declines of 35 and 12 percent, respectively, and Arkansas
and New Mexico recorded increases of 4 and 5 percent, respectively, for the 12 months ending December 2010.
Nonfarm payrolls in the Great Plains region continued a 3-year decline in 2010, but the pace of job losses slowed during the year. In 2010, nonfarm payrolls in the region decreased by 1 percent, or 49,000, to 6.4 million jobs, compared with a loss of about 3 percent during 2009. Payroll losses in 2010 were greatest in the construction sector, which declined by 18,000 jobs, or 6 percent, mainly because of declining commercial development and subdued residential construction. The manufacturing sector had the second greatest decline in payrolls in 2010, decreasing by 15,000 jobs, or 2 percent. In Kansas, the aerospace industry lost 4,100 jobs, or 14 percent, and the motor vehicles industry in Missouri lost 1,100 jobs, or 19 percent; these two losses represented the most significant workforce reductions. During 2010, shrinking construction and manufacturing payrolls equaled approx-imately one-fourth of the payroll decline that occurred in 2009, when a combined 127,000 jobs were cut in the two sectors. The education and health services, government, and other services sectors were the only private employ-ment sectors that had payroll increases. The education and health services sector increased by 11,000 jobs, or 1 per-cent, mainly because of hiring in the medical services industry. The government and the other services sectors each grew by about 0.5 percent, adding 6,000 and 500 jobs, respectively. Hiring in the government sector mainly consisted of adding census workers to the federal payroll, while in other services, new jobs were scattered among several subsectors. The unemployment rate averaged 7.5 percent during 2010 compared with 7.3 percent in 2009.
All four states in the region recorded smaller job losses in 2010 than in 2009. Iowa and Nebraska payrolls fell less than 1 percent, with jobs declining by 4,100 and 2,200, respectively, compared with the 45,000 and 20,000 jobs lost during 2009. In Kansas, in 2010, 13,200 payroll jobs were lost, which represents a 1-percent decline compared with a 3-percent decline, or a loss of 45,000 jobs, in 2009. During 2010, job losses in Missouri totaled slightly more than 29,000, which was a 1-percent decline compared with a decline of 104,000 jobs, or 3 percent, in 2009. In Kansas, for the first time since 2007, the average unem-ployment rate fell, declining from 6.7 percent in 2009 to 6.6 percent in 2010. In Iowa, Missouri, and Nebraska, the average unemployment rate increased during 2010 to 6.6, 9.4, and 5 percent from 6, 9.3, and 4.6 percent in 2009, respectively.
great PlaiNs
HUD Region VII

Regional Activity45
Weak economic conditions throughout the Great Plains region during 2010 led to a third year of soft sales housing market conditions as most metropolitan areas showed double-digit average months’ supply of unsold inventory. Sales activity was brisk before the July 1, 2010 expiration date of the homebuyer tax credit program but was more than offset by the slowdown during the last 6 months of the year. According to Hanley Wood, LLC, overall sales of new and existing homes fell 14 percent for the region, from 153,000 in 2009 to 130,300 in 2010. Despite the decline in sales during 2010, the average price of new and existing homes sold was $171,000, which is a 3-percent increase from the $165,200 average price during 2009. The increase occurred because of strong demand early in the year in all four states and because of decreased foreclosure sales activity in Kansas and Nebraska during 2010. Lender Processing Services Mortgage Performance Data show that the percentage of total loans 90 or more days delinquent, in foreclosure, or in REO (Real Estate Owned) fell in all four states in the Region during 2010. From 2009 to 2010, Missouri had the greatest percentage point decrease, falling from 6 to 5.4 percent. Nebraska had the second greatest decrease during that same period, falling from to 4.1 to 3.6 percent. Iowa and Kansas had rates of 4.8 and 5 percent, respectively, in 2010 compared with 5.2 and 5.3 percent in 2009. In Kansas and Missouri, sales of new and existing homes decreased by 14 and 10 percent, to 25,000 and 65,000 homes, respectively. In Kansas, the average home sale price increased 2 percent, to $181,700, and, in Missouri, it increased by 4 percent, to $174,500. In Iowa, total home sales, at 29,000, were relatively unchanged from 2009 to 2010, but the average home price increased 3 percent to $158,000.
New and existing home sales and average home price trends in the major metropolitan areas of the region were consistent with state trends. Total home sales in the Kansas City area had the largest declines in the region, falling by 17 percent to 30,000 homes in 2010 from 36,000 homes in 2009. Despite the decline in sales, the average price for all homes sold was up 3 percent, to $190,700 in 2010 compared with $184,500 in 2009. Accord-ing to the Kansas City Real Estate Report®, as of December 2010, Kansas City had an 11-month supply of unsold inventory, which was unchanged from a year earlier. Total home sales in Des Moines decreased 15 percent, from 10,150 in 2009 to 8,600 in 2010, but the average price increased from $159,800 to $166,200, which was an in-crease of 4 percent. The average sales price rose despite a 13-month supply of unsold inventory as of December 2010, as reported by the Des Moines Area Association of REALTORS®. In St. Louis, total home sales fell by 13 percent, from 43,000 in 2009 to 37,600 in 2010, but the average price increased 5 percent, to $179,700. Total home sales declined by 11 percent in Wichita, from 10,300 in 2009 to 9,200 in 2010, but the average price was un-changed at $142,300. According to the Wichita Area As - sociation of REALTORS®, as of December 2010, Wichita had a 7-month supply of unsold inventory. In Omaha,
according to the Great Plains Area Multiple Listing Service®, during 2010, total homes sales declined by 14 percent, to 9,200, but the average price increased 4 percent to $170,100. As of December 2010, Omaha had a 10-month supply of unsold inventory compared to a 9-month supply a year earlier.
Single-family home construction, as measured by the number of single-family building permits issued, totaled 17,200 homes in the region during 2010, which was a slight decrease from the 17,100 permits issued in 2009, based on preliminary data. Because of a regionwide soft sales market, construction activity continued to remain low compared with the 8-year period from 2001 through 2008, when single-family home permits averaged 46,000 a year. In Missouri, single-family home construction in-creased 8 percent in 2010 to 5,725 homes compared with the decline of 14 percent during 2009. In Iowa, in 2010, the number of single-family homes permitted totaled 5,150, a 6-percent increase compared with the 4-percent decline a year earlier. In Kansas, in 2010, the number of single-family homes permitted was 3,125, a decrease of 5 percent compared with a 20-percent decline in 2009. In Nebraska, during 2010, permits issued for single-family homes decreased by 17 percent, to 3,200 homes, compared with a 4-percent decline recorded a year earlier.
During 2010, increased demand for rental units in the Great Plains region led to improving metropolitan area rental market conditions. As of the end of 2010, the apartment market was balanced in Omaha and slightly soft in Kansas City, Wichita, and St. Louis, with rents increasing in all of these areas, except in Wichita. Accord-ing to Reis, Inc., during 2010, the Kansas City apartment vacancy rate averaged 7.9 percent compared with 9.1 percent in 2009, but the average rent increased by nearly 2 percent, to $712. In Wichita, in 2010, the average apartment vacancy rate was 6.4 percent compared with 8.4 percent a year earlier, and the average rent was $517, unchanged from 2009. In the St. Louis area, in 2010, the average apartment vacancy rate was the lowest rate since 2007, at 7.6 percent compared with 9.2 percent a year earlier, and the average rent was $730 compared with $724 a year earlier. In Omaha, during 2010, the vacancy rate averaged 4.6 percent compared with 6.8 percent a year earlier, and the average rent was $703, an increase of 2 percent from 2009.
Multifamily construction, as measured by the number of multifamily units permitted, declined by 29 percent, to 5,250 units, in the Great Plains Region during 2010 compared with a 32-percent decrease in 2009, based on preliminary data. Nearly all multifamily construction activity was for apartments. Because of weak economic conditions and limited credit availability during the past 2 years, multifamily construction activity is well below the 15,100 units built annually during the 2001-through- 2008 period. During 2010, improving rental markets in Missouri led to the permitting of 2,275 units, which is a 20-percent increase in multifamily construction activity
Regional Activity 46
compared with a 7-percent increase in 2009. During 2010, mainly because of the improving rental apartment market in Omaha, Nebraska recorded a 60-percent increase in multifamily construction activity; 925 units were issued permits compared with 575 a year earlier. Because of soft rental market conditions, during 2010, multifamily devel- opment in Iowa and Kansas declined by 22 and 69 percent, to 1,350 and 700 units, respectively, putting them on pace for the lowest level of annual multifamily construc-tion activity in the past 10 years.
Economic conditions in the Rocky Mountain region have stabilized in recent months, but employment for 2010 remained below the level of a year earlier. Average nonfarm payrolls for 2010 were down by about 43,600 jobs, or 0.9 percent, from a year earlier, to 4.9 million jobs. During the fourth quarter of 2010, however, seasonally adjusted nonfarm payrolls were relatively unchanged from the previous two quarters, suggesting that employment has stopped declining. In 2010, more than 80 percent of the job losses in the region occurred in Colorado, where nonfarm payrolls were down by 39,900 jobs, or 1.8 percent, compared with the payrolls recorded a year earlier. In Wyoming and Montana, payrolls declined by 3,100, and 3,900 jobs, or 1.1 and 0.9 percent, respectively. In 2010, in Utah and South Dakota, payrolls remained flat, but, in North Dakota, they increased by 3,400 jobs, or 0.9 percent, which was one of the highest rates of job growth among all states in the country. For the region, in 2010, the sectors with the biggest job losses were the construction and manufacturing sectors, where payrolls fell by 27,500 and 10,100 jobs, or 10 and 3 percent, respectively. The decline in construction payrolls was partly due to decreased com-mercial building activity, and partly because of a decline in multifamily residential construction. Payrolls also declined in the financial activities, transportation and utilities, and leisure and hospitality sectors by 7,200, 5,200, and 4,600 jobs, or 2, 3, and 1 percent, respectively. In 2010, the only sectors that expanded were the educa-tion and health services sector, which added 14,700 jobs, a 2-percent increase, and the government sector, which added 6,000 jobs, a 1-percent increase. The decline in pay- rolls led to an increase in the unemployment rate for the region, which rose from 6.8 percent in 2009 to 7.3 percent in 2010. Statewide un employment rates for 2010 ranged from 3.8 percent in North Dakota to 8.2 percent in Colorado, but all states in the region continued to have unemployment rates that were below the national average of 9.6 percent.
Home sales market conditions were soft throughout the Rocky Mountain region in the fourth quarter of 2010, al-though home prices increased in some local areas. During the fourth quarter of 2010, sales of existing homes fell, partly because of the expiration of the homebuyer tax credits. According to the NATIONAL ASSOCIATION OF REALTORS®, for fourth quarter 2010, the seasonally adjusted annual rate of existing home sales in the region was down 21 percent from a year earlier. The current an-nual rate of home sales is at171,200, well below the peak rates of 2005 and 2006, when an average of more than 250,000 homes a year were sold. Sales were down for all states in the region, with the biggest declines in North Dakota and South Dakota, where sales fell 28 and 38 per-cent, respectively, while Colorado and Wyoming had the smallest declines, at 16 and 8 percent, respectively.
Despite weaker home sales, mortgage defaults and fore-closures have decreased in the Rocky Mountain region in the past year. According to Lender Processing Services Mortgage Performance Data, from December 2009 to December 2010, the number of loans 90 or more days delinquent, in foreclosure, or in REO (Real Estate Owned) fell from 5.2 to 4.8 percent. The rate of distressed loans as a share of all loans ranged from 1.9 percent in North Dakota to 6.1 percent in Utah, but all states in the region had lower rates compared with a year earlier, and every state in the region was below the national average of 8.3 percent.
Consistent with the state trends, home sales have declined in most metropolitan areas of the Rocky Mountain region, based on data from Hanley Wood LLC, but prices have increased in some areas. Sales markets are soft in most of the Front Range cities in Colorado. In the 12 months ending November 2010, approximately 35,000 existing single-family homes were sold in the Denver-Aurora area, with a 7-percent decline from the 37,800 sold in the previous 12 months. In the Colorado Springs and Fort Collins-Loveland areas, sales were down 7 and 6 percent, to 10,500 and 4,800 homes sold, respectively. The sales market in Grand Junction remains soft, despite a drop in prices that boosted sales by 24 percent, to 2,500 homes sold. Home sales markets were also soft in the major metropolitan areas of Utah. In Salt Lake City, sales of existing single-family homes were down 1 percent, to 14,400 homes sold. In Provo-Orem and Ogden-Clearfield, sales were down 6 and 9 percent, to 7,800 and 6,300 homes sold, respectively. Sales were also down in other metropolitan areas of the region. Sales market conditions are soft in Fargo, Cheyenne, and Billings, where sales of existing single-family homes were down 8, 11, and 14 percent, to 1,700, 1,500, and 1,600 homes sold, respec-tively. Despite the slower home sales, prices were up in some metropolitan areas. During the 12 months ending November 2010, the average price for existing single-family homes sold in the Denver-Aurora area was about $281,400, a 10-percent increase from the previous 12 months. In the Colorado Springs and Fort Collins-Loveland areas, average prices were up 2 and 8 percent, to $206,100 and
rockY MouNtaiN
HUD Region VIII

Regional Activity47
$251,700, respectively. Prices were up in some other parts of the region as well. In Fargo, Cheyenne, and Billings, average prices for existing single-family homes were up 1, 2, and 5 percent, to $157,400, $176,700, and $202,700, respectively. In Grand Junction, however, the average price was down by 9 percent, to $208,000. Prices also declined in the major metropolitan areas of Utah. In Salt Lake City, the average price for existing single-family homes sold was down 6 percent, to $233,500. In Provo-Orem and Ogden-Clearfield, average home prices were down 7 and 2 percent, to $237,900, and $197,700, re spectively.
Condominium sales were also weak in metropolitan areas throughout the region in 2010, based on data from Hanley Wood LLC. In the Denver-Aurora area, during the 12 months ending November 2010, sales of existing condominiums were down 1 percent to about 7,000 units sold. In Boulder and Fort Collins-Loveland, sales were down 12 and 14 percent, to 750 and 550 units sold, respec-tively. Sales also fell in Ogden-Clearfield by 16 percent, to 450 units sold. In Colorado Springs, however, sales were up 18 percent, to 600 units sold. In both Salt Lake City and Provo-Orem, existing condominium sales also increased by 14 percent, to 3,100 and 1,100 units, re-spectively. Condominium prices declined in most areas. Average prices for existing condominiums fell 3, 4, and 16 percent in Colorado Springs, Fort Collins-Loveland, and Boulder, to $107,500, $159,100, and $191,900, respectively. In Salt Lake City, Provo-Orem, and Ogden-Clearfield, average prices were also down 1, 2, and 5 per-cent, to $195,700, $135,900, and $130,700, respectively. In the Denver-Aurora area, however, in the 12 months ending November 2010, the average sales price for existing condominiums was up 2 percent, to about $140,300.
Homebuilding activity in the Rocky Mountain region increased in 2010, despite slower home sales, but building activity remains well below levels recorded a few years earlier. In the region, in 2010, based on preliminary data, construction of single-family homes, as measured by the number of building permits issued, totaled about 23,700 homes, an increase of 3,000 homes, or 14 percent, from a year earlier. Recent construction activity is far below the 2004-through-2008 average, when nearly 59,000 single- family homes a year were permitted in the region. During 2010, in both Colorado and North Dakota, single-family construction was up 26 percent, to 9,100 and 2,100 homes permitted, respectively, and, in Utah, single-family con - struction was up 14 percent, to 7,200 homes permitted. Building activity fell in Wyoming, however, where con-struction of single-family homes declined 11 percent, to 1,400 homes permitted.
Rental market conditions were balanced to tight in most areas of the Rocky Mountain region in the fourth quarter of 2010. Demand for rental units has increased as more households have shifted from owner to renter occupancy, and apartment construction has not kept pace with rising demand. According to data from Apartment Insights, published by Apartment Appraisers & Consultants, in
the fourth quarter of 2010, the apartment market in the Denver-Aurora area was balanced to tight, with a 5.4- percent vacancy rate, which was down from 7.5 percent a year earlier. During the fourth quarter of 2010, conditions were tight in Fort Collins-Loveland, where the apartment vacancy rate was 4.1 percent, down from 6.3 percent a year earlier. In Colorado Springs, the vacancy rate fell from 7.5 to 6.8 percent during the same period, and con ditions are currently balanced. The Grand Junction rental market is currently soft, however. According to the Colorado Division of Housing, in the third quarter of 2010 (the most recent data available), the rental vacancy rate in Grand Junction was 7.9 percent, up from 7.1 per-cent a year earlier; this increase was a result of recent job losses. Rental markets in the major metropolitan areas of Utah have tightened in the past year and are now generally balanced. According to Reis, Inc., in Salt Lake City, in the fourth quarter of 2010, the apartment vacancy rate was 6.9 percent, down from 7.4 percent a year earlier. In Ogden- Clearfield, the apartment vacancy rate fell from 6.6 to 5.3 percent during the same period. The Fargo rental market is balanced. According to Appraisal Services, Inc., in Fargo, during the fourth quarter of 2010, the apartment vacancy rate was 5.7 percent, which was essentially unchanged from a year earlier.
The tighter rental markets have contributed to a rise in monthly rents in many areas. According to data from Apartment Insights, the average effective apartment rent in the Denver-Aurora metropolitan area for the fourth quarter of 2010 was about $860 compared with $830 a year earlier, a 4-percent increase. In Fort Collins-Loveland, during the same period, the average apartment rent in - creased from $800 to $870, an increase of 8 percent. In Colorado Springs, rents were up 2 percent, to about $710. According to data from Reis, Inc., monthly rents in major metropolitan areas of Utah were up just slightly. In Salt Lake City, in the fourth quarter of 2010, the average effective rent was about $710, compared with $700 a year earlier. In Ogden-Clearfield, the average effective rent increased from about $655 to $665 during the same period.
Multifamily construction activity in the Rocky Mountain region, based on preliminary data, slowed in 2010, as a total of 8,300 units were permitted, which is a decline of 12 percent from the previous year. Construction of multifamily units remains well below the 2004-through- 2008 levels, when an average of more than 15,000 units were permitted annually in the region. In Colorado, multifamily construction was up 27 percent, to about 2,700 units permitted, because of increased apartment construction in areas such as Fort Collins-Loveland. And multifamily building activity more than doubled in Montana, to about 700 units permitted, due to increased apartment construction in areas such as Missoula. Build-ing activity was down significantly, however, in Utah and South Dakota, where multifamily construction fell by 39 and 48 percent, to 2,200 and 600 units permitted, respectively, because of a steep decline in apartment con- struction in areas such as Salt Lake City and Sioux Falls.

Regional Activity 48
Employment losses in the Pacific region, which started in 2008, continued throughout 2010 on an annual average basis but at a slower pace. During 2010, nonfarm payrolls averaged nearly 18 million jobs, reflecting a decline of 270,900 jobs, or 1.5 percent, compared with a decline of 1.2 million jobs, or 6.3 percent, during 2009. Employment in the construction sector was down 108,200 jobs, or 12.6 percent, because of job losses in both residential and commercial construction. The manufacturing sector was down 47,700 jobs, or 3.2 percent, continuing a 3-year trend. During 2010, the wholesale and retail trade sector was down 43,400 jobs, or 1.5 percent. The education and health services sector was the only sector to grow in the region, adding 38,600 jobs, or 1.7 percent. The federal government subsector added an additional 10,600 jobs, or 3 percent.
During 2010, all four states in the region had nonfarm job losses. In California, nonfarm payrolls declined by 212,600 jobs, or 1.5 percent, to average 13.9 million jobs. The construction sector alone lost 72,900 jobs, or 11.9 percent. Southern California and the San Francisco Bay Area had job declines of 130,200 jobs, or 1 percent, and 65,900 jobs, or 2 percent, respectively. In Hawaii, non-farm payrolls decreased by 1,900 jobs, or 0.3 percent, to average 589,600 jobs. The main source of job losses in Hawaii in 2010 was the construction sector, which declined by 1,600 jobs, or 5 percent. The leisure and hos - pitality sector, which had the largest job losses in 2009, gained 1,800 jobs in 2010 because of a 16-percent, or $11.4 billion, increase in tourism. In Arizona, in 2010, nonfarm payrolls decreased by 22,000 jobs, or 0.9 percent, to average 2.4 million jobs. The construction sector and local government subsector declined the most, by 14,300 jobs, or 11.1 percent, and 7,400 jobs, or 2.6 percent, respec-tively. The education and health services sector added 10,200 jobs, which was an increase of 3.1 percent. In Nevada, nonfarm payrolls decreased by 34,500 jobs, or 3 percent, to average 1.1 million jobs. The completion of the $3.9 billion Cosmopolitan of Las Vegas hotel/casino complex resulted in the loss of several thousand construction jobs. The more than 2-percent increase in tourism did not prevent additional job cuts in the leisure and hospitality sector. The construction and the leisure and hospitality sectors declined by 19,500 jobs, or 23.9 percent, and 5,700 jobs, or 1.8 percent, respectively. The average unemployment rate in the region increased from 11.1 percent during 2009 to 12 percent during 2010. Un-employment rates in the region ranged from 6.5 percent in Hawaii to 14 percent in Nevada in 2010.
The sales housing markets in most of the Pacific region were soft because of high unemployment rates. Hawaii, with a moderate unemployment rate, was the only state in the region that had a balanced sales housing market. During 2010, according to Hanley Wood, LLC, the number of new and existing single-family homes sold totaled approximately 15,700 homes, an 8-percent increase com - pared with the number of homes sold during 2009. During 2010, the average single-family home sales price increased by 7 percent to $391,600. Although foreclosure sales in-creased from 8 percent of all existing sales in 2009 to 14 percent in 2010, this rate is still significantly lower than foreclosure rates in the rest of the region, which range from 43 percent in California to 60 percent in Nevada. In the Honolulu area, during 2010, 9,900 homes sold, a 5-percent increase compared with the number sold during 2009. The average single-family home sales price increased 11 percent to $438,400.
In California, the home sales market softened in 2010. According to Hanley Wood, LLC, the number of new and existing single-family homes sold totaled approximately 432,500, a 7-percent decrease compared with the number of homes sold during 2009. During 2010, the average single-family home sales price increased by 5 percent to $277,800. Foreclosure sales as a percentage of total existing sales decreased from 47 percent in 2009 to 43 percent in 2010. In the San Francisco Bay Area, during 2010, 83,300 homes sold, which was a 6-percent decrease compared with the number sold during 2009. During 2010, the aver - age home sales price increased by 6 percent to $368,100. In the Southern California area, the number of homes sold decreased by 6 percent, to 235,500 homes, but the average home sales price increased 6 percent, to $235,500.
The home sales markets also softened in both Arizona and Nevada in 2010. According to Hanley Wood, LLC, Arizona foreclosure sales increased from 51 percent of all existing home sales in 2009 to 57 percent in 2010. Nevada foreclosure sales declined from 67 percent of all existing home sales in 2009 to 60 percent in 2010. Ac-cording to Hanley Wood, LLC, 113,500 new and existing homes sold in Arizona during 2010, which was a 14-percent decline compared with the number sold during 2009. The average home sales price declined by 2 percent, to $139,500. In the Phoenix area, new and existing home sales declined by 9 percent, to 92,700. Even though sales declined, the average home price increased by 1 percent, to $138,700. In Nevada, 59,200 new and existing homes sold in 2010, a decline of 10 percent compared with the number sold during 2009, and the average home sales price decreased 3 percent, to $143,000. In Nevada in 2010, approximately 80 percent of all new and existing home sales occurred in the Las Vegas area. In Las Vegas, from 2009 to 2010, sales decreased by 12 percent, to 47,400 homes. During that same period, the average home price decreased from $142,200 to $139,600.
According to Lender Processing Services Mortgage Performance Data, in the region in December 2010,
PacificHUD Region IX

Regional Activity49
the number of homes 90 or more days delinquent, in foreclosure, or in REO (Real Estate Owned) decreased by 114,800 homes, or 17 percent, to 683,400 homes compared with the number of homes during December 2009. This level represents a current rate of 10.2 percent of all loans in the region in December 2010 compared with a rate of 12.1 percent in December 2009. The national rate in December 2010 was 8.3 percent.
The rate of new home construction, as measured by the number of single-family building permits issued, was mixed in the Pacific region during 2010. Based on prelimi-nary data, 41,300 single-family homes were permitted, a 4-percent decrease compared with the number of permits issued in 2009. In Nevada, the only state in the region that had an increase in single-family permits in 2010, single-family permits increased by 800, or 18 percent, to total 5,400 homes permitted. During 2010, the number of single-family homes permitted decreased in Arizona by 2,100 permits, or 17 percent, to 10,400; in California by 200 permits, or 1 percent, to 23,700; and in Hawaii by 100 permits, or 5 percent, to 1,900.
As of the fourth quarter of 2010, rental markets, in general, were balanced in California and tight in Hawaii. The San Francisco Bay Area rental market was balanced. According to Reis, Inc., from the fourth quarter of 2009 to the fourth quarter of 2010, the apartment rental vacancy rate decreased from 5.8 to 4.5 percent in Oakland, from 5.1 to 3.8 percent in San Jose, and from 4.8 to 4.3 percent in San Francisco. In both San Francisco and San Jose, average rents increased 3 percent to $1,858 and $1,531, respectively. The Oakland average rent increased 1 per - cent to $1,345. In Sacramento, in the fourth quarter of 2010, the rental vacancy rate was 6.2 percent, down from 7.3 percent in the fourth quarter of 2009, but average rents increased more than 1 percent to $926. From the fourth quarter of 2009 to the fourth quarter of 2010, ac-cording to Reis, Inc., the Honolulu apartment vacancy rate decreased from 3.3 to 2.8 percent, and average rents decreased 2 percent, to $1,315, even with the low vacancy rate. The low level of apartment construction during the past 10 years was the main reason for Honolulu’s declining vacancy rate.
The major rental market in Southern California remained balanced during 2010. From the fourth quarter of 2009 to the fourth quarter of 2010, Reis, Inc., reported that the apartment rental vacancy rates decreased throughout Southern California. During this period, Riverside and San Bernardino Counties had the largest declines in rental vacancy rates, down from 8 percent to 6.5 percent. Rental vacancy rates in Orange and San Diego Counties declined from 6.4 to 5.4 percent and from 4.9 to 4.1 per cent, respectively. In both Los Angeles and Ventura Counties, rental vacancy rate declined from 5.3 to 4.9 percent. Reis, Inc., recorded the average rent in Southern California at $1,372 in the fourth quarter of 2010, unchanged from the fourth quarter of 2009.
Although still soft, the rental housing markets in both Arizona and Nevada showed improvement. According to Reis, Inc., the Phoenix apartment vacancy rate was 9.7 percent in the fourth quarter of 2010, down from the 12.3-percent rate recorded in the fourth quarter of 2009, but the average rent, at $750, remained the same as the average rent in 2009. Reis, Inc., reported that, during the same period, the apartment vacancy rate in the Las Vegas apartment market decreased from 11.2 to 9.1 per-cent, and the average rent decreased 3 percent, to $804, during this same period.
Multifamily construction activity, as measured by the number of multifamily units permitted, increased in three of the four states in the Pacific region. In 2010, based on preliminary data, permits for 21,600 multifamily units were issued in the region, a 60-percent increase compared with the number of units permitted in 2009. In 2010, apartments represented more than 81 percent of the multifamily construction activity, mainly because of the decline in rental vacancy rates throughout the region. In Arizona, California, and Hawaii, during 2010, the number of multifamily units permitted totaled 1,600, 17,400, and 1,500, respectively, reflecting a 15-, 88-, and 49-percent increase compared with the number permitted during 2009. Only Nevada had a decline in the number of multifamily units permitted in 2010; 1,000 multifamily units were permitted, which is a decline of 1,200 units, or 53 percent, from 2009.
Nonfarm payrolls in the Northwest region averaged 5.3 million jobs during 2010, a decline of 39,400 jobs, or 0.7 percent, compared with the number recorded during 2009, when 279,500 jobs were lost, which was a 5-percent decline from 2008. In Washington, during 2010, nonfarm payrolls averaged 2.8 million jobs, down 22,100 jobs, or 0.8 percent. In Oregon, nonfarm payrolls declined by 15,100 jobs, or 0.9 percent, which brought nonfarm pay-roll jobs to a total of 1.6 million. Idaho lost 4,800 jobs, or 0.8 percent, resulting in an average of 605,300 nonfarm payroll jobs. Alaska was the only state in the region that gained jobs during 2010, with nonfarm payrolls up by 2,600 jobs, or 0.8 percent, to average 323,800 jobs.
Nonfarm payroll gains during 2010 in the region occurred primarily in the education and health services sector, which added 15,700 jobs, a 2.2-percent increase. Employ-ment in this sector increased by 9,200 jobs in Washington, 3,900 jobs in Idaho, 1,700 jobs in Alaska, and 900 jobs in Oregon.
NorthwestHUD Region X

Regional Activity 50
Nonfarm payroll declines in the region during 2010 were led by job losses in the construction and manufacturing sectors. Payrolls in the construction sector were down by 34,000 jobs, or 12 percent, largely because of declines in commercial and multifamily residential construction. Payrolls in the construction sector decreased in Wash-ington by 20,700 jobs, or 13 percent; in Oregon by 8,000 jobs, or 11 percent, and in Idaho by 5,100 jobs, or 15 per - cent. In Alaska, some commercial construction minimized losses in the construction sector to just 200 jobs, a decline of 1.1 percent. Payrolls in the manufacturing sector de-clined by 13,300 jobs, or 2.7 percent, in the region during 2010. Losses in the manufacturing sector payrolls totaled 8,300 jobs, or 3.1 percent, in Washington; 5,500 jobs, or 3.3 percent, in Oregon; and 800 jobs, or 1.5 percent, in Idaho. In Alaska, payrolls in the manufacturing sector gained 1,400 jobs, up nearly 11 percent, mainly because of hiring in the oil industry. Because of the job losses registered during 2010 throughout the region, the aver-age regional unemployment rate increased from 9.4 to 9.6 percent. The unemployment rate, which increased in every state in the region, ranged from 8.1 percent in Alaska to 10.6 percent in Oregon.
Sales housing market conditions in the Northwest region remained soft during 2010, a trend that started in 2008. In Washington, according to data from Hanley Wood, LLC, during 2010, the number of new and existing single- family homes sold totaled approximately 74,700 homes, a 5-percent decrease compared with the number of homes sold during 2009. The average new and existing single-family home sales price decreased by 1 percent, to $288,500, during 2010. In the Seattle metropolitan area, during 2010, 30,500 homes sold, which was a 3-percent decrease compared with the number sold during in 2009. The average home sales price in the Seattle metropolitan area decreased 1 percent, to $388,700. In the Tacoma metro-politan area, the number of homes sold decreased by 6 percent, to 9,450 homes, and the average home sales price decreased 5 percent, to $235,100.
In Oregon, during 2010, according to data from Hanley Wood, LLC, the number of new and existing single-family homes sold totaled approximately 43,900 homes, a 2-percent decrease compared with the number of homes sold during 2009. The average new and existing single-family home sales price decreased by 5 percent, to $232,600, during 2010. During 2010, in the Portland-Vancouver-Beaverton, Oregon-Washington metropolitan area, the number of new and existing homes sold totaled 27,200, down 4 percent compared with the number sold during 2009, and the average home sales price decreased 3 percent, to $262,200. Based on data from Hanley Wood, LLC, in Idaho, during 2010, new and existing homes sales increased by 3 percent, to 28,400 homes, but the average home sales price decreased 7 percent, to $169,500. For the same period, in the Boise metropolitan area, new and existing home sales totaled 15,000 homes, a 6-percent increase compared with total home sales during 2009,
largely because the average home sales price declined by 8 percent, to $164,900.
In Alaska, during 2010, the number of new and existing homes sold decreased by 17 percent, to 7,400 homes, but the average price increased 3 percent to $261,000, according to data from Hanley Wood, LLC. Market conditions were only slightly soft in Anchorage during the same period, with a 4-percent decline in the number of new and existing homes sold, down to a total of 6,300; the average price rose 3 percent to $271,500.
In the Northwest region, the number of foreclosures increased by 4.9 percent between December 2009 and December 2010, due to higher levels recorded in Washing-ton. According to Lender Processing Services Mortgage Performance Data, the percentage of mortgage loans 90 or more days delinquent, in foreclosure, or in REO (Real Estate Owned) increased from 5.6 to 6.2 percent in Washington. The rate remained relatively stable, at 5.6 percent, in Oregon, but it declined from 7 to 6.6 percent in Idaho and from 3.2 to 2.8 percent in Alaska. All these rates remained below the national average of 8.3 percent.
New single-family home construction activity, as measured by the number of permits issued, increased in 2010, after a 3-year declining trend, but this increase was largely based on gains in Washington. Based on preliminary data, 20,900 homes were permitted in the region, an increase of 1,420 homes, or 7 percent, compared with the number permitted during 2009. In Washington, 12,150 single-family building permits were issued in 2010, accounting for a gain of 1,760 homes permitted compared with the number permitted during 2009. In Oregon and Alaska, during 2010, home permit activity rose by 85 and 140 homes to total 750 and 4,880 homes permitted, respec-tively, when compared with the number permitted during 2009. In Idaho, during 2010, homebuilding activity decreased by 570 homes, to 3,150 homes permitted.
Multifamily construction activity, as measured by the number of units permitted, increased in the Northwest region during 2010. Based on preliminary data, the number of units permitted in the region totaled 6,960, up 23 per-cent, or 1,320 units, from the number of units permitted during 2009. In Washington, during 2010, the gain in multifamily building activity totaled 1,480 units, up 46 percent, for a total of 4,160 units permitted. Nearly all of the units permitted in Washington were for the Seattle metropolitan area, where tight rental market conditions have caused renewed interest in apartment development. In Alaska, during 2010, the number of multifamily units permitted declined by 150 units, to 150 units, compared with the number permitted during 2009. In Idaho and Oregon, during 2010, the number of multifamily units remained relatively unchanged from a year earlier, at 575 units and 1,565 units, respectively.
Rental housing market conditions were balanced to tight throughout much of the Northwest region during 2010,
Regional Activity51
because of declining or flat rents and reduced levels of apartment production. According to fourth quarter 2010 data from Reis, Inc., the apartment rental vacancy rate in the Seattle metropolitan area was 5.8 percent, down from the 7.3-percent rate recorded in the fourth quarter of 2009. During the fourth quarter of 2010, the average asking rent for apartments in the Seattle metropolitan area was $1,035, up 3 percent from the average asking rent a year earlier. In the fourth quarter of 2010, in the Tacoma metropolitan area, the apartment vacancy rate was 6 percent, down from 8.1 percent a year earlier. The decline in vacancies can be attributed to the return of roughly 18,000 troops to Fort Lewis from Iraq during the summer of 2010. For the fourth quarter of 2010, the average asking rent in Tacoma was $765, up approximately 3 percent from the fourth quarter of 2009. During the fourth quarter of 2010, in the Spokane metropolitan area, according to data from Reis, Inc., the apartment vacancy rate fell to 5.3 percent, down from approximately 6.5 percent in the fourth quarter of 2009, but the average asking rent of approximately $640 was up 1 percent.
In the Portland-Vancouver-Beaverton metropolitan area, rental housing market conditions were balanced as of the fourth quarter of 2010. According to Reis, Inc., the apart-ment vacancy rate was 5.7 percent, down from 7 percent in the fourth quarter of 2009. The average asking rent increased 2 percent, to $840, up from $820 in the fourth quarter of 2009. In the Boise metropolitan area, during the fourth quarter of 2010, rental housing market conditions were soft, with an apartment vacancy rate of 8.4 percent, up from 8 percent recorded in the same quarter a year earlier; the average asking rent was nearly $695, unchanged from the fourth quarter of 2009. In Anchorage, as of the fourth quarter of 2010, rental market conditions were tight, with an estimated apartment vacancy rate of 2.0 percent, which was essentially un changed from the rate recorded in the fourth quarter of 2009. The average asking rent was nearly $1,015, up 5 percent from the asking rent a year earlier. Continued job growth combined with a relatively low level of apartment construction contributed to the tight rental market conditions in the Anchorage area.
HUD’s 10 regions are grouped as follows:• Region I, New England: Connecticut, Maine,
Massachusetts, New Hampshire, Rhode Island, and Vermont.
• Region II, New York/New Jersey: New Jersey and New York.
• Region III, Mid-Atlantic: Delaware, District of Columbia, Maryland, Pennsylvania, Virginia, and West Virginia.
• Region IV, Southeast/Caribbean: Alabama, Florida, Georgia, Kentucky, Mississippi, North Carolina, Puerto Rico/U.S. Virgin Islands, South Carolina, and Tennessee.
• Region V, Midwest: Illinois, Indiana, Michigan, Minnesota, Ohio, and Wisconsin.
• Region VI, Southwest: Arkansas, Louisiana, New Mexico, Oklahoma, and Texas.
• Region VII, Great Plains: Iowa, Kansas, Missouri, and Nebraska.
• Region VIII, Rocky Mountain: Colorado, Montana, North Dakota, South Dakota, Utah, and Wyoming.
• Region IX, Pacific: Arizona, California, Hawaii, and Nevada.
• Region X, Northwest: Alaska, Idaho, Oregon, and Washington.

Regional Activity 52
Condo minium home sales in the metropolitan area increased to 540 units, or 24 percent, in 2010 compared with sales in 2009; however, sales remained 38 percent below the peak of 870 units sold in 2005. The median sales price for condominiums in Chittenden County was $197,900 in 2010, up 3 percent from the median price in 2009, but down 2.5 percent from the peak median sales price of $202,900 in 2007. As home sales and median home sales prices have started to increase, foreclosure rates have remained among the lowest in the country. According to Lender Processing Services Mortgage Per - formance Data, from December 2009 to December 2010, the number of loans that were 90 days or more delinquent, in foreclosure, or in REO (Real Estate Owned) decreased from 3.7 to 3.3 percent. This rate compares with 8.3 per-cent nationwide.
Single-family homebuilding activity, as measured by the number of building permits issued, has started to increase, reversing a downward trend that began in 2004. Based on preliminary data, during the 12 months ending November 2010, single-family homebuilding permits were issued for 250 homes, up from 200 homes permitted during the previous 12 months. In compari-son, between 2003 and 2007, an average of 620 homes were permitted annually. Heatherfield Townhomes, an 83-unit community in South Burlington, is scheduled for completion in February 2011, with prices on the remaining units ranging from $339,500 to $354,500. The price for a typical new single-family home in Chittenden County ranges from $350,000 to $425,000.
The rental market in the metropolitan area is extremely tight because of limited new additions to the inventory and growing student demand. According to data from Allen & Brooks Associates, Inc., the apartment vacancy rate in Chittenden County for December 2010 was 1.4 percent, down from 2.7 percent a year earlier. Although The University of Vermont, Champlain College, and Saint Michael’s College together have added 2,600 dor-mitory beds since 2000, the undergraduate student popu-lation of The University of Vermont alone increased by nearly 3,000 during that time. Nearly 5,000 undergradu-ates of the university live off campus and account for an estimated 10 percent of renters in the metropolitan area. As of September 2010, the most recent data available, the average effective rent for a two-bedroom unit was $1,000. Overall, rents increased by nearly 2 percent com-pared with rents recorded in September 2009.
Based on preliminary data, during the 12 months ending November 2010, the number of multifamily units per-mitted declined to 250 units compared with 300 units permitted during the previous 12 months. From 2004 to 2007, an average of 430 multifamily units were permitted annually. The Bacon Street Lofts in South Burlington, a 42-unit apartment complex, is under construction and scheduled to open in mid-2011. Rents for studios, one-bedroom, and two-bedroom units are expected to start at $950, $1,450, and $1,575, respectively.
Housing Market Profiles
Burlington-South Burlington, VermontThe Burlington-South Burlington metropolitan area com-prises Chittenden, Franklin, and Grand Isle Counties along Lake Champlain in Northwest Vermont and extends to the Canadian border. According to Moody’s Analytics, Inc., the leading employers include IBM Cor-poration, Fletcher Allen Health Care, and The Univer-sity of Vermont, with approximately 5,400, 5,375, and 3,225 employees, respectively. Based on data from The University of Vermont’s Office of Institutional Studies, the university has a direct economic impact of more than $400 million a year statewide. The estimated popu-lation of the area, as of January 1, 2011, was 211,261, accounting for nearly 35 percent of the state population. Since July 1, 2008, the population has grown by 1,025, or 0.5 percent, annually. The recent growth is greater than it was in the previous 4 years, when the population increased by an average of 650, or 0.3 percent, annually.
Nonfarm payroll jobs in the metropolitan area have declined since 2008, but job losses have slowed signifi-cantly in recent months. During the 12 months ending November 2010, nonfarm payrolls declined by 2,200 jobs, or 2 percent, to 108,900 jobs, compared with the previous 12-month decline of 3,100 jobs, or 2.8 percent. The larg-est job decreases occurred in the retail trade subsector and manufacturing sector, which lost 900 and 600 jobs, or 6.1 and 4.8 percent, respectively. In 2010, however, Dealer.com, a website and online marketing solutions provider for the automotive industry, added 170 jobs in the metropolitan area. The education and health services and the government sectors, which account for 18 and 19 percent of nonfarm payrolls, respectively, each gained 200 jobs, or 1 percent, during the 12 months ending November 2010. During the same period, the average unemployment rate was 5.4 percent, down from the 6.1-percent rate recorded a year earlier.
The home sales market in the metropolitan area is some-what soft, but the number of home sales is beginning to increase. Based on data from the Vermont Property Transfer Tax System, the number of new and existing residential home sales totaled 1,875 in 2010, a 14-percent increase compared with the 1,650 homes sold in 2009. Sales are down 46 percent, however, from the 2004 peak year of 3,450 homes sold and down 23 percent from the average of 2,450 homes sold during the past 5 years. The median sales price for residential homes in Chittenden County, which accounts for more than 75 percent of recent home sales, increased by nearly 4 percent in 2010, to $251,500, compared with the median price in 2009. The median home sales price, however, remained 2 per-cent below the peak median price of $257,250 in 2007.

Regional Activity53
Cincinnati-Middletown, Ohio- Kentucky-IndianaThe Cincinnati-Middletown metropolitan area, which encompasses 15 counties in the states of Ohio, Kentucky, and Indiana, is the largest metropolitan area in Ohio and the 24th largest metropolitan area in the United States. As of December 1, 2010, the population of the metro-politan area was estimated at 2.1 million, an increase of 10,750, or 0.5 percent, annually since July 2008. Because of job losses that began in 2008, population growth has slowed considerably from an average annual increase of 22,950, or 1.1 percent, recorded from July 2005 through July 2007. Approximately 40 percent of the population in the metropolitan area resides in Hamilton County, Ohio, which includes the city of Cincinnati. According to the Cincinnati USA Regional Chamber, five compa-nies employ more than 10,000 people in the area: The Kroger Co., The University of Cincinnati, The Procter & Gamble Company, Cincinnati Children’s Hospital Medical Center, and Health Alliance Greater Cincinnati.
Nonfarm payrolls in the metropolitan area began to decline in 2008, after nearly 5 years of growth. The decline con-tinued during the 12 months ending November 2010, when total nonfarm payrolls decreased by 12,500 jobs, or 1.3 percent, to 985,700, after declining by 4.5 percent during the previous 12 months. Job losses were widespread during the 12 months ending November 2010, with non- farm payrolls declining in most sectors. The largest rates of decline occurred in the financial services and the mining, logging, and construction sectors, which fell by 5.6 and 5 percent, or 3,600 and 2,000 jobs, respectively, because construction and financing of new homes in the area slowed. The largest overall decrease occurred in the trade sector, which fell by 5,800 jobs, or 3.6 percent. The only sector to add jobs during the 12 months ending November 2010 was the education and health services sector, which grew by 2,400 jobs, or 1.7 percent. Almost all of the growth in this sector occurred within the healthcare and social assistance subsector, which accounts for 4 of the 10 larg-est employers in the area. Reflecting overall job losses during the 12 months ending November 2010, the unem-ployment rate increased from 9.1 to 9.9 percent, which is well above the average unemployment rate of 5 percent recorded from 2000 through 2008.
Sales market conditions in the Cincinnati-Middletown metropolitan area are slightly soft. The sales vacancy rate is currently estimated to be 2 percent, down slightly from the 2.3-percent rate reported in the 2009 American Community Survey. Recent job losses and tight mort-gage lending standards have combined to reduce demand for single-family homes. Based on data from Terradatum, a real estate analysis company, during the 12 months ending November 2010, approximately 1,275 new and existing homes were sold in the four largest counties in the metropolitan area: Butler, Clermont, Hamilton, and Warren Counties in Ohio. This figure represents an
11-percent decline from the 1,425 homes sold during the previous 12-month period. During the 12 months ending November 2010, the median sales price declined 3 percent to $120,000 in the same four counties, and the level of unsold housing inventory increased slightly from a 9-month supply to a 10.4-month supply. According to Lender Processing Services Mortgage Performance Data for November 2010, 7.8 percent of the total loans in the metropolitan area were 90 or more days delinquent, in foreclosure, or in REO (Real Estate Owned), unchanged from the rate recorded in November 2009.
Home construction activity, as measured by the number of single-family building permits issued, declined in the area as demand for new homes remained below levels recorded earlier in the decade. In 2010, according to pre - liminary data, permits were issued for 2,700 single-family homes, which is a decline of 13 percent compared with the number of permits issued in 2009, and it is approx-imately 70 percent below the average of 8,750 homes permitted annually from 2000 through 2007. After peaking at 10,950 homes permitted in 2004, single-family home construction activity has steadily declined for 6 consecu-tive years. Despite the decline in homebuilding activity, several smaller subdivisions of 25 to 50 homes are cur rently under construction or in development in the metropolitan area. New three-bedroom, two-bathroom single-family homes start at approximately $140,000 in Cincinnati and the surrounding townships, and new two- and three-bedroom condominiums start at $100,000.
Production of new multifamily units has declined signifi cantly since 2009 as the economy weakened and population growth slowed. According to preliminary data, in 2010, approximately 350 multifamily units, mostly apartments, were permitted, down 15 percent from the 410 units permitted in 2009. From 2000 through 2008, approximately 2,050 multifamily units were permitted annually. Condominiums account for slightly less than 15 percent of all multifamily units in the metropolitan area, which is similar to the percentage of multifamily units permitted for condominiums since 2000. Since 2008, the percentage of multifamily units intended for owner occupation has declined because the sales market has softened. Among multifamily projects currently under construction is Current @ The Banks, a 300-unit apart-ment complex with rents starting at $800. The complex, located at The Banks, an 18-acre mixed-use development on the Ohio River in downtown Cincinnati, is expected to be completed in the spring of 2011, along with approx-imately 80,000 square feet of retail space, restaurants, and parking.
The rental market in the Cincinnati-Middletown metro-politan area is currently balanced. As builders in the metropolitan area have reduced production levels in the past 2 years, the excess supply of vacant available units has begun to be absorbed, and rental market conditions have improved. According to Reis, Inc., in the third quar-ter of 2010, the apartment vacancy rate in the Cincinnati

Regional Activity 54
market area, which includes 9 of the 15 counties in the metropolitan area, was 6.9 percent, down from 7.7 per-cent in the third quarter of 2009. By comparison, from 2003 through 2008, apartment vacancy rates in the area averaged 8.4 percent. According to Reis, Inc., in the third quarter of 2010, the average effective apartment rent increased from approximately $670 to $680, or 1 percent, when compared with the rents recorded during the third quarter of 2009. From 2003 through 2008, effective rents increased by an average of 2 percent annually.
Dallas-Plano-Irving, TexasThe Dallas-Plano-Irving metropolitan division encom-passes eight counties in northeast Texas, including the core counties of Collin, Dallas, and Denton, and is adjacent to the Fort Worth metropolitan division. As of December 1, 2010, the population of the metropolitan division was estimated at 4.5 million, up 144,600 from July 1, 2009. Since the beginning of 2006, the population of the metropolitan division has increased at an average rate of about 110,500, or 2.6 percent, annually compared with about 85,600, or 2.4 percent, annually between 2000 and 2005.
Located on the boundary between the Dallas and Fort Worth metropolitan divisions is the Dallas/Fort Worth International Airport. According to a study by the Texas Department of Transportation, the airport is the third busiest in the world for number of flights and eighth bus-iest for number of passengers. The airport provides more than 305,000 direct and indirect jobs, with annual payrolls totaling in excess of $7.6 billion. Leading employers in the metropolitan division include Wal-Mart Stores, Inc., with 32,800 employees; Texas Health Resources Inc., with 18,000 employees; and AT&T, with 16,600 employees. In June 2008, AT&T moved its headquarters from San Antonio to downtown Dallas, bringing approximately 700 executive jobs to the area.
The economic downturn that began in the first quarter of 2008 appears to be turning around. During the 12 months ending November 2010, nonfarm payrolls averaged 2 million, a decrease of 1,675 jobs, or 0.1 percent, compared with the number of jobs recorded for the previous 12 months. Despite a decline in the 12-month average, nonfarm pay-rolls for the 3-month average ending November 2010 are up 1.3 percent compared with payrolls during the same 3-month period a year earlier, indicating the beginning of recovery. During the 12 months ending November 2010, gains of 14,300, 9,850, and 7,100 jobs, or 6.0, 3.0, and 2.7 percent, were recorded in the education and health services, professional and business services, and govern-ment sectors, respectively. Gains in the education and health services sector were led by an increase of 11,000 jobs in the healthcare and social assistance industry while gains in the professional and business services sector were led by an increase of 6,500 jobs in administrative
and support services. Growth in the government sector is attributed to hiring in the local government, which added 5,300 jobs. Job losses occurred primarily in the mining, logging, and construction and the manufacturing sectors, which lost 10,400 and 6,150 jobs, or 9.3 and 5.1 percent, respectively. During the 12 months ending November 2010, the average unemployment rate in the metropolitan division was 8.3 percent, an increase from the 7.5-percent rate recorded a year earlier. New compa-nies are moving to the area, including Solera, a leading global provider of software and services for automobile claims, which is expected to create up to 750 jobs within 5 years, and Tribune Company, a media company, which is expected to create 200 jobs in the first quarter of 2011 in Denton County.
Sales housing market conditions in the Dallas-Plano-Irving metropolitan division are soft, but one submarket is balanced. Although the sales vacancy rate in the metropolitan division is high, at 2 percent, the Denton County submarket, north of Dallas, is balanced, with a vacancy rate of 1.6 percent. According to data from the Real Estate Center at Texas A&M University, during the 12 months ending November 2010, total home sales decreased by about 8 percent to 58,750 compared with 63,700 homes sold during the previous 12 months. By comparison, home sales averaged 77,800 annually from 2003 through 2008. The average home sales price in the metropolitan division was $215,800, up nearly 5 percent compared with the average price during the previous 12 months but still below the peak of $221,400 reached in March 2008. During the 12 months ending November 2010, the average sales price for new and existing homes in Collin and Denton Counties was $246,100 and $196,700, up 3.2 and 2.7 percent, respectively, compared with prices recorded during the previous period. According to Lender Processing Services Mortgage Performance Data, in November 2010, 5.3 percent of total loans in the met-ropolitan division were 90 or more days delinquent, in foreclosure, or in REO (Real Estate Owned), down from 6.1 percent in November 2009.
After a 2-year decline in single-family home construction, builders increased activity during the past year. According to preliminary data, during the 12 months ending Nov-ember 2010, building permits were issued for 9,700 new single-family homes, up 15 percent from the preceding 12 months. Collin County had 4,200 homes permitted, or 43 percent of the area total. Single-family home construc-tion remains well below the 2000-to-2006 period, when an average of 27,900 homes were permitted annually. According to data from CB Richard Ellis, since 2007, almost 6,200 townhomes and condominiums have been constructed. In the metropolitan division, approximately 1,500 condominiums are under construction, including 640 in Dallas County, 480 in Collin County, and 380 in Denton County. Currently, 90 percent of the condomini-ums in the metropolitan division are in Dallas County.

Regional Activity55
Rental market conditions have improved in the Dallas-Plano-Irving metropolitan division, but remain soft be-cause of the flat economy. According to data from ALN Systems, Inc., for the 12-month period ending November 2010, the apartment vacancy rate was 9.7 percent compared with 13.1 percent a year earlier. During the 12 months ending November 2010, the Collin County apartment vacancy rate was 9.3 percent, down from 12.2 percent during the previous 12 months. During the 12 months ending November 2010, average rents declined 2 percent to $890. The Denton County submarket also remained soft, with vacancy rates and average rents at 10 percent and $800, respectively, unchanged from the previous 12 months. The vacancy rate for apartments in Dallas County was 12 percent and the average rent was $790, relatively unchanged compared with the rate and rent during the previous 12-month period.
Because of soft rental housing market conditions in the metropolitan division, multifamily construction activity, as measured by the number of units permitted, has declined significantly. According to preliminary data, during the 12 months ending November 2010, approximately 3,900 multifamily units were permitted, a decline of 18 percent compared with the number of units permitted during the preceding 12 months. In comparison, about 11,900 multifamily units were permitted annually from 2006 through 2008. Apartment projects, which represent about 60 percent of all multifamily units currently under con -struction, include Brick Row apartments, a 500-unit mixed-use property, and Savoy at Vitruvian Park 2, a 350-unit property; both are expected to be completed in late 2011. The rents in these developments will start from $840 for a one-bedroom unit and $1,100 for a two-bedroom unit.
Grand Rapids, MichiganThe Grand Rapids metropolitan area, located in south-western Michigan, consists of Barry, Ionia, Kent, and Newaygo Counties. As of January 1, 2011, the population of the metropolitan area was estimated at 780,900, an increase of approximately 2,000, or 0.3 percent, in 2010. Since 2006, population growth has averaged 2,275, or 0.3 percent, annually, with all gains resulting from net natural change (resident births minus resident deaths), because net out-migration averaged 4,450 people annu-ally. The leading employer in the metropolitan area is Spectrum Health, a provider of hospital and medical care, which employs 16,100 people, followed by grocery and general merchandise chain Meijer Inc., which em-ploys 7,425 people. Grand Rapids has historically been known for furniture manufacturing. Although manu-facturing employment declined in 2010, two furniture-manufacturing companies continue as major employers in the area. Steelcase Inc. and Herman Miller, Inc., rank number three and number six among top employers in the metropolitan area and employ 4,800 and 3,800 people, respectively.
During 2010, nonfarm payrolls declined by approximately 3,400, or 0.9 percent, to 359,500 jobs, which is 7 percent below the 386,800 nonfarm payroll jobs reported, on av-erage, between 2004 and 2008. From 2006 through 2009, an average of 6,825 jobs, or 0.4 percent, was lost annually. The largest declines during 2010 were in the manufactur-ing sector, which lost 1,900 jobs, or 3.3 percent, includ-ing 300 manufacturing jobs lost in three mass layoffs at Steelcase Inc., Butterball Farms, and CompX Durislide. On January 12, 2011, Steelcase Inc. announced the planned closing of a plant in Kentwood, which is expected to eliminate 400 additional manufacturing jobs in the metro-politan area. The mining, logging, and construction sector and the trade sector declined by 1,200 jobs each, or 8.5 and 2.1 percent, respectively. Increases were reported in some service-providing sectors, including gains of 1,100 jobs, or 1.8 percent, in the education and health services sector, and 600 jobs, or 1.1 percent, in the professional and business services sector. Investment in healthcare services has been a priority in the metropolitan area, as reflected by the January 2011 opening of the $286 million Helen DeVos Children’s Hospital and the completion of the $90 million Secchia Center, a medical education fa-cility affiliated with Michigan State University. Together, these new healthcare facilities support approximately 1,125 new jobs downtown. The average unemployment rate in the metropolitan area increased from 10.9 percent in 2009 to 11.3 percent in 2010.
The sales housing market in the Grand Rapids metro-politan area is soft, with an estimated vacancy rate of 2.7 percent as of January 1, 2011, due to the continued weak economy. According to the Grand Rapids Association of REALTORS®, in 2010, new and existing home sales declined 9 percent to 9,350 compared with the number sold in 2009; this number is well below the 13,450 sales reported annually, on average, from 2003 through 2005, the peak sales years in the decade. In 2010, the average sales price increased almost 7 percent, to $114,700, as prices started returning to previous levels, which aver-aged $153,400 between 2003 and 2005. In 2010, condo-minium sales increased 22 percent, to 890, compared with sales in the previous year, but the average sales price for condominiums declined 4 percent, to $120,500. According to Lender Processing Services Mortgage Per-formance Data, during 2010, an average of 8.1 percent of total loans were 90 or more days delinquent, in foreclo-sure, or in REO (Real Estate Owned), up from an average of 7.8 percent of homes during 2009.
Despite the soft sales market in the Grand Rapids metropo- litan area, single-family homebuilding activity, as measured by the number of building permits issued, increased in 2010. According to preliminary data, in 2010, approx-imately 860 homes were permitted, indicating an increase of almost 9 percent from the 790 homes permitted in 2009. This level of single-family home construction is significantly lower than the 1,700 homes permitted, on average, from 2006 through 2008. Newly constructed

Regional Activity 56
homes start at approximately $100,000. Current develop-ments in the metropolitan area include the Trent Ridge community in Cedar Springs, with 41 building lots and home prices starting at $100,000, and Trail Side in Rock-ford, Michigan, with 41 building lots and home prices starting at $165,700.
Reflecting the slow economy, rental development has been minimal, with no multifamily rental units permit-ted in 2010 and only 190 units permitted in 2009, for a continuing care retirement community. From 2006 through 2008, approximately 520 rental units were permitted annually. Completed in the fall of 2009, the 210-unit Stone Falls of Ada is a new general-occupancy rental property, with rents ranging from $930 for a one-bedroom unit to $1,725 for a three-bedroom unit.
Because of the lack of new supply in the market, rental market conditions are tightening but remain slightly soft. The rental vacancy rate in the Grand Rapids metro-politan area is estimated at 8.5 percent, down from 9 per-cent a year earlier. In the third quarter of 2010, according to Reis, Inc., the apartment market was tighter, with a vacancy rate of 5.5 percent and an average monthly rent of $660 compared with a vacancy rate of 6.1 percent and an average monthly rent of $655 during the third quarter of 2009. Current concessions in this market include re-duced or waived security deposits and 50 to 100 percent off 1 month’s rent with a 13-month lease. In downtown Grand Rapids, the rental market is tighter, with an esti-mated vacancy rate of approximately 5 percent. Several downtown apartment properties have opened in the past 5 years, advertising one-bedroom units from $1,000 to $1,300 and two-bedroom units from $1,300 to $1,750.
Honolulu, HawaiiThe Honolulu metropolitan area is defined as the island of Oahu, which consists of Honolulu County, the most populous county in the state of Hawaii. Downtown Honolulu is Hawaii’s financial center, while nearby Waikiki, located on the southern shore of Oahu, draws millions of visitors each year. As of December 1, 2010, the population of the metropolitan area totaled 916,600, an increase of approximately 4,500, or 0.5 percent, com-pared with the December 1, 2009, population estimate. The rate of population growth has remained relatively unchanged during the past 4 years. Since 2007, net out-migration has averaged 2,000 a year compared with 2,725 annually from 2000 through 2005.
Although economic conditions remain weak, the economy of the metropolitan area is stabilizing because of increased tourism and a strong military presence. Nonfarm pay-rolls decreased by 400 jobs, or 0.1 percent, to an average of 438,200 jobs during the 12 months ending November 2010 compared with the number of jobs recorded during the previous 12 months. By comparison, payroll declines
averaged 3.3 percent during the 12 months ending Nov-ember 2009. During the past 12 months, the leisure and hospitality sector was one of the few sectors to record job growth, with the addition of 1,700 jobs, a 2.8-percent increase. Growth in this sector is attributed to hiring at several hotels, including Hilton Hotels, the largest private-sector employer in the area, with 6,400 employ-ees. According to the Hawaii Tourism Authority, Oahu accounted for 4.1 million visitors, who spent $5.1 billion in 2009, which represents declines of 4 and 11 percent, respectively, from 2008 levels. As of the first quarter of 2010, the Oahu Economic Development Board reported an increase in the number of visitors and amount of expenditures of nearly 5 percent compared with data from the first quarter of 2009. Equally vital to the local economy, the U.S. Department of Defense has annual expenditures of $6.8 billion statewide, according to the Hawaii Chamber of Commerce Military Affairs Council, 90 percent of which is estimated to be in Honolulu. Government-sector jobs decreased less than 1 percent for the 12 months ending November 2010 compared with the number of jobs for the previous period. Increases in federal and local government jobs partially made up for a decline in state government employment of 2,000 jobs due to budget deficits. As job losses began to stabilize, the unemployment rate remained flat at 5.6 percent dur-ing the 12 months ending November 2010.
Home sales market conditions in the Honolulu metro-politan area are slightly soft due to the recent economic downturn but appear to be improving. Home sales began to increase in Honolulu during the 12 months ending November 2010, following 4 years of decline, but remained well below the decade-high average of 4,575 homes sold annually from 2003 through 2005, based on the Honolulu Board of REALTORS® data. Approximately 2,975 exist-ing single-family homes were sold during the 12 months ending November 2010, up nearly 15 percent from the 2,600 homes sold during the 12 months ending Novem-ber 2009. During the same period, the median home sales price decreased nearly 1 percent to $585,000. Condo-minium sales, which represent approximately 56 percent of existing home sales, increased by 390 units to 3,875 units sold during the past year, while the median condo-minium sales price increased by more than 1 percent to $315,000. Despite the recent increase, condominium sales remained well below the average of 7,600 units sold annually from 2003 through 2005. According to Lender Processing Services Mortgage Performance Data, as of November 2010, the percentage of mortgage loans 90 days or more delinquent, in foreclosure, or in REO (Real Estate Owned) in the metropolitan area was 5.6 percent, unchanged from the rate recorded in Nov ember 2009.
Homebuilding activity, as measured by the number of single-family building permits issued, has increased slightly in the metropolitan area in response to recovering home sales. Based on preliminary data, for the 12 months ending November 2010, 880 homes were permitted, an increase

Regional Activity57
of 4 percent compared with the number permitted during the previous 12 months. In comparison, during the peak years of 2003 through 2005, an average of 2,325 single-family homes a year were permitted in the metropolitan area. D.R. Horton is currently offering single-family homes on the southwest side of Oahu at Kahiwelo at Makakilo. New homes at Makakilo range in price from $560,000 for starter homes to nearly $700,000 for larger, luxury homes.
Rental market conditions in the Honolulu metropolitan area are currently balanced. According to Reis, Inc., as of the third quarter of 2010, the apartment vacancy rate was 3.3 percent, a slight decrease from the 3.5-percent rate recorded in the third quarter of 2009. The average monthly contract rent was $1,300 as of the third quarter of 2010, which is unchanged from the third quarter of 2009. Apartment rents in the area averaged $1,100 for a one-bedroom unit, $1,350 for a two-bedroom unit, and $1,675 for a three-bedroom unit.
The construction of multifamily units increased sub-stantially to 990 units during the 12-month period ending November 2010 compared with 240 units constructed during the previous 12-month period, based on prelimi-nary building permit data. For the 12 months ending November 2010, condominiums accounted for approxi-mately 20 percent of the multifamily units permitted, down from an average of 45 percent of the multifamily units permitted annually from 2005 through 2009. Con-struction activity in 2008 and 2009 slowed dramatically to an average of 230 units permitted annually compared with the average of 1,425 units permitted annually from 2005 through 2007. As of November 2010, several apart-ment projects are either under way or in the leasing stages. Franciscan Vistas Ewa, a 149-unit senior’s com-munity, is currently under construction, with an antici-pated completion date of May 2011. Rents at Franciscan Vistas Ewa are expected to be income restricted at $745 and $885 for one- and two-bedroom units, respectively. Seawind Apartments, a 50-unit affordable housing devel-opment in Waianae, is currently in lease up, with rents starting at $831.
Louisville-Jefferson, Kentucky- IndianaThe Louisville-Jefferson metropolitan area, which consists of 13 counties in Kentucky and Indiana that are separated by the Ohio River, has a population estimated at 1,267,000 as of January 1, 2011. Since July 2009, population growth has slowed to an annualized rate of 0.4 percent, reflecting declining job opportunities in the area, compared with an average annual rate of 1 percent a year from 2005 to 2008. Humana, Inc., is the largest private employer in the area, with about 8,700 employees, followed by the United Postal Service (UPS) Worldport II and UPS Supply Chain Solutions, with about 7,350 employees combined, and Ford Motor Company, with nearly 5,100 employees.
The largest public sector employer in the area is the Uni-versity of Louisville, with about 6,100 employees, 22,000 students, and an annual budget of nearly $950 million.
During 2010, average nonfarm payrolls declined by 7,100, or 1.2 percent, to 588,600 jobs. The largest payroll declines occurred in the manufacturing sector, which lost 3,500 jobs, or 5.4 percent, and in the mining, log-ging, and construction sector, which lost 2,600 jobs, or 8.5 percent. In December 2010, Ford Motor Company announced it would retool the Louisville Assembly Plant, furloughing 700 workers during the renovation. Ford is expecting to add 1,800 jobs at the facility when it reopens in 2011, although some jobs will be filled by furloughed workers. In addition, several other companies are investing a total of nearly $300 million in manufac-turing facilities that are expected to result in more than 1,300 new jobs by 2014.
The professional and business services and the educa-tion and health services sectors expanded by 2,300 jobs and 2,100 jobs, or 3.3 and 2.6 percent, respectively, during 2010. The education and health services sector represents about 14 percent of nonfarm payrolls in the area and is expected to continue to grow during the next several years because of recent and ongoing investments by the University of Louisville in research facilities and private-sector partnerships. Since October 2009, the uni-versity has invested $187 million in 338,000 square feet of research laboratory space. Recently, the University of Louisville Foundation announced plans to break ground in March 2011 on a $20 million, 160,000-square-foot first phase of the University of Louisville Foundation and Nucleus’ Haymarket Research Park, which will provide laboratory space to develop technology and con-duct scientific research. Completion of this first phase is expected in 2012; the entire project will take 30 years to complete and is expected to generate 8,700 skilled jobs in Louisville. The average unemployment rate during the 12 months ending November 2010 increased to 10.2 percent from 9.9 percent during the previous 12 months.
The sales housing market in the metropolitan area is somewhat soft because of job losses, with a current estimated vacancy rate of 2.2 percent, compared with 2.4 percent reported by the 2009 American Community Survey. According to Lender Processing Services Mort-gage Performance Data, in December 2010, the number of loans 90 or more days delinquent, in foreclosure, or in REO (Real Estate Owned) in the area decreased to 6.7 percent compared with 7.1 percent in 2009. The Greater Louisville Association of REALTORS® reported that, during 2010, about 10,200 new and existing single-family homes and 1,200 new and existing condominiums were sold, a decrease of 2 and 4 percent from 2009, respective-ly. During 2010, the median prices of new and existing single-family homes and condominiums sold increased by 4 percent to $140,000 and 5 percent to $124,500, res-pectively, compared with the prices recorded during 2009.

Regional Activity 58
Homebuilding activity, as measured by the number of building permits issued, remained relatively unchanged in the metropolitan area during 2010 compared with activity in 2009 because of the softer sales market. Based on preliminary data, during the 12 months ending Nov-ember 2010, about 2,100 permits were issued for single-family homes, 2 percent fewer than were issued during the previous 12-month period. Single-family homebuilding has declined by an average of 12 percent a year since the peak in 2004, when nearly 7,600 homes were permitted. From 2007 to 2009, about 3,050 single-family homes were permitted annually. New development includes Norton Commons, in northeast Jefferson County, which offers building lots for 2,100 single-family homes, with prices starting at $359,000, and 600 townhomes, with prices starting at $289,000.
Rental housing market conditions in the metropolitan area are balanced because of continued population growth and because no new apartments have entered the market since 2009. According to Reis, Inc., for the third quarter of 2010, the Louisville-Jefferson metropolitan area apart-ment vacancy rate was 5.8 percent, down from the 7-percent rate recorded during the third quarter of 2009. For the third quarter of 2010, average rent increased by about 1 percent to $621 compared with the rent during the third quarter of 2009. The University of Louisville housing office reports that, during the fall of 2010, the resident halls’ vacancy rate was at 2 percent compared with 5 percent during the fall of 2009. Students at the University of Louisville occupy a large portion of the local rental stock; more than 17,000 students live off campus. The university offers about 4,800 dormitory beds, both on campus and privately operated off campus, and plans to add about 2,250 units by 2020, including 350 that are currently under construction. During the third quarter of 2010, the West Central submarket, as defined by Reis, Inc., where the university is located, re-ported an 8.8-percent apartment vacancy rate, compared with a 9.2-percent rate recorded during the third quarter of 2009.
Based on preliminary data, during the 12 months ending November 2010, about 525 multifamily units were per-mitted, up from approximately 225 units permitted during the previous 12 months. In 2007, multifamily permits peaked at nearly 1,700 units, after averaging 1,150 units permitted a year between 2000 and 2006. In October 2010, construction began on a privately operated 350-bed student-housing complex located near and endorsed by the University of Louisville; completion is expected by the fall of 2011. In December 2010, the Society of St. Vincent de Paul began construction on 54 low-income housing tax credit units in Louisville, consisting of 30 apartments and 24 dormitory rooms.
Miami-Miami Beach-Kendall, FloridaLocated on the southeast coast of Florida, the Miami-Miami Beach-Kendall metropolitan division comprises Miami-Dade County. Known for its tropical climate and diverse population, Miami attracts more than 11.9 million domestic and foreign visitors annually. In 2009, according to the Greater Miami Convention and Visitors Bureau, tourism accounted for an estimated $16.5 billion in ex-penditures, representing a 3-percent decline from 2008.
As of January 1, 2011, the population of Miami-Dade County, the most populous county in Florida, is estimated at 2.5 million. During the past year, the population in-creased by an estimated 24,100, or 1 percent, relatively unchanged from the annual rate of growth recorded since 2008. Net natural change (resident births minus resident deaths) has accounted for approximately 72 percent of the population growth since 2007, because net in-migration has slowed significantly from levels in the first half of the decade because of increased unemployment. Since 2000, net in-migration to the area has primarily been from for-eign immigrants from the Caribbean and South America.
International trade is one of the most significant contrib-utors to the Miami-Dade County economy. In 2009, the Miami International Airport (MIA) ranked first in the country for international freight and second for interna-tional passengers. MIA and the general aviation airports have an annual economic impact of $26.7 billion on the local economy, contributing more than 282,000 jobs directly and indirectly. The Port of Miami, which serves as a major cruise terminal and gateway for commercial trade, contributes more than $17 billion annually and provides more than 176,000 local jobs. During the 12 months ending November 2010, the trade and the transportation and utilities sectors, which account for approximately 26 percent of all nonfarm payrolls, lost a total of 2,200 jobs, or 0.9 percent, because of continued low volumes of international shipping.
Employment in Miami-Dade County began declining in 2008 and continued to decrease during the past year, although at a slower rate. During the 12 months ending November 2010, nonfarm payrolls declined by 13,000 jobs, or 1.3 percent, to 976,500, a decline from the previous 12-month period. The struggling housing market con-tinued to affect the construction sector, which led the area in job losses, registering a decline of 4,150 jobs, or 11 percent, from the previous 12 months. Decreased de-mand for commercial and residential loans also affected the financial services industry. The financial activities sector lost 3,600 jobs, declining by 5.5 percent during the 12 months ending November 2010. As a result of the job losses, the average unemployment rate increased from 10.4 percent during the 12 months ending November 2009 to 12.4 percent during the past 12 months. During this same period, the only sector that gained jobs was the education and health services sector, which increased

Regional Activity59
by 3,600 jobs, or 2.4 percent, from the number of jobs recorded during the previous 12-month period. Baptist Health South Florida, the second largest employer, with 10,850 employees, is opening a new hospital, West Kendall Baptist Hospital, in the spring of 2011. This $160 million facility will have 130 beds and more than 500 physicians. Other leading employers include Publix Super Markets, Inc., and Jackson Health System, with 11,000 and 10,500 employees, respectively.
The weak economy has contributed to current soft conditions in the Miami-Dade County home sales market; however, during the past year, home sales have increased as a result of the now-expired homebuyer tax credit and because distressed sales brought prices down. According to the Florida Association of REALTORS®, during the 12 months ending November 2010, 7,200 existing single-family homes were sold compared with 6,500 sold during the previous 12 months, indicating an 11-percent increase. From November 2009 to November 2010, the median home sales price decreased by 7 percent from $184,800 to $171,500 During the 12 months ending November 2010, sales of existing condominiums increased significantly, totaling 9,550 units, an increase of 46 percent. The median condominium sales price decreased by 29 percent to $105,600. During 2010, Miami-Dade County continued to lead the state in foreclosures. According to Lender Processing Services Mortgage Performance Data, during November 2010, the percentage of total home loans 90 or more days delinquent, in foreclosure, or in REO (Real Estate Owned) was 27 percent, unchanged from November 2009.
Although improving, rental market conditions in Miami- Dade County are slightly soft. According to Reis, Inc., as of the third quarter of 2010, the apartment vacancy rate was 6 percent compared with 6.2 percent during the third quarter of 2009. During the third quarter of 2010, net absorption of apartment units increased to 500 units compared with a net move-out of approximately 400 units during the third quarter of 2009. The average asking rent was approximately $1,070, nearly unchanged from the third quarter of 2009. The South Beach sub-market, which has the largest apartment inventory in Miami, with approximately 15,650 units, reported the lowest vacancy rate of all submarkets. Because no new apartment developments have been completed since 2005, the vacancy rate has declined significantly, de-creasing from 5.6 percent in the third quarter of 2009 to 4 percent during the third quarter of 2010. During this same period, the average asking rent was $1,485, almost a 1-percent increase from the previous year.
Reacting to increased home sales activity and the tighten - ing apartment market during the past year, home builders increased residential construction activity, as measured by the number of units permitted. According to prelimi-nary data, during the 12 months ending November 2010, 940 single-family homes were permitted, an increase of 71 percent from the previous 12-month period. Single-
family home permitting peaked in 2005, when 9,925 homes were permitted. From 2005 to 2009, permitting levels declined by 2,325 homes, or 23 percent, annually. According to preliminary data, during the 12 months ending November 2010, multifamily construction more than doubled, with 2,200 units permitted compared with 960 units permitted during the previous 12 month-period. Condominiums, which accounted for approxi-mately 85 percent of multifamily units permitted from 2002 to 2006, currently represent less than 50 percent of all multifamily permits because of the current excess supply. The largest condominium project currently under construction is Capital at Brickell in South Beach. The $320 million mixed-use development will have 850 units ranging from $400,000 to $2,000,000. Completion is expected at the end of 2012.
Milwaukee-Waukesha-West Allis, WisconsinThe Milwaukee-Waukesha-West Allis metropolitan area, which consists of Milwaukee, Ozaukee, Washington, and Waukesha Counties, is the largest metropolitan area in the state, accounting for approximately 28 percent of the total population in Wisconsin. The principal city of Milwaukee is located 80 miles east of Madison, the state capital, and 90 miles north of Chicago, Illinois. As of January 1, 2011, the metropolitan area had an estimated population of approximately 1.57 million, an increase of 8,900, or 0.4 percent, at an annualized rate from the July 1, 2009, U.S. Census Bureau estimate. Since 2000, the population has grown at a similar rate, with net natural change (resident births minus resident deaths) account-ing for all of the population increase.
Economic conditions in the Milwaukee-Waukesha-West Allis metropolitan area remained weak in 2010 since first declining in August 2008. During the 12 months ending November 2010, nonfarm payrolls averaged 795,000 jobs, a decrease of 19,100 jobs, or 2.3 percent, compared with a decrease of 40,000 jobs, or 4.7 percent, during the 12 months ending November 2009. The larg-est declines were in the trade, manufacturing, and pro-fessional and business services sectors, which lost 5,800, 5,600, and 4,300 jobs, or 5.1, 4.8, and 4.1 percent, re-spectively. Partially offsetting these losses were gains in three sectors: education and health services, leisure and hospitality, and government. The education and health services sector added 2,200 jobs, or 1.5 percent, because of the completion of two new hospitals in Waukesha County. Aurora Medical Center in Summit opened in March 2010 and Aurora Medical Center in Grafton opened in November 2010, adding 800 and 600 jobs, respectively. In addition, in October 2010, Columbia St. Mary’s Hospital opened a new $417 million hospital in Milwaukee; job gains were nominal because it closed two hospitals. Dur-ing the 12 months ending November 2010, the leisure and hospitality sector added 2,100 jobs, an increase of

Regional Activity 60
3 percent. Government employment increased by 1,200 jobs, or 1.3 percent, due primarily to hiring in local government. The average unemployment rate increased to 8.6 percent during the 12 months ending November 2010 compared with 8.4 percent during the previous 12 months.
The sales housing market in the Milwaukee-Waukesha-West Allis metropolitan area is currently soft due to the weak economy. According to the Greater Milwaukee Association of REALTORS® (GMAR®), during 2010, the number of new and existing homes sold declined 13 per-cent to 11,500 compared with 13,250 new and existing homes sold in 2009. During 2010, the average number of days a home remained on the market was relatively unchanged at 106, but the average unsold inventory increased from a 9-month supply to an 11-month supply. The median sales price of new and existing homes in the metropolitan area increased about 1 percent, from $173,600 to $176,000. Local REALTORS® reported higher levels of home sales in the city of Milwaukee and the inner ring suburbs bordering the city of Milwaukee compared with the rest of the metropolitan area because of the relatively affordable home prices. According to the GMAR®, in 2010, in Milwaukee County, the median sales price of a home was $136,500, or 5 percent lower than median prices in 2009. According to data from Lender Processing Services Mortgage Performance Data, as of November 2010, the percentage of mortgage loans 90 or more days delinquent, in foreclosure, or in REO (Real Estate Owned) in the Milwaukee-Waukesha-West Allis metropolitan area was 7 percent, down from 7.3 percent in November 2009.
In the past year, builders have increased the volume of single-family home construction, as measured by the number of building permits issued. For the 12 months ending November 2010, according to preliminary data, the number of single-family homes permitted increased 11 percent from 880 to 980 compared with the number permitted during the previous 12 months. The current level of single-family construction activity is down from an average of 2,350 units permitted annually between 2006 and 2007 and well below the 3,625 units permitted annually between 2000 and 2005.
Multifamily housing construction, as measured by the number of units permitted, has also increased. During the 12 months ending November 2010, the number of multifamily units permitted rose by 50 percent, from 525 to 1,025, with about one-half to be constructed in Milwaukee County and the remainder in Waukesha County. Multifamily construction activity is down from an average of 1,425 units permitted between 2006 and 2007 and well below the 2,250 units permitted annually between 2000 and 2005.
The Milwaukee-Waukesha-West Allis metropolitan area rental housing market is currently balanced. As of the third quarter of 2010, according to Reis, Inc., the apartment
vacancy rate remained flat at 5 percent compared with rates in the third quarter of 2009; in addition, the aver-age market rate rent increased by more than 1 percent to $795. Recently completed properties in Milwaukee include Corcoran Lofts, a 76-unit loft community, with rents averaging about $1,025 for a studio, $1,500 for a one-bedroom unit, and $1,925 for a two-bedroom unit. Currently under construction and scheduled for completion in 2013, the 203-unit Moderne Apartments development has rents ranging between $1,400 and $4,600 for one-, two-, and three-bedroom units. In November 2010, the City of Oconomowoc gave final approval for Meadows at Prairie Creek, a $25 million mixed-income, 352-unit development, which will set aside 20 percent of the units for households earning 60 percent of the Area Median Income.
Missoula, MontanaThe Missoula metropolitan area consists of Missoula County in western Montana. As of January 1, 2011, the population of the metropolitan area was estimated to be 110,000, which reflected an annual increase of about 900, or 0.8 percent, for the past 2 years. From 2004 to 2008, population growth averaged about 1,700 a year, or 1.7 percent annually, but growth has slowed in the past 2 years because of slower in-migration. From 2004 to 2008, net in-migration to the metropolitan area averaged nearly 1,200 a year, but in the past 2 years the rate de-clined to about 400 a year due to slower job growth. The largest employer in the metropolitan area is the Univer-sity of Montana (UMT), with approximately 2,400 full- and part-time employees. With a fall 2010 enrollment of nearly 16,000 students, the university’s estimated state-wide economic impact is more than $1 billion a year, based on a 2010 UMT study. Other leading employers include St. Patrick Hospital and Health Sciences Center and the Community Medical Center, with about 1,600 and 1,100 employees, respectively.
Economic conditions in the Missoula metropolitan region improved during the 12 months ending Novem-ber 2010, ending a 2-year period of job losses. For the 12 months ending November 2010, nonfarm payrolls averaged about 56,300, an increase of about 600 jobs, or 1.1 percent, from the previous 12 months. In late 2007, nonfarm payrolls peaked at 57,500 jobs but fell an aver-age of 1.1 percent a year in 2008 and 2009 because of the national recession and falling demand for furniture and manufactured wood products, which accounted for about one-third of manufacturing employment before the recession. The job losses in 2008 and 2009 were largest in the construction and manufacturing sectors, which declined by about 650 and 400 jobs, or 20 and 16 percent, respectively. Nonfarm payrolls began to expand again at a moderate pace in early 2010. Much of the growth in the 12 months ending November 2010 was in the education and health services and the professional

Regional Activity61
and business services sectors, which increased by 200 and 100 jobs, or 2.2 and 1.6 percent, respectively, from a year earlier. For the 12 months ending November 2010, the unemployment rate averaged 6.9 percent, up from 5.7 percent a year earlier.
The home sales market in the Missoula metropolitan area is currently somewhat soft, partly because of tight lending standards, but prices are beginning to stabilize. According to Hanley Wood, LLC, in the 12 months end-ing November 2010, sales of single-family homes were down 15 percent from the previous 12 months, to about 1,200 homes sold. Single-family home sales peaked in 2005 and 2006, when an average of 2,100 homes a year were sold. For the 12 months ending November 2010, the average sales price for existing single-family homes was about $236,900, up 1 percent from $234,700 in the previous 12 months. Single-family home prices are down 12 percent from the peak of $277,000 in 2007. The fall in prices since 2007 is partly because of an increase in the number of home foreclosures. Based on data from Hanley Wood, LLC, sales of foreclosed and REO (Real Estate Owned) properties currently account for 19 percent of single-family home sales in the area, up from 2 percent in 2007.
As a result of the soft home sales market, construction of single-family homes, as measured by the number of building permits issued, has declined. According to pre-liminary data, during the 12 months ending November 2010, about 180 single-family homes were permitted, down 12 percent from the 210 permitted during the pre-vious 12 months. By contrast, from 2003 through 2007, single-family home construction in the area averaged about 450 homes a year. According to Hanley Wood, LLC, during the 12 months ending November 2010, the average sales price for a new home was about $183,500, down approximately 1 percent from a year earlier.
The rental market in the Missoula metropolitan area is currently tight, with an estimated 3.3-percent vacancy rate. The market has tightened gradually during the past 6 years because of population growth and a lack of new construction. Monthly rents currently average from about $600 for one-bedroom units to $750 for two-bedroom units and $1,000 for three-bedroom units. Rents have increased by nearly 4 percent a year for the past 2 years. Contributing to the tight rental market are the large and growing presence of UMT students, who represent more than 30 percent of renter households, and a relatively large population of young professionals, who tend to rent. Apartment construction has also lagged behind demand in recent years, based on the number of building permits issued, exacerbating the tight market conditions. Multi - family construction peaked in 2002 and 2003, when an average of 600 units a year were per mitted, many of which were off-campus student housing. From 2004 through 2008, multifamily construction slowed to an average of 150 units a year and then, in 2009, fell sharply to
fewer than 20 multifamily units permitted. In the past 12 months, however, building activity has rebounded. Based on preliminary data, about 180 multifamily units were permitted in the 12 months ending November 2010. Silvertip Apartments, a 115-unit complex targeted to low- and moderate-income households, is expected to break ground in 2011. Rents for the one- and two-bedroom units are expected to range from $455 to $840 a month.
New York City, New YorkNew York City (NYC), the financial center of the United States, includes the five counties of Bronx, Kings (Brook-lyn), New York (Manhattan), Queens, and Richmond (Staten Island). As of January 1, 2011, the population of the city, which is the largest in the nation, is estimated to be nearly 8.5 million. During 2010, the population increased by 55,000, or more than 0.6 percent, which is slightly higher than the 0.5-percent average annual increase during 2008 and 2009. The growth was due entirely to net natural increase (resident births minus resident deaths) of approximately 61,500 people in 2010, nearly unchanged during the past 3 years. Although international immigration to the city averaged 58,200 people a year during the past 3 years, the average net out-migration was 38,200 people a year, because more than 96,400 residents moved out of NYC.
Economic conditions in NYC show signs of improving. Although job losses continued during the past year, ex-tending a trend that began in early 2009, the pace of decline has slowed. During the 12 months ending Nov-ember 2010, nonfarm payrolls decreased by 26,600 jobs, or 0.7 percent, which is significantly less than the loss of 95,400 jobs, or 2.5 percent, that occurred during the 12 months ending November 2009. Fewer job losses encour-aged more people to enter the labor force seeking jobs, which increased the unemployment rate from 9.2 to 9.7 percent during the 12 months ending November 2010.
Although total nonfarm payrolls continued to decline, growth occurred in education and health services, the largest employment sector, the leisure and hospitality sector, and the other services sector. The education and health services sector increased by 15,200 jobs, or 2.1 percent. That increase was more than offset by job losses in the government, financial activities, and professional and business services sectors of 18,300, 8,600, and 7,100 jobs, or 3.2, 2.0, and 1.2 percent, respectively. City workers were laid off because of budget cuts, which accounted for the decrease in the government sector, including a loss of 20,500 jobs, or 4.4 percent, in the local government subsector. During the 12 months ending November 2010, job losses in the financial activities and professional and business services sectors dropped to less than one-third of the declines that occurred during the 12 months end-ing November 2009. Despite weak economic conditions, according to the city, the number of leisure travelers to

Regional Activity 62
NYC increased by nearly 7 percent to 48.7 million. Hotel occupancy rates remained at approximately 90 percent in December 2010, comparable to rates of a year earlier, according to the Federal Reserve Board’s Beige Book. During the 12 months ending November 2010, the leisure and hospitality sector added 6,800 jobs, or 2.2 percent, and the other services sector increased by 3,275 jobs, or 2 percent.
The New York City home sales market remains slightly soft, although it strengthened during 2010. According to Prudential Douglas Elliman Real Estate, during 2010, ex-isting condominium and cooperative (co-op) home sales in Manhattan, Brooklyn, and Queens totaled 29,900 homes, which is an increase of 20 percent compared with the number sold during the previous year but 9 percent be-low the number recorded during 2008. During 2010, the average number of days a home remained on the market declined by 33 days to 113 days. During the same period, the average home sales price in NYC rose by 9 percent, from $727,100 to $791,300. In Manhattan, the median sales price for a co-op unit increased by nearly 9 percent, to $685,000, but prices for condominium units rose by less than 1 percent, to $997,900, compared with prices in 2009. The upper tier of the market remained strong, with the median sales price for luxury homes in the top 10 percent of condominium and co-op sales prices in-creasing by 15 percent, to nearly $4.4 million. The New York State Association of REALTORS, Inc.®, reports that, in Staten Island, the median price of an existing single-family home increased 2 percent from $380,500 to $388,000 during the 12 months ending November 2010, the most recent data available. According to Lender Processing Services Mortgage Performance Data, as of December 2010, 8.2 percent of total loans in NYC were 90 or more days delinquent, in foreclosure, or in REO (Real Estate Owned), up from 8.1 percent a year earlier.
Although economic conditions in NYC continue to be weak, building permits for single-family homes, which represent less than 10 percent of construction, increased; however, the number of permits issued for multifamily units decreased. During the 12 months ending Novem-ber 2010, the number of single-family homes permitted rose by 7 percent, to 330 units, compared with the num - ber permitted during the previous 12-month period, based on preliminary data. During the 12 months ending Nov-ember 2010, based on preliminary data, multifamily construction activity for the number of units permitted, declined by 4 percent, to 5,475 units, compared with the number permitted during the 12 months ending November 2009. Condominium and co-op units account for 7 percent of multifamily units currently under way, less than the average of 17 percent of multifamily units built between 2000 and 2009. Multifamily construction, which peaked during the 12 months ending June 2008, when 42,250 permits were issued, averaged 23,500 units annually from 2007 to 2009.
The NYC rental market is tight, although vacancy rates rose slightly during 2010 as demand eased because of job declines. According to Reis, Inc., from the third quarter of 2009 to the third quarter of 2010, the apartment vacancy rate for NYC increased from 2.9 to 3.6 percent. The highest vacancy rate of 7.1 percent was reported in the Midtown West area of Manhattan, an increase from the 2.7-percent rate recorded a year earlier, which occurred because of the completion of 1,750 apartments. In the Upper West Side of Manhattan and in Brooklyn, vacancy rates rose to 4.3 and 3.5 percent, as 450 and 580 units, respectively, were constructed. In the third quarter of 2010, average rents increased by nearly 5 per-cent, to $1,480, in Brooklyn and by less than 1 percent, to nearly $1,400, in Queens. In the Bronx, the average rent decreased by 1 percent to $1,140. Rents increased throughout Manhattan, reversing a decline that occurred during the third quarter of 2009. The largest rent gain—more than 5 percent—occurred in the Stuyvesant/Turtle Bay area, where rents increased to $3,620; in the Upper East Side, they increased nearly 3 percent, to approxi-mately $3,640. The highest average rents in NYC were in the Upper West Side, at nearly $4,100, and downtown Manhattan, at $3,860, with both increasing by almost 2 percent during the past year.
Progress continues on the New Housing Marketplace Plan, which has a 10-year goal of creating 165,000 afford-able housing units in the city by 2014. As of the fall of 2010, nearly 108,600 affordable housing units had been preserved or constructed. Recently completed affordable units include 323 units at Courtlandt Corners in the Bronx and 87 units at New Lots Plaza in Brooklyn. Developments currently under construction include the 168-unit Elliott Chelsea development, located in Manhattan, and 920 Westchester Avenue, which has 110 units and is located in the Bronx. The Bradford, a 105-unit mixed-use complex in Brooklyn, will be com-pleted in the summer of 2011.
Pittsburgh, PennsylvaniaLocated in southwestern Pennsylvania, the Pittsburgh metropolitan area comprises seven counties. Once the largest center for steel manufacturing in the nation, Pittsburgh has emerged as the healthcare and education center for western Pennsylvania and parts of the Ohio River Valley. With a total estimated population of 2.3 million as of January 1, 2011, Pittsburgh is the second-most populous metropolitan area in Pennsylvania. During 2010, population growth was relatively flat compared with 2009, which is an improvement from the average annual decline of 9,200 people, or 0.4 percent, from 2000 through 2008, when net out-migration averaged nearly 6,000 people a year. Net in-migration, which averaged 2,700 persons a year from 2009 through 2010, led to a slower rate of population decline. Net in-migration has increased partly as a result of an increased number

Regional Activity63
of empty nesters and young professionals moving to recently redeveloped areas of the city. Remnants of the industrial riverfront and downtown area in the city of Pittsburgh have been transformed during the past 4 years into more than $600 million in residential and $1.5 bil-lion in commercial developments, including the $622 million Children’s Hospital of Pittsburgh that opened in May 2009.
During the 12 months ending November 2010, average nonfarm payrolls totaled 1.1 million, down 4,800 jobs, or 0.4 percent, compared with payrolls during the previous 12-month period. The largest payroll declines occurred in the manufacturing and financial activities sectors and the wholesale trade subsector, which lost 4,300, 1,100, and 1,300 jobs, respectively, or 4.8, 1.6, and 2.7 percent. Despite overall job losses, the education and health services sector, accounting for 20 percent of all nonfarm payrolls in the area, increased by 2,800 jobs, or 1.2 per-cent, during the 12 months ending November 2010. In addition, the retail trade and the mining and logging subsectors increased by 700 and 300 jobs, respectively. Accounting for more than one-half of the increase in payrolls in the mining and logging subsector, Range Resources, a natural gas producer, added more than 150 jobs during the past year and is currently constructing a regional facility that will double its employment to 500 by November 2011. During 2010, 16 companies with intentions of extracting natural gas from the Marcellus Shale field, a natural gas deposit spanning southern New York State through Pennsylvania and West Virginia to the western portion of Virginia, announced plans to add more than 1,200 jobs in Pittsburgh during the next 4 years. Employment in the education and health services sector is also expected to continue to increase. The University of Pittsburgh Medical Center (UPMC), the leading em-ployer in the metropolitan area, with 37,000 employees, is planning to add 500 jobs during 2011. Currently, UPMC is constructing a $258 million full-service hospital, UPMC East, to be completed in 2012, adding 400 jobs. Additional leading employers include West Penn Allegheny Health and the University of Pittsburgh, with 11,000 employees each. Despite job growth in several sectors, losses during the 12 months ending November 2010 resulted in the increase of the average unemployment rate to 8.3 percent from 7.2 percent during the previous 12 months.
The sales housing market in Pittsburgh is slightly soft, with an estimated vacancy rate of 1.9 percent as of January 1, 2011, resulting from employment declines and tighter mortgage lending standards. During the 12 months ending November 2010, the average home sales price for new and existing homes increased by 4 percent to $160,000 from $154,000 a year earlier, according to Hanley Wood, LLC. As prices increased, new and exist-ing home sales declined by 19 percent to 1,900 homes sold compared with the 2,350 sold during the previous 12-month period. Condominium sales accounted for
4 percent of total home sales, with 80 condominiums sold during the 12 months ending November 2010, which is unchanged from a year earlier. The average con-dominium price declined to $164,200 or 3 percent, from the $169,200 price recorded the previous year. According to Lender Processing Services Mortgage Performance Data, from November 2009 to November 2010, the number of loans that were 90 or more days delinquent, in foreclosure, or in REO (Real Estate Owned) decreased from 5.7 to 5.1 percent.
Despite weaker sales market conditions, home construc-tion activity, as measured by the number of single-family homebuilding permits issued, increased during 2010 but remained below the number constructed during 2008. According to preliminary data, during the 12 months end- ing November 2010, single-family homebuilding activity totaled 2,950 homes permitted, up 22 percent compared with the number permitted during the 12 months ending November 2009, but down 830 homes, or 26 percent, for the same period in 2008. Single-family home construction was strong from 2000 through 2006, with an average of 5,100 homes permitted annually, before declining to an average of 3,500 homes permitted annually from 2007 through 2009. Nearly 40 percent of all single-family home construction is concentrated in Allegheny County, where construction increased by 20 percent to 1,175 homes per-mitted, according to preliminary data for the 12 months ending November 2010. Prices for new, two-bedroom homes in Allegheny County start at $190,000.
Although economic conditions remain weak, the overall rental housing market, as of January 1, 2011, is balanced, with an estimated vacancy rate of 5.7 percent, which is unchanged from the previous year. According to Reis, Inc., the apartment vacancy rate declined from 5.5 to 5.0 percent in the third quarter of 2010 compared with vacancy rates in the third quarter of 2009, while the average asking rent increased less than 1 percent to ap-proximately $840. According to preliminary data, during the 12 months ending November 2010, multifamily construction activity, as measured by the number of units permitted, was virtually unchanged at 350 units permitted compared with the number permitted during the previous year. Multifamily construction was strong from 2000 through 2006, averaging 1,325 units permit-ted annually, before declining to an average of 430 units a year from 2007 through 2009. During the 12 months ending November 2010, approximately 95 percent of all multifamily construction consisted of apartments, which is equivalent to the period from 2000 through 2006, but represents an increase from 70 percent during 2007 through 2009, when condominium construction was higher. Approximately 50 percent of apartments currently under construction are concentrated in the city of Pittsburgh. During the past 4 years, apartment de-velopments within the city, which include conversions from existing manufacturing and commercial structures, have totaled nearly $400 million in redevelopment and
Regional Activity 64
added 970 new rental units to the market. Since 2009, commercial-to-apartment conversions include Market Square Place, a 46-unit complex; The Century Building, a 60-unit complex; and River Vue Apartments, a 218-unit complex that is still under construction. Average asking rents for newly constructed efficiency, one-bedroom, and two-bedroom apartments in the metropolitan area are $830, $1,150, and $1,600, respectively.
West Palm Beach-Boca Raton- Boynton Beach, FloridaLocated on the southeast coast of Florida, approximately 60 miles north of Miami, the West Palm Beach-Boca Raton-Boynton Beach metropolitan division consists of Palm Beach County. Tourism has a significant effect on the local economy. According to the Palm Beach County Convention and Visitors Bureau, in 2009, an estimated 4 million people visited Palm Beach County, generating an estimated economic impact of $2.8 billion. As of Jan-uary 1, 2011, the estimated population of the county was 1.3 million, an increase of about 13,300, or 1.3 per cent, in the past 12 months. Population growth has dramatically declined during the past 5 years because of the recent declines in employment. The population has increased at an average annual rate of about 5,800, or 0.5 percent, since the beginning of 2006 compared with nearly 25,500, or 2.2 percent, annually between 2000 and 2005. Leading employers in the area include Tenet Healthcare Corpora-tion, Hospital Corporation of America, and Florida Power & Light Company, with 5,100, 4,150, and 3,650 employ-ees, respectively.
Employment in the metropolitan division has continued a decline that began in September 2007, but at a slower pace. During the 12 months ending November 2010, nonfarm payrolls declined by 9,000 jobs, or 1.8 percent, to an average of 498,700 compared with the decline of 37,800 jobs, or 6.9 percent, during the previous 12 months. During the past 12 months, job losses occurred in every sector except the education and health services and the government sectors, which added 1,900 and 700 jobs, at gains of 2.4 and 1.0 percent, respectively. During the 12 months ending November 2010, primarily because of a decrease in building activity and tourism, the most significant losses occurred in the construction, financial activities, and leisure and hospitality sectors, which lost 5,400, 2,100, and 2,000 jobs, respectively, or 19.1, 5.8, and 2.9 percent. Residential construction, which comprises 65 percent of all construction, is down 30 percent compared with 11 percent for commercial construction. These job losses contributed to the increase in the 12-month aver-age unemployment rate, which rose from 10.4 to 12.0 percent, the highest level in more than 20 years.
The Palm Beach County home sales market is currently soft. Based on data from Reinhold P. Wolff Economic
Research, Inc. (Wolff), for the 12 months ending Sep-tember 2010, sales of existing single-family homes in the area totaled approximately 20,700, an increase of 48 percent compared with the 13,900 homes sold during the same period a year earlier. The increase in sales was part-ly a result of declining home prices. In the third quarter of 2010, the median sales price of existing homes de-creased by 20 percent to $156,400, down from $197,200 during the same quarter of the previous year, which was a decrease of 27 percent from the third quarter of 2008. For the 12 months ending September 2010, sales of new single-family homes totaled 790, a decrease of 11 percent from the number sold during the same period in the previous year. Sales of new single-family homes have been declining since 2003, when they peaked at more than 12,200 homes. In the past 12 months, nearly 40 percent of new home sales activity has been in the Boynton Beach submarket, which is located on the east-ern coast, 15 miles south of West Palm Beach, where the median home price is slightly higher than the median price in the county. Wolff data indicate that the median sales price for new homes in the county during the third quarter of 2010 was $383,100, 7 percent higher than the price recorded a year earlier but down significantly from the third quarter of 2005, when the median sales price was $506,800. According to Lender Processing Services Mortgage Performance Data, as of November 2010, 19.5 percent of total loans were 90 or more days delinquent, in foreclosure, or in REO (Real Estate Owned), relatively unchanged from 19.2 percent a year earlier, but up sub-stantially from 4.8 percent 2 years earlier and much higher than the Nov ember 2010 national rate of 8.3 per-cent, but similar to the state rate of 18.6 percent during the same period.
Builders have curtailed production as new home sales have declined and existing home sales have increased. Building permits, based on preliminary data, were issued for 1,250 single-family homes in Palm Beach County during the 12-month period ending November 2010. From 2007 through 2009, an average of 1,425 single-family homes was permitted annually, down significantly from 9,825 homes that were permitted annually from 2002 to 2006.
Since 2006, in Palm Beach County, sales of existing con-dominiums have increased significantly but sales of new condominiums have declined sharply, according to Wolff data. During the 12 months ending September 2010, about 12,250 existing condominiums were sold, an increase of about 60 percent compared with the number sold during the same period a year earlier, because the median sales price decreased by nearly 20 percent to $73,100. During the 12 months ending September 2010, the number of new condominiums sold decreased 58 percent to 430 units as the median sales price increased 15 percent to $225,000. Since the third quarter of 2005, the median sales price of new condominiums has increased less than 1 percent but the median sales price of existing condominiums has declined 61 percent from $186,800. The large price

Regional Activity65
differential between new and existing condominiums, which has occurred since 2005, has reduced demand for new condominiums and led to lower construction levels. Based on the 2009 American Community Survey, although nearly one-half of multifamily units in the county are owner occupied, only 10 percent of the 220 multifamily units permitted during the 12 months end-ing November 2010 are estimated to be owner-occupied units. The number of multifamily units permitted is down from an average of 750 units permitted annually from 2007 through 2009 and, more significantly, from 3,900 units permitted annually between 2000 and 2007. These decreases parallel the decline in new condominium sales, which averaged 3,350 a year between 2000 and 2007.
The rental market is currently improving but remains somewhat soft because of increased job losses. According to ALN Systems, Inc., the apartment vacancy rate, as of December 2010, was 7.6 percent, down from 8.7 percent a year earlier. In December 2010, the average effective rent was $1,025, up nearly 2 percent from the previous year. During the 12 months ending November 2010, 820 apartment units were completed, down from approximately 3,000 units completed during the previous 12 months. Between 2003 and 2006, nearly 15,000 apartments were converted to condominiums. Many of these units are now available as investor-owned rental units. Such reversions are anticipated to continue to occur and keep the rental supply high.

Regional Activity 66*Multifamily is two or more units in structure. Source: Census Bureau, Department of Commerce
Units Authorized by Building Permits, Year to Date: HUD Regions and States
HUD Region and State 2010 Through December 2009 Through December Ratio: 2010/2009
Through December
Single Multi- Single Multi- Single Multi- Family family* Family family* Family family*Total Total Total
Connecticut 3,765 2,546 1,219 3,343 2,043 1,300 1.126 1.246 0.938Maine 2,962 2,743 219 2,766 2,524 242 1.071 1.087 0.905Massachusetts 8,648 5,482 3,166 7,097 4,751 2,346 1.219 1.154 1.350New Hampshire 2,737 1,992 745 2,224 1,663 561 1.231 1.198 1.328Rhode Island 949 744 205 958 701 257 0.991 1.061 0.798Vermont 1,530 1,199 331 1,209 859 350 1.266 1.396 0.946
New England 20,591 14,706 5,885 17,597 12,541 5,056 1.170 1.173 1.164New Jersey 13,318 7,393 5,925 12,235 7,133 5,102 1.089 1.036 1.161New York 20,205 10,355 9,850 17,356 9,441 7,915 1.164 1.097 1.244
New York/New Jersey 33,523 17,748 15,775 29,591 16,574 13,017 1.133 1.071 1.212Delaware 3,076 2,672 404 3,140 2,655 485 0.980 1.006 0.833District of Columbia 671 119 552 1,148 164 984 0.584 0.726 0.561Maryland 12,183 8,403 3,780 11,085 7,975 3,110 1.099 1.054 1.215Pennsylvania 21,339 17,402 3,937 18,712 14,898 3,814 1.140 1.168 1.032Virginia 21,215 16,270 4,945 21,078 16,142 4,936 1.006 1.008 1.002West Virginia 1,673 1,465 208 1,966 1,714 252 0.851 0.855 0.825
Mid-Atlantic 60,157 46,331 13,826 57,129 43,548 13,581 1.053 1.064 1.018Alabama 10,233 8,126 2,107 12,171 8,660 3,511 0.841 0.938 0.600Florida 39,524 30,862 8,662 35,858 27,463 8,395 1.102 1.124 1.032Georgia 17,731 15,194 2,537 17,202 13,994 3,208 1.031 1.086 0.791Kentucky 6,844 5,411 1,433 6,878 5,470 1,408 0.995 0.989 1.018Mississippi 4,794 3,986 808 6,665 4,948 1,717 0.719 0.806 0.471North Carolina 33,728 26,002 7,726 33,785 25,042 8,743 0.998 1.038 0.884South Carolina 14,452 13,128 1,324 15,829 13,784 2,045 0.913 0.952 0.647Tennessee 16,325 11,655 4,670 14,574 11,766 2,808 1.120 0.991 1.663
Southeast/Caribbean 143,631 114,364 29,267 142,962 111,127 31,835 1.005 1.029 0.919Illinois 11,596 7,862 3,734 10,912 8,236 2,676 1.063 0.955 1.395Indiana 12,988 9,937 3,051 12,433 9,939 2,494 1.045 1.000 1.223Michigan 9,256 7,930 1,326 6,984 6,392 592 1.325 1.241 2.240Minnesota 9,656 6,794 2,862 9,255 6,827 2,428 1.043 0.995 1.179Ohio 13,509 10,606 2,903 13,135 10,554 2,581 1.028 1.005 1.125Wisconsin 11,834 7,906 3,928 10,818 8,035 2,783 1.094 0.984 1.411
Midwest 68,839 51,035 17,804 63,537 49,983 13,554 1.083 1.021 1.314Arkansas 6,905 4,340 2,565 6,637 4,235 2,402 1.040 1.025 1.068Louisiana 11,515 10,493 1,022 12,562 10,985 1,577 0.917 0.955 0.648New Mexico 4,511 3,984 527 4,649 4,147 502 0.970 0.961 1.050Oklahoma 8,267 6,981 1,286 8,845 7,445 1,400 0.935 0.938 0.919Texas 84,753 65,330 19,423 82,938 66,289 16,649 1.022 0.986 1.167
Southwest 115,951 91,128 24,823 115,631 93,101 22,530 1.003 0.979 1.102Iowa 7,312 5,863 1,449 7,130 5,407 1,723 1.026 1.084 0.841Kansas 4,523 3,725 798 6,837 3,652 3,185 0.662 1.020 0.251Missouri 8,260 5,992 2,268 8,346 5,754 2,592 0.990 1.041 0.875Nebraska 5,013 4,098 915 5,180 4,611 569 0.968 0.889 1.608
Great Plains 25,108 19,678 5,430 27,493 19,424 8,069 0.913 1.013 0.673Colorado 11,779 9,129 2,650 9,393 7,449 1,944 1.254 1.226 1.363Montana 2,196 1,516 680 1,745 1,441 304 1.258 1.052 2.237North Dakota 3,558 2,146 1,412 3,065 1,866 1,199 1.161 1.150 1.178South Dakota 2,913 2,298 615 3,529 2,434 1,095 0.825 0.944 0.562Utah 9,441 7,192 2,249 10,627 6,777 3,850 0.888 1.061 0.584Wyoming 2,126 1,395 731 1,975 1,293 682 1.076 1.079 1.072
Rocky Mountain 32,013 23,676 8,337 30,334 21,260 9,074 1.055 1.114 0.919Arizona 12,235 10,641 1,594 14,134 12,745 1,389 0.866 0.835 1.148California 43,128 24,724 18,404 33,811 24,568 9,243 1.276 1.006 1.991Hawaii 3,430 1,896 1,534 2,617 2,002 615 1.311 0.947 2.494Nevada 6,402 5,370 1,032 6,752 4,560 2,192 0.948 1.178 0.471
Pacific 65,195 42,631 22,564 57,314 43,875 13,439 1.138 0.972 1.679Alaska 904 753 151 912 613 299 0.991 1.228 0.505Idaho 4,584 4,010 574 5,292 4,598 694 0.866 0.872 0.827Oregon 7,302 5,737 1,565 7,686 5,606 2,080 0.950 1.023 0.752Washington 20,235 14,843 5,392 16,754 12,845 3,909 1.208 1.156 1.379
Northwest 33,025 25,343 7,682 30,644 23,662 6,982 1.078 1.071 1.100United States 598,033 446,640 151,393 572,232 435,095 137,137 1.045 1.027 1.104

Regional Activity67
*Multifamily is two or more units in structure. **As per new Office of Management and Budget metropolitan area definitions.Source: Census Bureau, Department of Commerce
Units Authorized by Building Permits, Year to Date: 50 Most Active Core Based Statistical Areas (CBSAs)** (Listed by Total Building Permits)
2010 Through December
CBSA CBSA Name Single Multifamily* Total Family
26420 Houston-Sugar Land-Baytown, TX 22,332 18,023 4,30919100 Dallas-Fort Worth-Arlington, TX 15,227 11,578 3,64935620 New York-Northern New Jersey-Long Island, NY-NJ-PA 13,248 5,359 7,88947900 Washington-Arlington-Alexandria, DC-VA-MD-WV 10,082 7,600 2,48231100 Los Angeles-Long Beach-Santa Ana, CA 8,055 3,053 5,00242660 Seattle-Tacoma-Bellevue, WA 7,490 4,770 2,72038060 Phoenix-Mesa-Scottsdale, AZ 6,652 5,994 65812060 Atlanta-Sandy Springs-Marietta, GA 6,121 5,182 93912420 Austin-Round Rock, TX 5,686 4,970 71637980 Philadelphia-Camden-Wilmington, PA-NJ-DE-MD 5,633 4,057 1,57641700 San Antonio, TX 5,274 4,228 1,04616980 Chicago-Naperville-Joliet, IL-IN-WI 5,213 3,315 1,89840140 Riverside-San Bernardino-Ontario, CA 4,917 4,076 84114460 Boston-Cambridge-Quincy, MA-NH 4,836 2,791 2,04516740 Charlotte-Gastonia-Concord, NC-SC 4,656 3,805 85126900 Indianapolis, IN 4,523 3,049 1,47445300 Tampa-St. Petersburg-Clearwater, FL 4,498 3,486 1,01241180 St. Louis, MO-IL 4,474 3,448 1,02629820 Las Vegas-Paradise, NV 4,400 3,850 55039580 Raleigh-Cary, NC 4,369 3,830 53912580 Baltimore-Towson, MD 4,361 2,757 1,60434980 Nashville-Davidson--Murfreesboro, TN 4,326 3,182 1,14436740 Orlando-Kissimmee, FL 4,198 3,410 78833460 Minneapolis-St. Paul-Bloomington, MN-WI 4,025 2,997 1,02833100 Miami-Fort Lauderdale-Miami Beach, FL 4,014 2,539 1,47519740 Denver-Aurora, CO 3,929 2,923 1,00621340 El Paso, TX 3,623 2,225 1,39818140 Columbus, OH 3,518 2,443 1,07538900 Portland-Vancouver-Beaverton, OR-WA 3,383 2,719 66441860 San Francisco-Oakland-Fremont, CA 3,360 1,719 1,64147260 Virginia Beach-Norfolk-Newport News, VA-NC 3,317 2,541 77627260 Jacksonville, FL 3,026 2,843 18340060 Richmond, VA 2,972 2,101 87141740 San Diego-Carlsbad-San Marcos, CA 2,930 1,751 1,17936420 Oklahoma City, OK 2,880 2,387 49330780 Little Rock-North Little Rock, AR 2,838 1,375 1,46332580 McAllen-Edinburg-Mission, TX 2,616 2,215 40122180 Fayetteville, NC 2,608 1,257 1,35117140 Cincinnati-Middletown, OH-KY-IN 2,574 2,327 24717900 Columbia, SC 2,542 2,092 45038300 Pittsburgh, PA 2,482 2,212 27016700 Charleston-North Charleston, SC 2,444 2,195 24919820 Detroit-Warren-Livonia, MI 2,288 1,761 52741620 Salt Lake City, UT 2,163 1,500 66332820 Memphis, TN-MS-AR 2,162 1,342 82012940 Baton Rouge, LA 2,142 2,028 11446140 Tulsa, OK 2,130 1,856 27440900 Sacramento--Arden-Arcade--Roseville, CA 2,127 1,753 37436540 Omaha-Council Bluffs, NE-IA 2,101 1,897 20419780 Des Moines, IA 2,002 1,561 441

Historical Data 68
Historical Data
3 and 4 5 Units North- Mid- Units or More east west
Exhibit 1. New Privately Owned Housing Units Authorized:* 1967–Present** In Structures With MSAs Regions
1 Unit 2 Units Inside Outside South WestPeriod Total
*Authorized in permit-issuing places. **Components may not add to totals because of rounding. Units in thousands. MSA = Metropolitan statistical area. NA = Data published only annually.Source: Census Bureau, Department of Commercehttp://www.census.gov/const/newresconst.pdf
Annual Data
Monthly Data (Seasonally Adjusted Annual Rates)
1967 1,141.0 650.6 42.5 30.5 417.5 918.0 223.0 222.6 309.8 390.8 217.8 1968 1,353.4 694.7 45.1 39.2 574.4 1,104.6 248.8 234.8 350.1 477.3 291.1 1969 1,323.7 625.9 44.7 40.5 612.7 1,074.1 249.6 215.8 317.0 470.5 320.4 1970 1,351.5 646.8 43.0 45.1 616.7 1,067.6 284.0 218.3 287.4 502.9 342.9 1971 1,924.6 906.1 61.8 71.1 885.7 1,597.6 327.0 303.6 421.1 725.4 474.6 1972 2,218.9 1,033.1 68.1 80.5 1,037.2 1,798.0 420.9 333.3 440.8 905.4 539.3 1973 1,819.5 882.1 53.8 63.2 820.5 1,483.5 336.0 271.9 361.4 763.2 423.1 1974 1,074.4 643.8 32.6 31.7 366.2 835.0 239.4 165.4 241.3 390.1 277.6 1975 939.2 675.5 34.1 29.8 199.8 704.1 235.1 129.5 241.5 292.7 275.5 1976 1,296.2 893.6 47.5 45.6 309.5 1,001.9 294.2 152.4 326.1 401.7 416.0 1977 1,690.0 1,126.1 62.1 59.2 442.7 1,326.3 363.7 181.9 402.4 561.1 544.6 1978 1,800.5 1,182.6 64.5 66.1 487.3 1,398.6 401.9 194.4 388.0 667.6 550.5 1979 1,551.8 981.5 59.5 65.9 444.8 1,210.6 341.2 166.9 289.1 628.0 467.7 1980 1,190.6 710.4 53.8 60.7 365.7 911.0 279.6 117.9 192.0 561.9 318.9 1981 985.5 564.3 44.6 57.2 319.4 765.2 220.4 109.8 133.3 491.1 251.3 1982 1,000.5 546.4 38.4 49.9 365.8 812.6 187.9 106.7 126.3 543.5 224.1 1983 1,605.2 901.5 57.5 76.1 570.1 1,359.7 245.5 164.1 187.8 862.9 390.4 1984 1,681.8 922.4 61.9 80.7 616.8 1,456.2 225.7 200.8 211.7 812.1 457.3 1985 1,733.3 956.6 54.0 66.1 656.6 1,507.6 225.6 259.7 237.0 752.6 483.9 1986 1,769.4 1,077.6 50.4 58.0 583.5 1,551.3 218.1 283.3 290.0 686.5 509.7 1987 1,534.8 1,024.4 40.8 48.5 421.1 1,319.5 215.2 271.8 282.3 574.7 406.0 1988 1,455.6 993.8 35.0 40.7 386.1 1,239.7 215.9 230.2 266.3 543.5 415.6 1989 1,338.4 931.7 31.7 35.3 339.8 1,127.6 210.8 179.0 252.1 505.3 402.1 1990 1,110.8 793.9 26.7 27.6 262.6 910.9 199.9 125.8 233.8 426.2 324.9 1991 948.8 753.5 22.0 21.1 152.1 766.8 182.0 109.8 215.4 375.7 247.9 1992 1,094.9 910.7 23.3 22.5 138.4 888.5 206.5 124.8 259.0 442.5 268.6 1993 1,199.1 986.5 26.7 25.6 160.2 1,009.0 190.1 133.5 276.6 500.7 288.2 1994 1,371.6 1,068.5 31.4 30.8 241.0 1,144.1 227.5 138.5 305.2 585.5 342.41995 1,332.5 997.3 32.2 31.5 271.5 1,116.8 215.8 124.2 296.6 583.2 328.5 1996 1,425.6 1,069.5 33.6 32.2 290.3 1,200.0 225.6 136.9 317.8 623.4 347.4 1997 1,441.1 1,062.4 34.9 33.6 310.3 1,220.2 220.9 141.9 299.8 635.9 363.5 1998 1,612.3 1,187.6 33.2 36.0 355.5 1,377.9 234.4 159.4 327.2 724.5 401.2 1999 1,663.5 1,246.7 32.5 33.3 351.1 1,427.4 236.1 164.9 345.4 748.9 404.3 2000 1,592.3 1,198.1 30.6 34.3 329.3 1,364.9 227.3 165.1 323.8 701.9 401.5 2001 1,636.7 1,235.6 31.8 34.2 335.2 1,410.4 226.3 159.8 333.6 730.3 413.0 2002 1,747.7 1,332.6 37.2 36.5 341.4 1,501.5 246.1 173.7 352.4 790.7 430.92003 1,889.2 1,460.9 40.9 41.6 345.8 1,670.4 218.8 182.4 371.0 849.3 486.52004 2,070.1 1,613.4 43.0 47.4 366.2 1,814.8 255.3 197.0 370.5 960.8 541.92005 2,147.6 1,681.2 39.3 44.7 382.5 1,884.7 270.7 199.8 362.8 1,027.7 557.32006 1,838.9 1,378.2 35.3 41.3 384.1 1,598.4 240.5 174.6 279.4 929.7 455.22007 1,398.4 979.9 28.1 31.5 349.5 1,207.1 191.3 150.6 211.7 692.2 343.92008 905.4 575.6 16.8 17.6 295.4 776.7 128.6 119.0 137.7 451.9 196.72009 572.2 435.1 9.8 10.1 117.2 490.9 81.4 65.9 97.6 292.4 116.32010 598.0 446.6 9.9 10.9 130.6 517.5 80.6 75.5 100.4 293.9 128.3
2009 Oct 576 468 16 92 NA 68 106 289 113Nov 621 489 26 106 NA 76 110 317 118Dec 681 517 19 145 NA 106 117 325 133
2010 Jan 629 509 19 101 NA 74 95 317 143Feb 650 523 20 107 NA 85 106 311 148Mar 685 542 22 121 NA 68 117 356 144Apr 610 486 17 107 NA 68 114 310 118May 574 436 18 120 NA 65 102 294 113Jun 583 421 20 142 NA 85 93 283 122Jul 559 406 19 134 NA 66 94 283 116Aug 571 403 18 150 NA 68 92 279 132Sep 547 402 25 120 NA 75 91 267 114Oct 552 404 24 124 NA 72 108 259 113Nov 544 417 20 107 NA 67 90 264 123Dec 627 442 24 161 NA 117 94 255 161

Historical Data69
In Structures With MSAs Regions
Period Total
Exhibit 2. New Privately Owned Housing Units Started: 1967–Present*
*Components may not add to totals because of rounding. Units in thousands. MSA = Metropolitan statistical area. NA = Data published only annually.Source: Census Bureau, Department of Commercehttp://www.census.gov/const/newresconst.pdf
Annual Data
3 and 4 5 Units North- Mid- Units or More east west 1 Unit 2 Units Inside Outside South West
Monthly Data (Sea son al ly Adjusted Annual Rates)
1967 1,291.6 843.9 41.4 30.2 376.1 902.9 388.7 214.9 337.1 519.5 220.11968 1,507.6 899.4 46.0 34.9 527.3 1,096.4 411.2 226.8 368.6 618.5 293.7 1969 1,466.8 810.6 43.0 42.0 571.2 1,078.7 388.0 206.1 348.7 588.4 323.5 1970 1,433.6 812.9 42.4 42.4 535.9 1,017.9 415.7 217.9 293.5 611.6 310.5 1971 2,052.2 1,151.0 55.1 65.2 780.9 1,501.8 550.4 263.8 434.1 868.7 485.6 1972 2,356.6 1,309.2 67.1 74.2 906.2 1,720.4 636.2 329.5 442.8 1,057.0 527.4 1973 2,045.3 1,132.0 54.2 64.1 795.0 1,495.4 549.9 277.3 439.7 899.4 428.8 1974 1,337.7 888.1 33.2 34.9 381.6 922.5 415.3 183.2 317.3 552.8 284.5 1975 1,160.4 892.2 34.5 29.5 204.3 760.3 400.1 149.2 294.0 442.1 275.1 1976 1,537.5 1,162.4 44.0 41.9 289.2 1,043.5 494.1 169.2 400.1 568.5 399.6 1977 1,987.1 1,450.9 60.7 61.0 414.4 1,377.3 609.8 201.6 464.6 783.1 537.9 1978 2,020.3 1,433.3 62.2 62.8 462.0 1,432.1 588.2 200.3 451.2 823.7 545.2 1979 1,745.1 1,194.1 56.1 65.9 429.0 1,240.6 504.6 177.9 349.2 747.5 470.5 1980 1,292.2 852.2 48.8 60.7 330.5 913.6 378.7 125.4 218.1 642.7 306.0 1981 1,084.2 705.4 38.2 52.9 287.7 759.8 324.3 117.3 165.2 561.6 240.0 1982 1,062.2 662.6 31.9 48.1 319.6 784.8 277.4 116.7 149.1 591.0 205.4 1983 1,703.0 1,067.6 41.8 71.7 522.0 1,351.1 351.9 167.6 217.9 935.2 382.3 1984 1,749.5 1,084.2 38.6 82.8 544.0 1,414.6 334.9 204.1 243.4 866.0 436.0 1985 1,741.8 1,072.4 37.0 56.4 576.1 1,493.9 247.9 251.7 239.7 782.3 468.2 1986 1,805.4 1,179.4 36.1 47.9 542.0 1,546.3 259.1 293.5 295.8 733.1 483.0 1987 1,620.5 1,146.4 27.8 37.5 408.7 1,372.2 248.2 269.0 297.9 633.9 419.8 1988 1,488.1 1,081.3 23.4 35.4 348.0 1,243.0 245.1 235.3 274.0 574.9 403.9 1989 1,376.1 1,003.3 19.9 35.3 317.6 1,128.1 248.0 178.5 265.8 536.2 395.7 1990 1,192.7 894.8 16.1 21.4 260.4 946.9 245.7 131.3 253.2 479.3 328.9 1991 1,013.9 840.4 15.5 20.1 137.9 789.2 224.7 112.9 233.0 414.1 254.0 1992 1,199.7 1,029.9 12.4 18.3 139.0 931.5 268.2 126.7 287.8 496.9 288.3 1993 1,287.6 1,125.7 11.1 18.3 132.6 1,031.9 255.8 126.5 297.7 561.8 301.7 1994 1,457.0 1,198.4 14.8 20.2 223.5 1,183.1 273.9 138.2 328.9 639.1 350.8 1995 1,354.1 1,076.2 14.3 19.4 244.1 1,106.4 247.6 117.7 290.1 615.0 331.31996 1,476.8 1,160.9 16.4 28.8 270.8 1,211.4 265.5 132.1 321.5 661.9 361.4 1997 1,474.0 1,133.7 18.1 26.4 295.8 1,221.3 252.7 136.8 303.6 670.3 363.3 1998 1,616.9 1,271.4 15.7 26.9 302.9 1,349.9 267.0 148.5 330.5 743.0 394.9 1999 1,640.9 1,302.4 15.0 16.9 306.6 1,367.7 273.2 155.7 347.3 746.0 391.9 2000 1,568.7 1,230.9 15.2 23.5 299.1 1,297.3 271.4 154.5 317.5 713.6 383.1 2001 1,602.7 1,273.3 17.2 19.3 292.8 1,329.4 273.3 149.2 330.4 732.0 391.1 2002 1,704.9 1,358.6 14.0 24.4 307.9 1,398.1 306.8 158.7 349.6 781.5 415.5 2003 1,847.7 1,499.0 15.7 17.8 315.2 1,517.5 330.3 163.9 372.5 838.4 473.62004 1,955.8 1,610.5 17.7 24.6 303.0 1,592.6 363.3 175.4 355.7 908.5 516.22005 2,068.3 1,715.8 15.3 25.8 311.4 1,829.2 239.1 189.7 357.4 996.1 525.12006 1,800.9 1,465.4 15.3 27.4 292.8 1,599.2 201.7 167.2 279.5 910.3 443.82007 1,355.0 1,046.0 12.1 19.6 277.3 1,196.0 159.1 142.9 210.1 681.1 320.92008 905.5 622.0 6.2 11.4 266.0 799.0 106.6 121.0 134.9 453.4 196.22009 554.0 445.1 6.3 5.2 97.3 477.9 76.1 61.8 97.1 278.2 116.82010 587.6 470.9 5.7 5.8 105.2 512.8 74.8 71.6 98.4 297.2 120.3
2009 Oct 529 475 NA 49 NA 55 100 269 105Nov 589 504 NA 76 NA 66 107 303 113Dec 576 486 NA 78 NA 61 94 312 109
2010 Jan 612 511 NA 94 NA 70 91 326 125Feb 605 527 NA 62 NA 72 105 285 143Mar 634 535 NA 91 NA 66 93 339 136Apr 679 563 NA 104 NA 84 118 367 110May 588 459 NA 117 NA 72 109 291 116Jun 539 450 NA 84 NA 60 83 287 109Jul 550 427 NA 103 NA 75 92 275 108Aug 614 432 NA 168 NA 75 111 289 139Sep 601 447 NA 148 NA 69 97 301 134Oct 533 433 NA 88 NA 81 94 263 95Nov 553 458 NA 81 NA 77 112 268 96Dec 529 417 NA 102 NA 58 69 262 140

Historical Data 70
Exhibit 3. New Privately Owned Housing Units Under Construction: 1970–Present*
Period Total
*Components may not add to totals because of rounding. Units in thousands. MSA = Metropolitan statistical area. NA = Data published only annually.Sources: Census Bureau, Department of Commerce; Office of Policy Development and Research, Department of Housing and Urban De vel op menthttp://www.census.gov/const/newresconst.pdf
In Structures With MSAs Regions
Monthly Data (Sea son al ly Adjusted)
Annual Data
1 Unit 2 Units Inside Outside South West 3 and 4 5 Units North- Mid- Units or More east west
1970 922.0 381.1 22.8 27.3 490.8 NA NA 197.1 189.3 359.2 176.4 1971 1,254.0 504.9 26.7 37.8 684.6 NA NA 236.6 278.5 494.4 244.4 1972 1,542.1 612.5 36.4 46.4 846.8 NA NA 264.4 306.8 669.1 301.8 1973 1,454.4 521.7 31.0 48.0 853.6 NA NA 239.4 293.1 650.2 271.7 1974 1,000.8 441.1 19.4 29.1 511.3 NA NA 178.0 218.8 418.9 185.11975 794.3 447.5 20.1 27.4 299.4 563.2 231.1 130.2 195.1 298.1 171.0 1976 922.0 562.6 22.7 31.8 304.9 658.5 263.5 125.4 232.1 333.3 231.2 1977 1,208.0 729.8 34.0 44.9 399.3 862.5 345.5 145.5 284.6 457.3 320.6 1978 1,310.2 764.5 36.1 47.3 462.2 968.0 342.2 158.3 309.2 497.6 345.2 1979 1,140.1 638.7 31.3 46.7 423.4 820.1 320.0 146.7 232.5 449.3 311.6 1980 896.1 514.5 28.3 40.3 313.1 620.9 275.2 120.1 171.4 376.7 227.9 1981 682.4 381.7 16.5 29.0 255.3 458.9 223.5 103.2 109.7 299.7 169.8 1982 720.0 399.7 16.5 24.9 278.9 511.7 208.3 98.6 112.4 344.0 165.0 1983 1,002.8 523.9 19.0 39.1 420.8 757.8 245.0 120.8 122.6 520.6 238.8 1984 1,050.5 556.0 20.9 42.5 431.0 814.1 236.4 152.5 137.3 488.9 271.7 1985 1,062.5 538.6 20.6 34.9 468.4 885.1 177.4 186.6 143.8 437.5 294.7 1986 1,073.5 583.1 19.3 28.4 442.7 899.7 173.8 218.9 165.7 387.3 301.5 1987 987.3 590.6 17.3 22.5 356.9 820.6 166.7 221.7 158.7 342.5 264.4 1988 919.4 569.6 16.1 24.1 309.5 757.5 161.9 201.6 148.1 308.2 261.6 1989 850.3 535.1 11.9 25.1 278.1 686.7 163.6 158.8 145.5 282.1 263.9 1990 711.4 449.1 10.9 15.1 236.3 553.9 157.5 121.6 133.4 242.3 214.1 1991 606.3 433.5 9.1 14.5 149.2 458.4 147.9 103.9 122.4 208.5 171.6 1992 612.4 472.7 5.6 11.3 122.8 453.1 159.4 81.4 137.8 228.4 164.8 1993 680.1 543.0 6.5 12.4 118.2 521.0 159.1 89.3 154.4 265.4 170.9 1994 762.2 557.8 9.1 12.9 182.5 597.6 164.5 96.3 173.5 312.1 180.31995 775.9 547.2 8.4 12.7 207.7 620.1 155.8 86.3 172.0 331.4 186.3 1996 792.3 550.0 9.0 19.1 214.3 629.9 162.4 85.2 178.0 337.6 191.4 1997 846.7 554.6 11.2 20.7 260.2 684.4 163.2 87.1 181.9 364.8 213.0 1998 970.8 659.1 8.3 20.5 282.9 794.8 176.0 98.5 201.2 428.5 242.6 1999 952.8 647.6 9.0 12.1 284.1 786.1 166.6 103.5 202.5 422.3 224.5 2000 933.8 623.4 10.2 19.5 280.7 759.8 173.9 110.0 186.6 397.6 239.5 2001 959.4 638.3 11.8 16.7 292.6 790.6 168.7 116.1 195.9 396.5 250.9 2002 1,001.2 668.8 10.9 15.5 306.0 817.7 183.4 125.0 207.1 413.0 256.0 2003 1,141.4 772.9 10.4 13.9 344.2 940.4 201.0 128.1 234.7 482.6 296.12004 1,237.1 850.3 14.0 24.1 348.7 1,011.8 225.3 146.8 222.4 536.4 331.62005 1,355.9 929.1 14.7 20.3 391.8 1,194.3 161.6 171.9 221.4 604.2 358.42006 1,204.9 764.7 12.2 22.7 405.3 1,062.5 142.4 162.3 183.7 534.3 324.62007 1,025.0 579.1 10.9 18.7 416.3 907.2 117.7 155.9 162.5 431.6 274.92008 780.9 377.3 5.8 12.0 385.8 703.6 77.3 157.3 103.9 311.6 208.12009 495.4 283.1 5.3 6.6 200.4 432.9 62.4 112.2 76.4 183.6 123.22010 412.9 247.1 4.9 5.6 354.6 58.2 73.1 98.9 65.0 160.7 88.3
2009 Oct 551 305 NA 232 NA 121 84 207 139Nov 533 300 NA 220 NA 119 82 200 132Dec 514 298 NA 204 NA 115 79 193 127
2010 Jan 503 300 NA 192 NA 111 79 191 122Feb 496 304 NA 181 NA 110 79 188 119Mar 494 308 NA 175 NA 108 80 189 117Apr 487 308 NA 169 NA 108 79 186 114May 477 302 NA 164 NA 106 79 184 108Jun 448 283 NA 155 NA 103 72 176 97Jul 444 278 NA 155 NA 103 71 175 95Aug 444 274 NA 159 NA 102 72 175 95Sep 438 269 NA 159 NA 100 71 174 93Oct 433 263 NA 160 NA 99 70 172 92Nov 431 264 NA 156 NA 99 69 172 91Dec 428 261 NA 156 NA 100 67 169 92

Historical Data71
Exhibit 4. New Privately Owned Housing Units Completed: 1970–Present*
In Structures With MSAs Regions
Period Total
*Components may not add to totals because of rounding. Units in thousands. MSA = Metropolitan statistical area. NA = Data published only annually.Sources: Census Bureau, Department of Commerce; Office of Policy Development and Research, Department of Housing and Urban De vel op menthttp://www.census.gov/const/newresconst.pdf
1 Unit 2 Units Inside Outside South West 3 and 4 5 Units North- Mid- Units or More east west
Annual Data
Monthly Data (Sea son al ly Adjusted Annual Rates)
1970 1,418.4 801.8 42.9 42.2 531.5 1,013.2 405.2 184.9 323.4 594.6 315.5 1971 1,706.1 1,014.0 50.9 55.2 586.1 1,192.5 513.6 225.8 348.1 727.0 405.2 1972 2,003.9 1,160.2 54.0 64.9 724.7 1,430.9 573.0 281.1 411.8 848.5 462.4 1973 2,100.5 1,197.2 59.9 63.6 779.8 1,541.0 559.5 294.0 441.7 906.3 458.6 1974 1,728.5 940.3 43.5 51.8 692.9 1,266.1 462.4 231.7 377.4 755.8 363.6 1975 1,317.2 874.8 31.5 29.1 381.8 922.6 394.5 185.8 313.2 531.3 286.8 1976 1,377.2 1,034.2 40.8 36.5 265.8 950.1 427.2 170.2 355.6 513.2 338.3 1977 1,657.1 1,258.4 48.9 46.1 303.7 1,161.9 495.2 176.8 400.0 636.1 444.2 1978 1,867.5 1,369.0 59.0 57.2 382.2 1,313.6 553.9 181.9 416.5 752.0 517.1 1979 1,870.8 1,301.0 60.5 64.4 444.9 1,332.0 538.8 188.4 414.7 761.7 506.0 1980 1,501.6 956.7 51.4 67.2 426.3 1,078.9 422.7 146.0 273.5 696.1 386.0 1981 1,265.7 818.5 49.2 62.4 335.7 888.4 377.4 127.3 217.7 626.4 294.3 1982 1,005.5 631.5 29.8 51.1 293.1 708.2 297.3 120.5 143.0 538.8 203.2 1983 1,390.3 923.7 37.0 55.2 374.4 1,073.9 316.5 138.9 200.8 746.0 304.6 1984 1,652.2 1,025.1 35.0 77.3 514.8 1,316.7 335.6 168.2 221.1 866.6 396.4 1985 1,703.3 1,072.5 36.4 60.7 533.6 1,422.2 281.0 213.8 230.5 812.2 446.8 1986 1,756.4 1,120.2 35.0 51.0 550.1 1,502.1 254.3 254.0 269.8 763.8 468.8 1987 1,668.8 1,122.8 29.0 42.4 474.6 1,420.4 248.4 257.4 302.3 660.4 448.7 1988 1,529.8 1,084.6 23.5 33.2 388.6 1,286.1 243.7 250.2 280.3 594.8 404.6 1989 1,422.8 1,026.3 24.1 34.6 337.9 1,181.2 241.7 218.8 267.1 549.4 387.5 1990 1,308.0 966.0 16.5 28.2 297.3 1,060.2 247.7 157.7 263.3 510.7 376.3 1991 1,090.8 837.6 16.9 19.7 216.6 862.1 228.7 120.1 240.4 438.9 291.3 1992 1,157.5 963.6 15.1 20.8 158.0 909.5 248.0 136.4 268.4 462.4 290.3 1993 1,192.7 1,039.4 9.5 16.7 127.1 943.0 249.8 117.6 273.3 512.0 290.0 1994 1,346.9 1,160.3 12.1 19.5 154.9 1,086.3 260.6 123.4 307.1 580.9 335.51995 1,312.6 1,065.5 14.8 19.8 212.4 1,065.0 247.6 126.9 287.9 581.1 316.7 1996 1,412.9 1,128.5 13.6 19.5 251.3 1,163.4 249.4 125.1 304.5 637.1 346.2 1997 1,400.5 1,116.4 13.6 23.4 247.1 1,152.8 247.7 134.0 295.9 634.1 336.4 1998 1,474.2 1,159.7 16.2 24.4 273.9 1,228.5 245.7 137.3 305.1 671.6 360.2 1999 1,604.9 1,270.4 12.5 22.6 299.3 1,336.8 268.0 142.7 334.7 732.7 394.8 2000 1,573.7 1,241.8 12.6 14.7 304.7 1,313.7 260.0 146.1 334.4 729.3 363.9 2001 1,570.8 1,255.9 14.3 19.6 281.0 1,305.1 265.7 144.8 316.4 726.3 383.3 2002 1,648.4 1,325.1 13.1 21.9 288.2 1,367.4 281.0 147.9 329.8 757.8 412.8 2003 1,678.7 1,386.3 13.9 17.7 260.8 1,381.5 297.1 154.6 332.2 755.6 436.22004 1,841.9 1,531.5 11.2 12.2 286.9 1,514.5 327.4 155.9 362.4 840.4 483.32005 1,931.4 1,635.9 13.1 24.4 258.0 1,702.0 229.5 170.7 351.9 903.7 505.12006 1,979.4 1,654.5 16.4 24.3 284.2 1,760.1 219.3 179.1 325.1 986.7 488.62007 1,502.8 1,218.4 12.4 19.0 253.0 1,332.9 169.9 144.8 222.7 766.1 369.32008 1,119.7 818.8 9.3 14.4 277.2 977.4 142.3 109.6 178.2 567.4 264.42009 794.4 520.1 5.4 9.1 259.8 708.5 85.9 94.2 119.2 393.5 187.52010 653.5 497.1 3.9 5.1 147.5 580.5 73.1 79.9 106.8 317.7 149.1
2009 Oct 751 531 NA 205 NA 94 97 365 195 Nov 850 561 NA 273 NA 102 144 404 200 Dec 752 495 NA 236 NA 79 127 390 156
2010 Jan 662 440 NA 205 NA 86 82 296 198 Feb 668 455 NA 204 NA 85 87 328 168 Mar 643 489 NA 145 NA 66 82 340 155 Apr 747 554 NA 181 NA 94 105 407 141 May 705 516 NA 184 NA 93 120 312 180 Jun 879 682 NA 189 NA 84 171 391 233 Jul 576 475 NA 93 NA 66 107 288 115 Aug 606 480 NA 120 NA 84 100 299 123 Sep 631 485 NA 135 NA 88 94 305 144 Oct 602 481 NA 114 NA 87 115 287 113 Nov 562 439 NA 118 NA 72 123 267 100 Dec 585 463 NA 111 NA 54 89 311 131

Historical Data 72
Exhibit 5. Manufactured (Mobile) Home Shipments, Residential Placements, Average Prices, and Units for Sale: 1977–Present
Shipments* Placed for Residential Use*
*Components may not add to totals because of rounding. Units in thousands.NA = Not available.Sources: Shipments—National Conference of States on Building Codes and Standards; Placements—Census Bureau, Department of Commerce; Office of Policy Development and Research, Department of Housing and Urban Developmenthttp://www.census.gov/ftp/pub/const/www/mhsindex.html (See Current Tables, Monthly Tables.)
Average Price ($) For Sale*
Annual Data
Monthly Data (Sea son al ly Adjusted Annual Rates)
United United States States Northeast Midwest South West
Period
1977 266 258 17 51 113 78 14,200 70 1978 276 280 17 50 135 78 15,900 74 1979 277 280 17 47 145 71 17,600 76 1980 222 234 12 32 140 49 19,800 56 1981 241 229 12 30 144 44 19,900 58 1982 240 234 12 26 161 35 19,700 58 1983 296 278 16 34 186 41 21,000 73 1984 295 288 20 35 193 39 21,500 82 1985 284 283 20 39 188 37 21,800 78 1986 244 256 21 37 162 35 22,400 67 1987 233 239 24 40 146 30 23,700 61 1988 218 224 23 39 131 32 25,100 58 1989 198 203 20 39 113 31 27,200 56 1990 188 195 19 38 108 31 27,800 49 1991 171 174 14 35 98 27 27,700 49 1992 211 212 15 42 124 30 28,400 511993 254 243 15 45 147 36 30,500 61 1994 304 291 16 53 178 44 32,800 701995 340 319 15 58 203 44 35,300 83 1996 363 338 16 59 218 44 37,200 89 1997 354 336 14 55 219 47 39,800 91 1998 373 374 15 58 250 50 41,600 83 1999 348 338 14 54 227 44 43,300 88 2000 251 281 15 50 177 39 46,400 59 2001 193 196 12 38 116 30 48,900 56 2002 169 174 12 34 101 27 51,300 47 2003 131 140 11 25 77 26 54,900 362004 131 124 11 21 67 26 58,200 352005 147 123 9 17 68 29 62,600 352006 117 112 8 15 66 24 64,300 372007 96 95 7 11 59 18 65,400 342008 82 79 5 8 53 13 64,900 332009 50 53 4 5 37 7 62,900 252010 50 NA NA NA NA NA NA NA
2009 Aug 48 42 2 4 29 7 65,700 29Sep 48 53 5 6 35 7 64,000 28Oct 48 52 4 6 33 9 64,700 28Nov 49 62 4 5 45 8 64,900 27Dec 50 50 3 6 38 4 57,800 27 2010 Jan 50 41 4 4 28 5 64,200 26Feb 52 47 3 6 32 6 66,800 25Mar 55 47 2 4 35 6 61,800 25Apr 55 58 3 8 40 8 61,600 24May 58 56 4 5 40 6 62,400 24Jun 56 58 4 5 41 8 62,500 23Jul 52 52 5 6 36 6 62,600 23Aug 50 52 4 7 36 6 61,000 23Sep 47 43 4 4 28 6 61,400 23Oct 43 46 3 5 31 6 63,900 23Nov 43 39 4 4 25 6 62,900 23Dec 40 NA NA NA NA NA NA NA

Historical Data73
1970 485 61 100 203 121 227 38 47 91 51 NA NA 1971 656 82 127 270 176 294 45 55 131 63 NA NA 1972 718 96 130 305 187 416 53 69 199 95 NA NA 1973 634 95 120 257 161 422 59 81 181 102 NA NA 1974 519 69 103 207 139 350 50 68 150 82 NA NA 1975 549 71 106 222 150 316 43 66 133 74 NA NA 1976 646 72 128 247 199 358 45 68 154 91 NA NA 1977 819 86 162 317 255 408 44 73 168 123 NA NA 1978 817 78 145 331 262 419 45 80 170 124 NA NA 1979 709 67 112 304 225 402 42 74 172 114 NA NA 1980 545 50 81 267 145 342 40 55 149 97 NA NA 1981 436 46 60 219 112 278 41 34 127 76 NA NA 1982 412 47 48 219 99 255 39 27 129 60 NA NA 1983 623 76 71 323 152 304 42 33 149 79 NA NA 1984 639 94 76 309 160 358 55 41 177 85 NA NA 1985 688 112 82 323 171 350 66 34 172 79 NA NA 1986 750 136 96 322 196 361 88 32 153 87 NA NA 1987 671 117 97 271 186 370 103 39 149 79 NA NA 1988 676 101 97 276 202 371 112 43 133 82 NA NA 1989 650 86 102 260 202 366 108 41 123 93 NA NA 1990 534 71 89 225 149 321 77 42 105 97 NA NA 1991 509 57 93 215 144 284 62 41 97 83 NA NA 1992 610 65 116 259 170 267 48 41 104 74 NA NA 1993 666 60 123 295 188 295 53 48 121 73 NA NA 1994 670 61 123 295 191 340 55 63 140 82 NA NA 1995 667 55 125 300 187 374 62 69 158 86 NA NA 1996 757 74 137 337 209 326 38 67 146 74 NA NA 1997 804 78 140 363 223 287 26 65 127 69 NA NA 1998 886 81 164 398 243 300 28 63 142 68 NA NA 1999 880 76 168 395 242 315 28 64 153 70 NA NA 2000 877 71 155 406 244 301 28 65 146 62 NA NA 2001 908 66 164 439 239 310 28 70 142 69 NA NA 2002 973 65 185 450 273 344 36 77 161 70 NA NA 2003 1,086 79 189 511 307 377 29 97 172 79 3.92004 1,203 83 210 562 348 431 30 111 200 91 4.02005 1,283 81 205 638 358 515 47 109 249 109 4.52006 1,051 63 161 559 267 537 54 97 267 119 6.42007 776 65 118 411 181 496 48 79 248 121 8.52008 485 35 70 266 114 352 37 57 175 83 10.72009 375 31 54 202 87 232 27 38 118 48 9.12010 321 31 44 173 73 191 22 28 99 42 8.0
2009 Oct 396 33 54 213 96 243 28 42 123 50 242 7.3Nov 368 31 71 189 77 235 27 39 120 48 236 7.7Dec 356 38 51 184 83 232 27 38 118 48 231 7.8
2010 Jan 349 42 55 174 78 231 26 37 119 48 232 8.0Feb 347 30 49 180 88 229 26 36 119 47 232 8.0Mar 384 33 53 206 92 227 25 36 118 47 228 7.1Apr 414 36 56 213 109 216 24 35 113 45 216 6.3May 282 28 39 152 63 215 24 34 114 44 216 9.2Jun 310 34 46 174 56 213 24 32 111 45 211 8.2Jul 283 30 43 166 44 210 24 31 109 46 210 8.9Aug 274 29 31 149 65 209 23 31 108 46 207 9.1Sep 317 35 52 162 68 204 22 29 109 44 202 7.6Oct 280 30 40 161 49 200 22 29 105 45 200 8.6Nov 280 20 31 165 64 196 22 29 102 44 195 8.4Dec 329 19 32 168 110 191 22 28 99 42 190 6.9
Sold During Period For Sale at End of Period Months’ Supply at
Current U.S. Sales Rate
Exhibit 6. New Single-Family Home Sales: 1970–Present*
United South West
United South West
United States States States
North- Mid- North- Mid- east west east west
*Components may not add to totals because of rounding. Units in thousands. NA = Not available.Sources: Census Bureau, Department of Commerce; Office of Policy Development and Research, Department of Housing and Urban Developmenthttp://www.census.gov/const/www/newressalesindex.html
Period
Monthly Data (Seasonally Adjusted Annual Rates) (Not Seasonally Adjusted)
(SeasonallyAdjusted)
Annual Data

Historical Data 74
Months’ Supply
Exhibit 7. Existing Home Sales: 1969–Present*
*Components may not add to totals because of rounding. Units in thousands. NA = Not available.Source: NATIONAL ASSOCIATION OF REALTORS®
http://www.realtor.org/research.nsf/pages/EHSPage
Period United
Northeast Midwest South West For Sale
States
Annual Data
Monthly Data (Sea son al ly Adjusted Annual Rates)
1969 1,594 240 508 538 308 NA NA1970 1,612 251 501 568 292 NA NA1971 2,018 311 583 735 389 NA NA 1972 2,252 361 630 788 473 NA NA 1973 2,334 367 674 847 446 NA NA 1974 2,272 354 645 839 434 NA NA 1975 2,476 370 701 862 543 NA NA 1976 3,064 439 881 1,033 712 NA NA 1977 3,650 515 1,101 1,231 803 NA NA 1978 3,986 516 1,144 1,416 911 NA NA 1979 3,827 526 1,061 1,353 887 NA NA 1980 2,973 403 806 1,092 672 NA NA 1981 2,419 353 632 917 516 NA NA1982 1,990 354 490 780 366 1,910 NA 1983 2,719 493 709 1,035 481 1,980 NA 1984 2,868 511 755 1,073 529 2,260 NA 1985 3,214 622 866 1,172 554 2,200 NA 1986 3,565 703 991 1,261 610 1,970 NA 1987 3,526 685 959 1,282 600 2,160 NA 1988 3,594 673 929 1,350 642 2,160 NA 1989 3,290 635 886 1,075 694 1,870 NA1990 3,186 583 861 1,090 651 2,100 NA1991 3,145 591 863 1,067 624 2,130 NA1992 3,432 666 967 1,126 674 1,760 NA1993 3,739 709 1,027 1,262 740 1,520 NA1994 3,886 723 1,031 1,321 812 1,380 NA1995 3,852 717 1,010 1,315 810 1,470 NA1996 4,167 772 1,060 1,394 941 1,910 NA1997 4,371 812 1,088 1,474 997 1,840 NA1998 4,966 898 1,228 1,724 1,115 1,910 NA1999 5,183 910 1,246 1,850 1,177 1,894 4.82000 5,174 911 1,222 1,866 1,174 2,048 4.52001 5,335 912 1,271 1,967 1,184 2,068 4.62002 5,632 952 1,346 2,064 1,269 2,118 4.72003 6,175 1,019 1,468 2,283 1,405 2,270 4.72004 6,778 1,113 1,550 2,540 1,575 2,244 4.32005 7,076 1,169 1,588 2,702 1,617 2,846 4.52006 6,478 1,086 1,483 2,563 1,346 3,450 6.52007 5,652 1,006 1,327 2,235 1,084 3,974 8.92008 4,913 849 1,129 1,865 1,070 3,700 10.42009 5,156 868 1,163 1,914 1,211 3,283 8.82010 4,908 817 1,076 1,861 1,154 3,560 9.4
2009 Oct 5,980 1,030 1,390 2,250 1,310 3,565 7.2Nov 6,490 1,150 1,540 2,380 1,420 3,521 6.5Dec 5,440 920 1,160 2,020 1,350 3,283 7.2
2010 Jan 5,050 820 1,080 1,870 1,280 3,277 7.8Feb 5,010 840 1,110 1,840 1,220 3,531 8.5Mar 5,360 900 1,210 1,970 1,290 3,626 8.1Apr 5,790 1,090 1,330 2,140 1,230 4,029 8.4May 5,660 890 1,330 2,150 1,290 3,893 8.3Jun 5,260 880 1,230 1,990 1,160 3,887 8.9Jul 3,840 630 800 1,540 870 4,007 12.5Aug 4,120 690 830 1,600 1,000 4,117 12.0Sep 4,530 760 950 1,770 1,050 4,000 10.6Oct 4,430 750 940 1,710 1,030 3,863 10.5Nov 4,700 770 1,000 1,790 1,140 3,717 9.5Dec 5,280 870 1,110 1,970 1,330 3,560 8.1

Historical Data75
Median U.S. Average
Exhibit 8. New Single-Family Home Prices: 1964–Present
Period
1 The components of a constant-quality house reflect the kinds of new single-family homes sold in 2005. The average price of a constant-quality house is derived from a set of statistical models relating sales price to selected standard physical characteristics of new single-family homes sold in 2005.2 Effective with the December 2007 New Home Sales Release in January 2008, the Census Bureau began publishing the Constant Quality (Laspeyres) Price Index with 2005 as the base year. (The previous base year was 1996.) “Constant-Quality House” data are computed for this table from price indexes published by the Census Bureau.Sources: Census Bureau, Department of Commerce; Office of Policy Development and Research, Department of Housing and Urban Developmenthttp://www.census.gov/const/quarterly_sales.pdf (See Table Q6.)
Houses Constant- Actually Sold Quality House1, 2
Annual Data
Quarterly Data
1964 18,900 20,300 19,400 16,700 20,400 20,500 34,9001965 20,000 21,500 21,600 17,500 21,600 21,500 35,6001966 21,400 23,500 23,200 18,200 23,200 23,300 37,1001967 22,700 25,400 25,100 19,400 24,100 24,600 38,1001968 24,700 27,700 27,400 21,500 25,100 26,600 40,1001969 25,600 31,600 27,600 22,800 25,300 27,900 43,2001970 23,400 30,300 24,400 20,300 24,000 26,600 44,4001971 25,200 30,600 27,200 22,500 25,500 28,300 46,8001972 27,600 31,400 29,300 25,800 27,500 30,500 49,8001973 32,500 37,100 32,900 30,900 32,400 35,500 54,2001974 35,900 40,100 36,100 34,500 35,800 38,900 59,2001975 39,300 44,000 39,600 37,300 40,600 42,600 65,5001976 44,200 47,300 44,800 40,500 47,200 48,000 71,2001977 48,800 51,600 51,500 44,100 53,500 54,200 80,2001978 55,700 58,100 59,200 50,300 61,300 62,500 91,9001979 62,900 65,500 63,900 57,300 69,600 71,800 104,9001980 64,600 69,500 63,400 59,600 72,300 76,400 115,6001981 68,900 76,000 65,900 64,400 77,800 83,000 124,7001982 69,300 78,200 68,900 66,100 75,000 83,900 127,6001983 75,300 82,200 79,500 70,900 80,100 89,800 130,3001984 79,900 88,600 85,400 72,000 87,300 97,600 135,6001985 84,300 103,300 80,300 75,000 92,600 100,800 137,3001986 92,000 125,000 88,300 80,200 95,700 111,900 142,6001987 104,500 140,000 95,000 88,000 111,000 127,200 150,3001988 112,500 149,000 101,600 92,000 126,500 138,300 156,0001989 120,000 159,600 108,800 96,400 139,000 148,800 162,2001990 122,900 159,000 107,900 99,000 147,500 149,800 165,3001991 120,000 155,900 110,000 100,000 141,100 147,200 167,4001992 121,500 169,000 115,600 105,500 130,400 144,100 169,8001993 126,500 162,600 125,000 115,000 135,000 147,700 176,3001994 130,000 169,000 132,900 116,900 140,400 154,500 186,8001995 133,900 180,000 134,000 124,500 141,000 158,700 191,0001996 140,000 186,000 138,000 126,200 153,900 166,400 195,9001997 146,000 190,000 149,900 129,600 160,000 176,200 200,5001998 152,500 200,000 157,500 135,800 163,500 181,900 205,5001999 161,000 210,500 164,000 145,900 173,700 195,600 216,2002000 169,000 227,400 169,700 148,000 196,400 207,000 224,6002001 175,200 246,400 172,600 155,400 213,600 213,200 231,3002002 187,600 264,300 178,000 163,400 238,500 228,700 241,9002003 195,000 264,500 184,300 168,100 260,900 246,300 255,3002004 221,000 315,800 205,000 181,100 283,100 274,500 275,6002005 240,900 343,800 216,900 197,300 332,600 297,000 297,0002006 246,500 346,000 213,500 208,200 337,700 305,900 311,1002007 247,900 320,200 208,600 217,700 330,900 313,600 311,6002008 232,100 343,600 198,900 203,700 294,800 292,600 295,5002009 216,700 302,500 189,200 194,800 263,700 270,900 282,4002010 221,900 335,500 197,600 196,000 259,700 271,600 281,300
2009 Q4 219,000 324,600 196,000 191,800 251,900 272,900 285,700
2010 Q1 222,900 337,400 203,800 187,900 263,600 275,300 281,600 Q2 219,500 348,700 192,400 195,200 264,100 268,800 282,700 Q3 224,100 291,000 191,800 203,900 259,500 266,000 279,800 Q4 219,800 330,000 208,000 192,700 250,900 272,400 282,200
United Northeast Midwest South West States
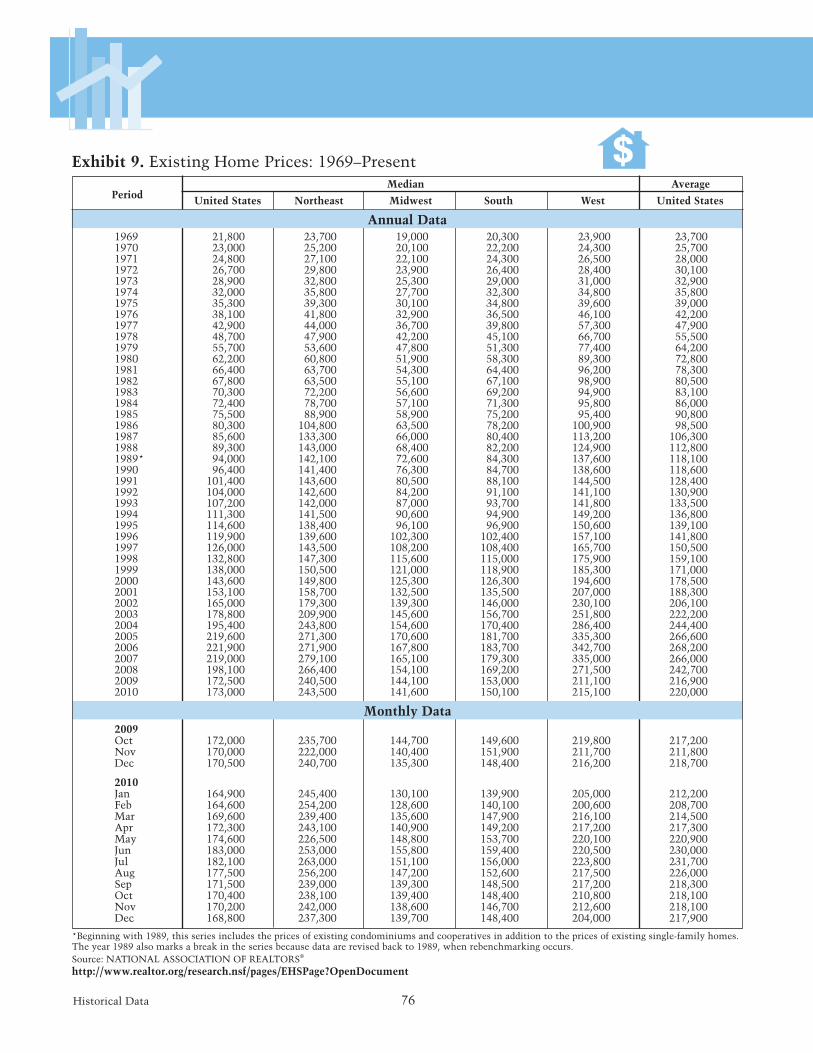
Historical Data 76
Median Average
United States Northeast Midwest South West United States
Exhibit 9. Existing Home Prices: 1969–Present
Period
*Beginning with 1989, this series includes the prices of existing condominiums and cooperatives in addition to the prices of existing single-family homes. The year 1989 also marks a break in the series because data are revised back to 1989, when rebenchmarking occurs.Source: NATIONAL ASSOCIATION OF REALTORS®
http://www.realtor.org/research.nsf/pages/EHSPage?OpenDocument
Annual Data
Monthly Data
1969 21,800 23,700 19,000 20,300 23,900 23,700 1970 23,000 25,200 20,100 22,200 24,300 25,700 1971 24,800 27,100 22,100 24,300 26,500 28,000 1972 26,700 29,800 23,900 26,400 28,400 30,100 1973 28,900 32,800 25,300 29,000 31,000 32,900 1974 32,000 35,800 27,700 32,300 34,800 35,800 1975 35,300 39,300 30,100 34,800 39,600 39,000 1976 38,100 41,800 32,900 36,500 46,100 42,200 1977 42,900 44,000 36,700 39,800 57,300 47,900 1978 48,700 47,900 42,200 45,100 66,700 55,500 1979 55,700 53,600 47,800 51,300 77,400 64,200 1980 62,200 60,800 51,900 58,300 89,300 72,800 1981 66,400 63,700 54,300 64,400 96,200 78,300 1982 67,800 63,500 55,100 67,100 98,900 80,500 1983 70,300 72,200 56,600 69,200 94,900 83,100 1984 72,400 78,700 57,100 71,300 95,800 86,000 1985 75,500 88,900 58,900 75,200 95,400 90,800 1986 80,300 104,800 63,500 78,200 100,900 98,500 1987 85,600 133,300 66,000 80,400 113,200 106,300 1988 89,300 143,000 68,400 82,200 124,900 112,800 1989* 94,000 142,100 72,600 84,300 137,600 118,1001990 96,400 141,400 76,300 84,700 138,600 118,6001991 101,400 143,600 80,500 88,100 144,500 128,4001992 104,000 142,600 84,200 91,100 141,100 130,9001993 107,200 142,000 87,000 93,700 141,800 133,5001994 111,300 141,500 90,600 94,900 149,200 136,8001995 114,600 138,400 96,100 96,900 150,600 139,1001996 119,900 139,600 102,300 102,400 157,100 141,8001997 126,000 143,500 108,200 108,400 165,700 150,5001998 132,800 147,300 115,600 115,000 175,900 159,1001999 138,000 150,500 121,000 118,900 185,300 171,0002000 143,600 149,800 125,300 126,300 194,600 178,5002001 153,100 158,700 132,500 135,500 207,000 188,3002002 165,000 179,300 139,300 146,000 230,100 206,1002003 178,800 209,900 145,600 156,700 251,800 222,2002004 195,400 243,800 154,600 170,400 286,400 244,4002005 219,600 271,300 170,600 181,700 335,300 266,6002006 221,900 271,900 167,800 183,700 342,700 268,2002007 219,000 279,100 165,100 179,300 335,000 266,0002008 198,100 266,400 154,100 169,200 271,500 242,7002009 172,500 240,500 144,100 153,000 211,100 216,9002010 173,000 243,500 141,600 150,100 215,100 220,000
2009 Oct 172,000 235,700 144,700 149,600 219,800 217,200Nov 170,000 222,000 140,400 151,900 211,700 211,800Dec 170,500 240,700 135,300 148,400 216,200 218,700
2010 Jan 164,900 245,400 130,100 139,900 205,000 212,200Feb 164,600 254,200 128,600 140,100 200,600 208,700Mar 169,600 239,400 135,600 147,900 216,100 214,500Apr 172,300 243,100 140,900 149,200 217,200 217,300May 174,600 226,500 148,800 153,700 220,100 220,900Jun 183,000 253,000 155,800 159,400 220,500 230,000 Jul 182,100 263,000 151,100 156,000 223,800 231,700 Aug 177,500 256,200 147,200 152,600 217,500 226,000 Sep 171,500 239,000 139,300 148,500 217,200 218,300Oct 170,400 238,100 139,400 148,400 210,800 218,100Nov 170,200 242,000 138,600 146,700 212,600 218,100Dec 168,800 237,300 139,700 148,400 204,000 217,900

Historical Data77
Exhibit 10. Repeat Sales House Price Index: 1991–Present
FHFA = Federal Housing Finance Agency.1 Federal Housing Finance Agency. First quarter 1991 equals 100. http://www.fhfa.gov/Default.aspx?Page=142 S&P/Case-Shiller® National Home Price Index. First quarter 2000 equals 100. http://www.homeprice.standardandpoors.com
Quarterly Data
Annual Average1991 100.5 98.2 99.9 100.5 100.8 101.0 100.7 101.5 101.1 99.7 74.51992 102.8 96.7 101.3 102.4 104.5 103.8 104.2 105.9 106.5 99.2 75.01993 105.3 94.9 101.7 104.1 109.0 108.0 109.5 110.5 115.6 97.0 75.51994 109.0 95.8 102.3 107.3 115.1 112.5 115.5 115.9 127.2 97.1 77.71995 111.8 96.0 101.9 110.1 120.1 115.3 120.1 121.5 134.6 97.1 79.11996 115.4 98.5 102.7 113.6 125.3 118.6 125.4 127.7 140.5 98.6 80.91997 118.9 101.7 104.2 117.2 129.6 121.6 129.8 132.5 145.1 101.7 83.61998 124.6 109.0 108.0 122.2 134.5 127.4 136.7 138.1 150.9 108.7 88.71999 132.1 119.8 114.5 128.7 140.3 134.6 145.9 145.5 159.2 116.3 95.52000 140.8 134.1 123.5 136.4 145.0 142.6 155.9 153.3 168.7 126.6 104.52001 150.6 151.3 134.9 146.3 149.2 149.1 166.8 160.7 178.1 139.3 113.42002 161.2 170.6 149.9 157.4 153.9 154.3 177.1 168.0 186.0 154.6 123.72003 173.3 189.9 167.1 170.6 160.3 159.4 187.8 175.9 197.2 174.1 136.32004 188.4 210.5 186.8 189.4 167.9 165.8 198.4 184.2 217.1 200.2 155.22005 206.2 228.7 207.6 215.0 178.5 175.1 207.9 191.5 246.9 232.1 179.02006 218.6 230.8 220.4 230.1 191.3 187.7 214.6 194.8 272.8 254.9 188.32007 221.1 226.5 223.9 232.7 198.4 196.5 216.7 192.0 282.8 254.1 179.72008 207.5 215.7 218.3 214.8 195.3 197.2 210.2 182.9 264.0 209.1 151.32009 197.9 210.1 211.6 201.7 191.5 197.2 206.7 177.3 239.1 185.1 134.0
2009 Q3 196.9 207.4 209.9 200.9 191.0 196.6 205.8 176.4 236.6 184.8 135.4 Q4 196.4 208.4 210.1 198.6 191.6 197.5 206.1 174.5 233.3 186.9 136.1
2010 Q1 192.4 205.6 209.5 192.0 186.5 196.0 201.9 169.6 225.2 184.5 134.5 Q2 193.7 204.8 208.6 193.6 187.7 198.3 204.6 172.1 227.0 184.2 138.0 Q3 190.6 206.7 207.5 187.9 187.2 197.3 202.3 170.2 218.0 179.0 133.2
New Middle South
East West West East Case-
Period
United England Atlantic Atlantic
South South North North Mountain Pacific Shiller®
States Central Central Central Central Index2
FHFA Purchase-Only House Price Index (Seasonally Adjusted)1

Historical Data 78
*The composite affordability index is the ratio of median family income to qualifying income. Values over 100 indicate that the typical (median) family has more than sufficient income to purchase the median-priced home.ARM = Adjustable-rate mortgage. NA = Data are not available.1 The Federal Housing Finance Agency’s monthly effective mortgage rate amortizes points over 10 years. Annual data are averages of the monthly rates.2 Beginning in December 2008, the Adjustable-Rate Mortgage Affordability Index could not be derived because the rates for ARMs were not longer available.Source: NATIONAL ASSOCIATION OF REALTORS® http://www.realtor.org/research.nsf/pages/HousingInx
Exhibit 11. Housing Affordability Index: 1973–Present United States Affordability Indexes*
Period Composite Fixed ARM Mortgage
Rate1
Monthly Data
Annual Data
Median Price Median Income Existing Single- Family To Family ($) Income ($) Qualify ($)
1973 28,900 8.01 12,051 8,151 147.9 147.9 147.9 1974 32,000 9.02 12,902 9,905 130.3 130.3 130.3 1975 35,300 9.21 13,719 11,112 123.5 123.5 123.5 1976 38,100 9.11 14,958 11,888 125.8 125.8 125.8 1977 42,900 9.02 16,010 13,279 120.6 120.6 120.6 1978 48,700 9.58 17,640 15,834 111.4 111.4 111.4 1979 55,700 10.92 19,680 20,240 97.2 97.2 97.2 1980 62,200 12.95 21,023 26,328 79.9 79.9 79.9 1981 66,400 15.12 22,388 32,485 68.9 68.9 68.9 1982 67,800 15.38 23,433 33,713 69.5 69.4 69.7 1983 70,300 12.85 24,580 29,546 83.2 81.7 85.2 1984 72,400 12.49 26,433 29,650 89.1 84.6 92.1 1985 75,500 11.74 27,735 29,243 94.8 89.6 100.6 1986 80,300 10.25 29,458 27,047 108.9 105.7 116.3 1987 85,600 9.28 30,970 27,113 114.2 107.6 122.4 1988 89,300 9.31 32,191 28,360 113.5 103.6 122.0 1989 94,600 10.11 34,218 30,432 112.4 105.9 116.8 1990 97,300 10.04 35,353 31,104 113.7 110.6 122.8 1991 102,700 9.30 35,940 30,816 116.6 113.5 128.3 1992 105,500 8.11 36,573 28,368 128.9 124.9 150.8 1993 109,100 7.16 36,959 26,784 138.0 133.0 160.4 1994 113,500 7.47 38,790 28,704 135.1 125.2 153.3 1995 117,000 7.85 40,612 30,672 132.4 126.6 143.3 1996 122,600 7.71 42,305 31,728 133.3 129.6 142.9 1997 129,000 7.68 44,573 35,232 126.5 123.6 137.2 1998 136,000 7.10 46,740 35,088 133.2 131.9 142.6 1999 141,200 7.33 48,955 37,296 131.3 128.8 142.0 2000 147,300 8.03 50,733 41,616 121.9 120.5 133.3 2001 156,600 7.03 51,407 40,128 128.1 128.1 137.3 2002 167,600 6.55 51,680 40,896 126.4 124.2 138.7 2003 180,200 5.74 52,680 40,320 130.7 128.2 141.82004 195,200 5.73 54,061 43,632 123.9 120.3 132.22005 219,000 5.91 56,914 49,920 112.6 110.9 116.4 2006 221,900 6.58 58,407 54,288 107.6 107.1 109.6 2007 217,900 6.52 61,173 52,992 115.4 115.3 117.6 20082 196,600 6.15 63,366 45,984 137.8 137.4 143.0 2009 172,100 5.14 61,082 36,048 169.4 169.2 NA2010 173,200 4.89 61,583 35,280 174.6 169.5 NA
2009 Oct 172,000 5.10 61,101 35,856 170.4 169.7 NANov 169,300 5.09 61,396 35,280 174.0 173.3 NADec 169,600 5.00 61,713 34,944 176.6 175.4 NA
2010 Jan 163,800 5.08 60,711 34,080 178.1 177.9 NAFeb 163,900 5.13 60,775 34,272 177.3 176.3 NAMar 169,500 5.07 61,032 35,232 173.2 172.5 NAApr 172,500 5.10 61,299 35,952 170.5 169.8 NAMay 174,500 5.09 61,519 36,336 169.3 168.2 NAJun 183,500 5.02 61,526 37,920 162.3 161.8 NAJul 183,000 4.90 61,634 37,296 165.3 164.6 NAAug 178,100 4.76 61,927 35,712 173.4 172.5 NASep 172,400 4.68 61,858 34,272 180.5 180.0 NAOct 171,500 4.62 62,141 33,840 183.6 183.4 NANov 170,900 4.54 62,156 33,408 186.1 185.0 NADec 169,300 4.69 62,423 33,696 185.3 183.9 NA
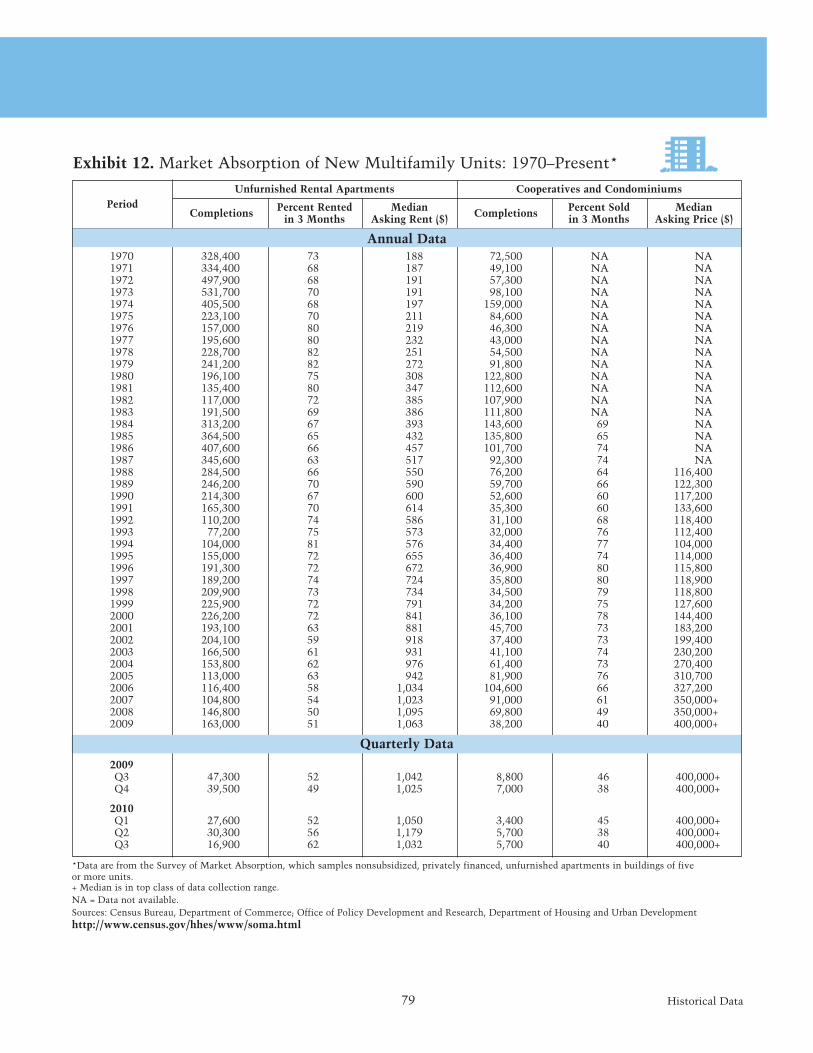
Historical Data79
Exhibit 12. Market Absorption of New Multifamily Units: 1970–Present*
*Data are from the Survey of Market Absorption, which samples nonsubsidized, privately financed, unfurnished apartments in buildings of five or more units.+ Median is in top class of data collection range.NA = Data not available.Sources: Census Bureau, Department of Commerce; Office of Policy Development and Research, Department of Housing and Urban Developmenthttp://www.census.gov/hhes/www/soma.html
1970 328,400 73 188 72,500 NA NA1971 334,400 68 187 49,100 NA NA1972 497,900 68 191 57,300 NA NA1973 531,700 70 191 98,100 NA NA1974 405,500 68 197 159,000 NA NA1975 223,100 70 211 84,600 NA NA1976 157,000 80 219 46,300 NA NA1977 195,600 80 232 43,000 NA NA1978 228,700 82 251 54,500 NA NA1979 241,200 82 272 91,800 NA NA1980 196,100 75 308 122,800 NA NA1981 135,400 80 347 112,600 NA NA1982 117,000 72 385 107,900 NA NA1983 191,500 69 386 111,800 NA NA1984 313,200 67 393 143,600 69 NA1985 364,500 65 432 135,800 65 NA1986 407,600 66 457 101,700 74 NA1987 345,600 63 517 92,300 74 NA1988 284,500 66 550 76,200 64 116,4001989 246,200 70 590 59,700 66 122,3001990 214,300 67 600 52,600 60 117,2001991 165,300 70 614 35,300 60 133,6001992 110,200 74 586 31,100 68 118,4001993 77,200 75 573 32,000 76 112,4001994 104,000 81 576 34,400 77 104,0001995 155,000 72 655 36,400 74 114,0001996 191,300 72 672 36,900 80 115,8001997 189,200 74 724 35,800 80 118,9001998 209,900 73 734 34,500 79 118,8001999 225,900 72 791 34,200 75 127,6002000 226,200 72 841 36,100 78 144,4002001 193,100 63 881 45,700 73 183,2002002 204,100 59 918 37,400 73 199,4002003 166,500 61 931 41,100 74 230,2002004 153,800 62 976 61,400 73 270,4002005 113,000 63 942 81,900 76 310,7002006 116,400 58 1,034 104,600 66 327,2002007 104,800 54 1,023 91,000 61 350,000+2008 146,800 50 1,095 69,800 49 350,000+2009 163,000 51 1,063 38,200 40 400,000+
PeriodUnfurnished Rental Apartments Cooperatives and Condominiums
Completions Percent Rented in 3 Months
Median Asking Rent ($) Completions Percent Sold
in 3 MonthsMedian
Asking Price ($)
Annual Data
Quarterly Data2009Q3 47,300 52 1,042 8,800 46 400,000+Q4 39,500 49 1,025 7,000 38 400,000+
2010Q1 27,600 52 1,050 3,400 45 400,000+Q2 30,300 56 1,179 5,700 38 400,000+Q3 16,900 62 1,032 5,700 40 400,000+

Historical Data 80
Exhibit 13. Builders’ Views of Housing Market Activity: 1979–Present
Current Activity Future Expectations
Sales of Single-Family Detached Homes
Housing Market Index
Prospective Buyer TrafficPeriod
NA = Not applicable.Source: Builders Economic Council Survey, National Association of Home Builders http://www.nahb.com/reference_list.aspx?sectionID=134
Annual Data
Monthly Data (Seasonally Adjusted)
1979 NA 48 37 321980 NA 19 26 17 1981 NA 8 16 141982 NA 15 28 181983 NA 52 60 481984 NA 52 52 411985 55 58 62 471986 60 62 67 531987 56 60 60 451988 53 57 59 431989 48 50 58 371990 34 36 42 271991 36 36 49 291992 48 50 59 391993 59 62 68 491994 56 61 62 441995 47 50 56 35 1996 57 61 64 46 1997 57 60 66 45 1998 70 76 78 54 1999 73 80 80 54 2000 62 69 69 45 2001 56 61 63 41 2002 61 66 69 46 2003 64 70 72 472004 68 75 76 512005 67 73 75 502006 42 45 51 302007 27 27 37 212008 16 16 25 142009 15 14 24 132010 16 16 23 12
2009 Oct 18 17 27 14Nov 17 17 28 13Dec 16 16 26 13
2010 Jan 15 15 26 12Feb 17 17 27 12Mar 15 15 24 10Apr 19 20 25 13May 22 23 27 16Jun 16 17 22 13Jul 14 15 21 10Aug 13 13 18 10Sep 13 13 18 9Oct 15 16 23 11Nov 16 16 25 12Dec 16 16 25 11

Historical Data81
Exhibit 14. Mortgage Interest Rates, Average Commitment Rates, and Points: 1973–Present
ARM = Adjustable-rate mortgage. NA = Not applicable.Source: Freddie Mac http://www.freddiemac.com/pmms/ (See 30-Year Fixed, 15-Year Fixed, and 1-Year Adjustable Rate Historic Tables.)
Period
Conventional
Rate Points Rate Points Rate Points
30-Year Fixed Rate 15-Year Fixed Rate 1-Year ARMs
Annual Data1973 8.04 1.0 NA NA NA NA1974 9.19 1.2 NA NA NA NA1975 9.05 1.1 NA NA NA NA1976 8.87 1.2 NA NA NA NA1977 8.85 1.1 NA NA NA NA1978 9.64 1.3 NA NA NA NA1979 11.20 1.6 NA NA NA NA1980 13.74 1.8 NA NA NA NA1981 16.63 2.1 NA NA NA NA1982 16.04 2.2 NA NA NA NA1983 13.24 2.1 NA NA NA NA1984 13.88 2.5 NA NA 11.51 2.5 1985 12.43 2.5 NA NA 10.05 2.5 1986 10.19 2.2 NA NA 8.43 2.3 1987 10.21 2.2 NA NA 7.83 2.2 1988 10.34 2.1 NA NA 7.90 2.3 1989 10.32 2.1 NA NA 8.80 2.3 1990 10.13 2.1 NA NA 8.36 2.1 1991 9.25 2.0 NA NA 7.09 1.9 1992 8.39 1.7 7.96 1.7 5.62 1.7 1993 7.31 1.6 6.83 1.6 4.58 1.5 1994 8.38 1.8 7.86 1.8 5.36 1.5 1995 7.93 1.8 7.48 1.8 6.06 1.5 1996 7.81 1.7 7.32 1.7 5.67 1.4 1997 7.60 1.7 7.13 1.7 5.61 1.4 1998 6.94 1.1 6.59 1.1 5.58 1.1 1999 7.44 1.0 7.06 1.0 5.99 1.1 2000 8.05 1.0 7.72 1.0 7.04 1.0 2001 6.97 0.9 6.50 0.9 5.82 0.9 2002 6.54 0.6 5.98 0.6 4.62 0.7 2003 5.83 0.6 5.17 0.6 3.76 0.6 2004 5.84 0.7 5.21 0.6 3.90 0.7 2005 5.87 0.6 5.42 0.6 4.49 0.7 2006 6.41 0.5 6.07 0.5 5.54 0.7 2007 6.34 0.4 6.03 0.4 5.56 0.6 2008 6.03 0.6 5.62 0.6 5.17 0.62009 5.04 0.7 4.57 0.7 4.70 0.62010 4.69 0.7 4.10 0.7 3.78 0.6 2009 Oct 4.95 0.7 4.39 0.6 4.55 0.5 Nov 4.88 0.7 4.34 0.6 4.41 0.6 Dec 4.93 0.7 4.39 0.6 4.31 0.6
2010 Jan 5.03 0.7 4.44 0.6 4.33 0.6 Feb 4.99 0.7 4.37 0.7 4.23 0.6 Mar 4.97 0.7 4.33 0.7 4.20 0.6Apr 5.10 0.7 4.42 0.6 4.16 0.5 May 4.89 0.7 4.28 0.7 4.01 0.6 Jun 4.74 0.7 4.18 0.7 3.86 0.7Jul 4.56 0.7 4.04 0.7 3.73 0.7 Aug 4.43 0.7 3.91 0.6 3.53 0.7 Sep 4.35 0.7 3.81 0.6 3.46 0.7 Oct 4.23 0.8 3.66 0.7 3.36 0.7 Nov 4.30 0.8 3.68 0.7 3.25 0.7 Dec 4.71 0.7 4.06 0.7 3.31 0.6
Monthly Data
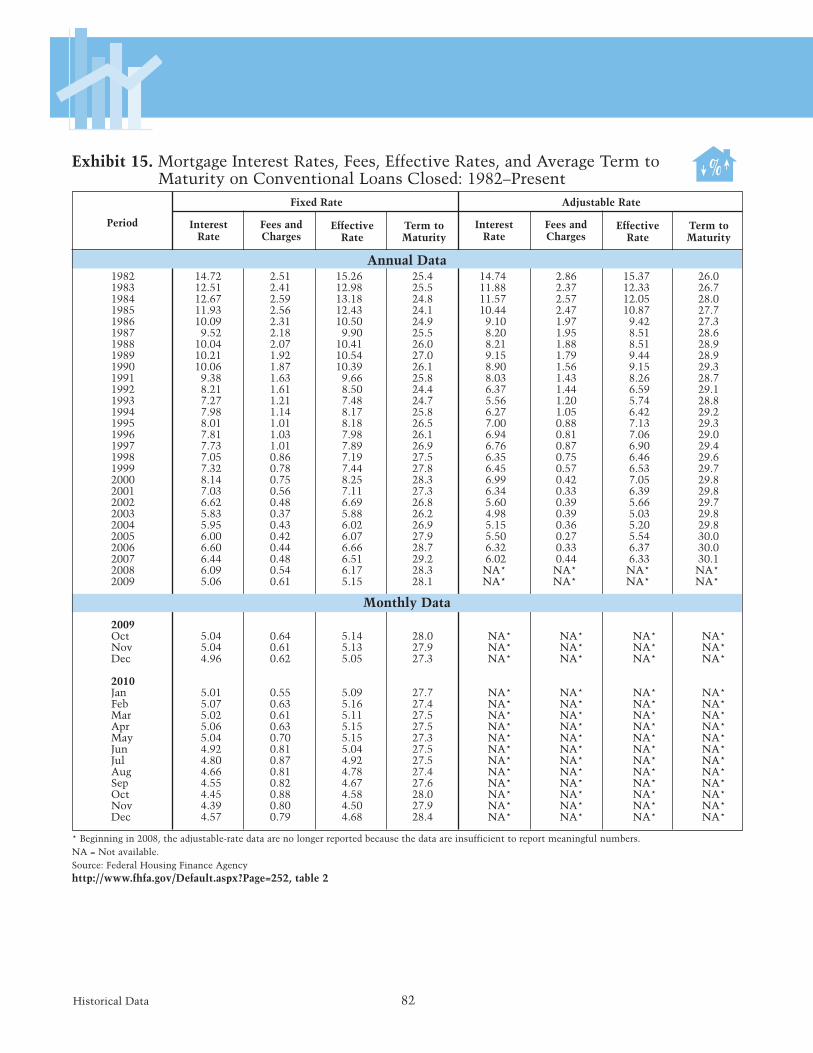
Historical Data 82
1982 14.72 2.51 15.26 25.4 14.74 2.86 15.37 26.0 1983 12.51 2.41 12.98 25.5 11.88 2.37 12.33 26.7 1984 12.67 2.59 13.18 24.8 11.57 2.57 12.05 28.0 1985 11.93 2.56 12.43 24.1 10.44 2.47 10.87 27.7 1986 10.09 2.31 10.50 24.9 9.10 1.97 9.42 27.3 1987 9.52 2.18 9.90 25.5 8.20 1.95 8.51 28.6 1988 10.04 2.07 10.41 26.0 8.21 1.88 8.51 28.9 1989 10.21 1.92 10.54 27.0 9.15 1.79 9.44 28.9 1990 10.06 1.87 10.39 26.1 8.90 1.56 9.15 29.3 1991 9.38 1.63 9.66 25.8 8.03 1.43 8.26 28.7 1992 8.21 1.61 8.50 24.4 6.37 1.44 6.59 29.1 1993 7.27 1.21 7.48 24.7 5.56 1.20 5.74 28.8 1994 7.98 1.14 8.17 25.8 6.27 1.05 6.42 29.21995 8.01 1.01 8.18 26.5 7.00 0.88 7.13 29.3 1996 7.81 1.03 7.98 26.1 6.94 0.81 7.06 29.0 1997 7.73 1.01 7.89 26.9 6.76 0.87 6.90 29.4 1998 7.05 0.86 7.19 27.5 6.35 0.75 6.46 29.6 1999 7.32 0.78 7.44 27.8 6.45 0.57 6.53 29.7 2000 8.14 0.75 8.25 28.3 6.99 0.42 7.05 29.8 2001 7.03 0.56 7.11 27.3 6.34 0.33 6.39 29.8 2002 6.62 0.48 6.69 26.8 5.60 0.39 5.66 29.7 2003 5.83 0.37 5.88 26.2 4.98 0.39 5.03 29.8 2004 5.95 0.43 6.02 26.9 5.15 0.36 5.20 29.8 2005 6.00 0.42 6.07 27.9 5.50 0.27 5.54 30.0 2006 6.60 0.44 6.66 28.7 6.32 0.33 6.37 30.0 2007 6.44 0.48 6.51 29.2 6.02 0.44 6.33 30.1 2008 6.09 0.54 6.17 28.3 NA* NA* NA* NA*2009 5.06 0.61 5.15 28.1 NA* NA* NA* NA*
2009 Oct 5.04 0.64 5.14 28.0 NA* NA* NA* NA*Nov 5.04 0.61 5.13 27.9 NA* NA* NA* NA*Dec 4.96 0.62 5.05 27.3 NA* NA* NA* NA*
2010 Jan 5.01 0.55 5.09 27.7 NA* NA* NA* NA*Feb 5.07 0.63 5.16 27.4 NA* NA* NA* NA*Mar 5.02 0.61 5.11 27.5 NA* NA* NA* NA*Apr 5.06 0.63 5.15 27.5 NA* NA* NA* NA*May 5.04 0.70 5.15 27.3 NA* NA* NA* NA*Jun 4.92 0.81 5.04 27.5 NA* NA* NA* NA*Jul 4.80 0.87 4.92 27.5 NA* NA* NA* NA*Aug 4.66 0.81 4.78 27.4 NA* NA* NA* NA*Sep 4.55 0.82 4.67 27.6 NA* NA* NA* NA*Oct 4.45 0.88 4.58 28.0 NA* NA* NA* NA*Nov 4.39 0.80 4.50 27.9 NA* NA* NA* NA*Dec 4.57 0.79 4.68 28.4 NA* NA* NA* NA*
Exhibit 15. Mortgage Interest Rates, Fees, Effective Rates, and Average Term to Ma tu ri ty on Conventional Loans Closed: 1982–Present
Period
* Beginning in 2008, the adjustable-rate data are no longer reported because the data are insufficient to report meaningful numbers.NA = Not available.Source: Federal Housing Finance Agencyhttp://www.fhfa.gov/Default.aspx?Page=252, table 2
Annual Data
Interest Fees and Interest Fees and Rate Charges Rate Charges
Fixed Rate Adjustable Rate
Effective Term to Effective Term to Rate Maturity Rate Maturity
Monthly Data

Historical Data83
Annual Data
Annual Data
Exhibit 16. FHA Market Share of 1- to 4-Family Mortgages: 2001–Present*
Mortgage Market Shares by Dollar Volume
Dollar Volume of Loan Originations (in Billions)
FHA Share (%) Total ($) Purchase ($) Refinance ($)
Period Total Purchase Refinance FHA Market FHA Market FHA Market
Mortgage Market Shares by Loan Count
Loan Originations (in Thousands)
FHA Share (%) Total Purchase Refinance
Period Total Purchase Refinance FHA Market FHA Market FHA Market
* This analysis includes first-lien mortgages originated in each time period. The amounts represented here are based on date of loan origination and thus will vary from what are shown in reports that summarize FHA insurance activity by insurance endorsement date.FHA = Federal Housing Administration.Sources: U.S. Department of Housing and Urban Department; data from FHA, Mortgage Bankers Association “MBA Mortgage Finance Forecast” report, and Loan Performance True Standings Servicing data system
Quarterly Data
Quarterly Data
2001 6.8 10.4 4.1 152 2,243 100 960 53 1,283 2002 4.9 8.2 2.9 140 2,854 90 1,097 50 1,7572003 4.0 6.1 3.0 153 3,812 78 1,280 75 2,532 2004 3.0 4.3 1.9 84 2,773 56 1,309 28 1,463 2005 1.9 2.6 1.1 56 3,027 40 1,512 16 1,514 2006 2.0 2.7 1.3 55 2,726 38 1,399 17 1,326 2007 3.4 3.9 2.9 77 2,306 44 1,140 33 1,166 2008 16.1 19.5 12.9 243 1,509 143 731 100 777 2009 17.9 28.1 12.8 357 1,995 187 664 171 1,331
2001 9.1 14.2 5.3 1,336.6 14,763.6 890.2 6,270.7 446.4 8,492.82002 6.4 11.1 3.6 1,188.6 18,552.8 764.7 6,865.5 423.9 11,687.32003 5.5 8.5 4.1 1,268.5 23,101.8 629.9 7,428.0 638.5 15,673.8 2004 4.7 6.6 3.0 695.4 14,869.2 457.4 6,905.6 238.0 7,963.6 2005 3.1 4.5 1.8 456.2 14,483.6 322.9 7,234.6 133.3 7,249.0 2006 3.3 4.5 2.0 411.1 12,329.0 295.3 6,564.5 115.9 5,764.5 2007 5.1 6.1 4.1 528.3 10,358.6 317.2 5,236.1 211.1 5,122.5 2008 19.8 24.1 15.6 1,405.7 7,092.2 844.9 3,508.2 560.8 3,584.1 2009 21.1 32.6 14.8 1,982.6 9,392.8 1,087.6 3,338.3 895.0 6,054.4
2009 Q3 18.2 26.0 12.3 89 491 55 211 34 280 Q4 17.4 34.0 10.2 90 520 53 156 37 364
2010 Q1 16.2 29.3 9.2 56 342 35 120 20 222 Q2 21.3 40.9 8.2 78 367 60 147 18 220 Q3 16.8 35.3 10.4 68 401 37 104 31 297
2009 Q3 21.6 30.3 14.5 502.2 2,327.4 316.9 1,046.8 185.3 1,280.6 Q4 20.8 38.8 12.0 506.4 2,437.1 309.7 797.7 196.7 1,639.4
2010 Q1 19.2 33.7 10.7 310.6 1,616.9 201.2 597.3 109.4 1,019.6 Q2 25.4 47.0 9.5 449.8 1,771.8 353.0 750.5 96.7 1,021.3 Q3 19.2 40.9 11.1 354.3 1,843.0 204.7 500.9 149.5 1,342.1

Historical Data 84
Annual Data
Exhibit 17. FHA, VA, and PMI 1- to 4-Family Mortgage Insurance Activity: 1971–Present
VA PMI Guaranties CertificatesApplications
Period Total Purchase Endorsements Endorsements
*These operational numbers differ slightly from adjusted accounting numbers. FHA = Federal Housing Administration. NA = Data not available. PMI = Private mortgage insurance. VA = Department of Veterans Affairs.1 Beginning December 2008, data for PMI-Net Certificates include Radian Guaranty, which represents roughly 17 percent of the private insurance market.Sources: FHA—Office of Housing, Department of Housing and Urban Development; VA—Department of Veterans Affairs; PMI—Mortgage Insurance Companies of America
FHA*
Monthly Data
1971 998,365 565,417 NA 284,358 NA 1972 655,747 427,858 NA 375,485 NA 1973 359,941 240,004 NA 321,522 NA 1974 383,993 195,850 NA 313,156 NA 1975 445,350 255,061 NA 301,443 NA 1976 491,981 250,808 NA 330,442 NA 1977 550,168 321,118 NA 392,557 NA 1978 627,971 334,108 NA 368,648 NA 1979 652,435 457,054 NA 364,656 NA 1980 516,938 381,169 359,151 274,193 392,808 1981 299,889 224,829 204,376 151,811 334,565 1982 461,129 166,734 143,931 103,354 315,868 1983 776,893 503,425 455,189 300,568 652,214 1984 476,888 267,831 235,847 210,366 946,408 1985 900,119 409,547 328,639 201,313 729,597 1986 1,907,316 921,370 634,491 351,242 585,987 1987 1,210,257 1,319,987 866,962 455,616 511,058 1988 949,353 698,990 622,873 212,671 423,470 1989 989,724 726,359 649,596 183,209 365,497 1990 957,302 780,329 726,028 192,992 367,120 1991 898,859 685,905 620,050 186,561 494,259 1992 1,090,392 680,278 522,738 290,003 907,511 1993 1,740,504 1,065,832 591,243 457,596 1,198,307 1994 961,466 1,217,685 686,487 536,867 1,148,696 1995 857,364 568,399 516,380 243,719 960,756 1996 1,064,324 849,861 719,517 326,458 1,068,707 1997 1,115,434 839,712 745,524 254,670 974,698 1998 1,563,394 1,110,530 796,779 384,605 1,473,344 1999 1,407,014 1,246,433 949,516 441,606 1,455,403 2000 1,154,622 891,874 826,708 186,671 1,236,214 2001 1,760,278 1,182,368 818,035 281,505 1,987,717 2002 1,521,730 1,246,561 805,198 328,506 2,305,709 2003 1,634,166 1,382,570 677,507 513,259 2,493,4352004 945,565 826,611 502,302 262,781 1,708,9722005 673,855 523,243 332,912 160,294 1,579,593 2006 653,910 465,379 264,074 137,874 1,444,3302007 751,454 460,317 231,750 102,430 1,567,96120081 2,340,715 1,468,057 810,712 199,679 971,5952009 2,862,029 2,022,759 1,039,216 354,926 442,224 2010 2,162,738 1,624,841 1,001,979 327,836 317,037
2009 Oct 253,503 176,279 105,901 29,337 24,339 Nov 205,808 157,119 92,936 24,306 21,877 Dec 141,766 179,155 106,137 27,488 19,989
2010 Jan 126,043 158,612 90,300 26,161 14,378 Feb 165,239 131,978 73,038 20,775 14,924 Mar 246,406 132,301 82,879 23,414 22,153 Apr 215,578 126,316 84,723 23,779 23,608 May 181,524 124,759 89,291 22,754 25,909 Jun 168,915 150,911 115,831 27,850 28,160 Jul 173,068 144,514 108,608 28,477 26,266 Aug 200,907 139,045 89,322 29,815 32,215 Sep 255,938 126,326 71,145 29,855 32,554 Oct 175,421 125,218 65,781 31,357 31,998 Nov 141,199 131,258 64,896 31,878 32,993 Dec 112,500 133,603 66,165 31,721 31,879

Historical Data85
Annual Data
Mortgage Mortgage Mortgage Amount Amount Amount
Congregate Housing, Nursing Homes, Assisted-Living Facilities,
and Board and Care Facilities3
Exhibit 18. FHA Unassisted Multifamily Mortgage Insurance Activity: 1980–Present*
Construction of Purchase or Refinance of New Rental Units1 Existing Rental Units2
Period
*Mortgage insurance written—initial endorsements. Mortgage amounts are in millions of dollars.1 Includes both new construction and substantial rehabilitation under Sections 207, 220, and 221(d).2 Includes purchase or refinance of existing rental housing under Section 223.3 Includes congregate rental housing for the elderly under Section 231 and nursing homes, board and care homes, assisted-living facilities, andintermediate-care facilities under Section 232. Includes both new construction or substantial rehabilitation and purchase or refinance of existing projects. Number of units shown includes beds and housing units.Source: Office of Multifamily Housing Development (FHA F–47 Data Series), Department of Housing and Urban Development
Projects Units Projects Units Projects Units
1980 79 14,671 560.8 32 6,459 89.1 25 3,187 78.11981 94 14,232 415.1 12 2,974 43.0 35 4,590 130.01982 98 14,303 460.4 28 7,431 95.2 50 7,096 200.01983 74 14,353 543.9 94 22,118 363.0 65 9,231 295.81984 96 14,158 566.2 88 21,655 428.2 45 5,697 175.21985 144 23,253 954.1 135 34,730 764.3 41 5,201 179.11986 154 22,006 1,117.5 245 32,554 1,550.1 22 3,123 111.21987 171 28,300 1,379.4 306 68,000 1,618.0 45 6,243 225.71988 140 21,180 922.2 234 49,443 1,402.3 47 5,537 197.11989 101 15,240 750.9 144 32,995 864.6 41 5,183 207.91990 61 9,910 411.4 69 13,848 295.3 53 6,166 263.21991 72 13,098 590.2 185 40,640 1,015.1 81 10,150 437.21992 54 7,823 358.5 119 24,960 547.1 66 8,229 367.41993 56 9,321 428.6 262 50,140 1,209.4 77 9,036 428.61994 84 12,988 658.5 321 61,416 1,587.0 94 13,688 701.71995 89 17,113 785.0 192 32,383 822.3 103 12,888 707.21996 128 23,554 1,178.8 268 51,760 1,391.1 152 20,069 927.5 1997 147 23,880 1,362.2 186 31,538 1,098.5 143 16,819 820.0 1998 149 25,237 1,420.7 158 19,271 576.3 89 7,965 541.0 1999 185 30,863 1,886.8 182 22,596 688.7 130 14,592 899.2 2000 193 35,271 2,171.7 165 20,446 572.6 178 18,618 891.7 2001 163 29,744 1,905.6 303 35,198 831.9 172 20,633 1,135.2 2002 167 31,187 2,042.7 439 52,434 1,284.5 287 33,086 1,780.62003 180 30,871 2,224.5 701 87,193 2,273.5 253 31,126 1,502.2 2004 166 27,891 1,802.6 672 70,740 2,203.1 228 26,094 1,344.32005 148 24,847 1,596.3 472 49,238 1,724.9 184 20,625 1,080.4 2006 97 14,603 873.3 614 59,451 2,252.5 228 26,898 1,425.6 2007 102 15,620 1,065.7 414 35,838 1,249.8 139 15,178 982.0 2008 74 11,551 875.1 262 25,443 987.8 174 19,685 1,232.4 2009 114 20,173 1,892.5 409 57,863 2,888.4 292 34,567 2,558.7 2010 (12 months) 197 36,560 3,787.1 717 116,843 6,497.4 300 34,754 2,636.4

Historical Data 86
Exhibit 19. Mortgage Delinquencies and Foreclosures Started: 1986–Present*
HUD has discontinued publishing historical NDS data in tabular format at MBA's request; hence, the table is being replaced with charts showing the same historical information.
0
5
10
15
20
25
30
35
1986
1987
1988
1989
1990
1991
1992
1993
1994
1995
1996
1997
1998
1999
2000
2001
2002
2003
2004
2005
2006
2007
2008
2009
2010
Q2
2010
Q3
2009
Q3
2009
Q4
2010
Q1
1986
1987
1988
1989
1990
1991
1992
1993
1994
1995
1996
1997
1998
1999
2000
2001
2002
2003
2004
2005
2006
2007
2008
2009
2010
Q2
2010
Q3
2009
Q3
2009
Q4
2010
Q1
Delinquency Rates: Total Past Due
All Loans Prime Subprime Subprime ARMs FHA Loans VA Loans
Annual Averages and Quarterly Data
0
5
10
15
20
25Delinquency Rates: 90 Days Past Due
1.0
0.5
0.0
2.0
1.5
3.0
3.5
2.5
4.0
4.5
5.0
5.5
6.0
6.5
7.0
Foreclosures Started
Per
cent
P
erce
nt
Per
cent
All Loans Prime Subprime Subprime ARMs FHA Loans VA Loans
Annual Averages and Quarterly Data
1986
1987
1988
1989
1990
1991
1992
1993
1994
1995
1996
1997
1998
1999
2000
2001
2002
2003
2004
2005
2006
2007
2008
2009
2010
Q2
2010
Q3
2009
Q3
2009
Q4
2010
Q1
All Loans Prime Subprime Subprime ARMs FHA Loans VA Loans
Annual Averages and Quarterly Data
0
5
10
15
20
25
30
35
1986
1987
1988
1989
1990
1991
1992
1993
1994
1995
1996
1997
1998
1999
2000
2001
2002
2003
2004
2005
2006
2007
2008
2009
2010
Q2
2010
Q3
2009
Q3
2009
Q4
2010
Q1
1986
1987
1988
1989
1990
1991
1992
1993
1994
1995
1996
1997
1998
1999
2000
2001
2002
2003
2004
2005
2006
2007
2008
2009
2010
Q2
2010
Q3
2009
Q3
2009
Q4
2010
Q1
Delinquency Rates: Total Past Due
All Loans Prime Subprime Subprime ARMs FHA Loans VA Loans
Annual Averages and Quarterly Data
0
5
10
15
20
25Delinquency Rates: 90 Days Past Due
1.0
0.5
0.0
2.0
1.5
3.0
3.5
2.5
4.0
4.5
5.0
5.5
6.0
6.5
7.0
Foreclosures Started
Per
cent
P
erce
nt
Per
cent
All Loans Prime Subprime Subprime ARMs FHA Loans VA Loans
Annual Averages and Quarterly Data
1986
1987
1988
1989
1990
1991
1992
1993
1994
1995
1996
1997
1998
1999
2000
2001
2002
2003
2004
2005
2006
2007
2008
2009
2010
Q2
2010
Q3
2009
Q3
2009
Q4
2010
Q1
All Loans Prime Subprime Subprime ARMs FHA Loans VA Loans
Annual Averages and Quarterly Data

Historical Data87
* All data are seasonally adjusted except for Foreclosures Started data.ARM = Adjustable-rate mortgage. FHA = Federal Housing Administration. HUD = Department of Housing and Urban Development. MBA = Mortgage Bankers Association. NDS = National Delinquency Survey. VA = Department of Veterans Affairs.HUD has discontinued publishing historical NDS data in tabular format at the request of MBA.Source: National Delinquency Survey, Mortgage Bankers Association
0
5
10
15
20
25
30
35
1986
1987
1988
1989
1990
1991
1992
1993
1994
1995
1996
1997
1998
1999
2000
2001
2002
2003
2004
2005
2006
2007
2008
2009
2010
Q2
2010
Q3
2009
Q3
2009
Q4
2010
Q1
1986
1987
1988
1989
1990
1991
1992
1993
1994
1995
1996
1997
1998
1999
2000
2001
2002
2003
2004
2005
2006
2007
2008
2009
2010
Q2
2010
Q3
2009
Q3
2009
Q4
2010
Q1
Delinquency Rates: Total Past Due
All Loans Prime Subprime Subprime ARMs FHA Loans VA Loans
Annual Averages and Quarterly Data
0
5
10
15
20
25Delinquency Rates: 90 Days Past Due
1.0
0.5
0.0
2.0
1.5
3.0
3.5
2.5
4.0
4.5
5.0
5.5
6.0
6.5
7.0
Foreclosures Started
Per
cent
P
erce
nt
Per
cent
All Loans Prime Subprime Subprime ARMs FHA Loans VA Loans
Annual Averages and Quarterly Data
1986
1987
1988
1989
1990
1991
1992
1993
1994
1995
1996
1997
1998
1999
2000
2001
2002
2003
2004
2005
2006
2007
2008
2009
2010
Q2
2010
Q3
2009
Q3
2009
Q4
2010
Q1
All Loans Prime Subprime Subprime ARMs FHA Loans VA Loans
Annual Averages and Quarterly Data

Historical Data 88
Exhibit 20. Value of New Construction Put in Place, Private Residential Buildings: 1974–Present
Improvements
New Residential Construction
Total Single-Family Multifamily Structures Structures
Period Total
*Effective with the May 2008 data, expenditures on private residential improvements to rental, vacant, and seasonal properties are not included in the construction spending data. To allow comparable time series analysis, these expenditures have been removed from historic data back to January 1993.NA = Data available only annually.Source: Census Bureau, Department of Commerce http://www.census.gov/const/C30/PRIVSAHIST.xls
Annual Data (Current Dollars in Millions)
Monthly Data (Seasonally Adjusted Annual Rates)
1974 55,967 43,420 29,700 13,720 12,547 1975 51,581 36,317 29,639 6,679 15,264 1976 68,273 50,771 43,860 6,910 17,502 1977 92,004 72,231 62,214 10,017 19,773 1978 109,838 85,601 72,769 12,832 24,237 1979 116,444 89,272 72,257 17,015 27,172 1980 100,381 69,629 52,921 16,708 30,752 1981 99,241 69,424 51,965 17,460 29,817 1982 84,676 57,001 41,462 15,838 27,675 1983 125,833 94,961 72,514 22,447 30,872 1984 155,015 114,616 86,395 28,221 40,399 1985 160,520 115,888 87,350 28,539 44,632 1986 190,677 135,169 104,131 31,038 55,508 1987 199,652 142,668 117,216 25,452 56,984 1988 204,496 142,391 120,093 22,298 62,105 1989 204,255 143,232 120,929 22,304 61,023 1990 191,103 132,137 112,886 19,250 58,966 1991 166,251 114,575 99,427 15,148 51,676 1992 199,393 135,070 121,976 13,094 64,323 1993* 208,180 150,911 140,123 10,788 57,269 1994 241,033 176,390 162,309 14,081 64,643 1995 228,121 171,404 153,515 17,889 56,717 1996 257,495 191,114 170,790 20,324 66,381 1997 264,696 198,062 175,179 22,883 66,634 1998 296,343 223,983 199,409 24,574 72,360 1999 326,302 251,271 223,837 27,434 75,031 2000 346,138 265,047 236,788 28,259 81,091 2001 364,414 279,391 249,086 30,305 85,023 2002 396,696 298,841 265,889 32,952 97,855 2003 446,035 345,691 310,575 35,116 100,344 2004 532,900 417,501 377,557 39,944 115,399 2005 611,899 480,807 433,510 47,297 131,092 2006 613,731 468,800 415,997 52,803 144,931 2007 493,246 354,143 305,184 48,959 139,103 2008 350,257 230,114 185,776 44,338 120,144 2009 245,621 133,582 105,336 28,246 112,0382010 241,403 126,778 112,783 13,995 114,625
2009 Oct 252,987 130,552 108,914 21,638 NANov 248,980 130,411 110,380 20,031 NADec 242,961 130,617 112,141 18,476 NA 2010 Jan 266,164 129,933 113,623 16,310 NAFeb 248,735 130,459 114,990 15,469 NAMar 249,340 131,231 116,852 14,379 NAApr 264,229 133,974 120,080 13,894 NAMay 251,813 132,766 119,517 13,249 NAJun 247,698 130,935 117,651 13,284 NAJul 237,604 128,894 115,100 13,794 NAAug 222,772 123,270 110,201 13,069 NASep 225,441 121,061 107,229 13,832 NAOct 234,424 119,983 106,452 13,531 NANov 236,109 120,941 106,837 14,104 NADec 226,377 120,724 107,367 13,357 NA

Historical Data89
Exhibit 21. Gross Domestic Product and Residential Fixed Investment: 1960–Present
Source: Bureau of Economic Analysis, Department of Commercehttp://www.bea.doc.gov/bea/newsrel/gdpnewsrelease.htm (See Table 3 in pdf.)
Quarterly Data (Seasonally Adjusted Annual Rates)
Gross Residential Residential Fixed Investment Domestic Fixed Percent of Product Investment Gross Domestic Product
Period
Annual Data (Current Dollars in Billions)1960 526.4 26.3 5.01961 544.7 26.4 4.81962 585.6 29.0 5.01963 617.7 32.1 5.21964 663.6 34.3 5.21965 719.1 34.2 4.81966 787.8 32.3 4.11967 832.6 32.4 3.91968 910.0 38.7 4.31969 984.6 42.6 4.31970 1,038.5 41.4 4.01971 1,127.1 55.8 5.01972 1,238.3 69.7 5.61973 1,382.7 75.3 5.41974 1,500.0 66.0 4.41975 1,638.3 62.7 3.81976 1,825.3 82.5 4.51977 2,030.9 110.3 5.41978 2,294.7 131.6 5.71979 2,563.3 141.0 5.51980 2,789.5 123.2 4.41981 3,128.4 122.6 3.91982 3,255.0 105.7 3.21983 3,536.7 152.9 4.31984 3,933.2 180.6 4.61985 4,220.3 188.2 4.51986 4,462.8 220.1 4.91987 4,739.5 233.7 4.91988 5,103.8 239.3 4.71989 5,484.4 239.5 4.41990 5,803.1 224.0 3.91991 5,995.9 205.1 3.41992 6,337.7 236.3 3.71993 6,657.4 266.0 4.01994 7,072.2 301.9 4.31995 7,397.7 302.8 4.11996 7,816.9 334.1 4.31997 8,304.3 349.1 4.21998 8,793.5 385.9 4.41999 9,353.5 425.8 4.62000 9,951.5 449.0 4.52001 10,286.2 472.4 4.62002 10,642.3 509.5 4.82003 11,142.1 577.6 5.22004 11,867.8 680.6 5.72005 12,638.4 775.0 6.12006 13,398.9 761.9 5.72007 14,061.8 628.6 4.52008 14,369.1 472.5 3.32009 14,119.0 352.1 2.52010 14,660.2 340.4 2.3
2009 Q4 14,277.3 351.0 2.5 2010 Q1 14,446.4 340.2 2.4 Q2 14,578.7 357.2 2.5 Q3 14,745.1 329.8 2.2 Q4 14,870.4 334.3 2.2

Historical Data 90
Exhibit 22. Net Change in Number of Households by Age of Householder: 1971–Present*
Less Than 25 to 29 30 to 34 35 to 44 45 to 54 55 to 64 65 Years 25 Years Years Years Years Years Years and Older Period Total
*Units in thousands. NA = Not available.r Implementation of new March Current Population Survey (CPS) processing system.1 Data from 1971 to 1979 weighted based on the 1970 decennial census.2 Data from 1980 to 1992 weighted based on the 1980 decennial census.3 Beginning in 1993, CPS data weighted based on the 1990 decennial census.4 Beginning in 2002, CPS data weighted based on 2000 decennial census data and housing unit controls.5 Beginning in 2010, CPS data weighted based on vintage 2009 housing estimates.Source: Current Population Survey, Census Bureau, Department of Commerce (The source of annual data is the Current Population Survey March Supplement. The quarterly data source is the monthly Current Population Survey/Housing Vacancy Survey.)
Annual Data
Quarterly Data
19711 848 NA NA NA NA NA NA NA1972 1,898 NA NA NA NA NA NA NA1973 1,575 282 320 438 191 49 76 218 1974r 1,554 351 395 321 (15) 134 (75) 448 1975 1,358 39 305 366 181 (38) 162 342 1976 1,704 11 484 78 341 (81) 332 539 1977 1,275 114 87 570 255 85 149 141978 1,888 229 213 451 487 (303) 403 4091979 1,300 122 81 84 359 (17) 101 57019802 3,446 228 573 935 652 69 241 7491981 1,592 (127) 262 387 482 40 179 368 1982 1,159 (333) 11 163 864 (189) 243 400 1983 391 (415) (60) (163) 694 (151) 127 3591984r 1,372 (237) 332 350 549 169 54 1561985 1,499 (20) (160) 388 912 105 (55) 3281986 1,669 65 144 252 516 471 (221) 4411987 1,021 (306) (129) 221 706 112 16 4021988r 1,645 109 (44) 163 624 389 (10) 4141989 1,706 109 16 287 625 418 (53) 3041990 517 (294) (201) (251) 602 496 (276) 4401991 965 (239) (177) 28 750 237 (5) 3711992 1,364 (23) (433) 120 474 796 36 39419933 750 398 46 1 84 866 (406) (239)1994 681 8 (387) 47 431 424 34 1241995 1,883 179 (72) (193) 621 753 36 559 1996 637 (162) (46) (181) 312 418 177 121 1997 1,391 (122) 293 (204) 597 835 68 (78) 1998 1,510 275 (184) (97) 120 704 603 89 1999 1,346 335 56 (270) 25 611 499 92 2000 831 90 1 (193) (13) 769 21 156 2001 1,244 297 (96) 50 (218) 917 284 11 20024 1,249 111 131 193 (586) 182 949 277 2003 669 73 (12) (85) (221) 224 654 37 2004 1,367 119 306 (187) (249) 435 766 181 2005 1,725 2 306 (277) 57 493 817 328 2006 1,082 27 164 (184) (299) 454 642 276 2007 455 (101) 173 (98) (436) 149 554 215 2008 286 (269) (143) (75) (260) 120 558 347 2009 522 (133) 30 36 (520) 206 426 4742010 701 (35) (20) 163 (535) (15) 667 480
2009 Q4 148 176 (194) 262 (225) (99) 81 146
20105 Q1 36 (55) 118 (104) (241) 141 (149) 327 Q2 261 (169) 61 (46) 61 (59) 380 33 Q3 247 73 (193) 142 (180) (41) 440 6 Q4 537 119 88 165 42 (220) 94 249

Historical Data91
Husband-Wife
Exhibit 23. Net Change in Number of Households by Type of Household: 1971–Present*
Non-Family One-Person Households Households
With Without Children Children
Other Other Male Female Headed Headed
Male Female Headed Headed
Male Female Period Total
*Units in thousands. NA = Not available.r Implementation of new March Current Population Survey (CPS) processing system.1 Data from 1971 to 1979 weighted based on the 1970 decennial census.2 Data from 1980 to 1992 weighted based on the 1980 decennial census.3 Beginning in 1993, CPS data weighted based on the 1990 decennial census.4 Beginning in 2002, CPS data weighted based on 2000 decennial census data and housing unit controls.5 Beginning in 2010, CPS data weighted based on vintage 2009 housing estimates.6 Primary families only.Source: Current Population Survey, Census Bureau, Department of Commerce (The source of annual data is the Current Population Survey March Supplement. The quarterly data source is the monthly Current Population Survey/Housing Vacancy Survey.)
Families6
Annual Data
Quarterly Data
19711 848 NA NA NA NA NA NA NA NA1972 1,898 NA NA NA NA NA NA NA NA1973 1,575 NA NA NA NA NA NA NA NA 1974r 1,554 NA NA NA NA NA NA NA NA1975 1,358 NA NA NA NA NA NA NA NA 1976 1,704 NA NA NA NA NA NA NA NA 1977 1,275 (191) 366 36 206 199 109 223 3261978 1,888 (228) 114 103 497 126 93 713 4701979 1,300 (91) 396 53 182 143 131 112 37519802 3,446 426 1,024 115 485 240 60 502 5921981 1,592 56 126 201 377 184 9 287 3531982 1,159 (393) 730 53 322 (50) 81 229 1891983 391 (2) 278 31 65 87 33 (31) (73)1984r 1,372 (60) 234 21 427 142 14 35 5621985 1,499 (178) 447 189 233 (12) 62 436 3191986 1,669 458 125 187 81 171 71 363 2131987 1,021 75 529 96 235 43 95 (39) (12)1988r 1,645 (107) 244 344 243 62 51 557 2491989 1,706 135 290 0 196 213 99 390 3851990 517 (123) 341 30 5 (124) 97 (144) 4351991 965 (66) (104) 28 373 143 (1) 401 1911992 1,364 (53) 363 114 430 115 12 163 22019933 750 550 83 44 364 37 87 (169) (247)1994 681 207 (128) (145) 340 170 185 (4) 571995 1,883 250 439 308 (182) 28 (80) 700 421 1996 637 (333) 43 286 295 11 169 148 20 1997 1,391 153 (117) 340 270 204 37 154 349 1998 1,510 246 467 61 (136) (143) 89 568 356 1999 1,346 (211) 663 63 139 280 132 (44) 323 2000 831 149 392 48 (98) 58 165 215 (97) 2001 1,244 (75) (9) 250 23 67 84 421 485 20024 1,249 (137) 615 150 82 (45) 11 325 257 2003 669 (20) 298 50 92 31 28 143 47 2004 1,367 (55) 435 299 216 51 (10) 206 227 2005 1,725 (94) 321 193 467 79 58 442 260 2006 1,082 2 153 42 136 84 93 422 146 2007 455 (164) 246 (26) 69 77 (86) 233 107 2008 286 (386) 303 87 (60) 56 (54) 179 152 2009 522 (315) 348 195 217 86 115 12 (138)2010 701 (109) (149) 204 358 78 201 81 40
2009 Q4 148 18 (168) 194 (165) 4 (95) 278 84
20105 Q1 36 234 133 116 (47) (17) 214 (338) (260) Q2 261 (118) (51) (206) 620 64 1 (239) 190 Q3 247 (71) (209) 35 (176) (124) (16) 491 316 Q4 537 (6) 114 147 37 226 131 103 (215)

Historical Data 92
Exhibit 24. Net Change in Number of Households by Race and Ethnicity of Householder: 1971–Present*
Period Total Hispanic
*Units in thousands. NA = Not available.r Implementation of new March Current Population Survey (CPS) processing system.1 Data from 1971 to 1979 weighted based on the 1970 decennial census.2 Data from 1980 to 1992 weighted based on the 1980 decennial census.3 Beginning in 1993, CPS data weighted based on the 1990 decennial census.4 Beginning in 2002, CPS data weighted based on 2000 decennial census data and housing unit controls.5 Beginning in 2010, CPS data weighted based on vintage 2009 housing estimates.6 Beginning in 2003, the CPS respondents were able to select more than one race. Source: Current Population Survey, Census Bureau, Department of Commerce (The source of annual data is the Current Population Survey March Supplement. The quarterly data source is the monthly Current Population Survey/Housing Vacancy Survey.)
White Black Other Race Two or More Alone Alone Alone Races6
Non-Hispanic
Annual Data
Quarterly Data
19711 848 NA NA NA NA NA1972 1,898 NA NA NA NA NA1973 1,575 NA NA NA NA NA1974r 1,554 NA NA NA NA NA1975 1,358 NA NA NA NA NA 1976 1,704 NA NA NA NA NA 1977 1,275 832 288 22 NA 1331978 1,888 1,356 190 119 NA 2231979 1,300 1,115 96 102 NA (13)19802 3,446 2,367 488 198 NA 3931981 1,592 903 244 223 NA 2221982 1,159 890 129 66 NA 741983 391 218 (37) 105 NA 1051984r 1,372 434 299 58 NA 5811985 1,499 938 250 94 NA 2171986 1,669 954 283 102 NA 3301987 1,021 527 116 173 NA 2051988r 1,645 1,053 255 113 NA 2241989 1,706 947 382 109 NA 2681990 517 428 (49) 115 NA 231991 965 540 156 (18) NA 2871992 1,364 590 397 218 NA 15919933 750 (518) 183 312 NA 7741994 681 590 (6) (114) NA 2091995 1,883 1,307 387 (182) NA 373 1996 637 (72) (156) 660 NA 204 1997 1,391 308 509 288 NA 286 1998 1,510 696 363 87 NA 365 1999 1,346 641 89 145 NA 470 2000 831 242 245 85 NA 259 2001 1,244 588 171 202 NA 285 20024 1,249 (171) (122) 618 NA 933 2003 669 (612) 3 (440) NA 608 2004 1,367 662 249 178 43 237 2005 1,725 768 267 170 51 471 2006 1,082 320 182 115 23 439 2007 455 (223) 149 197 (71) 405 2008 286 (93) 205 14 2 150 2009 522 245 118 83 39 372010 701 350 93 88 21 150
2009 Q4 148 101 (74) 3 14 105
20105 Q1 36 229 (83) (54) 8 (66) Q2 261 29 74 147 (13) 24 Q3 247 (42) 121 (109) 80 199 Q4 537 55 75 146 (27) 288

Historical Data93
*Components may not add to totals due to rounding. Units in thousands. NA = Not available.1 Decennial Census of Housing.2 American Housing Survey (AHS) estimates are available in odd-numbered years only after 1981.3 Beginning in 2009, Current Population Survey data weighted based on vintage 2008 housing estimates.4 AHS estimates through 1981 based on 1970 decennial census weights; 1983 to 1989 estimates based on 1980 decennial census weights; 1991 and 1995 estimates based on 1990 decennial census weights. No reduction in nation’s housing inventory has ever occurred; apparent reductions are due to changes in bases used for weighting sample data.Sources: Annual Data—Annual or American Housing Surveys; Quarterly Data—Current Population Survey/Housing Vacancy Survey in Current Housing Reports: Housing Vacancies and Homeownership, Census Bureau, Department of Commercehttp://www.census.gov/hhes/www/hvs.html (See Table 4.)
Total For Sale Other Total Year Round Only Vacant Occupied
Exhibit 25. Total U.S. Housing Stock: 1970–Present*
Period Total4 Seasonal For Rent Owner RenterTotal
Vacant Year Round
Annual and Biennial Data
Quarterly Data
19701 68,672 973 67,699 4,207 1,655 477 2,075 63,445 39,886 23,5601971 NA NA NA NA NA NA NA NA NA NA 1972 NA NA NA NA NA NA NA NA NA NA1973 75,969 676 75,293 5,956 1,545 502 3,909 69,337 44,653 24,6841974 77,601 1,715 75,886 5,056 1,630 547 2,879 70,830 45,784 25,0461975 79,087 1,534 77,553 5,030 1,489 577 2,964 72,523 46,867 25,656 1976 80,881 1,565 79,316 5,311 1,544 617 3,150 74,005 47,904 26,1011977 82,420 1,704 80,716 5,436 1,532 596 3,308 75,280 48,765 26,5151978 84,618 1,785 82,833 5,667 1,545 624 3,498 77,167 50,283 26,8841979 86,374 1,788 84,586 6,014 1,600 677 3,737 78,572 51,411 27,1601980 88,207 2,183 86,024 5,953 1,497 755 3,701 80,072 52,516 27,55619801 88,411 1,718 86,693 NA NA NA NA 80,390 51,795 28,59519812 91,561 1,950 89,610 6,435 1,634 812 3,989 83,175 54,342 28,8331983 93,519 1,845 91,675 7,037 1,906 955 4,176 84,638 54,724 29,9141985 99,931 3,182 96,749 8,324 2,518 1,128 4,678 88,425 56,145 32,2801987 102,652 2,837 99,818 8,927 2,895 1,116 4,916 90,888 58,164 32,7241989 105,661 2,881 102,780 9,097 2,644 1,115 5,338 93,683 59,916 33,76719901 102,264 NA NA NA NA NA NA 91,947 59,025 32,9231991 104,592 2,728 101,864 8,717 2,684 1,026 5,007 93,147 59,796 33,3511993 106,611 3,088 103,522 8,799 2,651 889 5,258 94,724 61,252 33,472 1995 109,457 3,054 106,403 8,710 2,666 917 5,128 97,693 63,544 34,150 1997 112,357 3,166 109,191 9,704 2,884 1,043 5,777 99,487 65,487 34,000 1999 115,253 2,961 112,292 9,489 2,719 971 5,799 102,803 68,796 34,00720001 119,628 NA NA NA NA NA NA 105,719 71,249 34,470 2001 119,116 3,078 116,038 9,777 2,916 1,243 5,618 106,261 72,265 33,996 2003 120,777 3,566 117,211 11,369 3,597 1,284 6,488 105,842 72,238 33,6042005 124,377 3,845 120,532 11,661 3,707 1,401 6,553 108,871 74,931 33,940 2007 128,203 4,402 123,801 13,109 3,852 2,017 7,240 110,692 75,647 35,0452009 130,112 4,618 125,494 13,688 4,018 2,108 7,562 111,806 76,428 35,378
20093 Q4 130,189 4,612 125,577 14,209 4,462 2,080 7,667 111,370 74,812 36,558
2010 Q1 130,350 4,610 125,740 14,335 4,409 1,988 7,938 111,406 74,770 36,635 Q2 130,517 4,431 126,086 14,419 4,423 1,958 8,038 111,667 74,735 36,933 Q3 130,681 4,443 126,238 14,324 4,335 1,934 8,055 111,914 74,874 37,040 Q4 130,845 4,294 126,551 14,100 3,969 2,052 8,079 112,451 74,782 37,669

Historical Data 94
Annual Data
Exhibit 26. Rental Vacancy Rates: 1979–Present
Regions Units in StructureMetropolitan Status1
PeriodAll
Rental Units
Inside Metro Area
In Central
CitySuburbs
Outside Metro Area
North-east
Mid-west South West One Two or
MoreFive or More
1 The Census Bureau has changed to the Office of Management and Budget’s new designation of metropolitan areas as core-based statistical areas effective January 2005. The new statistical area definitions and data are not comparable with the previous ones.
http://www.census.gov/hhes/www/hvs.html (See "Detail Tables," Tables 2 and 3.)
Quarterly Data
1979 5.4 5.4 5.7 5.1 5.4 4.5 5.7 6.1 5.3 3.2 6.6 7.6 1980 5.4 5.2 5.4 4.8 6.1 4.2 6.0 6.0 5.2 3.4 6.4 7.1 1981 5.0 4.8 5.0 4.6 5.7 3.7 5.9 5.4 5.1 3.3 6.0 6.4 1982 5.3 5.0 5.3 4.6 6.2 3.7 6.3 5.8 5.4 3.6 6.2 6.5 1983 5.7 5.5 6.0 4.8 6.3 4.0 6.1 6.9 5.2 3.7 6.7 7.1 1984 5.9 5.7 6.2 5.1 6.4 3.7 5.9 7.9 5.2 3.8 7.0 7.5 1985 6.5 6.3 6.6 6.0 7.1 3.5 5.9 9.1 6.2 3.8 7.9 8.8 1986 7.3 7.2 7.6 6.6 8.2 3.9 6.9 10.1 7.1 3.9 9.2 10.4 1987 7.7 7.7 8.3 6.9 7.8 4.1 6.8 10.9 7.3 4.0 9.7 11.2 1988 7.7 7.8 8.4 7.0 7.3 4.8 6.9 10.1 7.7 3.6 9.8 11.4 1989 7.4 7.4 7.9 6.6 7.7 4.7 6.8 9.7 7.1 4.2 9.2 10.1 1990 7.2 7.1 7.8 6.3 7.6 6.1 6.4 8.8 6.6 4.0 9.0 9.5 1991 7.4 7.5 8.0 6.8 7.3 6.9 6.7 8.9 6.5 3.9 9.4 10.4 1992 7.4 7.4 8.3 6.4 7.0 6.9 6.7 8.2 7.1 3.9 9.3 10.11993 7.3 7.5 8.2 6.6 6.5 7.0 6.6 7.9 7.4 3.8 9.5 10.31994 7.4 7.3 8.1 6.4 7.7 7.1 6.8 8.0 7.1 5.2 9.0 9.81995 7.6 7.6 8.4 6.6 7.9 7.2 7.2 8.3 7.5 5.4 9.0 9.51996 7.8 7.7 8.2 7.0 8.7 7.4 7.9 8.6 7.2 5.5 9.3 9.6 1997 7.7 7.5 8.1 6.9 8.8 6.7 8.0 9.1 6.6 5.8 9.0 9.1 1998 7.9 7.7 8.2 7.1 9.2 6.7 7.9 9.6 6.7 6.3 9.0 9.4 1999 8.1 7.8 8.4 7.2 9.6 6.3 8.6 10.3 6.2 7.3 8.7 8.7 2000 8.0 7.7 8.2 7.2 9.5 5.6 8.8 10.5 5.8 7.0 8.7 9.2 2001 8.4 8.0 8.6 7.4 10.4 5.3 9.7 11.1 6.2 7.9 8.9 9.6 2002 8.9 8.7 9.2 8.2 10.2 5.8 10.1 11.6 6.9 8.0 9.7 10.42003 9.8 9.6 10.0 9.2 10.6 6.6 10.8 12.5 7.7 8.4 10.7 11.42004 10.2 10.2 10.8 9.5 10.2 7.3 12.2 12.6 7.5 9.3 10.9 11.5 2005 9.8 9.7 10.0 9.4 10.5 6.5 12.6 11.8 7.3 9.9 10.0 10.42006 9.7 9.7 10.0 9.3 10.0 7.1 12.4 11.6 6.8 10.0 9.8 9.9 2007 9.7 9.8 10.0 9.6 9.3 7.0 11.5 12.3 6.7 9.6 10.0 10.3 2008 10.0 10.0 10.2 9.7 10.4 6.9 10.8 13.0 7.5 9.8 10.4 10.82009 10.6 10.7 11.1 10.2 10.4 7.2 10.7 13.4 9.0 9.8 11.3 12.32010 10.2 10.3 10.7 9.8 9.9 7.7 10.9 12.7 8.3 9.6 10.8 11.6
2009 Q4 10.7 10.7 11.2 10.2 10.8 7.2 11.2 13.7 8.9 9.6 11.5 12.5
2010 Q1 10.6 10.6 11.3 9.8 10.7 7.5 11.0 13.2 9.0 9.7 11.3 12.1 Q2 10.6 10.6 11.1 10.2 9.5 8.3 11.3 13.2 8.0 9.4 11.4 12.2 Q3 10.3 10.3 10.5 10.1 10.4 7.4 11.5 12.9 8.1 9.8 10.8 11.8 Q4 9.4 9.5 9.8 9.1 9.1 7.5 9.6 11.5 7.9 9.3 9.6 10.4
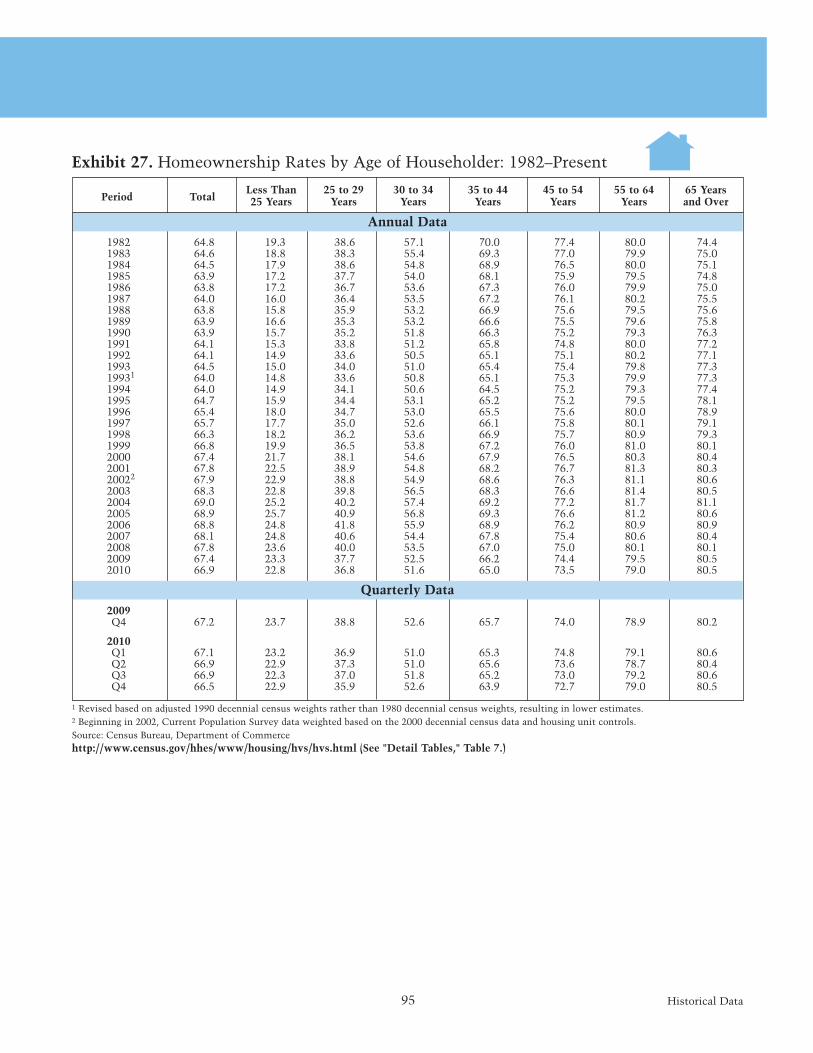
Historical Data95
Exhibit 27. Homeownership Rates by Age of Householder: 1982–Present
Period Total
1 Revised based on adjusted 1990 decennial census weights rather than 1980 decennial census weights, resulting in lower estimates.2 Beginning in 2002, Current Population Survey data weighted based on the 2000 decennial census data and housing unit controls.Source: Census Bureau, Department of Commercehttp://www.census.gov/hhes/www/housing/hvs/hvs.html (See "Detail Tables," Table 7.)
Less Than 25 to 29 30 to 34 35 to 44 45 to 54 55 to 64 65 Years 25 Years Years Years Years Years Years and Over
Annual Data
Quarterly Data
1982 64.8 19.3 38.6 57.1 70.0 77.4 80.0 74.4 1983 64.6 18.8 38.3 55.4 69.3 77.0 79.9 75.0 1984 64.5 17.9 38.6 54.8 68.9 76.5 80.0 75.1 1985 63.9 17.2 37.7 54.0 68.1 75.9 79.5 74.8 1986 63.8 17.2 36.7 53.6 67.3 76.0 79.9 75.0 1987 64.0 16.0 36.4 53.5 67.2 76.1 80.2 75.5 1988 63.8 15.8 35.9 53.2 66.9 75.6 79.5 75.6 1989 63.9 16.6 35.3 53.2 66.6 75.5 79.6 75.8 1990 63.9 15.7 35.2 51.8 66.3 75.2 79.3 76.3 1991 64.1 15.3 33.8 51.2 65.8 74.8 80.0 77.2 1992 64.1 14.9 33.6 50.5 65.1 75.1 80.2 77.11993 64.5 15.0 34.0 51.0 65.4 75.4 79.8 77.3 19931 64.0 14.8 33.6 50.8 65.1 75.3 79.9 77.3 1994 64.0 14.9 34.1 50.6 64.5 75.2 79.3 77.41995 64.7 15.9 34.4 53.1 65.2 75.2 79.5 78.1 1996 65.4 18.0 34.7 53.0 65.5 75.6 80.0 78.9 1997 65.7 17.7 35.0 52.6 66.1 75.8 80.1 79.1 1998 66.3 18.2 36.2 53.6 66.9 75.7 80.9 79.3 1999 66.8 19.9 36.5 53.8 67.2 76.0 81.0 80.1 2000 67.4 21.7 38.1 54.6 67.9 76.5 80.3 80.4 2001 67.8 22.5 38.9 54.8 68.2 76.7 81.3 80.3 20022 67.9 22.9 38.8 54.9 68.6 76.3 81.1 80.62003 68.3 22.8 39.8 56.5 68.3 76.6 81.4 80.52004 69.0 25.2 40.2 57.4 69.2 77.2 81.7 81.1 2005 68.9 25.7 40.9 56.8 69.3 76.6 81.2 80.62006 68.8 24.8 41.8 55.9 68.9 76.2 80.9 80.9 2007 68.1 24.8 40.6 54.4 67.8 75.4 80.6 80.42008 67.8 23.6 40.0 53.5 67.0 75.0 80.1 80.12009 67.4 23.3 37.7 52.5 66.2 74.4 79.5 80.52010 66.9 22.8 36.8 51.6 65.0 73.5 79.0 80.5
2009 Q4 67.2 23.7 38.8 52.6 65.7 74.0 78.9 80.2
2010 Q1 67.1 23.2 36.9 51.0 65.3 74.8 79.1 80.6 Q2 66.9 22.9 37.3 51.0 65.6 73.6 78.7 80.4 Q3 66.9 22.3 37.0 51.8 65.2 73.0 79.2 80.6 Q4 66.5 22.9 35.9 52.6 63.9 72.7 79.0 80.5

Historical Data 96
Exhibit 28. Homeownership Rates by Region and Metropolitan Status: 1983–Present
Region Metropolitan Status4, 5
Central Outside City Central City
Outside Metro Area
Inside Metro AreaPeriod Total
NA = Not available.1 Data from 1983 to 1992 weighted based on the 1980 decennial census.2 Beginning in 1993, Current Population Survey (CPS) data weighted based on the 1990 decennial census.3 Beginning in 2002, CPS data weighted based on the 2000 decennial census data and housing unit controls.4 From 1983 and 1984, the metropolitan data reflect 1970 definitions. From 1985 to 1994, the metropolitan data reflect 1980 definitions. Beginning in 1995, the metropolitan data reflect 1990 definitions.5 The Census Bureau has changed to the Office of Management and Budget's new designation of metropolitan areas as core-based statistical areas effective January 2005. The new statistical area definitions and data are not comparable with the previous ones.Source: Current Population Survey, Census Bureau, Department of Commerce (The annual data come from two sources: for years 1983 to 1993, the source is the Current Population Survey March Supplement; for years 1994 and later, the data are the average of the 12 monthly Current Population Surveys/Housing Vacancy Surveys. The quarterly data source is the monthly Current Population Survey/Housing Vacancy Survey.)http://www.census.gov/hhes/www/hvs.html (See Table 6.)
Northeast Midwest South West
Annual Averages of Monthly Data
Quarterly Averages of Monthly Data
March Supplemental Data19831 64.9 61.4 70.0 67.1 58.7 48.9 70.2 73.51984 64.5 60.7 69.0 67.2 58.5 49.2 69.8 72.61985 64.3 61.1 67.7 66.7 59.4 NA NA NA1986 63.8 61.1 66.9 66.7 57.8 48.3 71.2 72.01987 64.0 61.4 67.1 66.9 57.9 48.7 70.9 72.51988 64.0 61.9 67.0 65.9 59.0 48.7 71.1 72.11989 64.0 61.6 67.6 66.3 58.5 48.7 70.4 73.11990 64.1 62.3 67.3 66.5 58.0 48.9 70.1 73.51991 64.0 61.9 67.3 66.1 58.8 48.3 70.4 73.2 1992 64.1 62.7 67.0 65.8 59.2 49.0 70.2 73.019932 64.1 62.4 67.0 65.5 60.0 48.9 70.2 72.9
1994 64.0 61.5 67.7 65.6 59.4 48.5 70.3 72.01995 64.7 62.0 69.2 66.7 59.2 49.5 71.2 72.7 1996 65.4 62.2 70.6 67.5 59.2 49.7 72.2 73.5 1997 65.7 62.4 70.5 68.0 59.6 49.9 72.5 73.7 1998 66.3 62.6 71.1 68.6 60.5 50.0 73.2 74.7 1999 66.8 63.1 71.7 69.1 60.9 50.4 73.6 75.4 2000 67.4 63.4 72.6 69.6 61.7 51.4 74.0 75.2 2001 67.8 63.7 73.1 69.8 62.6 51.9 74.6 75.0 20023 67.9 64.3 73.1 69.7 62.5 51.7 74.7 75.4 2003 68.3 64.4 73.2 70.1 63.4 52.3 75.0 75.62004 69.0 65.0 73.8 70.9 64.2 53.1 75.7 76.32005 68.9 65.2 73.1 70.8 64.4 54.2 76.4 76.3 2006 68.8 65.2 72.7 70.5 64.7 54.3 76.1 75.92007 68.1 65.0 71.9 70.1 63.5 53.6 75.5 75.12008 67.8 64.6 71.7 69.9 63.0 53.2 75.1 75.22009 67.4 64.0 71.0 69.6 62.6 52.8 74.6 74.72010 66.9 64.1 70.8 69.0 61.4 52.1 74.0 74.5
2009 Q4 67.2 63.9 71.3 69.1 62.3 53.0 74.0 74.6
2010 Q1 67.1 64.4 70.9 69.2 61.9 52.6 74.2 74.6 Q2 66.9 64.2 70.8 69.1 61.4 52.0 74.3 74.2 Q3 66.9 63.9 71.1 69.1 61.3 52.0 74.0 75.1 Q4 66.5 64.1 70.5 68.5 61.0 52.0 73.6 74.1

Historical Data97
NA = Not available.r Implementation of new March Current Population Survey (CPS) processing system.1 CPS data from 1983 to 1992 weighted based on the 1980 decennial census.2 Beginning in 1993, CPS data weighted based on the 1990 decennial census.3 Beginning in 2002, CPS data weighted based on the 2000 decennial census data and housing unit controls.4 Beginning in 2003, the CPS respondents were able to answer more than one race.Source: Current Population Survey, Census Bureau, Department of Commerce (The annual data come from two sources: for years 1983 to 1993, the source is the Current Population Survey March Supplement; for years 1994 and later, the data are the average of the 12 monthly Current Population Surveys/Housing Vacancy Surveys. The quarterly data source is the monthly Current Population Survey/Housing Vacancy Survey.)
Exhibit 29. Homeownership Rates by Race and Ethnicity: 1983–Present
Non-HispanicHispanicPeriod White Black Other Race Two or More
Alone Alone Alone Races4
March Supplemental Data
Annual Averages of Monthly Data
Quarterly Averages of Monthly Data
19831 69.1 45.6 53.3 NA 41.21984r 69.0 46.0 50.9 NA 40.11985 69.0 44.4 50.7 NA 41.11986 68.4 44.8 49.7 NA 40.61987 68.7 45.8 48.7 NA 40.61988r 69.1 42.9 49.7 NA 40.61989 69.3 42.1 50.6 NA 41.61990 69.4 42.6 49.2 NA 41.21991 69.5 42.7 51.3 NA 39.01992 69.6 42.6 52.5 NA 39.919932 70.2 42.0 50.6 NA 39.4
1994 70.0 42.5 50.8 NA 41.21995 70.9 42.9 51.5 NA 42.01996 71.7 44.5 51.5 NA 42.81997 72.0 45.4 53.3 NA 43.31998 72.6 46.1 53.7 NA 44.71999 73.2 46.7 54.1 NA 45.52000 73.8 47.6 53.9 NA 46.32001 74.3 48.4 54.7 NA 47.320023 74.7 48.2 55.0 NA 47.02003 75.4 48.8 56.7 58.0 46.72004 76.0 49.7 59.6 60.4 48.12005 75.8 48.8 60.4 59.8 49.52006 75.8 48.4 61.1 59.9 49.72007 75.2 47.8 60.3 59.0 49.72008 75.0 47.9 59.8 57.8 49.12009 74.8 46.6 59.7 56.0 48.42010 74.4 45.9 58.8 55.6 47.5
2009 Q4 74.5 46.3 60.8 56.8 48.4
2010 Q1 74.5 46.1 59.4 56.6 48.5 Q2 74.4 46.6 57.5 53.6 47.8 Q3 74.7 45.5 59.5 53.6 47.0 Q4 74.2 45.3 58.9 58.6 46.8

Historical Data 98
Married Couples Other Families
Exhibit 30. Homeownership Rates by Household Type: 1983–Present
OtherPeriod
r Implementation of new March Current Population Survey (CPS) processing system.1 CPS data from 1983 to 1992 weighted based on the 1980 decennial census.2 Beginning in 1993, CPS data weighted based on the 1990 decennial census.3 Beginning in 2002, CPS data weighted based on the 2000 decennial census data and housing unit controls.Source: Current Population Survey, Census Bureau, Department of Commerce (The annual data come from two sources: for years 1983 to 1993, the source is the Current Population Survey March Supplement; for years 1994 and later, the data are the average of the 12 monthly Current Population Surveys/Housing Vacancy Surveys. The quarterly data source is the monthly Current Population Survey/Housing Vacancy Survey.)
Annual Averages of Monthly Data
Quarterly Averages of Monthly Data
March Supplemental Data
With Without With Without Children Children Children Children
19831 75.0 80.8 38.3 67.5 44.51984r 74.2 80.9 39.1 66.4 44.61985 74.0 81.1 38.6 65.4 45.01986 73.4 81.4 38.0 65.7 43.91987 73.8 81.6 37.6 66.3 43.91988r 73.9 81.7 38.0 64.9 44.61989 74.3 82.0 35.8 64.4 45.61990 73.5 82.2 36.0 64.3 46.61991 73.0 83.0 35.6 65.6 46.81992 73.4 83.0 35.1 64.9 47.319932 73.7 82.9 35.5 63.9 47.1
1994 74.3 83.2 36.1 65.3 47.01995 74.9 84.0 37.7 66.2 47.7 1996 75.8 84.4 38.6 67.4 48.6 1997 76.5 84.9 38.5 66.4 49.2 1998 77.3 85.4 40.4 66.0 49.7 1999 77.6 85.7 41.9 65.8 50.3 2000 78.3 86.1 43.2 65.8 50.9 2001 78.8 86.6 44.2 66.1 51.7 20023 78.6 86.8 43.5 66.3 52.32003 79.1 87.0 43.8 66.5 52.72004 79.7 87.7 45.3 67.8 53.52005 80.3 87.5 45.2 67.4 53.32006 79.9 87.6 45.2 67.6 53.42007 79.4 87.5 44.2 65.7 52.72008 78.9 87.1 43.3 66.1 52.72009 78.0 86.7 42.4 65.4 52.62010 76.4 86.6 41.6 66.0 52.8
2009 Q4 78.2 86.3 42.0 65.1 52.7
2010 Q1 77.3 86.6 42.4 66.4 52.3 Q2 76.2 86.8 42.1 66.2 52.7 Q3 76.0 87.1 41.3 64.6 53.3 Q4 76.2 85.9 40.7 66.7 52.9