Dollar General Corporation Reports First Quarter 2022 Results
Upload
khangminh22Category
view
2download
0
© Golar LNG Limited
Third Quarter 2020 ResultsNovember 30, 2020
Solid Results, Fundamentals Continue to Improve
© Golar LNG Limited
Forward
Looking
Statements
1
This press release contains forward-looking statements (as defined in Section 21E of the Securities Exchange Act of 1934, as amended) which reflectsmanagement’s current expectations, estimates and projections about its operations. All statements, other than statements of historical facts, thataddress activities and events that will, should, could or may occur in the future are forward-looking statements. Words such as “may,” “could,” “should,”“would,” "will," “expect,” “plan,” “anticipate,” “intend,” “forecast,” “believe,” “estimate,” “predict,” “propose,” “potential,” “continue,” or the negative ofthese terms and similar expressions are intended to identify such forward-looking statements. These statements are not guarantees of futureperformance and are subject to certain risks, uncertainties and other factors, some of which are beyond our control and are difficult to predict.Therefore, actual outcomes and results may differ materially from what is expressed or forecasted in such forward-looking statements. You should notplace undue reliance on these forward-looking statements, which speak only as of the date of this press release. Unless legally required, Golar undertakesno obligation to update publicly any forward-looking statements whether as a result of new information, future events or otherwise.
Among the important factors that could cause actual results to differ materially from those in the forward-looking statements are: changes in our ability toobtain additional financing or refinancing of our existing debt, including our Term Loan facility and Margin Loan facility, each scheduled to mature inDecember 2020, and our 2017 convertible bonds, on acceptable terms or at all; changes in our ability to comply with the covenants contained in theagreements governing our future or existing indebtedness; our inability and that of our counterparty to meet our respective obligations under the LeaseOperate Agreement (“LOA”) entered into in connection with the BP Greater Tortue/Ahmeyim Project (“Gimi GTA Project”); continuing uncertainty resultingfrom potential claims from our counterparties of purported force majeure under contractual arrangements, including but not limited to our constructionprojects, and other contracts to which we are a party; our ability to realize the expected benefits from acquisitions and investments we have made andmay make in the future; changes in the timeliness of the completion of the LNG Croatia (formerly known as the Golar Viking) commissioning andsubsequent acceptance by the customer; our ability to enter into contracts with third parties to fully utilize the Hilli Episeyo; the length and severity ofoutbreaks of pandemics, including the ongoing worldwide outbreak of the novel coronavirus (“COVID-19”) and its impact on demand for liquefied naturalgas (“LNG”) and natural gas, the timing of completion of our conversion projects, the operation of our charters, our global operations including impact toour vessel operating costs and our business in general; Hygo Energy Transition Ltd.’s (“Hygo”) (formerly known as Golar Power Limited) ability to operatethe Sergipe power station project and related floating storage and regasification unit (“FSRU”) contract and to execute its downstream LNG distributionand merchant power sales plans; Hygo’s ability to successfully complete the contemplated initial public offering (“IPO”) of its common shares; changes inour relationship with Golar LNG Partners LP (“Golar Partners”), Hygo or Avenir LNG Limited (“Avenir”) and the sustainability of any distributions they payto us; any adverse effects on us, including reputational harm, or the value of our investment in Hygo, as a result of the implication of Hygo’s former chiefexecutive officer, Eduardo Antonello, who resigned from his position with Hygo in October 2020, in certain allegations by the Brazilian governmentconcerning alleged improper payments made in Brazil pre-dating Mr. Antonello’s relationship with Hygo; the outcome of any pending or future legalproceedings to which we are a party; approval of amendments to agreements with our engineering, procurement and construction contractors andlending banks to adjust the construction and financing schedules relating to the Gimi GTA Project; failure of our contract counterparties, including our jointventure co-owners, to comply with their agreements with us or other key project stakeholders; changes in LNG carrier, FSRU, floating liquefaction naturalgas vessel (“FLNG”), or small-scale LNG market trends, including charter rates, vessel values or technological advancements; our vessel values and anyfuture impairment charges we may incur; challenges by authorities to the tax benefits we previously obtained under certain of our leasing agreements;continuing volatility of commodity prices; a decline or continuing weakness in the global financial markets; fluctuations in currencies and interest rates;our ability to close potential future sales of additional equity interests in our vessels, including the FLNG Gimi on a timely basis or at all; changes in ourability to retrofit vessels as FSRUs or FLNGs, our ability to obtain financing for such conversions on acceptable terms or at all and our ability to obtain thebenefits that may accrue to us as the result of such modifications; changes in the supply of or demand for LNG carriers, FSRUs, FLNGs or small-scale LNGinfrastructure; a material decline or prolonged weakness in rates for LNG carriers, FSRUs, FLNGs or small-scale LNG infrastructure; changes in theperformance of the pool in which certain of our vessels operate and the performance of our joint ventures; changes in trading patterns that affect theopportunities for the profitable operation of LNG carriers, FSRUs, FLNGs or small-scale LNG infrastructure; changes in the supply of or demand for LNG orLNG carried by sea; changes in the supply of or demand for natural gas generally or in particular regions; changes in our relationships with ourcounterparties, including our major chartering parties; changes in general domestic and international political conditions, particularly in regions where weoperate; changes in the availability of vessels to purchase and in the time it takes to construct new vessels or convert existing vessels; failures of shipyardsto comply with delivery schedules or performance specifications on a timely basis or at all; changes in our ability to sell vessels to Golar Partners or Hygo;changes to rules and regulations, applicable to LNG carriers, FSRUs, FLNGs or other parts of the LNG supply chain; our inability to achieve successfulutilization of our expanded fleet or inability to expand beyond the carriage of LNG and provision of FSRUs, FLNGs, and small-scale LNG infrastructureparticularly through our innovative FLNG strategy and our joint ventures; actions taken by regulatory authorities that may prohibit the access of LNGcarriers, FSRUs, FLNGs or small-scale LNG vessels to various ports; increases in costs, including, among other things, crew wages, insurance, provisions,repairs and maintenance; and other factors listed from time to time in registration statements, reports or other materials that we have filed with orfurnished to the U.S. Securities and Exchange Commission ("Commission"), including our most recent Annual Report on Form 20-F.
As a result, you are cautioned not to rely on any forward-looking statements. Actual results may differ materially from those expressed or implied by suchforward-looking statements. The Company undertakes no obligation to publicly update or revise any forward-looking statements, whether as a result ofnew information, future events or otherwise unless required by law.
© Golar LNG Limited
Speakers
2
Iain RossChief Executive Officer, Golar LNG
Karl Fredrik StauboChief Financial Officer, Golar LNG
Eduardo MaranhãoChief Financial Officer, Hygo
Tor Olav Troim Chairman, Golar LNG and Chairman, Hygo
© Golar LNG Limited
Agenda
3
❑ Group results
❑ Shipping
❑ FLNG – Hilli and Gimi
❑ Hygo
❑ Strategic focus

© Golar LNG Limited
-
10
20
30
40
50
60
70
80
90
-
10
20
30
40
50
60
70
80
90
Q1 2018 Q2 2018 Q3 2018 Q4 2018 Q1 2019 Q2 2019 Q3 2019 Q4 2019 Q1 2020 Q2 2020 Q3 2020
Shipping Adjusted EBITDA ($m) Shipping TCE/day ($'000s)
77%
62%
86%
93%
51%66% 65%
90%
94% 93%
80%
Utilization %
Q3 2020 Highlights
4
Shipping developments
▪ TCE1 of $39k in Q3 20 ahead of guidance, above $35k in Q3 19
and below $45k in Q2 20 due to low LNG prices resulting in
suppressed shipping demand and spot rates
▪ 80% utilization in Q3 20 down on the 93% achieved in Q2 20 but a
significant improvement over 65% in Q3 19
▪ Charter strategy continues to de-risk our portfolio with revenue
backlog1 of $198m at the end of Q3 2020 (vs $147m at Q3 19)
Sh
ipp
ing
FLNG developments
▪ FLNG Hilli achieved 100% commercial uptime maintained and
continued stable EBITDA during the quarter
▪ FLNG Gimi: Force majeure event with BP has ended with the
project schedule being extended by 11 months, with no other
changes to contractual terms. Covid-19 related construction delays
in Singapore now under control with workforce numbers on the
project back to pre-lockdown levels
Downstream Hygo developments
▪ Hygo, including its share of the Sergipe power station and Nanook
FSRU generated $31m revenue less operating costs during the
quarter of which Golar’s share is 50%
▪ Signed MoU with Pará state distribution company for use of
Barcarena terminal to supply regional demand for cleaner fuels
▪ Received Installation License for the construction of the Barcarena
power station and associated LNG Terminal
▪ Appointment of Paul Hanrahan as CEO
Hyg
o
$m Shipping Adjusted EBITDA1 $ ‘000 TCE/Day
$m Hilli Adjusted EBITDA1
FL
NG
(1) Please see appendix for definition on the non-GAAP measures.
0
10
20
30
40
Q1 2019 Q2 2019 Q3 2019 Q4 2019 Q1 2020 Q2 2020 Q3 2020
Hilli adjusted EBITDA (excl Brent Oil linked fee) Brent oil linked fee
-2.8
41.5
31.2
-10
0
10
20
30
40
50
Q1 2020 Q2 2020 Q3 2020
$m Hyo adjusted EBITDA1$m Hygo Adjusted EBITDA1
© Golar LNG Limited
Corporate Update
5
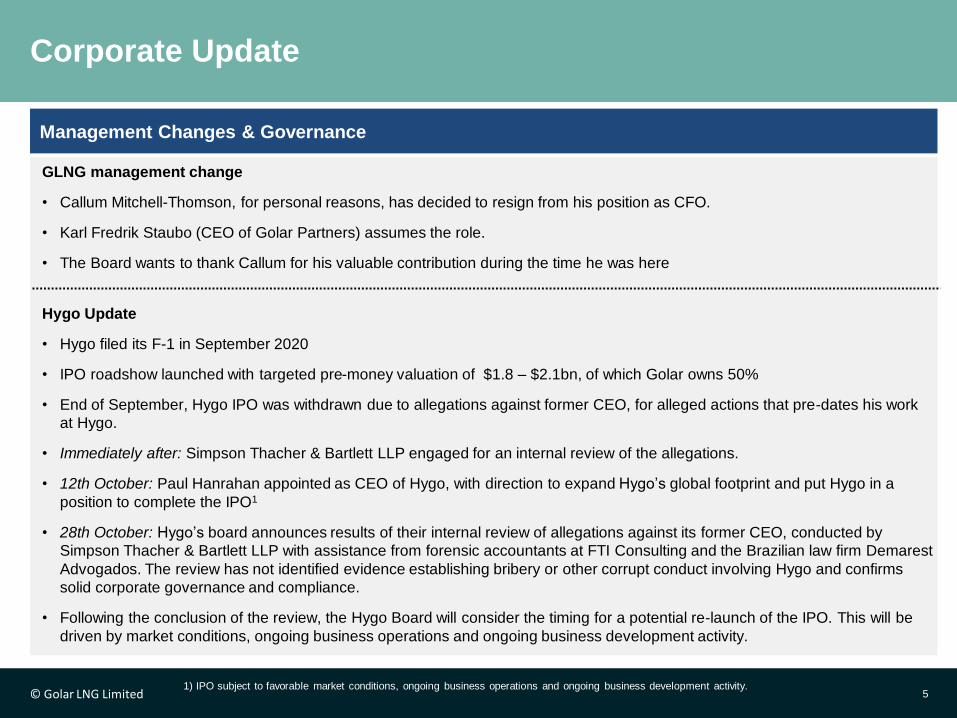
Hygo Update
• Hygo filed its F-1 in September 2020
• IPO roadshow launched with targeted pre-money valuation of $1.8 – $2.1bn, of which Golar owns 50%
• End of September, Hygo IPO was withdrawn due to allegations against former CEO, for alleged actions that pre-dates his work
at Hygo.
• Immediately after: Simpson Thacher & Bartlett LLP engaged for an internal review of the allegations.
• 12th October: Paul Hanrahan appointed as CEO of Hygo, with direction to expand Hygo’s global footprint and put Hygo in a
position to complete the IPO1
• 28th October: Hygo’s board announces results of their internal review of allegations against its former CEO, conducted by
Simpson Thacher & Bartlett LLP with assistance from forensic accountants at FTI Consulting and the Brazilian law firm Demarest
Advogados. The review has not identified evidence establishing bribery or other corrupt conduct involving Hygo and confirms
solid corporate governance and compliance.
• Following the conclusion of the review, the Hygo Board will consider the timing for a potential re-launch of the IPO. This will be
driven by market conditions, ongoing business operations and ongoing business development activity.
Management Changes & Governance
1) IPO subject to favorable market conditions, ongoing business operations and ongoing business development activity.
GLNG management change
• Callum Mitchell-Thomson, for personal reasons, has decided to resign from his position as CFO.
• Karl Fredrik Staubo (CEO of Golar Partners) assumes the role.
• The Board wants to thank Callum for his valuable contribution during the time he was here
© Golar LNG Limited
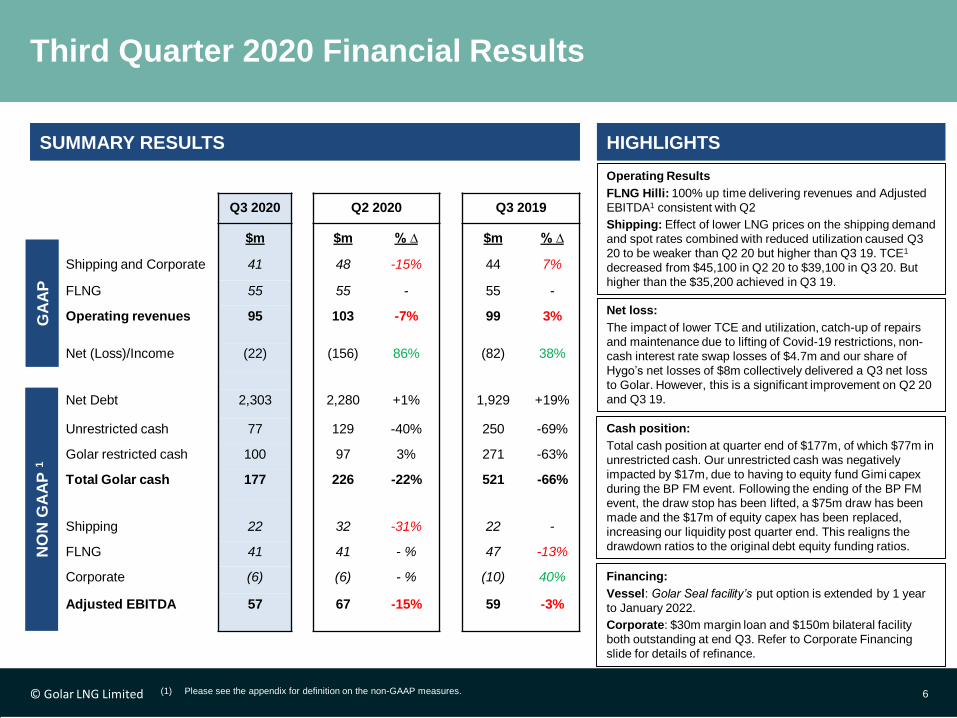
SUMMARY RESULTS HIGHLIGHTS
Operating Results
FLNG Hilli: 100% up time delivering revenues and Adjusted
EBITDA1 consistent with Q2
Shipping: Effect of lower LNG prices on the shipping demand
and spot rates combined with reduced utilization caused Q3
20 to be weaker than Q2 20 but higher than Q3 19. TCE1
decreased from $45,100 in Q2 20 to $39,100 in Q3 20. But
higher than the $35,200 achieved in Q3 19.
Third Quarter 2020 Financial Results
6
Net loss:
The impact of lower TCE and utilization, catch-up of repairs
and maintenance due to lifting of Covid-19 restrictions, non-
cash interest rate swap losses of $4.7m and our share of
Hygo’s net losses of $8m collectively delivered a Q3 net loss
to Golar. However, this is a significant improvement on Q2 20
and Q3 19.
Financing:
Vessel: Golar Seal facility’s put option is extended by 1 year
to January 2022.
Corporate: $30m margin loan and $150m bilateral facility
both outstanding at end Q3. Refer to Corporate Financing
slide for details of refinance.
GA
AP
NO
N G
AA
P 1
Q3 2020 Q2 2020 Q3 2019
$m $m % ∆ $m % ∆
Shipping and Corporate 41 48 -15% 44 7%
FLNG 55 55 - 55 -
Operating revenues 95 103 -7% 99 3%
Net (Loss)/Income (22) (156) 86% (82) 38%
Net Debt 2,303 2,280 +1% 1,929 +19%
Unrestricted cash 77 129 -40% 250 -69%
Golar restricted cash 100 97 3% 271 -63%
Total Golar cash 177 226 -22% 521 -66%
Shipping 22 32 -31% 22 -
FLNG 41 41 - % 47 -13%
Corporate (6) (6) - % (10) 40%
Adjusted EBITDA 57 67 -15% 59 -3%
(1) Please see the appendix for definition on the non-GAAP measures.
Cash position:
Total cash position at quarter end of $177m, of which $77m in
unrestricted cash. Our unrestricted cash was negatively
impacted by $17m, due to having to equity fund Gimi capex
during the BP FM event. Following the ending of the BP FM
event, the draw stop has been lifted, a $75m draw has been
made and the $17m of equity capex has been replaced,
increasing our liquidity post quarter end. This realigns the
drawdown ratios to the original debt equity funding ratios.
© Golar LNG Limited
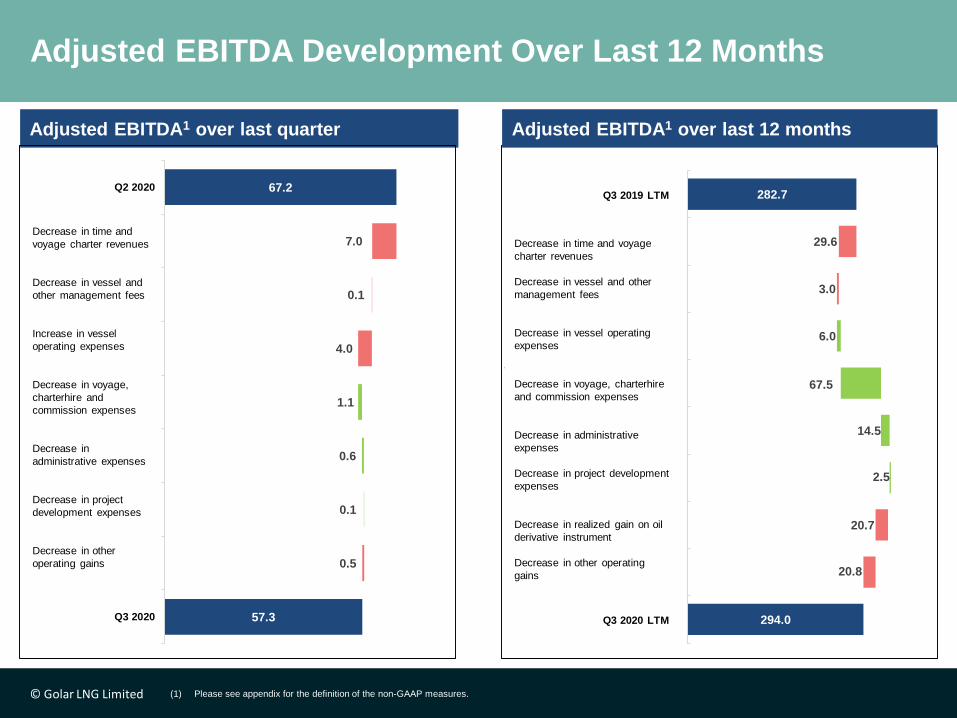
282.7
253.1
250.1
250.1
256.1
323.6
338.0
314.8
294.0
294.0
29.6
3.0
6.0
67.5
14.5
2.5
20.7
20.8
Q3 2019 LTM
Time And Voyage Charter Revenues(Incl. Collaborative Arrangement)
Vessel And Other Management Fees
Vessel Operating Expenses
Voyage, Charterhire And CommissionExpenses (Incl. Collaborative
Arrangement)
Administrative Expenses
Project Development Expenses
Realized Loss/(Gain) OnOil Derivative Instrument
Other Operating Gains
Q3 2020 LTM
Adjusted EBITDA Development Over Last 12 Months
(1) Please see appendix for the definition of the non-GAAP measures.
Adjusted EBITDA1 over last quarter Adjusted EBITDA1 over last 12 months
Q3 2019 LTM
Q3 2020 LTM
67.2
60.1
60.1
56.1
56.1
57.1
57.7
57.3
57.3
7.0
0.1
4.0
1.1
0.6
0.1
0.5
Q2 2020
Time And VoyageCharter Revenues
Vessel And OtherManagement Fees
Vessel OperatingExpenses
Voyage, Charterhire AndCommission Expenses
Administrative Expenses
Project DevelopmentExpenses
Other Operating Gains
Q3 2020
Decrease in time and
voyage charter revenues
Decrease in vessel and
other management fees
Increase in vessel
operating expenses
Decrease in voyage,
charterhire and
commission expenses
Decrease in
administrative expenses
Decrease in project
development expenses
Decrease in other
operating gains
Decrease in time and voyage
charter revenues
Decrease in vessel and other
management fees
Decrease in vessel operating
expenses
Decrease in voyage, charterhire
and commission expenses
Decrease in administrative
expenses
Decrease in project development
expenses
Decrease in realized gain on oil
derivative instrument
Decrease in other operating
gains
© Golar LNG Limited
Corporate Financing
8
Near Term Financing & Liquidity
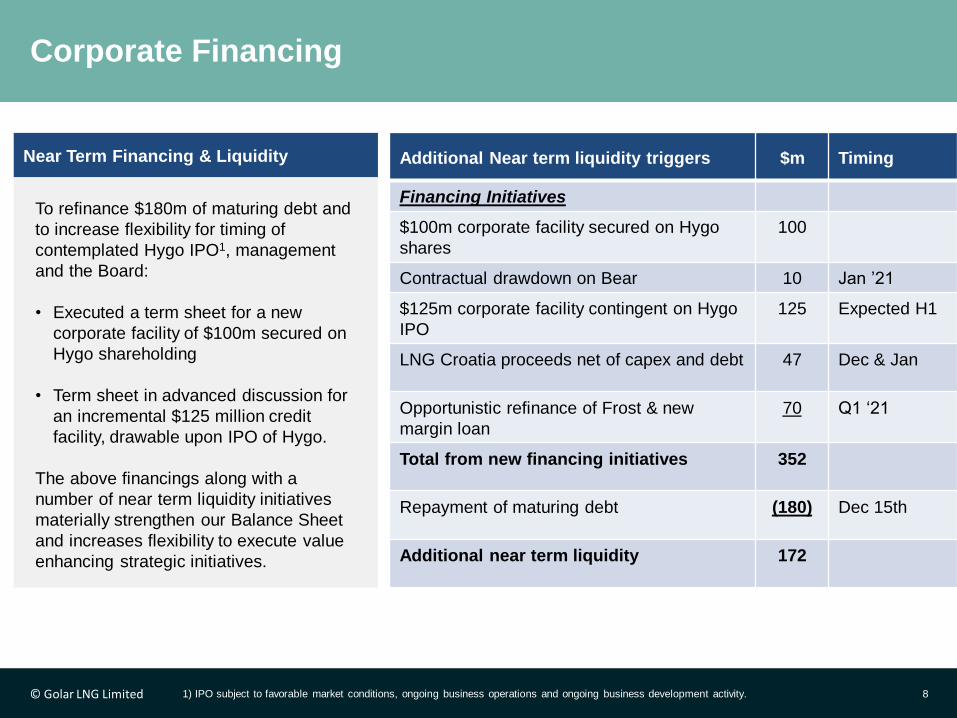
To refinance $180m of maturing debt and
to increase flexibility for timing of
contemplated Hygo IPO1, management
and the Board:
• Executed a term sheet for a new
corporate facility of $100m secured on
Hygo shareholding
• Term sheet in advanced discussion for
an incremental $125 million credit
facility, drawable upon IPO of Hygo.
The above financings along with a
number of near term liquidity initiatives
materially strengthen our Balance Sheet
and increases flexibility to execute value
enhancing strategic initiatives.
1) IPO subject to favorable market conditions, ongoing business operations and ongoing business development activity.
Additional Near term liquidity triggers $m Timing
Financing Initiatives
$100m corporate facility secured on Hygo
shares
100
Contractual drawdown on Bear 10 Jan ’21
$125m corporate facility contingent on Hygo
IPO
125 Expected H1
LNG Croatia proceeds net of capex and debt 47 Dec & Jan
Opportunistic refinance of Frost & new
margin loan
70 Q1 ‘21
Total from new financing initiatives 352
Repayment of maturing debt (180) Dec 15th
Additional near term liquidity 172
© Golar LNG Limited
7
93
99
77
276
72
348318
318
318
225
75
165
155
80
700
700
-
200
400
600
800
1,000
1,200
1,400
1,600
Historic Q4 -2020
2021 2022 2023 COD 2024 Total
Equity Equity Paid to Date Debt
286
84
100
42
512
118
630130
265
120
115
700
700
-
200
400
600
800
1,000
1,200
1,400
1,600
2019 2020 2021 2022 COD 2023 Total
Equity Debt
9
FLNG Gimi Conversion Funding Sources
$m
(1) The capex profile is based on fixed FM resolution packages which are subject to final approvals
(2) 100% basis represents the total funding requirement by equity partners. Golar’s share of equity funding is 70%
(3) Whilst the Gimi FM process was ongoing, the equity partners had to equity fund certain capex costs. With the removal of the draw stop, the Q4 drawdown of $75m realigns the
drawdown ratios to the original equity: debt funding percentages
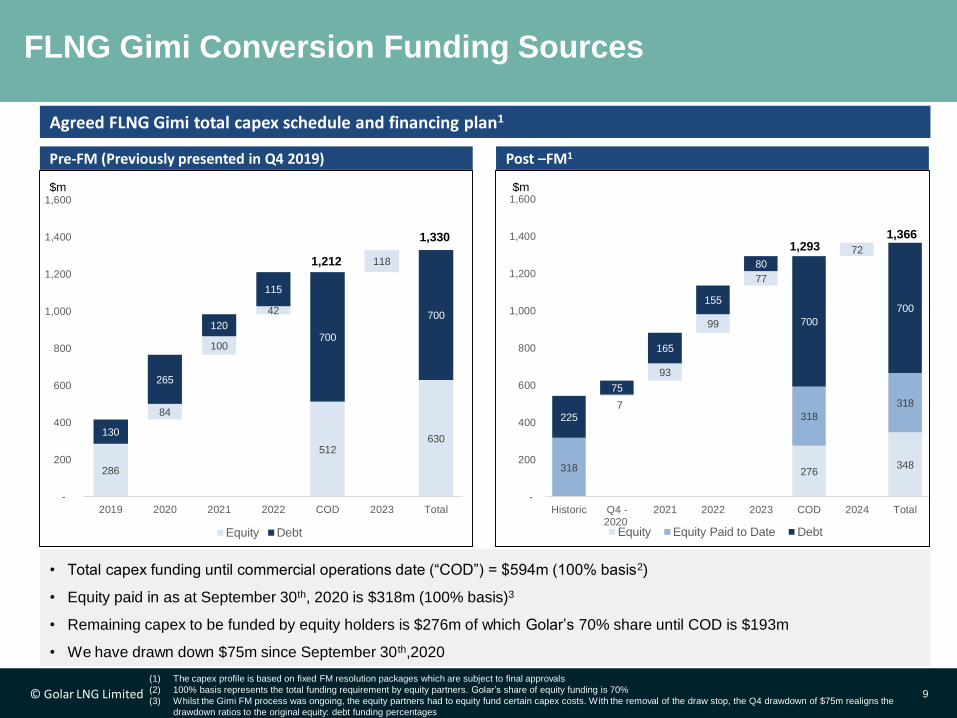
Agreed FLNG Gimi total capex schedule and financing plan1
• Total capex funding until commercial operations date (“COD”) = $594m (100% basis2)
• Equity paid in as at September 30th, 2020 is $318m (100% basis)3
• Remaining capex to be funded by equity holders is $276m of which Golar’s 70% share until COD is $193m
• We have drawn down $75m since September 30th,2020
1,2931,366
Post –FM1Pre-FM (Previously presented in Q4 2019)
1,212
1,330
$m
© Golar LNG Limited
Agenda
10
❑ Group results
❑ Shipping
❑ FLNG – Hilli and Gimi
❑ Hygo
❑ Strategic focus
© Golar LNG Limited 11
Shipping Adjusted EBITDA Over Previous Quarters
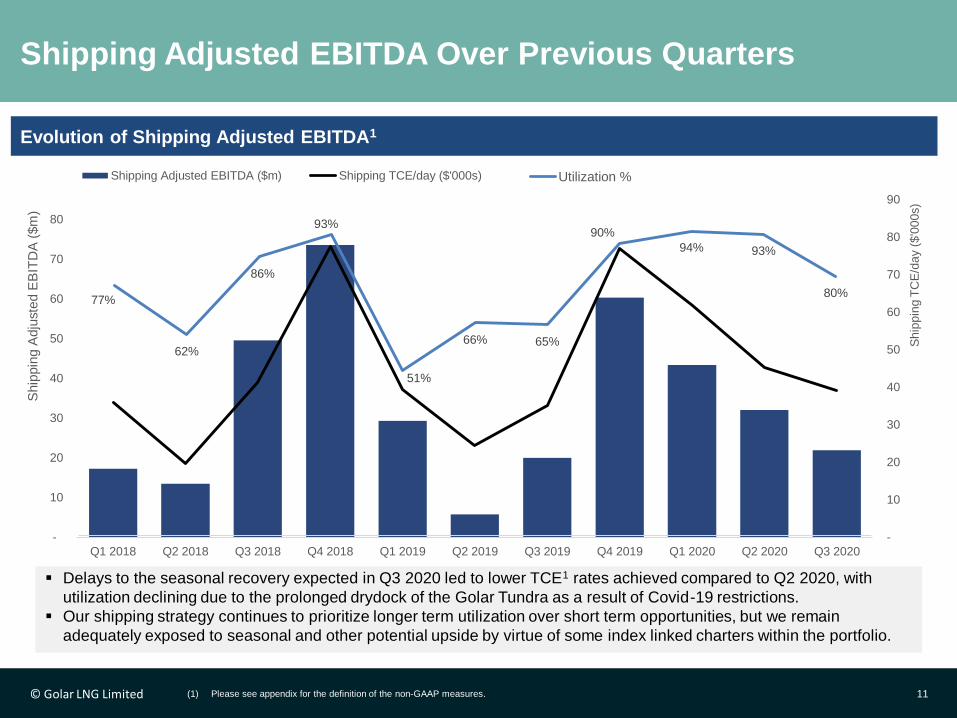
▪ Delays to the seasonal recovery expected in Q3 2020 led to lower TCE1 rates achieved compared to Q2 2020, with
utilization declining due to the prolonged drydock of the Golar Tundra as a result of Covid-19 restrictions.
▪ Our shipping strategy continues to prioritize longer term utilization over short term opportunities, but we remain
adequately exposed to seasonal and other potential upside by virtue of some index linked charters within the portfolio.
Evolution of Shipping Adjusted EBITDA1
(1) Please see appendix for the definition of the non-GAAP measures.
-
10
20
30
40
50
60
70
80
90
-
10
20
30
40
50
60
70
80
Q1 2018 Q2 2018 Q3 2018 Q4 2018 Q1 2019 Q2 2019 Q3 2019 Q4 2019 Q1 2020 Q2 2020 Q3 2020
Ship
pin
g T
CE
/day (
$'0
00s)
Ship
pin
g A
dju
ste
d E
BIT
DA
($m
)
Shipping Adjusted EBITDA ($m) Shipping TCE/day ($'000s)
77%
62%
86%
93%
51%
66% 65%
90%
94% 93%
80%
Utilization %
© Golar LNG Limited© Golar LNG Limited 12
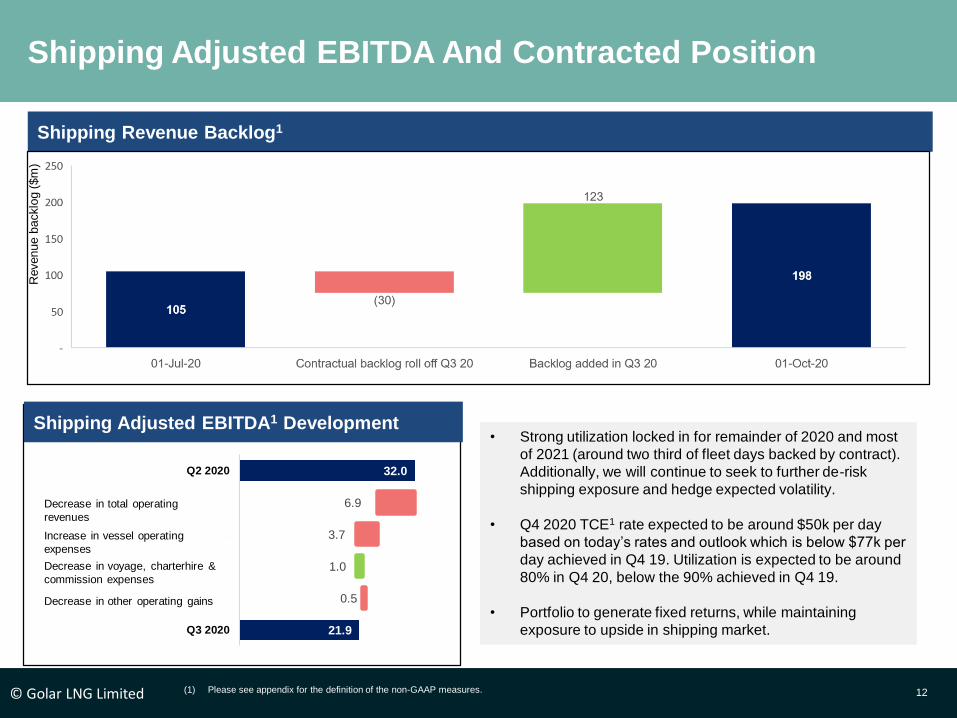
Shipping Adjusted EBITDA And Contracted Position
• Strong utilization locked in for remainder of 2020 and most
of 2021 (around two third of fleet days backed by contract).
Additionally, we will continue to seek to further de-risk
shipping exposure and hedge expected volatility.
• Q4 2020 TCE1 rate expected to be around $50k per day
based on today’s rates and outlook which is below $77k per
day achieved in Q4 19. Utilization is expected to be around
80% in Q4 20, below the 90% achieved in Q4 19.
• Portfolio to generate fixed returns, while maintaining
exposure to upside in shipping market.
(1) Please see appendix for the definition of the non-GAAP measures.
Revenue b
acklo
g (
$m
)
Shipping Revenue Backlog1
Shipping Adjusted EBITDA1 Development
32.0
25.1
21.4
21.4
22.4
21.9
6.9
3.7
1.0
0.5
Q2 2020
Total operating revenues
Vessel operating expenses
Voyage, charterhire& commission expenses
Other operating gains
Q3 2020
Decrease in total operating
revenues
Increase in vessel operating
expenses
Decrease in voyage, charterhire &
commission expenses
Decrease in other operating gains

© Golar LNG Limited
❑ Group results
❑ Shipping
❑ FLNG – Hilli and Gimi
❑ Hygo
❑ Strategic focus
Agenda
13
© Golar LNG Limited
FLNG Hilli Adjusted EBITDA Over The Previous Quarters
14
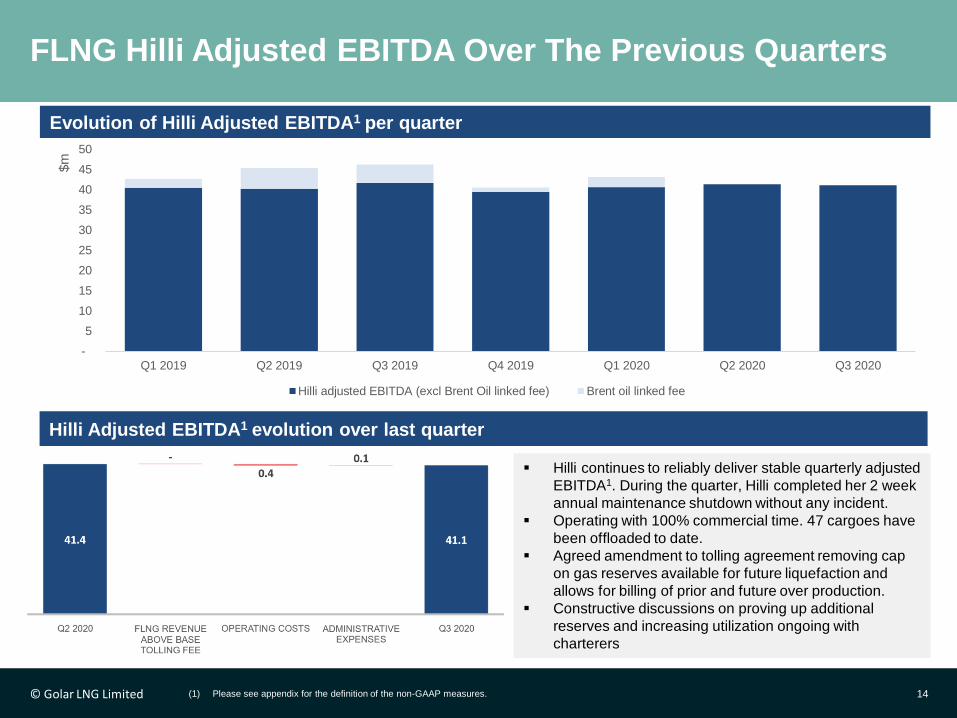
▪ Hilli continues to reliably deliver stable quarterly adjusted
EBITDA1. During the quarter, Hilli completed her 2 week
annual maintenance shutdown without any incident.
▪ Operating with 100% commercial time. 47 cargoes have
been offloaded to date.
▪ Agreed amendment to tolling agreement removing cap
on gas reserves available for future liquefaction and
allows for billing of prior and future over production.
▪ Constructive discussions on proving up additional
reserves and increasing utilization ongoing with
charterers
Hilli Episeyo’s EBITDA movement Q1’20 v Q4’19
Evolution of Hilli Adjusted EBITDA1 per quarter
(1) Please see appendix for the definition of the non-GAAP measures.
Hilli Adjusted EBITDA1 evolution over last quarter
-
5
10
15
20
25
30
35
40
45
50
Q1 2019 Q2 2019 Q3 2019 Q4 2019 Q1 2020 Q2 2020 Q3 2020
$m
Hilli adjusted EBITDA (excl Brent Oil linked fee) Brent oil linked fee
© Golar LNG Limited
FLNG Update
15
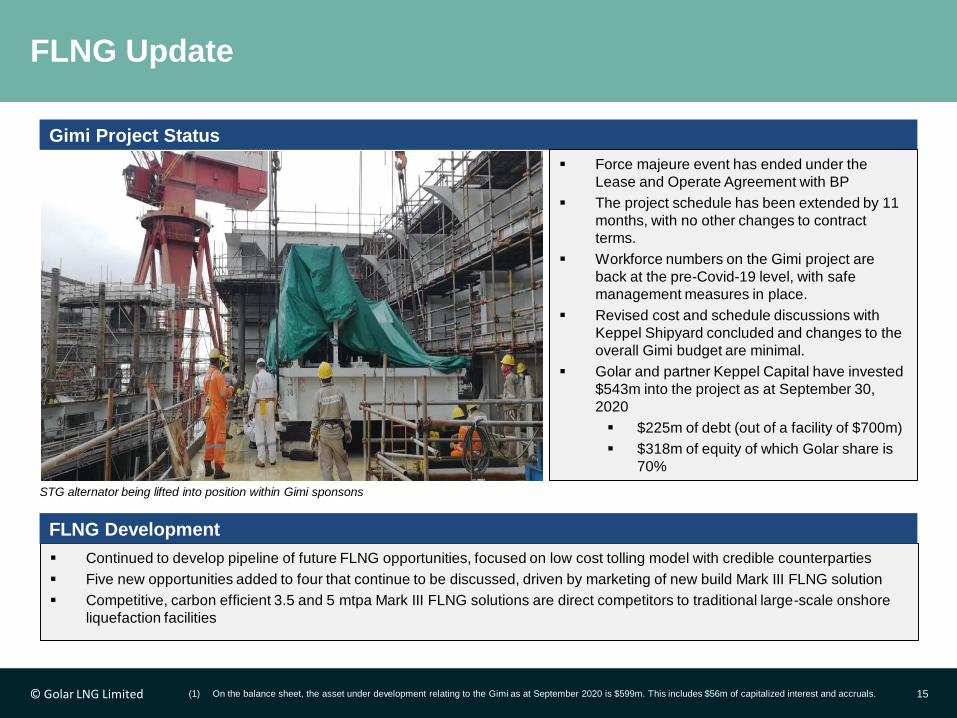
▪ Continued to develop pipeline of future FLNG opportunities, focused on low cost tolling model with credible counterparties
▪ Five new opportunities added to four that continue to be discussed, driven by marketing of new build Mark III FLNG solution
▪ Competitive, carbon efficient 3.5 and 5 mtpa Mark III FLNG solutions are direct competitors to traditional large-scale onshore
liquefaction facilities
Gimi Project Status
▪ Force majeure event has ended under the
Lease and Operate Agreement with BP
▪ The project schedule has been extended by 11
months, with no other changes to contract
terms.
▪ Workforce numbers on the Gimi project are
back at the pre-Covid-19 level, with safe
management measures in place.
▪ Revised cost and schedule discussions with
Keppel Shipyard concluded and changes to the
overall Gimi budget are minimal.
▪ Golar and partner Keppel Capital have invested
$543m into the project as at September 30,
2020
▪ $225m of debt (out of a facility of $700m)
▪ $318m of equity of which Golar share is
70%
FLNG Development
STG alternator being lifted into position within Gimi sponsons
(1) On the balance sheet, the asset under development relating to the Gimi as at September 2020 is $599m. This includes $56m of capitalized interest and accruals.
© Golar LNG Limited
❑ Group results
❑ Shipping
❑ FLNG – Hilli and Gimi
❑ Hygo
❑ Strategic focus
Agenda
16
© Golar LNG Limited
Hygo: Recent Corporate Events
17
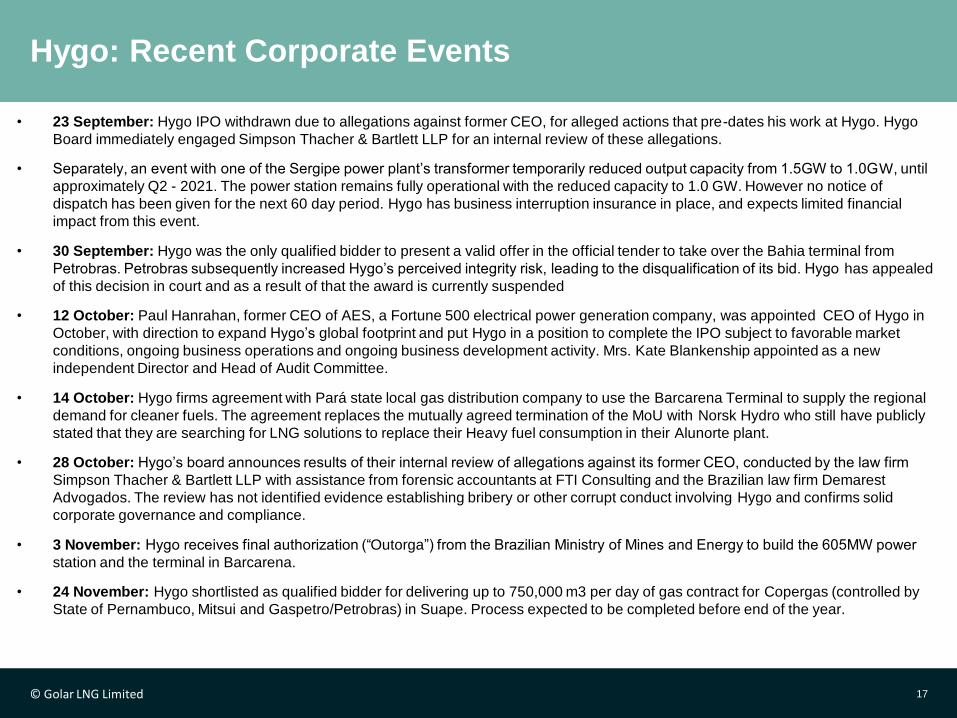
• 23 September: Hygo IPO withdrawn due to allegations against former CEO, for alleged actions that pre-dates his work at Hygo. Hygo
Board immediately engaged Simpson Thacher & Bartlett LLP for an internal review of these allegations.
• Separately, an event with one of the Sergipe power plant’s transformer temporarily reduced output capacity from 1.5GW to 1.0GW, until
approximately Q2 - 2021. The power station remains fully operational with the reduced capacity to 1.0 GW. However no notice of
dispatch has been given for the next 60 day period. Hygo has business interruption insurance in place, and expects limited financial
impact from this event.
• 30 September: Hygo was the only qualified bidder to present a valid offer in the official tender to take over the Bahia terminal from
Petrobras. Petrobras subsequently increased Hygo’s perceived integrity risk, leading to the disqualification of its bid. Hygo has appealed
of this decision in court and as a result of that the award is currently suspended
• 12 October: Paul Hanrahan, former CEO of AES, a Fortune 500 electrical power generation company, was appointed CEO of Hygo in
October, with direction to expand Hygo’s global footprint and put Hygo in a position to complete the IPO subject to favorable market
conditions, ongoing business operations and ongoing business development activity. Mrs. Kate Blankenship appointed as a new
independent Director and Head of Audit Committee.
• 14 October: Hygo firms agreement with Pará state local gas distribution company to use the Barcarena Terminal to supply the regional
demand for cleaner fuels. The agreement replaces the mutually agreed termination of the MoU with Norsk Hydro who still have publicly
stated that they are searching for LNG solutions to replace their Heavy fuel consumption in their Alunorte plant.
• 28 October: Hygo’s board announces results of their internal review of allegations against its former CEO, conducted by the law firm
Simpson Thacher & Bartlett LLP with assistance from forensic accountants at FTI Consulting and the Brazilian law firm Demarest
Advogados. The review has not identified evidence establishing bribery or other corrupt conduct involving Hygo and confirms solid
corporate governance and compliance.
• 3 November: Hygo receives final authorization (“Outorga”) from the Brazilian Ministry of Mines and Energy to build the 605MW power
station and the terminal in Barcarena.
• 24 November: Hygo shortlisted as qualified bidder for delivering up to 750,000 m3 per day of gas contract for Copergas (controlled by
State of Pernambuco, Mitsui and Gaspetro/Petrobras) in Suape. Process expected to be completed before end of the year.
© Golar LNG Limited
Hygo: Crystalizing Growth Pipeline in SSLNG
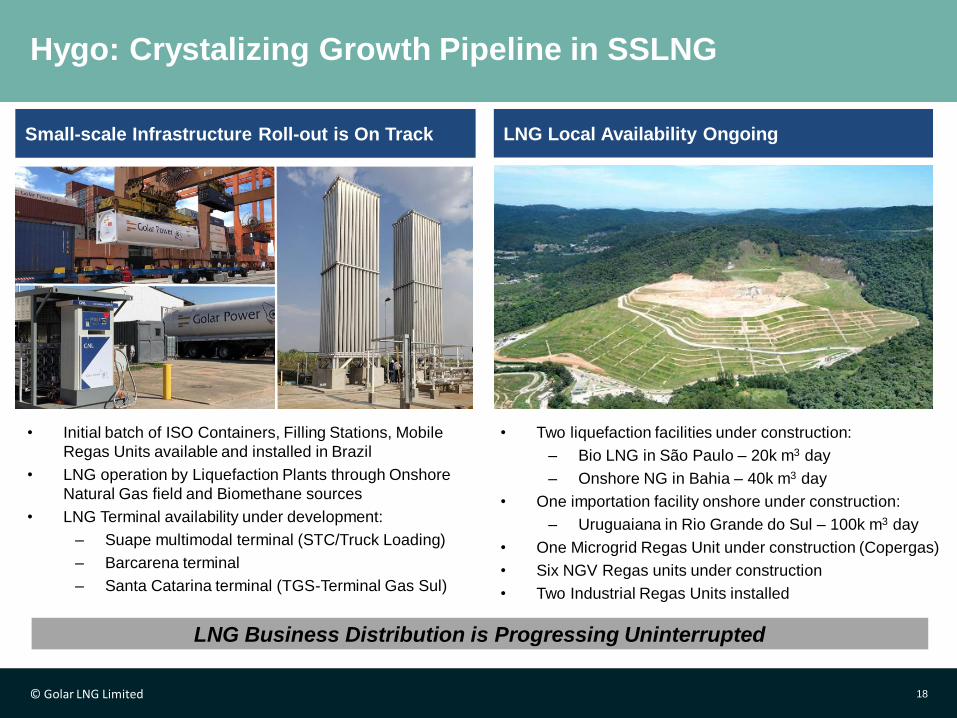
Small-scale Infrastructure Roll-out is On Track LNG Local Availability Ongoing
• Initial batch of ISO Containers, Filling Stations, Mobile
Regas Units available and installed in Brazil
• LNG operation by Liquefaction Plants through Onshore
Natural Gas field and Biomethane sources
• LNG Terminal availability under development:
– Suape multimodal terminal (STC/Truck Loading)
– Barcarena terminal
– Santa Catarina terminal (TGS-Terminal Gas Sul)
• Two liquefaction facilities under construction:
– Bio LNG in São Paulo – 20k m3 day
– Onshore NG in Bahia – 40k m3 day
• One importation facility onshore under construction:
– Uruguaiana in Rio Grande do Sul – 100k m3 day
• One Microgrid Regas Unit under construction (Copergas)
• Six NGV Regas units under construction
• Two Industrial Regas Units installed
LNG Business Distribution is Progressing Uninterrupted
18
© Golar LNG Limited
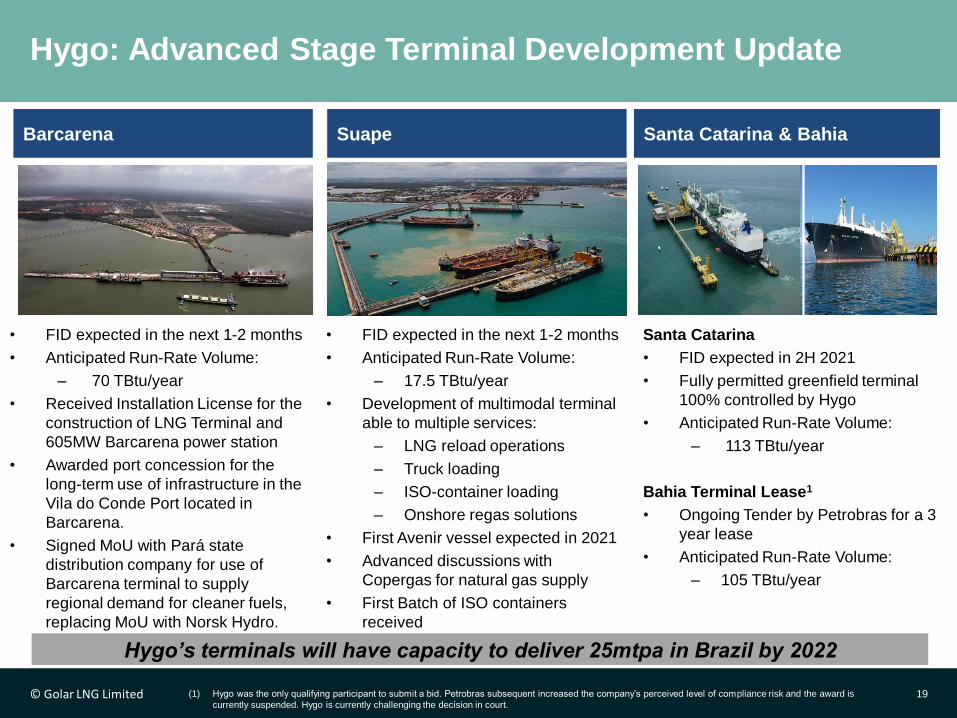
Hygo: Advanced Stage Terminal Development Update
Barcarena
• FID expected in the next 1-2 months
• Anticipated Run-Rate Volume:
– 70 TBtu/year
• Received Installation License for the
construction of LNG Terminal and
605MW Barcarena power station
• Awarded port concession for the
long-term use of infrastructure in the
Vila do Conde Port located in
Barcarena.
• Signed MoU with Pará state
distribution company for use of
Barcarena terminal to supply
regional demand for cleaner fuels,
replacing MoU with Norsk Hydro.
Hygo’s terminals will have capacity to deliver 25mtpa in Brazil by 2022
Suape Santa Catarina & Bahia
• FID expected in the next 1-2 months
• Anticipated Run-Rate Volume:
– 17.5 TBtu/year
• Development of multimodal terminal
able to multiple services:
– LNG reload operations
– Truck loading
– ISO-container loading
– Onshore regas solutions
• First Avenir vessel expected in 2021
• Advanced discussions with
Copergas for natural gas supply
• First Batch of ISO containers
received
Santa Catarina
• FID expected in 2H 2021
• Fully permitted greenfield terminal
100% controlled by Hygo
• Anticipated Run-Rate Volume:
– 113 TBtu/year
Bahia Terminal Lease1
• Ongoing Tender by Petrobras for a 3
year lease
• Anticipated Run-Rate Volume:
– 105 TBtu/year
(1) Hygo was the only qualifying participant to submit a bid. Petrobras subsequent increased the company’s perceived level of compliance risk and the award is
currently suspended. Hygo is currently challenging the decision in court.19
© Golar LNG Limited
❑ Group results
❑ Shipping
❑ FLNG – Hilli and Gimi
❑ Hygo
❑ Strategic focus
Agenda
20
© Golar LNG Limited
Golar ESG update
21
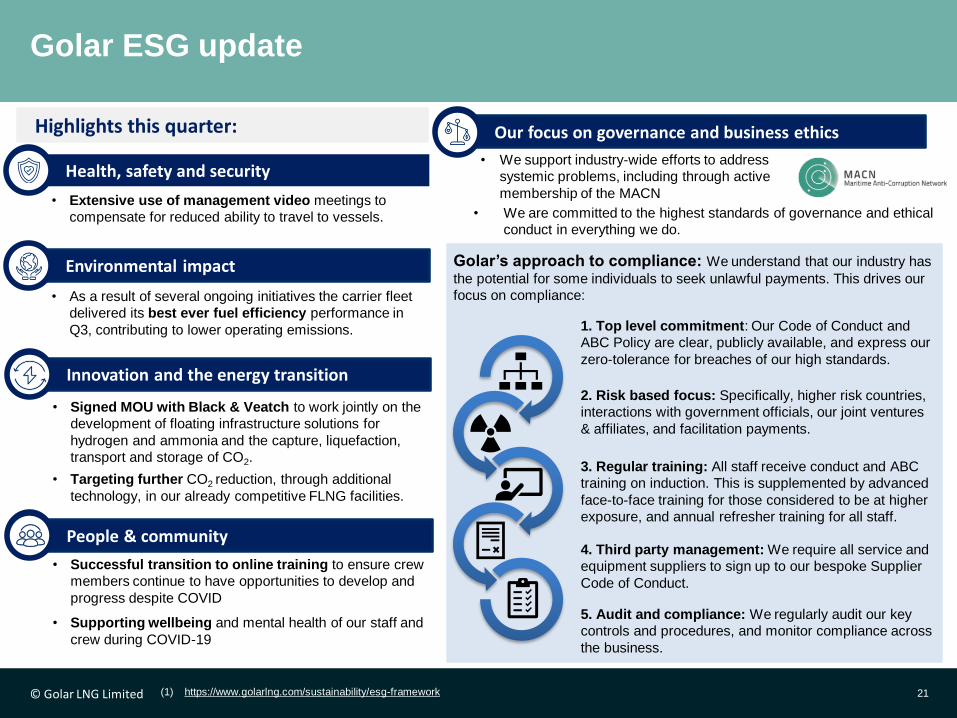
Highlights this quarter:
• Extensive use of management video meetings to
compensate for reduced ability to travel to vessels.
Health, safety and security
• As a result of several ongoing initiatives the carrier fleet
delivered its best ever fuel efficiency performance in
Q3, contributing to lower operating emissions.
Environmental impact
• Signed MOU with Black & Veatch to work jointly on the
development of floating infrastructure solutions for
hydrogen and ammonia and the capture, liquefaction,
transport and storage of CO2.
• Targeting further CO2 reduction, through additional
technology, in our already competitive FLNG facilities.
Innovation and the energy transition
• Successful transition to online training to ensure crew
members continue to have opportunities to develop and
progress despite COVID
• Supporting wellbeing and mental health of our staff and
crew during COVID-19
People & community
• We support industry-wide efforts to address
systemic problems, including through active
membership of the MACN
Our focus on governance and business ethics
• We are committed to the highest standards of governance and ethical
conduct in everything we do.
1. Top level commitment: Our Code of Conduct and
ABC Policy are clear, publicly available, and express our
zero-tolerance for breaches of our high standards.
2. Risk based focus: Specifically, higher risk countries,
interactions with government officials, our joint ventures
& affiliates, and facilitation payments.
3. Regular training: All staff receive conduct and ABC
training on induction. This is supplemented by advanced
face-to-face training for those considered to be at higher
exposure, and annual refresher training for all staff.
4. Third party management: We require all service and
equipment suppliers to sign up to our bespoke Supplier
Code of Conduct.
5. Audit and compliance: We regularly audit our key
controls and procedures, and monitor compliance across
the business.
Golar’s approach to compliance: We understand that our industry has
the potential for some individuals to seek unlawful payments. This drives our
focus on compliance:
(1) https://www.golarlng.com/sustainability/esg-framework
© Golar LNG Limited
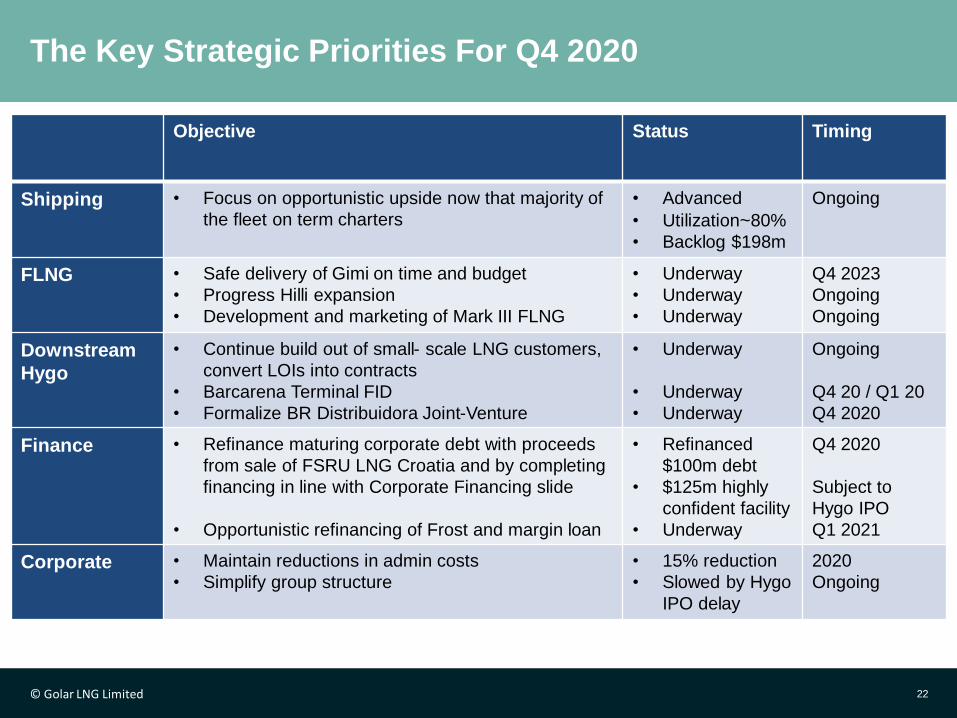
The Key Strategic Priorities For Q4 2020
22
Objective Status Timing
Shipping • Focus on opportunistic upside now that majority of
the fleet on term charters
• Advanced
• Utilization~80%
• Backlog $198m
Ongoing
FLNG • Safe delivery of Gimi on time and budget
• Progress Hilli expansion
• Development and marketing of Mark III FLNG
• Underway
• Underway
• Underway
Q4 2023
Ongoing
Ongoing
Downstream
Hygo
• Continue build out of small- scale LNG customers,
convert LOIs into contracts
• Barcarena Terminal FID
• Formalize BR Distribuidora Joint-Venture
• Underway
• Underway
• Underway
Ongoing
Q4 20 / Q1 20
Q4 2020
Finance • Refinance maturing corporate debt with proceeds
from sale of FSRU LNG Croatia and by completing
financing in line with Corporate Financing slide
• Opportunistic refinancing of Frost and margin loan
• Refinanced
$100m debt
• $125m highly
confident facility
• Underway
Q4 2020
Subject to
Hygo IPO
Q1 2021
Corporate • Maintain reductions in admin costs
• Simplify group structure
• 15% reduction
• Slowed by Hygo
IPO delay
2020
Ongoing

© Golar LNG Limited
Contact Us
Stuart BuchananHead of Investor Relations
T: +44 20 7063 7911
23
© Golar LNG Limited 24
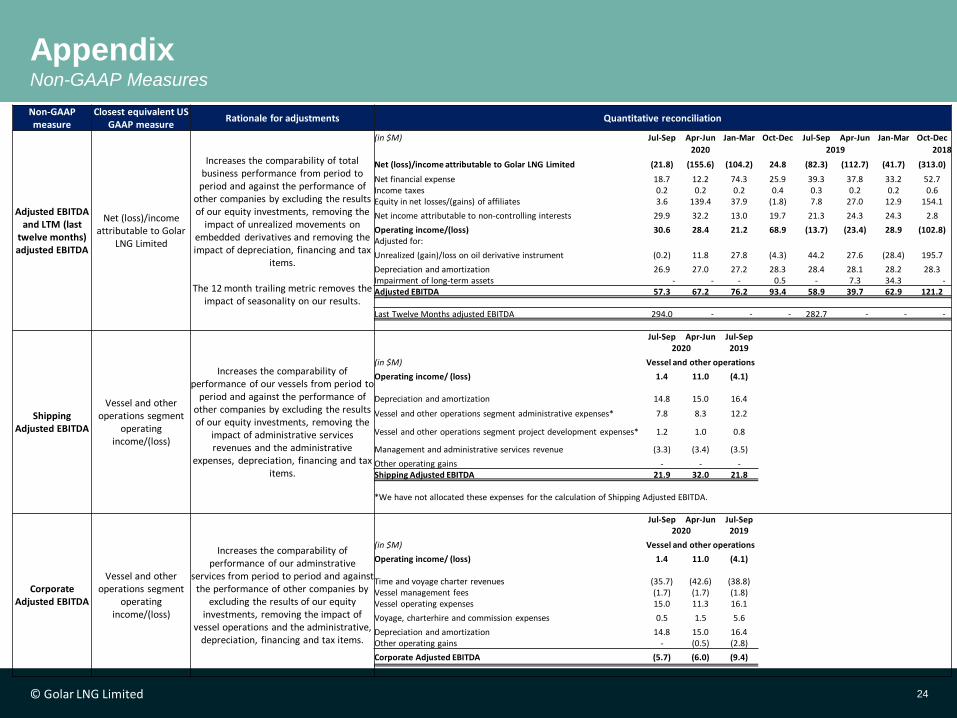
AppendixNon-GAAP Measures
Non-GAAP measure
Closest equivalent US GAAP measure
Rationale for adjustments Quantitative reconciliation
Adjusted EBITDA and LTM (last
twelve months) adjusted EBITDA
Net (loss)/income attributable to Golar
LNG Limited
Increases the comparability of total business performance from period to
period and against the performance of other companies by excluding the results of our equity investments, removing the
impact of unrealized movements on embedded derivatives and removing the impact of depreciation, financing and tax
items.
The 12 month trailing metric removes the impact of seasonality on our results.
(in $M) Jul-Sep Apr-Jun Jan-Mar Oct-Dec Jul-Sep Apr-Jun Jan-Mar Oct-Dec
2020 2019 2018
Net (loss)/income attributable to Golar LNG Limited (21.8) (155.6) (104.2) 24.8 (82.3) (112.7) (41.7) (313.0)
Net financial expense 18.7 12.2 74.3 25.9 39.3 37.8 33.2 52.7Income taxes 0.2 0.2 0.2 0.4 0.3 0.2 0.2 0.6Equity in net losses/(gains) of affiliates 3.6 139.4 37.9 (1.8) 7.8 27.0 12.9 154.1
Net income attributable to non-controlling interests 29.9 32.2 13.0 19.7 21.3 24.3 24.3 2.8
Operating income/(loss) 30.6 28.4 21.2 68.9 (13.7) (23.4) 28.9 (102.8)Adjusted for:
Unrealized (gain)/loss on oil derivative instrument (0.2) 11.8 27.8 (4.3) 44.2 27.6 (28.4) 195.7
Depreciation and amortization 26.9 27.0 27.2 28.3 28.4 28.1 28.2 28.3Impairment of long-term assets - - - 0.5 - 7.3 34.3 -Adjusted EBITDA 57.3 67.2 76.2 93.4 58.9 39.7 62.9 121.2
Last Twelve Months adjusted EBITDA 294.0 - - - 282.7 - - -
Shipping Adjusted EBITDA
Vessel and other operations segment
operating income/(loss)
Increases the comparability of performance of our vessels from period to
period and against the performance of other companies by excluding the results of our equity investments, removing the
impact of administrative services revenues and the administrative
expenses, depreciation, financing and tax items.
Jul-Sep Apr-Jun Jul-Sep2020 2019
(in $M) Vessel and other operations
Operating income/ (loss) 1.4 11.0 (4.1)
Depreciation and amortization 14.8 15.0 16.4
Vessel and other operations segment administrative expenses* 7.8 8.3 12.2
Vessel and other operations segment project development expenses* 1.2 1.0 0.8
Management and administrative services revenue (3.3) (3.4) (3.5)
Other operating gains - - -Shipping Adjusted EBITDA 21.9 32.0 21.8
*We have not allocated these expenses for the calculation of Shipping Adjusted EBITDA.
Corporate Adjusted EBITDA
Vessel and other operations segment
operating income/(loss)
Increases the comparability of performance of our adminstrative
services from period to period and against the performance of other companies by
excluding the results of our equity investments, removing the impact of
vessel operations and the administrative, depreciation, financing and tax items.
Jul-Sep Apr-Jun Jul-Sep2020 2019
(in $M) Vessel and other operations
Operating income/ (loss) 1.4 11.0 (4.1)
Time and voyage charter revenues (35.7) (42.6) (38.8)Vessel management fees (1.7) (1.7) (1.8)Vessel operating expenses 15.0 11.3 16.1
Voyage, charterhire and commission expenses 0.5 1.5 5.6
Depreciation and amortization 14.8 15.0 16.4Other operating gains - (0.5) (2.8)
Corporate Adjusted EBITDA (5.7) (6.0) (9.4)
© Golar LNG Limited 25
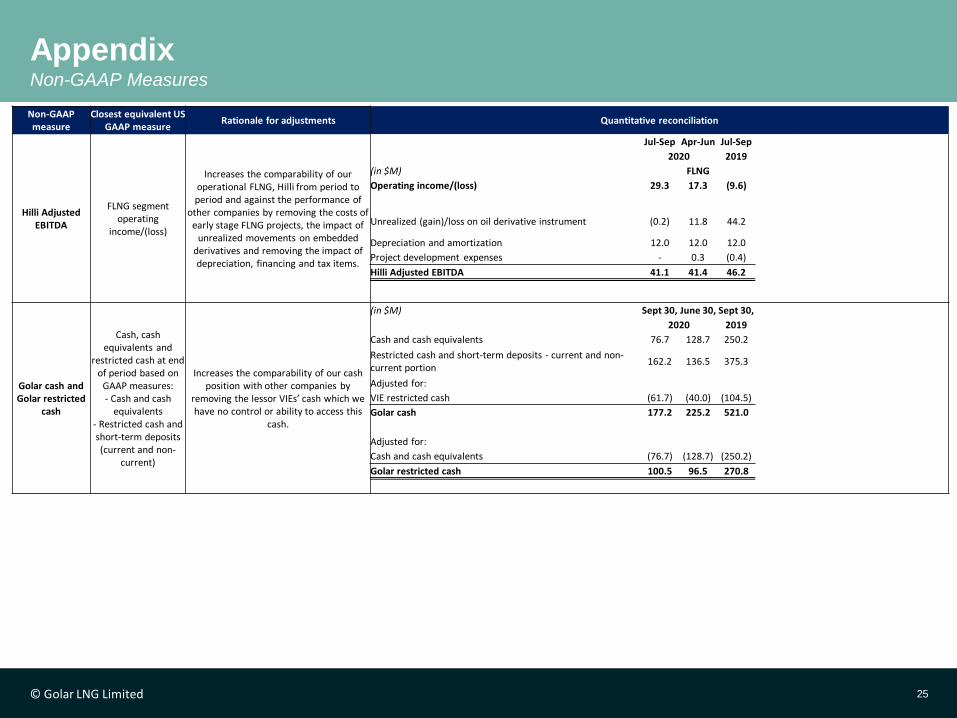
AppendixNon-GAAP Measures
Non-GAAP measure
Closest equivalent US GAAP measure
Rationale for adjustments Quantitative reconciliation
Hilli Adjusted EBITDA
FLNG segment operating
income/(loss)
Increases the comparability of our operational FLNG, Hilli from period to period and against the performance of
other companies by removing the costs of early stage FLNG projects, the impact of
unrealized movements on embedded derivatives and removing the impact of depreciation, financing and tax items.
Jul-Sep Apr-Jun Jul-Sep
2020 2019
(in $M) FLNG
Operating income/(loss) 29.3 17.3 (9.6)
Unrealized (gain)/loss on oil derivative instrument (0.2) 11.8 44.2
Depreciation and amortization 12.0 12.0 12.0
Project development expenses - 0.3 (0.4)
Hilli Adjusted EBITDA 41.1 41.4 46.2
Golar cash and Golar restricted
cash
Cash, cash equivalents and
restricted cash at end of period based on
GAAP measures:- Cash and cash
equivalents- Restricted cash and short-term deposits (current and non-
current)
Increases the comparability of our cash position with other companies by
removing the lessor VIEs’ cash which we have no control or ability to access this
cash.
(in $M) Sept 30, June 30, Sept 30,
2020 2019
Cash and cash equivalents 76.7 128.7 250.2
Restricted cash and short-term deposits - current and non-current portion
162.2 136.5 375.3
Adjusted for:
VIE restricted cash (61.7) (40.0) (104.5)
Golar cash 177.2 225.2 521.0
Adjusted for:
Cash and cash equivalents (76.7) (128.7) (250.2)
Golar restricted cash 100.5 96.5 270.8
© Golar LNG Limited 26
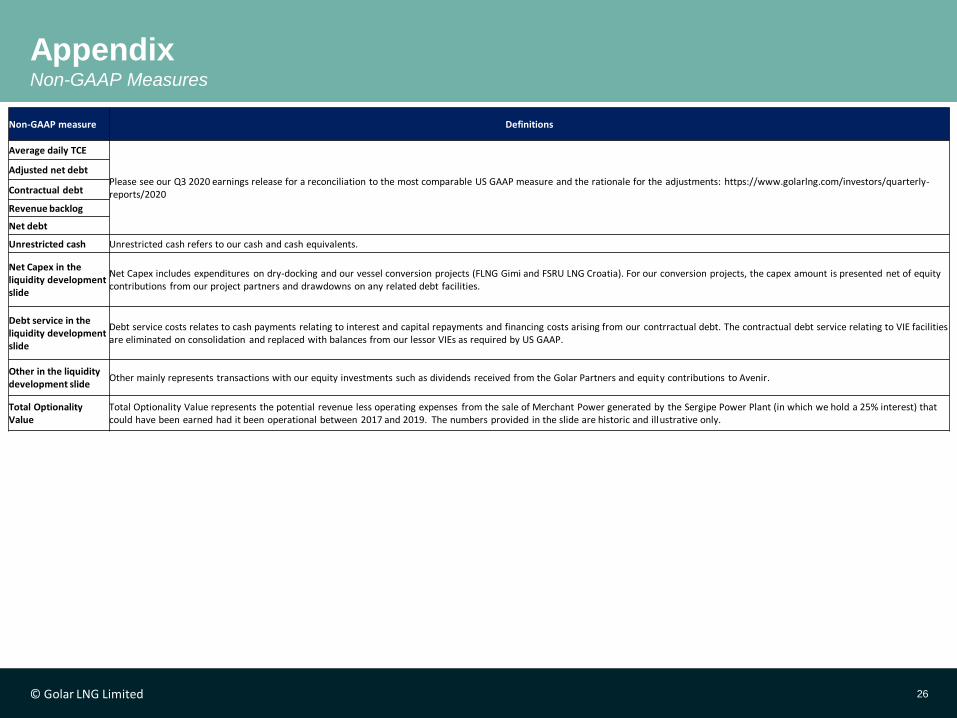
AppendixNon-GAAP Measures
Non-GAAP measure Definitions
Average daily TCE
Please see our Q3 2020 earnings release for a reconciliation to the most comparable US GAAP measure and the rationale for the adjustments: https://www.golarlng.com/investors/quarterly-reports/2020
Adjusted net debt
Contractual debt
Revenue backlog
Net debt
Unrestricted cash Unrestricted cash refers to our cash and cash equivalents.
Net Capex in the liquidity development slide
Net Capex includes expenditures on dry-docking and our vessel conversion projects (FLNG Gimi and FSRU LNG Croatia). For our conversion projects, the capex amount is presented net of equity contributions from our project partners and drawdowns on any related debt facilities.
Debt service in the liquidity development slide
Debt service costs relates to cash payments relating to interest and capital repayments and financing costs arising from our contrractual debt. The contractual debt service relating to VIE facilities are eliminated on consolidation and replaced with balances from our lessor VIEs as required by US GAAP.
Other in the liquidity development slide
Other mainly represents transactions with our equity investments such as dividends received from the Golar Partners and equity contributions to Avenir.
Total Optionality Value
Total Optionality Value represents the potential revenue less operating expenses from the sale of Merchant Power generated by the Sergipe Power Plant (in which we hold a 25% interest) that could have been earned had it been operational between 2017 and 2019. The numbers provided in the slide are historic and illustrative only.
Copyright © 2022 FDOKUMEN