
Home Capital Group Inc. 2019 Third Quarter Report
63
2019 THIRD QUARTER REPORT FINANCIAL HIGHLIGHTS (Unaudited) For the three months ended For the nine months ended (000s, except Percentage and Per Share Amounts) September 30 June 30 September 30 September 30 September 30 2019 2019 2018 2019 2018 OPERATING RESULTS Net Income $ 39,020 $ 31,907 $ 32,600 $ 98,750 $ 96,792 Adjusted Net Income 1 41,953 34,721 32,600 106,826 96,792 Net Interest Income 103,048 97,534 89,847 292,360 262,076 Total Revenue 116,649 111,272 105,086 331,745 310,476 Diluted Earnings per Share $ 0.67 $ 0.53 $ 0.41 $ 1.64 $ 1.21 Adjusted Diluted Earnings per Share 1 $ 0.72 $ 0.58 $ 0.41 $ 1.78 $ 1.21 Return on Shareholders’ Equity (annualized) 9.5% 7.7% 6.9% 8.0% 6.9% Adjusted Return on Shareholders’ Equity (annualized) 1 10.2% 8.4% 6.9% 8.7% 6.9% Return on Average Assets (annualized) 0.8% 0.7% 0.7% 0.7% 0.7% Net Interest Margin (TEB 2 ) 2.22% 2.09% 2.03% 2.11% 1.99% Provision as a Percentage of Gross Loans (annualized) 0.09% 0.15% 0.10% 0.12% 0.14% Net Write-Offs as a Percentage of Gross Loans (annualized) 0.06% 0.09% 0.02% 0.06% 0.03% Efficiency Ratio (TEB 2 ) 51.3% 55.4% 52.9% 54.7% 52.3% Adjusted Efficiency Ratio (TEB 2 ) 1 47.8% 51.9% 52.9% 51.4% 52.3% As at September 30 June 30 December 31 September 30 2019 2019 2018 2018 BALANCE SHEET HIGHLIGHTS Total Assets $ 18,934,256 $ 18,521,742 $ 18,141,689 $ 17,882,017 Total Assets Under Administration 3 24,776,872 24,584,880 24,680,225 24,657,402 Total Loan Portfolio 4 16,994,631 16,665,198 16,264,387 15,977,500 Total Loans Under Administration 3 22,968,969 22,901,521 22,933,274 22,818,087 Liquid Assets 1,341,268 1,323,216 1,287,933 1,376,156 Deposits 13,520,776 13,514,411 12,977,090 12,361,030 Shareholders’ Equity 1,642,182 1,647,519 1,640,610 1,911,352 FINANCIAL STRENGTH Capital Measures 5 Risk-Weighted Assets $ 7,517,872 $ 7,374,040 $ 7,245,855 $ 7,029,842 Common Equity Tier 1 Capital Ratio 19.67% 19.49% 18.94% 23.27% Tier 1 Capital Ratio 19.67% 19.49% 18.93% 23.27% Total Capital Ratio 20.13% 19.96% 19.38% 23.74% Leverage Ratio 7.80% 7.77% 7.54% 9.20% Credit Quality Net Non-Performing Loans as a Percentage of Gross Loans 0.49% 0.47% 0.47% 0.34% NPL Allowance as a Percentage of Gross NPL 6 23.6% 24.3% 19.9% 26.6% Share Information Book Value per Common Share $ 28.64 $ 27.80 $ 26.43 $ 23.82 Common Share Price – Close $ 25.77 $ 19.39 $ 14.40 $ 15.00 Market Capitalization $ 1,477,420 $ 1,149,129 $ 893,736 $ 1,203,690 Number of Common Shares Outstanding 57,331 59,264 62,065 80,246 1 See definition of Adjusted Net Income, Adjusted Diluted Earnings per Share, Adjusted Return on Shareholders’ Equity and Adjusted Efficiency Ratio under Non-GAAP Measures in this report and the Reconciliation of Net Income to Adjusted Net Income in Table 1 of this report. 2 See definition of Taxable Equivalent Basis (TEB) under Non-GAAP Measures in this report. 3 Total assets and loans under administration include both on- and off-balance sheet amounts. Total on-balance sheet loans include loans held for sale and are presented gross of allowance for credit losses. 4 Total loan portfolio is presented gross of allowance for credit losses and exclude loans held for sale. 5 These figures relate to the Company’s operating subsidiary, Home Trust Company. 6 NPL indicates non-performing loans, defined as Stage 3 loans under IFRS 9 Financial Instruments. See definition of impaired or non-performing loans under Glossary of Terms in this report.
-
Upload
khangminh22 -
Category
Documents
-
view
0 -
download
0
Transcript of Home Capital Group Inc. 2019 Third Quarter Report

2019 THIRD QUARTER REPORT FINANCIAL HIGHLIGHTS (Unaudited) For the three months ended For the nine months ended (000s, except Percentage and Per Share Amounts) September 30 June 30 September 30 September 30 September 30 2019 2019 2018 2019 2018 OPERATING RESULTS Net Income $ 39,020 $ 31,907 $ 32,600 $ 98,750 $ 96,792 Adjusted Net Income1 41,953 34,721 32,600 106,826 96,792 Net Interest Income 103,048 97,534 89,847 292,360 262,076 Total Revenue 116,649 111,272 105,086 331,745 310,476 Diluted Earnings per Share $ 0.67 $ 0.53 $ 0.41 $ 1.64 $ 1.21 Adjusted Diluted Earnings per Share1 $ 0.72 $ 0.58 $ 0.41 $ 1.78 $ 1.21 Return on Shareholders’ Equity (annualized) 9.5% 7.7% 6.9% 8.0% 6.9% Adjusted Return on Shareholders’ Equity (annualized)1 10.2% 8.4% 6.9% 8.7% 6.9% Return on Average Assets (annualized) 0.8% 0.7% 0.7% 0.7% 0.7% Net Interest Margin (TEB2) 2.22% 2.09% 2.03% 2.11% 1.99% Provision as a Percentage of Gross Loans (annualized) 0.09% 0.15% 0.10% 0.12% 0.14% Net Write-Offs as a Percentage of Gross Loans (annualized) 0.06% 0.09% 0.02% 0.06% 0.03% Efficiency Ratio (TEB2) 51.3% 55.4% 52.9% 54.7% 52.3% Adjusted Efficiency Ratio (TEB2)1 47.8% 51.9% 52.9% 51.4% 52.3% As at September 30 June 30 December 31 September 30 2019 2019 2018 2018 BALANCE SHEET HIGHLIGHTS Total Assets $ 18,934,256 $ 18,521,742 $ 18,141,689 $ 17,882,017 Total Assets Under Administration3 24,776,872 24,584,880 24,680,225 24,657,402 Total Loan Portfolio4 16,994,631 16,665,198 16,264,387 15,977,500 Total Loans Under Administration3 22,968,969 22,901,521 22,933,274 22,818,087 Liquid Assets 1,341,268 1,323,216 1,287,933 1,376,156 Deposits 13,520,776 13,514,411 12,977,090 12,361,030 Shareholders’ Equity 1,642,182 1,647,519 1,640,610 1,911,352 FINANCIAL STRENGTH Capital Measures5 Risk-Weighted Assets $ 7,517,872 $ 7,374,040 $ 7,245,855 $ 7,029,842 Common Equity Tier 1 Capital Ratio 19.67% 19.49% 18.94% 23.27% Tier 1 Capital Ratio 19.67% 19.49% 18.93% 23.27% Total Capital Ratio 20.13% 19.96% 19.38% 23.74% Leverage Ratio 7.80% 7.77% 7.54% 9.20% Credit Quality Net Non-Performing Loans as a Percentage of Gross Loans 0.49% 0.47% 0.47% 0.34% NPL Allowance as a Percentage of Gross NPL6 23.6% 24.3% 19.9% 26.6% Share Information Book Value per Common Share $ 28.64 $ 27.80 $ 26.43 $ 23.82 Common Share Price – Close $ 25.77 $ 19.39 $ 14.40 $ 15.00 Market Capitalization $ 1,477,420 $ 1,149,129 $ 893,736 $ 1,203,690 Number of Common Shares Outstanding 57,331 59,264 62,065 80,246 1 See definition of Adjusted Net Income, Adjusted Diluted Earnings per Share, Adjusted Return on Shareholders’ Equity and Adjusted Efficiency Ratio under Non-GAAP Measures in this report and the Reconciliation of Net Income to Adjusted Net Income in Table 1 of this report. 2 See definition of Taxable Equivalent Basis (TEB) under Non-GAAP Measures in this report. 3 Total assets and loans under administration include both on- and off-balance sheet amounts. Total on-balance sheet loans include loans held for sale and are presented gross of allowance for credit losses. 4 Total loan portfolio is presented gross of allowance for credit losses and exclude loans held for sale. 5 These figures relate to the Company’s operating subsidiary, Home Trust Company. 6 NPL indicates non-performing loans, defined as Stage 3 loans under IFRS 9 Financial Instruments. See definition of impaired or non-performing loans under Glossary of Terms in this report.

2
Home Capital Group Inc. is a public company, traded on the Toronto Stock Exchange (HCG), operating through its principal subsidiary, Home Trust Company. Home Trust is a federally regulated trust company offering residential and non-residential mortgage lending, securitization of residential mortgage products, consumer lending and credit card services. In addition, Home Trust offers deposits via brokers and financial planners, and through a direct-to-consumer brand, Oaken Financial. Home Trust also conducts business through its wholly owned subsidiary, Home Bank. Licensed to conduct business across Canada, we have offices in Ontario, Alberta, British Columbia, Nova Scotia, Quebec and Manitoba.
Home Trust Company www.hometrust.ca Home Capital Group Inc. www.homecapital.com
Table of Contents
Report to Shareholders p. 3 Quarterly Financial Highlights p. 33
Management’s Discussion and Analysis p. 5 Non-GAAP Measures and Glossary p. 34
Business Profile p. 6 Consolidated Balance Sheets p. 38
2019 Outlook p. 7 Consolidated Statements of Income p. 39
Financial Performance Review p. 9 Consolidated Statements of Comprehensive Income p. 40
Financial Position Review p. 16 Consolidated Statements of Changes in Shareholders' Equity p. 41
Capital Management p. 24 Consolidated Statements of Cash Flows p. 42
Risk Management p. 25 Notes to the Interim Consolidated Financial Statements p. 43
Accounting Standards and Policies p. 32 Corporate Directory & Shareholder Information p. 63

3
Home Capital today reported financial results for the three and nine months ended September 30, 2019. “I’m very pleased with what we accomplished in our third quarter,” stated Yousry Bissada, President and Chief Executive Officer. “The Home team delivered strong financial results, showcased our culture of innovation by completing the first Canadian cross-border Residential Mortgage-Backed Securities offering, and continued to make progress on our digital transformation journey.”
Net Income: 67 cents per share up 63.4% from 41 cents per share in Q3 2018
• Net income of $39.0 million or 67 cents per share, compared with $31.9 million or 53 cents per share for Q2 2019 and $32.6 million or 41 cents per share for Q3 2018
• Adjusted net income of $42.0 million or 72 cents per share, up 24.1% from 58 cents per share in Q2 2019 and up 75.6% from 41 cents per share or $32.6 million in Q3 2018 after adjusting for items of note related to implementing our IT Roadmap
• Net interest margin of 2.22% compared with 2.09% in Q2 2019 and 2.03% in Q3 2018
• Non-interest expenses of $59.9 million compared with $61.7 million in Q2 2019 and $55.6 million in Q3 2018, a decrease of 3.0% from Q2 2019 and an increase of 7.7% from Q3 2018
Asset Growth: Positive year-over-year growth in mortgage originations of 7.6% and total loan portfolio of 6.4%
• Mortgage originations of $1.55 billion in Q3 2019, compared with $1.28 billion in Q2 2019 and $1.44 billion in Q3 2018
• Single-family mortgage originations of $1.19 billion in Q3 2019, compared with $1.05 billion in Q2 2019 and $1.02 billion in Q3 2018
• Total loan portfolio at the end of the quarter of $16.99 billion, an increase of 2.0% from Q2 2019 and 6.4% over Q3 2018
• Loans under administration of $22.97 billion up 0.3% from Q2 2019 and up 0.7% from Q3 2018
Funding: Deposits through our Oaken channel of $3.27 billion
• Total deposits of $13.52 billion compared with $13.51 billion at the end of Q2 2019 and $12.36 billion at the end of Q3 2018
• Total Oaken deposits of $3.27 billion, an increase of 4.9% from the end of Q2 2019 and 27.7% from the end of Q3 2018
• Oaken’s share of total deposits was 24.2% at the end of Q3 2019 compared with 23.1% at the end of Q2 2019 and 20.7% at the end of Q3 2018
Credit Quality: Annualized credit provisions of 0.09% of gross loans compared with 0.10% in Q3 2018
• Total provision for credit losses (PCL) of $3.7 million in Q3 2019 compared with $6.1 million in Q2 2019, and $4.0 million in Q3 2018
• Provision expense of 0.09% of gross loans compared with 0.15% in Q2 2019 and 0.10% in Q3 2018
• Net write-offs as a percentage of gross loans of 0.06% compared with 0.09% in Q2 2019 and 0.02% in Q3 2018
• Net non-performing loans (represented by Stage 3 loans under IFRS 9) as a percentage of gross loans at 0.49% at the end of Q3 2019 compared with 0.47% at the end of Q2 2019 and 0.34% at the end of Q3 2018
TO OUR SHAREHOLDERS

4
Update on Capital Plan
Effective January 2, 2019, Home Capital commenced a normal course issuer bid (“NCIB”) to permit the repurchase of common shares of Home Capital (“Common Shares”) through the facilities of the Toronto Stock Exchange, designated exchanges and alternative trading systems. As of September 30, 2019, Home Capital had completed all of the repurchases authorized under the NCIB, 4,753,517 common shares. The Company announced that it intends to launch a Substantial Issuer Bid (“SIB”) to repurchase for cancellation up to $150 million of its common shares. Subject to market and other conditions, the Company expects that the terms of the bid will be announced in the fourth quarter of 2019 and that the bid will be completed in the first quarter of 2020. Upon completion of the SIB, the Company intends to apply to the Toronto Stock Exchange (“TSX”) for a renewal of its Normal Course Issuer Bid. “In the last 12 months we have completed a $300 million Substantial Issuer Bid and utilized $94.3 million to repurchase the maximum number of shares authorized under our Normal Course Issuer Bid. The shares repurchased under these two programs were acquired at an average discount of 40% to our third quarter 2019 book value of $28.64 per share. This clearly demonstrates Home Capital’s ability to increase shareholder value through share repurchases,” stated Brad Kotush, Executive Vice President and Chief Financial Officer. “Commencing another Substantial Issuer Bid in the fourth quarter of 2019 and renewing our Normal Course Issuer Bid in 2020 are part of our continuing commitment to return capital to shareholders.” The Board of Home Capital will continue its ongoing review of various options for deployment of capital, including further share repurchases and payment of common share dividends. Outlook
Home Capital believes that the healthy and balanced market conditions experienced for much of 2019 will continue for the balance of the year. “The results of this quarter reflect the combined efforts and dedication of all parts of the Company in executing our strategy,” said Mr. Bissada. “We will continue on this path to drive our efforts to create value for the long term.”
YOUSRY BISSADA PAUL DERKSEN President and Chief Executive Officer Chair of the Board November 12, 2019
Additional information concerning the Company’s expectations for 2019, including the risks and assumptions underlying these expectations may be found in the MD&A of this quarterly report.

5
This Management’s Discussion and Analysis (MD&A) is provided to enable readers to assess the financial condition and results of operations of Home Capital Group Inc. (the “Company” or “Home Capital”) for the three months ended September 30, 2019. The discussion and analysis relates principally to the Company’s subsidiary Home Trust Company (Home Trust), which offers residential and non-residential mortgage lending, securitization of residential mortgage products, consumer lending and credit card services. In addition, Home Trust offers deposits via brokers and financial planners, and through a direct-to-consumer brand, Oaken Financial. Home Trust also conducts business through its wholly owned subsidiary, Home Bank. This MD&A should be read in conjunction with the unaudited interim consolidated financial statements and accompanying notes for the period ended September 30, 2019 included in this report and the MD&A and audited consolidated financial statements and accompanying notes for the year ended December 31, 2018 included in the Company’s 2018 Annual Report. Except as described in this MD&A and these unaudited interim consolidated financial statements, all factors discussed and referred to in the MD&A for fiscal 2018 remain substantially unchanged. This MD&A has been prepared with reference to the unaudited consolidated financial statements which are prepared in accordance with International Financial Reporting Standards (IFRS or GAAP) and all amounts are presented in Canadian dollars. This MD&A is current as of November 12, 2019. As in prior quarters, the Company’s Audit and Conduct Review Committee reviewed this document, and prior to its release the Company’s Board of Directors (Board) approved it, on the Audit and Conduct Review Committee’s recommendation. The Non-GAAP Measures used in this MD&A and a glossary of terms used in this MD&A and the financial statements are presented in the last section of this MD&A.
The Company’s continuous disclosure materials, including interim filings, annual Management’s Discussion and Analysis and audited consolidated financial statements, Annual Information Form, Notice of Annual Meeting of Shareholders and Proxy Circular are available on the Company’s website at www.homecapital.com, and on the Canadian Securities Administrators’ website at www.sedar.com.
Caution Regarding Forward-looking Statements
From time to time Home Capital Group Inc. makes written and verbal forward-looking statements. These are included in the Annual Report, periodic reports to shareholders, regulatory filings, press releases, Company presentations and other Company communications. Forward-looking statements are made in connection with business objectives and targets, Company strategies, operations, anticipated financial results and the outlook for the Company, its industry, and the Canadian economy. These statements regarding expected future performance are “financial outlooks” within the meaning of National Instrument 51-102. Please see the risk factors, which are set forth in detail in the Risk Management section of this report, as well as the Company’s other publicly filed information, which is available on the System for Electronic Document Analysis and Retrieval (SEDAR) at www.sedar.com, for the material factors that could cause the Company’s actual results to differ materially from these statements. These risk factors are material risk factors a reader should consider, and include credit risk, liquidity and funding risk, structural interest rate risk, operational risk, investment risk, strategic risk, reputational risk, compliance risk and capital adequacy risk along with additional risk factors that may affect future results. Forward-looking statements can be found in the Report to the Shareholders and the Outlook section in this quarterly report. Forward-looking statements are typically identified by words such as “will,” “believe,” “expect,” “anticipate,” “intend,” “should,” “estimate,” “plan,” “forecast,” “may,” and “could” or other similar expressions.
By their very nature, these statements require the Company to make assumptions and are subject to inherent risks and uncertainty, general and specific, which may cause actual results to differ materially from the expectations expressed in the forward-looking statements. These risks and uncertainties include, but are not limited to, global capital market activity, changes in government monetary and economic policies, changes in interest rates, inflation levels and general economic conditions, legislative and regulatory developments, competition and technological change. The preceding list is not exhaustive of possible factors.
These and other factors should be considered carefully and readers are cautioned not to place undue reliance on these forward-looking statements. The Company presents forward-looking statements to assist shareholders in understanding the Company’s assumptions and expectations about the future that are relevant in management’s setting of performance goals, strategic priorities and outlook. The Company presents its outlook to assist shareholders in understanding management’s expectations on how the future will impact the financial performance of the Company. These forward-looking statements may not be appropriate for other purposes. The Company does not undertake to update any forward-looking statements, whether written or verbal, that may be made from time to time by it or on its behalf, except as required by securities laws.
Assumptions about the performance of the Canadian economy in 2019 and its effect on Home Capital’s business are material factors the Company considers when setting strategic priorities and outlook. In determining expectations for economic growth, both broadly and in the financial services sector, the Company primarily considers historical and forecasted economic data provided by the Canadian government and its agencies and other third-party providers. In setting and reviewing its strategic priorities and outlook for the remainder of 2019, management continues to assume:
• The Canadian economy is expected to be relatively stable in 2019. However, it will continue to be influenced by economic conditions in the United States and global markets, including the impact from trade relations; the Company is prepared for potential volatility.
• Stable employment conditions in the Company’s established regions. Also, the Company expects inflation will generally be within the Bank of Canada’s target of 1% to 3%, leading to stable credit losses and demand for the Company’s lending products in its established regions.
• The Bank of Canada overnight interest rate will remain stable in 2019.
• Current and expected levels of housing activity indicate a relatively stable real estate market overall and in particular for the Company’s key Greater Toronto Area (GTA) market. Please see Market Conditions under the 2019 Outlook for more discussion on the Company’s expectations for the housing market.
MANAGEMENT’S DISCUSSION AND ANALYSIS

6
• Debt service levels of Canadian households will remain manageable in 2019; however, high levels of consumer debt make the economy more vulnerable in the event of an increase in interest rates and any economic weakness.
• Access to the mortgage and deposit markets through broker networks will be maintained.
Home Capital is a holding company that operates primarily through its principal, federally regulated subsidiary, Home Trust, which offers residential and non-residential mortgage lending, securitization of residential mortgage products, consumer lending and credit card services. In addition, Home Trust offers deposits via brokers and financial planners, and through a direct-to-consumer brand, Oaken Financial. Home Trust also conducts business through its wholly owned subsidiary, Home Bank. Licensed to conduct business across Canada, Home Trust and Home Bank have offices in Ontario, Alberta, British Columbia, Nova Scotia, Quebec and Manitoba. Business is primarily conducted in Canadian dollars.
The Business Portfolios have not changed from the 2018 Annual Report. Please refer to pages 20 to 21 of the 2018 Annual Report.
As management views its business as a single segment with a variety of product and service activities, the financial statements and the MD&A are prepared on that basis.
BUSINESS PROFILE

7
The Company’s priority is to position the business for long-term profitable leadership in the alternative lending industry within the framework of a sustainable risk culture. To achieve this, management is focused on offering competitive products, increasing outreach in the broker community and enhancing service experience through technological innovation and process re-engineering. The Company has launched a multi-year transformation of the systems underlying the Company’s core operations (the “IT Roadmap”) that will improve the experience of customers, while making internal operations more flexible and efficient.
Market Conditions
The Company believes that current market conditions suggest a balanced and sustainable real estate market going forward, supported by healthy and rational levels of competition. The Company expects stable employment conditions, high immigration targets and relatively tight housing supply to continue to provide support to the Company’s primary market.
Classic Single-Family Mortgage Lending
The Company expects that focus on service for 2019 will allow the Company to continue to improve Classic mortgage origination volumes within its established regions.
Securitized Mortgage Lending
During the third quarter of 2019, the Company closed a $425 million private placement of Residential Mortgage-Backed Securities (RMBS). The RMBS are backed by a portfolio of the Company’s uninsured Classic single-family residential mortgages. The Company expects to be a serial issuer of these securities, subject to market conditions. Please see Note 6 to the unaudited consolidated financial statements included in this report for more information. The Company will continue to originate and securitize prime insured single-family and insured multi-unit residential mortgages and will generally sell the insured multi-unit residential mortgages off-balance sheet, generating gains on sale. The market for the products remains competitive and the Company expects that new origination levels and spreads will be impacted by this level of competition. The Company remains committed to offering a range of mortgage products through its distribution channels.
Commercial Mortgage Lending
Commercial mortgage lending will remain an important portfolio for the Company, contributing high yields and providing asset diversification. The Company continues to grow the non-residential commercial portfolio. The Company expects the commercial mortgage market to remain competitive.
Consumer Lending
Credit cards and other consumer retail loans are complementary product offerings supporting the Company’s lending strategy. The Company expects to complete its strategic review of its other consumer retail loan portfolio in Q4 2019.
Net Interest Margin
The Company is prepared for modest volatility in its net interest margin which may be impacted by interest rate changes should the Bank of Canada change its rate and increased competition from other lenders, among other variables.
Credit Performance and Losses
The Company’s prudent underwriting and collection practices are reflected in the low levels of credit losses and delinquencies in its mortgage portfolio. Credit losses and delinquencies on the mortgage portfolio are expected to remain low in 2019; however, the Company is prepared for volatility in this performance that may result from changes in the macroeconomic environment.
The allowance for credit losses is sensitive to the inputs used in models, including macroeconomic variables in the forward-looking scenarios and their respective probability weightings, among other factors. This may add significant volatility to reported credit losses.
Non-Interest Expenses
It is expected that salaries and benefits will increase in line with an increase in the number of employees required for current business levels along with inflationary increases. Some of the expected increase in the number of employees will result from additional resources needed to support the IT Roadmap. In addition, it is expected that other operating expenses will be higher than normal until the conclusion of the IT Roadmap. Contributing to the higher level of expense will be the accelerated amortization of internally developed software currently in use that will be replaced with software being developed under the IT Roadmap.
As the IT Roadmap is a multi-year transformation of the systems underlying the Company’s core operations, a significant portion of the total expenditure on the IT Roadmap will be capitalized during the development phase as internally developed software. Such expenditures will not be recognized in operating expenses until the development is substantially completed and amortization of the expenditures commences. It is expected that development of the underlying components of the IT
2019 OUTLOOK

8
Roadmap will be completed in stages and amortization of the expenditures will commence as each component is ready for use.
Deposits
The Company will continue to source deposits from the public through investment dealers and deposit brokers and will continue to emphasize growth of its direct-to-consumer business, Oaken Financial. The Company intends to maintain demand deposits at an appropriate level that is aligned with the Company’s liquidity and funding requirements as well as its risk appetite.
Liquidity, Funding and Capital
The inaugural RMBS issue referred to above under Securitized Mortgage Lending has expanded the Company’s funding sources. The Company will continue to diversify its funding sources and maintain a significant liquidity position by holding a sufficient stock of unencumbered high-quality liquid assets.
As announced, the Board has authorized the initiation of a substantial issuer bid (SIB) in Q4 2019 pursuant to which the Company will offer to purchase for cancellation its common shares. The Company expects to announce the terms of the SIB at the end of November this year.
Home Capital implemented a Normal Course Issuer Bid (NCIB), effective January 2, 2019 and repurchased 4,753,517 common shares under the NCIB during the first nine months of 2019. After finalizing its SIB, the Company will apply to renew its NCIB. The Company will continue to review opportunities to optimize its capital structure and expects capital ratios will remain in excess of both regulatory and internal capital targets.
This Outlook section contains forward-looking statements. Please see the Caution Regarding Forward-looking Statements in this report.

9
FINANCIAL PERFORMANCE REVIEW Table 1: Income Statement Summary For the three months ended For the nine months ended
(000s, except per share amounts) September 30 June 30 September 30 September 30 September 30
2019 2019 2018 2019 2018
Net interest income non-securitized assets $ 99,642 $ 94,264 $ 85,944 $ 281,094 $ 252,488
Net interest income securitized loans and assets 3,406 3,270 3,903 11,266 9,588
Total net interest income 103,048 97,534 89,847 292,360 262,076
Provision for credit losses 3,748 6,079 3,990 15,887 16,445
99,300 91,455 85,857 276,473 245,631
Non-interest income 13,601 13,738 15,239 39,385 48,400
Non-interest expenses 59,867 61,698 55,602 181,592 162,415
Income before income taxes 53,034 43,495 45,494 134,266 131,616
Income taxes 14,014 11,588 12,894 35,516 34,824
Net income $ 39,020 $ 31,907 $ 32,600 $ 98,750 $ 96,792
Basic earnings per share $ 0.67 $ 0.53 $ 0.41 $ 1.65 $ 1.21
Diluted earnings per share $ 0.67 $ 0.53 $ 0.41 $ 1.64 $ 1.21
Reconciliation of Net Income to Adjusted Net Income
Net income per above $ 39,020 $ 31,907 $ 32,600 $ 98,750 $ 96,792
Adjustments in connection with IT Roadmap, net of tax 2,933 2,814 - 8,076 -
Adjusted net income1 $ 41,953 $ 34,721 $ 32,600 $ 106,826 $ 96,792
Adjusted basic earnings per share1 $ 0.72 $ 0.58 $ 0.41 $ 1.78 $ 1.21
Adjusted diluted earnings per share1 $ 0.72 $ 0.58 $ 0.41 $ 1.78 $ 1.21 1 Adjusted net income and adjusted earnings per share are defined in the Non-GAAP Measures section of this MD&A.
Items of Note
Items of note are removed from reported results in determining adjusted results. Adjusted results are designed to provide a better understanding of how management assesses underlying business performance and to facilitate a more informed analysis of trends.
In connection with the Company’s IT Roadmap, the Company’s earnings were affected by the following items of note, which resulted in an aggregate reduction to net income of $2.9 million or $0.05 diluted earnings per share in Q3 2019 ($2.8 million or $0.05 diluted earnings per share – Q2 2019). On a year-to-date basis, items of note resulted in an aggregate reduction to net income of $8.1 million or $0.14 diluted earnings per share.
• Incremental amortization of intangible assets upon a reassessment of the useful life of certain assets of $3.1 million ($2.3 million net of tax) during the quarter and $9.7 million year to date ($7.1 million net of tax), recognized in other operating expenses in the consolidated statements of income. Incremental amortization of $3.4 million ($2.5 million net of tax) was identified as an item of note in Q2 2019.
• Elevated operating expenses for the reimplementation of the Company’s core banking system in the amount of $0.9 million ($0.6 million net of tax) during the quarter and $1.3 million year to date ($0.9 million net of tax), included in other operating expenses in the consolidated statements of income. Elevated operating expenses of $0.4 million ($0.3 million net of tax) was identified as an item of note in Q2 2019.
Net Income and Earnings per Share
Q3 2019 v Q2 2019
The Company reported net income of $39.0 million and diluted earnings per share of $0.67 during the third quarter of 2019 compared to $31.9 million and $0.53 last quarter. The increase in net income resulted primarily from an increase in net interest income and a lower provision for credit losses. The increase in reported diluted earnings per share reflects the increase in net income as well as a decrease in the average number of common shares outstanding. The decrease in the average number of common shares resulted from the repurchase of shares under the Company’s NCIB during Q3 2019.

10
Q3 2019 v Q3 2018
The Company reported net income of $39.0 million and diluted earnings per share of $0.67 during the third quarter of 2019 compared to $32.6 million and $0.41 in the same period last year. The increase in net income resulted primarily from higher net interest income. The increase in reported diluted earnings per share primarily reflects the increase in net income and the decrease in the average number of common shares. The decrease in the average number of common shares resulted from the repurchase of shares on December 21, 2018 under the Company’s SIB and the repurchase of shares under the Company’s NCIB during 2019.
YTD 2019 v YTD 2018
The Company reported net income of $98.8 million and diluted earnings per share of $1.64 during the first nine months of 2019 compared to $96.8 million and $1.21 year to date 2018. The increase in net income reflects higher net interest income largely offset by lower non-interest income and higher non-interest expenses. The increase in reported diluted earnings per share primarily reflects the decrease in the average number of common shares outstanding.
Net Interest Income Table 2: Net Interest Margin
For the three months ended For the nine months ended
September 30 June 30 September 30 September 30 September 30 2019 2019 2018 2019 2018
Net interest margin non-securitized interest-earning assets (TEB) 2.60% 2.44% 2.42% 2.46% 2.39% Net interest margin CMHC-sponsored securitized assets 0.49% 0.45% 0.48% 0.52% 0.38%
Total net interest margin (TEB) 2.22% 2.09% 2.03% 2.11% 1.99%
Spread of non-securitized loans over deposits and credit facilities 2.50% 2.42% 2.40% 2.39% 2.46%
Table 3: Net Interest Income by Product and Average Rate
For the three months ended (000s, except %) September 30, 2019 June 30, 2019 September 30, 2018 Income/ Average Income/ Average Income/ Average
Expense Rate1 Expense Rate1 Expense Rate1 Assets Cash resources and securities $ 5,306 2.05% $ 6,983 1.97% $ 6,535 1.74% Classic single-family residential mortgages 146,685 5.31% 140,690 5.17% 119,458 4.81% Accelerator single-family residential mortgages 4,838 3.23% 4,750 3.49% 4,211 3.36% Residential commercial mortgages2 4,610 4.47% 4,536 4.37% 3,220 5.01% Non-residential commercial mortgages 22,980 6.20% 22,468 6.10% 19,573 6.00% Credit card loans and lines of credit 9,821 8.70% 9,197 8.58% 8,274 8.79% Other consumer retail loans 6,346 8.07% 6,526 8.30% 7,018 8.10% Total non-securitized loans 195,280 5.46% 188,167 5.35% 161,754 5.08% Taxable equivalent adjustment 129 - 124 - 115 - Total non-securitized assets 200,715 5.23% 195,274 5.04% 168,404 4.73% CMHC-sponsored securitized single-family residential mortgages 18,993 3.18% 18,570 3.06% 17,331 2.87% CMHC-sponsored securitized multi-unit residential mortgages 2,496 4.29% 2,870 4.83% 6,080 4.74% Assets pledged as collateral for CMHC-sponsored securitization 866 1.96% 517 1.95% 188 1.53% Total CMHC-sponsored securitized residential mortgages 22,355 3.20% 21,957 3.17% 23,599 3.17% Mortgages securitized through other programs3 240 1.33% 222 3.33% 738 3.48% Other assets - - - - - - Total Assets $ 223,310 4.80% $ 217,453 4.65% $ 192,741 4.36% Liabilities and Shareholders’ Equity Deposits and credit facilities $ 100,944 2.96% $ 100,886 2.93% $ 82,345 2.68% CMHC-sponsored securitization liabilities 18,961 2.68% 18,857 2.68% 20,045 2.69% Other securitization liabilities3 228 1.27% 52 1.33% 389 2.08% Other liabilities and shareholders’ equity - - - - - - Total Liabilities and Shareholders’ Equity $ 120,133 2.58% $ 119,795 2.56% $ 102,779 2.33% Net Interest Income (TEB) $ 103,177 $ 97,658 $ 89,962 Tax Equivalent Adjustment (129) (124) (115) Net Interest Income per Financial Statements $ 103,048 $ 97,534 $ 89,847

11
Table 3: Net Interest Income by Product and Average Rate (Continued) For the nine months ended
(000s, except %) September 30, 2019 September 30, 2018 Income/ Average Income/ Average
Expense Rate1 Expense Rate1 Assets Cash resources and securities $ 19,149 2.07% $ 18,541 1.48% Classic single-family residential mortgages 419,785 5.15% 351,659 4.79% Accelerator single-family residential mortgages 13,773 3.33% 11,613 3.12% Residential commercial mortgages2 13,297 4.42% 8,041 4.44% Non-residential commercial mortgages 67,250 6.08% 54,319 5.99% Credit card loans and lines of credit 27,733 8.60% 23,915 8.79% Other consumer retail loans 19,206 8.14% 23,684 9.09% Total non-securitized loans 561,044 5.33% 473,231 5.07% Taxable equivalent adjustment 379 - 330 - Total on non-securitized assets 580,572 5.07% 492,102 4.65% CMHC-sponsored securitized single-family residential mortgages 56,304 3.09% 46,832 2.70% CMHC-sponsored securitized multi-unit residential mortgages 10,457 5.44% 19,152 4.82% Assets pledged as collateral for CMHC-sponsored securitization 1,550 1.96% 1,173 1.18% Total CMHC-sponsored securitized residential mortgages 68,311 3.26% 67,157 3.01% Mortgages securitized through other programs3 779 2.26% 2,604 3.29% Other assets - - - - Total Assets $ 649,662 4.68% $ 561,863 4.26% Liabilities and Shareholders’ Equity Deposits and credit facilities $ 299,099 2.94% $ 239,284 2.61% CMHC-sponsored securitization liabilities 57,423 2.72% 58,690 2.62% Other securitization liabilities3 401 1.35% 1,483 2.01% Other liabilities and shareholders’ equity - - - - Total Liabilities and Shareholders’ Equity $ 356,923 2.57% $ 299,457 2.27% Net Interest Income (TEB) $ 292,739 $ 262,406 Tax Equivalent Adjustment (379) (330) Net Interest Income per Financial Statements $ 292,360 $ 262,076 1 The average is calculated with reference to opening and closing monthly asset and liability and shareholders’ equity balances. 2 Residential commercial mortgages include non-securitized multi-unit residential mortgages and commercial mortgages secured by residential property types. 3 Other securitization programs include a bank-sponsored securitization conduit and the Company’s RMBS program. Q3 2019 v Q2 2019
Net interest income of $103.0 million for the quarter increased from $97.5 million last quarter resulting primarily from an increase of $5.4 million in non-securitized net interest income. Total net interest margin (TEB) improved 13 basis points to 2.22% from 2.09% last quarter reflecting increases in net interest margins on both non-securitized assets and CMHC-sponsored securitized assets. The increase in net interest income on non-securitized assets resulted from a combination of growth in the Company’s single-family residential mortgage portfolio and improved net interest margin. Net interest margin (TEB) on total non-securitized assets increased 16 basis points to 2.60% from 2.44% last quarter resulting from an improvement in the spread of non-securitized loans over deposits and credit facilities. The improvement in spread reflects higher average yields, particularly in the Classic single-family residential portfolio, with an overall increase of 11 basis points in the average rate earned on total non-securitized loans. A decrease in average cash and securities balances combined with an increase in yield on those assets contributed to the improvement in non-securitized net interest margin. The average balance of the lower-yielding cash and securities represented 6.8% of total non-securitized assets for the quarter compared to 9.1% last quarter. The increase in net interest income on securitized assets primarily reflects the increase in net interest margin on CMHC-sponsored securitized assets to 0.49% from 0.45% last quarter. Q3 2019 v Q3 2018
Net interest income for the quarter increased from $89.8 million one year ago resulting from an increase of $13.7 million in non-securitized net interest income offset slightly by a decrease of $0.5 million in securitized net interest income. Total net interest margin (TEB) increased 19 basis points from 2.03% last year resulting primarily from an increase in non-securitized net interest margin. The increase in net interest income on non-securitized assets resulted primarily from growth in both the residential and commercial mortgage portfolios combined with an increase in net interest margin. Net interest margin (TEB) on non-securitized assets increased 18 basis points from 2.42% one year ago reflecting an increase in the spread of non-securitized loans over deposits and credit facilities combined with a reduction in average cash and securities balances and improvement in yield on those assets. The increase in spread of non-securitized loans over deposits and credit facilities resulted primarily from higher average yields in the Classic single-family residential portfolio as noted above. The average balance of cash and securities represented 6.8% of total non-securitized assets for the quarter compared to 10.6% in the same period last year.

12
The decline in average cash balances from one year ago reflects actions taken by the Company in the second half of 2018 to better align its liquidity position to its liquidity and funding requirements. The decrease in net interest income on securitized assets resulted primarily from a decline in average securitized assets. YTD 2019 v YTD 2018
Net interest income of $292.4 million for the first nine months of 2019 increased from $262.1 million in the same period last year resulting from increases in both non-securitized and securitized assets. Total net interest margin (TEB) improved 12 basis points to 2.11% from 1.99% last year reflecting increases in net interest margins on both non-securitized and securitized assets. Net interest income on non-securitized assets increased to $281.1 million in the first nine months of 2019 from $252.5 million in the same period last year. The increase resulted primarily from growth in both the residential and commercial mortgage portfolios. Net interest margin (TEB) on non-securitized assets of 2.46% improved 7 basis points from 2.39% in the same period last year. The increase in net interest margin resulted from a decrease in the average balance of cash and securities reflecting actions taken by the Company in the second half of 2018 to better align its liquidity position to its liquidity and funding requirements as noted above. The average balance of cash and securities represented 8.1% of total non-securitized assets in the first nine months of 2019 compared to 11.8% in the same period last year. The impact of the decrease in average cash and securities on net interest margin was partially offset by a decrease of 7 basis points in the spread of non-securitized loans over deposits and credit facilities to 2.39% from 2.46% in the same period last year. The decrease in spread of non-securitized loans over deposits and credit facilities resulted from a lower spread in the first quarter of 2019 relative to the first quarter of 2018 reflecting the impact of increased funding costs as discussed in more detail in the Company’s 2019 First Quarter Report. Improved mortgage rates during the second and third quarters of 2019 have contributed to an improved spread relative to the second and third quarters of 2018 partially offsetting the year-over-year decline in spread experienced in the first quarter. Significantly lower prepayment penalty interest income in the consumer retail loan portfolio also contributed to the decline in spread. Interest income in the first nine months of 2018 included prepayment penalty interest income of $3.0 million earned on the early payout of certain portfolios of consumer retail loans. Only $0.1 million of prepayment penalty income has been earned on this portfolio year to date in 2019. The increase in net interest income and margin on securitized assets in the first nine months of 2019 over the same period last year resulted primarily from $2.0 million of prepayment penalty interest income earned during the first quarter of 2019 on the early repayment of a securitized multi-unit residential mortgage.

13
Non-Interest Income Table 4: Non-Interest Income For the three months ended For the nine months ended
(000s) September 30 June 30 September 30 September 30 September 30 2019 2019 2018 2019 2018
Fees and other income $ 12,066 $ 11,839 $ 11,768 $ 34,283 $ 35,277 Securitization income 2,627 1,424 3,129 5,614 7,883
Gain on sale of PSiGate - - - - 950
Net realized and unrealized (losses) gains on securities and loans (1,200) - 800 (915) 3,798
Net realized and unrealized gains (losses) on derivatives 108 475 (458) 403 492
$ 13,601 $ 13,738 $ 15,239 $ 39,385 $ 48,400
The following table presents the derivative gains and losses included in non-interest income.
Table 5: Derivative Gains and Losses For the three months ended For the nine months ended (000s) September 30 June 30 September 30 September 30 September 30 2019 2019 2018 2019 2018
Fair value hedging ineffectiveness $ 2 $ 472 $ (465) $ 294 $ (1,590) Derivative instruments marked-to-market gains1 106 3 7 109 2,082
Net realized and unrealized gains (losses) on derivatives $ 108 $ 475 $ (458) $ 403 $ 492 1 Included in derivative instruments marked to market are swaps.
Q3 2019 v Q2 2019
Non-interest income decreased slightly from last quarter reflecting $1.2 million of losses recognized during the quarter in relation to the 2017 sale of commercial mortgages offset by an increase in securitization income. The Company continues to be obligated to fund credit losses on the commercial mortgages sold in 2017. Securitization income results primarily from gains recognized on the sale of insured multi-unit residential mortgages along with income earned on servicing mortgages sold through securitization. In the case of previous sales of residual interests in securitized single-family residential mortgages, the Company services the loans and records related servicing fee revenue over the remaining term of the underlying mortgages. In the case of multi-unit residential mortgages, the Company outsources the servicing activity and no further net servicing revenue or fees are recorded. Securitization income for the quarter resulted primarily from servicing income of $1.2 million, compared to $1.1 million last quarter. Securitization income also included gains of $1.1 million recorded on sales of $175.0 million of insured multi-unit residential mortgages during the quarter compared to gains of $0.4 million recorded on sales of $188.6 million of insured multi-unit residential mortgages last quarter. Please see Note 6 to the unaudited interim consolidated financial statements included in this report for further information.
Q3 2019 v Q3 2018
Non-interest income decreased $1.6 million or 10.7% from Q3 2018, resulting primarily from $1.2 million of losses recognized during the quarter in relation to the 2017 sale of commercial mortgages, compared to a recovery of losses in Q3 2018 on the sale of those mortgages.
YTD 2019 v YTD 2018
Non-interest income decreased $9.0 million or 18.6% from the same period last year. Non-interest income in year to date 2019 includes net losses of $0.9 million on the 2017 sale of commercial mortgages compared to a recovery of losses of $3.7 million last year on the sale of those mortgages. Non-interest income in year to date 2018 also included higher securitization income and a gain of $950 thousand on the sale of the Company’s PSiGate and prepaid card business.

14
Table 6: Provision for Credit Losses and Net Write-Offs as a Percentage of Gross Loans on an Annualized Basis
For the three months ended
(000s, except %) September 30, 2019 June 30, 2019 September 30, 2018
% of Gross % of Gross % of Gross Amount Loans Amount Loans Amount Loans
Provision Single-family residential mortgages $ 24 0.00% $ 2,882 0.08% $ 1,392 0.04%
Commercial mortgages 2,687 0.53% 1,729 0.36% 1,882 0.36%
Credit card loans and lines of credit 1,213 1.05% 713 0.65% 462 0.48%
Other consumer retail loans (176) (0.23)% 755 0.95% 254 0.29%
Total provision $ 3,748 0.09% $ 6,079 0.15% $ 3,990 0.10%
Net Write-Offs Single-family residential mortgages $ 763 0.02% $ 851 0.02% $ 109 0.00%
Commercial mortgages 356 0.07% 2,089 0.43% - - Credit card loans and lines of credit 1,162 1.01% 672 0.61% 554 0.58%
Other consumer retail loans 213 0.27% 124 0.16% 164 0.19%
Net write-offs $ 2,494 0.06% $ 3,736 0.09% $ 827 0.02%
For the nine months ended
(000s, except %) September 30, 2019 September 30, 2018
% of Gross % of Gross Amount Loans Amount Loans
Provision
Single-family residential mortgages $ 2,903 0.03% $ 6,490 0.07%
Commercial mortgages 2,501 0.17% 6,270 0.40%
Credit card loans and lines of credit 2,104 0.61% 1,333 0.46%
Other consumer retail loans 8,379 3.59% 2,352 0.91%
Total provision $ 15,887 0.12% $ 16,445 0.14%
Net Write-Offs (Recoveries) Single-family residential mortgages $ 1,778 0.02% $ 1,566 0.02%
Commercial mortgages 2,445 0.16% (27) (0.00)%
Credit card loans and lines of credit 2,524 0.73% 1,778 0.62%
Other consumer retail loans 454 0.19% 435 0.17%
Net write-offs $ 7,201 0.06% $ 3,752 0.03%
The Company continues to have strong credit performance with total provision for credit losses of $3.7 million in Q3 2019. Provision as a percentage of gross loans remained low at 0.09%, down from 0.15% in Q2 2019 and down from 0.10% in Q3 2018. Provision for credit losses for the quarter resulted primarily from the commercial mortgage portfolio pertaining largely to one particular non-performing loan. Please see Note 5(C) to the unaudited interim consolidated financial statements included in this report for more information on the provision for credit losses and a continuity of the allowance for credit losses for the quarter.
As a part of periodic review and quarterly updates, the Company may make revisions to reflect updates in model-derived loss estimates in order to incorporate recent loss experience of its credit portfolios and forward-looking assumptions, which may cause a change to the allowance for expected credit losses.
The Company continues to observe strong credit profiles and stable loan to value across its mortgage portfolio, which continues to support low delinquency and non-performing rates and ultimately low net write-offs. Net write-offs were $2.5 million and represented 0.06% of gross loans compared to 0.09% in Q2 2019 and 0.02% in Q3 2018.
Net non-performing loans as a percentage of gross loans remained low at 0.49%, compared to 0.47% at the end Q2 2019 and 0.34% at the end of Q3 2018. The Company remains satisfied with the credit performance of the residential mortgage portfolios, but is prepared for moderate volatility in the trend.
Please see the Credit Risk section of this MD&A for more details pertaining to credit risk management.

15
Non-Interest Expenses Table 7: Non-Interest Expenses For the three months ended For the nine months ended
(000s, except % and average number of employees) September 30 June 30 September 30 September 30 September 30 2019 2019 2018 2019 2018
Salaries and benefits $ 24,348 $ 23,666 $ 20,941 $ 71,311 $ 56,395 Premises 2,611 3,214 2,611 8,629 7,573
Other operating expenses 32,908 34,818 32,050 101,652 98,447
$ 59,867 $ 61,698 $ 55,602 $ 181,592 $ 162,415
Efficiency ratio (TEB) 51.3% 55.4% 52.9% 54.7% 52.3%
Adjusted efficiency ratio (TEB) 47.8% 51.9% 52.9% 51.4% 52.3%
Average number of active employees during the period 752 744 709 747 698
Q3 2019 v Q2 2019
Non-interest expenses decreased by $1.8 million or 3.0% from last quarter, resulting primarily from a decrease in other operating expenses partially offset by an increase in salaries and benefits. The increase in salaries and benefits over last quarter reflects an increase in the average number of active employees, as well as the impact of the increase in the Company’s share price on stock-based compensation. Other operating expenses includes $4.0 million of incremental amortization and elevated operating expenses in connection with the Company’s IT Roadmap which has been identified as an item of note and removed for the purpose of determining adjusted results.
Q3 2019 v Q3 2018
The increase of $4.3 million or 7.7% in non-interest expenses over Q3 2018 represents an increase in salaries and benefits and other operating expenses. The increase in salaries and benefits over the same period last year reflects an increase in the average number of active employees combined with cost of living adjustments, as well as the impact of the increase in the Company’s share price on stock-based compensation. Incremental amortization and elevated spending in connection with the Company’s IT Roadmap were the primary drivers of the increase in other operating expenses. As indicated above, the Company has identified $4.0 million of such costs as an item of note for the purpose of determining adjusted results.
YTD 2019 v YTD 2018
Non-interest expenses for the first nine months of 2019 increased by $19.2 million or 11.8% from the same period last year, reflecting increases in salaries and benefits, premises and other operating expenses. These increases in salaries and benefits and other operating expenses resulted from the same factors that drove the third quarter year-over-year increases noted above. The Company has identified $11.0 million of incremental amortization and other elevated costs pertaining to the Company’s IT Roadmap as an item of note for the purpose of determining adjusted results. The increase in premises over the same period last year reflects the impact of the adoption of IFRS 16 Leases (IFRS 16). Please see Note 3 to the unaudited interim consolidated financial statements included in this report for further details.
Income Taxes The provision for income taxes for Q3 2019 amounted to $14.0 million, reflecting an effective tax rate of 26.42%, compared to $11.6 million (effective tax rate of 26.64%) in Q2 2019 and $12.9 million (effective tax rate of 28.34%) in Q3 2018.
Comprehensive Income
Comprehensive income is the aggregate of net income and other comprehensive income (OCI). Comprehensive income for the quarter was $39.5 million compared to $31.4 million in Q2 2019 and $33.5 million in Q3 2018. OCI in the quarter was a gain of $0.5 million compared to a loss of $0.5 million in Q2 2019 and a gain of $0.9 million in Q3 2018. The gain in OCI during the quarter relates to cash flow hedges, offset by a decline in the fair value of the Company’s securities.

16
FINANCIAL POSITION REVIEW Assets Table 8: Loan Portfolio (Gross of Allowance for Credit Losses)
As at (000s, except % and number of loans) September 30 % June 30 % December 31 %
2019 of Total 2019 of Total 2018 of Total CMHC-sponsored securitized single-family residential mortgages $ 2,437,765 10.6% $ 2,370,030 10.3% $ 2,441,279 10.6% CMHC-sponsored securitized multi-unit residential mortgages 231,691 1.0% 233,934 1.0% 310,652 1.4% Other securitized single-family residential mortgages 413,077 1.8% 20,340 0.1% 48,692 0.2%
Total securitized mortgages 3,082,533 13.4% 2,624,304 11.4% 2,800,623 12.2%
Classic single-family residential mortgages 10,820,157 47.1% 10,983,280 48.0% 10,535,512 45.9% Accelerator single-family residential mortgages 540,375 2.3% 604,424 2.6% 533,076 2.3% Residential commercial mortgages 265,629 1.2% 232,878 1.0% 219,395 1.0% Non-residential commercial mortgages 1,512,669 6.6% 1,463,965 6.4% 1,451,706 6.3% Credit card loans and lines of credit 461,987 2.0% 439,854 1.9% 405,051 1.8% Other consumer retail loans 311,281 1.4% 316,493 1.4% 319,024 1.4%
Total non-securitized mortgages and loans 13,912,098 60.6% 14,040,894 61.3% 13,463,764 58.7%
Total loan portfolio 16,994,631 74.0% 16,665,198 72.7% 16,264,387 70.9% Loans held for sale 131,722 0.6% 173,185 0.8% 130,351 0.6%
Total on-balance sheet loans $ 17,126,353 74.6% $ 16,838,383 73.5% $ 16,394,738 71.5%
Off-balance sheet loans Single-family residential mortgages $ 1,801,937 7.8% $ 2,164,378 9.5% $ 2,700,339 11.8% Multi-unit residential mortgages 4,040,679 17.6% 3,898,760 17.0% 3,838,197 16.7%
Total off-balance sheet loans 5,842,616 25.4% 6,063,138 26.5% 6,538,536 28.5%
Total loans under administration $ 22,968,969 100.0% $ 22,901,521 100.0% $ 22,933,274 100.0%
Total insured mortgages under administration $ 9,233,414 41.6% $ 9,512,443 43.0% $ 10,046,097 45.2% Total uninsured mortgages under administration 12,962,287 58.4% 12,632,731 57.0% 12,163,102 54.8%
Total mortgages under administration $ 22,195,701 100.0% $ 22,145,174 100.0% $ 22,209,199 100.0%
Number of loans outstanding under administration Mortgages 49,758 50,712 51,970 Credit card loans and lines of credit 88,677 87,306 77,613
Other consumer retail loans 100,388 104,401 107,155 Total number of loans outstanding 238,823 242,419 236,738
Total loans under administration were $22.97 billion at the end of the quarter, an increase of $67.4 million from the end of Q2 2019 and an increase of $35.7 million from the end of 2018. The increase in total loans under administration resulted from an increase in the on-balance sheet portfolio, partially offset by a decrease in the off-balance sheet portfolio. On-balance sheet loans were up $288.0 million from the end of Q2 2019 and $731.6 million from the end of 2018, while off-balance sheet loans were down $220.5 million from the end of Q2 2019 and $695.9 million from the end of 2018. The increase in on-balance sheet loans reflects the Company’s origination and retention efforts. The decrease in the off-balance sheet loans has resulted from the Company retaining its residual interests in on-balance sheet securitized insured single-family residential mortgages.
17
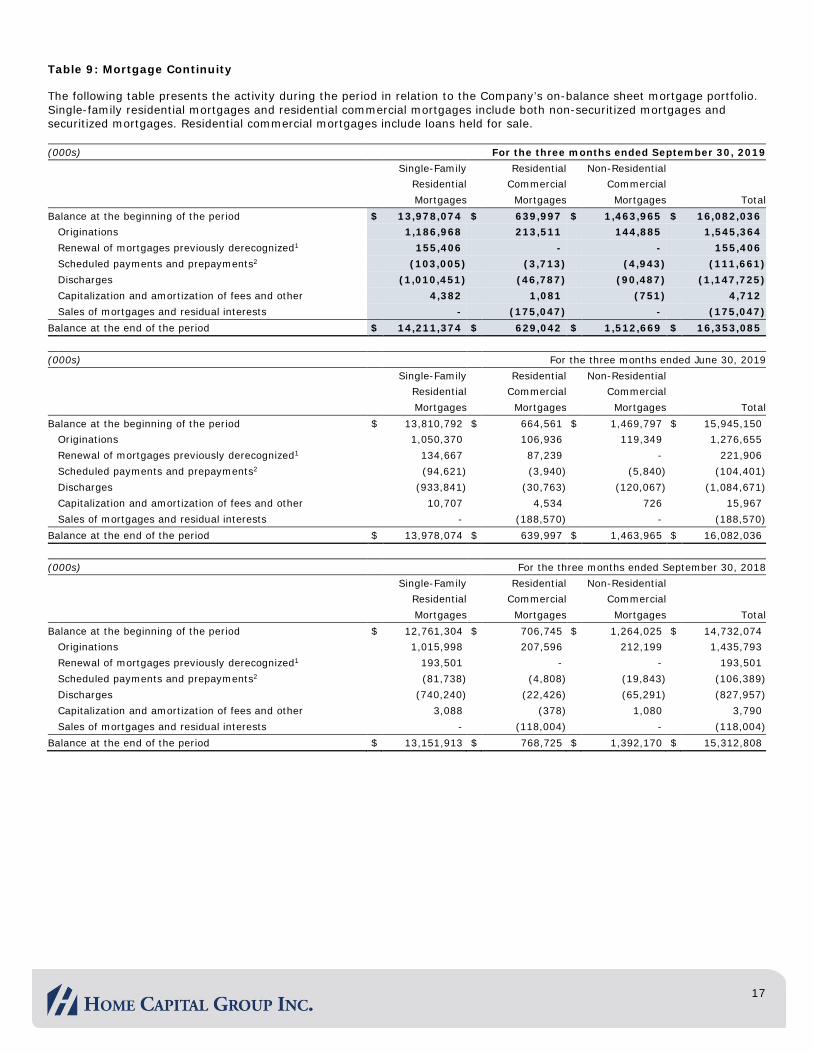
Table 9: Mortgage Continuity The following table presents the activity during the period in relation to the Company’s on-balance sheet mortgage portfolio. Single-family residential mortgages and residential commercial mortgages include both non-securitized mortgages and securitized mortgages. Residential commercial mortgages include loans held for sale. (000s) For the three months ended September 30, 2019 Single-Family Residential Non-Residential Residential Commercial Commercial
Mortgages Mortgages Mortgages Total Balance at the beginning of the period $ 13,978,074 $ 639,997 $ 1,463,965 $ 16,082,036 Originations 1,186,968 213,511 144,885 1,545,364 Renewal of mortgages previously derecognized1 155,406 - - 155,406 Scheduled payments and prepayments2 (103,005) (3,713) (4,943) (111,661) Discharges (1,010,451) (46,787) (90,487) (1,147,725) Capitalization and amortization of fees and other 4,382 1,081 (751) 4,712 Sales of mortgages and residual interests - (175,047) - (175,047)
Balance at the end of the period $ 14,211,374 $ 629,042 $ 1,512,669 $ 16,353,085
(000s) For the three months ended June 30, 2019 Single-Family Residential Non-Residential Residential Commercial Commercial
Mortgages Mortgages Mortgages Total Balance at the beginning of the period $ 13,810,792 $ 664,561 $ 1,469,797 $ 15,945,150 Originations 1,050,370 106,936 119,349 1,276,655 Renewal of mortgages previously derecognized1 134,667 87,239 - 221,906 Scheduled payments and prepayments2 (94,621) (3,940) (5,840) (104,401) Discharges (933,841) (30,763) (120,067) (1,084,671) Capitalization and amortization of fees and other 10,707 4,534 726 15,967 Sales of mortgages and residual interests - (188,570) - (188,570) Balance at the end of the period $ 13,978,074 $ 639,997 $ 1,463,965 $ 16,082,036
(000s) For the three months ended September 30, 2018 Single-Family Residential Non-Residential Residential Commercial Commercial
Mortgages Mortgages Mortgages Total Balance at the beginning of the period $ 12,761,304 $ 706,745 $ 1,264,025 $ 14,732,074 Originations 1,015,998 207,596 212,199 1,435,793 Renewal of mortgages previously derecognized1 193,501 - - 193,501 Scheduled payments and prepayments2 (81,738) (4,808) (19,843) (106,389) Discharges (740,240) (22,426) (65,291) (827,957) Capitalization and amortization of fees and other 3,088 (378) 1,080 3,790 Sales of mortgages and residual interests - (118,004) - (118,004) Balance at the end of the period $ 13,151,913 $ 768,725 $ 1,392,170 $ 15,312,808

18
Table 9: Mortgage Continuity (Continued)
(000s) For the nine months ended September 30, 2019 Single-Family Residential Non-Residential Residential Commercial Commercial
Mortgages Mortgages Mortgages Total Balance at the beginning of the period $ 13,558,559 $ 660,398 $ 1,451,706 $ 15,670,663 Originations 3,170,558 532,581 334,946 4,038,085 Renewal of mortgages previously derecognized1 382,197 87,239 - 469,436 Scheduled payments and prepayments2 (284,987) (11,361) (32,203) (328,551) Discharges (2,630,489) (168,494) (242,528) (3,041,511) Capitalization and amortization of fees and other 15,536 6,639 748 22,923 Sales of mortgages and residual interests - (477,960) - (477,960)
Balance at the end of the period $ 14,211,374 $ 629,042 $ 1,512,669 $ 16,353,085
(000s) For the nine months ended September 30, 2018
Single-Family Residential Non-Residential Residential Commercial Commercial
Mortgages Mortgages Mortgages Total Balance at the beginning of the period $ 12,472,459 $ 838,346 $ 1,045,603 $ 14,356,408 Originations 2,835,027 441,900 548,302 3,825,229 Renewal of mortgages previously derecognized1 480,759 29,609 - 510,368 Scheduled payments and prepayments2 (238,708) (14,957) (30,434) (284,099) Discharges (2,406,376) (69,267) (175,444) (2,651,087) Capitalization and amortization of fees and other 8,752 (1,356) 4,143 11,539 Sales of mortgages and residual interests - (455,550) - (455,550) Balance at the end of the period $ 13,151,913 $ 768,725 $ 1,392,170 $ 15,312,808 1 Represents renewals of mortgages that were previously derecognized and included in the off-balance sheet portfolio. Upon renewal, the mortgages are recognized on the balance sheet. 2 Includes regularly scheduled principal payments and unscheduled partial payments. Table 10: Mortgage Originations For the three months ended For the nine months ended
(000s) September 30 June 30 September 30 September 30 September 30 2019 2019 2018 2019 2018
Single-family residential mortgages Classic $ 1,144,745 $ 1,012,688 $ 959,117 $ 3,059,438 $ 2,645,605 Accelerator 42,223 37,682 56,881 111,120 189,422
Residential commercial mortgages
Multi-unit uninsured residential mortgages 68,038 13,004 22,750 129,389 83,135 Multi-unit insured residential mortgages 134,590 93,932 176,436 392,309 326,857 Other1 10,883 - 8,410 10,883 31,908
Non-residential commercial mortgages
Stores and apartments 17,140 14,840 14,149 53,309 52,165 Commercial 127,745 104,509 198,050 281,637 496,137
Total mortgage originations $ 1,545,364 $ 1,276,655 $ 1,435,793 $ 4,038,085 $ 3,825,229 1 Other residential commercial mortgages include mortgages such as builders’ inventory.

19
Mortgage Lending Uninsured Residential Mortgages – Classic Mortgages The Company’s uninsured residential mortgage portfolio is represented by its Classic mortgage portfolio. During the quarter, the Company began securitizing selected mortgages in its Classic portfolio under its RMBS securitization program. Please see Note 6(A) to the unaudited interim consolidated financial statements included in this report for more information. Total securitized and non-securitized Classic single-family residential mortgages of $11.23 billion represent the largest portfolio within loans under administration and on-balance sheet loans at 48.9% and 65.6%, respectively. Mortgage originations of $1.14 billion in the quarter and $3.06 billion for the first nine months of 2019 were up 19.4% and 15.6% from the same periods last year, respectively and up 13.0% from Q2 2019. Insured Residential Mortgages Insured residential loans under administration, which include both insured single-family and multi-unit residential mortgages, were $9.23 billion at the end of the quarter, down 2.9% from the balance of $9.51 billion at the end of Q2 2019 and 8.1% from the balance of $10.05 billion at the end of 2018. Of this total, $5.84 billion was accounted for off-balance sheet, down from $6.06 billion at the end of Q2 2019 and down from $6.54 billion at the end of 2018. The Company originated $42.2 million in insured single-family Accelerator mortgages in the quarter and $111.1 million for the first nine months of 2019, down 25.8% and 41.3% from the same periods last year and up 12.1% from Q2 2019. The Company views its Accelerator product offering as complementary to its Classic portfolio. During the quarter, the Company originated $134.6 million of insured multi-unit residential mortgages and sold $175.0 million that qualified for off-balance sheet treatment resulting in $1.1 million in gains on sale. The multi-unit residential mortgage market is relatively limited and the Company participates in appropriate transactions as they become available through various origination channels. As a result, origination volumes, sales and resultant securitization gains can vary significantly from quarter to quarter. All of the Company’s new insured multi-unit residential mortgage originations qualify for off-balance sheet treatment, and the on-balance sheet securitized multi-unit residential portfolio is declining through amortization and maturities. From time to time, the Company pools mortgages and may hold the related Mortgage-Backed Security (MBS) as liquid assets or inventory for replacement assets for the Canada Mortgage Bond (CMB) program. As these MBS are not sold, they are carried on the balance sheet at amortized cost as part of residential mortgage loans (see Table 23: Liquidity Resources). Residential Commercial Mortgages Residential commercial mortgages include commercial mortgages that are secured by residential property such as non-securitized multi-unit residential mortgages and builders’ inventory. Insured multi-unit residential mortgages are included in this portfolio until they are securitized. Non-Residential Commercial Mortgages Non-residential commercial mortgage originations were $144.9 million in the quarter and $334.9 million in the first nine months of 2019, down 31.7% and 38.9% from the same periods last year and up 21.4% from last quarter. Non-residential commercial mortgages, which include loans on office, industrial, retail and mixed-use properties as well as commercial mortgages on development projects, have been an important complementary source of loan assets and revenue. The Company expects to continue participating in appropriate commercial mortgage opportunities as they arise. Geographic Concentration Mortgage originations continued to favour Ontario and, in particular, the GTA, during the quarter. The Company will continue to cautiously increase business within other markets in Ontario and the rest of Canada to the extent that market conditions remain stable. The concentration of new originations is influenced, in part, by the Company’s credit experience. Please see Note 5(B) to the unaudited interim consolidated financial statements included in this report for the geographic distribution of the portfolio.

20
Table 11: Consumer Lending Continuity For the three months ended (000s) September 30, 2019 June 30, 2019 Credit Card Other Total Credit Card Other Total Loans and Consumer Consumer Loans and Consumer Consumer Lines of Credit Retail Loans Lending Lines of Credit Retail Loans Lending Balance at the beginning of the period $ 439,854 $ 316,493 $ 756,347 $ 420,969 $ 312,265 $ 733,234 Advances and draw-downs 131,471 30,675 162,146 121,233 34,759 155,992 Repayments (121,632) (53,238) (174,870) (114,295) (44,835) (159,130) Capitalization of interest and fees, and other 12,294 17,351 29,645 11,947 14,304 26,251 Balance at the end of the period $ 461,987 $ 311,281 $ 773,268 $ 439,854 $ 316,493 $ 756,347 Authorized limit on new credit card and line of credit issuances $ 81,988 $ 91,323 For the three months ended (000s) September 30, 2018 Credit Card Other Total Loans and Consumer Consumer Lines of Credit Retail Loans Lending Balance at the beginning of the period $ 369,048 $ 346,806 $ 715,854 Advances and draw-downs 99,095 29,441 128,536 Repayments (94,354) (48,606) (142,960) Capitalization of interest and fees, and other 11,590 16,874 28,464 Balance at the end of the period $ 385,379 $ 344,515 $ 729,894 Authorized limit on new credit card and line of credit issuances $ 79,351
For the nine months ended (000s) September 30, 2019 September 30, 2018 Credit Card Other Total Credit Card Other Total Loans and Consumer Consumer Loans and Consumer Consumer Lines of Credit Retail Loans Lending Lines of Credit Retail Loans Lending Balance at the beginning of the period $ 405,051 $ 319,024 $ 724,075 $ 352,062 $ 361,166 $ 713,228 Advances and draw-downs 363,313 88,585 451,898 227,729 96,376 324,105 Repayments (340,958) (142,277) (483,235) (226,042) (151,603) (377,645) Capitalization of interest and fees, and other 34,581 45,949 80,530 31,630 38,576 70,206 Balance at the end of the period $ 461,987 $ 311,281 $ 773,268 $ 385,379 $ 344,515 $ 729,894 Authorized limit on new credit card and line of credit issuances $ 248,917 $ 286,022
Consumer Lending The consumer lending loan portfolio comprises credit cards, lines of credit and other consumer retail loans. Gross credit card and lines of credit balances at the end of the quarter were $462.0 million, up from $439.9 million at the end of Q2 2019 and $405.1 million at the end of 2018. Equityline Visa (Home Equity Line of Credit) accounts represent 88.7% of the total credit card and lines of credit balance. The balance of other consumer retail loans at the end of the quarter was $311.3 million, down from $316.5 million at the end of Q2 2019 and down from $319.0 million at the end of 2018. These assets are typically generated through dealer programs. The Company ceased to finance HVAC rental equipment loans in 2018 and gross HVAC rental equipment loan balances were $123.3 million at the end of Q3 2019, $132.9 million at the end of Q2 2019 and $145.5 million at the end of 2018.

21
Cash Resources and Securities
Combined cash resources and securities stood at $964.9 million at the end of Q3 2019 compared to $857.7 million at the end of Q2 2019 and $1.05 billion at the end of 2018. The increase in cash balances from the end of last quarter reflects $425 million of cash received from the issuance of the Company’s RMBS at the end of the quarter. The decline in the cash balances from the end of 2018 reflects actions taken by the Company to better align its liquidity position to its liquidity and funding requirements. The Company maintains sufficient liquidity to meet its future commitments and expected business volumes. The Company has a $500 million committed secured standby credit facility with a syndicate of Canadian chartered banks, which is undrawn. The Company has a $300 million committed secured warehouse credit facility with a syndicate of Canadian chartered banks, which is undrawn. The Company has a $150 million uncommitted repo facility with a Canadian institutional investor, which is undrawn. The Company also has an uncommitted secured credit facility with a Canadian chartered bank in the amount of $20 million, which is undrawn. The details of the above facilities are disclosed in Note 4(A) to the unaudited interim consolidated financial statements included in this report with further details disclosed in Note 4(A) to the audited consolidated financial statements included in the Company’s 2018 Annual Report.
Other Assets
Total other assets of $903.4 million increased $18.6 million from the end of Q2 2019 and $157.1 million from the end of 2018. The increase resulted from an increase in acceptable securities assigned as replacement assets in the CMB program as the Company decreased its use of securitized mortgage pools relative to securities as replacement assets. In general, as CMB maturities approach, the Company replaces maturing securitized mortgages with other acceptable securities.
Liabilities and Shareholders’ Equity
Deposits and Securitization Liabilities Table 12: Deposits and Securitization Liabilities As at
(000s, except % and number of accounts) September 30 % June 30 % December 31 % 2019 of Totals 2019 of Totals 2018 of Totals
Deposits payable on demand High-interest savings accounts $ 155,951 1.2% $ 143,950 1.0% $ 147,183 1.2%
Oaken savings accounts 428,776 3.2% 334,669 2.5% 194,218 1.5%
Other deposits payable on demand 57,980 0.4% 39,488 0.3% 95,645 0.7%
642,707 4.8% 518,107 3.8% 437,046 3.4%
Deposits payable on fixed dates Brokered GICs1 10,037,484 74.2% 10,213,429 75.6% 10,053,280 77.4%
Oaken GICs1 2,840,585 21.0% 2,782,875 20.6% 2,486,764 19.2%
12,878,069 95.2% 12,996,304 96.2% 12,540,044 96.6%
Total deposits 13,520,776 100.0% 13,514,411 100.0% 12,977,090 100.0%
Securitization liabilities CMHC-sponsored mortgage-backed security liabilities 1,664,214 50.1% 1,539,045 55.2% 1,573,216 55.0%
CMHC-sponsored Canada Mortgage Bond liabilities 1,240,717 37.3% 1,240,363 44.4% 1,239,331 43.4%
Other securitization liabilities 420,153 12.6% 10,235 0.4% 46,779 1.6%
Total securitization liabilities $ 3,325,084 100.0% $ 2,789,643 100.0% $ 2,859,326 100.0%
Total number of deposit accounts 456,341 460,416 439,761 1 Included in Brokered and Oaken GICs presented above as payable on fixed dates are $79.2 million ($80.4 million – Q2 2019; $148.8 million – Q4 2018) of cashable GICs that have reached the required number of days to be payable on demand. In the absence of such demand, the GICs have a remaining contractual term to maturity of within one year.

22
Table 13: Non-Securitized Loans and Deposits by Remaining Contractual Term to Maturity (000s) As at September 30, 2019
Payable
on Demand 0-3 Months 3-12 Months 1 to 3 Years Over 3 Years Total
Non-securitized loans
Single-family residential mortgages $ - $ 2,009,335 $ 6,847,930 $ 2,122,242 $ 381,025 $ 11,360,532
Residential commercial mortgages - 17,101 111,600 133,228 3,700 265,629
Non-residential commercial mortgages - 251,929 575,336 660,402 25,002 1,512,669
Credit card loans and lines of credit - 461,987 - - - 461,987
Other consumer retail loans - 8,691 27,719 93,498 181,373 311,281
- 2,749,043 7,562,585 3,009,370 591,100 13,912,098
Deposits1 642,707 1,365,766 4,704,380 4,887,193 1,920,730 13,520,776
Net maturity $ (642,707) $ 1,383,277 $ 2,858,205 $ (1,877,823) $ (1,329,630) $ 391,322 1 Included in deposits presented above as payable within one year are $79.2 million of cashable GICs that have reached the required number of days to be payable on demand. In the absence of such demand, the GICs have a remaining contractual term to maturity of within one year.
The Company’s deposit portfolio primarily provides funding for the non-securitized loan portfolio and principally comprises fixed-term deposits, which represent 95.2% of all deposits, thereby reducing the risk of untimely withdrawal of funds by retail clients. The Company generally matches the terms of its deposits with its assets. The above table presents the net remaining contractual term to maturity of the Company’s non-securitized loans and deposits. Please see the Structural Interest Rate Risk and the Liquidity and Funding Risk sections of this MD&A for more information. Total deposits of $13.52 billion were up $6.4 million from the end of Q2 2019 and up $543.7 million from the end of 2018. Deposits raised through the Company’s direct-to-consumer brand, Oaken Financial, represented 24.2% of total deposits at the end of Q3 2019 compared to 23.1% at the end of Q2 2019 and 20.7% at the end of 2018. The balance of Oaken deposits at the end of the quarter was $3.27 billion, reflecting an increase of 4.9% over the balance at the end of Q2 2019 and 21.9% over the balance at the end of 2018. Securitization liabilities, including both CMHC-sponsored and other securitization liabilities, increased $535.4 million from the end of Q2 2019 and $465.8 million from the end of 2018 primarily due to the issuance of the Company’s $425 million RMBS at the end of Q3 2019. Other Liabilities
Other liabilities of $446.2 million decreased by $124.0 million from the end of Q2 2019 and decreased by $218.4 million from the end of 2018. The decrease in other liabilities from the end of both Q2 2019 and Q4 2018 resulted primarily from the Company having no amounts drawn on its credit facilities at the end of Q3 2019. Please see note 4(A) to the unaudited interim consolidated financial statements included in this report for more information on the Company’s credit facilities.
Shareholders’ Equity The increase of $1.6 million in total shareholders’ equity from the end of last year was internally generated from net income largely offset by the repurchase of shares through the Company’s NCIB.
At the end of the quarter, the book value per common share was $28.64, compared to $27.80 at the end of Q2 2019 and $26.43 at the end of 2018. The increase in book value per common share resulted from a combination of net income and the repurchase of shares under the NCIB in the first nine months of 2019.

23
Off-Balance Sheet Arrangements The Company offers credit products to meet the financial needs of its customers and has outstanding amounts for future advances on mortgages. These amounts include offers made but not yet accepted by the customer as of the reporting date. Offers for the loans remain open for various periods. Included within the outstanding amounts for future advances on mortgage loans are unutilized non-residential commercial loan advances and outstanding future advances for the Equityline Visa portfolio. Off-balance sheet arrangements also included unutilized credit card balances. The unutilized credit and offers to extend credit are in the normal course of business and are considered through the Company’s liquidity and capital management processes. The following table presents the amounts of these credit commitments as at the indicated reporting dates.
Table 14: Off-Balance Sheet Arrangements
As at (000s) September 30 June 30 December 31
2019 2019 2018
Outstanding amounts for future advances on residential mortgages $ 712,182 $ 683,692 $ 587,344
Unutilized non-residential commercial loan advances 367,580 448,978 386,712
Outstanding future advances for the Equityline Visa portfolio 31,992 35,932 28,551
Total outstanding amount for future advances on mortgage loans $ 1,111,754 $ 1,168,602 $ 1,002,607
Unutilized credit card balances $ 462,253 $ 440,702 $ 355,824
The Company has $5.84 billion ($6.06 billion – June 30, 2019; $6.54 billion – December 31, 2018) of loans under administration that are accounted for off-balance sheet (see Table 8). Please refer to Note 2 and Note 6 of the unaudited interim consolidated financial statements included in this report for details of the Company’s securitization activities.
Related Party Transactions
IFRS considers key management personnel to be related parties. Compensation of key management personnel is disclosed in the Company’s Annual Report and Management Information Circular.

24
The Company’s Capital Management Policy and its Capital Adequacy measurement have not changed from the descriptions provided in the 2018 Annual Report. The table below provides information on Home Trust’s regulatory capital position, risk-weighted assets, capital ratios and leverage ratio.
Table 15: Basel III Regulatory Capital (Based only on Home Trust Company's consolidated financial position) As at (000s, except ratios) September 30 December 31 2019 2018
Common Equity Tier 1 capital (CET 1) Capital stock $ 38,497 $ 38,497 Contributed surplus 951 951 Retained earnings 1,536,899 1,437,629 Accumulated other comprehensive loss (11,642) (10,485) Cash flow hedge reserves 934 1,606 Regulatory deductions from CET 11 (86,820) (96,295) Total CET 1 capital 1,478,819 1,371,903
Additional Tier 1 capital - - Total Tier 1 capital 1,478,819 1,371,903
Tier 2 capital Allowance for credit losses2 34,739 32,671
Total Tier 2 capital 34,739 32,671
Total regulatory capital 1,513,558 1,404,574
Risk-weighted assets for Credit risk 6,737,822 6,405,092 Operational risk 780,050 840,763
Total risk-weighted assets $ 7,517,872 $ 7,245,855
Regulated capital to risk-weighted assets CET 1 ratio 19.67% 18.94% Tier 1 capital ratio 19.67% 18.93% Total regulatory capital ratio 20.13% 19.38%
Leverage ratio 7.80% 7.54%
National regulatory minimum CET 1 ratio 7.00% 7.00% Tier 1 capital ratio 8.50% 8.50% Total regulatory capital ratio 10.50% 10.50% Leverage ratio 3.00% 3.00% 1 Regulatory deductions include intangible assets, net of deferred taxes, and unrealized mortgage securitization gains, net of deferred taxes. 2 The Company is allowed to include eligible allowances for credit losses up to a prescribed percentage of 1.25% of total credit risk-weighted assets in Tier 2 capital. At September 30, 2019, the Company’s eligible allowances represented 0.52% of total credit risk-weighted assets.
Home Trust’s Total regulatory capital ratio at the end of Q3 2019 increased from the end of 2018 reflecting an increase in regulatory capital partially offset by an increase in risk-weighted assets. The increase in regulatory capital resulted primarily from internally generated income while the increase in risk-weighted assets resulted primarily from growth in the mortgage portfolio. The Leverage ratio is a non-risk adjusted view of a company’s leverage. The Leverage ratio only includes Tier 1 capital. The Leverage ratio also includes some off-balance sheet exposures, including potential future exposure amounts on derivatives, credit equivalent amounts of certain commitments and securities financing transactions. The Company has disclosed the Leverage ratio and its components under “Regulatory Disclosures” on the Home Trust website. Home Trust’s Common Equity Tier 1, Total Tier 1, Total capital ratios and Leverage ratio continue to exceed regulatory and internal capital targets.
CAPITAL MANAGEMENT

25
The shaded areas of this section of the MD&A represent a discussion of risk management policies and procedures relating to certain risks that are required under IFRS 7 Financial Instruments: Disclosures, which permits these specific disclosures to be included in the MD&A. Therefore, the shaded areas presented in this Risk Management section form an integral part of the unaudited interim consolidated financial statements for the three months ended September 30, 2019. Risk management is an essential component of the Company’s strategy, directly affecting the Company’s profitability and return on equity. The Company continues to invest significantly in risk management practices and resources. The Company’s key risk management practices, risk governance, risk appetite, risk policies and limits, eight principal risks and risk identification and assessment tools remain in place and are continually reviewed and enhanced from those outlined on pages 45 through 63 in the MD&A section of the Company’s 2018 Annual Report.
Credit Risk Credit risk is the risk of the loss of principal and/or interest from the failure of debtors and/or counterparties to honour their financial or contractual obligations to the Company, for any reason. The Company’s overall exposure to credit risk is governed by a defined credit-specific risk appetite, risk limits, a Board-approved Credit Risk Policy, delegated lending authorities, and regular independent monitoring and reporting. The Company’s approach to establishing, implementing and monitoring credit risk policies and guidelines has not changed significantly from the description provided in the 2018 Annual Report.
Mortgage Lending As part of credit risk management of the mortgage portfolio, senior management and the Enterprise Risk Management (ERM) group monitor various portfolio characteristics, including the characteristics in the following table. Total mortgage loan exposures are presented in Table 8. Table 16: Mortgage Portfolio On Balance Sheet As at
(000s, except %) September 30 June 30 March 31 December 31 September 30 June 30
2019 2019 2019 2018 2018 2018
Total mortgage balance (gross of allowance for credit losses) $ 16,221,363 $ 15,908,851 $ 15,765,271 $ 15,540,312 $ 15,247,606 $ 14,725,286
Percentage of residential mortgages 90.7% 90.8% 90.7% 90.7% 90.9% 91.4%
Percentage of non-residential mortgages 9.3% 9.2% 9.3% 9.3% 9.1% 8.6%
Percentage of mortgages insured1 20.1% 20.6% 20.8% 21.7% 23.4% 23.7%
Percentage of mortgages current 99.1% 99.3% 99.3% 99.0% 98.9% 98.6%
Percentage of total mortgages 90 days or more past due 0.43% 0.36% 0.47% 0.39% 0.38% 0.33% 1Insured loans are loans insured against default by CMHC or another approved insurer either individually at origination or by portfolio.
Credit risk mitigation is a key component of the Company’s approach to credit risk management. The composition of the mortgage portfolio is well within the Company’s risk appetite. Senior management and the ERM group closely monitor credit metrics and the performance of the mortgage loan portfolio. The portfolio continues to perform well, with arrears and net write-offs that are well within expected levels.
The Company mitigates credit risk by ensuring borrowers have the capacity and willingness to pay as well as through collateral in the form of real property. Loan to value (LTV) is a key credit risk metric used in the Company’s underwriting process. Please see Tables 19 and 20 for further information.
The Company separately monitors segments of its portfolio for indications of deterioration in performance. The Company continues to closely monitor market conditions and the performance of the high-rise condominium market. High-rise condominiums represent 8.1% of the residential mortgage portfolio and, of these, 21.7% are insured. The average current LTV of the high-rise condominium portfolio was 54.1% at the end of Q3 2019. The credit performance of the high-rise condominium portfolio is well within the Company’s expectations, with 98.9% of the portfolio current and 0.1% over 90 days past due.
The level of non-residential mortgages increased during the quarter. The proportion is well within the policy limits.
RISK MANAGEMENT

26
Consumer Lending
Credit card and Equityline Visa balances were $462.0 million at the end of Q3 2019, most of which are secured by either cash deposits or residential property. Within the credit card and lines of credit portfolio, Equityline Visa accounts, which are secured by residential property, represent the principal driver of receivable balances. The Equityline Visa portfolio had a weighted-average LTV at origination of 61.4% at the end of Q3 2019, compared to 61.3% at the end of Q2 2019 and 59.7% at the end of Q3 2018. The LTV includes both the first mortgage and the secured Equityline Visa balance.
Senior management and the ERM group closely monitor the credit performance of the credit card and line of credit portfolio. The portfolio continued to perform well, with arrears well within expected levels. As of September 30, 2019, $1.9 million or 0.4% of the credit card and line of credit portfolio was over 90 days in arrears, compared to $1.0 million or 0.2% at June 30, 2019 and $2.4 million or 0.6% at September 30, 2018.
Other consumer retail loans are primarily secured by charges on financed assets or homes in which the financed assets are present, primarily automobiles and fixtures and/or improvements to residential property. Certain loans within the other consumer retail loan portfolio are advanced to the vendors who have underlying loans receivable from the end consumer. These loans are considered as commercial loans for purposes of underwriting and capital treatment. The Company holds a portion of the advanced amount on these loans as cash collateral. As of September 30, 2019, $14.0 million or 4.5% of the other consumer retail loans portfolio was impaired (stage 3), compared to $14.7 million or 4.7% at June 30, 2019 and $0.5 million or 0.1% at September 30, 2018. The increase is related to the HVAC rental equipment segment of the portfolio, which the Company ceased originating in 2018. Total expected credit losses on impaired other consumer retail loans as of September 30, 2019 was $8.5 million representing 61% of gross impaired loan balance. Management is closely monitoring the credit performance of this segment.
Refer to Note 5(B) to the unaudited interim consolidated financial statements included in this report for a breakdown of the overall loan portfolio by geographic region.
Non-Performing Loans, Credit Provisions and Allowances
The Company applies IFRS 9 Financial Instruments (IFRS 9) in its determination of what the Company considers as non-performing loans and how provisions and allowances for credit losses are calculated. The determination of allowances for credit losses under IFRS 9 involves a three-stage expected credit loss model. Stage 1 represents loans that are considered to be performing well with no significant deterioration in the risk of default. Stage 2 represents loans that are still considered to be performing but where there has been a significant increase in the risk of default. Stage 3 represents impaired (non-performing) loans where payments are generally more than 90 days past due or where there is other objective evidence of impairment. Please see Note 2 to the audited consolidated financial statements included in the Company’s 2018 Annual Report for more information on the determination of allowance for credit losses under IFRS 9.
Other than the HVAC rental equipment segment of other consumer retail portfolio discussed above, net non-performing loans remain within expected and acceptable ranges representing 0.49% of gross loans at the end of September 30, 2019.
Write-offs, net of recoveries, during the quarter totaled $2.5 million or 0.06% of gross loans on an annualized basis.
The Company has security in the form of real property or cash deposits for virtually the entire loan portfolio. Expected and unexpected future losses are mitigated with a combination of conservative LTVs, risk-based pricing and a strong capital position.
The Company maintains an allowance for credit losses in accordance with IFRS 9 which represents management’s best estimate of expected credit losses in the loan portfolio. The allowance is reviewed quarterly, at a minimum. Note 5 to the unaudited interim consolidated financial statements included in this report provides a continuity of the allowance for credit losses during the period by product and IFRS 9 stage indicating components of the provision for credit losses as well as write-offs and recoveries. The continuity disclosure also provides information pertaining to the movements between the IFRS 9 stages. Note 5 also provides a distribution of the gross carrying value of loans by product across five internal risk ratings for each of the IFRS 9 stages.
In addition to the allowance for credit losses, the risk of future losses is considered in the determination of the appropriate level of capital supporting the Company’s operations. The Company holds capital for possible further credit losses. This includes capital required by regulation (see Table 15) and additional capital amounts as recommended by management and approved by the Board. The Company uses stress testing and scenario analysis to challenge the adequacy of the capital appropriated for credit risk. As at September 30, 2019, the Company held total regulatory capital at 192% of the regulatory minimum. A substantial portion of this is appropriated for credit risk.

27
Additional Information: Residential Loans and Equityline Visa Home Equity Line of Credit (HELOC)
The tables below provide additional information on the composition of the Company’s single-family residential mortgage portfolio by province and insured status, as well as by remaining effective amortization periods and LTVs by province. The balance for single-family residential mortgages provided in the table below include both non-securitized mortgages and securitized mortgages.
Table 17: Single-Family Residential Loans by Province (Gross of Allowance for Credit Losses) (000s, except %) As at September 30, 2019 Insured Percentage Uninsured Percentage Percentage Residential of Total Residential of Total Equityline of Total
Mortgages1 for Province Mortgages for Province Visa2 for Province Total British Columbia $ 235,894 18.7% $ 1,012,429 80.3% $ 11,908 1.0% $ 1,260,231 Alberta 552,626 65.2% 287,908 33.9% 7,723 0.9% 848,257
Ontario 1,713,825 15.0% 9,302,404 81.6% 385,891 3.4% 11,402,120
Quebec 137,827 30.8% 308,059 68.9% 1,193 0.3% 447,079
Other 386,846 58.3% 273,556 41.3% 2,876 0.4% 663,278
$ 3,027,018 20.7% $ 11,184,356 76.5% $ 409,591 2.8% $ 14,620,965
(000s, except %) As at June 30, 2019
Insured Percentage Uninsured Percentage Percentage Residential of Total Residential of Total Equityline of Total
Mortgages1 for Province Mortgages for Province Visa2 for Province Total British Columbia $ 242,783 20.3% $ 947,342 79.0% $ 8,961 0.7% $ 1,199,086 Alberta 542,271 65.4% 278,378 33.6% 8,062 1.0% 828,711
Ontario 1,740,207 15.4% 9,173,774 81.3% 369,386 3.3% 11,283,367
Quebec 137,237 31.8% 293,711 67.9% 1,232 0.3% 432,180
Other 376,243 60.2% 246,128 39.4% 2,577 0.4% 624,948
$ 3,038,741 21.1% $ 10,939,333 76.2% $ 390,218 2.7% $ 14,368,292
(000s, except %) As at December 31, 2018
Insured Percentage Uninsured Percentage Percentage Residential of Total Residential of Total Equityline of Total
Mortgages1 for Province Mortgages for Province Visa2 for Province Total British Columbia $ 246,999 23.3% $ 804,847 76.1% $ 6,507 0.6% $ 1,058,353 Alberta 528,233 66.3% 259,776 32.6% 8,859 1.1% 796,868
Ontario 1,794,870 16.2% 8,964,756 80.8% 336,066 3.0% 11,095,692
Quebec 127,308 32.8% 260,034 67.0% 935 0.2% 388,277
Other 358,777 62.5% 212,959 37.1% 2,457 0.4% 574,193
$ 3,056,187 22.0% $ 10,502,372 75.4% $ 354,824 2.6% $ 13,913,383 1See definition of insured loans under the Glossary of Terms in this report. 2Equityline Visa is an uninsured product.

28
Table 18: Insured and Uninsured Single-Family Residential Mortgages by Effective Remaining Amortization Period (Gross of Allowance for Credit Losses)
(000s, except %) As at September 30, 2019 ≤ 20 >20 and ≤ 25 >25 and ≤ 30 >30 and ≤ 35 > 35
Years Years Years Years Years Total Balance outstanding $ 1,547,227 $ 2,784,317 $ 9,871,982 $ 7,000 $ 848 $ 14,211,374
Percentage of total 10.9% 19.6% 69.5% 0.0% 0.0% 100.0%
(000s, except %) As at June 30, 2019
≤ 20 >20 and ≤ 25 >25 and ≤ 30 >30 and ≤ 35 > 35
Years Years Years Years Years Total Balance outstanding $ 1,472,195 $ 2,740,741 $ 9,756,517 $ 7,771 $ 850 $ 13,978,074
Percentage of total 10.5% 19.6% 69.8% 0.1% 0.0% 100.0%
(000s, except %) As at December 31, 2018
≤ 20 >20 and ≤ 25 >25 and ≤ 30 >30 and ≤ 35 > 35
Years Years Years Years Years Total Balance outstanding $ 1,333,431 $ 2,666,307 $ 9,547,074 $ 10,501 $ 1,246 $ 13,558,559
Percentage of total 9.8% 19.7% 70.4% 0.1% 0.0% 100.0% Table 19: Weighted-Average LTV for Uninsured Single-Family Residential Mortgages Originated During the Quarter
For the three months ended
September 30 June 30 September 30
2019 2019 2018
Uninsured Uninsured Uninsured Residential Equityline Residential Equityline Residential Equityline
Mortgages1 Visa1 Mortgages1 Visa1 Mortgages1 Visa1
British Columbia 66.9% 60.8% 66.7% 63.4% 64.2% 61.5% Alberta 72.3% 64.9% 71.2% 53.7% 69.4% 60.9%
Ontario 71.3% 64.8% 71.1% 64.5% 70.0% 62.1%
Quebec 72.2% N/A 71.9% 73.6% 69.7% 66.4%
Other 74.8% 57.5% 74.6% 63.1% 71.1% 69.1%
Total 72.7% 64.5% 71.3% 64.3% 69.2% 62.1% 1 Weighted-average LTV is calculated by dividing the sum of the products of LTVs and loan balances by the sum of the loan balances. LTVs are calculated using appraised property values at the time of origination. N/A indicates not applicable as there were no originations during the quarter for the particular province.
The Company actively manages the mortgage portfolio and performs regular and ad-hoc stress testing. Stress testing includes scenarios that are based on a combination of increasing unemployment, rising interest rates, and a decline in real estate values, as well as specific operational, market and single-factor stress tests. The probability of default in the residential mortgage portfolio is most closely correlated with changes in employment rates. Consequently, during an economic downturn, either regionally or nationally, the Company would expect an increased rate of default and an increase in credit losses arising from lower real estate values. The Company’s stress tests related to either regional or national economic downturns, which include declining housing prices and increased unemployment, indicate that the Company has sufficient capital to absorb such events, albeit with increases to credit losses. The total single-family residential mortgage portfolio including HELOC was $14.62 billion as of September 30, 2019, of which $3.03 billion was insured against credit losses. The Company’s key mitigant against credit losses in the event of default in the uninsured portfolio is the excess of the value of the collateral over the outstanding loan amount (expressed as LTV ratio). As at September 30, 2019, the weighted-average LTV of the uninsured portfolio against the estimated current market value was 58.8% compared to 59.0% at the end of Q2 2019 and 59.0% at the end of 2018. These average current LTVs were estimated with appraised property values adjusted for price changes by using an independent third-party index. If an economic downturn involved reduced real estate values, the margin of value over loan amounts would be eroded and the extent of loan losses could increase. The weighted-average LTV for each significant market is indicated below.

29
Table 20: Weighted-Average LTV for Uninsured Single-Family Residential Mortgages As at September 30, 2019 June 30, 2019
Percentage of Total Value Percentage of Total Value Weighted-Average of Outstanding Mortgages with Weighted-Average of Outstanding Mortgages with
Current LTV1 Current LTV Less Than or Equal to Current LTV1 Current LTV Less Than or Equal to
75% 65% 75% 65%
British Columbia 55.6% 96.8% 82.8% 55.9% 96.1% 79.0% Alberta 64.0% 86.3% 62.3% 64.1% 84.9% 57.9%
Ontario 58.7% 88.1% 73.1% 58.9% 86.6% 69.7%
Quebec 60.9% 94.4% 75.2% 61.2% 92.9% 70.3%
Other 65.1% 83.9% 63.5% 65.0% 81.2% 56.7%
Total 58.8% 88.9% 73.5% 59.0% 87.5% 69.9% 1Weighted-average LTV is calculated by dividing the sum of the products of LTVs and loan balances by the sum of the loan balances.
Market Risk Market Risk is the potential for adverse changes in the value of assets, liabilities or earnings resulting from changes in market variables such as interest rates, equity prices and counterparty credit spreads. For the Company, market risk consists primarily of investment risk and structural interest rate risk. A summary of these risks is as follows:
Investment Risk
Investment risk is the risk of loss of earnings and capital from changes in security prices and dividends in the investment portfolio, whether they arise from macroeconomic factors, the economic prospects of the issuer, or the availability of liquid markets, among other factors. The Company’s investment portfolio consists primarily of government bonds at 93.1% of the portfolio and preferred shares at 6.1% of the portfolio. The total balance was $386.2 million at the end of Q3 2019 compared to $386.9 million at the end of Q2 2019 and $386.3 million at the end of 2018.
As of September 30, 2019, the Company assessed its securities portfolio for evidence of impairment and did not identify any negative credit events during the quarter in relation to its debt holdings (Refer to Note 4(B) to the unaudited interim consolidated financial statements included in this report).
There have been no changes to the Company’s investment risk management framework since the end of 2018. Please see page 56 of the 2018 Annual Report for more details.
Structural Interest Rate Risk
Structural interest rate risk is the risk of lost earnings or capital due to changes in interest rates. The objective of interest rate risk management is to ensure that the Company can realize stable and predictable earnings over specific time periods despite interest rate fluctuations. There have been no significant changes to the Company’s market risk management framework, interest rate risk policies, guidelines and procedures since the end of 2018. Please see page 57 of the 2018 Annual Report for more details.
From time to time, the Company enters into derivative transactions to hedge interest rate exposure resulting from outstanding loan commitments on fixed-rate mortgages, deposits, and CMB liabilities. Where appropriate, the Company will apply hedge accounting to minimize volatility in reported earnings from interest rate changes. All derivative contracts are over-the-counter contracts with highly rated Canadian financial institutions. Please see the Non-Interest Income section of this MD&A and Note 18 to the consolidated financial statements included in the 2018 Annual Report for further information on the Company’s use of derivatives and hedging activities.
The Company is exposed to interest rate risk because of a difference, or gap, between the maturity or repricing date of interest-sensitive assets and liabilities. The following table shows the gap positions at September 30, 2019, June 30, 2019 and December 31, 2018 for selected period intervals. Figures in parentheses represent an excess of liabilities over assets, or a negative gap position.
This schedule reflects the contractual maturities of both assets and liabilities, adjusted for assumptions regarding the effective change in the maturity date because of a mortgage becoming impaired and for credit commitments. Over the lifetime of certain assets, some contractual obligations, such as residential mortgages, will be terminated prior to their stated maturity at the election of the borrower, by way of prepayments. Similarly, some contractual off-balance sheet mortgage commitments may be made but may not materialize. In measuring its interest rate risk exposure, the Company makes assumptions about these factors and monitors these against actual experience. Variable-rate assets and liabilities are allocated to a maturity category based on their interest repricing date.

30
Table 21: Interest Rate Sensitivity
thousands of Canadian dollars, except % (Unaudited) As at September 30, 2019
Floating 0 to 3 3 Months Over Non-Interest Rate Months1 to 1 Year 1 to 5 Years 5 Years Sensitive Total
Total assets $ 358,885 $ 5,206,728 $ 8,058,180 $ 4,701,169 $ 186,423 $ 422,871 $ 18,934,256 Total liabilities and equity (584,727) (2,485,301) (5,338,554) (7,972,979) (420,153) (2,132,542) (18,934,256)
Off-balance sheet items - (1,078,029) 49,349 932,349 96,331 - -
Interest rate sensitive gap $ (225,842) $ 1,643,398 $ 2,768,975 $ (2,339,461) $ (137,399) $ (1,709,671) $ -
Cumulative gap $ (225,842) $ 1,417,556 $ 4,186,531 $ 1,847,070 $ 1,709,671 $ - $ -
Cumulative gap as a percentage of total assets (1.2)% 7.5% 22.1% 9.8% 9.0% - -
thousands of Canadian dollars, except % (Unaudited) As at June 30, 2019
Floating 0 to 3 3 Months Over Non-Interest Rate Months1 to 1 Year 1 to 5 Years 5 Years Sensitive Total
Total assets $ 348,657 $ 4,742,020 $ 7,905,573 $ 4,876,932 $ 215,117 $ 433,443 $ 18,521,742 Total liabilities and equity (478,619) (2,874,648) (4,854,885) (8,209,871) - (2,103,719) (18,521,742)
Off-balance sheet items - (1,122,618) 23,291 1,061,809 37,518 - -
Interest rate sensitive gap $ (129,962) $ 744,754 $ 3,073,979 $ (2,271,130) $ 252,635 $ (1,670,276) $ -
Cumulative gap $ (129,962) $ 614,792 $ 3,688,771 $ 1,417,641 $ 1,670,276 $ - $ -
Cumulative gap as a percentage of total assets (0.7)% 3.3% 19.9% 7.7% 9.0% - -
thousands of Canadian dollars, except % (Unaudited) As at December 31, 2018
Floating 0 to 3 3 Months Over Non-Interest Rate Months1 to 1 Year 1 to 5 Years 5 Years Sensitive Total
Total assets $ 326,948 $ 5,081,369 $ 6,951,307 $ 5,179,033 $ 167,511 $ 435,521 $ 18,141,689 Total liabilities and equity (341,401) (2,975,197) (4,449,572) (8,272,082) - (2,103,437) (18,141,689)
Off-balance sheet items - (957,344) 23,352 850,843 83,149 - -
Interest rate sensitive gap $ (14,453) $ 1,148,828 $ 2,525,087 $ (2,242,206) $ 250,660 $ (1,667,916) $ -
Cumulative gap $ (14,453) $ 1,134,375 $ 3,659,462 $ 1,417,256 $ 1,667,916 $ - $ -
Cumulative gap as a percentage of total assets (0.1)% 6.3% 20.2% 7.8% 9.2% - - 1Total assets in the 0-3 month category above include $1.61 billion in variable rate mortgages ($1.57 billion – Q2 2019; $1.77 billion – Q4 2018)
To assist in matching assets and liabilities, the Company utilizes a variety of metrics, including two interest rate risk sensitivity metrics that measure the relationship between changes in interest rates and the resulting estimated impact on both the Company’s future net interest income and the economic value of shareholders’ equity. The Company measures these metrics over many different yield curve scenarios. The following table provides measurements of interest rate sensitivity and the potential after-tax impact of an immediate and sustained 100 basis-point increase or decrease in interest rates on net interest income and on the economic value of shareholders’ equity and OCI. Table 22: Impact of Interest Rate Shifts As at
thousands of Canadian dollars (Unaudited) September 30 June 30 December 31 September 30 June 30 December 31 2019 2019 2018 2019 2019 2018
Increase in interest rates Decrease in interest rates
100 basis point shift
Impact on net interest income, after tax
(for the next 12 months) $ 7,880 $ 2,243 $ 5,039 $ (7,880) $ (2,243) $ (5,039)
Impact on net present value of shareholders’ equity 20,086 4,608 17,688 (16,455) (5,700) (19,171)
Impact on other comprehensive income 2,436 2,917 2,670 (2,436) (2,917) (2,670)

31
Liquidity and Funding Risk Liquidity and funding risk is the risk that the Company is unable to generate or obtain sufficient cash or equivalents in a timely manner and at a reasonable cost to meet its financial obligations (both on- and off-balance sheet) as they fall due. This risk will arise from fluctuations in the Company’s cash flows associated with lending, securitization, deposit-taking, investing and other business activities. The High-Interest Savings Accounts and Oaken Savings Accounts add to liquidity risk as depositors can withdraw deposits on notice in the absence of fixed contractual terms. The Company’s current exposure to this risk is within the Company’s current risk appetite. In addition, the Company has a $500 million committed secured standby credit facility from a syndicate of Canadian chartered banks. Please see Note 4(A) to the unaudited interim consolidated financial statements included in this report for details on this credit facility. The Company believes the current level of liquidity and credit facilities are sufficient to support ongoing business for the foreseeable future. As indicated in Table 13, maturities of non-securitized loans are in excess of deposit maturities for the next 12 months. The Company strategically limits demand deposits to an appropriate level that is aligned with the Company’s liquidity and funding limits, taking into consideration that a primary purpose of the Oaken Savings Accounts is to facilitate the seamless movement of funds to and from Oaken GICs for customers. Issuing deposits through Oaken and securitizing uninsured mortgages through the Company’s RMBS program are part of the Company’s funding diversification strategy. There have been no significant changes to the Company’s liquidity and funding risks, policies, guidelines or the measurement and management of the risks since the end of 2018. Please refer to page 61 of the 2018 Annual Report for more information. The Company’s liquid assets are presented in the table below.
Table 23: Liquidity Resources As at (000s, except %) September 30 June 30 December 31
2019 2019 2018
Cash and cash equivalents per balance sheet $ 578,632 $ 470,732 $ 665,947 Securities per balance sheet 386,225 386,934 386,333
Add: MBS and CMB included in residential mortgages 402,946 489,483 262,005
1,367,803 1,347,149 1,314,285 Less: securities held for investments (26,535) (23,933) (26,352) Liquid assets at carrying value $ 1,341,268 $ 1,323,216 $ 1,287,933
Liquid assets at fair value $ 1,344,868 $ 1,321,741 $ 1,290,857
Liquid assets at carrying value as a % of total assets 7.1% 7.1% 7.1%
Certain Company-originated NHA MBS are held as liquid assets but are classified in residential mortgages on the balance sheet, as required by IFRS. The underlying mortgages are insured and the securities are stamped by CMHC. On an overall basis, liquidity resources fluctuate as the Company’s future cash requirements change.
Operational Risk Operational risk for the Company has not changed from the descriptions provided in the 2018 Annual Report. Please refer to pages 62 and 63 of the 2018 Annual Report.
Compliance Risk Compliance risk for the Company has not changed from the descriptions provided in the 2018 Annual Report. Please refer to page 63 of the 2018 Annual Report.
Capital Adequacy Risk Capital Adequacy risk for the Company has not changed from the descriptions provided in the 2018 Annual Report. Please refer to page 63 of the 2018 Annual Report.
Strategic Risk Strategic risk for the Company has not changed from the descriptions provided in the 2018 Annual Report. Please refer to page 63 of the 2018 Annual Report.
Reputational Risk Reputational risk for the Company has not changed from the descriptions provided in the 2018 Annual Report. Please refer to page 63 of the 2018 Annual Report.

32
The significant accounting policies and critical accounting estimates are outlined in Note 2 to the audited consolidated financial statements included in the Company’s 2018 Annual Report. These policies are critical as they refer to material amounts and require management to make estimates.
Current and Future Changes in Accounting Standards On January 1, 2019, the Company adopted IFRS 16 Leases (IFRS 16). Please see Note 3 to the unaudited interim consolidated financial statements included in this report for further details including the impact of adoption of IFRS 16 on the consolidated financial statements. Please also see Note 3 for a description of accounting pronouncements applicable to the Company that were issued but not effective as at September 30, 2019.
Controls over Financial Reporting Disclosure Controls and Internal Control over Financial Reporting
Management is responsible for establishing the integrity and fairness of financial information presented in the consolidated financial statements prepared in accordance with Canadian generally accepted accounting principles. As such, management has established disclosure controls and procedures and internal controls over financial reporting to ensure that the Company’s consolidated financial statements and the Management’s Discussion and Analysis present fairly, in all material respects, the financial position of the Company and the results of its operations. Disclosure controls and procedures are designed to provide reasonable assurance that all relevant information is gathered and reported to senior management, including the Chief Executive Officer and Chief Financial Officer, on a timely basis so that appropriate decisions can be made regarding public disclosure. There were no changes in the quarter that have or could reasonably be expected to materially affect internal control over financial reporting.
ACCOUNTING STANDARDS AND POLICIES

33
QUARTERLY FINANCIAL HIGHLIGHTS Table 24: Summary of Quarterly Results1 (000s, except per share amounts and %) 2019 2018 2017
Q3 Q2 Q1 Q4 Q3 Q2 Q1 Q4
Net interest income (TEB2) $ 103,177 $ 97,658 $ 91,904 $ 90,449 $ 89,962 $ 84,240 $ 88,204 $ 91,818
Less: TEB adjustment 129 124 126 125 115 111 104 100
Net interest income per financial statements 103,048 97,534 91,778 90,324 89,847 84,129 88,100 91,718
Non-interest income 13,601 13,738 12,046 18,052 15,239 17,496 15,665 17,737
Non-interest expense 59,867 61,698 60,027 55,658 55,602 55,426 51,387 65,490
Total revenue 116,649 111,272 103,824 108,376 105,086 101,625 103,765 109,455
Net income 39,020 31,907 27,823 35,811 32,600 29,606 34,586 30,619
Adjusted net income3 41,953 34,721 30,152 35,811 32,600 29,606 34,586 30,619
Return on shareholders’ equity 9.5% 7.7% 6.8% 8.1% 6.9% 6.4% 7.6% 6.8%
Adjusted return on shareholders' equity3 10.2% 8.4% 7.3% 8.1% 6.9% 6.4% 7.6% 6.8%
Return on average total assets 0.8% 0.7% 0.6% 0.8% 0.7% 0.7% 0.8% 0.7%
Total assets under administration $ 24,776,872 $ 24,584,880 $ 24,935,030 $ 24,680,225 $ 24,657,402 $ 25,001,732 $ 24,776,803 $ 25,040,182
Total loans under administration $ 22,968,969 $ 22,901,521 $ 23,112,210 $ 22,933,274 $ 22,818,087 $ 22,513,861 $ 22,541,079 $ 22,518,675
Earnings per share
Basic $ 0.67 $ 0.53 $ 0.45 $ 0.46 $ 0.41 $ 0.37 $ 0.43 $ 0.38
Diluted $ 0.67 $ 0.53 $ 0.45 $ 0.46 $ 0.41 $ 0.37 $ 0.43 $ 0.38
Adjusted earnings per share3
Basic $ 0.72 $ 0.58 $ 0.49 $ 0.46 $ 0.41 $ 0.37 $ 0.43 $ 0.38
Diluted $ 0.72 $ 0.58 $ 0.49 $ 0.46 $ 0.41 $ 0.37 $ 0.43 $ 0.38
Book value per common share $ 28.64 $ 27.80 $ 27.00 $ 26.43 $ 23.82 $ 23.40 $ 23.04 $ 22.60
Efficiency ratio (TEB2) 51.3% 55.4% 57.7% 51.3% 52.9% 54.5% 49.5% 59.8%
Adjusted efficiency ratio (TEB2)3 47.8% 51.9% 54.7% 51.3% 52.9% 54.5% 49.5% 59.8%
Common equity tier 1 ratio4 19.67% 19.49% 18.99% 18.94% 23.27% 23.21% 23.64% 23.17%
Tier 1 capital ratio4 19.67% 19.49% 18.99% 18.93% 23.27% 23.21% 23.64% 23.17%
Total capital ratio4 20.13% 19.96% 19.42% 19.38% 23.74% 23.67% 24.12% 23.68%
Net non-performing loans as a % of gross loans 0.49% 0.47% 0.49% 0.47% 0.34% 0.34% 0.29% 0.30%
Annualized provision as a % of gross loans 0.09% 0.15% 0.15% 0.10% 0.10% 0.17% 0.16% 0.09%
Net write-offs as a % of gross loans (annualized) 0.06% 0.09% 0.02% 0.13% 0.02% 0.05% 0.03% 0.11% 1 The amounts pertaining to 2019 and 2018 have been prepared in accordance with IFRS 9; prior period amounts have not been restated and have been prepared in accordance with IAS 39 Financial Instruments: Recognition and Measurement (IAS 39). Please see Note 2 to the audited consolidated financial statements included in the Company’s 2018 Annual Report for further information. 2 TEB - Taxable Equivalent Basis: see definition under Non-GAAP Measures in this report. 3 See definition of adjusted net income, adjusted return on shareholders’ equity, adjusted earnings per share and adjusted efficiency ratio under Non-GAAP Measures in this report and the reconciliation of net income to adjusted net income in Table 1 of this report. 4 These figures relate to the Company’s operating subsidiary, Home Trust Company.
The Company’s key financial measures for each of the last eight quarters are summarized in the table above. These highlights illustrate the Company’s profitability, return on equity, efficiency measures and capital ratios. The quarterly results are modestly affected by seasonal factors, with first quarter mortgage advances typically impacted by winter weather conditions while the second and third quarters have traditionally experienced higher levels of originations. First quarter credit statistics may experience a decline reflecting post-holiday arrears increases.

34
Non-GAAP Measures The Company uses a number of financial measures to assess its performance. Some of these measures are not calculated in accordance with GAAP, are not defined by GAAP, and do not have standardized meanings that would ensure consistency and comparability between companies using these measures. The non-GAAP measures used in this MD&A are defined as follows:
Adjusted Net Income and Adjusted Earnings per Share
Items of note are removed from reported results in determining adjusted results. Adjusted results are designed to provide a better understanding of how management assesses underlying business performance and to facilitate a more informed analysis of trends.
The Company presents adjusted net income and adjusted earnings per share. The adjusted results remove items of note, net of income taxes, from reported results for items which management does not believe are indicative of future results. The item of note for 2019 is an adjustment in connection with the Company’s IT Roadmap. Please see Table 1 and Items of Note in the Financial Performance Review section of this MD&A for more information. Return on shareholders’ equity and efficiency ratio are also presented on an adjusted basis.
Common Equity Tier 1, Tier 1, and Total Capital Ratios
The capital ratios provided in this MD&A are those of the Company’s wholly owned subsidiary Home Trust. The calculations are in accordance with guidelines issued by OSFI. Refer to the Capital Management section of this MD&A and Note 8(C) to the unaudited interim consolidated financial statements included in this report.
Dividend Payout Ratio
Dividend payout ratio is a measure of the proportion of a Company’s earnings that is paid to shareholders in the form of dividends. The Company calculates its dividend payout ratio as the amount of dividends per share as a percentage of diluted earnings per share.
Efficiency Ratio and Adjusted Efficiency Ratio
Management uses the efficiency ratio as a measure of the Company’s efficiency in generating revenue. This ratio represents non-interest expenses as a percentage of total revenue, net of interest expense. The Company looks at the ratio on a taxable equivalent basis and will include this adjustment in arriving at the efficiency ratio, on a taxable equivalent basis. In addition, the Company uses the adjusted efficiency ratio calculated using adjusted revenue and adjusted expenses. A lower ratio indicates better efficiency.
Leverage Ratio
The Leverage ratio provided in this MD&A is that of the Company’s wholly owned subsidiary Home Trust. The calculations are in accordance with guidelines issued by OSFI. The Leverage ratio is defined as the Capital Measure divided by the Exposure Measure, with the ratio expressed as a percentage. The Capital Measure is the all-in Tier 1 capital of Home Trust. The Exposure Measure consists of on-balance sheet assets, derivative, securities financing transactions and off-balance sheet exposures.
Liquid Assets
Liquid assets are unencumbered high quality assets for which there is a broad and active secondary market available to the Company to sell these assets without incurring a substantial discount. Liquid assets are a dependable source of cash used by the Company when it experiences short-term funding shortfalls.
Market Capitalization
Market capitalization is calculated as the closing price of the Company’s common shares multiplied by the number of common shares of the Company outstanding.
Net Interest Margin (TEB)
Net interest margin is a measure of profitability of assets. Net interest margin (TEB) is calculated by taking net interest income, on a taxable equivalent basis, divided by the average total assets.
Net Non-Performing Loans as a Percentage of Gross Loans (NPL Ratio)
The NPL ratio is calculated as the total net non-performing loans divided by the gross on-balance sheet loans, which includes all on-balance sheet loans except for loans held for sale.
NON-GAAP MEASURES AND GLOSSARY

35
Net Write-Offs as a Percentage of Gross Loans
Net write-offs as a percentage of gross loans is calculated as write-offs, net of recoveries, divided by the gross on-balance sheet loans outstanding, which includes all on-balance sheet loans except for loans held for sale.
Non-Performing Loans Allowance as a Percentage of Gross Non-Performing Loans
Non-performing loans allowance as a percentage of gross non-performing loans is calculated as the total allowance against non-performing loans divided by the gross on-balance sheet non-performing loans outstanding, which includes all on-balance sheet non-performing loans except for loans held for sale.
Provision as a Percentage of Gross Loans (PCL Ratio)
The PCL ratio is calculated as the total provision expense divided by the gross on-balance sheet loans outstanding, which includes all on-balance sheet loans except for loans held for sale.
Return on Average Assets (ROA)
Return on average assets is a profitability measure that presents the annualized net income as a percentage of the average total assets for the period.
Return on Shareholders’ Equity (ROE) and Adjusted Return on Shareholders’ Equity
ROE is calculated on an annualized basis and is defined as net income available to common shareholders as a percentage of average common shareholders’ equity. To calculate adjusted return on shareholders’ equity, the Company uses adjusted net income.
Risk-Weighted Assets (RWA)
The risk-weighted assets reported in this MD&A are those of the Company’s wholly owned subsidiary Home Trust. The calculations are in accordance with guidelines issued by OSFI. Refer to the Capital Management section in this MD&A and Note 8(C) to the unaudited interim consolidated financial statements included in this report.
Taxable Equivalent Basis (TEB)
Most banks and trust companies analyze and discuss their financial results on a taxable equivalent basis (TEB) to provide uniform measurement and comparison of net interest income. Net interest income (as presented in the consolidated statements of income) includes tax-exempt income principally from preferred and common equity securities. The adjustment to TEB used in this MD&A increases income and the provision for income taxes to what they would have been had the income from tax-exempt securities been taxed at the statutory tax rate. TEB adjustments of $0.1 million for Q3 2019 ($0.1 million – Q2 2019; $0.1 million – Q3 2018) increased interest income as used in the calculation of net interest margin. Net interest margin is discussed on a TEB throughout this MD&A. See Table 3 for the calculation of net interest income on a TEB.
Total Assets under Administration (AUA)
Total assets under administration refers to all on-balance sheet assets plus, all off-balance sheet loans that qualify for derecognition under IFRS.
Total Loans under Administration (LUA)
Total loans under administration refers to all on-balance sheet loans plus, all off-balance sheet loans that qualify for derecognition under IFRS.
Total Revenue
Total revenue is a measure of the revenue, net of interest expense, earned by the Company before non-interest expenses, provision for credit losses and income taxes. Total revenue is the sum of interest and dividend income, net of interest expense, and non-interest income.

36
Glossary of Terms Assets or Loans under Administration refer to assets or loans administered by a financial institution that are beneficially owned by clients and therefore not reported on the balance sheet of the administering financial institution, plus all assets or loans beneficially owned by the Company and carried on the balance sheets.
Basis Point is one-hundredth of a percentage point.
Canada Deposit Insurance Corporation (CDIC) is a Canadian federal Crown corporation created to protect qualifying deposits made with member financial institutions in case of their failure.
Derivatives are a contract between two parties, which requires little or no initial investment and where payments between the parties are dependent upon the movements in price of an underlying instrument, index or financial rate. Examples of derivatives include swaps, options, forward rate agreements and futures. The notional amount of the derivative is the contract amount used as a reference point to calculate the payments to be exchanged between the two parties, and the notional amount itself is generally not exchanged by the parties.
Forwards used by the Company are contractual agreements to either buy or sell a specified amount of an interest-rate-sensitive financial instrument or security at a specific price and date in the future. Forwards are customized contracts transacted in the over-the-counter market.
Hedging is a risk management technique used by the Company to neutralize, manage or offset interest rate, equity, or credit exposures arising from normal banking activities.
Impaired or Non-Performing Loans are loans for which there is no longer reasonable assurance of the timely collection of principal or interest. The Company considers its non-performing loans to be those determined as Stage 3 under IFRS 9. Please see Note 2 to the audited consolidated financial statements included in the Company’s 2018 Annual Report for more information.
Insured Loans are loans insured against default by CMHC or another approved insurer, either individually at origination or by portfolio. The Company’s insured lending includes single-family homes and multi-unit residential properties.
Net Interest Income comprises earnings on assets, such as loans and securities, including interest and dividend income, less interest expense paid on liabilities, such as deposits.
Notional Amount refers to the principal used to calculate interest and other payments under derivative contracts. The principal does not change hands under the terms of a derivative contract.
Office of the Superintendent of Financial Institutions Canada (OSFI) is the government agency responsible for regulation and supervision of banks, insurance companies, trust companies, loan companies and pension plans in Canada.
Securitization is the practice of selling pools of contractual debts, such as residential or commercial mortgages, to third parties.
Swaps are contractual agreements between two parties to exchange a series of cash flows. The Company uses interest rate swaps and total return swaps. An interest rate swap is an agreement where counterparties generally exchange fixed-rate and floating-rate interest payments based on a notional value in a single currency. A total return swap is an agreement in which one party makes payments based on a set rate, either fixed or variable, while the other party makes payments based on the return of an underlying asset, which includes both the income it generates and any capital gains.

37
Acronyms ALCO – Asset/Liability Committee
AOCI – Accumulated Other Comprehensive Income
CDIC – Canada Deposit Insurance Corporation
CMB – Canada Mortgage Bond
CMHC – Canada Mortgage and Housing Corporation
COSO – Committee of Sponsoring Organizations of the Treadway Commission
ERM – Enterprise Risk Management
GAAP – Generally Accepted Accounting Principles
GIC – Guaranteed Investment Certificate
HELOC – Home Equity Line of Credit
IASB – International Accounting Standards Board
IFRS – International Financial Reporting Standards
LTV – Loan to Value (ratio expressed as a percentage)
MBS – Mortgage-Backed Security
MD&A – Management’s Discussion and Analysis
N/A – Not applicable for the respective period
NCCF – Net Cumulative Cash Flow
NHA – National Housing Act
OCI – Other Comprehensive Income
OSFI – Office of the Superintendent of Financial Institutions Canada
Repo – Repurchase Obligation
RMBS – Residential Mortgage-Backed Securities
TEB – Taxable Equivalent Basis
TLCA – Trust and Loan Companies Act (Canada)

38
Consolidated Balance Sheets As at
thousands of Canadian dollars (Unaudited) September 30 June 30 December 31
2019 2019 2018
ASSETS
Cash and Cash Equivalents (note 4(A)) $ 578,632 $ 470,732 $ 665,947
Securities (note 4(B)) 386,225 386,934 386,333
Loans Held for Sale 131,722 173,185 130,351
Loans (note 5)
Securitized mortgages (note 6(A)) 3,082,533 2,624,304 2,800,623
Non-securitized mortgages and loans 13,912,098 14,040,894 13,463,764
16,994,631 16,665,198 16,264,387
Allowance for credit losses (note 5(C)) (60,377) (59,123) (51,691)
16,934,254 16,606,075 16,212,696
Other
Restricted assets 447,653 411,868 309,205
Derivative assets 28,253 32,831 8,925
Other assets 350,791 361,070 338,987
Deferred tax assets 4,335 3,094 3,489
Goodwill and intangible assets 72,391 75,953 85,756
903,423 884,816 746,362
$ 18,934,256 $ 18,521,742 $ 18,141,689
LIABILITIES AND SHAREHOLDERS’ EQUITY
Liabilities
Deposits $ 13,520,776 $ 13,514,411 $ 12,977,090
Securitization Liabilities (note 6(B))
CMHC-sponsored mortgage-backed security liabilities 1,664,214 1,539,045 1,573,216
CMHC-sponsored Canada Mortgage Bond liabilities 1,240,717 1,240,363 1,239,331
Other securitization liabilities 420,153 10,235 46,779
3,325,084 2,789,643 2,859,326
Other
Credit facilities (note 4(A)) - 139,640 261,506
Derivative liabilities 13,832 14,079 35,975
Other liabilities 412,326 393,233 338,344
Deferred tax liabilities 20,056 23,217 28,838
446,214 570,169 664,663
17,292,074 16,874,223 16,501,079
Shareholders’ Equity
Capital stock (note 8(A)) 165,678 170,716 178,782
Contributed surplus 4,656 4,610 4,583
Retained earnings 1,483,490 1,484,354 1,467,730
Accumulated other comprehensive loss (note 9) (11,642) (12,161) (10,485)
1,642,182 1,647,519 1,640,610
$ 18,934,256 $ 18,521,742 $ 18,141,689
Provisions and Contingencies (note 10)
The accompanying notes are an integral part of these unaudited interim consolidated financial statements.

39
Consolidated Statements of Income For the three months ended For the nine months ended
thousands of Canadian dollars, except per share amounts (Unaudited) September 30 June 30 September 30 September 30 September 30
2019 2019 2018 2019 2018
Net Interest Income Non-Securitized Assets
Interest from loans (note 5(E)) $ 195,280 $ 188,167 $ 161,754 $ 561,044 $ 473,231
Dividends from securities 358 348 318 1,053 911
Other interest 4,948 6,635 6,217 18,096 17,630
200,586 195,150 168,289 580,193 491,772
Interest on deposits 97,281 98,115 80,740 289,953 225,627
Interest and fees on line of credit facilities (note 4(A)) 3,663 2,771 1,605 9,146 13,657
Net interest income non-securitized assets 99,642 94,264 85,944 281,094 252,488
Net Interest Income Securitized Loans and Assets
Interest income from securitized loans and assets (note 5(E)) 22,595 22,179 24,337 69,090 69,761
Interest expense on securitization liabilities 19,189 18,909 20,434 57,824 60,173
Net interest income securitized loans and assets 3,406 3,270 3,903 11,266 9,588
Total Net Interest Income 103,048 97,534 89,847 292,360 262,076
Provision for credit losses (note 5(C)) 3,748 6,079 3,990 15,887 16,445
99,300 91,455 85,857 276,473 245,631
Non-Interest Income
Fees and other income 12,066 11,839 11,768 34,283 35,277
Securitization income (note 6(C)) 2,627 1,424 3,129 5,614 7,883
Gain on sale of PSiGate - - - - 950
Net realized and unrealized (losses) gains on securities and loans (notes 4(B) & 5(F)) (1,200) - 800 (915) 3,798
Net realized and unrealized gains (losses) on derivatives 108 475 (458) 403 492
13,601 13,738 15,239 39,385 48,400
112,901 105,193 101,096 315,858 294,031
Non-Interest Expenses
Salaries and benefits 24,348 23,666 20,941 71,311 56,395
Premises (note 7) 2,611 3,214 2,611 8,629 7,573
Other operating expenses 32,908 34,818 32,050 101,652 98,447
59,867 61,698 55,602 181,592 162,415
Income Before Income Taxes 53,034 43,495 45,494 134,266 131,616
Income taxes
Current 18,416 16,152 11,546 46,504 28,082
Deferred (4,402) (4,564) 1,348 (10,988) 6,742
14,014 11,588 12,894 35,516 34,824
NET INCOME $ 39,020 $ 31,907 $ 32,600 $ 98,750 $ 96,792
NET INCOME PER COMMON SHARE
Basic $ 0.67 $ 0.53 $ 0.41 $ 1.65 $ 1.21
Diluted $ 0.67 $ 0.53 $ 0.41 $ 1.64 $ 1.21
AVERAGE NUMBER OF COMMON SHARES OUTSTANDING
Basic 58,229 60,068 80,246 59,905 80,246
Diluted 58,346 60,292 80,246 60,063 80,246
Total number of outstanding common shares (note 8(A)) 57,331 59,264 80,246 57,331 80,246
Book value per common share $ 28.64 $ 27.80 $ 23.82 $ 28.64 $ 23.82
The accompanying notes are an integral part of these unaudited interim consolidated financial statements.

40
Consolidated Statements of Comprehensive Income For the three months ended For the nine months ended
thousands of Canadian dollars (Unaudited) September 30 June 30 September 30 September 30 September 30
2019 2019 2018 2019 2018
NET INCOME $ 39,020 $ 31,907 $ 32,600 $ 98,750 $ 96,792
OTHER COMPREHENSIVE INCOME
ITEMS THAT WILL NOT BE SUBSEQUENTLY RECLASSIFIED TO NET INCOME
Equity Securities Designated at FVOCI1
Change in net unrealized gains or losses (398) (899) 464 (2,818) 1,287
Income tax (recovery) expense (110) (240) 125 (749) 344
(288) (659) 339 (2,069) 943
ITEMS THAT WILL BE SUBSEQUENTLY RECLASSIFIED TO NET INCOME
Debt Instruments at FVOCI1
Net change in unrealized gains or losses (147) 87 104 327 331
Net gains or losses reclassified to net income - - - - -
(147) 87 104 327 331
Income tax (recovery) expense (47) 24 19 87 88
(100) 63 85 240 243
Cash Flow Hedges
Net change in unrealized gains or losses 1,136 14 578 518 (642)
Net losses reclassified to net income 112 159 42 397 627
1,248 173 620 915 (15)
Income tax expense (recovery) 341 46 173 243 (5)
907 127 447 672 (10)
Total other comprehensive income (loss) 519 (469) 871 (1,157) 1,176
COMPREHENSIVE INCOME $ 39,539 $ 31,438 $ 33,471 $ 97,593 $ 97,968 1 FVOCI indicates fair value through other comprehensive income.
The accompanying notes are an integral part of these unaudited interim consolidated financial statements.

41
Consolidated Statements of Changes in Shareholders' Equity Net Unrealized Gains (Losses), After Tax, on: Total Total
Capital Contributed Retained Equity Securities Debt Instruments Cash Flow Accumulated Other Shareholders'
thousands of Canadian dollars (Unaudited) Stock Surplus Earnings Designated at FVOCI at FVOCI Hedges Comprehensive Loss Equity
Balance at December 31, 2018 $ 178,782 $ 4,583 $ 1,467,730 $ (10,263) $ 1,384 $ (1,606) $ (10,485) $ 1,640,610
Impact on adoption of IFRS 161 - - (2,352) - - - - (2,352)
Comprehensive income - - 98,750 (2,069) 240 672 (1,157) 97,593
Stock options settled (note 8(B)) 601 (137) - - - - - 464
Amortization of fair value of
employee stock options (note 8(B)) - 210 - - - - - 210
Repurchase of shares (note 8(A)) (13,705) - (80,638) - - - - (94,343)
Balance at September 30, 2019 $ 165,678 $ 4,656 $ 1,483,490 $ (12,332) $ 1,624 $ (934) $ (11,642) $ 1,642,182
Balance at January 1, 20182 $ 231,156 $ 4,978 $ 1,583,265 $ (6,902) $ 2,197 $ (1,189) $ (5,894) $ 1,813,505
Comprehensive income - - 96,792 943 243 (10) 1,176 97,968
Amortization of fair value of
employee stock options (note 8(B)) - (121) - - - - - (121)
Balance at September 30, 2018 $ 231,156 $ 4,857 $ 1,680,057 $ (5,959) $ 2,440 $ (1,199) $ (4,718) $ 1,911,352 1 Please see Note 3 in these unaudited interim consolidated financial statements for information on transition of balances as at December 31, 2018 to balances as at January 1, 2019 upon adoption of IFRS 16 Leases (IFRS 16). 2 Please see Note 3 to the consolidated financial statements included in the 2018 Annual Report for information on transition of balances as at December 31, 2017 to balances as at January 1, 2018 upon adoption of IFRS 9 Financial Instruments (IFRS 9). The accompanying notes are an integral part of these unaudited interim consolidated financial statements.

42
Consolidated Statements of Cash Flows For the three months ended For the nine months ended
thousands of Canadian dollars (Unaudited) September 30 September 30 September 30 September 30
2019 2018 2019 2018
CASH FLOWS FROM OPERATING ACTIVITIES Net income for the period $ 39,020 $ 32,600 $ 98,750 $ 96,792
Adjustments to determine cash flows relating to operating activities:
Amortization of net premium on securities 29 52 295 437
Provision for credit losses 3,748 3,990 15,887 16,445
Losses (recovery of losses) on sale of loan portfolio 1,200 (800) 915 (3,700)
Gain on sale of PSiGate - - - (950)
Gain on securitization and sale of mortgages (1,099) (866) (1,802) (3,263)
Net realized and unrealized gains on securities - - - (98)
Amortization on capital and intangible assets 7,863 5,353 24,913 16,048
Amortization of fair value of employee stock options 183 150 210 (121)
Deferred income taxes (4,402) 1,348 (10,988) 6,742
Changes in operating assets and liabilities
Loans, net of gains or losses on securitization and sales (289,365) (594,735) (737,014) (972,054)
Restricted assets (35,785) 427 (138,448) 136,681
Derivative assets and liabilities 5,579 14,045 (40,556) 23,843
Accrued interest receivable (1,397) (1,942) (5,246) (4,270)
Accrued interest payable 4,575 (1,411) 7,222 (4,938)
Deposits 6,365 (135,674) 543,686 190,576
Credit facilities (139,640) 99,811 (261,506) 99,811
Securitization liabilities 535,441 (4,552) 465,758 (68,833)
Taxes receivable or payable and other 25,057 (7,336) 61,556 (17,017)
Cash flows provided by (used in) operating activities 157,372 (589,540) 23,632 (487,869)
CASH FLOWS FROM FINANCING ACTIVITIES
Repurchase of shares (45,523) - (94,343) -
Exercise of employee stock options 464 - 464 -
Payment of lease liabilities (658) - (1,951) -
Cash flows used in financing activities (45,717) - (95,830) -
CASH FLOWS FROM INVESTING ACTIVITIES
Activity in securities
Purchases - - (3,000) (70,247)
Proceeds from sales - - - 10,151
Proceeds from maturities - 233 - 832
Net proceeds from the sale of PSiGate - - - 310
Purchases of capital assets (292) (534) (3,054) (993)
Capitalized intangible development costs (3,463) (1,042) (9,063) (3,355)
Cash flows used in investing activities (3,755) (1,343) (15,117) (63,302)
Net increase (decrease) in cash and cash equivalents during the period 107,900 (590,883) (87,315) (551,171)
Cash and cash equivalents at beginning of the period 470,732 1,375,850 665,947 1,336,138
Cash and Cash Equivalents at End of the Period (note 4(A)) $ 578,632 $ 784,967 $ 578,632 $ 784,967
Supplementary Disclosure of Cash Flow Information
Dividends received on investments $ 399 $ 318 $ 1,055 $ 907
Interest received 221,414 190,418 643,277 556,793
Interest paid 115,857 104,190 350,617 304,395
Income taxes paid 17,093 11,339 56,544 37,152
The accompanying notes are an integral part of these unaudited interim consolidated financial statements.

43
Notes to the Interim Consolidated Financial Statements (unless otherwise stated, all amounts are in Canadian dollars, Unaudited) 1. CORPORATE INFORMATION
Home Capital Group Inc. (the “Company” or “Home Capital”) is a public corporation traded on the Toronto Stock Exchange. The Company is incorporated and domiciled in Canada with its registered and principal business offices located at 145 King Street West, Suite 2300, Toronto, Ontario. The Company operates primarily through its federally regulated subsidiary, Home Trust Company (Home Trust), which offers residential and non-residential mortgage lending, securitization of residential mortgage products, consumer lending and credit card services. Home Bank, a wholly owned subsidiary of Home Trust, is a federally regulated retail bank offering mortgage lending and securitization of residential mortgages. Home Trust and Home Bank also offer deposits via brokers and financial planners, and through a direct-to-consumer brand, Oaken Financial. The Company’s former subsidiary, Payment Services Interactive Gateway Inc. (PSiGate), provided payment services. On February 1, 2018, the Company closed the sale of PSiGate. Licensed to conduct business across Canada, Home Trust and Home Bank have offices in Ontario, Alberta, British Columbia, Nova Scotia, Quebec and Manitoba. The Company is the ultimate parent of the group. These unaudited interim consolidated financial statements for the period ended September 30, 2019 were authorized for issuance by the Board of Directors (the Board) of the Company on November 12, 2019. The Board has the power to amend the consolidated financial statements after their issuance only in the case of discovery of an error. 2. ACCOUNTING POLICIES USED TO PREPARE THE UNAUDITED INTERIM CONSOLIDATED FINANCIAL STATEMENTS
These unaudited interim consolidated financial statements of the Company have been prepared in accordance with International Accounting Standard 34 Interim Financial Reporting (IAS 34) as issued by the International Accounting Standards Board (IASB). These unaudited interim consolidated financial statements should be read in conjunction with the Company’s audited consolidated financial statements as at and for the year ended December 31, 2018 as set out in the 2018 Annual Report, on pages 70 through 118. Those audited consolidated financial statements were prepared in accordance with Canadian generally accepted accounting principles (GAAP) for publicly accountable enterprises which are International Financial Reporting Standards (IFRS) as issued by the IASB. The significant accounting policies used in the preparation of these unaudited interim consolidated financial statements are summarized on pages 79 through 89 of the 2018 Annual Report or provided below. Use of Judgement and Estimates Management has exercised judgement in the process of applying the Company’s accounting policies. Some of the Company’s accounting policies require subjective, complex judgements and estimates relating to matters that are inherently uncertain. The preparation of these unaudited interim consolidated financial statements in accordance with GAAP requires management to make estimates and assumptions that affect the reported amounts of assets and liabilities and disclosure of contingent assets and liabilities at the consolidated balance sheet dates and the reported amounts of revenue and expenses during the reporting periods. Derecognition of Financial Assets Management has applied judgement in the application of its accounting policy with respect to derecognition of the loans and other assets used in current securitization programs. Certain securitized loans are recognized only to the extent of the Company’s continuing involvement, based on management’s judgement that it cannot be determined whether substantially all the risks and rewards of ownership have been transferred while control has been retained as defined by IFRS 9 Financial Instruments (IFRS 9). In other cases, when residual interests in securitized transactions are sold, the underlying securitized loans are derecognized based on management’s judgement that substantially all the risks and rewards of ownership have been transferred through the two transactions. The remaining loans and other assets that have been securitized are not derecognized, based on management’s judgement that the Company has not transferred substantially all of the risks and rewards of ownership of the loans and other assets. Impairment of Financial Assets Under IFRS 9, the expected credit loss (ECL) model requires management to make judgements and estimates in a number of areas. Management must exercise significant judgement in determining whether there has been a significant increase in credit risk (SICR) since initial recognition and in estimating the amount of expected credit losses. The calculation of expected credit losses includes the incorporation of forward-looking information, which requires significant judgement to determine the forward-looking variables that are relevant for each portfolio and the scenarios and probability weights that should be applied. Management also exercises expert credit judgement in determining the amount of ECLs at each reporting date by considering reasonable and supportable information that is not already incorporated in the quantitative modelling process. Changes in these inputs, assumptions, models and judgements directly impact the measurement of ECLs.

44
Impairment of Intangible Assets In applying judgement in its assessment of impairment of intangible assets, management has considered the asset usage, obsolescence and impact on that assessment of the decline in the Company’s common share price to below the book value per common share. While impairments have been recognized on intangible assets as a result of usage and obsolescence, management does not consider the current common share price to warrant the recognition of additional impairment in its intangible assets as at the date of these unaudited interim consolidated financial statements. Management will continue to assess the implications of the common share price remaining below book value on its assessment of impairment of intangible assets. Other Judgements and Estimates Other key areas where management has applied judgement and made estimates include fair values, income taxes, fair value of stock options, useful lives of capital assets and intangible assets, and provisions and contingent liabilities. Actual results could differ from those estimates.
3. CURRENT AND FUTURE CHANGES IN ACCOUNTING POLICIES Current Period Changes in Accounting Policies Amendments to IFRS 9 Financial Instruments In October 2017, the IASB published amendments to IFRS 9 relating to prepayment features with negative compensation. The amendments are to be applied retrospectively to annual reporting periods beginning on or after January 1, 2019 with earlier applications permitted. The amendments did not materially impact the Company’s consolidated financial statements. IFRS 16 Leases In January 2016, the IASB issued IFRS 16 Leases (IFRS 16) which sets out the principles for the recognition, measurement, presentation and disclosure of leases. The standard removes the previous requirements under IAS 17 Leases (IAS 17) and related interpretations for lessees to classify leases as finance leases or operating leases by introducing a single lessee accounting model that requires the recognition of lease assets and lease liabilities on the balance sheet for most leases. Lessees will also recognize depreciation expense on the right-of-use asset, interest expense on the lease liability, and shift the timing of expense recognition in the consolidated statements of income. There are no significant changes to lessor accounting aside from enhanced disclosure requirements. IFRS 16 is effective for the Company on January 1, 2019. The Company adopted IFRS 16 using the modified retrospective approach by adjusting the consolidated balance sheet at January 1, 2019, the date of initial application, with no restatement of comparative periods. The Company elected to apply practical expedients allowing the use of a single discount rate to a portfolio of leases with similar characteristics; the exclusion of initial direct costs from the measurement of the right-of-use asset at the date of initial application; the exclusion of short-term leases, which are defined as those that have a lease term of 12 months or less; and the exclusion of leases for low-value items. On transition to IFRS 16, the Company recognized right-of-use assets of $27.3 million and lease liabilities of $30.5 million. This excess of liabilities over assets resulted in a reduction in retained earnings of $2.4 million, net of tax ($3.2 million before tax) upon adoption of IFRS 16 on January 1, 2019. Please see Note 7 for more information. Future Changes in Accounting Policies The following accounting pronouncement issued by the IASB was not effective as at September 30, 2019 and therefore has not been applied in preparing these unaudited interim consolidated financial statements. Interest Rate Benchmark Reform The IASB released Interest Rate Benchmark Reform, which amends IFRS 9, IAS 39 Financial Instruments: Recognition and Measurement and IFRS 7 Financial Instruments: Disclosures, on September 26, 2019. The guidance amends some requirements for hedge accounting and is designed to support the provision of useful financial information by companies during the period of uncertainty arising from the phasing out of interest-rate benchmarks such as interbank offered rates (the IBOR reform). The amendments modify some specific hedge accounting requirements to provide relief from potential effects of the uncertainty caused by the IBOR reform. In addition, the amendments require companies to provide additional information to investors about their hedging relationships which are directly affected by these uncertainties. The amendments issued are considered Phase 1 of the IASB’s response to the IBOR reform, and will be effective for the Company on January 1, 2020, with the option to adopt early. The Company continues to evaluate the potential impact to existing contractual relationships, systems and processes that would be impacted by the IBOR reform in Canada, and the additional disclosures required by the new standard.

45
4. CASH RESOURCES, CREDIT FACILITIES AND SECURITIES
(A) Cash Resources and Credit Facilities As at thousands of Canadian dollars (Unaudited) September 30 June 30 December 31 2019 2019 2018
Cash and cash equivalents $ 578,632 $ 470,732 $ 665,947
Committed Secured Standby Credit Facility Home Trust has a $500 million secured committed standby credit facility with a syndicate of Canadian chartered banks, which was undrawn as at September 30, 2019. As required under the terms of the facility, Home Trust created a bankruptcy remote special purpose entity (SPE), which is a consolidated entity of Home Trust. The facility is limited to $500 million and is subject to Home Trust transferring eligible collateral to the SPE. Please see Note 4(A) to the audited consolidated financial statements included on page 91 of the Company’s 2018 Annual Report for further information on the facility including details required to be disclosed under the terms of the facility. Committed Secured Warehouse Credit Facility Home Trust has a $300 million committed secured warehouse credit facility with a syndicate of Canadian chartered banks. The facility was undrawn as at September 30, 2019. Please see Note 4(A) to the audited consolidated financial statements included on page 92 of the Company’s 2018 Annual Report for further information on the facility. Uncommitted Repo Facility Home Trust has a $150 million uncommitted repo facility with a Canadian institutional investor, which was undrawn as at September 30, 2019. As required under the terms of the facility, Home Trust created a bankruptcy remote SPE, which is a consolidated entity of Home Trust. The facility’s termination date is December 18, 2019. Please see Note 4(A) to the unaudited interim consolidated financial statements included on page 46 of the Company’s 2019 Second Quarter Report for further information on the facility. Uncommitted Secured Credit Facility The Company also has an uncommitted secured credit facility with a Canadian chartered bank in the amount of $20 million, subject to letters of credit issued against the facility. As at September 30, 2019, the facility is undrawn.

46
(B) Securities As at thousands of Canadian dollars (Unaudited) September 30 June 30 December 31 2019 2019 2018
Debt securities measured at FVOCI $ 359,690 $ 360,001 $ 359,981 Debt securities measured at FVTPL1 3,000 3,000 - Preferred shares designated at FVOCI 23,535 23,933 26,352
$ 386,225 $ 386,934 $ 386,333 1FVTPL indicates fair value through profit or loss.
Included in securities are preferred shares with a carrying amount of $21.1 million and government bonds with a carrying amount of $10.1 million which are held as security for the $20 million uncommitted secured credit facility referred to in Note 4(A). The Company may at any time and at its discretion replace the preferred shares and government bonds as security for the credit facility with other acceptable forms of security. The Company did not sell any government bonds in the first nine months of 2019 or in Q3 2018. During the nine months ended September 30, 2018, the Company sold government bonds for proceeds of $10.1 million and recognized gains of $49 thousand. There were no sales of preferred shares in the first nine months of 2019 or during 2018. Debt Securities Measured at FVOCI Net unrealized gains and losses (excluding impairment losses, which are recognized in the consolidated statements of income) are included in accumulated other comprehensive income (AOCI). These unrealized gains and losses are not included in net income. Please see Note 9 for more information. As of September 30, 2019, there were no allowances for credit losses recognized on debt securities. All debt securities measured at FVOCI are Government of Canada debt securities and are classified as Stage 1. Interest income earned on debt securities measured at FVOCI was $1.5 million in Q3 2019 and $5.5 million year to date 2019 ($1.9 million – Q2 2019; $1.8 million – Q3 2018; $4.4 million – year to date 2018) and is included in other interest in the consolidated statements of income. Equity Securities Designated at FVOCI Equity securities designated at FVOCI include non-trading equity securities, and for the Company, consist entirely of preferred shares. Net unrealized gains and losses are included in AOCI. These unrealized gains and losses are not included in net income. Please see Note 9 for more information. All dividend income was earned on equity securities designated at FVOCI still held at the end of the reporting period.

47
5. LOANS
(A) Loans by Product thousands of Canadian dollars (Unaudited) As at September 30, 2019
Gross Allowance Net Carrying for Credit Carrying
Amount Losses Amount
Securitized single-family residential mortgages1 $ 2,850,842 $ 371 $ 2,850,471 Securitized multi-unit residential mortgages 231,691 249 231,442
Total securitized mortgages 3,082,533 620 3,081,913
Single-family residential mortgages 11,360,532 26,813 11,333,719 Commercial mortgages2 1,778,298 16,581 1,761,717
Credit card loans and lines of credit 461,987 3,283 458,704
Other consumer retail loans 311,281 13,080 298,201
Total non-securitized mortgages and loans3 13,912,098 59,757 13,852,341
$ 16,994,631 $ 60,377 $ 16,934,254
thousands of Canadian dollars (Unaudited) As at June 30, 2019
Gross Allowance Net Carrying for Credit Carrying
Amount Losses Amount
Securitized single-family residential mortgages1 $ 2,390,370 $ 224 $ 2,390,146 Securitized multi-unit residential mortgages 233,934 236 233,698
Total securitized mortgages 2,624,304 460 2,623,844
Single-family residential mortgages 11,587,704 27,699 11,560,005 Commercial mortgages2 1,696,843 14,263 1,682,580
Credit card loans and lines of credit 439,854 3,232 436,622
Other consumer retail loans 316,493 13,469 303,024
Total non-securitized mortgages and loans3 14,040,894 58,663 13,982,231
$ 16,665,198 $ 59,123 $ 16,606,075
thousands of Canadian dollars (Unaudited) As at December 31, 2018
Gross Allowance Net Carrying for Credit Carrying
Amount Losses Amount
Securitized single-family residential mortgages1 $ 2,489,971 $ 271 $ 2,489,700 Securitized multi-unit residential mortgages 310,652 421 310,231
Total securitized mortgages 2,800,623 692 2,799,931
Single-family residential mortgages 11,068,588 25,788 11,042,800 Commercial mortgages2 1,671,101 16,353 1,654,748
Credit card loans and lines of credit 405,051 3,703 401,348
Other consumer retail loans 319,024 5,155 313,869
Total non-securitized mortgages and loans3 13,463,764 50,999 13,412,765
$ 16,264,387 $ 51,691 $ 16,212,696 1 Securitized single-family residential mortgages include both CMHC-sponsored securitized insured mortgages and uninsured mortgages securitized through other programs. 2 Commercial mortgages include both non-residential commercial mortgages and residential commercial mortgages. Residential commercial mortgages include non-securitized multi-unit residential mortgages and commercial mortgages secured by residential property types. 3 Loans exclude mortgages held for sale.

48
(B) Loans by Geographic Region and Type (Gross of Allowance for Credit Losses) thousands of Canadian dollars, except % (Unaudited) As at September 30, 2019 British Columbia Alberta Ontario Quebec Other Total Securitized single-family residential mortgages1 $ 222,347 $ 455,287 $ 1,756,579 $ 103,698 $ 312,931 $ 2,850,842 Securitized multi-unit residential mortgages - 14,501 148,450 17,654 51,086 231,691
Total securitized mortgages 222,347 469,788 1,905,029 121,352 364,017 3,082,533
Single-family residential mortgages 1,025,976 385,247 9,259,650 342,188 347,471 11,360,532 Residential commercial mortgages2 33,695 14,550 187,346 18,114 11,924 265,629
Non-residential commercial mortgages 149,969 54,242 1,270,271 33,119 5,068 1,512,669
Credit card loans and lines of credit 20,134 15,767 417,672 1,290 7,124 461,987
Other consumer retail loans 5,313 16,703 266,533 1,129 21,603 311,281
Total non-securitized mortgages and loans3 1,235,087 486,509 11,401,472 395,840 393,190 13,912,098 $ 1,457,434 $ 956,297 $ 13,306,501 $ 517,192 $ 757,207 $ 16,994,631
As a % of portfolio 8.6% 5.6% 78.3% 3.0% 4.5% 100.0% thousands of Canadian dollars, except % (Unaudited) As at June 30, 2019
British Columbia Alberta Ontario Quebec Other Total Securitized single-family residential mortgages1 $ 205,467 $ 435,689 $ 1,365,846 $ 90,679 $ 292,689 $ 2,390,370 Securitized multi-unit residential mortgages - 14,586 149,907 17,917 51,524 233,934
Total securitized mortgages 205,467 450,275 1,515,753 108,596 344,213 2,624,304
Single-family residential mortgages 984,658 384,960 9,548,135 340,269 329,682 11,587,704 Residential commercial mortgages2 33,297 7,059 160,999 19,066 12,457 232,878
Non-residential commercial mortgages 93,168 50,992 1,275,419 39,561 4,825 1,463,965
Credit card loans and lines of credit 16,205 15,770 399,047 2,200 6,632 439,854
Other consumer retail loans 4,248 14,723 277,161 1,094 19,267 316,493
Total non-securitized mortgages and loans3 1,131,576 473,504 11,660,761 402,190 372,863 14,040,894
$ 1,337,043 $ 923,779 $ 13,176,514 $ 510,786 $ 717,076 $ 16,665,198
As a % of portfolio 8.0% 5.5% 79.1% 3.1% 4.3% 100.0%
thousands of Canadian dollars, except % (Unaudited) As at December 31, 2018
British Columbia Alberta Ontario Quebec Other Total Securitized single-family residential mortgages1 $ 207,915 $ 406,894 $ 1,517,977 $ 93,869 $ 263,316 $ 2,489,971 Securitized multi-unit residential mortgages 65,326 14,723 159,923 18,399 52,281 310,652
Total securitized mortgages 273,241 421,617 1,677,900 112,268 315,597 2,800,623
Single-family residential mortgages 843,931 381,115 9,241,649 293,473 308,420 11,068,588 Residential commercial mortgages2 43,688 7,307 158,799 6,653 2,948 219,395
Non-residential commercial mortgages 98,889 45,751 1,266,194 35,692 5,180 1,451,706
Credit card loans and lines of credit 13,475 16,932 366,214 1,836 6,594 405,051
Other consumer retail loans 1,600 10,688 288,556 132 18,048 319,024
Total non-securitized mortgages and loans3 1,001,583 461,793 11,321,412 337,786 341,190 13,463,764
$ 1,274,824 $ 883,410 $ 12,999,312 $ 450,054 $ 656,787 $ 16,264,387
As a % of portfolio 7.8% 5.4% 80.0% 2.8% 4.0% 100.0% 1 Securitized single-family residential mortgages include both CMHC-sponsored securitized insured mortgages and uninsured mortgages securitized through other programs. 2 Residential commercial mortgages include non-securitized multi-unit residential mortgages and commercial mortgages secured by residential property types. 3 Loans exclude mortgages held for sale.

49
(C) Allowance for Credit Losses
For the three months ended
thousands of Canadian dollars (Unaudited) September 30, 2019 June 30, 2019 Stage 1 Stage 2 Stage 3 Total Stage 1 Stage 2 Stage 3 Total Single-family residential mortgages Balance at the beginning of the period $ 15,810 $ 4,896 $ 7,217 $ 27,923 $ 14,708 $ 4,411 $ 6,773 $ 25,892 New assets originated or purchased 8,846 - - 8,846 9,863 - - 9,863 Transfer from Stage 1 (1,544) 1,497 47 - (1,940) 1,926 14 - Transfer from Stage 2 1,910 (2,505) 595 - 2,008 (2,473) 465 - Transfer from Stage 3 452 953 (1,405) - 527 552 (1,079) - Remeasurement due to transfers (429) 44 528 143 (548) 276 567 295 Change in risk parameters and models (7,696) 201 3,775 (3,720) (7,044) 774 3,928 (2,342) Assets derecognized or repaid (excluding write-offs) (1,658) (596) (2,991) (5,245) (1,750) (570) (2,614) (4,934) Provision for credit losses (119) (406) 549 24 1,116 485 1,281 2,882 Write-offs (6) - (950) (956) (14) - (924) (938) Recoveries - - 193 193 - - 87 87 Balance at the end of the period 15,685 4,490 7,009 27,184 15,810 4,896 7,217 27,923 of which is securitized 233 135 3 371 111 93 20 224 of which is non-securitized 15,452 4,355 7,006 26,813 15,699 4,803 7,197 27,699
Commercial mortgages1 Balance at the beginning of the period 3,260 4,405 6,834 14,499 3,780 2,634 8,445 14,859 New assets originated or purchased 937 - - 937 737 - - 737 Transfer from Stage 1 (1,286) 1,286 - - (1,382) 1,382 - - Transfer from Stage 2 1,765 (1,782) 17 - 1,800 (1,805) 5 - Transfer from Stage 3 14 - (14) - - - - - Remeasurement due to transfers (790) 770 182 162 (955) 2,383 79 1,507 Change in risk parameters and models (93) 180 2,840 2,927 (299) (65) 1,648 1,284 Assets derecognized or repaid (excluding write-offs) (277) (240) (822) (1,339) (421) (124) (1,254) (1,799) Provision for credit losses 270 214 2,203 2,687 (520) 1,771 478 1,729 Write-offs - - (356) (356) - - (2,089) (2,089) Recoveries - - - - - - - - Balance at the end of the period 3,530 4,619 8,681 16,830 3,260 4,405 6,834 14,499 of which is securitized 176 73 - 249 236 - - 236 of which is non-securitized 3,354 4,546 8,681 16,581 3,024 4,405 6,834 14,263
Credit card loans and lines of credit Balance at the beginning of the period 664 1,085 1,483 3,232 550 1,115 1,526 3,191 New credit cards issued 100 - - 100 84 - - 84 Transfer from Stage 1 (72) 60 12 - (73) 67 6 - Transfer from Stage 2 263 (737) 474 - 330 (768) 438 - Transfer from Stage 3 70 153 (223) - 21 178 (199) - Remeasurement due to transfers (68) (10) 48 (30) (68) (5) 76 3 Change in risk parameters and models 175 930 583 1,688 68 773 624 1,465 Draws and repayments (excluding write-offs) (172) (105) (268) (545) (161) (238) (440) (839) Provision for credit losses 296 291 626 1,213 201 7 505 713 Write-offs (275) (234) (653) (1,162) (87) (37) (548) (672) Recoveries - - - - - - - - Balance at the end of the period 685 1,142 1,456 3,283 664 1,085 1,483 3,232 Other consumer retail loans Balance at the beginning of the period 648 3,280 9,541 13,469 658 3,696 8,484 12,838 New assets originated or purchased 88 - - 88 237 - - 237 Transfer from Stage 1 (111) 110 1 - (172) 87 85 - Transfer from Stage 2 525 (665) 140 - 408 (529) 121 - Transfer from Stage 3 334 546 (880) - 285 485 (770) - Remeasurement due to transfers (311) 374 7 70 (316) 345 9 38 Change in risk parameters and models (498) 899 681 1,082 (334) (452) 2,526 1,740 Assets derecognized or repaid (excluding write-offs) (117) (512) (787) (1,416) (118) (351) (791) (1,260) Provision for credit losses (90) 752 (838) (176) (10) (415) 1,180 755 Write-offs - (2) (211) (213) - (1) (123) (124) Recoveries - - - - - - - - Balance at the end of the period 558 4,030 8,492 13,080 648 3,280 9,541 13,469 Total allowance for credit losses $ 20,458 $ 14,281 $ 25,638 $ 60,377 $ 20,382 $ 13,666 $ 25,075 $ 59,123
Total provision for credit losses $ 357 $ 851 $ 2,540 $ 3,748 $ 787 $ 1,848 $ 3,444 $ 6,079

50
(C) Allowance for Credit Losses (Continued) For the three months ended thousands of Canadian dollars (Unaudited) September 30, 2018 Stage 1 Stage 2 Stage 3 Total Single-family residential mortgages Balance at the beginning of the period $ 15,285 $ 5,037 $ 5,772 $ 26,094 New assets originated or purchased 8,398 - - 8,398 Transfer from Stage 1 (1,488) 1,456 32 - Transfer from Stage 2 1,538 (2,221) 683 - Transfer from Stage 3 581 1,005 (1,586) - Remeasurement due to transfers (527) 250 509 232 Change in risk parameters and models (6,499) 77 3,813 (2,609) Assets derecognized or repaid (excluding write-offs) (1,331) (719) (2,579) (4,629) Provision for credit losses 672 (152) 872 1,392 Write-offs (126) (5) (127) (258) Recoveries - - 149 149 Balance at the end of the period 15,831 4,880 6,666 27,377 of which is securitized 735 906 48 1,689 of which is non-securitized 15,096 3,974 6,618 25,688
Commercial mortgages1 Balance at the beginning of the period 3,079 1,444 10,408 14,931 New assets originated or purchased 1,717 - - 1,717 Transfer from Stage 1 (658) 654 4 - Transfer from Stage 2 676 (909) 233 - Transfer from Stage 3 248 238 (486) - Remeasurement due to transfers (171) 106 38 (27) Change in risk parameters and models (738) 210 1,213 685 Assets derecognized or repaid (excluding write-offs) (218) (198) (77) (493) Provision for credit losses 856 101 925 1,882 Write-offs - - - - Recoveries - - - - Balance at the end of the period 3,935 1,545 11,333 16,813 of which is securitized 568 - - 568 of which is non-securitized 3,367 1,545 11,333 16,245
Credit card loans and lines of credit Balance at the beginning of the period 639 1,304 1,688 3,631 New credit cards issued 73 - - 73 Transfer from Stage 1 (97) 93 4 - Transfer from Stage 2 312 (739) 427 - Transfer from Stage 3 42 180 (222) - Remeasurement due to transfers (79) 6 54 (19) Change in risk parameters and models (69) 735 246 912 Draws and repayments (excluding write-offs) (119) (149) (236) (504) Provision for credit losses 63 126 273 462 Write-offs (47) (12) (495) (554) Recoveries - - - - Balance at the end of the period 655 1,418 1,466 3,539 Other consumer retail loans Balance at the beginning of the period 601 4,086 463 5,150 New assets originated or purchased 207 - - 207 Transfer from Stage 1 (167) 167 - - Transfer from Stage 2 88 (149) 61 - Transfer from Stage 3 - 52 (52) - Remeasurement due to transfers (59) 112 3 56 Change in risk parameters and models 70 332 122 524 Assets derecognized or repaid (excluding write-offs) (95) (391) (47) (533) Provision for credit losses 44 123 87 254 Write-offs (5) - (161) (166) Recoveries - - 2 2 Balance at the end of the period 640 4,209 391 5,240 Total allowance for credit losses $ 21,061 $ 12,052 $ 19,856 $ 52,969
Total provision for credit losses $ 1,635 $ 198 $ 2,157 $ 3,990

51
(C) Allowances for Credit Losses (Continued) For the nine months ended thousands of Canadian dollars (Unaudited) September 30, 2019 September 30, 2018 Stage 1 Stage 2 Stage 3 Total Stage 1 Stage 2 Stage 3 Total Single-family residential mortgages Balance at the beginning of the period $ 14,741 $ 4,218 $ 7,100 $ 26,059 $ 11,610 $ 7,280 $ 3,563 $ 22,453 New assets originated or purchased 26,429 - - 26,429 25,776 - - 25,776 Transfer from Stage 1 (4,846) 4,783 63 - (4,780) 4,478 302 - Transfer from Stage 2 5,921 (7,211) 1,290 - 6,688 (8,531) 1,843 - Transfer from Stage 3 1,560 2,309 (3,869) - 950 1,745 (2,695) - Remeasurement due to transfers (1,569) 428 1,414 273 (2,721) 1,398 1,450 127 Change in risk parameters and models (21,961) 1,447 10,627 (9,887) (16,793) 431 10,724 (5,638) Assets derecognized or repaid (excluding write-offs) (4,559) (1,484) (7,869) (13,912) (4,456) (1,915) (7,404) (13,775) Provision for credit losses 975 272 1,656 2,903 4,664 (2,394) 4,220 6,490 Write-offs (31) - (2,161) (2,192) (443) (6) (1,532) (1,981) Recoveries - - 414 414 - - 415 415 Balance at the end of the period 15,685 4,490 7,009 27,184 15,831 4,880 6,666 27,377 of which is securitized 233 135 3 371 735 906 48 1,689 of which is non-securitized 15,452 4,355 7,006 26,813 15,096 3,974 6,618 25,688
Commercial mortgages1 Balance at the beginning of the period 4,522 2,442 9,810 16,774 3,898 3,318 3,300 10,516 New assets originated or purchased 2,241 - - 2,241 3,788 - - 3,788 Transfer from Stage 1 (3,405) 3,403 2 - (1,681) 1,582 99 - Transfer from Stage 2 4,374 (4,454) 80 - 2,849 (3,113) 264 - Transfer from Stage 3 70 - (70) - 550 238 (788) - Remeasurement due to transfers (1,912) 3,640 306 2,034 (809) 616 145 (48) Change in risk parameters and models (1,441) 19 3,502 2,080 (4,053) (827) 8,537 3,657 Assets derecognized or repaid (excluding write-offs) (919) (431) (2,504) (3,854) (606) (269) (252) (1,127) Provision for credit losses (992) 2,177 1,316 2,501 38 (1,773) 8,005 6,270 Write-offs - - (2,445) (2,445) (1) - (1) (2) Recoveries - - - - - - 29 29 Balance at the end of the period 3,530 4,619 8,681 16,830 3,935 1,545 11,333 16,813 of which is securitized 176 73 - 249 568 - - 568 of which is non-securitized 3,354 4,546 8,681 16,581 3,367 1,545 11,333 16,245
Credit card loans and lines of credit Balance at the beginning of the period 683 1,339 1,681 3,703 823 1,965 1,196 3,984 New credit cards issued 248 - - 248 198 - - 198 Transfer from Stage 1 (224) 199 25 - (346) 308 38 - Transfer from Stage 2 825 (2,258) 1,433 - 985 (2,835) 1,850 - Transfer from Stage 3 131 491 (622) - 147 623 (770) - Remeasurement due to transfers (190) (13) 183 (20) (323) 47 219 (57) Change in risk parameters and models 70 2,253 1,506 3,829 (237) 1,731 162 1,656 Draws and repayments (excluding write-offs) (419) (546) (988) (1,953) (509) (317) 362 (464) Provision for credit losses 441 126 1,537 2,104 (85) (443) 1,861 1,333 Write-offs (439) (323) (1,762) (2,524) (83) (104) (1,749) (1,936) Recoveries - - - - - - 158 158 Balance at the end of the period 685 1,142 1,456 3,283 655 1,418 1,466 3,539 Other consumer retail loans Balance at the beginning of the period 707 4,019 429 5,155 565 2,199 559 3,323 New assets originated or purchased 427 - - 427 573 - - 573 Transfer from Stage 1 (393) 281 112 - (582) 579 3 - Transfer from Stage 2 1,471 (2,110) 639 - 585 (813) 228 - Transfer from Stage 3 619 1,055 (1,674) - 13 187 (200) - Remeasurement due to transfers (987) 1,062 43 118 (385) 881 9 505 Change in risk parameters and models (951) 972 10,993 11,014 145 2,159 455 2,759 Assets derecognized or repaid (excluding write-offs) (334) (1,246) (1,600) (3,180) (268) (957) (260) (1,485) Provision for credit losses (148) 14 8,513 8,379 81 2,036 235 2,352 Write-offs (1) (3) (450) (454) (6) (26) (405) (437) Recoveries - - - - - - 2 2 Balance at the end of the period 558 4,030 8,492 13,080 640 4,209 391 5,240 Total allowance for credit losses $ 20,458 $ 14,281 $ 25,638 $ 60,377 $ 21,061 $ 12,052 $ 19,856 $ 52,969
Total provision for credit losses $ 276 $ 2,589 $ 13,022 $ 15,887 $ 4,698 $ (2,574) $ 14,321 $ 16,445 1 Commercial mortgages include both non-residential commercial mortgages and residential commercial mortgages. Residential commercial mortgages include non-securitized multi-unit residential mortgages and commercial mortgages secured by residential property types.

52
(C) Allowance for Credit Losses (Continued)
The following provides explanations of the lines presented above:
• Transfers between stages are presumed to occur before any corresponding remeasurement of the allowance. • New assets originated or purchased reflect the allowance related to assets newly recognized during the period,
including renewals. • Assets derecognized or repaid (excluding write-offs) reflect the allowance related to assets derecognized during the
period including loans subsequently renewed. • Remeasurement due to transfers represents the remeasurement between 12-month and lifetime ECLs due to stage
transfers, excluding the changes to risk, parameters and models during the period. • Changes in risk parameters and models represent the change in the allowance related to the impact of
macroeconomic factors, risk parameters, and changes to models. The change in risk parameters also includes the impact on ECL of the change in probability of default and loss given default that occurs with the passage of time as the loan approaches the end of its contractual term. This impact is more significant for loans with shorter contractual terms. In addition, the change in risk parameters includes the impact on ECL of the probability of default increasing to 100% when loans become non-performing and transfer into Stage 3.

53
(D) Credit Risk Exposure by Internal Risk Rating
The following table presents the gross carrying amounts of loans subject to IFRS 9 impairment requirements by internal risk ratings used by the Company for credit risk management purposes. The gross carrying amount of loans represents the maximum exposure to credit risk at the end of the reporting period without taking into account any collateral or other credit enhancements.
The internal risk ratings presented in the table below are defined as follows:
Very low: Loans that have significantly below average probability of default with credit risk that is significantly lower than the Company’s risk appetite and risk tolerance levels. While the Company does originate loans under this category, these loans may have lower yield due to high credit quality. Low: Loans that have below average probability of default with credit risk that is lower than the Company’s risk appetite and risk tolerance levels. While the Company does originate loans under this category, these loans may have lower yield due to high credit quality. Medium: Loans that have an average probability of default with credit risk which is within the Company’s risk appetite and risk tolerance. The Company actively originates loans under this category due to higher yields. High: Loans that were originated within the Company’s risk appetite but have subsequently experienced an increase in credit risk which is outside of the Company’s typical risk appetite and risk tolerance levels. The Company will generally not originate loans in this category. Default: Loans that are over 90 days past due or loans for which there is objective evidence of impairment. As at thousands of Canadian dollars (Unaudited) September 30, 2019 June 30, 2019 Stage 1 Stage 2 Stage 3 Total Stage 1 Stage 2 Stage 3 Total Single-family residential mortgages Very Low $ 1,818,686 $ - $ - $ 1,818,686 $ 1,381,039 $ - $ - $ 1,381,039 Low 8,638,643 45,914 - 8,684,557 8,723,318 55,274 - 8,778,592 Medium 2,715,615 239,151 - 2,954,766 2,702,026 300,912 - 3,002,938 High 371,143 323,294 - 694,437 401,226 354,107 - 755,333 Default - - 58,928 58,928 - - 60,172 60,172 Gross carrying amount 13,544,087 608,359 58,928 14,211,374 13,207,609 710,293 60,172 13,978,074 Allowance for credit losses (15,685) (4,490) (7,009) (27,184) (15,810) (4,896) (7,217) (27,923) Net carrying amount 13,528,402 603,869 51,919 14,184,190 13,191,799 705,397 52,955 13,950,151 Commercial mortgages1 Very Low 257,883 - - 257,883 207,383 - - 207,383 Low 860,301 90,046 - 950,347 821,198 91,434 - 912,632 Medium 356,577 318,574 - 675,151 401,979 357,670 - 759,649 High 18,258 76,333 - 94,591 4,681 23,061 - 27,742 Default - - 32,017 32,017 - - 23,371 23,371 Gross carrying amount 1,493,019 484,953 32,017 2,009,989 1,435,241 472,165 23,371 1,930,777 Allowance for credit losses (3,530) (4,619) (8,681) (16,830) (3,260) (4,405) (6,834) (14,499) Net carrying amount 1,489,489 480,334 23,336 1,993,159 1,431,981 467,760 16,537 1,916,278 Credit card loans and lines of credit Very Low 139,768 - - 139,768 127,071 - - 127,071 Low 157,555 2,347 - 159,902 148,106 1,937 - 150,043 Medium 123,467 24,025 - 147,492 122,220 25,541 - 147,761 High 2,292 8,916 - 11,208 2,172 9,004 - 11,176 Default - - 3,617 3,617 - - 3,803 3,803 Gross carrying amount 423,082 35,288 3,617 461,987 399,569 36,482 3,803 439,854 Allowance for credit losses (685) (1,142) (1,456) (3,283) (664) (1,085) (1,483) (3,232) Net carrying amount 422,397 34,146 2,161 458,704 398,905 35,397 2,320 436,622 Other consumer retail loans Very Low 13,205 231 - 13,436 13,323 214 - 13,537 Low 99,148 26,050 - 125,198 102,424 27,641 - 130,065 Medium 64,880 33,801 - 98,681 64,229 35,941 - 100,170 High 7,926 52,037 - 59,963 9,160 48,834 - 57,994 Default - - 14,003 14,003 - - 14,727 14,727 Gross carrying amount 185,159 112,119 14,003 311,281 189,136 112,630 14,727 316,493 Allowance for credit losses (558) (4,030) (8,492) (13,080) (648) (3,280) (9,541) (13,469) Net carrying amount $ 184,601 $ 108,089 $ 5,511 $ 298,201 $ 188,488 $ 109,350 $ 5,186 $ 303,024

54
(D) Credit Risk Exposure by Internal Risk Rating (Continued)
As at thousands of Canadian dollars (Unaudited) December 31, 2018 Stage 1 Stage 2 Stage 3 Total Single-family residential mortgages Very Low $ 1,192,297 $ - $ - $ 1,192,297 Low 8,267,116 65,745 - 8,332,861 Medium 2,958,261 298,139 - 3,256,400 High 413,871 304,737 - 718,608 Default - - 58,393 58,393 Gross carrying amount 12,831,545 668,621 58,393 13,558,559 Allowance for credit losses (14,741) (4,218) (7,100) (26,059) Net carrying amount 12,816,804 664,403 51,293 13,532,500 Commercial mortgages1 Very Low 213,674 - - 213,674 Low 892,157 97,474 - 989,631 Medium 509,514 215,648 - 725,162 High 4,293 16,271 - 20,564 Default - - 32,722 32,722 Gross carrying amount 1,619,638 329,393 32,722 1,981,753 Allowance for credit losses (4,522) (2,442) (9,810) (16,774) Net carrying amount 1,615,116 326,951 22,912 1,964,979 Credit card loans and lines of credit Very Low 106,780 - - 106,780 Low 137,079 2,817 - 139,896 Medium 112,602 27,832 - 140,434 High 3,185 10,713 - 13,898 Default - - 4,043 4,043 Gross carrying amount 359,646 41,362 4,043 405,051 Allowance for credit losses (683) (1,339) (1,681) (3,703) Net carrying amount 358,963 40,023 2,362 401,348 Other consumer retail loans Very Low 19,122 - - 19,122 Low 102,628 21,323 - 123,951 Medium 74,001 51,039 - 125,040 High 5,348 45,048 - 50,396 Default - - 515 515 Gross carrying amount 201,099 117,410 515 319,024 Allowance for credit losses (707) (4,019) (429) (5,155) Net carrying amount $ 200,392 $ 113,391 $ 86 $ 313,869 1 Commercial mortgages included both non-residential commercial mortgages and residential commercial mortgages. Residential commercial mortgages include non-securitized multi-unit residential mortgages and commercial mortgages secured by residential property types.
(E) Interest Income by Product For the three months ended For the nine months ended
thousands of Canadian dollars (Unaudited) September 30 June 30 September 30 September 30 September 30 2019 2019 2018 2019 2018
Classic single-family residential mortgages $ 146,685 $ 140,690 $ 119,458 $ 419,785 $ 351,659 Accelerator single-family residential mortgages 4,838 4,750 4,211 13,773 11,613
Residential commercial mortgages 4,610 4,536 3,220 13,297 8,041
Non-residential commercial mortgages 22,980 22,468 19,573 67,250 54,319
Credit card loans and lines of credit 9,821 9,197 8,274 27,733 23,915
Other consumer retail loans 6,346 6,526 7,018 19,206 23,684
Total interest income on non-securitized loans 195,280 188,167 161,754 561,044 473,231
CMHC-sponsored securitized single-family residential mortgages 18,993 18,570 17,331 56,304 46,832 CMHC-sponsored securitized multi-unit residential mortgages 2,496 2,870 6,080 10,457 19,152
Assets pledged as collateral for CMHC-sponsored securitization 866 517 188 1,550 1,173
Mortgages securitized through other programs 240 222 738 779 2,604
Total interest income on securitized loans 22,595 22,179 24,337 69,090 69,761
$ 217,875 $ 210,346 $ 186,091 $ 630,134 $ 542,992

55
(F) Sale of Loan Portfolios The Company did not sell any mortgages during the first nine months of 2019 or during 2018. The Company recognized $1.2 million of losses in Q3 2019 and a loss, net of recoveries, of $0.9 million in year to date 2019 pertaining to the 2017 sale of commercial mortgages ($nil – Q2 2019; $0.8 million recovery of losses – Q3 2018; $3.7 million recovery of losses year to date 2018) in non-interest income in the consolidated statements of income. The Company continues to be obligated to fund credit losses on the commercial mortgages sold in 2017 to the extent of the Company’s continuing involvement in the mortgages.

56
6. SECURITIZATION ACTIVITY
(A) Assets Pledged as Collateral As a requirement of the National Housing Act (NHA) Mortgage-Backed Securities (MBS) and Canada Mortgage Bond (CMB) programs, the Company assigns to Canada Mortgage Housing Corporation (CMHC) all of its interest in CMHC-sponsored securitized mortgage pools. If the Company fails to make timely payment under an NHA MBS or CMB security, CMHC may enforce the assignment of the mortgages included in all the mortgage pools as well as other assets backing the MBS issued. During the quarter, the Company closed a $425 million private placement of Residential Mortgage-Backed Securities (RMBS) by Classic RMBS Trust, a securitization vehicle sponsored by Home Trust. Classic RMBS Trust is a consolidated entity of Home Trust. The RMBS are backed by a portfolio of near-prime, uninsured, residential mortgages and are comprised of A, B and Z tranches that aggregate $500 million. The A Tranche of $425 million was sold to accredited investors with the remaining $75 million, composed of the B and Z Tranches, taken up by Home Trust. The A Tranche has first priority with respect to payments of principal and interest with the B and Z Tranches having rights to payments subordinate to the A Tranche. The Company participated in a bank-sponsored securitization conduit program to provide for cost-effective funding of the Company’s ACE Plus product until Q2 2017. There are currently no mortgages assigned to the program. The following table presents the activity associated with the principal value of the Company’s on-balance sheet mortgage loans and other assets assigned as collateral for both the CMHC-sponsored and other securitization programs. The mortgages are recorded as securitized single-family or multi-unit residential mortgages and assets assigned as CMB replacement assets are recorded as restricted assets. For the three months ended For the nine months ended
thousands of Canadian dollars (Unaudited) September 30 June 30 September 30 September 30 September 30
2019 2019 2018 2019 2018
Beginning balance of on-balance sheet assets assigned as collateral for securitization1 $ 2,774,310 $ 2,803,800 $ 3,100,538 $ 2,847,613 $ 3,176,127
Mortgages assigned in new securitizations 856,834 216,654 230,665 1,323,840 790,881
Net change in acceptable securities assigned as replacement assets 59,263 135,189 33,939 162,279 (123,683)
Mortgages derecognized2 (175,047) (188,570) (118,004) (477,960) (455,550)
Maturity, amortization and changes in mortgages assigned as CMB replacement assets (223,558) (192,763) (128,942) (563,970) (269,579)
Ending balance of on-balance sheet assets assigned as collateral for securitization1 $ 3,291,802 $ 2,774,310 $ 3,118,196 $ 3,291,802 $ 3,118,196 1 Included in the on-balance sheet assets assigned as collateral at September 30, 2019 is $209.3 million ($150.0 million – June 30, 2019; $47.0 million – December 31, 2018) in acceptable securities assigned as replacement assets and $3.08 billion ($2.62 billion – June 30, 2019; $2.80 billion – December 31, 2018) of securitized mortgages. 2 Mortgages are derecognized upon the securitization and sale of multi-unit residential mortgages.
Acceptable securities assigned as collateral were accounted for as debt instrument financial assets measured at amortized cost and included in restricted assets on the consolidated balance sheets. Additionally, off-balance sheet mortgage loans of $5.84 billion ($6.06 billion – June 30, 2019; $6.54 billion – December 31, 2018) were assigned as collateral related to CMHC for sponsored securitization programs. Included in this amount is $0.19 billion ($0.25 billion – June 30, 2019; $0.33 billion – December 31, 2018) of mortgages that were sold under the former whole loan sales program of Home Bank. These mortgages were securitized subsequent to the whole loan sales by the purchaser. (B) Securitization Liabilities The following table presents the securitization liabilities, including liabilities added during the period, which are secured by insured mortgages for CMHC-sponsored securitizations, uninsured mortgages for the other securitization programs and other restricted assets. This table includes only on-balance sheet originations and discharges.
For the three months ended For the nine months ended thousands of Canadian dollars (Unaudited) September 30 June 30 September 30 September 30 September 30
2019 2019 2018 2019 2018
Balance at the beginning of the period $ 2,789,643 $ 2,878,367 $ 3,113,468 $ 2,859,326 $ 3,177,749
Addition to securitization liabilities as a result of on-balance sheet activity 681,787 28,085 112,661 845,881 335,331
Net reduction in securitization liabilities due to maturities, amortization and sales (142,044) (118,642) (116,814) (378,996) (405,084)
Other1 (4,302) 1,833 (399) (1,127) 920
Securitization liability $ 3,325,084 $ 2,789,643 $ 3,108,916 $ 3,325,084 $ 3,108,916
Proceeds received for mortgages assigned in new securitizations $ 856,664 $ 216,271 $ 227,720 $ 1,322,746 $ 777,692 1 Other includes premiums, discounts, transaction costs and changes in the mark to market of hedged items.

57
(C) Securitization Income The following table presents the total securitization income for the period.
For the three months ended For the nine months ended
thousands of Canadian dollars (Unaudited) September 30 June 30 September 30 September 30 September 30 2019 2019 2018 2019 2018
Net gain on sale of mortgages1 $ 1,099 $ 448 $ 866 $ 1,802 $ 3,263 Net change in unrealized gain or loss on hedging activities 298 (156) 783 150 148
Servicing income 1,230 1,132 1,480 3,662 4,472
Total securitization income $ 2,627 $ 1,424 $ 3,129 $ 5,614 $ 7,883 1Gain on sale of mortgages are net of hedging impact.
The hedging activities included in the previous table hedge interest rate risk on loans held for sale. The derivatives, which are typically bond forwards, are not designated in hedge accounting relationships. The gains or losses on the derivatives are mostly offset by the fair value changes related to the loans held for sale. During the period, the Company securitized and sold through the NHA MBS program certain insured multi-unit residential mortgages with no prepayment privileges. These mortgages are recognized on the Company’s consolidated balance sheets only to the extent of the Company’s continuing involvement in the mortgages (continuing involvement accounting). The Company’s continuing involvement is limited to its retained interest and its obligations for mortgage servicing. There is no prepayment or credit risk associated with the retained interest or the cost of servicing. The mortgages are effectively derecognized as a result of this transaction. The gains on this transaction type are included in non-interest income under securitization income in the consolidated statements of income. The retained interest and servicing liability are recorded on the consolidated balance sheets in other assets and other liabilities, respectively. The following table provides additional quantitative information about these securitization and sales activities during the period.
For the three months ended For the nine months ended
thousands of Canadian dollars (Unaudited) September 30 June 30 September 30 September 30 September 30
2019 2019 2018 2019 2018
Carrying value of underlying mortgages derecognized $ 175,047 $ 188,570 $ 118,004 $ 477,960 $ 455,550
Net gains on sale of mortgages1 1,099 448 866 1,802 3,263
Retained interests recorded 8,976 8,720 4,790 24,697 18,099
Servicing liability recorded 1,600 1,390 1,095 4,410 3,615 1Gains on sale of mortgages are net of hedging impact.
7. LEASES The Company has entered into commercial leases on premises and property, as well as certain computer hardware and software leases. There are no restrictions imposed by lease arrangements. Right-of-use assets recognized in other assets on the consolidated balance sheets were $25.0 million at September 30, 2019 ($25.8 million – June 30, 2019; $27.3 million – January 1, 2019) and lease liabilities recognized in other liabilities on the consolidated balance sheet were $28.6 million at September 30, 2019 ($29.3 million – June 30, 2019; $30.5 million – January 1, 2019).
Depreciation expense on right-of-use assets of $787 thousand in Q3 2019 and $2.4 million year to date 2019 ($787 thousand – Q2 2019) and interest expense on lease liabilities of $299 thousand in Q3 2019 and $916 thousand year to date 2019 ($305 thousand – Q2 2019) are included in premises under non-interest expenses in the consolidated statements of income.
Cash payments on the principal portion of the lease liability of $658 thousand for Q3 2019 and $2.0 million year to date 2019 ($651 thousand – Q2 2019) and cash payments on the interest portion of the lease liability of $299 thousand for Q3 2019 and $916 thousand year to date 2019 ($305 thousand – Q2 2019) are included in financing activities and interest paid, respectively, on the consolidated statements of cash flows.

58
8. CAPITAL (A) Common Shares Issued and Outstanding As at September 30, 2019, the Company had 57,331,014 common shares issued and outstanding (59,264,446 – June 30, 2019; 62,064,531 – December 31, 2018). The changes in common shares issued and outstanding during the nine months ended September 30, 2019 resulted from the repurchase of shares and options exercised as described below. There was no change in common shares issued and outstanding during the nine months ended September 30, 2018.
The Company repurchased 1,953,432 common shares under its Normal Course Issuer Bid (NCIB) for $45.5 million in Q3 2019 and repurchased 4,753,517 common shares for $94.3 million year to date 2019 (1,766,500 common shares for $31.8 million – Q2 2019). The purchase price of shares acquired through the NCIB is allocated between capital stock and retained earnings. The reduction to capital stock in connection with the NCIB was $5.6 million in Q3 2019 and $13.7 million year to date 2019 ($5.1 million – Q2 2019). The balance of the purchase price of $39.9 million in Q3 2019 and $80.6 million year to date 2019 ($26.7 million – Q2 2019) was charged to retained earnings.
(B) Share Purchase Options The company issued 20,000 common shares for options exercised during the third quarter of 2019, increasing capital stock by $601 thousand and reducing contributed surplus by $137 thousand. During the third quarter of 2019, $183 thousand was recognized as compensation expense for a year-to-date compensation expense of $210 thousand (compensation expense of $170 thousand – Q2 2019; compensation expense of $150 thousand – Q3 2018; reduction to compensation expense of $121 thousand – year to date 2018) for stock option awards in the consolidated statements of income, with an offsetting amount to contributed surplus. The net reductions to compensation expense in previous periods resulted from grants cancelled by forfeiture where certain vesting conditions were not satisfied.
(C) Capital Management The Company has a Capital Management Policy that governs the quantity and quality of capital held. The objectives of the policy are to ensure that capital levels are adequate and that Home Trust meets all regulatory capital requirements, while also providing a sufficient return to investors. The Risk and Capital Committee and the Board review the policy annually and monitor compliance with the policy on a quarterly basis. The Company’s subsidiary, Home Trust, is subject to the regulatory capital requirements stipulated by OSFI. These requirements are consistent with international standards (Basel II and Basel III) set by the Bank for International Settlements. Home Trust follows the Basel II Standardized Approach for calculating credit risk and the Basic Indicator Approach for operational risk. Home Trust is also required to meet a minimum Leverage ratio determined by OSFI. In addition, the declaration and payment of dividends by Home Trust to Home Capital are subject to restrictions under the Trust and Loan Companies Act (Canada). The regulatory capital position and Leverage ratio of Home Trust were as follows:
As at (Unaudited) September 30 June 30 December 31 National Regulatory 2019 2019 2018 Minimum
Regulated capital to risk-weighted assets Common equity tier 1 ratio 19.67% 19.49% 18.94% 7.00% Tier 1 capital ratio 19.67% 19.49% 18.93% 8.50% Total regulatory capital ratio 20.13% 19.96% 19.38% 10.50%
Leverage ratio 7.80% 7.77% 7.54% 3.00%
Home Trust’s Common Equity Tier 1, Total Tier 1 and Total capital ratios exceed OSFI’s regulatory targets, as well as Home Trust’s internal capital targets. The Leverage ratio also exceeds OSFI’s minimum requirements.

59
9. ACCUMULATED OTHER COMPREHENSIVE INCOME As at thousands of Canadian dollars (Unaudited) September 30 June 30 December 31 2019 2019 2018
Unrealized losses on
Equity securities designated at FVOCI $ (16,806) $ (16,408) $ (13,988)
Income tax recovery (4,474) (4,364) (3,725) (12,332) (12,044) (10,263)
Unrealized gains on
Debt instruments at FVOCI1 2,201 2,348 1,874
Income tax expense 577 624 490
1,624 1,724 1,384
Unrealized losses on
Cash flow hedges (1,259) (2,507) (2,174)
Income tax recovery (325) (666) (568) (934) (1,841) (1,606) Accumulated other comprehensive loss $ (11,642) $ (12,161) $ (10,485) 1Includes unrealized gains of $0.2 million ($0.5 million – June 30, 2019; $0.2 million – December 31, 2018) on debt securities and unrealized gains of $2.0 million ($1.8 million – June 30, 2019; $1.7 million – December 31, 2018) on retained interests.
10. PROVISIONS AND CONTINGENCIES In the ordinary course of business, the Company and its subsidiaries are involved in various legal actions. The Company establishes legal provisions when it becomes probable that the Company will incur a loss and the amount can be reliably estimated. In management’s opinion, based on its current knowledge and after consultation with counsel, the ultimate disposition of these actions, individually or in the aggregate, will not have a material adverse effect on the consolidated financial position of the Company. However, as there are uncertainties inherent in litigation advice, there is a possibility that the ultimate resolution of these actions may be material to the Company’s consolidated results of operations for any particular reporting period. The following provides an update to the Company’s material legal actions from what was disclosed in the 2018 Annual Report. Putative Class Action Related to Consumer HVAC Rental Equipment Financing In connection with the putative class action related to consumer HVAC rental equipment financing, subsequent to September 30, 2019, a decision was rendered in the plaintiff’s motions for certification and summary judgment. The Court certified certain aspects of the plaintiff’s claims. The Court held that this was not an appropriate case for summary judgment. There will be a trial on terms and timing to be fixed by the Court. Home Trust considers that it has good defences to the claims and intends to fully defend its conduct.
Claims by Shareholders Who Opted Out of Securities Class Action Settlement Related to Disclosure In connection with claims by shareholders who opted out of the securities class action settlement related to disclosure, Home Trust served and filed its statements of defence to the claims during the second and third quarters of 2019. Management’s current assessment is that it has good and valid defences to all three claims and the Company intends to fully defend its conduct.

60
11. FAIR VALUE OF FINANCIAL INSTRUMENTS
The amounts set out in the following tables represent the fair values of the Company's financial instruments. The valuation methods and assumptions are described below. The estimated fair value amounts approximate the price that would be received to sell an asset or paid to transfer a liability in an orderly transaction between market participants that are under no compulsion to act at the consolidated balance sheet date in the principal or most advantageous market that is accessible to the Company. For financial instruments carried at fair value that lack an active market, the Company applies present value and valuation techniques that use, to the greatest extent possible, observable market inputs. Because of the estimation process and the need to use judgement, the aggregate fair value amounts should not be interpreted as being necessarily realizable in an immediate settlement of the instruments. The Company uses the following hierarchy for determining and disclosing the fair value of financial instruments by valuation technique: Level 1: Significant inputs are quoted (unadjusted) prices in active markets for identical assets or liabilities. This level includes cash and cash equivalents, equity securities traded on the Toronto Stock Exchange and quoted corporate debt instruments. Level 2: Significant inputs are observable for the asset or liability, either directly or indirectly, and are not quoted prices included within Level 1. This level includes government-backed debt instruments, loans held for sale, interest rate swaps, total return swaps, bond forwards and certain corporate debt instruments. Level 3: Significant inputs are unobservable for the asset or liability. This level includes retained interest, certain corporate debt instruments, securitized and non-securitized mortgages and loans, securitization receivables and liabilities, other assets and liabilities, and deposits and liabilities arising from credit facilities. The following table presents the fair value of financial instruments across the levels of the fair value hierarchy. thousands of Canadian dollars (Unaudited) As at September 30, 2019 Level 1 Level 2 Level 3 Fair Value Carrying Value Financial assets at FVTPL Cash and cash equivalents $ 578,632 $ - $ - $ 578,632 $ 578,632 Debt securities - - 3,000 3,000 3,000 Loans held for sale - 131,722 - 131,722 131,722 Derivative assets - 28,253 - 28,253 28,253 Restricted assets 238,384 - - 238,384 238,384 Total financial assets at FVTPL 817,016 159,975 3,000 979,991 979,991 Financial assets at FVOCI Debt securities - 359,690 - 359,690 359,690 Equity securities (designated at FVOCI) 23,535 - - 23,535 23,535 Retained interest owned - - 115,974 115,974 115,974 Total financial assets at FVOCI 23,535 359,690 115,974 499,199 499,199 Financial assets at amortized cost Securitized mortgages - - 3,075,291 3,075,291 3,081,913 Non-securitized mortgages and loans - - 13,814,730 13,814,730 13,852,341 Restricted assets - 209,269 - 209,269 209,269 Securitization receivables - - 30,498 30,498 30,498 Other - - 108,456 108,456 108,456 Total financial assets at amortized cost - 209,269 17,028,975 17,238,244 17,282,477 Total $ 840,551 $ 728,934 $ 17,147,949 $ 18,717,434 $ 18,761,667 Financial liabilities at amortized cost Deposits $ - $ - $ 13,759,208 $ 13,759,208 $ 13,520,776 Securitization liabilities - - 3,333,610 3,333,610 3,325,084 Other - - 412,326 412,326 412,326 Total financial liabilities at amortized cost - - 17,505,144 17,505,144 17,258,186 Financial liabilities at FVTPL Derivative liabilities - 13,832 - 13,832 13,832 Total $ - $ 13,832 $ 17,505,144 $ 17,518,976 $ 17,272,018

61
11. FAIR VALUE OF FINANCIAL INSTRUMENTS (Continued)
thousands of Canadian dollars (Unaudited) As at June 30, 2019 Level 1 Level 2 Level 3 Fair Value Carrying Value Financial assets at FVTPL Cash and cash equivalents $ 470,732 $ - $ - $ 470,732 $ 470,732 Debt securities - - 3,000 3,000 3,000 Loans held for sale - 173,185 - 173,185 173,185 Derivative assets - 32,831 - 32,831 32,831 Restricted assets 261,862 - - 261,862 261,862 Total financial assets at FVTPL 732,594 206,016 3,000 941,610 941,610 Financial assets at FVOCI Debt securities - 360,001 - 360,001 360,001 Equity securities (designated at FVOCI) 23,933 - - 23,933 23,933 Retained interest owned - - 112,668 112,668 112,668 Total financial assets at FVOCI 23,933 360,001 112,668 496,602 496,602 Financial assets at amortized cost Securitized mortgages - - 2,613,422 2,613,422 2,623,844 Non-securitized mortgages and loans - - 13,990,192 13,990,192 13,982,231 Restricted assets - 150,006 - 150,006 150,006 Securitization receivables - - 40,815 40,815 40,815 Other - - 108,566 108,566 108,566 Total financial assets at amortized cost - 150,006 16,752,995 16,903,001 16,905,462 Total $ 756,527 $ 716,023 $ 16,868,663 $ 18,341,213 $ 18,343,674 Financial liabilities at amortized cost Deposits $ - $ - $ 13,694,507 $ 13,694,507 $ 13,514,411 Securitization liabilities - - 2,801,181 2,801,181 2,789,643 Other - - 532,873 532,873 532,873 Total financial liabilities at amortized cost - - 17,028,561 17,028,561 16,836,927 Financial liabilities at FVTPL Derivative liabilities - 14,079 - 14,079 14,079 Total $ - $ 14,079 $ 17,028,561 $ 17,042,640 $ 16,851,006 thousands of Canadian dollars (Unaudited) As at December 31, 2018 Level 1 Level 2 Level 3 Fair Value Carrying Value Financial assets at FVTPL Cash and cash equivalents $ 665,947 $ - $ - $ 665,947 $ 665,947 Loans held for sale - 130,351 - 130,351 130,351 Derivative assets - 8,925 - 8,925 8,925 Restricted assets 262,215 - - 262,215 262,215 Total financial assets at FVTPL 928,162 139,276 - 1,067,438 1,067,438 Financial assets at FVOCI Debt securities - 359,981 - 359,981 359,981 Equity securities (designated at FVOCI) 26,352 - - 26,352 26,352 Retained interest owned - - 108,445 108,445 108,445 Total financial assets at FVOCI 26,352 359,981 108,445 494,778 494,778 Financial assets at amortized cost Securitized mortgages - - 2,771,406 2,771,406 2,799,931 Non-securitized mortgages and loans - - 13,338,215 13,338,215 13,412,765 Restricted assets - 46,990 - 46,990 46,990 Securitization receivables - - 56,706 56,706 56,706 Other - - 92,751 92,751 92,751 Total financial assets at amortized cost - 46,990 16,259,078 16,306,068 16,409,143 Total $ 954,514 $ 546,247 $ 16,367,523 $ 17,868,284 $ 17,971,359 Financial liabilities at amortized cost Deposits $ - $ - $ 13,003,402 $ 13,003,402 $ 12,977,090 Securitization liabilities - - 2,859,905 2,859,905 2,859,326 Other - - 599,850 599,850 599,850 Total financial liabilities at amortized cost - - 16,463,157 16,463,157 16,436,266 Financial liabilities at FVTPL Derivative liabilities - 35,975 - 35,975 35,975 Total $ - $ 35,975 $ 16,463,157 $ 16,499,132 $ 16,472,241

62
11. FAIR VALUE OF FINANCIAL INSTRUMENTS (Continued)
The Company did not transfer any financial instrument from Level 1 or Level 2 to Level 3 of the fair value hierarchy during the quarters ended September 30, 2019, June 30, 2019 or September 30, 2018. The following methods and assumptions were used to estimate the fair values of financial instruments:
• The fair value of cash and cash equivalents, restricted assets, other assets and other liabilities approximate their carrying values due to their short-term nature.
• Debt and equity securities are generally valued based on the quoted bid price. Third-party MBS are fair valued using average dealer quoted prices.
• Fair value of loans held for sale, all of which are insured, is determined by discounting the expected future cash flows of the loans at current market rates imputed by the realized sale of loans with similar terms.
• The fair value of the retained interest is determined by discounting the expected future cash flows using the current MBS spread over Government of Canada bonds imputed from recent sale transactions.
• The fair value of securitization receivables is determined by discounting the expected future cash flows using current interest rate swap rates.
• Securitized and non-securitized mortgages and loans are carried at amortized cost in the financial statements. For fair value disclosures, the fair value is estimated by discounting the expected future cash flows of the loans, adjusting for credit risk and prepayment assumptions at current market rates for offered loans with similar terms.
• Fair value of derivative financial instruments represents point-in-time estimates that may change in subsequent reporting periods due to market conditions or other factors. The fair value of derivatives is determined from swap curves adjusted for credit risks. Swap curves are obtained directly from market sources or calculated from market prices.
• Retail deposits are not transferable by the deposit holders. In the absence of such transfer transactions, fair value of deposits is determined by discounting the expected future cash flows of the deposits at offered rates for deposits with similar terms.
• Fair value of securitization liabilities is determined using their correspondent current market rates including market rates for MBS, CMB and the interest rate swap curve.
12. RISK MANAGEMENT
The Company is exposed to various types of risk owing to the nature of the business activities it carries on. Types of risk to which the Company is subject include capital adequacy, credit, market, liquidity and funding, operational, compliance, strategic and reputational risk. The Company has adopted enterprise risk management (ERM) as a discipline for managing risk. The Company’s ERM structure is supported by a governance framework that includes policies, management standards, guidelines, procedures and limits appropriate to each business activity. The policies are reviewed and approved annually by the Board. A description of the Company’s risk management policies and procedures is included in the shaded text of the Risk Management section of the Management’s Discussion and Analysis included in this report. Significant exposures to credit and liquidity risks are described in Notes 4 and 5.

63
HOME CAPITAL GROUP INC. 145 King Street West, Suite 2300 Toronto, Ontario M5H 1J8
Auditors Ernst & Young LLP Toronto, Ontario
Transfer Agent Computershare Investor Services Inc. 100 University Avenue Toronto, Ontario M5J 2Y1 Tel: 1-800-564-6253
Capital Stock As at September 30, 2019 there were 57,331,014 Common Shares outstanding. Stock Listing Toronto Stock Exchange, Ticker Symbol: HCG Options Listing Montreal Stock Exchange, Ticker Symbol: HCG
BRANCHES Toronto 145 King Street West, Suite 2300 Toronto, Ontario M5H IJ8 Tel: (416) 360-4663 1-800-990-7881 Fax: (416) 363-7611 1-888-470-2092 Calgary 517-10th Avenue SW Calgary, Alberta T2R 0A8 Tel: (403) 244-2432 1-866-235-3081 Fax: (403) 244-6542 1-866-544-3081 Vancouver 200 Granville Street, Suite 1288 Vancouver, B.C. V6C 1S4 Tel: (604) 484-4663 1-866-235-3080 Fax: (604) 484-4664 1-866-564-3524
Halifax 1949 Upper Water Street, Suite 101 Halifax, Nova Scotia B3J 3N3 Tel: (902) 422-4387 1-888-306-2421 Fax: (902) 422-8891 1-888-306-2435 Montreal 2020 Boulevard Robert-Bourassa Suite 2420 Montreal, Quebec H3A 2A5 Tel: (514) 843-0129 1-866-542-0129 Fax: (514) 843-7620 1-866-620-7620 Winnipeg 201 Portage Avenue Suite 830 Winnipeg, Manitoba R3B 3K6 Tel: (204) 220-3400 Fax: (204) 942-1638
For Shareholder Information, Please Contact: Mark Hemingway General Counsel and Corporate Secretary Home Capital Group Inc. 145 King Street West, Suite 2300 Toronto, Ontario M5H 1J8 Tel: (416) 360-4663 Fax: (416) 363-7611 Email:[email protected] Websites Home Capital Group Inc. www.homecapital.com Home Trust Company www.hometrust.ca Quarterly Conference Call and Webcast Our quarterly conference call and live audio webcast with management will take place on Wednesday, November 13, 2019 at 8:00 AM ET. The webcast will be archived at www.homecapital.com for 90 days.
Investor Information Service Home Capital Group Inc. has established an e-mail investor information service. Sign up at www.homecapital.com to receive quarterly reports, press releases, the annual report, the management information circular, and other information pertaining to the Company.
OAKEN FINANCIAL STORES Toronto 145 King Street West Concourse Level Toronto, Ontario M5H IJ8 Calgary 517-10th Avenue SW Calgary, Alberta T2R 0A8
Vancouver 200 Granville Street Suite 1288 Vancouver, British Columbia V6C 1S4
Tel: 855-OAKEN-22 (625-3622) Email: [email protected]
CORPORATE DIRECTORY & SHAREHOLDER INFORMATION