
First Quarter Economic Report 2018
159
Press Release (embargoed until 4:30 p.m. on 11 May 2018) Economic Situation in the First Quarter of 2018 and Latest GDP and Price Forecasts for 2018 The Government released today (11 May) the First Quarter Economic Report 2018, together with the preliminary figures on Gross Domestic Product (GDP) for the first quarter of 2018. Government Economist, Mr Andrew Au, described the economic situation in the first quarter of 2018 and provided the latest GDP and price forecasts for 2018. Main points * The Hong Kong economy turned in a robust growth of 4.7% over a year earlier in the first quarter of 2018, sustaining the full-fledged upturn in 2017. External demand picked up as the global economy maintained broad-based momentum. Domestic demand also strengthened, buttressed by favourable labour market conditions and positive business sentiment. On a seasonally adjusted quarter-to-quarter comparison, real GDP grew notably by 2.2% in the first quarter. * Total exports of goods grew strongly by 5.2% year-on-year in real terms in the first quarter, as the upswing in global investment and trade translated into booming production and trading activities in Asia. Exports of services likewise accelerated to show broad-based growth of 7.5% year-on-year in real terms, bolstered by a strong recovery in inbound tourism, active global financial market activities and buoyant regional trade flows. * Domestic demand continued to strengthen. Private consumption expenditure grew notably by 8.6% year-on-year in real terms in the first quarter, reflecting optimistic consumer sentiment on the back of favourable job and income as well as asset market conditions. Overall investment expenditure registered further real year-on-year growth of 3.8%, amid notable growth in machinery and equipment acquisition as well as modest expansion in building and construction activity. * The labour market remained tight. The seasonally adjusted unemployment rate stayed at a 20-year low of 2.9% in the first quarter, while the underemployment rate showed a further decline. Total employment continued to record sturdy growth. In tandem, wages and earnings registered further real improvements, with more notable increases in the lower-skilled segments of the labour market. * The local stock market was bullish on entering 2018, but experienced corrections in the latter part of the first quarter amid a firmer outlook for gradual US interest rate hikes and intensified concerns over the global trading environment. Separately, the residential property market remained buoyant, with flat prices rising further amid active trading. LC Paper No. CB(1)943/17-18(01)
-
Upload
khangminh22 -
Category
Documents
-
view
0 -
download
0
Transcript of First Quarter Economic Report 2018
Press Release (embargoed until 4:30 p.m. on 11 May 2018)
Economic Situation in the First Quarter of 2018
and Latest GDP and Price Forecasts for 2018
The Government released today (11 May) the First Quarter Economic Report 2018, together with the preliminary figures on Gross Domestic Product (GDP) for the first quarter of 2018. Government Economist, Mr Andrew Au, described the economic situation in the first quarter of 2018 and provided the latest GDP and price forecasts for 2018. Main points * The Hong Kong economy turned in a robust growth of 4.7% over a year earlier
in the first quarter of 2018, sustaining the full-fledged upturn in 2017. External demand picked up as the global economy maintained broad-based momentum. Domestic demand also strengthened, buttressed by favourable labour market conditions and positive business sentiment. On a seasonally adjusted quarter-to-quarter comparison, real GDP grew notably by 2.2% in the first quarter.
* Total exports of goods grew strongly by 5.2% year-on-year in real terms in the first quarter, as the upswing in global investment and trade translated into booming production and trading activities in Asia. Exports of services likewise accelerated to show broad-based growth of 7.5% year-on-year in real terms, bolstered by a strong recovery in inbound tourism, active global financial market activities and buoyant regional trade flows.
* Domestic demand continued to strengthen. Private consumption expenditure grew notably by 8.6% year-on-year in real terms in the first quarter, reflecting optimistic consumer sentiment on the back of favourable job and income as well as asset market conditions. Overall investment expenditure registered further real year-on-year growth of 3.8%, amid notable growth in machinery and equipment acquisition as well as modest expansion in building and construction activity.
* The labour market remained tight. The seasonally adjusted unemployment rate stayed at a 20-year low of 2.9% in the first quarter, while the underemployment rate showed a further decline. Total employment continued to record sturdy growth. In tandem, wages and earnings registered further real improvements, with more notable increases in the lower-skilled segments of the labour market.
* The local stock market was bullish on entering 2018, but experienced corrections in the latter part of the first quarter amid a firmer outlook for gradual US interest rate hikes and intensified concerns over the global trading environment. Separately, the residential property market remained buoyant, with flat prices rising further amid active trading.
LC Paper No. CB(1)943/17-18(01)
- 2 -
* Looking ahead, the broad-based momentum in the global economy is likely to continue in 2018. The Mainland economy should stay on a robust growth track in 2018 following the strong performance in the first quarter. The US economy is also expected to see faster growth this year as the stimulating effect of the expansionary fiscal policy kicks in. In the euro area and Japan, recent indicators point to further moderate economic growth. The strengthening global demand should be conducive to manufacturing and trading activities in Asia, to the benefit of Hong Kong’s exports. Further improvement in inbound tourism should also render additional support to Hong Kong’s exports of services. However, external uncertainties have increased of late. Of particular concern are the trade tensions between the US and its trading partners, notably the Mainland, for their potential adverse impacts on global trade flows and investor sentiment. Separately, the evolving global financial conditions amid the expected US rate hikes also warrant close attention.
* Domestic demand should continue to stay resilient. Local consumption sentiment is likely to be well underpinned by favourable job and income conditions. The latest Quarterly Business Tendency Survey indicated that large enterprises have turned more upbeat about their near-term business outlook. Ongoing infrastructure works and the measures in the 2018/19 Budget (the Budget) should provide further growth impetus to the economy.
* The actual growth outturn of the Hong Kong economy in the first quarter was stronger than expected. Nonetheless, considering the increased uncertainties in the external environment, particularly on the trade and financial fronts, the forecast real GDP growth of 3-4% for 2018, as announced in the Budget, is maintained in the current round of review. The Government will continue to closely monitor developments on the external and local fronts.
* Inflation pressures have generally been moderate. Underlying consumer price inflation went up to 2.4% in the first quarter, due to favourable global and local economic situations as well as some temporary factors. Looking ahead, the robust economic conditions, if continued, are likely to exert some upward pressures on inflation over the course of 2018, though the inflation rate for the year as a whole should remain moderate. As the outturn in inflation so far has largely been in line with expectations, the forecast rates of underlying and headline consumer price inflation for 2018 as a whole put out in the Budget, at 2.5% and 2.2% respectively, are maintained in the current round of review.

- 3 -
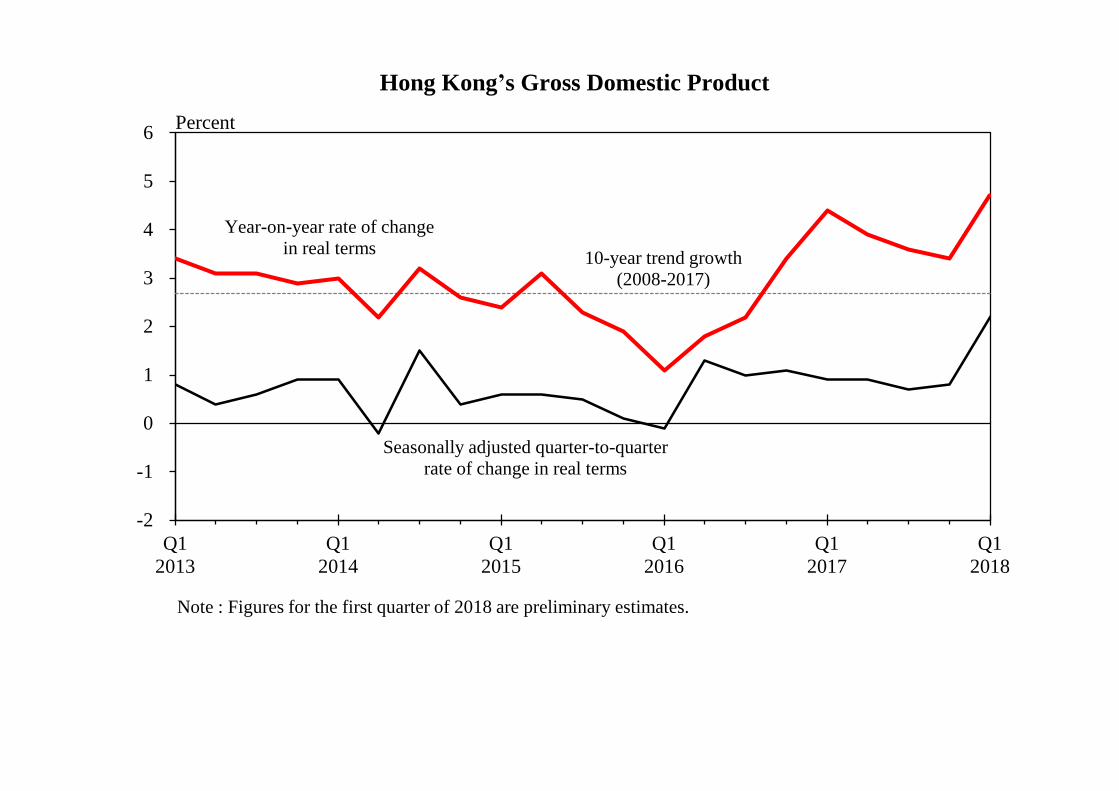
Details GDP According to the preliminary data on the Gross Domestic Product (GDP) released today by the Census and Statistics Department, GDP grew notably by 4.7% in real terms in the first quarter of 2018 over a year earlier, up from 3.4% in the preceding quarter (same as the earlier estimate), marking the sixth consecutive quarter of growth above the trend growth rate of 2.7% per annum in the past ten years. On a seasonally adjusted quarter-to-quarter comparison, real GDP surged by 2.2% in the first quarter, up from 0.8% in the preceding quarter (same as the earlier estimate) (Chart). 2. The latest figures on GDP and its major expenditure components up to the first quarter of 2018 are presented in Table 1. Developments in different segments of the economy in the first quarter of 2018 are described below. External trade 3. Total exports of goods picked up to show notable year-on-year growth of 5.2% in real terms in the first quarter, from that of 3.4% in the preceding quarter. This was broadly similar to the growth of 5.9% for 2017 as a whole. Analysed by major market, with reference to external merchandise trade statistics, exports to Asian markets as a whole continued to show robust growth, on the back of buoyant manufacturing activities in the region that generated solid demand for exports of raw materials and semi-manufactures. In particular, exports to the Mainland saw a visible acceleration in growth. Also, exports to the US and the EU increased sizably, thanks to sustained improvement in final demand in these economies. On a seasonally adjusted quarter-to-quarter basis, total exports of goods grew by 3.1% in real terms in the first quarter. 4. Exports of services likewise displayed strength in the first quarter, with broad-based growth of 7.5% in real terms over a year earlier, up from 3.9% growth in the preceding quarter and 3.2% growth for 2017 as a whole. Exports of travel services strengthened to show double-digit growth, reflecting the strong recovery of inbound tourism. Notwithstanding the somewhat more volatile financial markets in the first quarter, the solid momentum in the global economy underpinned active financial market activities, resulting in sizable growth in exports of financial services. Exports of transport services expanded solidly amid vibrant regional trade flows, while exports of business and other services grew modestly. On a seasonally adjusted quarter-to-quarter basis, exports of services continued to rise, by 4.8% in real terms in the first quarter.
- 4 -
Domestic sector 5. The domestic sector continued to strengthen in the first quarter. Private consumption expenditure grew markedly by 8.6% in real terms over a year earlier. Consumer sentiment was firmly supported by favourable job and income conditions as well as wealth effect resulting from the buoyant asset markets. On a seasonally adjusted quarter-to-quarter comparison, private consumption expenditure increased by 3.1% in real terms in the first quarter. Government consumption expenditure continued to grow steadily by 3.9% year-on-year in the first quarter, following a 3.2% growth in the preceding quarter. 6. Overall investment spending in terms of gross domestic fixed capital formation increased further by 3.8% year-on-year in real terms in the first quarter, following growth of 3.5% in 2017. Thanks to the sustained upturn in the global economy, local business sentiment was broadly positive in early 2018. This, together with the sizable increase in purchases by the public sector, rendered a notable year-on-year increase in overall machinery and equipment acquisition. Overall building and construction activity saw modest growth in the first quarter, backed by the expansion in public building and construction works. Costs of ownership transfer showed a double-digit increase as property market transactions went up visibly over a year earlier. The labour sector 7. The labour market remained tight, with the seasonally adjusted unemployment rate staying at a 20-year low of 2.9% in the first quarter of 2018. The underemployment rate edged down to 1.0%, the lowest level in over 20 years. Total employment continued to grow sturdily over a year earlier. In tandem, wages and earnings registered further year-on-year improvements in real terms, with more notable increases in the lower-skilled segments of the labour market. The asset markets 8. The local stock market was bullish on entering 2018, but experienced corrections in the latter part of the first quarter amid a firmer outlook for gradual US interest rate hikes and intensified concerns over the global trading environment. The Hang Seng Index closed the first quarter at 30 093, up by only 0.6% from end-2017 and down by 9.2% from its peak in late January. On 10 May, the Hang Seng Index closed at 30 809.
- 5 -
9. The residential property market remained buoyant in the first quarter of 2018. While trading volume was 8% lower than the fervent level in the preceding quarter, it was 14% higher than a year ago. Residential property prices increased by 4% between December 2017 and March 2018. Overall flat prices in March 2018 exceeded the 1997 peak by 113%, and the housing affordability ratio worsened to around 71% in the first quarter. Flat rentals rose by 1% during the first quarter. In contrast, office rentals stayed virtually flat over the same period, while those for retail premises fell by 1%. Prices 10. Consumer price inflation was moderate in the first quarter, though going up somewhat on the back of strong economic growth as well as some temporary factors. Locally, labour cost pressure was held in check on a unit cost basis, as rises in wages and earnings were largely matched with concurrent growth in labour productivity. Commercial rental cost pressure was contained in general, while the increase in fresh-letting residential rentals over the past year or so continued to feed through gradually to consumer price inflation. External price pressures also remained moderate, only edging up slightly due to the weaker US dollar over the past year and mildly higher inflation in some major import sources amid the global economic upturn. Overall, netting out the effects of the Government’s one-off relief measures, underlying consumer price inflation was 2.4% in the first quarter, up from 1.6% in the preceding quarter. Headline consumer price inflation rose to 2.4% from 1.6% in parallel. Latest GDP and price forecasts for 2018 11. Looking ahead, the broad-based momentum in the global economy is likely to continue in 2018. The Mainland economy should stay on a robust growth track in 2018 following the strong performance in the first quarter. The US economy is also expected to see faster growth this year as the stimulating effect of the expansionary fiscal policy kicks in. In the euro area and Japan, recent indicators point to further moderate economic growth. The strengthening global demand should be conducive to manufacturing and trading activities in Asia, to the benefit of Hong Kong’s exports. Further improvement in inbound tourism should also render additional support to Hong Kong’s exports of services. However, external uncertainties have increased of late. Of particular concern are the trade tensions between the US and its trading partners, notably the Mainland, for their potential adverse impacts on global trade flows and investor sentiment. Separately, the evolving global financial conditions amid the expected US rate hikes also warrant close attention.
- 6 -
12. Domestic demand should continue to stay resilient. Local consumption sentiment is likely to be well underpinned by favourable job and income conditions. The latest Quarterly Business Tendency Survey indicated that large enterprises have turned more upbeat about their near-term business outlook. Ongoing infrastructure works and the measures in the Budget should provide further growth impetus to the economy.
13. The actual growth outturn of the Hong Kong economy in the first quarter was stronger than expected. Nonetheless, considering the increased uncertainties in the external environment, particularly on the trade and financial fronts, the forecast real GDP growth of 3-4% for 2018, as announced in the Budget, is maintained in the current round of review (Table 2). The Government will continue to closely monitor developments on the external and local fronts. For reference, the latest forecasts by private sector analysts mostly range from 2.8-3.5%, averaging around 3.1%.
14. On inflation outlook, the robust economic conditions, if continued, are likely to exert some upward pressures on inflation over the course of 2018, though the inflation rate for the year as a whole should remain moderate. As the outturn in inflation so far has largely been in line with expectations, the forecast rates of underlying and headline consumer price inflation for 2018 as a whole put out in the Budget, at 2.5% and 2.2% respectively, are maintained in the current round of review (Table 2).
(The First Quarter Economic Report 2018 is now available for online download, free of charge at www.hkeconomy.gov.hk/en/reports/index.htm. The Report of the Gross Domestic Product, First Quarter 2018, which contains the GDP figures up to the first quarter of 2018, is also available for online download, free of charge at the homepage of the Census and Statistics Department, www.censtatd.gov.hk.)
Q12013
Q12014
Q12015
Q12016
Q12017
Q12018
-2
-1
0
1
2
3
4
5
6 Percent
Year-on-year rate of changein real terms
Seasonally adjusted quarter-to-quarterrate of change in real terms
Hong Kongʼs Gross Domestic Product
Note : Figures for the first quarter of 2018 are preliminary estimates.
10-year trend growth(2008-2017)
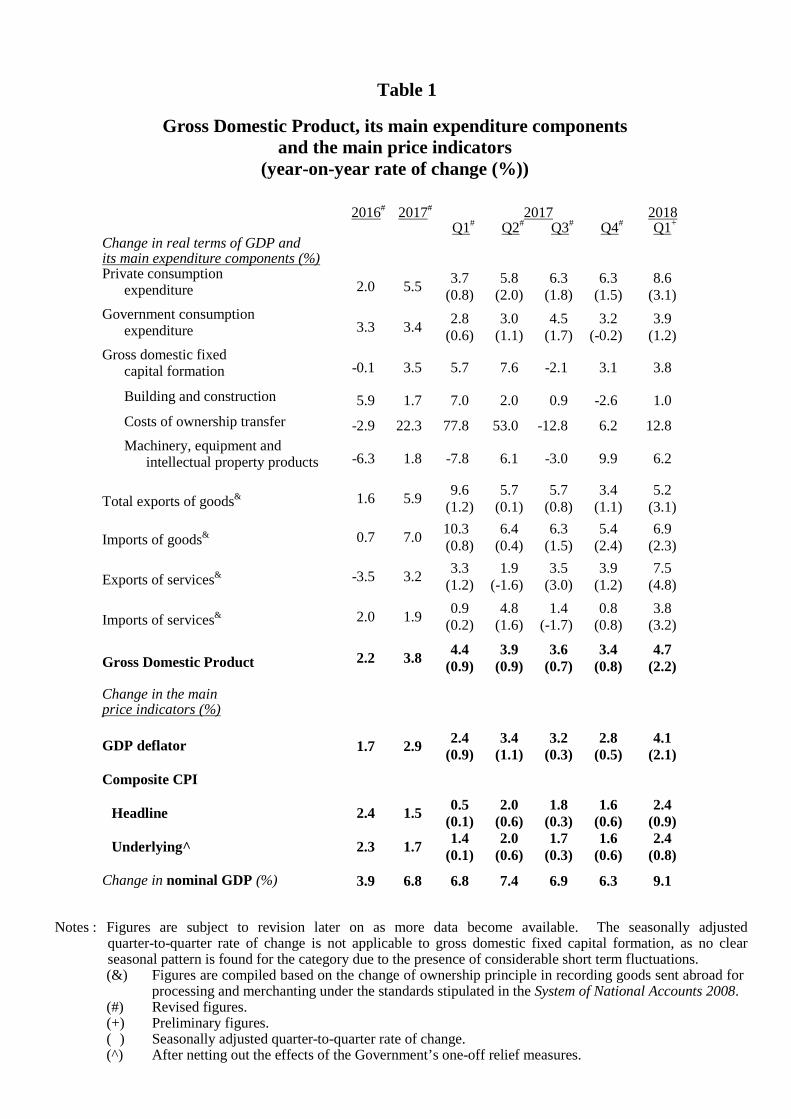
Table 1
Gross Domestic Product, its main expenditure components and the main price indicators
(year-on-year rate of change (%))
2016# 2017# 2017 2018 Q1# Q2# Q3# Q4# Q1+ Change in real terms of GDP and its main expenditure components (%)
Private consumption expenditure 2.0 5.5 3.7
(0.8) 5.8
(2.0) 6.3
(1.8) 6.3
(1.5) 8.6
(3.1) Government consumption expenditure 3.3 3.4 2.8
(0.6) 3.0
(1.1) 4.5
(1.7) 3.2
(-0.2) 3.9
(1.2) Gross domestic fixed capital formation -0.1 3.5 5.7 7.6 -2.1 3.1 3.8
Building and construction 5.9 1.7 7.0 2.0 0.9 -2.6 1.0 Costs of ownership transfer -2.9 22.3 77.8 53.0 -12.8 6.2 12.8 Machinery, equipment and intellectual property products -6.3 1.8 -7.8 6.1 -3.0 9.9 6.2
Total exports of goods& 1.6 5.9 9.6 (1.2)
5.7 (0.1)
5.7 (0.8)
3.4 (1.1)
5.2 (3.1)
Imports of goods& 0.7 7.0 10.3 (0.8)
6.4 (0.4)
6.3 (1.5)
5.4 (2.4)
6.9 (2.3)
Exports of services& -3.5 3.2 3.3 (1.2)
1.9 (-1.6)
3.5 (3.0)
3.9 (1.2)
7.5 (4.8)
Imports of services& 2.0 1.9 0.9 (0.2)
4.8 (1.6)
1.4 (-1.7)
0.8 (0.8)
3.8 (3.2)
Gross Domestic Product 2.2 3.8 4.4 (0.9)
3.9 (0.9)
3.6 (0.7)
3.4 (0.8)
4.7 (2.2)
Change in the main price indicators (%)
GDP deflator 1.7 2.9 2.4 (0.9)
3.4 (1.1)
3.2 (0.3)
2.8 (0.5)
4.1 (2.1)
Composite CPI
Headline 2.4 1.5 0.5 (0.1)
2.0 (0.6)
1.8 (0.3)
1.6
(0.6) 2.4
(0.9)
Underlying^ 2.3 1.7 1.4 (0.1)
2.0 (0.6)
1.7 (0.3)
1.6 (0.6)
2.4 (0.8)
Change in nominal GDP (%) 3.9 6.8 6.8 7.4 6.9 6.3 9.1 Notes : Figures are subject to revision later on as more data become available. The seasonally adjusted
quarter-to-quarter rate of change is not applicable to gross domestic fixed capital formation, as no clear seasonal pattern is found for the category due to the presence of considerable short term fluctuations.
(&) Figures are compiled based on the change of ownership principle in recording goods sent abroad for processing and merchanting under the standards stipulated in the System of National Accounts 2008.
(#) Revised figures. (+) Preliminary figures. (+) Seasonally adjusted quarter-to-quarter rate of change. (^) After netting out the effects of the Government’s one-off relief measures.
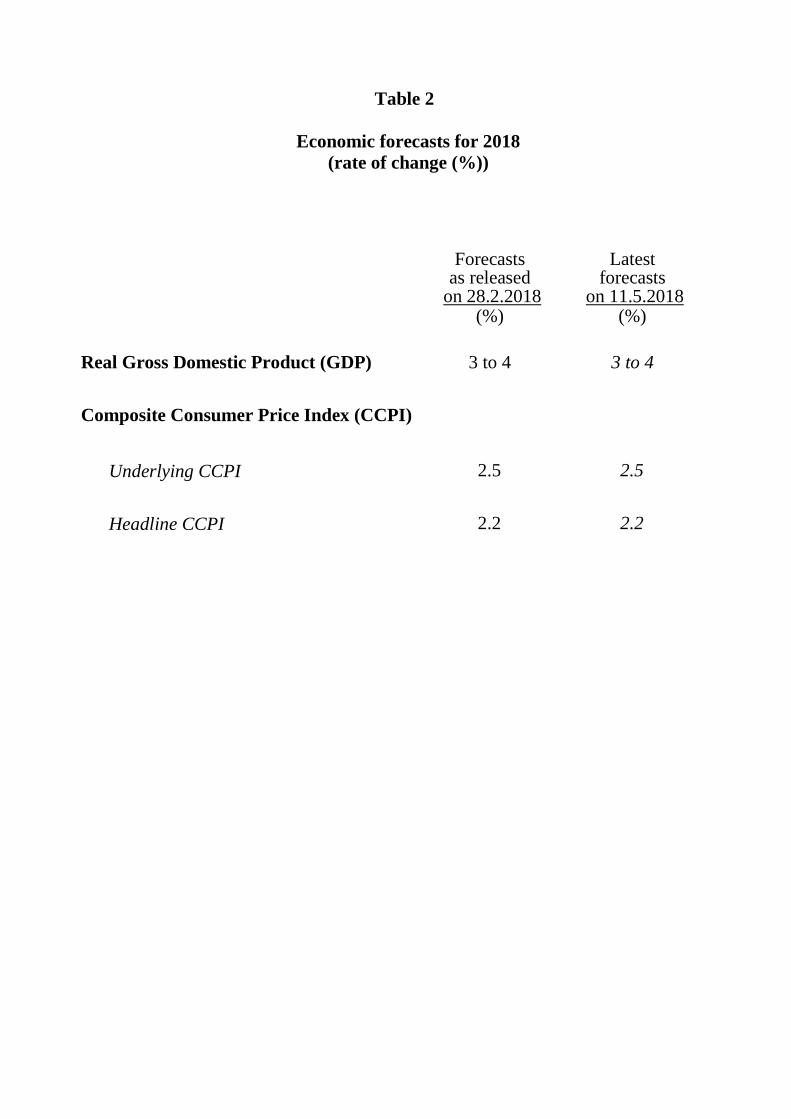
Table 2
Economic forecasts for 2018 (rate of change (%))
Forecasts as released
on 28.2.2018
Latest forecasts
on 11.5.2018 (%) (%)
Real Gross Domestic Product (GDP) 3 to 4 3 to 4 Composite Consumer Price Index (CCPI)
Underlying CCPI 2.5 2.5
Headline CCPI 2.2 2.2
FIRST QUARTER ECONOMIC REPORT 2018
OFFICE OF THE GOVERNMENT ECONOMIST FINANCIAL SECRETARY’S OFFICE
GOVERNMENT OF THE HONG KONG SPECIAL ADMINISTRATIVE REGION
May 2018

CONTENTS
Paragraphs CHAPTER 1 : OVERVIEW OF ECONOMIC PERFORMANCE
Overall situation 1.1 - 1.3 The external sector 1.4 - 1.5 The domestic sector 1.6 - 1.7 The labour sector 1.8 The asset markets 1.9 - 1.10 Inflation 1.11 - 1.12 GDP by major economic sector 1.13 Other economic developments 1.14 - 1.17 Box 1.1 Business sentiment in Hong Kong Box 1.2 A snapshot of micro enterprises in Hong Kong
CHAPTER 2 : THE EXTERNAL SECTOR
Goods trade Total exports of goods 2.1 - 2.5 Imports of goods 2.6 Services trade Exports of services 2.7 Imports of services 2.8 Goods and services balance 2.9 Other developments 2.10 - 2.13 Box 2.1 Recent labour market and inflation situations in the US Box 2.2 Hong Kong’s current account: Some salient observations
CHAPTER 3 : DEVELOPMENTS IN SELECTED SECTORS
Property 3.1 - 3.13 Land 3.14 Tourism 3.15 - 3.17 Logistics 3.18 - 3.19 Transport 3.20 Innovation and technology 3.21 Environment 3.22 - 3.23
CHAPTER 4 : THE FINANCIAL SECTOR
Interest rates and exchange rates 4.1 - 4.5 Money supply and banking sector 4.6 - 4.10 The debt market 4.11 - 4.13 The stock and derivatives markets 4.14 - 4.20 Fund management and investment funds 4.21 Insurance sector 4.22 Highlights of policy and market developments 4.23

CHAPTER 5 : THE LABOUR SECTOR
Overall labour market situation 5.1 Labour force and total employment 5.2 - 5.3 Profile of unemployment 5.4 - 5.8 Profile of underemployment 5.9 Profile of employment in establishments 5.10 - 5.11 Vacancies 5.12 - 5.16 Wages and earnings 5.17 - 5.21 Highlights of labour-related measures and policy developments 5.22 - 5.23 Box 5.1 Business performance and operating situation of low paying sectors in 2016 CHAPTER 6 : PRICES
Consumer prices 6.1 - 6.3 Costs of factor inputs and import prices 6.4 - 6.5 Output prices 6.6 GDP deflator 6.7 STATISTICAL APPENDIX
1
CHAPTER 1 : OVERVIEW OF ECONOMIC PERFORMANCE Summary Following the full-fledged upturn in 2017, the Hong Kong economy stayed
vibrant in the first quarter of 2018, turning in a robust growth of 4.7% over a year earlier. External demand picked up as the global economy sustained broad-based momentum. Domestic demand also strengthened, buttressed by favourable labour market conditions and positive business sentiment.
Total exports of goods grew strongly in the first quarter as the upswing in global investment and trade translated into booming production and trading activities in Asia. Exports of services also picked up visibly, with an extra boost from a strong recovery in inbound tourism and active global financial market activities. Lately, increased trade tensions between the US and the Mainland have clouded the external trade outlook. The developments down the road are still uncertain and need to be monitored closely.
Domestic demand continued to strengthen in the first quarter. Private consumption expenditure grew notably, reflecting generally optimistic consumer sentiment on the back of stronger income and asset market conditions. Overall investment expenditure registered further growth, amid notable growth in machinery and equipment acquisition as well as modest expansion in building and construction activity.
The labour market was tight. The seasonally adjusted unemployment rate stayed at a 20-year low of 2.9% in the first quarter, while the underemployment rate showed a further decline. Total employment continued to record sturdy growth. In tandem, wages and earnings continued to register real improvements.
The local stock market was bullish on entering 2018, but experienced corrections in the latter part of the first quarter amid a firmer outlook for gradual US interest rate hikes and intensified concerns over the global trading environment. Separately, the residential property market remained buoyant, with flat prices rising further amid active trading.
Consumer price inflation was moderate in the first quarter, though going up somewhat due partly to favourable global and local economic situations and partly to some temporary factors. Local cost pressures stayed largely in check. External price pressures also remained moderate, though import prices picked up slightly given the weakness in the US dollar over the past year and the mild acceleration in inflation in some of our major import sources.

2
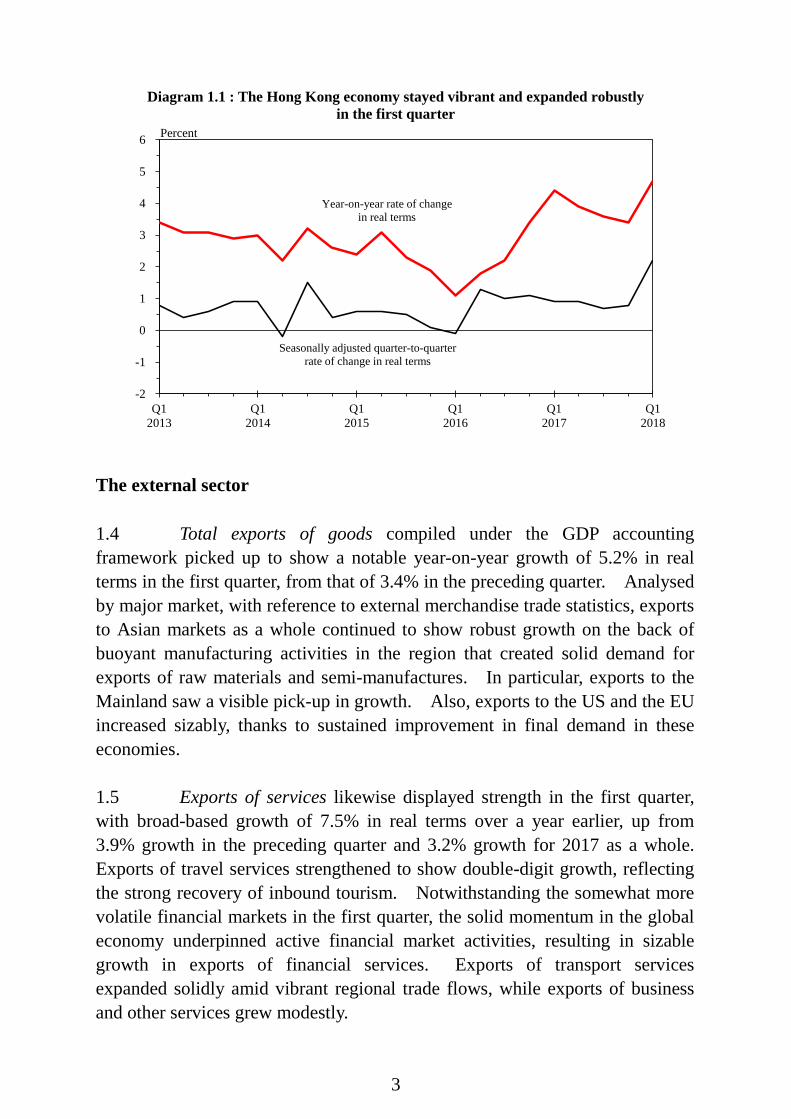
Overall situation 1.1 The Hong Kong economy stayed vibrant, expanding notably by 4.7% in the first quarter of 2018 over a year earlier and strengthening from its 3.8% growth rate in 2017. With the global economy maintaining its broad-based momentum, there was strong external demand for Hong Kong’s exports, which grew robustly in the first quarter. The continued expansion of trade flows, together with the strong recovery of inbound tourism and active global financial market activities, also saw exports of services register faster growth. Domestically, private consumption expenditure continued to display strength as consumer sentiment was well anchored by favourable labour market conditions. Overall investment expenditure grew moderately, supported by notable increases in machinery and equipment acquisition, active property transactions, and modest expansion in building and construction activity. Meanwhile, business sentiment stayed generally positive. The labour market remained tight, with strong employment growth and solid increases in wages and earnings. Consumer price inflation was moderate, though going up somewhat from the preceding quarter due to strengthening economic conditions as well as certain temporary factors. 1.2 While the expansion of the global economy has become more established, as reflected in the latest forecasts by the International Monetary Fund (IMF) in mid-April(1), there are still uncertainties prevailing in the external environment. In the first quarter, all major economies continued to perform well. The strength in the US economy, fanned by fiscal expansion by the US government in the form of tax cuts, not only prompted the Federal Reserve to raise the Federal Funds Rate again in March, but also firmed up market expectations of further US interest rate hikes going forward. The shift in market expectations on the pace of US interest rate normalisation increased the volatility in financial markets worldwide. The local stock market also experienced corrections in the latter part of the first quarter. More recently, trade tensions between the US and the Mainland have increased and become a key source of uncertainty surrounding the external trading environment. 1.3 In the first quarter of 2018, Gross Domestic Product (GDP)(2) grew notably by 4.7% in real terms over a year earlier, up from 3.4% growth in the preceding quarter (same as the earlier estimate), marking the sixth consecutive quarter of growth above the trend growth rate of 2.7% per annum in the past ten years. On a seasonally adjusted quarter-to-quarter comparison(3), real GDP surged by 2.2% in the first quarter, up from 0.8% in the preceding quarter (same as the earlier estimate).
3
Q12013
Q12014
Q12015
Q12016
Q12017
Q12018
-2
-1
0
1
2
3
4
5
6 Percent
Year-on-year rate of changein real terms
Seasonally adjusted quarter-to-quarterrate of change in real terms
Diagram 1.1 : The Hong Kong economy stayed vibrant and expanded robustly in the first quarter
The external sector 1.4 Total exports of goods compiled under the GDP accounting framework picked up to show a notable year-on-year growth of 5.2% in real terms in the first quarter, from that of 3.4% in the preceding quarter. Analysed by major market, with reference to external merchandise trade statistics, exports to Asian markets as a whole continued to show robust growth on the back of buoyant manufacturing activities in the region that created solid demand for exports of raw materials and semi-manufactures. In particular, exports to the Mainland saw a visible pick-up in growth. Also, exports to the US and the EU increased sizably, thanks to sustained improvement in final demand in these economies. 1.5 Exports of services likewise displayed strength in the first quarter, with broad-based growth of 7.5% in real terms over a year earlier, up from 3.9% growth in the preceding quarter and 3.2% growth for 2017 as a whole. Exports of travel services strengthened to show double-digit growth, reflecting the strong recovery of inbound tourism. Notwithstanding the somewhat more volatile financial markets in the first quarter, the solid momentum in the global economy underpinned active financial market activities, resulting in sizable growth in exports of financial services. Exports of transport services expanded solidly amid vibrant regional trade flows, while exports of business and other services grew modestly.
4
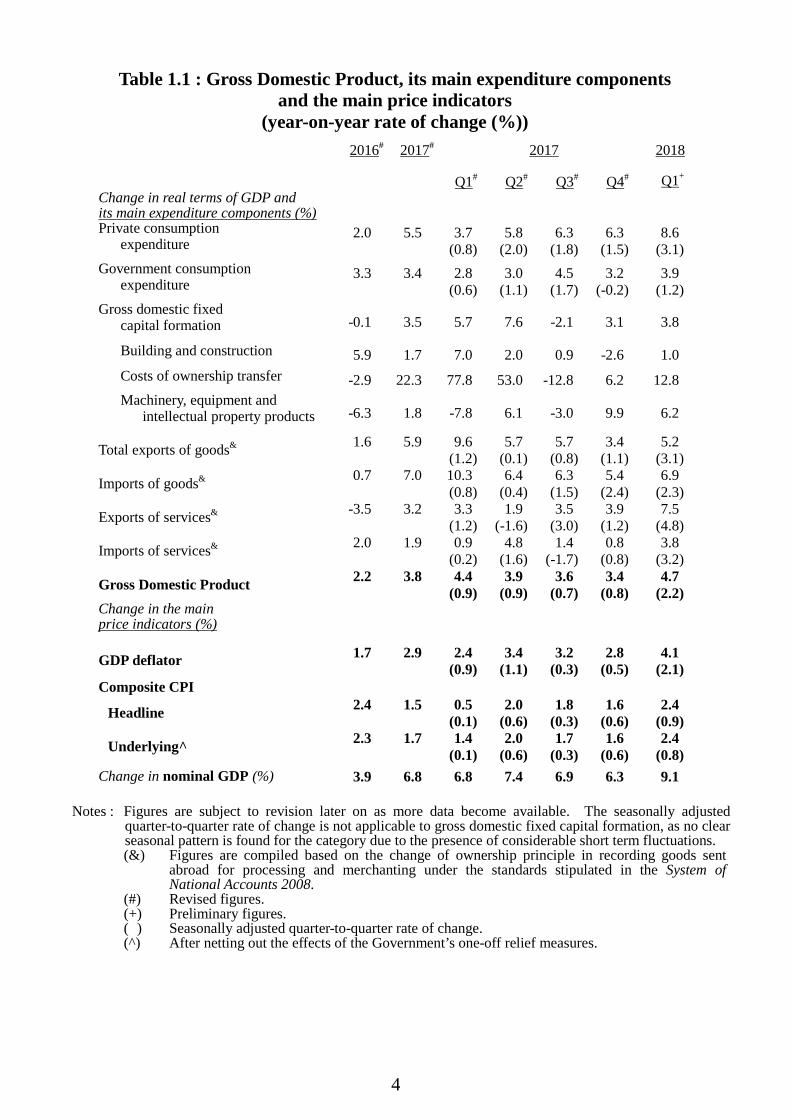
Table 1.1 : Gross Domestic Product, its main expenditure components and the main price indicators
(year-on-year rate of change (%)) 2016# 2017# 2017 2018
Q1# Q2# Q3# Q4# Q1+ Change in real terms of GDP and its main expenditure components (%)
Private consumption expenditure
2.0
5.5
3.7 (0.8)
5.8 (2.0)
6.3 (1.8)
6.3 (1.5)
8.6 (3.1)
Government consumption expenditure
3.3
3.4
2.8 (0.6)
3.0 (1.1)
4.5 (1.7)
3.2 (-0.2)
3.9 (1.2)
Gross domestic fixed capital formation -0.1 3.5 5.7 7.6 -2.1 3.1 3.8
Building and construction 5.9 1.7 7.0 2.0 0.9 -2.6 1.0 Costs of ownership transfer -2.9 22.3 77.8 53.0 -12.8 6.2 12.8 Machinery, equipment and intellectual property products -6.3 1.8 -7.8 6.1 -3.0 9.9 6.2
Total exports of goods& 1.6
5.9
9.6 (1.2)
5.7 (0.1)
5.7 (0.8)
3.4 (1.1)
5.2 (3.1)
Imports of goods& 0.7
7.0
10.3 (0.8)
6.4 (0.4)
6.3 (1.5)
5.4 (2.4)
6.9 (2.3)
Exports of services& -3.5
3.2
3.3 (1.2)
1.9 (-1.6)
3.5 (3.0)
3.9 (1.2)
7.5 (4.8)
Imports of services& 2.0
1.9
0.9 (0.2)
4.8 (1.6)
1.4 (-1.7)
0.8 (0.8)
3.8 (3.2)
Gross Domestic Product 2.2
3.8
4.4 (0.9)
3.9 (0.9)
3.6 (0.7)
3.4 (0.8)
4.7 (2.2)
Change in the main price indicators (%)
GDP deflator 1.7
2.9
2.4 (0.9)
3.4 (1.1)
3.2 (0.3)
2.8 (0.5)
4.1 (2.1)
Composite CPI
Headline 2.4
1.5
0.5
(0.1) 2.0
(0.6) 1.8
(0.3) 1.6
(0.6) 2.4
(0.9)
Underlying^ 2.3
1.7
1.4
(0.1) 2.0
(0.6) 1.7
(0.3) 1.6
(0.6) 2.4
(0.8) Change in nominal GDP (%) 3.9 6.8 6.8 7.4 6.9 6.3 9.1
Notes : Figures are subject to revision later on as more data become available. The seasonally adjusted
quarter-to-quarter rate of change is not applicable to gross domestic fixed capital formation, as no clear seasonal pattern is found for the category due to the presence of considerable short term fluctuations.
(&) Figures are compiled based on the change of ownership principle in recording goods sent abroad for processing and merchanting under the standards stipulated in the System of National Accounts 2008.
(#) Revised figures. (+) Preliminary figures. (+) Seasonally adjusted quarter-to-quarter rate of change. (^) After netting out the effects of the Government’s one-off relief measures.

5
The domestic sector 1.6 The domestic sector continued to strengthen in the first quarter. Private consumption expenditure grew markedly by 8.6% in real terms in the first quarter over a year earlier. Local consumption sentiment was firmly supported by favourable job and income conditions as well as wealth effect from stronger asset market conditions. Government consumption expenditure continued to grow steadily by 3.9% in the first quarter, following its 3.2% growth in the preceding quarter.
Table 1.2 : Consumer spending by major component(a) (year-on-year rate of change in real terms (%))
Total consumer
spending in the domestic
market(a)
Of which :
Non- durables
Services
Residents’ expenditure
abroad
Visitor
spending
Private consumption expenditure(b)
Food
Durables
2017 Annual 5.1 3.6 6.0 6.4 4.8 4.0 1.5 5.5
H1 4.0 3.4 -0.9 5.6 4.2 5.2 * 4.8
H2 6.1 3.9 11.9 7.2 5.3 3.0 2.9 6.3
Q1 3.7 3.4 -1.1 5.2 4.1 -0.8 1.5 3.7
Q2 4.3 3.4 -0.6 5.9 4.3 11.5 -1.7 5.8
Q3 5.9 4.5 9.4 7.6 4.9 3.8 1.8 6.3
Q4 6.3 3.4 13.9 6.9 5.6 2.1 4.0 6.3
2018 Q1 9.3 4.1 25.7 13.9 6.0 6.1 11.6 8.6 Notes : (a) Consumer spending in the domestic market comprises both local consumer and visitor
spending. (b) Private consumption expenditure is obtained by deducting visitor spending from total
consumer spending in the domestic market, and adding back residents’ expenditure abroad.
(*) Change within ± 0.05%.
6
Q12013
Q12014
Q12015
Q12016
Q12017
Q12018
-4
-2
0
2
4
6
8
10
Year-on-year rate of change in real terms
Seasonally adjusted quarter-to-quarter rate of
change in real terms
Q12013
Q12014
Q12015
Q12016
Q12017
Q12018
-25
-20
-15
-10
-5
0
5
10
15
20
25
30
Expenditure on machinery, equipmentand intellectual property products
Expenditure on building
and construction
Year-on-year rate of change in real terms (%)
Overall investment expenditure
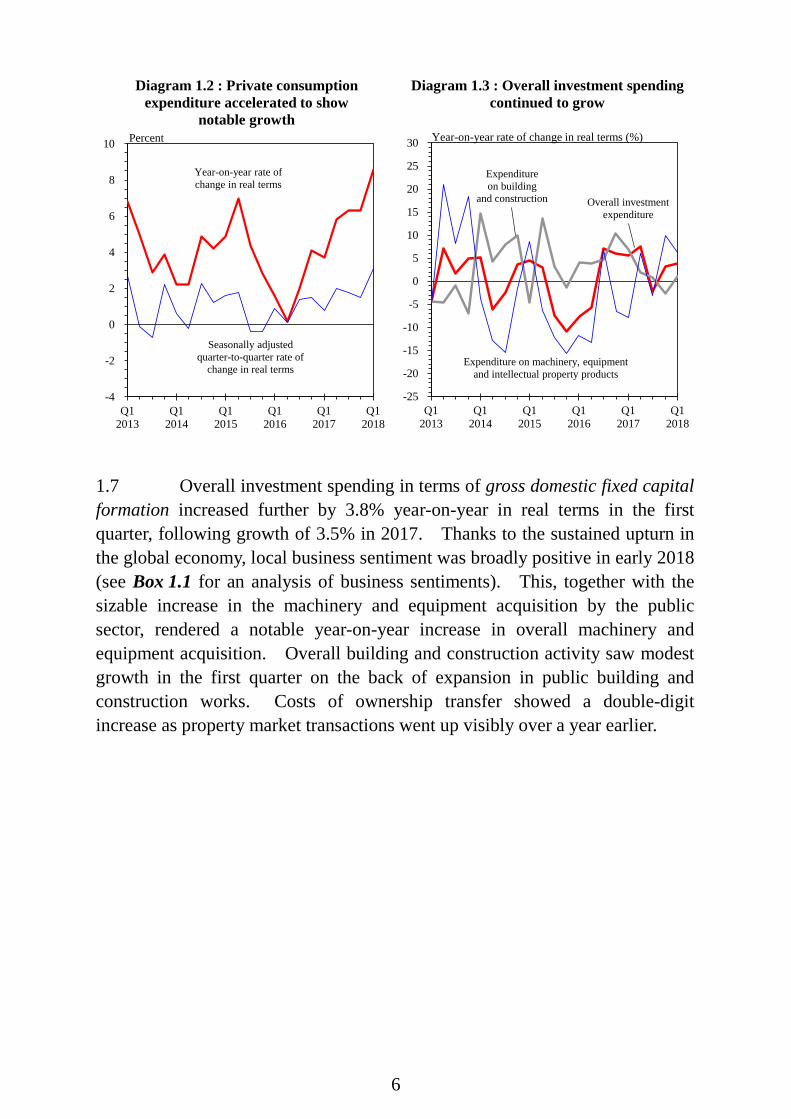
Diagram 1.2 : Private consumption expenditure accelerated to show
notable growth
Diagram 1.3 : Overall investment spending continued to grow
Percent
1.7 Overall investment spending in terms of gross domestic fixed capital formation increased further by 3.8% year-on-year in real terms in the first quarter, following growth of 3.5% in 2017. Thanks to the sustained upturn in the global economy, local business sentiment was broadly positive in early 2018 (see Box 1.1 for an analysis of business sentiments). This, together with the sizable increase in the machinery and equipment acquisition by the public sector, rendered a notable year-on-year increase in overall machinery and equipment acquisition. Overall building and construction activity saw modest growth in the first quarter on the back of expansion in public building and construction works. Costs of ownership transfer showed a double-digit increase as property market transactions went up visibly over a year earlier.

7
Box 1.1 Business sentiment in Hong Kong
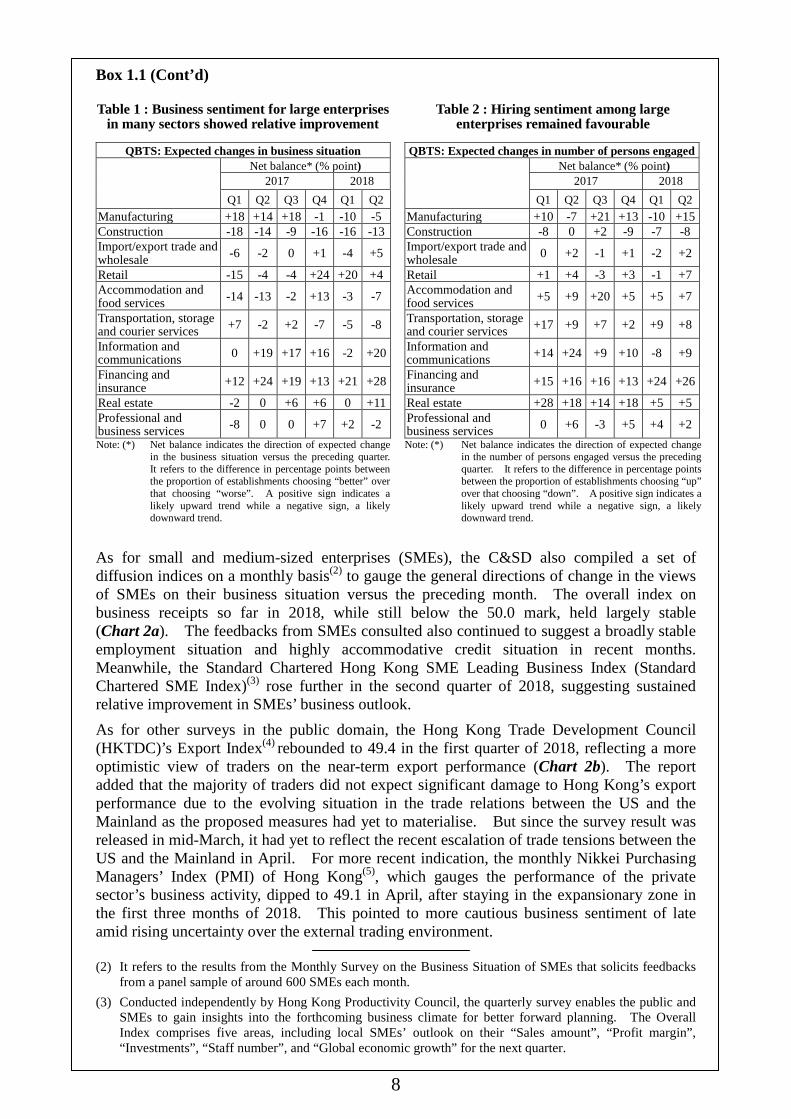
This box article gives a general overview of the prevailing business sentiment in Hong Kong, based on results from various surveys that are available in the public domain. According to the latest results from the Census and Statistics Department (C&SD)’s Quarterly Business Tendency Survey (QBTS)(1), overall business sentiment of large enterprises in Hong Kong turned more upbeat of late, amid the benign global economic environment and sustained above-trend growth of the local economy (Chart 1). In particular, the proportion of large enterprises expecting a better business situation in the second quarter of 2018 outweighed that of those expecting a weaker one by 8 percentage points (i.e. a net balance of +8), the highest net balance since the second quarter of 2014. It should however be noted that the survey was conducted in early March to mid-April 2018, and so the respondents’ expectations may not have fully taken into account the evolving situation surrounding the escalation of trade tensions between the US and the Mainland of late. Among various sectors, large enterprises in “financing and insurance”, “information and communications” and “real estate” were particularly optimistic (Table 1), thanks to robust economic conditions and buoyant property market. Business sentiment was broadly positive among large enterprises in “import/export trade and wholesale” and “retail” amid notable growth in external trade and consumption, while that in “manufacturing” and “construction” also saw relative improvement. On the other hand, large enterprises in “accommodation and food services”, “transportation, storage and courier services” and “professional and business services” were more cautious. Meanwhile, hiring sentiment of large enterprises in most sectors was positive (Table 2), in line with prevailing sturdy employment growth.
Chart 1 : Large enterprises in Hong Kong turned more upbeat on their near-term business prospects
-60
-50
-40
-30
-20
-10
0
10
20
30
40
Q12008
Q12009
Q12010
Q12011
Q12012
Q12013
Q12014
Q12015
Q12016
Q12017
Q12018
-10
-8
-6
-4
-2
0
2
4
6
8
10Year-on-year rate of change (%)
Real GDP (LHS)
Net balance* (% point)
Net balance indicates the direction of expected change in the business situation versus the preceding quarter. It refers to the difference inpercentage points between the proportion of establishments choosing “better” over that choosing “worse”. A positive sign indicates alikely upward trend while a negative sign, a likely downward trend.
Note : (*)
Expected change in the business situation
for all surveyed sectors (RHS)
(1) The Quarterly Business Tendency Survey collected views from around 500-600 large establishments on
their near-term business outlook. Respondents were asked to exclude seasonal influences in their responses.
8
Box 1.1 (Cont’d) Table 1 : Business sentiment for large enterprises
in many sectors showed relative improvement Table 2 : Hiring sentiment among large
enterprises remained favourable
QBTS: Expected changes in business situation Net balance* (% point)
2017 2018 Q1 Q2 Q3 Q4 Q1 Q2
Manufacturing +18 +14 +18 -1 -10 -5 Construction -18 -14 -9 -16 -16 -13 Import/export trade and wholesale -6 -2 0 +1 -4 +5
Retail -15 -4 -4 +24 +20 +4 Accommodation and food services -14 -13 -2 +13 -3 -7
Transportation, storage and courier services +7 -2 +2 -7 -5 -8
Information and communications 0 +19 +17 +16 -2 +20
Financing and insurance +12 +24 +19 +13 +21 +28
Real estate -2 0 +6 +6 0 +11 Professional and business services -8 0 0 +7 +2 -2
QBTS: Expected changes in number of persons engaged Net balance* (% point)
2017 2018 Q1 Q2 Q3 Q4 Q1 Q2
Manufacturing +10 -7 +21 +13 -10 +15 Construction -8 0 +2 -9 -7 -8 Import/export trade and wholesale 0 +2 -1 +1 -2 +2
Retail +1 +4 -3 +3 -1 +7 Accommodation and food services +5 +9 +20 +5 +5 +7
Transportation, storage and courier services +17 +9 +7 +2 +9 +8
Information and communications +14 +24 +9 +10 -8 +9
Financing and insurance +15 +16 +16 +13 +24 +26
Real estate +28 +18 +14 +18 +5 +5 Professional and business services 0 +6 -3 +5 +4 +2
Note: (*) Net balance indicates the direction of expected change in the business situation versus the preceding quarter. It refers to the difference in percentage points between the proportion of establishments choosing “better” over that choosing “worse”. A positive sign indicates a likely upward trend while a negative sign, a likely downward trend.
Note: (*) Net balance indicates the direction of expected change in the number of persons engaged versus the preceding quarter. It refers to the difference in percentage points between the proportion of establishments choosing “up” over that choosing “down”. A positive sign indicates a likely upward trend while a negative sign, a likely downward trend.
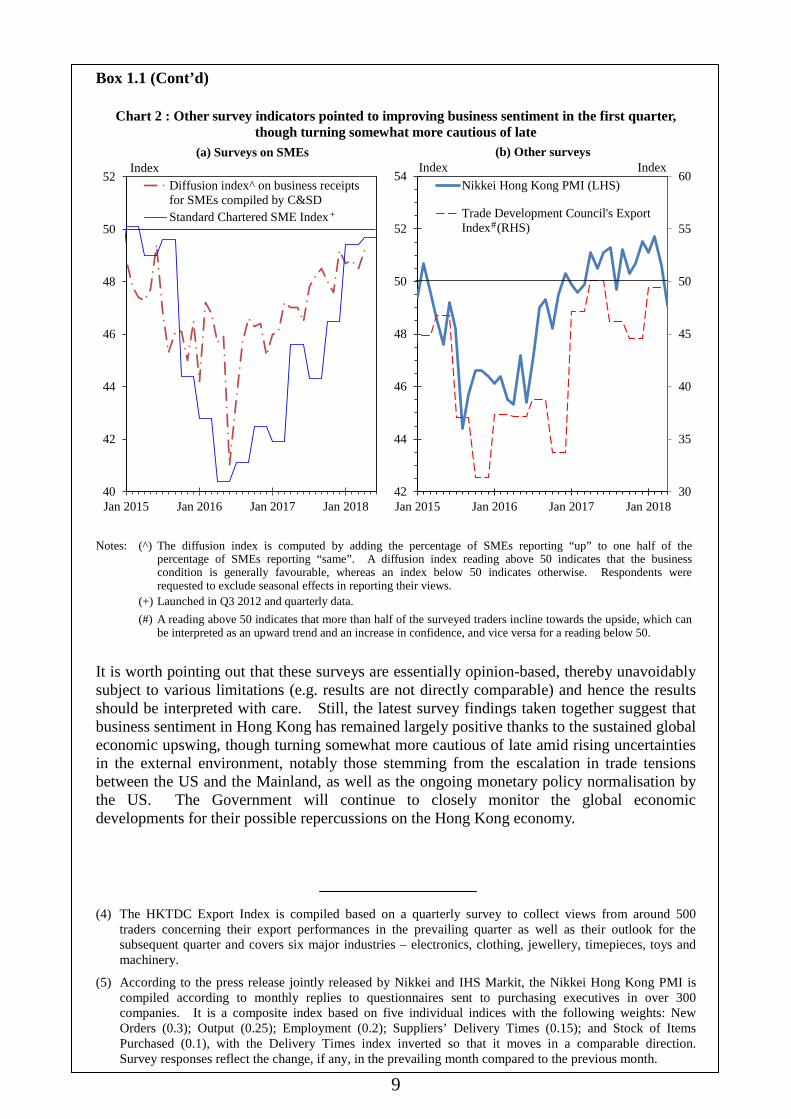
As for small and medium-sized enterprises (SMEs), the C&SD also compiled a set of diffusion indices on a monthly basis(2) to gauge the general directions of change in the views of SMEs on their business situation versus the preceding month. The overall index on business receipts so far in 2018, while still below the 50.0 mark, held largely stable (Chart 2a). The feedbacks from SMEs consulted also continued to suggest a broadly stable employment situation and highly accommodative credit situation in recent months. Meanwhile, the Standard Chartered Hong Kong SME Leading Business Index (Standard Chartered SME Index)(3) rose further in the second quarter of 2018, suggesting sustained relative improvement in SMEs’ business outlook. As for other surveys in the public domain, the Hong Kong Trade Development Council (HKTDC)’s Export Index(4) rebounded to 49.4 in the first quarter of 2018, reflecting a more optimistic view of traders on the near-term export performance (Chart 2b). The report added that the majority of traders did not expect significant damage to Hong Kong’s export performance due to the evolving situation in the trade relations between the US and the Mainland as the proposed measures had yet to materialise. But since the survey result was released in mid-March, it had yet to reflect the recent escalation of trade tensions between the US and the Mainland in April. For more recent indication, the monthly Nikkei Purchasing Managers’ Index (PMI) of Hong Kong(5), which gauges the performance of the private sector’s business activity, dipped to 49.1 in April, after staying in the expansionary zone in the first three months of 2018. This pointed to more cautious business sentiment of late amid rising uncertainty over the external trading environment. (2) It refers to the results from the Monthly Survey on the Business Situation of SMEs that solicits feedbacks
from a panel sample of around 600 SMEs each month. (3) Conducted independently by Hong Kong Productivity Council, the quarterly survey enables the public and
SMEs to gain insights into the forthcoming business climate for better forward planning. The Overall Index comprises five areas, including local SMEs’ outlook on their “Sales amount”, “Profit margin”, “Investments”, “Staff number”, and “Global economic growth” for the next quarter.
9
Box 1.1 (Cont’d)
Chart 2 : Other survey indicators pointed to improving business sentiment in the first quarter, though turning somewhat more cautious of late
30
35
40
45
50
55
60
42
44
46
48
50
52
54
Jan 2015 Jan 2016 Jan 2017 Jan 2018
Nikkei Hong Kong PMI (LHS)
Trade Development Council's ExportIndex (RHS)
Index
40
42
44
46
48
50
52
Jan 2015 Jan 2016 Jan 2017 Jan 2018
Diffusion index^ on business receiptsfor SMEs compiled by C&SDStandard Chartered SME Index
Index
+
(a) Surveys on SMEs
#
(b) Other surveysIndex
Notes: (^) The diffusion index is computed by adding the percentage of SMEs reporting “up” to one half of the
percentage of SMEs reporting “same”. A diffusion index reading above 50 indicates that the business condition is generally favourable, whereas an index below 50 indicates otherwise. Respondents were requested to exclude seasonal effects in reporting their views.
(+) (#)
Launched in Q3 2012 and quarterly data. A reading above 50 indicates that more than half of the surveyed traders incline towards the upside, which can be interpreted as an upward trend and an increase in confidence, and vice versa for a reading below 50.
It is worth pointing out that these surveys are essentially opinion-based, thereby unavoidably subject to various limitations (e.g. results are not directly comparable) and hence the results should be interpreted with care. Still, the latest survey findings taken together suggest that business sentiment in Hong Kong has remained largely positive thanks to the sustained global economic upswing, though turning somewhat more cautious of late amid rising uncertainties in the external environment, notably those stemming from the escalation in trade tensions between the US and the Mainland, as well as the ongoing monetary policy normalisation by the US. The Government will continue to closely monitor the global economic developments for their possible repercussions on the Hong Kong economy. (4) The HKTDC Export Index is compiled based on a quarterly survey to collect views from around 500
traders concerning their export performances in the prevailing quarter as well as their outlook for the subsequent quarter and covers six major industries – electronics, clothing, jewellery, timepieces, toys and machinery.
(5) According to the press release jointly released by Nikkei and IHS Markit, the Nikkei Hong Kong PMI is compiled according to monthly replies to questionnaires sent to purchasing executives in over 300 companies. It is a composite index based on five individual indices with the following weights: New Orders (0.3); Output (0.25); Employment (0.2); Suppliers’ Delivery Times (0.15); and Stock of Items Purchased (0.1), with the Delivery Times index inverted so that it moves in a comparable direction. Survey responses reflect the change, if any, in the prevailing month compared to the previous month.
10
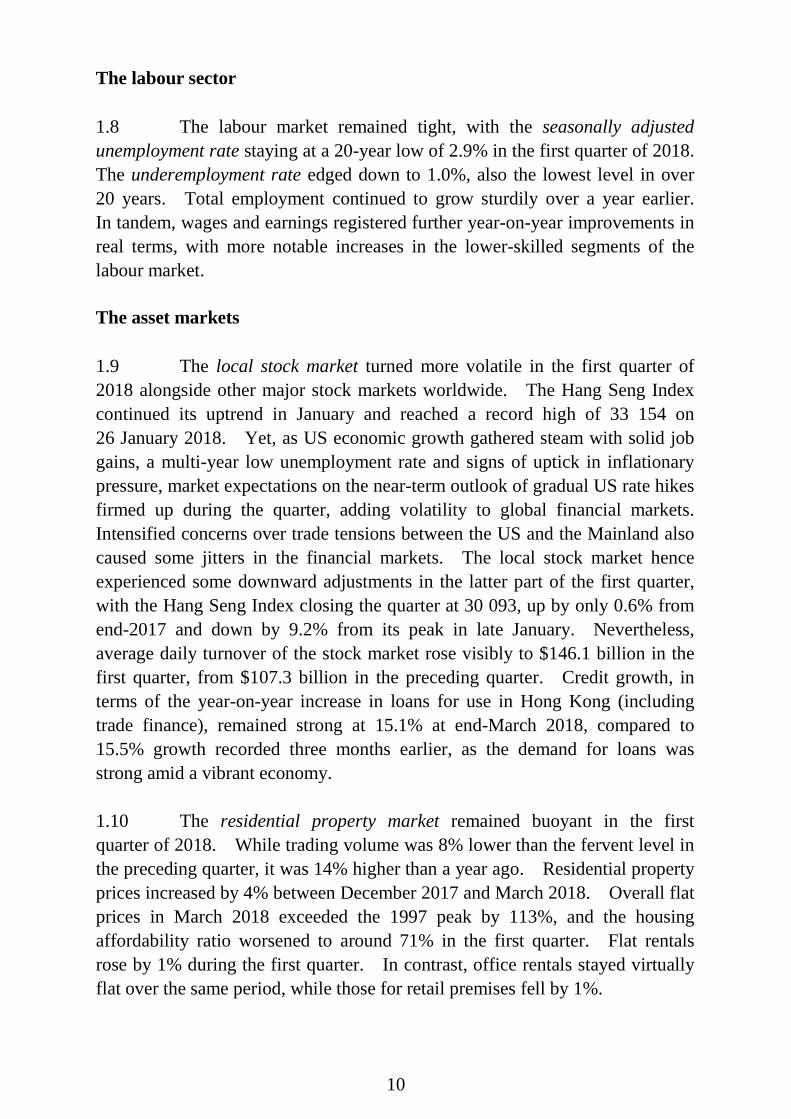
The labour sector 1.8 The labour market remained tight, with the seasonally adjusted unemployment rate staying at a 20-year low of 2.9% in the first quarter of 2018. The underemployment rate edged down to 1.0%, also the lowest level in over 20 years. Total employment continued to grow sturdily over a year earlier. In tandem, wages and earnings registered further year-on-year improvements in real terms, with more notable increases in the lower-skilled segments of the labour market. The asset markets 1.9 The local stock market turned more volatile in the first quarter of 2018 alongside other major stock markets worldwide. The Hang Seng Index continued its uptrend in January and reached a record high of 33 154 on 26 January 2018. Yet, as US economic growth gathered steam with solid job gains, a multi-year low unemployment rate and signs of uptick in inflationary pressure, market expectations on the near-term outlook of gradual US rate hikes firmed up during the quarter, adding volatility to global financial markets. Intensified concerns over trade tensions between the US and the Mainland also caused some jitters in the financial markets. The local stock market hence experienced some downward adjustments in the latter part of the first quarter, with the Hang Seng Index closing the quarter at 30 093, up by only 0.6% from end-2017 and down by 9.2% from its peak in late January. Nevertheless, average daily turnover of the stock market rose visibly to $146.1 billion in the first quarter, from $107.3 billion in the preceding quarter. Credit growth, in terms of the year-on-year increase in loans for use in Hong Kong (including trade finance), remained strong at 15.1% at end-March 2018, compared to 15.5% growth recorded three months earlier, as the demand for loans was strong amid a vibrant economy. 1.10 The residential property market remained buoyant in the first quarter of 2018. While trading volume was 8% lower than the fervent level in the preceding quarter, it was 14% higher than a year ago. Residential property prices increased by 4% between December 2017 and March 2018. Overall flat prices in March 2018 exceeded the 1997 peak by 113%, and the housing affordability ratio worsened to around 71% in the first quarter. Flat rentals rose by 1% during the first quarter. In contrast, office rentals stayed virtually flat over the same period, while those for retail premises fell by 1%.

11
Inflation 1.11 Consumer price inflation was moderate in the first quarter, though going up somewhat on the back of strong economic conditions as well as some temporary factors. Locally, labour cost pressure was held in check on a unit cost basis, as rises in wages and earnings were largely matched with concurrent growth in labour productivity. Commercial rental cost pressure was contained in general, while the increase in fresh-letting residential rentals over the past year or so continued to feed through gradually to consumer price inflation. External price pressures also remained moderate, only edging up slightly due to the weaker US dollar and mildly higher inflation in some major import sources amid the global economic upturn. Overall, netting out the effects of the Government’s one-off relief measures, underlying consumer price inflation was 2.4% in the first quarter, up from 1.6% in the prior quarter. Headline consumer price inflation rose to 2.4% in the first quarter from 1.6% in the preceding quarter. 1.12 The year-on-year rate of increase in the GDP deflator climbed up to 4.1% in the first quarter from 2.8% in the prior quarter. The year-on-year increase in the domestic demand deflator likewise rose to 3.7%, partly driven by the modest rise in consumer price inflation. Meanwhile, the terms of trade saw a mild improvement, as export prices rose slightly faster than import prices.
Q12013
Q12014
Q12015
Q12016
Q12017
Q12018
0
1
2
3
4
5
6 Year-on-year rate of change (%)
Underlying Composite Consumer Price Index
Diagram 1.4 : Underlying consumer price inflation pressure went up somewhat in the first quarter
Domesticdemand deflator
GDP deflator
Note : The year-on-year rates of change of the Composite Consumer Price Index from
the fourth quarter of 2015 onwards are computed from the new 2014/15-based series, and those before are from the old 2009/10-based series.
12
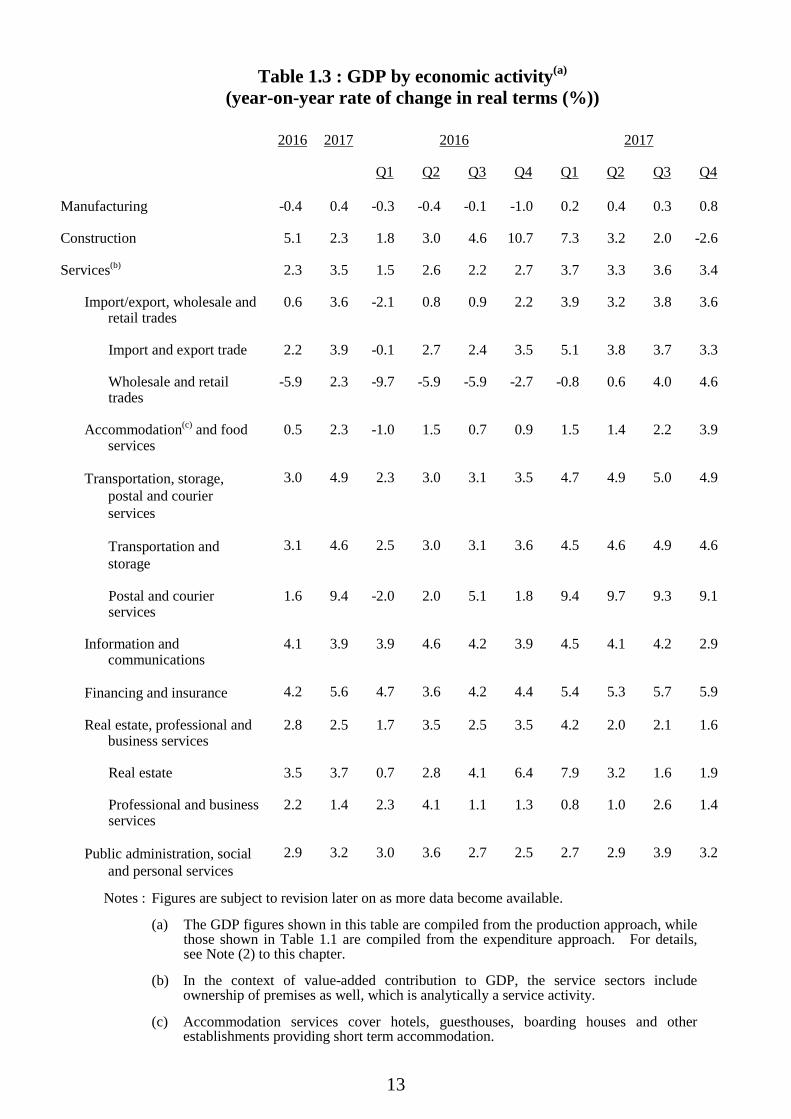
GDP by major economic sector 1.13 The growth in the net output of the services sector as a whole picked up to 3.5% in real terms in 2017 from 2.3% in 2016, as the local economy exhibited notable expansion amid a synchronised global economic upswing. The improvement was widespread across different segments. Specifically, alongside vibrant regional trading activities, the net output of import and export trade as well as that of transportation and storage grew solidly throughout 2017. Thanks to the revival in inbound tourism and positive local consumer sentiment, the net output of wholesale and retail trades recovered progressively over the course of 2017 and reverted to moderate growth for the year as a whole, while the net output of accommodation and food services also grew at a faster pace in 2017. The net output of the financing and insurance sector saw a pick-up in growth in 2017 amid more buoyant financial markets. The net output of public administration, social and personal services expanded steadily. The net output of real estate, which covers activities of private sector developers and property agencies, also saw further growth in 2017. Meanwhile, the net output of professional and business services saw further modest growth. As for the secondary sector, the net output of the construction sector continued to grow for 2017 as a whole, notwithstanding a decline in the final quarter against a higher base of comparison in the same quarter last year. Meanwhile, the net output of the manufacturing sector reverted to mild growth for the year as a whole.
13
Table 1.3 : GDP by economic activity(a) (year-on-year rate of change in real terms (%))
2016
2017 2016 2017
Q1
Q2 Q3 Q4 Q1 Q2 Q3 Q4
Manufacturing
-0.4 0.4 -0.3 -0.4 -0.1 -1.0 0.2 0.4 0.3 0.8
Construction
5.1 2.3 1.8 3.0 4.6 10.7 7.3 3.2 2.0 -2.6
Services(b)
2.3 3.5 1.5 2.6 2.2 2.7 3.7 3.3 3.6 3.4
Import/export, wholesale and retail trades
0.6 3.6 -2.1 0.8 0.9 2.2 3.9 3.2 3.8 3.6
Import and export trade
2.2 3.9 -0.1 2.7 2.4 3.5 5.1 3.8 3.7 3.3
Wholesale and retail trades
-5.9 2.3 -9.7 -5.9 -5.9 -2.7 -0.8 0.6 4.0 4.6
Accommodation(c) and food services
0.5 2.3 -1.0 1.5 0.7 0.9 1.5 1.4 2.2 3.9
Transportation, storage, postal and courier services
3.0 4.9 2.3 3.0 3.1 3.5 4.7 4.9 5.0 4.9
Transportation and storage
3.1 4.6 2.5 3.0 3.1 3.6 4.5 4.6 4.9 4.6
Postal and courier services
1.6 9.4 -2.0 2.0 5.1 1.8 9.4 9.7 9.3 9.1
Information and communications
4.1 3.9 3.9 4.6 4.2 3.9 4.5 4.1 4.2 2.9
Financing and insurance
4.2 5.6 4.7 3.6 4.2 4.4 5.4 5.3 5.7 5.9
Real estate, professional and business services
2.8 2.5 1.7 3.5 2.5 3.5 4.2 2.0 2.1 1.6
Real estate
3.5 3.7 0.7 2.8 4.1 6.4 7.9 3.2 1.6 1.9
Professional and business services
2.2 1.4 2.3 4.1 1.1 1.3 0.8 1.0 2.6 1.4
Public administration, social and personal services
2.9 3.2 3.0 3.6 2.7 2.5 2.7 2.9 3.9 3.2
Notes : Figures are subject to revision later on as more data become available.
(a) The GDP figures shown in this table are compiled from the production approach, while those shown in Table 1.1 are compiled from the expenditure approach. For details, see Note (2) to this chapter.
(b) In the context of value-added contribution to GDP, the service sectors include ownership of premises as well, which is analytically a service activity.
(c) Accommodation services cover hotels, guesthouses, boarding houses and other establishments providing short term accommodation.

14
Other economic developments 1.14 The Financial Secretary, in the 2018-19 Budget, identified three mega trends in the global economy: the unstoppable wave of innovation and technology (I&T), the continued shift in global economic gravity from West to East, and the rising tendency of regional or bilateral trade negotiations between economies amid the threat of protectionism. In response, the Budget pledged to take a proactive approach to ensure that Hong Kong can ride on the enormous opportunities therein through, among other strategies, promoting I&T development in the economy, making bold investments in the future to overcome development bottlenecks posed by land and human capital, and maintaining the competitiveness of our tax regime. 1.15 For the development of I&T, the Budget pledged considerable resources to support the Government’s targeted efforts in our areas of strength, namely biotechnology, artificial intelligence, development as a smart city and Fintech, with a view to boosting a diversified economy. In particular, the Budget set aside an additional $50 billion for developing the Hong Kong-Shenzhen Innovation and Technology Park in the Lok Ma Chau Loop and the Science Park, providing financial support to establish two research clusters in healthcare technologies and in artificial intelligence and robotic technologies, as well as implementing other initiatives that would boost the development of I&T. 1.16 As for investments in the future, the Government will continue to place a high priority on nurturing talent in Hong Kong. The Budget pledged to allocate additional resources in education, training and retraining, which include providing an extra $2 billion in recurrent expenditure to strengthen support for teachers, kindergartens, integrated education and life-wide learning, as well as a further injection of an additional $8.5 billion into the Continuing Education Fund, among other initiatives. Separately, the Government will also continue its unwavering efforts to address the development constraints posed by inadequate land supply, through identifying land for housing to boost housing supply and increasing the supply of commercial floor area through various means. For long-term development, the Task Force on Land Supply launched a five-month public engagement exercise in April 2018 to discuss options for increasing land supply.

15
1.17 The Budget also focused on building a caring and sharing society in Hong Kong. In particular, the Budget pledged new resources for initiatives in elderly services, rehabilitation services and child care services. With the substantial fiscal surplus in 2017/18 fiscal year, the Financial Secretary also announced in the Budget various concessionary measures to share the fruits of economic success with the community.
16
Box 1.2 A snapshot of micro enterprises in Hong Kong
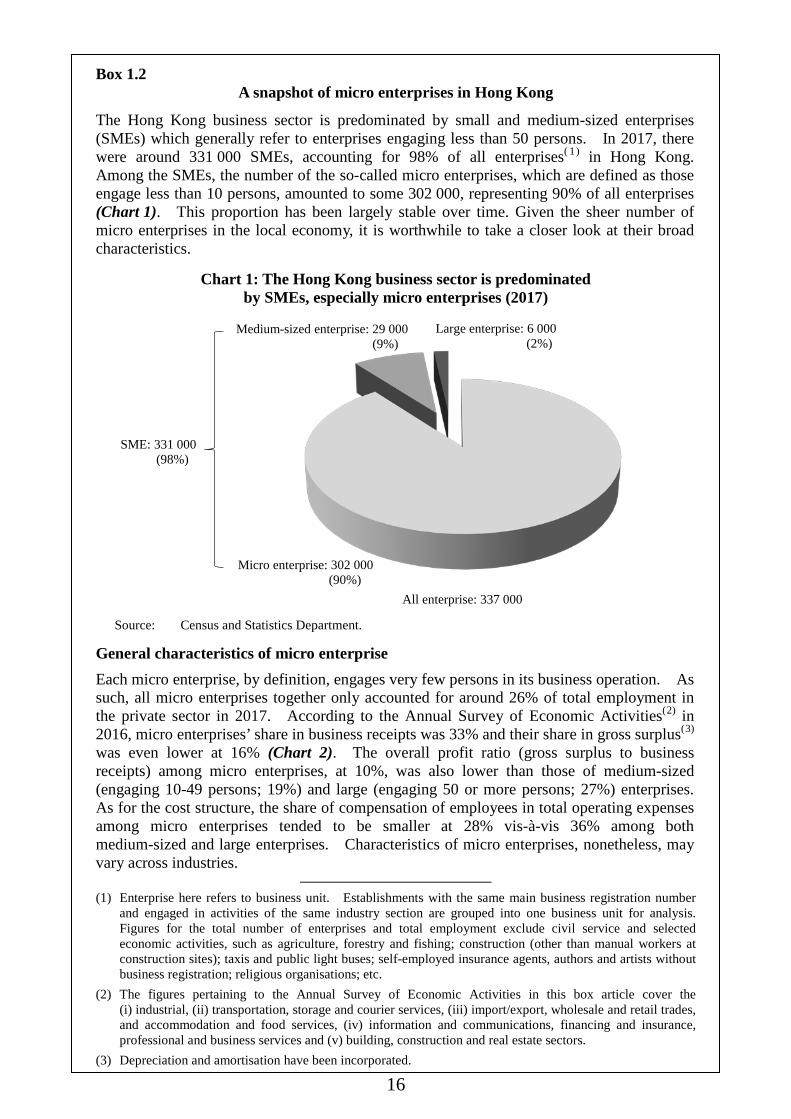
The Hong Kong business sector is predominated by small and medium-sized enterprises (SMEs) which generally refer to enterprises engaging less than 50 persons. In 2017, there were around 331 000 SMEs, accounting for 98% of all enterprises( 1) in Hong Kong. Among the SMEs, the number of the so-called micro enterprises, which are defined as those engage less than 10 persons, amounted to some 302 000, representing 90% of all enterprises (Chart 1). This proportion has been largely stable over time. Given the sheer number of micro enterprises in the local economy, it is worthwhile to take a closer look at their broad characteristics.
Chart 1: The Hong Kong business sector is predominated by SMEs, especially micro enterprises (2017)
Micro enterprise: 302 000(90%)
Medium-sized enterprise: 29 000(9%)
Large enterprise: 6 000(2%)
SME: 331 000(98%)
All enterprise: 337 000 Source: Census and Statistics Department.
General characteristics of micro enterprise Each micro enterprise, by definition, engages very few persons in its business operation. As such, all micro enterprises together only accounted for around 26% of total employment in the private sector in 2017. According to the Annual Survey of Economic Activities(2) in 2016, micro enterprises’ share in business receipts was 33% and their share in gross surplus(3) was even lower at 16% (Chart 2). The overall profit ratio (gross surplus to business receipts) among micro enterprises, at 10%, was also lower than those of medium-sized (engaging 10-49 persons; 19%) and large (engaging 50 or more persons; 27%) enterprises. As for the cost structure, the share of compensation of employees in total operating expenses among micro enterprises tended to be smaller at 28% vis-à-vis 36% among both medium-sized and large enterprises. Characteristics of micro enterprises, nonetheless, may vary across industries.
(1) Enterprise here refers to business unit. Establishments with the same main business registration number
and engaged in activities of the same industry section are grouped into one business unit for analysis. Figures for the total number of enterprises and total employment exclude civil service and selected economic activities, such as agriculture, forestry and fishing; construction (other than manual workers at construction sites); taxis and public light buses; self-employed insurance agents, authors and artists without business registration; religious organisations; etc.
(2) The figures pertaining to the Annual Survey of Economic Activities in this box article cover the (i) industrial, (ii) transportation, storage and courier services, (iii) import/export, wholesale and retail trades, and accommodation and food services, (iv) information and communications, financing and insurance, professional and business services and (v) building, construction and real estate sectors.
(3) Depreciation and amortisation have been incorporated.

17
Box 1.2 (Cont’d) Chart 2: Huge number of micro enterprises
but their shares in employment, business receipts and gross surplus were small (2016)
89
26 33
16
9
19
23
23
2
54 44
61
0
20
40
60
80
100
Number ofenterprises
Number ofpersons engaged
Businessreceipts
Grosssurplus
Large enterprise (50+ persons) Medium-sized enterprise (10 to <50 persons) Micro enterprise (<10 persons)
%
# #
... Note: Source:
(#) Based on Annual Survey of Economic Activities. Census and Statistics Department.
General characteristics of micro enterprise by selected industry While micro enterprises generally dominated the business sector, they featured even more prominently in retail (accounting for 96% of all enterprises in the sector); and wholesale (93%) industries. On the contrary, their shares in financing and insurance (82%); and accommodation and food services (62%) industries were much smaller. The variation should be related to the operational characteristics of different industries. In terms of number, those in import and export trade (29%); retail (18%); and professional and business services (14%) together made up of over 60% of all micro enterprises.
Micro enterprises together accounted for around 26% of total employment in the private sector. Each of these micro enterprises, on average, engaged 3 persons only. Accommodation and food services industry tended to engage more persons per micro enterprise (5 persons) whereas retail; transportation, storage, postal and courier services; and professional and business services industries appeared to engage less (2 persons). The number of employees (i.e. the number of persons engaged excluding working proprietors and partners and unpaid family workers) among micro enterprises averaged only 2. Larger proportion of persons engaged other than employees was seen in retail (53%); and transport, storage, postal and courier services industries (44%), in contrast to import and export trade industry (9%) which was associated with a particularly low ratio.
Other features of micro enterprises
From the distribution of enterprises by year of operation(4), it is noted that the proportion of enterprises with shorter years of operation was consistently larger among micro enterprises over time. In 2017, 29% of micro enterprises were associated with less than 5 years of operation, while the corresponding share among large enterprises was only 7%. Notwithstanding the above, there was still a notable proportion of micro enterprises (46%)
(4) The number of years of operation of a business unit is derived from the earliest year of commencement
among all active establishments under the business unit. The year of commencement of individual establishment is primarily based on the information on commencement date or business registration date as recorded by the Business Registration Office.
18
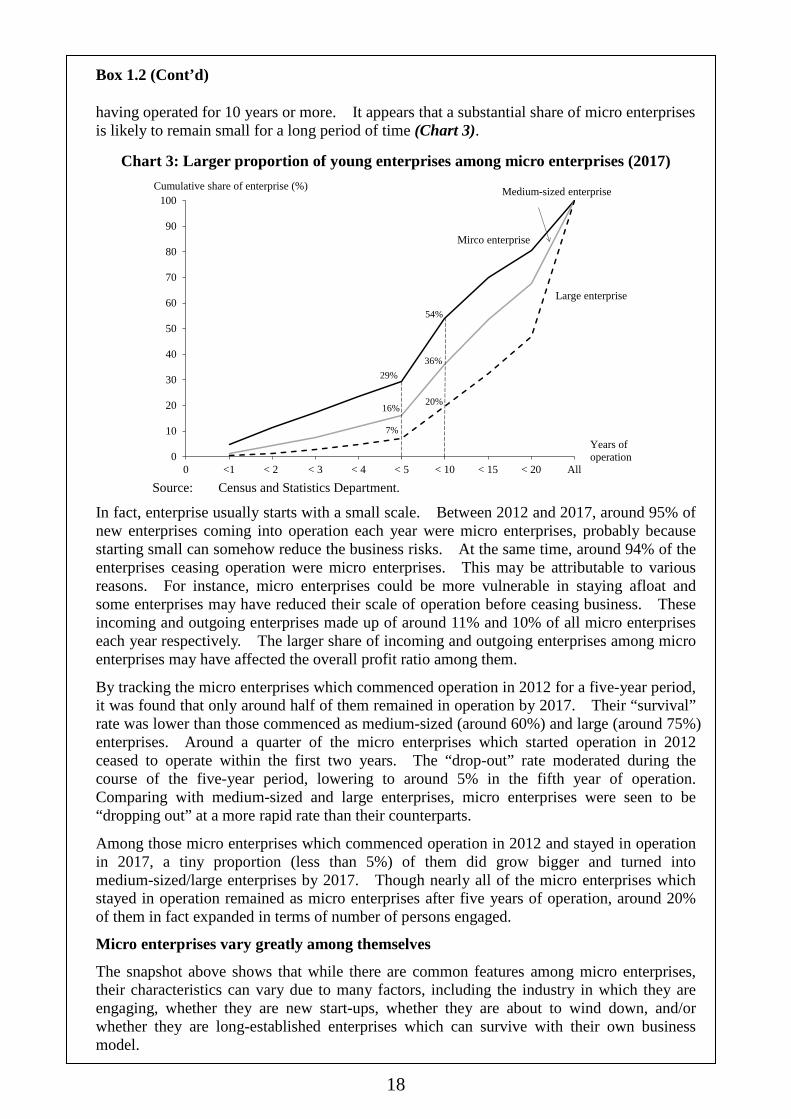
Box 1.2 (Cont’d) having operated for 10 years or more. It appears that a substantial share of micro enterprises is likely to remain small for a long period of time (Chart 3).
Chart 3: Larger proportion of young enterprises among micro enterprises (2017)
29%
54%
16%
36%
7%
20%
0
10
20
30
40
50
60
70
80
90
100
0 <1 < 2 < 3 < 4 < 5 < 10 < 15 < 20 All
Large enterprise
Medium-sized enterprise
Mirco enterprise
Cumulative share of enterprise (%)
Years of operation
Source: Census and Statistics Department.
In fact, enterprise usually starts with a small scale. Between 2012 and 2017, around 95% of new enterprises coming into operation each year were micro enterprises, probably because starting small can somehow reduce the business risks. At the same time, around 94% of the enterprises ceasing operation were micro enterprises. This may be attributable to various reasons. For instance, micro enterprises could be more vulnerable in staying afloat and some enterprises may have reduced their scale of operation before ceasing business. These incoming and outgoing enterprises made up of around 11% and 10% of all micro enterprises each year respectively. The larger share of incoming and outgoing enterprises among micro enterprises may have affected the overall profit ratio among them.
By tracking the micro enterprises which commenced operation in 2012 for a five-year period, it was found that only around half of them remained in operation by 2017. Their “survival” rate was lower than those commenced as medium-sized (around 60%) and large (around 75%) enterprises. Around a quarter of the micro enterprises which started operation in 2012 ceased to operate within the first two years. The “drop-out” rate moderated during the course of the five-year period, lowering to around 5% in the fifth year of operation. Comparing with medium-sized and large enterprises, micro enterprises were seen to be “dropping out” at a more rapid rate than their counterparts.
Among those micro enterprises which commenced operation in 2012 and stayed in operation in 2017, a tiny proportion (less than 5%) of them did grow bigger and turned into medium-sized/large enterprises by 2017. Though nearly all of the micro enterprises which stayed in operation remained as micro enterprises after five years of operation, around 20% of them in fact expanded in terms of number of persons engaged.
Micro enterprises vary greatly among themselves
The snapshot above shows that while there are common features among micro enterprises, their characteristics can vary due to many factors, including the industry in which they are engaging, whether they are new start-ups, whether they are about to wind down, and/or whether they are long-established enterprises which can survive with their own business model.
19
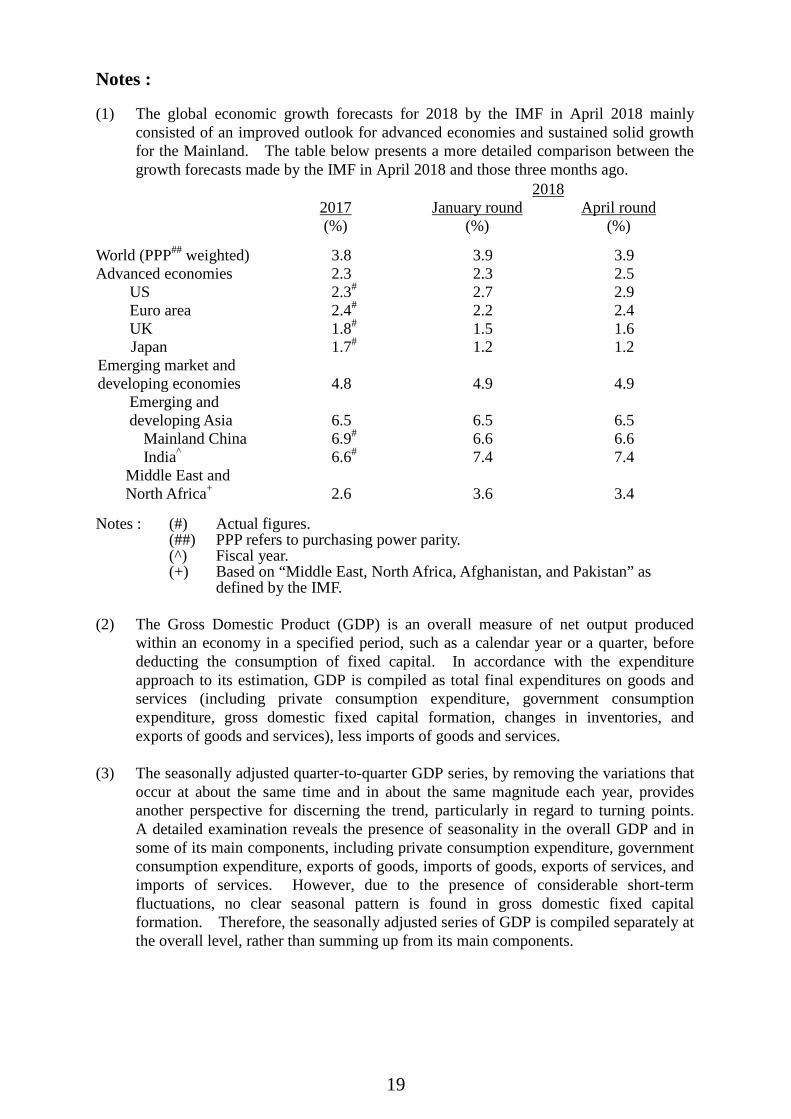
Notes : (1) The global economic growth forecasts for 2018 by the IMF in April 2018 mainly
consisted of an improved outlook for advanced economies and sustained solid growth for the Mainland. The table below presents a more detailed comparison between the growth forecasts made by the IMF in April 2018 and those three months ago.
2017
(%)
2018
January round
(%) April round
(%) World (PPP## weighted) 3.8 3.9 3.9 Advanced economies 2.3 2.3 2.5
US 2.3# 2.7 2.9 Euro area 2.4# 2.2 2.4 UK 1.8# 1.5 1.6
Japan 1.7# 1.2 1.2 Emerging market and developing economies
4.8 4.9 4.9
Emerging and developing Asia 6.5 6.5 6.5
Mainland China 6.9# 6.6 6.6 India^ 6.6# 7.4 7.4
Middle East and North Africa+
2.6
3.6
3.4
Notes : (#)
(##) (^) (+)
Actual figures. PPP refers to purchasing power parity. Fiscal year. Based on “Middle East, North Africa, Afghanistan, and Pakistan” as defined by the IMF.
(2) The Gross Domestic Product (GDP) is an overall measure of net output produced
within an economy in a specified period, such as a calendar year or a quarter, before deducting the consumption of fixed capital. In accordance with the expenditure approach to its estimation, GDP is compiled as total final expenditures on goods and services (including private consumption expenditure, government consumption expenditure, gross domestic fixed capital formation, changes in inventories, and exports of goods and services), less imports of goods and services.
(3) The seasonally adjusted quarter-to-quarter GDP series, by removing the variations that
occur at about the same time and in about the same magnitude each year, provides another perspective for discerning the trend, particularly in regard to turning points. A detailed examination reveals the presence of seasonality in the overall GDP and in some of its main components, including private consumption expenditure, government consumption expenditure, exports of goods, imports of goods, exports of services, and imports of services. However, due to the presence of considerable short-term fluctuations, no clear seasonal pattern is found in gross domestic fixed capital formation. Therefore, the seasonally adjusted series of GDP is compiled separately at the overall level, rather than summing up from its main components.

20
CHAPTER 2 : THE EXTERNAL SECTOR
Summary
The global economy sustained broad-based growth in the first quarter of 2018. Major advanced economies saw solid expansion, while the Mainland economy maintained strong momentum. The favourable developments continued to render firm support to global trade flows to the benefit of Hong Kong and other Asian economies. However, trade tensions between the US and the Mainland have increased recently. The situation is still evolving and warrants close attention.
Amid continued expansion in global demand, Hong Kong’s merchandise exports accelerated to grow by 7.3% year-on-year in real terms(1) in the first quarter. Exports to Asian markets as a whole grew notably along with robust regional production activities, particularly so for those to the Mainland, Singapore and Taiwan. Exports to the US and Europe also gathered pace thanks to firming demand in these economies.
Exports of services likewise displayed strength, picking up to show broad-based growth, which was the fastest since the second quarter of 2013. Specifically, exports of travel services accelerated to attain double-digit growth as inbound tourism improved further. Exports of financial services likewise picked up to sizeable growth, bolstered by active global financial market activities. Exports of transport services grew solidly amid buoyant regional trade flows. Meanwhile, exports of business and other services expanded steadily.
The 2018-19 Budget laid out a bundle of initiatives to strengthen and consolidate Hong Kong’s edge as an international trading and business centre. Meanwhile, the Government continued to expand Hong Kong’s tax treaty network, by signing a comprehensive agreement for the avoidance of double taxation (CDTA) with India in March. The Government will also actively seek to expand our Free Trade Agreement (FTA) and Investment Promotion and Protection Agreement (IPPA) networks. In the face of rising trade protectionism, the Government will continue to uphold the principle of free trade, which is the cornerstone of Hong Kong’s economic success. It is also all the more important for Hong Kong businesses, through active participation in the Belt and Road Initiative and the Bay Area development, to get access to the rapidly-expanding markets and to capture the vast opportunities so arisen. This will enable the Hong Kong economy to sustain its long-term growth and development.
21
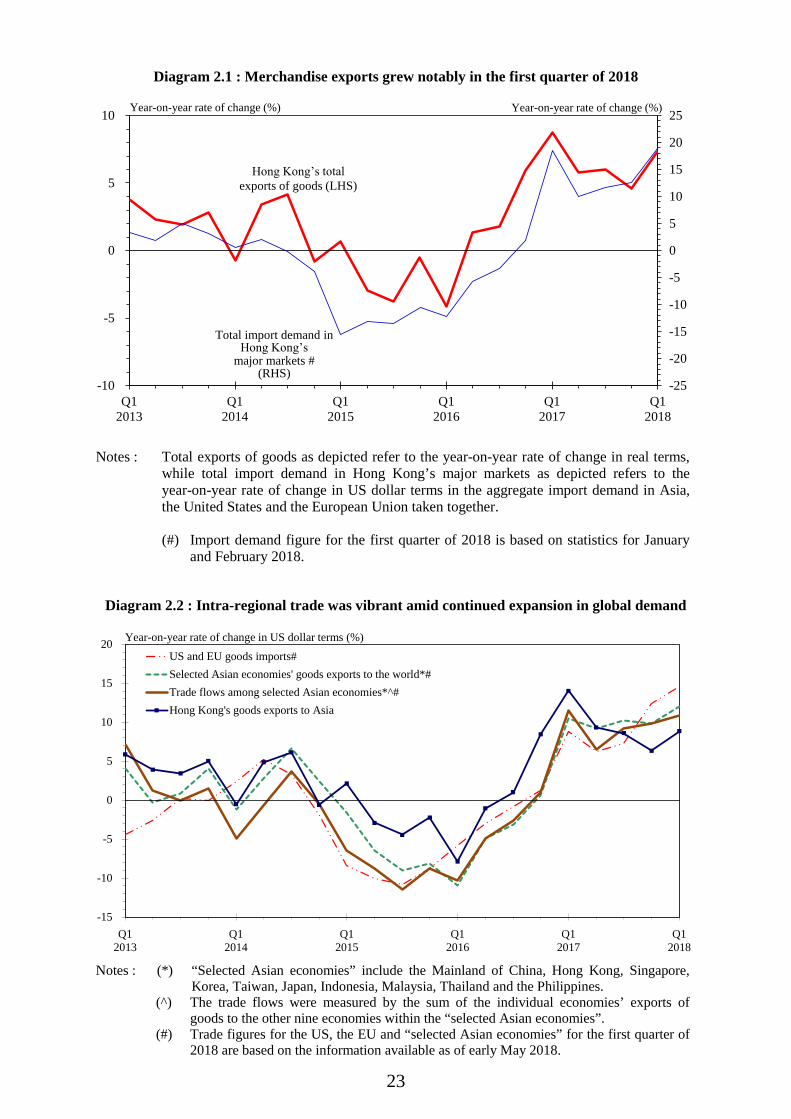
Goods trade Total exports of goods 2.1 The global economy sustained solid, broad-based growth in the first quarter of 2018, underpinning the vibrant manufacturing and trading activities in the Asian region. Many Asian economies saw visible export growth in the quarter. As part of this regional phenomenon, Hong Kong’s merchandise exports grew notably by 7.3% year-on-year in real terms in the first quarter of 2018, picking up from 4.6% growth in the preceding quarter. 2.2 The growth of major economies became more entrenched in the first quarter of 2018. The US economy expanded solidly, showing further job gains and a multi-year low unemployment rate. This supported a widely-expected interest rate hike in the US in March, marking the sixth hike since the lift-off in December 2015 by the Federal Reserve amid its ongoing monetary policy normalisation. The euro-area economy likewise sustained above-trend expansion. The Brexit negotiations also made progress, with the European Council endorsing a 21-month transition period till end-December 2020 that paved the way for a new phase of negotiations. Japan’s economy held firm, amid strong export performance and improved domestic demand. Meanwhile, the Mainland economy sustained robust growth of 6.8% in the first quarter, against the backdrop of vibrant exports and resilient domestic demand. Many other Asian economies also registered notable growth amid buoyant manufacturing and trading activities in the region. The International Monetary Fund (IMF) in April maintained its global economic growth forecast for 2018 at 3.9%, compared to the 3.8% growth in 2017. While the IMF believed that there could be some upside to its near-term outlook considering the prevailing growth momentum in the global economy, it expressed concerns about the possibility of some abrupt tightening in the global financial conditions due to such factors as a faster pick-up in inflation in the US. The IMF also highlighted the potential downside risk from a worsening of trade tensions and imposition of broader barriers to cross-border trade that would not only take a direct toll on economic activity, but would also weaken confidence. 2.3 While global trade flows continued to thrive in the first quarter, the threat of trade protectionism also turned more visible. Following the imposition by the US of tariffs on imports of washing machines, solar panels, and some specific aluminium and steel items in early 2018, trade tensions between the US and the Mainland escalated in the more recent months. The Office of the US Trade Representative (USTR) in early April proposed to

22
impose an additional tariff of 25% on imports from the Mainland involving more than 1 300 products worth around US$50 billion (constituting around 10% of the total value of US’ imports from the Mainland in 2017)(2) and restrict the Mainland’s investments in industries or technologies deemed important to the US. The Mainland subsequently announced its plan of counter-measures and the US indicated its intention to impose more tariff barriers on the trade flows between the two economies. Most of these plans or proposals of trade measures since early April have yet to be implemented. The trade conflicts will be averted if the two sides can reconcile their differences in the near term. Given that the US and the Mainland are the two largest economies and trading entities in the world, how their economic and trade relations would evolve has become the major source of uncertainty clouding the external trading environment.
Table 2.1 : Total exports of goods (year-on-year rate of change (%))
Total exports of goods
In value
terms
In real terms(a)
Change in prices
2017 Annual 8.0 6.2 1.8
Q1 10.3 8.8 (0.2) 1.6 Q2 7.4 5.8 (1.0) 1.6 Q3 8.0 6.0 (0.5) 1.9 Q4
6.8 4.6 (2.6) 2.2
2018 Q1 9.7 7.3 (2.2) 2.3
Notes : ( ) Seasonally adjusted quarter-to-quarter rate of change. (a) The growth rates here are not strictly comparable with those in the GDP accounts in
Table 1.1. Figures in Table 1.1 are compiled based on the change of ownership principle in recording goods sent abroad for processing and merchanting under the standards stipulated in the System of National Accounts 2008.
23
Notes : Total exports of goods as depicted refer to the year-on-year rate of change in real terms, while total import demand in Hong Kong’s major markets as depicted refers to the year-on-year rate of change in US dollar terms in the aggregate import demand in Asia, the United States and the European Union taken together.
(#) Import demand figure for the first quarter of 2018 is based on statistics for January
and February 2018.
Notes : (*) “Selected Asian economies” include the Mainland of China, Hong Kong, Singapore,
Korea, Taiwan, Japan, Indonesia, Malaysia, Thailand and the Philippines. (^) The trade flows were measured by the sum of the individual economies’ exports of
goods to the other nine economies within the “selected Asian economies”. (#) Trade figures for the US, the EU and “selected Asian economies” for the first quarter of
2018 are based on the information available as of early May 2018.
-25
-20
-15
-10
-5
0
5
10
15
20
25
Q12013
Q12014
Q12015
Q12016
Q12017
Q12018
-10
-5
0
5
10
Total import demand inHong Kongʼs
major markets #(RHS)
Hong Kongʼs total exports of goods (LHS)
Diagram 2.1 : Merchandise exports grew notably in the first quarter of 2018
Year-on-year rate of change (%) Year-on-year rate of change (%)
Q12013
Q12014
Q12015
Q12016
Q12017
Q12018
-15
-10
-5
0
5
10
15
20US and EU goods imports#Selected Asian economies' goods exports to the world*#Trade flows among selected Asian economies*^#Hong Kong's goods exports to Asia
Year-on-year rate of change in US dollar terms (%)
Diagram 2.2 : Intra-regional trade was vibrant amid continued expansion in global demand

24
Table 2.2 : Total exports of goods by major market (year-on-year rate of change in real terms (%))
2017 2018 Annual Q1 Q2 Q3 Q4 Q1 Mainland of China 5.4 9.3 3.9 6.0 3.0 9.4 United States 1.9 3.4 1.1 -0.5 3.8 5.1 European Union 4.6 3.0 1.3 5.0 8.5 9.1 India 35.1 40.1 53.8 9.9 39.5 -7.6 Japan 10.3 7.5 12.0 10.8 10.6 5.2 Taiwan 16.1 44.3 23.0 14.7 -5.4 8.4 Vietnam 8.7 10.8 11.9 6.8 5.9 0.9 Singapore 1.8 -1.2 3.9 11.7 -6.2 10.5 Korea 3.3 15.3 -2.8 -1.5 3.5 -3.1 Overall* 6.2 8.8 5.8 6.0 4.6 7.3
Note : (*) The growth rates here are not strictly comparable with those in the GDP accounts in
Table 1.1. Figures in Table 1.1 are compiled based on the change of ownership principle in recording goods sent abroad for processing and merchanting under the standards stipulated in the System of National Accounts 2008.
India$35.4 billion
(3.7%)
Singapore$15.5 billion
(1.6%)Taiwan
$23.5 billion(2.5%)
Korea$13.7 billion
(1.5%)
Japan$31.5 billion
(3.3%)EU
$83.4 billion(8.8%)
United States$77.7 billion
(8.2%)
Vietnam$18.8 billion
(2.0%)Rest of Asia$53.8 billion
(5.7%)
Q12013
Q12014
Q12015
Q12016
Q12017
Q12018
-10
-5
0
5
10
15Total exports
to Asia
Total exports to non-Asia
Total exports toall markets
Year-on-year rate of change in nominal terms (%)
Diagram 2.3 : Exports to Asia sustained solid growth and those to non-Asia picked up further
Others$75.0 billion(8.0%)
Mainland of China$514.8 billion
(54.6%)
Total exports of goods in the first quarter of 2018: $943.0 billion
25
2.4 In the first quarter, trading and manufacturing activities in Asia remained buoyant, as manifested by the notable growth in the region’s intake of raw materials and semi-manufactures. Against this backdrop, Hong Kong’s merchandise exports to Asian markets as a whole continued to record robust growth. Analysed by individual market, exports to the Mainland picked up visibly, while those to Japan grew notably in the first quarter over a year earlier. Exports to Taiwan and Singapore reverted to considerable increases. Yet exports to Vietnam moderated, while those to India fell back following successive quarters of upsurge. Exports to Korea also relapsed to some moderate year-on-year decline. 2.5 Exports to the US and the EU picked up firmly in the first quarter, thanks to sustained improvement in final demand in these economies. Exports to the US gathered pace alongside the solid expansion in household spending and business investment there. Exports to the EU likewise saw accelerated year-on-year growth, as the EU economy maintained above-trend growth momentum.

26
Q12013
Q12014
Q12015
Q12016
Q12017
Q12018
-20
-15
-10
-5
0
5
10
15
20
Year-on-year rate of change (%)
Hong Kongʼs total exports
to the EU
-10
-5
0
5
10
15
Q12013
Q12014
Q12015
Q12016
Q12017
Q12018
-20
-15
-10
-5
0
5
10
15
20
25
30
Hong Kongʼs total exports to Mainland
of China (RHS)
Year-on-year rate of change (%)
Mainland of Chinaʼsimport demand in US$
(LHS)
Year-on-year rate of change (%)
Diagram 2.4 : Exports to the Mainland picked up visibly in the first quarter
EUʼs import demand in US$
Diagram 2.5 : Exports to the EU saw accelerated growth
-8
-4
0
4
8
Q12013
Q12014
Q12015
Q12016
Q12017
Q12018
-10
-5
0
5
10
Year-on-yearrate of change (%)
Hong Kongʼstotal exportsto US (LHS)
USʼ import demand (RHS)
Year-on-year rate of change (%)
Diagram 2.6 : Exports to the US likewise gathered pace
-12
-9
-6
-3
0
3
6
9
12
15
Q12013
Q12014
Q12015
Q12016
Q12017
Q12018
-12
-9
-6
-3
0
3
6
9
12
15
Year-on-yearrate of change (%)
Hong Kongʼstotal exports
to JapanJapanʼs import demand
Diagram 2.7 : Exports to Japan grew notably

27
Q12013
Q12014
Q12015
Q12016
Q12017
Q12018
-30
-15
0
15
30
45
60
Hong Kongʼstotal exports to
India
Year-on-year rate of change (%)
Indiaʼsimport demand
in US$
-30
-20
-10
0
10
20
30
40
50
Q12013
Q12014
Q12015
Q12016
Q12017
Q12018
-12
-8
-4
0
4
8
12
16
20
Year-on-year rate of change (%)
Hong Kongʼs total exports to Taiwan
(RHS)
Year-on-year rate of change (%)
Taiwanʼsimport demand(LHS)
Diagram 2.8 : Exports to India fell back after successive quarters of upsurge
Diagram 2.9 : Exports to Taiwan saw a strong recovery
HK$ / NT$(LHS)
Q12013
Q12014
Q12015
Q12016
Q12017
Q12018
-25
-20
-15
-10
-5
0
5
10
15
20
25 Year-on-year rate of change (%)
Hong Kongʼstotal exports to Korea
Koreaʼs import demand
in US$
Diagram 2.10 : Exports to Korea relapsed to moderate decline
Q12013
Q12014
Q12015
Q12016
Q12017
Q12018
-25
-20
-15
-10
-5
0
5
10
15
20
25 Year-on-year rate of change (%)Hong Kongʼs
total exports toSingapore
Singaporeʼsimport
demand in US$
Diagram 2.11 : Exports to Singapore rebounded visibly

28
Box 2.1
Recent labour market and inflation situations in the US
The labour market and inflation conditions in the US have long been closely watched over by financial market participants around the world, given their implications for policy actions by the US Federal Reserve (Fed), as the US central bank is committed to the dual mandate of fostering maximum employment and price stability. With improving prospect of the US economy, there have been of late firmer market expectations of gradual interest rate hikes in the US. It is thus worth reviewing the recent labour market and inflation situations in the US, in an attempt to shed more light on the US interest rate outlook. Month-to-month fluctuations aside, the US labour market created employment steadily in recent years. The non-farm payroll employment rose by a monthly average of around 202 000 in the first quarter in 2018(1), on par with the average monthly increase of around 209 000 over 2013-2017. Against this backdrop, the unemployment rate fell progressively over the years. In particular, it had hovered around 5% throughout 2016 and then followed a broad trend of gradual decline in 2017 to levels below those considered normal over the longer run by the Federal Open Market Committee (FOMC) members(2). It hit a 17-year low of 4.1% in October 2017, and has since stayed put (Chart 1a). Nonetheless, wages in the US only increased moderately in recent years. The year-on-year growth in average hourly earnings, at 2.7% in first quarter of 2018, was only somewhat higher than the 2.5% growth in 2017 and 2.6% in 2016 (Chart 1b).
Chart 1 : Unemployment rate fell to 17-year low, while wage pressure remained moderate
Generally speaking, a low unemployment rate usually signifies a tight labour market, which should in turn exert upward pressure on wages. Yet, a combination of low unemployment rate and a lack of obvious wage pressures tend to suggest that the unemployment rate alone may not paint a complete picture of the tightness of the labour market.
(1) Based on the statistics released on 6 April 2018. (2) In their meeting in March 2018, the central tendency of the normal unemployment rate over the longer run
as projected by FOMC members was in the range of 4.3%-4.7%.
Jan2007
Jan2008
Jan2009
Jan2010
Jan2011
Jan2012
Jan2013
Jan2014
Jan2015
Jan2016
Jan2017
Jan2018
0
2
4
6
8
10
12
-1,000
-800
-600
-400
-200
0
200
400
600
Monthly change in non-farmpayroll employment, s.a. (LHS)
Unemployment rate, s.a. (RHS)
Thousand (%)
(a) Employment growth and unemployment rate
Jan2008
Jan2009
Jan2010
Jan2011
Jan2012
Jan2013
Jan2014
Jan2015
Jan2016
Jan2017
Jan2018
0
1
2
3
4
Average hourly earnings
(b) Wage inflationYear-on-year rate of change (%)

29
Box 2.1 (Cont’d) A look at a wider range of labour market indicators may offer a more comprehensive view on the prevailing tightness of the labour market. For instance, an alternative gauge for slack in the labour market is the share of full-time workers in total employment, which fell sharply during the US recession in 2008-2009. It recovered gradually afterwards. The latest readings only fell short of its pre-crisis average in 2003-2007 by around 0.4 percentage point, equivalent to around 0.7 million of employed persons (Chart 2). Considering that there could be some structural factors behind a decline in the share of full-time workers such as changing industry structure or preference of workers, it seems that the extent of slackness in the US labour market, once prominent in the years following the 2008-2009 recession, has been rather close to being worked off. If we look at another indicator, the employment-to-population ratio for those at the prime working ages of 25-54, it has been on a rising trend and come close to its pre-crisis average level, also suggesting a closing gap between labour supply and demand (Chart 2).
Chart 2 : Slackness in labour market has been largely worked off
Chart 3: Wage growth could go up in the near term
As such, while the existence of some slackness in the labour market in the earlier period might be the factor underpinning the moderate increase in earnings to date, there is a possibility that wage growth can go up in the near term as the slackness has largely been worked off (Chart 3). In fact, taking a broader perspective, the output gap in the US economy, which has been in the negative domain since 2008, was largely closed in early 2018 (Chart 4). Considering that the US economy is widely expected to have above-trend growth in 2018 and 2019 with the extra demand boost from the tax cuts implemented late last year, the output gap should return to positive territory in the near term, rendering more inflationary pressure at the macro level. While inflationary pressure stays relatively modest at present, with core PCE deflator increasing by 1.9% y-o-y in March, it is likely to go up gradually in the near term. This would also be aided by the fading of some transient factors that held back inflation in the previous quarters (e.g. the price reduction in communication-related items). Nevertheless, the growth in labour productivity as observed of late, if continued, might continue to provide some offset to the increase in labour cost pressure (Chart 5). Meanwhile, inflation
74
75
76
77
78
79
80
81
82
83
84
2000
2001
2002
2003
2004
2005
2006
2007
2008
2009
2010
2011
2012
2013
2014
2015
2016
2017
2018
Average(2003-2007)
(%)
Share of full-time workers in total employment
Employment-to-population ratio for 25-54 age group
Average(2003-2007)
Jan2000
Jan2002
Jan2004
Jan2006
Jan2008
Jan2010
Jan2012
Jan2014
Jan2016
Jan2018
0.0
0.5
1.0
1.5
2.0
2.5
3.0
3.5
4.0
4.5
73
74
75
76
77
78
79
80
81
82
83
Employmet-to-population ratio for 25-54 agegroup (LHS)Average hourly earnings of private productionand non-supervisory employees (RHS)
(%) Year-on-year rate of change (%)
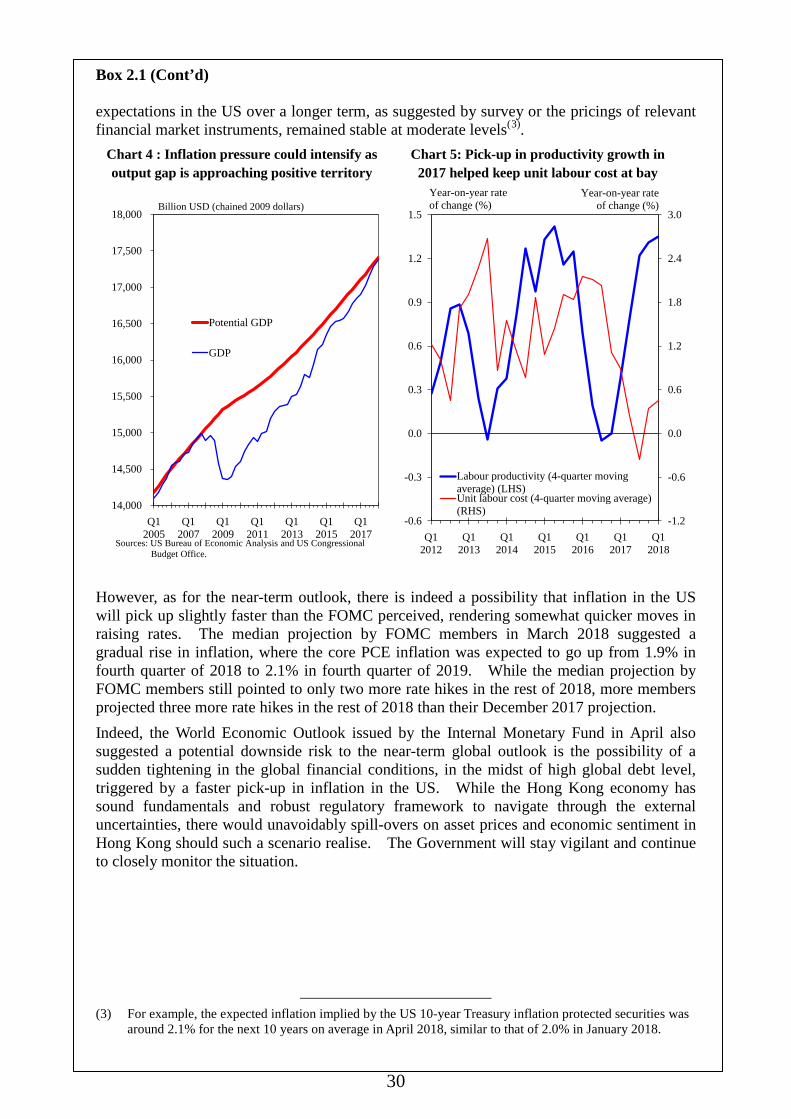
30
Box 2.1 (Cont’d) expectations in the US over a longer term, as suggested by survey or the pricings of relevant financial market instruments, remained stable at moderate levels(3).
Chart 4 : Inflation pressure could intensify as output gap is approaching positive territory
Chart 5: Pick-up in productivity growth in 2017 helped keep unit labour cost at bay
However, as for the near-term outlook, there is indeed a possibility that inflation in the US will pick up slightly faster than the FOMC perceived, rendering somewhat quicker moves in raising rates. The median projection by FOMC members in March 2018 suggested a gradual rise in inflation, where the core PCE inflation was expected to go up from 1.9% in fourth quarter of 2018 to 2.1% in fourth quarter of 2019. While the median projection by FOMC members still pointed to only two more rate hikes in the rest of 2018, more members projected three more rate hikes in the rest of 2018 than their December 2017 projection. Indeed, the World Economic Outlook issued by the Internal Monetary Fund in April also suggested a potential downside risk to the near-term global outlook is the possibility of a sudden tightening in the global financial conditions, in the midst of high global debt level, triggered by a faster pick-up in inflation in the US. While the Hong Kong economy has sound fundamentals and robust regulatory framework to navigate through the external uncertainties, there would unavoidably spill-overs on asset prices and economic sentiment in Hong Kong should such a scenario realise. The Government will stay vigilant and continue to closely monitor the situation.
(3) For example, the expected inflation implied by the US 10-year Treasury inflation protected securities was
around 2.1% for the next 10 years on average in April 2018, similar to that of 2.0% in January 2018.
Q12005
Q12007
Q12009
Q12011
Q12013
Q12015
Q12017
14,000
14,500
15,000
15,500
16,000
16,500
17,000
17,500
18,000
Potential GDP
GDP
Billion USD (chained 2009 dollars)
Sources: US Bureau of Economic Analysis and US Congressional Budget Office.
Q12012
Q12013
Q12014
Q12015
Q12016
Q12017
Q12018
-1.2
-0.6
0.0
0.6
1.2
1.8
2.4
3.0
-0.6
-0.3
0.0
0.3
0.6
0.9
1.2
1.5
Labour productivity (4-quarter movingaverage) (LHS)Unit labour cost (4-quarter moving average)(RHS)
Year-on-year rate of change (%)
Year-on-year rate of change (%)
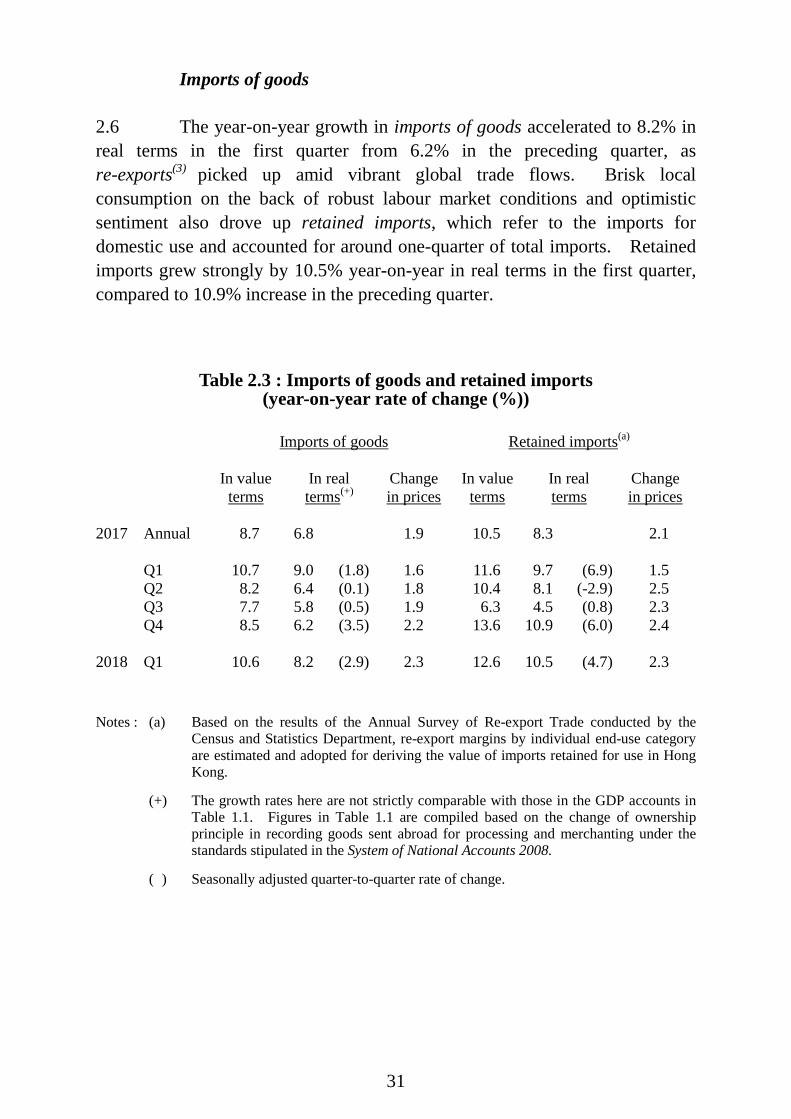
31
Imports of goods 2.6 The year-on-year growth in imports of goods accelerated to 8.2% in real terms in the first quarter from 6.2% in the preceding quarter, as re-exports(3) picked up amid vibrant global trade flows. Brisk local consumption on the back of robust labour market conditions and optimistic sentiment also drove up retained imports, which refer to the imports for domestic use and accounted for around one-quarter of total imports. Retained imports grew strongly by 10.5% year-on-year in real terms in the first quarter, compared to 10.9% increase in the preceding quarter.
Table 2.3 : Imports of goods and retained imports (year-on-year rate of change (%))
Imports of goods
Retained imports(a)
In value terms
In real terms(+)
Change in prices
In value terms
In real terms
Change in prices
2017 Annual
8.7 6.8 1.9 10.5 8.3 2.1
Q1 10.7 9.0 (1.8) 1.6 11.6 9.7 (6.9) 1.5 Q2 8.2 6.4 (0.1) 1.8 10.4 8.1 (-2.9) 2.5 Q3 7.7 5.8 (0.5) 1.9 6.3 4.5 (0.8) 2.3 Q4
8.5 6.2 (3.5) 2.2 13.6 10.9 (6.0) 2.4
2018 Q1 10.6 8.2 (2.9) 2.3 12.6 10.5 (4.7) 2.3 Notes : (a) Based on the results of the Annual Survey of Re-export Trade conducted by the
Census and Statistics Department, re-export margins by individual end-use category are estimated and adopted for deriving the value of imports retained for use in Hong Kong.
(+) The growth rates here are not strictly comparable with those in the GDP accounts in Table 1.1. Figures in Table 1.1 are compiled based on the change of ownership principle in recording goods sent abroad for processing and merchanting under the standards stipulated in the System of National Accounts 2008.
( ) Seasonally adjusted quarter-to-quarter rate of change.
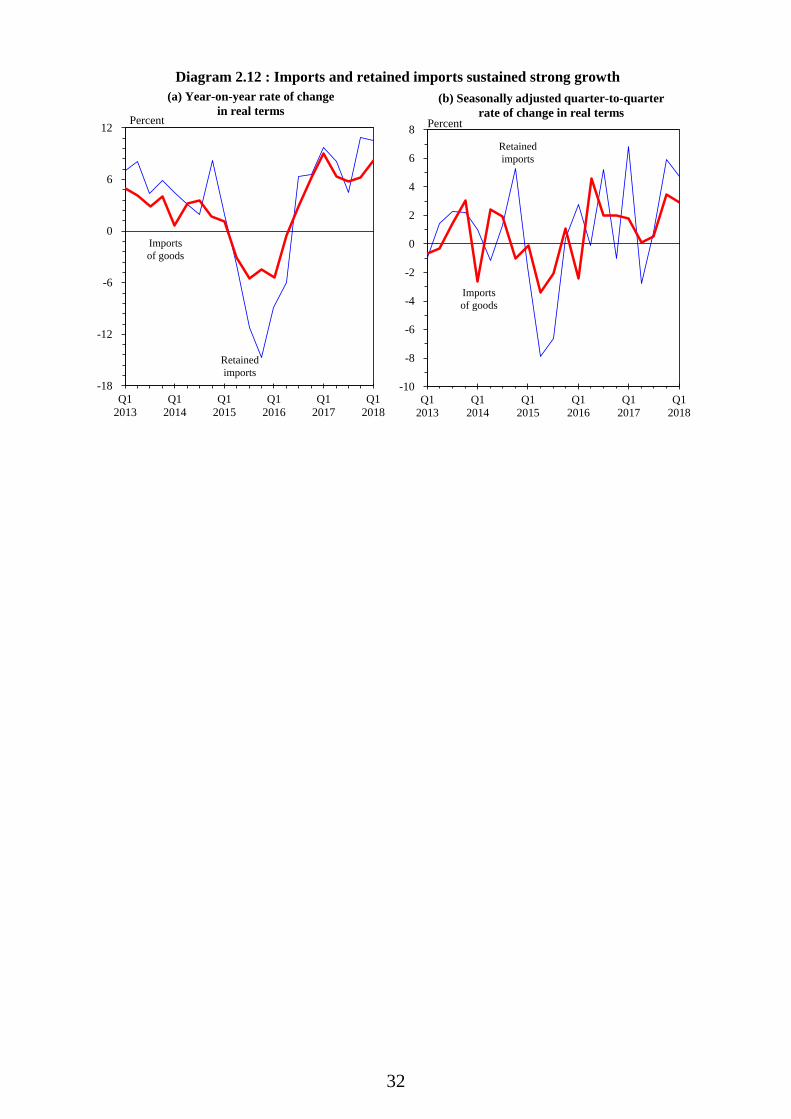
32
Q12013
Q12014
Q12015
Q12016
Q12017
Q12018
-18
-12
-6
0
6
12 Percent
Retainedimports
Importsof goods
(a) Year-on-year rate of changein real terms
Q12013
Q12014
Q12015
Q12016
Q12017
Q12018
-10
-8
-6
-4
-2
0
2
4
6
8 Percent
(b) Seasonally adjusted quarter-to-quarterrate of change in real terms
Retainedimports
Importsof goods
Diagram 2.12 : Imports and retained imports sustained strong growth

33
Services trade Exports of services
2.7 Exports of services likewise displayed strength, benefitting from the favourable global economic environment and picking up to show a broad-based growth of 7.5% year-on-year in real terms in the first quarter, the fastest growth since the second quarter of 2013. Exports of travel services strengthened further to show double-digit growth of 11.8%, on the back of strong growth in visitor arrivals and improvement in tourist spending. Notwithstanding some jitters during the quarter, various major stock markets in the world were generally on a higher plateau in the first quarter than a year earlier, accompanied by active global financial market activities. In tandem, exports of financial services also picked up visibly to show double-digit growth. Exports of transport services sustained solid growth amid flourishing global trade flows. Meanwhile, exports of business and other services grew steadily.
Financial services
$54.5 billion(23.7%)
Business and other services $42.2 billion
(18.4%)
Q12013
Q12014
Q12015
Q12016
Q12017
Q12018
-10
-5
0
5
10 Percent
Diagram 2.14 : Exports of services saw the fastest growth in nearly five years
Diagram 2.13 : Travel, transport and financial services are major service components
within exports of services
Exports of services in the first quarter of 2018:$229.8 billion
Transport $58.7 billion
(25.5%)
Seasonally adjustedquarter-to-quarter
rate of change in real terms
Travel $74.4 billion
(32.4%)Year-on-yearrate of changein real terms
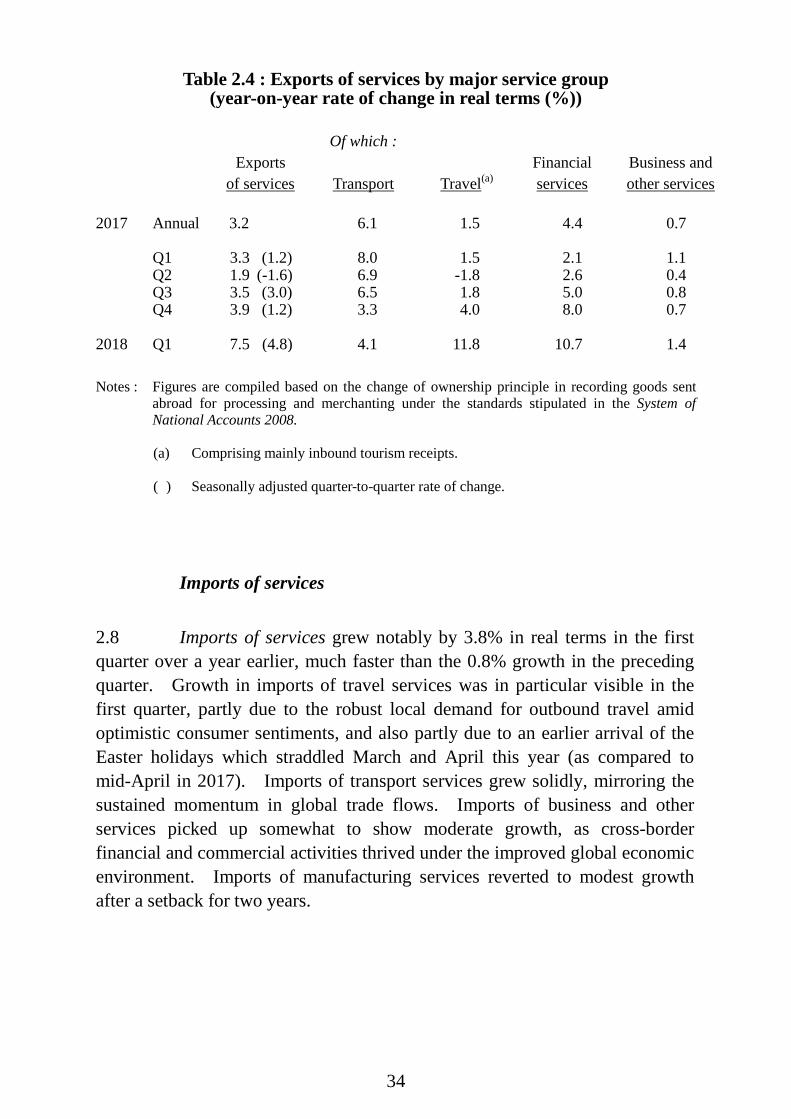
34
Table 2.4 : Exports of services by major service group (year-on-year rate of change in real terms (%))
Exports of services
Of which :
Transport
Travel(a)
Financial services
Business and other services
2017 Annual
3.2 6.1 1.5 4.4 0.7
Q1 3.3 (1.2) 8.0 1.5 2.1 1.1 Q2 1.9 (-1.6) 6.9 -1.8 2.6 0.4 Q3 3.5 (3.0) 6.5 1.8 5.0 0.8 Q4
3.9 (1.2) 3.3 4.0 8.0 0.7
2018 Q1 7.5 (4.8) 4.1 11.8 10.7 1.4
Notes : Figures are compiled based on the change of ownership principle in recording goods sent
abroad for processing and merchanting under the standards stipulated in the System of National Accounts 2008.
(a) Comprising mainly inbound tourism receipts. ( ) Seasonally adjusted quarter-to-quarter rate of change.
Imports of services
2.8 Imports of services grew notably by 3.8% in real terms in the first quarter over a year earlier, much faster than the 0.8% growth in the preceding quarter. Growth in imports of travel services was in particular visible in the first quarter, partly due to the robust local demand for outbound travel amid optimistic consumer sentiments, and also partly due to an earlier arrival of the Easter holidays which straddled March and April this year (as compared to mid-April in 2017). Imports of transport services grew solidly, mirroring the sustained momentum in global trade flows. Imports of business and other services picked up somewhat to show moderate growth, as cross-border financial and commercial activities thrived under the improved global economic environment. Imports of manufacturing services reverted to modest growth after a setback for two years.
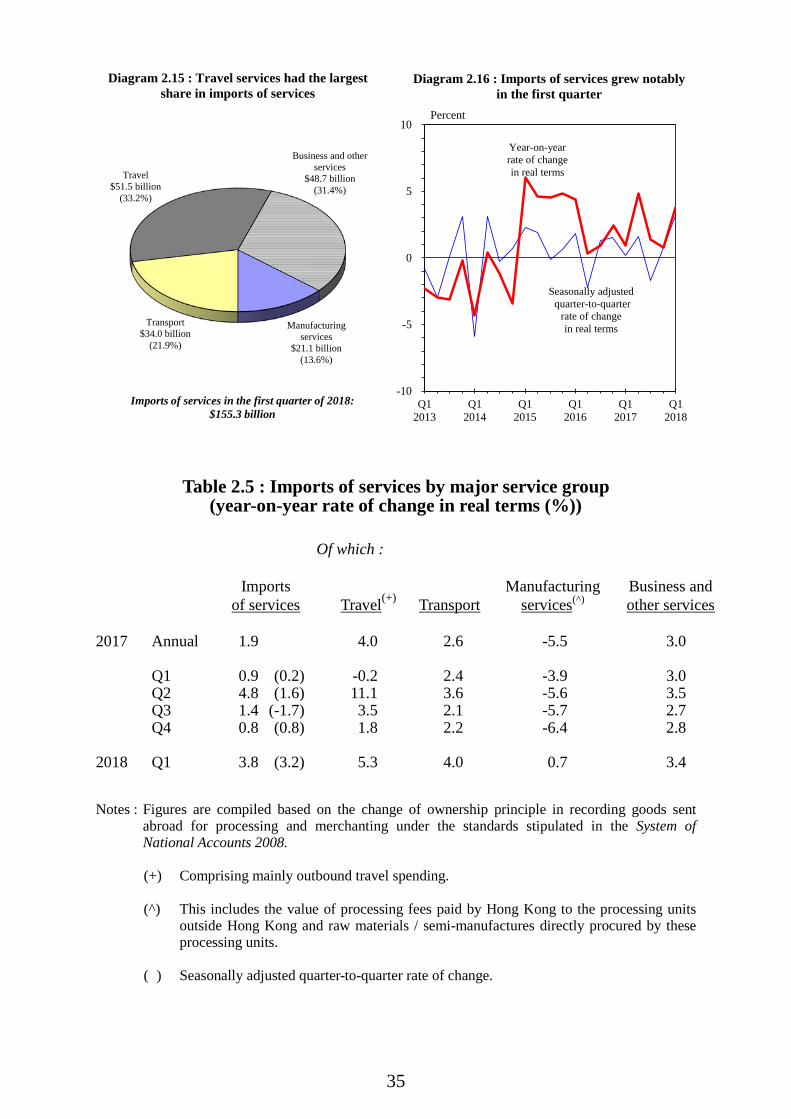
35
Table 2.5 : Imports of services by major service group (year-on-year rate of change in real terms (%))
Of which :
Imports of services
Travel(+)
Transport
Manufacturing
services(^)
Business and other services
2017 Annual
1.9 4.0 2.6 -5.5 3.0
Q1 0.9 (0.2) -0.2 2.4 -3.9 3.0 Q2 4.8 (1.6) 11.1 3.6 -5.6 3.5 Q3 1.4 (-1.7) 3.5 2.1 -5.7 2.7 Q4
0.8 (0.8) 1.8 2.2 -6.4 2.8
2018 Q1 3.8 (3.2) 5.3 4.0 0.7 3.4 Notes : Figures are compiled based on the change of ownership principle in recording goods sent
abroad for processing and merchanting under the standards stipulated in the System of National Accounts 2008.
(+) Comprising mainly outbound travel spending. (^) This includes the value of processing fees paid by Hong Kong to the processing units
outside Hong Kong and raw materials / semi-manufactures directly procured by these processing units.
( ) Seasonally adjusted quarter-to-quarter rate of change.
Travel $51.5 billion
(33.2%)
Diagram 2.15 : Travel services had the largest share in imports of services
Q12013
Q12014
Q12015
Q12016
Q12017
Q12018
-10
-5
0
5
10Percent
Diagram 2.16 : Imports of services grew notably in the first quarter
Year-on-yearrate of changein real terms
Imports of services in the first quarter of 2018:$155.3 billion
Seasonally adjustedquarter-to-quarter
rate of change in real terms
Business and other services
$48.7 billion(31.4%)
Transport $34.0 billion
(21.9%)
Manufacturing services
$21.1 billion(13.6%)

36
Goods and services balance 2.9 Based on the GDP accounting framework, the goods deficit in the first quarter widened from a year earlier, as the growth in imports of goods amid robust domestic demand outpaced that in exports of goods. With the goods deficit partly offset by the surplus in services trade, the combined goods and services account registered a small deficit of $2 billion in the first quarter of 2018, equivalent to 0.2% of total import value, as compared to a small surplus of $5 billion (or 0.5% of total import value) in the first quarter of 2017.
Table 2.6 : Goods and services balance
($ billion at current market prices)
Total exports Imports Trade balance
Goods Services
Goods
Services
Goods
Services
Combined
As % of imports
2017 Annual 4,191 811 4,378 601 -187 211 24 0.5 Q1 941 203 998 141 -57 62 5 0.5 Q2 995 184 1,063 143 -68 41 -27 -2.2 Q3 1,099 208 1,116 154 -17 53 37 2.9 Q4
1,156 216 1,201 162 -46 55 9 0.6
2018 Q1 1,017 230 1,094 155 -77 75 -2 -0.2
Notes : Figures are compiled based on the change of ownership principle in recording goods sent
abroad for processing and merchanting under the standards stipulated in the System of National Accounts 2008.
Figures may not add up exactly to the total due to rounding. Other developments 2.10 To strengthen and consolidate Hong Kong’s edge as an international trading and business centre, the Financial Secretary in the 2018-19 Budget highlighted the key strategy of enlarging the hinterland for business development of Hong Kong enterprises and expanding the boundaries and scale of Hong Kong’s market. Against this backdrop, the Budget pledged that the Government will actively seek to sign FTAs, IPPAs and CDTAs with other economies, including those along the Belt and Road, in order to facilitate trade and investment flows between Hong Kong and other economies in the world. In March, the Government signed a CDTA with India, which will help attract more enterprises to use Hong Kong as their base for overseas investments and bring trade relations between the two places to a new level. Also, Hong Kong and the UK issued a Joint Statement on Closer Collaboration between UK and
37
Hong Kong on Trade and Economic Matters in March, with collaboration areas covering global free trade, innovation, creative industries and the Belt and Road Initiative. 2.11 The Government has been proactively implementing policies and measures to tap opportunities arising from the Belt and Road Initiative. In February, the Government held a large-scale Belt and Road seminar in Beijing to promote Hong Kong’s distinctive edge in finance and investment, professional services, and commerce and trade to Mainland ministries and state-owned enterprises. Separately, in March, the Secretary for Commerce and Economic Development led a Hong Kong delegation of business people and professional service providers to visit Cambodia and Vietnam to establish closer economic ties with economies along the Belt and Road. 2.12 The Bay Area development is another national policy of strategic significance to Hong Kong. The Budget stressed the enormous potential in the Bay Area market for Hong Kong’s financial and high-end service industries, a huge room of complementarity between Hong Kong and the rest of the Bay Area in such areas as the innovation and technology industries and land resources. According to the Government Work Report of the State Council as announced in early March, a detailed development plan for the Bay Area will be unveiled and implemented soon to encourage a freer flow of talents, goods, capital and information within the region, with the aspiration of building it into a world-class city cluster. 2.13 As to the trading and logistics industry, the Government set aside $5 billion in the Budget for the redevelopment of the Air Mail Centre at the Hong Kong International Airport. Separately, to encourage the trading and logistics industry to move up the value chain, the Government announced in the Budget to cap the trade declaration charge at $200 to further lower the cost of importing and exporting high-value goods to and from Hong Kong.
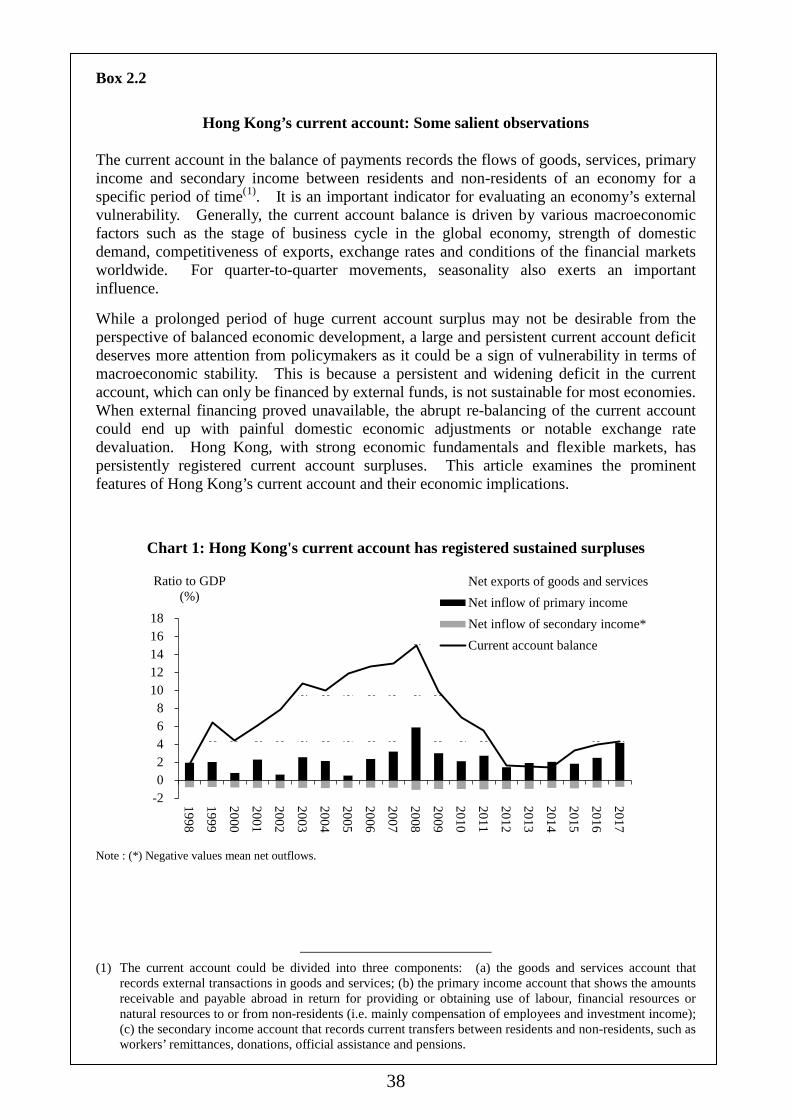
38
Box 2.2
Hong Kong’s current account: Some salient observations
The current account in the balance of payments records the flows of goods, services, primary income and secondary income between residents and non-residents of an economy for a specific period of time(1). It is an important indicator for evaluating an economy’s external vulnerability. Generally, the current account balance is driven by various macroeconomic factors such as the stage of business cycle in the global economy, strength of domestic demand, competitiveness of exports, exchange rates and conditions of the financial markets worldwide. For quarter-to-quarter movements, seasonality also exerts an important influence.
While a prolonged period of huge current account surplus may not be desirable from the perspective of balanced economic development, a large and persistent current account deficit deserves more attention from policymakers as it could be a sign of vulnerability in terms of macroeconomic stability. This is because a persistent and widening deficit in the current account, which can only be financed by external funds, is not sustainable for most economies. When external financing proved unavailable, the abrupt re-balancing of the current account could end up with painful domestic economic adjustments or notable exchange rate devaluation. Hong Kong, with strong economic fundamentals and flexible markets, has persistently registered current account surpluses. This article examines the prominent features of Hong Kong’s current account and their economic implications.
Chart 1: Hong Kong's current account has registered sustained surpluses
Note : (*) Negative values mean net outflows.
(1) The current account could be divided into three components: (a) the goods and services account that records external transactions in goods and services; (b) the primary income account that shows the amounts receivable and payable abroad in return for providing or obtaining use of labour, financial resources or natural resources to or from non-residents (i.e. mainly compensation of employees and investment income); (c) the secondary income account that records current transfers between residents and non-residents, such as workers’ remittances, donations, official assistance and pensions.
-202468
1012141618
1998
1999
2000
2001
2002
2003
2004
2005
2006
2007
2008
2009
2010
2011
2012
2013
2014
2015
2016
2017
Ratio to GDP (%)
Net exports of goods and servicesNet inflow of primary incomeNet inflow of secondary income*Current account balance

39
Box 2.2 (Cont’d)
Hong Kong ran a current account surplus every year over the past twenty years (see Chart 1), with its size following the ebb and flow of global economic developments. Following the Mainland's accession to the World Trade Organization (WTO) in 2001, Hong Kong as a conduit between the Mainland and the rest of the world in trading activities gained in significance. The current account surplus surged from 1.7% of GDP in 1998 to 15.0% of GDP in 2008. However, the current account surplus shrank after the outbreak of the Global Financial Crisis (GFC) in 2008, to 1.4% of GDP in 2014, as the reduced demand from the advanced economies dragged our exports. In recent years, the current account surplus climbed up again, to 4.3% of GDP in 2017.
On average, the current account surplus in Hong Kong was smaller in the post-GFC period as compared with the preceding decade, weighed by the shrinking size of net exports of goods and services.
The smaller net exports of goods and services in Hong Kong in the post-GFC period were partly due to the slow and bumpy global economic recovery during the period. Major advanced economies had undergone a prolonged period of deleveraging. The European economy was further dented by the sovereign debt crisis. Held back by the flagging global demand, exports of goods and services grew by just 2.5% per annum in nominal terms in the five-year period from 2011 to 2016, only to register visible growth in 2017 in tandem with the synchronised global economic upturn. Yet, domestic demand in Hong Kong was rather resilient during most of the period after GFC, underpinned by the full-employment labour market conditions since 2011. To a lesser extent, the positive wealth effects arising from rising asset prices amid ultra-loose global monetary conditions also boosted local consumption sentiment. Thanks to the resilient domestic demand, retained imports were bolstered. Taken together, net exports of goods and services became smaller in the post-GFC period, driving down the current account surplus. Nonetheless, Hong Kong, as a mainly service economy, attained annual surpluses in net exports of goods and services throughout the past two decades, reflecting our strong competitiveness as a service provider bridging the Mainland and the rest of the world.
The sustained positive current account balances point to a healthy Hong Kong economy from the perspective of external vulnerability, as the economy has not consumed or invested beyond what it earned domestically or externally during the period(2). It has also enabled the economy to accumulate vast external financial assets on net over years. Our net International Investment Position (IIP) reached 409% of GDP at end-2017, up significantly from 287% of GDP in 2008. This means that Hong Kong is a net exporter of capital to the rest of the world. Both external financial assets and liabilities were huge, at 1606% of GDP and 1197% of GDP respectively at end-2017, a typical feature of a prominent international financial centre. The large net IIP position provides us with a strong buffer in the presence of global financial volatilities.
(2) Analytically, current account balance can be interpreted as the difference between gross savings and gross domestic capital formation. Gross savings refer to the residual by subtracting private consumption expenditure and government consumption expenditure from gross national disposable income. Gross national disposable income is the sum of GDP and the net inflow of primary and secondary income.

40
Box 2.2 (Cont’d)
Chart 2: Rising net external assets have driven up the net inflow of primary income in recent years
As a net creditor, Hong Kong has enjoyed a net primary income inflow (the other major component of the current account on top of net exports of goods and services(3)) over the past two decades (see Chart 2). In the run-up to the 2008 GFC, the net primary income inflow climbed up, attributable to the upbeat financial markets worldwide and increased rates of returns on external financial assets from 2004 to 2008. Nevertheless, the net primary income inflow fell after the GFC amid the “new normal” of lower yields that affected investments in general. During 2015-2017, the net primary income inflow saw a sharper uptick despite the persistence of low-yield environment, on the back of the rapid increase in Hong Kong’s net IIP, in which the increases in portfolio investment and reserve assets were most prominent. In fact, the net inflow of primary income reached a record high of $110.7 billion in 2017, contributed mainly by the increases in the net inflow of portfolio investment income and reserve assets income against the backdrop of buoyant global financial markets.
The increased net inflow of primary income raised the total income available to Hong Kong residents. In particular, with the net primary income inflow as a ratio to GDP rising from 0.8% in 2000 to 4.2% in 2017, there was slightly faster growth of nominal Gross National Income (GNI(4))than its GDP counterpart over the period, at 4.3% per annum versus 4.1% per annum in Hong Kong. In particular for 2017, thanks mainly to the robust net primary income inflow amid a synchronized global economic upturn, nominal GNI rose markedly by 8.6%, outpacing the growth of nominal GDP by 1.8 percentage points.
In conclusion, Hong Kong’s current account has been persistently in surplus since data available 20 years ago, resulting in a huge amount of net external financial assets, which provide the economy with a strong cushion against sudden external shocks.
(3) There has long been a small net outflow in secondary income in Hong Kong over the years. However, the net outflow had been rather stable and should be analytically insignificant in terms of macroeconomic stability.
(4) GNI denotes the total income earned by residents of an economy from engaging in various economic
activities, irrespective of whether the economic activities are carried out within the economic territory of the economy or outside. In other words, GNI is obtained by adding to GDP the primary income earned by residents from outside the economic territory and deducting primary income earned by non-residents from within the economic territory.
050100150200250300350400450
0
1
2
3
4
5
6
7
2000
2001
2002
2003
2004
2005
2006
2007
2008
2009
2010
2011
2012
2013
2014
2015
2016
2017
Ratio to GDP (%)
Ratio to GDP (%) Net inflow of primary income (LHS)
Net International Investment Position (RHS)
41
Notes : (1) Changes in merchandise exports and imports in real terms are derived by discounting
the effect of price changes from changes in the value of the trade aggregates. Estimates of price changes for the trade aggregates are based on changes in unit values, which do not take into account changes in the composition or quality of the goods traded, except for some selected commodities for which specific price indices are available. The real growth figures reported here are based on the external trade quantum index series compiled using the chain linking approach, which were first released in March 2015 to replace the previous trade index numbers compiled using the Laspeyres method with a fixed base year. The series are not comparable with the real trade aggregates under GDP (reported in Chapter 1) which are compiled based on the change of ownership principle in recording goods sent abroad for processing and merchanting under the standards stipulated in the System of National Accounts 2008. Apart from this, non-monetary gold is recorded as a separate item in the statistics of merchandise trade and not included in the trade aggregates reported in Chapter 2, but is included in the trade aggregates under GDP in accordance to the international compilation standard.
(2) As far as Hong Kong’s trade flows are concerned, the tariff measures imposed by the US on their imports from the Mainland would also be applied to Hong Kong’s re-exports of the Mainland origin to the US. Separately, Hong Kong’s offshore trade involving the two sides would also be affected. For the products affected by tariffs already implemented by the US earlier this year (i.e. washing machines, solar panels, specific items in steel and aluminium), the value of re-export trade flows from the Mainland through Hong Kong to the US should be relatively small. Using 2017 as the reference year, it is estimated that the value of re-export trade flows affected would be equivalent to less than 0.02% of Hong Kong’s total exports of goods. For the list of items proposed by the USTR targeted at imports from the Mainland as announced on 3 April 2018, again using 2017 as the reference year, it is crudely estimated that the value of those affected goods would amount to some 19% of Hong Kong’s re-exports of Mainland origin to the US or around HK$52 billion, constituting around 1.3% of Hong Kong’s total exports of goods.
(3) Re-exports are those goods which have previously been imported into Hong Kong and
are subsequently exported without having undergone in Hong Kong any manufacturing processes which change permanently the shape, nature, form or utility of the goods.
42
CHAPTER 3 : DEVELOPMENTS IN SELECTED SECTORS Summary The residential property market remained buoyant in the first quarter of
2018, supported by a still tight demand-supply balance of flats and generally low local interest rates. Trading stayed generally active, while flat prices rose further by 4% during the quarter.
Reflecting the Government’s sustained efforts to increase land and flat supply, total flat supply in the coming three to four years stayed at a high level of 96 000 units as estimated at end-March 2018.
For the commercial and industrial property markets, sale prices of office
space, retail shop space and flatted factory space all increased during the first quarter, but their rentals exhibited diverse movements. Meanwhile, trading activities of different market segments showed mixed performance.
Inbound tourism gathered further momentum in the first quarter, mainly driven by the sharp increase in Mainland visitors. Overall visitor arrivals rose by an accelerated 9.6% over a year earlier to 15.6 million.
The logistics sector put up a mixed performance in the first quarter. Total container throughput edged down by 0.6% from a year earlier, while air freight throughput rose further by 4.2%.
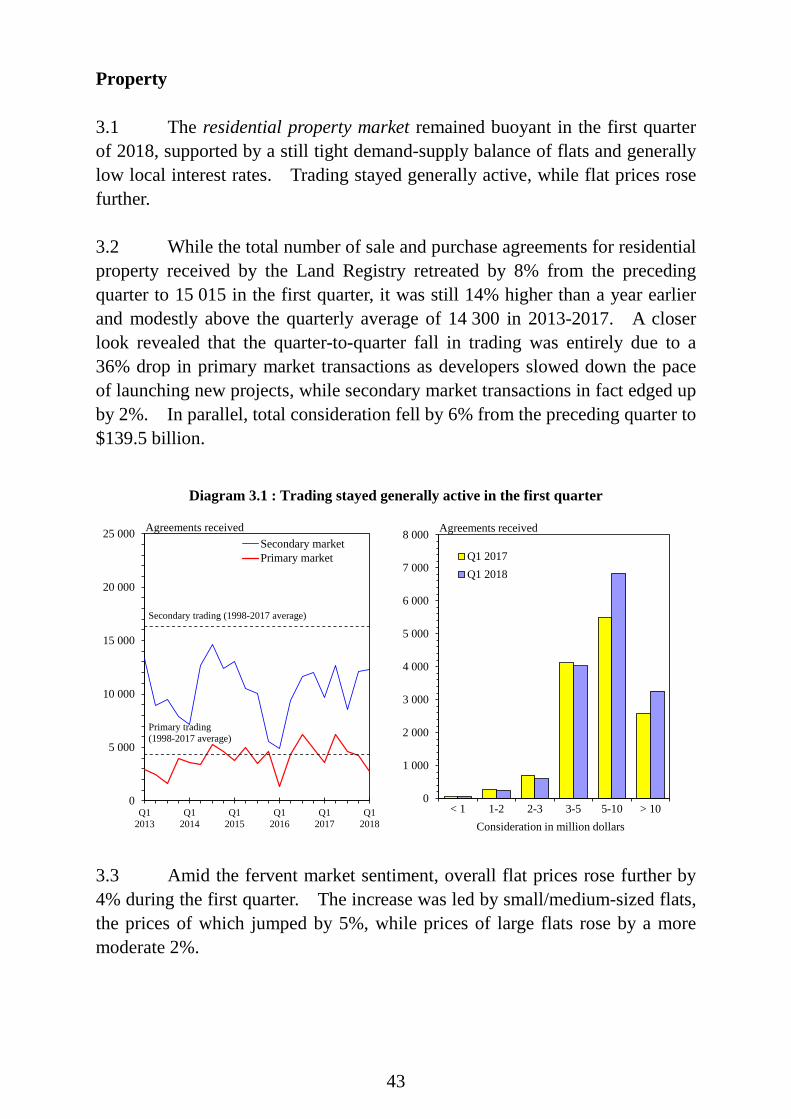
43
Property 3.1 The residential property market remained buoyant in the first quarter of 2018, supported by a still tight demand-supply balance of flats and generally low local interest rates. Trading stayed generally active, while flat prices rose further. 3.2 While the total number of sale and purchase agreements for residential property received by the Land Registry retreated by 8% from the preceding quarter to 15 015 in the first quarter, it was still 14% higher than a year earlier and modestly above the quarterly average of 14 300 in 2013-2017. A closer look revealed that the quarter-to-quarter fall in trading was entirely due to a 36% drop in primary market transactions as developers slowed down the pace of launching new projects, while secondary market transactions in fact edged up by 2%. In parallel, total consideration fell by 6% from the preceding quarter to $139.5 billion.
0
1 000
2 000
3 000
4 000
5 000
6 000
7 000
8 000
< 1 1-2 2-3 3-5 5-10 > 10
Q1 2017Q1 2018
Agreements received
Primary market
Consideration in million dollarsQ1
2013Q1
2014Q1
2015Q1
2016Q1
2017Q1
2018
0
5 000
10 000
15 000
20 000
25 000Secondary marketPrimary market
Agreements received
Primary trading(1998-2017 average)
Secondary trading (1998-2017 average)
Diagram 3.1 : Trading stayed generally active in the first quarter
3.3 Amid the fervent market sentiment, overall flat prices rose further by 4% during the first quarter. The increase was led by small/medium-sized flats, the prices of which jumped by 5%, while prices of large flats rose by a more moderate 2%.

44
3.4 Overall flat rentals went up by 1% during the first quarter. Analysed by size, rentals of small/medium-sized flats increased by 1%, while those of large flats were virtually flat. The average rental yield for residential property stayed at 2.5% in March 2018, unchanged from December 2017.
2013 2014 2015 2016 2017 201850
60
70
80
90
100
110
120
130
140
150
160
Large flats All flats Small/medium-sized flats
Index (Oct 1997=100)(b) Rentals
Introduction of DSD
Introduction ofNRSD
2013 2014 2015 2016 2017 20185060708090
100110120130140150160170180190200210220230
Large flats All flats Small/medium-sized flats
Index (Oct 1997=100)(a) Prices
Introduction of Double Stamp Duty (DSD)
Introduction of New Residential
Stamp Duty (NRSD)
Diagram 3.2 : Flat prices and rentals continued to rise during the first quarter
Note : Residential property price index pertains to secondary market transactions only. Large flats refer to those with a saleable area of atleast 100 m2, and small/medium-sized flats with a saleable area of less than 100 m2.
3.5 As a result of the surge over the past several years, overall flat prices in March 2018 exceeded the 1997 peak by 113%. The index of home purchase affordability (i.e. the ratio of mortgage payment for a 45-square metre flat to median income of households, excluding those living in public housing) worsened to around 71% in the first quarter, significantly above the long-term average of 44% over 1998-2017. Should interest rates rise by three percentage points to a more normal level, the ratio would soar to 93%.
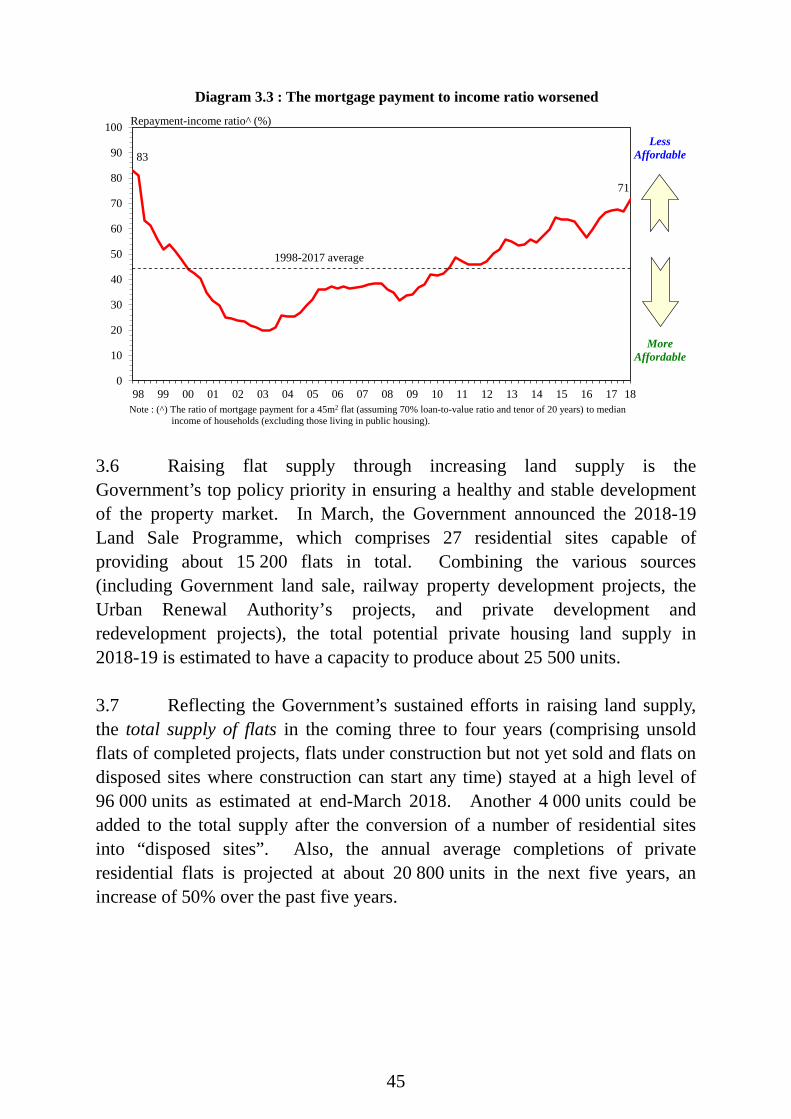
45
98 99 00 01 02 03 04 05 06 07 08 09 10 11 12 13 14 15 16 17 180
10
20
30
40
50
60
70
80
90
100 Repayment-income ratio^ (%)
Diagram 3.3 : The mortgage payment to income ratio worsened
83
1998-2017 average
71
Note : (^) The ratio of mortgage payment for a 45m2 flat (assuming 70% loan-to-value ratio and tenor of 20 years) to median income of households (excluding those living in public housing).
MoreAffordable
LessAffordable
3.6 Raising flat supply through increasing land supply is the Government’s top policy priority in ensuring a healthy and stable development of the property market. In March, the Government announced the 2018-19 Land Sale Programme, which comprises 27 residential sites capable of providing about 15 200 flats in total. Combining the various sources (including Government land sale, railway property development projects, the Urban Renewal Authority’s projects, and private development and redevelopment projects), the total potential private housing land supply in 2018-19 is estimated to have a capacity to produce about 25 500 units. 3.7 Reflecting the Government’s sustained efforts in raising land supply, the total supply of flats in the coming three to four years (comprising unsold flats of completed projects, flats under construction but not yet sold and flats on disposed sites where construction can start any time) stayed at a high level of 96 000 units as estimated at end-March 2018. Another 4 000 units could be added to the total supply after the conversion of a number of residential sites into “disposed sites”. Also, the annual average completions of private residential flats is projected at about 20 800 units in the next five years, an increase of 50% over the past five years.

46
3.8 The Government has also put in significant efforts to manage demand and reduce the possible risks to financial stability arising from an exuberant property market(1). These measures have yielded notable results. On speculative activities, the number of short-term resale (comprising confirmor transactions and resale within 24 months after assignment) remained low at 48 cases per month or 0.8% of total transactions in the first quarter, well below the monthly average of 2 661 cases or 20.0% in January to November 2010 (i.e. the period before the introduction of the Special Stamp Duty). Reflecting the effects of the Buyer’s Stamp Duty, purchases by non-local individuals and non-local companies also stayed low at 61 cases per month or 1.0% of total transactions in the first quarter, much lower than the monthly average of 365 cases or 4.5% in January to October 2012. As an indicator of investment activities, purchases subject to the New Residential Stamp Duty stayed at a modest level of 701 cases per month or 11.6% of total transactions in the first quarter, markedly lower than the monthly average of 1 412 cases subject to Double Stamp Duty or 26.5% in January-November 2016. As to mortgage lending, the average loan-to-value ratio of new mortgages was 49% in the first quarter, likewise considerably below the average of 64% in January to October 2009 before the first round of macro-prudential measures for residential property mortgage lending was introduced by the Hong Kong Monetary Authority.
0
5
10
15
20
25
30
0
1 000
2 000
3 000
4 000
5 000
6 000
7 000
8 000
9 000
10 000
11 000
12 000
Q12010
Q12011
Q12012
Q12013
Q12014
Q12015
Q12016
Q12017
Q12018
Number
Diagram 3.4 : Speculative activities stayed subdued
Share of total transactions (%)
Resale within 24 months after assignment (LHS)
Confirmor transactions (LHS)
Confirmor transactions and short-term resale cases within 24 months as a share of total transactions (RHS)
Note : Confirmor transactions refer to resale before assignment.
Introduction of Special Stamp Duty
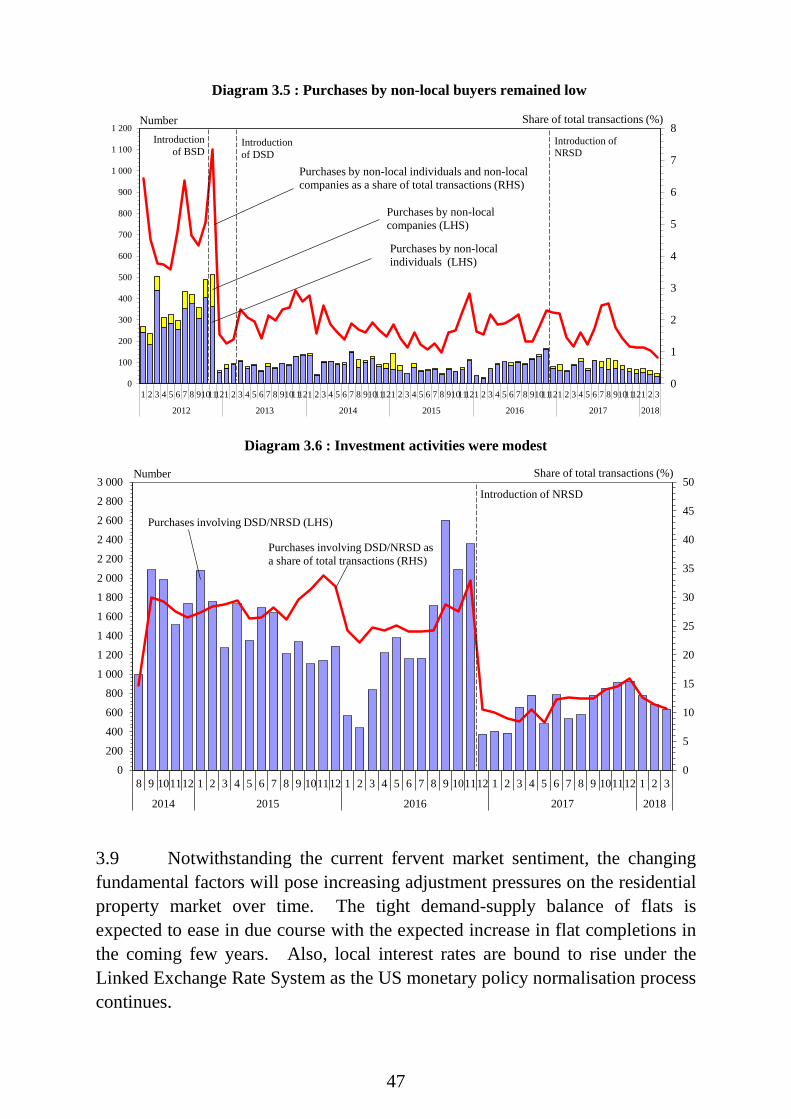
47
0
1
2
3
4
5
6
7
8
0
100
200
300
400
500
600
700
800
900
1 000
1 100
1 200
1 2 3 4 5 6 7 8 91011121 2 3 4 5 6 7 8 91011121 2 3 4 5 6 7 8 91011121 2 3 4 5 6 7 8 91011121 2 3 4 5 6 7 8 91011121 2 3 4 5 6 7 8 91011121 2 3
2012 2013 2014 2015 2016 2017 2018
Share of total transactions (%)
Diagram 3.5 : Purchases by non-local buyers remained low
Purchases by non-local individuals and non-localcompanies as a share of total transactions (RHS)
Purchases by non-local individuals (LHS)
Purchases by non-local companies (LHS)
Number
Introduction of DSD
Introduction of NRSD
Introduction of BSD
0
5
10
15
20
25
30
35
40
45
50
0
200
400
600
800
1 000
1 200
1 400
1 600
1 800
2 000
2 200
2 400
2 600
2 800
3 000
8 9 101112 1 2 3 4 5 6 7 8 9 101112 1 2 3 4 5 6 7 8 9 101112 1 2 3 4 5 6 7 8 9 101112 1 2 3
2014 2015 2016 2017 2018
Diagram 3.6 : Investment activities were modest
Number Share of total transactions (%)
Purchases involving DSD/NRSD (LHS)
Purchases involving DSD/NRSD as a share of total transactions (RHS)
Introduction of NRSD
3.9 Notwithstanding the current fervent market sentiment, the changing fundamental factors will pose increasing adjustment pressures on the residential property market over time. The tight demand-supply balance of flats is expected to ease in due course with the expected increase in flat completions in the coming few years. Also, local interest rates are bound to rise under the Linked Exchange Rate System as the US monetary policy normalisation process continues.

48
3.10 For the commercial and industrial property markets, sale prices of office space, retail shop space and flatted factory space all increased during the first quarter, but their rentals exhibited diverse movements. Meanwhile, trading activities of different market segments showed mixed performance. 3.11 Comparing March 2018 with December 2017, overall sale prices of office space went up by 4%. Within the total, prices of Grade A, B and C office space rose by 6%, 2% and 2% respectively. Over the same period, overall rentals stayed virtually unchanged. Within the total, rentals of Grade A and C office space stayed virtually flat, while rentals of Grade B office space edged up by 1%. The average rental yields of Grade A, B and C office space were 2.4%, 2.7% and 2.7% respectively in March 2018, compared with 2.6%, 2.7% and 2.7% in December 2017. Transactions for office space fell by 16% from the preceding quarter or 35% from a year earlier to 380 cases in the first quarter. 3.12 Sale prices of retail shop space edged up by 1% between December 2017 and March 2018, while rentals edged down by 1%. The average rental yield stayed unchanged at 2.5%. Meanwhile, trading activities fell by 6% from the preceding quarter to 560 cases in the first quarter. This was however 15% higher than a year earlier(2). 3.13 For flatted factory space, sale prices and rentals rose by 5% and 2% respectively between December 2017 and March 2018. Reflecting these movements, the average rental yield edged down from 2.9% to 2.8%. Transactions edged up by 1% over the preceding quarter to 1 540 cases in the first quarter, but were distinctly higher by 60% than the low base a year earlier.
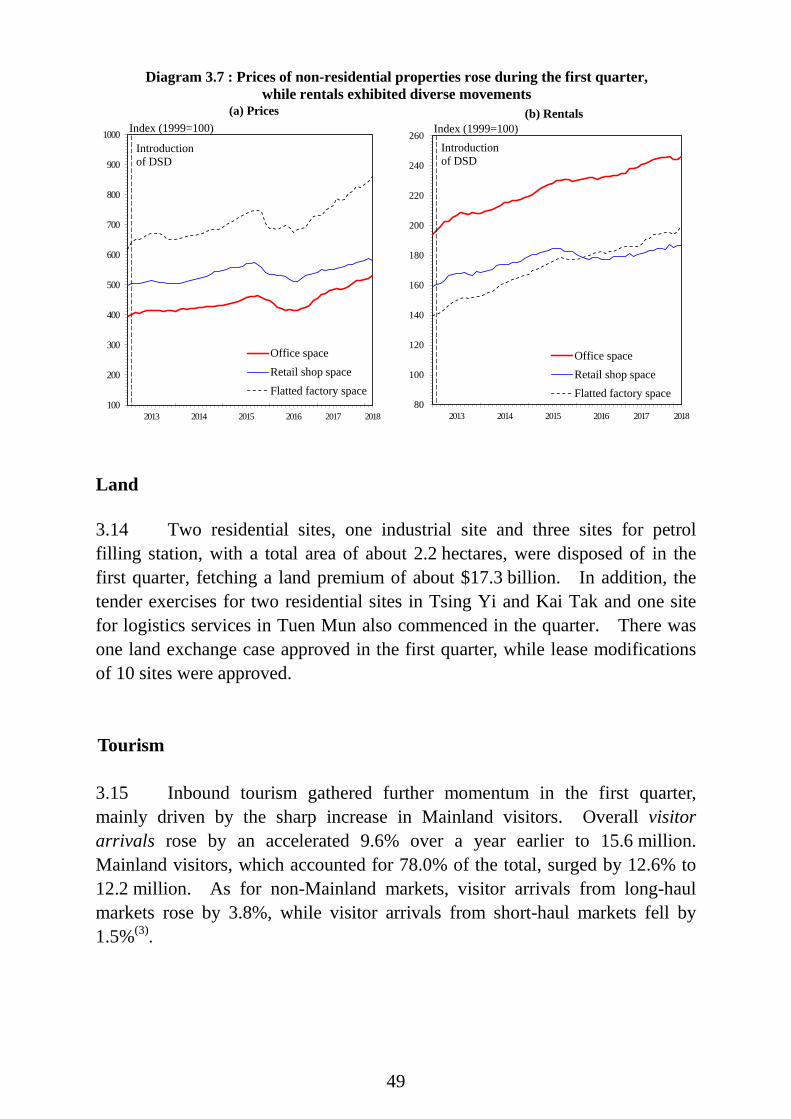
49
2013 2014 2015 2016 2017 2018100
200
300
400
500
600
700
800
900
1000
Office spaceRetail shop spaceFlatted factory space
Index (1999=100)(a) Prices
Introductionof DSD
2013 2014 2015 2016 2017 201880
100
120
140
160
180
200
220
240
260
Office spaceRetail shop spaceFlatted factory space
Index (1999=100)(b) Rentals
Introductionof DSD
Diagram 3.7 : Prices of non-residential properties rose during the first quarter,while rentals exhibited diverse movements
Land 3.14 Two residential sites, one industrial site and three sites for petrol filling station, with a total area of about 2.2 hectares, were disposed of in the first quarter, fetching a land premium of about $17.3 billion. In addition, the tender exercises for two residential sites in Tsing Yi and Kai Tak and one site for logistics services in Tuen Mun also commenced in the quarter. There was one land exchange case approved in the first quarter, while lease modifications of 10 sites were approved. Tourism 3.15 Inbound tourism gathered further momentum in the first quarter, mainly driven by the sharp increase in Mainland visitors. Overall visitor arrivals rose by an accelerated 9.6% over a year earlier to 15.6 million. Mainland visitors, which accounted for 78.0% of the total, surged by 12.6% to 12.2 million. As for non-Mainland markets, visitor arrivals from long-haul markets rose by 3.8%, while visitor arrivals from short-haul markets fell by 1.5%(3).

50
Q12013
Q12014
Q12015
Q12016
Q12017
Q12018
-20
-15
-10
-5
0
5
10
15
20
25
30
35
40 All sources Mainland Short-haul markets* Long-haul markets*
Year-on-year rate of change (%)
Diagram 3.8 : Inbound tourism gathered further momentum in the first quarter
Note : (*) See note (3) at the end of this chapter for the definition of short-haul and long-haul markets. 3.16 Analysed by the length of stay, same-day and overnight visitor arrivals rose further by 11.7% and 7.2% respectively over a year earlier. Reflecting these movements, the share of same-day visitors increased from 54.0% a year earlier to 55.0% in the first quarter, while that of overnight visitors declined from 46.0% to 45.0%.
Q12013
Q12014
Q12015
Q12016
Q12017
Q12018
-20
-15
-10
-5
0
5
10
15
20
25
30
35
40Overnight visitors Same-day visitors
Year-on-year rate of change (%)
Diagram 3.9 : Both same-day visitors and overnight visitors increased further

51
3.17 Supported by the notable increase in overnight visitors, the average hotel room occupancy rate rose from 88% a year earlier to 91% in the first quarter. The average achieved hotel room rate also went up by 8.0% to $1,371(4). Logistics 3.18 The logistics sector put up a mixed performance in the first quarter. Notwithstanding the favourable external trade performance, total container throughput edged down by 0.6% from a year earlier to 4.9 million twenty-foot equivalent units (TEUs). While the value of trade handled at the Hong Kong port rose by 5.7%, its share in total trade shrank from 18.9% a year earlier to 18.1%.
-20
-15
-10
-5
0
5
10
15
20
25
30
0
1 000
2 000
3 000
4 000
5 000
6 000
7 000
8 000
9 000
Q12013
Q12014
Q12015
Q12016
Q12017
Q12018
Container throughput by river vessels (LHS) Container throughput by ocean vessels (LHS) Overall year-on-year rate of change (RHS)
Diagram 3.10 : Container throughput edged down in the first quarter
TEU ('000) Percent
*
Note : (*) The container throughput figure for the latest quarter is the preliminary estimate by the Hong Kong Maritime and Port Board, for which a breakdown by ocean and river vessels is not yet available.
3.19 Meanwhile, air freight throughput rose by another 4.2% over a year earlier to 1.1 million tonnes in the first quarter. Likewise, the value of trade by air increased by 10.8%, and its share in total trade rose further from 42.3% a year earlier to 42.5%.
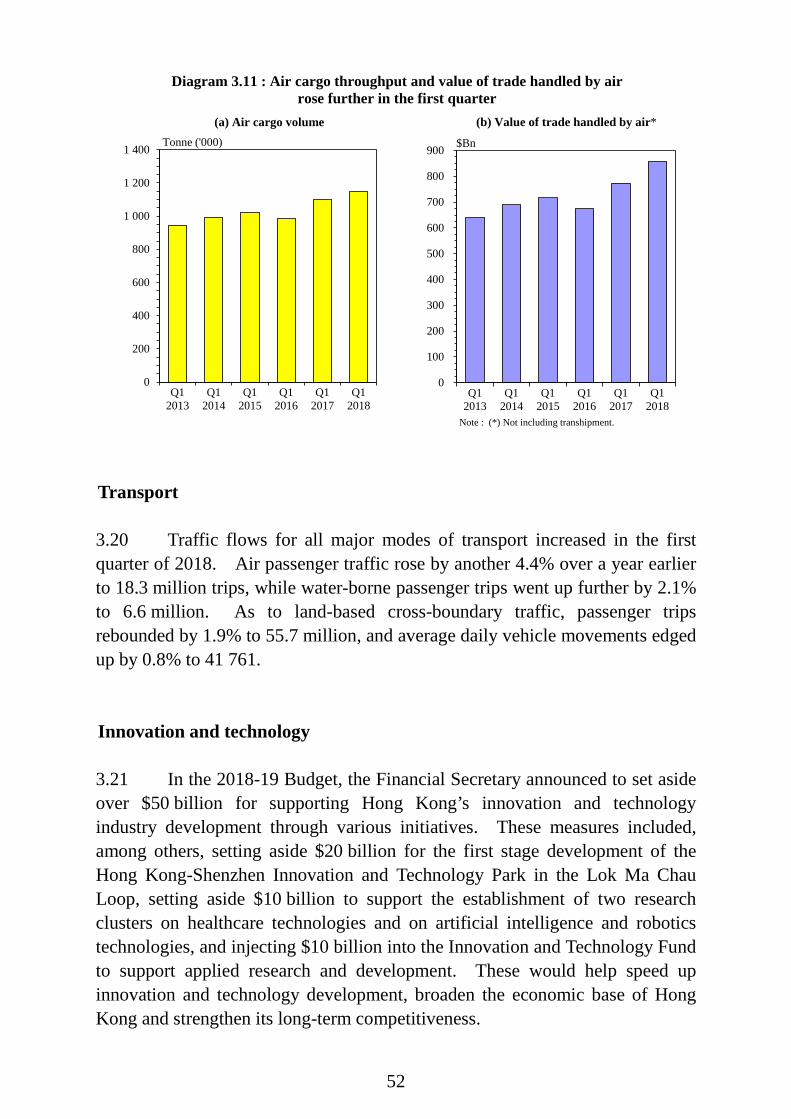
52
0
100
200
300
400
500
600
700
800
900
Q12013
Q12014
Q12015
Q12016
Q12017
Q12018
(b) Value of trade handled by air*
0
200
400
600
800
1 000
1 200
1 400
Q12013
Q12014
Q12015
Q12016
Q12017
Q12018
(a) Air cargo volume
Diagram 3.11 : Air cargo throughput and value of trade handled by air rose further in the first quarter
Tonne ('000) $Bn
Note : (*) Not including transhipment. Transport 3.20 Traffic flows for all major modes of transport increased in the first quarter of 2018. Air passenger traffic rose by another 4.4% over a year earlier to 18.3 million trips, while water-borne passenger trips went up further by 2.1% to 6.6 million. As to land-based cross-boundary traffic, passenger trips rebounded by 1.9% to 55.7 million, and average daily vehicle movements edged up by 0.8% to 41 761. Innovation and technology 3.21 In the 2018-19 Budget, the Financial Secretary announced to set aside over $50 billion for supporting Hong Kong’s innovation and technology industry development through various initiatives. These measures included, among others, setting aside $20 billion for the first stage development of the Hong Kong-Shenzhen Innovation and Technology Park in the Lok Ma Chau Loop, setting aside $10 billion to support the establishment of two research clusters on healthcare technologies and on artificial intelligence and robotics technologies, and injecting $10 billion into the Innovation and Technology Fund to support applied research and development. These would help speed up innovation and technology development, broaden the economic base of Hong Kong and strengthen its long-term competitiveness.
53
Environment 3.22 The Financial Secretary announced several policy initiatives in the 2018-19 Budget to promote environmental protection and combat climate change. Starting from the 2018-19 financial year, capital expenditure on renewable energy and energy-efficient building installations can be fully deducted in the first year of purchase, instead of split into five years as currently stipulated. Also, a new “One-for-One Replacement” Scheme was launched on 28 February 2018 to 31 March 2021, allowing private car owners who buy a new electric private car and scrap their eligible old private cars to enjoy a higher first registration tax concession of up to $250,000. 3.23 Separately, the Government’s Waste Electrical and Electronic Equipment (WEEE) Treatment and Recycling Facility, WEEE·PARK, officially opened in March to treat WEEE and turn them into reusable materials such as plastics and metals, marking a key milestone in the development of waste-to-resources facilities in Hong Kong. This also underpins the producer responsibility scheme on WEEE that will be fully implemented in later this year. Notes : (1) For details of the measures promulgated in 2010, see Box 3.1 in the First Quarter
Economic Report 2010, Box 3.1 in the Third Quarter Economic Report 2010 and note (2) at the end of Chapter 4 in the 2010 Economic Background and 2011 Prospects. For details of the measures promulgated in 2011, see note (2) at the end of Chapter 3 in the Half-yearly Economic Report 2011 and Box 3.1 in the Third Quarter Economic Report 2011. For details of the measures promulgated in 2012, see Box 3.1 in the Third Quarter Economic Report 2012 and Box 4.1 in the 2012 Economic Background and 2013 Prospects. For details of the measures promulgated in 2013, see Box 4.2 in the 2012 Economic Background and 2013 Prospects and Box 3.1 in the First Quarter Economic Report 2013. For details of the measures promulgated in 2014, see Box 4.1 in the 2013 Economic Background and 2014 Prospects. For details of the measures promulgated in 2015, see Box 3.1 of the First Quarter Economic Report 2015. For details of the measures promulgated in 2016, see note (1) at the end of Chapter 4 in the 2016 Economic Background and 2017 Prospects. For details of the measures promulgated in 2017, see note (3) at the end of Chapter 3 in the First Quarter Economic Report 2017, note (2) at the end of Chapter 3 in the Half-yearly Economic Report 2017 and Box 3.1 of the Third Quarter Economic Report 2017.
(2) The figures on transaction refer to commercial space, which comprises retail premises
and other premises designed or adapted for commercial use but excludes purpose-built office space.
(3) Short-haul markets refer to North Asia, South and Southeast Asia, Taiwan and Macao,
but excluding the Mainland, while long-haul markets refer to the Americas, Europe, Africa, the Middle East, Australia, New Zealand and South Pacific. In the first quarter of 2018, visitor arrivals from the Mainland, short-haul and long-haul markets accounted

54
for respective shares of 78%, 14% and 8% of total visitors. (4) The figures on hotel room occupancy and achieved room rate do not include
guesthouses.
55
CHAPTER 4 : THE FINANCIAL SECTOR# Summary While the monetary policy normalisation in the US proceeded further, the
low interest rate environment in Hong Kong continued in the first quarter of 2018. Following the interest rate hike by the US Federal Open Market Committee, the Hong Kong Monetary Authority adjusted the Base Rate upward from 1.75% to 2.00%. The Hong Kong dollar interbank interest rates remained at low levels, despite some pick-up in March.
The Hong Kong dollar spot exchange rate weakened against the US dollar during the first quarter in face of increased carry trade activities. It hovered close to the weak-side Convertibility Undertaking in late March and closed the quarter at 7.849. Meanwhile, as the US dollar depreciated against many other major currencies, the trade-weighted Hong Kong dollar Nominal and Real Effective Exchange Rate Indices declined further by 3.7% and 3.0% respectively.
Total loans and advances expanded by an accelerated 3.6% during the first quarter, within which loans for use in and outside Hong Kong increased by 3.6% and 3.7% respectively.
The local stock market exhibited substantial volatility in the first quarter of 2018. After surging to an all-time high in late January, the Hang Seng Index pared most of the gains thereafter amid concerns about a faster-than-expected rate hike in the US and increased trade tensions between the US and the Mainland. It closed the quarter at 30 093, only 0.6% above end-2017. Trading was active in the quarter while fund raising activities quietened down.
__________ (#) This chapter is jointly prepared by the Hong Kong Monetary Authority (HKMA) and
the Office of the Government Economist.

56
Interest rates and exchange rates 4.1 While the monetary policy normalisation in the US proceeded further, the low interest rate environment in Hong Kong continued in the first quarter of 2018. The US Federal Open Market Committee raised the target range for the Federal Funds Rate from 1.25-1.50% to 1.50-1.75% in March. Consequentially, the HKMA adjusted the Base Rate under the Discount Window upward from 1.75% to 2.00%(1). Meanwhile, after an up-tick in late 2017, the Hong Kong dollar interbank interest rates (HIBORs) reverted to low levels in most of the first quarter before showing some pick-up again in March due to expectation of a faster pace of US interest rate hike. The overnight HIBOR declined from 1.34% at end-2017 to 0.59% at end-March 2018, and the three-month HIBOR from 1.31% to 1.21%. 4.2 The US dollar yield curve shifted upward during the first quarter, while the Hong Kong dollar yields were little changed. Reflecting these relative movements, the negative yield spread between 6-month Exchange Fund Bills and 6-month US Treasury Bills widened noticeably from 52 basis points at end-2017 to 86 basis points at end-March 2018, and the negative yield spread between 10-year Hong Kong Government Bonds and 10-year US Treasury Notes from 57 basis points to 84 basis points.
0.0
0.5
1.0
1.5
2.0
2.5
3.0
3.5
1M 3M 6M 1Y 2Y 3Y* 5Y* 10Y*
Diagram 4.1 : The US dollar yield curve shifted upward, while the Hong Kong dollar yields were little changed
Percent per annum
Spread of yield between Exchange Fund Bills & Notes / HK Government Bonds and US Treasuries at end-March 2018 :6-month Time to Maturity : -86 basis points5-year Time to Maturity : -86 basis points10-year Time to Maturity : -84 basis points
Time to Maturity
US Treasuries (end-2017)
Exchange FundBills & Notes / HK Government Bonds
(end-2017)
US Treasuries(end-March 2018)
Exchange FundBills & Notes / HK Government Bonds(end-March 2018)
Note : (*) With the HKMA stopping new issuance of Exchange Fund Notes of tenors of three years or above since January 2015, the Hong Kong dollar yields for tenor of 3 years and above refer to those for Hong Kong Government Bonds.
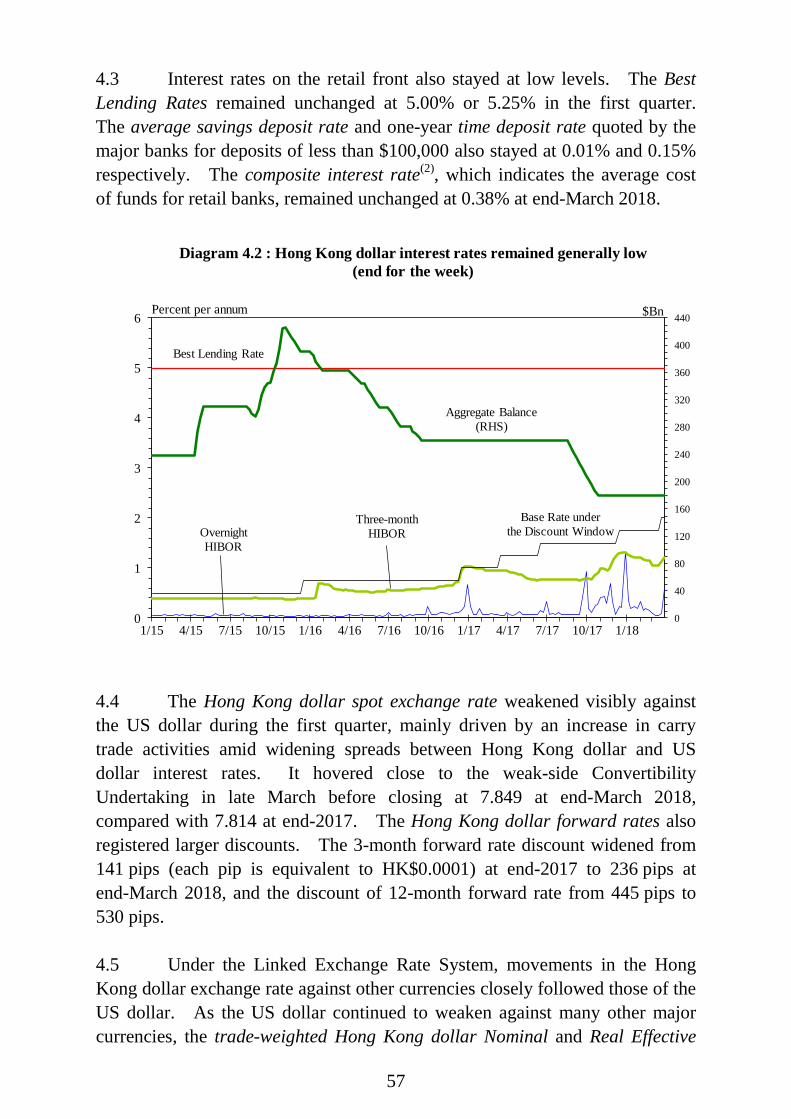
57
4.3 Interest rates on the retail front also stayed at low levels. The Best Lending Rates remained unchanged at 5.00% or 5.25% in the first quarter. The average savings deposit rate and one-year time deposit rate quoted by the major banks for deposits of less than $100,000 also stayed at 0.01% and 0.15% respectively. The composite interest rate(2), which indicates the average cost of funds for retail banks, remained unchanged at 0.38% at end-March 2018.
0
40
80
120
160
200
240
280
320
360
400
440
0
1
2
3
4
5
6
1/15 4/15 7/15 10/15 1/16 4/16 7/16 10/16 1/17 4/17 7/17 10/17 1/18
Diagram 4.2 : Hong Kong dollar interest rates remained generally low(end for the week)
Percent per annum $Bn
Best Lending Rate
Three-monthHIBOR
Aggregate Balance (RHS)
Overnight HIBOR
Base Rate under the Discount Window
4.4 The Hong Kong dollar spot exchange rate weakened visibly against the US dollar during the first quarter, mainly driven by an increase in carry trade activities amid widening spreads between Hong Kong dollar and US dollar interest rates. It hovered close to the weak-side Convertibility Undertaking in late March before closing at 7.849 at end-March 2018, compared with 7.814 at end-2017. The Hong Kong dollar forward rates also registered larger discounts. The 3-month forward rate discount widened from 141 pips (each pip is equivalent to HK$0.0001) at end-2017 to 236 pips at end-March 2018, and the discount of 12-month forward rate from 445 pips to 530 pips. 4.5 Under the Linked Exchange Rate System, movements in the Hong Kong dollar exchange rate against other currencies closely followed those of the US dollar. As the US dollar continued to weaken against many other major currencies, the trade-weighted Hong Kong dollar Nominal and Real Effective

58
Exchange Rate Indices(3) declined further by 3.7% and 3.0% respectively during the first quarter.
7.55
7.60
7.65
7.70
7.75
7.80
7.85
7.90
1/15 7/15 1/16 7/16 1/17 7/17 1/18
HK$/US$spot rate
HK$/US$twelve-month forward rate
HK$/US$three-month forward rate
HK$/US$
85
90
95
100
105
110
115
120
1/13 1/14 1/15 1/16 1/17 1/18
Index (Jan 2010=100)
Nominal EERI
Real EERI
Diagram 4.3 : Hong Kong dollar weakened against the US dollar during the first quarter
(end for the week)
Diagram 4.4 : The trade-weighted nominal and real EERIs declined further
(average for the month)
Linked Rate/Convertibility Zone*
Note : (*) The shaded area represents the Convertibility Zonethat was introduced in May 2005 as part of the threerefinements to the Linked Exchange Rate System.
Money supply and banking sector 4.6 The monetary aggregates recorded solid growth in the first quarter. The Hong Kong dollar broad money supply (HK$M3) expanded by 3.2% over end-2017 to $7,246 billion(4) at end-March 2018, and the seasonally adjusted Hong Kong dollar narrow money supply (HK$M1) by 4.2% to $1,676 billion. Meanwhile, total deposits with authorised institutions (AIs)(5) increased by 1.2% to $12,911 billion. Within the total, the Hong Kong dollar deposits went up by 3.0%, while foreign currency deposits edged down by 0.6%.
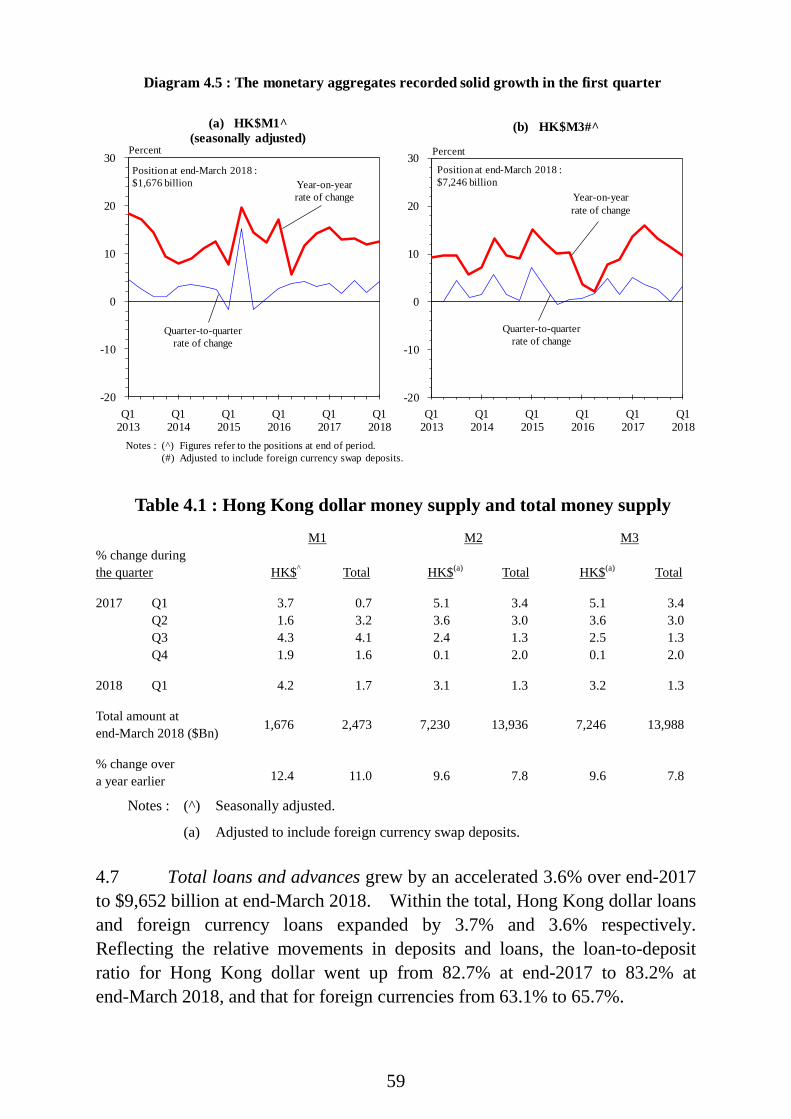
59
Q12013
Q12014
Q12015
Q12016
Q12017
Q12018
-20
-10
0
10
20
30Percent
Position at end-March 2018 :$1,676 billion Year-on-year
rate of change
Quarter-to-quarterrate of change
(a) HK$M1^(seasonally adjusted)
Diagram 4.5 : The monetary aggregates recorded solid growth in the first quarter
Q12013
Q12014
Q12015
Q12016
Q12017
Q12018
-20
-10
0
10
20
30
(b) HK$M3#^
Percent
Year-on-yearrate of change
Quarter-to-quarterrate of change
Position at end-March 2018 :$7,246 billion
Notes : (^) Figures refer to the positions at end of period. Notes : (#) Adjusted to include foreign currency swap deposits.
Table 4.1 : Hong Kong dollar money supply and total money supply
M1 M2 M3 % change during the quarter HK$^ Total HK$(a) Total HK$(a) Total 2017 Q1 3.7 0.7 5.1 3.4 5.1 3.4 Q2 1.6 3.2 3.6 3.0 3.6 3.0 Q3 4.3 4.1 2.4 1.3 2.5 1.3 Q4 1.9 1.6 0.1 2.0 0.1 2.0 2018 Q1 4.2 1.7 3.1 1.3 3.2 1.3 Total amount at end-March 2018 ($Bn) 1,676 2,473 7,230 13,936 7,246 13,988
% change over a year earlier 12.4 11.0 9.6 7.8 9.6 7.8
Notes : (^) Seasonally adjusted.
(a) Adjusted to include foreign currency swap deposits. 4.7 Total loans and advances grew by an accelerated 3.6% over end-2017 to $9,652 billion at end-March 2018. Within the total, Hong Kong dollar loans and foreign currency loans expanded by 3.7% and 3.6% respectively. Reflecting the relative movements in deposits and loans, the loan-to-deposit ratio for Hong Kong dollar went up from 82.7% at end-2017 to 83.2% at end-March 2018, and that for foreign currencies from 63.1% to 65.7%.
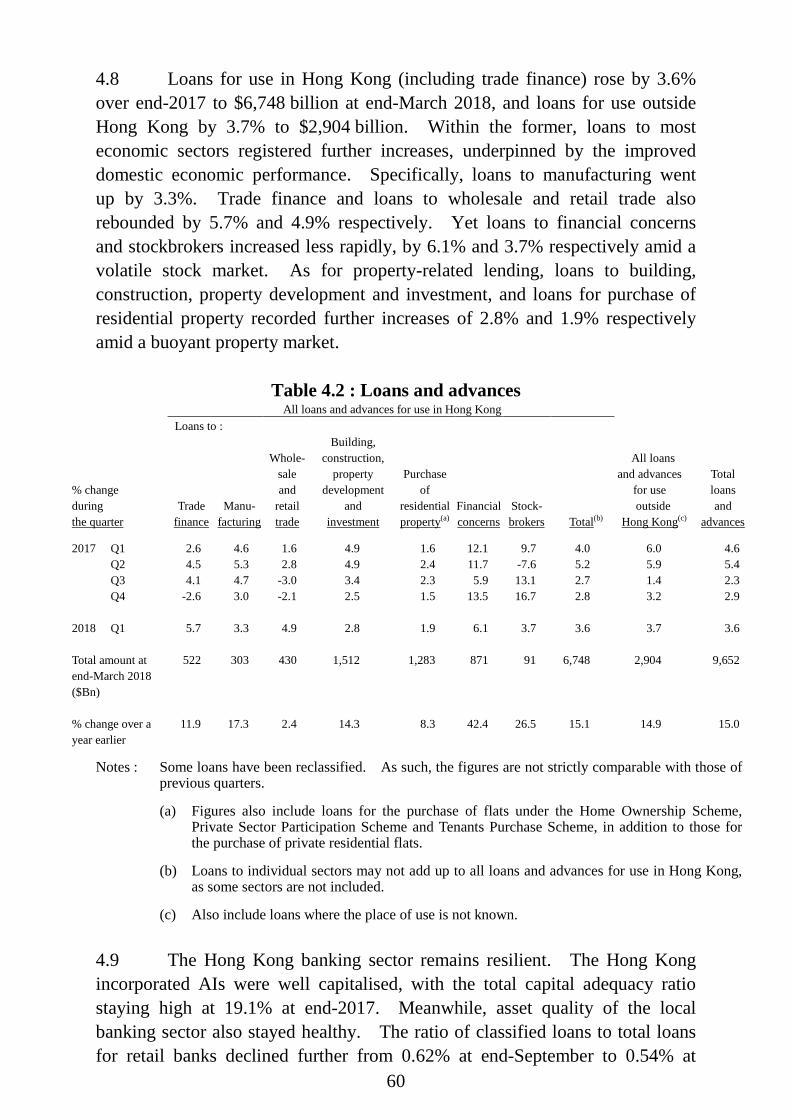
60
4.8 Loans for use in Hong Kong (including trade finance) rose by 3.6% over end-2017 to $6,748 billion at end-March 2018, and loans for use outside Hong Kong by 3.7% to $2,904 billion. Within the former, loans to most economic sectors registered further increases, underpinned by the improved domestic economic performance. Specifically, loans to manufacturing went up by 3.3%. Trade finance and loans to wholesale and retail trade also rebounded by 5.7% and 4.9% respectively. Yet loans to financial concerns and stockbrokers increased less rapidly, by 6.1% and 3.7% respectively amid a volatile stock market. As for property-related lending, loans to building, construction, property development and investment, and loans for purchase of residential property recorded further increases of 2.8% and 1.9% respectively amid a buoyant property market.
Table 4.2 : Loans and advances All loans and advances for use in Hong Kong
Loans to : Building, Whole- construction, All loans sale property Purchase and advances Total
% change and development of for use loans during Trade Manu- retail and residential Financial Stock- outside and the quarter finance facturing trade investment property(a) concerns brokers Total(b) Hong Kong(c) advances 2017 Q1 2.6 4.6 1.6 4.9 1.6 12.1 9.7 4.0 6.0 4.6
Q2 4.5 5.3 2.8 4.9 2.4 11.7 -7.6 5.2 5.9 5.4 Q3 4.1 4.7 -3.0 3.4 2.3 5.9 13.1 2.7 1.4 2.3 Q4 -2.6 3.0 -2.1 2.5 1.5 13.5 16.7 2.8 3.2 2.9
2018 Q1 5.7 3.3 4.9 2.8 1.9 6.1 3.7 3.6 3.7 3.6 Total amount at end-March 2018 ($Bn)
522 303 430 1,512 1,283 871 91 6,748 2,904 9,652
% change over a year earlier
11.9 17.3 2.4 14.3 8.3 42.4 26.5 15.1 14.9 15.0
Notes : Some loans have been reclassified. As such, the figures are not strictly comparable with those of previous quarters.
(a) Figures also include loans for the purchase of flats under the Home Ownership Scheme, Private Sector Participation Scheme and Tenants Purchase Scheme, in addition to those for the purchase of private residential flats.
(b) Loans to individual sectors may not add up to all loans and advances for use in Hong Kong, as some sectors are not included.
(c) Also include loans where the place of use is not known. 4.9 The Hong Kong banking sector remains resilient. The Hong Kong incorporated AIs were well capitalised, with the total capital adequacy ratio staying high at 19.1% at end-2017. Meanwhile, asset quality of the local banking sector also stayed healthy. The ratio of classified loans to total loans for retail banks declined further from 0.62% at end-September to 0.54% at

61
end-2017, and the delinquency ratio for credit card lending from 0.23% to 0.22%. The delinquency ratio for residential mortgage loans edged down from 0.03% at end-2017 to 0.02% at end-March 2018.
Table 4.3 : Asset quality of retail banks* (as % of total loans)
As at end of period Pass loans Special mention loans Classified loans
(gross)
2016 Q1 97.77 1.45 0.78 Q2 97.80 1.40 0.80 Q3 97.68 1.51 0.81 Q4 97.75 1.53 0.72 2017 Q1 97.94 1.35 0.70 Q2 98.22 1.10 0.68 Q3 98.35 1.02 0.62 Q4 98.43 1.03 0.54
Notes : Due to rounding, figures may not add up to 100.
(*) Period-end figures relate to Hong Kong offices, overseas branches and major overseas subsidiaries. Loans and advances are classified into the following categories: Pass, Special Mention, Substandard, Doubtful and Loss. Loans in the substandard, doubtful and loss categories are collectively known as “classified loans”.
4.10 Different segments of the offshore renminbi (RMB) business showed diverse performance in the first quarter. RMB trade settlement transactions handled by banks in Hong Kong rose by 23.9% over a year earlier to RMB1,007.9 billion in the first quarter. Total RMB deposits (including customer deposits and outstanding certificates of deposit) fell modestly by 2.4% from end-2017 to RMB603.7 billion at end-March 2018. RMB financing activities stayed generally soft. RMB bond issuance declined from RMB10.0 billion in the preceding quarter to RMB9.5 billion in the first quarter, though sharply above the RMB1.0 billion issuance a year earlier. Outstanding RMB bank loans also decreased by 4.1% from end-2017 to RMB138.5 billion at end-March 2018.
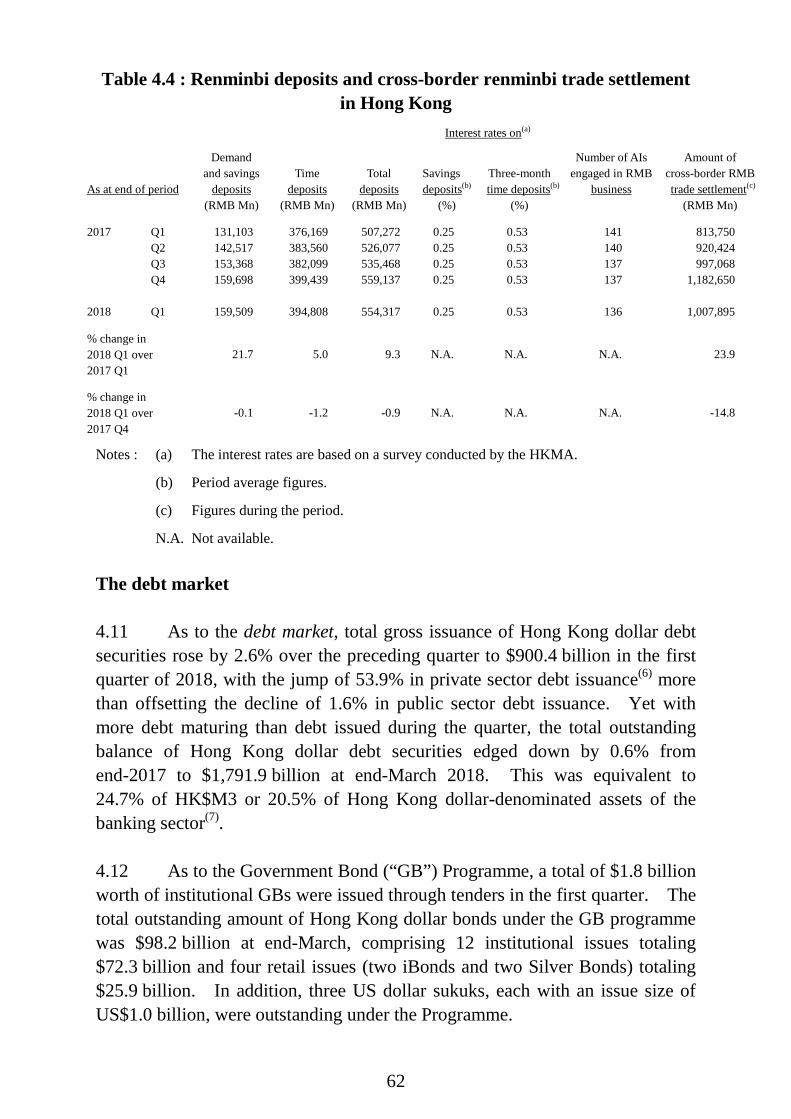
62
Table 4.4 : Renminbi deposits and cross-border renminbi trade settlement in Hong Kong
Interest rates on(a)
Number of AIs
engaged in RMB business
Amount of cross-border RMB trade settlement(c) As at end of period
Demand and savings
deposits Time
deposits Total
deposits Savings deposits(b)
Three-month time deposits(b)
(RMB Mn) (RMB Mn) (RMB Mn) (%) (%) (RMB Mn) 2017 Q1 131,103 376,169 507,272 0.25 0.53 141 813,750 Q2 142,517 383,560 526,077 0.25 0.53 140 920,424 Q3 153,368 382,099 535,468 0.25 0.53 137 997,068 Q4 159,698 399,439 559,137 0.25 0.53 137 1,182,650 2018 Q1 159,509 394,808 554,317 0.25 0.53 136 1,007,895 % change in 2018 Q1 over 2017 Q1
21.7 5.0 9.3 N.A. N.A. N.A. 23.9
% change in 2018 Q1 over 2017 Q4
-0.1 -1.2 -0.9 N.A. N.A. N.A. -14.8
Notes : (a) The interest rates are based on a survey conducted by the HKMA.
(b) Period average figures.
(c) Figures during the period.
N.A. Not available. The debt market 4.11 As to the debt market, total gross issuance of Hong Kong dollar debt securities rose by 2.6% over the preceding quarter to $900.4 billion in the first quarter of 2018, with the jump of 53.9% in private sector debt issuance(6) more than offsetting the decline of 1.6% in public sector debt issuance. Yet with more debt maturing than debt issued during the quarter, the total outstanding balance of Hong Kong dollar debt securities edged down by 0.6% from end-2017 to $1,791.9 billion at end-March 2018. This was equivalent to 24.7% of HK$M3 or 20.5% of Hong Kong dollar-denominated assets of the banking sector(7). 4.12 As to the Government Bond (“GB”) Programme, a total of $1.8 billion worth of institutional GBs were issued through tenders in the first quarter. The total outstanding amount of Hong Kong dollar bonds under the GB programme was $98.2 billion at end-March, comprising 12 institutional issues totaling $72.3 billion and four retail issues (two iBonds and two Silver Bonds) totaling $25.9 billion. In addition, three US dollar sukuks, each with an issue size of US$1.0 billion, were outstanding under the Programme.

63
4.13 In the 2018-19 Budget, the Financial Secretary announced an array of measures to enhance the attractiveness of the bond market in Hong Kong. These include the launch of a three-year Pilot Bond Grant Scheme, the extension of the scope of tax exemption for qualified instruments under the qualifying debt instrument scheme, and the launch of a green bond issuance programme with a borrowing ceiling of $100 billion. Also, the issuance of Silver Bonds would continue in 2018 and 2019, targeting Hong Kong residents aged 65 or above. These measures would help attract corporate bond issuance in Hong Kong and broaden the investment platform of the debt market.

64
Table 4.5 : New issuance and outstanding value of Hong Kong dollar debt securities ($Bn)
Exchange
Fund paper
Statutory bodies/government-owned corporations
Govern-ment
Public sector total AIs(a)
Local corporations
Non-MDBs overseas
borrowers(b)
Private sector total MDBs(b) Total
New Issuance
2017 Annual 3,000.4 21.5 19.6 3,041.6 185.8 20.7 84.0 290.5 3.2 3,335.3 Q1 709.7 9.7 1.8 721.3 54.9 4.1 17.4 76.4 1.7 799.3 Q2 718.1 8.6 10.7 737.4 41.6 4.5 37.0 83.1 1.6 822.0 Q3 766.5 2.0 0.6 769.1 43.9 9.7 13.6 67.2 0.0 836.3 Q4 806.1 1.2 6.5 813.8 45.4 2.4 16.0 63.8 0.0 877.6 2018 Q1 791.9 7.2 1.8 801.0 63.9 5.6 28.8 98.2 1.2 900.4 % change in 2018 Q1 over 2017 Q1
11.6 -25.6 * 11.0 16.4 35.8 65.2 28.6 -27.4 12.6
% change in 2018 Q1 over 2017 Q4
-1.8 504.1 -72.3 -1.6 40.6 135.1 79.4 53.9 N.A. 2.6
Outstanding (as at end of period)
2017 Q1 964.6 54.4 104.6 1,123.7 283.7 153.2 176.5 613.4 11.8 1,748.8 Q2 965.6 52.0 112.3 1,129.9 269.2 154.7 186.4 610.3 11.4 1,751.6 Q3 1,014.6 52.8 102.8 1,170.3 262.7 158.7 182.7 604.2 10.8 1,785.2 Q4 1,048.5 53.6 106.3 1,208.5 242.6 160.6 180.5 583.8 9.9 1,802.2 2018 Q1 1,050.6 55.9 99.7 1,206.2 221.9 159.5 193.1 574.6 11.1 1,791.9 % change in 2018 Q1 over 2017 Q1
8.9 2.8 -4.7 7.4 -21.8 4.1 9.4 -6.3 -5.8 2.5
% change in 2018 Q1 over 2017 Q4
0.2 4.2 -6.2 -0.2 -8.5 -0.7 7.0 -1.6 12.4 -0.6
Notes : Figures may not add up to the corresponding totals due to rounding and may be subject to
revisions. N.A. Not available. (a) AIs : Authorised institutions. (b) MDBs : Multilateral Development Banks. (*) Change of less than ±0.05%.
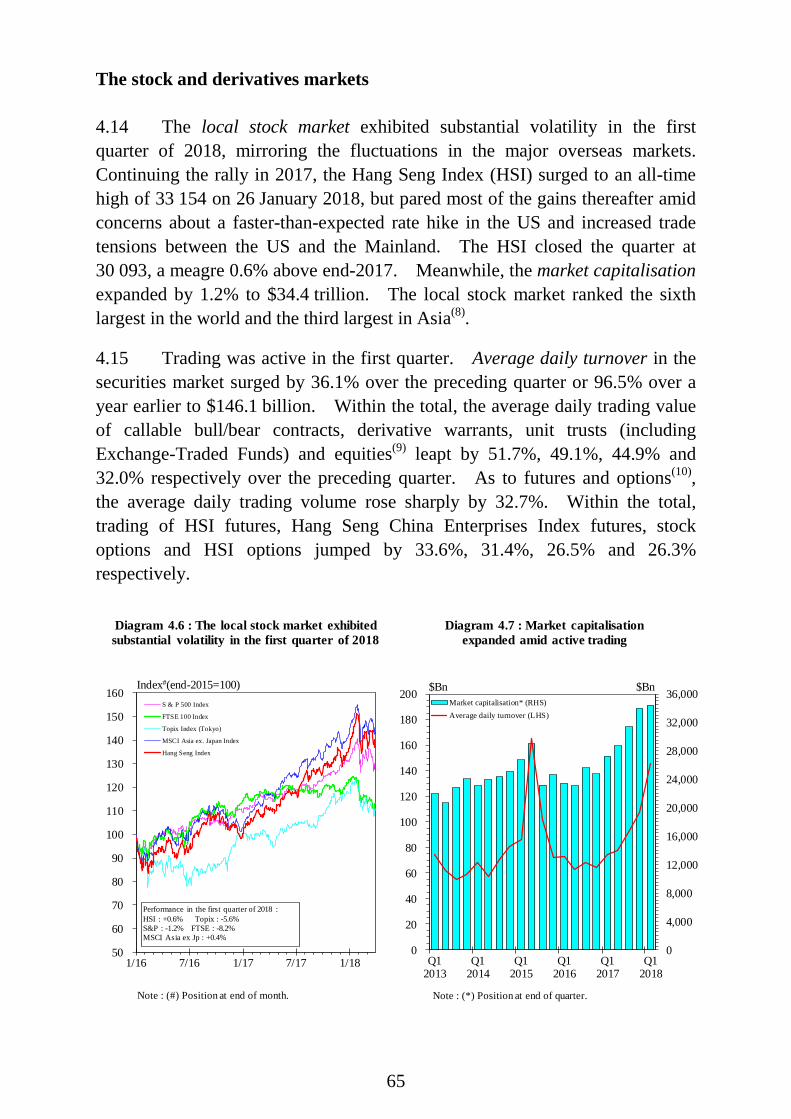
65
The stock and derivatives markets 4.14 The local stock market exhibited substantial volatility in the first quarter of 2018, mirroring the fluctuations in the major overseas markets. Continuing the rally in 2017, the Hang Seng Index (HSI) surged to an all-time high of 33 154 on 26 January 2018, but pared most of the gains thereafter amid concerns about a faster-than-expected rate hike in the US and increased trade tensions between the US and the Mainland. The HSI closed the quarter at 30 093, a meagre 0.6% above end-2017. Meanwhile, the market capitalisation expanded by 1.2% to $34.4 trillion. The local stock market ranked the sixth largest in the world and the third largest in Asia(8). 4.15 Trading was active in the first quarter. Average daily turnover in the securities market surged by 36.1% over the preceding quarter or 96.5% over a year earlier to $146.1 billion. Within the total, the average daily trading value of callable bull/bear contracts, derivative warrants, unit trusts (including Exchange-Traded Funds) and equities(9) leapt by 51.7%, 49.1%, 44.9% and 32.0% respectively over the preceding quarter. As to futures and options(10), the average daily trading volume rose sharply by 32.7%. Within the total, trading of HSI futures, Hang Seng China Enterprises Index futures, stock options and HSI options jumped by 33.6%, 31.4%, 26.5% and 26.3% respectively.
0
4,000
8,000
12,000
16,000
20,000
24,000
28,000
32,000
36,000
0
20
40
60
80
100
120
140
160
180
200
Q12013
Q12014
Q12015
Q12016
Q12017
Q12018
Market capitalisation* (RHS)Average daily turnover (LHS)
Diagram 4.7 : Market capitalisation expanded amid active trading
50
60
70
80
90
100
110
120
130
140
150
160
1/16 7/16 1/17 7/17 1/18
S & P 500 Index
FTSE 100 Index
Topix Index (Tokyo)
MSCI Asia ex. Japan Index
Hang Seng Index
Performance in the first quarter of 2018 :HSI : +0.6% Topix : -5.6% S&P : -1.2% FTSE : -8.2%MSCI Asia ex Jp : +0.4%
Index#(end-2015=100)
Diagram 4.6 : The local stock market exhibited substantial volatility in the first quarter of 2018
$Bn $Bn
Note : (#) Position at end of month. Note : (*) Position at end of quarter.
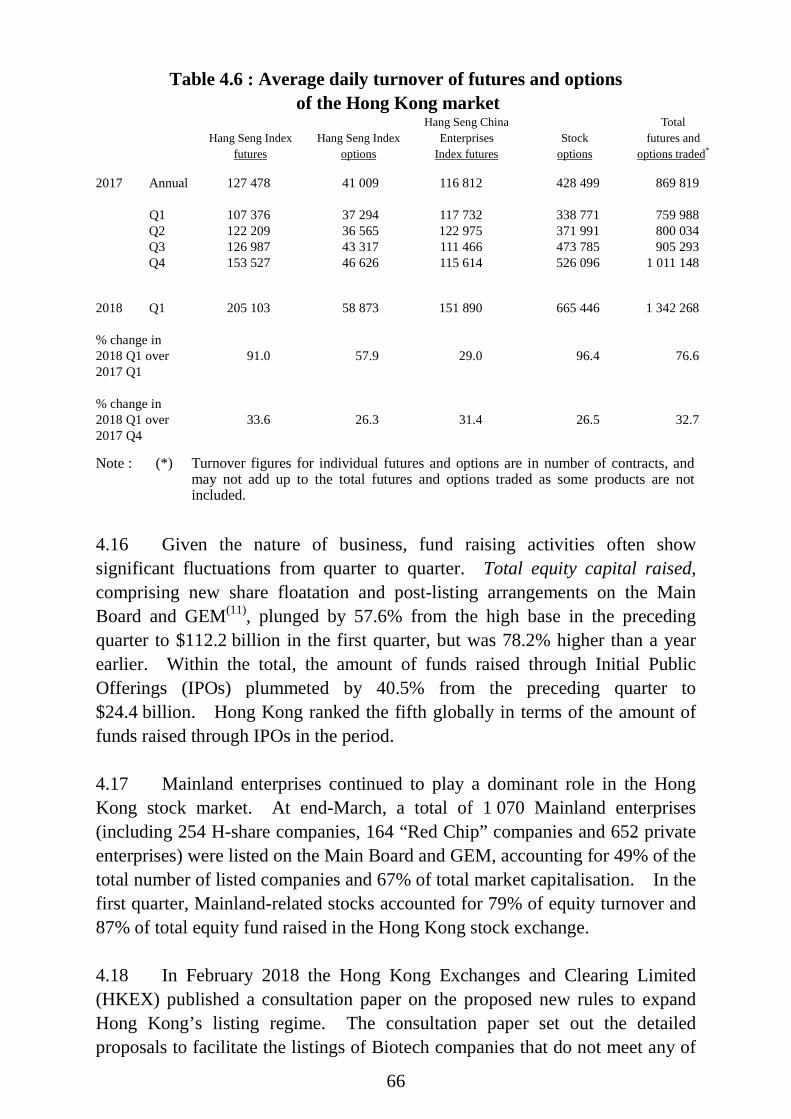
66
Table 4.6 : Average daily turnover of futures and options of the Hong Kong market
Hang Seng Index
futures Hang Seng Index
options
Hang Seng China Enterprises
Index futures Stock
options
Total futures and
options traded* 2017 Annual 127 478 41 009 116 812 428 499 869 819
Q1 107 376 37 294 117 732 338 771 759 988 Q2 122 209 36 565 122 975 371 991 800 034 Q3 126 987 43 317 111 466 473 785 905 293 Q4 153 527 46 626 115 614 526 096 1 011 148 2018 Q1 205 103 58 873 151 890 665 446 1 342 268 % change in 2018 Q1 over 2017 Q1
91.0 57.9 29.0 96.4 76.6
% change in 2018 Q1 over 2017 Q4
33.6 26.3 31.4 26.5 32.7
Note : (*) Turnover figures for individual futures and options are in number of contracts, and may not add up to the total futures and options traded as some products are not included.
4.16 Given the nature of business, fund raising activities often show significant fluctuations from quarter to quarter. Total equity capital raised, comprising new share floatation and post-listing arrangements on the Main Board and GEM(11), plunged by 57.6% from the high base in the preceding quarter to $112.2 billion in the first quarter, but was 78.2% higher than a year earlier. Within the total, the amount of funds raised through Initial Public Offerings (IPOs) plummeted by 40.5% from the preceding quarter to $24.4 billion. Hong Kong ranked the fifth globally in terms of the amount of funds raised through IPOs in the period. 4.17 Mainland enterprises continued to play a dominant role in the Hong Kong stock market. At end-March, a total of 1 070 Mainland enterprises (including 254 H-share companies, 164 “Red Chip” companies and 652 private enterprises) were listed on the Main Board and GEM, accounting for 49% of the total number of listed companies and 67% of total market capitalisation. In the first quarter, Mainland-related stocks accounted for 79% of equity turnover and 87% of total equity fund raised in the Hong Kong stock exchange.
4.18 In February 2018 the Hong Kong Exchanges and Clearing Limited (HKEX) published a consultation paper on the proposed new rules to expand Hong Kong’s listing regime. The consultation paper set out the detailed proposals to facilitate the listings of Biotech companies that do not meet any of

67
the Financial Eligibility Tests; high growth and innovative companies that have weighted voting rights structures; and Qualifying Issuers seeking a secondary listing on the HKEX through a new concessionary route. These proposals aimed at attracting good quality and high growth companies to list in Hong Kong whilst maintaining a high standard of investor protection. 4.19 As the second phase of the After-Hours Trading (AHT) enhancement plan, the HKEX proposed to include four most actively traded equity index options (i.e. Hang Seng Index Options, Hang Seng China Enterprises Index Options, Mini-Hang Seng Index Options and Mini-Hang Seng China Enterprises Index Options) in the AHT of the derivative market in the second quarter, subject to regulatory approval and market readiness. These enhancements would help provide more comprehensive trading and risk management tools to market participants.
4.20 In March, the HKMA and Securities and Future Commission issued a joint consultation paper on further enhancements to the over-the-counter derivatives regulatory regime. A mandatory use of the Legal Entity Identifier for trade reporting, an expansion of the clearing obligation and the adoption of a trading determination process for introducing a platform trading obligation were proposed. These proposals would help align the regulatory regime with international standards and enhance its robustness for the benefit of financial system stability. Fund management and investment funds 4.21 The fund management business recorded a solid performance in general in the first quarter. The aggregate net asset value of the approved constituent funds under the Mandatory Provident Fund (MPF) schemes(12) expanded further by 1.6% over end-2017 to $856.7 billion at end-March 2018. The gross retail sales of mutual funds leapt by 49.1% over a year earlier or 67.5% over the preceding quarter to US$32.8 billion in the first quarter(13). Yet the amount of net assets managed by retail hedge fund declined further(14). Insurance sector 4.22 Different segments of the insurance sector(15) showed mixed performance in 2017. Gross premium income from long-term business
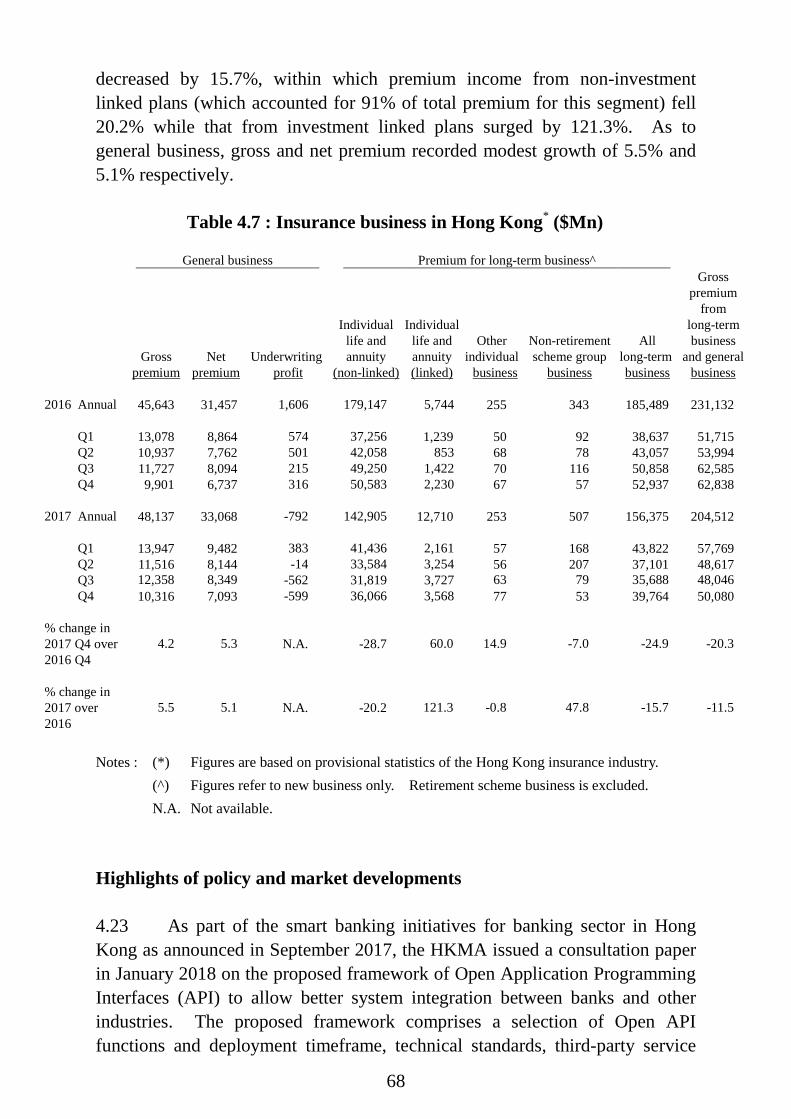
68
decreased by 15.7%, within which premium income from non-investment linked plans (which accounted for 91% of total premium for this segment) fell 20.2% while that from investment linked plans surged by 121.3%. As to general business, gross and net premium recorded modest growth of 5.5% and 5.1% respectively.
Table 4.7 : Insurance business in Hong Kong* ($Mn)
General business Premium for long-term business^
Gross
premium Net
premium Underwriting
profit
Individual life and annuity
(non-linked)
Individual life and annuity (linked)
Other individual business
Non-retirement scheme group
business
All long-term business
Gross premium
from long-term business
and general business
2016 Annual 45,643 31,457 1,606 179,147 5,744 255 343 185,489 231,132 Q1 13,078 8,864 574 37,256 1,239 50 92 38,637 51,715 Q2 10,937 7,762 501 42,058 853 68 78 43,057 53,994 Q3 11,727 8,094 215 49,250 1,422 70 116 50,858 62,585 Q4 9,901 6,737 316 50,583 2,230 67 57 52,937 62,838 2017 Annual 48,137 33,068 -792 142,905 12,710 253 507 156,375 204,512 Q1 13,947 9,482 383 41,436 2,161 57 168 43,822 57,769 Q2 11,516 8,144 -14 33,584 3,254 56 207 37,101 48,617 Q3 12,358 8,349 -562 31,819 3,727 63 79 35,688 48,046 Q4 10,316 7,093 -599 36,066 3,568 77 53 39,764 50,080 % change in 2017 Q4 over 2016 Q4
4.2 5.3 N.A. -28.7 60.0 14.9 -7.0 -24.9 -20.3
% change in 2017 over 2016
5.5 5.1 N.A. -20.2 121.3 -0.8 47.8 -15.7 -11.5
Notes : (*) Figures are based on provisional statistics of the Hong Kong insurance industry. (^) Figures refer to new business only. Retirement scheme business is excluded. N.A. Not available.
Highlights of policy and market developments 4.23 As part of the smart banking initiatives for banking sector in Hong Kong as announced in September 2017, the HKMA issued a consultation paper in January 2018 on the proposed framework of Open Application Programming Interfaces (API) to allow better system integration between banks and other industries. The proposed framework comprises a selection of Open API functions and deployment timeframe, technical standards, third-party service

69
provider governance, facilitation measures and maintenance models. The proposed framework would facilitate the development and wider adoption of Open API by the banking sector, thereby maintaining its competitiveness and improving financial services for better user experience. Notes : (1) Prior to 9 October 2008, the Base Rate was set at either 150 basis points above the
prevailing US Federal Funds Target Rate (FFTR) or the average of the five-day moving averages of the overnight and one-month HIBORs, whichever was higher. Between 9 October 2008 and 31 March 2009, this formula for determination of the Base Rate was temporarily changed by reducing the spread of 150 basis points above the prevailing FFTR to 50 basis points and by removing the other leg relating to the moving averages of the relevant interbank interest rates. After a review of the appropriateness of the new Base Rate formula, the narrower 50 basis point spread over the FFTR was retained while the HIBOR leg was re-instated in the calculation of the Base Rate after 31 March 2009.
(2) In December 2005, the HKMA published a new data series on composite interest rate,
reflecting movement in various deposit rates, interbank and other interest rates to closely track the average cost of funds for banks. The published data enable the banks to keep track of changes in funding cost and thus help improve interest rate risk management in the banking sector.
(3) The trade-weighted Nominal Effective Exchange Rate Index (EERI) is an indicator of
the overall exchange value of the Hong Kong dollar against a fixed basket of other currencies. Specifically, it is a weighted average of the exchange rates of the Hong Kong dollar against some 15 currencies of its major trading partners, with the weights adopted being the respective shares of these trading partners in the total value of merchandise trade for Hong Kong during 2009 and 2010.
The Real EERI of the Hong Kong dollar is obtained by adjusting the Nominal EERI
for relative movements in the seasonally adjusted consumer price indices of the respective trading partners.
(4) The various definitions of the money supply are as follows: M1 : Notes and coins with the public, plus customers’ demand deposits with
licensed banks.
M2 : M1 plus customers’ savings and time deposits with licensed banks, plus negotiable certificates of deposit (NCDs) issued by licensed banks, held outside the monetary sector as well as short-term Exchange Fund placements of less than one month.
M3 : M2 plus customers’ deposits with restricted licence banks and deposit-taking
companies, plus NCDs issued by such institutions and held outside the monetary sector.
Among the various monetary aggregates, more apparent seasonal patterns are found in
HK$M1, currency held by the public, and demand deposits.

70
(5) AIs include licensed banks, restricted licence banks and deposit-taking companies. At end-March 2018, there were 154 licensed banks, 19 restricted licence banks and 17 deposit-taking companies in Hong Kong. Altogether, 190 AIs (excluding representative offices) from 30 countries and territories (including Hong Kong) had a presence in Hong Kong.
(6) The figures for private sector debt may not represent a full coverage of all the
Hong Kong dollar debt paper issued. (7) Assets of the banking sector include notes and coins, amount due from AIs in Hong
Kong as well as from banks abroad, loans and advances to customers, negotiable certificates of deposit (NCDs) held, negotiable debt instruments other than NCDs held, and other assets. Certificates of indebtedness issued by Exchange Fund and the counterpart bank notes issued are nevertheless excluded.
(8) The ranking is based on the figures compiled by the World Federation of Exchanges
and the London Stock Exchanges Group. (9) Given the relatively small share (less than 0.5% of the daily turnover in the securities
market), trading of debt securities and its movements were not analysed. (10) At end-March 2018, there were 89 classes of stock options contracts and 77 classes of
stock futures contracts. (11) With effect from 15 February 2018, “Growth Enterprise Market” has been renamed as
“GEM”. At end-March 2018, there were 1 827 and 352 companies listed on the Main Board and GEM respectively.
(12) At end-March 2018, there were 17 approved trustees. On MPF products, 29 master
trust schemes, two industry schemes and one employer sponsored scheme, comprising altogether 469 constituent funds, were approved by the Mandatory Provident Fund Schemes Authority. A total of 281 000 employers, 2.59 million employees and 206 000 self-employed persons have participated in MPF schemes.
(13) These figures are obtained from the Sales and Redemptions Survey conducted by the
Hong Kong Investment Funds Association on their members, and cover only the active authorised funds that have responded to the survey. At end-March 2018, the survey covered a total of 1 297 active authorised funds.
(14) At end-March 2018, there was one SFC-authorised retail hedge fund with net asset size
of US$26 million. The amount of net assets under management represented a 0.8% decrease from end-2017, and a 83.8% decrease from end-2002, the year when the hedge funds guidelines were first issued.
(15) At end-March 2018, there were 160 authorised insurers in Hong Kong. Within this
total, 47 were engaged in long-term insurance business, 94 in general insurance business, and 19 in composite insurance business. These authorised insurers come from 23 countries and territories (including Hong Kong).
71
CHAPTER 5 : THE LABOUR SECTOR
Summary • The labour market remained tight in the first quarter of 2018.
The seasonally adjusted unemployment rate held unchanged at a low level of 2.9%, while the underemployment rate edged down further to a post-1997 low of 1.0%.
• On the back of the vibrant local economy, labour demand stayed robust in recent months. This was reflected by the continued appreciable growth in total employment on entering 2018 as well as the faster increase in the number of private sector job vacancies.
• Amid a state of full employment, nominal wages and payroll sustained
their growth momentum in 2017. Earnings of lower-paid workers showed particularly visible improvement that well exceeded inflation, thanks partly to the upward adjustment of the Statutory Minimum Wage rate since May 2017.
Overall labour market situation(1) 5.1 The labour market stayed tight in the first quarter of 2018, with both the labour force and total employment posting further solid year-on-year growth against the backdrop of the strong local economic performance. Compared to the preceding quarter, the seasonally adjusted unemployment rate(2) remained low at 2.9% in the first quarter, while the underemployment rate(3) edged down by 0.1 percentage point to 1.0%, the lowest level in more than two decades. Data collected from private sector establishments also pointed to sturdy labour demand, characterised by solid job gains and a remarkably broad-based increase in job vacancies. Backed by an essentially full employment situation, overall wages and earnings continued to register increases that well exceeded inflation, pointing to appreciable real improvement. Earnings of the grassroots workers fared relatively better alongside the upward adjustment of the Statutory Minimum Wage rate since May 2017.
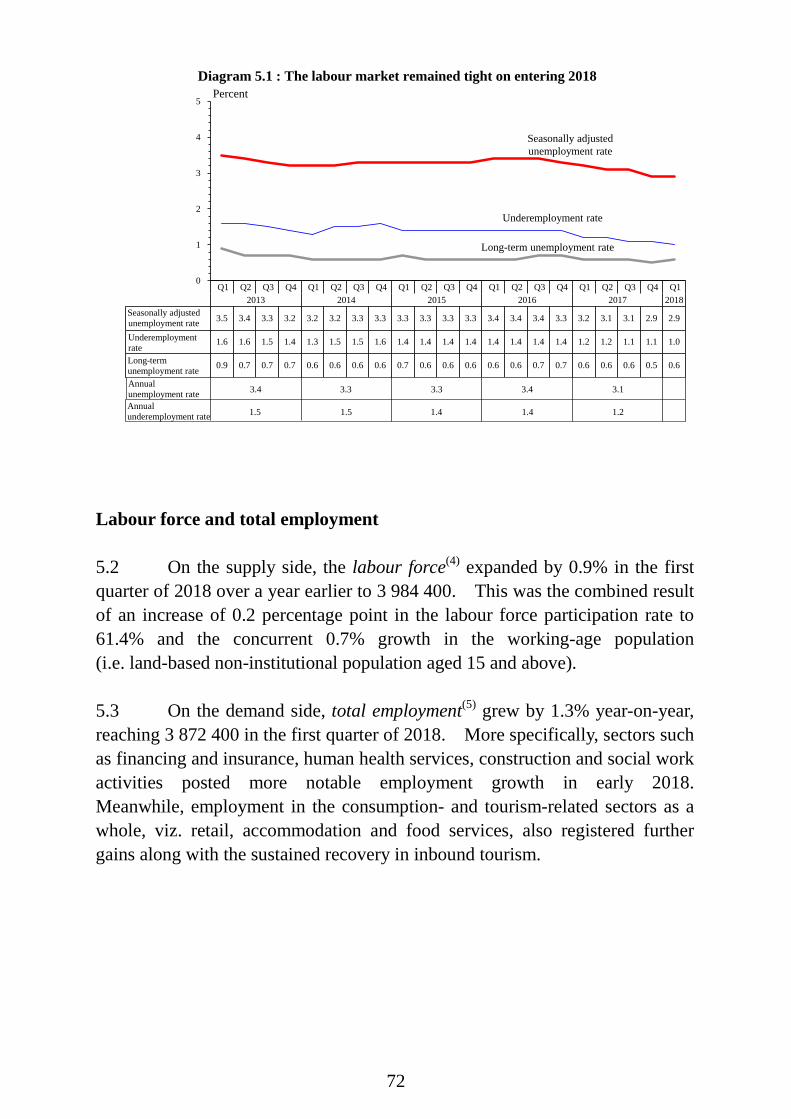
72
Q1 Q2 Q3 Q4 Q1 Q2 Q3 Q4 Q1 Q2 Q3 Q4 Q1 Q2 Q3 Q4 Q1 Q2 Q3 Q4 Q12013 2014 2015 2016 2017 2018
Seasonally adjustedunemployment rate 3.5 3.4 3.3 3.2 3.2 3.2 3.3 3.3 3.3 3.3 3.3 3.3 3.4 3.4 3.4 3.3 3.2 3.1 3.1 2.9 2.9
Underemploymentrate 1.6 1.6 1.5 1.4 1.3 1.5 1.5 1.6 1.4 1.4 1.4 1.4 1.4 1.4 1.4 1.4 1.2 1.2 1.1 1.1 1.0
Long-termunemployment rate 0.9 0.7 0.7 0.7 0.6 0.6 0.6 0.6 0.7 0.6 0.6 0.6 0.6 0.6 0.7 0.7 0.6 0.6 0.6 0.5 0.6
0
1
2
3
4
5
Diagram 5.1 : The labour market remained tight on entering 2018
Seasonally adjustedunemployment rate
Percent
Underemployment rate
Long-term unemployment rate
UnderemploymentrateLong-termunemployment rateAnnualunemployment rateAnnualunderemployment rate 1.5 1.5
3.4 3.3 3.43.3 3.1
1.4 1.4 1.2
Labour force and total employment 5.2 On the supply side, the labour force(4) expanded by 0.9% in the first quarter of 2018 over a year earlier to 3 984 400. This was the combined result of an increase of 0.2 percentage point in the labour force participation rate to 61.4% and the concurrent 0.7% growth in the working-age population (i.e. land-based non-institutional population aged 15 and above). 5.3 On the demand side, total employment(5) grew by 1.3% year-on-year, reaching 3 872 400 in the first quarter of 2018. More specifically, sectors such as financing and insurance, human health services, construction and social work activities posted more notable employment growth in early 2018. Meanwhile, employment in the consumption- and tourism-related sectors as a whole, viz. retail, accommodation and food services, also registered further gains along with the sustained recovery in inbound tourism.
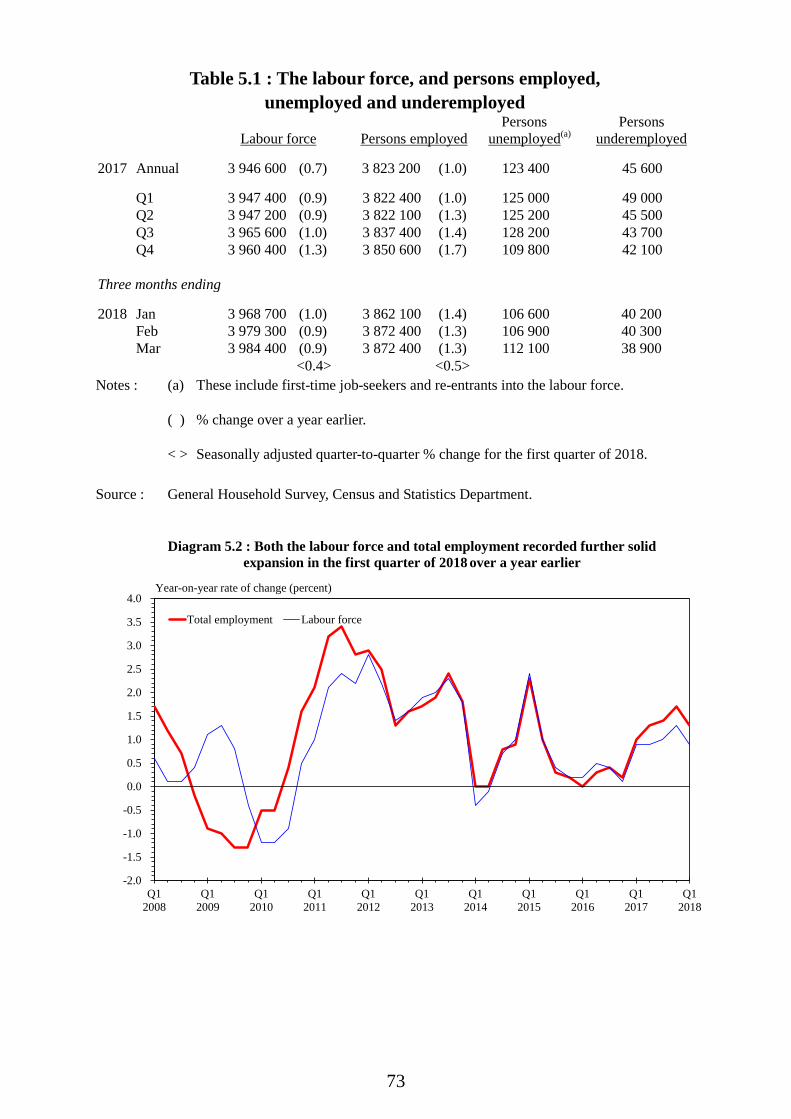
73
Table 5.1 : The labour force, and persons employed, unemployed and underemployed
Labour force
Persons employed
Persons unemployed(a)
Persons underemployed
2017 Annual 3 946 600 (0.7) 3 823 200 (1.0) 123 400 45 600 Q1 3 947 400 (0.9) 3 822 400 (1.0) 125 000 49 000 Q2 3 947 200 (0.9) 3 822 100 (1.3) 125 200 45 500 Q3 3 965 600 (1.0) 3 837 400 (1.4) 128 200 43 700 Q4 3 960 400 (1.3) 3 850 600 (1.7) 109 800 42 100 Three months ending 2018 Jan 3 968 700 (1.0) 3 862 100 (1.4) 106 600 40 200 Feb 3 979 300 (0.9) 3 872 400 (1.3) 106 900 40 300 Mar 3 984 400 (0.9) 3 872 400 (1.3) 112 100 38 900 <0.4> <0.5> Notes : (a) These include first-time job-seekers and re-entrants into the labour force. ( ) % change over a year earlier. < > Seasonally adjusted quarter-to-quarter % change for the first quarter of 2018. Source : General Household Survey, Census and Statistics Department.
Q1
2008Q1
2009Q1
2010Q1
2011Q1
2012Q1
2013Q1
2014Q1
2015Q1
2016Q1
2017Q1
2018
-2.0
-1.5
-1.0
-0.5
0.0
0.5
1.0
1.5
2.0
2.5
3.0
3.5
4.0
Total employment Labour force
Year-on-year rate of change (percent)
Diagram 5.2 : Both the labour force and total employment recorded further solid expansion in the first quarter of 2018 over a year earlier

74
Table 5.2 : Labour force participation rates by gender and by age group (%)
2013 2014 2015 2016 2017 2017 Q1 2018 Q1
Male 15-24 37.8 37.8 39.1 39.5 38.1 37.0 39.0 of which:
15-19 11.0 11.1 11.7 12.9 9.9 9.6 9.3 20-24 62.5 61.4 62.0 60.7 59.2 58.0 60.7
25-29 93.8 93.4 93.7 92.9 92.6 91.8 92.2 30-39 96.9 96.5 96.5 96.4 96.6 96.8 96.9 40-49 95.5 94.7 95.1 95.0 95.2 95.1 95.5 50-59 86.9 86.7 86.6 86.0 86.7 86.5 87.3 ≥ 60 27.0 28.0 28.5 29.9 30.4 30.8 31.2
Overall 69.2 68.8 68.8 68.6 68.3 68.4 68.7
Female 15-24 40.0 39.3 41.4 41.9 41.5 40.6 40.8 of which:
15-19 11.5 12.5 12.8 12.3 11.8 10.3 11.1 20-24 64.2 61.4 63.6 63.6 61.8 62.0 60.5
25-29 86.5 86.3 85.7 86.2 86.5 87.3 87.3 30-39 78.4 78.9 78.4 78.0 79.0 80.3 80.2 40-49 72.8 73.0 73.7 73.4 73.8 73.7 74.1 50-59 56.2 57.2 58.3 59.7 60.4 60.0 61.1 ≥ 60 9.7 10.7 11.4 12.3 13.7 13.3 14.3
Overall 54.5 54.5 54.7 54.8 55.1 55.3 55.4
Both genders combined 15-24 38.9 38.5 40.2 40.7 39.8 38.8 39.9 of which:
15-19 11.3 11.8 12.3 12.6 10.8 10.0 10.1 20-24 63.4 61.4 62.8 62.2 60.5 60.0 60.6
25-29 89.6 89.4 89.2 89.2 89.3 89.3 89.5 30-39 85.9 86.0 85.7 85.4 86.0 86.9 86.8 40-49 82.5 82.3 82.7 82.4 82.6 82.6 82.9 50-59 71.1 71.4 71.8 72.2 72.7 72.5 73.3 ≥ 60 18.0 19.0 19.6 20.7 21.7 21.7 22.4
Overall 61.2 61.1 61.1 61.1 61.1 61.2 61.4 Source : General Household Survey, Census and Statistics Department.

75
Profile of unemployment 5.4 The number of unemployed persons rose by 2 200 over the preceding quarter to 112 100 in the first quarter of 2018. Nevertheless, comparing this figure with that in the same period of 2017 to net out seasonal influence, there was indeed a decrease of 10.3%, or 12 900. The seasonally adjusted unemployment rate in the quarter, at 2.9%, was the same as that in the fourth quarter of 2017. 5.5 In terms of sectoral unemployment rate (not seasonally adjusted) as compared to the preceding quarter, more notable declines were seen in the warehousing and support activities for transportation as well as the accommodation services (both down 0.8 percentage point) sectors. On the other hand, more discernible increases in jobless rates were observed in the decoration, repair and maintenance for buildings (up 1.5 percentage points), and insurance (up 0.9 percentage point) sectors. The former conceivably reflected the influence of usual activity wind-down of the sector concerned around the Lunar New Year. On a year-on-year comparison, improvement in jobless situation was observed across most of the major service sectors in the first quarter of 2018. Specifically, the continued recovery in inbound tourism had pushed the unemployment rate in the consumption- and tourism-related segment as a whole (viz. retail, accommodation, and food services) down by 0.5 percentage point from its year-ago level to 4.2%, the lowest level since the fourth quarter of 2014. For the low paying sectors(6) as a whole, its unemployment rate, at 2.8%, was also 0.4 percentage point below its year-ago level. 5.6 Analysed by skill segment, the unemployment rates of both the higher-skilled and lower-skilled segments edged up by 0.1 percentage point over the preceding quarter, to 1.6% and 3.2% respectively. However, on a year-on-year comparison which nets out the effect of seasonality, the unemployment rates of the two segments declined by 0.2 and 0.4 percentage point respectively. 5.7 As regards other socio-economic attributes, jobless situation improved generally across different groups when compared to a year earlier. More specifically, visible year-on-year decreases in the unemployment rate were observed among persons aged 50-59 (down 0.7 percentage point) and those with lower secondary education (down 1.1 percentage points).

76
Q12013
Q12014
Q12015
Q12016
Q12017
Q12018
2
3
4
5
6
7Construction
Retail
Accommodation and food services
Percent
0
Percent
0
Diagram 5.3 : Most of the major service sectors saw improvement in unemployment situation in the first quarter of 2018 when compared to a year earlier
Q12013
Q12014
Q12015
Q12016
Q12017
Q12018
0
1
2
3
4
5Import/export trade and wholesale
Financing, insurance, real estate, and professional andbusiness servicesTransportation, storage, postal and courier services, andinformation and communicationsPublic administration, social and personal services
PercentPercent

77
Table 5.3 : Unemployment rates by major economic sector 2017 2018 Q1 Q2 Q3 Q4 Q1 Import/export trade and wholesale
3.0 3.1 2.9 2.3 2.4
Retail 5.0 4.8 4.2 4.0 3.9 Accommodation and food services
4.3 4.5 4.6 4.5 4.5
Transportation, storage, postal and courier services
3.3 3.0 2.5 2.4 2.3
Information and communications
2.5 3.2 3.3 2.8 2.3
Financing and insurance 2.0 1.8 1.7 1.3 1.6 Real estate 1.9 2.3 2.0 2.0 2.3 Professional and business services
2.7 2.6 2.2 2.3 2.4
Public administration, social and personal services
1.5 1.3 1.4 1.3 1.3
Manufacturing 2.6 2.4 2.7 2.6 3.3 Construction 4.4 4.8 4.7 4.1 4.8 Overall* 3.2 3.2 3.2 2.8 2.8 (3.2) (3.1) (3.1) (2.9) (2.9) Notes : * Including first-time job-seekers and re-entrants into the labour force. ( ) Seasonally adjusted unemployment rates. Source : General Household Survey, Census and Statistics Department.

78
Q12008
Q12009
Q12010
Q12011
Q12012
Q12013
Q12014
Q12015
Q12016
Q12017
Q12018
0
1
2
3
4
5
6
7
8
Diagram 5.4 : The unemployment rates of both the higher-skilled and lower-skilled segments were lower on a year-on-year basis
Percent
Unemployment rate of lower-skilled workers
Unemployment rate of higher-skilled workers
Seasonally adjustedunemployment rate
Table 5.4 : Unemployment rates* by skill segment 2017 2018 Q1 Q2 Q3 Q4 Q1 Higher-skilled segment 1.8 1.7 1.7 1.5 1.6 Managers and administrators 1.4 1.0 1.0 0.8 1.2 Professionals 1.8 1.4 1.6 1.3 1.1 Associate professionals 2.0 2.2 2.1 2.1 1.9 Lower-skilled segment^ 3.6 3.6 3.3 3.1 3.2 Clerical support workers 3.2 3.6 3.4 3.1 3.3 Service and sales workers 4.3 4.6 4.1 3.8 3.9 Craft and related workers 4.5 4.2 4.0 4.1 4.8 Plant and machine operators
and assemblers 2.8 2.0 1.7 1.2 1.5
Elementary occupations 3.1 3.0 2.7 2.6 2.5 Notes : * Not seasonally adjusted, and not including first-time job-seekers and re-entrants into the
labour force. ^ Including other occupations. Source : General Household Survey, Census and Statistics Department.
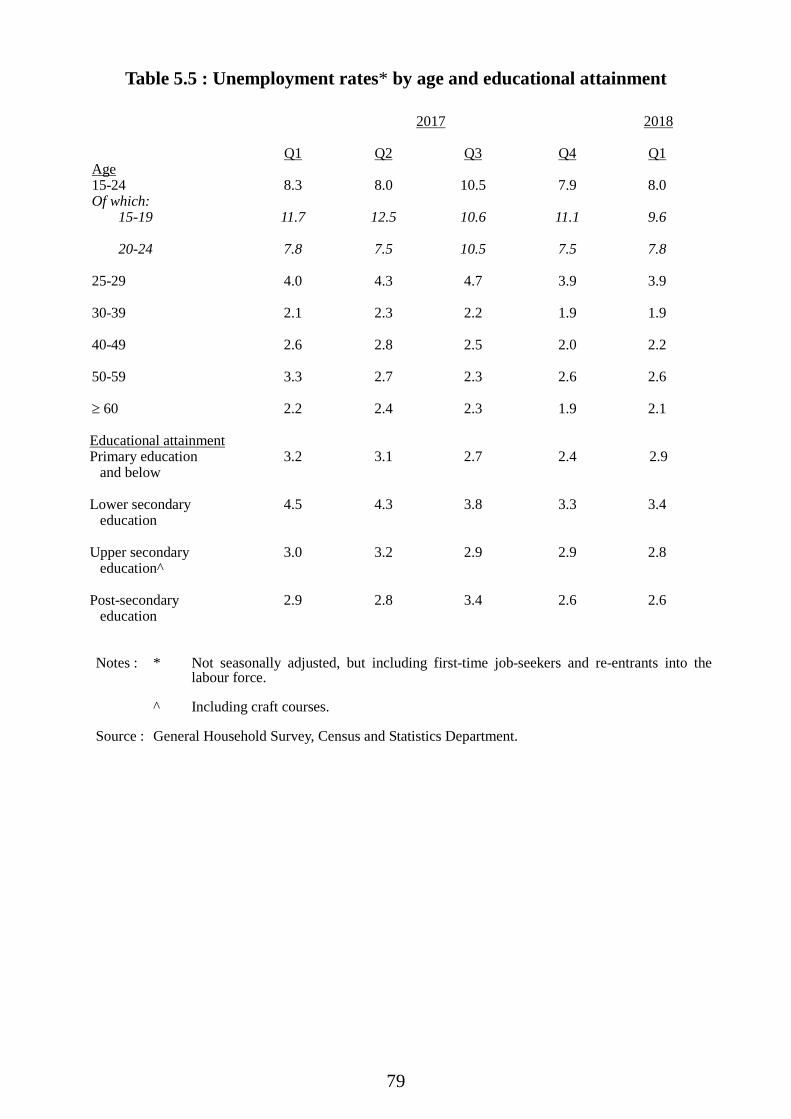
79
Table 5.5 : Unemployment rates* by age and educational attainment
2017 2018 Q1 Q2 Q3 Q4 Q1 Age 15-24 8.3 8.0 10.5 7.9 8.0 Of which:
15-19 20-24
11.7
7.8
12.5
7.5
10.6
10.5
11.1
7.5
9.6
7.8
25-29 4.0 4.3 4.7 3.9 3.9 30-39 2.1 2.3 2.2 1.9 1.9 40-49 2.6 2.8 2.5 2.0 2.2 50-59 3.3 2.7 2.3 2.6 2.6 ≥ 60 2.2 2.4 2.3 1.9 2.1 Educational attainment
Primary education and below
3.2 3.1 2.7 2.4 2.9
Lower secondary
education 4.5 4.3 3.8 3.3 3.4
Upper secondary
education^ 3.0 3.2 2.9 2.9 2.8
Post-secondary
education 2.9 2.8 3.4 2.6 2.6
Notes : * Not seasonally adjusted, but including first-time job-seekers and re-entrants into the
labour force. ^ Including craft courses. Source : General Household Survey, Census and Statistics Department.

80
5.8 Other indicators measuring the intensity of unemployment remained mostly stable in the first quarter of 2018 when compared to their year-ago levels. The number of long-term unemployed persons (i.e. unemployed for six months or longer) increased slightly to 24 200 from 23 600 a year earlier. Given the notable decline in the total number of unemployed persons, the share of long-term unemployment in total unemployment went up from 18.9% to 21.6% over the same period. Yet the long-term unemployment rate was unchanged at 0.6% from a year earlier, while the median duration of unemployment shortened marginally from 70 days to 69 days. Moreover, the proportion of dismissal or lay-offs among the total number of unemployed persons (not including first-time job-seekers and re-entrants into the labour force) declined by 0.7 percentage point over a year earlier to 48.4% in the first quarter. Profile of underemployment 5.9 The underemployment rate edged down further by 0.1 percentage point over the preceding quarter to 1.0% in the first quarter of 2018, the lowest level since end-1997. The number of underemployed persons likewise decreased by 3 100 to 38 900. More significant declines in underemployment rate were seen in the foundation and superstructure as well as warehousing and support activities for transportation sectors. Analysed by occupational category, the underemployment rate of the higher-skilled segment stood at 0.3%, while that of the lower-skilled segment was 1.4%, down by 0.2 percentage point from the preceding quarter. More notable falls in underemployment rate were observed among craft and related workers and service and sales workers.

81
Box 5.1 Business performance and operating situation of low paying sectors in 2016
The main policy objective of the Statutory Minimum Wage (SMW) implemented since May 2011 is to protect grassroots employees from excessively low wages. Setting a wage floor, however, will inevitably push up labour costs borne by enterprises and exert certain pressure on business operation. If enterprises opt to mitigate the additional operating expenses by downsizing, the stability of the labour market may be compromised and the brunt may particularly be borne by employees with lower skills and weaker bargaining power. Fortunately, the sustained expansion of Hong Kong economy over the past few years and the sturdy labour demand eased to a large extent the pressure that SMW might have put on the labour market. Besides, the improved income prospects for grassroots employees have also attracted more people, especially women and older persons, to enter or re-enter the labour market, thereby partly relieving the pressure of a dwindling workforce due to gradually ageing population. Since the business performance of enterprises is closely related to the labour market, this article seeks to analyse, based on the results of the 2016 Annual Survey of Economic Activities(1) released by the Census and Statistics Department, the business performance and operating situation of the low paying sectors (LPS) and the small and medium-sized enterprises(2) (SMEs) therein, which hire more low-paid employees. Despite the subpar global economic growth at the start of 2016, the Hong Kong economy still recorded a moderate growth of 2.1% for the year as a whole, thanks to the largely resilient domestic demand and gradual stabilisation of the external environment during the year. The overall local business environment thus did not show visible deterioration. As for LPS, most sectors managed to record growth in business receipts during the year, with restaurants, local courier services and elderly homes in particular sustaining modest increases in business receipts. Nonetheless, with a noticeable decline in both visitor arrivals and per capita visitor spending in 2016, the business receipts of the retail sector (which accounted for about 70% of those of LPS) plunged by 7.5%, weighing down the business receipts for LPS as a whole by 4.7%, the first decline since the implementation of SMW (Chart 1).
Chart 1: Business receipts of many LPS recorded growth on the back of moderate economic expansion in 2016
0.3
-8.3
3.0
2.5
6.4
2.3
-9.4
10.9 11.5
1.8 5.3
-6.4
4.01.1
-4.7
0.9 0.40.9
-0.3 -0.9
6.16.1
4.3 5.0 7.76.0 2.6
6.6
21.4
3.94.5
1.1 0.3 0.4
-15
-10
-5
0
5
10
15
20
25
Supe
rmar
kets
and
conv
enie
nce
stor
es
Oth
er re
tail
stor
es
Chi
nese
rest
aura
nts
Non
-Chi
nese
rest
aura
nts
Fast
food
caf
es
Hon
g K
ong
styl
e te
a ca
fes
Rea
l est
ate
mai
nten
ance
man
agem
ent
Secu
rity
serv
ices
Cle
anin
gse
rvic
es
Elde
rly h
omes
Laun
dry
and
dry
clea
ning
serv
ices
Hai
rdre
ssin
g se
rvic
es
Loca
l cou
rier
serv
ices
Food
pro
cess
ing
and
prod
uctio
n
Low
pay
ing
sect
ors
Oth
er se
ctor
s
All
sect
ors
2016
2015
Rate of change (%)
Retail[-0.2%] [-7.5%]
2015 → 2016
Restaurants[3.2%] [3.5%]
2015 → 2016
Estate management, security and
cleaning services[5.7%] [-1.3%]
2015 → 2016
Other low paying sectors[5.2%] [0.9%]
2015 → 2016 Note: [ ] Figures in brackets denote the rate of change in business receipts of all enterprises in that sector in the specified year. Source: Annual Survey of Economic Activities, Census and Statistics Department.
(1) For the business performance of enterprises in LPS in previous years, please see Box 6.1 in the 2012 Economic
Background and 2013 Prospects, as well as Box 5.1 in the First Quarter Economic Report 2014, First Quarter Economic Report 2015, First Quarter Economic Report 2016 and First Quarter Economic Report 2017.
(2) The statistics discussed in this article pertain to enterprises with employees only. SMEs refer to enterprises with fewer than 50 persons engaged.

82
Box 5.1 (Cont’d)
Operating costs Alongside the moderate expansion of the Hong Kong economy in 2016, the overall labour demand held broadly stable and the labour market remained in a state of full employment. Given the steady growth in labour earnings, the labour costs of enterprises generally went up. With most LPS being labour-intensive in nature, the rise in staff costs was a key factor underlying the increase in total operating expenses of enterprises. Among the LPS, the contribution of staff costs to the increase in operating expenses was more apparent for the restaurants, cleaning services, security services, and food processing and production sectors. Taking cleaning and security services as examples, within the respective increases of 10.3% and 9.6% in their total operating expenses, 6.6 and 6.3 percentage points came from the rise in staff costs correspondingly which accounted for over 60% of the total increases in operating expenses for the two sectors. Nevertheless, thanks to softening rentals for retail space and office during the year and enterprises’ efforts to compress expenses other than wage bills through strategies such as cost control and operational efficiency enhancement, the total operating expenses of LPS dropped by 1.0% in 2016, in contrast to the increase of 6.2% in 2015 (Chart 2).
Chart 2: Staff costs were the key driver for the increase in total operating expenses of most LPS in 2016
1.5-1.2 0.3 -0.8
1.0
-1.20.1 * 0.1 -2.5
3.5
-2.1
-0.4
0.9
-0.5
-0.1 -0.1
1.3
-0.3
2.7 2.93.7
3.4 2.46.3 6.6
*
4.0
3.8
-2.1
2.51.4 1.8 1.7
0.6
-2.2
2.2
-0.1
2.40.8
-13.8
3.4 3.6
3.3
-3.9-0.7
2.9
0.5
-1.9-0.2 -0.4
3.4
-3.6
5.22.0
7.1
3.0
-11.3
9.6 10.3
0.7
3.6
1.1 0.43.8
-1.0
1.5 1.2
-20
-15
-10
-5
0
5
10
15
Supe
rmar
kets
and
conv
enie
nce
stor
es
Oth
er re
tail
stor
es
Chi
nese
rest
aura
nts
Non
-Chi
nese
rest
aura
nts
Fast
food
caf
es
Hon
g K
ong
styl
e te
a ca
fes
Rea
l est
ate
mai
nten
ance
man
agem
ent
Secu
rity
serv
ices
Cle
anin
gse
rvic
es
Elde
rly h
omes
Laun
dry
and
dry
clea
ning
serv
ices
Hai
rdre
ssin
g se
rvic
es
Loca
l cou
rier
serv
ices
Food
pro
cess
ing
and
prod
uctio
n
Low
pay
ing
sect
ors
Oth
er se
ctor
s
All
sect
ors
Contribution of other operating expenses (% point)Contribution of staff costs (% point)Contribution of rent, rates and government rent (% point)
Rate of change (%) / Percentage point
Rate of change in total operating expenses (excluding cost of goods sold)Of which:
Estate management, security and
cleaning services[-3.0%]
Other low paying sectors[2.4%]
Retail[-3.1%]
Restaurants[4.3%]
Note: The sum of the individual items may not add up to the totals due to rounding. [ ] Figures in brackets denote the rate of change in total operating expenses of all enterprises in that sector in 2016. (*) Within ±0.05 percentage point. Source: Annual Survey of Economic Activities, Census and Statistics Department.
Profitability Notwithstanding the pressure arising from a fall in business volume in 2016, the profitability of LPS held steady through effective cost control. Statistics showed that the overall profit ratio of LPS edged up by 0.1 percentage point to 6.2%, within which the profit ratios(3) of most sub-sectors (including the retail sector) were comparable to those in 2015 (Chart 3).
(3) Earnings before tax ratio (abbreviated as profit ratio) refers to the ratio of profits (before deducting tax;
gain/loss on disposal of property, machinery and equipment; bad debts/write-off; provisions, etc.) to business receipts.
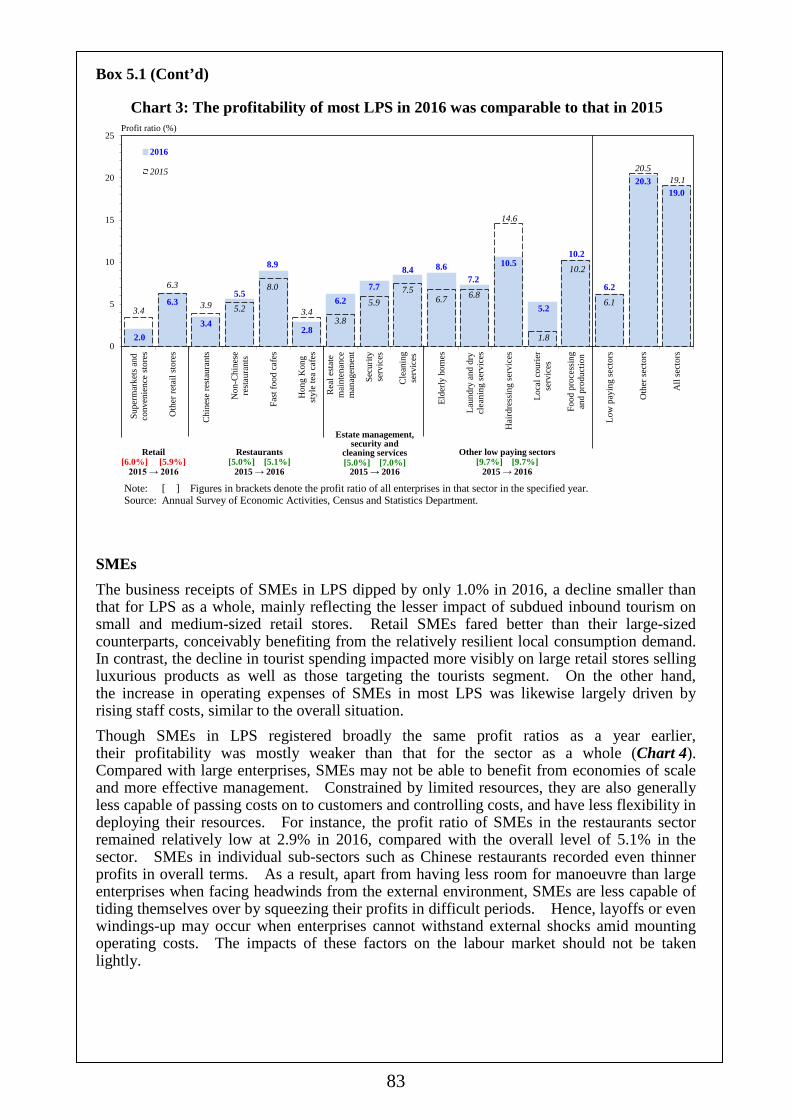
83
Box 5.1 (Cont’d)
Chart 3: The profitability of most LPS in 2016 was comparable to that in 2015
2.0
6.3
3.4
5.5
8.9
2.8
6.27.7
8.4 8.67.2
10.5
5.2
10.2
6.2
20.319.0
3.4
6.3
3.9 5.2
8.0
3.43.8
5.97.5
6.7 6.8
14.6
1.8
10.2
6.1
20.519.1
0
5
10
15
20
25Su
perm
arke
ts a
ndco
nven
ienc
e st
ores
Oth
er re
tail
stor
es
Chi
nese
rest
aura
nts
Non
-Chi
nese
rest
aura
nts
Fast
food
caf
es
Hon
g K
ong
styl
e te
a ca
fes
Rea
l est
ate
mai
nten
ance
man
agem
ent
Secu
rity
serv
ices
Cle
anin
gse
rvic
es
Elde
rly h
omes
Laun
dry
and
dry
clea
ning
serv
ices
Hai
rdre
ssin
g se
rvic
es
Loca
l cou
rier
serv
ices
Food
pro
cess
ing
and
prod
uctio
n
Low
pay
ing
sect
ors
Oth
er se
ctor
s
All
sect
ors
2016
2015
Profit ratio (%)
Retail[6.0%] [5.9%]
2015 → 2016
Restaurants[5.0%] [5.1%]
2015 → 2016
Estate management, security and
cleaning services[5.0%] [7.0%]
2015 → 2016
Other low paying sectors[9.7%] [9.7%]
2015 → 2016 Note: [ ] Figures in brackets denote the profit ratio of all enterprises in that sector in the specified year. Source: Annual Survey of Economic Activities, Census and Statistics Department.
SMEs The business receipts of SMEs in LPS dipped by only 1.0% in 2016, a decline smaller than that for LPS as a whole, mainly reflecting the lesser impact of subdued inbound tourism on small and medium-sized retail stores. Retail SMEs fared better than their large-sized counterparts, conceivably benefiting from the relatively resilient local consumption demand. In contrast, the decline in tourist spending impacted more visibly on large retail stores selling luxurious products as well as those targeting the tourists segment. On the other hand, the increase in operating expenses of SMEs in most LPS was likewise largely driven by rising staff costs, similar to the overall situation. Though SMEs in LPS registered broadly the same profit ratios as a year earlier, their profitability was mostly weaker than that for the sector as a whole (Chart 4). Compared with large enterprises, SMEs may not be able to benefit from economies of scale and more effective management. Constrained by limited resources, they are also generally less capable of passing costs on to customers and controlling costs, and have less flexibility in deploying their resources. For instance, the profit ratio of SMEs in the restaurants sector remained relatively low at 2.9% in 2016, compared with the overall level of 5.1% in the sector. SMEs in individual sub-sectors such as Chinese restaurants recorded even thinner profits in overall terms. As a result, apart from having less room for manoeuvre than large enterprises when facing headwinds from the external environment, SMEs are less capable of tiding themselves over by squeezing their profits in difficult periods. Hence, layoffs or even windings-up may occur when enterprises cannot withstand external shocks amid mounting operating costs. The impacts of these factors on the labour market should not be taken lightly.
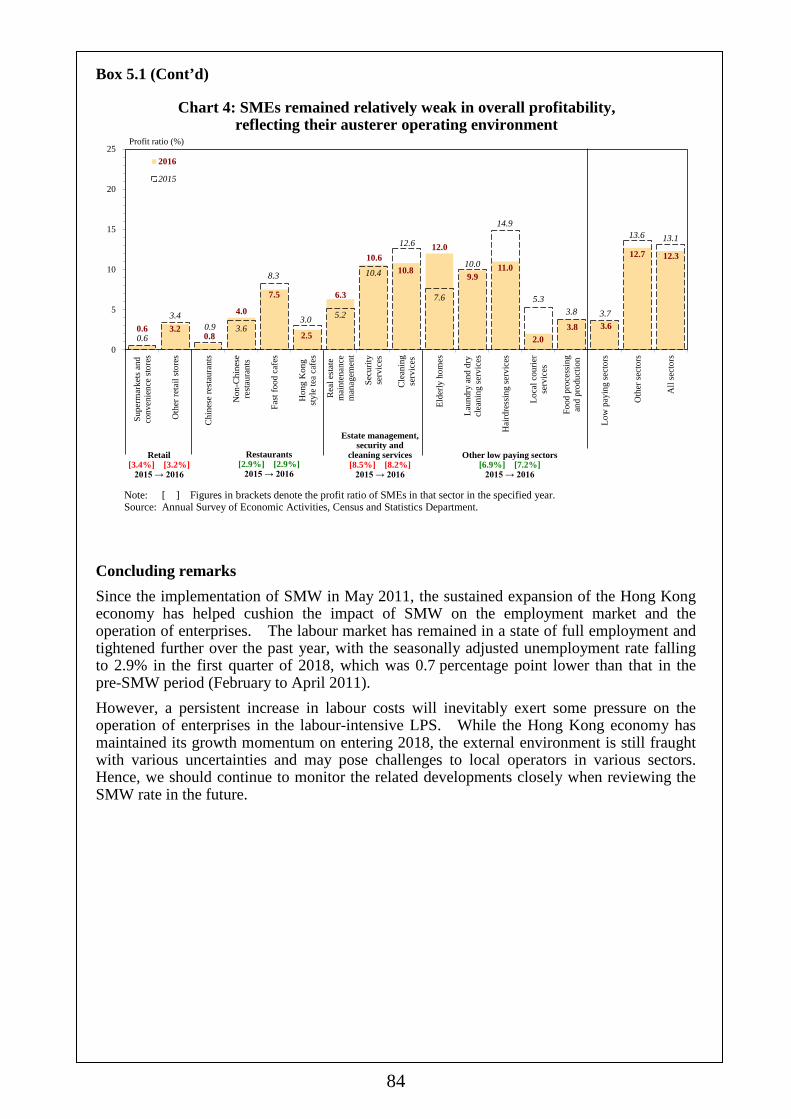
84
Box 5.1 (Cont’d)
Chart 4: SMEs remained relatively weak in overall profitability, reflecting their austerer operating environment
0.6 3.20.8
4.0
7.5
2.5
6.3
10.610.8
12.0
9.911.0
2.03.8 3.6
12.7 12.3
0.6
3.40.9 3.6
8.3
3.0 5.2
10.4
12.6
7.6
10.0
14.9
5.33.8 3.7
13.6 13.1
0
5
10
15
20
25Su
perm
arke
ts a
ndco
nven
ienc
e st
ores
Oth
er re
tail
stor
es
Chi
nese
rest
aura
nts
Non
-Chi
nese
rest
aura
nts
Fast
food
caf
es
Hon
g K
ong
styl
e te
a ca
fes
Rea
l est
ate
mai
nten
ance
man
agem
ent
Secu
rity
serv
ices
Cle
anin
gse
rvic
es
Elde
rly h
omes
Laun
dry
and
dry
clea
ning
serv
ices
Hai
rdre
ssin
g se
rvic
es
Loca
l cou
rier
serv
ices
Food
pro
cess
ing
and
prod
uctio
n
Low
pay
ing
sect
ors
Oth
er se
ctor
s
All
sect
ors
2016
2015
Profit ratio (%)
Retail[3.4%] [3.2%]
2015 → 2016
Restaurants[2.9%] [2.9%]
2015 → 2016
Estate management, security and
cleaning services[8.5%] [8.2%]
2015 → 2016
Other low paying sectors[6.9%] [7.2%]
2015 → 2016 Note: [ ] Figures in brackets denote the profit ratio of SMEs in that sector in the specified year. Source: Annual Survey of Economic Activities, Census and Statistics Department.
Concluding remarks Since the implementation of SMW in May 2011, the sustained expansion of the Hong Kong economy has helped cushion the impact of SMW on the employment market and the operation of enterprises. The labour market has remained in a state of full employment and tightened further over the past year, with the seasonally adjusted unemployment rate falling to 2.9% in the first quarter of 2018, which was 0.7 percentage point lower than that in the pre-SMW period (February to April 2011). However, a persistent increase in labour costs will inevitably exert some pressure on the operation of enterprises in the labour-intensive LPS. While the Hong Kong economy has maintained its growth momentum on entering 2018, the external environment is still fraught with various uncertainties and may pose challenges to local operators in various sectors. Hence, we should continue to monitor the related developments closely when reviewing the SMW rate in the future.

85
Profile of employment in establishments 5.10 The quarterly statistics collected from private sector establishments on employment, vacancies, wages and payroll are available only up to December 2017. To bring the analysis more up-to-date, attempts have been made wherever possible by drawing reference to information from supplementary sources. 5.11 Private sector employment recorded another solid increase of 1.0% in December 2017 over a year earlier to 2 857 900, backed by the buoyant economic performance and the further recovery in inbound tourism. Analysed by industries, more notable increases were seen in construction sites (covering manual workers only) (up 9.2% year-on-year), human health services (up 3.5%), financing and insurance (up 2.0%), professional and business services (excluding cleaning and similar services) (up 1.8%), education (up 1.6%), and residential care and social work services (up 1.5%). Meanwhile, declines in persons engaged were observed in manufacturing (down 3.6% year-on-year), and import and export trade (down 0.7%) over the same period. Analysed by establishment size, employment in small and medium-sized enterprises (SMEs)(7) in December 2017 fell by 0.9% over a year earlier, whereas that in large enterprises went up visibly by 2.6%. For 2017 as a whole, growth in total private sector employment picked up to 1.0%, compared to the 0.6% gain in 2016. As for the civil service, the year-on-year employment growth was 2.2% in December 2017, and 1.6% for 2017 as a whole.

86
Table 5.6 : Employment by major economic sector 2016 2017 Annual Annual average Mar Jun Sep Dec average Mar Jun Sep Dec Import/export trade
and wholesale 542 400
(-0.7) 542 900
(-1.1) 543 000
(-0.5) 542 000
(-0.6) 541 600
(-0.7) 539 900
(-0.5) 540 900
(-0.4) 541 000
(-0.4) 539 400
(-0.5) 538 200
(-0.6) Retail 266 600
(-1.1) 266 200
(-1.9) 266 200
(-1.4) 266 500
(-0.9) 267 500
(-0.2) 267 900
(0.5) 267 300
(0.4) 267 800
(0.6) 267 100
(0.2) 269 300
(0.6) Accommodation(a) and
food services 281 600
(-0.5) 280 600
(-1.1) 280 800
(-0.7) 282 100
(-0.1) 282 900
(-0.1) 282 300
(0.3) 280 900
(0.1) 281 500
(0.3) 283 400
(0.5) 283 500
(0.2) Transportation, storage,
postal and courier services
178 400 (0.5)
178 600 (1.2)
177 900 (0.8)
178 200 (§)
178 800 (0.2)
178 700 (0.2)
178 100 (-0.3)
177 600 (-0.1)
179 000 (0.5)
180 300 (0.8)
Information and
communications 106 000
(0.7) 105 700
(1.6) 105 100
(0.2) 105 700
(0.2) 107 300
(0.8) 106 900
(0.9) 107 300
(1.5) 106 600
(1.4) 106 600
(0.9) 107 100
(-0.2) Financing, insurance,
real estate, professional and business services
719 500 (1.0)
714 100 (0.4)
718 000 (0.8)
720 600 (1.1)
725 200 (1.8)
731 100 (1.6)
728 300 (2.0)
728 600 (1.5)
730 900 (1.4)
736 700 (1.6)
Social and personal
services 505 500
(1.7) 505 500
(2.3) 503 400
(1.7) 505 200
(1.6) 508 000
(1.2) 512 800
(1.4) 510 300
(1.0) 510 800
(1.5) 512 500
(1.4) 517 400
(1.9) Manufacturing 96 000
(-3.6) 97 800 (-2.5)
96 100 (-3.5)
95 300 (-4.4)
94 900 (-4.1)
92 900 (-3.3)
94 500 (-3.4)
93 400 (-2.8)
92 000 (-3.4)
91 400 (-3.6)
Construction sites
(covering manual workers only)
107 800 (13.3)
104 800 (14.1)
106 200 (14.4)
107 800 (15.0)
112 400 (10.2)
118 700 (10.1)
117 600 (12.2)
112 800 (6.2)
121 500 (12.7)
122 800 (9.2)
All establishments
surveyed in the private sector(b)
2 814 800 (0.6)
2 807 200 (0.5)
<0.1>
2 807 600 (0.6)
<0.2>
2 814 500 (0.7)
<0.3>
2 829 800 (0.8)
<0.2>
2 842 400 (1.0)
2 836 500 (1.0)
<0.3>
2 831 400 (0.8) <§>
2 843 800 (1.0)
<0.4>
2 857 900 (1.0)
<0.2> Civil service(c) 166 100
(1.2) 166 200
(1.5) 165 500
(1.1) 165 900
(1.1) 166 600
(1.0) 168 700
(1.6) 167 700
(0.9) 167 900
(1.4) 169 000
(1.9) 170 300
(2.2)
Notes : Employment figures enumerated from business establishments, as obtained from the Quarterly Survey of
Employment and Vacancies, are somewhat different from those enumerated from households, as obtained from the General Household Survey. This is mainly due to the difference in sectoral coverage: while the former survey covers selected major sectors, the latter survey covers all sectors in the economy.
(a) Accommodation services sector covers hotels, guesthouses, boarding houses and other establishments providing short-term accommodation.
(b) The total figures on private sector employment cover also employment in mining and quarrying; and in electricity and gas supply, and waste management, besides employment in the major sectors indicated above.
(c) These figures cover only those employed on civil service terms of appointment. Judges, judicial officers, ICAC officers, locally engaged staff working in the Hong Kong Economic and Trade Offices outside Hong Kong, and other government employees such as non-civil service contract staff are not included.
( ) % change over a year earlier.
< > Seasonally adjusted quarter-to-quarter % change.
§ Change less than 0.05%.
Sources : Quarterly Survey of Employment and Vacancies, Census and Statistics Department. Quarterly Employment Survey of Construction Sites, Census and Statistics Department.

87
Vacancies 5.12 As one of the manifestations of sturdy labour demand, private sector vacancies increased notably by 10.3% in December 2017 over a year earlier to 74 040, the fastest pace in four years. For 2017 as a whole, the number of job openings rebounded by 3.7%, to an average of 71 310, after three consecutive annual declines. 5.13 Analysed by economic sector, further increases in the number of vacancies were observed in most economic sectors in December 2017, more visibly so in sectors such as human health services (up 155.0% year-on-year), construction sites (covering manual workers only) (up 62.0%), manufacturing (up 26.0%), accommodation services (up 15.6%), financing and insurance (up 14.0%), transportation, storage, postal and courier services (up 13.4%), education (up 13.1%), and professional and business services (excluding cleaning and similar services) (up 11.0%). On the other hand, vacancies in the real estate and the arts, entertainment, recreation and other services sectors fell by 4.7% and 3.2% respectively over the same period. In terms of occupational categories, vacancies in higher-skilled occupations increased for the fourth consecutive quarter, by 27.7% in December 2017. Meanwhile, vacancies in the lower-skilled segment recorded its first year-on-year increase since June 2014, by 3.2%. For 2017 as a whole, the number of vacancies in higher-skilled occupations increased by 17.7%, while that for the lower-skilled occupations fell somewhat by 1.9% notwithstanding the notable improvement towards the end of the year. Analysed by the size of establishments, vacancies in SMEs fell by 2.1% year-on-year in December 2017, while those in large enterprises increased markedly by 19.4%. As for the civil service, the number of job openings for civil service decreased by 9.6% year-on-year to 7 980 in December 2017, and by 3.6% to an average of 8 320 for 2017 as a whole. 5.14 In tandem with the significant increase in unfilled positions in the private sector, the ratio of job vacancies per 100 unemployed persons went up notably to 67 in December 2017, from 55 in both the preceding period (i.e. September 2017) and a year earlier. More specifically, the ratios for the higher- and lower-skilled segments rose from 89 and 60 in September 2017 to 105 and 67 in December 2017 respectively. For 2017 as a whole, the overall ratio increased to 58 from 52 in 2016, with the corresponding ratios of the higher- and lower-skilled segments also rising to 88 and 59 respectively from 67 and 56 in 2016. From a sectoral perspective, manpower shortage was particularly noticeable in the human health services, residential care and social work services, financing and insurance, real estate, and professional and business services sectors in December 2017, as their ratios of job vacancies to unemployed persons stayed above 100.
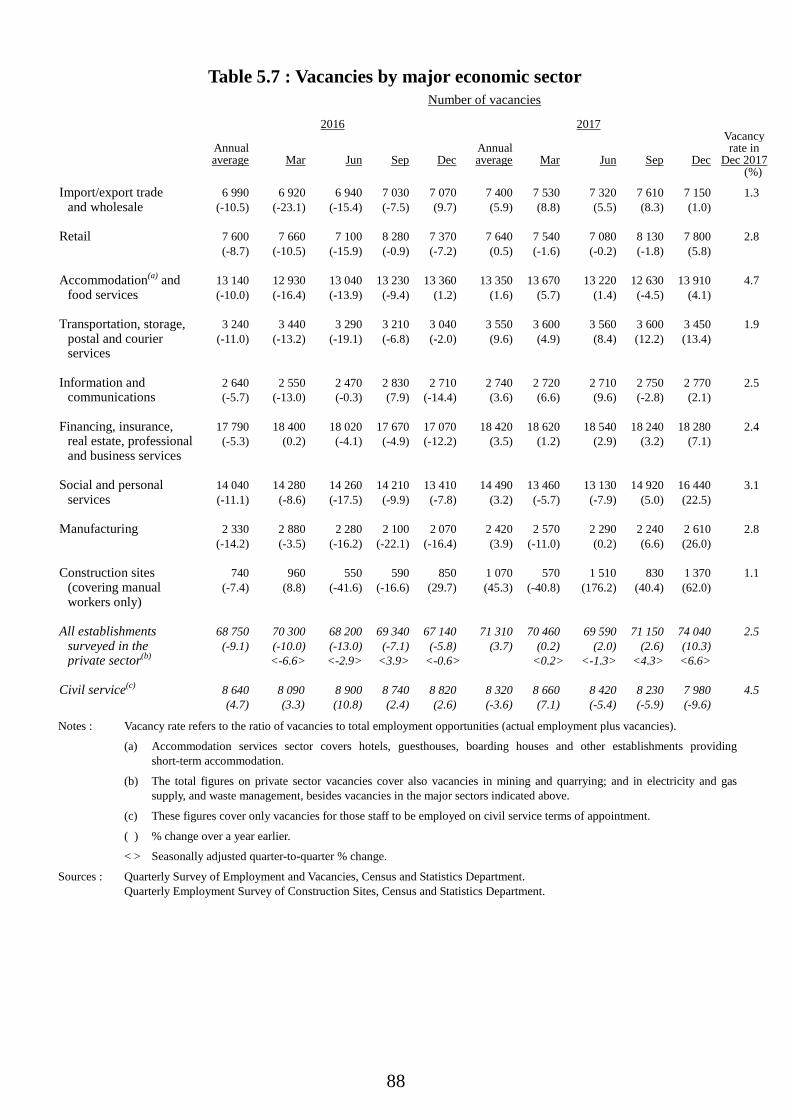
88
Table 5.7 : Vacancies by major economic sector
Number of vacancies 2016 2017 Vacancy Annual Annual rate in average Mar Jun Sep Dec average Mar Jun Sep Dec Dec 2017 (%)
Import/export trade and wholesale
6 990 (-10.5)
6 920 (-23.1)
6 940 (-15.4)
7 030 (-7.5)
7 070 (9.7)
7 400 (5.9)
7 530 (8.8)
7 320 (5.5)
7 610 (8.3)
7 150 (1.0)
1.3
Retail 7 600
(-8.7) 7 660
(-10.5) 7 100
(-15.9) 8 280
(-0.9) 7 370 (-7.2)
7 640 (0.5)
7 540 (-1.6)
7 080 (-0.2)
8 130 (-1.8)
7 800 (5.8)
2.8
Accommodation(a) and
food services 13 140 (-10.0)
12 930 (-16.4)
13 040 (-13.9)
13 230 (-9.4)
13 360 (1.2)
13 350 (1.6)
13 670(5.7)
13 220 (1.4)
12 630 (-4.5)
13 910 (4.1)
4.7
Transportation, storage,
postal and courier services
3 240 (-11.0)
3 440 (-13.2)
3 290 (-19.1)
3 210 (-6.8)
3 040 (-2.0)
3 550 (9.6)
3 600 (4.9)
3 560 (8.4)
3 600 (12.2)
3 450 (13.4)
1.9
Information and
communications 2 640 (-5.7)
2 550 (-13.0)
2 470 (-0.3)
2 830 (7.9)
2 710 (-14.4)
2 740 (3.6)
2 720 (6.6)
2 710 (9.6)
2 750 (-2.8)
2 770 (2.1)
2.5
Financing, insurance,
real estate, professional and business services
17 790 (-5.3)
18 400 (0.2)
18 020 (-4.1)
17 670 (-4.9)
17 070 (-12.2)
18 420 (3.5)
18 620(1.2)
18 540 (2.9)
18 240 (3.2)
18 280 (7.1)
2.4
Social and personal
services 14 040 (-11.1)
14 280 (-8.6)
14 260 (-17.5)
14 210 (-9.9)
13 410 (-7.8)
14 490 (3.2)
13 460(-5.7)
13 130 (-7.9)
14 920 (5.0)
16 440 (22.5)
3.1
Manufacturing 2 330
(-14.2) 2 880 (-3.5)
2 280 (-16.2)
2 100 (-22.1)
2 070 (-16.4)
2 420 (3.9)
2 570 (-11.0)
2 290 (0.2)
2 240 (6.6)
2 610 (26.0)
2.8
Construction sites
(covering manual workers only)
740 (-7.4)
960 (8.8)
550 (-41.6)
590 (-16.6)
850 (29.7)
1 070 (45.3)
570 (-40.8)
1 510 (176.2)
830 (40.4)
1 370 (62.0)
1.1
All establishments
surveyed in the private sector(b)
68 750 (-9.1)
70 300 (-10.0) <-6.6>
68 200 (-13.0) <-2.9>
69 340 (-7.1)
<3.9>
67 140 (-5.8)
<-0.6>
71 310 (3.7)
70 460(0.2)
<0.2>
69 590 (2.0)
<-1.3>
71 150 (2.6)
<4.3>
74 040 (10.3) <6.6>
2.5
Civil service(c) 8 640
(4.7) 8 090 (3.3)
8 900 (10.8)
8 740 (2.4)
8 820 (2.6)
8 320 (-3.6)
8 660 (7.1)
8 420 (-5.4)
8 230 (-5.9)
7 980 (-9.6)
4.5
Notes : Vacancy rate refers to the ratio of vacancies to total employment opportunities (actual employment plus vacancies).
(a) Accommodation services sector covers hotels, guesthouses, boarding houses and other establishments providing short-term accommodation.
(b) The total figures on private sector vacancies cover also vacancies in mining and quarrying; and in electricity and gas supply, and waste management, besides vacancies in the major sectors indicated above.
(c) These figures cover only vacancies for those staff to be employed on civil service terms of appointment.
( ) % change over a year earlier.
< > Seasonally adjusted quarter-to-quarter % change.
Sources : Quarterly Survey of Employment and Vacancies, Census and Statistics Department. Quarterly Employment Survey of Construction Sites, Census and Statistics Department.
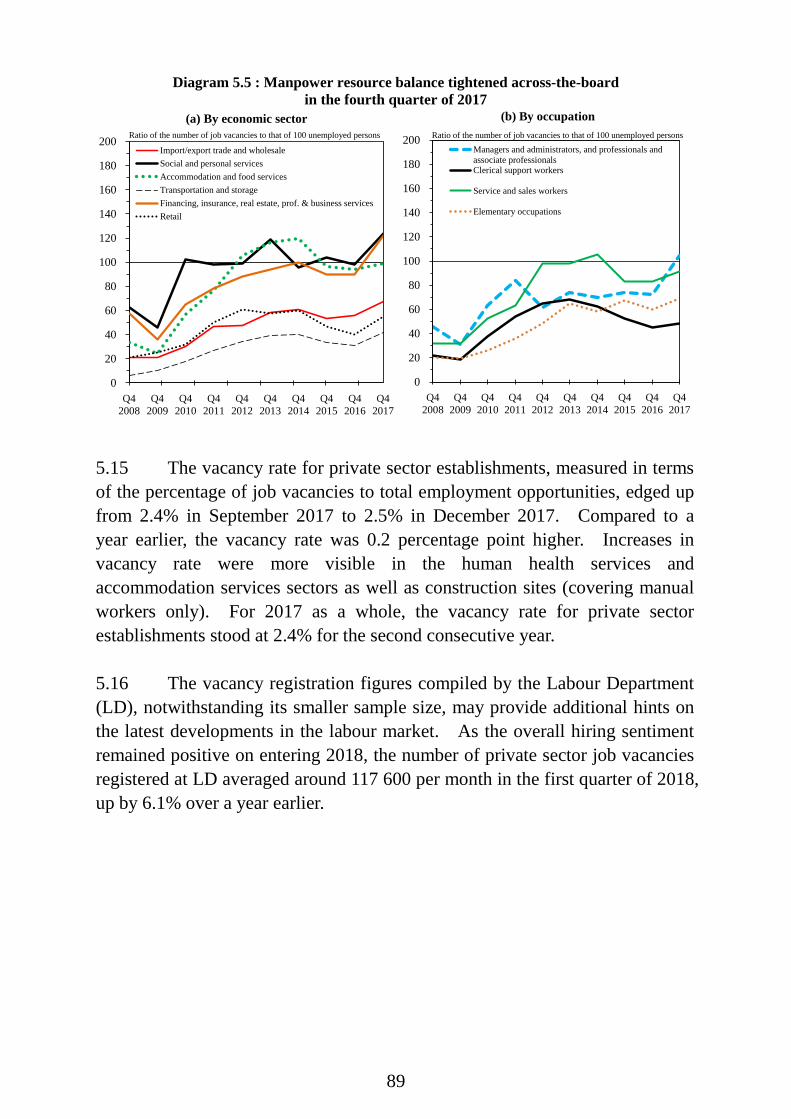
89
Q42008
Q42009
Q42010
Q42011
Q42012
Q42013
Q42014
Q42015
Q42016
Q42017
0
20
40
60
80
100
120
140
160
180
200
(a) By economic sector
Import/export trade and wholesaleSocial and personal servicesAccommodation and food servicesTransportation and storageFinancing, insurance, real estate, prof. & business servicesRetail
Ratio of the number of job vacancies to that of 100 unemployed persons
Q42008
Q42009
Q42010
Q42011
Q42012
Q42013
Q42014
Q42015
Q42016
Q42017
0
20
40
60
80
100
120
140
160
180
200
(b) By occupation
Managers and administrators, and professionals andassociate professionalsClerical support workers
Service and sales workers
Elementary occupations
Ratio of the number of job vacancies to that of 100 unemployed persons
Diagram 5.5 : Manpower resource balance tightened across-the-boardin the fourth quarter of 2017
5.15 The vacancy rate for private sector establishments, measured in terms of the percentage of job vacancies to total employment opportunities, edged up from 2.4% in September 2017 to 2.5% in December 2017. Compared to a year earlier, the vacancy rate was 0.2 percentage point higher. Increases in vacancy rate were more visible in the human health services and accommodation services sectors as well as construction sites (covering manual workers only). For 2017 as a whole, the vacancy rate for private sector establishments stood at 2.4% for the second consecutive year. 5.16 The vacancy registration figures compiled by the Labour Department (LD), notwithstanding its smaller sample size, may provide additional hints on the latest developments in the labour market. As the overall hiring sentiment remained positive on entering 2018, the number of private sector job vacancies registered at LD averaged around 117 600 per month in the first quarter of 2018, up by 6.1% over a year earlier.

90
Wages and earnings 5.17 With the overall labour market tightened progressively over the course of 2017, both nominal wages and payroll stayed on the rise throughout the year. The wage index, which covers regular payment to employees at the supervisory level or below, increased in nominal terms by 3.8% year-on-year in December 2017 and also for 2017 as a whole, further to the 3.7% gain in 2016. After adjusting for inflation(8), the wage index rose notably by 2.3% in real terms for 2017 as a whole. 5.18 Nominal wages continued to increase across all selected economic sectors in December 2017, with more appreciable growth seen in the accommodation and food service activities (up 4.7%), professional and business services (up 4.6%), and real estate leasing and maintenance management (up 4.5%) sectors. Analysed by occupation, service workers (up 4.6%), miscellaneous non-production workers (which includes such lower-income occupations as guards, cleaners, messengers / office assistants, and bell boys) (up 4.4%), and clerical and secretarial workers (up 4.3%) recorded relatively faster growth in wages during the period. 5.19 Labour earnings(9), as measured by the index of payroll per person engaged in the private sector, including overtime pay, discretionary bonuses and other irregular payments, went up by 4.2% in nominal terms in the fourth quarter of 2017 over a year earlier. For 2017 as a whole, nominal earnings rose by 3.7%, translating into a visible real improvement of 2.3%. 5.20 While payroll increases were observed across-the-board in the fourth quarter of 2017, sectors such as social and personal services (up 5.8%), professional and business services (up 4.5%), and real estate activities (up 4.3%) posted particularly robust increases in the period.
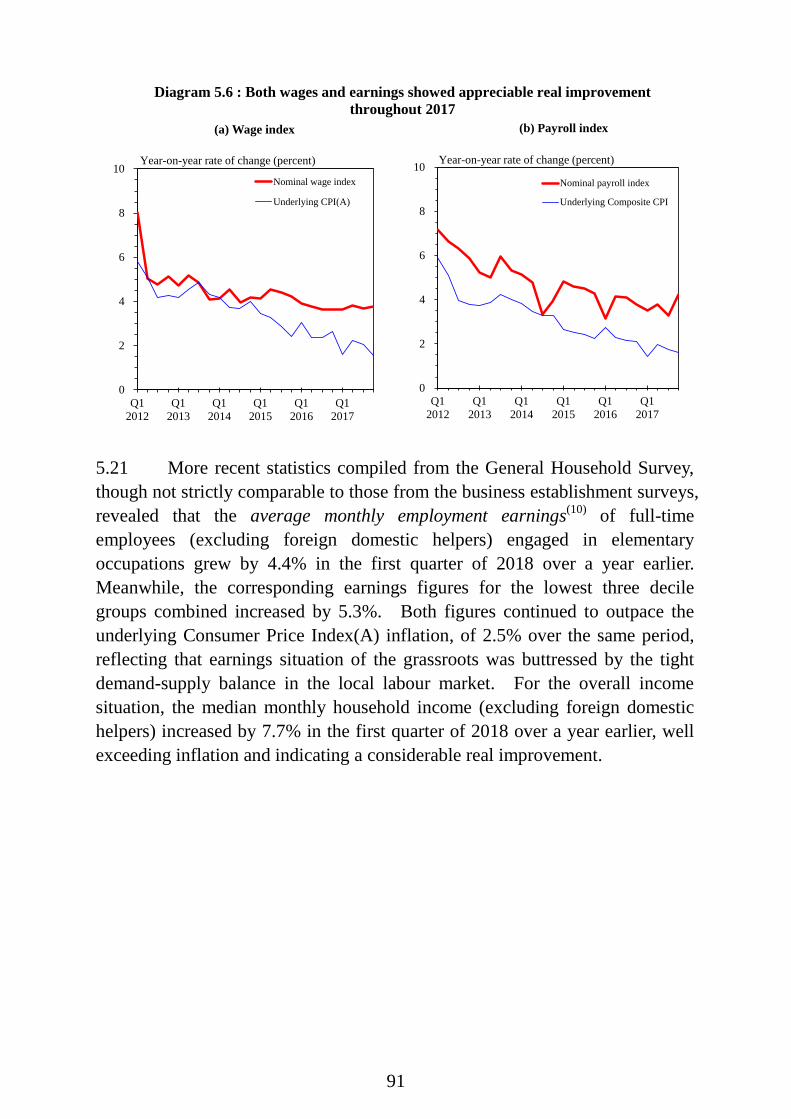
91
Q12012
Q12013
Q12014
Q12015
Q12016
Q12017
0
2
4
6
8
10
(a) Wage index
Nominal wage index
Underlying CPI(A)
Year-on-year rate of change (percent)
Q12012
Q12013
Q12014
Q12015
Q12016
Q12017
0
2
4
6
8
10
(b) Payroll index
Nominal payroll index
Underlying Composite CPI
Year-on-year rate of change (percent)
Diagram 5.6 : Both wages and earnings showed appreciable real improvement throughout 2017
5.21 More recent statistics compiled from the General Household Survey, though not strictly comparable to those from the business establishment surveys, revealed that the average monthly employment earnings(10) of full-time employees (excluding foreign domestic helpers) engaged in elementary occupations grew by 4.4% in the first quarter of 2018 over a year earlier. Meanwhile, the corresponding earnings figures for the lowest three decile groups combined increased by 5.3%. Both figures continued to outpace the underlying Consumer Price Index(A) inflation, of 2.5% over the same period, reflecting that earnings situation of the grassroots was buttressed by the tight demand-supply balance in the local labour market. For the overall income situation, the median monthly household income (excluding foreign domestic helpers) increased by 7.7% in the first quarter of 2018 over a year earlier, well exceeding inflation and indicating a considerable real improvement.
92
Highlights of labour-related measures and policy developments 5.22 LD regularly organises large-scale job fairs in different locations, canvassing vacancies from various industries for application by job-seekers on the spot. In the first quarter of 2018, LD organised five large-scale job fairs in Kowloon Tong, Mong Kok and North District. A total of 212 participating organisations offered more than 16 700 job opportunities in the retail, catering, property management, transport and other industries. There were also 16 training bodies joining the job fairs to introduce job training courses and receive applications on the spot. Apart from large-scale job fairs, district-based job fairs are organised at LD’s job centres from time to time to assist job-seekers in finding employment. Recruitment activities are also staged by catering, retail and construction employers at the three industry-based recruitment centres regularly for interviewing job-seekers on the spot. 5.23 Moreover, LD has started the work on formulating sector-specific working hours guidelines through the department’s industry-based tripartite committees. These committees, comprising representatives from employers, employees and the Government, serve as useful platforms for the parties concerned to draw up guidelines on suggested working hours arrangements, overtime compensation methods and good working hours management measures for employers’ reference and adoption so as to improve the working hours arrangements of employees.

93
Notes : (1) Labour force statistics enumerated from the General Household Survey are statistics
which involve the use of the population figures in the compilation process. The statistics of the three-month periods of November 2015 – January 2016 to October – December 2016 have been revised to take into account the final end-2016 population estimates.
The classification of occupation adopted by the Census and Statistics Department
follows the International Standard Classification of Occupations (ISCO), which is used to classify the occupation of an employed person or the previous occupation of an unemployed person. After the implementation of the new ISCO, 2008 (ISCO-08), the General Household Survey has been enhanced to adopt the ISCO-08 in compiling labour force statistics by occupation, with statistics backcasted to the quarter of January – March 2011. Starting from the reference quarter of January – March 2011, all the labour force statistics by occupation, unless otherwise specified, are compiled based on the ISCO-08.
(2) For a person aged 15 or above to be classified as unemployed, he or she should:
(a) not have a job and not be performing any work for pay or profit during the reference period (i.e. seven days before enumeration); (b) be available for work during the reference period; and (c) be seeking work during the 30 days before enumeration.
Notwithstanding the above, the following types of persons are also considered
unemployed: (a) persons without a job, having sought work but not available for work because of temporary sickness; (b) persons without a job, available for work but not having sought work because they will take up new jobs or start business at a subsequent date, or expect to return to their original jobs; and (c) discouraged workers not having sought work because they believe work is not available to them.
Even at full employment, some frictional unemployment is bound to exist as workers
move between jobs in order to obtain better terms of employment. The precise level of unemployment which can be described as purely frictional varies amongst economies, depending on the structure and characteristics of their labour markets.
The seasonally adjusted series is compiled using the X-12 ARIMA method, which is a
standard method applied in compiling seasonally adjusted statistical data series. (3) The main criteria for an employed person aged 15 or above to be classified as
underemployed are: involuntarily working less than 35 hours during the reference period (i.e. seven days before enumeration), and either available for additional work during the reference period or seeking additional work during the 30 days before enumeration.
Following these criteria, employed persons taking no-pay leave due to slack work
during the reference period are also classified as underemployed if they had worked less than 35 hours or were on leave for the entire reference period.
(4) The labour force, or the economically active population, is defined to include all
persons aged 15 or above who either were engaged in productive work during the reference period (i.e. seven days before enumeration) or would otherwise have been engaged in productive work but were unemployed.
94
(5) Figures enumerated from household data. The employed population is defined here to include those persons aged 15 or above who performed work for pay or profit or had a formal job attachment during the reference period (i.e. seven days before enumeration).
(6) The low paying sectors as identified by the Minimum Wage Commission include:
(i) retail (including supermarkets and convenience stores, and other retail stores); (ii) restaurants (including Chinese restaurants, non-Chinese restaurants, fast food cafes, and Hong Kong style tea cafes); (iii) estate management, security and cleaning services (including real estate maintenance management, security services, cleaning services and membership organisations); (iv) other low paying sectors, including - elderly homes; - laundry and dry cleaning services; - hairdressing and other personal services; - local courier services; and - food processing and production.
(7) Manufacturing enterprises with fewer than 100 employees and non-manufacturing enterprises with fewer than 50 employees are regarded as small and medium-sized enterprises (SMEs) in Hong Kong. Yet, establishments with the same main business registration number (BRN) and engaging in activities of the same industry sector are grouped into one business unit for the purpose of calculating the number of SMEs. Thus, a business with a lot of small chain stores each employing a small number of employees will be considered as a single large enterprise, instead of separate SMEs.
(8) Different consumer price indices (CPIs) are used for compiling the real indices of
labour earnings and wages, taking into account their relevance to the respective occupation coverage. Specifically, the Composite CPI, being an indicator of overall consumer prices, is taken as the price deflator for earnings received by employees at all levels of the occupational hierarchy. The CPI(A), being an indicator of consumer prices for the relatively low expenditure group, is taken as the price deflator for wages in respect of employees engaged in occupations up to the supervisory level.
(9) In addition to wages, which include all regular and guaranteed payments like basic pay
and stipulated bonuses and allowances, earnings also cover overtime pay and other non-guaranteed or irregular bonuses and allowances, except severance pay and long service payment. Because of this difference, as well as the difference in sectoral and occupational coverage, the movements in average earnings, as measured by payroll per person engaged, do not necessarily match closely with those in wage rates.
(10) The average (mean) monthly employment earnings are easily affected by extreme
values in the survey sample, more so when reckoned for higher-end workers. They should therefore be interpreted with caution, in particular when they are compared over time.
95
CHAPTER 6 : PRICES
Summary
Consumer price inflation remained generally moderate in the first quarter of 2018, though going up somewhat amid favourable global and local economic situations as well as some temporary factors. The year-on-year increase in the underlying Composite Consumer Price Index (Composite CPI)(1), which nets out the effects of the Government’s one-off relief measures, was 2.4% in the first quarter of 2018, as compared to 1.6% in the fourth quarter of 2017. Headline Composite CPI inflation was likewise higher, at 2.4% in the first quarter of 2018, as compared to 1.6% in the preceding quarter.
Domestic cost pressures remained largely in check in the first quarter. The moderate growth in wages and earnings amid tight labour market conditions did not add much to labour costs on a unit output basis, given the accompanying solid improvement of labour productivity. Commercial rental cost pressures were contained in general. Meanwhile, the gradual feed-through of the increase in fresh-letting residential rentals over the past year or so has led to a slightly faster increase in the private housing rental component in consumer price inflation.
Nonetheless, there were a number of temporary factors that pushed the inflation rate higher in the first quarter, including a low base of comparison for electricity charge resulting from the special fuel rebate in January and February last year, and higher fresh vegetable prices in February this year due to bad weather conditions. An early arrival of the Easter holidays which straddled March and April this year (as compared to mid-April last year) also led to a more notable year-on-year increase in prices of such items as package tours in the first quarter.
External price pressures stayed moderate in general in the first quarter, only with some pick-up in import prices of foodstuffs and consumer goods amid the weakness of the US dollar over the past year and the mild acceleration of inflation in some of our major import sources(2). Import prices of raw materials and semi-manufactures, and capital goods saw modest to moderate increases.

96
Consumer prices 6.1 Consumer price inflation remained generally moderate in the first quarter of 2018, though going up somewhat amid favourable global and local economic situations as well as some temporary factors. Domestically, labour cost pressure remained largely in check, as the growth in wages and earnings was matched by a concurrent growth in productivity. Commercial rental cost pressure was contained in general, while the increase in fresh-letting residential rentals over the past year or so continued to feed through gradually to consumer price inflation. Meanwhile, external price pressures stayed largely moderate, only increasing somewhat in some consumption items in tandem with the sustained global economic upturn and depreciation of the US dollar against other major currencies over the past year.
Note : The year-on-year rates of change of the CPIs from the fourth quarter of 2015 onwards are
computed from the new 2014/15-based series, and those before are from the old 2009/10-based series.
Q12013
Q12014
Q12015
Q12016
Q12017
Q12018
0
2
4
6Composite CPI
Underlying Composite CPI
Year-on-year rate of change (%)
Diagram 6.1 : Underlying consumer price inflation remained generally moderate in the first quarter of 2018

97
Note : The year-on-year rates of change of the CPI from the fourth quarter of 2015 onwards are
computed from the new 2014/15-based series, and those before are from the old 2009/10-based series.
6.2 Underlying consumer price inflation, in terms of the year-on-year rate of change in the underlying Composite CPI, which nets out the effects of the Government’s one-off relief measures to more genuinely reflect the underlying inflation trend, averaged 2.4% in the first quarter of 2018, up from 1.6% in the preceding quarter. Headline consumer price inflation, as measured by the year-on-year rate of change in the Composite CPI, likewise went up to 2.4% from 1.6%. In addition to economic fundamentals, the pick-up in underlying and headline inflation rates were also attributable to a combination of temporary factors, including a spike in the increase in electricity charge due to a low base of comparison resulting from the special fuel rebate in early 2017, and higher fresh vegetable prices in February this year due to adverse weather conditions. Moreover, the early arrival of the Easter holidays which began in late March this year (whereas in mid-April last year) led to a notable increase in prices of such items as package tours in the first quarter on a year-on-year basis.
-6
-3
0
3
6
9
12
Q12013
Q12014
Q12015
Q12016
Q12017
Q12018
-4
-2
0
2
4
6
8Underlying Composite CPI (LHS)Import prices (LHS)Nominal wage index (LHS)Fresh-letting residential rentals (8-quarter moving average) (RHS)
Year-on-year rate of change (%) Year-on-year rate of change (%)
Diagram 6.2 : Domestic cost pressures were generally contained while external price pressures stayed largely moderate

98
Table 6.1 : Consumer Price Indices (year-on-year rate of change (%))
Composite CPI CPI(A) CPI(B) CPI(C)
Underlying(a) Headline
2017 Annual 1.7 1.5 1.5 1.4 1.5
H1 1.7 1.3 1.2 1.2 1.4
H2 1.7 1.7 1.9 1.5 1.7
Q1 1.4 0.5 0.1 0.6 0.9
Q2 2.0 2.0 2.3 1.8 1.9
Q3 1.7 1.8 2.1 1.6 1.6
Q4 1.6 1.6 1.6 1.5 1.7
2018 Q1 2.4 2.4 2.6 2.4 2.4
(seasonally adjusted quarter-to-quarter rate of change (%))
2017 Q1 0.1 0.1 * 0.1 0.2
Q2 0.6 0.6 0.7 0.6 0.6
Q3 0.3 0.3 0.4 0.3 0.2
Q4 0.6 0.6 0.5 0.6 0.7
2018 Q1 0.8 0.9 0.9 0.9 0.8
Notes : (a) Underlying consumer price inflation is calculated by netting out the effects of all
relevant one-off measures introduced since 2007, including the waiver and Government’s payment of public housing rentals, rates concession, suspension and subsequent abolition of Employees Retraining Levy, and subsidies for household electricity charges.
(*) Change within ±0.05%.

99
6.3 Many major components in the underlying Composite CPI showed faster rises in the first quarter, suggesting that overall inflationary pressure, while remaining generally moderate, increased somewhat amid the sustained above-trend economic expansion. Apart from the faster increase in prices of basic foodstuffs which was partly attributed to the spike in vegetable prices amid adverse weather conditions, prices of meals away from home also saw some pick-up. Prices of clothing and footwear, and other consumer goods saw slightly faster increases amid continued improvement in retail businesses. Prices of miscellaneous services reverted to an increase, mainly driven by a faster year-on-year increase in prices of package tours amid robust local demand for outbound tourism and the weak US dollar, though an earlier arrival of the Easter holidays this year also contributed. The private housing rental component also showed some slightly faster increase, as the rises in fresh-letting residential rentals over the past year or so gradually fed through to the consumer price indices. On the other hand, prices of durable goods continued their secular downtrend.
Note : The year-on-year rates of change of the CPIs from October 2015 onwards are computed
from the new 2014/15-based series, and those before are from the old 2009/10-based series.
0
3
6
9
12
15
Jan2013
Jan2014
Jan2015
Jan2016
Jan2017
Jan2018
0
2
4
6
8
10Underlying Composite CPI -private housing rent (LHS)Fresh-letting residential rentals(24-month moving average) (RHS)
Q12013
Q12014
Q12015
Q12016
Q12017
Q12018
-4
-2
0
2
4
6
8
10Underlying Composite CPI - food
Mainland's food inflation
Year-on-year rate of change (%)Year-on-year rate of change (%)
Year-on-year rate of change (%)
Diagram 6.3 : Food and private housing rent components of the underlying Composite CPI
(a) Food inflation picked up in the first quarter of 2018
(b) Rental inflation rose slightly
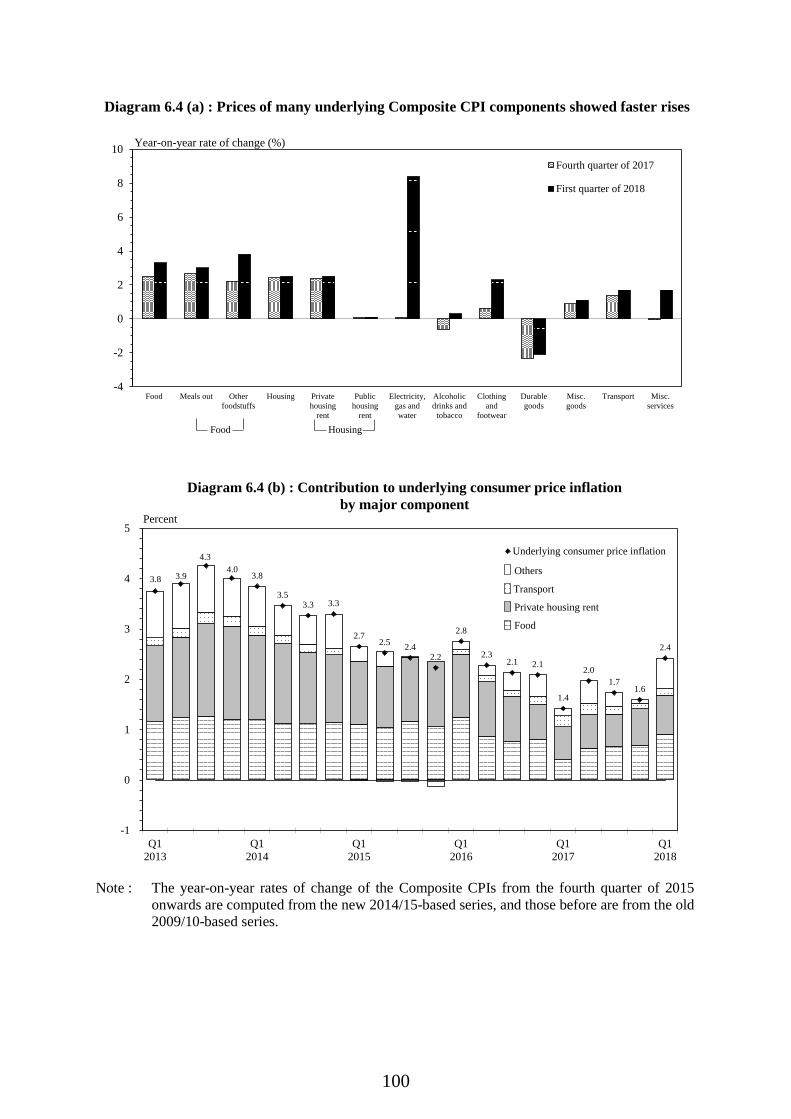
100
Note : The year-on-year rates of change of the Composite CPIs from the fourth quarter of 2015
onwards are computed from the new 2014/15-based series, and those before are from the old 2009/10-based series.
-4
-2
0
2
4
6
8
10
Food Meals out Otherfoodstuffs
Housing Privatehousing
rent
Publichousing
rent
Electricity,gas andwater
Alcoholicdrinks and
tobacco
Clothingand
footwear
Durablegoods
Misc.goods
Transport Misc.services
Fourth quarter of 2017
First quarter of 2018
Diagram 6.4 (a) : Prices of many underlying Composite CPI components showed faster rises
Year-on-year rate of change (%)
Food Housing
3.8 3.9
4.3 4.0
3.8
3.5 3.3 3.3
2.7 2.5 2.4
2.2
2.8
2.3 2.1 2.1
1.4
2.0 1.7
1.6
2.4
-1
0
1
2
3
4
5
Q12013
Q12014
Q12015
Q12016
Q12017
Q12018
Diagram 6.4 (b) : Contribution to underlying consumer price inflationby major component
Underlying consumer price inflation
Percent
Food
Private housing rent
Transport
Others
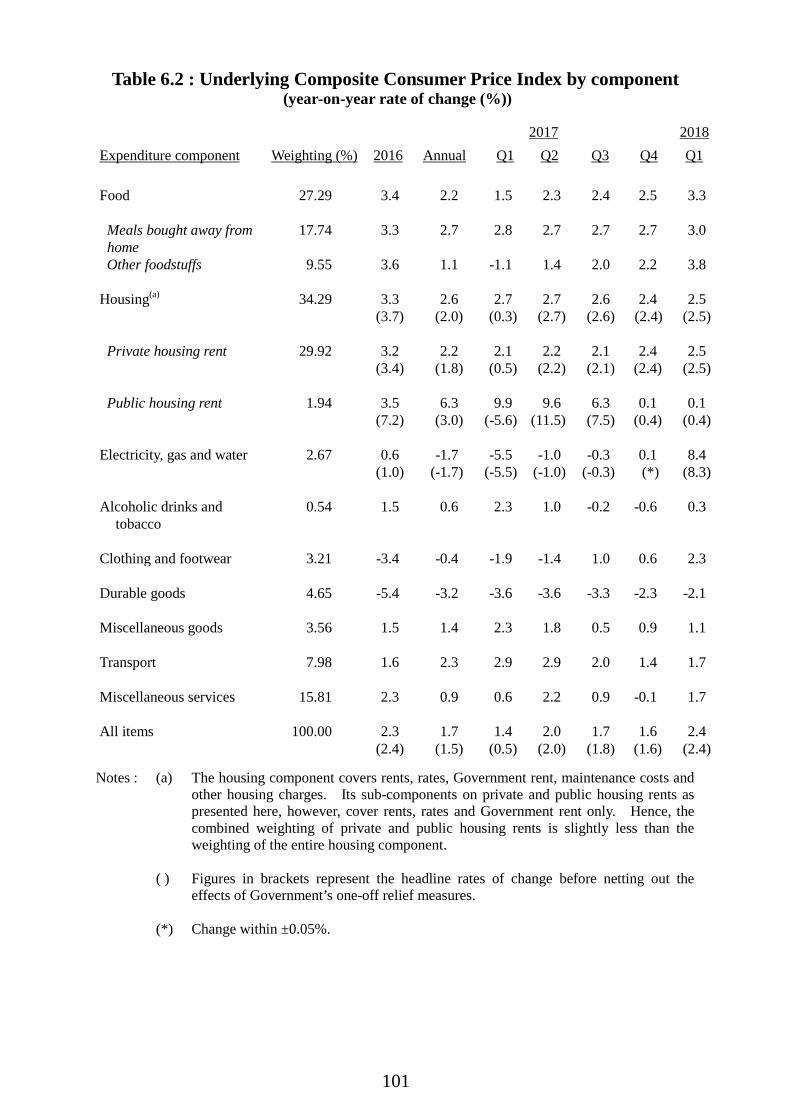
101
Table 6.2 : Underlying Composite Consumer Price Index by component (year-on-year rate of change (%))
2017 2018 Expenditure component Weighting (%) 2016 Annual Q1 Q2 Q3 Q4 Q1 Food 27.29 3.4 2.2 1.5 2.3 2.4 2.5 3.3
Meals bought away from home
17.74 3.3 2.7 2.8 2.7 2.7 2.7 3.0
Other foodstuffs 9.55 3.6 1.1 -1.1 1.4 2.0 2.2 3.8 Housing(a) 34.29 3.3 2.6 2.7 2.7 2.6 2.4 2.5 (3.7) (2.0) (0.3) (2.7) (2.6) (2.4) (2.5)
Private housing rent 29.92 3.2 2.2 2.1 2.2 2.1 2.4 2.5 (3.4) (1.8) (0.5) (2.2) (2.1) (2.4) (2.5) Public housing rent 1.94 3.5 6.3 9.9 9.6 6.3 0.1 0.1
(7.2) (3.0) (-5.6) (11.5) (7.5) (0.4) (0.4) Electricity, gas and water 2.67 0.6 -1.7 -5.5 -1.0 -0.3 0.1 8.4 (1.0) (-1.7) (-5.5) (-1.0) (-0.3) (*) (8.3) Alcoholic drinks and
tobacco 0.54 1.5 0.6 2.3 1.0 -0.2 -0.6 0.3
Clothing and footwear 3.21 -3.4 -0.4 -1.9 -1.4 1.0 0.6 2.3 Durable goods 4.65 -5.4 -3.2 -3.6 -3.6 -3.3 -2.3 -2.1 Miscellaneous goods 3.56 1.5 1.4 2.3 1.8 0.5 0.9 1.1 Transport 7.98 1.6 2.3 2.9 2.9 2.0 1.4 1.7 Miscellaneous services 15.81 2.3 0.9 0.6 2.2 0.9 -0.1 1.7
All items 100.00 2.3 1.7 1.4 2.0 1.7 1.6 2.4 (2.4) (1.5) (0.5) (2.0) (1.8) (1.6) (2.4)
Notes : (a) The housing component covers rents, rates, Government rent, maintenance costs and
other housing charges. Its sub-components on private and public housing rents as presented here, however, cover rents, rates and Government rent only. Hence, the combined weighting of private and public housing rents is slightly less than the weighting of the entire housing component.
( ) Figures in brackets represent the headline rates of change before netting out the
effects of Government’s one-off relief measures. (*) Change within ±0.05%.
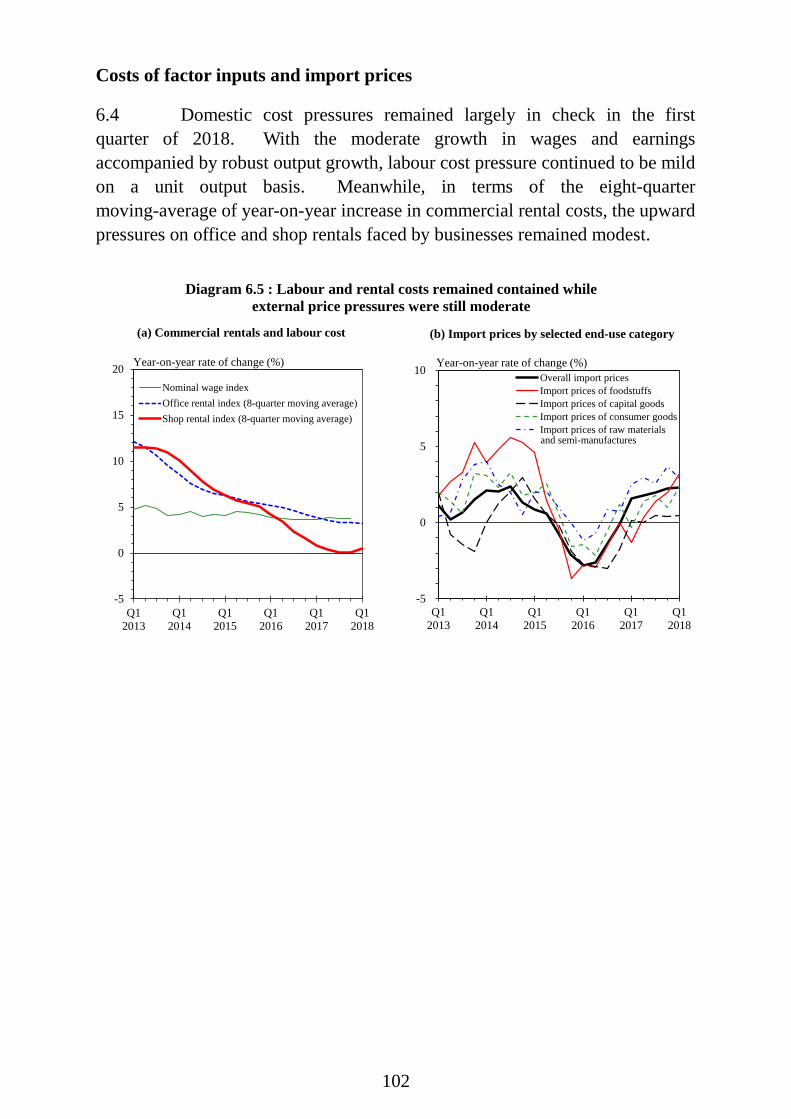
102
Costs of factor inputs and import prices
6.4 Domestic cost pressures remained largely in check in the first quarter of 2018. With the moderate growth in wages and earnings accompanied by robust output growth, labour cost pressure continued to be mild on a unit output basis. Meanwhile, in terms of the eight-quarter moving-average of year-on-year increase in commercial rental costs, the upward pressures on office and shop rentals faced by businesses remained modest.
Q12013
Q12014
Q12015
Q12016
Q12017
Q12018
-5
0
5
10Overall import pricesImport prices of foodstuffsImport prices of capital goodsImport prices of consumer goodsImport prices of raw materials
Year-on-year rate of change (%)
and semi-manufactures
Diagram 6.5 : Labour and rental costs remained contained while external price pressures were still moderate
(a) Commercial rentals and labour cost (b) Import prices by selected end-use category
Q12013
Q12014
Q12015
Q12016
Q12017
Q12018
-5
0
5
10
15
20Nominal wage indexOffice rental index (8-quarter moving average)Shop rental index (8-quarter moving average)
Year-on-year rate of change (%)
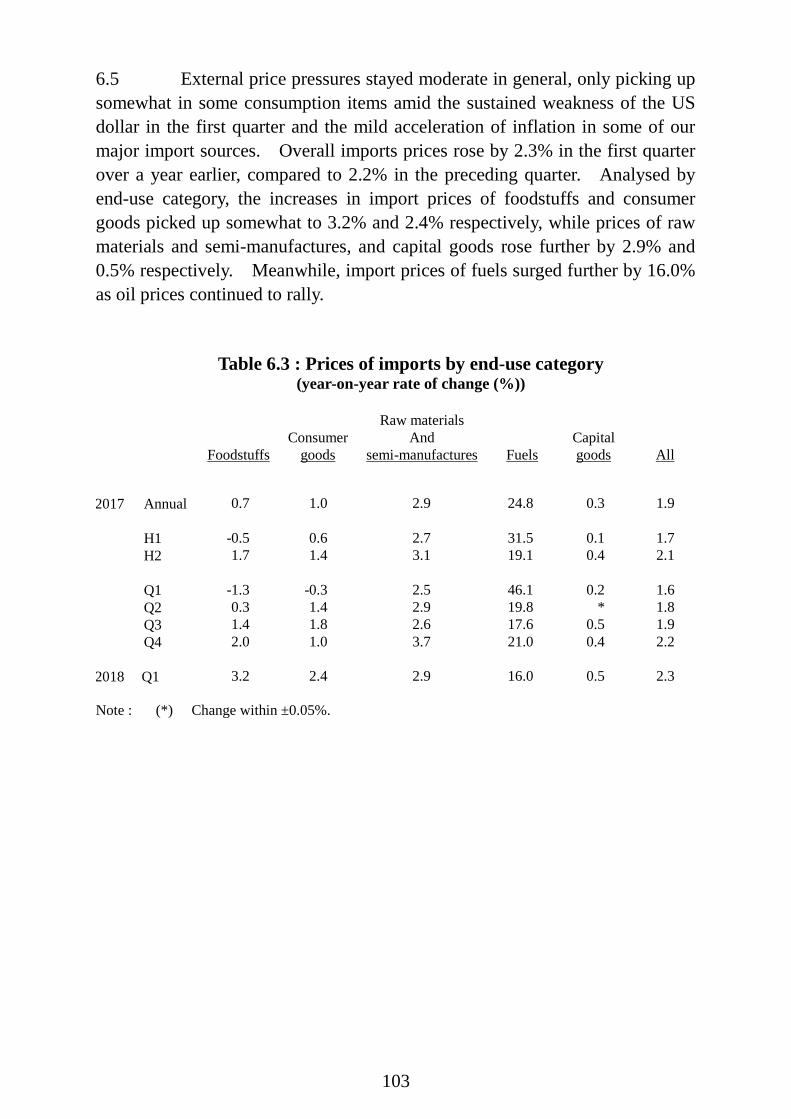
103
6.5 External price pressures stayed moderate in general, only picking up somewhat in some consumption items amid the sustained weakness of the US dollar in the first quarter and the mild acceleration of inflation in some of our major import sources. Overall imports prices rose by 2.3% in the first quarter over a year earlier, compared to 2.2% in the preceding quarter. Analysed by end-use category, the increases in import prices of foodstuffs and consumer goods picked up somewhat to 3.2% and 2.4% respectively, while prices of raw materials and semi-manufactures, and capital goods rose further by 2.9% and 0.5% respectively. Meanwhile, import prices of fuels surged further by 16.0% as oil prices continued to rally.
Table 6.3 : Prices of imports by end-use category (year-on-year rate of change (%))
Foodstuffs
Consumer
goods
Raw materials And
semi-manufactures
Fuels
Capital goods
All
2017 Annual 0.7 1.0 2.9 24.8 0.3 1.9 H1 -0.5 0.6 2.7 31.5 0.1 1.7 H2 1.7 1.4 3.1 19.1 0.4 2.1 Q1 -1.3 -0.3 2.5 46.1 0.2 1.6 Q2 0.3 1.4 2.9 19.8 * 1.8 Q3 1.4 1.8 2.6 17.6 0.5 1.9 Q4 2.0 1.0 3.7 21.0 0.4 2.2 2018 Q1 3.2 2.4 2.9 16.0 0.5 2.3 Note : (*) Change within ±0.05%.

104
-6
-4
-2
0
2
4
6
Q12013
Q12014
Q12015
Q12016
Q12017
Q12018
-8
-4
0
4
8
Import-weighted nominal effective exchange rateindex of the Hong Kong dollar (LHS, inverted)Prices of imports of consumer goods (RHS)
Year-on-year rate of change (%)
Year-on-year rate of change (%)
Q12013
Q12014
Q12015
Q12016
Q12017
Q12018
-5
0
5
10Mainland's retail price index for food items
Prices of imports of foodstuffs
Year-on-year rate of change (%)
Diagram 6.6 : Import prices by end-use category
(a) Import prices of food picked up further (b) Import prices of consumer goods likewise saw faster growth
An increase in the nominal EERI indicates strengthening of the Hong Kong dollar. The y-axis of nominal EERI in this graph is inverted for easier comprehension.
Note :
-10
-5
0
5
10
Q12013
Q12014
Q12015
Q12016
Q12017
Q12018
-40
-20
0
20
40
CRB spot index (LHS)Prices of imports of raw materials
Year-on-year rate of change (%)
and semi-manufactures (RHS)
Year-on-year rate of change (%)
Q12013
Q12014
Q12015
Q12016
Q12017
Q12018
-60
-40
-20
0
20
40
60
North Sea Brent pricesPrices of imports of fuels
Year-on-year rate of change (%)
(c) Import prices of raw materials and semi-manufactures rose further
(d) Import prices of fuels surged further
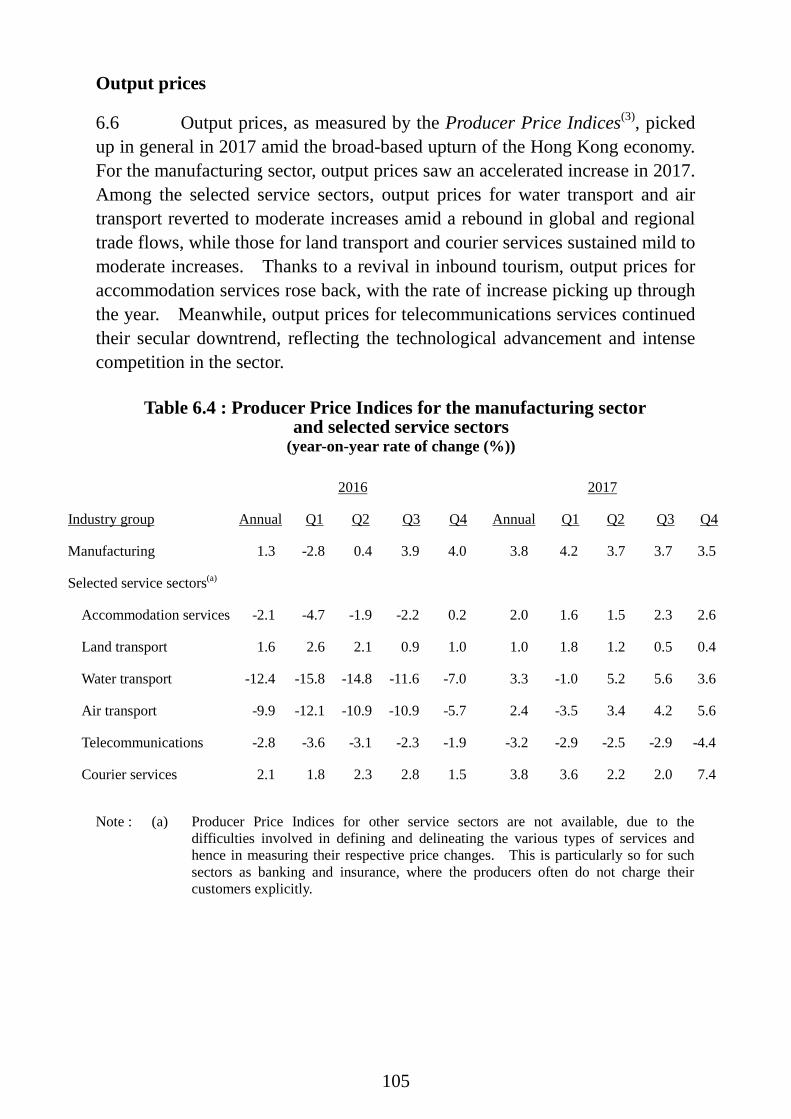
105
Output prices
6.6 Output prices, as measured by the Producer Price Indices(3), picked up in general in 2017 amid the broad-based upturn of the Hong Kong economy. For the manufacturing sector, output prices saw an accelerated increase in 2017. Among the selected service sectors, output prices for water transport and air transport reverted to moderate increases amid a rebound in global and regional trade flows, while those for land transport and courier services sustained mild to moderate increases. Thanks to a revival in inbound tourism, output prices for accommodation services rose back, with the rate of increase picking up through the year. Meanwhile, output prices for telecommunications services continued their secular downtrend, reflecting the technological advancement and intense competition in the sector.
Table 6.4 : Producer Price Indices for the manufacturing sector and selected service sectors
(year-on-year rate of change (%))
2016
2017
Industry group
Annual Q1 Q2 Q3 Q4 Annual Q1 Q2 Q3 Q4
Manufacturing
1.3 -2.8 0.4 3.9 4.0 3.8 4.2 3.7 3.7 3.5
Selected service sectors(a)
Accommodation services
-2.1 -4.7 -1.9 -2.2 0.2 2.0 1.6 1.5 2.3 2.6
Land transport
1.6 2.6 2.1 0.9 1.0 1.0 1.8 1.2 0.5 0.4
Water transport
-12.4 -15.8 -14.8 -11.6 -7.0 3.3 -1.0 5.2 5.6 3.6
Air transport
-9.9 -12.1 -10.9 -10.9 -5.7 2.4 -3.5 3.4 4.2 5.6
Telecommunications
-2.8 -3.6 -3.1 -2.3 -1.9 -3.2 -2.9 -2.5 -2.9 -4.4
Courier services 2.1 1.8 2.3 2.8 1.5 3.8 3.6 2.2 2.0 7.4 Note : (a) Producer Price Indices for other service sectors are not available, due to the
difficulties involved in defining and delineating the various types of services and hence in measuring their respective price changes. This is particularly so for such sectors as banking and insurance, where the producers often do not charge their customers explicitly.

106
GDP deflator 6.7 As a broad measure of the overall change in prices in the economy, the GDP deflator(4) rose by 4.1% in the first quarter of 2018 over a year earlier, faster than the 2.8% increase in the fourth quarter of 2017. The acceleration was mainly driven by a faster increase in the domestic demand deflator, which went up to 3.7% from 2.7% in tandem with the modest pick-up in consumer price inflation. As for the external trade components, the terms of trade(5) increased slightly as export prices rose slightly faster than import prices.
Q12013
Q12014
Q12015
Q12016
Q12017
Q12018
-4
-2
0
2
4
6
GDP deflatorDomestic demand deflator
Year-on-year rate of change (%)
(a) GDP deflator saw faster increase
Q12013
Q12014
Q12015
Q12016
Q12017
Q12018
-4
-2
0
2
4
6
GDP deflatorTerms of trade in goods and services
Year-on-year rate of change (%)
Diagram 6.7 : GDP deflator
(b) Terms of trade increased slightly
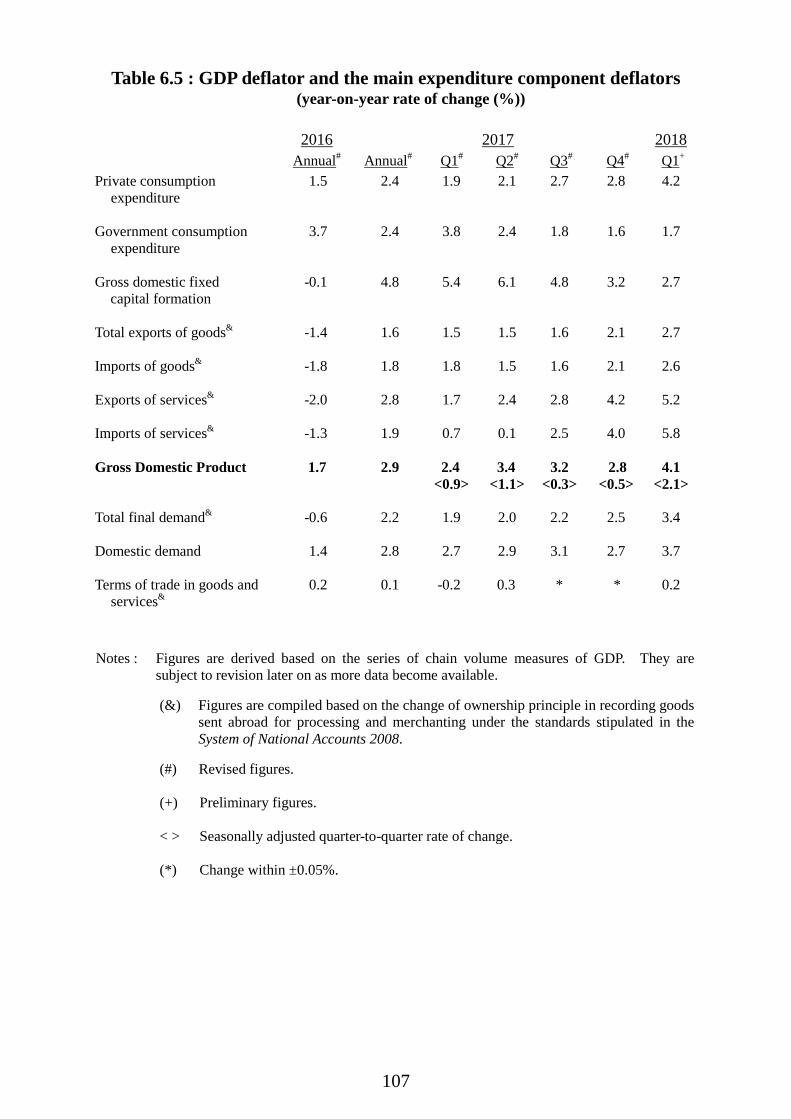
107
Table 6.5 : GDP deflator and the main expenditure component deflators (year-on-year rate of change (%))
2016 2017 2018 Annual# Annual# Q1# Q2# Q3# Q4# Q1+
Private consumption expenditure
1.5 2.4 1.9 2.1 2.7 2.8 4.2
Government consumption expenditure
3.7 2.4 3.8 2.4 1.8 1.6 1.7
Gross domestic fixed capital formation
-0.1 4.8 5.4 6.1 4.8 3.2 2.7
Total exports of goods&
-1.4 1.6 1.5 1.5 1.6 2.1 2.7
Imports of goods&
-1.8 1.8 1.8 1.5 1.6 2.1 2.6
Exports of services&
-2.0 2.8 1.7 2.4 2.8 4.2 5.2
Imports of services&
-1.3 1.9 0.7 0.1 2.5 4.0 5.8
Gross Domestic Product
1.7
2.9 2.4 <0.9>
3.4 <1.1>
3.2 <0.3>
2.8 <0.5>
4.1 <2.1>
Total final demand&
-0.6 2.2 1.9 2.0 2.2 2.5 3.4
Domestic demand
1.4 2.8 2.7 2.9 3.1 2.7 3.7
Terms of trade in goods and services&
0.2 0.1 -0.2 0.3 * * 0.2
Notes : Figures are derived based on the series of chain volume measures of GDP. They are subject to revision later on as more data become available.
(&) Figures are compiled based on the change of ownership principle in recording goods
sent abroad for processing and merchanting under the standards stipulated in the System of National Accounts 2008.
(#) Revised figures. (+) Preliminary figures.
< > Seasonally adjusted quarter-to-quarter rate of change. (*) Change within ±0.05%.

108
Notes : (1) The Consumer Price Indices (A), (B) and (C) are compiled by reference to the average
expenditure patterns for different groups of households as obtained from the Household Expenditure Survey. Then, by aggregating the expenditure patterns of all the households covered by the above three indices, a Composite CPI is compiled.
The expenditure ranges of the households covered in the 2014/15-based CPIs are shown
below:
Approximate proportion of households covered
Average monthly expenditure range during Oct 2014 to Sep 2015
(%) ($) CPI(A) 50 5,500 to 24,499 CPI(B) 30 24,500 to 44,499 CPI(C) 10 44,500 to 89,999
The weightings of the various components in the 2014/15-based CPIs are as follows:
Expenditure component
Composite CPI
CPI(A)
CPI(B)
CPI(C)
(%) (%) (%) (%)
Food 27.29 34.37 26.26 20.85 Meals bought away from
home 17.74 20.99 17.88 13.98
Other foodstuffs 9.55 13.38 8.38 6.87 Housing 34.29 33.77 35.24 33.60 Private housing rent 29.92 26.51 32.15 30.72 Public housing rent 1.94 5.44 0.49 -- Maintenance costs and
other housing charges 2.43 1.82 2.60 2.88
Electricity, gas and water 2.67 3.85 2.38 1.76 Alcoholic drinks and
tobacco 0.54 0.75 0.57 0.26
Clothing and footwear 3.21 2.57 3.26 3.88 Durable goods 4.65 3.41 5.03 5.53 Miscellaneous goods 3.56 3.28 3.64 3.77 Transport 7.98 6.75 7.60 9.84 Miscellaneous services
15.81 11.25 16.02 20.51
All items 100.00 100.00 100.00 100.00
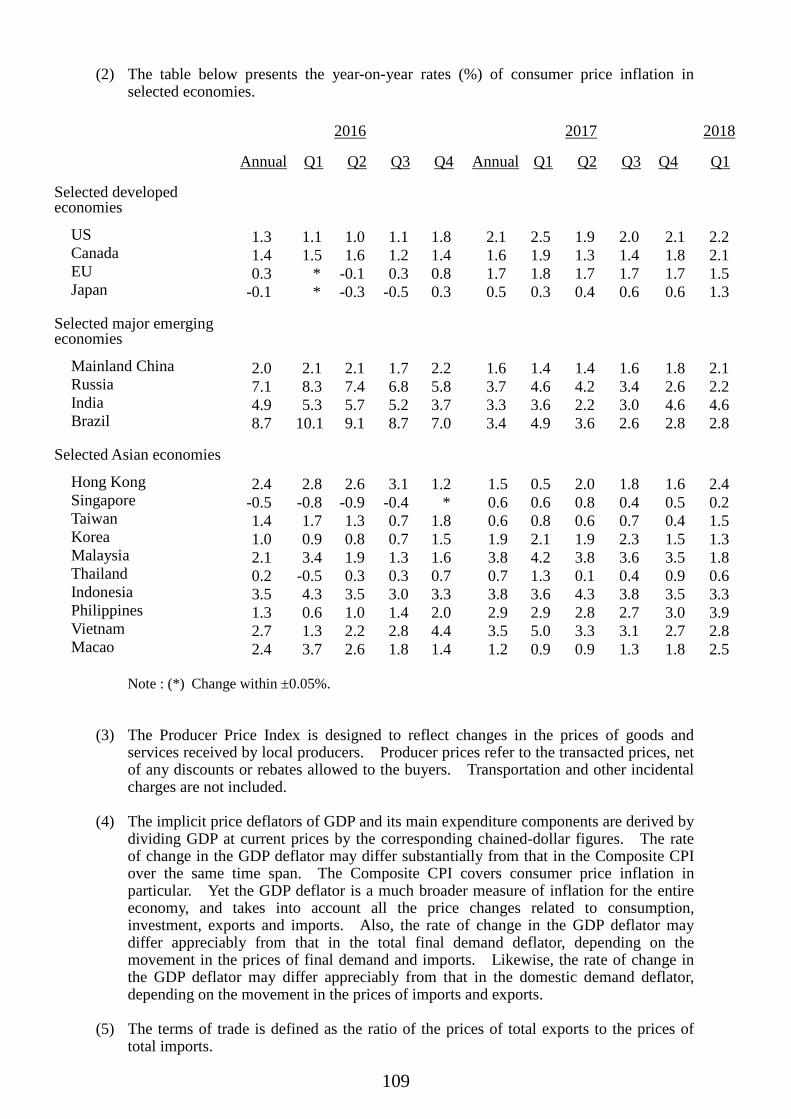
109
(2) The table below presents the year-on-year rates (%) of consumer price inflation in selected economies.
2016 2017 2018
Annual Q1 Q2 Q3 Q4 Annual Q1 Q2 Q3 Q4 Q1
Selected developed economies
US 1.3 1.1 1.0 1.1 1.8 2.1 2.5 1.9 2.0 2.1 2.2 Canada 1.4 1.5 1.6 1.2 1.4 1.6 1.9 1.3 1.4 1.8 2.1 EU 0.3 * -0.1 0.3 0.8 1.7 1.8 1.7 1.7 1.7 1.5 Japan -0.1 * -0.3 -0.5 0.3 0.5 0.3 0.4 0.6 0.6 1.3
Selected major emerging economies
Mainland China 2.0 2.1 2.1 1.7 2.2 1.6 1.4 1.4 1.6 1.8 2.1 Russia 7.1 8.3 7.4 6.8 5.8 3.7 4.6 4.2 3.4 2.6 2.2 India 4.9 5.3 5.7 5.2 3.7 3.3 3.6 2.2 3.0 4.6 4.6 Brazil 8.7 10.1 9.1 8.7 7.0 3.4 4.9 3.6 2.6 2.8 2.8
Selected Asian economies
Hong Kong 2.4 2.8 2.6 3.1 1.2 1.5 0.5 2.0 1.8 1.6 2.4 Singapore -0.5 -0.8 -0.9 -0.4 * 0.6 0.6 0.8 0.4 0.5 0.2 Taiwan 1.4 1.7 1.3 0.7 1.8 0.6 0.8 0.6 0.7 0.4 1.5 Korea 1.0 0.9 0.8 0.7 1.5 1.9 2.1 1.9 2.3 1.5 1.3 Malaysia 2.1 3.4 1.9 1.3 1.6 3.8 4.2 3.8 3.6 3.5 1.8 Thailand 0.2 -0.5 0.3 0.3 0.7 0.7 1.3 0.1 0.4 0.9 0.6 Indonesia 3.5 4.3 3.5 3.0 3.3 3.8 3.6 4.3 3.8 3.5 3.3 Philippines 1.3 0.6 1.0 1.4 2.0 2.9 2.9 2.8 2.7 3.0 3.9 Vietnam 2.7 1.3 2.2 2.8 4.4 3.5 5.0 3.3 3.1 2.7 2.8 Macao 2.4 3.7 2.6 1.8 1.4 1.2 0.9 0.9 1.3 1.8 2.5
Note : (*) Change within ±0.05%.
(3) The Producer Price Index is designed to reflect changes in the prices of goods and
services received by local producers. Producer prices refer to the transacted prices, net of any discounts or rebates allowed to the buyers. Transportation and other incidental charges are not included.
(4) The implicit price deflators of GDP and its main expenditure components are derived by
dividing GDP at current prices by the corresponding chained-dollar figures. The rate of change in the GDP deflator may differ substantially from that in the Composite CPI over the same time span. The Composite CPI covers consumer price inflation in particular. Yet the GDP deflator is a much broader measure of inflation for the entire economy, and takes into account all the price changes related to consumption, investment, exports and imports. Also, the rate of change in the GDP deflator may differ appreciably from that in the total final demand deflator, depending on the movement in the prices of final demand and imports. Likewise, the rate of change in the GDP deflator may differ appreciably from that in the domestic demand deflator, depending on the movement in the prices of imports and exports.
(5) The terms of trade is defined as the ratio of the prices of total exports to the prices of
total imports.

111
Table Page
1. Gross Domestic Product by expenditure component (at current market prices) 112-113
2. 114-115
3. Gross Domestic Product by economic activity (at current prices) 116
4. 117
5. Balance of Payments by major component (at current prices) 118
6. 119
6a. 120
7. Total exports of goods by market (in value terms) 121
8. Imports of goods by source (in value terms) 122
9. Exports and imports of services by component (at current market prices) 123
9a. 124
10. Incoming visitors by source 125
11. Property market 126-127
12. 128-129
13. Monetary aggregates 130-131
14. Rates of change in business receipts indices for services industries/domains 132
15. Labour force characteristics 133
16. Employment in selected major industries 134
17. Number of manual workers engaged at building and construction sites 135
18. Rates of change in indices of payroll per person engaged by selected industry section 136
19. Rates of change in wage indices by selected industry section 137
20. 138
21. 139
22. Rates of change in prices 140-141
23. Rates of change in Composite Consumer Price Index 142-143
24. 144-145
Monthly wage level and distribution analysed by industry section : all employees
Hourly wage level and distribution analysed by industry section : all employees
Goods and services trade (at current market prices)
Rates of change in implicit price deflators of GDP and its main expenditurecomponents
Statistical Appendix
Property prices and rentals
Rates of change in chain volume measures of Gross Domestic Product byexpenditure component (in real terms)
Rates of change in chain volume measures of Gross Domestic Product by economicactivity (in real terms)
Goods and services trade based on the standards stipulated in the System of NationalAccounts 2008 , other than the change of ownership principle
Exports and imports of services by component based on the standards stipulated inthe System of National Accounts 2008 , other than the change of ownership principle(at current market prices)

112
($Mn)
2008 2009 2010 2011 2012 2013
Private consumption expenditure 1,026,482 1,013,615 1,090,234 1,224,402 1,314,969 1,413,058Government consumption expenditure 148,017 152,512 157,371 168,517 185,310 198,572Gross domestic fixed capital formation 350,796 339,552 386,852 455,294 517,411 515,516
Building and construction 127,312 123,746 139,249 179,341 204,860 211,130
Costs of ownership transfer 24,851 24,238 38,035 36,099 34,074 39,389 Machinery, equipment and intellectual property products 198,633 191,568 209,568 239,854 278,477 264,997
Changes in inventories 8,480 22,941 37,522 11,739 -3,662 -1,673
Total exports of goods& 2,758,181 2,454,394 3,021,492 3,406,765 3,632,957 3,926,059
Imports of goods& 2,563,428 2,351,386 2,995,928 3,464,968 3,779,686 4,142,651
Exports of services& 544,358 501,303 625,719 710,716 764,026 812,640
Imports of services& 565,399 473,686 546,930 578,035 594,266 583,216
GDP 1,707,487 1,659,245 1,776,332 1,934,430 2,037,059 2,138,305
Per capita GDP ($) 245,406 237,960 252,887 273,549 284,899 297,860
GNI 1,807,994 1,709,007 1,813,928 1,987,256 2,066,514 2,178,824
Per capita GNI ($) 259,851 245,096 258,240 281,019 289,019 303,504
Total final demand 4,836,314 4,484,317 5,319,190 5,977,433 6,411,011 6,864,172Total final demand excluding re-exports(a) 3,001,538 2,823,844 3,235,971 3,604,705 3,828,055 4,025,243
Domestic demand 1,533,775 1,528,620 1,671,979 1,859,952 2,014,028 2,125,473 Private 1,342,889 1,327,688 1,449,592 1,614,010 1,737,274 1,827,460 Public 190,886 200,932 222,387 245,942 276,754 298,013
External demand 3,302,539 2,955,697 3,647,211 4,117,481 4,396,983 4,738,699
Table 1 : Gross Domestic Product by expenditure component(at current market prices)
Definition of Terms :
Total final demand = private consumption expenditure + government consumption expenditure + gross domestic fixed capital formation + changes in inventories + total exports of goods + exports of services
Private sector domestic demand = private consumption expenditure + gross domestic fixed capital formation by the private sector + changes in inventories
Public sector domestic demand = government consumption expenditure + gross domestic fixed capital formation by the public sector
Domestic demand = private sector domestic demand + public sector domestic demand
External demand = total exports of goods + exports of services

113
($Mn)
2014 2015 2016# 2017# 2017 2018Q2# Q3# Q4# Q1#
Private consumption expenditure 1,502,768 1,593,091 1,649,664 1,782,567 445,797 439,031 477,768 475,240Government consumption expenditure 214,216 231,263 247,615 262,116 62,893 66,016 65,776 71,246Gross domestic fixed capital formation 530,916 537,205 536,010 581,018 145,057 138,867 163,307 142,577
Building and construction 244,047 262,780 283,444 304,842 74,233 74,122 80,296 80,340
Costs of ownership transfer 43,967 45,846 45,131 68,294 19,065 14,048 20,771 18,552 Machinery, equipment and intellectual property products 242,902 228,579 207,435 207,882 51,759 50,697 62,240 43,685
Changes in inventories 7,473 -20,580 447 11,065 1,187 -399 5,886 1,260
Total exports of goods& 3,986,769 3,889,225 3,892,886 4,191,267 995,127 1,099,086 1,155,569 1,016,863
Imports of goods& 4,237,700 4,066,527 4,022,579 4,377,940 1,062,849 1,115,653 1,201,380 1,093,727
Exports of services& 829,085 808,948 764,839 811,396 184,377 207,622 216,240 229,784
Imports of services& 573,522 574,345 578,106 600,506 143,255 154,339 161,604 155,277
GDP 2,260,005 2,398,280 2,490,776 2,660,983 628,334 680,231 721,562 687,966
Per capita GDP ($) 312,609 328,924 339,500 359,996 -- -- -- --
GNI 2,306,612 2,442,656 2,553,369 2,771,717 678,754 708,413 733,894 N.A.
Per capita GNI ($) 319,056 335,010 348,032 374,977 -- -- -- --
Total final demand 7,071,227 7,039,152 7,091,461 7,639,429 1,834,438 1,950,223 2,084,546 1,936,970Total final demand excluding re-exports(a) 4,116,670 4,139,786 4,190,864 4,491,147 1,076,328 1,125,093 1,225,521 1,168,147
Domestic demand 2,255,373 2,340,979 2,433,736 2,636,766 654,934 643,515 712,737 690,323 Private 1,929,514 1,991,436 2,062,392 2,242,869 560,585 547,696 612,625 579,091 Public 325,859 349,543 371,344 393,897 94,349 95,819 100,112 111,232
External demand 4,815,854 4,698,173 4,657,725 5,002,663 1,179,504 1,306,708 1,371,809 1,246,647
Table 1 : Gross Domestic Product by expenditure component(at current market prices) (Cont'd)
Notes: (a) Re-export margin is nevertheless retained in the total final demand.
(#) Figures are subject to revision later on as more data become available.
(&) Figures are compiled based on the change of ownership principle in recording goods sent abroad for processing and merchanting under the standards stipulated in the System of National Accounts 2008.
(--) Not applicable.
N.A. Not yet available.

114
(%)
2008 2009 2010 2011 2012 2013
Private consumption expenditure 1.9 0.2 6.1 8.4 4.1 4.6Government consumption expenditure 2.0 2.3 3.4 2.5 3.6 2.7Gross domestic fixed capital formation 1.4 -3.5 7.7 10.2 6.8 2.6
Building and construction 6.8 -5.5 5.7 15.7 7.2 -4.3
Costs of ownership transfer -11.6 -2.9 27.2 -20.9 -17.8 -28.1 Machinery, equipment and intellectual property products * -2.2 6.5 12.3 10.2 11.3
Total exports of goods& 3.2 -11.2 18.0 4.6 3.3 8.2
Imports of goods& 3.7 -7.0 19.9 6.7 4.6 9.9
Exports of services& 4.9 1.7 15.3 5.7 2.7 6.0
Imports of services& 1.1 -12.9 10.0 -0.2 2.2 -2.1
GDP 2.1 -2.5 6.8 4.8 1.7 3.1
Per capita GDP 1.5 -2.7 6.0 4.1 0.6 2.7
RGNI 3.3 -4.6 3.7 4.8 -0.2 4.0
Per capita RGNI 2.7 -4.8 2.9 4.1 -1.3 3.6
Total final demand 2.8 -6.1 14.0 5.3 3.4 6.6Total final demand excluding re-exports(a) 2.9 -3.5 11.0 4.7 3.2 4.2
Domestic demand 1.4 0.5 7.1 6.5 3.9 4.1 Private 1.2 -0.1 6.6 6.7 3.6 4.1 Public 3.2 4.5 10.2 5.5 5.8 3.7
External demand 3.5 -9.1 17.6 4.8 3.2 7.8
Table 2 : Rates of change in chain volume measures of Gross Domestic Productby expenditure component (in real terms)
Notes: (a) Re-export margin is nevertheless retained in the total final demand.
(#) Figures are subject to revision later on as more data become available.
(&) Figures are compiled based on the change of ownership principle in recording goods sent abroad for processing and merchanting under the standards stipulated in the System of National Accounts 2008.
(--) Not applicable.
(*) Change within ±0.05%.
N.A. Not yet available.

115
(%)
2014 2015 2016# 2017# 2017 2018
Q2# Q3# Q4# Q1#
10 years2007 to
2017#
5 years2012 to
2017#
Private consumption expenditure 3.3 4.8 2.0 5.5 5.8 6.3 6.3 8.6 4.1 4.0Government consumption expenditure 3.1 3.4 3.3 3.4 3.0 4.5 3.2 3.9 3.0 3.2Gross domestic fixed capital formation -0.1 -3.2 -0.1 3.5 7.6 -2.1 3.1 3.8 2.4 0.5
Building and construction 9.3 2.2 5.9 1.7 2.0 0.9 -2.6 1.0 4.3 2.9
Costs of ownership transfer 6.9 -8.3 -2.9 22.3 53.0 -12.8 6.2 12.8 -5.1 -3.5 Machinery, equipment and intellectual property products -8.7 -7.7 -6.3 1.8 6.1 -3.0 9.9 6.2 1.4 -2.2
Total exports of goods& 0.8 -1.7 1.6 5.9 5.7 5.7 3.4 5.2 3.0 2.9
Imports of goods& 1.5 -2.7 0.7 7.0 6.4 6.3 5.4 6.9 4.2 3.2
Exports of services& 1.6 0.3 -3.5 3.2 1.9 3.5 3.9 7.5 3.7 1.5
Imports of services& -2.2 5.0 2.0 1.9 4.8 1.4 0.8 3.8 0.3 0.9
GDP 2.8 2.4 2.2 3.8 3.9 3.6 3.4 4.7 2.7 2.8
Per capita GDP 2.0 1.5 1.5 3.0 -- -- -- -- 2.0 2.2
RGNI 2.7 3.8 3.2 5.6 6.9 6.9 4.5 N.A. 2.6 3.8
Per capita RGNI 1.9 2.9 2.6 4.8 -- -- -- -- 1.9 3.1
Total final demand 1.6 -0.4 1.3 5.4 5.4 4.9 4.3 5.9 3.3 2.9Total final demand excluding re-exports(a) 0.6 0.1 1.5 4.4 4.8 3.6 4.5 5.7 2.9 2.1
Domestic demand 2.9 1.6 2.6 5.4 5.9 4.1 6.0 6.4 3.6 3.3
Private 2.6 1.3 2.5 5.8 6.5 4.1 7.2 6.5 3.4 3.3 Public 4.6 2.9 3.0 2.9 2.4 4.1 -1.0 5.6 4.6 3.4External demand 1.0 -1.4 0.7 5.5 5.1 5.4 3.5 5.6 3.2 2.7
Table 2 : Rates of change in chain volume measures of Gross Domestic Productby expenditure component (in real terms) (Cont'd)
Average annualrate of change:
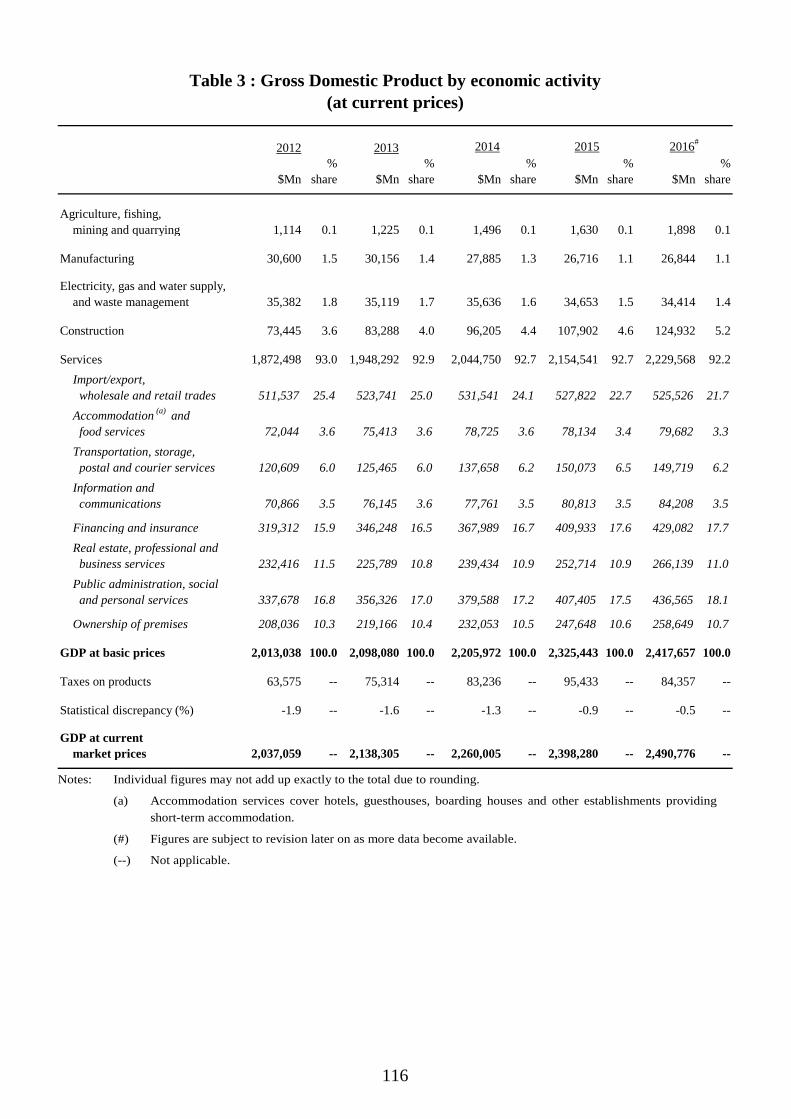
116
2012 2013
$Mn%
share $Mn%
share $Mn%
share $Mn%
share $Mn%
share
Agriculture, fishing, mining and quarrying 1,114 0.1 1,225 0.1 1,496 0.1 1,630 0.1 1,898 0.1
Manufacturing 30,600 1.5 30,156 1.4 27,885 1.3 26,716 1.1 26,844 1.1
Electricity, gas and water supply, and waste management 35,382 1.8 35,119 1.7 35,636 1.6 34,653 1.5 34,414 1.4
Construction 73,445 3.6 83,288 4.0 96,205 4.4 107,902 4.6 124,932 5.2
Services 1,872,498 93.0 1,948,292 92.9 2,044,750 92.7 2,154,541 92.7 2,229,568 92.2Import/export, wholesale and retail trades 511,537 25.4 523,741 25.0 531,541 24.1 527,822 22.7 525,526 21.7Accommodation (a) and food services 72,044 3.6 75,413 3.6 78,725 3.6 78,134 3.4 79,682 3.3Transportation, storage, postal and courier services 120,609 6.0 125,465 6.0 137,658 6.2 150,073 6.5 149,719 6.2Information and communications 70,866 3.5 76,145 3.6 77,761 3.5 80,813 3.5 84,208 3.5
Financing and insurance 319,312 15.9 346,248 16.5 367,989 16.7 409,933 17.6 429,082 17.7Real estate, professional and business services 232,416 11.5 225,789 10.8 239,434 10.9 252,714 10.9 266,139 11.0Public administration, social and personal services 337,678 16.8 356,326 17.0 379,588 17.2 407,405 17.5 436,565 18.1
Ownership of premises 208,036 10.3 219,166 10.4 232,053 10.5 247,648 10.6 258,649 10.7
GDP at basic prices 2,013,038 100.0 2,098,080 100.0 2,205,972 100.0 2,325,443 100.0 2,417,657 100.0
Taxes on products 63,575 -- 75,314 -- 83,236 -- 95,433 -- 84,357 --
Statistical discrepancy (%) -1.9 -- -1.6 -- -1.3 -- -0.9 -- -0.5 --
GDP at current market prices 2,037,059 -- 2,138,305 -- 2,260,005 -- 2,398,280 -- 2,490,776 --
Table 3 : Gross Domestic Product by economic activity(at current prices)
2016#20152014
Notes: Individual figures may not add up exactly to the total due to rounding.
(a) Accommodation services cover hotels, guesthouses, boarding houses and other establishments providing short-term accommodation.
(#) Figures are subject to revision later on as more data become available.
(--) Not applicable.
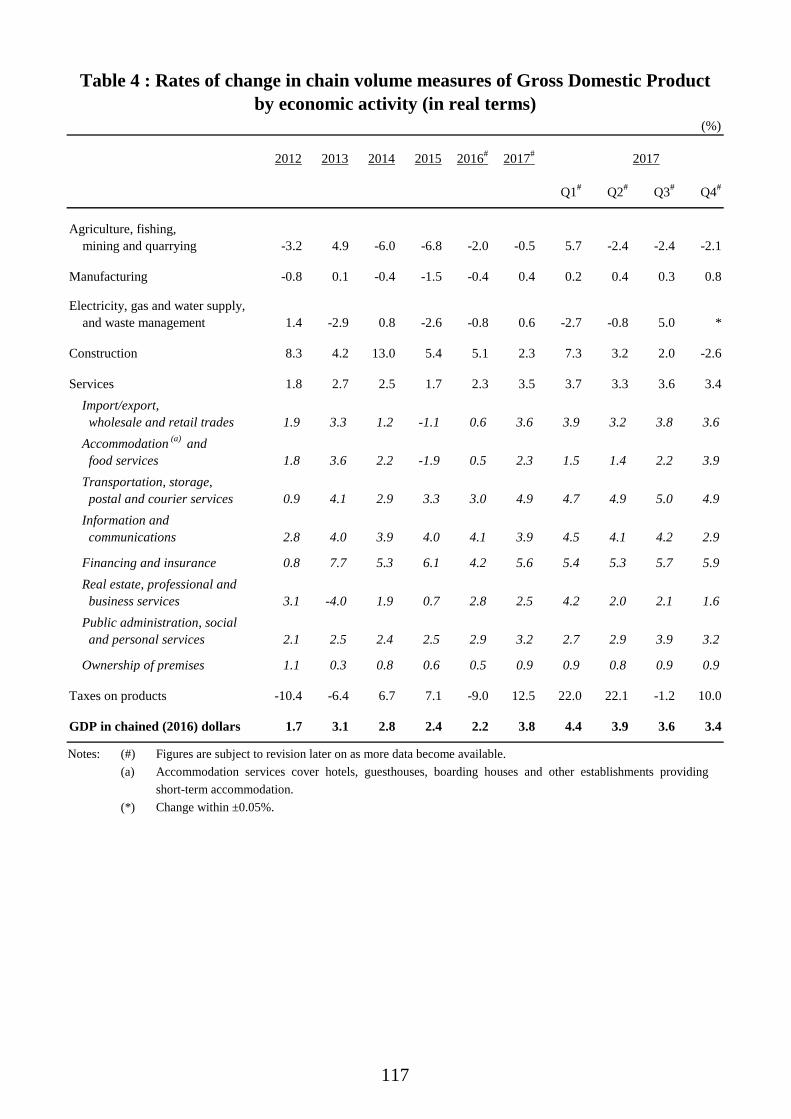
117
(%)
2012 2013 2014 2015 2016# 2017# 2017
Q1# Q2# Q3# Q4#
Agriculture, fishing, mining and quarrying -3.2 4.9 -6.0 -6.8 -2.0 -0.5 5.7 -2.4 -2.4 -2.1
Manufacturing -0.8 0.1 -0.4 -1.5 -0.4 0.4 0.2 0.4 0.3 0.8
Electricity, gas and water supply, and waste management 1.4 -2.9 0.8 -2.6 -0.8 0.6 -2.7 -0.8 5.0 *
Construction 8.3 4.2 13.0 5.4 5.1 2.3 7.3 3.2 2.0 -2.6
Services 1.8 2.7 2.5 1.7 2.3 3.5 3.7 3.3 3.6 3.4Import/export, wholesale and retail trades 1.9 3.3 1.2 -1.1 0.6 3.6 3.9 3.2 3.8 3.6Accommodation (a) and food services 1.8 3.6 2.2 -1.9 0.5 2.3 1.5 1.4 2.2 3.9Transportation, storage, postal and courier services 0.9 4.1 2.9 3.3 3.0 4.9 4.7 4.9 5.0 4.9Information and communications 2.8 4.0 3.9 4.0 4.1 3.9 4.5 4.1 4.2 2.9
Financing and insurance 0.8 7.7 5.3 6.1 4.2 5.6 5.4 5.3 5.7 5.9Real estate, professional and business services 3.1 -4.0 1.9 0.7 2.8 2.5 4.2 2.0 2.1 1.6Public administration, social and personal services 2.1 2.5 2.4 2.5 2.9 3.2 2.7 2.9 3.9 3.2
Ownership of premises 1.1 0.3 0.8 0.6 0.5 0.9 0.9 0.8 0.9 0.9
Taxes on products -10.4 -6.4 6.7 7.1 -9.0 12.5 22.0 22.1 -1.2 10.0
GDP in chained (2016) dollars 1.7 3.1 2.8 2.4 2.2 3.8 4.4 3.9 3.6 3.4
Table 4 : Rates of change in chain volume measures of Gross Domestic Productby economic activity (in real terms)
Notes: (#) Figures are subject to revision later on as more data become available. (a) Accommodation services cover hotels, guesthouses, boarding houses and other establishments providing
short-term accommodation. (*) Change within ±0.05%.

118
($Mn)
2013 2014 2015 2016# 2017# 2017
Q1# Q2# Q3# Q4#
Current account(a) 32,475 31,453 79,553 98,664 114,946 20,157 19,070 59,733 15,985
Goods -216,592 -250,931 -177,302 -129,693 -186,673 -56,573 -67,722 -16,567 -45,811
Services 229,424 255,563 234,603 186,733 210,890 61,849 41,122 53,283 54,636
Primary income 40,519 46,607 44,376 62,593 110,734 19,800 50,420 28,182 12,332
Secondary income -20,876 -19,786 -22,124 -20,969 -20,005 -4,919 -4,749 -5,165 -5,172
Capital and financial account(a) -86,308 -73,785 -128,642 -101,104 -155,044 12,087 -45,533 -89,585 -32,013
Capital account -1,609 -748 -216 -374 -646 -59 -74 -147 -366
Financial account -84,699 -73,037 -128,426 -100,730 -154,397 12,146 -45,459 -89,437 -31,647 Financial non-reserve assets -26,810 66,052 153,570 -91,874 96,111 57,455 30,646 -33,836 41,847
Direct investment -50,250 -85,718 794,800 447,758 167,473 69,372 -36,922 13,217 121,806
Portfolio investment -386,077 -64,384 -970,938 -469,591 305,014 103,040 229,086 -13,462 -13,650
Financial derivatives 54,661 118,359 99,178 36,327 39,646 12,533 -3,570 10,997 19,685
Other investment 354,856 97,795 230,531 -106,368 -416,022 -127,491 -157,948 -44,588 -85,995
Reserve assets -57,890 -139,089 -281,996 -8,856 -250,509 -45,309 -76,105 -55,601 -73,494
Net errors and omissions 53,833 42,332 49,089 2,440 40,098 -32,244 26,463 29,852 16,028
Overall Balance of Payments 57,890 139,089 281,996 8,856 250,509 45,309 76,105 55,601 73,494
Table 5 : Balance of Payments by major component(at current prices)
Notes: Individual figures may not add up exactly to the total due to rounding.
(a) In accordance with the accounting rules adopted in compiling Balance of Payments, a positive value for the balance figure in the current account represents a surplus whereas a negative value represents a deficit. In the capital and financial account, a positive value indicates a net financial inflow while a negative value indicates a net outflow. As increases in external assets are debit entries and decreases are credit entries, a negative value for the reserve assets represents a net increase while a positive value represents a net decrease.
(#) Figures are subject to revision later on as more data become available.
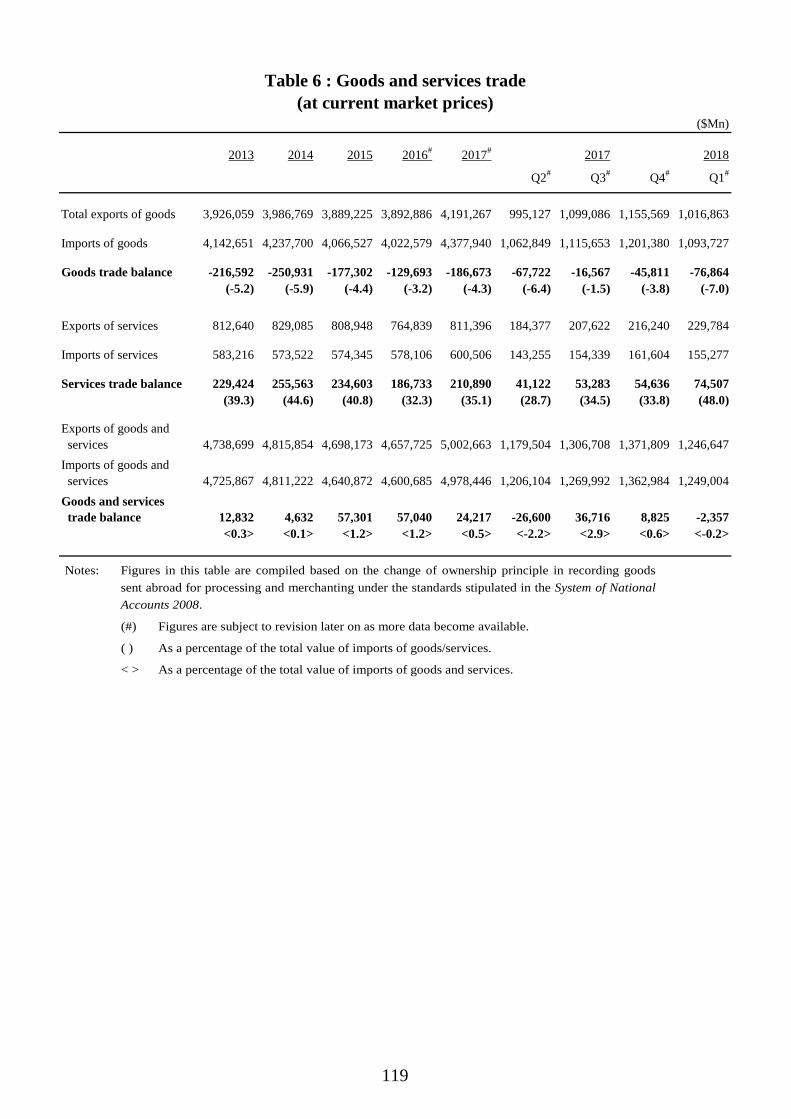
119
($Mn)
2013 2014 2015 2016# 2017# 2017 2018
Q2# Q3# Q4# Q1#
Total exports of goods 3,926,059 3,986,769 3,889,225 3,892,886 4,191,267 995,127 1,099,086 1,155,569 1,016,863
Imports of goods 4,142,651 4,237,700 4,066,527 4,022,579 4,377,940 1,062,849 1,115,653 1,201,380 1,093,727
Goods trade balance -216,592 -250,931 -177,302 -129,693 -186,673 -67,722 -16,567 -45,811 -76,864(-5.2) (-5.9) (-4.4) (-3.2) (-4.3) (-6.4) (-1.5) (-3.8) (-7.0)
Exports of services 812,640 829,085 808,948 764,839 811,396 184,377 207,622 216,240 229,784
Imports of services 583,216 573,522 574,345 578,106 600,506 143,255 154,339 161,604 155,277
Services trade balance 229,424 255,563 234,603 186,733 210,890 41,122 53,283 54,636 74,507(39.3) (44.6) (40.8) (32.3) (35.1) (28.7) (34.5) (33.8) (48.0)
Exports of goods and services 4,738,699 4,815,854 4,698,173 4,657,725 5,002,663 1,179,504 1,306,708 1,371,809 1,246,647Imports of goods and services 4,725,867 4,811,222 4,640,872 4,600,685 4,978,446 1,206,104 1,269,992 1,362,984 1,249,004Goods and services trade balance 12,832 4,632 57,301 57,040 24,217 -26,600 36,716 8,825 -2,357
<0.3> <0.1> <1.2> <1.2> <0.5> <-2.2> <2.9> <0.6> <-0.2>
Table 6 : Goods and services trade(at current market prices)
Notes: Figures in this table are compiled based on the change of ownership principle in recording goods sent abroad for processing and merchanting under the standards stipulated in the System of National Accounts 2008.
(#) Figures are subject to revision later on as more data become available.
( ) As a percentage of the total value of imports of goods/services.
< > As a percentage of the total value of imports of goods and services.

120
2013 2014 2015 2016# 2017# 2017 2018
Q2# Q3# Q4# Q1#
At current market prices ($Mn)
Total exports of goods 3,816,390 3,877,458 3,779,263 3,776,638 4,055,437 975,059 1,059,892 1,105,177 987,978
Imports of goods 4,394,928 4,471,810 4,289,991 4,240,000 4,586,052 1,115,073 1,168,631 1,255,717 1,143,416
Goods trade balance -578,538 -594,352 -510,728 -463,362 -530,615 -140,014 -108,739 -150,540 -155,438(-13.2) (-13.3) (-11.9) (-10.9) (-11.6) (-12.6) (-9.3) (-12.0) (-13.6)
Exports of services 1,058,584 1,079,989 1,052,355 1,010,316 1,066,446 236,185 276,563 295,817 287,299
Imports of services 467,214 481,005 484,326 489,914 511,614 122,771 131,108 136,452 134,218
Services trade balance 591,370 598,984 568,029 520,402 554,832 113,414 145,455 159,365 153,081(126.6) (124.5) (117.3) (106.2) (108.4) (92.4) (110.9) (116.8) (114.1)
Exports of goods and services 4,874,974 4,957,447 4,831,618 4,786,954 5,121,883 1,211,244 1,336,455 1,400,994 1,275,277
Imports of goods and services 4,862,142 4,952,815 4,774,317 4,729,914 5,097,666 1,237,844 1,299,739 1,392,169 1,277,634
Goods and services trade balance 12,832 4,632 57,301 57,040 24,217 -26,600 36,716 8,825 -2,357
<0.3> <0.1> <1.2> <1.2> <0.5> <-2.1> <2.8> <0.6> <-0.2>
Rates of change in real terms (%)
Total exports of goods 6.5 0.8 -1.9 1.4 5.6 5.3 5.5 3.0 5.1
Imports of goods 7.2 0.9 -2.7 0.6 6.2 5.6 5.5 4.6 6.5
Exports of services 4.9 1.2 -0.3 -2.1 2.9 1.8 3.1 3.4 6.5
Imports of services 1.5 1.8 5.3 2.4 3.3 6.6 2.9 2.2 4.3
Table 6a : Goods and services trade based on the standards stipulated in the System ofNational Accounts 2008 , other than the change of ownership principle
Notes: (#) Figures are subject to revision later on as more data become available.
( ) As a percentage of the total value of imports of goods/services.
< > As a percentage of the total value of imports of goods and services.

121
2013 2014 2015 2016 2017 2018Q2 Q3 Q4 Q1
(% change) ($Mn)
All markets 3.6 3.2 -1.8 -0.5 8.0 3,875,898 7.4 8.0 6.8 9.7
Mainland of China 4.9 1.5 -2.1 0.4 8.4 2,105,829 6.8 8.9 6.0 12.6
United States -2.1 3.1 0.2 -5.3 1.9 330,198 -0.1 -0.7 6.1 7.4
India 7.9 13.1 8.1 14.6 35.9 158,635 54.7 12.4 38.9 -6.3
Japan -6.1 -2.8 -6.6 -4.9 10.0 128,474 9.7 12.9 13.2 7.0
Taiwan -4.3 2.5 -18.0 14.6 19.9 89,371 27.2 19.6 -0.7 11.9
Vietnam 15.5 14.0 14.7 -5.8 10.3 79,632 13.6 7.7 7.7 0.1
Germany -5.1 -1.7 -3.2 -5.1 10.8 73,912 1.1 16.8 21.3 12.4
Netherlands 1.1 12.7 10.2 10.3 11.5 63,982 16.9 10.6 1.2 0.1
Singapore 4.7 2.2 -2.3 4.8 -0.4 61,023 0.9 9.6 -8.5 8.9
Korea 9.0 -2.7 -12.8 -0.6 4.9 56,672 -1.7 1.4 5.9 -1.8
Rest of the world 5.4 7.6 -1.8 -3.3 3.8 728,169 2.8 6.1 4.8 9.2
Table 7 : Total exports of goods by market(in value terms)
2017
(% change over a year earlier)(% change)
Note: Individual figures may not add up exactly to the total due to rounding.

122
2013 2014 2015 2016 2017 2018Q2 Q3 Q4 Q1
(% change) ($Mn)
All sources 3.8 3.9 -4.1 -0.9 8.7 4,357,004 8.2 7.7 8.5 10.6
Mainland of China 5.5 2.3 -0.1 -3.4 5.9 2,030,145 4.8 4.9 5.8 7.8
Taiwan 6.9 14.7 -8.6 6.4 12.9 329,678 8.3 8.0 16.2 15.1
Singapore * 5.8 -5.7 6.4 10.1 288,107 12.1 16.7 -0.1 8.8
Japan -8.1 0.9 -9.9 -5.2 2.7 253,394 1.4 1.1 0.6 0.5
Korea 3.4 10.6 -2.0 14.0 28.5 252,056 23.2 29.8 20.0 13.3
United States 7.4 * -3.9 -2.0 3.4 213,737 7.9 2.5 0.9 6.2
Malaysia 4.7 16.7 -7.9 -3.7 26.8 114,877 18.1 20.6 62.0 97.9
India 6.7 10.0 -13.7 11.9 15.8 107,412 32.8 -0.6 3.1 -12.3
Thailand 6.4 13.7 -3.7 -2.7 8.5 89,641 9.3 6.2 8.3 4.2
Philippines 2.5 22.0 10.3 5.8 27.6 76,275 24.5 30.8 20.9 5.3
Rest of the world 3.2 -0.3 -10.6 -3.1 7.0 601,681 8.3 7.0 11.2 14.4
(% change)
Table 8 : Imports of goods by source(in value terms)
2017
(% change over a year earlier)
Notes: Individual figures may not add up exactly to the total due to rounding. (*) Change within ±0.05%.
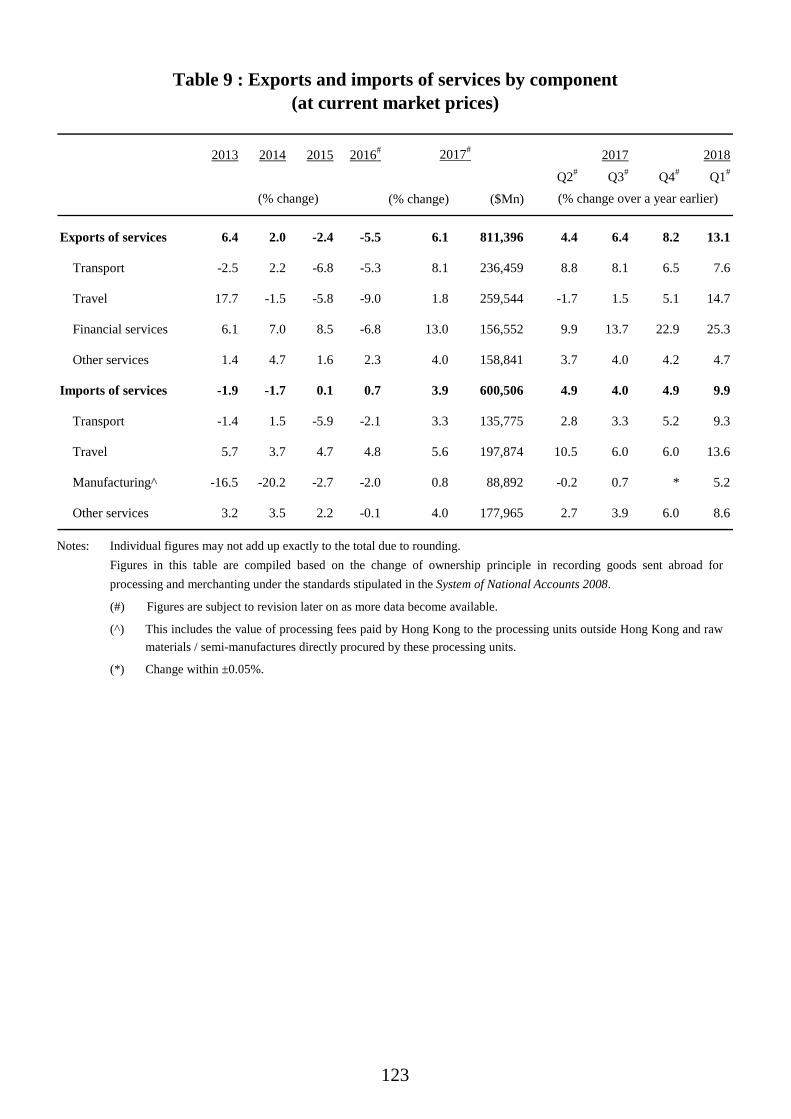
123
2013 2014 2015 2016# 2017 2018
Q2# Q3# Q4# Q1#
(% change) ($Mn)
Exports of services 6.4 2.0 -2.4 -5.5 6.1 811,396 4.4 6.4 8.2 13.1
Transport -2.5 2.2 -6.8 -5.3 8.1 236,459 8.8 8.1 6.5 7.6
Travel 17.7 -1.5 -5.8 -9.0 1.8 259,544 -1.7 1.5 5.1 14.7
Financial services 6.1 7.0 8.5 -6.8 13.0 156,552 9.9 13.7 22.9 25.3
Other services 1.4 4.7 1.6 2.3 4.0 158,841 3.7 4.0 4.2 4.7
Imports of services -1.9 -1.7 0.1 0.7 3.9 600,506 4.9 4.0 4.9 9.9
Transport -1.4 1.5 -5.9 -2.1 3.3 135,775 2.8 3.3 5.2 9.3
Travel 5.7 3.7 4.7 4.8 5.6 197,874 10.5 6.0 6.0 13.6
Manufacturing^ -16.5 -20.2 -2.7 -2.0 0.8 88,892 -0.2 0.7 * 5.2
Other services 3.2 3.5 2.2 -0.1 4.0 177,965 2.7 3.9 6.0 8.6
(% change)
Table 9 : Exports and imports of services by component(at current market prices)
2017#
(% change over a year earlier)
Notes: Individual figures may not add up exactly to the total due to rounding. Figures in this table are compiled based on the change of ownership principle in recording goods sent abroad for
processing and merchanting under the standards stipulated in the System of National Accounts 2008.
(#) Figures are subject to revision later on as more data become available.
(^) This includes the value of processing fees paid by Hong Kong to the processing units outside Hong Kong and raw materials / semi-manufactures directly procured by these processing units.
(*) Change within ±0.05%.
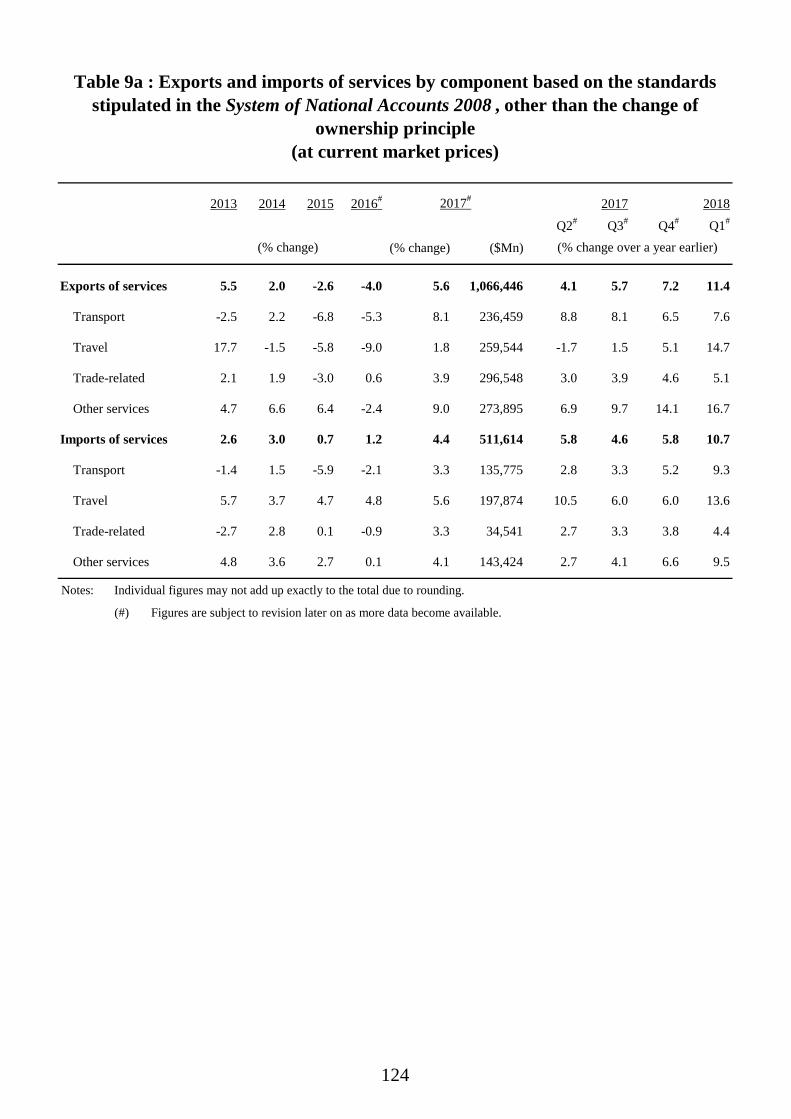
124
2013 2014 2015 2016# 2017 2018
Q2# Q3# Q4# Q1#
(% change) ($Mn)
Exports of services 5.5 2.0 -2.6 -4.0 5.6 1,066,446 4.1 5.7 7.2 11.4
Transport -2.5 2.2 -6.8 -5.3 8.1 236,459 8.8 8.1 6.5 7.6
Travel 17.7 -1.5 -5.8 -9.0 1.8 259,544 -1.7 1.5 5.1 14.7
Trade-related 2.1 1.9 -3.0 0.6 3.9 296,548 3.0 3.9 4.6 5.1
Other services 4.7 6.6 6.4 -2.4 9.0 273,895 6.9 9.7 14.1 16.7
Imports of services 2.6 3.0 0.7 1.2 4.4 511,614 5.8 4.6 5.8 10.7
Transport -1.4 1.5 -5.9 -2.1 3.3 135,775 2.8 3.3 5.2 9.3
Travel 5.7 3.7 4.7 4.8 5.6 197,874 10.5 6.0 6.0 13.6
Trade-related -2.7 2.8 0.1 -0.9 3.3 34,541 2.7 3.3 3.8 4.4
Other services 4.8 3.6 2.7 0.1 4.1 143,424 2.7 4.1 6.6 9.5
(% change over a year earlier)(% change)
Table 9a : Exports and imports of services by component based on the standardsstipulated in the System of National Accounts 2008 , other than the change of
ownership principle(at current market prices)
2017#
Notes: Individual figures may not add up exactly to the total due to rounding.
(#) Figures are subject to revision later on as more data become available.
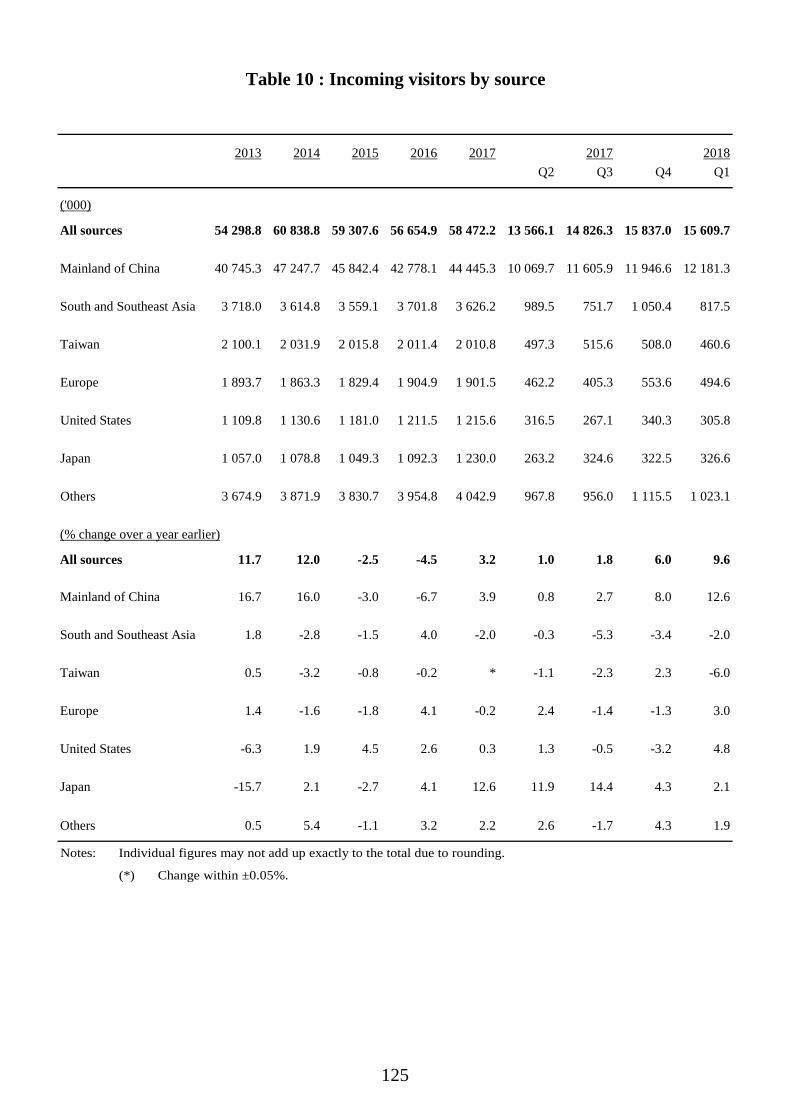
125
2013 2014 2015 2016 2017 2017 2018Q2 Q3 Q4 Q1
('000)
All sources 54 298.8 60 838.8 59 307.6 56 654.9 58 472.2 13 566.1 14 826.3 15 837.0 15 609.7
Mainland of China 40 745.3 47 247.7 45 842.4 42 778.1 44 445.3 10 069.7 11 605.9 11 946.6 12 181.3
South and Southeast Asia 3 718.0 3 614.8 3 559.1 3 701.8 3 626.2 989.5 751.7 1 050.4 817.5
Taiwan 2 100.1 2 031.9 2 015.8 2 011.4 2 010.8 497.3 515.6 508.0 460.6
Europe 1 893.7 1 863.3 1 829.4 1 904.9 1 901.5 462.2 405.3 553.6 494.6
United States 1 109.8 1 130.6 1 181.0 1 211.5 1 215.6 316.5 267.1 340.3 305.8
Japan 1 057.0 1 078.8 1 049.3 1 092.3 1 230.0 263.2 324.6 322.5 326.6
Others 3 674.9 3 871.9 3 830.7 3 954.8 4 042.9 967.8 956.0 1 115.5 1 023.1
(% change over a year earlier)
All sources 11.7 12.0 -2.5 -4.5 3.2 1.0 1.8 6.0 9.6
Mainland of China 16.7 16.0 -3.0 -6.7 3.9 0.8 2.7 8.0 12.6
South and Southeast Asia 1.8 -2.8 -1.5 4.0 -2.0 -0.3 -5.3 -3.4 -2.0
Taiwan 0.5 -3.2 -0.8 -0.2 * -1.1 -2.3 2.3 -6.0
Europe 1.4 -1.6 -1.8 4.1 -0.2 2.4 -1.4 -1.3 3.0
United States -6.3 1.9 4.5 2.6 0.3 1.3 -0.5 -3.2 4.8
Japan -15.7 2.1 -2.7 4.1 12.6 11.9 14.4 4.3 2.1
Others 0.5 5.4 -1.1 3.2 2.2 2.6 -1.7 4.3 1.9
Table 10 : Incoming visitors by source
Notes: Individual figures may not add up exactly to the total due to rounding.
(*) Change within ±0.05%.
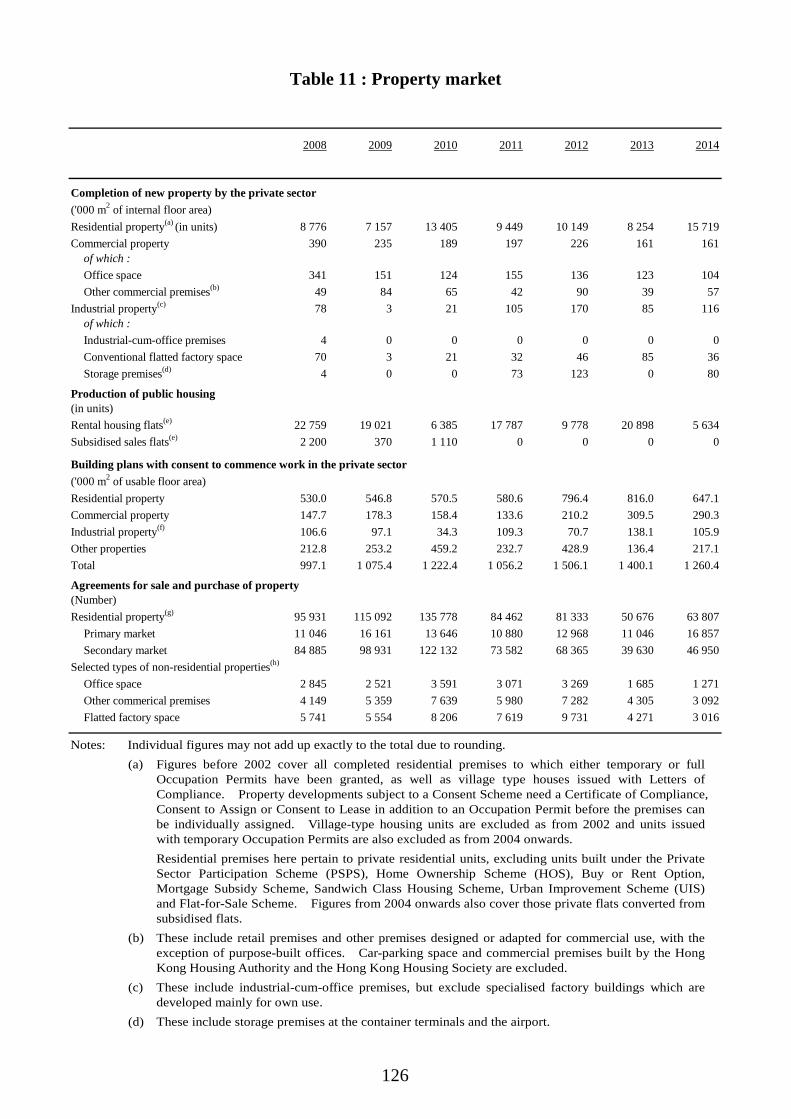
126
2008 2009 2010 2011 2012 2013 2014
Residential property(a) (in units) 8 776 7 157 13 405 9 449 10 149 8 254 15 719Commercial property 390 235 189 197 226 161 161
of which :Office space 341 151 124 155 136 123 104Other commercial premises(b) 49 84 65 42 90 39 57
Industrial property(c) 78 3 21 105 170 85 116of which :Industrial-cum-office premises 4 0 0 0 0 0 0Conventional flatted factory space 70 3 21 32 46 85 36Storage premises(d) 4 0 0 73 123 0 80
Production of public housing(in units)Rental housing flats(e) 22 759 19 021 6 385 17 787 9 778 20 898 5 634Subsidised sales flats(e) 2 200 370 1 110 0 0 0 0
Residential property 530.0 546.8 570.5 580.6 796.4 816.0 647.1Commercial property 147.7 178.3 158.4 133.6 210.2 309.5 290.3Industrial property(f) 106.6 97.1 34.3 109.3 70.7 138.1 105.9Other properties 212.8 253.2 459.2 232.7 428.9 136.4 217.1Total 997.1 1 075.4 1 222.4 1 056.2 1 506.1 1 400.1 1 260.4
Residential property(g) 95 931 115 092 135 778 84 462 81 333 50 676 63 807Primary market 11 046 16 161 13 646 10 880 12 968 11 046 16 857Secondary market 84 885 98 931 122 132 73 582 68 365 39 630 46 950
Selected types of non-residential properties(h)
Office space 2 845 2 521 3 591 3 071 3 269 1 685 1 271Other commerical premises 4 149 5 359 7 639 5 980 7 282 4 305 3 092Flatted factory space 5 741 5 554 8 206 7 619 9 731 4 271 3 016
Table 11 : Property market
Completion of new property by the private sector('000 m2 of internal floor area)
Building plans with consent to commence work in the private sector('000 m2 of usable floor area)
Agreements for sale and purchase of property(Number)
Notes: Individual figures may not add up exactly to the total due to rounding. (a) Figures before 2002 cover all completed residential premises to which either temporary or full
Occupation Permits have been granted, as well as village type houses issued with Letters of Compliance. Property developments subject to a Consent Scheme need a Certificate of Compliance, Consent to Assign or Consent to Lease in addition to an Occupation Permit before the premises can be individually assigned. Village-type housing units are excluded as from 2002 and units issued with temporary Occupation Permits are also excluded as from 2004 onwards.
Residential premises here pertain to private residential units, excluding units built under the Private Sector Participation Scheme (PSPS), Home Ownership Scheme (HOS), Buy or Rent Option, Mortgage Subsidy Scheme, Sandwich Class Housing Scheme, Urban Improvement Scheme (UIS) and Flat-for-Sale Scheme. Figures from 2004 onwards also cover those private flats converted from subsidised flats.
(b) These include retail premises and other premises designed or adapted for commercial use, with the exception of purpose-built offices. Car-parking space and commercial premises built by the Hong Kong Housing Authority and the Hong Kong Housing Society are excluded.
(c) These include industrial-cum-office premises, but exclude specialised factory buildings which are developed mainly for own use.
(d) These include storage premises at the container terminals and the airport.
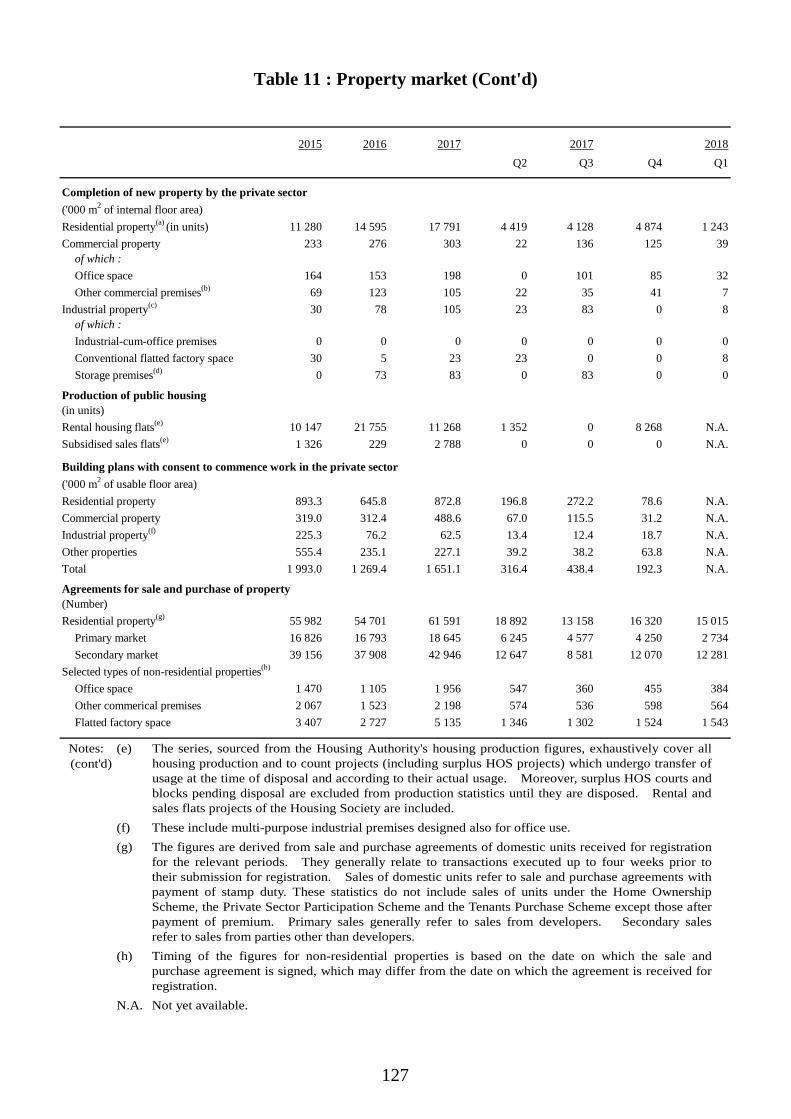
127
2015 2016 2017 2017 2018Q2 Q3 Q4 Q1
Residential property(a) (in units) 11 280 14 595 17 791 4 419 4 128 4 874 1 243Commercial property 233 276 303 22 136 125 39
of which :Office space 164 153 198 0 101 85 32Other commercial premises(b) 69 123 105 22 35 41 7
Industrial property(c) 30 78 105 23 83 0 8of which :Industrial-cum-office premises 0 0 0 0 0 0 0Conventional flatted factory space 30 5 23 23 0 0 8Storage premises(d) 0 73 83 0 83 0 0
Production of public housing(in units)Rental housing flats(e) 10 147 21 755 11 268 1 352 0 8 268 N.A.Subsidised sales flats(e) 1 326 229 2 788 0 0 0 N.A.
Residential property 893.3 645.8 872.8 196.8 272.2 78.6 N.A.Commercial property 319.0 312.4 488.6 67.0 115.5 31.2 N.A.Industrial property(f) 225.3 76.2 62.5 13.4 12.4 18.7 N.A.Other properties 555.4 235.1 227.1 39.2 38.2 63.8 N.A.Total 1 993.0 1 269.4 1 651.1 316.4 438.4 192.3 N.A.
Residential property(g) 55 982 54 701 61 591 18 892 13 158 16 320 15 015Primary market 16 826 16 793 18 645 6 245 4 577 4 250 2 734Secondary market 39 156 37 908 42 946 12 647 8 581 12 070 12 281
Selected types of non-residential properties(h)
Office space 1 470 1 105 1 956 547 360 455 384Other commerical premises 2 067 1 523 2 198 574 536 598 564Flatted factory space 3 407 2 727 5 135 1 346 1 302 1 524 1 543
Table 11 : Property market (Cont'd)
Completion of new property by the private sector('000 m2 of internal floor area)
Building plans with consent to commence work in the private sector('000 m2 of usable floor area)
Agreements for sale and purchase of property(Number)
Notes: (e) The series, sourced from the Housing Authority's housing production figures, exhaustively cover all housing production and to count projects (including surplus HOS projects) which undergo transfer of usage at the time of disposal and according to their actual usage. Moreover, surplus HOS courts and blocks pending disposal are excluded from production statistics until they are disposed. Rental and sales flats projects of the Housing Society are included.
(f) These include multi-purpose industrial premises designed also for office use. (g) The figures are derived from sale and purchase agreements of domestic units received for registration
for the relevant periods. They generally relate to transactions executed up to four weeks prior to their submission for registration. Sales of domestic units refer to sale and purchase agreements with payment of stamp duty. These statistics do not include sales of units under the Home Ownership Scheme, the Private Sector Participation Scheme and the Tenants Purchase Scheme except those after payment of premium. Primary sales generally refer to sales from developers. Secondary sales refer to sales from parties other than developers.
(h) Timing of the figures for non-residential properties is based on the date on which the sale and purchase agreement is signed, which may differ from the date on which the agreement is received for registration.
N.A. Not yet available.
(cont'd)
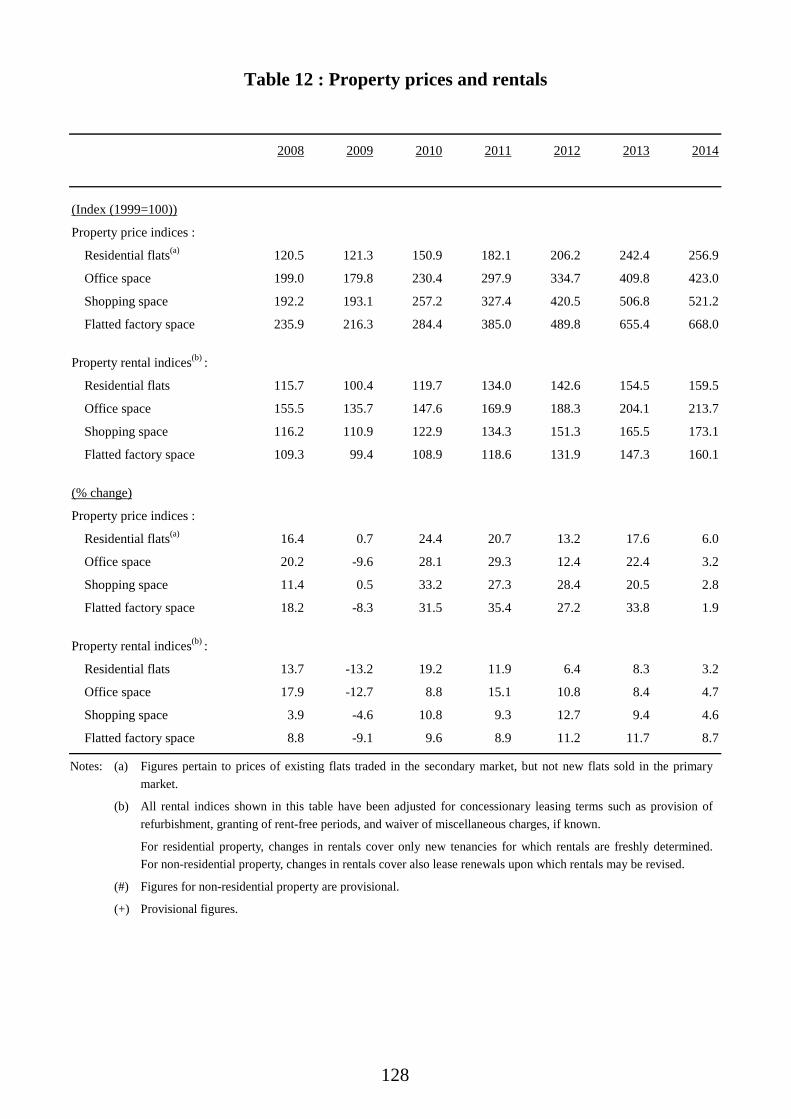
128
2008 2009 2010 2011 2012 2013 2014
(Index (1999=100))
Property price indices :
Residential flats(a) 120.5 121.3 150.9 182.1 206.2 242.4 256.9
Office space 199.0 179.8 230.4 297.9 334.7 409.8 423.0
Shopping space 192.2 193.1 257.2 327.4 420.5 506.8 521.2
Flatted factory space 235.9 216.3 284.4 385.0 489.8 655.4 668.0
Property rental indices(b) :
Residential flats 115.7 100.4 119.7 134.0 142.6 154.5 159.5
Office space 155.5 135.7 147.6 169.9 188.3 204.1 213.7
Shopping space 116.2 110.9 122.9 134.3 151.3 165.5 173.1
Flatted factory space 109.3 99.4 108.9 118.6 131.9 147.3 160.1
(% change)
Property price indices :
Residential flats(a) 16.4 0.7 24.4 20.7 13.2 17.6 6.0
Office space 20.2 -9.6 28.1 29.3 12.4 22.4 3.2
Shopping space 11.4 0.5 33.2 27.3 28.4 20.5 2.8
Flatted factory space 18.2 -8.3 31.5 35.4 27.2 33.8 1.9
Property rental indices(b) :
Residential flats 13.7 -13.2 19.2 11.9 6.4 8.3 3.2
Office space 17.9 -12.7 8.8 15.1 10.8 8.4 4.7
Shopping space 3.9 -4.6 10.8 9.3 12.7 9.4 4.6
Flatted factory space 8.8 -9.1 9.6 8.9 11.2 11.7 8.7
Table 12 : Property prices and rentals
Notes: (a) Figures pertain to prices of existing flats traded in the secondary market, but not new flats sold in the primary market.
(b) All rental indices shown in this table have been adjusted for concessionary leasing terms such as provision of refurbishment, granting of rent-free periods, and waiver of miscellaneous charges, if known.
For residential property, changes in rentals cover only new tenancies for which rentals are freshly determined. For non-residential property, changes in rentals cover also lease renewals upon which rentals may be revised.
(#) Figures for non-residential property are provisional.
(+) Provisional figures.

129
2015 2016 2017# 2017 2018Q2 Q3 Q4# Q1+
(Index (1999=100))
Property price indices :
Residential flats(a) 296.8 286.1 333.9 333.2 339.3 348.0 363.8
Office space 448.9 426.9 487.0 483.6 489.0 510.5 523.4
Shopping space 559.2 526.9 558.3 550.9 562.3 573.1 583.6
Flatted factory space 723.9 692.7 778.4 769.2 788.4 819.7 845.8
Property rental indices(b) :
Residential flats 172.8 168.2 182.6 181.5 185.1 187.1 188.3
Office space 226.7 232.3 241.8 240.3 243.9 245.7 245.1
Shopping space 182.5 178.6 182.5 181.2 183.6 185.1 186.1
Flatted factory space 174.4 181.4 190.6 188.1 192.9 195.4 196.7
(% change over a year earlier)
Property price indices :
Residential flats(a) 15.5 -3.6 16.7 21.1 17.6 13.7 15.5
Office space 6.1 -4.9 14.1 15.6 17.0 17.5 12.6
Shopping space 7.3 -5.8 6.0 4.8 9.4 7.2 6.7
Flatted factory space 8.4 -4.3 12.4 11.1 15.6 15.6 14.9
Property rental indices(b) :
Residential flats 8.3 -2.7 8.6 10.1 9.0 8.3 6.5
Office space 6.1 2.5 4.1 3.7 4.8 5.0 3.4
Shopping space 5.4 -2.1 2.2 1.7 3.4 3.2 3.3
Flatted factory space 8.9 4.0 5.1 3.9 6.0 6.1 5.8
Table 12 : Property prices and rentals (Cont'd)
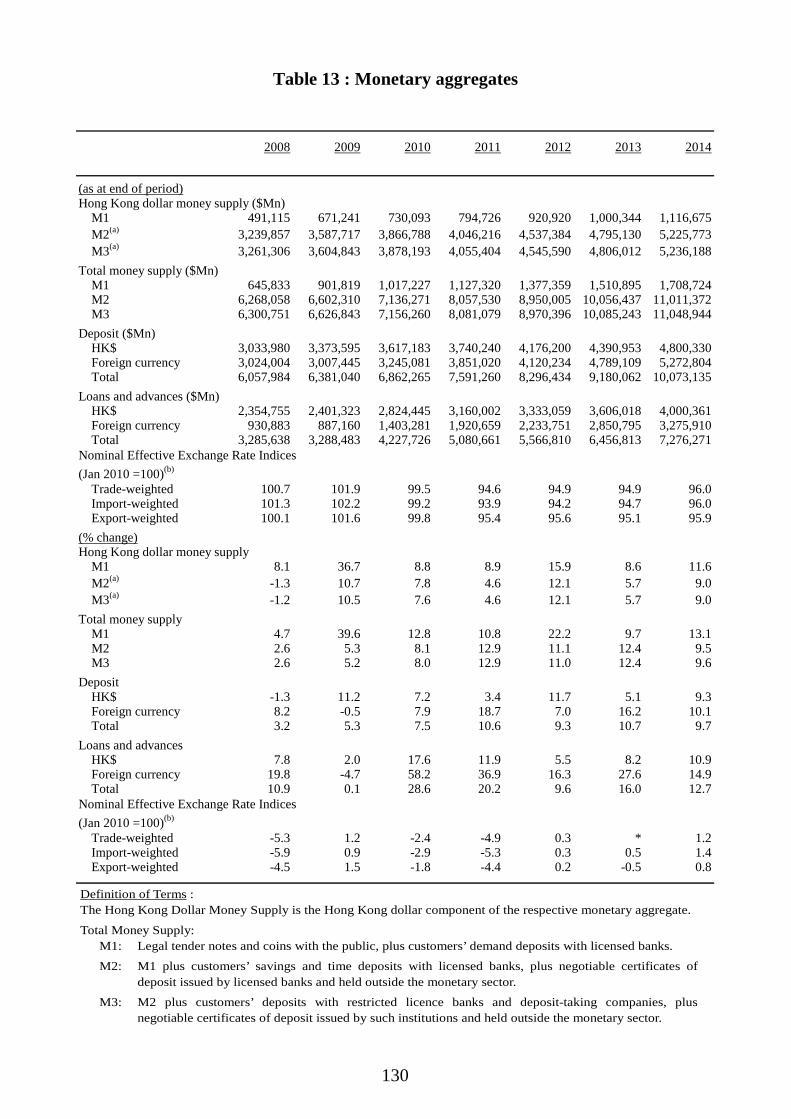
130
2008 2009 2010 2011 2012 2013 2014
(as at end of period)Hong Kong dollar money supply ($Mn)
M1 491,115 671,241 730,093 794,726 920,920 1,000,344 1,116,675M2(a) 3,239,857 3,587,717 3,866,788 4,046,216 4,537,384 4,795,130 5,225,773M3(a) 3,261,306 3,604,843 3,878,193 4,055,404 4,545,590 4,806,012 5,236,188
Total money supply ($Mn)M1 645,833 901,819 1,017,227 1,127,320 1,377,359 1,510,895 1,708,724M2 6,268,058 6,602,310 7,136,271 8,057,530 8,950,005 10,056,437 11,011,372M3 6,300,751 6,626,843 7,156,260 8,081,079 8,970,396 10,085,243 11,048,944
Deposit ($Mn)HK$ 3,033,980 3,373,595 3,617,183 3,740,240 4,176,200 4,390,953 4,800,330Foreign currency 3,024,004 3,007,445 3,245,081 3,851,020 4,120,234 4,789,109 5,272,804Total 6,057,984 6,381,040 6,862,265 7,591,260 8,296,434 9,180,062 10,073,135
Loans and advances ($Mn)HK$ 2,354,755 2,401,323 2,824,445 3,160,002 3,333,059 3,606,018 4,000,361Foreign currency 930,883 887,160 1,403,281 1,920,659 2,233,751 2,850,795 3,275,910Total 3,285,638 3,288,483 4,227,726 5,080,661 5,566,810 6,456,813 7,276,271
Trade-weighted 100.7 101.9 99.5 94.6 94.9 94.9 96.0Import-weighted 101.3 102.2 99.2 93.9 94.2 94.7 96.0Export-weighted 100.1 101.6 99.8 95.4 95.6 95.1 95.9
(% change)Hong Kong dollar money supply
M1 8.1 36.7 8.8 8.9 15.9 8.6 11.6M2(a) -1.3 10.7 7.8 4.6 12.1 5.7 9.0M3(a) -1.2 10.5 7.6 4.6 12.1 5.7 9.0
Total money supplyM1 4.7 39.6 12.8 10.8 22.2 9.7 13.1M2 2.6 5.3 8.1 12.9 11.1 12.4 9.5M3 2.6 5.2 8.0 12.9 11.0 12.4 9.6
DepositHK$ -1.3 11.2 7.2 3.4 11.7 5.1 9.3Foreign currency 8.2 -0.5 7.9 18.7 7.0 16.2 10.1Total 3.2 5.3 7.5 10.6 9.3 10.7 9.7
Loans and advancesHK$ 7.8 2.0 17.6 11.9 5.5 8.2 10.9Foreign currency 19.8 -4.7 58.2 36.9 16.3 27.6 14.9Total 10.9 0.1 28.6 20.2 9.6 16.0 12.7
Trade-weighted -5.3 1.2 -2.4 -4.9 0.3 * 1.2Import-weighted -5.9 0.9 -2.9 -5.3 0.3 0.5 1.4Export-weighted -4.5 1.5 -1.8 -4.4 0.2 -0.5 0.8
Table 13 : Monetary aggregates
Nominal Effective Exchange Rate Indices(Jan 2010 =100)(b)
Nominal Effective Exchange Rate Indices(Jan 2010 =100)(b)
Definition of Terms : The Hong Kong Dollar Money Supply is the Hong Kong dollar component of the respective monetary aggregate.
Total Money Supply: M1: Legal tender notes and coins with the public, plus customers’ demand deposits with licensed banks.
M2: M1 plus customers’ savings and time deposits with licensed banks, plus negotiable certificates of deposit issued by licensed banks and held outside the monetary sector.
M3: M2 plus customers’ deposits with restricted licence banks and deposit-taking companies, plus negotiable certificates of deposit issued by such institutions and held outside the monetary sector.
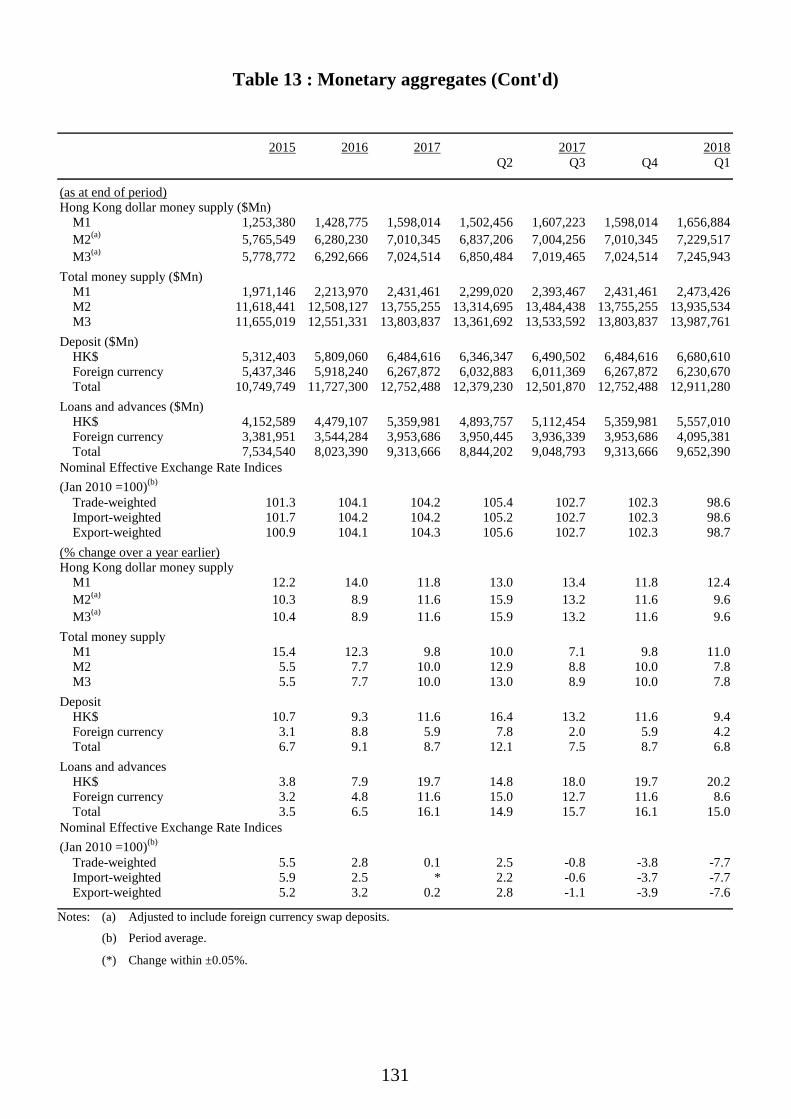
131
2015 2016 2017 2017 2018Q2 Q3 Q4 Q1
(as at end of period)Hong Kong dollar money supply ($Mn)
M1 1,253,380 1,428,775 1,598,014 1,502,456 1,607,223 1,598,014 1,656,884M2(a) 5,765,549 6,280,230 7,010,345 6,837,206 7,004,256 7,010,345 7,229,517M3(a) 5,778,772 6,292,666 7,024,514 6,850,484 7,019,465 7,024,514 7,245,943
Total money supply ($Mn)M1 1,971,146 2,213,970 2,431,461 2,299,020 2,393,467 2,431,461 2,473,426M2 11,618,441 12,508,127 13,755,255 13,314,695 13,484,438 13,755,255 13,935,534M3 11,655,019 12,551,331 13,803,837 13,361,692 13,533,592 13,803,837 13,987,761
Deposit ($Mn)HK$ 5,312,403 5,809,060 6,484,616 6,346,347 6,490,502 6,484,616 6,680,610Foreign currency 5,437,346 5,918,240 6,267,872 6,032,883 6,011,369 6,267,872 6,230,670Total 10,749,749 11,727,300 12,752,488 12,379,230 12,501,870 12,752,488 12,911,280
Loans and advances ($Mn)HK$ 4,152,589 4,479,107 5,359,981 4,893,757 5,112,454 5,359,981 5,557,010Foreign currency 3,381,951 3,544,284 3,953,686 3,950,445 3,936,339 3,953,686 4,095,381Total 7,534,540 8,023,390 9,313,666 8,844,202 9,048,793 9,313,666 9,652,390
Trade-weighted 101.3 104.1 104.2 105.4 102.7 102.3 98.6Import-weighted 101.7 104.2 104.2 105.2 102.7 102.3 98.6Export-weighted 100.9 104.1 104.3 105.6 102.7 102.3 98.7
(% change over a year earlier)Hong Kong dollar money supply
M1 12.2 14.0 11.8 13.0 13.4 11.8 12.4M2(a) 10.3 8.9 11.6 15.9 13.2 11.6 9.6M3(a) 10.4 8.9 11.6 15.9 13.2 11.6 9.6
Total money supplyM1 15.4 12.3 9.8 10.0 7.1 9.8 11.0M2 5.5 7.7 10.0 12.9 8.8 10.0 7.8M3 5.5 7.7 10.0 13.0 8.9 10.0 7.8
DepositHK$ 10.7 9.3 11.6 16.4 13.2 11.6 9.4Foreign currency 3.1 8.8 5.9 7.8 2.0 5.9 4.2Total 6.7 9.1 8.7 12.1 7.5 8.7 6.8
Loans and advancesHK$ 3.8 7.9 19.7 14.8 18.0 19.7 20.2Foreign currency 3.2 4.8 11.6 15.0 12.7 11.6 8.6Total 3.5 6.5 16.1 14.9 15.7 16.1 15.0
Trade-weighted 5.5 2.8 0.1 2.5 -0.8 -3.8 -7.7Import-weighted 5.9 2.5 * 2.2 -0.6 -3.7 -7.7Export-weighted 5.2 3.2 0.2 2.8 -1.1 -3.9 -7.6
Table 13 : Monetary aggregates (Cont'd)
Nominal Effective Exchange Rate Indices(Jan 2010 =100)(b)
Nominal Effective Exchange Rate Indices(Jan 2010 =100)(b)
Notes: (a) Adjusted to include foreign currency swap deposits.
(b) Period average.
(*) Change within ±0.05%.
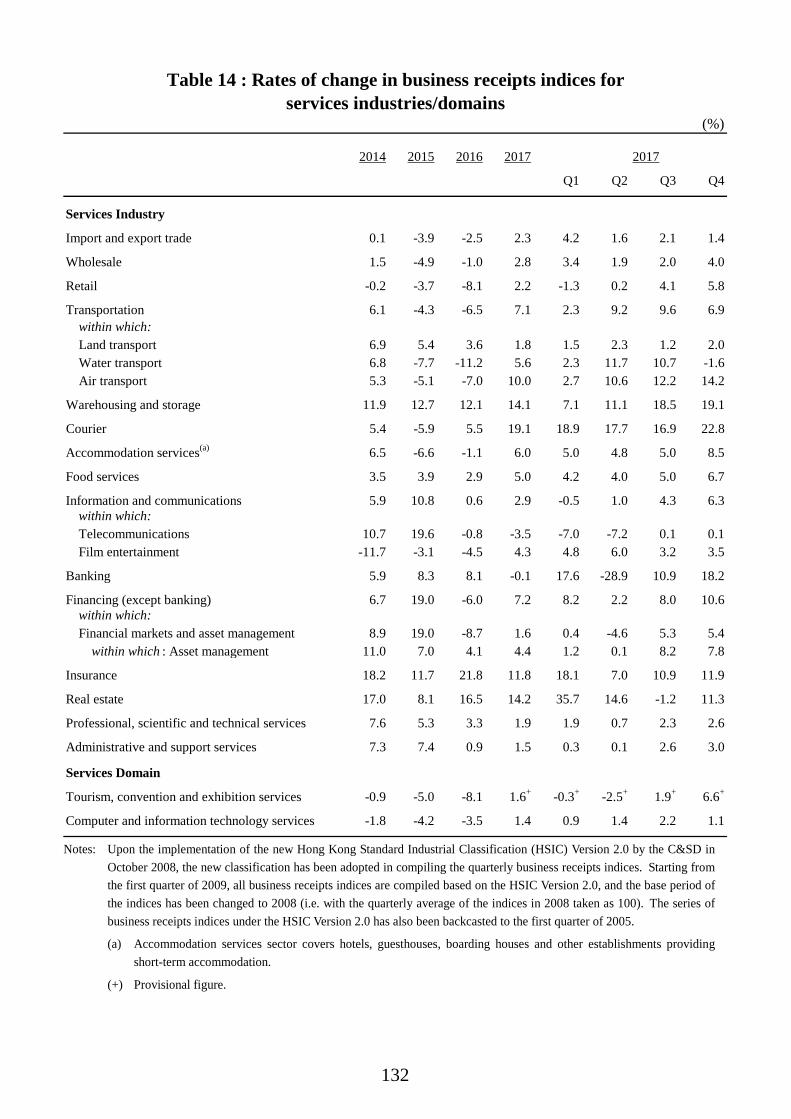
132
Table 14 : Rates of change in business receipts indices forservices industries/domains
(%)
2014 2015 2016 2017 2017
Q1 Q2 Q3 Q4
Services Industry
Import and export trade 0.1 -3.9 -2.5 2.3 4.2 1.6 2.1 1.4
Wholesale 1.5 -4.9 -1.0 2.8 3.4 1.9 2.0 4.0
Retail -0.2 -3.7 -8.1 2.2 -1.3 0.2 4.1 5.8
Transportation 6.1 -4.3 -6.5 7.1 2.3 9.2 9.6 6.9within which:Land transport 6.9 5.4 3.6 1.8 1.5 2.3 1.2 2.0Water transport 6.8 -7.7 -11.2 5.6 2.3 11.7 10.7 -1.6Air transport 5.3 -5.1 -7.0 10.0 2.7 10.6 12.2 14.2
Warehousing and storage 11.9 12.7 12.1 14.1 7.1 11.1 18.5 19.1
Courier 5.4 -5.9 5.5 19.1 18.9 17.7 16.9 22.8
Accommodation services(a) 6.5 -6.6 -1.1 6.0 5.0 4.8 5.0 8.5
Food services 3.5 3.9 2.9 5.0 4.2 4.0 5.0 6.7
Information and communications 5.9 10.8 0.6 2.9 -0.5 1.0 4.3 6.3within which:Telecommunications 10.7 19.6 -0.8 -3.5 -7.0 -7.2 0.1 0.1Film entertainment -11.7 -3.1 -4.5 4.3 4.8 6.0 3.2 3.5
Banking 5.9 8.3 8.1 -0.1 17.6 -28.9 10.9 18.2
Financing (except banking) 6.7 19.0 -6.0 7.2 8.2 2.2 8.0 10.6within which:Financial markets and asset management 8.9 19.0 -8.7 1.6 0.4 -4.6 5.3 5.4
within which : Asset management 11.0 7.0 4.1 4.4 1.2 0.1 8.2 7.8
Insurance 18.2 11.7 21.8 11.8 18.1 7.0 10.9 11.9
Real estate 17.0 8.1 16.5 14.2 35.7 14.6 -1.2 11.3
Professional, scientific and technical services 7.6 5.3 3.3 1.9 1.9 0.7 2.3 2.6
Administrative and support services 7.3 7.4 0.9 1.5 0.3 0.1 2.6 3.0
Services Domain
Tourism, convention and exhibition services -0.9 -5.0 -8.1 1.6+ -0.3+ -2.5+ 1.9+ 6.6+
Computer and information technology services -1.8 -4.2 -3.5 1.4 0.9 1.4 2.2 1.1
Notes: Upon the implementation of the new Hong Kong Standard Industrial Classification (HSIC) Version 2.0 by the C&SD in October 2008, the new classification has been adopted in compiling the quarterly business receipts indices. Starting from the first quarter of 2009, all business receipts indices are compiled based on the HSIC Version 2.0, and the base period of the indices has been changed to 2008 (i.e. with the quarterly average of the indices in 2008 taken as 100). The series of business receipts indices under the HSIC Version 2.0 has also been backcasted to the first quarter of 2005.
(a) Accommodation services sector covers hotels, guesthouses, boarding houses and other establishments providing short-term accommodation.
(+) Provisional figure.
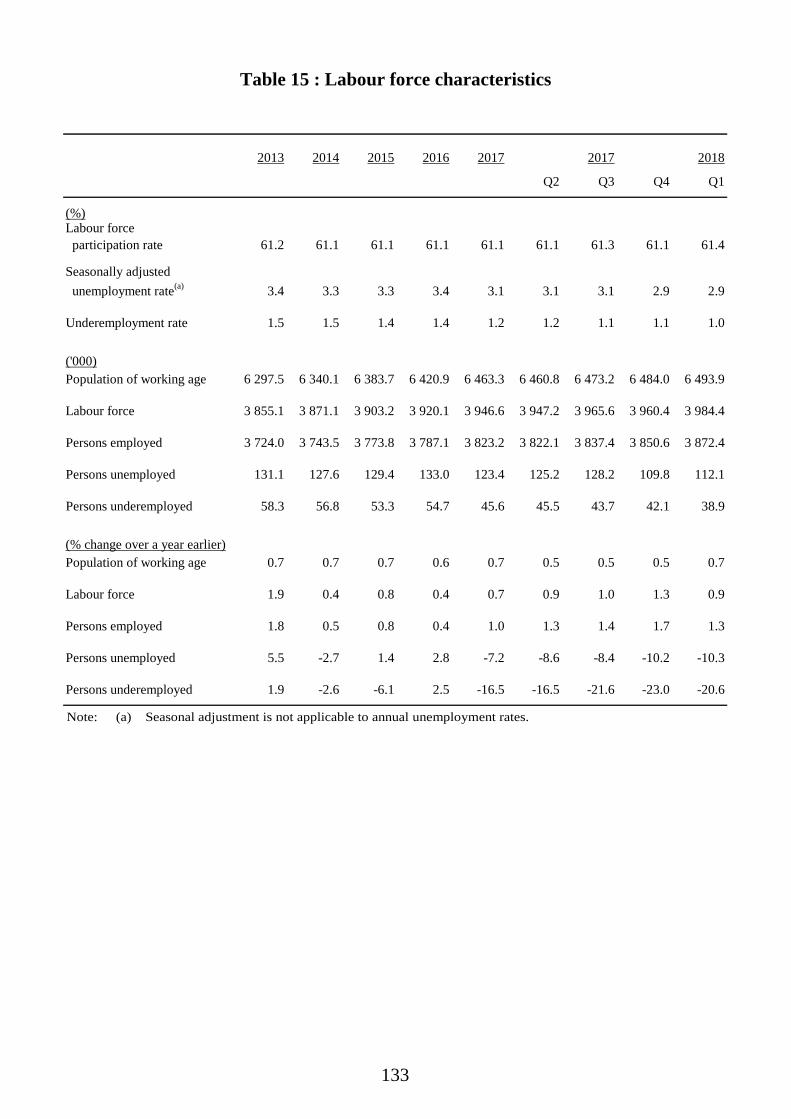
133
2013 2014 2015 2016 2017 2017 2018
Q2 Q3 Q4 Q1
(%)Labour force participation rate 61.2 61.1 61.1 61.1 61.1 61.1 61.3 61.1 61.4
Seasonally adjusted unemployment rate(a) 3.4 3.3 3.3 3.4 3.1 3.1 3.1 2.9 2.9
Underemployment rate 1.5 1.5 1.4 1.4 1.2 1.2 1.1 1.1 1.0
('000)Population of working age 6 297.5 6 340.1 6 383.7 6 420.9 6 463.3 6 460.8 6 473.2 6 484.0 6 493.9
Labour force 3 855.1 3 871.1 3 903.2 3 920.1 3 946.6 3 947.2 3 965.6 3 960.4 3 984.4
Persons employed 3 724.0 3 743.5 3 773.8 3 787.1 3 823.2 3 822.1 3 837.4 3 850.6 3 872.4
Persons unemployed 131.1 127.6 129.4 133.0 123.4 125.2 128.2 109.8 112.1
Persons underemployed 58.3 56.8 53.3 54.7 45.6 45.5 43.7 42.1 38.9
(% change over a year earlier)Population of working age 0.7 0.7 0.7 0.6 0.7 0.5 0.5 0.5 0.7
Labour force 1.9 0.4 0.8 0.4 0.7 0.9 1.0 1.3 0.9
Persons employed 1.8 0.5 0.8 0.4 1.0 1.3 1.4 1.7 1.3
Persons unemployed 5.5 -2.7 1.4 2.8 -7.2 -8.6 -8.4 -10.2 -10.3
Persons underemployed 1.9 -2.6 -6.1 2.5 -16.5 -16.5 -21.6 -23.0 -20.6
Table 15 : Labour force characteristics
Note: (a) Seasonal adjustment is not applicable to annual unemployment rates.

134
2013 2014 2015 2016 2017 2017Mar Jun Sep
Selected major industries (No.)
Manufacturing -3.0 -1.2 -2.8 -3.6 -3.3 -3.4 -2.8 -3.4 -3.6 91 442
Construction sites (covering manual workers only) 11.2 4.4 14.9 13.3 10.1 12.2 6.2 12.7 9.2 122 761
Import and export trade -0.2 0.1 -1.4 -0.7 -0.4 -0.3 -0.3 -0.5 -0.7 477 820
Wholesale -2.0 -0.3 -1.4 -0.8 -0.6 -1.0 -0.9 -0.3 -0.4 60 415
Retail 2.3 2.2 -0.5 -1.1 0.5 0.4 0.6 0.2 0.6 269 264
Food and beverage services 0.9 2.4 0.1 -0.2 0.3 0.3 0.2 0.4 0.1 243 621
Accommodation services(a) 5.0 3.2 -1.1 -2.1 0.3 -1.0 0.8 0.5 0.8 39 884
Transportation, storage, postal and courier services 2.0 2.7 1.6 0.5 0.2 -0.3 -0.1 0.5 0.8 180 251
Information and communications 5.1 2.7 1.1 0.7 0.9 1.5 1.4 0.9 -0.2 107 122
Financing and insurance 1.0 2.3 2.3 0.8 1.5 0.9 1.4 1.9 2.0 227 156
Real estate 1.6 0.6 1.7 -0.1 1.3 1.3 1.2 1.3 1.4 131 855
Professional and business services (excluding cleaning and similar services) 4.5 2.7 2.4 1.9 2.1 3.2 1.9 1.4 1.8 296 127
Cleaning and similar services 1.6 0.2 2.4 0.5 0.7 1.8 0.4 0.6 0.1 81 532
Education 2.8 4.4 3.9 2.3 1.6 1.5 2.0 1.4 1.6 201 488
Human health services 5.2 4.3 4.5 4.3 3.5 3.9 3.3 3.2 3.5 127 350
Residential care and social work services 0.5 0.6 2.8 3.0 1.0 0.3 0.6 1.4 1.5 63 462
Arts, entertainment, recreation and other services 1.6 5.9 0.9 -2.2 -0.6 -2.4 -0.6 -0.2 0.9 125 073
Civil service(b) 1.3 1.0 0.7 1.2 1.6 0.9 1.4 1.9 2.2 170 343
Others(c) 3.5 3.1 -1.0 0.8 2.1 3.3 3.7 1.1 0.2 11 277
Table 16 : Employment in selected major industries
(% change over a year earlier)Dec
(% change)
Notes: Starting from March 2009, the survey coverage has been expanded to include more economic activities in some of the industries due to the change in industrial classification based on the Hong Kong Standard Industrial Classification (HSIC) Version 2.0. The activities newly covered are in the industries of transportation, storage, postal and courier services; professional and business services; and arts, entertainment, recreation and other services. The series of employment statistics under the HSIC Version 2.0 has also been backcasted to March 2000.
(a) Accommodation services sector covers hotels, guesthouses, boarding houses and other establishments providing short-term accommodation.
(b) These figures cover only those employed on civil service terms of appointment. Judges, judicial officers, ICAC officers, locally engaged staff working in the Hong Kong Economic and Trade Offices outside Hong Kong, and other government employees such as non-civil service contract staff are not included.
(c) Include employment in mining and quarrying; and in electricity and gas supply, and waste management.

135
2013 2014 2015 2016 2017 2017Mar Jun Sep Dec
(Number)
Building sites
Private sector 41 308 44 024 50 372 60 243 65 985 65 559 63 176 66 764 68 442
Public sector(a) 9 860 11 212 15 470 16 030 21 660 21 141 20 189 22 388 22 921
Sub-total 51 168 55 236 65 842 76 273 87 645 86 700 83 365 89 152 91 363
Civil engineering sites
Private sector 1 322 1 414 1 609 1 386 979 1 110 904 892 1 010
Public sector(a) 26 813 26 145 27 652 30 141 30 050 29 832 28 556 31 422 30 388
Sub-total 28 135 27 559 29 261 31 526 31 029 30 942 29 460 32 314 31 398
Total 79 303 82 795 95 103 107 799 118 674 117 642 112 825 121 466 122 761
(% change over a year earlier)
Building sites
Private sector 9.6 6.6 14.4 19.6 9.5 14.9 6.1 9.3 8.2
Public sector(a) -6.8 13.7 38.0 3.6 35.1 32.6 34.2 47.8 27.5
Sub-total 6.0 8.0 19.2 15.8 14.9 18.7 11.7 16.9 12.5
Civil engineering sites
Private sector -6.2 7.0 13.8 -13.9 -29.3 -33.5 -31.4 -33.1 -17.3
Public sector(a) 24.0 -2.5 5.8 9.0 -0.3 -1.0 -5.7 3.9 1.6
Sub-total 22.2 -2.0 6.2 7.7 -1.6 -2.7 -6.7 2.3 0.8
Total 11.2 4.4 14.9 13.3 10.1 12.2 6.2 12.7 9.2
Table 17 : Number of manual workers engaged at building and construction sites
Notes: Individual figures may not add up exactly to the total due to rounding.
(a) Including the Mass Transit Railway Corporation Limited and the Airport Authority Hong Kong.

136
(%)
2013 2014 2015 2016 2017 2017
Selected industry sections Q1 Q2 Q3 Q4
(in nominal terms)Manufacturing 3.3 5.3 5.2 3.5 3.4 3.3 3.8 3.6 3.9Import/export and wholesale trade 3.3 2.8 3.7 2.3 2.9 2.2 3.0 3.3 3.3Retail trade 6.7 4.2 3.5 2.4 3.3 2.6 3.2 3.4 3.3Transportation, storage, postal and courier services 5.4 3.3 4.3 3.3 3.4 3.3 3.6 3.7 2.8Accommodation(a) and food service activities 6.7 5.2 5.8 5.1 4.7 3.9 5.3 5.6 4.1Information and communications 5.4 5.1 4.4 3.4 3.3 3.2 2.9 3.5 3.6Financial and insurance activities 4.6 6.3 4.0 2.7 3.0 2.5 3.5 3.2 2.8Real estate activities 5.9 4.7 5.1 4.2 4.3 4.2 4.7 4.2 4.3Professional and business services 7.1 6.9 5.8 5.1 4.2 4.1 4.1 4.3 4.5Social and personal services 3.6 1.6 6.7 2.5 3.1 4.6 3.6 -0.7 5.8All selected industry sections surveyed 5.4 4.3 4.6 3.7 3.7 3.5 3.8 3.3 4.2
(in real terms)Manufacturing -0.9 0.9 2.1 1.0 2.0 2.7 1.8 1.8 2.2Import/export and wholesale trade -1.0 -1.5 0.7 -0.1 1.4 1.6 1.0 1.5 1.7Retail trade 2.3 -0.1 0.5 * 1.8 2.1 1.2 1.6 1.7Transportation, storage, postal and courier services 1.0 -1.0 1.3 0.9 1.9 2.8 1.6 1.9 1.1Accommodation(a) and food service activities 2.3 0.8 2.7 2.6 3.2 3.3 3.3 3.7 2.4Information and communications 1.0 0.7 1.4 1.0 1.9 2.7 0.9 1.7 2.0Financial and insurance activities 0.4 1.9 0.7 0.3 1.6 2.0 1.4 1.4 1.1Real estate activities 1.4 0.2 2.0 1.7 2.8 3.6 2.7 2.3 2.7Professional and business services 2.6 2.3 2.8 2.6 2.7 3.5 2.1 2.5 2.8Social and personal services -0.8 -2.7 3.6 0.1 1.6 4.0 1.6 -2.5 4.1All selected industry sections surveyed 1.1 -0.1 1.5 1.3 2.3 2.9 1.7 1.5 2.6
Table 18 : Rates of change in indices of payroll per person engagedby selected industry section
Notes: The rates of change in real terms are compiled from the Real Indices of Payroll per Person Engaged. The Indices are derived by deflating the Nominal Indices of Payroll per Person Engaged by the 2014/15-based Composite CPI.
In addition to wages, which include all regular and guaranteed payments like basic pay and stipulated bonuses and allowances, payroll also covers overtime pay and other non-guaranteed or irregular bonuses and allowances, except severance pay and long service payment. Because of this difference, as well as the difference in industrial and occupational coverage, the movements in payroll per person engaged do not necessarily match closely with those in wage rates.
(a) Accommodation services sector covers hotels, guesthouses, boarding houses and other establishments providing short-term accommodation.
(*) Change within ±0.05%.
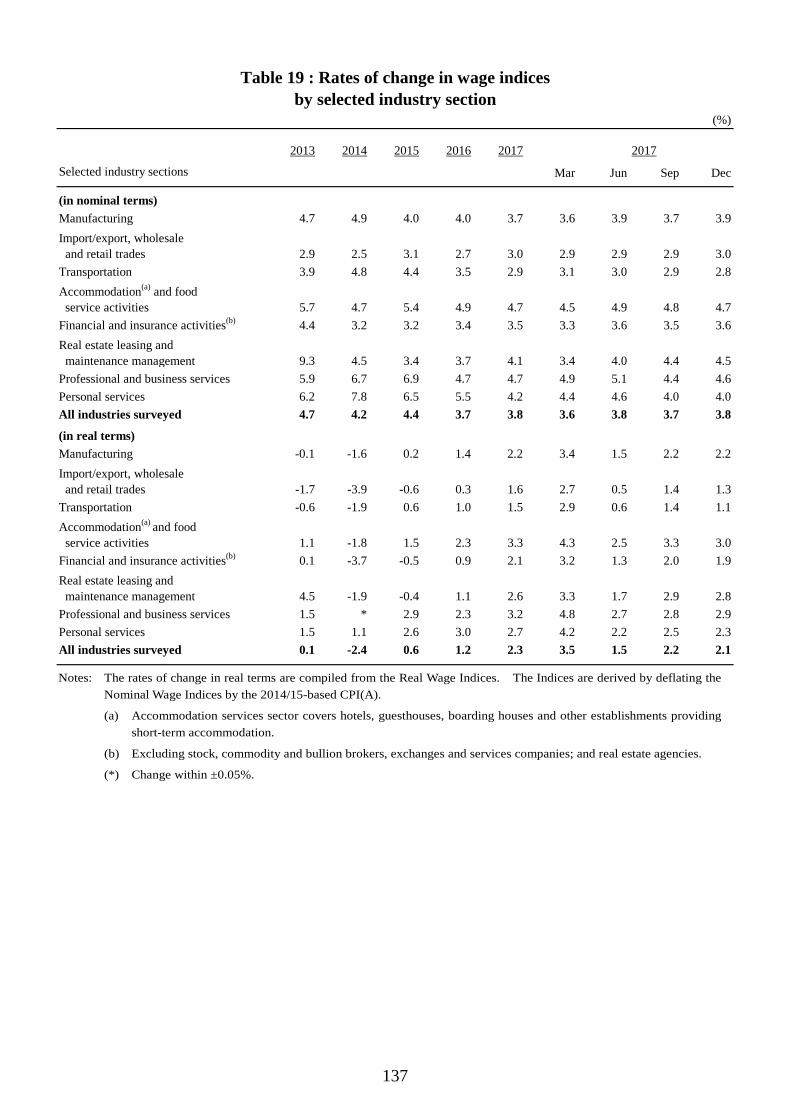
137
(%)
2013 2014 2015 2016 2017 2017
Mar Jun Sep Dec
(in nominal terms)Manufacturing 4.7 4.9 4.0 4.0 3.7 3.6 3.9 3.7 3.9Import/export, wholesale and retail trades 2.9 2.5 3.1 2.7 3.0 2.9 2.9 2.9 3.0Transportation 3.9 4.8 4.4 3.5 2.9 3.1 3.0 2.9 2.8Accommodation(a) and food service activities 5.7 4.7 5.4 4.9 4.7 4.5 4.9 4.8 4.7Financial and insurance activities(b) 4.4 3.2 3.2 3.4 3.5 3.3 3.6 3.5 3.6Real estate leasing and maintenance management 9.3 4.5 3.4 3.7 4.1 3.4 4.0 4.4 4.5Professional and business services 5.9 6.7 6.9 4.7 4.7 4.9 5.1 4.4 4.6Personal services 6.2 7.8 6.5 5.5 4.2 4.4 4.6 4.0 4.0All industries surveyed 4.7 4.2 4.4 3.7 3.8 3.6 3.8 3.7 3.8
(in real terms)Manufacturing -0.1 -1.6 0.2 1.4 2.2 3.4 1.5 2.2 2.2Import/export, wholesale and retail trades -1.7 -3.9 -0.6 0.3 1.6 2.7 0.5 1.4 1.3Transportation -0.6 -1.9 0.6 1.0 1.5 2.9 0.6 1.4 1.1Accommodation(a) and food service activities 1.1 -1.8 1.5 2.3 3.3 4.3 2.5 3.3 3.0Financial and insurance activities(b) 0.1 -3.7 -0.5 0.9 2.1 3.2 1.3 2.0 1.9Real estate leasing and maintenance management 4.5 -1.9 -0.4 1.1 2.6 3.3 1.7 2.9 2.8Professional and business services 1.5 * 2.9 2.3 3.2 4.8 2.7 2.8 2.9Personal services 1.5 1.1 2.6 3.0 2.7 4.2 2.2 2.5 2.3All industries surveyed 0.1 -2.4 0.6 1.2 2.3 3.5 1.5 2.2 2.1
Table 19 : Rates of change in wage indicesby selected industry section
Selected industry sections
Notes: The rates of change in real terms are compiled from the Real Wage Indices. The Indices are derived by deflating the Nominal Wage Indices by the 2014/15-based CPI(A).
(a) Accommodation services sector covers hotels, guesthouses, boarding houses and other establishments providing short-term accommodation.
(b) Excluding stock, commodity and bullion brokers, exchanges and services companies; and real estate agencies.
(*) Change within ±0.05%.
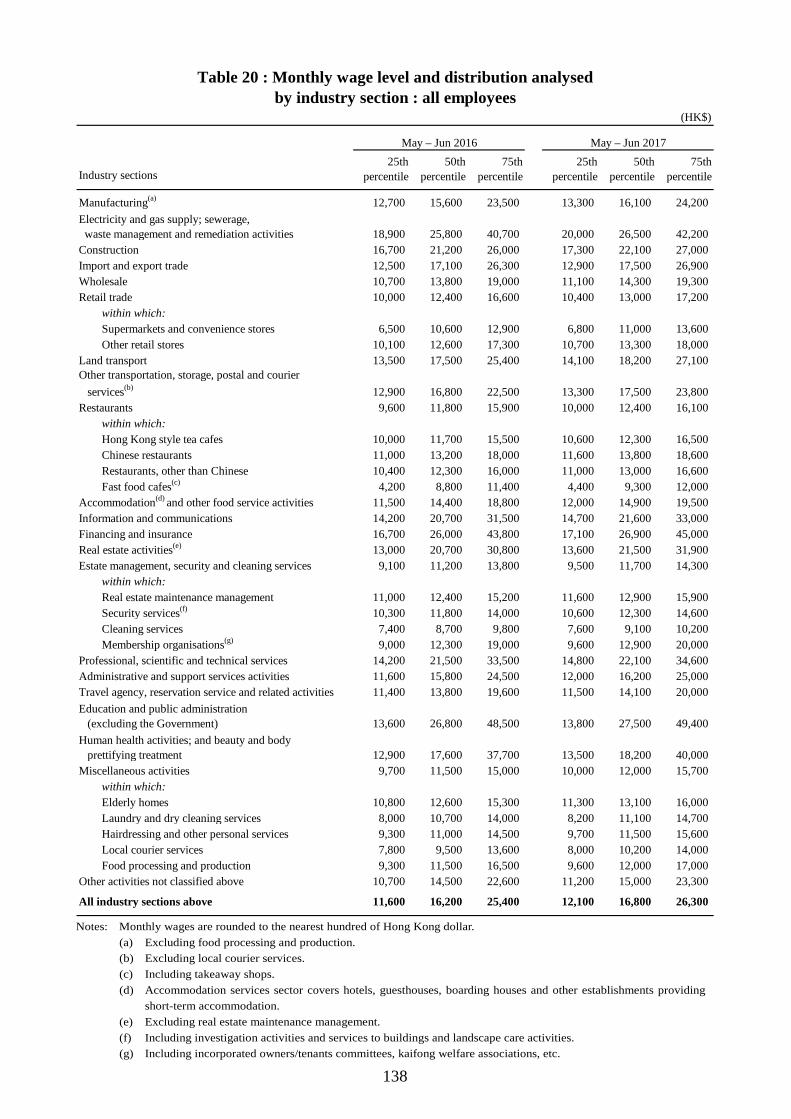
138
(HK$)
25thpercentile
50thpercentile
75thpercentile
25thpercentile
50thpercentile
75thpercentile
Manufacturing(a) 12,700 15,600 23,500 13,300 16,100 24,200Electricity and gas supply; sewerage, waste management and remediation activities 18,900 25,800 40,700 20,000 26,500 42,200Construction 16,700 21,200 26,000 17,300 22,100 27,000Import and export trade 12,500 17,100 26,300 12,900 17,500 26,900Wholesale 10,700 13,800 19,000 11,100 14,300 19,300Retail trade 10,000 12,400 16,600 10,400 13,000 17,200 within which: Supermarkets and convenience stores 6,500 10,600 12,900 6,800 11,000 13,600 Other retail stores 10,100 12,600 17,300 10,700 13,300 18,000Land transport 13,500 17,500 25,400 14,100 18,200 27,100Other transportation, storage, postal and courier services(b) 12,900 16,800 22,500 13,300 17,500 23,800Restaurants 9,600 11,800 15,900 10,000 12,400 16,100 within which: Hong Kong style tea cafes 10,000 11,700 15,500 10,600 12,300 16,500 Chinese restaurants 11,000 13,200 18,000 11,600 13,800 18,600 Restaurants, other than Chinese 10,400 12,300 16,000 11,000 13,000 16,600 Fast food cafes(c) 4,200 8,800 11,400 4,400 9,300 12,000Accommodation(d) and other food service activities 11,500 14,400 18,800 12,000 14,900 19,500Information and communications 14,200 20,700 31,500 14,700 21,600 33,000Financing and insurance 16,700 26,000 43,800 17,100 26,900 45,000Real estate activities(e) 13,000 20,700 30,800 13,600 21,500 31,900Estate management, security and cleaning services 9,100 11,200 13,800 9,500 11,700 14,300 within which: Real estate maintenance management 11,000 12,400 15,200 11,600 12,900 15,900 Security services(f) 10,300 11,800 14,000 10,600 12,300 14,600 Cleaning services 7,400 8,700 9,800 7,600 9,100 10,200 Membership organisations(g) 9,000 12,300 19,000 9,600 12,900 20,000Professional, scientific and technical services 14,200 21,500 33,500 14,800 22,100 34,600Administrative and support services activities 11,600 15,800 24,500 12,000 16,200 25,000Travel agency, reservation service and related activities 11,400 13,800 19,600 11,500 14,100 20,000Education and public administration (excluding the Government) 13,600 26,800 48,500 13,800 27,500 49,400Human health activities; and beauty and body prettifying treatment 12,900 17,600 37,700 13,500 18,200 40,000Miscellaneous activities 9,700 11,500 15,000 10,000 12,000 15,700 within which: Elderly homes 10,800 12,600 15,300 11,300 13,100 16,000 Laundry and dry cleaning services 8,000 10,700 14,000 8,200 11,100 14,700 Hairdressing and other personal services 9,300 11,000 14,500 9,700 11,500 15,600 Local courier services 7,800 9,500 13,600 8,000 10,200 14,000 Food processing and production 9,300 11,500 16,500 9,600 12,000 17,000Other activities not classified above 10,700 14,500 22,600 11,200 15,000 23,300
All industry sections above 11,600 16,200 25,400 12,100 16,800 26,300
Table 20 : Monthly wage level and distribution analysedby industry section : all employees
Industry sections
May – Jun 2016 May – Jun 2017
Notes: Monthly wages are rounded to the nearest hundred of Hong Kong dollar. (a) Excluding food processing and production. (b) Excluding local courier services. (c) Including takeaway shops. (d) Accommodation services sector covers hotels, guesthouses, boarding houses and other establishments providing
short-term accommodation. (e) Excluding real estate maintenance management. (f) Including investigation activities and services to buildings and landscape care activities. (g) Including incorporated owners/tenants committees, kaifong welfare associations, etc.
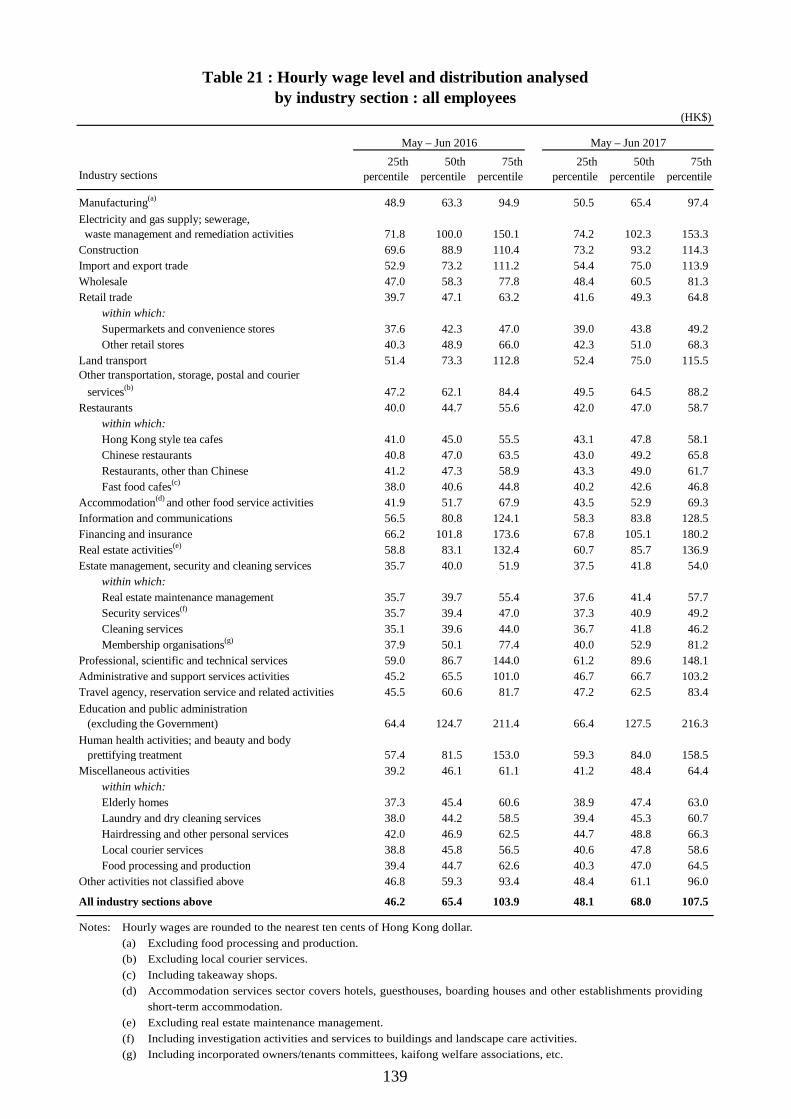
139
(HK$)
25thpercentile
50thpercentile
75thpercentile
25thpercentile
50thpercentile
75thpercentile
Manufacturing(a) 48.9 63.3 94.9 50.5 65.4 97.4Electricity and gas supply; sewerage, waste management and remediation activities 71.8 100.0 150.1 74.2 102.3 153.3Construction 69.6 88.9 110.4 73.2 93.2 114.3Import and export trade 52.9 73.2 111.2 54.4 75.0 113.9Wholesale 47.0 58.3 77.8 48.4 60.5 81.3Retail trade 39.7 47.1 63.2 41.6 49.3 64.8 within which: Supermarkets and convenience stores 37.6 42.3 47.0 39.0 43.8 49.2 Other retail stores 40.3 48.9 66.0 42.3 51.0 68.3Land transport 51.4 73.3 112.8 52.4 75.0 115.5Other transportation, storage, postal and courier services(b) 47.2 62.1 84.4 49.5 64.5 88.2Restaurants 40.0 44.7 55.6 42.0 47.0 58.7 within which: Hong Kong style tea cafes 41.0 45.0 55.5 43.1 47.8 58.1 Chinese restaurants 40.8 47.0 63.5 43.0 49.2 65.8 Restaurants, other than Chinese 41.2 47.3 58.9 43.3 49.0 61.7 Fast food cafes(c) 38.0 40.6 44.8 40.2 42.6 46.8Accommodation(d) and other food service activities 41.9 51.7 67.9 43.5 52.9 69.3Information and communications 56.5 80.8 124.1 58.3 83.8 128.5Financing and insurance 66.2 101.8 173.6 67.8 105.1 180.2Real estate activities(e) 58.8 83.1 132.4 60.7 85.7 136.9Estate management, security and cleaning services 35.7 40.0 51.9 37.5 41.8 54.0 within which: Real estate maintenance management 35.7 39.7 55.4 37.6 41.4 57.7 Security services(f) 35.7 39.4 47.0 37.3 40.9 49.2 Cleaning services 35.1 39.6 44.0 36.7 41.8 46.2 Membership organisations(g) 37.9 50.1 77.4 40.0 52.9 81.2Professional, scientific and technical services 59.0 86.7 144.0 61.2 89.6 148.1Administrative and support services activities 45.2 65.5 101.0 46.7 66.7 103.2Travel agency, reservation service and related activities 45.5 60.6 81.7 47.2 62.5 83.4Education and public administration (excluding the Government) 64.4 124.7 211.4 66.4 127.5 216.3Human health activities; and beauty and body prettifying treatment 57.4 81.5 153.0 59.3 84.0 158.5Miscellaneous activities 39.2 46.1 61.1 41.2 48.4 64.4 within which: Elderly homes 37.3 45.4 60.6 38.9 47.4 63.0 Laundry and dry cleaning services 38.0 44.2 58.5 39.4 45.3 60.7 Hairdressing and other personal services 42.0 46.9 62.5 44.7 48.8 66.3 Local courier services 38.8 45.8 56.5 40.6 47.8 58.6 Food processing and production 39.4 44.7 62.6 40.3 47.0 64.5Other activities not classified above 46.8 59.3 93.4 48.4 61.1 96.0
All industry sections above 46.2 65.4 103.9 48.1 68.0 107.5
Table 21 : Hourly wage level and distribution analysedby industry section : all employees
Industry sections
May – Jun 2016 May – Jun 2017
Notes: Hourly wages are rounded to the nearest ten cents of Hong Kong dollar. (a) Excluding food processing and production. (b) Excluding local courier services. (c) Including takeaway shops. (d) Accommodation services sector covers hotels, guesthouses, boarding houses and other establishments providing
short-term accommodation. (e) Excluding real estate maintenance management. (f) Including investigation activities and services to buildings and landscape care activities. (g) Including incorporated owners/tenants committees, kaifong welfare associations, etc.

140
(%)
2008 2009 2010 2011 2012 2013 2014 2015
GDP deflator 1.3 -0.4 0.3 3.9 3.5 1.8 2.9 3.6
Domestic demand deflator 2.6 -0.8 2.2 4.5 4.2 1.4 3.1 2.2
Consumer Price Indices(a) :Composite CPI 4.3 0.5 2.4 5.3 4.1 4.3 4.4 3.0CPI(A) 3.6 0.4 2.7 5.6 3.6 5.1 5.6 4.0CPI(B) 4.6 0.5 2.3 5.2 4.3 4.1 4.2 2.9CPI(C) 4.7 0.6 2.1 5.1 4.1 3.8 3.5 2.1
Unit Value Indices :Total exports of goods 3.8 1.1 4.7 8.0 3.4 1.3 2.0 0.1Imports of goods 4.4 -0.1 6.4 8.1 3.3 0.9 1.9 -0.4
Terms of Trade Index(b) -0.5 1.3 -1.7 -0.1 0.1 0.4 0.1 0.5
Producer Price Index for all manufacturing industries 5.6 -1.7 6.0 8.3 0.1 -3.1 -1.7 -2.7
Tender Price Indices :
Public sector building projects 41.9 -15.9 12.5 11.6 8.3 6.6 7.3 5.9Public housing projects 30.8 -6.8 6.7 10.1 6.4 9.3 8.0 12.5
Table 22 : Rates of change in prices
Notes: (a) The year-on-year rates of change before October 2015 were derived using the index series in the base periods at that time (for instance the 2009/10-based index series), compared with the index a year earlier in the same base period.
(b) Derived from merchandise trade index numbers.
(#) Figures are subject to revision later on as more data become available.
(*) Change within ±0.05%.
N.A. Not yet available.
(^) Average annual rate of change for the 10-year period 2006-2016.
(~) Average annual rate of change for the 5-year period 2011-2016.
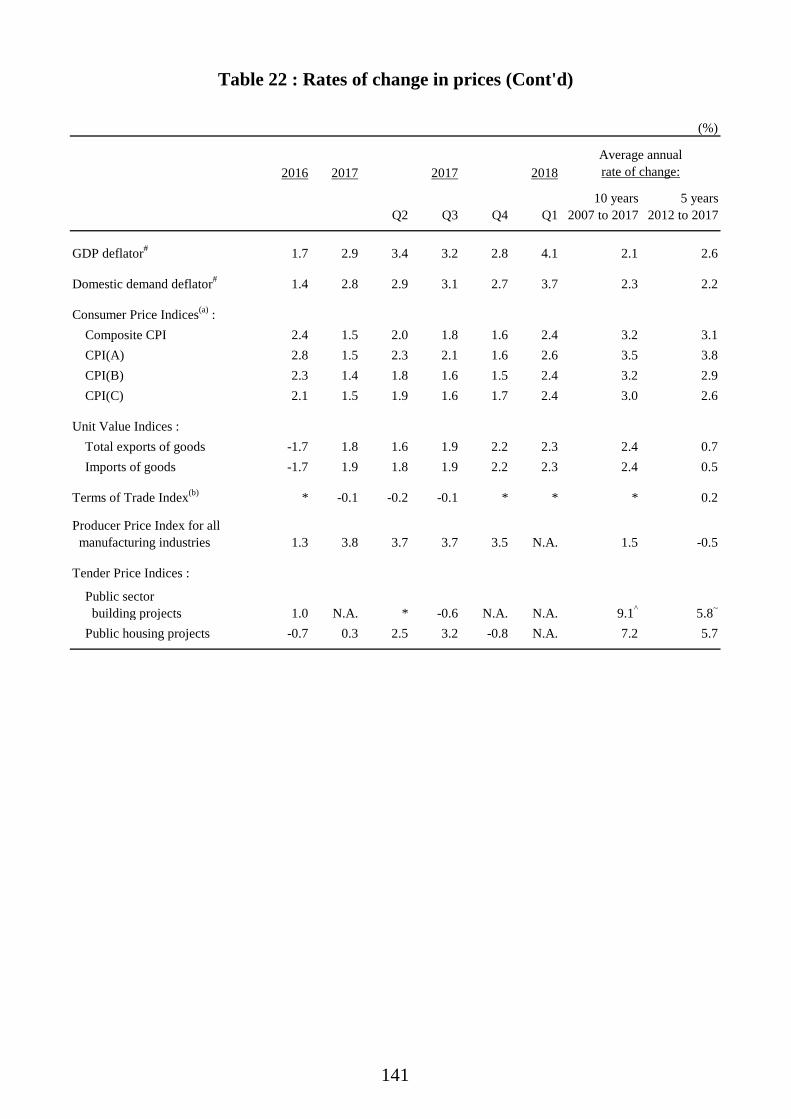
141
(%)
2016 2017 2017 2018
Q2 Q3 Q4 Q110 years
2007 to 20175 years
2012 to 2017
GDP deflator# 1.7 2.9 3.4 3.2 2.8 4.1 2.1 2.6
Domestic demand deflator# 1.4 2.8 2.9 3.1 2.7 3.7 2.3 2.2
Consumer Price Indices(a) :Composite CPI 2.4 1.5 2.0 1.8 1.6 2.4 3.2 3.1CPI(A) 2.8 1.5 2.3 2.1 1.6 2.6 3.5 3.8CPI(B) 2.3 1.4 1.8 1.6 1.5 2.4 3.2 2.9CPI(C) 2.1 1.5 1.9 1.6 1.7 2.4 3.0 2.6
Unit Value Indices :Total exports of goods -1.7 1.8 1.6 1.9 2.2 2.3 2.4 0.7Imports of goods -1.7 1.9 1.8 1.9 2.2 2.3 2.4 0.5
Terms of Trade Index(b) * -0.1 -0.2 -0.1 * * * 0.2
Producer Price Index for all manufacturing industries 1.3 3.8 3.7 3.7 3.5 N.A. 1.5 -0.5
Tender Price Indices :
Public sector building projects 1.0 N.A. * -0.6 N.A. N.A. 9.1^ 5.8~
Public housing projects -0.7 0.3 2.5 3.2 -0.8 N.A. 7.2 5.7
Average annualrate of change:
Table 22 : Rates of change in prices (Cont'd)
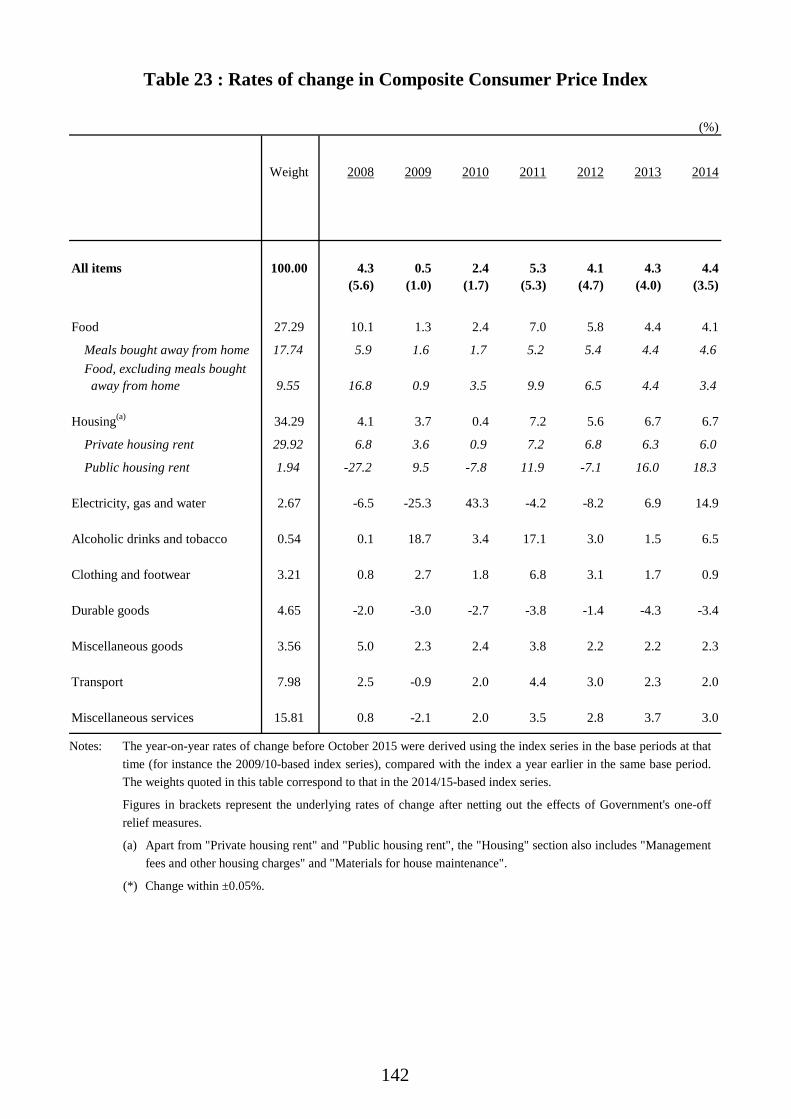
142
(%)
Weight 2008 2009 2010 2011 2012 2013 2014
All items 100.00 4.3 0.5 2.4 5.3 4.1 4.3 4.4(5.6) (1.0) (1.7) (5.3) (4.7) (4.0) (3.5)
Food 27.29 10.1 1.3 2.4 7.0 5.8 4.4 4.1
Meals bought away from home 17.74 5.9 1.6 1.7 5.2 5.4 4.4 4.6Food, excluding meals bought away from home 9.55 16.8 0.9 3.5 9.9 6.5 4.4 3.4
Housing(a) 34.29 4.1 3.7 0.4 7.2 5.6 6.7 6.7
Private housing rent 29.92 6.8 3.6 0.9 7.2 6.8 6.3 6.0
Public housing rent 1.94 -27.2 9.5 -7.8 11.9 -7.1 16.0 18.3
Electricity, gas and water 2.67 -6.5 -25.3 43.3 -4.2 -8.2 6.9 14.9
Alcoholic drinks and tobacco 0.54 0.1 18.7 3.4 17.1 3.0 1.5 6.5
Clothing and footwear 3.21 0.8 2.7 1.8 6.8 3.1 1.7 0.9
Durable goods 4.65 -2.0 -3.0 -2.7 -3.8 -1.4 -4.3 -3.4
Miscellaneous goods 3.56 5.0 2.3 2.4 3.8 2.2 2.2 2.3
Transport 7.98 2.5 -0.9 2.0 4.4 3.0 2.3 2.0
Miscellaneous services 15.81 0.8 -2.1 2.0 3.5 2.8 3.7 3.0
Table 23 : Rates of change in Composite Consumer Price Index
Notes: The year-on-year rates of change before October 2015 were derived using the index series in the base periods at that time (for instance the 2009/10-based index series), compared with the index a year earlier in the same base period. The weights quoted in this table correspond to that in the 2014/15-based index series.
Figures in brackets represent the underlying rates of change after netting out the effects of Government's one-off relief measures.
(a) Apart from "Private housing rent" and "Public housing rent", the "Housing" section also includes "Management fees and other housing charges" and "Materials for house maintenance".
(*) Change within ±0.05%.
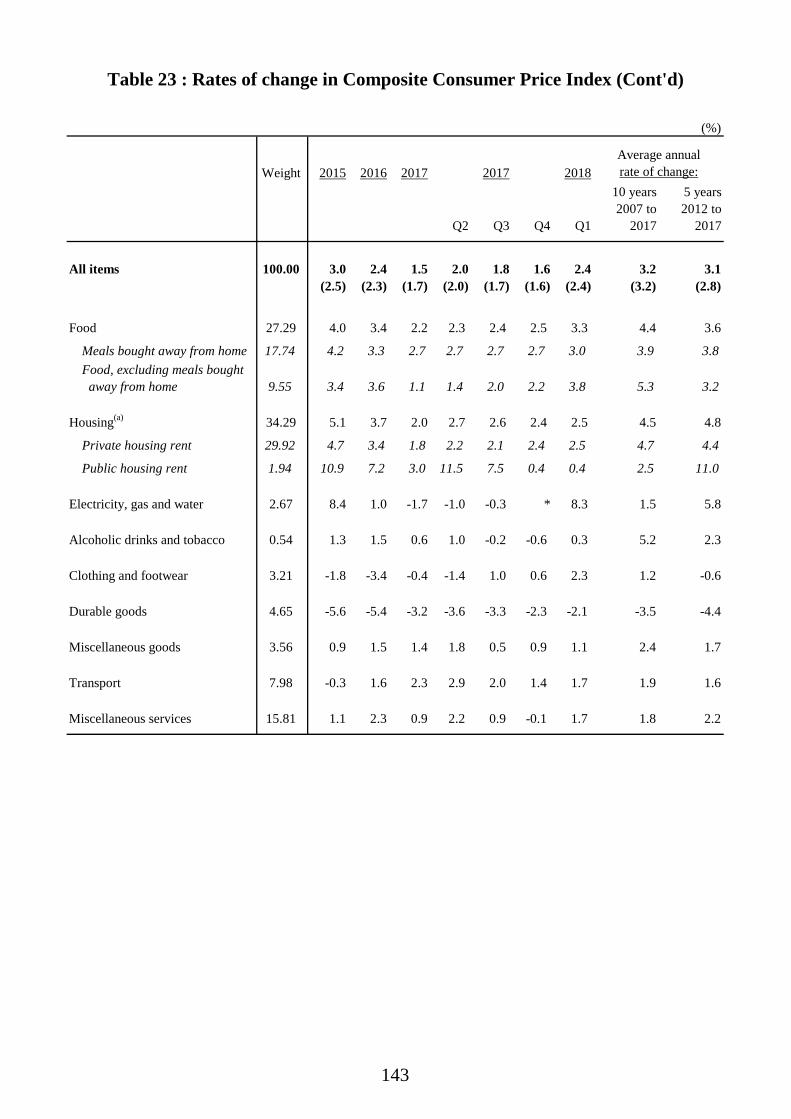
143
(%)
Weight 2015 2016 2017 2017 2018
Q2 Q3 Q4 Q1
10 years2007 to
2017
5 years2012 to
2017
All items 100.00 3.0 2.4 1.5 2.0 1.8 1.6 2.4 3.2 3.1(2.5) (2.3) (1.7) (2.0) (1.7) (1.6) (2.4) (3.2) (2.8)
Food 27.29 4.0 3.4 2.2 2.3 2.4 2.5 3.3 4.4 3.6
Meals bought away from home 17.74 4.2 3.3 2.7 2.7 2.7 2.7 3.0 3.9 3.8Food, excluding meals bought away from home 9.55 3.4 3.6 1.1 1.4 2.0 2.2 3.8 5.3 3.2
Housing(a) 34.29 5.1 3.7 2.0 2.7 2.6 2.4 2.5 4.5 4.8
Private housing rent 29.92 4.7 3.4 1.8 2.2 2.1 2.4 2.5 4.7 4.4
Public housing rent 1.94 10.9 7.2 3.0 11.5 7.5 0.4 0.4 2.5 11.0
Electricity, gas and water 2.67 8.4 1.0 -1.7 -1.0 -0.3 * 8.3 1.5 5.8
Alcoholic drinks and tobacco 0.54 1.3 1.5 0.6 1.0 -0.2 -0.6 0.3 5.2 2.3
Clothing and footwear 3.21 -1.8 -3.4 -0.4 -1.4 1.0 0.6 2.3 1.2 -0.6
Durable goods 4.65 -5.6 -5.4 -3.2 -3.6 -3.3 -2.3 -2.1 -3.5 -4.4
Miscellaneous goods 3.56 0.9 1.5 1.4 1.8 0.5 0.9 1.1 2.4 1.7
Transport 7.98 -0.3 1.6 2.3 2.9 2.0 1.4 1.7 1.9 1.6
Miscellaneous services 15.81 1.1 2.3 0.9 2.2 0.9 -0.1 1.7 1.8 2.2
Table 23 : Rates of change in Composite Consumer Price Index (Cont'd)
Average annualrate of change:
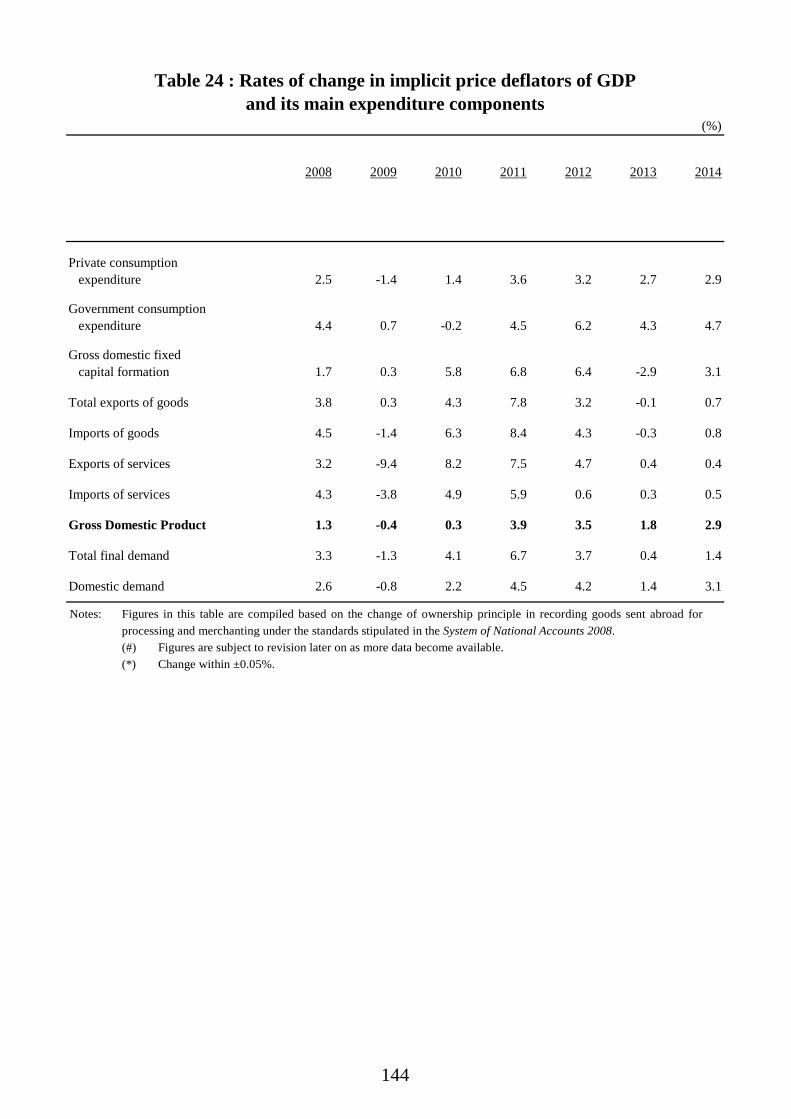
144
(%)
2008 2009 2010 2011 2012 2013 2014
Private consumption expenditure 2.5 -1.4 1.4 3.6 3.2 2.7 2.9
Government consumption expenditure 4.4 0.7 -0.2 4.5 6.2 4.3 4.7
Gross domestic fixed capital formation 1.7 0.3 5.8 6.8 6.4 -2.9 3.1
Total exports of goods 3.8 0.3 4.3 7.8 3.2 -0.1 0.7
Imports of goods 4.5 -1.4 6.3 8.4 4.3 -0.3 0.8
Exports of services 3.2 -9.4 8.2 7.5 4.7 0.4 0.4
Imports of services 4.3 -3.8 4.9 5.9 0.6 0.3 0.5
Gross Domestic Product 1.3 -0.4 0.3 3.9 3.5 1.8 2.9
Total final demand 3.3 -1.3 4.1 6.7 3.7 0.4 1.4
Domestic demand 2.6 -0.8 2.2 4.5 4.2 1.4 3.1
Table 24 : Rates of change in implicit price deflators of GDPand its main expenditure components
Notes: Figures in this table are compiled based on the change of ownership principle in recording goods sent abroad for processing and merchanting under the standards stipulated in the System of National Accounts 2008.
(#) Figures are subject to revision later on as more data become available. (*) Change within ±0.05%.

145
(%)
2015 2016# 2017# 2017 2018
Q2# Q3# Q4# Q1#
10 years2007 to
2017#
5 years2012 to
2017#
Private consumption expenditure 1.2 1.5 2.4 2.1 2.7 2.8 4.2 2.0 2.1
Government consumption expenditure 4.4 3.7 2.4 2.4 1.8 1.6 1.7 3.5 3.9
Gross domestic fixed capital formation 4.5 -0.1 4.8 6.1 4.8 3.2 2.7 3.0 1.8
Total exports of goods -0.7 -1.4 1.6 1.5 1.6 2.1 2.7 1.9 *
Imports of goods -1.4 -1.8 1.8 1.5 1.6 2.1 2.6 2.1 -0.2
Exports of services -2.8 -2.0 2.8 2.4 2.8 4.2 5.2 1.2 -0.3
Imports of services -4.6 -1.3 1.9 0.1 2.5 4.0 5.8 0.8 -0.7
Gross Domestic Product 3.6 1.7 2.9 3.4 3.2 2.8 4.1 2.1 2.6
Total final demand * -0.6 2.2 2.0 2.2 2.5 3.4 2.0 0.7
Domestic demand 2.2 1.4 2.8 2.9 3.1 2.7 3.7 2.3 2.2
Average annualrate of change:
Table 24 : Rates of change in implicit price deflators of GDPand its main expenditure components (Cont'd)