Dollar General Corporation Reports First Quarter 2022 Results
12
May 26, 2022 06:55 AM Eastern Daylight Time GOODLETTSVILLE, Tenn.--( BUSINESS WIRE)--Dollar General Corporation (NYSE: DG) today reported financial results for its fiscal year 2022 first quarter (13 weeks) ended April 29, 2022. Net Sales Increased 4.2% to $8.8 Billion Same-Store Sales Decreased 0.1% Operating Profit Decreased 17.9% to $746.2 Million Diluted Earnings Per Share (“EPS”) Decreased 14.5% to $2.41 Cash Flows From Operations of $449.5 Million Board of Directors Declares Quarterly Cash Dividend of $0.55 per share “We are pleased with our start to 2022, and I want to thank each of our team members for their ongoing commitment and dedication to serving our customers every day,” said Todd Vasos, Dollar General’s chief executive officer. “Despite ongoing headwinds due to supply chain pressures and heightened inflation, we remained focused on controlling what we can control and delivered solid financial results, which exceeded our expectations for sales and EPS for the quarter.” “During the first quarter, we executed more than 800 real estate projects, and made significant progress advancing our key strategic initiatives to enhance the value and convenience proposition for our customers. We continue to drive strategic innovation as we further differentiate Dollar General in the discount retail channel, while delivering long-term sustainable growth and value for our shareholders.” First Quarter 2022 Highlights Net sales increased 4.2% to $8.8 billion in the first quarter of 2022 compared to $8.4 billion in the first quarter of 2021. The net sales increase was primarily driven by positive sales contributions from new stores, partially offset by the slight decline in same-store sales and the impact of store closures. Same-store sales decreased 0.1% compared to the first quarter of 2021, driven by a decline in customer traffic, partially offset by an increase in average transaction amount. Same-store sales in the first quarter of 2022 declined in each of the seasonal, apparel, and home products categories, offset by an increase in the consumables category. Gross profit as a percentage of net sales was 31.3% in the first quarter of 2022 compared to 32.8% in the first quarter of 2021, a decrease of 151 basis points. This gross profit rate decrease was primarily attributable to a greater proportion of sales coming from the consumables category, which generally has a lower gross profit rate than other product categories; Dollar General Corporation Reports First Quarter 2022 Results Raises Sales Guidance for Fiscal Year 2022
-
Upload
khangminh22 -
Category
Documents
-
view
3 -
download
0
Transcript of Dollar General Corporation Reports First Quarter 2022 Results
May 26, 2022 06:55 AM Eastern Daylight Time
GOODLETTSVILLE, Tenn.--(BUSINESS WIRE)--Dollar General Corporation (NYSE: DG) today reported financial resultsfor its fiscal year 2022 first quarter (13 weeks) ended April 29, 2022.
Net Sales Increased 4.2% to $8.8 Billion
Same-Store Sales Decreased 0.1%
Operating Profit Decreased 17.9% to $746.2 Million
Diluted Earnings Per Share (“EPS”) Decreased 14.5% to $2.41
Cash Flows From Operations of $449.5 Million
Board of Directors Declares Quarterly Cash Dividend of $0.55 per share
“We are pleased with our start to 2022, and I want to thank each of our team members for their ongoing commitment anddedication to serving our customers every day,” said Todd Vasos, Dollar General’s chief executive officer. “Despite ongoingheadwinds due to supply chain pressures and heightened inflation, we remained focused on controlling what we cancontrol and delivered solid financial results, which exceeded our expectations for sales and EPS for the quarter.”
“During the first quarter, we executed more than 800 real estate projects, and made significant progress advancing our keystrategic initiatives to enhance the value and convenience proposition for our customers. We continue to drive strategicinnovation as we further differentiate Dollar General in the discount retail channel, while delivering long-term sustainablegrowth and value for our shareholders.”
First Quarter 2022 Highlights
Net sales increased 4.2% to $8.8 billion in the first quarter of 2022 compared to $8.4 billion in the first quarter of 2021. Thenet sales increase was primarily driven by positive sales contributions from new stores, partially offset by the slight declinein same-store sales and the impact of store closures. Same-store sales decreased 0.1% compared to the first quarter of2021, driven by a decline in customer traffic, partially offset by an increase in average transaction amount. Same-storesales in the first quarter of 2022 declined in each of the seasonal, apparel, and home products categories, offset by anincrease in the consumables category.
Gross profit as a percentage of net sales was 31.3% in the first quarter of 2022 compared to 32.8% in the first quarter of2021, a decrease of 151 basis points. This gross profit rate decrease was primarily attributable to a greater proportion ofsales coming from the consumables category, which generally has a lower gross profit rate than other product categories;
Dollar General Corporation Reports First Quarter 2022 Results
Raises Sales Guidance for Fiscal Year 2022
an increased LIFO provision, which was driven by higher product costs; increased transportation costs; an increase inmarkdowns as a percentage of sales; increased distribution costs; and an increase in inventory damages. These factorswere partially offset by higher inventory markups.
Selling, general and administrative expenses (“SG&A”) as a percentage of net sales were 22.8% in the first quarter of 2022compared to 22.0% in the first quarter of 2021, an increase of 78 basis points. The primary expenses that were a greaterpercentage of net sales in the current year period were retail labor, store occupancy costs, depreciation and amortizationand utilities; partially offset by reductions in incentive compensation and winter storm related disaster expenses.
Operating profit for the first quarter of 2022 decreased 17.9% to $746.2 million compared to $908.9 million in the firstquarter of 2021.
The effective income tax rate in the first quarter of 2022 was 21.8% compared to 22.0% in the first quarter of 2021. Thislower effective income tax rate was primarily due to a decrease in pre-tax earnings in the 2022 period compared to the2021 period while rate impacting items, such as the benefits from stock-based compensation and federal tax credits,remained materially the same in amount in both the 2022 and 2021 periods.
The Company reported net income of $552.7 million for the first quarter of 2022, a decrease of 18.5% compared to $677.7million in the first quarter of 2021. Diluted EPS decreased 14.5% to $2.41 for the first quarter of 2022 compared to dilutedEPS of $2.82 in the first quarter of 2021.
Merchandise Inventories
As of April 29, 2022, total merchandise inventories, at cost, were $6.1 billion compared to $5.1 billion as of April 30, 2021,an increase of 13.3% on a per-store basis. This increase primarily reflects the impact of product cost inflation and a greatermix of higher-value products.
Capital Expenditures
Total additions to property and equipment in first quarter of 2022 were $282 million, including approximately: $112 millionfor improvements, upgrades, remodels and relocations of existing stores; $107 million related to store facilities, primarilyfor leasehold improvements, fixtures and equipment in new stores; $47 million for distribution and transportation-relatedprojects; and $9 million for information systems upgrades and technology-related projects. During first quarter of 2022, theCompany opened 239 new stores, remodeled 532 stores, and relocated 32 stores.
Share Repurchases
In the first quarter of 2022, the Company repurchased $747 million of its common stock, or 3.4 million shares, at anaverage price of $220.13 per share, under its share repurchase program. The total remaining authorization for futurerepurchases was $1.4 billion at the end of the first quarter of 2022. Under the authorization, repurchases may be madefrom time to time in open market transactions, including pursuant to trading plans adopted in accordance with Rule 10b5-1of the Securities Exchange Act of 1934, as amended, or in privately negotiated transactions. The timing, manner andnumber of shares repurchased will depend on a variety of factors, including price, market conditions, compliance with thecovenants and restrictions under the Company’s debt agreements and other factors. The authorization has no expirationdate.
Dividend
On May 25, 2022, the Company’s Board of Directors declared a quarterly cash dividend of $0.55 per share on theCompany’s common stock, payable on or before July 19, 2022 to shareholders of record on July 5, 2022. While the Boardof Directors intends to continue regular cash dividends, the declaration and amount of future dividends are subject to thesole discretion of the Board and will depend upon, among other things, the Company’s results of operations, cashrequirements, financial condition, contractual restrictions, and other factors the Board may deem relevant in its solediscretion.
Fiscal Year 2022 Financial Guidance and Store Growth Outlook
Despite the ongoing uncertainties arising from product cost inflation and continued pressure in the supply chain, theCompany is updating its sales guidance, and reiterating the remainder of its financial guidance, for the 53-week fiscal yearending February 3, 2023 (“fiscal year 2022”) issued on March 17, 2022. The Company now expects the following:
Net sales growth of approximately 10.0% -10.5%, including an estimated benefit ofapproximately two percentage points from the 53 week; compared to its previousexpectation of approximately 10%, including an estimated benefit of approximately twopercentage points from the 53 week; and
Same-store sales growth of approximately 3.0% -3.5%; compared to its previousexpectation of 2.5%.
The Company continues to expect the following:
Diluted EPS growth in the range of approximately 12% to 14%, including an estimatedbenefit of approximately four percentage points from the 53 week;
This Diluted EPS guidance assumes an effective tax rate in the range of 22.5% to23.0%;
Share repurchases of approximately $2.75 billion; and
Capital expenditures, including those related to investments in the Company’s strategicinitiatives, in the range of $1.4 billion to $1.5 billion.
The Company is also reiterating its plans to execute 2,980 real estate projects in fiscal year 2022, including 1,110 newstore openings, 1,750 remodels, and 120 store relocations.
“We are pleased with our strong start to the year,” said John Garratt, Dollar General’s chief financial officer. “As a result ofour strong topline performance and current expectations for the remainder of the year, we are raising our net sales andsame-store sales guidance for fiscal 2022. Looking ahead, our plans include targeted investments to further enhance thein-store experience, while driving an even greater improvement in in-stock levels and customer service. We believe theseinvestments will position us well to build on our sales momentum as we move ahead.”
Conference Call Information
The Company will hold a conference call on May 26, 2022 at 9:00 a.m. CT/10:00 a.m. ET, hosted by Todd Vasos, chiefexecutive officer, Jeff Owen, chief operating officer, and John Garratt, chief financial officer. To participate via telephone,please call (877) 407-0890 at least 10 minutes before the conference call is scheduled to begin. The conference ID is13729427. There will also be a live webcast of the call available at https://investor.dollargeneral.com under “News &Events, Events & Presentations.” A replay of the conference call will be available through June 23, 2022, and will beaccessible via webcast replay or by calling (877) 660-6853. The conference ID for the telephonic replay is 13729427.
Forward-Looking Statements
This press release contains forward-looking information within the meaning of the federal securities laws, including thePrivate Securities Litigation Reform Act. Forward-looking statements include those regarding the Company’s outlook,strategy, initiatives, plans and intentions including, but not limited to, statements made within the quotation of Mr. Vasos,and in the sections entitled “Share Repurchases,” “Dividend,” and “Fiscal Year 2022 Financial Guidance and Store GrowthOutlook.” A reader can identify forward-looking statements because they are not limited to historical fact or they use wordssuch as “outlook,” “may,” “will,” “should,” “could,” “would,” “can,” “believe,” “anticipate,” “plan,” “project,” “expect,”“estimate,” “target,” “forecast,” “predict,” “position,” “assume,” “opportunities,” “intend,” “continue,” “future,” “beyond,”“ongoing,” “potential,” “long-term,” “guidance,” “goal,” “outcome,” “uncertainty,” “look to,” “move ahead,” “looking ahead,”“subject to,” “committed,” “confident,” “focus on,” or “likely to,” and similar expressions that concern the Company’s
rd
rd
rd
strategies, plans, initiatives, intentions or beliefs about future occurrences or results. These matters involve risks,uncertainties and other factors that may change at any time and may cause actual results to differ materially from thosewhich the Company expected. Many of these statements are derived from the Company’s operating budgets and forecastsas of the date of this release, which are based on many detailed assumptions that the Company believes are reasonable.However, it is very difficult to predict the effect of known factors on future results, and the Company cannot anticipate allfactors that could affect future results that may be important to an investor. All forward-looking information should beevaluated in the context of these risks, uncertainties and other factors. Important factors that could cause actual results todiffer materially from the expectations expressed in or implied by such forward-looking statements include, but are notlimited to:
risks related to the COVID-19 pandemic and associated governmental responses,including but not limited to, the effects on the Company’s supply chain, distributionnetwork, store and distribution center growth, store and distribution center closures,transportation and distribution costs, SG&A expenses, share repurchase activity, andcybersecurity risk profile, as well as the effects on domestic and foreign economies, theglobal supply chain, labor availability, and customers’ spending patterns;
economic factors, including but not limited to employment levels; inflation; pandemics;higher fuel, energy, healthcare and housing costs, interest rates, consumer debt levels,and tax rates; tax law changes that negatively affect credits and refunds; lack ofavailable credit; decreases in, or elimination of, government stimulus programs orsubsidies such as unemployment, food/nutrition assistance programs, and the Child TaxCredit; commodity rates; transportation, lease and insurance costs; wage rates(including the heightened possibility of increased federal, state and/or local minimumwage rates); foreign exchange rate fluctuations; measures or events that create barriersto or increase the costs of international trade (including increased import duties ortariffs); and changes in laws and regulations and their effect on, as applicable, customerspending and disposable income, the Company’s ability to execute its strategies andinitiatives, the Company’s cost of goods sold, the Company’s SG&A expenses (includingreal estate costs), and the Company’s sales and profitability;
failure to achieve or sustain the Company’s strategies and initiatives, including thoserelating to merchandising, real estate and new store development, internationalexpansion, store formats and concepts, digital, marketing, health services, shrink,sourcing, private brand, inventory management, supply chain, store operations, expensereduction, technology, pOpshelf, DG Fresh initiative, Fast Track, and DG Media Network;
competitive pressures and changes in the competitive environment and the geographicand product markets where the Company operates, including, but not limited to, pricing,promotional activity, expanded availability of mobile, web-based and other digitaltechnologies, and alliances or other business combinations;
failure to timely and cost-effectively execute the Company’s real estate projects or toanticipate or successfully address the challenges imposed by the Company’s expansion,including into new countries or domestic markets, states, or urban or suburban areas;
levels of inventory shrinkage;
failure to successfully manage inventory balances;

failure to maintain the security of the Company’s business, customer, employee orvendor information or to comply with privacy laws, or the Company or one of its vendorsfalling victim to a cyberattack (which risk is heightened as a result of the current conflictbetween Russia and Ukraine) that prevents the Company from operating all or a portionof its business;
damage or interruption to the Company’s information systems as a result of externalfactors, staffing shortages or challenges in maintaining or updating the Company’sexisting technology or developing or implementing new technology;
a significant disruption to the Company’s distribution network, the capacity of theCompany’s distribution centers or the timely receipt of inventory, or delays inconstructing, opening or staffing new distribution centers;
risks and challenges associated with sourcing merchandise from suppliers, including, butnot limited to, those related to international trade (for example, disruptive political eventslike the current conflict between Russia and Ukraine);
natural disasters, unusual weather conditions (whether or not caused by climatechange), pandemic outbreaks or other health crises, political or civil unrest, acts of war,violence or terrorism, and disruptive global political events (for example, the currentconflict between Russia and Ukraine);
product liability, product recall or other product safety or labeling claims;
incurrence of material uninsured losses, excessive insurance costs or accident costs;
failure to attract, develop and retain qualified employees while controlling labor costs(including the heightened possibility of increased federal, state and/or local minimumwage rates/salary levels) and other labor issues;
loss of key personnel or inability to hire additional qualified personnel;
risks associated with the Company’s private brands, including, but not limited to, theCompany’s level of success in improving their gross profit rate;
seasonality of the Company’s business;
failure to protect the Company’s reputation;
the impact of changes in or noncompliance with governmental regulations andrequirements (including, but not limited to, those dealing with the sale of products,including without limitation, product and food safety, marketing or labeling; informationsecurity and privacy; labor and employment; employee wages and benefits (includingthe heightened possibility of increased federal, state and/or local minimum wagerates/salary levels); health and safety; imports and customs; bribery; climate change;and environmental compliance, as well as tax laws (including those related to thefederal, state or foreign corporate tax rate), the interpretation of existing tax laws, or theCompany’s failure to sustain its reporting positions negatively affecting the Company’stax rate) and developments in or outcomes of private actions, class actions, multi-districtlitigation, arbitrations, derivative actions, administrative proceedings, regulatory actionsor other litigation or of inquiries from federal, state and local agencies, regulatory
authorities, attorneys general, committees, subcommittees and members of the U.S.Congress, and other local, state, federal and international governmental authorities;
new accounting guidance or changes in the interpretation or application of existingguidance;
deterioration in market conditions, including market disruptions, limited liquidity andinterest rate fluctuations, or changes in the Company’s credit profile;
the factors disclosed under “Risk Factors” in the Company’s most recent Annual Reporton Form 10-K and any subsequently filed Quarterly Reports on Form 10-Q; and
such other factors as may be discussed or identified in this press release.
All forward-looking statements are qualified in their entirety by these and other cautionary statements that the Companymakes from time to time in its SEC filings and public communications. The Company cannot assure the reader that it willrealize the results or developments the Company anticipates or, even if substantially realized, that they will result in theconsequences or affect the Company or its operations in the way the Company expects. Forward-looking statementsspeak only as of the date made. The Company undertakes no obligation, and specifically disclaims any duty, to update orrevise any forward-looking statements as a result of new information, future events or circumstances, or otherwise, exceptas otherwise required by law. As a result of these risks and uncertainties, readers are cautioned not to place unduereliance on any forward-looking statements included herein or that may be made elsewhere from time to time by, or onbehalf of, the Company.
Investors should also be aware that while the Company does, from time to time, communicate with securities analysts andothers, it is against the Company’s policy to disclose to them any material, nonpublic information or other confidentialcommercial information. Accordingly, shareholders should not assume that the Company agrees with any statement orreport issued by any securities analyst regardless of the content of the statement or report. Furthermore, the Company hasa policy against confirming projections, forecasts or opinions issued by others. Thus, to the extent that reports issued bysecurities analysts contain any projections, forecasts or opinions, such reports are not the Company’s responsibility.
About Dollar General Corporation
Dollar General Corporation has been delivering value to shoppers for more than 80 years. Dollar General helps shoppersSave time. Save money. Every day.® by offering products that are frequently used and replenished, such as food, snacks,health and beauty aids, cleaning supplies, basic apparel, housewares and seasonal items at everyday low prices inconvenient neighborhood locations. Dollar General operated 18,356 stores in 47 states as of April 29, 2022. In addition tohigh-quality private brands, Dollar General sells products from America's most-trusted manufacturers such as Clorox,Energizer, Procter & Gamble, Hanes, Coca-Cola, Mars, Unilever, Nestle, Kimberly-Clark, Kellogg's, General Mills, andPepsiCo. Learn more about Dollar General at www.dollargeneral.com.
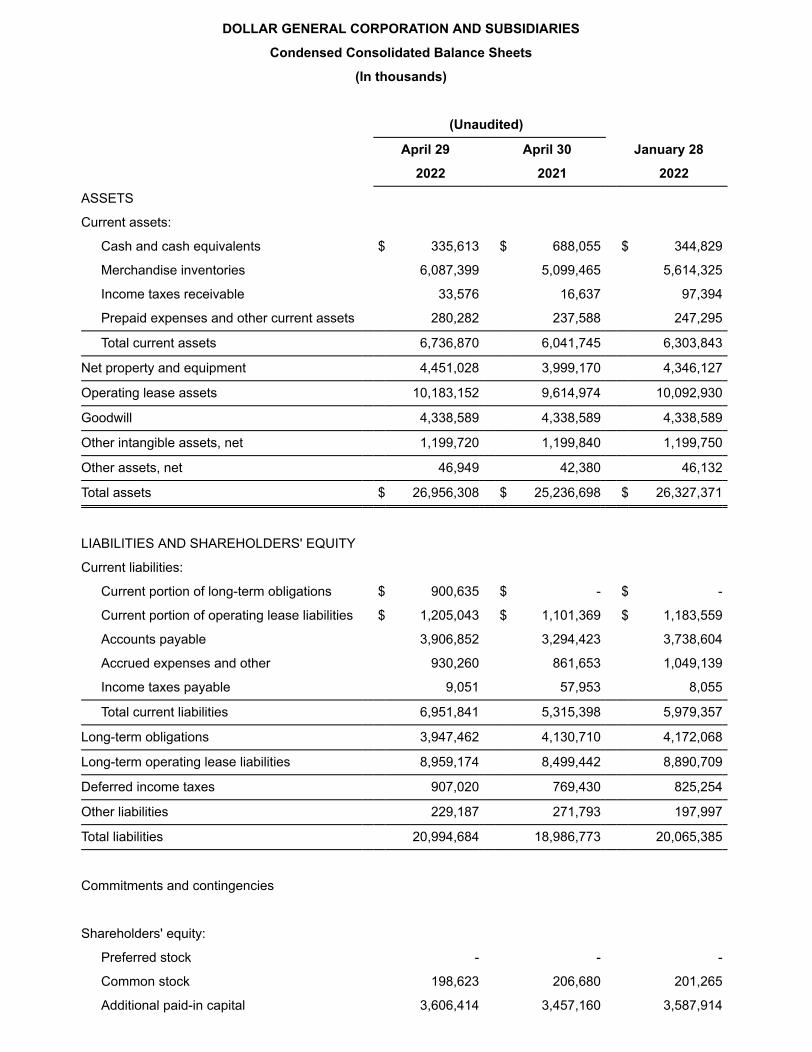
DOLLAR GENERAL CORPORATION AND SUBSIDIARIES
Condensed Consolidated Balance Sheets
(In thousands)
(Unaudited)
April 29 April 30 January 28
2022 2021 2022
ASSETS
Current assets:
Cash and cash equivalents $ 335,613 $ 688,055 $ 344,829
Merchandise inventories 6,087,399 5,099,465 5,614,325
Income taxes receivable 33,576 16,637 97,394
Prepaid expenses and other current assets 280,282 237,588 247,295
Total current assets 6,736,870 6,041,745 6,303,843
Net property and equipment 4,451,028 3,999,170 4,346,127
Operating lease assets 10,183,152 9,614,974 10,092,930
Goodwill 4,338,589 4,338,589 4,338,589
Other intangible assets, net 1,199,720 1,199,840 1,199,750
Other assets, net 46,949 42,380 46,132
Total assets $ 26,956,308 $ 25,236,698 $ 26,327,371
LIABILITIES AND SHAREHOLDERS' EQUITY
Current liabilities:
Current portion of long-term obligations $ 900,635 $ - $ -
Current portion of operating lease liabilities $ 1,205,043 $ 1,101,369 $ 1,183,559
Accounts payable 3,906,852 3,294,423 3,738,604
Accrued expenses and other 930,260 861,653 1,049,139
Income taxes payable 9,051 57,953 8,055
Total current liabilities 6,951,841 5,315,398 5,979,357
Long-term obligations 3,947,462 4,130,710 4,172,068
Long-term operating lease liabilities 8,959,174 8,499,442 8,890,709
Deferred income taxes 907,020 769,430 825,254
Other liabilities 229,187 271,793 197,997
Total liabilities 20,994,684 18,986,773 20,065,385
Commitments and contingencies
Shareholders' equity:
Preferred stock - - -
Common stock 198,623 206,680 201,265
Additional paid-in capital 3,606,414 3,457,160 3,587,914
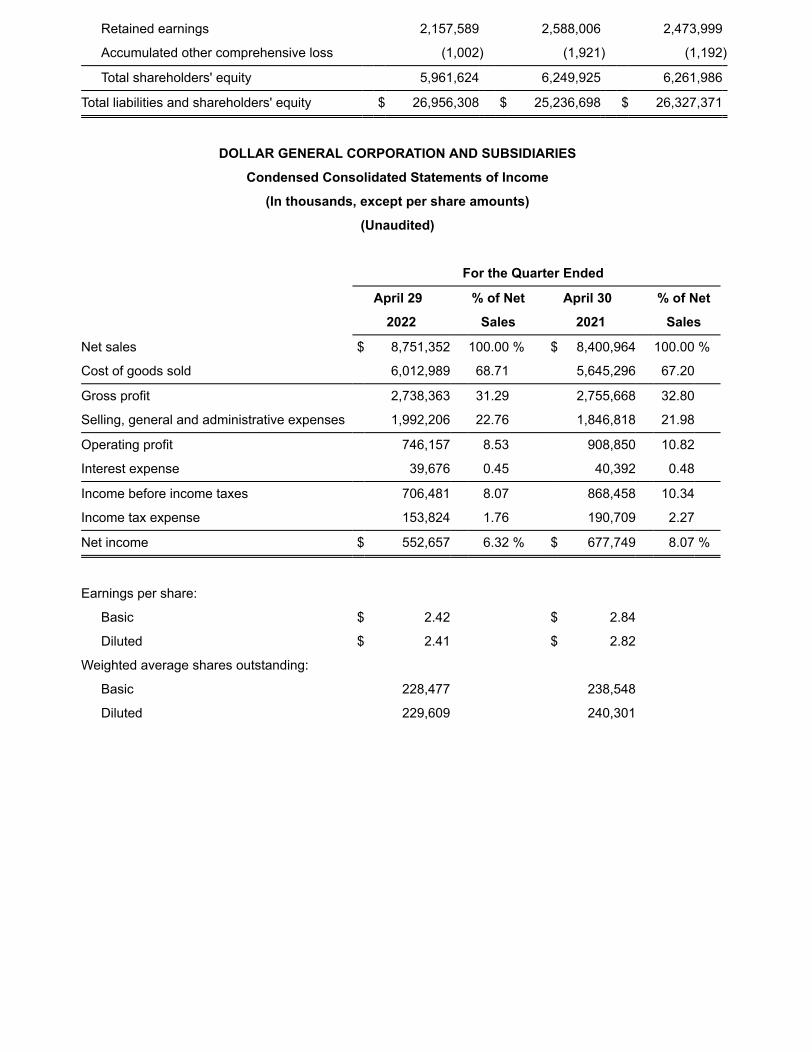
Retained earnings 2,157,589 2,588,006 2,473,999
Accumulated other comprehensive loss (1,002) (1,921) (1,192)
Total shareholders' equity 5,961,624 6,249,925 6,261,986
Total liabilities and shareholders' equity $ 26,956,308 $ 25,236,698 $ 26,327,371
DOLLAR GENERAL CORPORATION AND SUBSIDIARIES
Condensed Consolidated Statements of Income
(In thousands, except per share amounts)
(Unaudited)
For the Quarter Ended
April 29 % of Net April 30 % of Net
2022 Sales 2021 Sales
Net sales $ 8,751,352 100.00 % $ 8,400,964 100.00 %
Cost of goods sold 6,012,989 68.71 5,645,296 67.20
Gross profit 2,738,363 31.29 2,755,668 32.80
Selling, general and administrative expenses 1,992,206 22.76 1,846,818 21.98
Operating profit 746,157 8.53 908,850 10.82
Interest expense 39,676 0.45 40,392 0.48
Income before income taxes 706,481 8.07 868,458 10.34
Income tax expense 153,824 1.76 190,709 2.27
Net income $ 552,657 6.32 % $ 677,749 8.07 %
Earnings per share:
Basic $ 2.42 $ 2.84
Diluted $ 2.41 $ 2.82
Weighted average shares outstanding:
Basic 228,477 238,548
Diluted 229,609 240,301
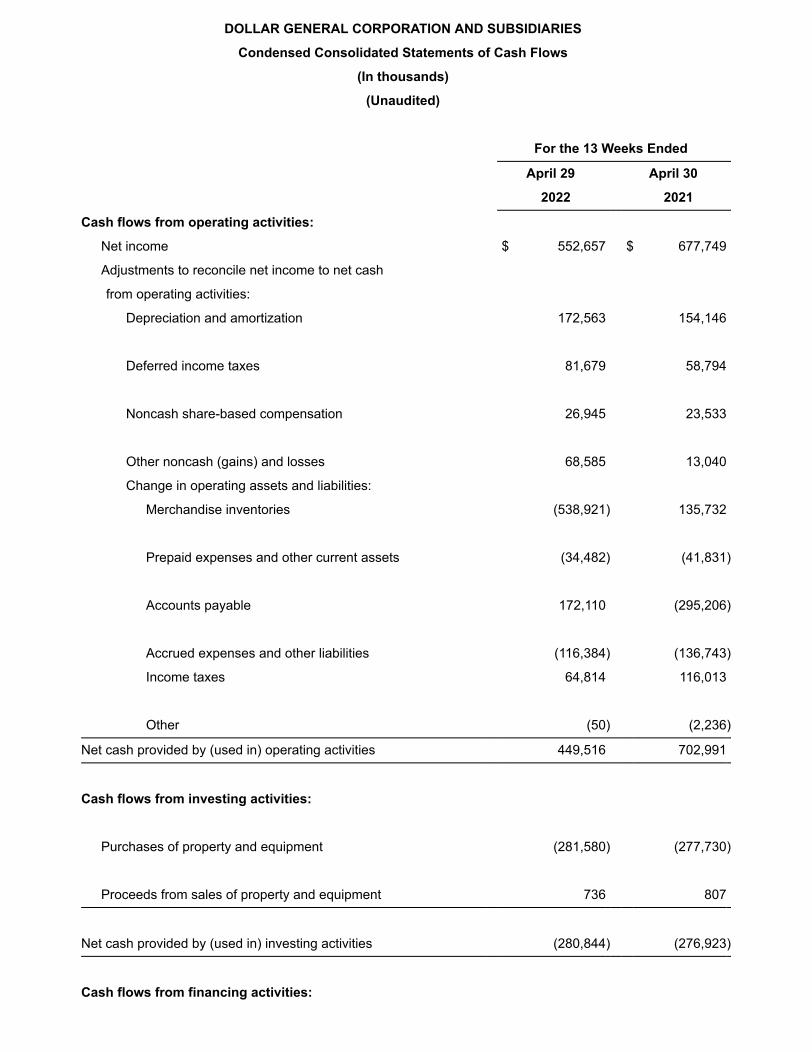
DOLLAR GENERAL CORPORATION AND SUBSIDIARIES
Condensed Consolidated Statements of Cash Flows
(In thousands)
(Unaudited)
For the 13 Weeks Ended
April 29 April 30
2022 2021
Cash flows from operating activities:
Net income $ 552,657 $ 677,749
Adjustments to reconcile net income to net cash
from operating activities:
Depreciation and amortization 172,563 154,146
Deferred income taxes 81,679
58,794
Noncash share-based compensation 26,945
23,533
Other noncash (gains) and losses 68,585
13,040
Change in operating assets and liabilities:
Merchandise inventories (538,921) 135,732
Prepaid expenses and other current assets
(34,482)
(41,831)
Accounts payable 172,110
(295,206)
Accrued expenses and other liabilities (116,384)
(136,743)
Income taxes 64,814 116,013
Other
(50)
(2,236)
Net cash provided by (used in) operating activities 449,516 702,991
Cash flows from investing activities:
Purchases of property and equipment (281,580)
(277,730)
Proceeds from sales of property and equipment
736
807
Net cash provided by (used in) investing activities (280,844)
(276,923)
Cash flows from financing activities:
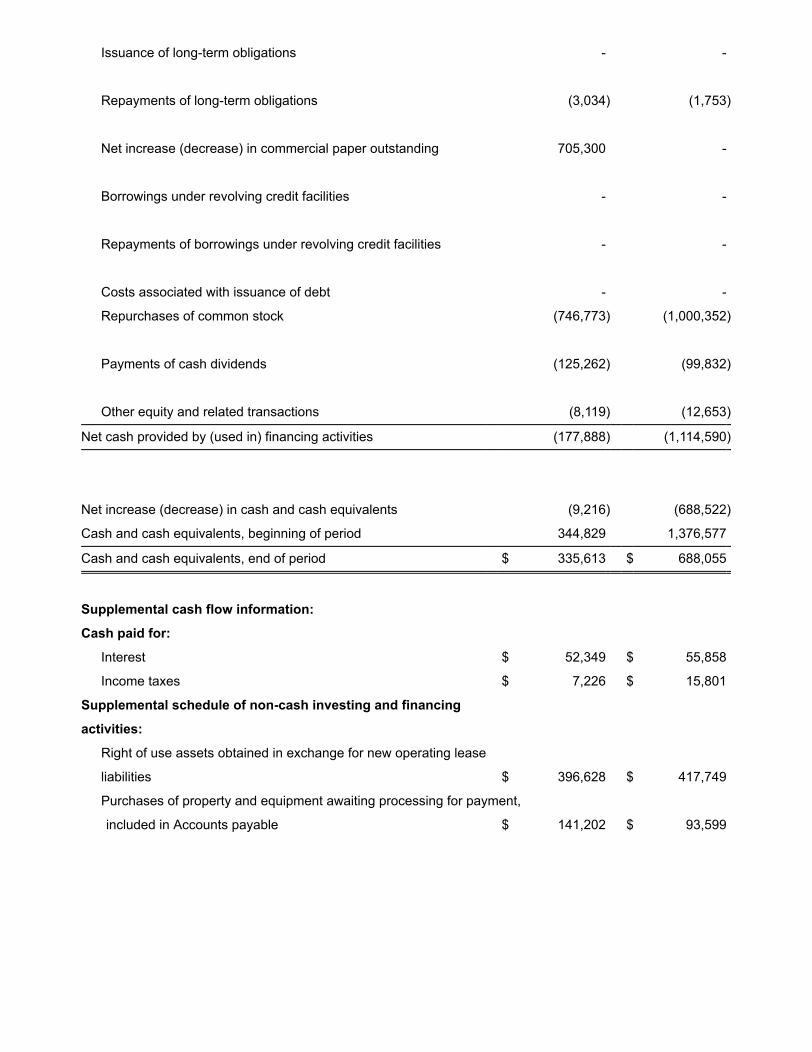
Issuance of long-term obligations
-
-
Repayments of long-term obligations
(3,034)
(1,753)
Net increase (decrease) in commercial paper outstanding 705,300
-
Borrowings under revolving credit facilities
-
-
Repayments of borrowings under revolving credit facilities
-
-
Costs associated with issuance of debt
-
-
Repurchases of common stock (746,773) (1,000,352)
Payments of cash dividends (125,262)
(99,832)
Other equity and related transactions (8,119)
(12,653)
Net cash provided by (used in) financing activities (177,888) (1,114,590)
Net increase (decrease) in cash and cash equivalents
(9,216)
(688,522)
Cash and cash equivalents, beginning of period 344,829 1,376,577
Cash and cash equivalents, end of period $ 335,613 $ 688,055
Supplemental cash flow information:
Cash paid for:
Interest $ 52,349 $ 55,858
Income taxes $ 7,226 $ 15,801
Supplemental schedule of non-cash investing and financing
activities:
Right of use assets obtained in exchange for new operating lease
liabilities $ 396,628 $ 417,749
Purchases of property and equipment awaiting processing for payment,
included in Accounts payable $ 141,202 $ 93,599
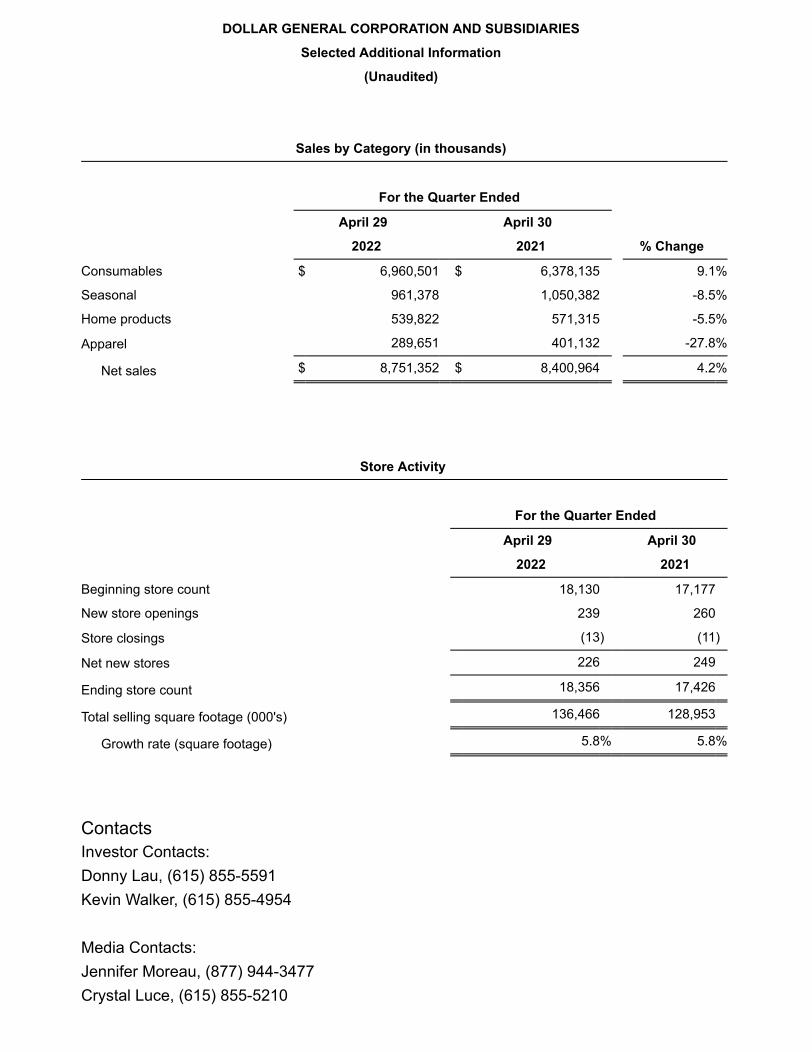
DOLLAR GENERAL CORPORATION AND SUBSIDIARIES
Selected Additional Information
(Unaudited)
Sales by Category (in thousands)
For the Quarter Ended
April 29 April 30
2022 2021 % Change
Consumables $ 6,960,501 $ 6,378,135 9.1%
Seasonal 961,378 1,050,382 -8.5%
Home products 539,822 571,315 -5.5%
Apparel 289,651 401,132 -27.8%
Net sales $ 8,751,352 $ 8,400,964 4.2%
Store Activity
For the Quarter Ended
April 29 April 30
2022 2021
Beginning store count 18,130 17,177
New store openings 239 260
Store closings (13) (11)
Net new stores 226 249
Ending store count 18,356 17,426
Total selling square footage (000's) 136,466 128,953
Growth rate (square footage) 5.8% 5.8%
ContactsInvestor Contacts: Donny Lau, (615) 855-5591 Kevin Walker, (615) 855-4954
Media Contacts: Jennifer Moreau, (877) 944-3477 Crystal Luce, (615) 855-5210