Module 1 - 4th QUARTER - ZNNHS
16
Republic of the Philippines Department of Education Regional Office IX, Zamboanga Peninsula Zest for Progress Zeal of Partnership 10 4 th QUARTER – Module 1: MEASURES OF POSITION Name of Learner: ___________________________ Grade & Section: ___________________________ Name of School: ___________________________
-
Upload
khangminh22 -
Category
Documents
-
view
3 -
download
0
Transcript of Module 1 - 4th QUARTER - ZNNHS
Republic of the Philippines
Department of Education Regional Office IX, Zamboanga Peninsula
Zest for Progress
Zeal of Partnership
10
4th QUARTER – Module 1: MEASURES OF POSITION
Name of Learner: ___________________________
Grade & Section: ___________________________
Name of School: ___________________________
1
Mathematics – Grade 10 Alternative Delivery Mode Quarter 4 - Module 1: Measures of Position First Edition, 2020
Republic Act 8293, section 176 states that: No copyright shall subsist in any work of
the Government of the Philippines. However, prior approval of the government agency or
office wherein the work is created shall be necessary for exploitation of such work for profit.
Such agency or office may, among other things, impose as a condition the payment of royalty.
Borrowed materials (i.e., songs, stories, poems, pictures, photos, brand names,
trademarks, etc.) included in this module are owned by their respective copyright holders.
Every effort has been exerted to locate and seek permission to use these materials from their
respective copyright owners. The publisher and authors do not represent nor claim ownership
over them.
Published by the Department of Education Secretary: Leonor Magtolis Briones Undersecretary: Diosdado M. San Antonio
Printed in the Philippines
Department of Education – Region IX, Zamboanga Peninsula
Office Address: Tiguma, Airport Road, Pagadian City
Telefax: (062) – 215 – 3751; 991 – 5975
E-mail Address: [email protected]
Development Team of the Module
Writer: Mildred P. Caceres
Editors: Rosemary B. Garcia
Elizabeth M. Raciles, Ed.D.
Illustrator: Mildred P. Caceres
Layout Artist: Zandro G. Sepe, M.S.
Reviewers: EPS, Mathematics Vilma A. Brown, Ed.D.
Principal Zandro G. Sepe, M.S.
Management Team: SDS Roy C. Tuballa, EMD, JD, CESO VI
ASDS Jay S. Montealto, CESO VI
ASDS Norma T. Francisco, Ed.D.,CESE
EPS Mathematics Vilma A. Brown, Ed.D.
EPS LRMS Aida F. Coyme, Ed.D.
2
Introductory Message
This Self – Learning Module (SLM) is prepared so that you, our dear learners, can continue
your studies and learn while at home. Activities, questions, directions, exercises, and
discussions are carefully stated for you to understand each lesson.
Each SLM is composed of different parts. Each part shall guide you step-by-step as you
discover and understand the lesson prepared for you.
Pre-tests are provided to measure your prior knowledge on lessons in each SLM. This will tell
you if you can proceed on completing this module or if you need to ask your facilitator or your
teacher’s assistance for better understanding of the lesson. At the end of each module, you
need to answer the post-test to self-check your learning. Answer keys are provided for each
activity and test. We trust that you will be honest in using these.
In addition to the material in the main text, notes to the Teacher are also provided to our
facilitators and parents for strategies and reminders on how they can best help you on your
home-based learning.
Please use this module with care. Do not put unnecessary marks on any part of this SLM. Use
a separate sheet of paper in answering the exercises and tests. Read the instructions carefully
before performing each task.
If you have any questions in using this SLM or any difficulty in answering the tasks in this
module, do not hesitate to consult your teacher or facilitator.
Thank you.
Can you still recall your lessons in Grades 7 and 8 about the measures of
central tendency? If so, were you able to apply this concept in understanding the
characteristics of the grouped and ungrouped data? For instance, in your academic
performance; what grade do you need to have for a certain subject for you to qualify
in the honors list? Or what score do you need to have in your last exam for you to have
higher grade than your classmate? What does it mean to you?
The study of measures of position is significant in the field of economics,
statistics and research, as well as in our day-to-day activities.
With the learned concepts on measures of central tendency, this module will
take you in another way of describing data through the different measures of position:
Quartiles, Deciles and Percentiles. Measures of position allow us to determine where
a certain value or data fall which may be below, average (median) or above a given
set of data or distribution for grouped and ungrouped data.
What I Need to Know
3
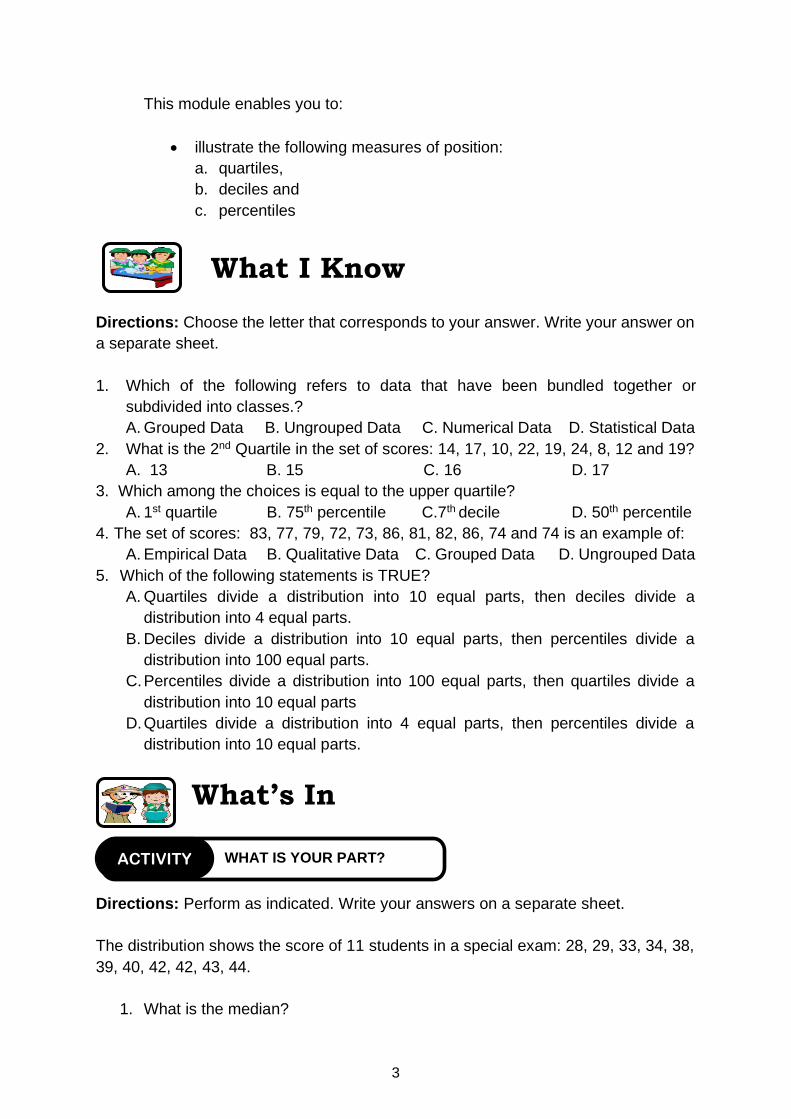
This module enables you to:
• illustrate the following measures of position:
a. quartiles,
b. deciles and
c. percentiles
What I Know
Directions: Choose the letter that corresponds to your answer. Write your answer on
a separate sheet.
1. Which of the following refers to data that have been bundled together or
subdivided into classes.?
A. Grouped Data B. Ungrouped Data C. Numerical Data D. Statistical Data
2. What is the 2nd Quartile in the set of scores: 14, 17, 10, 22, 19, 24, 8, 12 and 19?
A. 13 B. 15 C. 16 D. 17
3. Which among the choices is equal to the upper quartile?
A. 1st quartile B. 75th percentile C.7th decile D. 50th percentile
4. The set of scores: 83, 77, 79, 72, 73, 86, 81, 82, 86, 74 and 74 is an example of:
A. Empirical Data B. Qualitative Data C. Grouped Data D. Ungrouped Data
5. Which of the following statements is TRUE?
A. Quartiles divide a distribution into 10 equal parts, then deciles divide a
distribution into 4 equal parts.
B. Deciles divide a distribution into 10 equal parts, then percentiles divide a
distribution into 100 equal parts.
C. Percentiles divide a distribution into 100 equal parts, then quartiles divide a
distribution into 10 equal parts
D. Quartiles divide a distribution into 4 equal parts, then percentiles divide a
distribution into 10 equal parts.
What’s In
Directions: Perform as indicated. Write your answers on a separate sheet.
The distribution shows the score of 11 students in a special exam: 28, 29, 33, 34, 38,
39, 40, 42, 42, 43, 44.
1. What is the median?
WHAT IS YOUR PART? ACTIVITY

4
__ __ __ __ __ __ __
2. How many scores above the median? below the median?
3. If the distribution is divided into 4 parts, in what part is 33?
a. How many scores above 33?
b. How many scores below 33?
4. Which part would 33 fall, if the distribution is divided into 10 equal parts? 100
equal parts?
5. How does the number of partitions affect the position of the scores?
What’s New
Directions: Form the correct word from the set of letters below the pictures. Write
your answer on a separate sheet.
What is another way of describing a set of data?
ANSWER: ____________ of ___________
What is It
LESSON 1
Measures of Position:
Quartiles, Deciles and Percentiles
R S I O I
T O N E P
M E E R S
C A T U L
4PICs1Word ACTIVITY
__ __ __ __ __ __ __ __
5
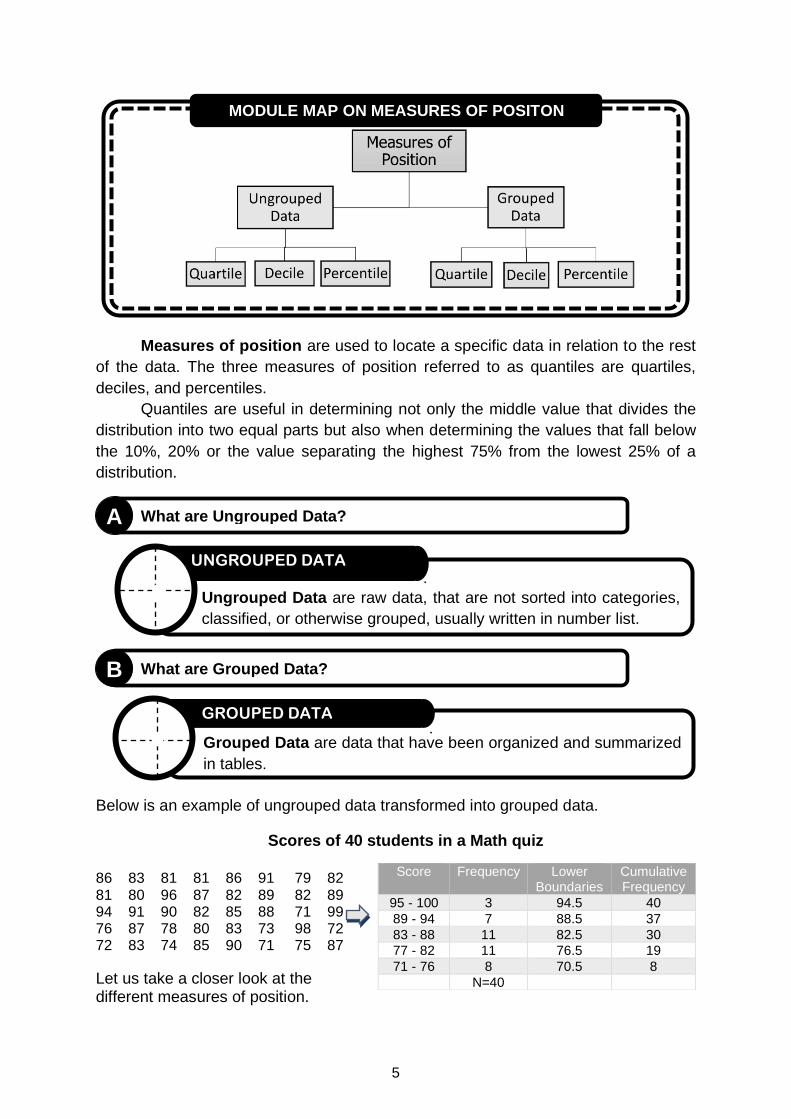
Measures of position are used to locate a specific data in relation to the rest
of the data. The three measures of position referred to as quantiles are quartiles,
deciles, and percentiles.
Quantiles are useful in determining not only the middle value that divides the
distribution into two equal parts but also when determining the values that fall below
the 10%, 20% or the value separating the highest 75% from the lowest 25% of a
distribution.
Below is an example of ungrouped data transformed into grouped data.
86 83 81 81 86 91 79 82 81 80 96 87 82 89 82 89 94 91 90 82 85 88 71 99 76 87 78 80 83 73 98 72 72 83 74 85 90 71 75 87
Let us take a closer look at the different measures of position.
Score Frequency Lower Boundaries
Cumulative Frequency
95 - 100 3 94.5 40
89 - 94 7 88.5 37
83 - 88 11 82.5 30
77 - 82 11 76.5 19
71 - 76 8 70.5 8
N=40
MODULE MAP ON MEASURES OF POSITON
Scores of 40 students in a Math quiz
.
GROUPED DATA
Grouped Data are data that have been organized and summarized
in tables.
.
UNGROUPED DATA
Ungrouped Data are raw data, that are not sorted into categories,
classified, or otherwise grouped, usually written in number list.
What are Ungrouped Data?
A
What are Grouped Data?
B
6
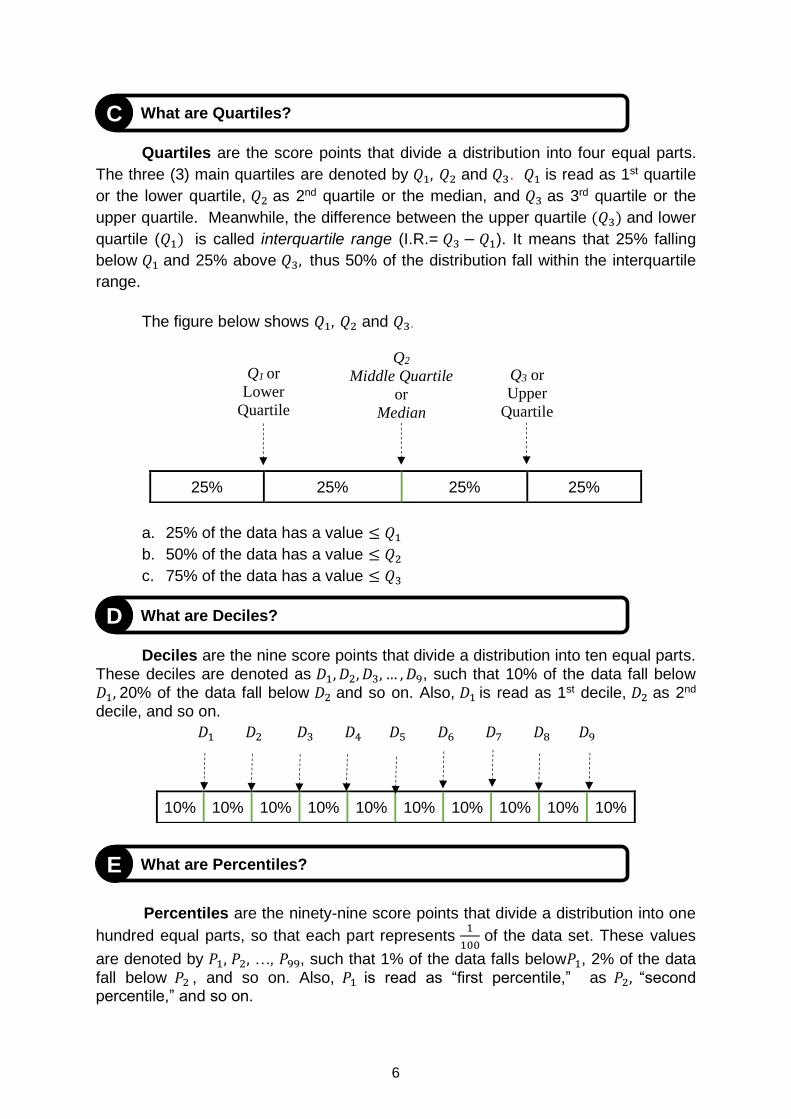
Quartiles are the score points that divide a distribution into four equal parts.
The three (3) main quartiles are denoted by 𝑄1, 𝑄2 and 𝑄3. 𝑄1 is read as 1st quartile
or the lower quartile, 𝑄2 as 2nd quartile or the median, and 𝑄3 as 3rd quartile or the
upper quartile. Meanwhile, the difference between the upper quartile (𝑄3) and lower
quartile (𝑄1) is called interquartile range (I.R.= 𝑄3 − 𝑄1). It means that 25% falling
below 𝑄1 and 25% above 𝑄3, thus 50% of the distribution fall within the interquartile
range.
The figure below shows 𝑄1, 𝑄2 and 𝑄3.
a. 25% of the data has a value ≤ 𝑄1
b. 50% of the data has a value ≤ 𝑄2
c. 75% of the data has a value ≤ 𝑄3
Deciles are the nine score points that divide a distribution into ten equal parts. These deciles are denoted as 𝐷1, 𝐷2, 𝐷3, … , 𝐷9, such that 10% of the data fall below 𝐷1, 20% of the data fall below 𝐷2 and so on. Also, 𝐷1 is read as 1st decile, 𝐷2 as 2nd decile, and so on.
Percentiles are the ninety-nine score points that divide a distribution into one
hundred equal parts, so that each part represents 1
100 of the data set. These values
are denoted by 𝑃1, 𝑃2, …, 𝑃99, such that 1% of the data falls below𝑃1, 2% of the data fall below 𝑃2 , and so on. Also, 𝑃1 is read as “first percentile,” as 𝑃2, “second percentile,” and so on.
25% 25% 25% 25%
𝐷1 𝐷2 𝐷3 𝐷4 𝐷5 𝐷6 𝐷7 𝐷8 𝐷9
10% 10% 10% 10% 10% 10% 10% 10% 10% 10%
What are Quartiles?
C
What are Deciles?
D
What are Percentiles?
E
Q2
Middle Quartile
or
Median
Q1 or
Lower
Quartile
Q3 or
Upper
Quartile

7
The relationships among percentile, decile, and quartile are presented below.
The 1th quartile (𝑄1) is the same as the 25th percentile (𝑃25) and the 2nd quartile
(𝑄2) is the same as the 50th percentile (𝑃50).
This means that 25% of the data is less than or equal to 𝑄1 or 𝑃25; 50% of the
data is less than or equal to 𝑄2 or 𝑃50, and 75% of the data is less than or equal to 𝑄3
or 𝑃75.
The 1th decile (𝐷1) is the same as the 10th percentile (𝑃10) and the 2nd decile
(𝐷2) is the same as the 20th percentile (𝑃20). This means that 10% of the data is less
than or equal to 𝐷1 or 𝑃10, 20% of the data is less than or equal to 𝐷2 or 𝑃20, 30% of
the data is less than or equal to 𝐷3 or 𝑃30, and so on.
EXAMPLE 1: Given a set of scores of 15 students in their English Quiz: 15, 2, 8, 3, 11, 8, 8, 6,
9, 5, 7, 5, 12, 11 and 14. Find the lower quartile (𝑄1) or the 25th percentile (𝑃25), upper quartile (𝑄3) or the 75th percentile (𝑃75) , and 5th decile (𝐷5) or the 50th percentile (𝑃50) or the 2nd Quartile (𝑄2) of the data.
Solution:
Scores are sorted in ascending order:
2, 3, 5, 5, 6, 7, 8, 8, 8, 9, 11, 11, 12, 14, 15
Notice, the least value in the data is 2 and the greatest value in the data is 15
• The middle value in the data is 8,
which is the 2nd Quartile (𝑄2) or 5th
decile (𝐷5) or the 50th percentile
(𝑃50).
2, 3, 5, 5, 6, 7, 8, 8, 8, 9, 11, 11, 12, 14, 15
• The lower quartile is the value that
is between the median and the
least value in the data set. So, the
25% 25% 25% 25%
𝑄1 𝑄2 𝑄3
𝑃25 𝑃50 𝑃75
𝑃10 𝑃20 𝑃30 𝑃40 𝑃50 𝑃60 𝑃70 𝑃80 𝑃90
𝐷1 𝐷2 𝐷3 𝐷4 𝐷5 𝐷6 𝐷7 𝐷8 𝐷9
10% 10% 10% 10% 10% 10% 10% 10% 10% 10%
Median
𝑄1
𝑃25
𝑄3
𝑃75
8
Guide questions: a. What is your observation about the quartile in ungrouped data? decile?
percentile? b. How is median related to (𝑄2) 𝐷5 and 𝑃50? c. What is the equivalent of 𝐷1 to percentile? 𝑃90 to decile? d. What if you have a large set of data? How do we find the median?
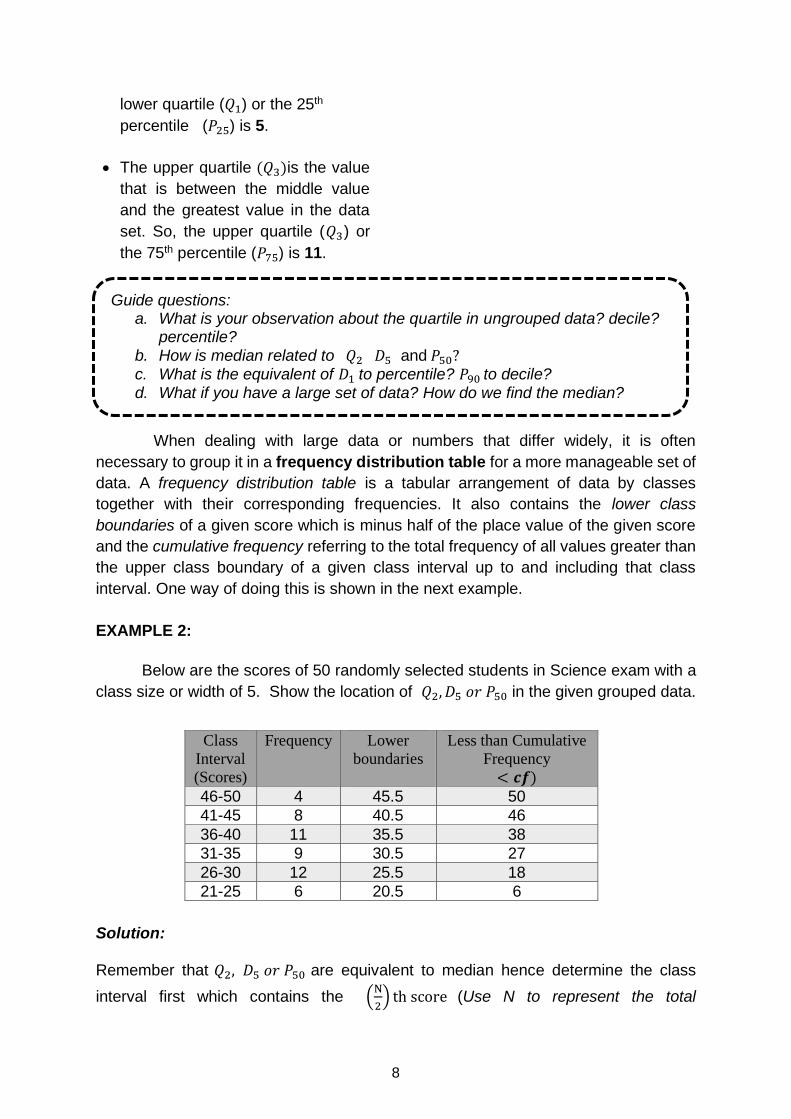
lower quartile (𝑄1) or the 25th
percentile (𝑃25) is 5.
• The upper quartile (𝑄3)is the value
that is between the middle value
and the greatest value in the data
set. So, the upper quartile (𝑄3) or
the 75th percentile (𝑃75) is 11.
When dealing with large data or numbers that differ widely, it is often
necessary to group it in a frequency distribution table for a more manageable set of
data. A frequency distribution table is a tabular arrangement of data by classes
together with their corresponding frequencies. It also contains the lower class
boundaries of a given score which is minus half of the place value of the given score
and the cumulative frequency referring to the total frequency of all values greater than
the upper class boundary of a given class interval up to and including that class
interval. One way of doing this is shown in the next example.
EXAMPLE 2:
Below are the scores of 50 randomly selected students in Science exam with a
class size or width of 5. Show the location of 𝑄2, 𝐷5 𝑜𝑟 𝑃50 in the given grouped data.
Solution:
Remember that 𝑄2, 𝐷5 𝑜𝑟 𝑃50 are equivalent to median hence determine the class
interval first which contains the (N
2) th score (Use N to represent the total
Class
Interval
(Scores)
Frequency Lower
boundaries
Less than Cumulative
Frequency
< 𝒄𝒇)
46-50 4 45.5 50
41-45 8 40.5 46
36-40 11 35.5 38
31-35 9 30.5 27
26-30 12 25.5 18
21-25 6 20.5 6
9
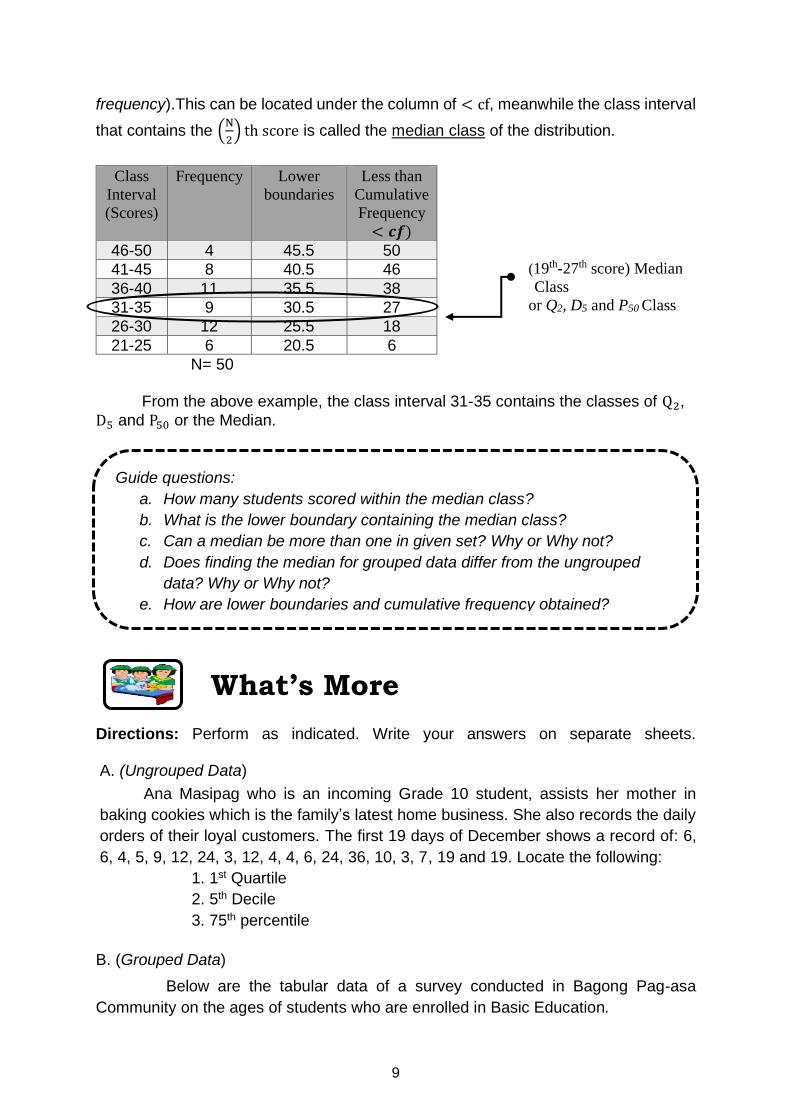
frequency).This can be located under the column of < cf, meanwhile the class interval
that contains the (N
2) th score is called the median class of the distribution.
Class
Interval
(Scores)
Frequency Lower
boundaries
Less than
Cumulative
Frequency
< 𝒄𝒇)
46-50 4 45.5 50
41-45 8 40.5 46
36-40 11 35.5 38
31-35 9 30.5 27
26-30 12 25.5 18
21-25 6 20.5 6
N= 50 From the above example, the class interval 31-35 contains the classes of Q2,
D5 and P50 or the Median.
What’s More
Directions: Perform as indicated. Write your answers on separate sheets.
A. (Ungrouped Data)
Ana Masipag who is an incoming Grade 10 student, assists her mother in
baking cookies which is the family’s latest home business. She also records the daily
orders of their loyal customers. The first 19 days of December shows a record of: 6,
6, 4, 5, 9, 12, 24, 3, 12, 4, 4, 6, 24, 36, 10, 3, 7, 19 and 19. Locate the following:
1. 1st Quartile
2. 5th Decile
3. 75th percentile
B. (Grouped Data)
Below are the tabular data of a survey conducted in Bagong Pag-asa
Community on the ages of students who are enrolled in Basic Education.
(19th-27th score) Median
Class
or Q2, D5 and P50 Class
Guide questions:
a. How many students scored within the median class?
b. What is the lower boundary containing the median class?
c. Can a median be more than one in given set? Why or Why not?
d. Does finding the median for grouped data differ from the ungrouped
data? Why or Why not?
e. How are lower boundaries and cumulative frequency obtained?
10
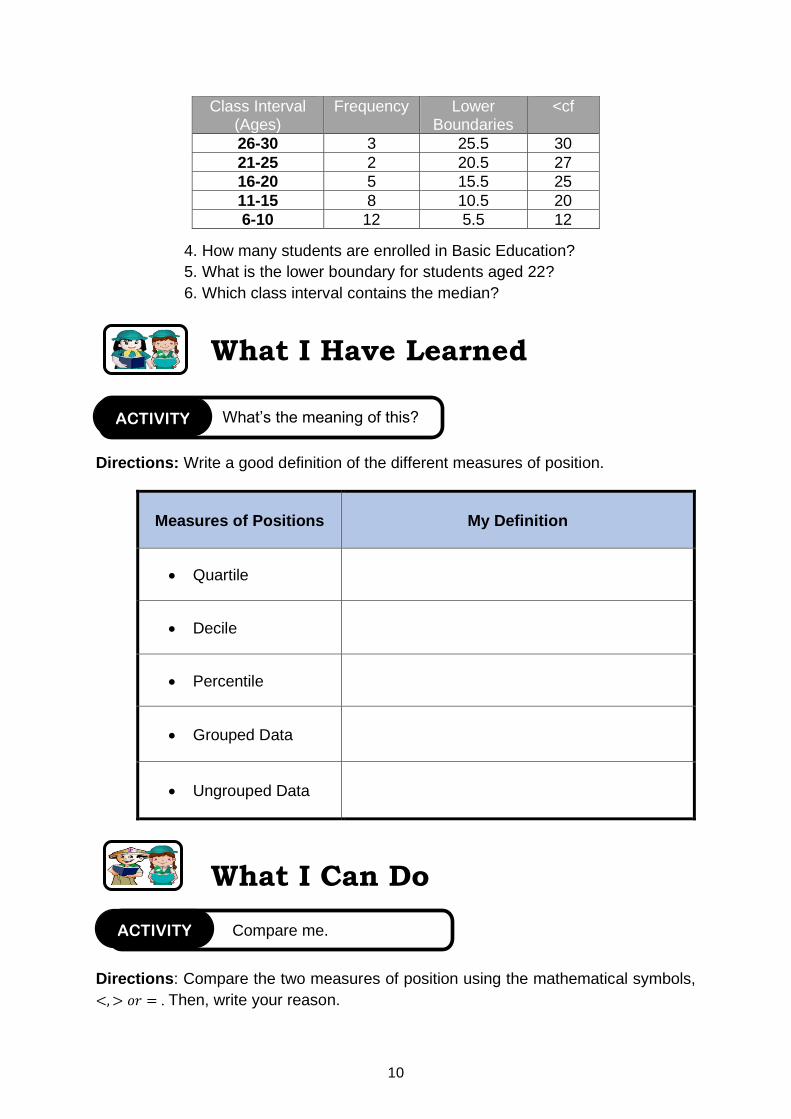
4. How many students are enrolled in Basic Education?
5. What is the lower boundary for students aged 22?
6. Which class interval contains the median?
What I Have Learned
Directions: Write a good definition of the different measures of position.
Measures of Positions
My Definition
• Quartile
• Decile
• Percentile
• Grouped Data
• Ungrouped Data
What I Can Do
Directions: Compare the two measures of position using the mathematical symbols,
<, > 𝑜𝑟 = . Then, write your reason.
Class Interval (Ages)
Frequency Lower Boundaries
<cf
26-30 3 25.5 30
21-25 2 20.5 27
16-20 5 15.5 25
11-15 8 10.5 20
6-10 12 5.5 12
What’s the meaning of this? ACTIVITY
Compare me. ACTIVITY
11
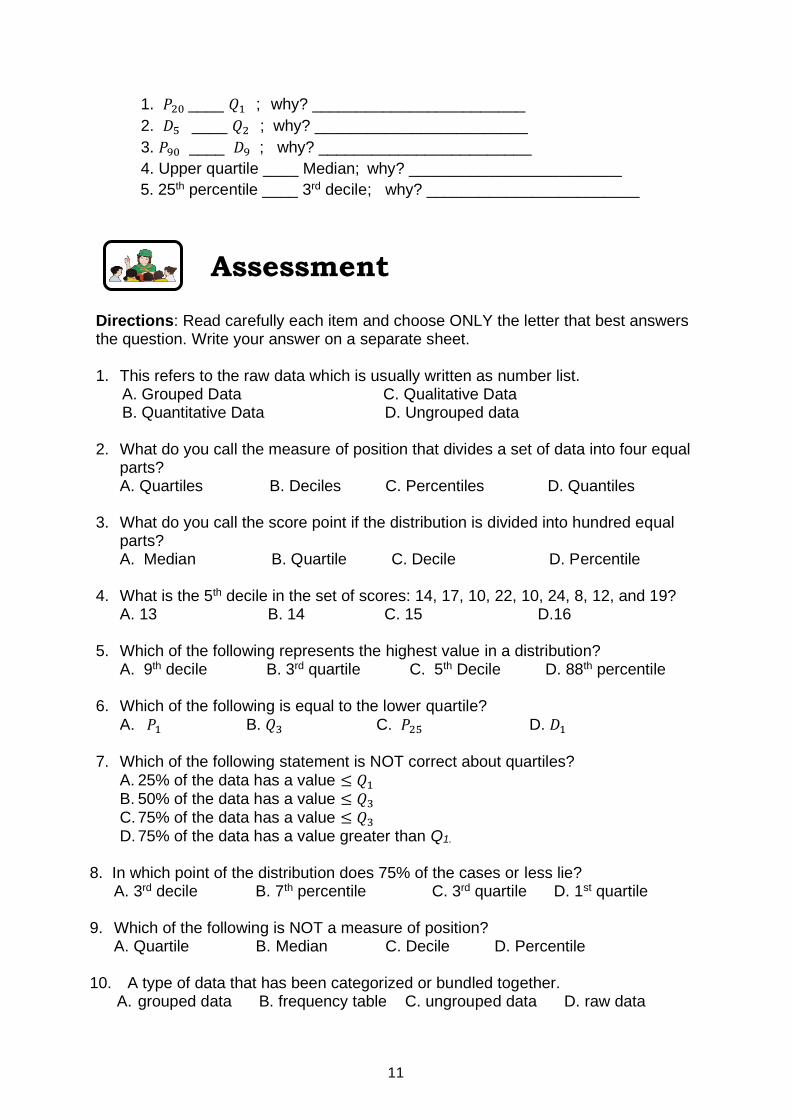
1. 𝑃20 ____ 𝑄1 ; why? ________________________
2. 𝐷5 ____ 𝑄2 ; why? ________________________
3. 𝑃90 ____ 𝐷9 ; why? ________________________
4. Upper quartile ____ Median; why? ________________________
5. 25th percentile ____ 3rd decile; why? ________________________
Assessment
Directions: Read carefully each item and choose ONLY the letter that best answers the question. Write your answer on a separate sheet. 1. This refers to the raw data which is usually written as number list.
A. Grouped Data C. Qualitative Data B. Quantitative Data D. Ungrouped data
2. What do you call the measure of position that divides a set of data into four equal
parts? A. Quartiles B. Deciles C. Percentiles D. Quantiles
3. What do you call the score point if the distribution is divided into hundred equal
parts? A. Median B. Quartile C. Decile D. Percentile
4. What is the 5th decile in the set of scores: 14, 17, 10, 22, 10, 24, 8, 12, and 19?
A. 13 B. 14 C. 15 D.16
5. Which of the following represents the highest value in a distribution? A. 9th decile B. 3rd quartile C. 5th Decile D. 88th percentile
6. Which of the following is equal to the lower quartile? A. 𝑃1 B. 𝑄3 C. 𝑃25 D. 𝐷1
7. Which of the following statement is NOT correct about quartiles?
A. 25% of the data has a value ≤ 𝑄1 B. 50% of the data has a value ≤ 𝑄3 C. 75% of the data has a value ≤ 𝑄3 D. 75% of the data has a value greater than Q1.
8. In which point of the distribution does 75% of the cases or less lie? A. 3rd decile B. 7th percentile C. 3rd quartile D. 1st quartile
9. Which of the following is NOT a measure of position?
A. Quartile B. Median C. Decile D. Percentile
10. A type of data that has been categorized or bundled together. A. grouped data B. frequency table C. ungrouped data D. raw data
12
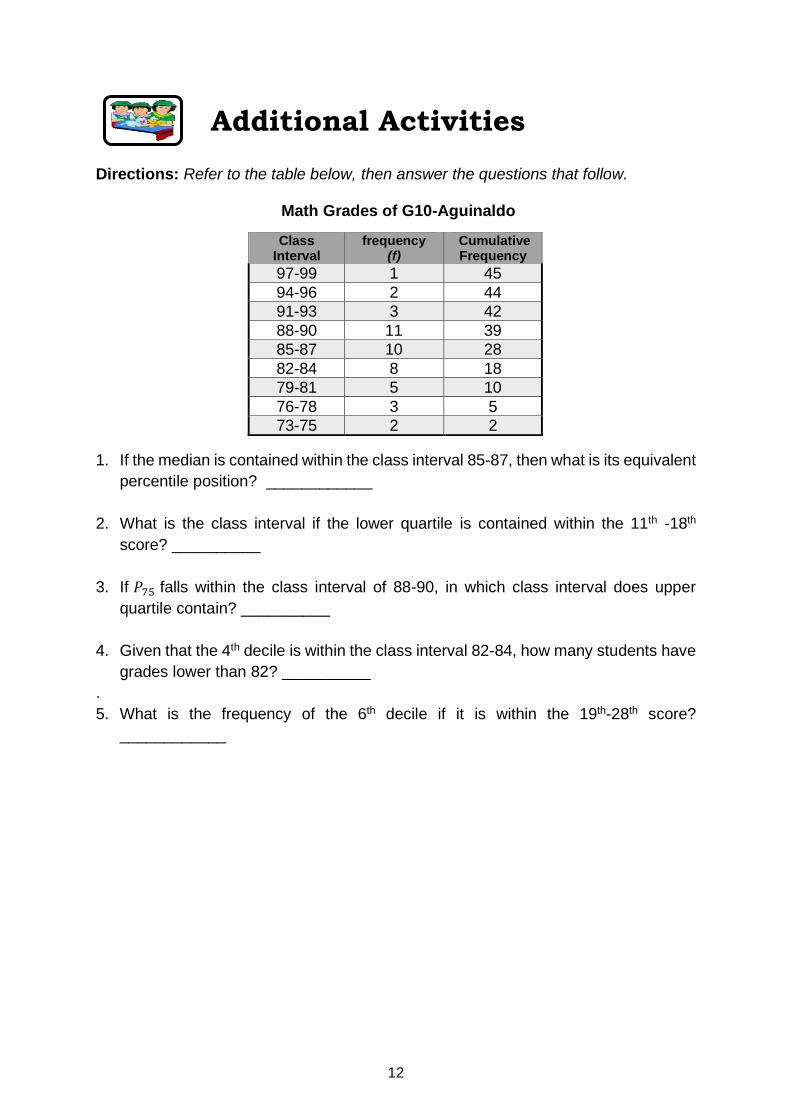
Additional Activities
Directions: Refer to the table below, then answer the questions that follow.
Math Grades of G10-Aguinaldo
1. If the median is contained within the class interval 85-87, then what is its equivalent
percentile position? ____________
2. What is the class interval if the lower quartile is contained within the 11th -18th
score? __________
3. If 𝑃75 falls within the class interval of 88-90, in which class interval does upper
quartile contain? __________
4. Given that the 4th decile is within the class interval 82-84, how many students have
grades lower than 82? __________
.
5. What is the frequency of the 6th decile if it is within the 19th-28th score?
____________
Class Interval
frequency (f)
Cumulative Frequency
97-99 1 45
94-96 2 44
91-93 3 42
88-90 11 39
85-87 10 28
82-84 8 18
79-81 5 10
76-78 3 5
73-75 2 2
13
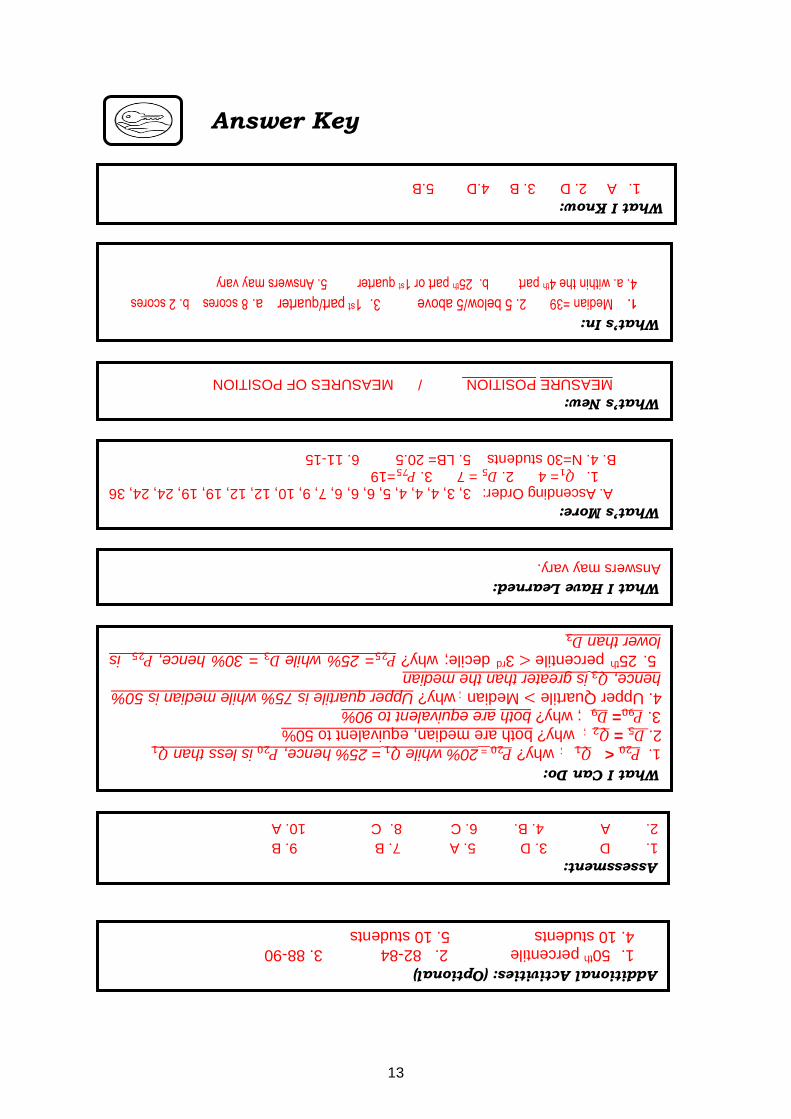
Answer Key
What I Know:
1.A 2. D 3. B 4.D 5.B
What’s In:
1.Median =39 2. 5 below/5 above 3. 1st part/quarter a. 8 scores b. 2 scores
4. a. within the 4th part b. 25th part or 1st quarter 5. Answers may vary
What’s New:
MEASURE POSITION / MEASURES OF POSITION
What’s More:
A.A. Ascending Order: 3, 3, 4, 4, 4, 5, 6, 6, 6, 7, 9, 10, 12, 12, 19, 19, 24, 24, 36 1.𝑄1= 4 2. 𝐷5 = 7 3. 𝑃75=19
B. 4. N=30 students 5. LB= 20.5 6. 11-15
What I Have Learned:
Answers may vary.
What I Can Do:
1. 𝑃20 < 𝑄1 ; why? 𝑃20 = 20% while 𝑄1 = 25% hence, 𝑃20 is less than 𝑄1
2. 𝐷5 = 𝑄2 ; why? both are median, equivalent to 50%
3. 𝑃90= 𝐷9 ; why? both are equivalent to 90% 4. Upper Quartile > Median ; why? Upper quartile is 75% while median is 50%
hence, 𝑄3 is greater than the median 5. 25
th percentile < 3
rd decile; why? 𝑃25= 25% while 𝐷3 = 30% hence, 𝑃25 is
lower than 𝐷3
Assessment:
1. D 3. D 5. A 7. B 9. B
2. A 4. B. 6. C 8. C 10. A
Additional Activities: (Optional)
1.50th percentile 2. 82-84 3. 88-90
4. 10 students 5. 10 students
14
References:
Orlando A. Oronce and Marilyn O. Mendoza, e-math Advanced Algebra and Trigonometry IV, Manila: Rex Bookstore, 2010, pp 407, 410-411, 425-426, 431- 435 Melvin M. Callanta, et al, Mathematics Learner’s Module 10 DepEd Pasig: Rex Bookstore, Inc., 2015, pp 356-357, 362-363, 366, 373, 376, 386-389 Ramon B. Cristobal, et al, Math World 10 Quezon City: C & E Publishing, Inc. 2015, pp. 246-247, pp. 254-255 Olivia N. Buzon, et al, Advanced Algebra with Trigonometry and Statistics Explorations and Applications, Salesiana Publishers, Inc. 2003, pp. 298-299, pp. 316-317, pp. 300 “Measures of Position,” Stephanie Glen, last modified Aug 26, 2019, https://www.statisticshowto.com/measures-of-position/
15
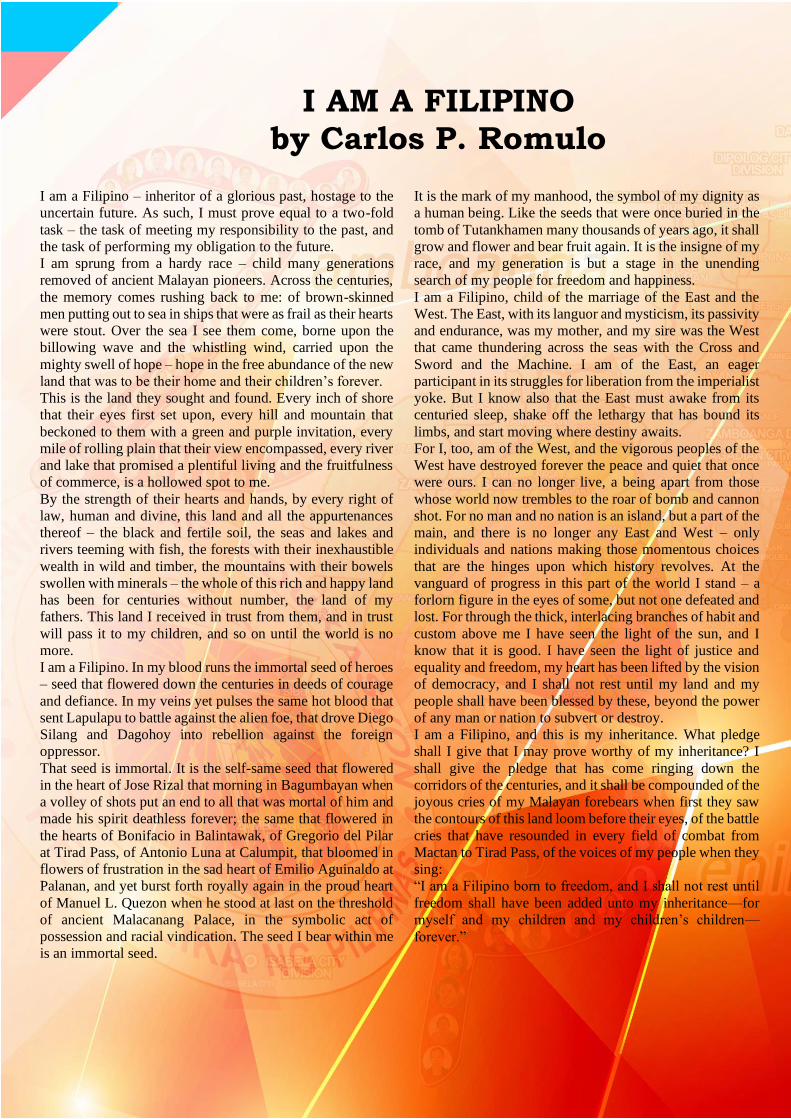
I AM A FILIPINO
by Carlos P. Romulo
I am a Filipino – inheritor of a glorious past, hostage to the
uncertain future. As such, I must prove equal to a two-fold
task – the task of meeting my responsibility to the past, and
the task of performing my obligation to the future.
I am sprung from a hardy race – child many generations
removed of ancient Malayan pioneers. Across the centuries,
the memory comes rushing back to me: of brown-skinned
men putting out to sea in ships that were as frail as their hearts
were stout. Over the sea I see them come, borne upon the
billowing wave and the whistling wind, carried upon the
mighty swell of hope – hope in the free abundance of the new
land that was to be their home and their children’s forever.
This is the land they sought and found. Every inch of shore
that their eyes first set upon, every hill and mountain that
beckoned to them with a green and purple invitation, every
mile of rolling plain that their view encompassed, every river
and lake that promised a plentiful living and the fruitfulness
of commerce, is a hollowed spot to me.
By the strength of their hearts and hands, by every right of
law, human and divine, this land and all the appurtenances
thereof – the black and fertile soil, the seas and lakes and
rivers teeming with fish, the forests with their inexhaustible
wealth in wild and timber, the mountains with their bowels
swollen with minerals – the whole of this rich and happy land
has been for centuries without number, the land of my
fathers. This land I received in trust from them, and in trust
will pass it to my children, and so on until the world is no
more.
I am a Filipino. In my blood runs the immortal seed of heroes
– seed that flowered down the centuries in deeds of courage
and defiance. In my veins yet pulses the same hot blood that
sent Lapulapu to battle against the alien foe, that drove Diego
Silang and Dagohoy into rebellion against the foreign
oppressor.
That seed is immortal. It is the self-same seed that flowered
in the heart of Jose Rizal that morning in Bagumbayan when
a volley of shots put an end to all that was mortal of him and
made his spirit deathless forever; the same that flowered in
the hearts of Bonifacio in Balintawak, of Gregorio del Pilar
at Tirad Pass, of Antonio Luna at Calumpit, that bloomed in
flowers of frustration in the sad heart of Emilio Aguinaldo at
Palanan, and yet burst forth royally again in the proud heart
of Manuel L. Quezon when he stood at last on the threshold
of ancient Malacanang Palace, in the symbolic act of
possession and racial vindication. The seed I bear within me
is an immortal seed.
It is the mark of my manhood, the symbol of my dignity as
a human being. Like the seeds that were once buried in the
tomb of Tutankhamen many thousands of years ago, it shall
grow and flower and bear fruit again. It is the insigne of my
race, and my generation is but a stage in the unending
search of my people for freedom and happiness.
I am a Filipino, child of the marriage of the East and the
West. The East, with its languor and mysticism, its passivity
and endurance, was my mother, and my sire was the West
that came thundering across the seas with the Cross and
Sword and the Machine. I am of the East, an eager
participant in its struggles for liberation from the imperialist
yoke. But I know also that the East must awake from its
centuried sleep, shake off the lethargy that has bound its
limbs, and start moving where destiny awaits.
For I, too, am of the West, and the vigorous peoples of the
West have destroyed forever the peace and quiet that once
were ours. I can no longer live, a being apart from those
whose world now trembles to the roar of bomb and cannon
shot. For no man and no nation is an island, but a part of the
main, and there is no longer any East and West – only
individuals and nations making those momentous choices
that are the hinges upon which history revolves. At the
vanguard of progress in this part of the world I stand – a
forlorn figure in the eyes of some, but not one defeated and
lost. For through the thick, interlacing branches of habit and
custom above me I have seen the light of the sun, and I
know that it is good. I have seen the light of justice and
equality and freedom, my heart has been lifted by the vision
of democracy, and I shall not rest until my land and my
people shall have been blessed by these, beyond the power
of any man or nation to subvert or destroy.
I am a Filipino, and this is my inheritance. What pledge
shall I give that I may prove worthy of my inheritance? I
shall give the pledge that has come ringing down the
corridors of the centuries, and it shall be compounded of the
joyous cries of my Malayan forebears when first they saw
the contours of this land loom before their eyes, of the battle
cries that have resounded in every field of combat from
Mactan to Tirad Pass, of the voices of my people when they
sing:
“I am a Filipino born to freedom, and I shall not rest until
freedom shall have been added unto my inheritance—for
myself and my children and my children’s children—
forever.”