Hilton Reports First Quarter Results; Resumes Capital Return ...
17
Investor Contact 7930 Jones Branch Drive Jill Slattery McLean, VA 22102 +1 703 883 5476 ir.hilton.com Media Contact Kent Landers +1 703 883 3246 Hilton Reports First Quarter Results; Resumes Capital Return to Shareholders MCLEAN, VA (May 3, 2022) - Hilton Worldwide Holdings Inc. ("Hilton" or the "Company") (NYSE: HLT) today reported its first quarter 2022 results. Highlights include: • Diluted EPS was $0.75 for the first quarter, and diluted EPS, adjusted for special items, was $0.71 • Net income was $211 million for the first quarter • Adjusted EBITDA was $448 million for the first quarter • System-wide comparable RevPAR increased 80.5 percent, on a currency neutral basis, for the first quarter compared to the same period in 2021 • System-wide comparable RevPAR was down 17.0 percent, on a currency neutral basis, for the first quarter compared to the same period in 2019 • Approved 22,200 new rooms for development during the first quarter, bringing Hilton's development pipeline to more than 410,000 rooms as of March 31, 2022 • Added 13,200 rooms to Hilton's system in the first quarter, contributing to 7,800 net additional rooms in Hilton's system during the period, which represented 5.0 percent net unit growth from March 31, 2021 • Resumed share repurchases in March 2022 and repurchased 907,000 shares of Hilton common stock for approximately $130 million in the first quarter and 1.8 million shares for approximately $265 million through April • Declared a $0.15 per share quarterly cash dividend in May 2022 • Full year 2022 system-wide comparable RevPAR is expected to increase between 32.0 percent and 38.0 percent on a currency neutral basis compared to 2021; full year net income is projected to be between $1,001 million and $1,071 million; full year Adjusted EBITDA is projected to be between $2,250 million and $2,350 million • Full year 2022 capital return is projected to be between $1.4 billion and $1.8 billion 1
-
Upload
khangminh22 -
Category
Documents
-
view
0 -
download
0
Transcript of Hilton Reports First Quarter Results; Resumes Capital Return ...
Investor Contact 7930 Jones Branch DriveJill Slattery McLean, VA 22102+1 703 883 5476 ir.hilton.com
Media ContactKent Landers+1 703 883 3246
Hilton Reports First Quarter Results; Resumes Capital Return to Shareholders
MCLEAN, VA (May 3, 2022) - Hilton Worldwide Holdings Inc. ("Hilton" or the "Company") (NYSE: HLT) today reported its first quarter 2022 results. Highlights include:
• Diluted EPS was $0.75 for the first quarter, and diluted EPS, adjusted for special items, was $0.71
• Net income was $211 million for the first quarter
• Adjusted EBITDA was $448 million for the first quarter
• System-wide comparable RevPAR increased 80.5 percent, on a currency neutral basis, for the first quarter compared to the same period in 2021
• System-wide comparable RevPAR was down 17.0 percent, on a currency neutral basis, for the first quarter compared to the same period in 2019
• Approved 22,200 new rooms for development during the first quarter, bringing Hilton's development pipeline to more than 410,000 rooms as of March 31, 2022
• Added 13,200 rooms to Hilton's system in the first quarter, contributing to 7,800 net additional rooms in Hilton's system during the period, which represented 5.0 percent net unit growth from March 31, 2021
• Resumed share repurchases in March 2022 and repurchased 907,000 shares of Hilton common stock for approximately $130 million in the first quarter and 1.8 million shares for approximately $265 million through April
• Declared a $0.15 per share quarterly cash dividend in May 2022
• Full year 2022 system-wide comparable RevPAR is expected to increase between 32.0 percent and 38.0 percent on a currency neutral basis compared to 2021; full year net income is projected to be between $1,001 million and $1,071 million; full year Adjusted EBITDA is projected to be between $2,250 million and $2,350 million
• Full year 2022 capital return is projected to be between $1.4 billion and $1.8 billion
1
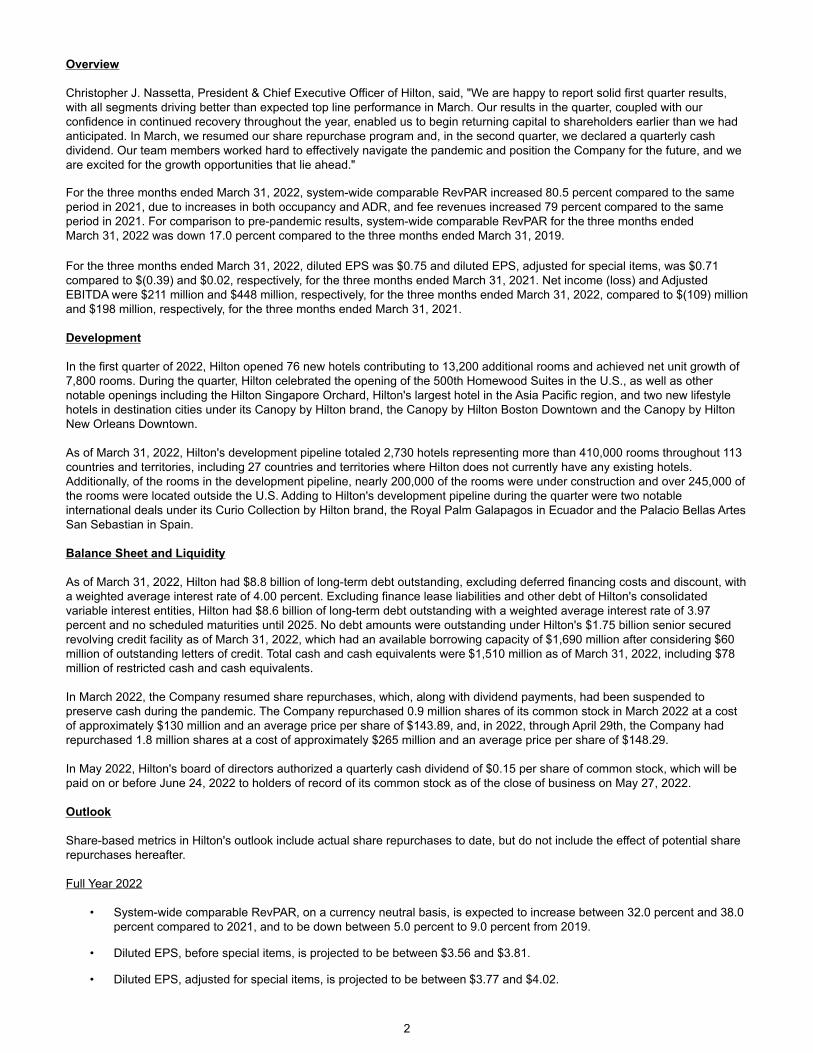
Overview
Christopher J. Nassetta, President & Chief Executive Officer of Hilton, said, "We are happy to report solid first quarter results, with all segments driving better than expected top line performance in March. Our results in the quarter, coupled with our confidence in continued recovery throughout the year, enabled us to begin returning capital to shareholders earlier than we had anticipated. In March, we resumed our share repurchase program and, in the second quarter, we declared a quarterly cash dividend. Our team members worked hard to effectively navigate the pandemic and position the Company for the future, and we are excited for the growth opportunities that lie ahead."
For the three months ended March 31, 2022, system-wide comparable RevPAR increased 80.5 percent compared to the same period in 2021, due to increases in both occupancy and ADR, and fee revenues increased 79 percent compared to the same period in 2021. For comparison to pre-pandemic results, system-wide comparable RevPAR for the three months ended March 31, 2022 was down 17.0 percent compared to the three months ended March 31, 2019.
For the three months ended March 31, 2022, diluted EPS was $0.75 and diluted EPS, adjusted for special items, was $0.71 compared to $(0.39) and $0.02, respectively, for the three months ended March 31, 2021. Net income (loss) and Adjusted EBITDA were $211 million and $448 million, respectively, for the three months ended March 31, 2022, compared to $(109) million and $198 million, respectively, for the three months ended March 31, 2021.
Development
In the first quarter of 2022, Hilton opened 76 new hotels contributing to 13,200 additional rooms and achieved net unit growth of 7,800 rooms. During the quarter, Hilton celebrated the opening of the 500th Homewood Suites in the U.S., as well as other notable openings including the Hilton Singapore Orchard, Hilton's largest hotel in the Asia Pacific region, and two new lifestyle hotels in destination cities under its Canopy by Hilton brand, the Canopy by Hilton Boston Downtown and the Canopy by Hilton New Orleans Downtown.
As of March 31, 2022, Hilton's development pipeline totaled 2,730 hotels representing more than 410,000 rooms throughout 113 countries and territories, including 27 countries and territories where Hilton does not currently have any existing hotels. Additionally, of the rooms in the development pipeline, nearly 200,000 of the rooms were under construction and over 245,000 of the rooms were located outside the U.S. Adding to Hilton's development pipeline during the quarter were two notable international deals under its Curio Collection by Hilton brand, the Royal Palm Galapagos in Ecuador and the Palacio Bellas Artes San Sebastian in Spain.
Balance Sheet and Liquidity
As of March 31, 2022, Hilton had $8.8 billion of long-term debt outstanding, excluding deferred financing costs and discount, with a weighted average interest rate of 4.00 percent. Excluding finance lease liabilities and other debt of Hilton's consolidated variable interest entities, Hilton had $8.6 billion of long-term debt outstanding with a weighted average interest rate of 3.97 percent and no scheduled maturities until 2025. No debt amounts were outstanding under Hilton's $1.75 billion senior secured revolving credit facility as of March 31, 2022, which had an available borrowing capacity of $1,690 million after considering $60 million of outstanding letters of credit. Total cash and cash equivalents were $1,510 million as of March 31, 2022, including $78 million of restricted cash and cash equivalents.
In March 2022, the Company resumed share repurchases, which, along with dividend payments, had been suspended to preserve cash during the pandemic. The Company repurchased 0.9 million shares of its common stock in March 2022 at a cost of approximately $130 million and an average price per share of $143.89, and, in 2022, through April 29th, the Company had repurchased 1.8 million shares at a cost of approximately $265 million and an average price per share of $148.29.
In May 2022, Hilton's board of directors authorized a quarterly cash dividend of $0.15 per share of common stock, which will be paid on or before June 24, 2022 to holders of record of its common stock as of the close of business on May 27, 2022.
Outlook
Share-based metrics in Hilton's outlook include actual share repurchases to date, but do not include the effect of potential share repurchases hereafter.
Full Year 2022
• System-wide comparable RevPAR, on a currency neutral basis, is expected to increase between 32.0 percent and 38.0 percent compared to 2021, and to be down between 5.0 percent to 9.0 percent from 2019.
• Diluted EPS, before special items, is projected to be between $3.56 and $3.81.
• Diluted EPS, adjusted for special items, is projected to be between $3.77 and $4.02.
2

• Net income is projected to be between $1,001 million and $1,071 million.
• Adjusted EBITDA is projected to be between $2,250 million and $2,350 million.
• Contract acquisition costs and capital expenditures, excluding amounts indirectly reimbursed by hotel owners, are expected to be between $250 million and $275 million.
• Capital return is projected to be between $1.4 billion and $1.8 billion.
• General and administrative expenses are projected to be between $410 million and $430 million.
• Net unit growth is expected to be approximately 5.0 percent.
Second Quarter 2022
• System-wide comparable RevPAR, on a currency neutral basis, is expected to increase between 45.0 percent and 50.0 percent compared to the second quarter of 2021, and to be down between 5.0 percent to 10.0 percent from the second quarter of 2019.
• Diluted EPS, before special items, is projected to be between $0.89 and $0.94.
• Diluted EPS, adjusted for special items, is projected to be between $0.98 and $1.03.
• Net income is projected to be between $250 million and $264 million.
• Adjusted EBITDA is projected to be between $590 million and $610 million.
Conference Call
Hilton will host a conference call to discuss first quarter 2022 results on May 3, 2022 at 10:00 a.m. Eastern Time. Participants may listen to the live webcast by logging on to the Hilton Investor Relations website at https://ir.hilton.com/events-and-presentations. A replay and transcript of the webcast will be available within 24 hours after the live event at https://ir.hilton.com/financial-reporting.
Alternatively, participants may listen to the live call by dialing 1-888-317-6003 in the United States ("U.S.") or 1-412-317-6061 internationally using the conference ID 3306232. Participants are encouraged to dial into the call or link to the webcast at least fifteen minutes prior to the scheduled start time. A telephone replay will be available for seven days following the call. To access the telephone replay, dial 1-877-344-7529 in the U.S. or 1-412-317-0088 internationally using the conference ID 2469261.
Forward-Looking Statements
This press release contains forward-looking statements within the meaning of Section 27A of the Securities Act of 1933, as amended, and Section 21E of the Securities Exchange Act of 1934, as amended. These statements include, but are not limited to, statements related to the expectations regarding the impact of and recovery from the coronavirus ("COVID-19") pandemic (the "pandemic"), the performance of Hilton's business, financial results, liquidity and capital resources and other non-historical statements. In some cases, these forward-looking statements can be identified by the use of words such as "outlook," "believes," "expects," "potential," "continues," "may," "will," "should," "could," "seeks," "projects," "predicts," "intends," "plans," "estimates," "anticipates" or the negative version of these words or other comparable words. Such forward-looking statements are subject to various risks and uncertainties including, among others, risks inherent to the hospitality industry, macroeconomic factors beyond Hilton's control, such as challenges due to labor shortages and supply chain disruptions, risks related to the impact of the pandemic, including as a result of new strains or variants of the virus and uncertainty of acceptance of the COVID-19 vaccines and their effectiveness, competition for hotel guests and management and franchise contracts, risks related to doing business with third-party hotel owners, performance of Hilton's information technology systems, growth of reservation channels outside of Hilton's system, risks of doing business outside of the U.S., risks associated with the Russian invasion of Ukraine and Hilton's indebtedness. Additional factors that could cause Hilton's results to differ materially from those described in the forward-looking statements can be found under the section entitled "Part I—Item 1A. Risk Factors" of Hilton's Annual Report on Form 10-K for the fiscal year ended December 31, 2021, filed with the Securities and Exchange Commission (the "SEC"), as such factors may be updated from time to time in Hilton's periodic filings with the SEC, which are accessible on the SEC's website at www.sec.gov. Accordingly, there are or will be important factors that could cause actual outcomes or results to differ materially from those indicated in these statements. These factors should not be construed as exhaustive and should be read in conjunction with the other cautionary statements that are included in this press release and in Hilton's filings with the SEC. The Company undertakes no obligation to publicly update or review any forward-looking statement, whether as a result of new information, future developments or otherwise, except as required by law.
3

Definitions
See the "Definitions" section for the definition of certain terms used within this press release, including within the schedules.
Non-GAAP Financial Measures
The Company refers to certain financial measures that are not recognized under U.S. generally accepted accounting principles ("GAAP") in this press release, including: net income (loss), adjusted for special items; diluted EPS, adjusted for special items; EBITDA; Adjusted EBITDA; Adjusted EBITDA margin; net debt; and net debt to Adjusted EBITDA ratio. See the schedules to this press release, including the "Definitions" section, for additional information and reconciliations of such non-GAAP financial measures.
About Hilton
Hilton (NYSE: HLT) is a leading global hospitality company with a portfolio of 18 world-class brands comprising nearly 6,900 properties and nearly 1.1 million rooms, in 122 countries and territories. Dedicated to fulfilling its founding vision to fill the earth with the light and warmth of hospitality, Hilton has welcomed more than 3 billion guests in its more than 100-year history, earned a top spot on Fortune's 100 Best Companies to Work For list and been recognized as a global leader on the Dow Jones Sustainability Indices for five consecutive years. Hilton has introduced several industry-leading technology enhancements to improve the guest experience, including Digital Key Share, automated complimentary room upgrades and the ability to book confirmed connecting rooms. Through the award-winning guest loyalty program Hilton Honors, the 133 million members who book directly with Hilton can earn Points for hotel stays and experiences money can't buy. With the free Hilton Honors app, guests can book their stay, select their room, check in, unlock their door with a Digital Key and check out, all from their smartphone. Visit newsroom.hilton.com for more information, and connect with Hilton on facebook.com/hiltonnewsroom, twitter.com/hiltonnewsroom, linkedin.com/company/hilton, instagram.com/hiltonnewsroom and youtube.com/hiltonnewsroom.
4

HILTON WORLDWIDE HOLDINGS INC.EARNINGS RELEASE SCHEDULES
TABLE OF CONTENTS
PageCondensed Consolidated Statements of Operations 6Comparable and Currency Neutral System-Wide Hotel Operating Statistics 7Property Summary 8Capital Expenditures and Contract Acquisition Costs 10Reconciliations of Non-GAAP Financial Measures 11Definitions 16
5

HILTON WORLDWIDE HOLDINGS INC.CONDENSED CONSOLIDATED STATEMENTS OF OPERATIONS
(unaudited, in millions, except per share data)
Three Months EndedMarch 31,
2022 2021Revenues
Franchise and licensing fees $ 413 $ 242 Base and other management fees 55 25 Incentive management fees 34 13 Owned and leased hotels 150 56 Other revenues 18 17
670 353 Other revenues from managed and franchised properties 1,051 521
Total revenues 1,721 874
ExpensesOwned and leased hotels 185 110 Depreciation and amortization 44 51 General and administrative 91 97 Other expenses 11 10
331 268 Other expenses from managed and franchised properties 1,021 585
Total expenses 1,352 853
Operating income 369 21
Interest expense (90) (103) Gain (loss) on foreign currency transactions (4) 2 Loss on debt extinguishment — (69) Other non-operating income, net 16 5
Income (loss) before income taxes 291 (144)
Income tax benefit (expense) (80) 35
Net income (loss) 211 (109) Net loss attributable to noncontrolling interests 1 1 Net income (loss) attributable to Hilton stockholders $ 212 $ (108)
Weighted average shares outstanding:Basic 279 278 Diluted 282 278
Earnings (loss) per share:Basic $ 0.76 $ (0.39) Diluted $ 0.75 $ (0.39)
6

HILTON WORLDWIDE HOLDINGS INC.COMPARABLE AND CURRENCY NEUTRAL SYSTEM-WIDE HOTEL OPERATING STATISTICS
BY REGION, BRAND AND SEGMENT(unaudited)
Three Months Ended March 31,Occupancy ADR RevPAR
2022 vs. 2021 2022 vs. 2021 2022 vs. 2021By Region:U.S. 61.8 % 14.1 % pts. $ 144.32 36.4 % $ 89.12 76.8 %Americas (excluding U.S.) 50.7 21.7 126.05 35.7 63.92 137.0 Europe 47.9 29.2 120.70 74.8 57.77 348.8 Middle East & Africa 66.2 26.0 159.07 34.6 105.28 121.4 Asia Pacific 42.5 (0.4) 104.13 12.0 44.28 11.0
By Brand:Waldorf Astoria Hotels & Resorts 47.7 % 23.6 % pts. $ 599.50 7.5 % $ 286.03 113.0 %Conrad Hotels & Resorts 45.8 15.6 229.69 33.4 105.21 102.1 Canopy by Hilton 53.4 23.1 186.89 34.7 99.89 137.2 Hilton Hotels & Resorts 49.6 20.1 169.18 38.2 83.85 132.9 Curio Collection by Hilton 52.6 19.0 214.50 27.7 112.83 100.1 DoubleTree by Hilton 52.9 17.5 127.02 32.9 67.24 98.5 Tapestry Collection by Hilton 53.8 18.1 145.89 28.3 78.48 93.2 Embassy Suites by Hilton 59.6 16.2 161.99 36.8 96.52 87.8 Hilton Garden Inn 59.0 13.8 124.60 34.8 73.56 75.8 Hampton by Hilton 60.5 10.8 118.90 30.3 71.98 58.4 Tru by Hilton 63.1 12.3 112.29 35.4 70.86 68.3 Homewood Suites by Hilton 73.6 9.5 135.97 28.6 100.09 47.8 Home2 Suites by Hilton 73.7 10.2 123.65 27.2 91.16 47.5
By Segment:Management and franchise 58.4 % 14.4 % pts. $ 138.77 35.0 % $ 81.08 79.2 %Ownership(1) 38.0 25.0 176.04 31.1 66.82 283.5
System-wide 58.1 % 14.6 % pts. $ 139.17 35.2 % $ 80.84 80.5 %____________(1) Includes hotels owned or leased by entities in which Hilton owns a noncontrolling financial interest.
7

HILTON WORLDWIDE HOLDINGS INC.PROPERTY SUMMARYAs of March 31, 2022
Owned / Leased(1) Managed Franchised TotalProperties Rooms Properties Rooms Properties Rooms Properties Rooms
Waldorf Astoria Hotels & ResortsU.S. — — 11 4,224 — — 11 4,224 Americas (excluding U.S.) — — 2 261 — — 2 261 Europe 2 463 4 898 — — 6 1,361 Middle East & Africa — — 5 1,224 — — 5 1,224 Asia Pacific — — 6 1,259 — — 6 1,259
LXR Hotels & ResortsU.S. — — — — 3 426 3 426 Americas (excluding U.S.) — — — — 1 76 1 76 Europe — — 2 383 — — 2 383 Middle East & Africa — — 1 41 1 234 2 275 Asia Pacific — — — — 1 114 1 114
Conrad Hotels & ResortsU.S. — — 5 1,922 1 1,496 6 3,418 Americas (excluding U.S.) — — 3 787 — — 3 787 Europe — — 4 1,155 — — 4 1,155 Middle East & Africa 1 614 3 1,569 — — 4 2,183 Asia Pacific 1 164 22 7,074 1 659 24 7,897
Canopy by HiltonU.S. — — — — 25 4,296 25 4,296 Americas (excluding U.S.) — — 2 272 — — 2 272 Europe — — 1 123 4 917 5 1,040 Middle East & Africa — — 1 200 — — 1 200 Asia Pacific — — 4 614 — — 4 614
Signia by HiltonU.S. — — 1 1,009 — — 1 1,009
Hilton Hotels & ResortsU.S. — — 57 43,212 188 59,118 245 102,330 Americas (excluding U.S.) 1 405 28 10,562 26 7,826 55 18,793 Europe 39 11,514 44 14,888 43 11,268 126 37,670 Middle East & Africa 5 1,992 36 12,555 3 1,565 44 16,112 Asia Pacific 5 2,999 112 39,294 8 3,247 125 45,540
Curio Collection by HiltonU.S. — — 8 3,593 60 12,915 68 16,508 Americas (excluding U.S.) — — 2 99 12 1,750 14 1,849 Europe — — 4 360 21 2,894 25 3,254 Middle East & Africa — — 4 741 2 557 6 1,298 Asia Pacific — — 4 773 2 248 6 1,021
DoubleTree by HiltonU.S. — — 32 10,605 341 77,510 373 88,115 Americas (excluding U.S.) — — 3 587 35 7,085 38 7,672 Europe — — 13 3,418 109 18,419 122 21,837 Middle East & Africa — — 18 4,710 5 568 23 5,278 Asia Pacific — — 77 20,478 5 1,395 82 21,873
(continued on next page)
8

HILTON WORLDWIDE HOLDINGS INC.PROPERTY SUMMARY (continued)
As of March 31, 2022
Owned / Leased(1) Managed Franchised TotalProperties Rooms Properties Rooms Properties Rooms Properties Rooms
Tapestry Collection by HiltonU.S. — — — — 63 7,545 63 7,545 Americas (excluding U.S.) — — 1 138 5 479 6 617 Europe — — — — 4 238 4 238 Asia Pacific — — 1 266 1 175 2 441
Embassy Suites by HiltonU.S. — — 40 10,585 211 47,377 251 57,962 Americas (excluding U.S.) — — 2 354 6 1,649 8 2,003
Motto by HiltonU.S. — — — — 3 871 3 871
Hilton Garden InnU.S. — — 4 425 730 100,857 734 101,282 Americas (excluding U.S.) — — 12 1,757 51 7,664 63 9,421 Europe — — 18 3,499 59 9,515 77 13,014 Middle East & Africa — — 17 3,555 3 474 20 4,029 Asia Pacific — — 49 10,771 1 177 50 10,948
Hampton by HiltonU.S. — — 26 3,366 2,282 225,332 2,308 228,698 Americas (excluding U.S.) — — 13 1,644 109 13,305 122 14,949 Europe — — 16 2,697 101 15,769 117 18,466 Middle East & Africa — — 4 1,238 — — 4 1,238 Asia Pacific — — — — 236 38,195 236 38,195
Tru by HiltonU.S. — — — — 213 20,736 213 20,736 Americas (excluding U.S.) — — — — 2 179 2 179
Homewood Suites by HiltonU.S. — — 10 1,172 493 56,282 503 57,454 Americas (excluding U.S.) — — 3 406 24 2,688 27 3,094
Home2 Suites by HiltonU.S. — — 2 210 522 54,829 524 55,039 Americas (excluding U.S.) — — — — 7 753 7 753 Asia Pacific — — — — 5 783 5 783
Other — — 3 1,343 10 2,317 13 3,660 Total hotels 54 18,151 740 232,316 6,038 822,772 6,832 1,073,239
Hilton Grand Vacations — — — — 60 9,489 60 9,489 Total system 54 18,151 740 232,316 6,098 832,261 6,892 1,082,728
____________(1) Includes hotels owned or leased by entities in which Hilton owns a noncontrolling financial interest.
9

HILTON WORLDWIDE HOLDINGS INC.CAPITAL EXPENDITURES AND CONTRACT ACQUISITION COSTS
(unaudited, dollars in millions)
Three Months EndedMarch 31, Increase / (Decrease)
2022 2021 $ %Capital expenditures for property and equipment(1) $ 4 $ 3 1 33.3 Capitalized software costs(2) 10 8 2 25.0
Total capital expenditures 14 11 3 27.3 Contract acquisition costs 15 43 (28) (65.1)
Total capital expenditures and contract acquisition costs $ 29 $ 54 (25) (46.3) ____________(1) Represents expenditures for hotels, corporate and other property and equipment, which include amounts indirectly reimbursed by hotel
owners of less than $1 million for both the three months ended March 31, 2022 and 2021. Excludes expenditures for FF&E replacement reserves of $12 million and $4 million for the three months ended March 31, 2022 and 2021, respectively.
(2) Includes $9 million and $7 million of expenditures that were indirectly reimbursed by hotel owners for the three months ended March 31, 2022 and 2021, respectively.
10
HILTON WORLDWIDE HOLDINGS INC.RECONCILIATIONS OF NON-GAAP FINANCIAL MEASURES
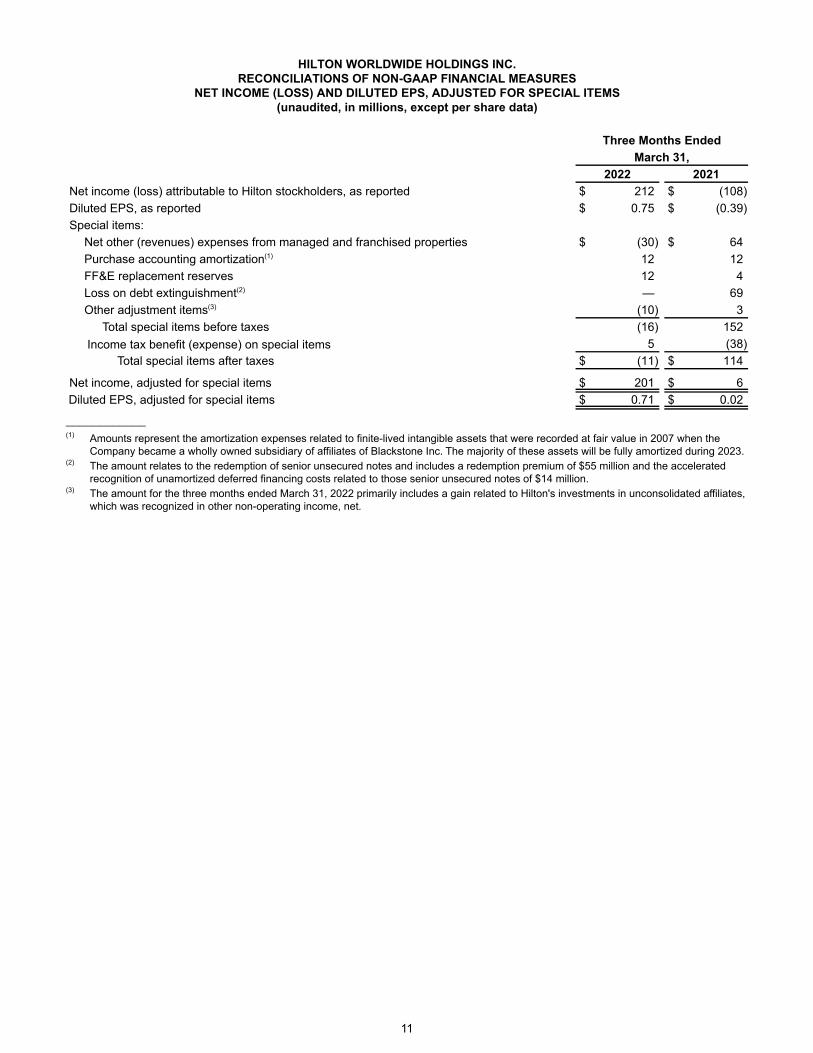
NET INCOME (LOSS) AND DILUTED EPS, ADJUSTED FOR SPECIAL ITEMS(unaudited, in millions, except per share data)
Three Months EndedMarch 31,
2022 2021Net income (loss) attributable to Hilton stockholders, as reported $ 212 $ (108) Diluted EPS, as reported $ 0.75 $ (0.39) Special items:
Net other (revenues) expenses from managed and franchised properties $ (30) $ 64 Purchase accounting amortization(1) 12 12 FF&E replacement reserves 12 4 Loss on debt extinguishment(2) — 69 Other adjustment items(3) (10) 3
Total special items before taxes (16) 152 Income tax benefit (expense) on special items 5 (38)
Total special items after taxes $ (11) $ 114
Net income, adjusted for special items $ 201 $ 6 Diluted EPS, adjusted for special items $ 0.71 $ 0.02 ____________(1) Amounts represent the amortization expenses related to finite-lived intangible assets that were recorded at fair value in 2007 when the
Company became a wholly owned subsidiary of affiliates of Blackstone Inc. The majority of these assets will be fully amortized during 2023.(2) The amount relates to the redemption of senior unsecured notes and includes a redemption premium of $55 million and the accelerated
recognition of unamortized deferred financing costs related to those senior unsecured notes of $14 million.(3) The amount for the three months ended March 31, 2022 primarily includes a gain related to Hilton's investments in unconsolidated affiliates,
which was recognized in other non-operating income, net.
11

HILTON WORLDWIDE HOLDINGS INC.RECONCILIATIONS OF NON-GAAP FINANCIAL MEASURES
ADJUSTED EBITDA AND ADJUSTED EBITDA MARGIN(unaudited, dollars in millions)
Three Months EndedMarch 31,
2022 2021Net income (loss) $ 211 $ (109)
Interest expense 90 103 Income tax expense (benefit) 80 (35) Depreciation and amortization expenses 44 51
EBITDA 425 10 Loss (gain) on foreign currency transactions 4 (2) Loss on debt extinguishment — 69 FF&E replacement reserves 12 4 Share-based compensation expense 37 39 Amortization of contract acquisition costs 8 7 Net other expenses (revenues) from managed and franchised properties (30) 64 Other adjustments(1) (8) 7
Adjusted EBITDA $ 448 $ 198 ____________(1) Amount for the three months ended March 31, 2022 primarily includes a gain related to Hilton's investments in unconsolidated affiliates.
Both periods include severance and other items.
Three Months EndedMarch 31,
2022 2021Total revenues, as reported $ 1,721 $ 874
Add: amortization of contract acquisition costs 8 7 Less: other revenues from managed and franchised properties (1,051) (521)
Total revenues, as adjusted $ 678 $ 360
Adjusted EBITDA $ 448 $ 198
Adjusted EBITDA margin 66.1% 55.0%
12
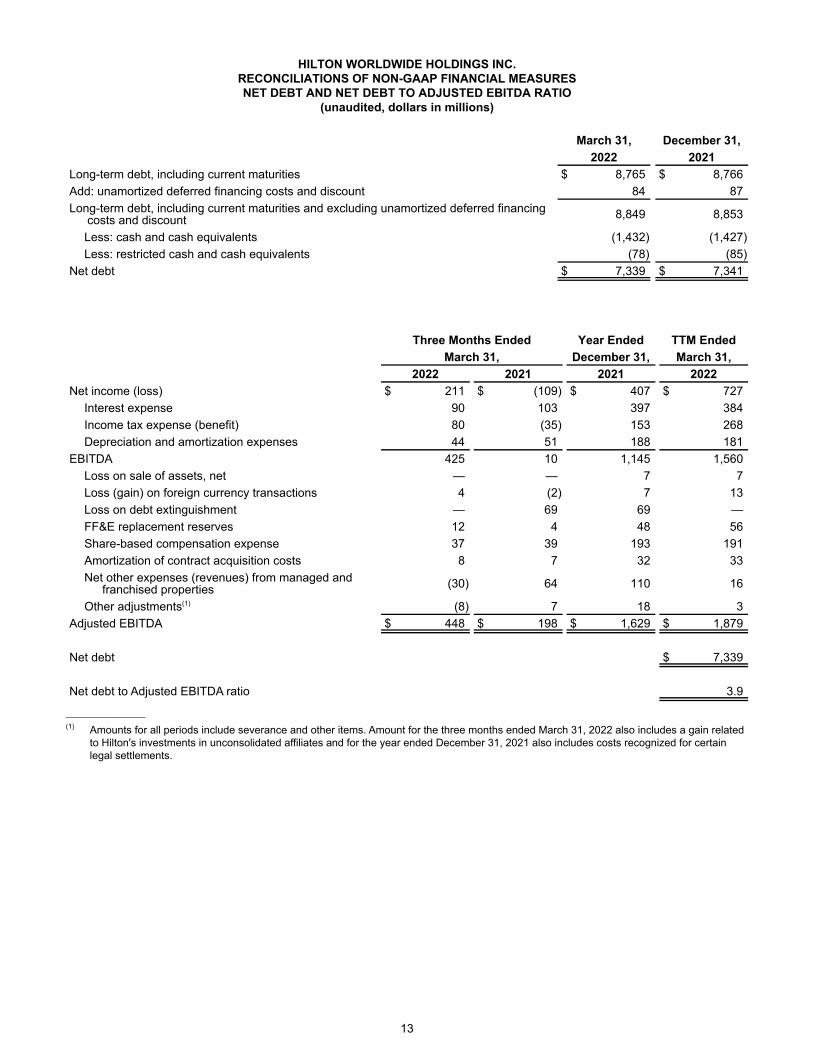
HILTON WORLDWIDE HOLDINGS INC.RECONCILIATIONS OF NON-GAAP FINANCIAL MEASURESNET DEBT AND NET DEBT TO ADJUSTED EBITDA RATIO
(unaudited, dollars in millions)
March 31, December 31,2022 2021
Long-term debt, including current maturities $ 8,765 $ 8,766 Add: unamortized deferred financing costs and discount 84 87 Long-term debt, including current maturities and excluding unamortized deferred financing
costs and discount 8,849 8,853
Less: cash and cash equivalents (1,432) (1,427) Less: restricted cash and cash equivalents (78) (85)
Net debt $ 7,339 $ 7,341
Three Months Ended Year Ended TTM EndedMarch 31, December 31, March 31,
2022 2021 2021 2022Net income (loss) $ 211 $ (109) $ 407 $ 727
Interest expense 90 103 397 384 Income tax expense (benefit) 80 (35) 153 268 Depreciation and amortization expenses 44 51 188 181
EBITDA 425 10 1,145 1,560 Loss on sale of assets, net — — 7 7 Loss (gain) on foreign currency transactions 4 (2) 7 13 Loss on debt extinguishment — 69 69 — FF&E replacement reserves 12 4 48 56 Share-based compensation expense 37 39 193 191 Amortization of contract acquisition costs 8 7 32 33 Net other expenses (revenues) from managed and
franchised properties (30) 64 110 16
Other adjustments(1) (8) 7 18 3 Adjusted EBITDA $ 448 $ 198 $ 1,629 $ 1,879
Net debt $ 7,339
Net debt to Adjusted EBITDA ratio 3.9 ____________(1) Amounts for all periods include severance and other items. Amount for the three months ended March 31, 2022 also includes a gain related
to Hilton's investments in unconsolidated affiliates and for the year ended December 31, 2021 also includes costs recognized for certain legal settlements.
13

HILTON WORLDWIDE HOLDINGS INC.RECONCILIATIONS OF NON-GAAP FINANCIAL MEASURES
OUTLOOK: NET INCOME AND DILUTED EPS, ADJUSTED FOR SPECIAL ITEMSFORECASTED 2022
(unaudited, in millions, except per share data)
Three Months EndingJune 30, 2022
Low Case High CaseNet income attributable to Hilton stockholders, before special items $ 250 $ 264 Diluted EPS, before special items(1) $ 0.89 $ 0.94 Special items(2):
Purchase accounting amortization $ 12 $ 12 FF&E replacement reserves 20 20
Total special items before tax 32 32 Income tax expense on special items (7) (7)
Total special items after tax $ 25 $ 25
Net income, adjusted for special items $ 275 $ 289 Diluted EPS, adjusted for special items(1) $ 0.98 $ 1.03
Year EndingDecember 31, 2022
Low Case High CaseNet income attributable to Hilton stockholders, before special items $ 1,001 $ 1,071 Diluted EPS, before special items(1) $ 3.56 $ 3.81 Special items(2):
Net other revenues from managed and franchised properties $ (30) $ (30) Purchase accounting amortization 47 47 FF&E replacement reserves 65 65 Other adjustment items (10) (9)
Total special items before tax 72 73 Income tax expense on special items (13) (13)
Total special items after tax $ 59 $ 60
Net income, adjusted for special items $ 1,060 $ 1,131 Diluted EPS, adjusted for special items(1) $ 3.77 $ 4.02 ____________(1) Does not include the effect of potential share repurchases.(2) See "—Net Income (Loss) and Diluted EPS, Adjusted for Special Items" for details of these special items.
14

HILTON WORLDWIDE HOLDINGS INC.RECONCILIATIONS OF NON-GAAP FINANCIAL MEASURES
OUTLOOK: ADJUSTED EBITDAFORECASTED 2022
(unaudited, in millions)
Three Months EndingJune 30, 2022
Low Case High CaseNet income $ 250 $ 264
Interest expense 108 108 Income tax expense 106 112 Depreciation and amortization expenses 41 41
EBITDA 505 525 FF&E replacement reserves 20 20 Share-based compensation expense 49 49 Amortization of contract acquisition costs 9 9 Other adjustments(1) 7 7
Adjusted EBITDA $ 590 $ 610
Year EndingDecember 31, 2022
Low Case High CaseNet income $ 1,001 $ 1,071
Interest expense 421 421 Income tax expense 415 444 Depreciation and amortization expenses 169 169
EBITDA 2,006 2,105 Loss on foreign currency transactions 4 4 FF&E replacement reserves 65 65 Share-based compensation expense 160 160 Amortization of contract acquisition costs 39 39 Net other revenues from managed and franchised properties (30) (30) Other adjustments(1) 6 7
Adjusted EBITDA $ 2,250 $ 2,350 ____________(1) Includes adjustments for severance and other items.
15

HILTON WORLDWIDE HOLDINGS INC.DEFINITIONS
Trailing Twelve Month Financial Information
This press release includes certain unaudited financial information for the trailing twelve months ("TTM") ended March 31, 2022, which is calculated as the three months ended March 31, 2022 plus the year ended December 31, 2021 less the three months ended March 31, 2021. This presentation is not in accordance with GAAP. However, the Company believes that this presentation provides useful information to investors regarding its recent financial performance, and it views this presentation of the four most recently completed fiscal quarters as a key measurement period for investors to assess its historical results. In addition, the Company's management uses TTM information to evaluate the Company's financial performance for ongoing planning purposes.
The pandemic had a material adverse impact on the Company's results for the TTM period ended March 31, 2022 when compared to periods prior to the onset of the pandemic. As such, this TTM period, as well as upcoming periods, are unlikely to be comparable to periods prior to the onset of the pandemic or to other periods affected by the pandemic, and are not indicative of future performance. As such, TTM information may not be useful for projecting future operating results.
Net Income (Loss), Adjusted for Special Items, and Diluted EPS, Adjusted for Special Items
Net income (loss), adjusted for special items, and diluted earnings (loss) per share ("EPS"), adjusted for special items, are not recognized terms under GAAP and should not be considered as alternatives to net income (loss) or other measures of financial performance or liquidity derived in accordance with GAAP. In addition, the Company's definition of net income (loss), adjusted for special items, and diluted EPS, adjusted for special items, may not be comparable to similarly titled measures of other companies.
Net income (loss), adjusted for special items, and diluted EPS, adjusted for special items, are included to assist investors in performing meaningful comparisons of past, present and future operating results and as a means of highlighting the results of the Company's ongoing operations.
EBITDA, Adjusted EBITDA and Adjusted EBITDA Margin
EBITDA, presented herein, reflects net income (loss), excluding interest expense, a provision for income tax benefit (expense) and depreciation and amortization expenses. Adjusted EBITDA, presented herein, is calculated as EBITDA, as previously defined, further adjusted to exclude certain items, including gains, losses, revenues and expenses in connection with: (i) asset dispositions for both consolidated and unconsolidated investments; (ii) foreign currency transactions; (iii) debt restructurings and retirements; (iv) furniture, fixtures and equipment ("FF&E") replacement reserves required under certain lease agreements; (v) share-based compensation; (vi) reorganization, severance, relocation and other expenses; (vii) non-cash impairment; (viii) amortization of contract acquisition costs; (ix) the net effect of reimbursable costs included in other revenues and other expenses from managed and franchised properties; and (x) other items.
Adjusted EBITDA margin represents Adjusted EBITDA as a percentage of total revenues, adjusted to exclude the amortization of contract acquisition costs and other revenues from managed and franchised properties.
The Company believes that EBITDA, Adjusted EBITDA and Adjusted EBITDA margin provide useful information to investors about the Company's financial condition and results of operations for the following reasons: (i) these measures are among the measures used by the Company's management team to evaluate its operating performance and make day-to-day operating decisions and (ii) these measures are frequently used by securities analysts, investors and other interested parties as a common performance measure to compare results or estimate valuations across companies in the industry. Additionally, these measures exclude certain items that can vary widely across different industries and among competitors within the Company's industry. For instance, interest expense and income taxes are dependent on company specifics, including, among other things, capital structure and operating jurisdictions, respectively, and, therefore, could vary significantly across companies. Depreciation and amortization expenses, as well as amortization of contract acquisition costs, are dependent upon company policies, including the method of acquiring and depreciating assets and the useful lives that are used. For Adjusted EBITDA, the Company also excludes items such as: (i) FF&E replacement reserves for leased hotels to be consistent with the treatment of capital expenditures for property and equipment, where payments for such capitalized assets are depreciated over their useful lives; (ii) share-based compensation, as this could vary widely among companies due to the different plans in place and the usage of them; (iii) the net effect of the Company's cost reimbursement revenues and reimbursed expenses, as the Company contractually does not operate the related programs to generate a profit over the terms of the respective contracts; and (iv) other items, such as amounts related to debt restructurings and debt retirements and reorganization and related severance costs, that are not core to the Company's operations and are not reflective of the Company's operating performance.
EBITDA, Adjusted EBITDA and Adjusted EBITDA margin are not recognized terms under GAAP and should not be considered as alternatives, either in isolation or as a substitute, for net income (loss) or other measures of financial performance or liquidity, including cash flows, derived in accordance with GAAP. Further, EBITDA, Adjusted EBITDA and Adjusted EBITDA margin have
16

limitations as analytical tools, may not be comparable to similarly titled measures of other companies and should not be considered as other methods of analyzing the Company's results as reported under GAAP.
Net Debt and Net Debt to Adjusted EBITDA Ratio
Net debt and net debt to Adjusted EBITDA ratio, presented herein, are non-GAAP financial measures that the Company uses to evaluate its financial leverage. Net debt is calculated as: long-term debt, including current maturities and excluding unamortized deferred financing costs and discount; reduced by: (i) cash and cash equivalents and (ii) restricted cash and cash equivalents. Beginning as of March 31, 2022, the Company has modified its definition of net debt to no longer include Hilton's share of unconsolidated affiliate debt. Since this debt is not consolidated by the Company, the modified definition more accurately reflects how the Company and the Company's investors evaluate Hilton's financial leverage, as well as its indebtedness.
Net debt should not be considered as a substitute to debt presented in accordance with GAAP, and net debt to Adjusted EBITDA ratio should not be considered as an alternative to measures of financial condition derived in accordance with GAAP. Net debt and net debt to Adjusted EBITDA ratio may not be comparable to similarly titled measures of other companies. The Company believes net debt and net debt to Adjusted EBITDA ratio provide useful information about its indebtedness to investors as they are frequently used by securities analysts, investors and other interested parties to compare the indebtedness between companies.
Comparable Hotels
The Company defines comparable hotels as those that: (i) were active and operating in the Company's system for at least one full calendar year as of the end of the current period, and open January 1st of the previous year; (ii) have not undergone a change in brand or ownership type during the current or comparable periods reported; and (iii) have not sustained substantial property damage, business interruption, undergone large-scale capital projects or for which comparable results were not available. Of the 6,832 hotels in the Company's system as of March 31, 2022, 6,069 hotels were classified as comparable hotels. The 763 non-comparable hotels included 99 hotels, or one percent of the total hotels in the Company's system, that were removed from the comparable group during the last twelve months because they have sustained substantial property damage, business interruption, undergone large-scale capital projects or comparable results were otherwise not available.
When considering business interruption in the context of the Company's definition of comparable hotels, no hotel that had completely or partially suspended operations on a temporary basis at any time as a result of the pandemic was excluded from the definition of comparable hotels on that basis alone. Despite these temporary suspensions of hotel operations, the Company believes that including these hotels within the hotel operating statistics of occupancy, average daily rate ("ADR") and revenue per available room ("RevPAR"), if they would have otherwise been included, reflects the underlying results of the business for the three months ended March 31, 2022 and 2021.
Occupancy
Occupancy represents the total number of room nights sold divided by the total number of room nights available at a hotel or group of hotels for a given period. Occupancy measures the utilization of the hotels' available capacity. Management uses occupancy to gauge demand at a specific hotel or group of hotels in a given period. Occupancy levels also help management determine achievable ADR pricing levels as demand for hotel rooms increases or decreases.
ADR
ADR represents hotel room revenue divided by the total number of room nights sold for a given period. ADR measures the average room price attained by a hotel, and ADR trends provide useful information concerning the pricing environment and the nature of the customer base of a hotel or group of hotels. ADR is a commonly used performance measure in the industry, and management uses ADR to assess pricing levels that the Company is able to generate by type of customer, as changes in rates charged to customers have different effects on overall revenues and incremental profitability than changes in occupancy, as described above.
RevPAR
RevPAR is calculated by dividing hotel room revenue by the total number of room nights available to guests for a given period. Management considers RevPAR to be a meaningful indicator of the Company's performance as it provides a metric correlated to two primary and key drivers of operations at a hotel or group of hotels, as previously described: occupancy and ADR. RevPAR is also a useful indicator in measuring performance over comparable periods for comparable hotels.
References to occupancy, ADR and RevPAR throughout this press release are presented on a comparable basis, based on the comparable hotels as of March 31, 2022, and references to ADR and RevPAR are presented on a currency neutral basis, unless otherwise noted. As such, comparisons of these hotel operating statistics for the three months ended March 31, 2022 and 2021 or 2019, use the foreign currency exchange rates used to translate the results of the Company's foreign operations within its condensed consolidated financial statements for the three months ended March 31, 2022.
17