hilton head island airport master plan update
221
HILTON HEAD ISLAND AIRPORT MASTER PLAN UPDATE Table of Contents TALBERT & BRIGHT i TABLE OF CONTENTS EXECUTIVE SUMMARY ...................................................................................................................... E-i E.1 PURPOSE OF THE HILTON HEAD ISLAND AIRPORT MASTER PLAN UPDATE ...................... i E.1.1 Key Issues ............................................................................................................................................................... i E.2 EXISTING FACILITIES SUMMARY ................................................................................................................ i E.3 FORECAST SUMMARY ...................................................................................................................................... iii E.4 FACILITY REQUIREMENTS SUMMARY .................................................................................................... iii E.5 SUMMARY OF ALTERNATIVES AND RECOMMENDATION ........................................................... iii E.6 AIRPORT DEVELOMENT PROGRAM ........................................................................................................ iii E.7 FINANCIAL ANALYSIS SUMMARY AND RECOMMENDATIONS ................................................... iv E.8 PUBLIC INVOLVEMENT ................................................................................................................................. iv E.9 AIRPORT LAYOUT PLAN ................................................................................................................................. v INTRODUCTION .................................................................................................................................... 1 1.1 GOALS AND OBJECTIVES OF A MASTER PLAN .................................................................................... 1 1.2 PURPOSE OF THE HILTON HEAD ISLAND AIRPORT MASTER PLAN UPDATE ..................... 1 1.2.1 Key Issues .............................................................................................................................................................. 1 1.2.2 Airport Layout Plans ............................................................................................................................................ 1 1.3 HILTON HEAD ISLAND ................................................................................................................................... 2 EXISTING CONDITIONS....................................................................................................................... 4 2.1 AREA AIRPORTS .................................................................................................................................................. 4 2.1.1 Area Commercial Service Airports ..................................................................................................................... 4 2.1.1.1 Hilton Head Island Airport ....................................................................................................................... 4 2.1.1.2 Savannah-Hilton Head International Airport......................................................................................... 4 2.1.1.3 Charleston International Airport .............................................................................................................. 4 2.1.2 Area General Aviation Airports.......................................................................................................................... 4 2.1.2.1 Beaufort County Airport ........................................................................................................................... 4 2.1.2.2 Ridgeland Airport ....................................................................................................................................... 4 2.1.2.3 Lowcountry Regional Airport ................................................................................................................... 5 2.1.3 Vicinity Aeronautical Chart Obstructions ......................................................................................................... 5 2.2 HILTON HEAD ISLAND AIRPORT ............................................................................................................... 5 2.2.1 Airport Location ................................................................................................................................................... 5 2.2.2 Airport History ...................................................................................................................................................... 5 2.2.3 Part 139 Certification ........................................................................................................................................... 5 2.2.4 Historical Funding ................................................................................................................................................ 6 2.2.5 Airport Facility Directory .................................................................................................................................... 6 2.2.5.1 Airport Name and Associated City .......................................................................................................... 6 2.2.5.2 Airport Identifier ........................................................................................................................................ 6 2.2.5.3 Airport Coordinates (Airport Reference Point) ..................................................................................... 6 2.2.5.4 Navigational Charts .................................................................................................................................... 6 2.2.5.5 Instrument Approaches ............................................................................................................................. 6 2.2.5.6 Obstacles .................................................................................................................................................... 10 2.2.6 Airport Inventory................................................................................................................................................ 10 2.2.6.1 Runway/Taxiways .................................................................................................................................... 10 2.2.6.2 Apron ......................................................................................................................................................... 10 2.2.6.3 Commercial Service Terminal ................................................................................................................. 13 2.2.6.4 General Aviation Terminal ...................................................................................................................... 13 2.2.6.5 Aviation Services....................................................................................................................................... 13 2.2.6.6 Automobile Parking ................................................................................................................................. 13 2.2.6.7 Aircraft Rescue and Firefighting Facilities ............................................................................................ 15 2.2.6.8 Hangars ...................................................................................................................................................... 15 2.2.6.9 Air Traffic Control Tower....................................................................................................................... 15 2.2.6.10 Based Aircraft ............................................................................................................................................ 16 2.2.6.11 Modification of Standards ....................................................................................................................... 16 AVIATION FORECASTS ........................................................................................................................ 17 3.1 FORECASTS OF AVIATION ACTIVITY ..................................................................................................... 17 3.1.1 Forecast Planning Horizon................................................................................................................................ 17 3.1.2 Forecast Approach ............................................................................................................................................. 17 3.2 EXISTING AIRPORT ACTIVITY LEVELS ................................................................................................. 17 3.3 COMMERCIAL SERVICE AIR CARRIER MARKET ................................................................................ 17 3.3.1 Commercial Service Air Carrier Passengers (Scheduled) .............................................................................. 17 3.3.2 Commercial Service Air Carrier Enplanement Forecast Scenarios ............................................................. 18 3.4 FORECAST OF BASED AIRCRAFT .............................................................................................................. 18 3.5 FORECAST OF AIRCRAFT OPERATIONS ................................................................................................ 20 3.5.1 Commercial Service Annual Operations Forecast ......................................................................................... 20 3.5.2 General Aviation and Military Annual Operations Forecast ........................................................................ 21 3.5.3 Local/Itinerant Operations Forecast ............................................................................................................... 22 3.6 CRITICAL AIRCRAFT FORECAST ............................................................................................................... 22 3.7 FORECAST OF AIRPORT PEAKING CHARACTERISTICS ................................................................. 23 3.8 INSTRUMENT OPERATIONS FORECAST................................................................................................ 23 3.9 SUMMARY ............................................................................................................................................................. 23 FACILITY REQUIREMENTS................................................................................................................ 24 4.1 DEMAND CAPACITY ANALYSIS ................................................................................................................. 24 4.1.1 Airfield Capacity.................................................................................................................................................. 24 4.1.2 Aircraft Delay ...................................................................................................................................................... 25 4.1.3 Airport Service Level .......................................................................................................................................... 25 4.1.4.1 Airport Reference Code........................................................................................................................... 25 4.1.4.2 Visibility Minimums ................................................................................................................................. 25 4.2 AIRFIELD GEOMETRY ................................................................................................................................... 26 4.2.1 Runway Wind Coverage..................................................................................................................................... 26 4.2.2 Runway Length Requirements .......................................................................................................................... 26 4.2.2.1 Procedure for Runway Length Determination..................................................................................... 26 4.2.2.2 Runway Length Measurement ................................................................................................................ 28 4.2.3 Runway Width ..................................................................................................................................................... 29 4.2.4 Pavement Strength and Condition ................................................................................................................... 29 4.2.5 Runway Protection Zone ................................................................................................................................... 29 4.2.6 Runway Safety Area ............................................................................................................................................ 31 4.2.7 Runway Obstacle Free Zone ............................................................................................................................. 31 4.2.8 Runway Obstacle Free Area .............................................................................................................................. 31
-
Upload
khangminh22 -
Category
Documents
-
view
0 -
download
0
Transcript of hilton head island airport master plan update
HILTON HEAD ISLAND AIRPORT
MASTER PLAN UPDATE
Table of Contents TALBERT & BRIGHT i
TABLE OF CONTENTS EXECUTIVE SUMMARY ...................................................................................................................... E-i E.1 PURPOSE OF THE HILTON HEAD ISLAND AIRPORT MASTER PLAN UPDATE ...................... i
E.1.1 Key Issues ............................................................................................................................................................... i E.2 EXISTING FACILITIES SUMMARY ................................................................................................................ i E.3 FORECAST SUMMARY ...................................................................................................................................... iii E.4 FACILITY REQUIREMENTS SUMMARY .................................................................................................... iii E.5 SUMMARY OF ALTERNATIVES AND RECOMMENDATION ........................................................... iii E.6 AIRPORT DEVELOMENT PROGRAM ........................................................................................................ iii E.7 FINANCIAL ANALYSIS SUMMARY AND RECOMMENDATIONS ................................................... iv E.8 PUBLIC INVOLVEMENT ................................................................................................................................. iv E.9 AIRPORT LAYOUT PLAN ................................................................................................................................. v INTRODUCTION .................................................................................................................................... 1 1.1 GOALS AND OBJECTIVES OF A MASTER PLAN .................................................................................... 1 1.2 PURPOSE OF THE HILTON HEAD ISLAND AIRPORT MASTER PLAN UPDATE ..................... 1
1.2.1 Key Issues .............................................................................................................................................................. 1 1.2.2 Airport Layout Plans ............................................................................................................................................ 1
1.3 HILTON HEAD ISLAND ................................................................................................................................... 2 EXISTING CONDITIONS ....................................................................................................................... 4 2.1 AREA AIRPORTS .................................................................................................................................................. 4
2.1.1 Area Commercial Service Airports ..................................................................................................................... 4 2.1.1.1 Hilton Head Island Airport ....................................................................................................................... 4 2.1.1.2 Savannah-Hilton Head International Airport......................................................................................... 4 2.1.1.3 Charleston International Airport .............................................................................................................. 4
2.1.2 Area General Aviation Airports .......................................................................................................................... 4 2.1.2.1 Beaufort County Airport ........................................................................................................................... 4 2.1.2.2 Ridgeland Airport ....................................................................................................................................... 4 2.1.2.3 Lowcountry Regional Airport ................................................................................................................... 5
2.1.3 Vicinity Aeronautical Chart Obstructions ......................................................................................................... 5 2.2 HILTON HEAD ISLAND AIRPORT ............................................................................................................... 5
2.2.1 Airport Location ................................................................................................................................................... 5 2.2.2 Airport History ...................................................................................................................................................... 5 2.2.3 Part 139 Certification ........................................................................................................................................... 5 2.2.4 Historical Funding ................................................................................................................................................ 6 2.2.5 Airport Facility Directory .................................................................................................................................... 6
2.2.5.1 Airport Name and Associated City .......................................................................................................... 6 2.2.5.2 Airport Identifier ........................................................................................................................................ 6 2.2.5.3 Airport Coordinates (Airport Reference Point) ..................................................................................... 6 2.2.5.4 Navigational Charts .................................................................................................................................... 6 2.2.5.5 Instrument Approaches ............................................................................................................................. 6 2.2.5.6 Obstacles .................................................................................................................................................... 10
2.2.6 Airport Inventory ................................................................................................................................................ 10
2.2.6.1 Runway/Taxiways .................................................................................................................................... 10 2.2.6.2 Apron ......................................................................................................................................................... 10 2.2.6.3 Commercial Service Terminal ................................................................................................................. 13 2.2.6.4 General Aviation Terminal ...................................................................................................................... 13 2.2.6.5 Aviation Services ....................................................................................................................................... 13 2.2.6.6 Automobile Parking ................................................................................................................................. 13 2.2.6.7 Aircraft Rescue and Firefighting Facilities ............................................................................................ 15 2.2.6.8 Hangars ...................................................................................................................................................... 15 2.2.6.9 Air Traffic Control Tower ....................................................................................................................... 15 2.2.6.10 Based Aircraft ............................................................................................................................................ 16 2.2.6.11 Modification of Standards ....................................................................................................................... 16
AVIATION FORECASTS ........................................................................................................................ 17 3.1 FORECASTS OF AVIATION ACTIVITY ..................................................................................................... 17
3.1.1 Forecast Planning Horizon................................................................................................................................ 17 3.1.2 Forecast Approach ............................................................................................................................................. 17
3.2 EXISTING AIRPORT ACTIVITY LEVELS ................................................................................................. 17 3.3 COMMERCIAL SERVICE AIR CARRIER MARKET ................................................................................ 17
3.3.1 Commercial Service Air Carrier Passengers (Scheduled) .............................................................................. 17 3.3.2 Commercial Service Air Carrier Enplanement Forecast Scenarios ............................................................. 18
3.4 FORECAST OF BASED AIRCRAFT .............................................................................................................. 18 3.5 FORECAST OF AIRCRAFT OPERATIONS ................................................................................................ 20
3.5.1 Commercial Service Annual Operations Forecast ......................................................................................... 20 3.5.2 General Aviation and Military Annual Operations Forecast ........................................................................ 21 3.5.3 Local/Itinerant Operations Forecast ............................................................................................................... 22
3.6 CRITICAL AIRCRAFT FORECAST ............................................................................................................... 22 3.7 FORECAST OF AIRPORT PEAKING CHARACTERISTICS ................................................................. 23 3.8 INSTRUMENT OPERATIONS FORECAST ................................................................................................ 23 3.9 SUMMARY ............................................................................................................................................................. 23 FACILITY REQUIREMENTS ................................................................................................................ 24 4.1 DEMAND CAPACITY ANALYSIS ................................................................................................................. 24
4.1.1 Airfield Capacity .................................................................................................................................................. 24 4.1.2 Aircraft Delay ...................................................................................................................................................... 25 4.1.3 Airport Service Level .......................................................................................................................................... 25
4.1.4.1 Airport Reference Code ........................................................................................................................... 25 4.1.4.2 Visibility Minimums ................................................................................................................................. 25
4.2 AIRFIELD GEOMETRY ................................................................................................................................... 26 4.2.1 Runway Wind Coverage ..................................................................................................................................... 26 4.2.2 Runway Length Requirements .......................................................................................................................... 26
4.2.2.1 Procedure for Runway Length Determination ..................................................................................... 26 4.2.2.2 Runway Length Measurement ................................................................................................................ 28
4.2.3 Runway Width ..................................................................................................................................................... 29 4.2.4 Pavement Strength and Condition ................................................................................................................... 29 4.2.5 Runway Protection Zone ................................................................................................................................... 29 4.2.6 Runway Safety Area ............................................................................................................................................ 31 4.2.7 Runway Obstacle Free Zone ............................................................................................................................. 31 4.2.8 Runway Obstacle Free Area .............................................................................................................................. 31

HILTON HEAD ISLAND AIRPORT
MASTER PLAN UPDATE
Table of Contents TALBERT & BRIGHT ii
4.2.9 Runway Line of Sight ......................................................................................................................................... 31 4.2.10 Runway Edge Lighting and Signage ................................................................................................................. 32 4.2.11 Taxiway Requirements ....................................................................................................................................... 32 4.2.12 Taxiway and Taxilane Obstacle Free Areas .................................................................................................... 32 4.2.13 Parallel Taxiways ................................................................................................................................................. 32 4.2.14 Taxiway Edge Lighting and Signage ................................................................................................................ 32 4.2.15 Runway to Taxiway Separation ......................................................................................................................... 32 4.2.16 Taxilane System ................................................................................................................................................... 32
4.3 FACILITY REQUIREMENTS .......................................................................................................................... 33 4.3.1 Airside Facility Requirements ........................................................................................................................... 33
4.3.1.1 Based Aircraft ............................................................................................................................................ 33 4.3.1.2 T-Hangar Storage ..................................................................................................................................... 33 4.3.1.3 Conventional Hangar Storage ................................................................................................................. 33 4.3.1.4 Apron Area ................................................................................................................................................ 33 4.3.1.5 Transient Aircraft Storage ....................................................................................................................... 34 4.3.1.6 Fueling Facilities ....................................................................................................................................... 34 4.3.1.7 Airfield Maintenance Equipment and Storage Facilities ..................................................................... 34 4.3.1.8 Aircraft Rescue and Firefighting Facilities ............................................................................................ 34 4.3.1.9 Perimeter Fencing ..................................................................................................................................... 34
4.3.2 Landside Facility Requirements ........................................................................................................................ 34 4.3.2.1 Commercial Service Terminal Building ................................................................................................. 34 4.3.2.2 General Aviation Terminal Building ...................................................................................................... 37 4.3.2.3 Automobile Parking ................................................................................................................................. 37 4.3.2.4 Landside Access ........................................................................................................................................ 37
4.4 AIRSPACE AND NAVAID REQUIREMENTS ........................................................................................... 37 4.4.1 Airspace Capacity ................................................................................................................................................ 37 4.4.2 Approach Procedures ......................................................................................................................................... 37 4.4.3 Visual Guidance Lighting System ..................................................................................................................... 37 4.4.4 Automated Weather Observing System .......................................................................................................... 38
4.5 FACILITY REQUIREMENTS SUMMARY ................................................................................................... 38 ALTERNATIVES DEVELOPMENT AND EVALUATION ............................................................... 39 5.1 RUNWAY EXTENSION ALTERNATIVES ANALYSIS........................................................................... 39
5.1.1 Existing 4,300-Foot Runway (Current Configuration) .................................................................................. 39 5.1.2 Existing 4,300-Foot Runway (Configuration in Compliance) ...................................................................... 39 5.1.3 Alternative No. 1 (5,400-Foot Runway Unconstrained Configuration) ..................................................... 42 5.1.4 Alternative No. 2 (5,400-Foot Runway Constrained Configuration) .......................................................... 42
5.1.4.1 Alternative No. 2 – Phase 1 (5,000-Foot Runway Constrained Configuration) ............................. 42 5.1.4.2 Alternative No. 2 – Phase 1a (4,600-Foot Runway Constrained Configuration) ............................ 42
5.1.5 Alternative No. 3 (5,400-Foot Runway Realigned and Constrained Configuration) ................................ 46 5.1.6 Alternative No. 4 (New Airport – 5,400 Feet) ............................................................................................... 46
5.2 SUMMARY OF ALTERNATIVES AND RECOMMENDATION .......................................................... 46 ENVIRONMENTAL CONSIDERATIONS .......................................................................................... 49 6.1 AIR QUALITY ...................................................................................................................................................... 49 6.2 COASTAL RESOURCES .................................................................................................................................... 50 6.3 COMPATIBLE LAND USE ............................................................................................................................... 51 6.4 CONSTRUCTION IMPACTS ........................................................................................................................... 54
6.5 DEPARTMENT OF TRANSPORTATION ACT: SECTION 4(f) ............................................................ 54 6.6 FARMLANDS ....................................................................................................................................................... 55 6.7 FISH, WILDLIFE, AND PLANTS ................................................................................................................... 56 6.8 FLOODPLAINS ................................................................................................................................................... 56 6.9 HAZARDOUS MATERIALS, POLLUTION PREVENTION, AND SOLID WASTE ....................... 60
6.9.1 Hazardous Materials ........................................................................................................................................... 60 6.9.2 Pollution Prevention ........................................................................................................................................... 60 6.9.3 Solid Waste .......................................................................................................................................................... 60
6.10 HISTORICAL, ARCHITECTURAL, ARCHAEOLOGICAL, AND CULTURAL RESOURCES ......................................................................................................................................................... 60
6.10.1 History of Hilton Head Island .......................................................................................................................... 60 6.10.2 Mitchelville ........................................................................................................................................................... 60 6.10.3 Previously Identified Cultural Resources ........................................................................................................ 62
6.11 LIGHT EMISSIONS AND VISUAL IMPACTS ............................................................................................ 62 6.11.1 Light Emissions ................................................................................................................................................... 62 6.11.2 Visual Impacts ..................................................................................................................................................... 62
6.12 NATURAL RESOURCES AND ENERGY SUPPLY .................................................................................. 62 6.13 NOISE ..................................................................................................................................................................... 63
6.13.1 Definition of Noise ............................................................................................................................................ 63 6.13.2 Hilton Head Island Airport Noise Assessment .............................................................................................. 64 6.13.3 Noise Compatibility Study ................................................................................................................................. 65
6.14 SECONDARY (INDUCED) IMPACTS .......................................................................................................... 65 6.15 SOCIOECONOMIC IMPACTS, ENVIRONMENTAL JUSTICE, AND CHILDREN'S
ENVIRONMENTAL HEALTH AND SAFETY RISKS ............................................................................. 65 6.15.1 Socioeconomic Impacts ..................................................................................................................................... 65 6.15.2 Environmental Justice ........................................................................................................................................ 68 6.15.3 Children’s Environmental Health and Safety Risks ....................................................................................... 70
6.16 WATER QUALITY .............................................................................................................................................. 70 6.17 WETLANDS .......................................................................................................................................................... 71 6.18 WILD AND SCENIC RIVERS .......................................................................................................................... 73 6.19 INDIRECT AND CUMULATIVE IMPACTS ............................................................................................... 73 AIRPORT LAYOUT PLANS ................................................................................................................... 74 7.1 COVER SHEET .................................................................................................................................................... 74 7.2 AIRPORT LAYOUT PLAN ............................................................................................................................... 74 7.3 TERMINAL AREA PLAN ................................................................................................................................. 74 7.4 AIRPORT AIRSPACE PROFILE AND INNER APPROACH SURFACE DRAWING ..................... 74 7.5 AIRPORT AIRSPACE DRAWING .................................................................................................................. 74 7.6 LAND USE PLAN................................................................................................................................................ 74 7.7 AIRPORT PROPERTY MAP ............................................................................................................................. 74 7.8 CHECKLIST .......................................................................................................................................................... 75 FACILITIES IMPLEMENTATION PLAN ........................................................................................... 92 8.1 AIRPORT DEVELOMENT PROGRAM ....................................................................................................... 92 FINANCIAL FEASIBILITY ANALYSIS ................................................................................................ 93 9.1 AIRPORT FINANCIAL STRUCTURE ........................................................................................................... 93 9.2 CAPITAL IMPROVEMENT PROGRAM ...................................................................................................... 93

HILTON HEAD ISLAND AIRPORT
MASTER PLAN UPDATE
Table of Contents TALBERT & BRIGHT iii
9.3 DEVELOPMENT PLAN FINANCING......................................................................................................... 93 9.3.1 Potential Funding Sources ................................................................................................................................. 93 9.3.2 Federal Aviation Administration – Aviation Trust Fund ............................................................................. 93
9.3.2.1 Overview and Status of the Airport Improvement Program ............................................................. 95 9.3.2.2 Obligations and Assurances .................................................................................................................... 96
9.3.3 Airport Improvement Program - Funding Sources ....................................................................................... 96 9.3.3.1 Passenger Entitlement Grants ................................................................................................................ 96 9.3.3.2 Cargo Service Entitlement Grants ......................................................................................................... 97 9.3.3.3 Discretionary Grants ................................................................................................................................ 97
9.3.4 Airport Improvement Program Eligibility and Funding Assumptions....................................................... 97 9.3.5 Facilities and Equipment Program ................................................................................................................... 97 9.3.6 South Carolina Aeronautics Commission ....................................................................................................... 97 9.3.7 Third-Party/Tenant Financing ......................................................................................................................... 98 9.3.8 Non-Traditional Funding Sources .................................................................................................................... 98 9.3.9 Local Funding Requirement .............................................................................................................................. 99 9.3.10 FAA-Approved Passenger Facility Charges .................................................................................................... 99 9.3.11 Contract Facility Charges ................................................................................................................................... 99 9.3.12 County’s Remaining Funding Requirement .................................................................................................... 99 9.3.13 Airport Cash Flows and Reserves .................................................................................................................... 99 9.3.14 General Aviation Financing Alternative .......................................................................................................... 99 9.3.15 Allocation of Average Annual Debt Service to Project Elements ............................................................ 100
9.4 HISTORICAL FINANCIAL INFORMATION ........................................................................................... 100 9.5 PRO FORMA CASH FLOW ANALYSIS ...................................................................................................... 101
9.5.1 Operating Revenues ......................................................................................................................................... 101 9.5.2 Operating Expenses ......................................................................................................................................... 101
9.5.2.1 Personnel Services .................................................................................................................................. 101 9.5.2.2 Other Operating Expenses ................................................................................................................... 101
9.5.3 Non-Operating Revenue and Expense .......................................................................................................... 101 9.5.4 Capital Improvement Program – Local Share .............................................................................................. 101 9.5.5 Pro Forma Cash Flow Analysis – Summary ................................................................................................. 102
9.6 SUMMARY AND RECOMMENDATIONS ................................................................................................ 102
APPENDICES A ACRONYMS AND ABBREVIATIONS ..................................................................................... A-1 B PUBLIC INVOLVEMENT ....................................................................................................... B-1 B.1 PUBLIC INVOLVEMENT .............................................................................................................................. B-1
B.1.1 How was public participation accomplished for the Master Plan Update? ............................................. B-1 B.1.2 What are the goals of public involvement? ................................................................................................... B-1
B.2 AUGUST 27-28, 2009, PUBLIC COMMENT MEETING ........................................................................ B-1 B.2.1 What was the purpose of the public comment meeting? ............................................................................ B-1 B.2.2 What were the survey results? ......................................................................................................................... B-2 B.2.3 What were the public’s goals for the airport? ............................................................................................... B-2 B.2.4 What were the public’s options for the airport? ........................................................................................... B-2 B.2.5 What were the public’s issues of the airport? ............................................................................................... B-3
B.2.6 What were the public’s facts on the airport? ................................................................................................ B-3 B.2.7 What was the public’s idea of airport strengths? .......................................................................................... B-4 B.2.8 What was the public’s idea of airport weaknesses? ...................................................................................... B-4 B.2.9 What was the public’s idea of airport opportunities? .................................................................................. B-4 B.2.10 What was the public’s idea of airport threats? .............................................................................................. B-4
B.3 MARCH 15-16, 2010, PUBLIC COMMENT MEETING .......................................................................... B-5 B.3.1 What was the purpose of the public comment meeting? ............................................................................ B-5 B.3.2 What were the survey results? ......................................................................................................................... B-5 B.3.3 Response to Questions .................................................................................................................................... B-6
B.3.3.1 Economy .................................................................................................................................................. B-6 B.3.3.2 Environment ........................................................................................................................................... B-6 B.3.3.3 Multiple Questions ................................................................................................................................. B-6 B.3.3.4 Airport/Airline ........................................................................................................................................ B-8 B.3.3.5 Location/Other ...................................................................................................................................... B-8
B.4 MAY 24-25, 2010, PUBLIC MEETING ......................................................................................................... B-9 B.4.1 What was the purpose of the public comment meeting? ............................................................................ B-9 B.4.2 What were the survey results? ......................................................................................................................... B-9 B.4.3 Response to Questions .................................................................................................................................... B-9
B.5 PRESENTATIONS TO BEAUFORT COUNTY AND HILTON HEAD ISLAND TOWN COUNCILS ......................................................................................................................................... B-11
B.6 MEETINGS WITH AND PRESENTATIONS TO FAA AND SCAC ................................................. B-11 Exhibit B.1 Master Plan Status Update – November 17, 2009 and November 23, 2009 ......................... B-12 Exhibit B.2 Master Plan Status Update – March 9, 2010 .............................................................................. B-13 Exhibit B.3 Master Plan Status Update – May 19, 2010 ................................................................................ B-16 Exhibit B.4 Master Plan Status Update – July 12, 2010 ................................................................................. B-19 Exhibit B.5 Responses to Consolidated List of Questions – June 30, 2010 .............................................. B-21 Exhibit B.6 Responses to Master Plan Update Draft Final Report Questions Received
October 13 and 19, 2010 ............................................................................................................................... B-34 B.6.1 Questions Not Answered from March 15-16, 2010, Public Comment Meeting .................................. B-34 B.6.2 Questions Not Answered from May 24-25, 2010, Public Comment Meeting ...................................... B-34 B.6.3 Stewart Rodman’s (Beaufort County Council) Questions (Received October 14, 2010) .................... B-35 B.6.4 Rick Caporale’s (Beaufort County Council) Questions (Received October 14 and 19, 2010) ............ B-38 B.6.5 Joe Zimmerman’s (Beaufort County Airports Board) Questions (Received October 19,
2010) ................................................................................................................................................................. B-40 B.6.6 Ken Heitzke’s (Town of Hilton Head Island Council) Questions (Received October 19,
2010) ................................................................................................................................................................. B-44 B.6.7 Steve Baer’s (Beaufort County Council) Questions (Received October 19, 2010) ............................... B-48 Exhibit B.7 Master Plan Update Summary – October 27, 2010 ................................................................... B-52 Exhibit B.8 Concurrence Correspondence and Resolutions ......................................................................... B-56
C INSTRUMENT FLIGHT RULES DATA ................................................................................. C-1 C.1 IFR OPERATIONS AT HXD IN 2009 .......................................................................................................... C-1 C.2 IFR OPERATIONS AT HXD IN 2008 .......................................................................................................... C-2 C.3 IFR OPERATIONS AT HXD IN 2007 .......................................................................................................... C-3 C.4 IFR OPERATIONS AT HXD IN 2006 .......................................................................................................... C-4 C.5 IFR OPERATIONS AT HXD IN 2005 .......................................................................................................... C-5 C.6 IFR OPERATIONS AT HXD IN 2004 .......................................................................................................... C-6 C.7 IFR OPERATIONS AT HXD IN 2003 .......................................................................................................... C-7

HILTON HEAD ISLAND AIRPORT
MASTER PLAN UPDATE
Table of Contents TALBERT & BRIGHT iv
C.8 IFR OPERATIONS AT HXD IN 2002 .......................................................................................................... C-9 C.9 IFR OPERATIONS AT HXD IN 2001 ........................................................................................................ C-10 C.10 IFR OPERATIONS AT HXD IN 2000 ........................................................................................................ C-11 C.11 SINGLE-ENGINE PISTON AIRCRAFT ................................................................................................... C-12 C.12 MULTI-ENGINE PISTON AIRCRAFT ..................................................................................................... C-13 C.13 TURBOPROP AIRCRAFT ............................................................................................................................. C-14 C.14 JET AIRCRAFT ................................................................................................................................................ C-14 C.15 HELICOPTERS ................................................................................................................................................ C-15 D BEAUFORT COUNTY AND TOWN OF HILTON HEAD ISLAND ISSUES ..................... D-1 D.1 EMERGENCY OPERATIONS ..................................................................................................................... D-1
D.1.1 South Carolina Hurricane Plan for Hilton Head Island ............................................................................. D-1 D.1.2 Role of Hilton Head Island Airport in the Beaufort County Emergency Management Plan .............. D-1 D.1.3 Role of Hilton Head Island Airport in the Town of Hilton Head Island Emergency
Management Plan............................................................................................................................................. D-1 D.1.4 Conclusion ........................................................................................................................................................ D-2 D.1.5 Recommendation for the Role of Hilton Head Island Airport ................................................................ D-2
D.2 COMMERCIAL SERVICE .............................................................................................................................. D-3 D.2.1 Air Service Analysis Introduction .................................................................................................................. D-3 D.2.2 Air Service Demand and the Air Service Area ............................................................................................ D-3 D.2.3 Airline Service Patterns ................................................................................................................................... D-3 D.2.4 Historical Airline Activity ............................................................................................................................... D-3 D.2.5 Passenger Demand Profile ............................................................................................................................. D-4 D.2.6 Airport Constraints .......................................................................................................................................... D-5 D.2.7. Analysis Summary ............................................................................................................................................ D-5 D.2.8 Conclusion ........................................................................................................................................................ D-6 D.2.9 Recommendation ............................................................................................................................................. D-6
D.3 LAND AND FACILITY REQUIREMENTS .............................................................................................. D-6 D.3.1 Airport Property Limitations ......................................................................................................................... D-6 D.3.2 Impact of Airport Property Limitations ....................................................................................................... D-6
E INTEGRATED NOISE MODEL INPUT DATA .................................................................... E-1 E.1 EXISTING OPERATIONS REPORT .......................................................................................................... E-1 E.2 FUTURE OPERATIONS REPORT............................................................................................................... E-5 F PRELIMINARY PROJECT COST ESTIMATES ..................................................................... F-1
TABLES E.2-1 Inventory of Existing Facilities ................................................................................................................... E-ii E.3-1 Aviation Forecast Summary ........................................................................................................................ E-iii E-4-1 Facility Requirements Summary ................................................................................................................. E-iii E-5-1 Alternative Runway Lengths Preliminary Project Cost Estimate Summary ........................................ E-iii E.6-1 Preliminary Project Cost Estimates (2010 $) ............................................................................................ E-iv
2.1.1-1 Commercial Service Aiport Comparisons ..................................................................................................... 4 2.2.3-1 Part 139 Requirements ...................................................................................................................................... 6 2.2.4-1 Grant History ..................................................................................................................................................... 7 2.2.5.5-1 Airport Approach Minimums ........................................................................................................................ 10 2.2.6-1 Inventory of Existing Facilities ..................................................................................................................... 12 2.3.5.10-1 Based Aircraft .................................................................................................................................................. 16 3.2-1 Current Airport Activity ................................................................................................................................. 17 3.3.2-1 Enplanements Forecast Comparison ........................................................................................................... 18 3.4-1 Based Aircraft Growth Rate Comparison ................................................................................................... 18 3.4-2 Historical Based Aircraft Forecast Comparison ......................................................................................... 19 3.4-3 Based Aircraft Forecast by Aircraft Type .................................................................................................... 20 3.5.1-1 Commercial Service Operations Forecast .................................................................................................... 20 3.5.2-1 General Aviation and Military Forecast Operations .................................................................................. 21 3.5.2-2 Annual Operations Forecast Comparison ................................................................................................... 22 3.5.3-1 Annual Operations by Type ........................................................................................................................... 22 3.6-1 Critical Aircraft Forecasts ............................................................................................................................... 22 3.6-2 Forecast of Aircraft Mix by FAA Design Groups (2010-2029) ............................................................... 22 3.7-1 Airport Peaking Charactistics (2009-2029) .................................................................................................. 23 3.8-1 Forecast Instrument Operations ................................................................................................................... 23 3.9-1 Aviation Forecast Summary ........................................................................................................................... 23 4.1.1-1 Forecast Demand as Percentage of Annual Service Volume .................................................................... 24 4.1.1-2 Forecast Demand as Percentage of Hourly Capacity ................................................................................. 24 4.1.2-1 Aircraft Delay Calculations ............................................................................................................................ 25 4.1.4.1-1 Aircraft Approach Category .......................................................................................................................... 25 4.1.4.1-2 Aircraft Design Group ................................................................................................................................... 25 4.1.4.2-1 Airport Approach Minimums ........................................................................................................................ 26 4.2.1-1 Runway Wind Coverage ................................................................................................................................. 26 4.2.2.1-1 Methodology for Determining Runway Length ......................................................................................... 26 4.2.2.1-2 Airplanes that Make Up 75 Percent of the Fleet ........................................................................................ 27 4.2.2.1-3 Remaining 25 Percent of Airplanes that Make Up 100 Percent of the Fleet ......................................... 27 4.2.2.1-4 Critical Design Aircraft IFR Data ................................................................................................................. 27 4.2.2.2-1 Family of Critical Design Aircraft ................................................................................................................. 28 4.2.2.2-2 Critical Design Aircraft Departure Haul Lengths ....................................................................................... 30 4.2.2.2-3 Runway Length Requirement Based on Aircraft Airport Planning Manual Design Curves ................ 29 4.2.5-1 Runway Prorection Zone Requirements ...................................................................................................... 31 4.2.6-1 Runway Safety Area Dimensions and Design Standards........................................................................... 31 4.2.8-1 Runway Obstacle Free Area Dimensions and Design Standards ............................................................. 31 4.2.16-1 Airfield Design Standards .............................................................................................................................. 33 4.3.1.1-1 Based Aircraft Storage Ratios ........................................................................................................................ 33 4.3.1.2-1 T-Hangar Storage Requirements by Forecast Number of Aircraft ......................................................... 33 4.3.1.3-1 Conventional Hangar Storage Requirements .............................................................................................. 33 4.3.1.3-2 Conventional Hangar Storage Requirements by Total Size (Square Feet) .............................................. 33 4.3.1.4-1 Based Aircraft Apron Area Requirements by Total Size (Square Yards) ................................................ 34 4.3.1.5-1 Transient Aircraft Storage Requirements ..................................................................................................... 34 4.3.1.5-2 Total Aircraft Storage Requirements ............................................................................................................ 34 4.3.1.6-1 Fuel Storage Requirements ............................................................................................................................ 34

HILTON HEAD ISLAND AIRPORT
MASTER PLAN UPDATE
Table of Contents TALBERT & BRIGHT v
4.3.2.1-1 Commercial Servie Terminal Requirements (Square Feet) ....................................................................... 36 4.3.2.3-1 Commercial Service Terminal Automobile Parking Space Requirements .............................................. 37 4.5-1 Facility Requirements Summary .................................................................................................................... 38 5.1.2-1 Existing 4,300-Foot Runway (Configuration in Complaince) Preliminiary Estimate of Probable Construction Costs ......................................................................................................................... 42 5.1.4-1 Alternative No. 2 (5,400-Foot Runway Constrained Configuration) Preliminiary Estimate of Probable Construction Costs ......................................................................................................................... 42 5.1.4.1-1 Alternative No. 2 – Phase 1 (5,000-Foot Runway Constrained Configuration) Preliminiary Estimate of Probable Construction Costs ................................................................................................... 42 5.1.4.2-1 Alternative No. 2 – Phase 1a (4,600-Foot Runway Constrained Configuration) Preliminiary Estimate of Probable Construction Costs ................................................................................................... 46 5.2-1 Runway Analysis Matrix ................................................................................................................................. 48 5.2-2 Alternative Runway Lengths Preliminary Project Cost Estimate Summary ........................................... 48 6.1-1 National Ambient Air Quality Standards ..................................................................................................... 49 6.3-1 Compatible Land Use for Noise Level Ranges ........................................................................................... 54 6.6-1 Soils Within the Vicinity of the Airport ....................................................................................................... 56 6.7-1 Species of Concern in Beaufort County ....................................................................................................... 57 6.10.2-1 Mitchelville Through Time ............................................................................................................................ 61 6.10.3-1 Previously Investigated Sites Near the Airport ........................................................................................... 62 6.13.2-1 Operations Forecast by Aircraft Type .......................................................................................................... 64 6.13.2-2 Assigned Integrated Noise Model Aircraft .................................................................................................. 64 6.13.2-3 Assigned Integrated Noise Flight Tracks ..................................................................................................... 64 6.13.2-4 Existing (2009) Operations by Aircraft Type .............................................................................................. 66 6.13.2-5 Future (2029) Operations by Aircraft Type ................................................................................................. 66 6.15.1-1 Population Projections ................................................................................................................................... 68 6.15.1-2 General Demographic Characteristics (2000) ............................................................................................. 68 6.15.1-3 Major Employers in Beaufort County .......................................................................................................... 68 6.15.2-1 USDHHS Poverty Guidelines ....................................................................................................................... 69 6.15.2-2 U.S. Census Minority Population by Individuals ........................................................................................ 69 6.15.2-3 U.S. Census Low-Income Populations by Individuals (1999) .................................................................. 69 8.1-1 Preliminary Project Cost Estimates (2010 $) ............................................................................................... 92 9.2-1 Schedule of Project Costs and Phasing ........................................................................................................ 94 9.3.4-1 Airport Improvement Program Eligibility ................................................................................................... 97 9.3.4-2 Short-Term Projects Funding Plan ............................................................................................................... 98 9.3.4-3 Intermediate- and Long-Term Projects Funding Plan ............................................................................... 98 9.3.10-1 Alternative Short-Term Local Funding Plan ............................................................................................... 99 9.3.14-1 General Aviation Financing Sources and Use of Funds .......................................................................... 100 9.3.15-1 General Aviation Financing Allocation of Debt Service ......................................................................... 100 9.4-1 Historical Revenues and Expenses ............................................................................................................. 101 9.5.1-1 Pro Forma Cash Flow Analysis ................................................................................................................... 102 B.2.2-1 Public Comment and Web Survey Results ................................................................................................ B-2 B.2.2-2 Public Input Survey Results ......................................................................................................................... B-2 B.3.2-1 Public Comment and Web Survey Results ................................................................................................ B-5
B.3.2-2 Public Input Survey Results ......................................................................................................................... B-5 B.4.2-1 Public Comment and Web Survey Results ................................................................................................ B-9 B.4.2-2 Public Input Survey Results ......................................................................................................................... B-9 Table A Key Runway Dimensions ........................................................................................................................... B-28 Table 1 Summary of Dimensions in Various Phases ........................................................................................... B-29 Table 2 Summary of Vertical Clearances in Various Phases ............................................................................... B-29 B.6.1-1 Historical revenues and Expenses ............................................................................................................ B-34 B.6.1-2 Signature Fligjht Support – Rates and Charges ....................................................................................... B-35 B.6.1-3 Short-Term Project Funding Plan............................................................................................................. B-35 B.6.3-1 Commercial Service Aircraft ...................................................................................................................... B-36 B.6.3-2 General Aviation Aircraft ........................................................................................................................... B-36 B.6.3-3 Property Acquisition for the 5,000-Foot Alternative ............................................................................. B-37 B.6.3-4 Alternative No. 2 – Phase 1 (5,000-Foot Runway Constrained Configuration) ................................ B-36 B.6.4-1 Runway Length requirements Based on Aircraft Airport Planning Manual Design Curves ............ B-39 B.6.5-1 Preliminary Project Cost Estimate Existing 4,300-Foot Runway (Configuration in Compliance) ................................................................................................................................................. B-41 B.6.5-2 Preliminary Project Cost Estimate Alternative No. 2 – Phase 1a (4,600-Foot Runway Constrained Configuration) ....................................................................................................................... B-41 B.6.5-3 Preliminary Project Cost Estimate Alternative No. 2 – Phase 1 (5,000-Foot Runway Constrained Configuration) ....................................................................................................................... B-42 B.6.5-4 Preliminary Project Cost Estimate Alternative No. 2 (5,400-Foot Runway Constrained Configuration) .............................................................................................................................................. B-42 B.6.7-1 Incremental Costs ........................................................................................................................................ B-49 B.6.7-2 Expected Load Factor Capability (seats usable/seats total) for Commercial Service to Charlotte and Atlanta (Based on Maximum Takeoff Weight) .............................................................. B-51 B.6.7-3 Commercial Service Airports with Runway Lengths Less Than 5,400 Feet ...................................... B-51 D.2.4-1 Historical Load Factor ................................................................................................................................. D-3 D.2.5-1 Historical Origin and Destination Enplanements ................................................................................... D-4 D.2.5-2 Potential Origin and Destination Enplanements ..................................................................................... D-5
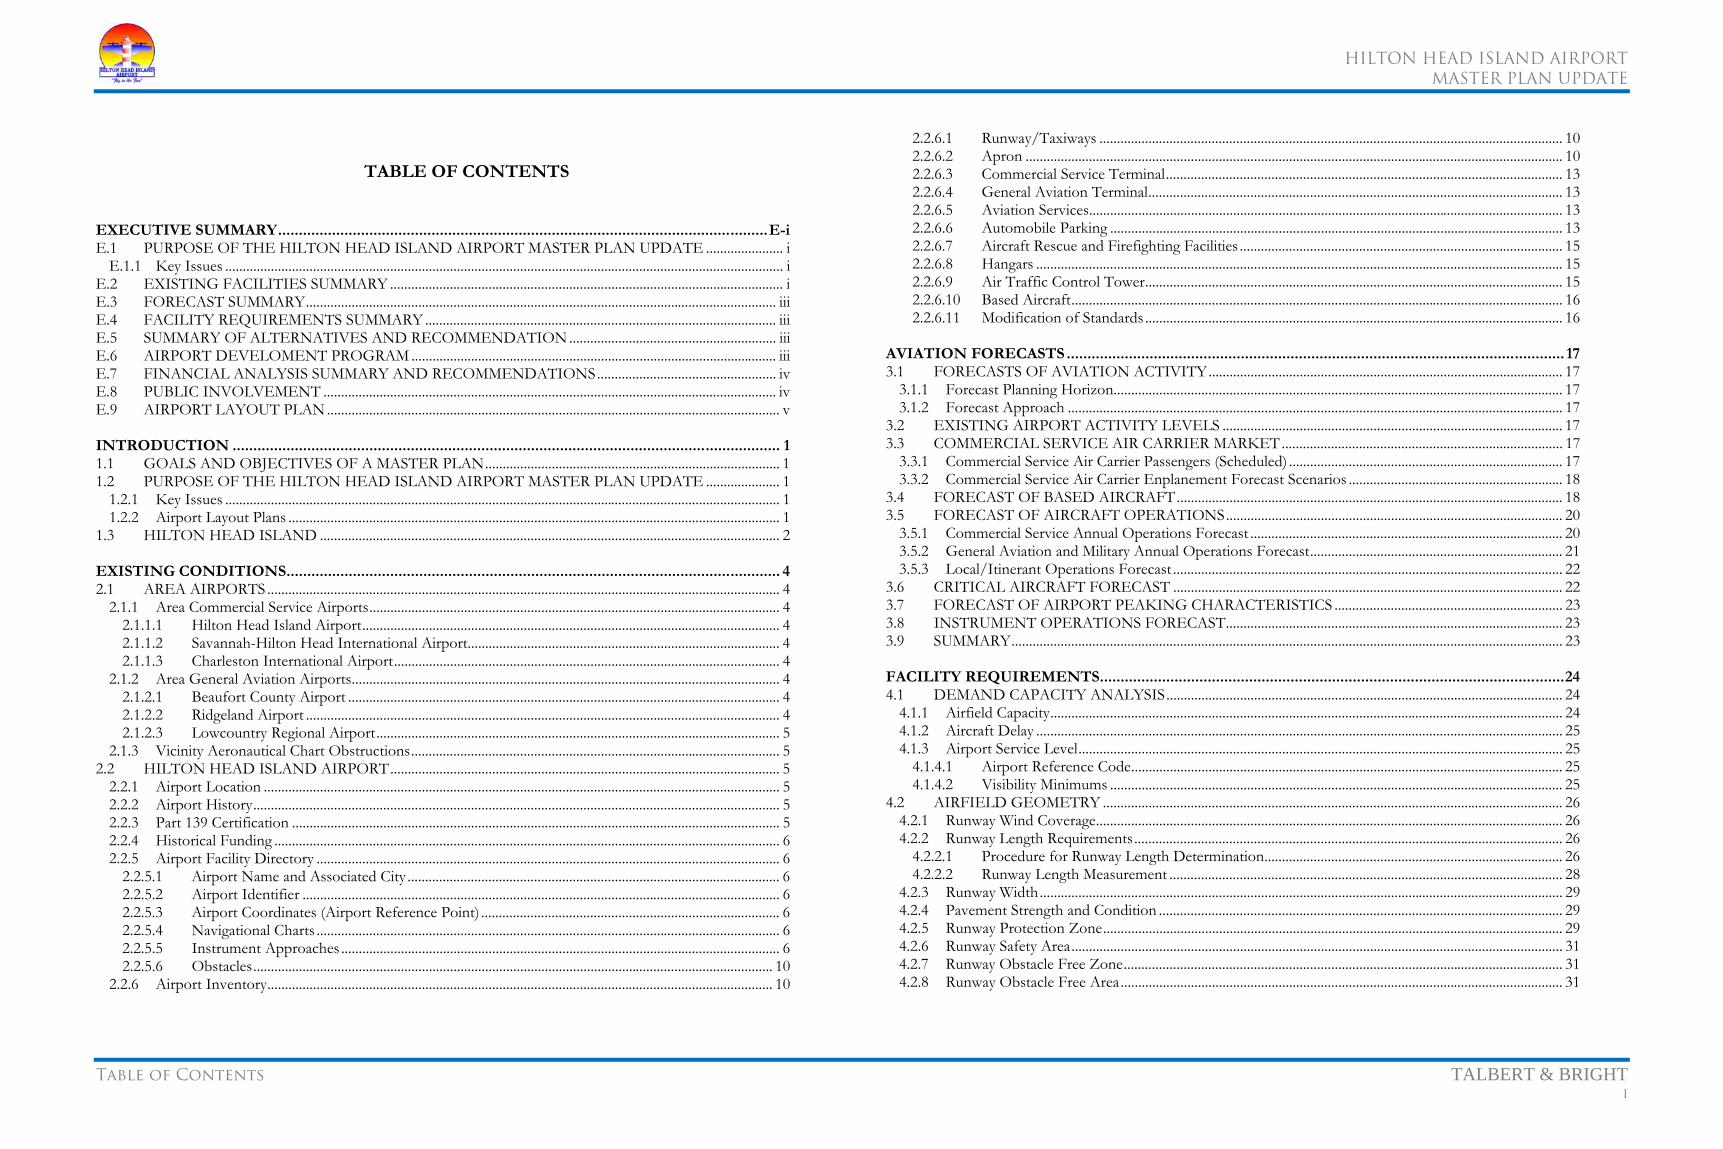
FIGURES E-1 Location Map .................................................................................................................................................. E-i Sheet 4 Airport Layout Plan (Ultimate Development) of ALP Drawing Set .................................................... E-vi Sheet 5 Airport Layout Plan Data of ALP Drawing Set...................................................................................... E-vii 1.3-1 Location Map ..................................................................................................................................................... 2 1.3-2 Aiport Facilities .................................................................................................................................................. 3 2.1.1-1 Area Airports and Selected Vicinity Obstructions ....................................................................................... 5 2.2.5-1 Facility Directory ............................................................................................................................................... 8 2.2.5.5-1 Approach Plates ................................................................................................................................................. 9 2.2.5.5-2 Approach Plate ................................................................................................................................................ 10 2.2.6-1 Inventory of Existing Facilities ..................................................................................................................... 11 2.2.6.3-1 Commercial Service Terminal Floor Plan .................................................................................................... 13

HILTON HEAD ISLAND AIRPORT
MASTER PLAN UPDATE
Table of Contents TALBERT & BRIGHT vi
2.2.6.4-1 General Aviation Terminal Floor Plan ......................................................................................................... 14 2.2.6.6-1 Commercial Service Terminal Automobile Parking ................................................................................... 14 2.2.6.6-2 General Aviation Terminal Automobile Parking ........................................................................................ 15 3.3.2-1 Enplanements Forecast Comparison ........................................................................................................... 19 3.4-1 Based Aircraft Forecast Comparision .......................................................................................................... 20 3.5.1-1 Annual Operations Comparison ................................................................................................................... 21 4.2.2.2-1 75% of Fleet at 60% or 90% Useful Load ................................................................................................... 28 4.2.2.2-2 100% of Fleet at 60% or 90% Useful Load................................................................................................. 29 4.3.2.1-1 Existing Commercial Terminal Layout ........................................................................................................ 35 5.1.1-1 Existing 4,300' Runway ................................................................................................................................... 40 5.1.2-1 Existing 4,300' Runway Configuration in Compliance .............................................................................. 41 5.1.3-1 Alternative No. 1 ............................................................................................................................................. 43 5.1.4-1 Alternative No. 2 ............................................................................................................................................. 44 5.1.4.1-1 Alternative No. 2 – Phase 1 ........................................................................................................................... 45 5.1.5-1 Alternative No. 3 ............................................................................................................................................. 47 6.2-1 Coastal Zone Map ........................................................................................................................................... 50 6.2-2 Coastal Barrier Resources System ................................................................................................................. 51 6.3-1 Land Use ........................................................................................................................................................... 52 6.3-2 Zoning ............................................................................................................................................................... 53 6.6-1 Soils Map .......................................................................................................................................................... 55 6.7-1 Location of Bald Eagle Nest .......................................................................................................................... 58 6.8-1 Floodplain ......................................................................................................................................................... 59 6.10.2-1 Mitchelville ....................................................................................................................................................... 61 6.13-1 Typical A-Weighted Sound Levels of Common Sounds ........................................................................... 63 6.13.2-1 Flight Tracks .................................................................................................................................................... 67 6.15.2-1 Environmental Justice Evaluation Area ....................................................................................................... 69 6.16-1 Watershed ......................................................................................................................................................... 70 6.17-1 Location of Potential Wetlands ..................................................................................................................... 72 Sheet 1 Cover Sheet of ALP Drawing Set ................................................................................................................. 78 Sheet 2 Airport Layout Plan (Current Configuration) of ALP Drawing Set ........................................................ 79 Sheet 3 Airport Layout Plan (Phase 1 Development) of ALP Drawing Set ......................................................... 80 Sheet 4 Airport Layout Plan (Ultimate Development) of ALP Drawing Set ....................................................... 81 Sheet 5 Airport Layout Plan Data of ALP Drawing Set.......................................................................................... 82 Sheet 6 Runway 03 Inner Approach Plan of ALP Drawing Set ............................................................................. 83 Sheet 7 Runway 21 Inner Approach Plan of ALP Drawing Set ............................................................................. 84 Sheet 8 Runway 21 Inner Approach Plan On-Airport Property Tree Data of ALP Drawing Set .................... 85 Sheet 9 Runway 21 Inner Approach Plan Off- Airport Property Tree Data of ALP Drawing Set .................. 86 Sheet 10 Terminal Area Plan of ALP Drawing Set .................................................................................................... 87 Sheet 11 GA Area Plan of ALP Drawing Set .............................................................................................................. 88 Sheet 12 Airspace Plan of ALP Drawing Set .............................................................................................................. 89 Sheet 13 Land Use Plan Drawing of ALP Drawing Set ............................................................................................ 90 Sheet 14 Exhibit A Property Map of ALP Drawing Set ............................................................................................ 91
9.3.2-1 Aviation Trust Fund Funding Sources ......................................................................................................... 94 9.3.2-2 FAA Funding ................................................................................................................................................... 95 9.3.2.1-1 Historical AIP Authorization and Appropriations ..................................................................................... 96 D.1.1-1 Beaufort County Evacauation Zones ........................................................................................................ D-1 D.1.2-1 Evacaution Routes for Beaufort County .................................................................................................. D-2 D.1.3-1 Hilton Head Island Evacuation Plan ......................................................................................................... D-2 D.2.4-1 Airport Load Factor ..................................................................................................................................... D-4
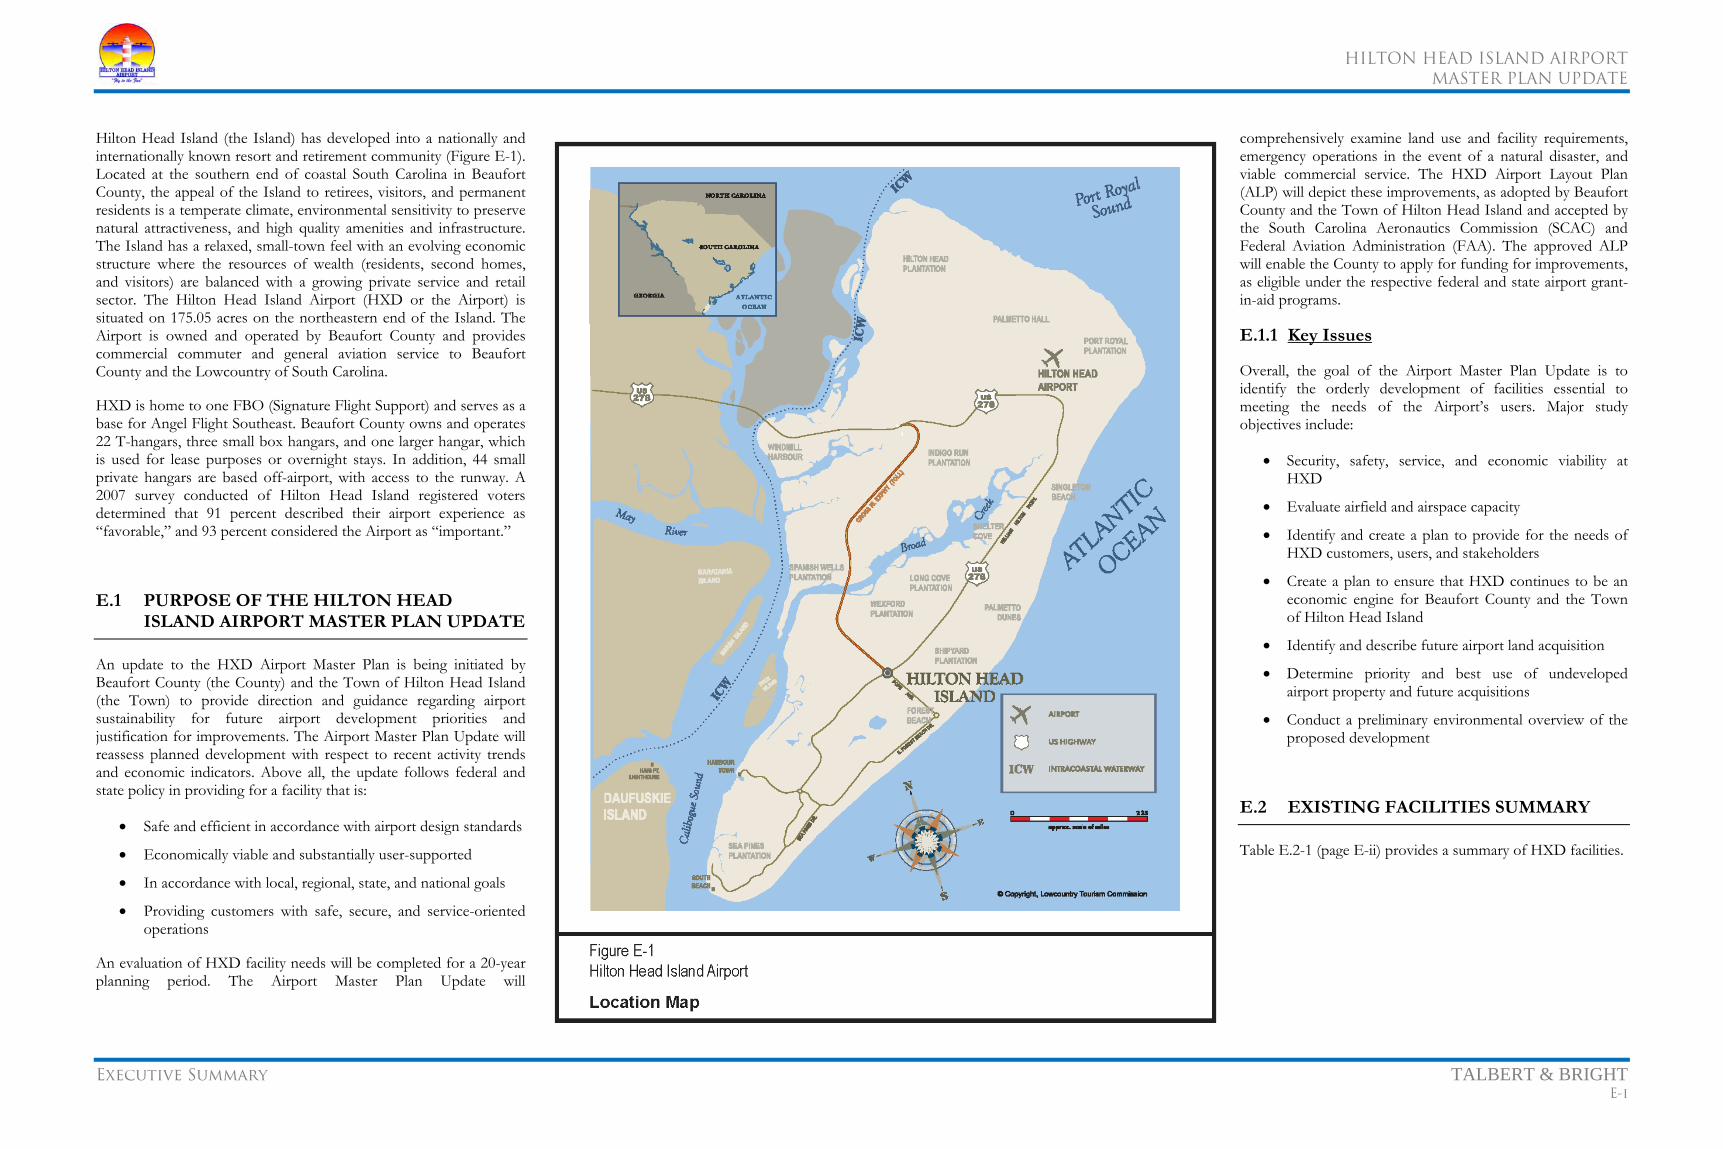
HILTON HEAD ISLAND AIRPORT
MASTER PLAN UPDATE
Executive Summary TALBERT & BRIGHT E-i
Hilton Head Island (the Island) has developed into a nationally and internationally known resort and retirement community (Figure E-1). Located at the southern end of coastal South Carolina in Beaufort County, the appeal of the Island to retirees, visitors, and permanent residents is a temperate climate, environmental sensitivity to preserve natural attractiveness, and high quality amenities and infrastructure. The Island has a relaxed, small-town feel with an evolving economic structure where the resources of wealth (residents, second homes, and visitors) are balanced with a growing private service and retail sector. The Hilton Head Island Airport (HXD or the Airport) is situated on 175.05 acres on the northeastern end of the Island. The Airport is owned and operated by Beaufort County and provides commercial commuter and general aviation service to Beaufort County and the Lowcountry of South Carolina.
HXD is home to one FBO (Signature Flight Support) and serves as a base for Angel Flight Southeast. Beaufort County owns and operates 22 T-hangars, three small box hangars, and one larger hangar, which is used for lease purposes or overnight stays. In addition, 44 small private hangars are based off-airport, with access to the runway. A 2007 survey conducted of Hilton Head Island registered voters determined that 91 percent described their airport experience as “favorable,” and 93 percent considered the Airport as “important.”
E.1 PURPOSE OF THE HILTON HEAD ISLAND AIRPORT MASTER PLAN UPDATE
An update to the HXD Airport Master Plan is being initiated by Beaufort County (the County) and the Town of Hilton Head Island (the Town) to provide direction and guidance regarding airport sustainability for future airport development priorities and justification for improvements. The Airport Master Plan Update will reassess planned development with respect to recent activity trends and economic indicators. Above all, the update follows federal and state policy in providing for a facility that is:
• Safe and efficient in accordance with airport design standards
• Economically viable and substantially user-supported
• In accordance with local, regional, state, and national goals
• Providing customers with safe, secure, and service-oriented operations
An evaluation of HXD facility needs will be completed for a 20-year planning period. The Airport Master Plan Update will
comprehensively examine land use and facility requirements, emergency operations in the event of a natural disaster, and viable commercial service. The HXD Airport Layout Plan (ALP) will depict these improvements, as adopted by Beaufort County and the Town of Hilton Head Island and accepted by the South Carolina Aeronautics Commission (SCAC) and Federal Aviation Administration (FAA). The approved ALP will enable the County to apply for funding for improvements, as eligible under the respective federal and state airport grant-in-aid programs.
E.1.1 Key Issues
Overall, the goal of the Airport Master Plan Update is to identify the orderly development of facilities essential to meeting the needs of the Airport’s users. Major study objectives include:
• Security, safety, service, and economic viability at HXD
• Evaluate airfield and airspace capacity
• Identify and create a plan to provide for the needs of HXD customers, users, and stakeholders
• Create a plan to ensure that HXD continues to be an economic engine for Beaufort County and the Town of Hilton Head Island
• Identify and describe future airport land acquisition
• Determine priority and best use of undeveloped airport property and future acquisitions
• Conduct a preliminary environmental overview of the proposed development
E.2 EXISTING FACILITIES SUMMARY
Table E.2-1 (page E-ii) provides a summary of HXD facilities.

HILTON HEAD ISLAND AIRPORT
MASTER PLAN UPDATE
Executive Summary TALBERT & BRIGHT E-ii
Table E.2-1 Inventory of Existing Facilities
Hilton Head Island Airport A. Aviation Facilities
1 Runway Runway 03/21 a) Length 4,300' with 300' displaced thresholds on either end b) Width 100' c) Type Pavement Asphalt/Grooved d) Pavement Condition Good e) Strength 38,000 SWG/75,000 DWG f) Marking Non-Precision
2 Taxiways A B C D E Fa) Description/Width Full parallel/40' Connector/40' Ramp Connector/40' Full parallel/50' b) Type Pavement Asphalt c) Pavement Condition Good to Excellent d) Marking Centerline
3 Lighting a) Runway Type MIRL b) Taxiway Type MITL c) Approach P4L/P4L, REIL, LOC/DME
4 General Aviation Apron a) Area 58,105 sq yds b) Type Pavement Asphalt c) Condition Good d) Tie-downs 66 e) Lighting Flood
5 Commercial Service Apron a) Area 11,960 sq yds b) Type Pavement Concrete/Asphalt c) Condition Good d) Lighting Flood
6 Wind Indicator & Segmented Circle a) Location East of RWY 03
7 AWOS-3 a) Location Next to ATCT
8 Beacon a) Location East of RWY 03, near old FBO building
9 ATCT Contract a) Location East of RWY 21
10 ARFF 1 – 1,500-gal Crash Truck 1 Light Rescue Vehicle
B. Physical Site 1 Location 120 Beach City Road, Hilton Head Island 2 Counties Served Beaufort, Jasper 3 Ground Access Beach City Road from U.S. Highway 278 (William Hilton Parkway) 4 Mean Max. Hot Mo. Temp. 89.4°F 5 Airport Elevation 19.1' AMSL 6 Airport Ownership Beaufort County
Table E.2-1 Inventory of Existing Facilities
Hilton Head Island Airport C. Terminal Facilities/Services
1 Commercial Service Terminala) Building 18,484 sq ft b) Automobile Parking 325 – 170 public (107 long-term, 63 short-term), 55 employee (28 long-term, 27 short-term), 100 rental car c) Airlines US Airways (Piedmont Airlines), Delta Airlines (Mesaba Airlines, seasonal)d) Rental Car Agencies Avis, Hertz, National, Budget, Thrifty, Enterprise (off-site)
2 General Aviation Terminal a) Building 4,628 sq ft b) Automobile Parking 127
3 Fuel a) 100 LL 1 - 12,000 gal b) Jet A 3 - 10,000 gal c) Vehicle 1 - 250 gal d) Trucks 1 - 1,200 gal (100 LL)
2 - 3,000 gal (Jet A) 4 Services FBO
Aircraft Rental Flight Training Angel Flight Southeast Civil Air Patrol
5 Hangarsa) T-hangars (40' opening) 22 b) 52' x 60' Box Hangars 6 c) 80' x 80' Box Hangar 1
6 Equipment 3 Tractor Mowers 2 Push Mowers 1 Lawn Tractor 2 Weed Eaters 1 Equipment Trailer 2 Pickup Trucks
D. Flight Navigation Aids1 Airport Beacon 36" Green/White Rotating Beacon 2 Instrument Approaches Localizer/DME Approach – Runway 21
RNAV (GPS) Approach – Runway 21 RNAV (GPS) Approach – Runway 03 VOR/DME-A – Runway 03/21 (circling)
3 Visual Approach Aids PAPI 4L/RWY 03 PAPI 4l/RWY 21 REILS RWY 03/21
4 Communications & NAVAIDs CTAF: 118.975 Savannah Approach: 125.3 UNICOM: 123.0 Savannah Departure: 125.3 ATIS: 121.4 Clearance Delivery: 121.1 WX AWOS-3: 121.4 (843-342-5072) WX AWOS-3 at ARW (12 nm N): 119.675 (843-524-1000) Hilton Head Ground: 121.1 (6:00 a.m. – 8:00 p.m.) Hilton Head Tower: 118.975 (6:00 a.m. – 8:00 p.m.)
Source: Talbert & Bright, Inc., September 2009.

HILTON HEAD ISLAND AIRPORT
MASTER PLAN UPDATE
Executive Summary TALBERT & BRIGHT E-iii
E.3 FORECAST SUMMARY
The forecasts of aviation activity developed as part of this Master Plan Update indicate a consistent growth in activity over the next 20 years. The forecast numbers indicate a reduction in the growth rate of based aircraft and operations at the Airport when compared to the 1999 Master Plan forecasts. This is due to the recent trend in fewer annual operations at the Airport. This recent reduction is due primarily to the contraction of the economy. A large portion of general aviation users rely on discretionary income to operate their aircraft. A contraction of the economy reduces the amount of money being spent on aviation and, therefore, a reduction in aviation activity, as seen in the forecasts. However, the restoration of the economy will result in increased activity at the Airport including based aircraft and commercial operations.
Table E.3-1 provides a summary of the forecasts for the Hilton Head Island Airport throughout the 20-year Master Plan Update planning period.
Table E.3-1 Aviation Forecast Summary Hilton Head Island Airport
2009
(Existing) 2014 2019 2029 BASED AIRCRAFT
Single-Engine Piston 60 68 74 86 Multi-Engine Piston 12 13 15 18 Turboprop 6 7 7 9 Jets 3 3 4 5 Helicopters 0 0 1 2 TOTAL BASED AIRCRAFT 81 91 101 120
AIRCRAFT OPERATIONS General Aviation Local 3,062 3,353 3,714 4,435 General Aviation Itinerant 24,638 26,985 29,884 35,682 Commercial 9,353 11,441 12,532 15,069 Military Itinerant 635 696 771 920 Military Local 549 601 666 795 TOTAL OPERATIONS 38,237 43,076 47,567 56,901 Instrument Operations 22,950 26,578 29,349 35,108 Operations per Based Aircraft 348 348 348 348
COMMERCIAL SERVICE PASSENGERS Enplanements 66,823 74,393 77,908 84,094 Peak Hour Enplanements1 67 78 89 110 1Based on two departures (37 seats) in 60 minutes at 90 percent load factor. Source: Federal Aviation Administration, “FAA APO Terminal Area Forecast Detail Report,” <http://aspm.faa.gov/>, accessed March 19, 2010. Talbert & Bright, Inc., March 2010.
E.4 FACILITY REQUIREMENTS SUMMARY
Table E.4-1 summarizes the facility requirements for the Hilton Head Island Airport and lists the phases in which various facilities will be needed, as driven by demand.
E.5 SUMMARY OF ALTERNATIVES AND RECOMMENDATION
The runway extension development alternatives were presented to joint meetings of Beaufort County and Town of Hilton Head Island Councils on May 19, 2010, July 12, 2010, and October 27, 2010. During the July 12, 2010, joint meeting of councils, Alternatives 1 (5,400-foot runway unconstrained configuration), 3 (5,400-foot runway realigned and constrained configuration), and 4 (new airport – 5,400 feet) were removed from further consideration because of excessive cost and potential impact on the surrounding community. Also during the July 12, 2010, joint meeting of councils, an additional alternative, Alternative 1a (4,600-foot runway constrained configuration), was added for evaluation.
Of the runway extension alternatives considered as part this Master Plan Update, the Alternative 2 (5,400-foot runway constrained configuration, including Phase 1) was recommended for implementation. This recommendation was approved on October 27, 2010, during a joint council meeting of Beaufort County and Town of Hilton Head Island Councils.
The most important element of the Master Plan Update for the long-term development of the Hilton Head Island Airport was the extension of Runway 03/21. Because the landside development is currently on the east and west side of the runway, the length and orientation of the runway were first determined prior to outlining the needs of the commercial service (west
side of the runway) and general aviation (east side of the runway). Landside development of the Hilton Head Island Airport is described in Table E.4-1.
Table E.5-1 illustrates a preliminary project cost comparison.
E.6 AIRPORT DEVELOMENT PROGRAM
This section lists each future airport improvement project by phase for the 20-year planning period (2010-2029). Planning estimates of probable construction cost are listed on Table E.6-1 (page E-iv), as well as a breakdown of potential FAA, state, and local funding sources.
Table E.5-1 Alternative Runway Lengths
Preliminary Project Cost Estimate Summary Hilton Head Island Airport
Preliminary Costs Runway Length
4,300 Feet 4,600 Feet 5,000 Feet 5,400 FeetLand Acquisition $3,600,000 $3,600,000 $8,750,000 $9,100,000 Construction (includes design) $1,750,000 $2,183,000 $3,290,000 $4,215,000 EMAS $2,000,000 $2,000,000 $2,000,000 $4,000,000 Beach City Road Relocation $0 $0 $0 $750,000 BCA/EA $0 $500,000 $500,000 $500,000 Environmental Mitigation/ Litigation (estimated)
$291,000 $364,000 $550,000 $705,000
Total $7,641,000 $8,647,000 $15,090,000 $19,270,000 4,300' vs. Extension Options $1,006,000 $7,449,000 $11,629,000 Incremental Costs $1,006,000 $6,443,000 $4,180,000 Source: Talbert & Bright, Inc., November 2010.
Table E.4-1 Facility Requirements Summary
Hilton Head Island Airport
Facility ExistingPhase 1
(2010-2014)Phase 2
(2015-2019)Phase 3
(2020-2029) Runway 4,300' x 100' 5,400' x 100' 5,400' x 100' 5,400' x 100' Taxiway Full-Parallels Full-Parallels Full-Parallels Full-Parallels T-Hangar Units 22 30 36 50 Conventional Hangar (sq ft) 15,760 sq ft 29,490 sq ft 41,490 sq ft 53,490 sq ft Total Apron Area (sq yd) 53,785 sq yd 54,782 sq yd 61,628 sq yd 72,316 sq yd Commercial Service Automobile Parking Spaces 325 443 489 590 General Aviation Automobile Parking Spaces 127 127 127 127 Commercial Service Terminal (sq ft) 18,484 26,500 26,500 26,500 General Aviation Terminal (sq ft) 4,628 4,628 4,628 4,628 Source: Talbert & Bright, Inc., September 2010.

HILTON HEAD ISLAND AIRPORT
MASTER PLAN UPDATE
Executive Summary TALBERT & BRIGHT E-iv
E.7 FINANCIAL ANALYSIS SUMMARY AND RECOMMENDATIONS
As a result of the proposed projects outlined in this Master Plan Update, the financial impact to Beaufort County can be drawn based on the following information.
• Beaufort County’s financial structure and historical revenues and expenses were examined to project future operating revenues, operating expenses, and non-operating revenue and expense at the Airport over the short-term planning period.
• The total proposed projects in the capital improvement program (CIP) amounts to $52.9 million, as presented in Table E.6-1.
• The funding for the proposed projects during the short-term development program is presented in Table E.6-1 and is as follows:
• Funding the local share of the proposed projects short-term planning period, with the proposed funding levels from the FAA and SCAC results in Beaufort County’s funding approximately $624,000 of the local share from its general fund and/or annual cash flow from the Airport, which is consistent with the manner in which capital projects have been paid for historically at the Hilton Head Island Airport.
• It is recommended that Beaufort County closely monitor the federal AIP and the SCAC funding program for any changes that may enhance or adversely affect future funding of the proposed projects.
• Total operating revenues are projected to increase from $1.7 million in FY 2011 to approximately $1.9 million in FY 2015, representing an average annual growth rate of 2.0 percent.
• Operating expenses are projected to increase from $1.3 million in FY 2011 to $1.6 million in FY 2015, representing an average annual growth rate of 4.5 percent.
• Non-operating revenue and expense are projected to increase by 2.9 percent over the short-term planning period.
• Operating income/(deficit) is projected to decrease from $391,000 in FY 2011 to $315,000 in FY 2015 based on the assumptions contained in this Section.
• The staging of the proposed projects is flexible. Beaufort County should proactively monitor/revise these projects on an annual basis to ensure that projects are not implemented before the appropriate demand levels.
• Beaufort County should submit another PFC application to impose and use passenger facility charges (PFCs) on PFC-eligible projects in the CIP or to reimburse itself for prior PFC eligible projects as soon as possible.
Based on the assumptions and the financial analyses presented herein, the proposed projects in the CIP are considered practicable, and it is anticipated that the County will be able to meet its future financial operational obligations with additional local subsidies. The financial overview presented as part of this Section reflects implementation of the proposed projects in the short-term development program. It is important that Beaufort County continually monitor the status of its operating revenues and operating expenses and the implementation of its capital program. Future analyses may suggest adjusting the implementation of certain projects in the CIP to meet Beaufort County’s other financial objectives.
E.8 PUBLIC INVOLVEMENT
Public participation is an essential element in FAA AC 150/5070-6B, Airport Master Plans, and is proportional to the complexity of the study. For the preparation of the Hilton Head Island Airport Master Plan Update, public participation was considered to be an integral part of the process because of the ongoing issues of the economical viability of the Airport to the Town of Hilton Head Island and Beaufort County.
The intent of public involvement is to encourage and facilitate public input and comments in the decision-making process of the project. The opportunities for input incorporated several methods including use of the media, public comment meetings, and public information meetings, coupled with a project web site maintained by Beaufort County.
It is the goal of the project team, which included the FAA, SCAC, Beaufort County, Town of Hilton Head Island, and the consultant team led by Talbert & Bright, Inc., to inform, educate, and seek input from the public about the project. To achieve this goal, the project team:
• Created an open and objective environment to allow the public to understand the project and provide their opinions
• Integrated citizen concerns and needs into the project development process
Table E.6-1 Preliminary Project Cost Estimates (2010 $)*
Hilton Head Island Airport Phase Project Cost Federal State Local
I Commercial Service Terminal Expansion $1,900,000 $1,805,000 $0 $95,000 I Land Acquisition for Airfield Deficiency Correction $3,600,000 $3,420,000 $0 $180,000 I Airfield Deficiency Correction $2,041,400 $1,939,330 $51,035 $51,035 I Runway 03 EMAS $2,000,000 $1,900,000 $50,000 $50,000 I Runway Extension Benefit Cost Analysis/Environmental
Documentation $500,000 $475,000 $12,500 $12,500
I Land Acquisition for Runway Extension and Road Relocation $5,500,000 $5,225,000 $0 $275,000 I 700' Runway Extension Design and Construction $2,245,200 $2,132,940 $56,130 $56,130 I 400' Runway Extension Design and Construction $925,000 $878,750 $23,125 $23,125 I Runway 21 EMAS $2,000,000 $1,900,000 $50,000 $50,000 I Relocation of Beach City Road Design and Construction $750,000 $712,500 $18,750 $18,750 I Runway 03 34:1 Obstruction Removal (trees) $1,500,000 $1,425,000 $37,500 $37,500 I Transitional Surface Obstruction Removal (trees) $2,000,000 $1,900,000 $50,000 $50,000 TOTAL $24,961,600 $23,713,520 $349,040 $899,040 II Avigation Easements within Runway 21 RPZ $1,145,000 $1,087,750 $0 $57,250 II Commercial Service Parking Lot Expansion (120 spaces) $922,100 $0 $0 $922,100 II General Aviation Apron Expansion (18,500 sq yd) $1,600,000 $1,520,000 $40,000 $40,000 II 10-Unit T-Hangar $1,350,000 $1,282,500 $33,750 $33,750 II Conventional Hangars (2) $2,830,000 $2,688,500 $70,750 $70,750 II Land Acquisition General Aviation Side $3,335,000 $3,168,250 $0 $83,375 TOTAL $11,182,100 $9,747,000 $144,500 $1,207,225
III 10-Unit T-Hangar (2) $2,660,000 $2,527,000 $66,500 $66,500 III Conventional Hangars (2) $2,450,000 $2,327,500 $61,250 $61,250 III General Aviation Apron Expansion (17,000 sq yd) $1,520,000 $1,444,000 $38,000 $38,000 III Commercial Service Parking Lot Expansion (150 spaces) $720,000 $0 $0 $720,000 III Land Acquisition (Exec Air) $9,400,000 $8,930,000 $0 $470,000 TOTAL $16,750,000 $15,228,500 $165,750 $1,355,750 GRAND TOTAL $52,893,700 $48,689,020 $659,290 $3,462,015
* - These are estimations only and are not to be relied on without further confirmation. Source: Talbert & Bright, Inc. October 2010.
FAA $23.7 million State 0.4 million Local 0.9 million Total $25.0 million
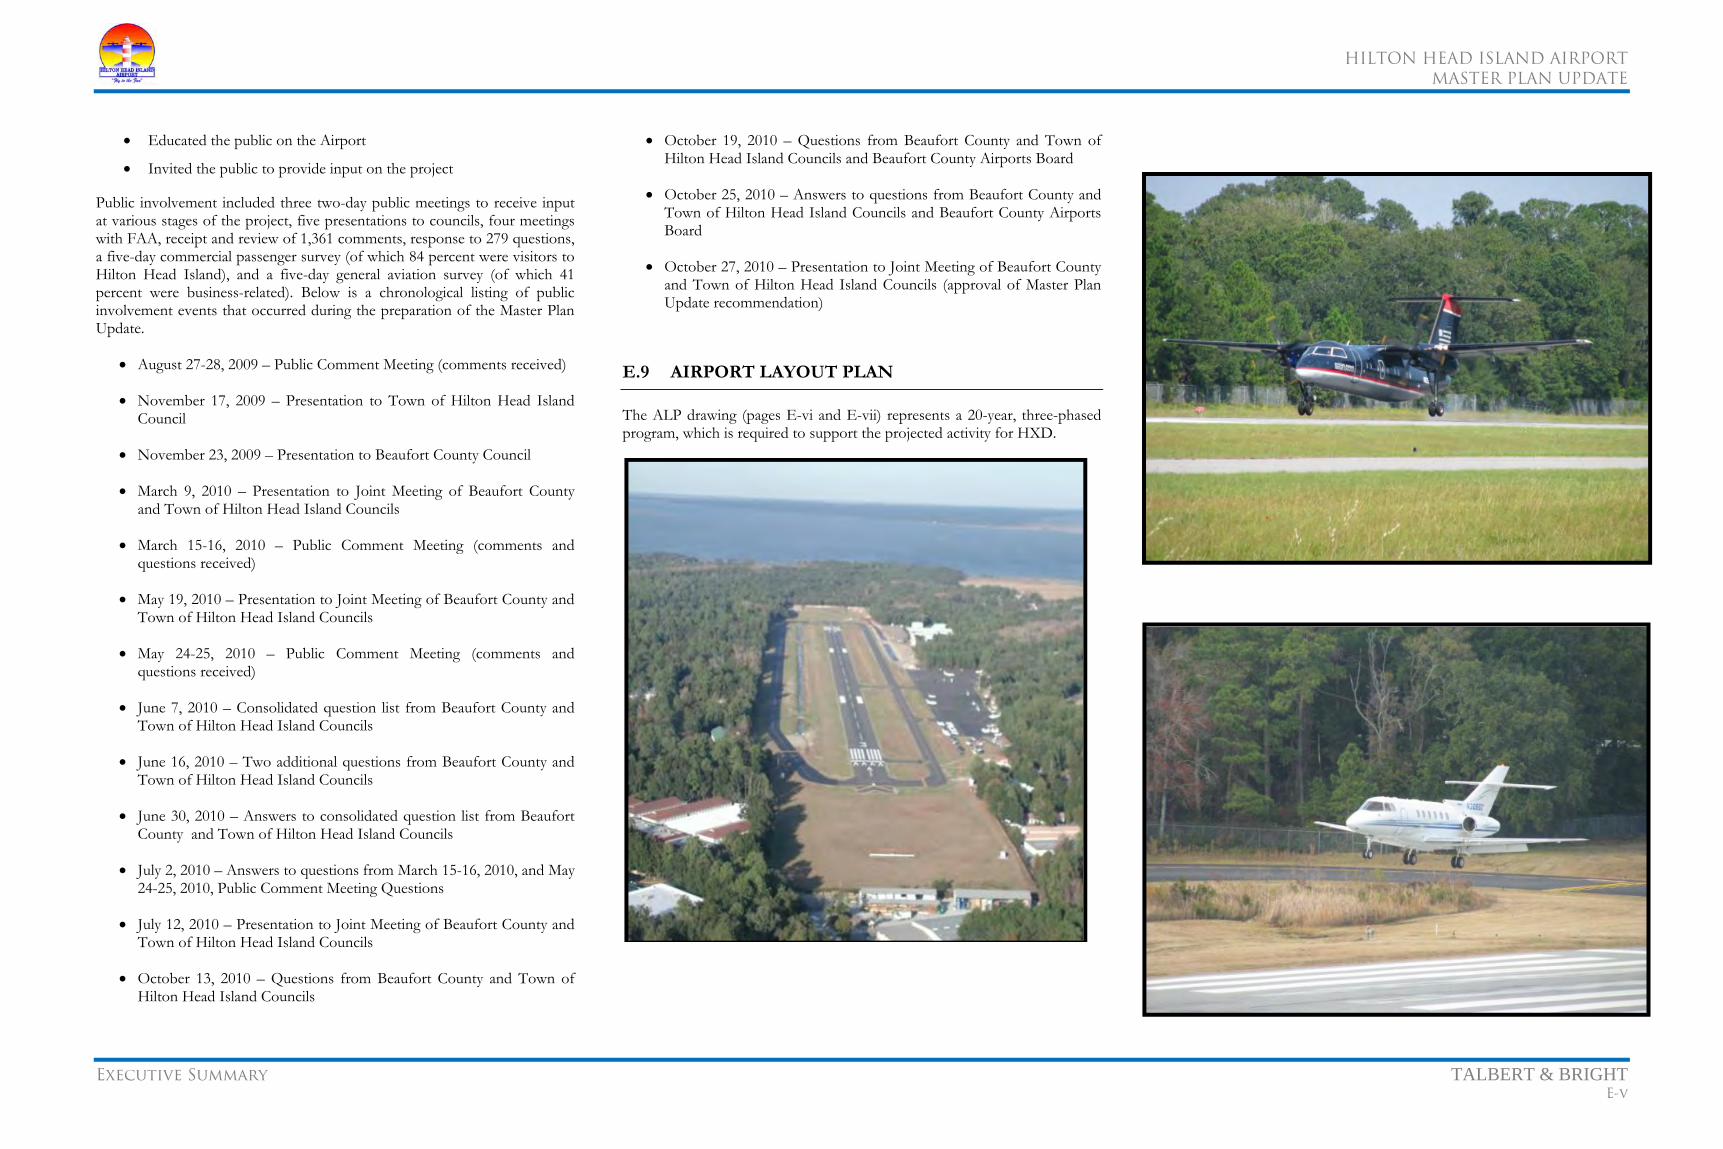
HILTON HEAD ISLAND AIRPORT
MASTER PLAN UPDATE
Executive Summary TALBERT & BRIGHT E-v
• Educated the public on the Airport
• Invited the public to provide input on the project
Public involvement included three two-day public meetings to receive input at various stages of the project, five presentations to councils, four meetings with FAA, receipt and review of 1,361 comments, response to 279 questions, a five-day commercial passenger survey (of which 84 percent were visitors to Hilton Head Island), and a five-day general aviation survey (of which 41 percent were business-related). Below is a chronological listing of public involvement events that occurred during the preparation of the Master Plan Update.
• August 27-28, 2009 – Public Comment Meeting (comments received)
• November 17, 2009 – Presentation to Town of Hilton Head Island Council
• November 23, 2009 – Presentation to Beaufort County Council
• March 9, 2010 – Presentation to Joint Meeting of Beaufort County and Town of Hilton Head Island Councils
• March 15-16, 2010 – Public Comment Meeting (comments and questions received)
• May 19, 2010 – Presentation to Joint Meeting of Beaufort County and Town of Hilton Head Island Councils
• May 24-25, 2010 – Public Comment Meeting (comments and questions received)
• June 7, 2010 – Consolidated question list from Beaufort County and Town of Hilton Head Island Councils
• June 16, 2010 – Two additional questions from Beaufort County and Town of Hilton Head Island Councils
• June 30, 2010 – Answers to consolidated question list from Beaufort County and Town of Hilton Head Island Councils
• July 2, 2010 – Answers to questions from March 15-16, 2010, and May 24-25, 2010, Public Comment Meeting Questions
• July 12, 2010 – Presentation to Joint Meeting of Beaufort County and Town of Hilton Head Island Councils
• October 13, 2010 – Questions from Beaufort County and Town of Hilton Head Island Councils
• October 19, 2010 – Questions from Beaufort County and Town of Hilton Head Island Councils and Beaufort County Airports Board
• October 25, 2010 – Answers to questions from Beaufort County and Town of Hilton Head Island Councils and Beaufort County Airports Board
• October 27, 2010 – Presentation to Joint Meeting of Beaufort County and Town of Hilton Head Island Councils (approval of Master Plan Update recommendation)
E.9 AIRPORT LAYOUT PLAN
The ALP drawing (pages E-vi and E-vii) represents a 20-year, three-phased program, which is required to support the projected activity for HXD.

HILTON HEAD ISLAND AIRPORT
MASTER PLAN UPDATE
Executive Summary TALBERT & BRIGHT E-vi
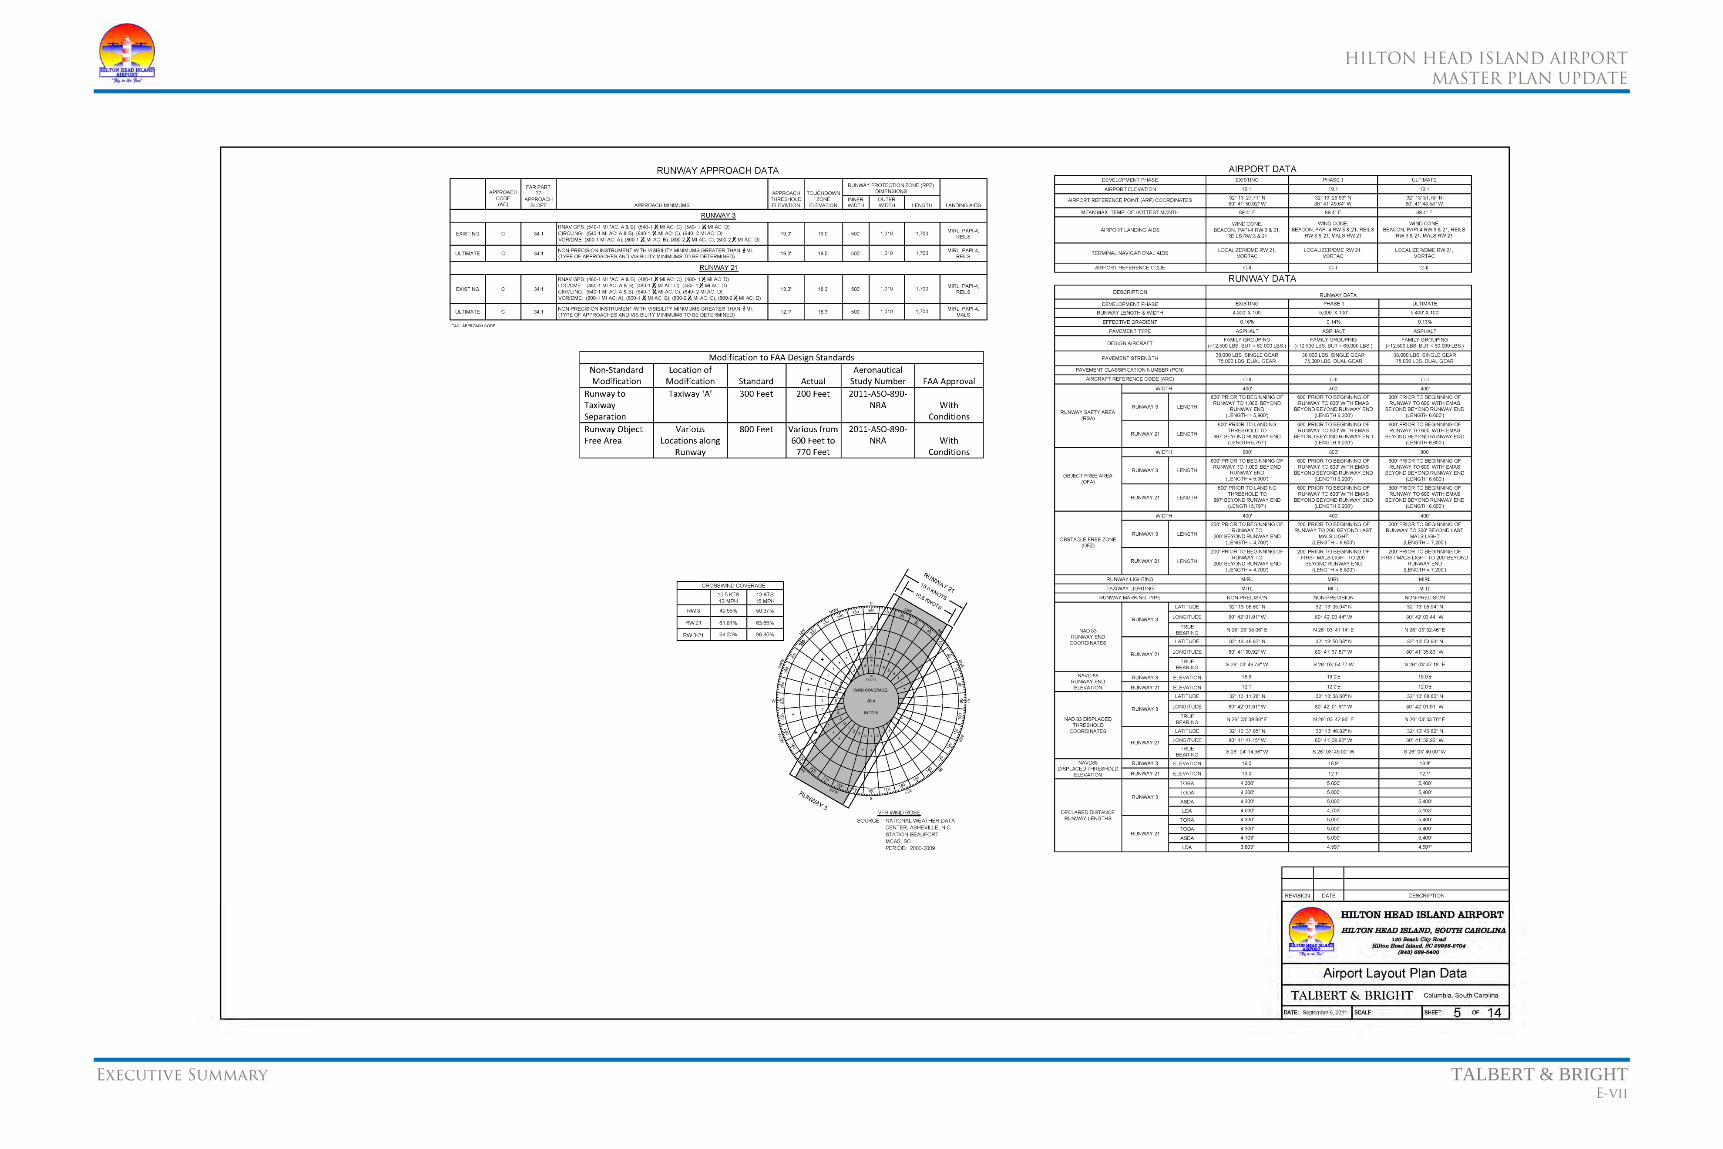
HILTON HEAD ISLAND AIRPORT
MASTER PLAN UPDATE
Executive Summary TALBERT & BRIGHT E-vii
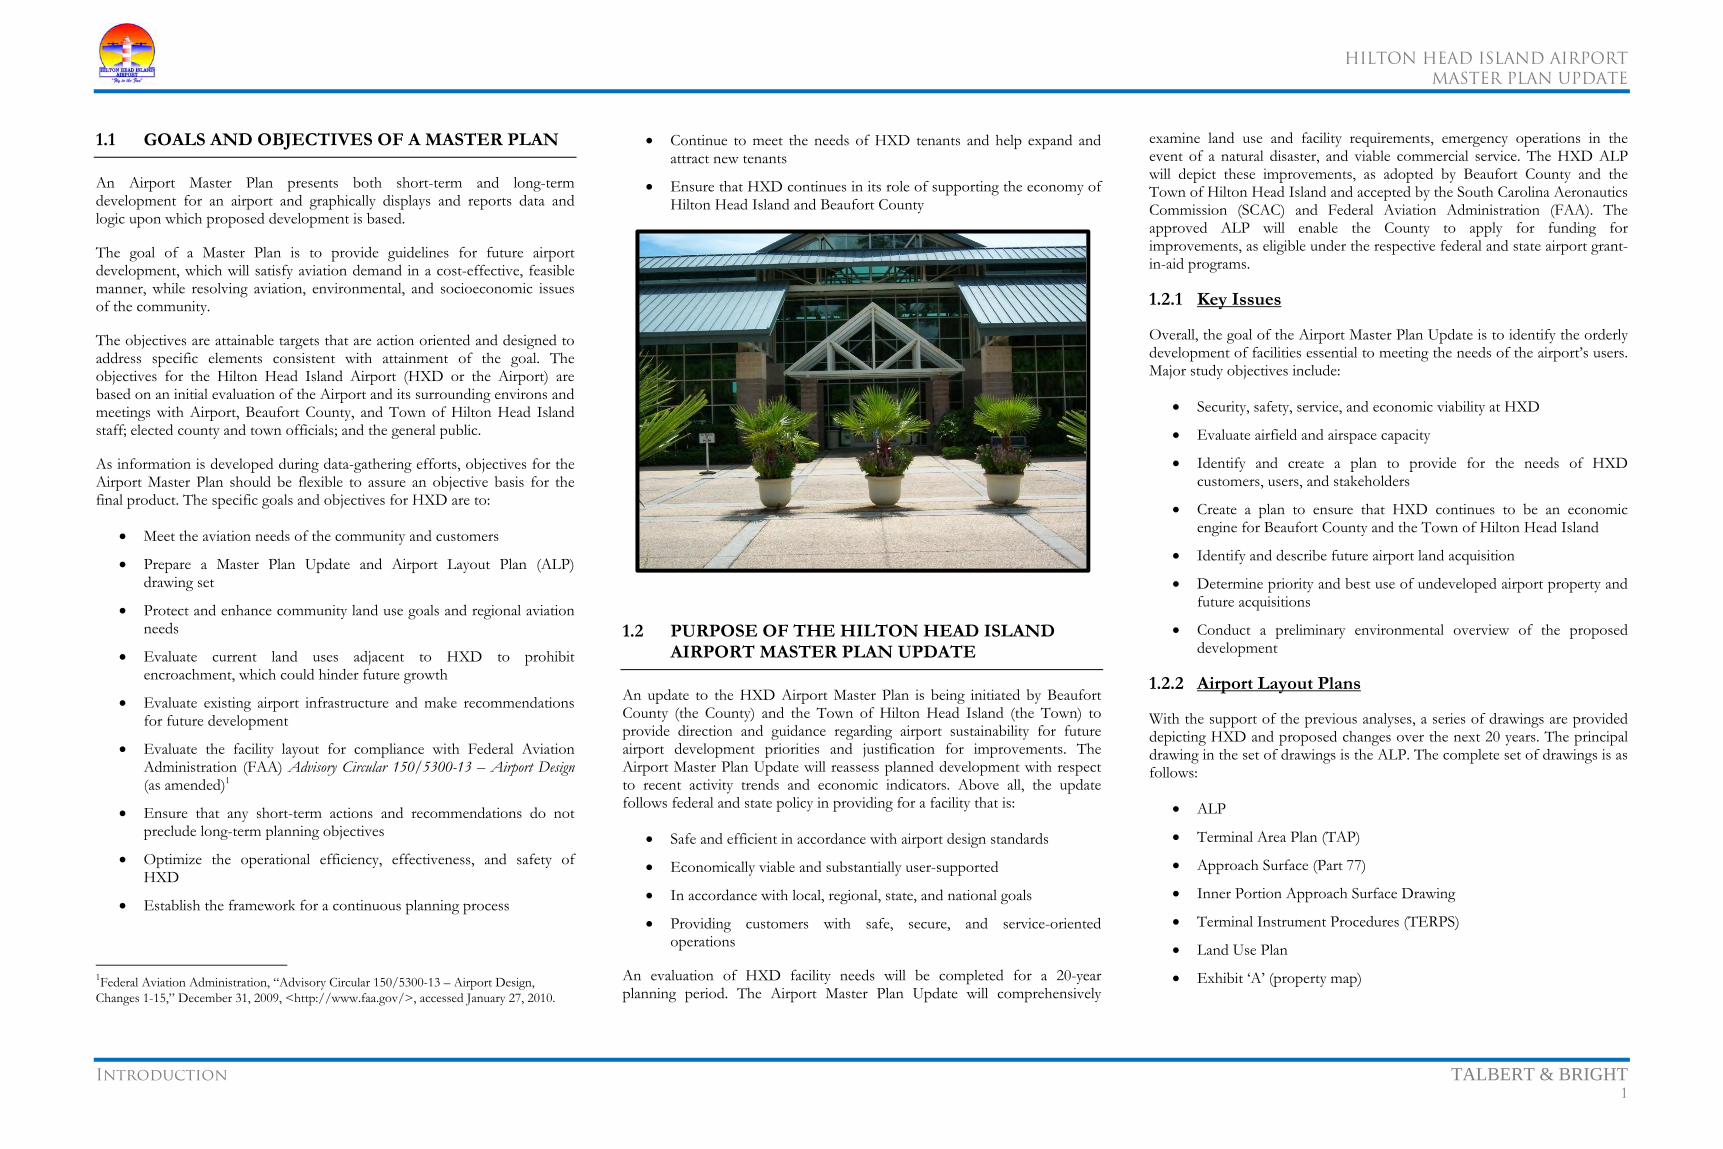
HILTON HEAD ISLAND AIRPORT
MASTER PLAN UPDATE
Introduction TALBERT & BRIGHT 1
1.1 GOALS AND OBJECTIVES OF A MASTER PLAN
An Airport Master Plan presents both short-term and long-term development for an airport and graphically displays and reports data and logic upon which proposed development is based.
The goal of a Master Plan is to provide guidelines for future airport development, which will satisfy aviation demand in a cost-effective, feasible manner, while resolving aviation, environmental, and socioeconomic issues of the community.
The objectives are attainable targets that are action oriented and designed to address specific elements consistent with attainment of the goal. The objectives for the Hilton Head Island Airport (HXD or the Airport) are based on an initial evaluation of the Airport and its surrounding environs and meetings with Airport, Beaufort County, and Town of Hilton Head Island staff; elected county and town officials; and the general public.
As information is developed during data-gathering efforts, objectives for the Airport Master Plan should be flexible to assure an objective basis for the final product. The specific goals and objectives for HXD are to:
• Meet the aviation needs of the community and customers
• Prepare a Master Plan Update and Airport Layout Plan (ALP) drawing set
• Protect and enhance community land use goals and regional aviation needs
• Evaluate current land uses adjacent to HXD to prohibit encroachment, which could hinder future growth
• Evaluate existing airport infrastructure and make recommendations for future development
• Evaluate the facility layout for compliance with Federal Aviation Administration (FAA) Advisory Circular 150/5300-13 – Airport Design (as amended)1
• Ensure that any short-term actions and recommendations do not preclude long-term planning objectives
• Optimize the operational efficiency, effectiveness, and safety of HXD
• Establish the framework for a continuous planning process
1Federal Aviation Administration, “Advisory Circular 150/5300-13 – Airport Design, Changes 1-15,” December 31, 2009, <http://www.faa.gov/>, accessed January 27, 2010.
• Continue to meet the needs of HXD tenants and help expand and attract new tenants
• Ensure that HXD continues in its role of supporting the economy of Hilton Head Island and Beaufort County
1.2 PURPOSE OF THE HILTON HEAD ISLAND AIRPORT MASTER PLAN UPDATE
An update to the HXD Airport Master Plan is being initiated by Beaufort County (the County) and the Town of Hilton Head Island (the Town) to provide direction and guidance regarding airport sustainability for future airport development priorities and justification for improvements. The Airport Master Plan Update will reassess planned development with respect to recent activity trends and economic indicators. Above all, the update follows federal and state policy in providing for a facility that is:
• Safe and efficient in accordance with airport design standards
• Economically viable and substantially user-supported
• In accordance with local, regional, state, and national goals
• Providing customers with safe, secure, and service-oriented operations
An evaluation of HXD facility needs will be completed for a 20-year planning period. The Airport Master Plan Update will comprehensively
examine land use and facility requirements, emergency operations in the event of a natural disaster, and viable commercial service. The HXD ALP will depict these improvements, as adopted by Beaufort County and the Town of Hilton Head Island and accepted by the South Carolina Aeronautics Commission (SCAC) and Federal Aviation Administration (FAA). The approved ALP will enable the County to apply for funding for improvements, as eligible under the respective federal and state airport grant-in-aid programs.
1.2.1 Key Issues
Overall, the goal of the Airport Master Plan Update is to identify the orderly development of facilities essential to meeting the needs of the airport’s users. Major study objectives include:
• Security, safety, service, and economic viability at HXD
• Evaluate airfield and airspace capacity
• Identify and create a plan to provide for the needs of HXD customers, users, and stakeholders
• Create a plan to ensure that HXD continues to be an economic engine for Beaufort County and the Town of Hilton Head Island
• Identify and describe future airport land acquisition
• Determine priority and best use of undeveloped airport property and future acquisitions
• Conduct a preliminary environmental overview of the proposed development
1.2.2 Airport Layout Plans
With the support of the previous analyses, a series of drawings are provided depicting HXD and proposed changes over the next 20 years. The principal drawing in the set of drawings is the ALP. The complete set of drawings is as follows:
• ALP
• Terminal Area Plan (TAP)
• Approach Surface (Part 77)
• Inner Portion Approach Surface Drawing
• Terminal Instrument Procedures (TERPS)
• Land Use Plan
• Exhibit ‘A’ (property map)

HILTON HEAD ISLAND AIRPORT
MASTER PLAN UPDATE
Introduction TALBERT & BRIGHT 2
1.3 HILTON HEAD ISLAND
Hilton Head Island (the Island) has developed into a nationally and internationally known resort and retirement community (Figure 1.3-1). Located at the southern end of coastal South Carolina in Beaufort County, the appeal of the Island to retirees, visitors, and permanent residents is a temperate climate, environmental sensitivity to preserve natural attractiveness, and high quality amenities and infrastructure. The Island has a relaxed, small-town feel with an evolving economic structure where the resources of wealth (residents, second homes, and visitors) are balanced with a growing private service and retail sector. The Hilton Head Island Airport is situated on 175.05 acres on the northeastern end of the Island. The Airport is owned and operated by Beaufort County and provides commercial commuter and general aviation service to Beaufort County and the Lowcountry of South Carolina (Figure 1.3-2, page 3).
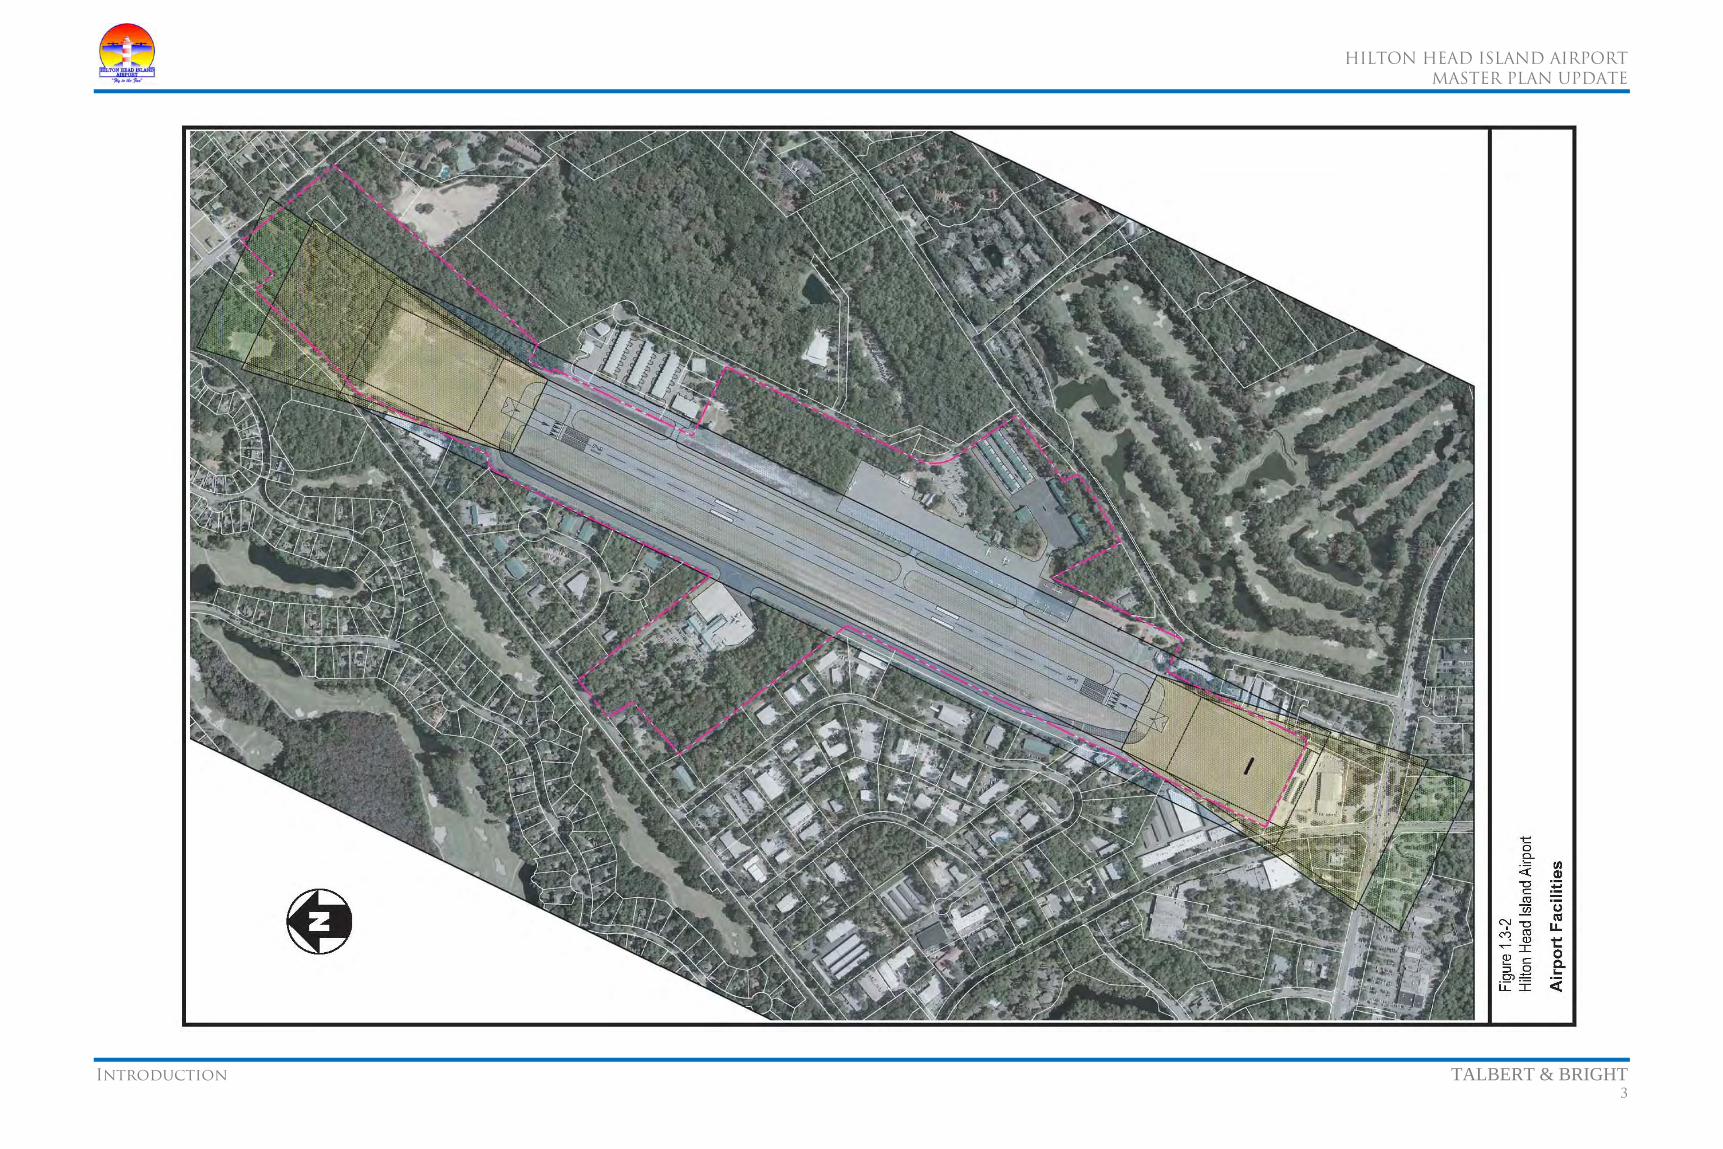
HILTON HEAD ISLAND AIRPORT
MASTER PLAN UPDATE
Introduction TALBERT & BRIGHT 3

HILTON HEAD ISLAND AIRPORT
MASTER PLAN UPDATE
Existing Conditions TALBERT & BRIGHT 4
The purpose of the existing conditions section is to provide a baseline of the physical layout and facilities currently existing at the Airport. This information is utilized in future sections of the Master Plan Update document to determine future development needs within the 20-year planning period.
2.1 AREA AIRPORTS
2.1.1 Area Commercial Service Airports
A review of area commercial service airports is illustrated by Figure 2.1.1-1 (page 5) and summarized in Table 2.1.1-1.
2.1.1.1 Hilton Head Island Airport
Section 2.2.1 (page 5.)
2.1.1.2 Savannah-Hilton Head International Airport
The Savannah-Hilton Head International Airport (SAV) in Savannah, Georgia, is located 40 miles southwest of Hilton Head Island. Traffic to SAV has increased considerably over the years because of the popularity of Hilton Head Island as a residential and tourist destination and an increasing amount of commercial business on the Island and throughout Beaufort County. According to the 2009 passenger survey,2 39 percent of arriving passengers were destined for Hilton Head Island, and an additional 11 percent were traveling to other South Carolina locations. In addition to commercial air service, SAV offers general aviation service, cargo services, two fixed base operators (FBOs), a free trade zone (FTZ),3 secure hangar space, and pilot conveniences, as well as off-airport amenities such as hotels, restaurants, a golf course, and related businesses.
2.1.1.3 Charleston International Airport
Charleston International Airport (CHS) is located in North Charleston, approximately 114 miles northeast of Hilton Head Island. The airport is situated adjacent to Charleston Air Force Base and uses the airfield facilities at the Air Force Base jointly with the U.S. Air Force. In addition to commercial air service, CHS offers general aviation service, cargo services, and two FBOs.
2Savannah-Hilton Head International Airport, “Passenger Survey, May 2009,” <http://www.savannahairport.com/>, accessed August 25, 2009. 3Definition of a free trade zone – is a special designated area where normal trade barriers like quotas and tariffs are removed and the bureaucratic necessities are narrowed in order to attract new business and foreign investments.
2.1.2 Area General Aviation Airports
2.1.2.1 Beaufort County Airport
Beaufort County Airport (ARW) has a runway length of 3,430 feet and serves general aviation traffic only. However, the airport is popular with northern Beaufort County residents and commuting business executives and is also home to Executive Flight Training, which operates two training aircraft and a flight simulator facility on the property. The only hangar facility houses the County’s mosquito control helicopters.
2.1.2.2 Ridgeland Airport
Ridgeland Airport (3J1), in neighboring Jasper County, is general aviation only, with a runway of 2,692 feet. Despite the growth in Jasper County, an elementary school positioned close to the end of the runway restricts expansion on the existing site.
Table 2.1.1-1 Commercial Service Airport Comparisons
Hilton Head Island Airport
Hilton Head Island AirportSavannah-Hilton Head
International Airport Charleston International AirportRUNWAY RUNWAYS RUNWAYS
03/21 4,300' x 100' 10/28 9,351' x 150' 15/33 9,001' x 200' 01/19 7,002' x 150' 03/21 7,004' x 150'
MINIMUMS MINIMUMS MINIMUMS RNAV (GPS) RWY 03 540-1 1/2 521 CATEGORY C ILS RWY 01 239/40 200 ILS CAT II RWY 15 143/12 100 RNAV (GPS) RWY 21 480-1 1/4 462 CATEGORY C ILS RWY 10 230/18 200 ILS or LOC RWY 33 245/24 200
FLIGHTS FLIGHTS FLIGHTS US Airways 7 daily to Charlotte, NC American Eagle 2 daily to Dallas-Ft. Worth, TX Air Tran 3 daily to Atlanta, GA
1 daily to Washington, DC (except Saturday) 1 daily to Miami, FL American Eagle 3 daily to Dallas-Ft. Worth, TX Delta 3 daily to Atlanta, GA Continental Express 3 daily to Newark, NJ Continental 3 daily to Houston, TX
Total 10 daily flights 3 daily to Houston, TX 1 daily to Newark, NJ Delta Connection 3 daily to LaGuardia, NY Delta 12 daily to Atlanta, GA 2 daily to Cincinnati, OH 5 daily to LaGuardia, NY Delta 9 daily to Atlanta, GA 2 daily to Cincinnati, OH United Express 3 daily to Washington, DC 1 daily to Boston, MA 3 daily to Chicago, IL Northwest AirLink 2 daily to Detroit, MI US Airways 7 daily to Charlotte, NC 2 daily to Memphis, TN 1 daily to Philadelphia, PA US Airways 2 daily to New York, NY Total 37 daily flights 3 daily to Washington, DC 9 daily to Charlotte, NC 3 daily to Philadelphia, PA United Express 4 daily to Washington, DC 4 daily to Chicago, IL Total 59 daily flights Source: Federal Aviation Administration Aviation System Standards, “digital - Terminal Procedures Publication (d-TPP) Digital Terminal Procedures Version: 0909 Effective 0901Z Thursday, August 27, 2009 to 0901Z Thursday, September 24, 2009,” <http://naco.faa.gov/index.asp?xml=naco/online/d_tpp>, accessed August 25, 2009. Savannah-Hilton Head International Airport, “Airlines,” <http://www.savannahairport.com/airlines/airlines/>, accessed August 25, 2009. Hilton Head Island Airport, “Airline Information,” <http://www.bcgov.net/Airport_HHI/AirlineInfo.php>, accessed August 25, 2009. Charleston International Airport, “Flight Schedules, August 2009,” <http://www.chs-airport.com/alschedd.htm>, accessed August 25, 2009.
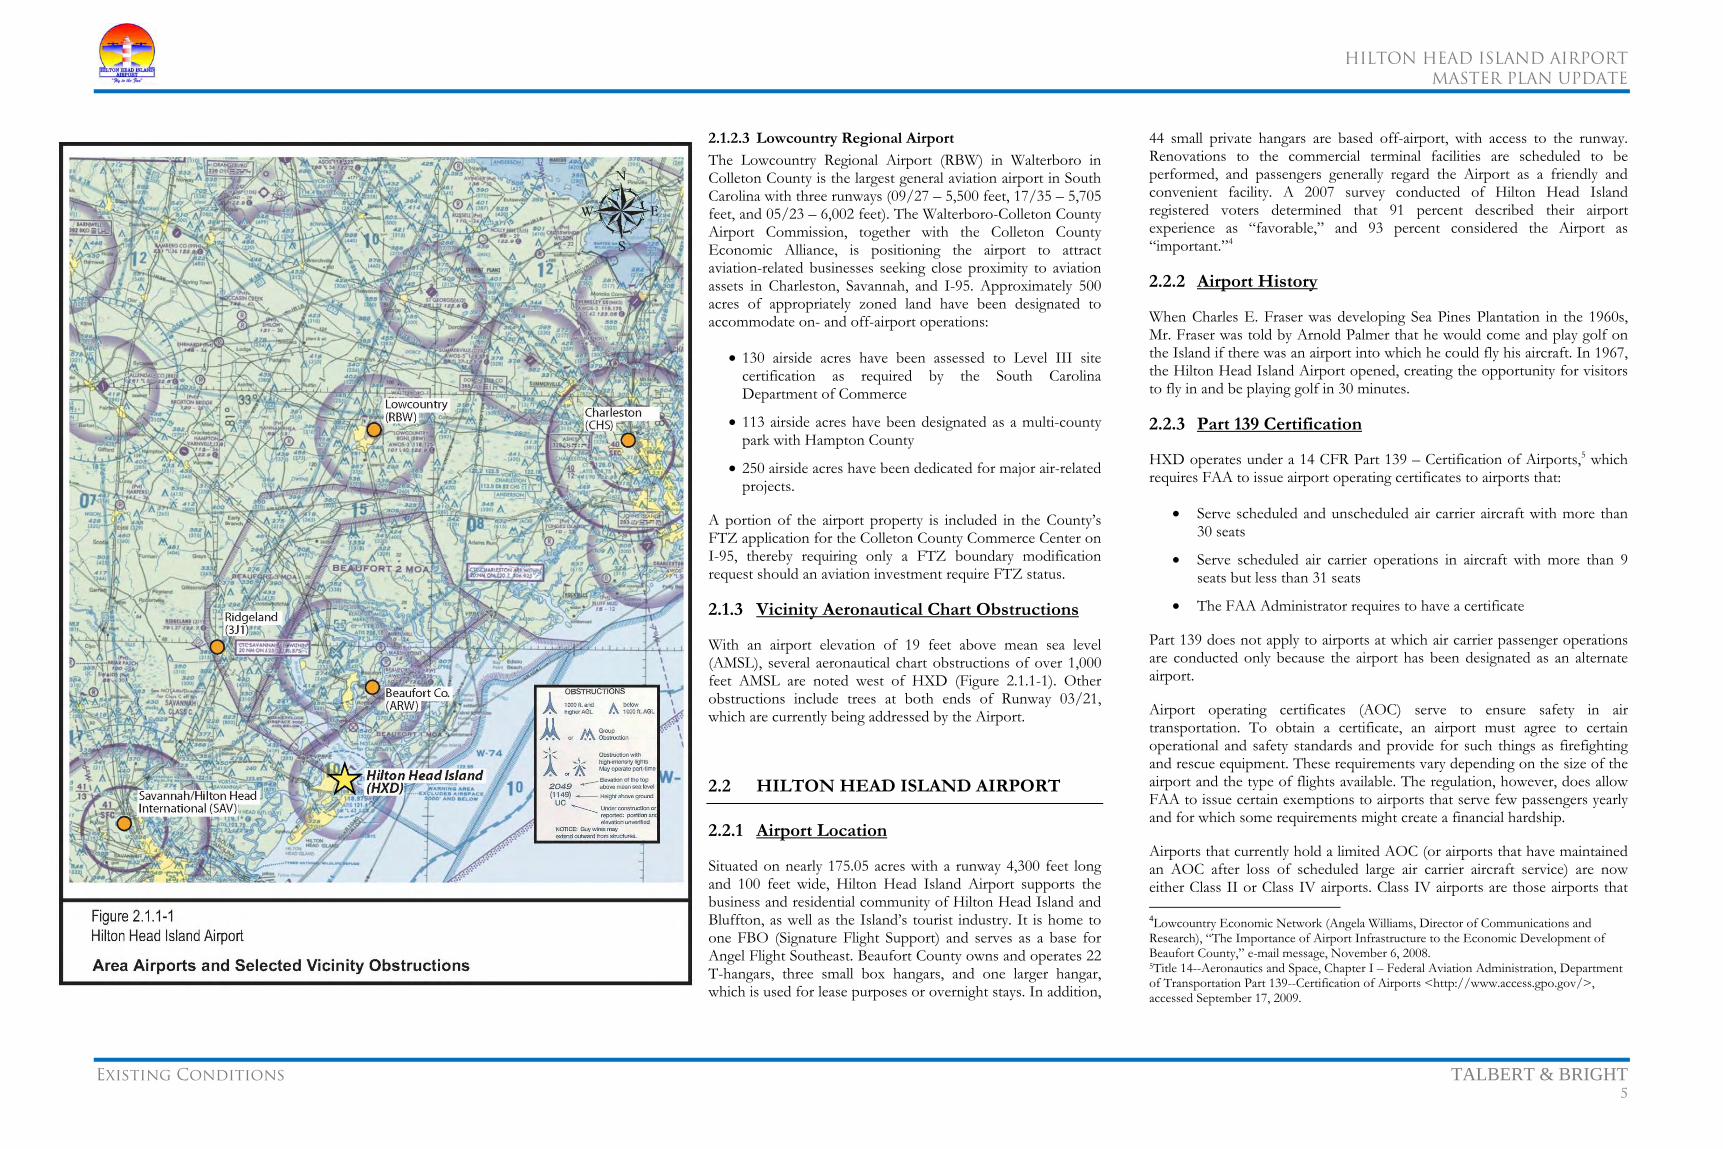
HILTON HEAD ISLAND AIRPORT
MASTER PLAN UPDATE
Existing Conditions TALBERT & BRIGHT 5
2.1.2.3 Lowcountry Regional Airport
The Lowcountry Regional Airport (RBW) in Walterboro in Colleton County is the largest general aviation airport in South Carolina with three runways (09/27 – 5,500 feet, 17/35 – 5,705 feet, and 05/23 – 6,002 feet). The Walterboro-Colleton County Airport Commission, together with the Colleton County Economic Alliance, is positioning the airport to attract aviation-related businesses seeking close proximity to aviation assets in Charleston, Savannah, and I-95. Approximately 500 acres of appropriately zoned land have been designated to accommodate on- and off-airport operations:
• 130 airside acres have been assessed to Level III site certification as required by the South Carolina Department of Commerce
• 113 airside acres have been designated as a multi-county park with Hampton County
• 250 airside acres have been dedicated for major air-related projects.
A portion of the airport property is included in the County’s FTZ application for the Colleton County Commerce Center on I-95, thereby requiring only a FTZ boundary modification request should an aviation investment require FTZ status.
2.1.3 Vicinity Aeronautical Chart Obstructions
With an airport elevation of 19 feet above mean sea level (AMSL), several aeronautical chart obstructions of over 1,000 feet AMSL are noted west of HXD (Figure 2.1.1-1). Other obstructions include trees at both ends of Runway 03/21, which are currently being addressed by the Airport.
2.2 HILTON HEAD ISLAND AIRPORT
2.2.1 Airport Location
Situated on nearly 175.05 acres with a runway 4,300 feet long and 100 feet wide, Hilton Head Island Airport supports the business and residential community of Hilton Head Island and Bluffton, as well as the Island’s tourist industry. It is home to one FBO (Signature Flight Support) and serves as a base for Angel Flight Southeast. Beaufort County owns and operates 22 T-hangars, three small box hangars, and one larger hangar, which is used for lease purposes or overnight stays. In addition,
44 small private hangars are based off-airport, with access to the runway. Renovations to the commercial terminal facilities are scheduled to be performed, and passengers generally regard the Airport as a friendly and convenient facility. A 2007 survey conducted of Hilton Head Island registered voters determined that 91 percent described their airport experience as “favorable,” and 93 percent considered the Airport as “important.”4
2.2.2 Airport History
When Charles E. Fraser was developing Sea Pines Plantation in the 1960s, Mr. Fraser was told by Arnold Palmer that he would come and play golf on the Island if there was an airport into which he could fly his aircraft. In 1967, the Hilton Head Island Airport opened, creating the opportunity for visitors to fly in and be playing golf in 30 minutes.
2.2.3 Part 139 Certification
HXD operates under a 14 CFR Part 139 – Certification of Airports,5 which requires FAA to issue airport operating certificates to airports that:
• Serve scheduled and unscheduled air carrier aircraft with more than 30 seats
• Serve scheduled air carrier operations in aircraft with more than 9 seats but less than 31 seats
• The FAA Administrator requires to have a certificate
Part 139 does not apply to airports at which air carrier passenger operations are conducted only because the airport has been designated as an alternate airport.
Airport operating certificates (AOC) serve to ensure safety in air transportation. To obtain a certificate, an airport must agree to certain operational and safety standards and provide for such things as firefighting and rescue equipment. These requirements vary depending on the size of the airport and the type of flights available. The regulation, however, does allow FAA to issue certain exemptions to airports that serve few passengers yearly and for which some requirements might create a financial hardship.
Airports that currently hold a limited AOC (or airports that have maintained an AOC after loss of scheduled large air carrier aircraft service) are now either Class II or Class IV airports. Class IV airports are those airports that 4Lowcountry Economic Network (Angela Williams, Director of Communications and Research), “The Importance of Airport Infrastructure to the Economic Development of Beaufort County,” e-mail message, November 6, 2008. 5Title 14--Aeronautics and Space, Chapter I – Federal Aviation Administration, Department of Transportation Part 139--Certification of Airports <http://www.access.gpo.gov/>, accessed September 17, 2009.

HILTON HEAD ISLAND AIRPORT
MASTER PLAN UPDATE
Existing Conditions TALBERT & BRIGHT 6
serve only unscheduled operations of large air carrier aircraft. Air carrier operations are so infrequent at these airports that, in the past, FAA only required them to comply with some Part 139 requirements. This continues to be the case, but new operational requirements have been added along with modifications to the airport certification process and other administrative changes. HXD is classified as a Class I airport.
Table 2.2.3-1 compares previous Part 139 operational and safety requirements with those now required of Class 1 airports under the revised Part 139.
For the purpose of Index determination, air carrier aircraft lengths are grouped as follows:
(1) Index A includes aircraft less than 90 feet in length.
(2) Index B includes aircraft at least 90 feet but less than 126 feet in length.
(3) Index C includes aircraft at least 126 feet but less than 159 feet in length.
(4) Index D includes aircraft at least 159 feet but less than 200 feet in length.
(5) Index E includes aircraft at least 200 feet in length.
HXD is a Part 139 Class I Index A tower airport.6
2.2.4 Historical Funding
Table 2.2.4-1 (page 7) provides a historical listing of federal- and state-funded projects at HXD for the last 25 years. This listing, totaling approximately $22.0 million, provides the chronological development of HXD between 1984 and 2009.
2.2.5 Airport Facility Directory
This section describes the airside characteristics of HXD. Many of the characteristics noted are published in the FAA Airport/Facility Directory (AFD, Figure 2.2.5-1, page 8).
6Hilton Head Island Airport, “Airport Certification Manual, Class 1 Airport, To comply with CFR 14 Part 139 as administered by the Federal Aviation Administration,” approved by the FAA February 17, 2009.
Table 2.2.3-1 Part 139 Requirements
Hilton Head Island Airport Previous Revised
1. Personnel provisions (§139.303) A recordkeeping system and new personnel training standards and clarification of use of a designee to comply with Part 139
2. Paved and unpaved surfaces (§139.305 and §139.307)
Clarification of requirement to repair pavement cracks
3. Safety areas (§139.309) Clarification of safety area definition (§139.3) 4. Marking, lighting, and signs
(§139.311) Clarification of requirement to mark pavement edges and new requirement for sign plan (§139.203(b)(13))
5. Snow and ice control plan (§139.313)
Clarification of requirement for determining need for plan and positioning of snow off movement areas
6. ARFF (§139.315, §139.317 and §139.319)
New personnel training, fire extinguishing agent, and HAZMAT response standards; elimination of older ARFF vehicle exception; and clarification of Index criteria. Also, extends ARFF coverage to scheduled operations of small air carrier aircraft.
7. HAZMAT handling/storage (§139.321)
Standards for air carrier fueling operations and additional fuel fire safety and personnel training standards
8. Traffic/wind indicators (§139.323) New supplemental wind cone/segmented circle standards
9. Airport emergency plan (§139.325) New requirement to plan for fuel storage fires, HAZMAT and security incidents, alarm systems and water rescue situations
10. Self-inspections (§139.327) New training requirements for inspection personnel
11. Ground vehicle operations (§139.329)
New training requirements for pedestrians and ground vehicles
12. Obstructions (§139.331) Unchanged 13. NAVAIDS (§139.333) Unchanged 14. Public protection (§139.335) Unchanged 15. Wildlife hazard management
(§139.337) Clarification of wildlife hazards requiring action and new hazard assessment and management plan standards
16. Airport condition reporting (§139.339)
New notification standard
17. Construction/unserviceable areas (§139.341)
Unchanged
Source: Title 14--Aeronautics and Space, Chapter I – Federal Aviation Administration, Department of Transportation Part 139--Certification of Airports <http://www.access.gpo.gov/nara/cfr/waisidx_08/14cfr139_08.html>, accessed September 17, 2009.
2.2.5.1 Airport Name and Associated City
The Airport/Facility Directory (AFD) lists the airport name as Hilton Head Island Airport. Airports are listed alphabetically in the AFD by the associated city and state. The associated city for HXD is Hilton Head Island, South Carolina. HXD is located three miles northeast of the center of Hilton Head Island, South Carolina.
2.2.5.2 Airport Identifier
A three- or four-character code is assigned to airports. These identifiers are used by air traffic control (ATC) in lieu of the airport name in flight plans, flight strips, and other written records and computer operations. The location identifier for Hilton Head Island Airport is HXD.
2.2.5.3 Airport Coordinates (Airport Reference Point)
The geographic position is shown in degrees, minutes, and hundredths of a minute and represents the approximate center of mass of usable runways, also defined as the airport reference point (ARP). The existing ARP for HXD is N 32° 13.46′, W 080° 41.85′.
2.2.5.4 Navigational Charts
Airports are typically illustrated on Sectional and IFR Enroute Low and High Altitude Charts. HXD is shown on the Charlotte Sectional Aeronautical Chart, Jacksonville Sectional Aeronautical Chart, H-9 IFR Enroute High Altitude Chart, and L-24 IFR Enroute Low Altitude Chart.
2.2.5.5 Instrument Approaches7
Hilton Head Island Airport has five published instrument approach procedures (Figures 2.2.5.5-1, page 9 and 2.2.5.5-2, page 10 and Table 2.2.5.5-1, page 10):
• Localizer/DME Approach – Runway 21
• RNAV (GPS) Approach – Runway 21
• RNAV (GPS) Approach – Runway 03
• VOR/DME-A – Runway 03/21 (circling)
• Broad Creek Visual – Runway 03
7Federal Aviation Administration Aviation System Standards, “digital - Terminal Procedures Publication (d-TPP) Digital Terminal Procedures Version: 0909 Effective 0901Z Thursday, August 27, 2009 to 0901Z Thursday, September 24, 2009,” <http://naco.faa.gov/>, accessed September 17, 2009.

HILTON HEAD ISLAND AIRPORT
MASTER PLAN UPDATE
Existing Conditions TALBERT & BRIGHT 7
Table 2.2.4-1 Grant History
Hilton Head Island Airport Fiscal Year
Grant Number Project Description
FAA State LocalEntitlement Discretionary Total
1984 001-1984 Install Apron Lighting $0 $70,376 $70,376 $0 $7,820 1986 86-011 Resealing and Remarking Runway
Overruns $0 $0 $0 $4,350 $4,350
1987 002-1987 Improve Aircraft Rescue and Firefighting Building
$0 $186,193 $186,193
Improve Airport Drainage $0 $24,152 $24,152 Acquire Aircraft Rescue and
Firefighting Vehicle $0 $102,272 $102,272
002-1987 Total $0 $312,617 $312,617 $0 $34,735 1988 003-1988 Install Instrument Approach Aid $0 $327,688 $327,688
Remove Obstructions $0 $58,614 $58,614 Acquire Land For Approaches $0 $435,654 $435,654 Acquire Land for Development $603,000 $128,767 $731,767 Extend Taxiway $0 $112,196 $112,196 Install Apron Lighting $0 $49,152 $49,152 003-1988 Total $603,000 $1,112,071 $1,715,071 $57,050 $133,513
1989 004-1989 Conduct Airport Master Plan Study $64,293 $0 $64,293 $0 $7,144 1990 005-1990 Acquire Land for Development $475,682 $0 $475,682 $0 $52,854 1992 006-1992 Construct Apron $376,994 $0 $376,994
Construct Terminal Building $625,417 $0 $625,417 006-1992 Total $1,002,411 $0 $1,002,411 $0 $246,077
1993 007-1993 Improve Access Road $98,100 $0 $98,100 Install Guidance Signs $0 $91,452 $91,452 Construct Taxiway $108,031 $0 $108,031 Construct Apron $297,540 $0 $297,540 Expand Apron $0 $28,652 $28,652 007-1993 Total $503,671 $120,104 $623,775 $0 $179,541
1994 008-1994 Construct Terminal Building $307,384 $0 $307,384 $0 $102,461 1994 009-1994 Construct Terminal Building $288,611 $0 $288,611 $0 $50,931 1995 010-1995 Acquire Land for Development $126,594 $0 $126,594
Improve Access Road $126,594 $0 $126,594 Construct Terminal Building $126,593 $0 $126,593 Construct Taxiway $126,594 $0 $126,594 010-1995 Total $506,375 $0 $506,375 $0 $56,264
1996 011-1996 Construct Terminal Building $117,448 $0 $117,448 Acquire Land for Development $117,448 $0 $117,448 Improve Access Road $117,447 $0 $117,447 Construct Taxiway $117,448 $0 $117,448 011-1996 Total $469,791 $0 $469,791 $0 $52,199
1997 012-1997 Improve Access Road $131,240 $0 $131,240 Acquire Land for Development $131,240 $0 $131,240 Construct Terminal Building $131,240 $0 $131,240 Construct Taxiway $131,241 $0 $131,241 012-1997 Total $524,961 $0 $524,961 $0 $58,329
1998 013-1998 Construct Terminal Building $132,033 $0 $132,033 Construct Apron $132,034 $0 $132,034 Improve Access Road $132,032 $0 $132,032 Construct Taxiway $132,034 $0 $132,034
Table 2.2.4-1 Grant History
Hilton Head Island Airport Fiscal Year
Grant Number Project Description
FAAState LocalEntitlement Discretionary Total
013-1998 Total $528,133 $0 $528,133 $0 $58,681 1999 014-1999 Improve Access Road $109,479 $0 $109,479
Construct Apron $109,480 $0 $109,480 Construct Terminal Building $109,480 $0 $109,480 Construct Taxiway $109,479 $0 $109,479 014-1999 Total $437,918 $0 $437,918 $0 $48,658
1999 015-1999 Rehabilitate Runway Lighting $2,337 $137,912 $140,249 Rehabilitate Taxiway Lighting $0 $116,285 $116,285 Install Runway Vertical/Visual
Guidance System $0 $11,356 $11,356
015-1999 Total $2,337 $265,553 $267,890 $0 $29,766 1999 016-1999 Improve Access Road $41,043 $0 $41,043
Construct Apron $41,044 $0 $41,044 Construct Terminal Building $41,044 $0 $41,044 Construct Taxiway $41,043 $0 $41,043 016-1999 Total $164,174 $0 $164,174 $0 $18,242
2000 017-2000 Improve Access Road $23,735 $0 $23,735 Construct Apron $23,735 $0 $23,735 Construct Terminal Building $23,735 $0 $23,735 Construct Taxiway $23,736 $0 $23,736 017-2000 Total $94,941 $0 $94,941 $0 $10,549
2000 018-2000 Acquire Land for Development $300,000 $0 $300,000 Rehabilitate Runway $178,124 $0 $178,124 018-2000 Total $478,124 $0 $478,124 $0 $53,125
2001 019-2001 Install Instrument Approach Aid $10,962 $0 $10,962 Acquire Land for Development $50,488 $0 $50,488 Install Weather Reporting
Equipment $10,800 $0 $10,800
Install Perimeter Fencing $81,000 $0 $81,000 Improve Terminal Building $17,640 $0 $17,640 Acquire Handicap Passenger Lift
Device $23,511 $0 $23,511
Conduct Environmental Study $44,921 $0 $44,921 019-2001 Total $239,322 $0 $239,322 $46,300 $26,591
2002 020-2002 Install Security Fencing $131,602 $0 $131,602 Security Enhancements $59,002 $0 $59,002 Acquire Land for Development $50,488 $0 $50,488 Install Miscellaneous NAVAIDs $307,467 $0 $307,467 020-2002 Total $548,559 $0 $548,559 $0 $0
2002 023-2002 Construct Building $128,191 $0 $128,191 $0 $42,730 2003 024-2003 Acquire Land for Development $50,488 $0 $50,488
Install Weather Reporting Equipment
$148,500 $0 $148,500
Install Perimeter Fencing $148,500 $0 $148,500 Acquire Equipment $67,500 $0 $67,500 Construct Building $985,009 $0 $985,009 Rehabilitate Runway $28,755 $0 $28,755 Rehabilitate Apron $28,755 $0 $28,755
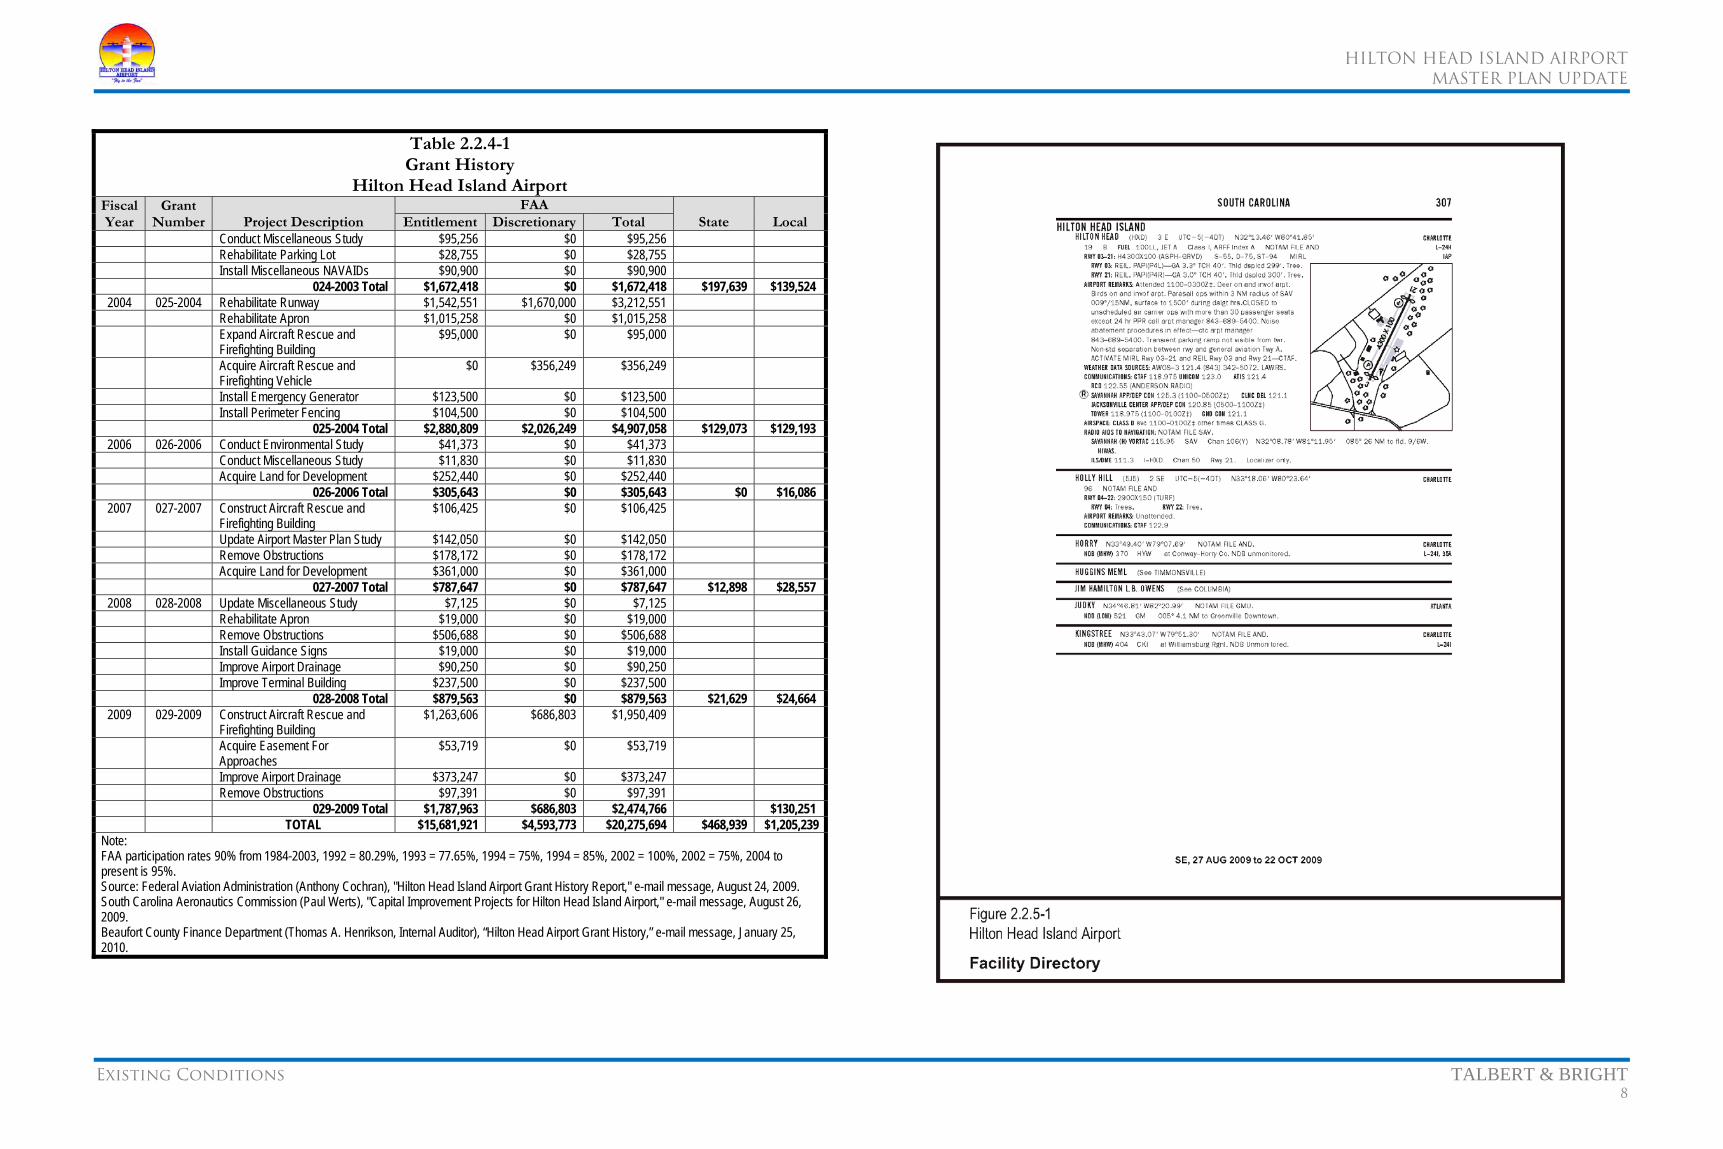
HILTON HEAD ISLAND AIRPORT
MASTER PLAN UPDATE
Existing Conditions TALBERT & BRIGHT 8
Table 2.2.4-1 Grant History
Hilton Head Island Airport Fiscal Year
Grant Number Project Description
FAA State LocalEntitlement Discretionary Total
Conduct Miscellaneous Study $95,256 $0 $95,256 Rehabilitate Parking Lot $28,755 $0 $28,755 Install Miscellaneous NAVAIDs $90,900 $0 $90,900 024-2003 Total $1,672,418 $0 $1,672,418 $197,639 $139,524
2004 025-2004 Rehabilitate Runway $1,542,551 $1,670,000 $3,212,551 Rehabilitate Apron $1,015,258 $0 $1,015,258 Expand Aircraft Rescue and
Firefighting Building $95,000 $0 $95,000
Acquire Aircraft Rescue and Firefighting Vehicle
$0 $356,249 $356,249
Install Emergency Generator $123,500 $0 $123,500 Install Perimeter Fencing $104,500 $0 $104,500 025-2004 Total $2,880,809 $2,026,249 $4,907,058 $129,073 $129,193
2006 026-2006 Conduct Environmental Study $41,373 $0 $41,373 Conduct Miscellaneous Study $11,830 $0 $11,830 Acquire Land for Development $252,440 $0 $252,440 026-2006 Total $305,643 $0 $305,643 $0 $16,086
2007 027-2007 Construct Aircraft Rescue and Firefighting Building
$106,425 $0 $106,425
Update Airport Master Plan Study $142,050 $0 $142,050 Remove Obstructions $178,172 $0 $178,172 Acquire Land for Development $361,000 $0 $361,000 027-2007 Total $787,647 $0 $787,647 $12,898 $28,557
2008 028-2008 Update Miscellaneous Study $7,125 $0 $7,125 Rehabilitate Apron $19,000 $0 $19,000 Remove Obstructions $506,688 $0 $506,688 Install Guidance Signs $19,000 $0 $19,000 Improve Airport Drainage $90,250 $0 $90,250 Improve Terminal Building $237,500 $0 $237,500 028-2008 Total $879,563 $0 $879,563 $21,629 $24,664
2009 029-2009 Construct Aircraft Rescue and Firefighting Building
$1,263,606 $686,803 $1,950,409
Acquire Easement For Approaches
$53,719 $0 $53,719
Improve Airport Drainage $373,247 $0 $373,247 Remove Obstructions $97,391 $0 $97,391 029-2009 Total $1,787,963 $686,803 $2,474,766 $130,251 TOTAL $15,681,921 $4,593,773 $20,275,694 $468,939 $1,205,239
Note: FAA participation rates 90% from 1984-2003, 1992 = 80.29%, 1993 = 77.65%, 1994 = 75%, 1994 = 85%, 2002 = 100%, 2002 = 75%, 2004 to present is 95%. Source: Federal Aviation Administration (Anthony Cochran), "Hilton Head Island Airport Grant History Report," e-mail message, August 24, 2009. South Carolina Aeronautics Commission (Paul Werts), "Capital Improvement Projects for Hilton Head Island Airport," e-mail message, August 26, 2009. Beaufort County Finance Department (Thomas A. Henrikson, Internal Auditor), “Hilton Head Airport Grant History,” e-mail message, January 25, 2010.
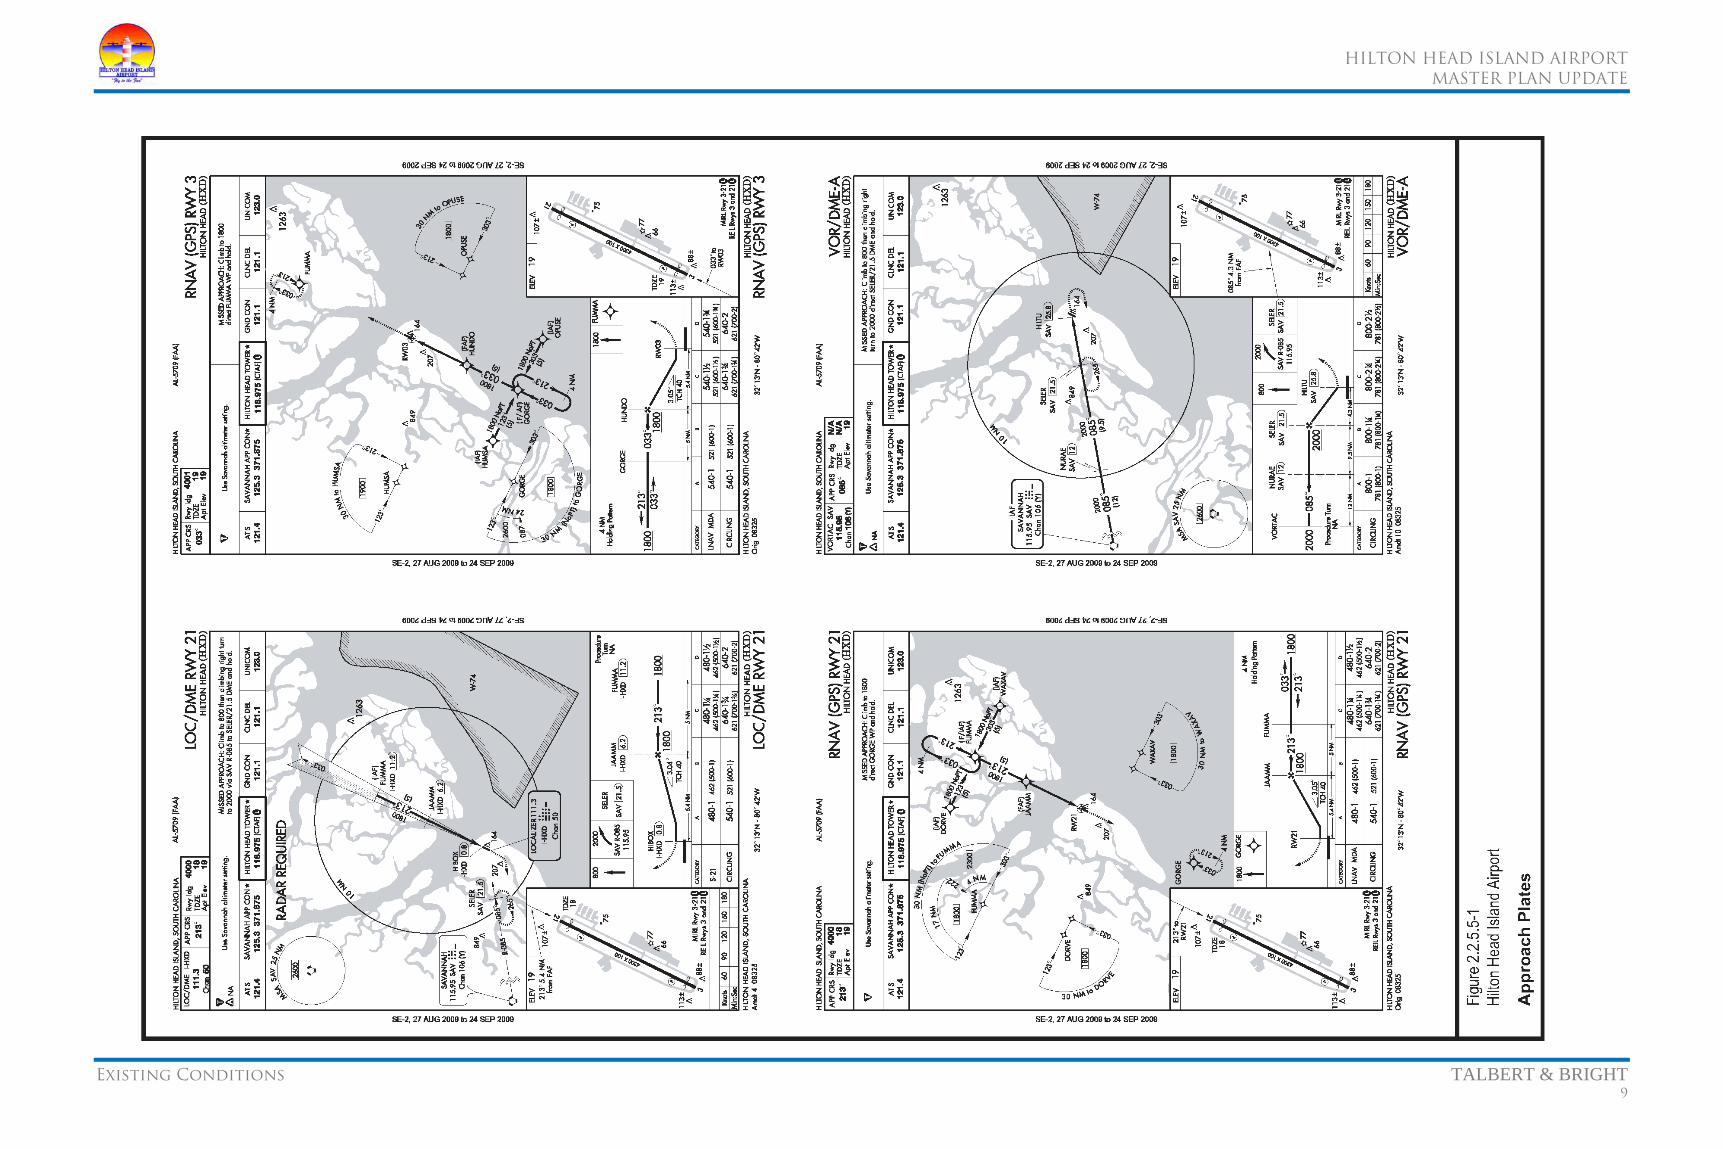
HILTON HEAD ISLAND AIRPORT
MASTER PLAN UPDATE
Existing Conditions TALBERT & BRIGHT 9

HILTON HEAD ISLAND AIRPORT
MASTER PLAN UPDATE
Existing Conditions TALBERT & BRIGHT 10
Table 2.2.5.5-1 Airport Approach Minimums Hilton Head Island Airport
Approach Procedure
Minimum Altitude (AMSL)
Visibility (MI) Category
LOC/DME – Runway 21
480' 1 A/B 480 1¼ C 480 1½ D
LNAV – Runway 21
480' 1 A/B 480 1¼ C 480 1½ D
LNAV – Runway 03
540' 1 A/B 540' 1½ C 540' 1¾ D
Source: Federal Aviation Administration Aviation System Standards, “digital - Terminal Procedures Publication (d-TPP) Digital Terminal Procedures Version: 0909 Effective 0901Z Thursday, August 27, 2009 to 0901Z Thursday, September 24, 2009.
2.2.5.6 Obstacles8 Hilton Head Island Airport has the following published obstacle data:
• Runway 03: numerous trees 328 feet from departure end of runway, 428 feet left of departure end of runway, and 86 feet above ground level (AGL)/106 feet AMSL. Numerous trees 319 feet from departure end of runway, 390 feet right of departure end of runway, and 83 feet AGL/97 feet AMSL.
• Runway 21: numerous trees 39 feet from departure end of runway, 357 feet right of departure end of runway, and 94 feet AGL/111 feet AMSL. Numerous trees 368 feet from departure end of runway, 332 feet left of departure end of runway, and 73 feet AGL/87 feet AMSL. Numerous trees 1,421 feet from departure end of runway, 221 feet right of departure end of runway, and 74 feet AGL/91 feet AMSL. Numerous trees 1,207 feet from departure end of runway, 329 feet left of departure end of runway, and 85 feet AGL/99 feet AMSL.
8Ibid.
2.2.6 Airport Inventory
Figure 2.2.6-1 (page 11) provides an inventory of the facilities at HXD, and Table 2.2.6-1 (page 12) provides a summary of HXD facilities.
2.2.6.1 Runway/Taxiways
As shown by Figure 2.2.6-1 (page 11), Runway 03/21 at HXD is a 4,300-foot by 100-foot runway with 300-foot displaced thresholds at either end. The runway is lighted by medium intensity runway lights (MIRLs), with runway end identifier lights (REILs) and four-box precision approach path indicators (4-PAPI) at either end.
The taxiway system consists of two parallel taxiways: Taxiway ‘F’ (50 feet wide), which is on the commuter side (west) of the runway, and Taxiway ‘A’ (40 feet wide), which is on the general aviation side (east) of the runway. There are also three connector taxiways (40 feet wide): B, C, and E on the east side of the runway that connect Runway 03/21 with Taxiway ‘A.’ The taxiway system is lighted with medium intensity taxiway lights (MITLs).
2.2.6.2 Apron
There are two apron areas:
• Commuter terminal apron consists of 8,426 square yards of concrete and 3,535 square yards of asphalt and is capable of holding up to four commuter service aircraft
• General aviation terminal apron consists of 43,730 square yards of asphalt with 66 tie-downs. The apron/taxilane area in the vicinity of the hangars encompasses 14,375 square yards.
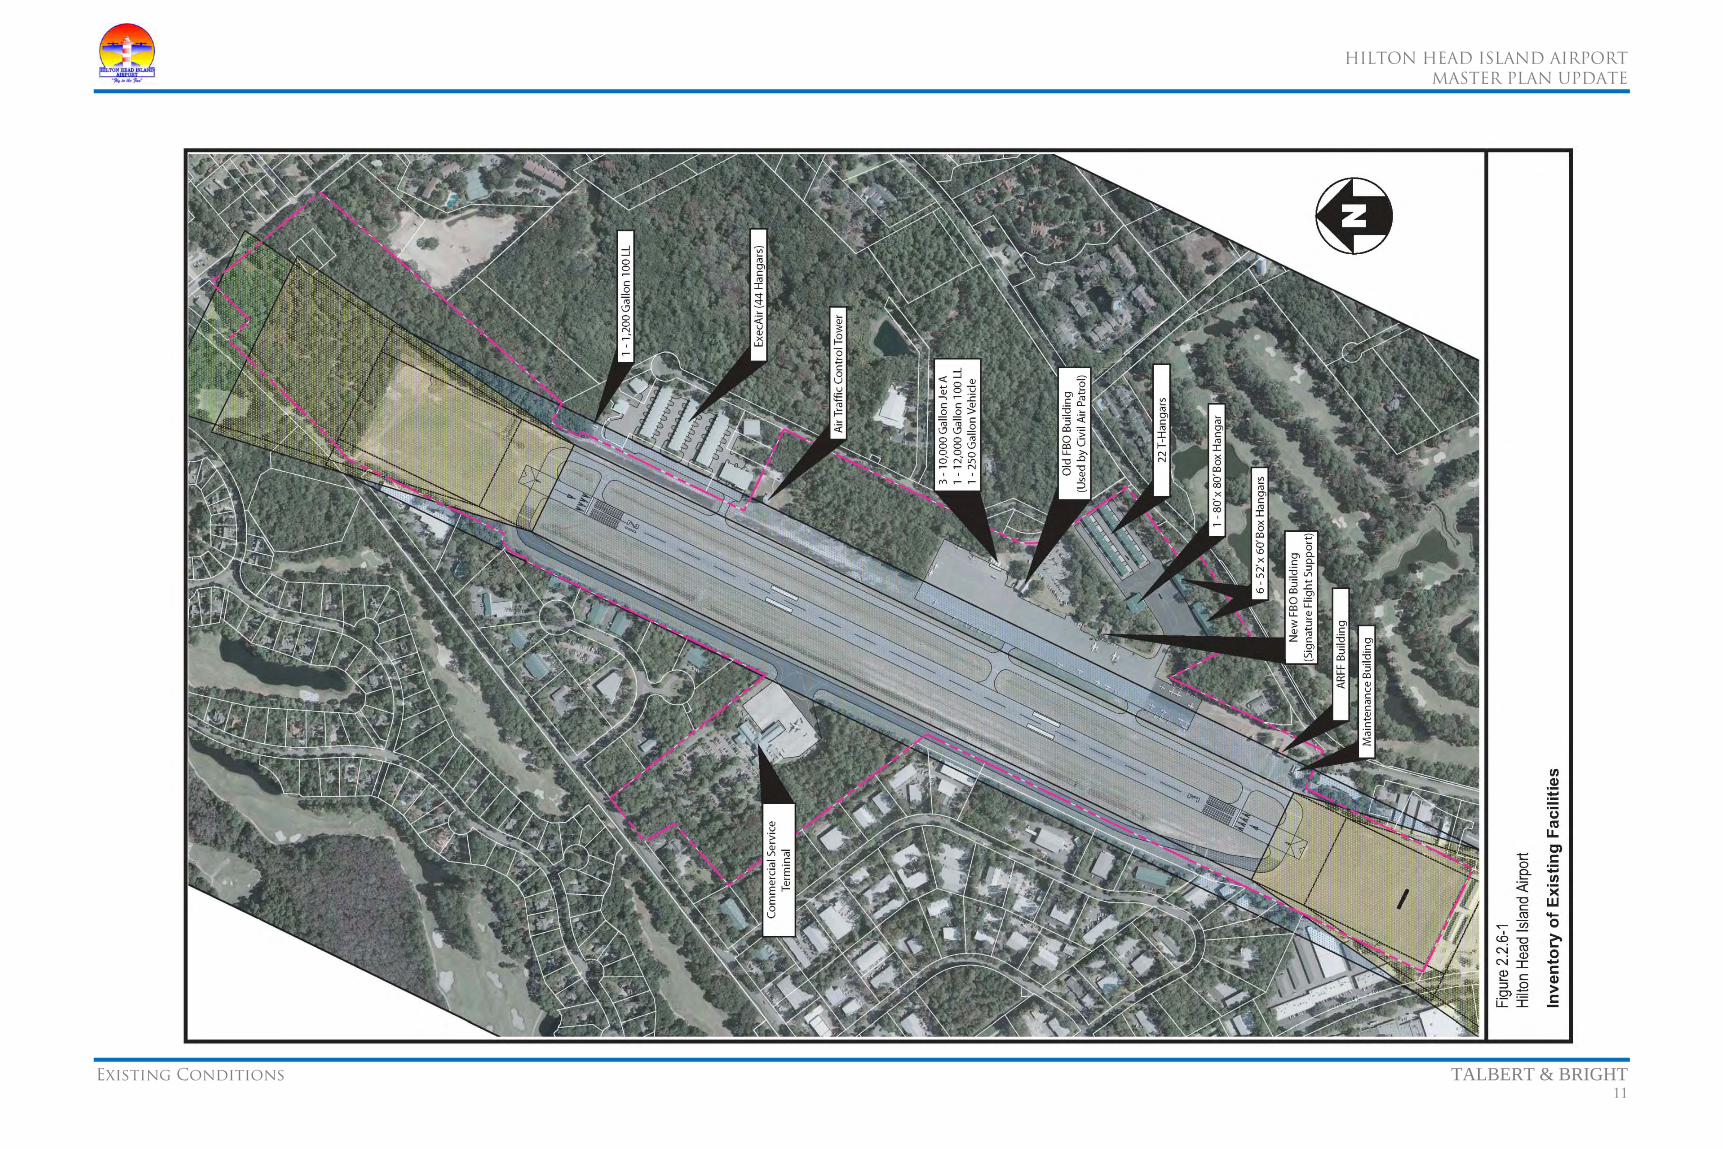
HILTON HEAD ISLAND AIRPORT
MASTER PLAN UPDATE
Existing Conditions TALBERT & BRIGHT 11
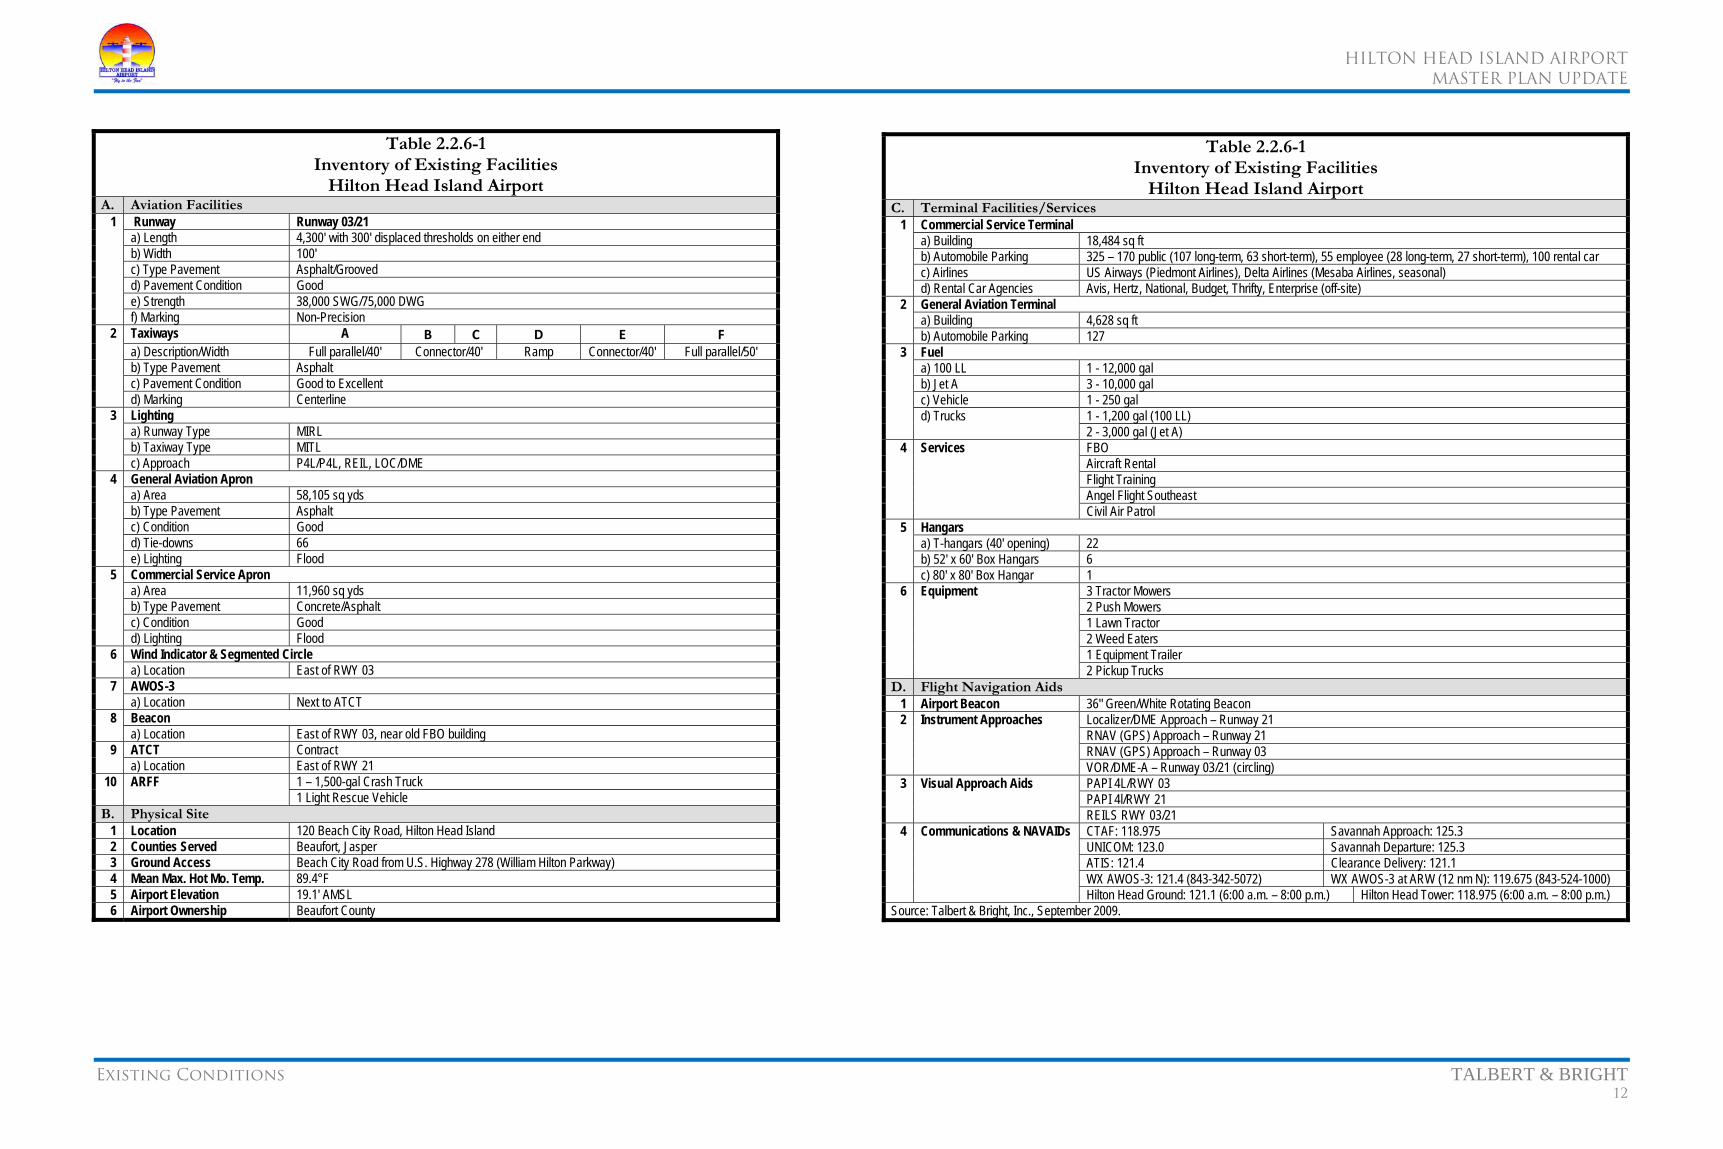
HILTON HEAD ISLAND AIRPORT
MASTER PLAN UPDATE
Existing Conditions TALBERT & BRIGHT 12
Table 2.2.6-1 Inventory of Existing Facilities
Hilton Head Island Airport A. Aviation Facilities
1 Runway Runway 03/21 a) Length 4,300' with 300' displaced thresholds on either end b) Width 100' c) Type Pavement Asphalt/Grooved d) Pavement Condition Good e) Strength 38,000 SWG/75,000 DWG f) Marking Non-Precision
2 Taxiways A B C D E Fa) Description/Width Full parallel/40' Connector/40' Ramp Connector/40' Full parallel/50' b) Type Pavement Asphalt c) Pavement Condition Good to Excellent d) Marking Centerline
3 Lighting a) Runway Type MIRL b) Taxiway Type MITL c) Approach P4L/P4L, REIL, LOC/DME
4 General Aviation Apron a) Area 58,105 sq yds b) Type Pavement Asphalt c) Condition Good d) Tie-downs 66 e) Lighting Flood
5 Commercial Service Apron a) Area 11,960 sq yds b) Type Pavement Concrete/Asphalt c) Condition Good d) Lighting Flood
6 Wind Indicator & Segmented Circle a) Location East of RWY 03
7 AWOS-3 a) Location Next to ATCT
8 Beacon a) Location East of RWY 03, near old FBO building
9 ATCT Contract a) Location East of RWY 21
10 ARFF 1 – 1,500-gal Crash Truck 1 Light Rescue Vehicle
B. Physical Site 1 Location 120 Beach City Road, Hilton Head Island 2 Counties Served Beaufort, Jasper 3 Ground Access Beach City Road from U.S. Highway 278 (William Hilton Parkway) 4 Mean Max. Hot Mo. Temp. 89.4°F 5 Airport Elevation 19.1' AMSL 6 Airport Ownership Beaufort County
Table 2.2.6-1 Inventory of Existing Facilities
Hilton Head Island Airport C. Terminal Facilities/Services
1 Commercial Service Terminala) Building 18,484 sq ft b) Automobile Parking 325 – 170 public (107 long-term, 63 short-term), 55 employee (28 long-term, 27 short-term), 100 rental car c) Airlines US Airways (Piedmont Airlines), Delta Airlines (Mesaba Airlines, seasonal)d) Rental Car Agencies Avis, Hertz, National, Budget, Thrifty, Enterprise (off-site)
2 General Aviation Terminal a) Building 4,628 sq ft b) Automobile Parking 127
3 Fuel a) 100 LL 1 - 12,000 gal b) Jet A 3 - 10,000 gal c) Vehicle 1 - 250 gal d) Trucks 1 - 1,200 gal (100 LL)
2 - 3,000 gal (Jet A) 4 Services FBO
Aircraft Rental Flight Training Angel Flight Southeast Civil Air Patrol
5 Hangarsa) T-hangars (40' opening) 22 b) 52' x 60' Box Hangars 6 c) 80' x 80' Box Hangar 1
6 Equipment 3 Tractor Mowers 2 Push Mowers 1 Lawn Tractor 2 Weed Eaters 1 Equipment Trailer 2 Pickup Trucks
D. Flight Navigation Aids1 Airport Beacon 36" Green/White Rotating Beacon 2 Instrument Approaches Localizer/DME Approach – Runway 21
RNAV (GPS) Approach – Runway 21 RNAV (GPS) Approach – Runway 03 VOR/DME-A – Runway 03/21 (circling)
3 Visual Approach Aids PAPI 4L/RWY 03 PAPI 4l/RWY 21 REILS RWY 03/21
4 Communications & NAVAIDs CTAF: 118.975 Savannah Approach: 125.3 UNICOM: 123.0 Savannah Departure: 125.3 ATIS: 121.4 Clearance Delivery: 121.1 WX AWOS-3: 121.4 (843-342-5072) WX AWOS-3 at ARW (12 nm N): 119.675 (843-524-1000) Hilton Head Ground: 121.1 (6:00 a.m. – 8:00 p.m.) Hilton Head Tower: 118.975 (6:00 a.m. – 8:00 p.m.)
Source: Talbert & Bright, Inc., September 2009.
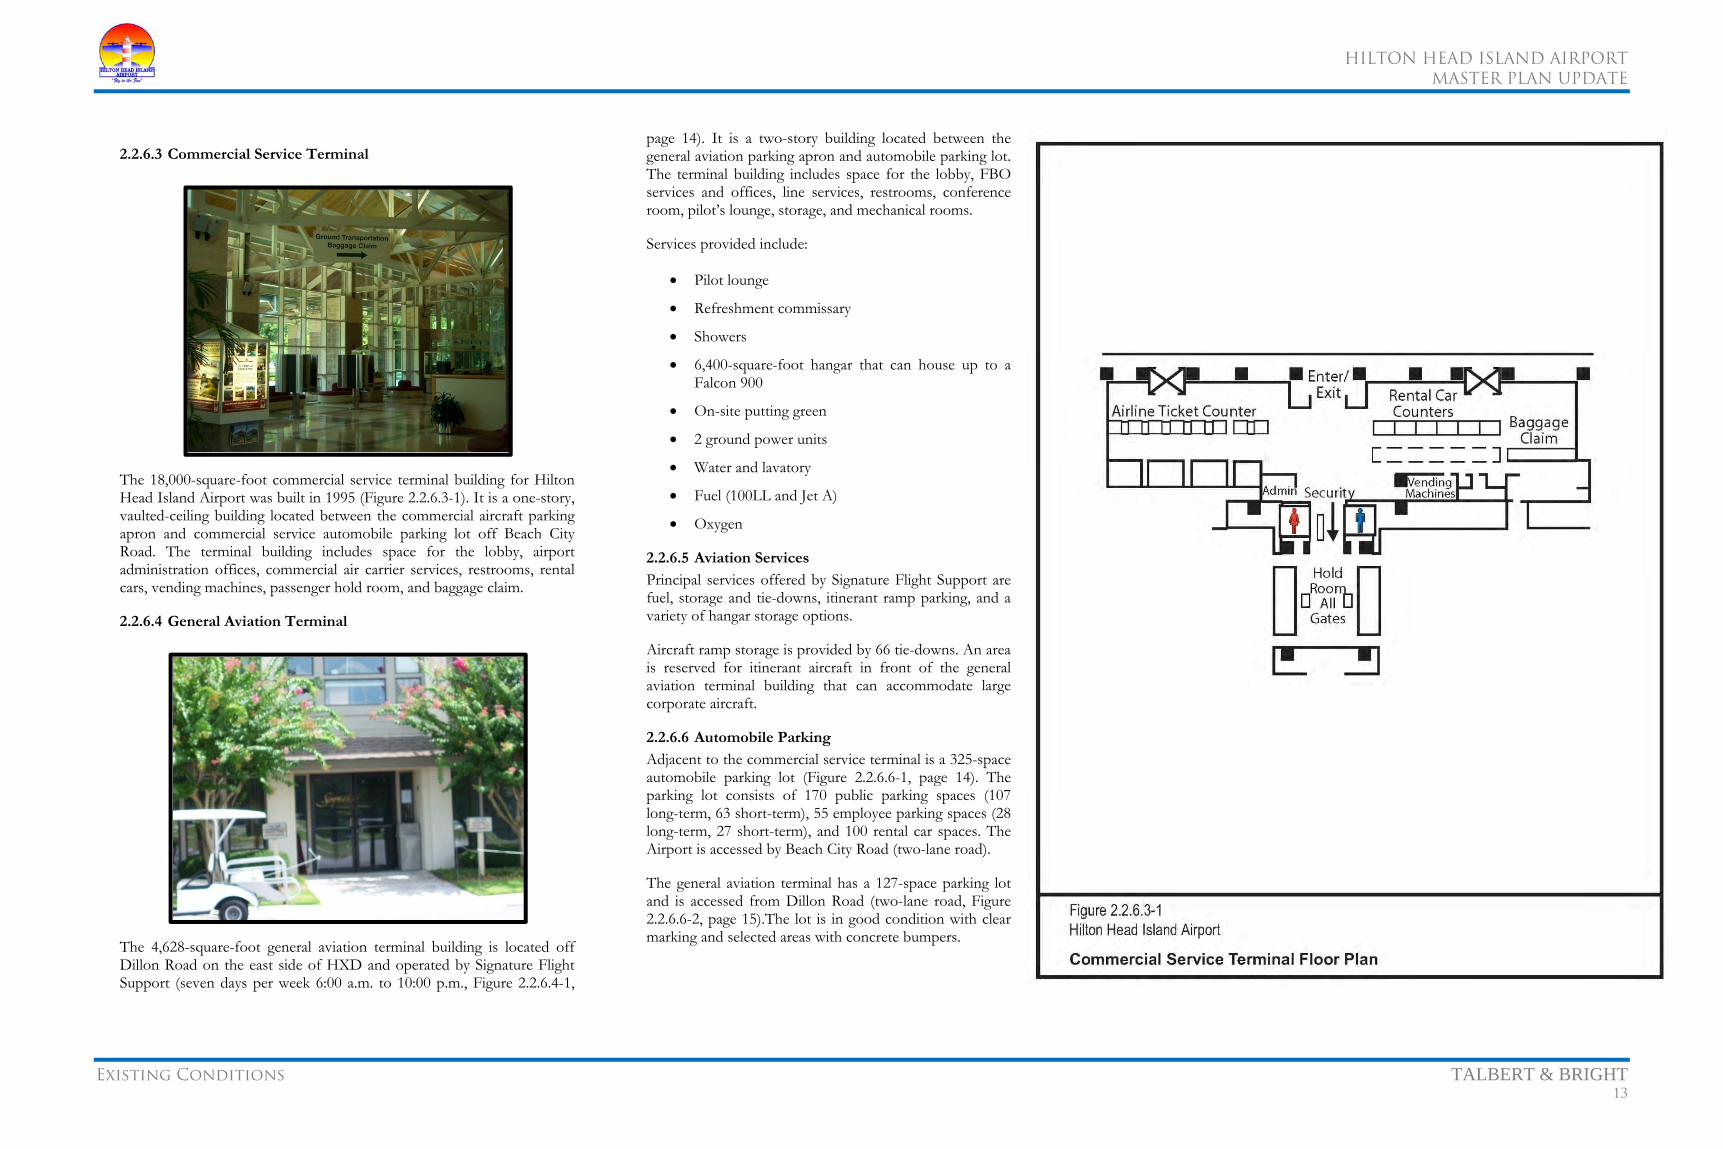
HILTON HEAD ISLAND AIRPORT
MASTER PLAN UPDATE
Existing Conditions TALBERT & BRIGHT 13
2.2.6.3 Commercial Service Terminal
The 18,000-square-foot commercial service terminal building for Hilton Head Island Airport was built in 1995 (Figure 2.2.6.3-1). It is a one-story, vaulted-ceiling building located between the commercial aircraft parking apron and commercial service automobile parking lot off Beach City Road. The terminal building includes space for the lobby, airport administration offices, commercial air carrier services, restrooms, rental cars, vending machines, passenger hold room, and baggage claim.
2.2.6.4 General Aviation Terminal
The 4,628-square-foot general aviation terminal building is located off Dillon Road on the east side of HXD and operated by Signature Flight Support (seven days per week 6:00 a.m. to 10:00 p.m., Figure 2.2.6.4-1,
page 14). It is a two-story building located between the general aviation parking apron and automobile parking lot. The terminal building includes space for the lobby, FBO services and offices, line services, restrooms, conference room, pilot’s lounge, storage, and mechanical rooms.
Services provided include:
• Pilot lounge
• Refreshment commissary
• Showers
• 6,400-square-foot hangar that can house up to a Falcon 900
• On-site putting green
• 2 ground power units
• Water and lavatory
• Fuel (100LL and Jet A)
• Oxygen
2.2.6.5 Aviation Services
Principal services offered by Signature Flight Support are fuel, storage and tie-downs, itinerant ramp parking, and a variety of hangar storage options.
Aircraft ramp storage is provided by 66 tie-downs. An area is reserved for itinerant aircraft in front of the general aviation terminal building that can accommodate large corporate aircraft.
2.2.6.6 Automobile Parking
Adjacent to the commercial service terminal is a 325-space automobile parking lot (Figure 2.2.6.6-1, page 14). The parking lot consists of 170 public parking spaces (107 long-term, 63 short-term), 55 employee parking spaces (28 long-term, 27 short-term), and 100 rental car spaces. The Airport is accessed by Beach City Road (two-lane road).
The general aviation terminal has a 127-space parking lot and is accessed from Dillon Road (two-lane road, Figure 2.2.6.6-2, page 15).The lot is in good condition with clear marking and selected areas with concrete bumpers.

HILTON HEAD ISLAND AIRPORT
MASTER PLAN UPDATE
Existing Conditions TALBERT & BRIGHT 14
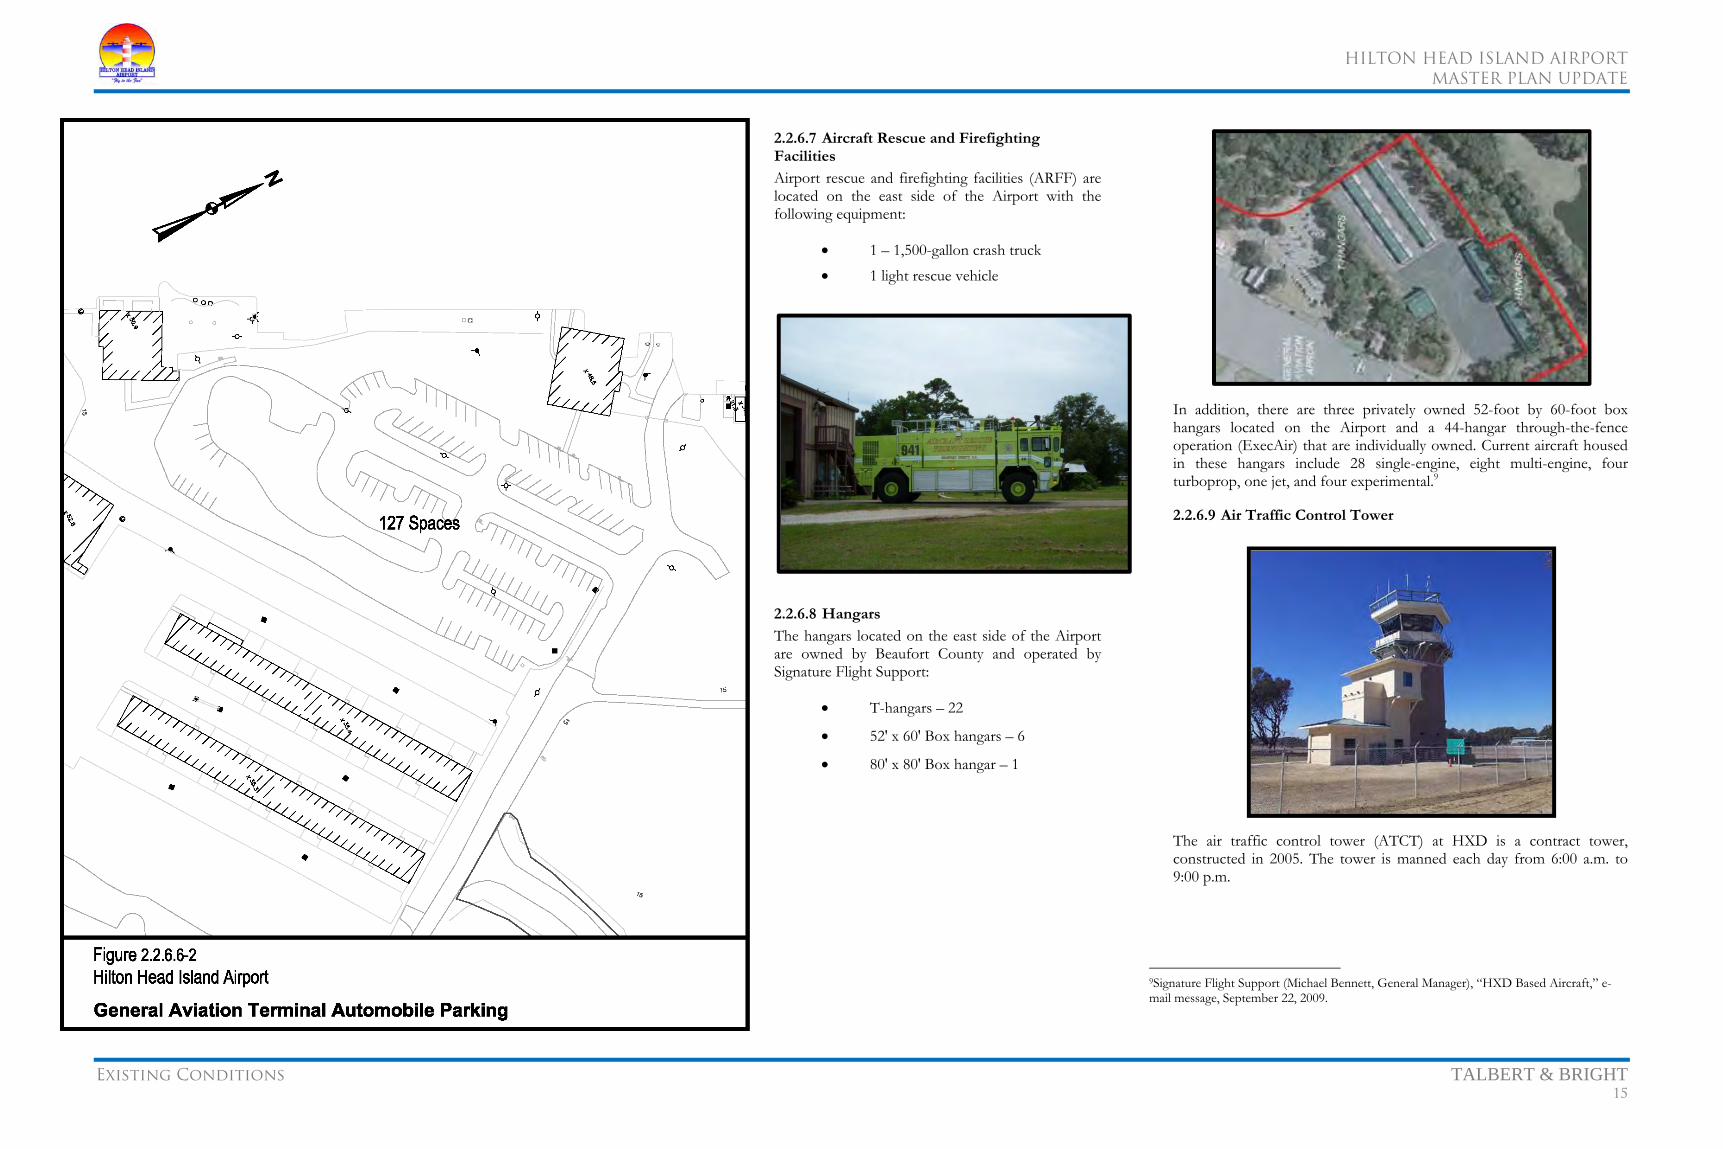
HILTON HEAD ISLAND AIRPORT
MASTER PLAN UPDATE
Existing Conditions TALBERT & BRIGHT 15
2.2.6.7 Aircraft Rescue and Firefighting Facilities
Airport rescue and firefighting facilities (ARFF) are located on the east side of the Airport with the following equipment:
• 1 – 1,500-gallon crash truck • 1 light rescue vehicle
2.2.6.8 Hangars
The hangars located on the east side of the Airport are owned by Beaufort County and operated by Signature Flight Support:
• T-hangars – 22
• 52' x 60' Box hangars – 6
• 80' x 80' Box hangar – 1
In addition, there are three privately owned 52-foot by 60-foot box hangars located on the Airport and a 44-hangar through-the-fence operation (ExecAir) that are individually owned. Current aircraft housed in these hangars include 28 single-engine, eight multi-engine, four turboprop, one jet, and four experimental.9
2.2.6.9 Air Traffic Control Tower
The air traffic control tower (ATCT) at HXD is a contract tower, constructed in 2005. The tower is manned each day from 6:00 a.m. to 9:00 p.m.
9Signature Flight Support (Michael Bennett, General Manager), “HXD Based Aircraft,” e-mail message, September 22, 2009.
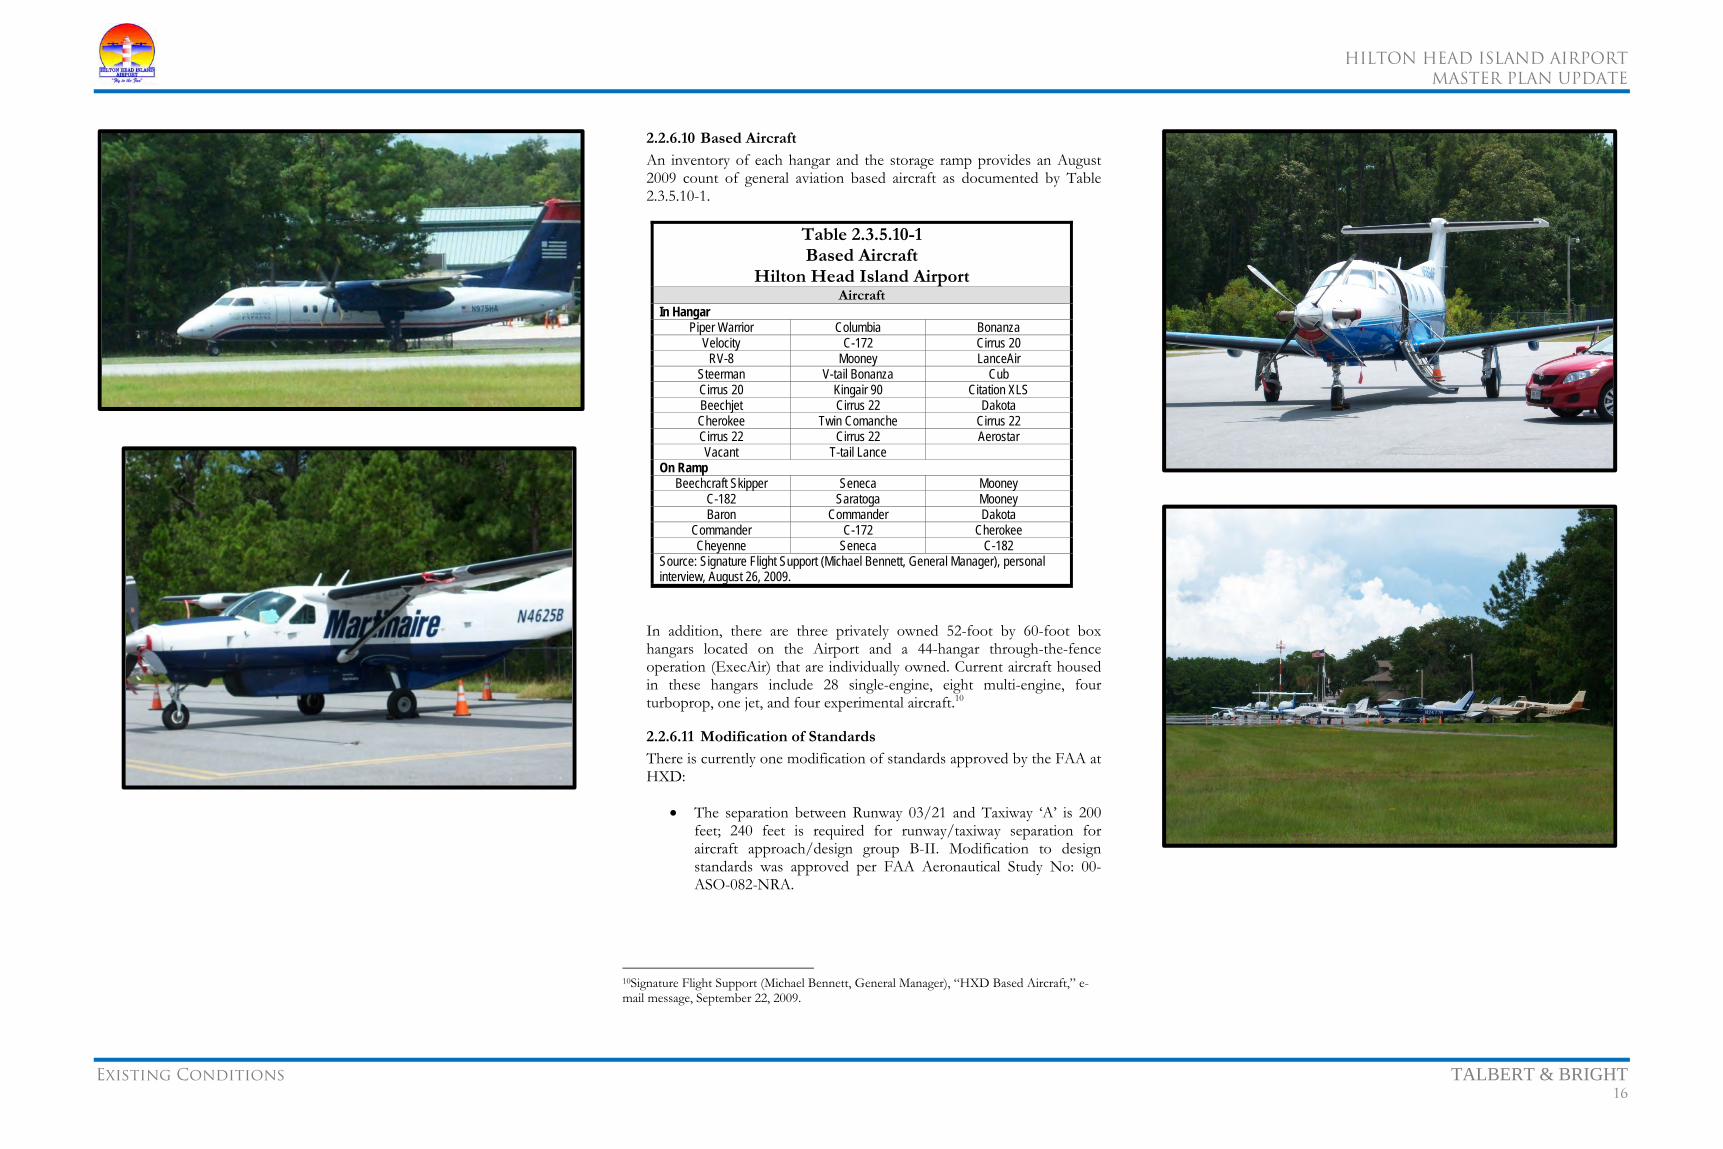
HILTON HEAD ISLAND AIRPORT
MASTER PLAN UPDATE
Existing Conditions TALBERT & BRIGHT 16
2.2.6.10 Based Aircraft
An inventory of each hangar and the storage ramp provides an August 2009 count of general aviation based aircraft as documented by Table 2.3.5.10-1.
Table 2.3.5.10-1 Based Aircraft
Hilton Head Island Airport Aircraft
In Hangar Piper Warrior Columbia Bonanza
Velocity C-172 Cirrus 20 RV-8 Mooney LanceAir
Steerman V-tail Bonanza Cub Cirrus 20 Kingair 90 Citation XLS Beechjet Cirrus 22 Dakota Cherokee Twin Comanche Cirrus 22 Cirrus 22 Cirrus 22 Aerostar Vacant T-tail Lance
On Ramp Beechcraft Skipper Seneca Mooney
C-182 Saratoga Mooney Baron Commander Dakota
Commander C-172 Cherokee Cheyenne Seneca C-182
Source: Signature Flight Support (Michael Bennett, General Manager), personal interview, August 26, 2009.
In addition, there are three privately owned 52-foot by 60-foot box hangars located on the Airport and a 44-hangar through-the-fence operation (ExecAir) that are individually owned. Current aircraft housed in these hangars include 28 single-engine, eight multi-engine, four turboprop, one jet, and four experimental aircraft.10
2.2.6.11 Modification of Standards
There is currently one modification of standards approved by the FAA at HXD:
• The separation between Runway 03/21 and Taxiway ‘A’ is 200 feet; 240 feet is required for runway/taxiway separation for aircraft approach/design group B-II. Modification to design standards was approved per FAA Aeronautical Study No: 00-ASO-082-NRA.
10Signature Flight Support (Michael Bennett, General Manager), “HXD Based Aircraft,” e-mail message, September 22, 2009.
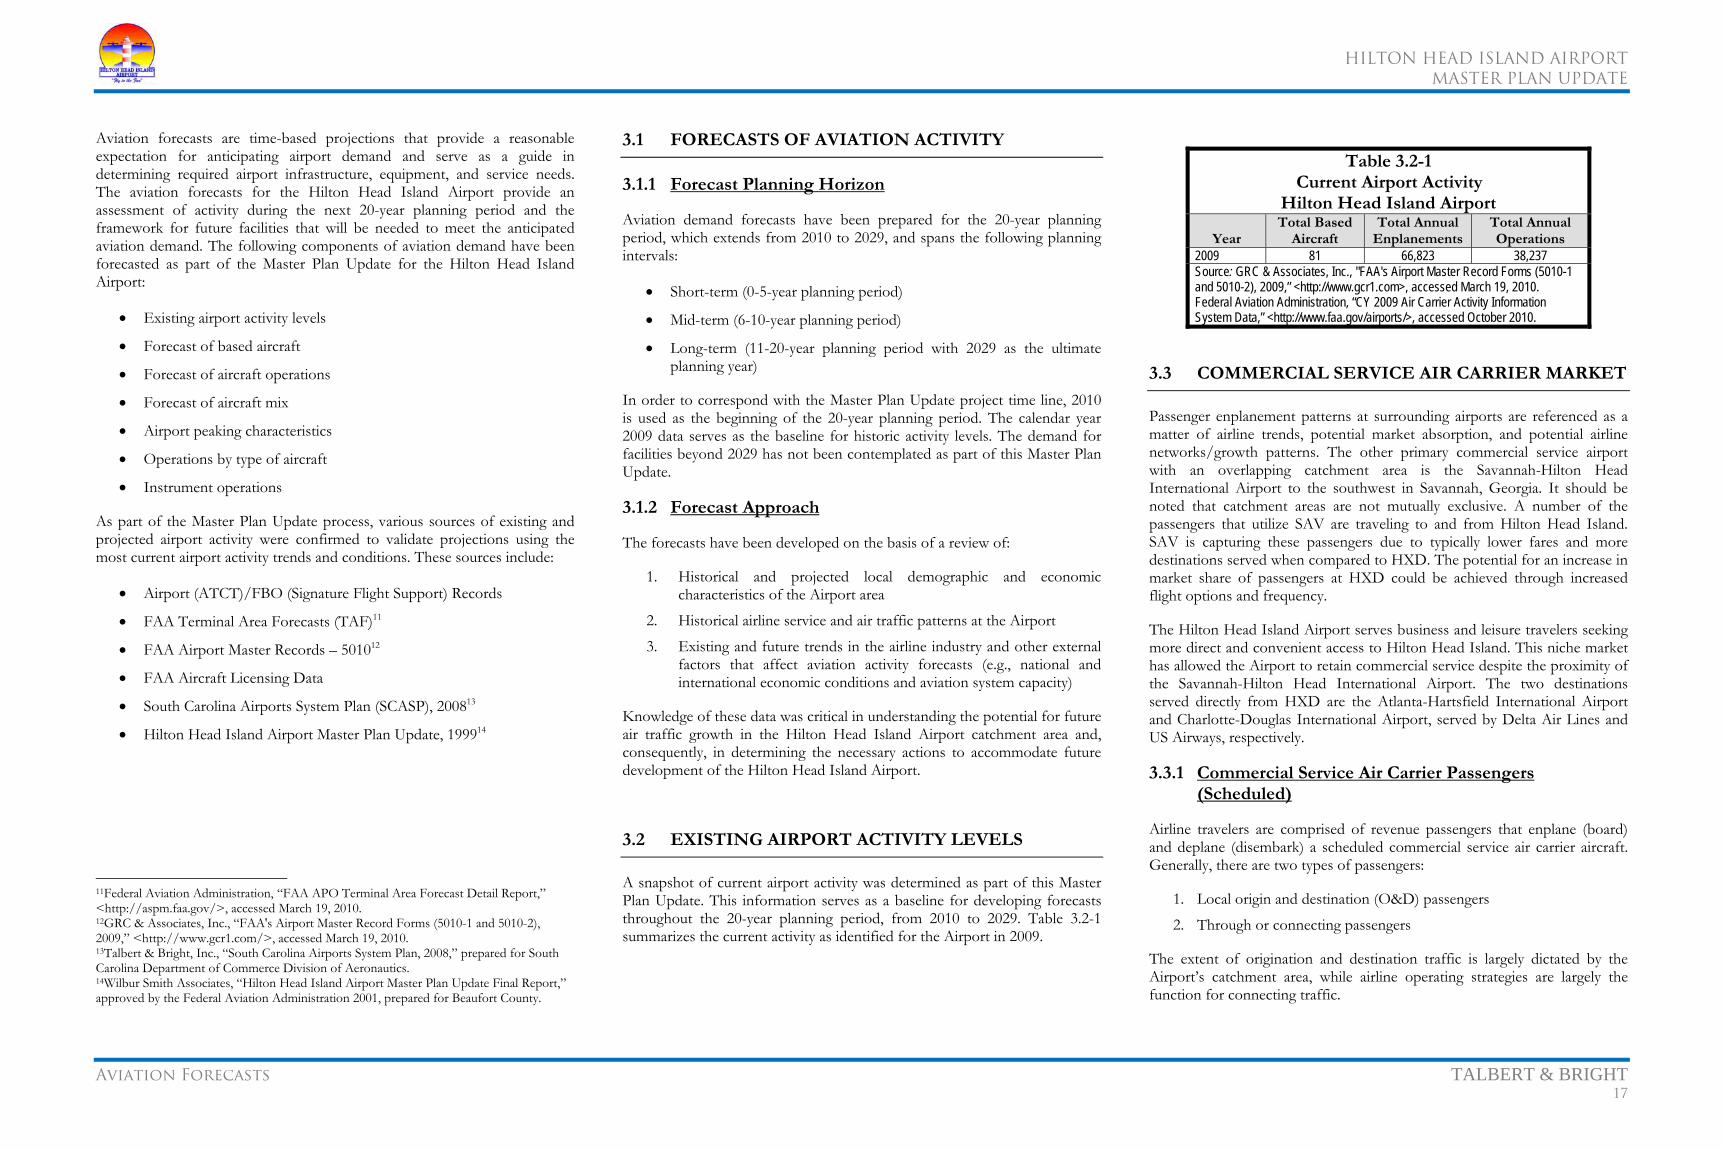
HILTON HEAD ISLAND AIRPORT
MASTER PLAN UPDATE
Aviation Forecasts TALBERT & BRIGHT 17
Aviation forecasts are time-based projections that provide a reasonable expectation for anticipating airport demand and serve as a guide in determining required airport infrastructure, equipment, and service needs. The aviation forecasts for the Hilton Head Island Airport provide an assessment of activity during the next 20-year planning period and the framework for future facilities that will be needed to meet the anticipated aviation demand. The following components of aviation demand have been forecasted as part of the Master Plan Update for the Hilton Head Island Airport:
• Existing airport activity levels
• Forecast of based aircraft
• Forecast of aircraft operations
• Forecast of aircraft mix
• Airport peaking characteristics
• Operations by type of aircraft
• Instrument operations
As part of the Master Plan Update process, various sources of existing and projected airport activity were confirmed to validate projections using the most current airport activity trends and conditions. These sources include:
• Airport (ATCT)/FBO (Signature Flight Support) Records
• FAA Terminal Area Forecasts (TAF)11
• FAA Airport Master Records – 501012
• FAA Aircraft Licensing Data
• South Carolina Airports System Plan (SCASP), 200813
• Hilton Head Island Airport Master Plan Update, 199914
11Federal Aviation Administration, “FAA APO Terminal Area Forecast Detail Report,” <http://aspm.faa.gov/>, accessed March 19, 2010. 12GRC & Associates, Inc., “FAA's Airport Master Record Forms (5010-1 and 5010-2), 2009,” <http://www.gcr1.com/>, accessed March 19, 2010. 13Talbert & Bright, Inc., “South Carolina Airports System Plan, 2008,” prepared for South Carolina Department of Commerce Division of Aeronautics. 14Wilbur Smith Associates, “Hilton Head Island Airport Master Plan Update Final Report,” approved by the Federal Aviation Administration 2001, prepared for Beaufort County.
3.1 FORECASTS OF AVIATION ACTIVITY
3.1.1 Forecast Planning Horizon
Aviation demand forecasts have been prepared for the 20-year planning period, which extends from 2010 to 2029, and spans the following planning intervals:
• Short-term (0-5-year planning period)
• Mid-term (6-10-year planning period)
• Long-term (11-20-year planning period with 2029 as the ultimate planning year)
In order to correspond with the Master Plan Update project time line, 2010 is used as the beginning of the 20-year planning period. The calendar year 2009 data serves as the baseline for historic activity levels. The demand for facilities beyond 2029 has not been contemplated as part of this Master Plan Update.
3.1.2 Forecast Approach
The forecasts have been developed on the basis of a review of:
1. Historical and projected local demographic and economic characteristics of the Airport area
2. Historical airline service and air traffic patterns at the Airport
3. Existing and future trends in the airline industry and other external factors that affect aviation activity forecasts (e.g., national and international economic conditions and aviation system capacity)
Knowledge of these data was critical in understanding the potential for future air traffic growth in the Hilton Head Island Airport catchment area and, consequently, in determining the necessary actions to accommodate future development of the Hilton Head Island Airport.
3.2 EXISTING AIRPORT ACTIVITY LEVELS
A snapshot of current airport activity was determined as part of this Master Plan Update. This information serves as a baseline for developing forecasts throughout the 20-year planning period, from 2010 to 2029. Table 3.2-1 summarizes the current activity as identified for the Airport in 2009.
Table 3.2-1 Current Airport Activity
Hilton Head Island Airport
Year Total Based
AircraftTotal Annual
EnplanementsTotal Annual Operations
2009 81 66,823 38,237 Source: GRC & Associates, Inc., "FAA's Airport Master Record Forms (5010-1 and 5010-2), 2009,” <http://www.gcr1.com>, accessed March 19, 2010. Federal Aviation Administration, “CY 2009 Air Carrier Activity Information System Data,” <http://www.faa.gov/airports/>, accessed October 2010.
3.3 COMMERCIAL SERVICE AIR CARRIER MARKET
Passenger enplanement patterns at surrounding airports are referenced as a matter of airline trends, potential market absorption, and potential airline networks/growth patterns. The other primary commercial service airport with an overlapping catchment area is the Savannah-Hilton Head International Airport to the southwest in Savannah, Georgia. It should be noted that catchment areas are not mutually exclusive. A number of the passengers that utilize SAV are traveling to and from Hilton Head Island. SAV is capturing these passengers due to typically lower fares and more destinations served when compared to HXD. The potential for an increase in market share of passengers at HXD could be achieved through increased flight options and frequency.
The Hilton Head Island Airport serves business and leisure travelers seeking more direct and convenient access to Hilton Head Island. This niche market has allowed the Airport to retain commercial service despite the proximity of the Savannah-Hilton Head International Airport. The two destinations served directly from HXD are the Atlanta-Hartsfield International Airport and Charlotte-Douglas International Airport, served by Delta Air Lines and US Airways, respectively.
3.3.1 Commercial Service Air Carrier Passengers (Scheduled)
Airline travelers are comprised of revenue passengers that enplane (board) and deplane (disembark) a scheduled commercial service air carrier aircraft. Generally, there are two types of passengers:
1. Local origin and destination (O&D) passengers
2. Through or connecting passengers
The extent of origination and destination traffic is largely dictated by the Airport’s catchment area, while airline operating strategies are largely the function for connecting traffic.

HILTON HEAD ISLAND AIRPORT
MASTER PLAN UPDATE
Aviation Forecasts TALBERT & BRIGHT 18
For the Master Plan Update, the following passenger enplanement factors are assumed:
• Future growth in airline traffic would not be constrained by limitations in the air traffic control system capacity, airfield capacity, and airline service; or by government policies or actions restricting growth
• Airline passenger catchment area would continue to include those areas that are currently being served by the Hilton Head Island Airport
• International passenger activity would remain limited in the near future
• Air fares would increase over time at rates that would be generally consistent with the prices of other goods and services, including fuel
• HXD expansion potential makes it attractive to airlines currently serving Hilton Head Island and to new airlines entering the market
3.3.2 Commercial Service Air Carrier Enplanement Forecast Scenarios
Table 3.3.2-1 summarizes each of the enplanement forecasts considered. The methodology used to develop the demand forecast scenarios involves comparisons with preestablished airport trends and other official published forecasts for the Hilton Head Island Airport. These time-series techniques measure growth by means of trend analysis. Forecasts are presented in tabular form, along with a discussion of forecast factors, as influenced by possible forecast assumptions.
The complexity in forecasting passenger enplanements, beyond time-series analysis, involves numerous external relationships, most having an unconfirmed independent correlation. Without specific market survey data or an understanding of specific and foreseeable airline market strategies, the market is best understood as a comparison of past events. In recognition of this, future passenger enplanements are largely predicated by the following major influences:
• Socioeconomic and demographic composition of airport catchment area(s)
• Ground travel characteristics within airport catchment area(s)
• Number of airline markets (communities) served
• Type of air carrier (network carrier; low-cost major, national, and regional)
• Schedule and frequency of flights (time sensitivity)
Table 3.3.2-1 Enplanements Forecast Comparison
Hilton Head Island Airport
Year
Historical/Forecast
Enplanements
1999 HXD Master
PlanFAA TAF
2008 SCASP
1998 97,035 99,948 97,035 97,035 1999 103,028 103,138 103,028 103,028 2000 94,247 106,329 94,247 94,247 2001 84,812 109,519 84,812 84,812 2002 75,209 112,710 75,209 75,209 2003 64,099 115,900 64,099 64,099 2004 61,419 120,280 61,419 61,419 2005 66,679 124,660 66,679 66,679 2006 64,132 129,040 64,132 64,132 2007 76,599 133,420 76,599 76,599 2008 71,003 137,800 85,230 71,003 2009 66,823 143,870 70,121 75,073 2010 73,022 149,940 72,398 77,229 2011 73,129 156,010 74,749 79,385 2012 73,792 162,080 77,178 81,541 2013 72,248 168,150 79,684 83,697 2014 74,393 174,220 82,273 85,279 2015 75,854 180,290 84,945 86,861 2016 75,381 186,360 87,705 88,443 2017 76,092 192,430 90,556 90,025 2018 76,863 198,500 93,497 91,607 2019 77,908 – 96,534 93,189 2020 78,213 – 99,671 94,771 2021 78,733 – 102,908 96,353 2022 79,616 – 106,251 97,935 2023 80,258 – 109,704 99,517 2024 80,860 – 113,269 101,098 2025 81,442 – 116,949 102,680 2026 82,170 – 120,748 104,262 2027 82,840 – 124,671 105,844 2028 83,442 – 128,722 107,426 2029 84,094 – 132,903 –
Source: Federal Aviation Administration, “FAA APO Terminal Area Forecast Detail Report,” <http://aspm.faa.gov/>, accessed March 19, 2010. Talbert & Bright, Inc., “South Carolina Airports System Plan, 2008,” prepared for South Carolina Department of Commerce Division of Aeronautics. Wilbur Smith Associates, “Hilton Head Island Airport Master Plan Update Final Report,” approved by the Federal Aviation Administration 2001, prepared for Beaufort County. Federal Aviation Administration, “CY 2009 Air Carrier Activity Information System Data,” <http://www.faa.gov/airports/>, accessed October 2010. Talbert & Bright, Inc., March 2010.
• Types and frequency of passengers (originating, departing, interline, and connecting)
• Type and size of the aircraft (turboprop, small jet, or transport jet)
• Airline fares (passenger price sensitivity)
• Availability to alternative airport locations and modes of transportation
Another complex forecast issue pertains to the HXD catchment area overlapping heavily with the Savannah-Hilton Head International Airport.
Past HXD passenger enplanements in comparison to regional population gains have demonstrated that there is not a definable relationship between competing airline catchment areas and that overlapping catchment areas are not proportionally or distinctly shared given the multitude of passenger circumstances. The forecast growth trend for HXD extrapolates passenger levels based on the historical enplanements experienced at the Airport. Per this forecast, annual enplanements would reach 84,000 by 2029. Under this forecast, it is assumed that the primary role of the Airport would remain the same over the 20-year planning period. Figure 3.3.2-1 (page 19) graphically depicts the various enplanement forecasts listed in Table 3.3.2-1.
3.4 FORECAST OF BASED AIRCRAFT
A based aircraft is defined as an actively registered airplane stationed at a select airport and regularly uses that airport as the primary home base for filing flight plans, frequently uses available airport amenities, and/or maintains a formal commitment for long-term parking/storage.
The number of based aircraft at any given airport directly impacts the size, number, and type of facilities needed at that airport. Table 3.4-1 lists the average annual growth rates from the forecast studies.
Table 3.4-1 Based Aircraft Growth Rate Comparison
Hilton Head Island Airport
FAA TAF 2008
SCASP
1999 HXD
Master Plan
Proposed Growth
Rate Average Annual
Growth Rate 1.8% 1.6% 2.1% 1.96%
Source: Federal Aviation Administration, “FAA APO Terminal Area Forecast Detail Report,” <http://aspm.faa.gov/>, accessed March 19, 2010. Talbert & Bright, Inc., “South Carolina Airports System Plan, 2008,” prepared for South Carolina Department of Commerce Division of Aeronautics. Wilbur Smith Associates, “Hilton Head Island Airport Master Plan Update Final Report,” approved by the Federal Aviation Administration 2001, prepared for Beaufort County. Talbert & Bright, Inc., March 2010.
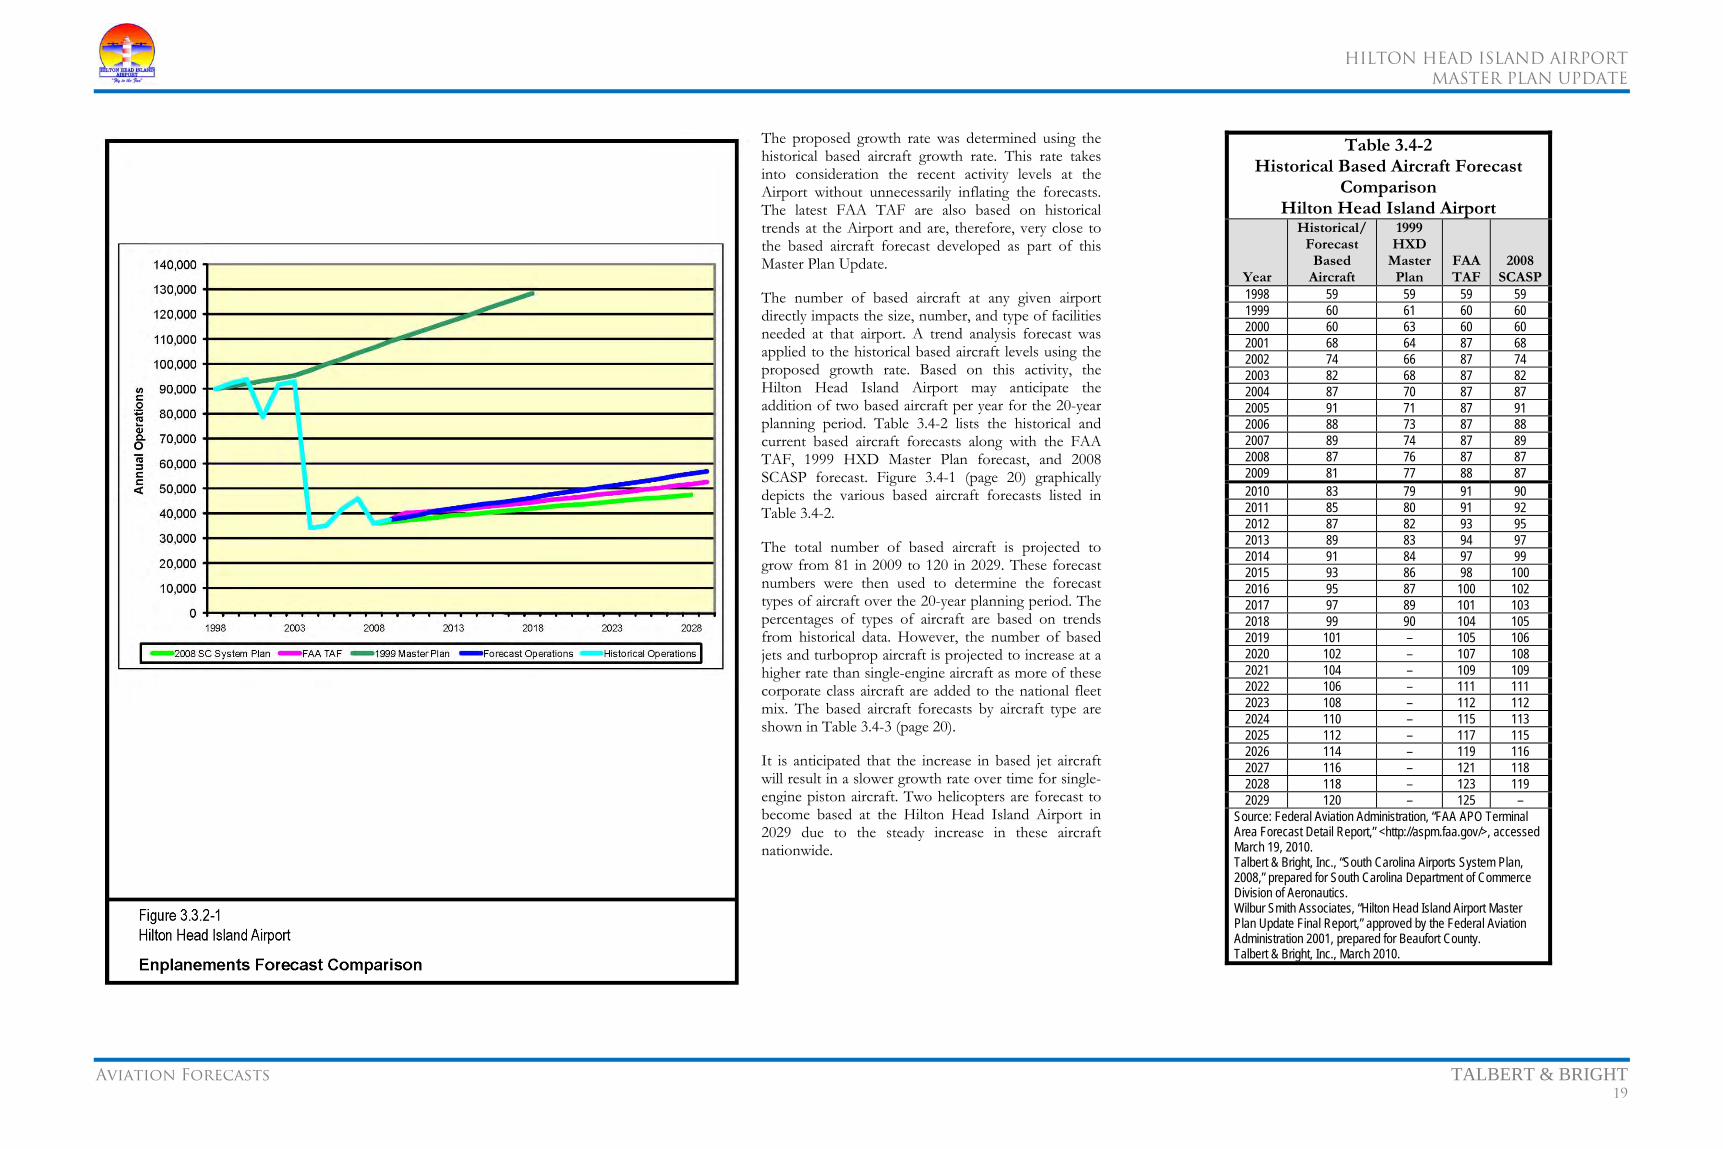
HILTON HEAD ISLAND AIRPORT
MASTER PLAN UPDATE
Aviation Forecasts TALBERT & BRIGHT 19
The proposed growth rate was determined using the historical based aircraft growth rate. This rate takes into consideration the recent activity levels at the Airport without unnecessarily inflating the forecasts. The latest FAA TAF are also based on historical trends at the Airport and are, therefore, very close to the based aircraft forecast developed as part of this Master Plan Update.
The number of based aircraft at any given airport directly impacts the size, number, and type of facilities needed at that airport. A trend analysis forecast was applied to the historical based aircraft levels using the proposed growth rate. Based on this activity, the Hilton Head Island Airport may anticipate the addition of two based aircraft per year for the 20-year planning period. Table 3.4-2 lists the historical and current based aircraft forecasts along with the FAA TAF, 1999 HXD Master Plan forecast, and 2008 SCASP forecast. Figure 3.4-1 (page 20) graphically depicts the various based aircraft forecasts listed in Table 3.4-2.
The total number of based aircraft is projected to grow from 81 in 2009 to 120 in 2029. These forecast numbers were then used to determine the forecast types of aircraft over the 20-year planning period. The percentages of types of aircraft are based on trends from historical data. However, the number of based jets and turboprop aircraft is projected to increase at a higher rate than single-engine aircraft as more of these corporate class aircraft are added to the national fleet mix. The based aircraft forecasts by aircraft type are shown in Table 3.4-3 (page 20).
It is anticipated that the increase in based jet aircraft will result in a slower growth rate over time for single-engine piston aircraft. Two helicopters are forecast to become based at the Hilton Head Island Airport in 2029 due to the steady increase in these aircraft nationwide.
Table 3.4-2 Historical Based Aircraft Forecast
Comparison Hilton Head Island Airport
Year
Historical/Forecast
Based Aircraft
1999 HXD
Master Plan
FAA TAF
2008 SCASP
1998 59 59 59 59 1999 60 61 60 60 2000 60 63 60 60 2001 68 64 87 68 2002 74 66 87 74 2003 82 68 87 82 2004 87 70 87 87 2005 91 71 87 91 2006 88 73 87 88 2007 89 74 87 89 2008 87 76 87 87 2009 81 77 88 87 2010 83 79 91 90 2011 85 80 91 92 2012 87 82 93 95 2013 89 83 94 97 2014 91 84 97 99 2015 93 86 98 100 2016 95 87 100 102 2017 97 89 101 103 2018 99 90 104 105 2019 101 – 105 106 2020 102 – 107 108 2021 104 – 109 109 2022 106 – 111 111 2023 108 – 112 112 2024 110 – 115 113 2025 112 – 117 115 2026 114 – 119 116 2027 116 – 121 118 2028 118 – 123 119 2029 120 – 125 –
Source: Federal Aviation Administration, “FAA APO Terminal Area Forecast Detail Report,” <http://aspm.faa.gov/>, accessed March 19, 2010. Talbert & Bright, Inc., “South Carolina Airports System Plan, 2008,” prepared for South Carolina Department of Commerce Division of Aeronautics. Wilbur Smith Associates, “Hilton Head Island Airport Master Plan Update Final Report,” approved by the Federal Aviation Administration 2001, prepared for Beaufort County. Talbert & Bright, Inc., March 2010.
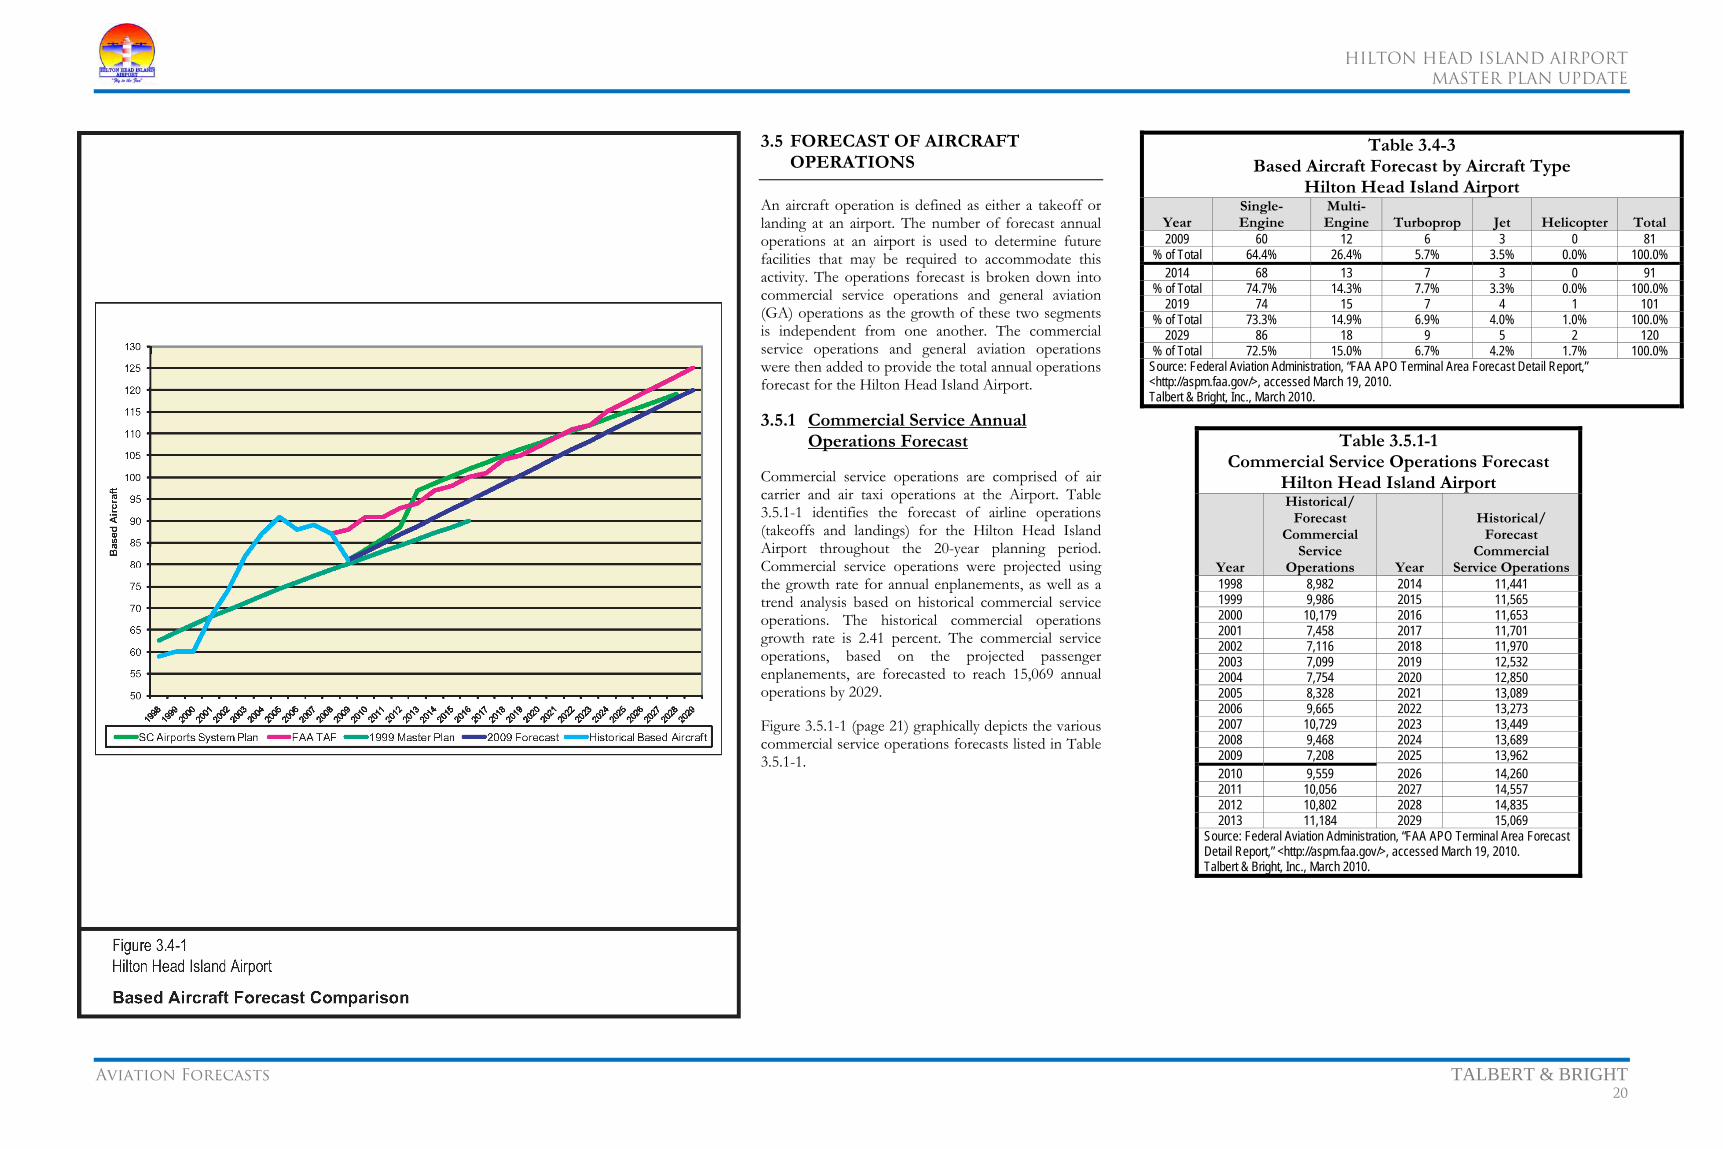
HILTON HEAD ISLAND AIRPORT
MASTER PLAN UPDATE
Aviation Forecasts TALBERT & BRIGHT 20
3.5 FORECAST OF AIRCRAFT OPERATIONS
An aircraft operation is defined as either a takeoff or landing at an airport. The number of forecast annual operations at an airport is used to determine future facilities that may be required to accommodate this activity. The operations forecast is broken down into commercial service operations and general aviation (GA) operations as the growth of these two segments is independent from one another. The commercial service operations and general aviation operations were then added to provide the total annual operations forecast for the Hilton Head Island Airport.
3.5.1 Commercial Service Annual Operations Forecast
Commercial service operations are comprised of air carrier and air taxi operations at the Airport. Table 3.5.1-1 identifies the forecast of airline operations (takeoffs and landings) for the Hilton Head Island Airport throughout the 20-year planning period. Commercial service operations were projected using the growth rate for annual enplanements, as well as a trend analysis based on historical commercial service operations. The historical commercial operations growth rate is 2.41 percent. The commercial service operations, based on the projected passenger enplanements, are forecasted to reach 15,069 annual operations by 2029.
Figure 3.5.1-1 (page 21) graphically depicts the various commercial service operations forecasts listed in Table 3.5.1-1.
Table 3.4-3 Based Aircraft Forecast by Aircraft Type
Hilton Head Island Airport
Year Single-Engine
Multi-Engine Turboprop Jet Helicopter Total
2009 60 12 6 3 0 81 % of Total 64.4% 26.4% 5.7% 3.5% 0.0% 100.0%
2014 68 13 7 3 0 91 % of Total 74.7% 14.3% 7.7% 3.3% 0.0% 100.0%
2019 74 15 7 4 1 101 % of Total 73.3% 14.9% 6.9% 4.0% 1.0% 100.0%
2029 86 18 9 5 2 120 % of Total 72.5% 15.0% 6.7% 4.2% 1.7% 100.0%
Source: Federal Aviation Administration, “FAA APO Terminal Area Forecast Detail Report,” <http://aspm.faa.gov/>, accessed March 19, 2010. Talbert & Bright, Inc., March 2010.
Table 3.5.1-1
Commercial Service Operations Forecast Hilton Head Island Airport
Year
Historical/Forecast
Commercial Service
Operations Year
Historical/ Forecast
Commercial Service Operations
1998 8,982 2014 11,441 1999 9,986 2015 11,565 2000 10,179 2016 11,653 2001 7,458 2017 11,701 2002 7,116 2018 11,970 2003 7,099 2019 12,532 2004 7,754 2020 12,850 2005 8,328 2021 13,089 2006 9,665 2022 13,273 2007 10,729 2023 13,449 2008 9,468 2024 13,689 2009 7,208 2025 13,962 2010 9,559 2026 14,260 2011 10,056 2027 14,557 2012 10,802 2028 14,835 2013 11,184 2029 15,069
Source: Federal Aviation Administration, “FAA APO Terminal Area Forecast Detail Report,” <http://aspm.faa.gov/>, accessed March 19, 2010. Talbert & Bright, Inc., March 2010.
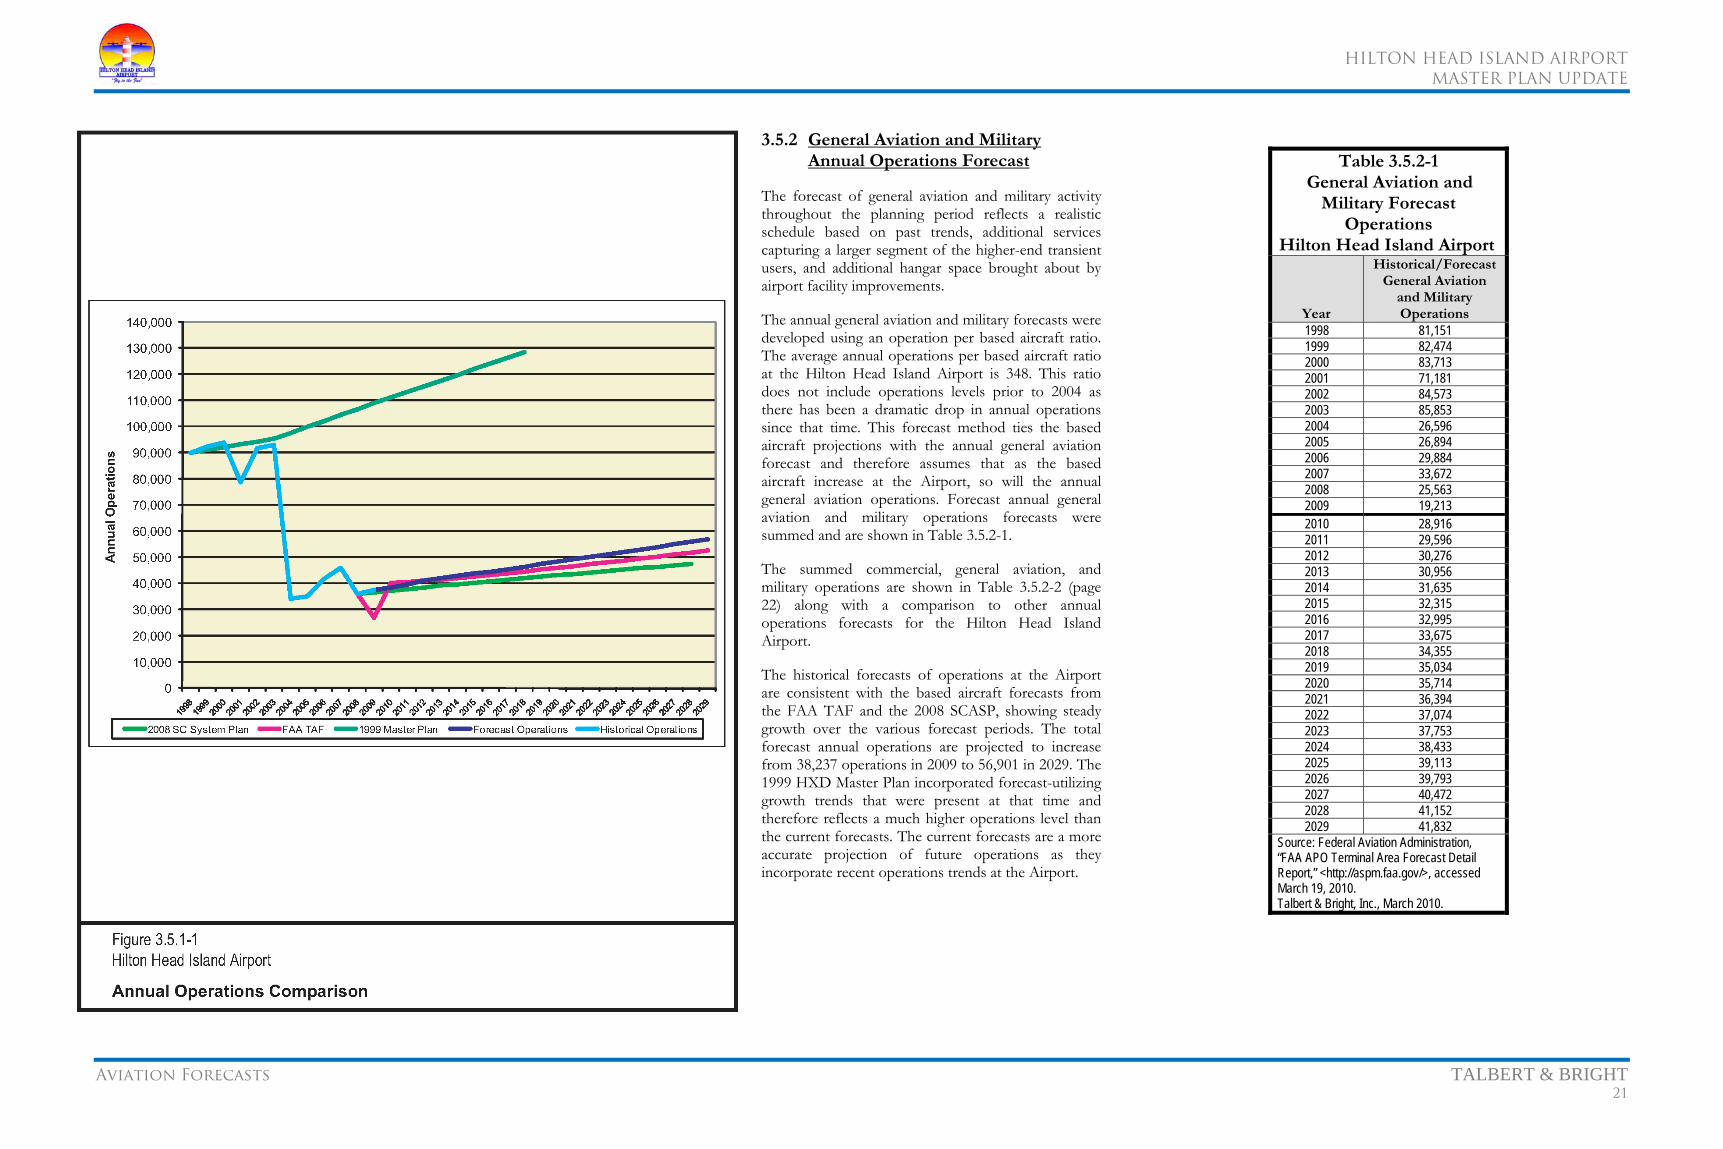
HILTON HEAD ISLAND AIRPORT
MASTER PLAN UPDATE
Aviation Forecasts TALBERT & BRIGHT 21
3.5.2 General Aviation and Military Annual Operations Forecast
The forecast of general aviation and military activity throughout the planning period reflects a realistic schedule based on past trends, additional services capturing a larger segment of the higher-end transient users, and additional hangar space brought about by airport facility improvements.
The annual general aviation and military forecasts were developed using an operation per based aircraft ratio. The average annual operations per based aircraft ratio at the Hilton Head Island Airport is 348. This ratio does not include operations levels prior to 2004 as there has been a dramatic drop in annual operations since that time. This forecast method ties the based aircraft projections with the annual general aviation forecast and therefore assumes that as the based aircraft increase at the Airport, so will the annual general aviation operations. Forecast annual general aviation and military operations forecasts were summed and are shown in Table 3.5.2-1.
The summed commercial, general aviation, and military operations are shown in Table 3.5.2-2 (page 22) along with a comparison to other annual operations forecasts for the Hilton Head Island Airport.
The historical forecasts of operations at the Airport are consistent with the based aircraft forecasts from the FAA TAF and the 2008 SCASP, showing steady growth over the various forecast periods. The total forecast annual operations are projected to increase from 38,237 operations in 2009 to 56,901 in 2029. The 1999 HXD Master Plan incorporated forecast-utilizing growth trends that were present at that time and therefore reflects a much higher operations level than the current forecasts. The current forecasts are a more accurate projection of future operations as they incorporate recent operations trends at the Airport.
Table 3.5.2-1 General Aviation and
Military Forecast Operations
Hilton Head Island Airport
Year
Historical/Forecast General Aviation
and Military Operations
1998 81,151 1999 82,474 2000 83,713 2001 71,181 2002 84,573 2003 85,853 2004 26,596 2005 26,894 2006 29,884 2007 33,672 2008 25,563 2009 19,213 2010 28,916 2011 29,596 2012 30,276 2013 30,956 2014 31,635 2015 32,315 2016 32,995 2017 33,675 2018 34,355 2019 35,034 2020 35,714 2021 36,394 2022 37,074 2023 37,753 2024 38,433 2025 39,113 2026 39,793 2027 40,472 2028 41,152 2029 41,832
Source: Federal Aviation Administration, “FAA APO Terminal Area Forecast Detail Report,” <http://aspm.faa.gov/>, accessed March 19, 2010. Talbert & Bright, Inc., March 2010.

HILTON HEAD ISLAND AIRPORT
MASTER PLAN UPDATE
Aviation Forecasts TALBERT & BRIGHT 22
Table 3.5.2-2 Annual Operations Forecast Comparison
Hilton Head Island Airport
Year
Historical/ Forecast General Aviation, Military,
and Commercial Operations
1999 HXD
Master Plan
FAA TAF
2008 SCASP
1998 90,133 90,133 90,133 90,133 1999 92,460 91,175 92,460 92,460 2000 93,892 92,218 93,892 93,892 2001 78,639 93,260 78,639 78,639 2002 91,689 94,303 91,689 91,689 2003 92,952 95,345 92,952 92,952 2004 34,350 97,631 17,296 34,350 2005 35,222 99,916 35,222 35,222 2006 41,869 102,202 39,975 41,869 2007 46,061 104,487 45,624 46,061 2008 36,125 106,773 36,125 36,125 2009 38,237 108,949 26,859 36,749 2010 38,475 111,125 40,255 37,373 2011 39,652 113,300 40,703 37,997 2012 41,078 115,476 41,156 38,621 2013 42,139 117,652 41,617 39,247 2014 43,076 119,828 42,081 39,821 2015 43,880 122,004 42,709 40,396 2016 44,648 124,179 43,350 40,970 2017 45,376 126,355 44,007 41,545 2018 46,324 128,531 44,673 42,119 2019 47,567 – 45,350 42,667 2020 48,564 – 46,037 43,215 2021 49,483 – 46,732 43,763 2022 50,347 – 47,441 44,311 2023 51,202 – 48,163 44,859 2024 52,122 – 48,893 45,406 2025 53,075 – 49,638 45,954 2026 54,052 – 50,394 46,502 2027 55,029 – 51,159 47,050 2028 55,988 – 51,939 47,598 2029 56,901 – 52,731 –
Source: Federal Aviation Administration, “FAA APO Terminal Area Forecast Detail Report,” <http://aspm.faa.gov/>, accessed March 19, 2010. Talbert & Bright, Inc., “South Carolina Airports System Plan, 2008,” prepared for South Carolina Department of Commerce Division of Aeronautics. Wilbur Smith Associates, “Hilton Head Island Airport Master Plan Update Final Report,” approved by the Federal Aviation Administration 2001, prepared for Beaufort County. Talbert & Bright, Inc., March 2010.
3.5.3 Local/Itinerant Operations Forecast
Aircraft operations are identified as local and itinerant. Local operations consist of those within a 25-mile radius of the Airport vicinity. Itinerant operations include flights having a terminus of flight from another Airport at least 25 miles away. The forecast operations at the Hilton Head Island Airport were divided into local and itinerant operations categories. Table 3.5.3-1 shows the breakdown of annual operations, by operation type, for the Airport throughout the 20-year planning period. The mix of forecast aircraft was projected using historic airport-based aircraft patterns, as reported by the Airport, and overall general aviation utilization and user trends as published annually by the FAA.
Table 3.5.3-1 Annual Operations by Type Hilton Head Island Airport
YearItinerant Local
TotalCommercial GA Military Civil Military2009 9,353 24,638 635 3,062 549 38,237 2014 11,441 26,985 696 3,353 601 43,076 2019 12,532 29,884 771 3,714 666 47,567 2029 15,069 35,682 920 4,435 795 56,901 Source: Federal Aviation Administration, “FAA APO Terminal Area Forecast Detail Report,” <http://aspm.faa.gov/>, accessed March 19, 2010. Talbert & Bright, Inc., March 2010.
The percentage of operations by type was calculated from the Airport Master Record 5010 data, as well as the FAA TAF. Currently, general aviation operations are predominantly itinerant because of Hilton Head Island being a vacation destination. The average operational split is 89 percent itinerant and 11 percent local at HXD.
3.6 CRITICAL AIRCRAFT FORECAST
Table 3.6-1 provides information about the existing and ultimate critical aircraft families for the Hilton Head Island Airport. The critical aircraft is the largest airplane or family of aircraft conducting at least 500 annual operations (combination of 250 takeoffs and landings) per year at the Airport. The critical aircraft is evaluated with respect to size, speed, and weight and is important for determining airport design, structural, and equipment needs for the airfield and terminal area facilities. The current critical aircraft family at the Airport consists of an airport reference code (ARC) C-II business jet aircraft.
Table 3.6-1 Critical Aircraft Forecasts
Hilton Head Island Airport Aircraft Type and ARC Wing Span Approach Speed
ARC C-II (Current)
49 feet up to but not including 79 feet
121 knots or more but less than 141 knots
ARC C-II (Future)
49 feet up to but not including 79 feet
121 knots or more but less than 141 knots
Source: Federal Aviation Administration, “Advisory Circular 150/5300-13 – Airport Design, Changes 1-15,” December 31, 2009, <http://www.faa.gov/>, accessed August 25, 2009.
Table 3.6-2 presents the aircraft mix forecast for each planning phase. The mix forecast is used to determine future airport design, structural, and equipment needs. The mix of aircraft corresponds with the FAA design categories (A, B, C, and D), as determined from the wingspan of the aircraft. The mix forecast was developed from the bottom up, by assigning the projected level of operations to each component of commercial service air carrier, general aviation, and military user events.
Table 3.6-2 Forecast Aircraft Mix by FAA Design Groups (2010-2029)
Hilton Head Island Airport
Aircraft Approach Category
Phase 1Short-Term (2014) %
Phase 2Mid-Term (2019) %
Phase 3Long-Term (2029) %
TOTAL OPERATIONS
43,076 47,567 56,901
Category A (Less than 91 Knots)
11,631 27% 13,319 28% 15,932 28%
Category B (92 – 120 Knots)
27,999 65% 29,967 63% 34,710 61%
Category C (121 – 140 Knots)
1,292 3% 1,903 4% 2,276 4%
Category D (141 – 166 Knots)
1,292 3% 1,427 3% 2,276 4%
ROTORCRAFT (Not ARC Designated)
862 2% 951 2% 1,707 3%
Note: The aircraft approach category (AAC) is classified from A to E, and the airplane design group (ADG) is classified from I to VI. Combined, the two classifications produce an ARC, which yields specific characteristics about the type of airplane (family) that the airport is designed to accommodate. AAC grouping is based on 1.3 times the stall speed of the aircraft at the maximum certified landing weight in the landing configuration (knots). Source: Federal Aviation Administration, “Advisory Circular 150/5300-13 – Airport Design, Changes 1-15,” December 31, 2009, <http://www.faa.gov/>, accessed August 25, 2009. Talbert & Bright, Inc., March 2010.
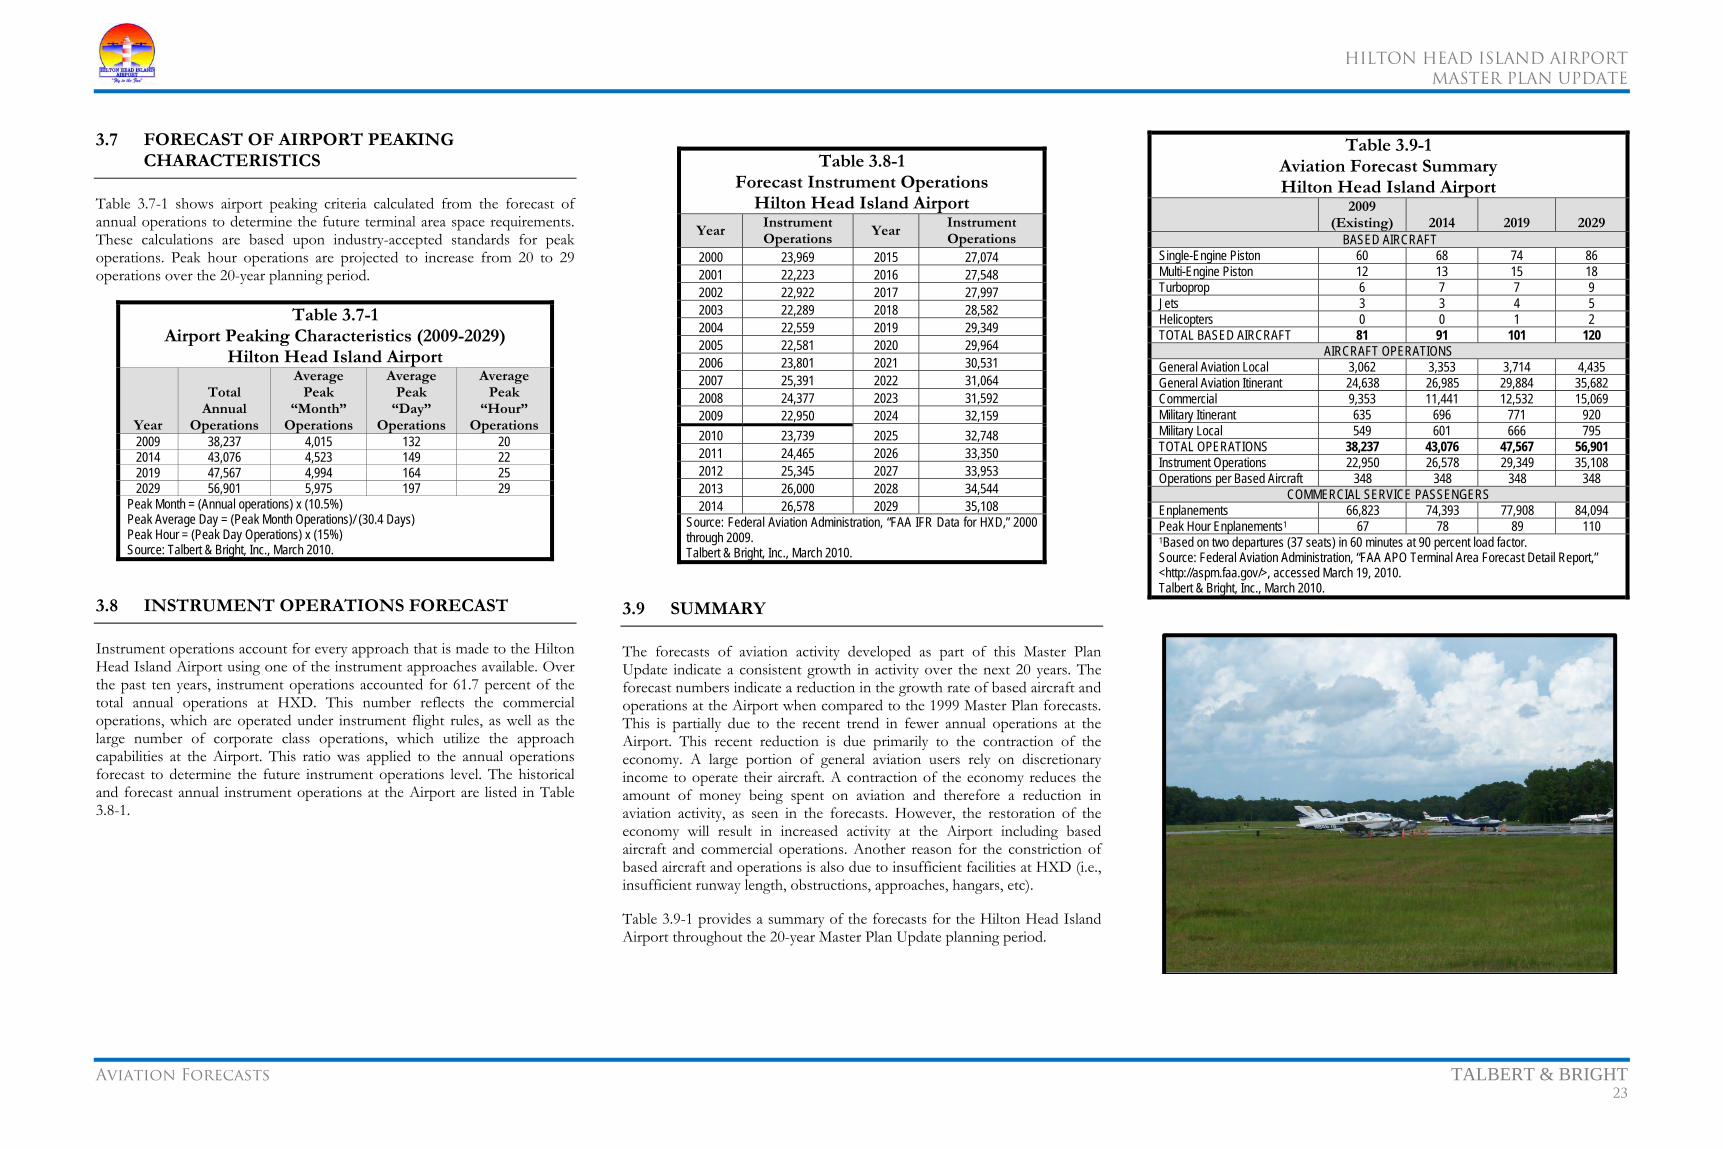
HILTON HEAD ISLAND AIRPORT
MASTER PLAN UPDATE
Aviation Forecasts TALBERT & BRIGHT 23
3.7 FORECAST OF AIRPORT PEAKING CHARACTERISTICS
Table 3.7-1 shows airport peaking criteria calculated from the forecast of annual operations to determine the future terminal area space requirements. These calculations are based upon industry-accepted standards for peak operations. Peak hour operations are projected to increase from 20 to 29 operations over the 20-year planning period.
Table 3.7-1 Airport Peaking Characteristics (2009-2029)
Hilton Head Island Airport
Year
Total Annual
Operations
Average Peak
“Month” Operations
Average Peak
“Day” Operations
Average Peak
“Hour” Operations
2009 38,237 4,015 132 20 2014 43,076 4,523 149 22 2019 47,567 4,994 164 25 2029 56,901 5,975 197 29
Peak Month = (Annual operations) x (10.5%) Peak Average Day = (Peak Month Operations)/ (30.4 Days) Peak Hour = (Peak Day Operations) x (15%) Source: Talbert & Bright, Inc., March 2010.
3.8 INSTRUMENT OPERATIONS FORECAST
Instrument operations account for every approach that is made to the Hilton Head Island Airport using one of the instrument approaches available. Over the past ten years, instrument operations accounted for 61.7 percent of the total annual operations at HXD. This number reflects the commercial operations, which are operated under instrument flight rules, as well as the large number of corporate class operations, which utilize the approach capabilities at the Airport. This ratio was applied to the annual operations forecast to determine the future instrument operations level. The historical and forecast annual instrument operations at the Airport are listed in Table 3.8-1.
Table 3.8-1 Forecast Instrument Operations
Hilton Head Island Airport
Year Instrument Operations
Year Instrument Operations
2000 23,969 2015 27,074 2001 22,223 2016 27,548 2002 22,922 2017 27,997 2003 22,289 2018 28,582 2004 22,559 2019 29,349 2005 22,581 2020 29,964 2006 23,801 2021 30,531 2007 25,391 2022 31,064 2008 24,377 2023 31,592 2009 22,950 2024 32,159 2010 23,739 2025 32,748 2011 24,465 2026 33,350 2012 25,345 2027 33,953 2013 26,000 2028 34,544 2014 26,578 2029 35,108
Source: Federal Aviation Administration, “FAA IFR Data for HXD,” 2000 through 2009. Talbert & Bright, Inc., March 2010.
3.9 SUMMARY
The forecasts of aviation activity developed as part of this Master Plan Update indicate a consistent growth in activity over the next 20 years. The forecast numbers indicate a reduction in the growth rate of based aircraft and operations at the Airport when compared to the 1999 Master Plan forecasts. This is partially due to the recent trend in fewer annual operations at the Airport. This recent reduction is due primarily to the contraction of the economy. A large portion of general aviation users rely on discretionary income to operate their aircraft. A contraction of the economy reduces the amount of money being spent on aviation and therefore a reduction in aviation activity, as seen in the forecasts. However, the restoration of the economy will result in increased activity at the Airport including based aircraft and commercial operations. Another reason for the constriction of based aircraft and operations is also due to insufficient facilities at HXD (i.e., insufficient runway length, obstructions, approaches, hangars, etc).
Table 3.9-1 provides a summary of the forecasts for the Hilton Head Island Airport throughout the 20-year Master Plan Update planning period.
Table 3.9-1 Aviation Forecast Summary Hilton Head Island Airport
2009
(Existing) 2014 2019 2029BASED AIRCRAFT
Single-Engine Piston 60 68 74 86 Multi-Engine Piston 12 13 15 18 Turboprop 6 7 7 9 Jets 3 3 4 5 Helicopters 0 0 1 2 TOTAL BASED AIRCRAFT 81 91 101 120
AIRCRAFT OPERATIONS General Aviation Local 3,062 3,353 3,714 4,435 General Aviation Itinerant 24,638 26,985 29,884 35,682 Commercial 9,353 11,441 12,532 15,069 Military Itinerant 635 696 771 920 Military Local 549 601 666 795 TOTAL OPERATIONS 38,237 43,076 47,567 56,901 Instrument Operations 22,950 26,578 29,349 35,108 Operations per Based Aircraft 348 348 348 348
COMMERCIAL SERVICE PASSENGERS Enplanements 66,823 74,393 77,908 84,094 Peak Hour Enplanements1 67 78 89 110 1Based on two departures (37 seats) in 60 minutes at 90 percent load factor. Source: Federal Aviation Administration, “FAA APO Terminal Area Forecast Detail Report,” <http://aspm.faa.gov/>, accessed March 19, 2010. Talbert & Bright, Inc., March 2010.

HILTON HEAD ISLAND AIRPORT
MASTER PLAN UPDATE
Facility Requirements TALBERT & BRIGHT 24
This section of the Master Plan Update assesses whether or not the existing facilities at the Hilton Head Island Airport are able to meet the current and future aviation demand.
4.1 DEMAND CAPACITY ANALYSIS
The purpose of the demand capacity analysis is to determine the Airport’s capacity and its ability to support the forecast demand. Facility requirements identify development, replacement, or modification of airport facilities to accommodate the existing and 20-year forecast demand.
Methodology used to determine facility requirements begins with an examination of the Airport’s major components:
• Airfield
• Airspace
• Buildings
• Landside/Surface Access
It is important to note that each of these system components should be balanced in order to achieve system optimization. Any deficiencies in the airport facilities that encompass these four elements will be identified based upon standards presented in FAA Advisory Circular 150/5300-13 – Airport Design (as amended) and FAA Advisory Circular 150/5060-5 – Airport Capacity and Delay.15 Recommended improvements to facilities will be noted.
4.1.1 Airfield Capacity
Airport capacity and delay computations are used to design and evaluate airport development and improvements. As demand approaches capacity, individual aircraft delay is increased. Successive hourly demands exceeding the hourly capacity result in unacceptable delays. Even when hourly demand is less than the hourly capacity, aircraft delays can still occur if the demand within a portion of the time interval exceeds the capacity during that interval.
Airport capacity is governed by runway use configuration, percentage of arrivals, percentage of touch and go’s, taxiway configuration, airspace limitations, and runway instrumentation. Annual service volume (ASV) is a reasonable estimate of an airport’s annual capacity. It accounts for differences in runway use, aircraft mix, and weather conditions that would be encountered over a year’s time.
15Federal Aviation Administration, “Advisory Circular 150/5060-5 – Airport Capacity and Delay, Changes 1-2,” September 23, 1983, <http://www.faa.gov/>, accessed October 8, 2009.
The airfield operational capacity for the Hilton Head Island Airport, as calculated from FAA Advisory Circular 150/5060-5 – Airport Capacity and Delay, is approximately 230,000 annual operations per year. A “mix index” analysis is performed, which reduces the ASV as the number of category C and D aircraft operations increases at an airport. This mix index calculation is shown below.
Mix Index = C + 3D where:
C = Annual Percentage of Category C Aircraft D = Annual Percentage of Category D Aircraft
HXD Mix Index = 1.02 + 3(0.08) = 1.26%
The current mix index for the Hilton Head Island Airport is approximately 1.26 percent, which is short of the 20 percent index required to lower the ASV. Based on the forecasts for the Airport, the demand, as a percentage of ASV is presented in Table 4.1.1-1.
Table 4.1.1-1 Forecast Demand as Percentage of
Annual Service Volume Hilton Head Island Airport
YearForecast Annual
OperationsPercentage of
ASV2009 38,237 16.6% 2014 43,562 18.9% 2019 47,890 20.8% 2029 56,901 24.7%
Source: Federal Aviation Administration, “Advisory Circular 150/5060-5 – Airport Capacity and Delay, Changes 1-2,” September 23, 1983, <http://www.faa.gov/>, accessed October 8, 2009. Talbert & Bright, Inc., March 2010.
Table 4.1.1-1 indicates that the forecast total annual operations are expected to grow from 16.6 percent to 24.7 percent of the annual service volume by the end of the 20-year planning period. Industry and FAA guidelines recommend that capacity improvements be pursued when annual operations reach 60 percent of the theoretical ASV. Therefore, when actual annual operations reach 138,000 operations, more detailed analysis should be performed to better determine the runway’s capacity. Since the demand at the Hilton Head Island Airport is not forecasted to reach the 60 percent threshold level within the 20-year planning period, no additional runways are required to increase the Airport’s capacity.
Hourly airfield capacity is a measure of the maximum number of aircraft operations that can be accommodated on the airport or airport component
in an hour. Hourly capacity is an important consideration, since this measure determines whether an airport can accommodate the projected peak hour operations during the planning period.
FAA Advisory Circular 150/5060-5 – Airport Capacity and Delay was used to calculate the hourly capacity of the Hilton Head Island Airport. Hourly capacity is calculated based on the mix index, number of touch and go operations, and number of runway exits. The hourly capacity is calculated for both visual flight rule (VFR) operations and instrument flight rules (IFR) operations. The following formula is used for this analysis.
Hourly Capacity = C x T x E where:
C = Hourly Capacity Base from Advisory Circular 150/5060-5 T = Touch and Go Factor
E = Exit Factor
VFR Hourly Capacity = 104 x 1.04 x 0.94 = 101.7 operations IFR Hourly Capacity = 68 x 1.0 x 0.99 = 67.3 operations
The VFR and IFR hourly capacity for a single runway airport with a full parallel taxiway is 101.7 VFR and 67.3 IFR operations based on the formula above. Touch and go operations were estimated at 10 percent with the number of arrivals at the Airport estimated at 50 percent of the total operations. The forecast demand as a percentage of VFR and IFR hourly capacity is presented in Table 4.1.1-2.
Table 4.1.1-2 Forecast Demand as Percentage of Hourly Capacity
Hilton Head Island Airport
Year
Forecast Peak Hour Operations (operations/hour)
VFR Percent of Hourly Capacity
IFR Percent of Hourly Capacity
2009 20 19.7% 29.7% 2014 23 22.6% 34.2% 2019 25 24.6% 37.2% 2029 29 28.5% 43.1%
Source: Federal Aviation Administration, “Advisory Circular 150/5060-5 – Airport Capacity and Delay, Changes 1-2,” September 23, 1983, <http://www.faa.gov/>, accessed October 8, 2009. Talbert & Bright, Inc., March 2010.
Similar to the runway capacity analysis, the actual/projected hourly demand is only expected to reach 28.5 percent of hourly VFR capacity and approximately 43.1 percent of hourly IFR capacity by the end of the 20-year planning period. Therefore, no improvements are required at this time to increase the Hilton Head Island Airport VFR and IFR capacity.
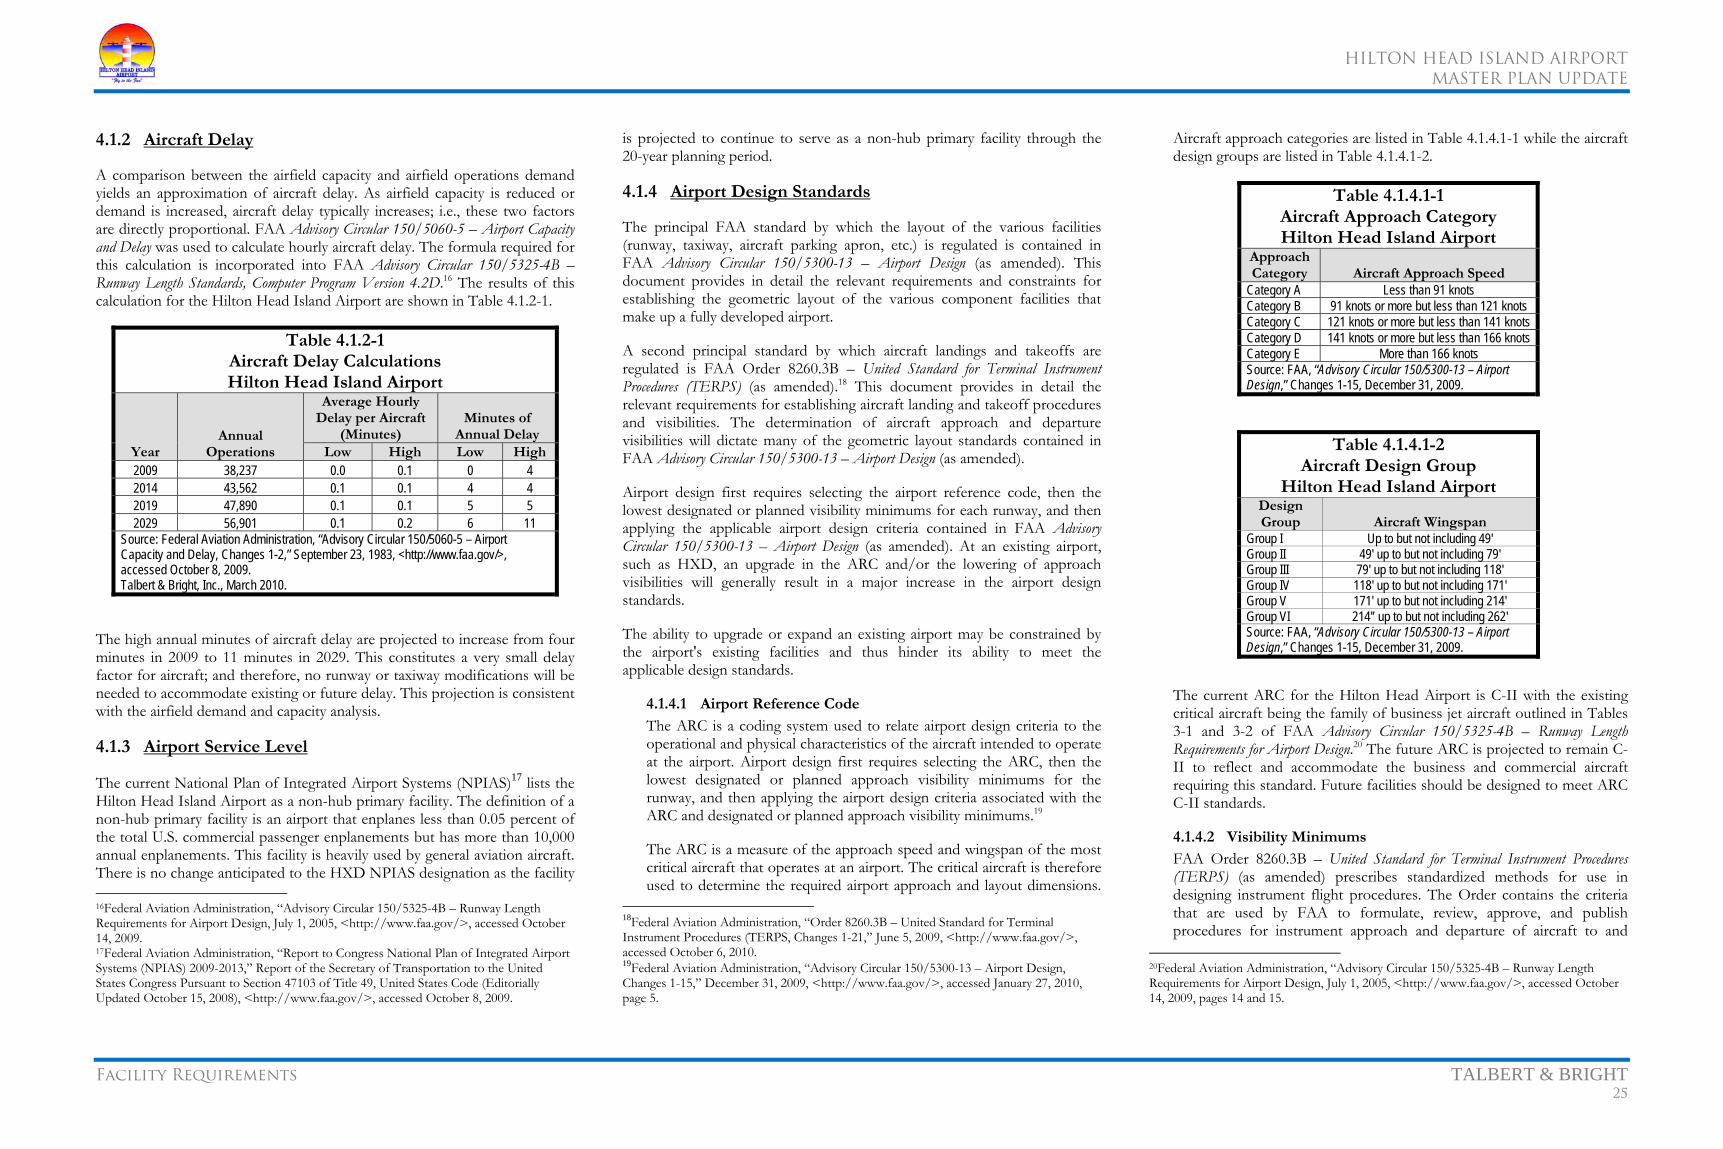
HILTON HEAD ISLAND AIRPORT
MASTER PLAN UPDATE
Facility Requirements TALBERT & BRIGHT 25
4.1.2 Aircraft Delay
A comparison between the airfield capacity and airfield operations demand yields an approximation of aircraft delay. As airfield capacity is reduced or demand is increased, aircraft delay typically increases; i.e., these two factors are directly proportional. FAA Advisory Circular 150/5060-5 – Airport Capacity and Delay was used to calculate hourly aircraft delay. The formula required for this calculation is incorporated into FAA Advisory Circular 150/5325-4B – Runway Length Standards, Computer Program Version 4.2D.16 The results of this calculation for the Hilton Head Island Airport are shown in Table 4.1.2-1.
Table 4.1.2-1 Aircraft Delay Calculations Hilton Head Island Airport
Year Annual
Operations
Average Hourly Delay per Aircraft
(Minutes) Minutes of
Annual Delay Low High Low High
2009 38,237 0.0 0.1 0 4 2014 43,562 0.1 0.1 4 4 2019 47,890 0.1 0.1 5 5 2029 56,901 0.1 0.2 6 11
Source: Federal Aviation Administration, “Advisory Circular 150/5060-5 – Airport Capacity and Delay, Changes 1-2,” September 23, 1983, <http://www.faa.gov/>, accessed October 8, 2009. Talbert & Bright, Inc., March 2010.
The high annual minutes of aircraft delay are projected to increase from four minutes in 2009 to 11 minutes in 2029. This constitutes a very small delay factor for aircraft; and therefore, no runway or taxiway modifications will be needed to accommodate existing or future delay. This projection is consistent with the airfield demand and capacity analysis.
4.1.3 Airport Service Level
The current National Plan of Integrated Airport Systems (NPIAS)17 lists the Hilton Head Island Airport as a non-hub primary facility. The definition of a non-hub primary facility is an airport that enplanes less than 0.05 percent of the total U.S. commercial passenger enplanements but has more than 10,000 annual enplanements. This facility is heavily used by general aviation aircraft. There is no change anticipated to the HXD NPIAS designation as the facility 16Federal Aviation Administration, “Advisory Circular 150/5325-4B – Runway Length Requirements for Airport Design, July 1, 2005, <http://www.faa.gov/>, accessed October 14, 2009. 17Federal Aviation Administration, “Report to Congress National Plan of Integrated Airport Systems (NPIAS) 2009-2013,” Report of the Secretary of Transportation to the United States Congress Pursuant to Section 47103 of Title 49, United States Code (Editorially Updated October 15, 2008), <http://www.faa.gov/>, accessed October 8, 2009.
is projected to continue to serve as a non-hub primary facility through the 20-year planning period.
4.1.4 Airport Design Standards
The principal FAA standard by which the layout of the various facilities (runway, taxiway, aircraft parking apron, etc.) is regulated is contained in FAA Advisory Circular 150/5300-13 – Airport Design (as amended). This document provides in detail the relevant requirements and constraints for establishing the geometric layout of the various component facilities that make up a fully developed airport.
A second principal standard by which aircraft landings and takeoffs are regulated is FAA Order 8260.3B – United Standard for Terminal Instrument Procedures (TERPS) (as amended).18 This document provides in detail the relevant requirements for establishing aircraft landing and takeoff procedures and visibilities. The determination of aircraft approach and departure visibilities will dictate many of the geometric layout standards contained in FAA Advisory Circular 150/5300-13 – Airport Design (as amended).
Airport design first requires selecting the airport reference code, then the lowest designated or planned visibility minimums for each runway, and then applying the applicable airport design criteria contained in FAA Advisory Circular 150/5300-13 – Airport Design (as amended). At an existing airport, such as HXD, an upgrade in the ARC and/or the lowering of approach visibilities will generally result in a major increase in the airport design standards.
The ability to upgrade or expand an existing airport may be constrained by the airport's existing facilities and thus hinder its ability to meet the applicable design standards.
4.1.4.1 Airport Reference Code
The ARC is a coding system used to relate airport design criteria to the operational and physical characteristics of the aircraft intended to operate at the airport. Airport design first requires selecting the ARC, then the lowest designated or planned approach visibility minimums for the runway, and then applying the airport design criteria associated with the ARC and designated or planned approach visibility minimums.19
The ARC is a measure of the approach speed and wingspan of the most critical aircraft that operates at an airport. The critical aircraft is therefore used to determine the required airport approach and layout dimensions.
18Federal Aviation Administration, “Order 8260.3B – United Standard for Terminal Instrument Procedures (TERPS, Changes 1-21,” June 5, 2009, <http://www.faa.gov/>, accessed October 6, 2010. 19Federal Aviation Administration, “Advisory Circular 150/5300-13 – Airport Design, Changes 1-15,” December 31, 2009, <http://www.faa.gov/>, accessed January 27, 2010, page 5.
Aircraft approach categories are listed in Table 4.1.4.1-1 while the aircraft design groups are listed in Table 4.1.4.1-2.
Table 4.1.4.1-1 Aircraft Approach Category Hilton Head Island Airport
Approach Category Aircraft Approach Speed
Category A Less than 91 knots Category B 91 knots or more but less than 121 knots Category C 121 knots or more but less than 141 knots Category D 141 knots or more but less than 166 knots Category E More than 166 knots Source: FAA, “Advisory Circular 150/5300-13 – Airport Design,” Changes 1-15, December 31, 2009.
Table 4.1.4.1-2 Aircraft Design Group
Hilton Head Island Airport Design Group Aircraft Wingspan
Group I Up to but not including 49' Group II 49' up to but not including 79' Group III 79' up to but not including 118' Group IV 118' up to but not including 171' Group V 171' up to but not including 214' Group VI 214'’ up to but not including 262' Source: FAA, “Advisory Circular 150/5300-13 – Airport Design,” Changes 1-15, December 31, 2009.
The current ARC for the Hilton Head Airport is C-II with the existing critical aircraft being the family of business jet aircraft outlined in Tables 3-1 and 3-2 of FAA Advisory Circular 150/5325-4B – Runway Length Requirements for Airport Design.20 The future ARC is projected to remain C-II to reflect and accommodate the business and commercial aircraft requiring this standard. Future facilities should be designed to meet ARC C-II standards.
4.1.4.2 Visibility Minimums
FAA Order 8260.3B – United Standard for Terminal Instrument Procedures (TERPS) (as amended) prescribes standardized methods for use in designing instrument flight procedures. The Order contains the criteria that are used by FAA to formulate, review, approve, and publish procedures for instrument approach and departure of aircraft to and
20Federal Aviation Administration, “Advisory Circular 150/5325-4B – Runway Length Requirements for Airport Design, July 1, 2005, <http://www.faa.gov/>, accessed October 14, 2009, pages 14 and 15.
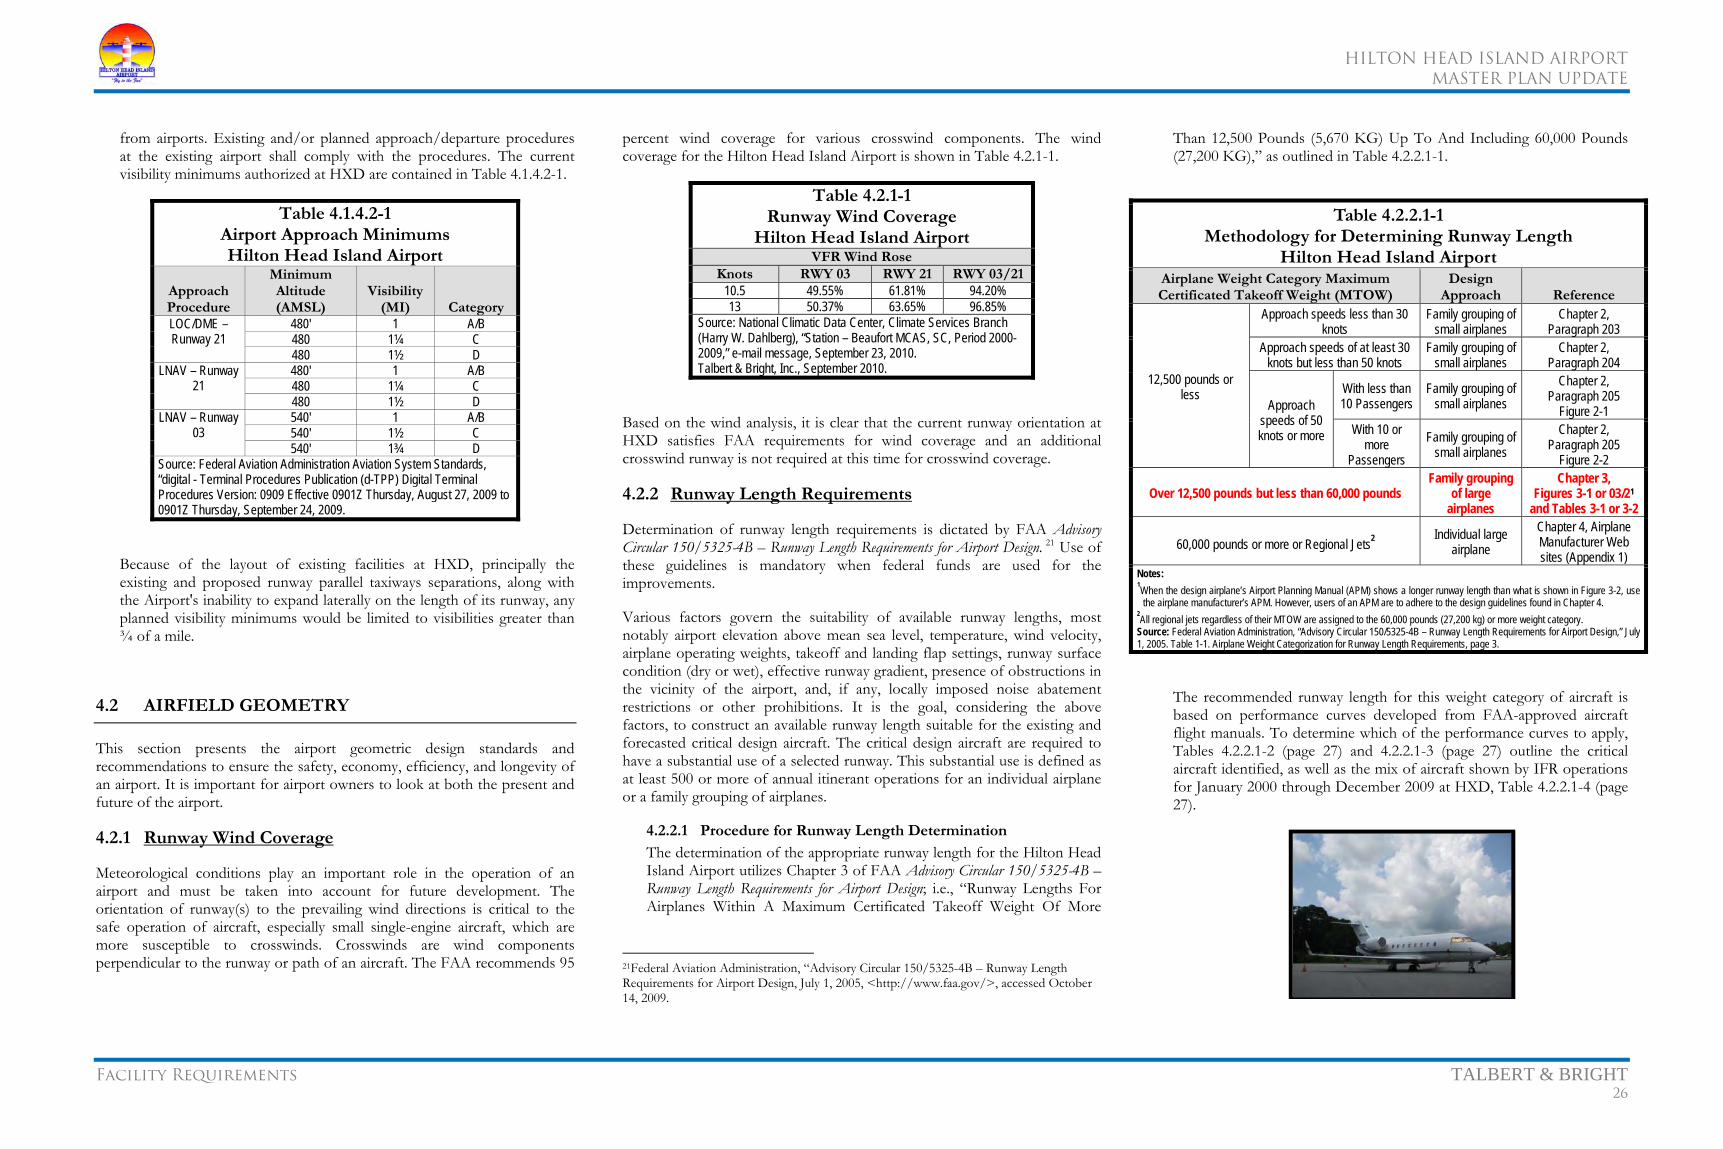
HILTON HEAD ISLAND AIRPORT
MASTER PLAN UPDATE
Facility Requirements TALBERT & BRIGHT 26
from airports. Existing and/or planned approach/departure procedures at the existing airport shall comply with the procedures. The current visibility minimums authorized at HXD are contained in Table 4.1.4.2-1.
Table 4.1.4.2-1 Airport Approach Minimums Hilton Head Island Airport
Approach Procedure
Minimum Altitude (AMSL)
Visibility (MI) Category
LOC/DME – Runway 21
480' 1 A/B 480 1¼ C 480 1½ D
LNAV – Runway 21
480' 1 A/B 480 1¼ C 480 1½ D
LNAV – Runway 03
540' 1 A/B 540' 1½ C 540' 1¾ D
Source: Federal Aviation Administration Aviation System Standards, “digital - Terminal Procedures Publication (d-TPP) Digital Terminal Procedures Version: 0909 Effective 0901Z Thursday, August 27, 2009 to 0901Z Thursday, September 24, 2009.
Because of the layout of existing facilities at HXD, principally the existing and proposed runway parallel taxiways separations, along with the Airport's inability to expand laterally on the length of its runway, any planned visibility minimums would be limited to visibilities greater than ¾ of a mile.
4.2 AIRFIELD GEOMETRY
This section presents the airport geometric design standards and recommendations to ensure the safety, economy, efficiency, and longevity of an airport. It is important for airport owners to look at both the present and future of the airport.
4.2.1 Runway Wind Coverage
Meteorological conditions play an important role in the operation of an airport and must be taken into account for future development. The orientation of runway(s) to the prevailing wind directions is critical to the safe operation of aircraft, especially small single-engine aircraft, which are more susceptible to crosswinds. Crosswinds are wind components perpendicular to the runway or path of an aircraft. The FAA recommends 95
percent wind coverage for various crosswind components. The wind coverage for the Hilton Head Island Airport is shown in Table 4.2.1-1.
Table 4.2.1-1 Runway Wind Coverage
Hilton Head Island Airport VFR Wind Rose
Knots RWY 03 RWY 21 RWY 03/2110.5 49.55% 61.81% 94.20% 13 50.37% 63.65% 96.85%
Source: National Climatic Data Center, Climate Services Branch (Harry W. Dahlberg), “Station – Beaufort MCAS, SC, Period 2000-2009,” e-mail message, September 23, 2010. Talbert & Bright, Inc., September 2010.
Based on the wind analysis, it is clear that the current runway orientation at HXD satisfies FAA requirements for wind coverage and an additional crosswind runway is not required at this time for crosswind coverage.
4.2.2 Runway Length Requirements
Determination of runway length requirements is dictated by FAA Advisory Circular 150/5325-4B – Runway Length Requirements for Airport Design. 21 Use of these guidelines is mandatory when federal funds are used for the improvements.
Various factors govern the suitability of available runway lengths, most notably airport elevation above mean sea level, temperature, wind velocity, airplane operating weights, takeoff and landing flap settings, runway surface condition (dry or wet), effective runway gradient, presence of obstructions in the vicinity of the airport, and, if any, locally imposed noise abatement restrictions or other prohibitions. It is the goal, considering the above factors, to construct an available runway length suitable for the existing and forecasted critical design aircraft. The critical design aircraft are required to have a substantial use of a selected runway. This substantial use is defined as at least 500 or more of annual itinerant operations for an individual airplane or a family grouping of airplanes.
4.2.2.1 Procedure for Runway Length Determination
The determination of the appropriate runway length for the Hilton Head Island Airport utilizes Chapter 3 of FAA Advisory Circular 150/5325-4B – Runway Length Requirements for Airport Design; i.e., “Runway Lengths For Airplanes Within A Maximum Certificated Takeoff Weight Of More
21Federal Aviation Administration, “Advisory Circular 150/5325-4B – Runway Length Requirements for Airport Design, July 1, 2005, <http://www.faa.gov/>, accessed October 14, 2009.
Than 12,500 Pounds (5,670 KG) Up To And Including 60,000 Pounds (27,200 KG),” as outlined in Table 4.2.2.1-1.
Table 4.2.2.1-1 Methodology for Determining Runway Length
Hilton Head Island Airport Airplane Weight Category Maximum Certificated Takeoff Weight (MTOW)
Design Approach Reference
12,500 pounds or less
Approach speeds less than 30 knots
Family grouping of small airplanes
Chapter 2, Paragraph 203
Approach speeds of at least 30 knots but less than 50 knots
Family grouping of small airplanes
Chapter 2, Paragraph 204
Approach speeds of 50 knots or more
With less than 10 Passengers
Family grouping of small airplanes
Chapter 2, Paragraph 205
Figure 2-1 With 10 or
more Passengers
Family grouping of small airplanes
Chapter 2, Paragraph 205
Figure 2-2
Over 12,500 pounds but less than 60,000 pounds Family grouping
of large airplanes
Chapter 3, Figures 3-1 or 03/21
and Tables 3-1 or 3-2
60,000 pounds or more or Regional Jets2 Individual large
airplane Chapter 4, Airplane Manufacturer Web sites (Appendix 1)
Notes: 1When the design airplane’s Airport Planning Manual (APM) shows a longer runway length than what is shown in Figure 3-2, use
the airplane manufacturer’s APM. However, users of an APM are to adhere to the design guidelines found in Chapter 4. 2All regional jets regardless of their MTOW are assigned to the 60,000 pounds (27,200 kg) or more weight category. Source: Federal Aviation Administration, “Advisory Circular 150/5325-4B – Runway Length Requirements for Airport Design,” July 1, 2005. Table 1-1. Airplane Weight Categorization for Runway Length Requirements, page 3.
The recommended runway length for this weight category of aircraft is based on performance curves developed from FAA-approved aircraft flight manuals. To determine which of the performance curves to apply, Tables 4.2.2.1-2 (page 27) and 4.2.2.1-3 (page 27) outline the critical aircraft identified, as well as the mix of aircraft shown by IFR operations for January 2000 through December 2009 at HXD, Table 4.2.2.1-4 (page 27).

HILTON HEAD ISLAND AIRPORT
MASTER PLAN UPDATE
Facility Requirements TALBERT & BRIGHT 27
Table 4.2.2.1-2 Airplanes that Make Up 75 Percent of the Fleet
Hilton Head Island Airport Manufacturer Model Manufacturer Model
Aerospatiale Sn-601 Corvette Dassault Falcon 10 Bae 125-700 Dassault Falcon 20
Beechjet 400A Dassault Falcon 50/50 EX Beechjet Premier I Dassault Falcon 900/900B Beechjet 2000 Starship Aircraft Industries (IAI) Jet Commander 1121
Bombardier Challenger 300 IAI Westwind 1123/1124 Cessna 500 Citation/501Citation Sp Learjet 20 Series Cessna Citation I/II/III Learjet 31/31A/31A ER Cessna 525A Citation II (CJ-2) Learjet 35/35A/36/36A Cessna 550 Citation Bravo Learjet 40/45 Cessna 550 Citation II Mitsubishi Mu-300 Diamond Cessna 551 Citation II/Special Raytheon 390 Premier Cessna 552 Citation Raytheon Hawker 400/400 XP Cessna 560 Citation Encore Raytheon Hawker 600 Cessna 560/560 XL Citation Excel Sabreliner 40/60 Cessna 560 Citation V Ultra Sabreliner 75A Cessna 650 Citation VII Sabreliner 80 Cessna 680 Citation Sovereign Sabreliner T-39
Note: Airplanes that operate at HXD. Source: Federal Aviation Administration, “Advisory Circular 150/5325-4B – Runway Length Requirements for Airport Design,” July 1, 2005. Table 3-1. Airplanes that Make Up 75 Percent of the Fleet, page 14. FAA Flight Plan Database (2000-2008) furnished by the SC Aeronautics Commission.
Table 4.2.2.1-3 Remaining 25 Percent of
Airplanes that Make Up 100 Percent of the Fleet
Hilton Head Island Airport Manufacturer Model
Bae Corporate 800/1000 Bombardier 600 Challenger Bombardier 601/601-3A/3ER
Challenger Bombardier 604 Challenger Bombardier BD-100 Continental
Cessna S550 Citation S/II Cessna 650 Citation III/IV Cessna 750 Citation X Dassault Falcon 900C/900EX Dassault Falcon 2000/2000EX
Aircraft Industries(IAI) Astra 1125 IAI Galaxy 1126
Learjet 45 XR Learjet 55/55B/55C Learjet 60
Raytheon/Hawker Horizon Raytheon/Hawker 800/800 XP Raytheon/Hawker 1000
Sabreliner 65/75 Note: Airplanes that operate at HXD. Airplanes in Tables 4.2.2.1-2 and 4.2.2.1-3 combine to comprise 100% of the fleet. Source: Federal Aviation Administration, “Advisory Circular 150/5325-4B – Runway Length Requirements for Airport Design,” July 1, 2005. Table 3-2. Remaining 25 Percent of Airplanes that Make Up 100 Percent of the Fleet, page 15. FAA Flight Plan Database (2000-2008) furnished by the SC Aeronautics Commission.
Table 4.2.2.1-4 Critical Design Aircraft IFR Data
Hilton Head Island Airport
Aircraft Reference
CodeOperations
2005 2006 2007 2008 2009Table 3-1 AC/5325-4B Referenced Aircraft
Beechjet Premier I B-I 41 40 46 35 94 Bombardier Challenger 300 B-II 42 120 114 95 62 Cessna 500 Citation/501 Citation Sp B-I 186 76 74 81 42 Cessna Citation I/II/III B-II 422 399 321 287 225 Cessna 525A Citation II (CJ-2) B-II 41 58 100 74 81 Cessna 550 Citation Bravo B-II 758 886 633 466 236 Cessna 560 Citation Encore B-II 964 910 944 761 744 Cessna 560/560 XL Citation Excel B-II 1,044 963 958 922 695 Cessna 650 Citation VII B-II 109 63 155 130 80 Cessna 680 Citation Sovereign B-II 20 98 162 261 291 Dassault Falcon 10 B-I 162 99 71 108 90 Dassault Falcon 20 B-II 50 123 150 106 109 Dassault Falcon 50/50 EX B-II 143 74 70 82 74 Dassault Falcon 900/900B B-II 120 92 63 100 86 IAI Westwind 1123/1124 C-I 60 55 28 18 17 Learjet 20 Series C-I 36 56 18 34 30 Learjet 31/31A/31A ER C-I 68 120 92 48 54 Learjet 35/35A/36/36A D-I 62 34 24 29 18 Learjet 40/45 C-I 264 262 238 224 177 Mitsubishi Mu-300 Diamond B-I 4 19 8 4 6 Raytheon Hawker 400/400 XP B-I 531 607 730 526 566 Sabreliner 40/60 B-I 11 16 2 8 0
Total 5,138 5,170 5,001 4,399 3,777 Table 3-2 AC/5325-4B Referenced Aircraft
Bombardier 600 Challenger B-II 77 84 79 70 96 Dassault Falcon 2000/2000EX B-II 75 100 100 139 81 IAI Astra 1125 C-I 70 40 32 38 26 Learjet 55/55B/55C C-I 6 15 15 8 10 Learjet 60 C-I 22 34 36 21 12
Total 250 273 262 276 225 US Airways (Piedmont Airlines)
DHC-8-100 A-III 3,356 4,792 5,263 5,015 5,070 DHC-8-200 A-III 2,231 786 0 0 0 DHC-8-300 A-III 27 16 23 24 4
Total US Airways 5,614 5,594 5,286 5,039 5,074 Delta Air Lines (ASA Airlines/Mesaba Airlines)
ATR-72 (operated from 03/07 to 11/08) B-III 0 0 1,922 1,629 3 Saab 340 (operated from 03/09 to 11/09) B-II 0 0 0 0 1,7670
Total Delta Air Lines 0 0 1,922 1,629 1,770 Source: FAA Flight Plan Database (2000-2008) furnished by the SC Aeronautics Commission.

HILTON HEAD ISLAND AIRPORT
MASTER PLAN UPDATE
Facility Requirements TALBERT & BRIGHT 28
4.2.2.2 Runway Length Measurement
As shown in Table 4.2.2.1-4, substantial operations of itinerant aircraft frequent the Hilton Head Island Airport to justify usage of a family of aircraft (Table 4.2.2.2-1) in the determination of appropriate runway length.
Table 4.2.2.2-1 Family of Critical Design Aircraft
Hilton Head Island Airport Beechjet Premier I Dassault Falcon 900/900B Cessna 500 Citation/501 Citation Sp Bombardier 600 Challenger Dassault Falcon 10 Dassault Falcon 2000/2000EX Mitsubishi Mu-300 Diamond IAI Westwind 1123/1124 Raytheon Hawker 400/400 XP Learjet 20 Series Sabreliner 40/60 Learjet 31/31A/31A ER Bombardier Challenger 300 Learjet 40/45 Cessna Citation I/II/III IAI Astra 1125 Cessna 525A Citation II (CJ-2) Learjet 55/55B/55C Cessna 550 Citation Bravo Learjet 60 Cessna 560 Citation Encore Learjet 35/35A/36/36 A Cessna 560/560 XL Citation Excel Cessna 650 Citation VII Commercial Service Aircraft Cessna 680 Citation Sovereign De Havilland DHC 8-100 Dassault Falcon 20 Bombardier DASH 8-Q200 Dassault Falcon 50/50 EX SAAB 340 Source: FAA Flight Plan Database (2000-2009) furnished by the SC Aeronautics Commission.
The corresponding runway length graphs are found in Figures 4.2.2.2-1 and 4.2.2.2-2 (page 29). In Figure 4.2.2.2-1, two options are provided: 75 percent of fleet at 60 percent useful load or 75 percent of fleet at 90 percent load. In Figure 4.2.2.2-2 (page 29) two options are provided: 100 percent of fleet at 60 percent useful load or 100 percent of fleet at 90 percent load.
The 100 percent of fleet at 60 percent useful load has been selected based on the departure haul lengths outlined in Table 4.2.2.2-2 (page 30). Runway length measurement calculations are shown in Table 4.2.2.2-3 (page 29).
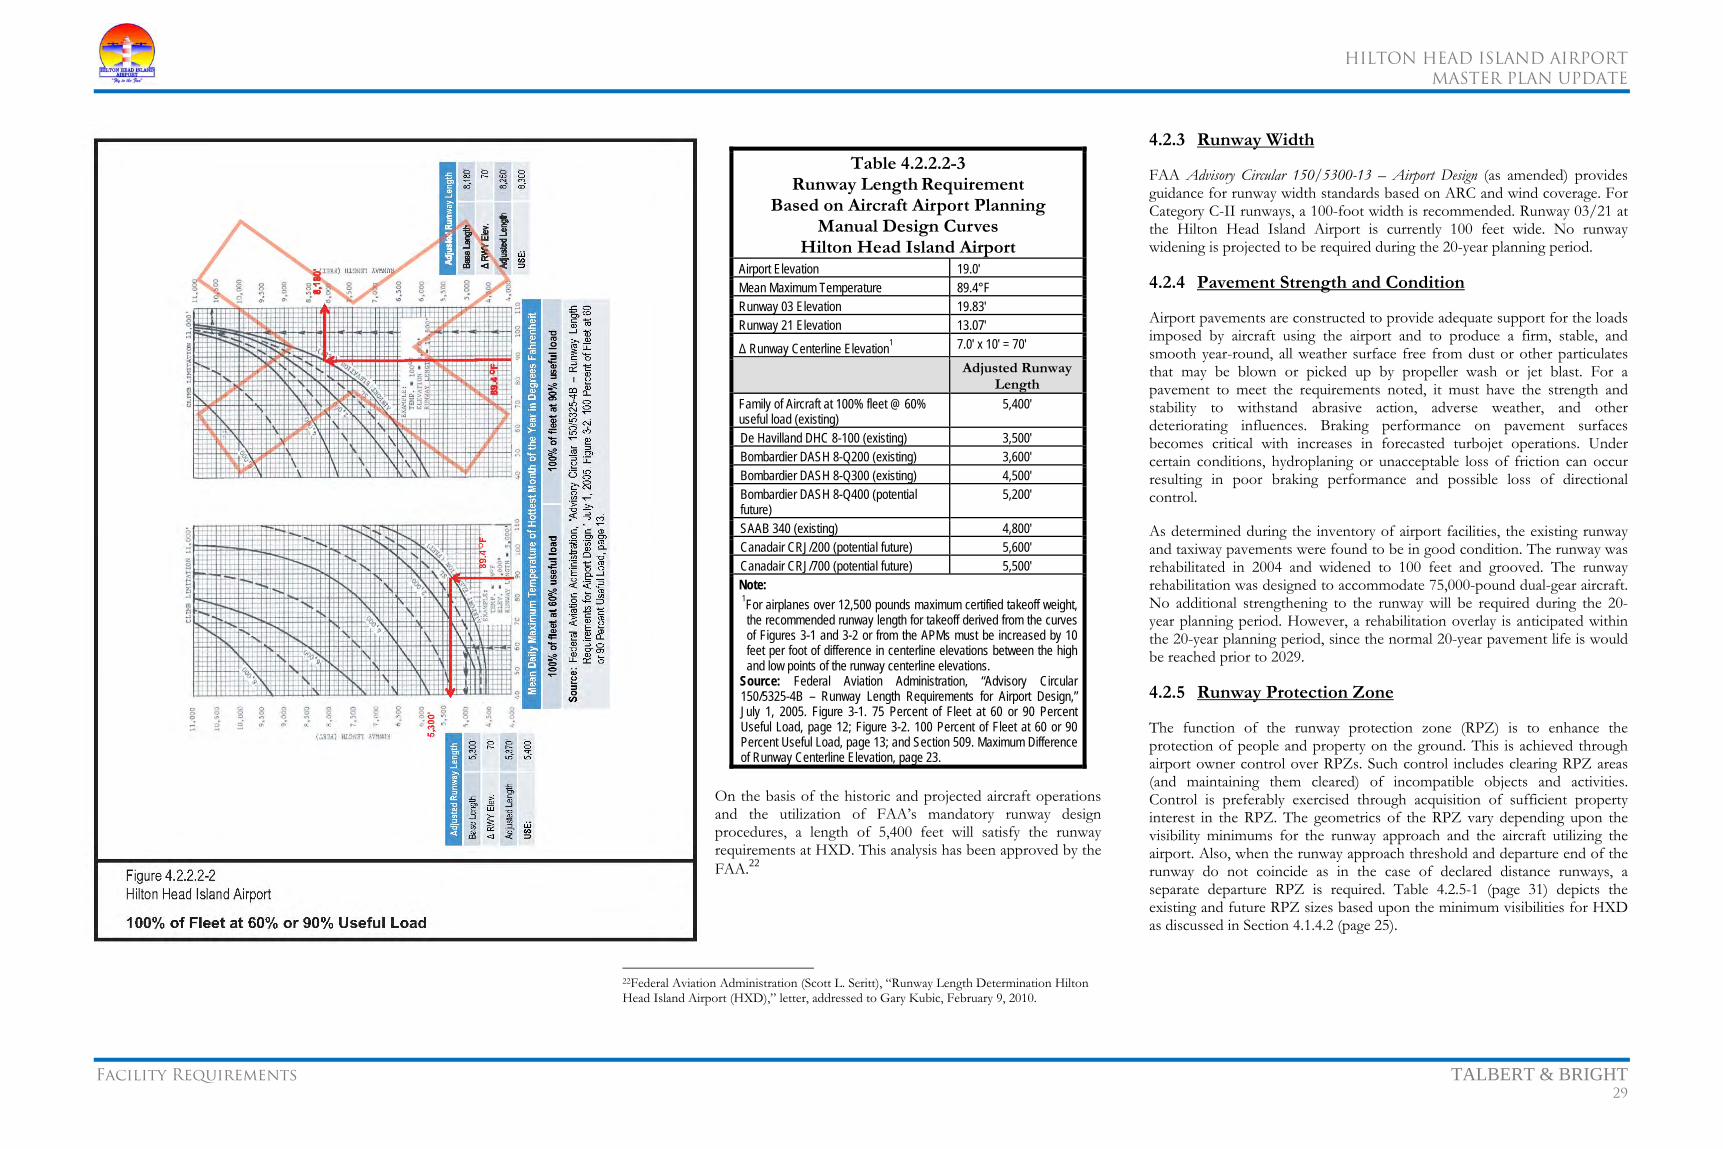
HILTON HEAD ISLAND AIRPORT
MASTER PLAN UPDATE
Facility Requirements TALBERT & BRIGHT 29
Table 4.2.2.2-3 Runway Length Requirement
Based on Aircraft Airport Planning Manual Design Curves
Hilton Head Island Airport Airport Elevation 19.0′ Mean Maximum Temperature 89.4°F Runway 03 Elevation 19.83′ Runway 21 Elevation 13.07′
Δ Runway Centerline Elevation1 7.0′ x 10′ = 70′
Adjusted Runway Length
Family of Aircraft at 100% fleet @ 60% useful load (existing)
5,400′
De Havilland DHC 8-100 (existing) 3,500′ Bombardier DASH 8-Q200 (existing) 3,600′ Bombardier DASH 8-Q300 (existing) 4,500′ Bombardier DASH 8-Q400 (potential future)
5,200′
SAAB 340 (existing) 4,800′ Canadair CRJ/200 (potential future) 5,600′ Canadair CRJ/700 (potential future) 5,500′ Note: 1For airplanes over 12,500 pounds maximum certified takeoff weight, the recommended runway length for takeoff derived from the curves of Figures 3-1 and 3-2 or from the APMs must be increased by 10 feet per foot of difference in centerline elevations between the high and low points of the runway centerline elevations.
Source: Federal Aviation Administration, “Advisory Circular 150/5325-4B – Runway Length Requirements for Airport Design,” July 1, 2005. Figure 3-1. 75 Percent of Fleet at 60 or 90 Percent Useful Load, page 12; Figure 3-2. 100 Percent of Fleet at 60 or 90 Percent Useful Load, page 13; and Section 509. Maximum Difference of Runway Centerline Elevation, page 23.
On the basis of the historic and projected aircraft operations and the utilization of FAA’s mandatory runway design procedures, a length of 5,400 feet will satisfy the runway requirements at HXD. This analysis has been approved by the FAA.22
22Federal Aviation Administration (Scott L. Seritt), “Runway Length Determination Hilton Head Island Airport (HXD),” letter, addressed to Gary Kubic, February 9, 2010.
4.2.3 Runway Width
FAA Advisory Circular 150/5300-13 – Airport Design (as amended) provides guidance for runway width standards based on ARC and wind coverage. For Category C-II runways, a 100-foot width is recommended. Runway 03/21 at the Hilton Head Island Airport is currently 100 feet wide. No runway widening is projected to be required during the 20-year planning period.
4.2.4 Pavement Strength and Condition
Airport pavements are constructed to provide adequate support for the loads imposed by aircraft using the airport and to produce a firm, stable, and smooth year-round, all weather surface free from dust or other particulates that may be blown or picked up by propeller wash or jet blast. For a pavement to meet the requirements noted, it must have the strength and stability to withstand abrasive action, adverse weather, and other deteriorating influences. Braking performance on pavement surfaces becomes critical with increases in forecasted turbojet operations. Under certain conditions, hydroplaning or unacceptable loss of friction can occur resulting in poor braking performance and possible loss of directional control.
As determined during the inventory of airport facilities, the existing runway and taxiway pavements were found to be in good condition. The runway was rehabilitated in 2004 and widened to 100 feet and grooved. The runway rehabilitation was designed to accommodate 75,000-pound dual-gear aircraft. No additional strengthening to the runway will be required during the 20-year planning period. However, a rehabilitation overlay is anticipated within the 20-year planning period, since the normal 20-year pavement life is would be reached prior to 2029.
4.2.5 Runway Protection Zone
The function of the runway protection zone (RPZ) is to enhance the protection of people and property on the ground. This is achieved through airport owner control over RPZs. Such control includes clearing RPZ areas (and maintaining them cleared) of incompatible objects and activities. Control is preferably exercised through acquisition of sufficient property interest in the RPZ. The geometrics of the RPZ vary depending upon the visibility minimums for the runway approach and the aircraft utilizing the airport. Also, when the runway approach threshold and departure end of the runway do not coincide as in the case of declared distance runways, a separate departure RPZ is required. Table 4.2.5-1 (page 31) depicts the existing and future RPZ sizes based upon the minimum visibilities for HXD as discussed in Section 4.1.4.2 (page 25).

HILTON HEAD ISLAND AIRPORT
MASTER PLAN UPDATE
Facility Requirements TALBERT & BRIGHT 30
Table 4.2.2.2-2 Critical Design Aircraft Departure Haul Lengths
Hilton Head Island Airport
Airport
Haul Length (NM)
Number of Departures
Airport
Haul Length (NM)
Number of Departures
2004 2005 2006 2007 2008 2009 2004 2005 2006 2007 2008 2009SAV Savannah-Hilton Head International, Savannah, GA 26 35 28 33 31 38 30 APF Naples Municipal, Naples, FL 368 20 20 JZI Charleston Executive, Charleston, SC 45 27 21 FLL Fort Lauderdale-Hollywood International, Fort Lauderdale, FL 370 32 CHS Charleston International, Charleston, SC 52 31 35 32 41 30 39 BNA Nashville International, Nashville, TN 378 25 34 31 54 SSI Malcolm McKinnon, Brunswick, GA 74 20 26 IAD Washington-Dulles International, Washington, DC 433 76 58 73 58 65 CAE Columbia Metropolitan, Columbia, SC 105 54 40 36 LUK Cincinnati Municipal-Luken Field, Cincinnati, OH 450 36 41 30 7 JAX Jacksonville International, Jacksonville, FL 115 35 36 29 25 24 29 MKL McKellar-Sipes Regional, Jackson, TN 457 31 22 35 32 GMU Greenville Downtown, Greenville, SC 178 21 21 CMH Port Columbus International, Columbus, OH 478 24 29 29 28 CLT Charlotte-Douglas International, Charlotte, NC 180 2,615 2,841 2,830 2,675 2,551 2,561 HMZ Bedford County, Bedford, PA 483 21 21 TVI Thomasville Regional, Thomasville, GA 181 20 20 OSU Ohio State University, Columbus, OH 485 30 ATL Atlanta Hartsfield International, Atlanta, GA 206 961 814 885 AGC Allegheny County, Pittsburgh, PA 489 23 PDK DeKalb-Peachtree, Atlanta, GA 207 120 135 104 94 88 86 BMG Monroe County, Bloomington, IN 506 6 FTY Fulton County-Brown Field, Atlanta, GA 214 44 50 40 30 30 N94 Carlisle, Carlisle, PA 507 25 24 22 22 ORL Orlando Executive, Orlando, FL 223 43 34 BKL Burke Lakefront, Cleveland, OH 560 9 RYY Cobb County-McCollum Field, Atlanta, GA 224 25 39 TTN Trenton-Mercer, Trenton, NJ 561 24 JNX Johnston County, Smithfield, NC 230 43 MMU Morristown Municipal, Morristown, NJ 597 44 31 24 35 MCO Orlando International, Orlando, FL 230 20 23 22 24 TEB Teterboro, Teterboro, NJ 608 78 56 62 65 62 73 GSO Piedmont Triad International, Greensboro, NC 235 29 31 48 42 44 48 SUS Spirit of St. Louis, St. Louis, MO 624 28 23 INT Smith Reynolds, Winston Salem, NC 236 5 HPN Westchester County, White Plains, NY 628 42 46 52 64 60 36 RDU Raleigh-Durham International, Raleigh/Durham, NC 239 47 89 112 111 111 64 POU Duchess County, Poughkeepsie, NY 651 35 TRI Tri-Cities Regional, Bristol/Johnson/Kingsport, TN 269 60 83 57 MDW Chicago Midway International, Chicago, IL 665 30 25 27 26 TYS McGhee Tyson, Knoxville, TN 271 107 111 85 106 102 112 PWK Chicago Executive, Chicago/Prospect Heights/Wheeling, IL 685 24 23 30 25 CHA Lovell Field, Chattanooga, TN 282 22 36 40 36 25 22 UGN Waukegan Regional, Chicago/Waukegan, IL 700 19 13 17 19 18 12 SUA Witham Field, Stuart, FL 304 25 24 PVD Theodore Francis Green State, Providence, RI 722 11 10 SRQ Sarasota-Bradenton International, Sarasota/Bradenton, FL 305 20 5 BED Laurence G. Hanscom Field, Bedford, MA 760 22 BHM Birmingham-Shuttlesworth International, Birmingham, AL 316 20 28 CID Eastern Iowa, Cedar Rapids, IA 782 45 28 PBI Palm Beach International, West Palm Beach, FL 333 41 36 36 24 21 22 Total IFR Operations 3,927 4,123 4,099 4,854 4,270 4,242 BCT Boca Raton, Boca Raton, FL 352 24 21 Operations under 500 NM 3,597 3,889 3,845 4,567 4,083 4,062 RIC Richmond International, Richmond, VA 358 36 30 31 31 23 21 Operations over 500 NM 330 234 254 287 187 180 Notes: Table 3-1 AC/5325-4B Referenced Aircraft (includes only destinations with at least 20 departures from HXD). Table 3-2 AC/5325-4B Referenced Aircraft (includes only destinations with at least 5 departures from HXD). Source: FAA Flight Plan Database (2000-2009) furnished by the SC Aeronautics Commission.
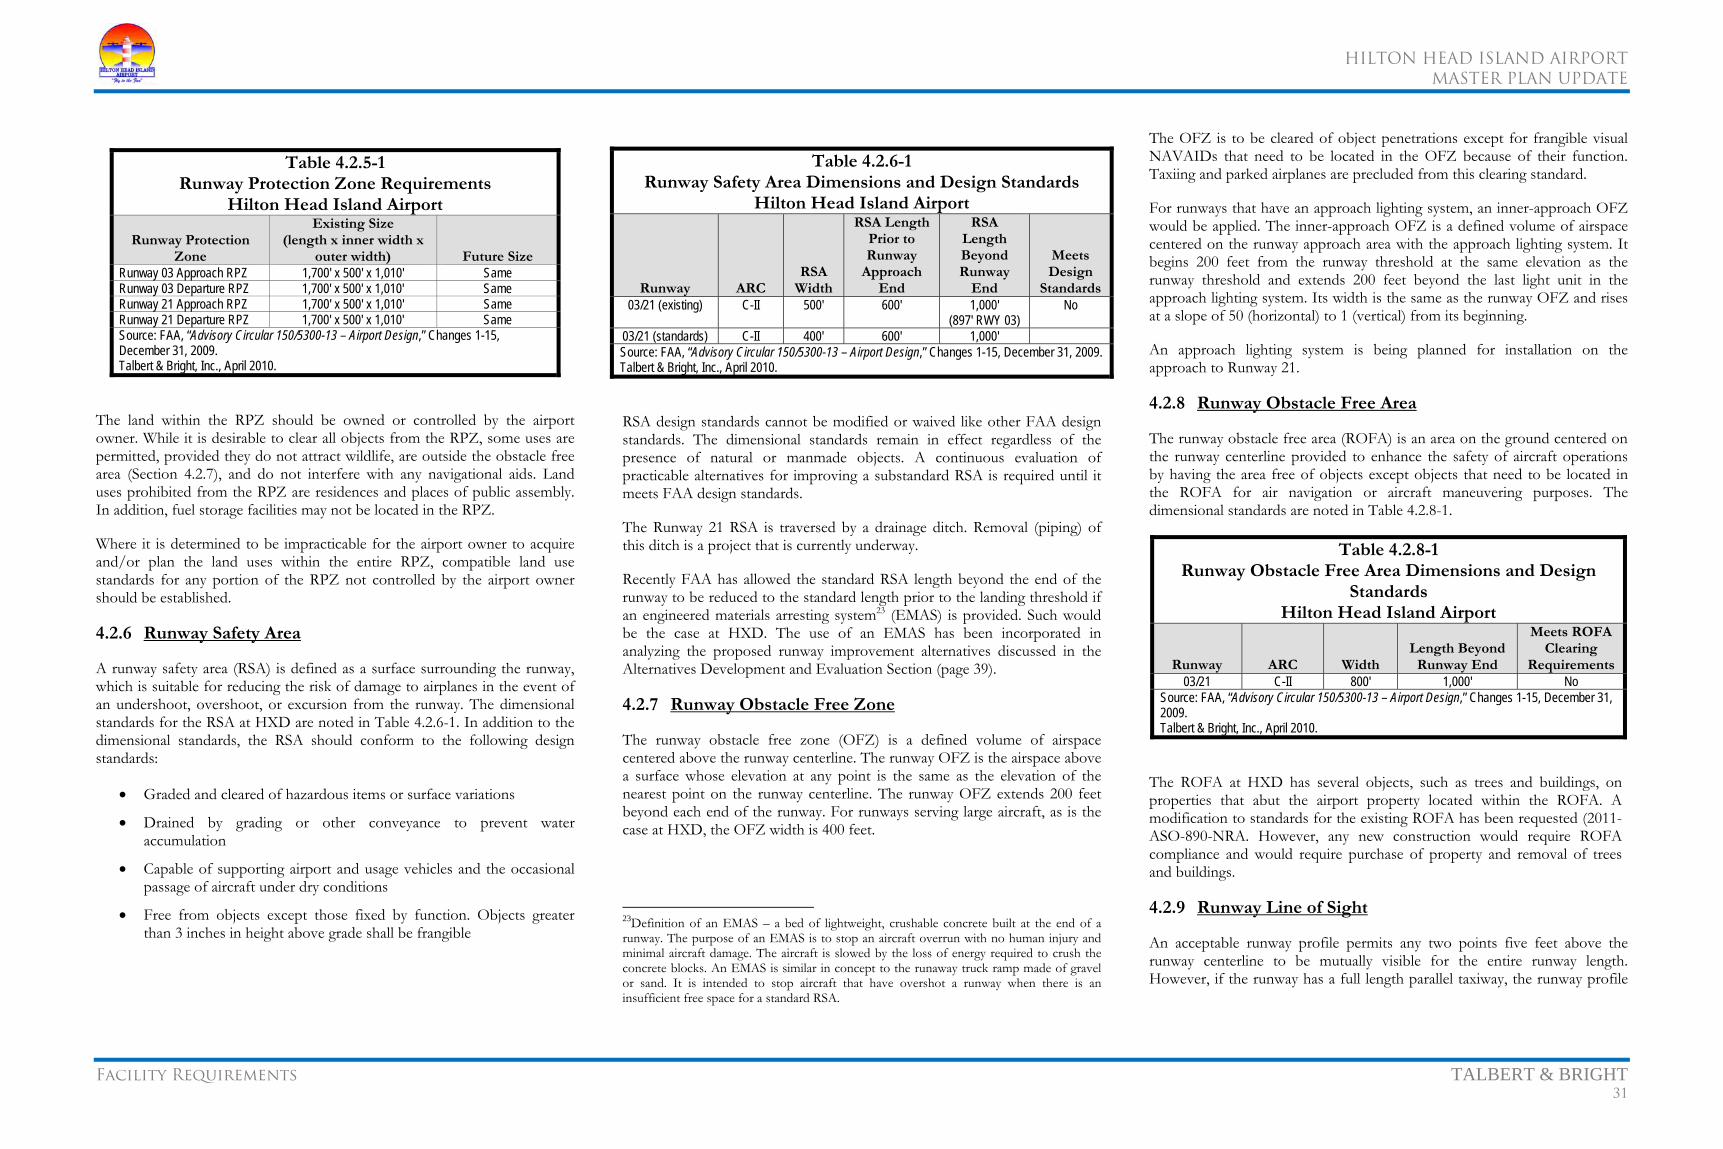
HILTON HEAD ISLAND AIRPORT
MASTER PLAN UPDATE
Facility Requirements TALBERT & BRIGHT 31
Table 4.2.5-1 Runway Protection Zone Requirements
Hilton Head Island Airport
Runway Protection Zone
Existing Size (length x inner width x
outer width) Future Size Runway 03 Approach RPZ 1,700' x 500' x 1,010' Same Runway 03 Departure RPZ 1,700' x 500' x 1,010' Same Runway 21 Approach RPZ 1,700' x 500' x 1,010' Same Runway 21 Departure RPZ 1,700' x 500' x 1,010' Same Source: FAA, “Advisory Circular 150/5300-13 – Airport Design,” Changes 1-15, December 31, 2009. Talbert & Bright, Inc., April 2010.
The land within the RPZ should be owned or controlled by the airport owner. While it is desirable to clear all objects from the RPZ, some uses are permitted, provided they do not attract wildlife, are outside the obstacle free area (Section 4.2.7), and do not interfere with any navigational aids. Land uses prohibited from the RPZ are residences and places of public assembly. In addition, fuel storage facilities may not be located in the RPZ.
Where it is determined to be impracticable for the airport owner to acquire and/or plan the land uses within the entire RPZ, compatible land use standards for any portion of the RPZ not controlled by the airport owner should be established.
4.2.6 Runway Safety Area
A runway safety area (RSA) is defined as a surface surrounding the runway, which is suitable for reducing the risk of damage to airplanes in the event of an undershoot, overshoot, or excursion from the runway. The dimensional standards for the RSA at HXD are noted in Table 4.2.6-1. In addition to the dimensional standards, the RSA should conform to the following design standards:
• Graded and cleared of hazardous items or surface variations
• Drained by grading or other conveyance to prevent water accumulation
• Capable of supporting airport and usage vehicles and the occasional passage of aircraft under dry conditions
• Free from objects except those fixed by function. Objects greater than 3 inches in height above grade shall be frangible
Table 4.2.6-1 Runway Safety Area Dimensions and Design Standards
Hilton Head Island Airport
Runway ARCRSA
Width
RSA Length Prior to Runway
Approach End
RSA Length Beyond Runway
End
Meets Design
Standards03/21 (existing) C-II 500' 600' 1,000'
(897' RWY 03) No
03/21 (standards) C-II 400' 600' 1,000' Source: FAA, “Advisory Circular 150/5300-13 – Airport Design,” Changes 1-15, December 31, 2009. Talbert & Bright, Inc., April 2010.
RSA design standards cannot be modified or waived like other FAA design standards. The dimensional standards remain in effect regardless of the presence of natural or manmade objects. A continuous evaluation of practicable alternatives for improving a substandard RSA is required until it meets FAA design standards.
The Runway 21 RSA is traversed by a drainage ditch. Removal (piping) of this ditch is a project that is currently underway.
Recently FAA has allowed the standard RSA length beyond the end of the runway to be reduced to the standard length prior to the landing threshold if an engineered materials arresting system23 (EMAS) is provided. Such would be the case at HXD. The use of an EMAS has been incorporated in analyzing the proposed runway improvement alternatives discussed in the Alternatives Development and Evaluation Section (page 39).
4.2.7 Runway Obstacle Free Zone
The runway obstacle free zone (OFZ) is a defined volume of airspace centered above the runway centerline. The runway OFZ is the airspace above a surface whose elevation at any point is the same as the elevation of the nearest point on the runway centerline. The runway OFZ extends 200 feet beyond each end of the runway. For runways serving large aircraft, as is the case at HXD, the OFZ width is 400 feet.
23Definition of an EMAS – a bed of lightweight, crushable concrete built at the end of a runway. The purpose of an EMAS is to stop an aircraft overrun with no human injury and minimal aircraft damage. The aircraft is slowed by the loss of energy required to crush the concrete blocks. An EMAS is similar in concept to the runaway truck ramp made of gravel or sand. It is intended to stop aircraft that have overshot a runway when there is an insufficient free space for a standard RSA.
The OFZ is to be cleared of object penetrations except for frangible visual NAVAIDs that need to be located in the OFZ because of their function. Taxiing and parked airplanes are precluded from this clearing standard.
For runways that have an approach lighting system, an inner-approach OFZ would be applied. The inner-approach OFZ is a defined volume of airspace centered on the runway approach area with the approach lighting system. It begins 200 feet from the runway threshold at the same elevation as the runway threshold and extends 200 feet beyond the last light unit in the approach lighting system. Its width is the same as the runway OFZ and rises at a slope of 50 (horizontal) to 1 (vertical) from its beginning.
An approach lighting system is being planned for installation on the approach to Runway 21.
4.2.8 Runway Obstacle Free Area
The runway obstacle free area (ROFA) is an area on the ground centered on the runway centerline provided to enhance the safety of aircraft operations by having the area free of objects except objects that need to be located in the ROFA for air navigation or aircraft maneuvering purposes. The dimensional standards are noted in Table 4.2.8-1.
Table 4.2.8-1 Runway Obstacle Free Area Dimensions and Design
Standards Hilton Head Island Airport
Runway ARC WidthLength Beyond
Runway End
Meets ROFA Clearing
Requirements03/21 C-II 800' 1,000' No
Source: FAA, “Advisory Circular 150/5300-13 – Airport Design,” Changes 1-15, December 31, 2009. Talbert & Bright, Inc., April 2010.
The ROFA at HXD has several objects, such as trees and buildings, on properties that abut the airport property located within the ROFA. A modification to standards for the existing ROFA has been requested (2011-ASO-890-NRA. However, any new construction would require ROFA compliance and would require purchase of property and removal of trees and buildings.
4.2.9 Runway Line of Sight
An acceptable runway profile permits any two points five feet above the runway centerline to be mutually visible for the entire runway length. However, if the runway has a full length parallel taxiway, the runway profile

HILTON HEAD ISLAND AIRPORT
MASTER PLAN UPDATE
Facility Requirements TALBERT & BRIGHT 32
may be such that an unobstructed line of sight will exist from any point five feet above the runway centerline for one-half the runway length. There are no obstructions or limitations to the line of sight within the visibility zone. No changes are required to meet runway visibility standards.
4.2.10 Runway Edge Lighting and Signage
Edge lights are used to outline usable operational areas of airports during periods of darkness and low visibility weather conditions. The Hilton Head Island Airport is currently equipped with MIRLs. It is recommended that these lights be retrofitted so that the “high” setting may be accessed via pilot-controlled lighting. A conversion of these lights to light-emitting diodes (LED) is recommended if the FAA approves LED lights for runway use. No other modifications are anticipated other than routine maintenance.
Existing airside signage consists of lighted guidance signs. These signs will require periodic maintenance. The Airport is currently in the process of upgrading the signage; no other modifications are anticipated other than routine maintenance.
4.2.11 Taxiway Requirements
The minimum pavement widths, curve radii, and separations associated with airplane movement areas and airplane physical characteristics establish the taxiway system. Since the taxiway system is the transitional facility, which supports airport operational capacity, the capability to maintain an average taxiing speed of at least 20 mph is recommended, which is currently met by the existing taxiways at the Airport. Taxiway dimensional standards are categorized by separations, widths, curves, and fillets. In addition, the taxiway safety area shall be:
• Cleared and graded and have no potentially hazardous ruts, humps, depressions, or other surface variations
• Drained by grading or storm sewers to prevent water accumulation
• Capable, under dry conditions, of supporting ARFF equipment and the occasional passage of aircraft without causing structural damage for the aircraft
• Free of objects except those which need to be located in the taxiway safety area because of their function. Objects higher than 3 inches above grade should be constructed on low impact resistant supports (frangible mounted structures) of the lowest practical height with the frangible point no higher than 3 inches above grade. Other objects, such as manholes, should be constructed at grade. In no case should their height exceed 3 inches above grade
4.2.12 Taxiway and Taxilane Obstacle Free Areas
The taxiway and taxilane OFAs are centered on the taxiway and taxilane centerlines. The taxiway and taxilane OFA clearing standards prohibit service vehicle roads, parked airplanes, and aboveground objects except for objects that need to be located in the OFA for air navigation or aircraft ground maneuvering purposes. Vehicles may operate within the OFA provided they give right-of-way to oncoming aircraft by either maintaining a safe distance ahead or behind the aircraft or by exiting the OFA to let the aircraft pass. The taxiway and taxilane OFAs at HXD meet FAA standards, and no modifications are necessary.
4.2.13 Parallel Taxiways
A basic airport consists of a runway with a full-length parallel taxiway, an apron, and connecting transverse taxiways between the runway, parallel taxiway, and the apron. The Airport currently has two full parallel taxiways connecting each end and each side of the runway. Taxiway ‘A’ (general aviation side of the Airport) is connected to the runway via five stub taxiways and Taxiway ‘F’ (commercial service side of the Airport) by two stub taxiways. The existing taxiways meet C-II design standards (Taxiway ‘F’ is 50 feet wide and Taxiway ‘A’ is 35 feet wide. There are no changes required to Taxiway ‘F,’ as the centerline separation between the runway and the taxiway is 300 feet.
Taxiway ‘A’ currently has a runway/taxiway separation of 200 feet and will have to be relocated to a runway/taxiway separation of 300 feet. This relocation will render approximately 17,500 square yards of the existing apron unusable on the general aviation side of the Airport. Bypass taxiways, along Taxiway ‘A,’ are available at each runway end. This allows departing aircraft that have been cleared for takeoff to access the runway ends without waiting behind aircraft, which have not been cleared.
4.2.14 Taxiway Edge Lighting and Signage
The taxiway edge lighting system is a configuration of lights that define the lateral and longitudinal limits of usable taxiway. Taxiway signage provides the airport users with guidance information for taxiing destinations and to assist in taxi route decision making upon exiting the apron area. The Hilton Head Island Airport is currently equipped with medium intensity taxiway lighting (MITL) and lighted taxiway signs. The signs are currently being relocated to appropriate distances to improve visibility for pilots. The taxiway lights are currently regular quartz lights. It is recommended that these lights be replaced with LED lights, which use a fraction of the power that regular quartz lights use, when there is a need to replace the taxiway lighting system or during construction of the Taxiway ‘A’ relocation. This change in the taxiway lights provides a “green” benefit to the Airport by reducing power
consumption. There are no other improvements recommended for these ground navigational aids.
4.2.15 Runway to Taxiway Separation
Runway to taxiway separation standards are predicated on the ARC and the existing/future visibility minimums expected. The higher the ARC and the lower the visibility minimums, the greater the runway to taxiway separation distances. For an airport with an ARC of C-II and runways with instrument approach minimums as low as ¾ mile visibility, FAA Advisory Circular 150-5300-13 – Airport Design (as amended) recommends a 300-foot separation between the runway and taxiway. The Hilton Head Island Airport currently meets this standard for Taxiway ‘F’. However, Taxiway ‘A’ will need to be relocated to a 300-foot runway/taxiway separation.
4.2.16 Taxilane System
The taxilanes, having access from the apron and taxiway system to hangar and ramp areas, should be designed in accordance with ARC C-II standards as specified in FAA Advisory Circular 150-5300-13 – Airport Design (as amended). The taxilane pavement strength should be commensurate with aircraft usage as needed between the airfield and associated hangar/ramp maneuvering areas. Hangar taxilanes should be of sufficient width to allow unencumbered wingtip clearance between fixed objects (hangars, fence, fueling facilities, light poles, etc.).
The taxilanes at the Hilton Head Island Airport are used for aircraft maneuvering from the taxiways to and from the hangars and apron areas. Additional taxilanes will be required as more hangars are constructed at the Airport. These taxilanes will provide access to these new facilities. Existing taxilanes may require strengthening to accommodate frequent passage of heavier aircraft to and from existing hangars at HXD. This strengthening will be dependent upon the aircraft type, location of the hangars, and frequency of use. There are no other modifications or improvements required at this time to the taxiway/taxilane network at the Hilton Head Island Airport. Table 4.2.16-1 summarizes the existing and future airfield design standards.

HILTON HEAD ISLAND AIRPORT
MASTER PLAN UPDATE
Facility Requirements TALBERT & BRIGHT 33
Table 4.2.16-1 Airfield Design Standards
Hilton Head Island Airport
Runway Design Factors Existing
(ARC C-II) Non-Precision
Approach Requirements
Runway Width 100' 100' Runway Safety Area (RSA):
RSA width RSA length beyond runway end
500'
1,000' (897' RWY 03)
400'
1,000’ Obstacle free area (OFA):
OFA width OFA length beyond runway end
800'
1,000'
800'
1,000' Building Restriction Line (BRL) 800' from centerline 800' from centerline Taxiway width 50' (‘F’)/35' (‘A’) 50' Runway to taxiway distance Runway to parking distance Taxiway to parking distance
300' (‘F’)/200’ (‘A’) 400' 100'
300' 400' 105'
Source: FAA, “Advisory Circular 150/5300-13 – Airport Design,” Changes 1-15, December 31, 2009. Talbert & Bright, Inc., April 2010.
4.3 FACILITY REQUIREMENTS
This subsection identifies airside facilities needed to satisfy the 20-year forecast of aviation demand at the Hilton Head Island Airport. The identification of needed facilities does not constitute a requirement in terms of absolute design standards or goals, but rather an option for facility improvements to resolve various types of facility or operational inadequacies or to make improvements as demand warrants. The facilities recommended as part of this Master Plan Update have been identified from inventory and forecast findings and planned in accordance with FAA airport design standards and airspace criteria.
The following analysis addresses seven major airport areas. The runway length has been addressed as part of the demand capacity study and is thus not included in the following analysis. The facility requirements section has been broken down into airside and landside facility requirements.
4.3.1 Airside Facility Requirements
4.3.1.1 Based Aircraft
General aviation aircraft parking and storage requirements can vary widely from airport to airport depending on the number of transient aircraft using the airport and the number of based aircraft owners who choose to tie down their aircraft on the ramp versus those who choose to
use available hangar space. Table 4.3.1.1-1 lists the existing storage percentages at the Hilton Head Island Airport by aircraft type.
4.3.1.2 T-Hangar Storage
Airports most often utilize T-hangars as covered storage for small general aviation aircraft. HXD currently has 22 T-hangar units. Based on this ratio, a total of 98 T-hangar units will be required by 2029 as shown in Table 4.3.1.2-1. This equates to three additional 10-unit T-hangar buildings for the Airport over the 20-year planning period.
Table 4.3.1.2-1 T-Hangar Storage Requirements by Forecast Number of Aircraft
Hilton Head Island Airport Aircraft Type 2009 2014 2019 2029
Single-Engine Piston 21 28 33 44 Multi-Engine Piston 1 2 3 6 Turboprop 0 0 0 0 Jet 0 0 0 0 Rotorcraft 0 0 0 0 Total T-Hangar Units 22 30 36 50 Source: Talbert & Bright, Inc., March 2010.
4.3.1.3 Conventional Hangar Storage
Conventional hangars (box and corporate hangars) represent the other most common method of covered aircraft storage. The following square footage requirements were used for calculating the total conventional hangar storage required at the Airport.
• Single-Engine – 1,000 square feet
• Multi-Engine – 3,000 square feet
• Turboprop – 6,000 square feet
• Jet – 8,000 square feet
• Helicopter – 4,000 square feet
The existing conventional hangar storage area at HXD totals 25,120 square feet. Table 4.3.1.3-1 depicts the number of aircraft per hangar type over the 20-year planning period. A total of 84,120 square feet of conventional hangar storage will be needed by 2029 as shown in Table 4.3.1.3-2. This accounts for conventional hangar requirements accommodating single-engine, multi-engine, turboprop, jet, and rotorcraft.
Table 4.3.1.3-1 Conventional Hangar Storage
Requirements by Forecast Number of Aircraft
Hilton Head Island Airport Aircraft Type 2009 2014 2019 2029
Single-Engine Piston 0 0 0 0 Multi-Engine Piston 1 1 1 1 Turboprop 1 2 2 2 Jet 2 2 3 4 Rotorcraft 0 0 1 2 Source: Talbert & Bright, Inc., March 2010.
Table 4.3.1.3-2 Conventional Hangar Storage Requirements
by Total Size (Square Feet) Hilton Head Island Airport
Aircraft Types 2009 2014 2019 2029Single-Engine Piston 0 0 0 0 Multi-Engine Piston 3,120 3,120 3,120 3,120 Turboprop 3,120 9,120 9,120 9,120 Jet 9,250 17,250 25,250 33,250 Rotorcraft 0 0 4,000 8,000 Total Conventional Hangar Space 15,760 29,490 41,490 53,490 Source: Talbert & Bright, Inc., March 2010.
4.3.1.4 Apron Area
Apron areas are used for outside aircraft storage. There are 66 individual tie-down spaces with a total general aviation apron size of 53,785 square yards currently at the Airport. The following square footage requirements were used for calculating the total apron area required at the Airport. Table 4.3.1.4-1 lists the based aircraft apron requirements in square yards.
• Single-Engine – 1,000 square yards
• Multi-Engine – 2,000 square yards
Table 4.3.1.1-1 Based Aircraft Storage Ratios Hilton Head Island Airport
Aircraft Type2009 Based
AircraftApron Tie-
DownsT-Hangars Conventional Hangars
HXD ExecAir HXD Private Single-Engine Piston 60 18% 35% 47% 0% 0% Multi-Engine Piston 12 17% 8% 67% 8% 0% Turboprop 6 17% 0% 17% 17% 50% Jet 3 0% 0% 33% 67% 0% Rotorcraft 0 0% 0% 0% 0% 0% Source: Talbert & Bright, Inc., March 2010.

HILTON HEAD ISLAND AIRPORT
MASTER PLAN UPDATE
Facility Requirements TALBERT & BRIGHT 34
• Turboprop – 3,000 square yards
• Jet – 4,000 square yards
• Helicopter – 4,000 square yards
Table 4.3.1.4-1 Based Aircraft Apron Area Requirements by
Total Size (Square Yards) Hilton Head Island Airport
Aircraft Types 2009 2014 2019 2029 Single-Engine Piston 11,000 12,000 13,000 16,000 Multi-Engine Piston 4,000 4,000 6,000 6,000 Turboprop 3,000 3,000 3,000 3,000 Jet 0 0 0 0 Rotorcraft 0 0 0 0 Total Apron Area 18,000 19,000 22,000 25,000 Source: Talbert & Bright, Inc., March 2010.
These calculations account for taxilanes, as well as the ingress and egress of aircraft to and from the apron parking spaces. While the current demand calculations may be less than the current apron space available, an expansion should be considered for the near-term (first five years of the planning period) development to accommodate future growth and reduce aircraft congestion on days when operations are higher .
4.3.1.5 Transient Aircraft Storage
Transient aircraft parking requirements typically make up the largest demand for apron space requirements. Typically, 80 percent of transient aircraft are stored on the apron while the remaining 20 percent are stored in conventional hangars. These percentages were used to calculate the transient aircraft storage areas required to meet the forecast demand. Table 4.3.1.5-1 lists the transient aircraft storage requirements based on the forecast transient aircraft activity at the Hilton Head Island Airport.
Table 4.3.1.5-1 Transient Aircraft Storage Requirements
Hilton Head Island Airport
Year Apron Area
(Square Yards) Conventional Hangars
(Square Feet) 2009 32,671 10,429 2014 35,782 11,422 2019 39,628 12,650 2029 47,316 15,104
Source: Talbert & Bright, Inc., March 2010.
Table 4.3.1.5-2 lists the aircraft storage requirements for the 20-year planning period. These numbers include storage for both based and transient aircraft.
Table 4.3.1.5-2 Total Aircraft Storage Requirements
Hilton Head Island Airport
Facility ExistingPhase 1
(2010-2014)Phase 2
(2015-2019)Phase 3
(2020-2029)T-Hangar Units 22 30 36 50 Conventional Hangar (sq ft) 15,760 29,490 41,490 53,490 Transient Hangar Storage (Sq ft) 10,429 11,422 12,650 15,104 Based Aircraft Apron Area (sq yd) 18,000 19,000 22,000 25,000 Transient Apron Area (sq yd) 32,671 35,782 39,628 47,316 Source: Talbert & Bright, Inc., March 2010.
4.3.1.6 Fueling Facilities
The Hilton Head Island Airport’s fueling facilities currently consist of six separate aboveground storage tanks. Fuel delivery schedules can be adjusted as the demand warrants, which temporarily eliminates the need for additional fuel storage tanks. However, one additional Jet A tank may be necessary over the 20-year planning period. This proposed tank can be accommodated at the existing fuel farm. The existing and proposed fuel storage tanks are shown in Table 4.3.1.6-1.
Table 4.3.1.6-1 Fuel Storage Requirements Hilton Head Island Airport
No. of Tanks Fuel
Size (gallons) Status
2 Avgas 12,000 existing 3 Jet A 10,000 existing 1 Unleaded automobile gas 250 existing 1 Jet A 15,000 proposed
Source: Talbert & Bright, Inc., March 2010.
The fuel farm meets U.S. Environmental Protection Agency (USEPA) requirements and is in good condition. As the number of based aircraft increases, the demand on Avgas and Jet A fuel will also increase.
4.3.1.7 Airfield Maintenance Equipment and Storage Facilities
The Airport currently operates a number of vehicles used for airfield maintenance including three tractors for grass cutting. The Airport plans to store this field maintenance equipment in a 2,400-square-foot storage building, currently used as the ARFF building, located east of the end of Runway 03. This facility will have to be relocated when Taxiway ‘A’ is
brought into compliance with FAA requirements. It is anticipated that the current size of this facility will sufficiently accommodate the airfield storage needs over the 20-year planning period but may need to be expanded if additional maintenance equipment is acquired.
4.3.1.8 Aircraft Rescue and Firefighting Facilities
A new ARFF facility is under construction between the ATCT and the existing apron. The new 7,300-square-foot facility is currently scheduled for operation in November 2010.
4.3.1.9 Perimeter Fencing
Perimeter fencing is crucial to the prevention of animal and human incursion on aircraft operating areas. A portion of the Airport is bounded by woods and undeveloped areas and subject to animal incursions. The terminal area of the general aviation side of the Airport is the most likely place for human incursions to occur. The Hilton Head Island Airport has installed perimeter fencing along the airport property line. This fencing meets FAA CFR Part 139 standards and is in good shape but may need to be replaced during the 20-year planning period.
4.3.2 Landside Facility Requirements
4.3.2.1 Commercial Service Terminal Building
This section investigates, from a preliminary planning perspective, the following terminal elements:
Functional use of the existing terminal
Internal square footage elements
Terminal expansion
Associated automobile parking requirements
As depicted in Figure 4.3.2.1-1 (page 35), the existing terminal has estimated square footage of 18,484.
The precise functional elements of a commercial service terminal can vary widely depending on the total usage envisioned by the airport community. The existing terminal incorporates a variety of activities including space for vending machines. There are currently design plans that have been prepared to add the following to the terminal.
Restroom facilities within the passenger hold room
Third airline office and ticket counter
Automated baggage belt
Second floor to include a conference center and offices for airport administrative staff
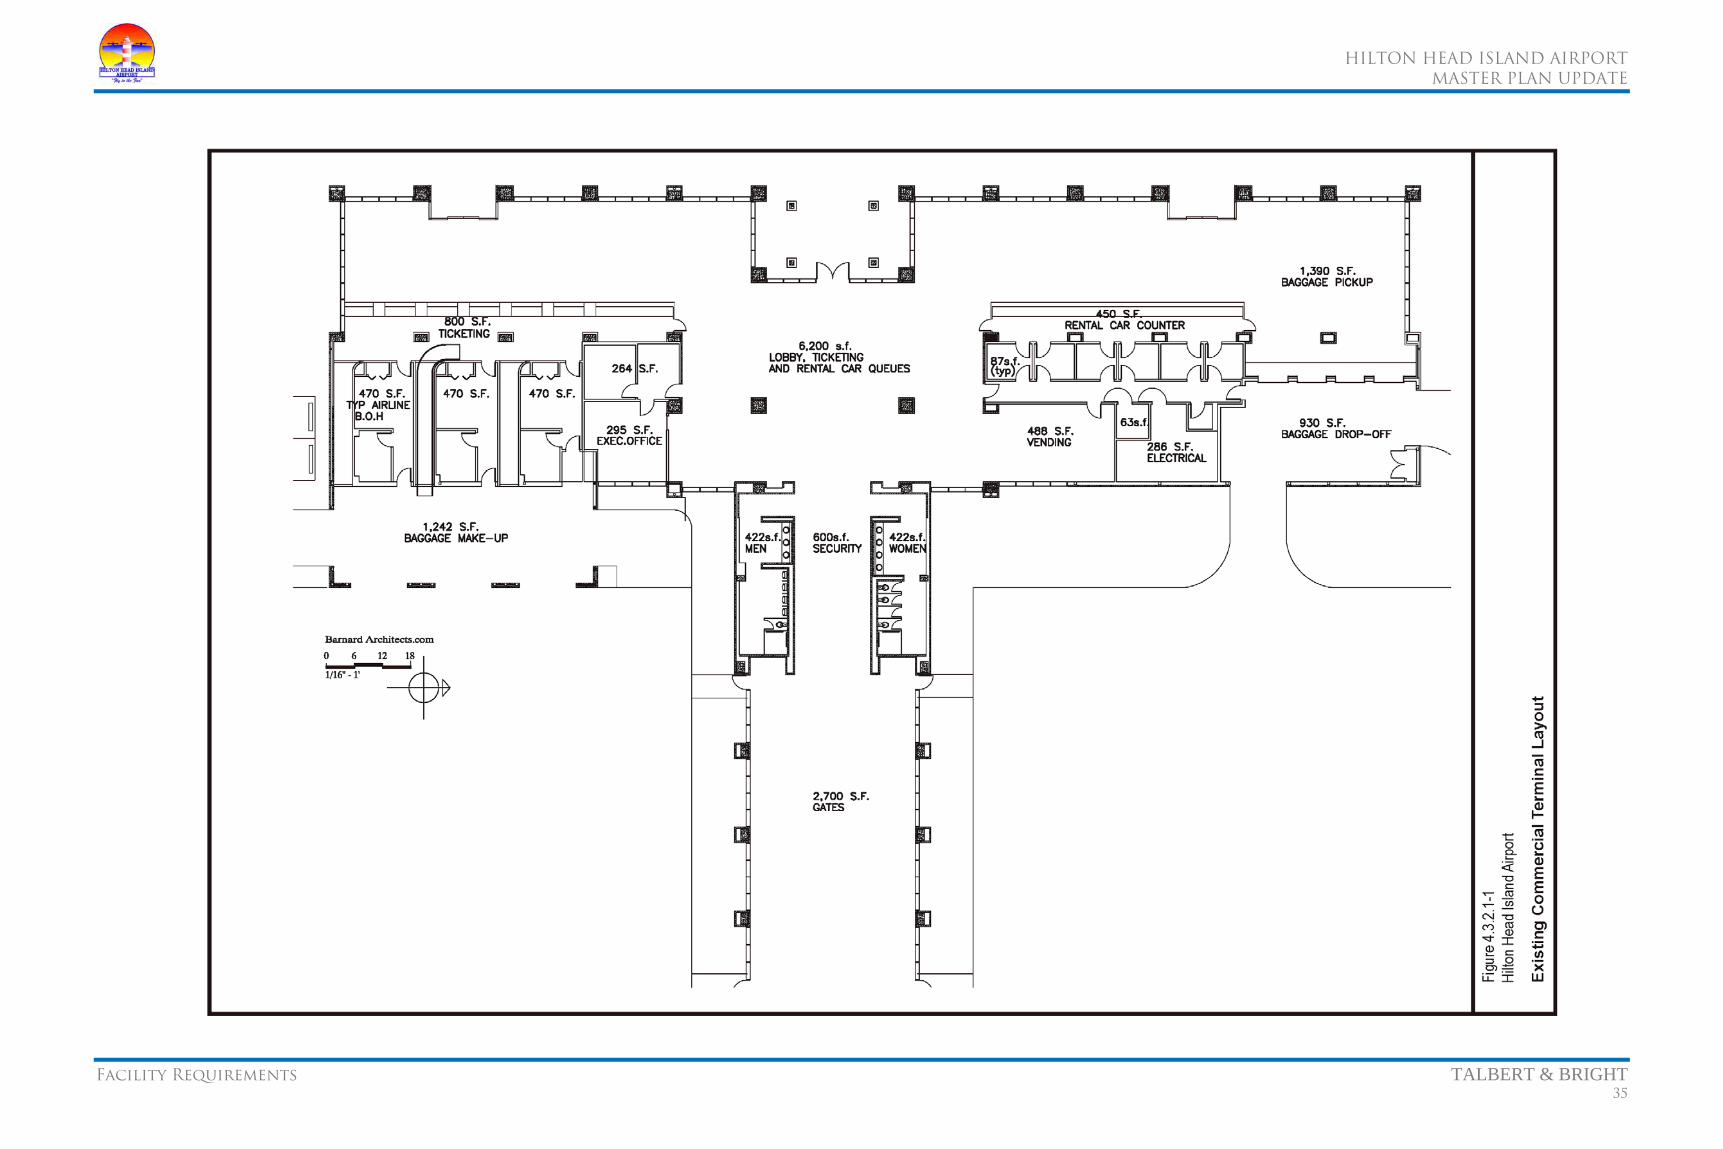
HILTON HEAD ISLAND AIRPORT
MASTER PLAN UPDATE
Facility Requirements TALBERT & BRIGHT 35
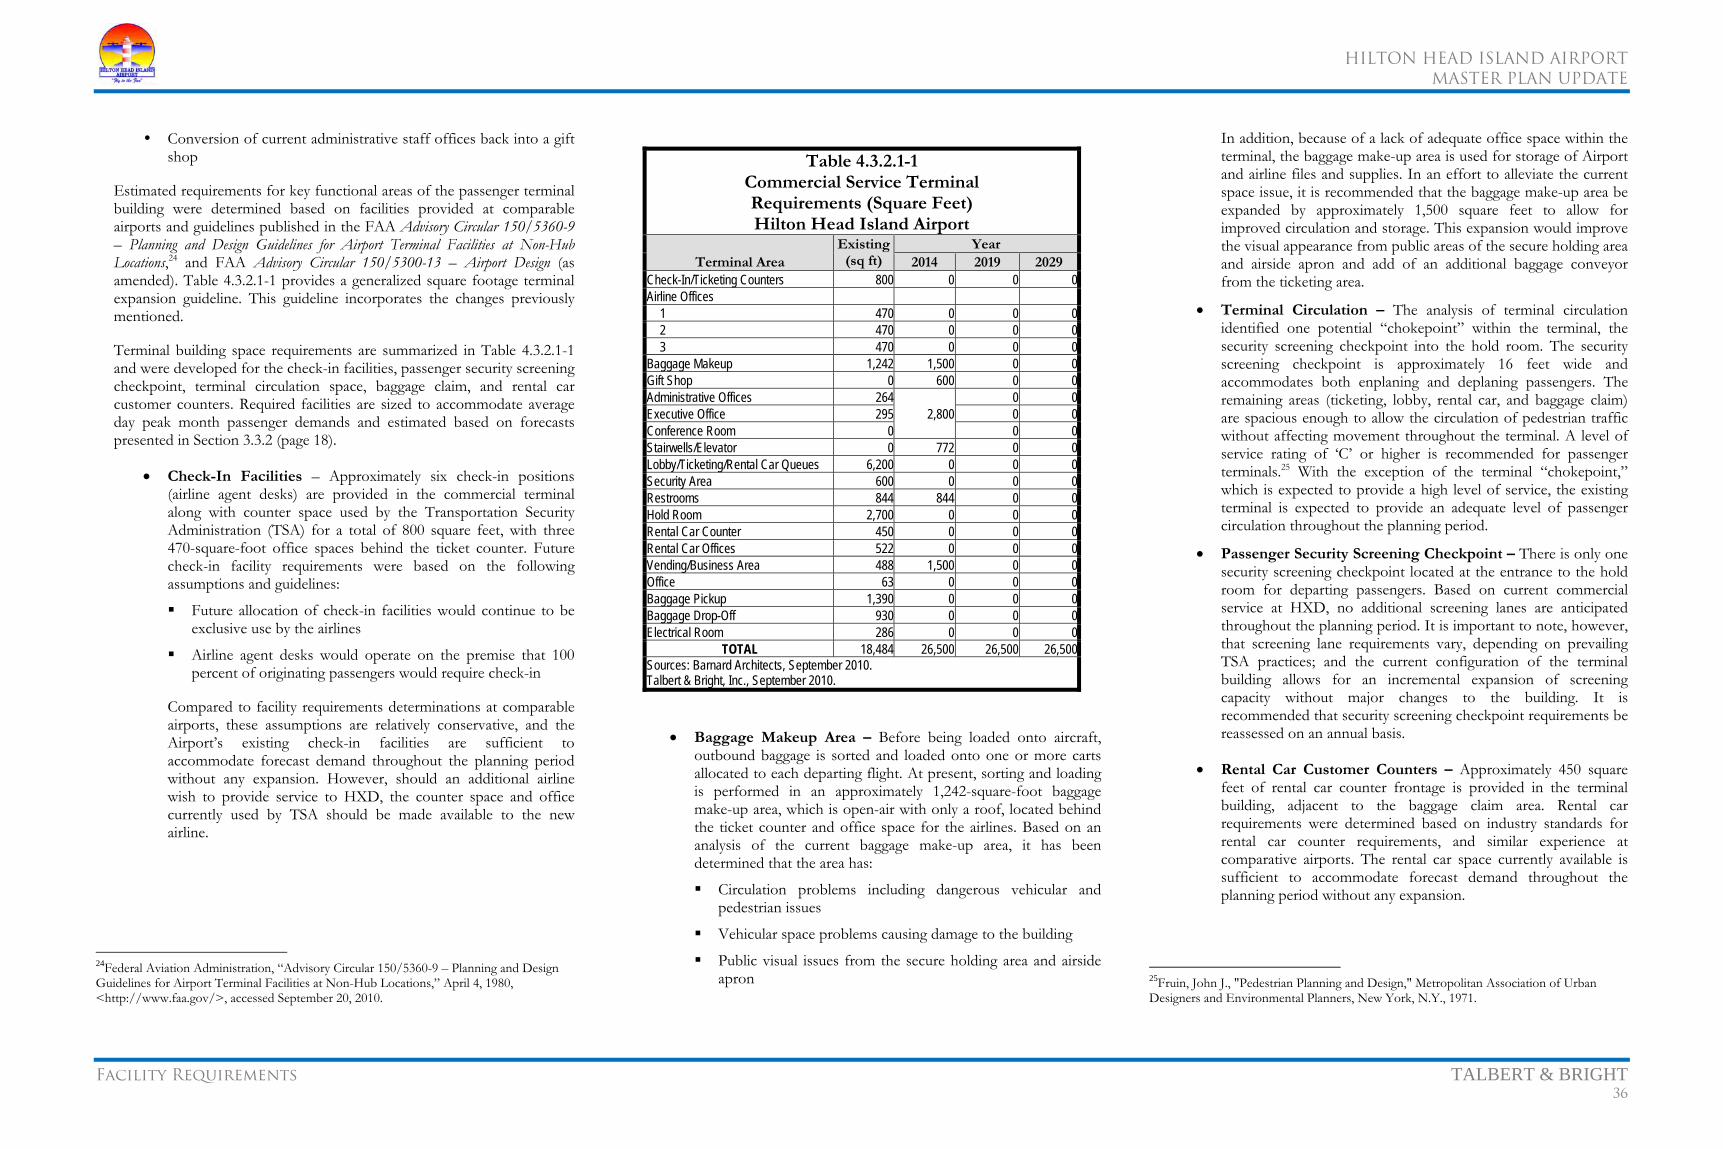
HILTON HEAD ISLAND AIRPORT
MASTER PLAN UPDATE
Facility Requirements TALBERT & BRIGHT 36
Conversion of current administrative staff offices back into a gift shop
Estimated requirements for key functional areas of the passenger terminal building were determined based on facilities provided at comparable airports and guidelines published in the FAA Advisory Circular 150/5360-9 – Planning and Design Guidelines for Airport Terminal Facilities at Non-Hub Locations,24 and FAA Advisory Circular 150/5300-13 – Airport Design (as amended). Table 4.3.2.1-1 provides a generalized square footage terminal expansion guideline. This guideline incorporates the changes previously mentioned.
Terminal building space requirements are summarized in Table 4.3.2.1-1 and were developed for the check-in facilities, passenger security screening checkpoint, terminal circulation space, baggage claim, and rental car customer counters. Required facilities are sized to accommodate average day peak month passenger demands and estimated based on forecasts presented in Section 3.3.2 (page 18).
• Check-In Facilities – Approximately six check-in positions (airline agent desks) are provided in the commercial terminal along with counter space used by the Transportation Security Administration (TSA) for a total of 800 square feet, with three 470-square-foot office spaces behind the ticket counter. Future check-in facility requirements were based on the following assumptions and guidelines:
Future allocation of check-in facilities would continue to be exclusive use by the airlines
Airline agent desks would operate on the premise that 100 percent of originating passengers would require check-in
Compared to facility requirements determinations at comparable airports, these assumptions are relatively conservative, and the Airport’s existing check-in facilities are sufficient to accommodate forecast demand throughout the planning period without any expansion. However, should an additional airline wish to provide service to HXD, the counter space and office currently used by TSA should be made available to the new airline.
24Federal Aviation Administration, “Advisory Circular 150/5360-9 – Planning and Design Guidelines for Airport Terminal Facilities at Non-Hub Locations,” April 4, 1980, <http://www.faa.gov/>, accessed September 20, 2010.
Table 4.3.2.1-1 Commercial Service Terminal Requirements (Square Feet) Hilton Head Island Airport
Terminal AreaExisting
(sq ft) Year
2014 2019 2029Check-In/Ticketing Counters 800 0 0 0Airline Offices
1 470 0 0 02 470 0 0 03 470 0 0 0
Baggage Makeup 1,242 1,500 0 0Gift Shop 0 600 0 0Administrative Offices 264
2,800 0 0
Executive Office 295 0 0Conference Room 0 0 0Stairwells/Elevator 0 772 0 0Lobby/Ticketing/Rental Car Queues 6,200 0 0 0Security Area 600 0 0 0Restrooms 844 844 0 0Hold Room 2,700 0 0 0Rental Car Counter 450 0 0 0Rental Car Offices 522 0 0 0Vending/Business Area 488 1,500 0 0Office 63 0 0 0Baggage Pickup 1,390 0 0 0Baggage Drop-Off 930 0 0 0Electrical Room 286 0 0 0
TOTAL 18,484 26,500 26,500 26,500Sources: Barnard Architects, September 2010. Talbert & Bright, Inc., September 2010.
• Baggage Makeup Area – Before being loaded onto aircraft, outbound baggage is sorted and loaded onto one or more carts allocated to each departing flight. At present, sorting and loading is performed in an approximately 1,242-square-foot baggage make-up area, which is open-air with only a roof, located behind the ticket counter and office space for the airlines. Based on an analysis of the current baggage make-up area, it has been determined that the area has:
Circulation problems including dangerous vehicular and pedestrian issues
Vehicular space problems causing damage to the building
Public visual issues from the secure holding area and airside apron
In addition, because of a lack of adequate office space within the terminal, the baggage make-up area is used for storage of Airport and airline files and supplies. In an effort to alleviate the current space issue, it is recommended that the baggage make-up area be expanded by approximately 1,500 square feet to allow for improved circulation and storage. This expansion would improve the visual appearance from public areas of the secure holding area and airside apron and add of an additional baggage conveyor from the ticketing area.
• Terminal Circulation – The analysis of terminal circulation identified one potential “chokepoint” within the terminal, the security screening checkpoint into the hold room. The security screening checkpoint is approximately 16 feet wide and accommodates both enplaning and deplaning passengers. The remaining areas (ticketing, lobby, rental car, and baggage claim) are spacious enough to allow the circulation of pedestrian traffic without affecting movement throughout the terminal. A level of service rating of ‘C’ or higher is recommended for passenger terminals.25 With the exception of the terminal “chokepoint,” which is expected to provide a high level of service, the existing terminal is expected to provide an adequate level of passenger circulation throughout the planning period.
• Passenger Security Screening Checkpoint – There is only one security screening checkpoint located at the entrance to the hold room for departing passengers. Based on current commercial service at HXD, no additional screening lanes are anticipated throughout the planning period. It is important to note, however, that screening lane requirements vary, depending on prevailing TSA practices; and the current configuration of the terminal building allows for an incremental expansion of screening capacity without major changes to the building. It is recommended that security screening checkpoint requirements be reassessed on an annual basis.
• Rental Car Customer Counters – Approximately 450 square feet of rental car counter frontage is provided in the terminal building, adjacent to the baggage claim area. Rental car requirements were determined based on industry standards for rental car counter requirements, and similar experience at comparative airports. The rental car space currently available is sufficient to accommodate forecast demand throughout the planning period without any expansion.
25Fruin, John J., "Pedestrian Planning and Design," Metropolitan Association of Urban Designers and Environmental Planners, New York, N.Y., 1971.
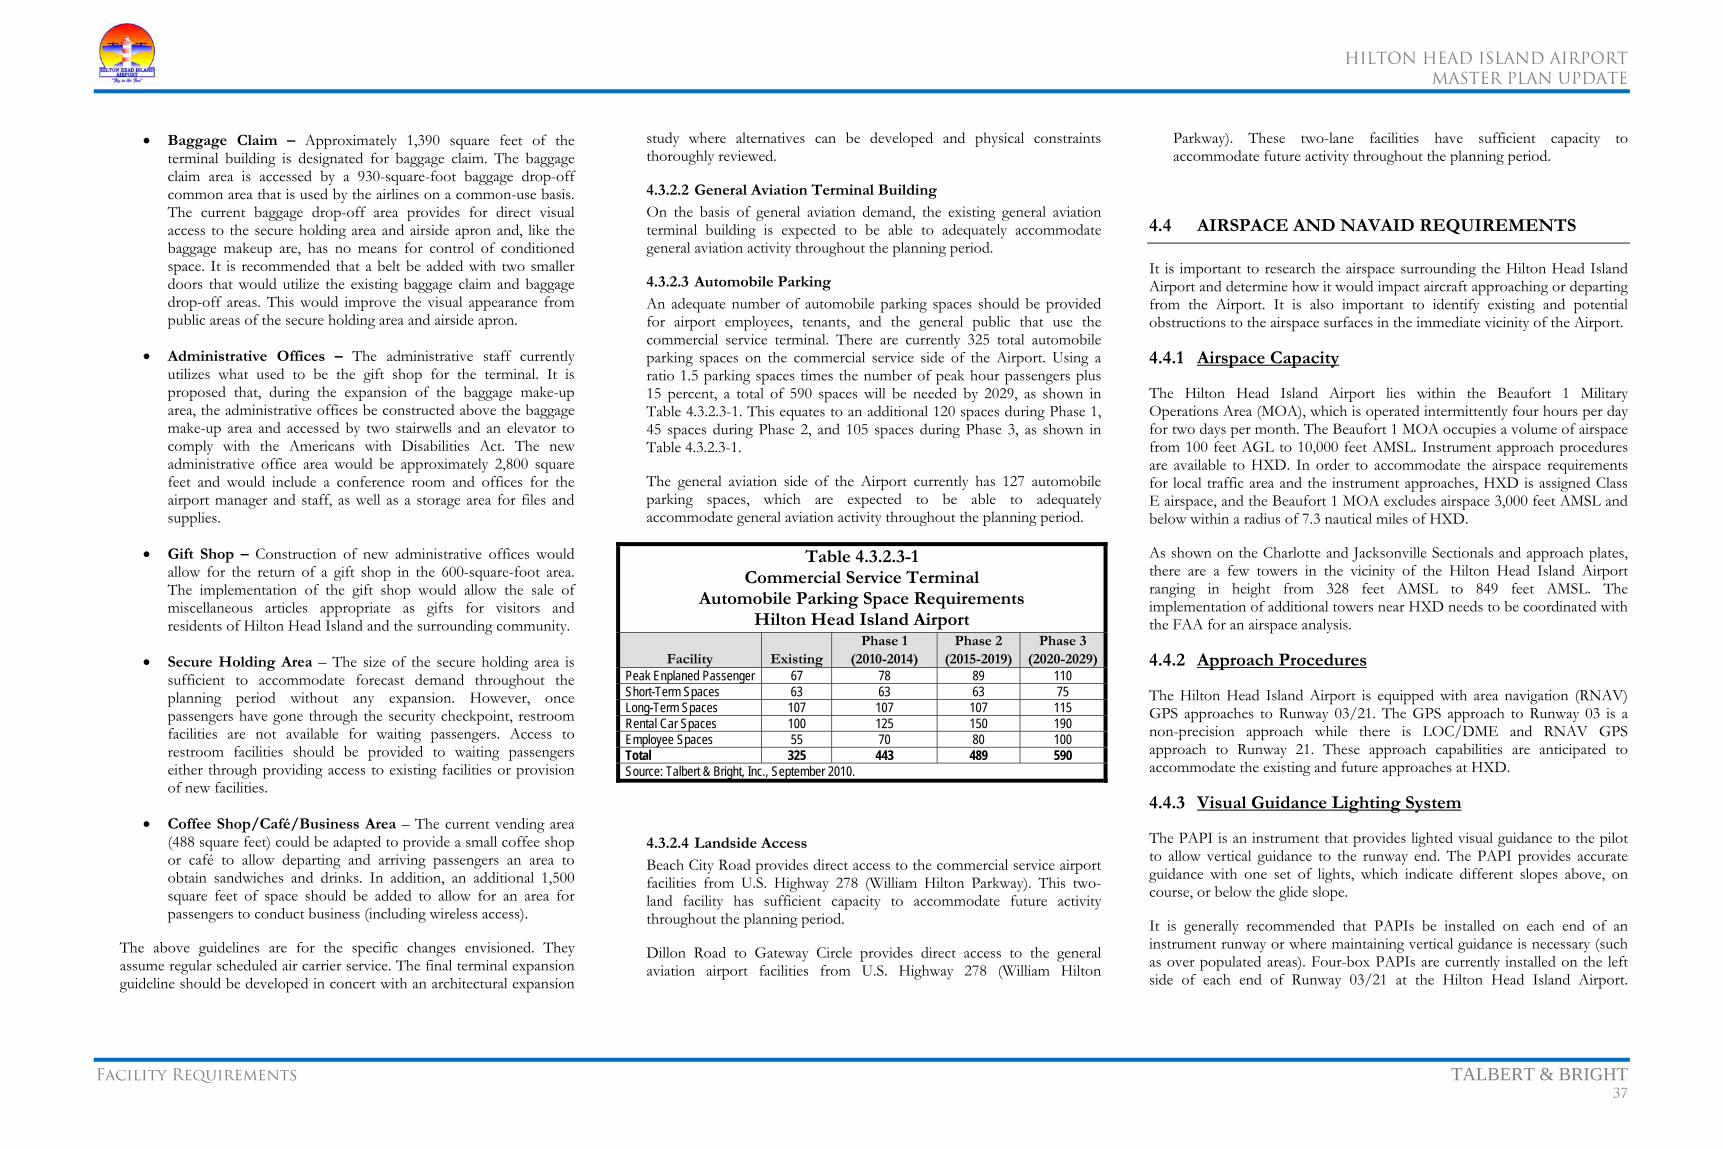
HILTON HEAD ISLAND AIRPORT
MASTER PLAN UPDATE
Facility Requirements TALBERT & BRIGHT 37
• Baggage Claim – Approximately 1,390 square feet of the terminal building is designated for baggage claim. The baggage claim area is accessed by a 930-square-foot baggage drop-off common area that is used by the airlines on a common-use basis. The current baggage drop-off area provides for direct visual access to the secure holding area and airside apron and, like the baggage makeup are, has no means for control of conditioned space. It is recommended that a belt be added with two smaller doors that would utilize the existing baggage claim and baggage drop-off areas. This would improve the visual appearance from public areas of the secure holding area and airside apron.
• Administrative Offices – The administrative staff currently utilizes what used to be the gift shop for the terminal. It is proposed that, during the expansion of the baggage make-up area, the administrative offices be constructed above the baggage make-up area and accessed by two stairwells and an elevator to comply with the Americans with Disabilities Act. The new administrative office area would be approximately 2,800 square feet and would include a conference room and offices for the airport manager and staff, as well as a storage area for files and supplies.
• Gift Shop – Construction of new administrative offices would allow for the return of a gift shop in the 600-square-foot area. The implementation of the gift shop would allow the sale of miscellaneous articles appropriate as gifts for visitors and residents of Hilton Head Island and the surrounding community.
• Secure Holding Area – The size of the secure holding area is sufficient to accommodate forecast demand throughout the planning period without any expansion. However, once passengers have gone through the security checkpoint, restroom facilities are not available for waiting passengers. Access to restroom facilities should be provided to waiting passengers either through providing access to existing facilities or provision of new facilities.
• Coffee Shop/Café/Business Area – The current vending area (488 square feet) could be adapted to provide a small coffee shop or café to allow departing and arriving passengers an area to obtain sandwiches and drinks. In addition, an additional 1,500 square feet of space should be added to allow for an area for passengers to conduct business (including wireless access).
The above guidelines are for the specific changes envisioned. They assume regular scheduled air carrier service. The final terminal expansion guideline should be developed in concert with an architectural expansion
study where alternatives can be developed and physical constraints thoroughly reviewed.
4.3.2.2 General Aviation Terminal Building
On the basis of general aviation demand, the existing general aviation terminal building is expected to be able to adequately accommodate general aviation activity throughout the planning period.
4.3.2.3 Automobile Parking
An adequate number of automobile parking spaces should be provided for airport employees, tenants, and the general public that use the commercial service terminal. There are currently 325 total automobile parking spaces on the commercial service side of the Airport. Using a ratio 1.5 parking spaces times the number of peak hour passengers plus 15 percent, a total of 590 spaces will be needed by 2029, as shown in Table 4.3.2.3-1. This equates to an additional 120 spaces during Phase 1, 45 spaces during Phase 2, and 105 spaces during Phase 3, as shown in Table 4.3.2.3-1.
The general aviation side of the Airport currently has 127 automobile parking spaces, which are expected to be able to adequately accommodate general aviation activity throughout the planning period.
Table 4.3.2.3-1 Commercial Service Terminal
Automobile Parking Space Requirements Hilton Head Island Airport
Facility ExistingPhase 1
(2010-2014)Phase 2
(2015-2019)Phase 3
(2020-2029)Peak Enplaned Passenger 67 78 89 110 Short-Term Spaces 63 63 63 75 Long-Term Spaces 107 107 107 115 Rental Car Spaces 100 125 150 190 Employee Spaces 55 70 80 100 Total 325 443 489 590 Source: Talbert & Bright, Inc., September 2010.
4.3.2.4 Landside Access
Beach City Road provides direct access to the commercial service airport facilities from U.S. Highway 278 (William Hilton Parkway). This two-land facility has sufficient capacity to accommodate future activity throughout the planning period.
Dillon Road to Gateway Circle provides direct access to the general aviation airport facilities from U.S. Highway 278 (William Hilton
Parkway). These two-lane facilities have sufficient capacity to accommodate future activity throughout the planning period.
4.4 AIRSPACE AND NAVAID REQUIREMENTS
It is important to research the airspace surrounding the Hilton Head Island Airport and determine how it would impact aircraft approaching or departing from the Airport. It is also important to identify existing and potential obstructions to the airspace surfaces in the immediate vicinity of the Airport.
4.4.1 Airspace Capacity
The Hilton Head Island Airport lies within the Beaufort 1 Military Operations Area (MOA), which is operated intermittently four hours per day for two days per month. The Beaufort 1 MOA occupies a volume of airspace from 100 feet AGL to 10,000 feet AMSL. Instrument approach procedures are available to HXD. In order to accommodate the airspace requirements for local traffic area and the instrument approaches, HXD is assigned Class E airspace, and the Beaufort 1 MOA excludes airspace 3,000 feet AMSL and below within a radius of 7.3 nautical miles of HXD.
As shown on the Charlotte and Jacksonville Sectionals and approach plates, there are a few towers in the vicinity of the Hilton Head Island Airport ranging in height from 328 feet AMSL to 849 feet AMSL. The implementation of additional towers near HXD needs to be coordinated with the FAA for an airspace analysis.
4.4.2 Approach Procedures
The Hilton Head Island Airport is equipped with area navigation (RNAV) GPS approaches to Runway 03/21. The GPS approach to Runway 03 is a non-precision approach while there is LOC/DME and RNAV GPS approach to Runway 21. These approach capabilities are anticipated to accommodate the existing and future approaches at HXD.
4.4.3 Visual Guidance Lighting System
The PAPI is an instrument that provides lighted visual guidance to the pilot to allow vertical guidance to the runway end. The PAPI provides accurate guidance with one set of lights, which indicate different slopes above, on course, or below the glide slope.
It is generally recommended that PAPIs be installed on each end of an instrument runway or where maintaining vertical guidance is necessary (such as over populated areas). Four-box PAPIs are currently installed on the left side of each end of Runway 03/21 at the Hilton Head Island Airport.
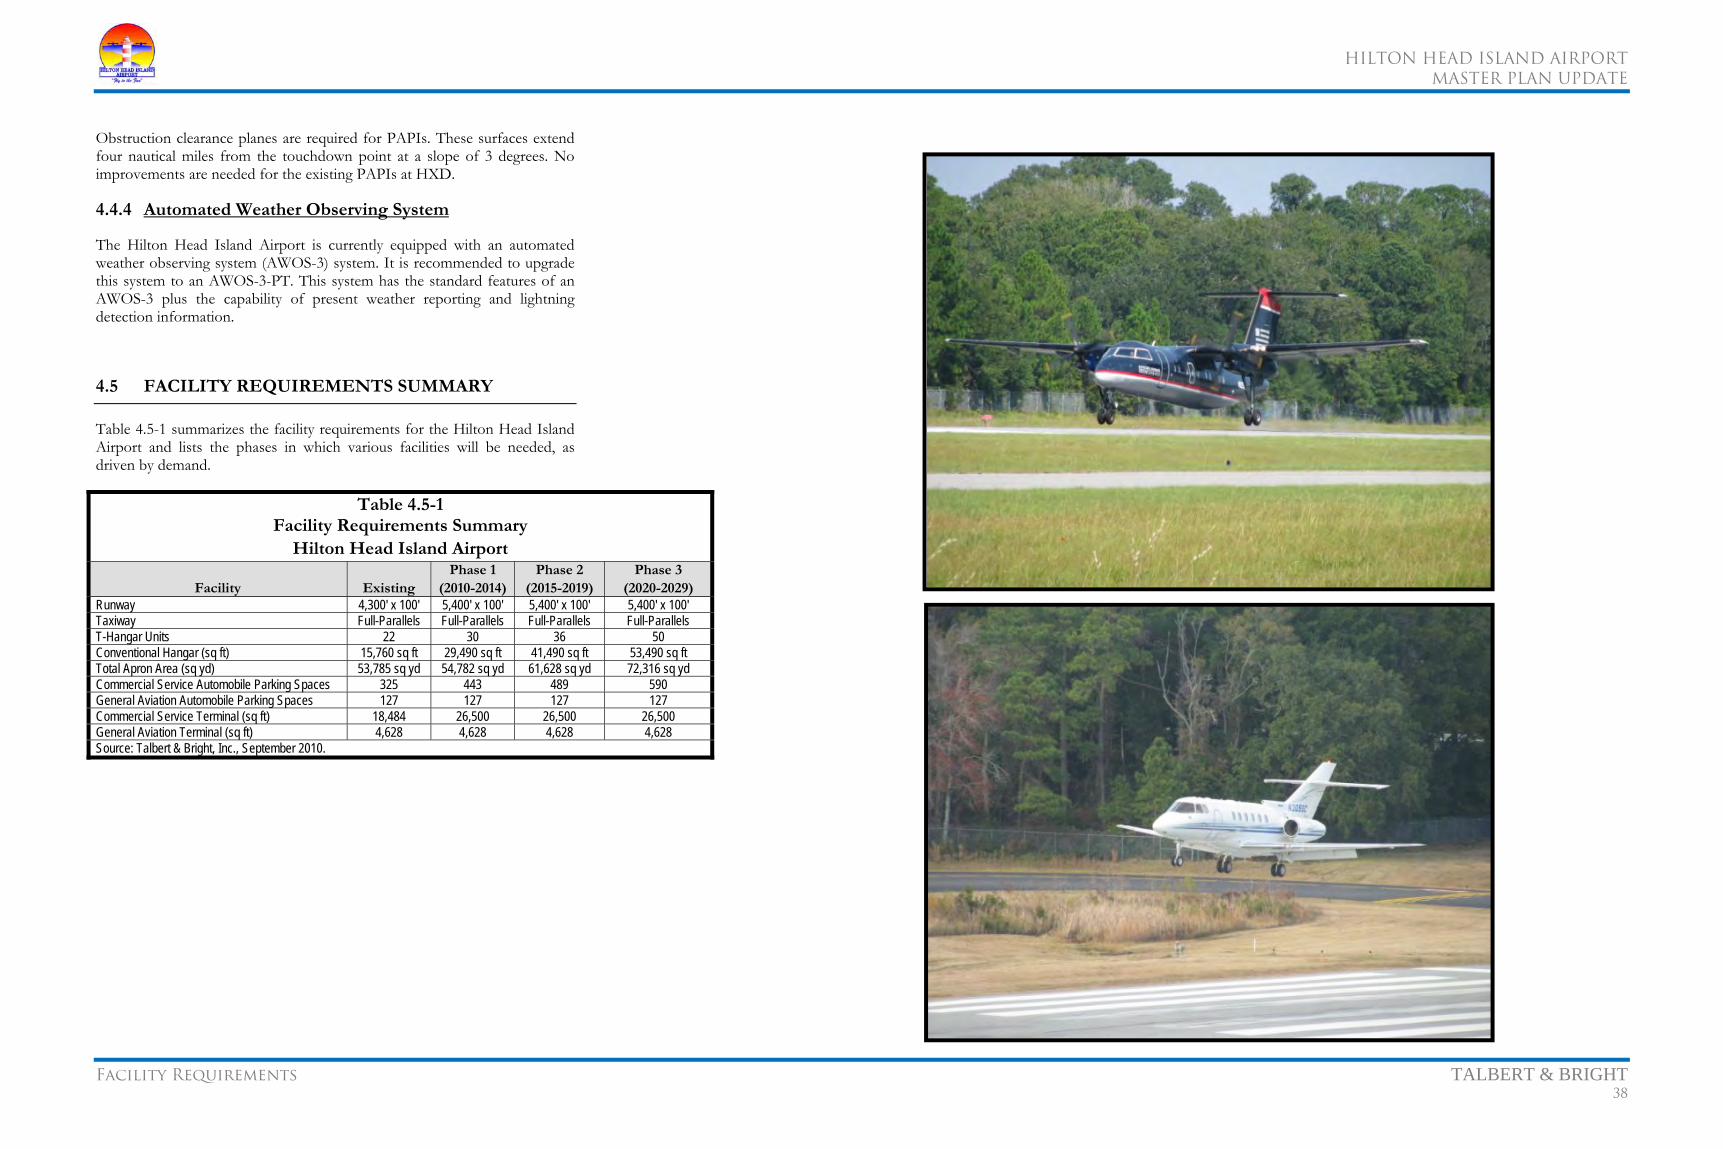
HILTON HEAD ISLAND AIRPORT
MASTER PLAN UPDATE
Facility Requirements TALBERT & BRIGHT 38
Obstruction clearance planes are required for PAPIs. These surfaces extend four nautical miles from the touchdown point at a slope of 3 degrees. No improvements are needed for the existing PAPIs at HXD.
4.4.4 Automated Weather Observing System
The Hilton Head Island Airport is currently equipped with an automated weather observing system (AWOS-3) system. It is recommended to upgrade this system to an AWOS-3-PT. This system has the standard features of an AWOS-3 plus the capability of present weather reporting and lightning detection information.
4.5 FACILITY REQUIREMENTS SUMMARY
Table 4.5-1 summarizes the facility requirements for the Hilton Head Island Airport and lists the phases in which various facilities will be needed, as driven by demand.
Table 4.5-1 Facility Requirements Summary
Hilton Head Island Airport
Facility Existing Phase 1
(2010-2014) Phase 2
(2015-2019) Phase 3
(2020-2029)Runway 4,300' x 100' 5,400' x 100' 5,400' x 100' 5,400' x 100' Taxiway Full-Parallels Full-Parallels Full-Parallels Full-Parallels T-Hangar Units 22 30 36 50 Conventional Hangar (sq ft) 15,760 sq ft 29,490 sq ft 41,490 sq ft 53,490 sq ft Total Apron Area (sq yd) 53,785 sq yd 54,782 sq yd 61,628 sq yd 72,316 sq yd Commercial Service Automobile Parking Spaces 325 443 489 590 General Aviation Automobile Parking Spaces 127 127 127 127 Commercial Service Terminal (sq ft) 18,484 26,500 26,500 26,500 General Aviation Terminal (sq ft) 4,628 4,628 4,628 4,628 Source: Talbert & Bright, Inc., September 2010.
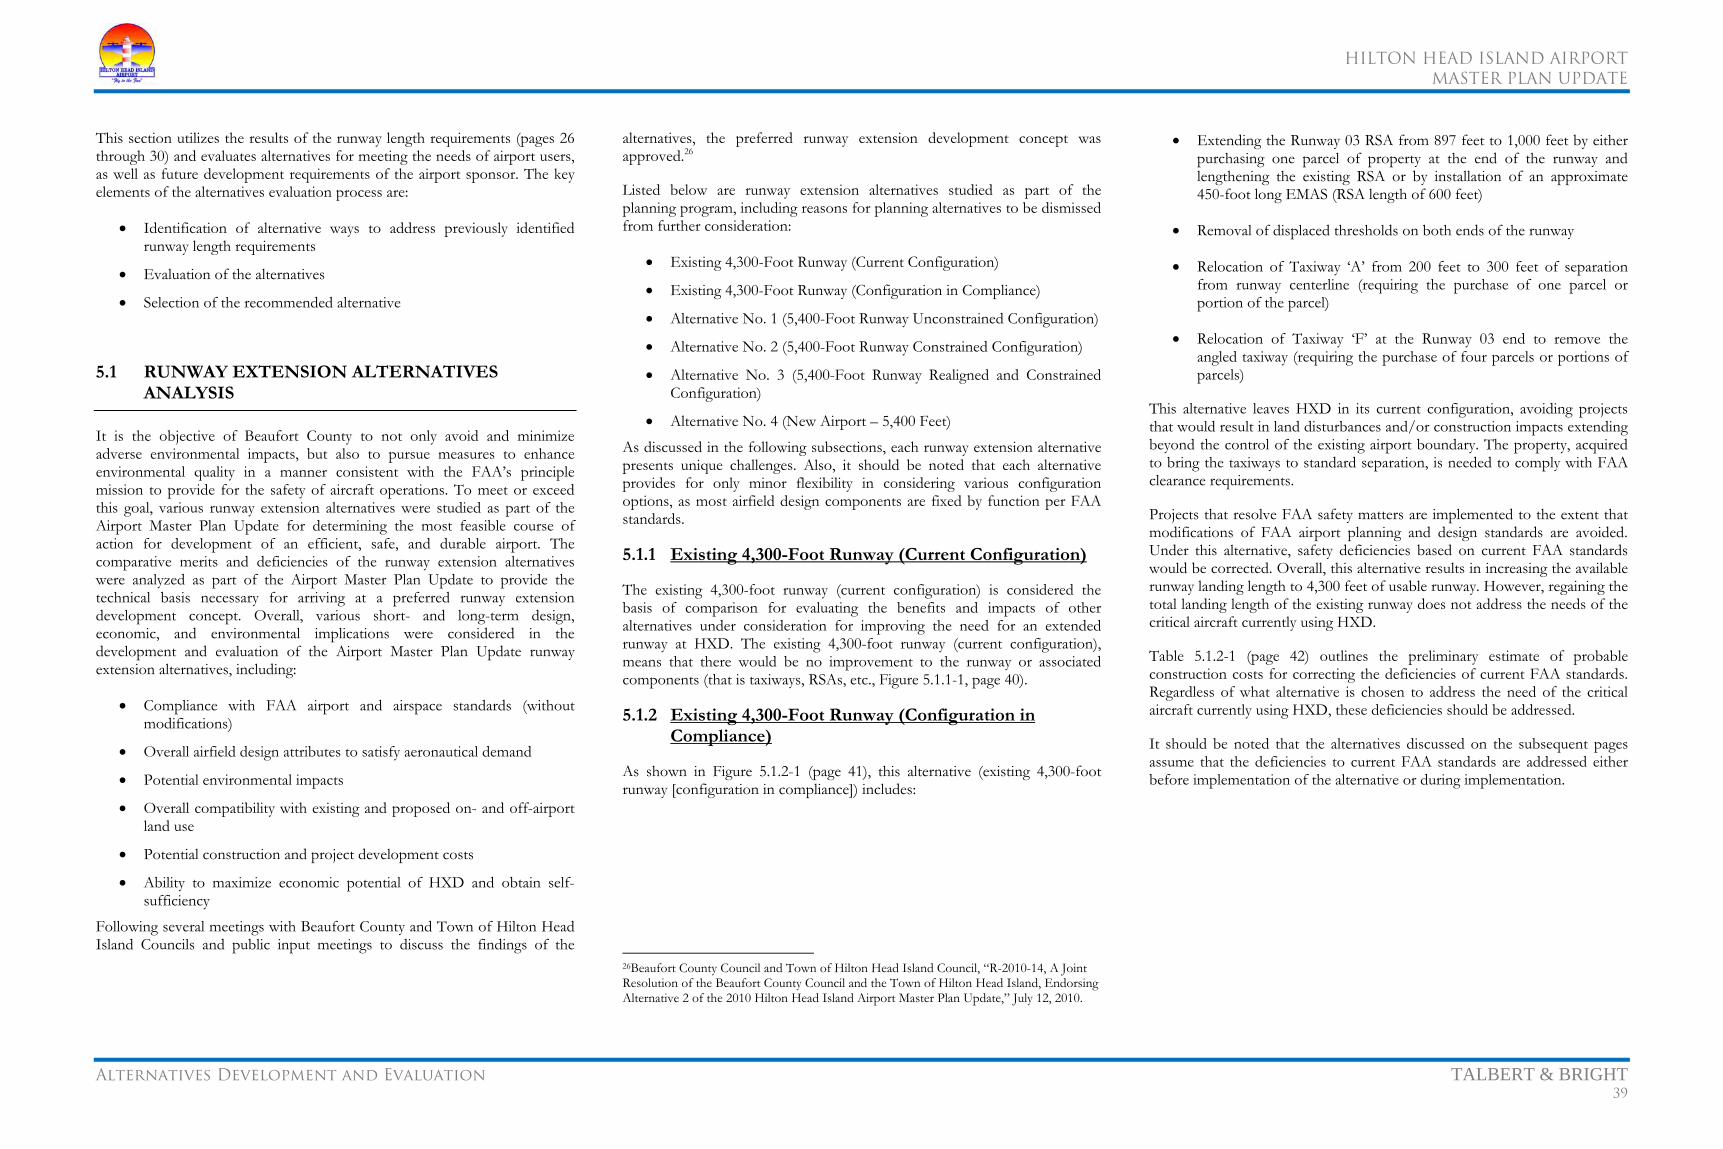
HILTON HEAD ISLAND AIRPORT
MASTER PLAN UPDATE
Alternatives Development and Evaluation TALBERT & BRIGHT 39
This section utilizes the results of the runway length requirements (pages 26 through 30) and evaluates alternatives for meeting the needs of airport users, as well as future development requirements of the airport sponsor. The key elements of the alternatives evaluation process are:
• Identification of alternative ways to address previously identified runway length requirements
• Evaluation of the alternatives
• Selection of the recommended alternative
5.1 RUNWAY EXTENSION ALTERNATIVES ANALYSIS
It is the objective of Beaufort County to not only avoid and minimize adverse environmental impacts, but also to pursue measures to enhance environmental quality in a manner consistent with the FAA’s principle mission to provide for the safety of aircraft operations. To meet or exceed this goal, various runway extension alternatives were studied as part of the Airport Master Plan Update for determining the most feasible course of action for development of an efficient, safe, and durable airport. The comparative merits and deficiencies of the runway extension alternatives were analyzed as part of the Airport Master Plan Update to provide the technical basis necessary for arriving at a preferred runway extension development concept. Overall, various short- and long-term design, economic, and environmental implications were considered in the development and evaluation of the Airport Master Plan Update runway extension alternatives, including:
• Compliance with FAA airport and airspace standards (without modifications)
• Overall airfield design attributes to satisfy aeronautical demand
• Potential environmental impacts
• Overall compatibility with existing and proposed on- and off-airport land use
• Potential construction and project development costs
• Ability to maximize economic potential of HXD and obtain self-sufficiency
Following several meetings with Beaufort County and Town of Hilton Head Island Councils and public input meetings to discuss the findings of the
alternatives, the preferred runway extension development concept was approved.26
Listed below are runway extension alternatives studied as part of the planning program, including reasons for planning alternatives to be dismissed from further consideration:
• Existing 4,300-Foot Runway (Current Configuration)
• Existing 4,300-Foot Runway (Configuration in Compliance)
• Alternative No. 1 (5,400-Foot Runway Unconstrained Configuration)
• Alternative No. 2 (5,400-Foot Runway Constrained Configuration)
• Alternative No. 3 (5,400-Foot Runway Realigned and Constrained Configuration)
• Alternative No. 4 (New Airport – 5,400 Feet)
As discussed in the following subsections, each runway extension alternative presents unique challenges. Also, it should be noted that each alternative provides for only minor flexibility in considering various configuration options, as most airfield design components are fixed by function per FAA standards.
5.1.1 Existing 4,300-Foot Runway (Current Configuration)
The existing 4,300-foot runway (current configuration) is considered the basis of comparison for evaluating the benefits and impacts of other alternatives under consideration for improving the need for an extended runway at HXD. The existing 4,300-foot runway (current configuration), means that there would be no improvement to the runway or associated components (that is taxiways, RSAs, etc., Figure 5.1.1-1, page 40).
5.1.2 Existing 4,300-Foot Runway (Configuration in Compliance)
As shown in Figure 5.1.2-1 (page 41), this alternative (existing 4,300-foot runway [configuration in compliance]) includes:
26Beaufort County Council and Town of Hilton Head Island Council, “R-2010-14, A Joint Resolution of the Beaufort County Council and the Town of Hilton Head Island, Endorsing Alternative 2 of the 2010 Hilton Head Island Airport Master Plan Update,” July 12, 2010.
• Extending the Runway 03 RSA from 897 feet to 1,000 feet by either purchasing one parcel of property at the end of the runway and lengthening the existing RSA or by installation of an approximate 450-foot long EMAS (RSA length of 600 feet)
• Removal of displaced thresholds on both ends of the runway
• Relocation of Taxiway ‘A’ from 200 feet to 300 feet of separation from runway centerline (requiring the purchase of one parcel or portion of the parcel)
• Relocation of Taxiway ‘F’ at the Runway 03 end to remove the angled taxiway (requiring the purchase of four parcels or portions of parcels)
This alternative leaves HXD in its current configuration, avoiding projects that would result in land disturbances and/or construction impacts extending beyond the control of the existing airport boundary. The property, acquired to bring the taxiways to standard separation, is needed to comply with FAA clearance requirements.
Projects that resolve FAA safety matters are implemented to the extent that modifications of FAA airport planning and design standards are avoided. Under this alternative, safety deficiencies based on current FAA standards would be corrected. Overall, this alternative results in increasing the available runway landing length to 4,300 feet of usable runway. However, regaining the total landing length of the existing runway does not address the needs of the critical aircraft currently using HXD.
Table 5.1.2-1 (page 42) outlines the preliminary estimate of probable construction costs for correcting the deficiencies of current FAA standards. Regardless of what alternative is chosen to address the need of the critical aircraft currently using HXD, these deficiencies should be addressed.
It should be noted that the alternatives discussed on the subsequent pages assume that the deficiencies to current FAA standards are addressed either before implementation of the alternative or during implementation.

HILTON HEAD ISLAND AIRPORT
MASTER PLAN UPDATE
Alternatives Development and Evaluation TALBERT & BRIGHT 40

HILTON HEAD ISLAND AIRPORT
MASTER PLAN UPDATE
Alternatives Development and Evaluation TALBERT & BRIGHT 41
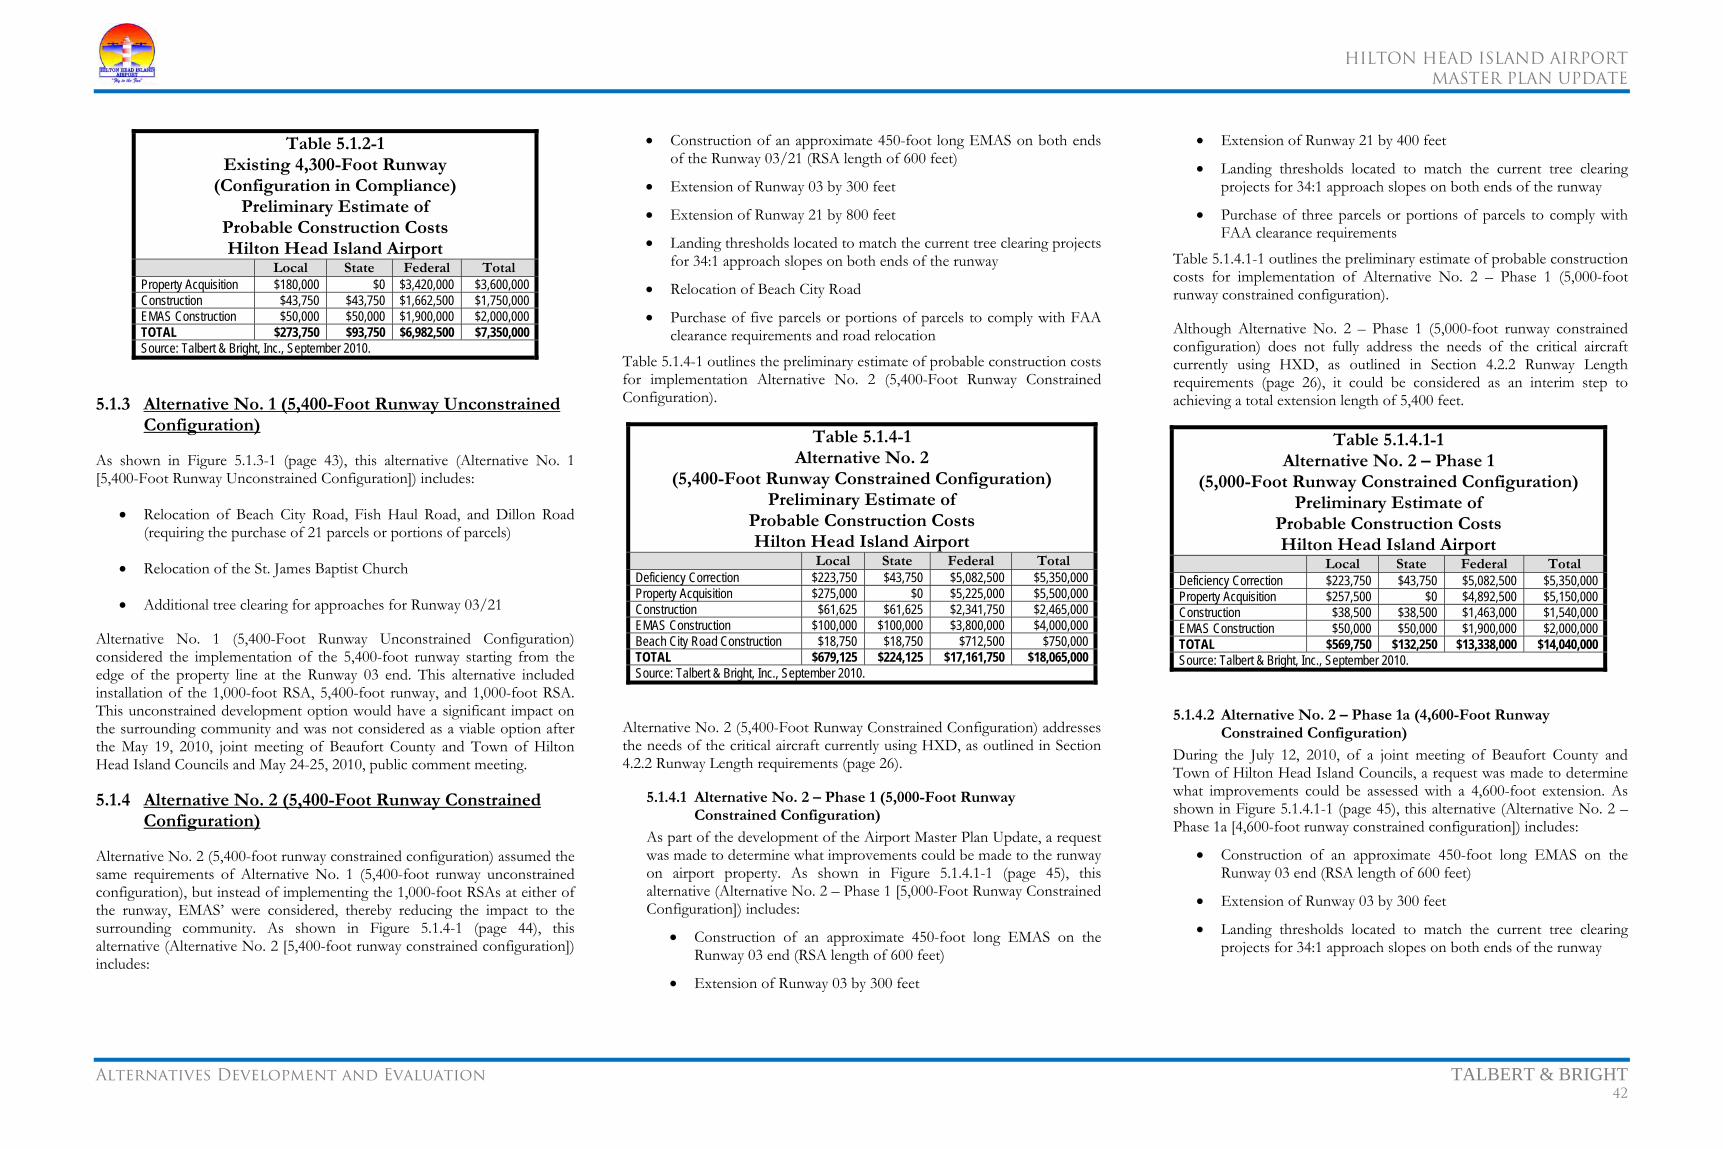
HILTON HEAD ISLAND AIRPORT
MASTER PLAN UPDATE
Alternatives Development and Evaluation TALBERT & BRIGHT 42
Table 5.1.2-1 Existing 4,300-Foot Runway
(Configuration in Compliance) Preliminary Estimate of
Probable Construction Costs Hilton Head Island Airport
Local State Federal Total Property Acquisition $180,000 $0 $3,420,000 $3,600,000 Construction $43,750 $43,750 $1,662,500 $1,750,000 EMAS Construction $50,000 $50,000 $1,900,000 $2,000,000 TOTAL $273,750 $93,750 $6,982,500 $7,350,000 Source: Talbert & Bright, Inc., September 2010.
5.1.3 Alternative No. 1 (5,400-Foot Runway Unconstrained Configuration)
As shown in Figure 5.1.3-1 (page 43), this alternative (Alternative No. 1 [5,400-Foot Runway Unconstrained Configuration]) includes:
• Relocation of Beach City Road, Fish Haul Road, and Dillon Road (requiring the purchase of 21 parcels or portions of parcels)
• Relocation of the St. James Baptist Church
• Additional tree clearing for approaches for Runway 03/21
Alternative No. 1 (5,400-Foot Runway Unconstrained Configuration) considered the implementation of the 5,400-foot runway starting from the edge of the property line at the Runway 03 end. This alternative included installation of the 1,000-foot RSA, 5,400-foot runway, and 1,000-foot RSA. This unconstrained development option would have a significant impact on the surrounding community and was not considered as a viable option after the May 19, 2010, joint meeting of Beaufort County and Town of Hilton Head Island Councils and May 24-25, 2010, public comment meeting.
5.1.4 Alternative No. 2 (5,400-Foot Runway Constrained Configuration)
Alternative No. 2 (5,400-foot runway constrained configuration) assumed the same requirements of Alternative No. 1 (5,400-foot runway unconstrained configuration), but instead of implementing the 1,000-foot RSAs at either of the runway, EMAS’ were considered, thereby reducing the impact to the surrounding community. As shown in Figure 5.1.4-1 (page 44), this alternative (Alternative No. 2 [5,400-foot runway constrained configuration]) includes:
• Construction of an approximate 450-foot long EMAS on both ends of the Runway 03/21 (RSA length of 600 feet)
• Extension of Runway 03 by 300 feet
• Extension of Runway 21 by 800 feet
• Landing thresholds located to match the current tree clearing projects for 34:1 approach slopes on both ends of the runway
• Relocation of Beach City Road
• Purchase of five parcels or portions of parcels to comply with FAA clearance requirements and road relocation
Table 5.1.4-1 outlines the preliminary estimate of probable construction costs for implementation Alternative No. 2 (5,400-Foot Runway Constrained Configuration).
Table 5.1.4-1 Alternative No. 2
(5,400-Foot Runway Constrained Configuration) Preliminary Estimate of
Probable Construction Costs Hilton Head Island Airport
Local State Federal TotalDeficiency Correction $223,750 $43,750 $5,082,500 $5,350,000 Property Acquisition $275,000 $0 $5,225,000 $5,500,000 Construction $61,625 $61,625 $2,341,750 $2,465,000 EMAS Construction $100,000 $100,000 $3,800,000 $4,000,000 Beach City Road Construction $18,750 $18,750 $712,500 $750,000 TOTAL $679,125 $224,125 $17,161,750 $18,065,000 Source: Talbert & Bright, Inc., September 2010.
Alternative No. 2 (5,400-Foot Runway Constrained Configuration) addresses the needs of the critical aircraft currently using HXD, as outlined in Section 4.2.2 Runway Length requirements (page 26).
5.1.4.1 Alternative No. 2 – Phase 1 (5,000-Foot Runway Constrained Configuration)
As part of the development of the Airport Master Plan Update, a request was made to determine what improvements could be made to the runway on airport property. As shown in Figure 5.1.4.1-1 (page 45), this alternative (Alternative No. 2 – Phase 1 [5,000-Foot Runway Constrained Configuration]) includes:
• Construction of an approximate 450-foot long EMAS on the Runway 03 end (RSA length of 600 feet)
• Extension of Runway 03 by 300 feet
• Extension of Runway 21 by 400 feet
• Landing thresholds located to match the current tree clearing projects for 34:1 approach slopes on both ends of the runway
• Purchase of three parcels or portions of parcels to comply with FAA clearance requirements
Table 5.1.4.1-1 outlines the preliminary estimate of probable construction costs for implementation of Alternative No. 2 – Phase 1 (5,000-foot runway constrained configuration).
Although Alternative No. 2 – Phase 1 (5,000-foot runway constrained configuration) does not fully address the needs of the critical aircraft currently using HXD, as outlined in Section 4.2.2 Runway Length requirements (page 26), it could be considered as an interim step to achieving a total extension length of 5,400 feet.
Table 5.1.4.1-1 Alternative No. 2 – Phase 1
(5,000-Foot Runway Constrained Configuration) Preliminary Estimate of
Probable Construction Costs Hilton Head Island Airport
Local State Federal TotalDeficiency Correction $223,750 $43,750 $5,082,500 $5,350,000 Property Acquisition $257,500 $0 $4,892,500 $5,150,000 Construction $38,500 $38,500 $1,463,000 $1,540,000 EMAS Construction $50,000 $50,000 $1,900,000 $2,000,000 TOTAL $569,750 $132,250 $13,338,000 $14,040,000 Source: Talbert & Bright, Inc., September 2010.
5.1.4.2 Alternative No. 2 – Phase 1a (4,600-Foot Runway Constrained Configuration)
During the July 12, 2010, of a joint meeting of Beaufort County and Town of Hilton Head Island Councils, a request was made to determine what improvements could be assessed with a 4,600-foot extension. As shown in Figure 5.1.4.1-1 (page 45), this alternative (Alternative No. 2 – Phase 1a [4,600-foot runway constrained configuration]) includes:
• Construction of an approximate 450-foot long EMAS on the Runway 03 end (RSA length of 600 feet)
• Extension of Runway 03 by 300 feet
• Landing thresholds located to match the current tree clearing projects for 34:1 approach slopes on both ends of the runway

HILTON HEAD ISLAND AIRPORT
MASTER PLAN UPDATE
Alternatives Development and Evaluation TALBERT & BRIGHT 43
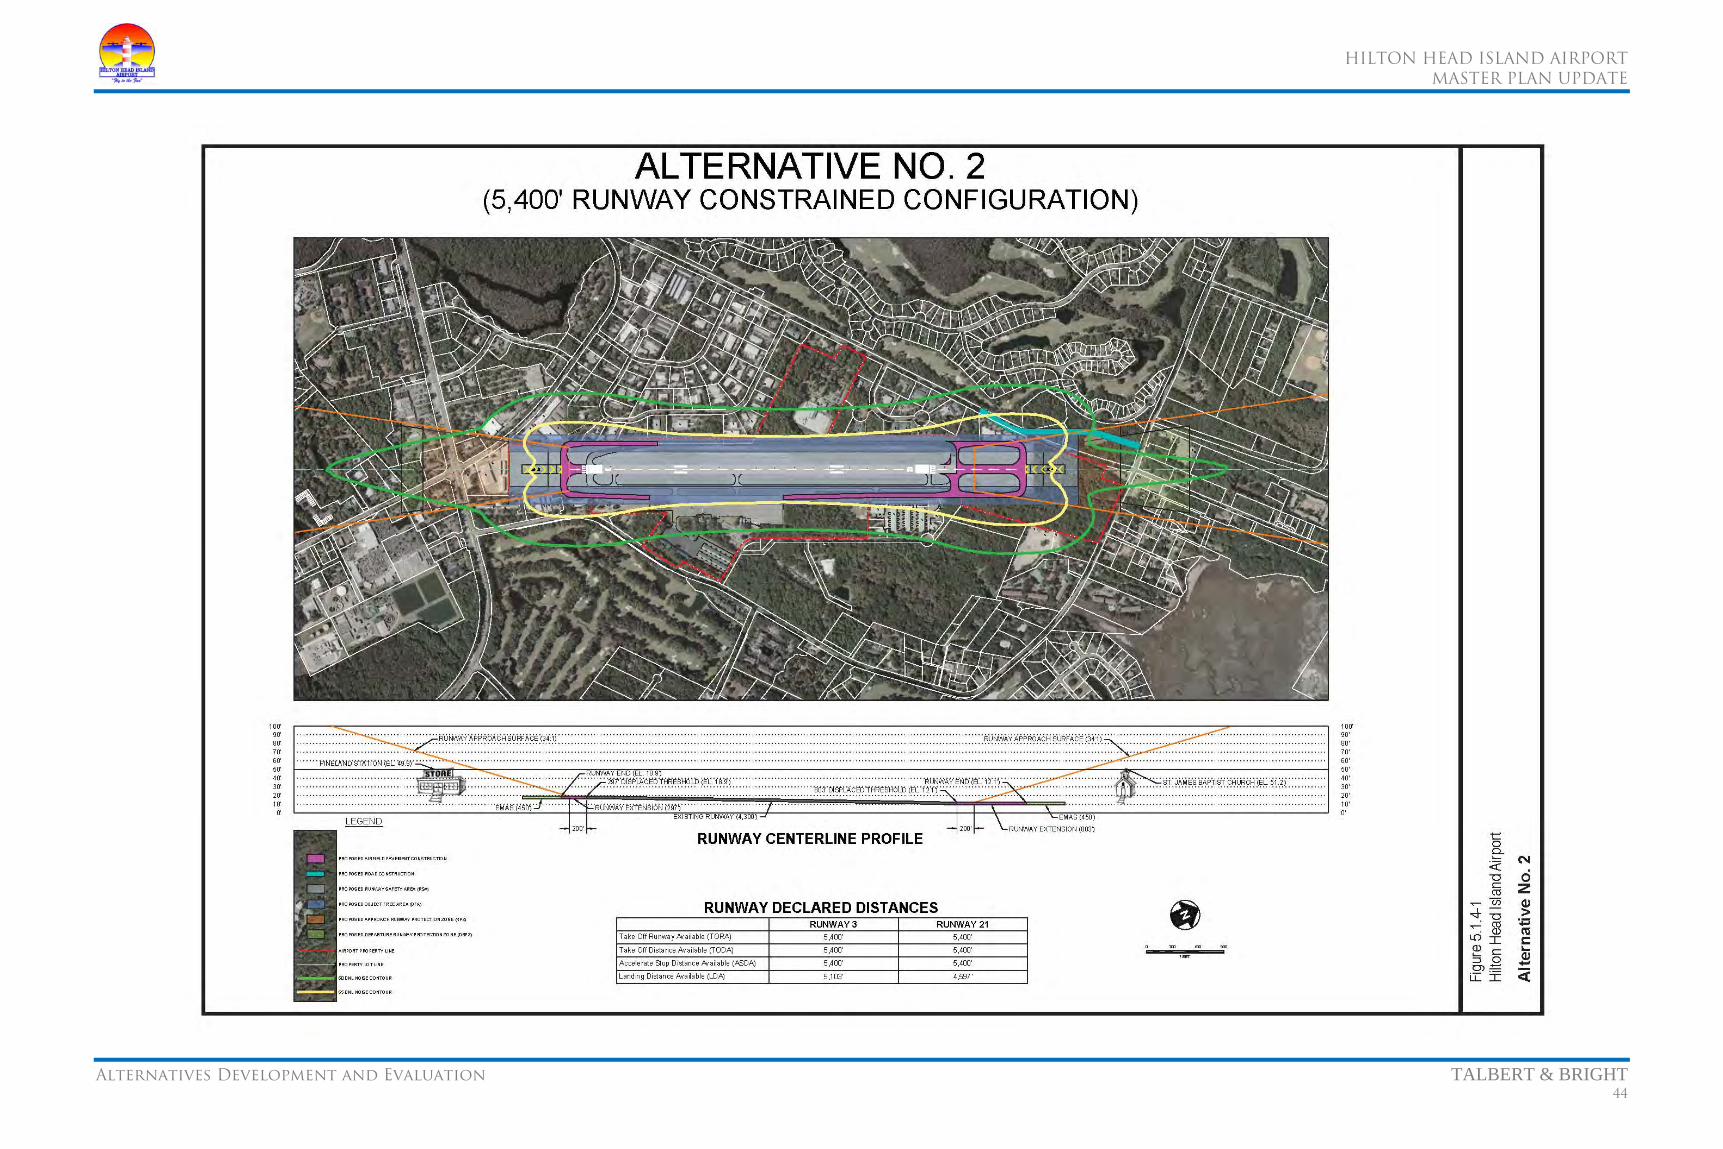
HILTON HEAD ISLAND AIRPORT
MASTER PLAN UPDATE
Alternatives Development and Evaluation TALBERT & BRIGHT 44
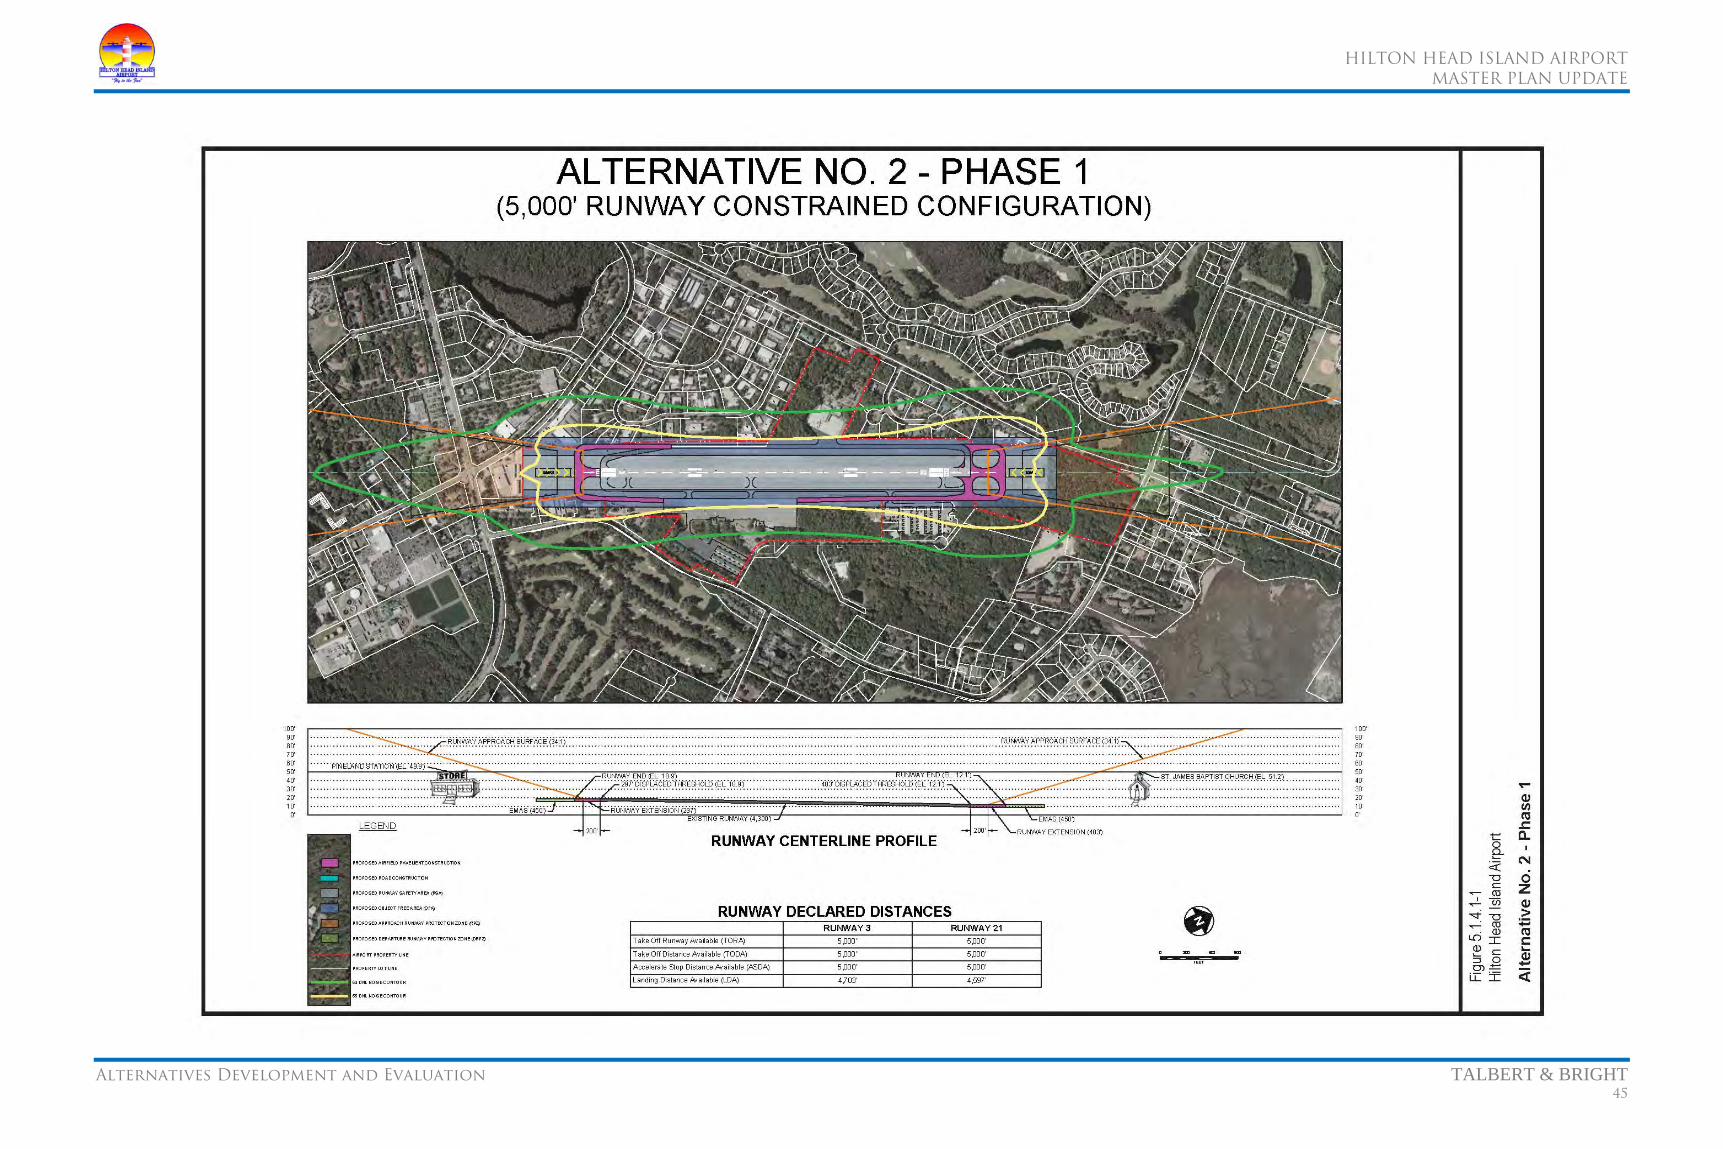
HILTON HEAD ISLAND AIRPORT
MASTER PLAN UPDATE
Alternatives Development and Evaluation TALBERT & BRIGHT 45
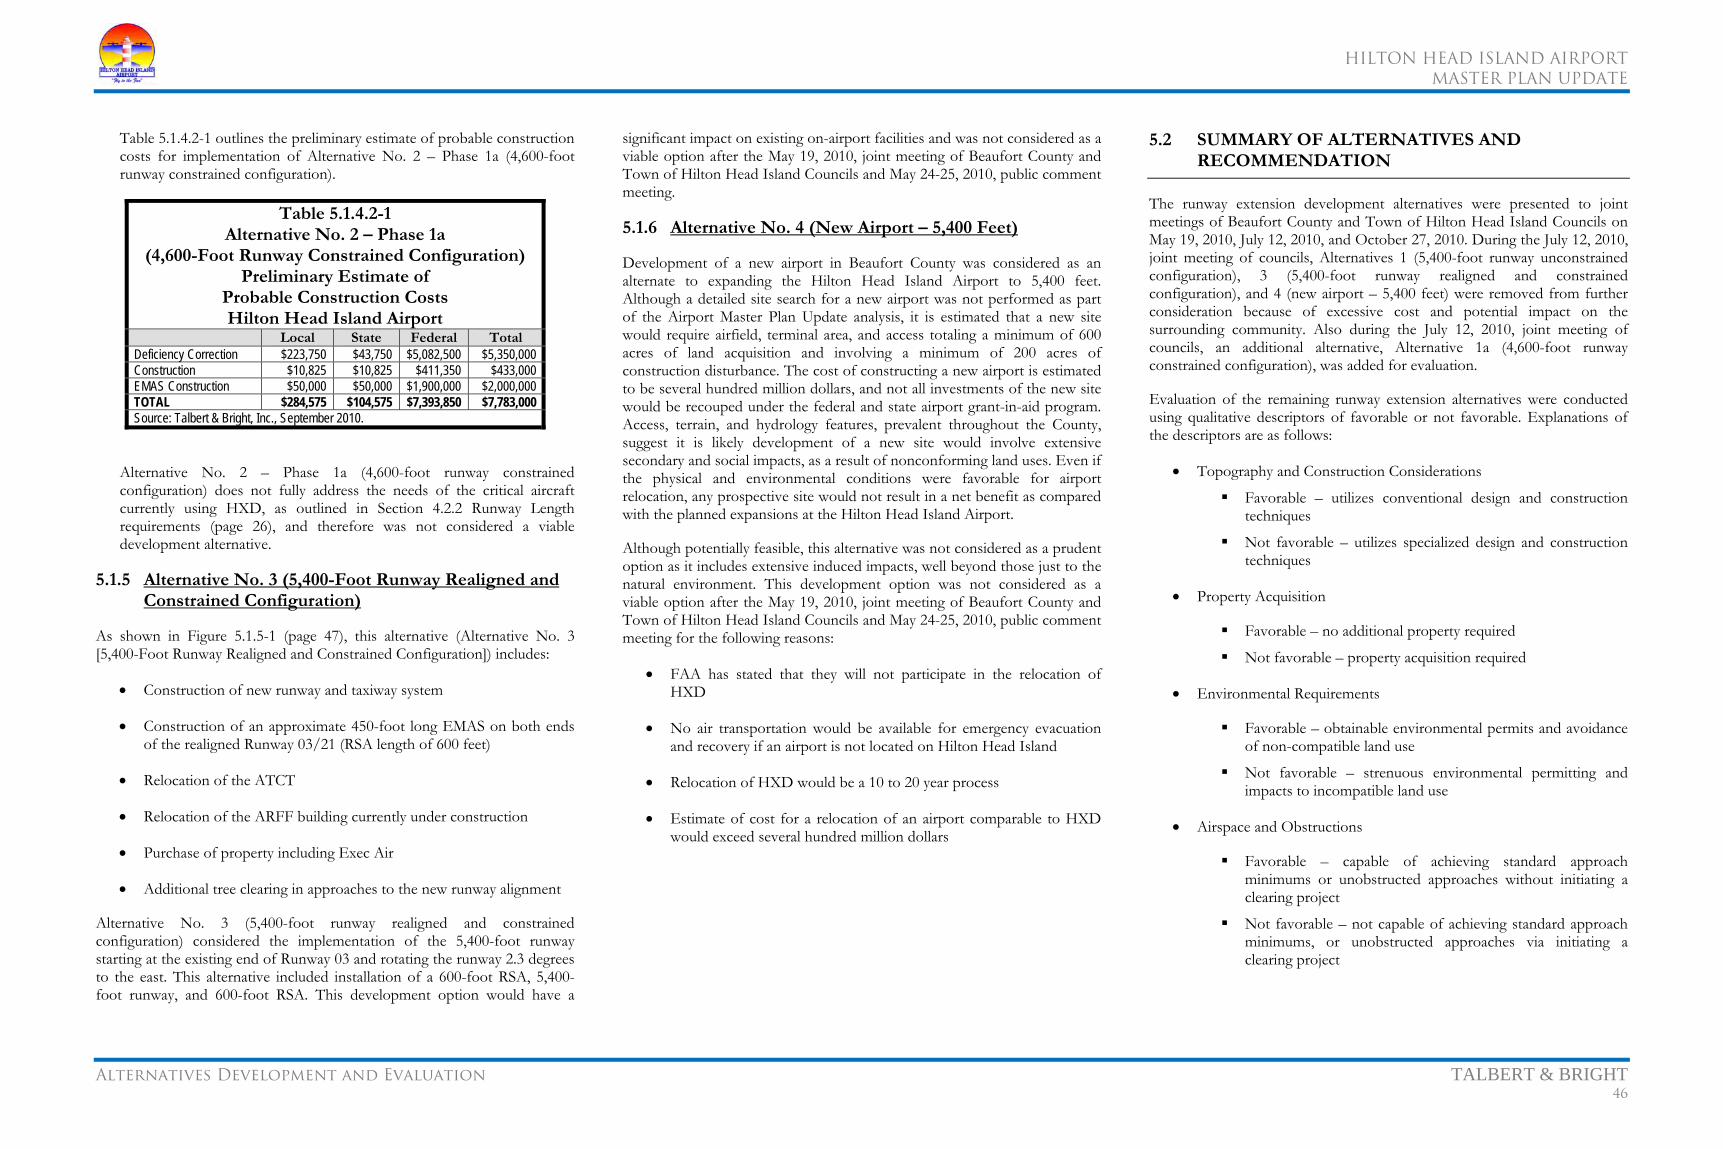
HILTON HEAD ISLAND AIRPORT
MASTER PLAN UPDATE
Alternatives Development and Evaluation TALBERT & BRIGHT 46
Table 5.1.4.2-1 outlines the preliminary estimate of probable construction costs for implementation of Alternative No. 2 – Phase 1a (4,600-foot runway constrained configuration).
Table 5.1.4.2-1 Alternative No. 2 – Phase 1a
(4,600-Foot Runway Constrained Configuration) Preliminary Estimate of
Probable Construction Costs Hilton Head Island Airport
Local State Federal Total Deficiency Correction $223,750 $43,750 $5,082,500 $5,350,000 Construction $10,825 $10,825 $411,350 $433,000 EMAS Construction $50,000 $50,000 $1,900,000 $2,000,000 TOTAL $284,575 $104,575 $7,393,850 $7,783,000 Source: Talbert & Bright, Inc., September 2010.
Alternative No. 2 – Phase 1a (4,600-foot runway constrained configuration) does not fully address the needs of the critical aircraft currently using HXD, as outlined in Section 4.2.2 Runway Length requirements (page 26), and therefore was not considered a viable development alternative.
5.1.5 Alternative No. 3 (5,400-Foot Runway Realigned and Constrained Configuration)
As shown in Figure 5.1.5-1 (page 47), this alternative (Alternative No. 3 [5,400-Foot Runway Realigned and Constrained Configuration]) includes:
• Construction of new runway and taxiway system
• Construction of an approximate 450-foot long EMAS on both ends of the realigned Runway 03/21 (RSA length of 600 feet)
• Relocation of the ATCT
• Relocation of the ARFF building currently under construction
• Purchase of property including Exec Air
• Additional tree clearing in approaches to the new runway alignment
Alternative No. 3 (5,400-foot runway realigned and constrained configuration) considered the implementation of the 5,400-foot runway starting at the existing end of Runway 03 and rotating the runway 2.3 degrees to the east. This alternative included installation of a 600-foot RSA, 5,400-foot runway, and 600-foot RSA. This development option would have a
significant impact on existing on-airport facilities and was not considered as a viable option after the May 19, 2010, joint meeting of Beaufort County and Town of Hilton Head Island Councils and May 24-25, 2010, public comment meeting.
5.1.6 Alternative No. 4 (New Airport – 5,400 Feet)
Development of a new airport in Beaufort County was considered as an alternate to expanding the Hilton Head Island Airport to 5,400 feet. Although a detailed site search for a new airport was not performed as part of the Airport Master Plan Update analysis, it is estimated that a new site would require airfield, terminal area, and access totaling a minimum of 600 acres of land acquisition and involving a minimum of 200 acres of construction disturbance. The cost of constructing a new airport is estimated to be several hundred million dollars, and not all investments of the new site would be recouped under the federal and state airport grant-in-aid program. Access, terrain, and hydrology features, prevalent throughout the County, suggest it is likely development of a new site would involve extensive secondary and social impacts, as a result of nonconforming land uses. Even if the physical and environmental conditions were favorable for airport relocation, any prospective site would not result in a net benefit as compared with the planned expansions at the Hilton Head Island Airport.
Although potentially feasible, this alternative was not considered as a prudent option as it includes extensive induced impacts, well beyond those just to the natural environment. This development option was not considered as a viable option after the May 19, 2010, joint meeting of Beaufort County and Town of Hilton Head Island Councils and May 24-25, 2010, public comment meeting for the following reasons:
• FAA has stated that they will not participate in the relocation of HXD
• No air transportation would be available for emergency evacuation and recovery if an airport is not located on Hilton Head Island
• Relocation of HXD would be a 10 to 20 year process
• Estimate of cost for a relocation of an airport comparable to HXD would exceed several hundred million dollars
5.2 SUMMARY OF ALTERNATIVES AND RECOMMENDATION
The runway extension development alternatives were presented to joint meetings of Beaufort County and Town of Hilton Head Island Councils on May 19, 2010, July 12, 2010, and October 27, 2010. During the July 12, 2010, joint meeting of councils, Alternatives 1 (5,400-foot runway unconstrained configuration), 3 (5,400-foot runway realigned and constrained configuration), and 4 (new airport – 5,400 feet) were removed from further consideration because of excessive cost and potential impact on the surrounding community. Also during the July 12, 2010, joint meeting of councils, an additional alternative, Alternative 1a (4,600-foot runway constrained configuration), was added for evaluation.
Evaluation of the remaining runway extension alternatives were conducted using qualitative descriptors of favorable or not favorable. Explanations of the descriptors are as follows:
• Topography and Construction Considerations
Favorable – utilizes conventional design and construction techniques
Not favorable – utilizes specialized design and construction techniques
• Property Acquisition
Favorable – no additional property required
Not favorable – property acquisition required
• Environmental Requirements
Favorable – obtainable environmental permits and avoidance of non-compatible land use
Not favorable – strenuous environmental permitting and impacts to incompatible land use
• Airspace and Obstructions
Favorable – capable of achieving standard approach minimums or unobstructed approaches without initiating a clearing project
Not favorable – not capable of achieving standard approach minimums, or unobstructed approaches via initiating a clearing project

HILTON HEAD ISLAND AIRPORT
MASTER PLAN UPDATE
Alternatives Development and Evaluation TALBERT & BRIGHT 47

HILTON HEAD ISLAND AIRPORT
MASTER PLAN UPDATE
Alternatives Development and Evaluation TALBERT & BRIGHT 48
• Wind Coverage
Favorable – 95 percent wind coverage for a single runway (10.5 knots)
Not favorable – less than 95 percent wind coverage for a single runway (10.5 knots
• Satisfies Aeronautical Demand
Favorable – meets runway requirements for critical aircraft
Not favorable – does not meet runway requirements of critical aircraft
Table 5.2-1 illustrates each of the analysis criteria and its descriptor. Table 5.2-2 illustrates a preliminary project cost comparison.
Table 5.2-1 Runway Analysis Matrix
Hilton Head Island Airport
Preliminary Costs Runway Length
4,300 Feet 4,600 Feet 5,000 Feet 5,400 Feet Topographic and Construction Considerations
F F F F
Property Acquisition N N N N Environmental Requirements F F F F Airspace and Obstructions F F F F Wind Coverage N N N N Satisfies Aeronautical Demand
N N N F
F = Favorable N = Not favorable Source: Talbert & Bright, Inc., November 2010.
Of the runway extension alternatives considered as part this Master Plan Update, the Alternative 2 (5,400-foot runway constrained configuration, including Phase 1) was recommended for implementation. This recommendation was approved on October 27, 2010, during a joint council meeting of Beaufort County and Town of Hilton Head Island Councils.27,28,29,30
27Beaufort County Council and Town Council of the Town of Hilton Head Island, “Resolution R-2101-23, A Joint Resolution of the Beaufort County Council and the town Council for the Town of Hilton Head Island, South Carolina Adopting the 2010 Hilton Head Island Airport Master Plan Update and Directing Staff to begin to Implement the Plan,” approved October 27, 2010.
Table 5.2-2 Alternative Runway Lengths
Preliminary Project Cost Estimate Summary Hilton Head Island Airport
Preliminary CostsRunway Length
4,300 Feet 4,600 Feet 5,000 Feet 5,400 FeetLand Acquisition $3,600,000 $3,600,000 $8,750,000 $9,100,000 Construction (includes design) $1,750,000 $2,183,000 $3,290,000 $4,215,000 EMAS $2,000,000 $2,000,000 $2,000,000 $4,000,000 Beach City Road Relocation $0 $0 $0 $750,000 BCA/EA $0 $500,000 $500,000 $500,000 Environmental Mitigation/ Litigation (estimated)
$291,000 $364,000 $550,000 $705,000
Total $7,641,000 $8,647,000 $15,090,000 $19,270,000 4,300' vs. Extension Options $1,006,000 $7,449,000 $11,629,000 Incremental Costs $1,006,000 $6,443,000 $4,180,000 Source: Talbert & Bright, Inc., November 2010.
The most important element of the Master Plan Update for the long-term development of the Hilton Head Island Airport was the extension of Runway 03/21. Because the landside development is currently on the east and west side of the runway, the length and orientation of the runway were first determined prior to outlining the needs of the commercial service (west side of the runway) and general aviation (east side of the runway). Landside development of the Hilton Head Island Airport is described in Section 4.3 – Facility Requirements (page 32).
28Beaufort County Council, “Resolution R-2101-21, A Resolution of Beaufort County Council to Provide for a Runway Length of 5,000 Linear Feet at the Hilton Head Island Airport,” approved October 27, 2010. 29Town of Hilton Head Island Council, “Resolution 2010-24, A Resolution of the Town Council for the Town of Hilton Head Island, South Carolina Directing the Town Manager to Begin the Process of Amending LMO Section 16-4-1307 to Provide for a Runway Length of 5,000 Linear Feet,” approved October 27, 2010. 30Beaufort County Council, “Resolution R-2101-22, A Resolution,” approved October 27, 2010.
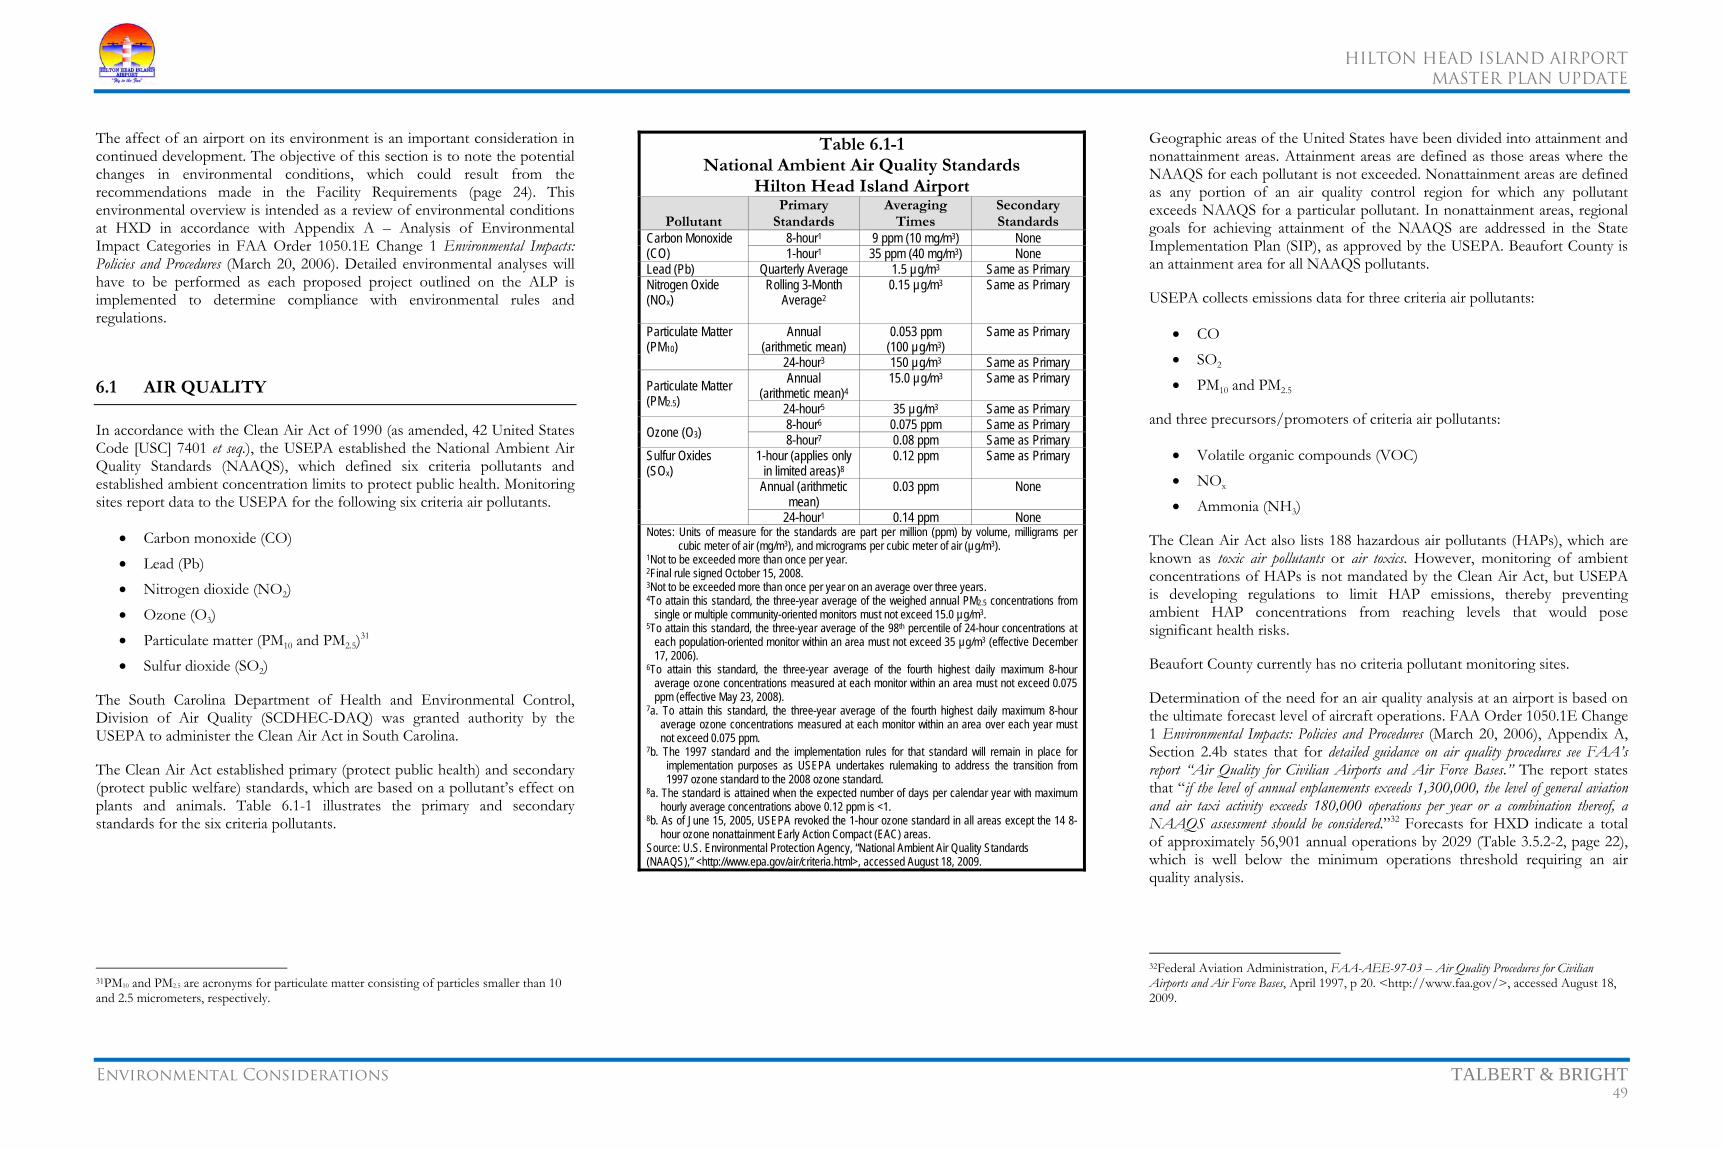
HILTON HEAD ISLAND AIRPORT
MASTER PLAN UPDATE
Environmental Considerations TALBERT & BRIGHT 49
The affect of an airport on its environment is an important consideration in continued development. The objective of this section is to note the potential changes in environmental conditions, which could result from the recommendations made in the Facility Requirements (page 24). This environmental overview is intended as a review of environmental conditions at HXD in accordance with Appendix A – Analysis of Environmental Impact Categories in FAA Order 1050.1E Change 1 Environmental Impacts: Policies and Procedures (March 20, 2006). Detailed environmental analyses will have to be performed as each proposed project outlined on the ALP is implemented to determine compliance with environmental rules and regulations.
6.1 AIR QUALITY
In accordance with the Clean Air Act of 1990 (as amended, 42 United States Code [USC] 7401 et seq.), the USEPA established the National Ambient Air Quality Standards (NAAQS), which defined six criteria pollutants and established ambient concentration limits to protect public health. Monitoring sites report data to the USEPA for the following six criteria air pollutants.
• Carbon monoxide (CO) • Lead (Pb) • Nitrogen dioxide (NO2) • Ozone (O3) • Particulate matter (PM10 and PM2.5)31 • Sulfur dioxide (SO2)
The South Carolina Department of Health and Environmental Control, Division of Air Quality (SCDHEC-DAQ) was granted authority by the USEPA to administer the Clean Air Act in South Carolina.
The Clean Air Act established primary (protect public health) and secondary (protect public welfare) standards, which are based on a pollutant’s effect on plants and animals. Table 6.1-1 illustrates the primary and secondary standards for the six criteria pollutants.
31PM10 and PM2.5 are acronyms for particulate matter consisting of particles smaller than 10 and 2.5 micrometers, respectively.
Table 6.1-1 National Ambient Air Quality Standards
Hilton Head Island Airport
PollutantPrimary
StandardsAveraging
TimesSecondary Standards
Carbon Monoxide (CO)
8-hour1 9 ppm (10 mg/m3) None 1-hour1 35 ppm (40 mg/m3) None
Lead (Pb) Quarterly Average 1.5 µg/m3 Same as Primary Nitrogen Oxide (NOx)
Rolling 3-Month Average2
0.15 µg/m3 Same as Primary
Particulate Matter (PM10)
Annual (arithmetic mean)
0.053 ppm (100 µg/m3)
Same as Primary
24-hour3 150 µg/m3 Same as Primary
Particulate Matter (PM2.5)
Annual (arithmetic mean)4
15.0 µg/m3 Same as Primary
24-hour5 35 µg/m3 Same as Primary
Ozone (O3) 8-hour6 0.075 ppm Same as Primary 8-hour7 0.08 ppm Same as Primary
Sulfur Oxides (SOx)
1-hour (applies only in limited areas)8
0.12 ppm Same as Primary
Annual (arithmetic mean)
0.03 ppm None
24-hour1 0.14 ppm None Notes: Units of measure for the standards are part per million (ppm) by volume, milligrams per
cubic meter of air (mg/m3), and micrograms per cubic meter of air (µg/m3). 1Not to be exceeded more than once per year. 2Final rule signed October 15, 2008. 3Not to be exceeded more than once per year on an average over three years. 4To attain this standard, the three-year average of the weighed annual PM2.5 concentrations from
single or multiple community-oriented monitors must not exceed 15.0 µg/m3. 5To attain this standard, the three-year average of the 98th percentile of 24-hour concentrations at
each population-oriented monitor within an area must not exceed 35 µg/m3 (effective December 17, 2006).
6To attain this standard, the three-year average of the fourth highest daily maximum 8-hour average ozone concentrations measured at each monitor within an area must not exceed 0.075 ppm (effective May 23, 2008).
7a. To attain this standard, the three-year average of the fourth highest daily maximum 8-hour average ozone concentrations measured at each monitor within an area over each year must not exceed 0.075 ppm.
7b. The 1997 standard and the implementation rules for that standard will remain in place for implementation purposes as USEPA undertakes rulemaking to address the transition from 1997 ozone standard to the 2008 ozone standard.
8a. The standard is attained when the expected number of days per calendar year with maximum hourly average concentrations above 0.12 ppm is <1.
8b. As of June 15, 2005, USEPA revoked the 1-hour ozone standard in all areas except the 14 8-hour ozone nonattainment Early Action Compact (EAC) areas.
Source: U.S. Environmental Protection Agency, “National Ambient Air Quality Standards (NAAQS),” <http://www.epa.gov/air/criteria.html>, accessed August 18, 2009.
Geographic areas of the United States have been divided into attainment and nonattainment areas. Attainment areas are defined as those areas where the NAAQS for each pollutant is not exceeded. Nonattainment areas are defined as any portion of an air quality control region for which any pollutant exceeds NAAQS for a particular pollutant. In nonattainment areas, regional goals for achieving attainment of the NAAQS are addressed in the State Implementation Plan (SIP), as approved by the USEPA. Beaufort County is an attainment area for all NAAQS pollutants.
USEPA collects emissions data for three criteria air pollutants:
• CO • SO2 • PM10 and PM2.5
and three precursors/promoters of criteria air pollutants:
• Volatile organic compounds (VOC) • NOx • Ammonia (NH3)
The Clean Air Act also lists 188 hazardous air pollutants (HAPs), which are known as toxic air pollutants or air toxics. However, monitoring of ambient concentrations of HAPs is not mandated by the Clean Air Act, but USEPA is developing regulations to limit HAP emissions, thereby preventing ambient HAP concentrations from reaching levels that would pose significant health risks.
Beaufort County currently has no criteria pollutant monitoring sites.
Determination of the need for an air quality analysis at an airport is based on the ultimate forecast level of aircraft operations. FAA Order 1050.1E Change 1 Environmental Impacts: Policies and Procedures (March 20, 2006), Appendix A, Section 2.4b states that for detailed guidance on air quality procedures see FAA’s report “Air Quality for Civilian Airports and Air Force Bases.” The report states that “if the level of annual enplanements exceeds 1,300,000, the level of general aviation and air taxi activity exceeds 180,000 operations per year or a combination thereof, a NAAQS assessment should be considered.”32 Forecasts for HXD indicate a total of approximately 56,901 annual operations by 2029 (Table 3.5.2-2, page 22), which is well below the minimum operations threshold requiring an air quality analysis.
32Federal Aviation Administration, FAA-AEE-97-03 – Air Quality Procedures for Civilian Airports and Air Force Bases, April 1997, p 20. <http://www.faa.gov/>, accessed August 18, 2009.
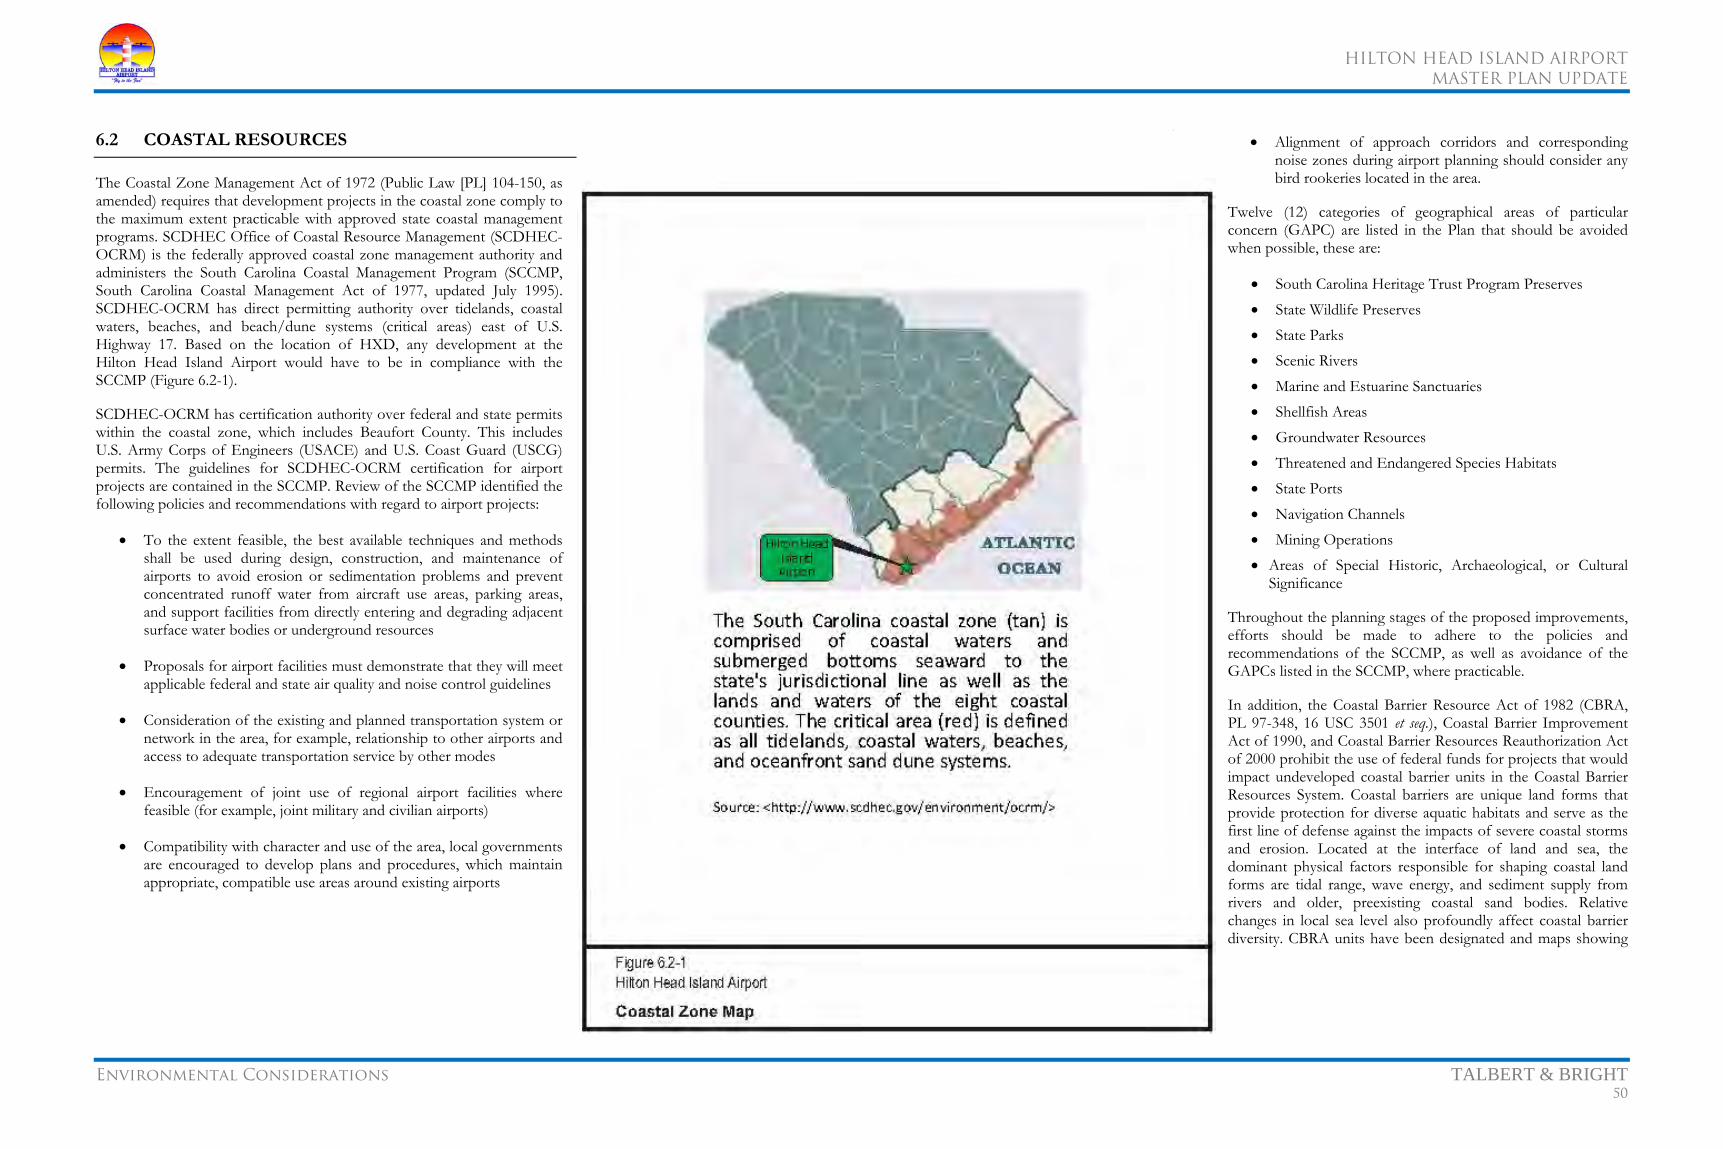
HILTON HEAD ISLAND AIRPORT
MASTER PLAN UPDATE
Environmental Considerations TALBERT & BRIGHT 50
6.2 COASTAL RESOURCES
The Coastal Zone Management Act of 1972 (Public Law [PL] 104-150, as amended) requires that development projects in the coastal zone comply to the maximum extent practicable with approved state coastal management programs. SCDHEC Office of Coastal Resource Management (SCDHEC-OCRM) is the federally approved coastal zone management authority and administers the South Carolina Coastal Management Program (SCCMP, South Carolina Coastal Management Act of 1977, updated July 1995). SCDHEC-OCRM has direct permitting authority over tidelands, coastal waters, beaches, and beach/dune systems (critical areas) east of U.S. Highway 17. Based on the location of HXD, any development at the Hilton Head Island Airport would have to be in compliance with the SCCMP (Figure 6.2-1).
SCDHEC-OCRM has certification authority over federal and state permits within the coastal zone, which includes Beaufort County. This includes U.S. Army Corps of Engineers (USACE) and U.S. Coast Guard (USCG) permits. The guidelines for SCDHEC-OCRM certification for airport projects are contained in the SCCMP. Review of the SCCMP identified the following policies and recommendations with regard to airport projects:
• To the extent feasible, the best available techniques and methods shall be used during design, construction, and maintenance of airports to avoid erosion or sedimentation problems and prevent concentrated runoff water from aircraft use areas, parking areas, and support facilities from directly entering and degrading adjacent surface water bodies or underground resources
• Proposals for airport facilities must demonstrate that they will meet applicable federal and state air quality and noise control guidelines
• Consideration of the existing and planned transportation system or network in the area, for example, relationship to other airports and access to adequate transportation service by other modes
• Encouragement of joint use of regional airport facilities where feasible (for example, joint military and civilian airports)
• Compatibility with character and use of the area, local governments are encouraged to develop plans and procedures, which maintain appropriate, compatible use areas around existing airports
•
• Alignment of approach corridors and corresponding noise zones during airport planning should consider any bird rookeries located in the area.
Twelve (12) categories of geographical areas of particular concern (GAPC) are listed in the Plan that should be avoided when possible, these are:
• South Carolina Heritage Trust Program Preserves • State Wildlife Preserves • State Parks • Scenic Rivers • Marine and Estuarine Sanctuaries • Shellfish Areas • Groundwater Resources • Threatened and Endangered Species Habitats • State Ports • Navigation Channels • Mining Operations • Areas of Special Historic, Archaeological, or Cultural
Significance
Throughout the planning stages of the proposed improvements, efforts should be made to adhere to the policies and recommendations of the SCCMP, as well as avoidance of the GAPCs listed in the SCCMP, where practicable.
In addition, the Coastal Barrier Resource Act of 1982 (CBRA, PL 97-348, 16 USC 3501 et seq.), Coastal Barrier Improvement Act of 1990, and Coastal Barrier Resources Reauthorization Act of 2000 prohibit the use of federal funds for projects that would impact undeveloped coastal barrier units in the Coastal Barrier Resources System. Coastal barriers are unique land forms that provide protection for diverse aquatic habitats and serve as the first line of defense against the impacts of severe coastal storms and erosion. Located at the interface of land and sea, the dominant physical factors responsible for shaping coastal land forms are tidal range, wave energy, and sediment supply from rivers and older, preexisting coastal sand bodies. Relative changes in local sea level also profoundly affect coastal barrier diversity. CBRA units have been designated and maps showing
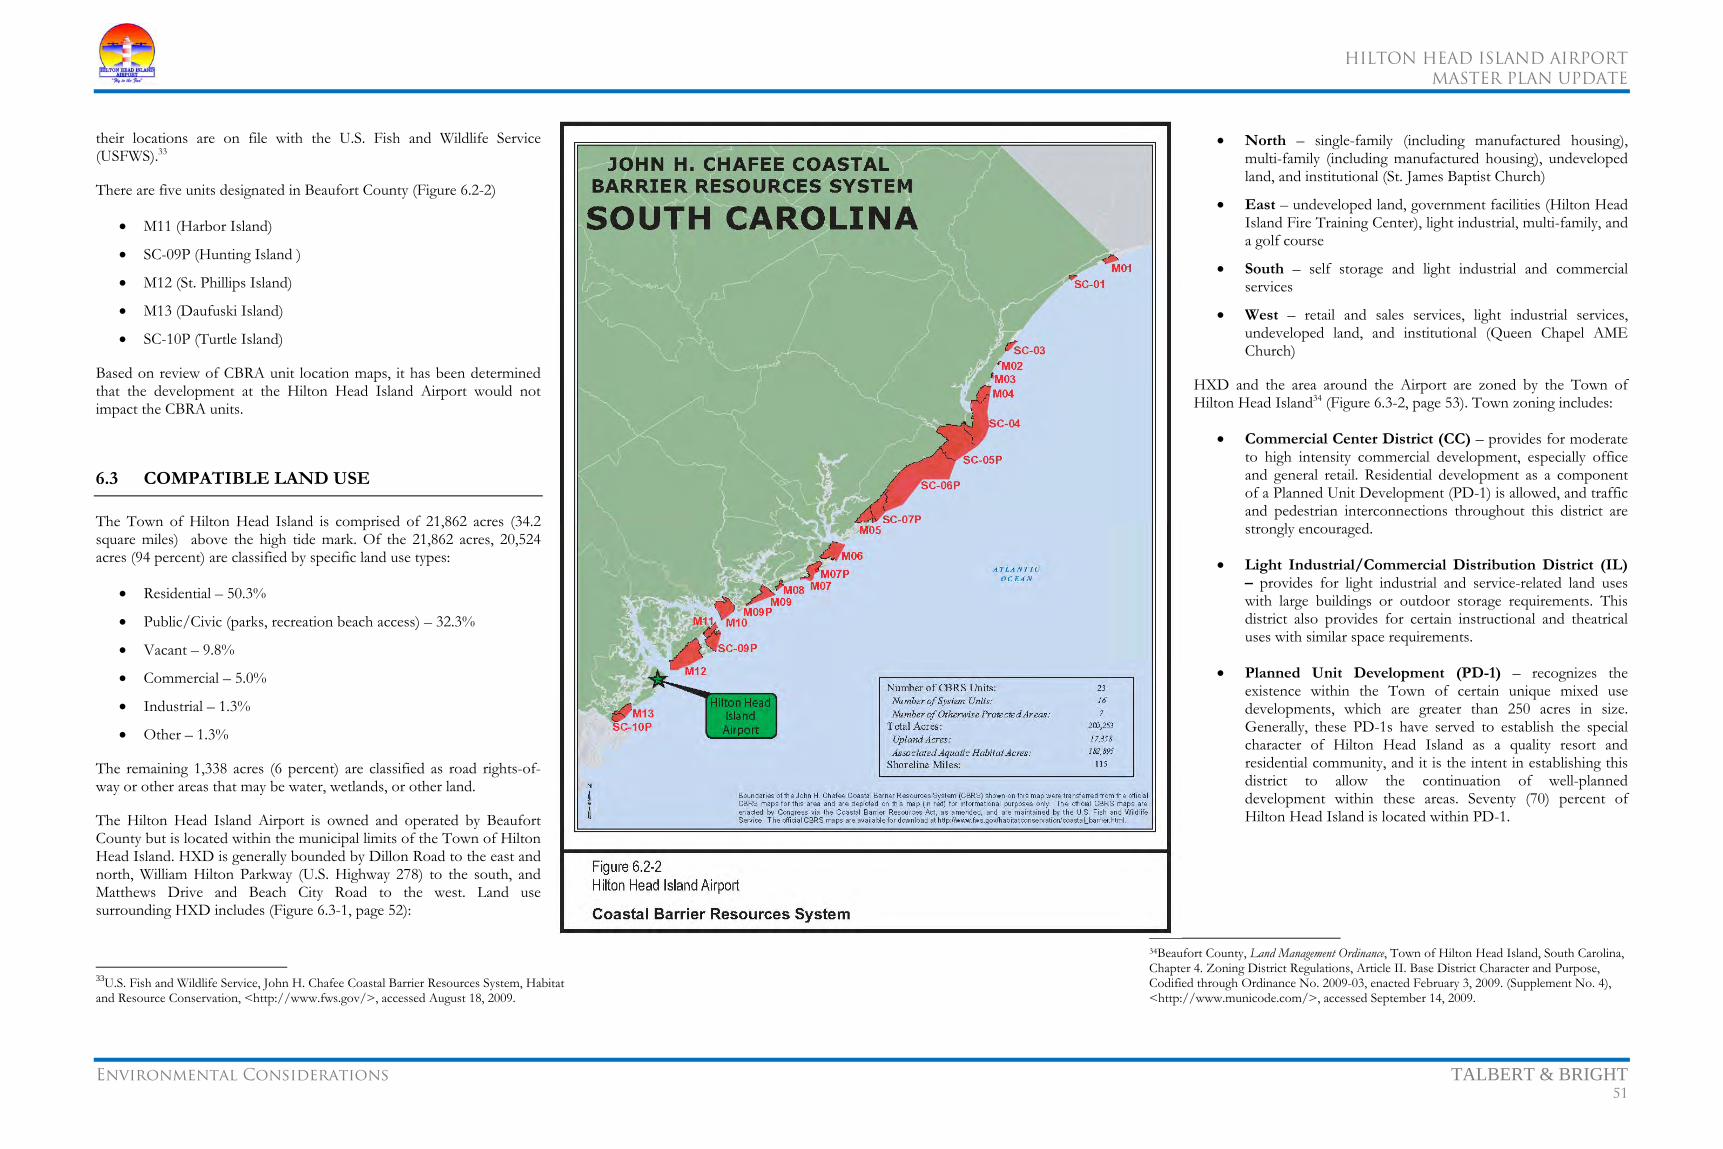
HILTON HEAD ISLAND AIRPORT
MASTER PLAN UPDATE
Environmental Considerations TALBERT & BRIGHT 51
their locations are on file with the U.S. Fish and Wildlife Service (USFWS).33
There are five units designated in Beaufort County (Figure 6.2-2)
• M11 (Harbor Island)
• SC-09P (Hunting Island )
• M12 (St. Phillips Island)
• M13 (Daufuski Island)
• SC-10P (Turtle Island)
Based on review of CBRA unit location maps, it has been determined that the development at the Hilton Head Island Airport would not impact the CBRA units.
6.3 COMPATIBLE LAND USE
The Town of Hilton Head Island is comprised of 21,862 acres (34.2 square miles) above the high tide mark. Of the 21,862 acres, 20,524 acres (94 percent) are classified by specific land use types:
• Residential – 50.3%
• Public/Civic (parks, recreation beach access) – 32.3%
• Vacant – 9.8%
• Commercial – 5.0%
• Industrial – 1.3%
• Other – 1.3%
The remaining 1,338 acres (6 percent) are classified as road rights-of-way or other areas that may be water, wetlands, or other land.
The Hilton Head Island Airport is owned and operated by Beaufort County but is located within the municipal limits of the Town of Hilton Head Island. HXD is generally bounded by Dillon Road to the east and north, William Hilton Parkway (U.S. Highway 278) to the south, and Matthews Drive and Beach City Road to the west. Land use surrounding HXD includes (Figure 6.3-1, page 52):
33U.S. Fish and Wildlife Service, John H. Chafee Coastal Barrier Resources System, Habitat and Resource Conservation, <http://www.fws.gov/>, accessed August 18, 2009.
• North – single-family (including manufactured housing), multi-family (including manufactured housing), undeveloped land, and institutional (St. James Baptist Church)
• East – undeveloped land, government facilities (Hilton Head Island Fire Training Center), light industrial, multi-family, and a golf course
• South – self storage and light industrial and commercial services
• West – retail and sales services, light industrial services, undeveloped land, and institutional (Queen Chapel AME Church)
HXD and the area around the Airport are zoned by the Town of Hilton Head Island34 (Figure 6.3-2, page 53). Town zoning includes:
• Commercial Center District (CC) – provides for moderate to high intensity commercial development, especially office and general retail. Residential development as a component of a Planned Unit Development (PD-1) is allowed, and traffic and pedestrian interconnections throughout this district are strongly encouraged.
• Light Industrial/Commercial Distribution District (IL) – provides for light industrial and service-related land uses with large buildings or outdoor storage requirements. This district also provides for certain instructional and theatrical uses with similar space requirements.
• Planned Unit Development (PD-1) – recognizes the existence within the Town of certain unique mixed use developments, which are greater than 250 acres in size. Generally, these PD-1s have served to establish the special character of Hilton Head Island as a quality resort and residential community, and it is the intent in establishing this district to allow the continuation of well-planned development within these areas. Seventy (70) percent of Hilton Head Island is located within PD-1.
34Beaufort County, Land Management Ordinance, Town of Hilton Head Island, South Carolina, Chapter 4. Zoning District Regulations, Article II. Base District Character and Purpose, Codified through Ordinance No. 2009-03, enacted February 3, 2009. (Supplement No. 4), <http://www.municode.com/>, accessed September 14, 2009.

HILTON HEAD ISLAND AIRPORT
MASTER PLAN UPDATE
Environmental Considerations TALBERT & BRIGHT 52
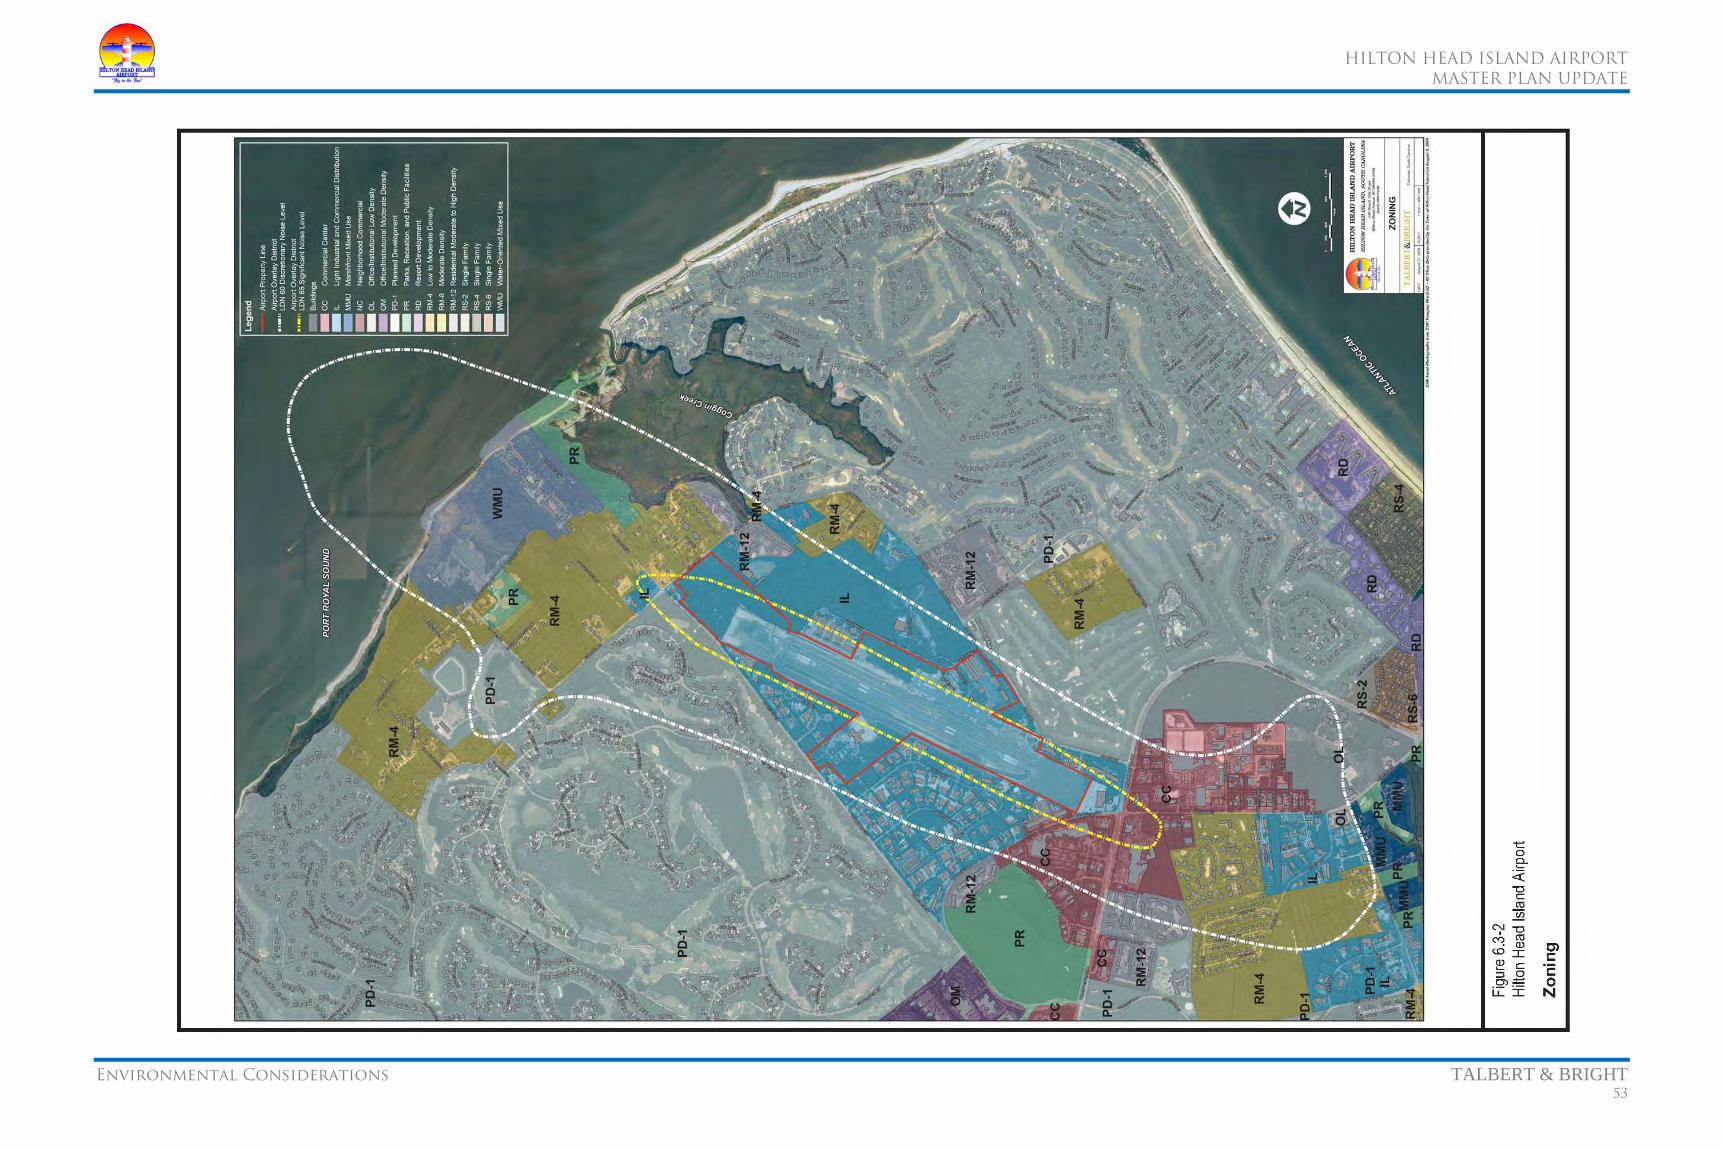
HILTON HEAD ISLAND AIRPORT
MASTER PLAN UPDATE
Environmental Considerations TALBERT & BRIGHT 53

HILTON HEAD ISLAND AIRPORT
MASTER PLAN UPDATE
Environmental Considerations TALBERT & BRIGHT 54
• Low to Moderate Density Residential District (4 to 8 units per acre, RM-4) – provides for a residential district that protects and preserves the unique character of Native Islander areas and neighborhoods.
• Moderate to High Density Residential District (12 units per acre, RM-12) – provides for a residential district that protects and preserves the unique character of Native Islander areas and neighborhoods.
The Town of Hilton Head Island35 has an airport overlay district (AOD), which protects HXD’s imaginary surfaces and sections within their zoning ordinances specifically dedicated to aviation and states:
An Airport Hazard Overlay District is hereby established in order to insure against safety hazards, noise and obstruction problems associated with aircraft utilizing the Hilton Head Island Airport. All development proposed within this district shall be subject to the standards specified within this part, in addition to the standards and regulations contained in the particular base district in which the development occurs. Development activity within this district is subject to regulation primarily to mitigate safety and noise problems; however, land uses within this district also shall be regulated to mitigate their incompatibility with airport operations. The regulations governing use and height within the Airport Hazard Overlay District conform to the standards recommended by the Federal Aviation Administration's Advisory Circular, 150/5190-4A, "Model Zoning Ordinance to Limit Height of Objects Around Airports.”
Potential land use impacts associated with future development of the Hilton Head Island Airport as outlined on the ALP are described in terms of airport and community planning efforts, jurisdictional coordination, and development patterns. The compatibility of existing and planned land uses in the vicinity of an airport is usually associated with two factors.
• The extent of noise impacts from and to the airport and related development
• Consistency with local land use plans and development policies
The principal factors influencing land use in the vicinity of an airport often include height obstructions, airport safety zones, and noise. Overall, noise exposure is often the most objectionable interference of the airport with the surrounding environment, as the compatibility with existing and planned land uses in the airport’s vicinity is normally associated with the extent of noise impacts. Therefore, prior to development of the proposed projects outlined
35Beaufort County, Land Management Ordinance, Town of Hilton Head Island, South Carolina, Chapter 4. Zoning District Regulations, Article IV. AHZ--Airport Hazard Overlay District, Codified through Ordinance No. 2009-03, enacted February 3, 2009. (Supplement No. 4), <http://www.municode.com/>, accessed September 14, 2009.
in the ALP, a noise survey shall be performed to determine the extent of noise impacts on the surrounding land use. Table 6.3-1 identifies FAA land use compatibility standards, as identified by the 65, 70, 75, and 80 day-night average sound level (DNL) noise contours.
It should be noted that the responsibility for determining the acceptable and permissible land use in the vicinity of an airport remains with local authorities in response to local needs and values in achieving compatible land use.
6.4 CONSTRUCTION IMPACTS
During construction of the proposed development at the Hilton Head Island Airport outlined on the ALP, there are a number of potential environmental impacts that could occur to air and water quality, as well as construction noise, but these would be controlled through careful attention to construction methods and implementation of best management practices (BMPs).
6.5 DEPARTMENT OF TRANSPORTATION ACT: SECTION 4(f)
Section 4(f) of the U.S. Department of Transportation (USDOT) Act of 1966 states that the Secretary of Transportation shall not approve any program or project, which requires the use of any publicly owned land from a public park, recreation area, or wildlife and waterfowl refuge of national, state, or local significance as determined by federal, state, or local officials having jurisdiction thereof, or any land from an historic structure of national, state, or local significance as so determined by such officials unless:
There is no feasible and prudent alternative to the use of such land
The project includes all possible planning to minimize harm to the land resulting from such use
Prior to development of the proposed projects outlined on the ALP on currently undeveloped areas within the HXD property boundary, a cultural resources survey shall be performed to determine whether there are any
Section 4(f) properties located on-site. Also, if additional property is to be acquired, compliance with Section 4(f) will be necessary, as well as coordination with appropriate federal and state agencies. In addition, an assessment will be performed to determine land use compatibility and
Table 6.3-1 Compatible Land Use for Noise Level Ranges
Hilton Head Island Airport
Land Use Yearly DNL in Decibels (dB)
Below 65 65–70 70–75 75–80 80–85 Over 85Residential, other than mobile homes and transient lodgings
Y N N N N N
Mobile home parks Y N N N N N Transient lodgings Y N N N N N Public Use
Schools Y N N N N N Hospitals and nursing homes Y 25 30 N N N Churches, auditoriums, and concert halls Y 25 30 N N N Government services Y Y 25 30 N N Transportation Y Y Y Y Y Y Parking Y Y Y Y Y Y
Commercial Use Offices, businesses, and professional Y Y 25 30 N N Wholesale and retail – building materials, hardware, and farm equipment
Y Y Y Y Y N
Retail trade – general Y Y 25 30 N N Utilities Y Y Y Y Y N Communication Y Y 25 30 N N
Manufacturing and Production Manufacturing – general Y Y Y Y Y N Photographic and optical Y Y 25 30 N N Agriculture (except livestock) and forestry Y Y Y Y Y Y Livestock farming and breeding Y Y Y N N N Mining and fishing, resource production and extraction
Y Y Y Y Y Y
Recreational Outdoor sports areas and spectator sports Y Y Y N N N Outdoor music amphitheaters Y N N N N N Nature exhibits and zoos Y Y N N N N Amusements, parks, resorts, and camps Y Y Y N N N Golf courses, riding stables, and water recreation Y Y 25 30 N N
Notes: Y (Yes) – Land use and related structures compatible without restrictions. N (No) – Land use and related structures are not compatible and should be prohibited. NLR – Noise level reduction (outdoor and indoor) to be achieved through incorporation of noise attenuation into the design and construction of the structure. 25 or 30 – Land use and related structures generally compatible; measures to achieve NLR of 25, 30, or 35 dB must be incorporated in design and construction of structure. Source: Federal Aviation Administration, Advisory Circular 150/5020-1 – Noise Control And Compatibility Planning For Airports, August 1983, <http://www.faa.gov/>, accessed August 25, 2009.

HILTON HEAD ISLAND AIRPORT
MASTER PLAN UPDATE
Environmental Considerations TALBERT & BRIGHT 55
location of recreational areas in respect to potential impacts under the requirements of Section 4(f).
6.6 FARMLANDS
The U.S. Department of Agriculture (USDA) oversees the Farmland Protection Policy Act (FPPA). The purpose of FPPA is to minimize the extent to which federal programs contribute to the unnecessary and irreversible conversion of farmland to non-agricultural uses. The FPPA establishes the protocol and criteria to be used by federal agencies to:
Identify and take into account the adverse effects of their programs on the preservation of farmland
Consider alternative actions, as appropriate, that could lessen adverse effects
Ensure that their programs are compatible with state and units of local government and private programs and policies to protect farmland
The FPPA does not provide authority to withhold federal assistance for projects that convert farmland to non-agricultural uses. For the purposes of implementing the FPPA, farmland is defined as prime or unique farmlands or farmland that is determined by the state or unit of local government agency to be farmland of statewide or local importance (Figure 6.6-1 and Table 6.6-1, page 56).36
The Natural Resources Conservation Service (NRCS) farmland definitions are:37
Prime farmland – land that has the best combination of physical and chemical characteristics for producing food, feed, forage, fiber, and oilseed crops and that is available for these uses. It has the combination of soil properties, growing season, and moisture supply needed to produce sustained high yields of crops in an economic manner if it is treated and managed according to acceptable farming methods. In general, prime farmland has an adequate and dependable water supply from precipitation or irrigation, a favorable temperature and growing season, an acceptable level of acidity or alkalinity, an
36Code of Federal Regulations Title 7 – Agriculture, Chapter VI – Natural Resources Conservation Service, Department Of Agriculture, Part 658 – Farmland Protection Policy Act. (January 1, 2006 edition). 37U.S. Department of Agriculture, “Soil Survey Manual Handbook No. 18,” October 1993.
acceptable content of salt or sodium, and few or no rocks. Its soils are permeable to water and air. Prime farmland is not excessively eroded or saturated with water for long periods of time, and it either does not flood frequently during the growing season or is protected from flooding.
Unique farmland – land other than prime farmland that is used for the production of specific high value food and fiber crops. It has the special combination of soil quality, location, growing season, and moisture supply needed to economically produce sustained high quality and/or high yields of a specific crop when treated and managed according to acceptable farming methods.
Statewide or local important – land, in addition to prime and unique farmlands, that is of statewide or local importance for the production of food, feed, fiber, forage, and oil seed crops. Criteria for defining and delineating this land are to be determined by the appropriate state agency or agencies. Generally, additional farmlands of statewide or local importance include those that are nearly prime farmland and economically produce high yields of crops when treated and managed according to acceptable farming methods. Some may produce as high a yield as prime farmlands if conditions are favorable.
Development of the Hilton Head Island Airport as outlined on the ALP will have an impact on soils by converting undeveloped land; however, these soils are not considered prime, unique, or statewide important because of the presence of zoning and land use ordinances for the Town of Hilton Head Island.38 Therefore, there would be no impact to farmland.
Table 6.6-1 (page 56) illustrates the degree and soil limitations that affect small commercial buildings, buildings without basements, and roads and streets. The limitations indicate the extent to which the soils are limited by soil features that affect the specified use.
• Not limited – indicates that the soil has features that are very favorable for the specified use. Good performance and very low maintenance can be expected.
• Somewhat limited – indicates that the soil has features that are moderately favorable for the specified use. The limitations can be overcome or minimized by special planning, design, or
38Beaufort County, Land Management Ordinance, Town of Hilton Head Island, South Carolina, Chapter 4. Zoning District Regulations, Article II. Base District Character and Purpose, Codified through Ordinance No. 2009-03, enacted February 3, 2009. (Supplement No. 4), <http://www.municode.com/>, accessed September 14, 2009.

HILTON HEAD ISLAND AIRPORT
MASTER PLAN UPDATE
Environmental Considerations TALBERT & BRIGHT 56
installation. Fair performance and moderate maintenance can be expected.
• Very limited – indicates that the soil has one or more features that are unfavorable for the specified use. The limitations generally cannot be overcome without major soil reclamation, special design, or expensive installation procedures. Poor performance and high maintenance can be expected.
Special studies will be performed where soil limitations are very limited prior to development of the proposed projects outlined on the ALP.
6.7 FISH, WILDLIFE, AND PLANTS
The Endangered Species Act of 1973, as amended, gives the Secretary of the Interior, acting for the Secretary of Commerce, USFWS, and National Marine Fisheries Service (NMFS), the power to protect and conserve forms of wildlife and plants deemed to be in serious jeopardy. Section 7 of the Act requires federal agencies or their designated non-federal representatives, in consultation with and assisted by the USFWS, to ensure that their actions are
not likely to jeopardize the continued existence of endangered and threatened species or result in the destruction or adverse modification of critical habitat of such species.
The South Carolina Department of Natural Resources (SCDNR) and South Carolina Heritage Trust Program (SCHTP) online databases and the USFWS web site were consulted regarding current federal and state listed species within Beaufort County. The SCHTP database records did not identify the presence of known occurrences on or adjacent to the Hilton Head Island Airport. Listed species of concern and their respective federal and state status are identified in Table 6.7-1 (page 57).
Based on review of the aerial photographs,39 it would appear that habitat for the West Indian manatee (Trichechus manatus), green sea turtle (Chelonia mydas), Kemp’s ridley sea turtle (Lepidochelys kempii), leatherback sea turtle (Dermochelys coriacea), loggerhead sea turtle (Caretta caretta), piping plover (Charadrius melodus), and shortnose sturgeon (Acipenser brevirostrum) is not present within the boundary of HXD. If wetlands are present on the airport property, potential habitat for the wood stork (Mycteria americana), flatwoods salamander (Ambystoma cingulatum), American chaffseed (Schwalbea americana), Canby’s dropwort (Oxypolis canbyi), and pondberry (Lindera melissifolia) may be present. If mature pine stands are located within the wooded area of the Airport, potential habitat for the red-cockaded woodpecker (Picoides borealis) may be present.
Prior to development of the proposed projects outlined on the ALP in undeveloped areas, a threatened and endangered species survey will be performed to achieve compliance with Section 7 of the Endangered Species Act, as well as to coordinate with federal and state environmental agencies.
In addition, SCDNR was interviewed regarding bald eagle (Haliaeetus leucocephalus) nests in the vicinity of the Airport.40 The SCDNR indicated that a bald eagle nest was located immediately adjacent to the airport approach on Runway 21 (32° 13.82'N, 80° 41.57'W, Figure 6.7-1, page 58) and noted that an eagle had been hit by an airplane in 2008. Current exclusion zones for the bald
eagle for habitat destruction are 330 feet and 660 feet (for the nesting season, October through May). The SCDNR suggested that proposed airport development plans (expansion, tree cutting, or habitat alteration) be discussed with the USFWS prior to implementation. During these discussions, the nest tree and the primary and secondary zones, as well as the possibility of a “take” permit to remove the eagle nest, were determined.
39South Carolina Department of Natural Sources, “NAPP 2006, 1999, and 1994 Aerial Photographs,” <http://dnr.state.sc.us>, accessed September 11, 2009. 40South Carolina Department of Natural Resources (Charlotte Hope) interviewed by S&ME (Chris Daves, Biologist), September 11, 2009.
The bald eagle’s nest was removed and the tree cut down in August 2010, prior to the initiation of the on-airport tree removal project on the Runway 21 end of the Airport.
6.8 FLOODPLAINS
As outlined in Executive Order 11988, Floodplain Management,41 agencies are required to reduce the risk of flood loss; minimize the impact of floods on human safety, health, and welfare; and restore and preserve the natural and beneficial values served by the floodplain.
Federal regulations permit development in the 100-year floodplain if it is demonstrated through hydraulic analysis that the development would meet the requirements set forth by the Federal Emergency Management Agency (FEMA) for the National Flood Insurance Program. These requirements allow encroachment in the floodplain as long as the base flood elevation does not increase by more than one foot. When a regulatory floodway has been defined for a waterway, the encroachment should remain outside the floodway limits.
Review of the Beaufort County floodplain maps provided by the FEMA Map Service Center42 indicates that the Airport is located within Zones C, B, and A7 (Figure 6.8-1, page 59):
• Zones B and C – are areas outside the 1 percent annual chance floodplain; areas of 1 percent annual chance sheet flow flooding where average depths are less than 1 foot; areas of 1 percent annual chance stream flooding where the contributing drainage area is less than 1 square mile; or areas protected from the 1 percent annual chance flood by levees. No base flood elevations or depths are shown within this zone. Insurance purchase is not required in these zones.
• Zone A7 – is an area with a 1 percent annual chance of flooding and a 26 percent chance of flooding over the life of a 30-year mortgage. In most instances, base flood elevations derived from detailed analyses are shown at selected intervals within these zones.
The majority of HXD is located within an area zoned C.
41Federal Register, Vol. 42, Pg. 26951, May 24, 1977, “Floodplain Management,” <https://propertydisposal.gsa.gov/>, accessed September 15, 2009. 42Federal Emergency Management Agency Map Service Center, “FEMA issued Flood Maps – Flood Insurance Rate Map Town of Hilton Head Island. South Carolina, Beaufort County, Panel 9 of 15, Community Panel Number 450250 0009 D, Map Revised September 29, 1986,” <http://msc.fema.gov/>, accessed September 15, 2009.
Table 6.6-1 Soils within the Vicinity of the Airport
Hilton Head Island Airport
Map Unit
Symbol Map Unit Name
Development Suitabilities and Limitations for Use
Farmland Classification
Small Commercial
Buildings
Buildings without
Basements
Roads and
Streets Ba Baratari fine sand, 0% to 2%
slopes very limited very limited somewhat
limited prime farmland, if irrigated and
drained CE Capers association, 0% to 2%
slopes very limited very limited very limited not prime
farmland Po Polowana loamy fine sand, 0%
to 2% slopes very limited very limited very limited prime farmland,
if irrigated and drained
Rd Ridgeland fine sand, 0% to 2% slopes
very limited very limited very limited prime farmland, if irrigated
Ro Rosedhu fine sand, 0% to 2% slopes
somewhat limited
somewhat limited
somewhat limited
prime farmland, if irrigated and
drained Sk Seabrook fine sand, 0% to 2%
slopes not limited not limited not limited prime farmland,
if irrigated Wd Wando fine sand, 0% to 6%
slopes not limited not limited not limited prime farmland,
if irrigated Source: Soil Survey Staff, Natural Resources Conservation Service, United States Department of Agriculture, “Web Soil Survey,” <http://websoilsurvey.nrcs.usda.gov/>, accessed September 14, 2009.

HILTON HEAD ISLAND AIRPORT
MASTER PLAN UPDATE
Environmental Considerations TALBERT & BRIGHT 57
Table 6.7-1 Species of Concern in Beaufort County
Hilton Head Island Airport
Common Name Scientific Name State
Status Federal Status Habitat
Flora American chaffseed Schwalbea americana E E Various sandy soil areas on the coastal plain;
plants are usually found on margins of savannahs and cypress ponds that are seasonally wet; best managed by prescribed fire
Canby’s dropwort Oxypolis canbyi E E Pond-cypress savannahs in Carolina Bays formations dominated by grasses and sedges or ditches next to bays; prefer borders and shallows of cypress-pond pine ponds and sloughs
Pondberry Lindera melissifolia E E Swamp and pond margins, sandy sinks, swampy depressions, or wet flats that are subject to drying but the roots are submerged at times
Fauna Bald eagle Haliaeetus leucocephalus BGEPA BGEPA Coastlines, rivers, large lakes, or streams,
which provide adequate feeding grounds; typically nest in SC between late October and late May; tend to return year after year to the same nest tree, once they have successfully established a nest
Flatwoods salamander Ambystoma cingulatum E T Adults and sub-adults are fossorial; found in open mesic pine/wiregrass flatwoods dominated by longleaf or slash pine and maintained by frequent fire; during breeding period, which coincides with heavy rains from October to December, move to isolated, shallow, small depressions (forested with emergent vegetation) that dry completely on a cyclic basis
Green sea turtle Chelonia mydas T T Rarely nests in SC, generally found in fairly shallow waters (except when migrating) inside reefs, bays, and inlets
Kemp’s ridley sea turtle Lepidochelys kempii E E Outside of nesting season, primarily found in the near-shore and inshore waters of the Gulf of Mexico, although immature have been observed along the Atlantic as far north as Massachusetts
Leatherback sea turtle Dermochelys coriacea E E Rarely nests in SC, visits often coincide with periodic abundance of cannonball jellyfish; distributed worldwide in tropical and temperate waters of the Atlantic, Pacific, and Indian Oceans; most pelagic of the sea turtles
Loggerhead sea turtle Caretta caretta T T Nests on SC ocean beaches, forages primarily on mollusks and crustaceans in shallow ocean waters and stream channels, widely distributed throughout the world
Table 6.7-1 Species of Concern in Beaufort County
Hilton Head Island Airport
Common Name Scientific NameState
Status Federal Status Habitat
Piping plover Charadrius melodus T T Winters on SC coast; prefers area with expansive sands and mudflats (for foraging) in close proximity to a sand beach (for roosting)
Red-cockaded woodpecker
Picoides borealis E E Nest in mature pine with low understory vegetation (<1.5 m); forage in pine and pine hardwood stands >30 years of age, preferably 10" diameter at breast height
Shortnose sturgeon Acipenser brevirostrum E E Occur in major river systems along the eastern seaboard
West Indian manatee Trichechus manatus E E Coastal waters, estuaries, and warm water outfalls
Wood stork Mycteria americana E E Primarily feed in fresh and brackish wetlands and nest in cypress and other wooded swamps
BGEPA – Bald and Golden Eagle Protection Act E – Endangered T – Threatened Source: South Carolina Department Natural Resources, “Rare, Threatened, & Endangered Species Inventory, Species Found in Beaufort County, Current Online Edition,” <https://www.dnr.sc.gov/>, accessed September 11, 2009. South Carolina Heritage Trust, “Geographic Database of Rare and Endangered Species,” <https://www.dnr.sc.gov/>, accessed September 11, 2009. U.S. Fish and Wildlife Service, “Listed Endangered Species in South Carolina,” <http://www.fws.gov/>, accessed September 11, 2009.
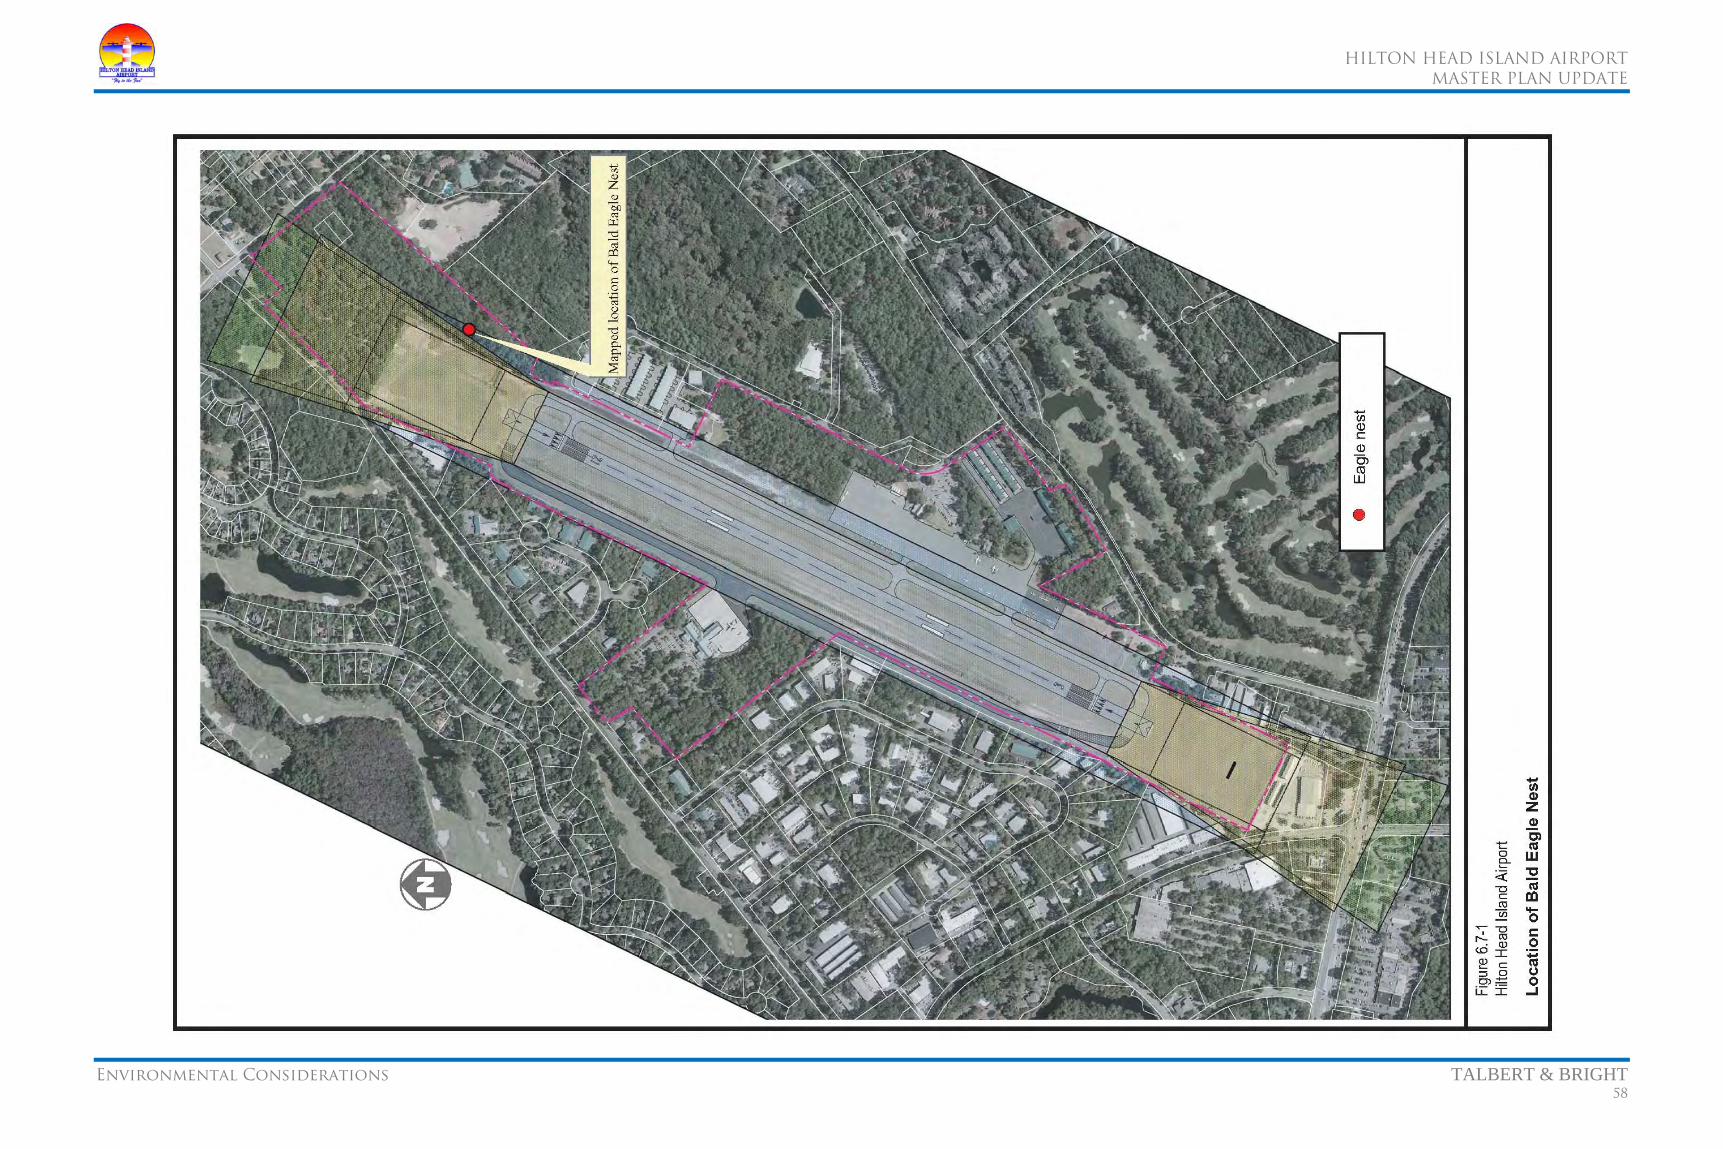
HILTON HEAD ISLAND AIRPORT
MASTER PLAN UPDATE
Environmental Considerations TALBERT & BRIGHT 58

HILTON HEAD ISLAND AIRPORT
MASTER PLAN UPDATE
Environmental Considerations TALBERT & BRIGHT 59
HILTON HEAD ISLAND AIRPORT
MASTER PLAN UPDATE
Environmental Considerations TALBERT & BRIGHT 60
Prior to development of the proposed projects outlined on the ALP, floodplain analysis is recommended to determine whether there would be an impact in the areas designated Zone A7.
6.9 HAZARDOUS MATERIALS, POLLUTION PREVENTION, AND SOLID WASTE
6.9.1 Hazardous Materials
The purpose of a Phase I Environmental Site Assessment (ESA) is to identify, to the extent feasible, pursuant to American Society of Testing and Materials (ASTM) E 1527-00, Recognized Environmental Conditions (RECs) in connection with the property. The ASTM Standard Practice E 1527-00 defines good commercial and customary practice for conducting an environmental site assessment of a parcel of commercial real estate with respect to the range of contaminants within the scope of the Comprehensive Environmental Response, Compensation and Liability Act (CERCLA) and to petroleum products. This practice is intended to permit a user to satisfy one of the requirements to qualify for the innocent landowner defense to CERCLA liability.
Prior to development of the proposed projects outlined on the ALP, an ESA should be performed of the airport property and the surrounding environs to determine the potential extent (if any) of hazardous material contamination.
6.9.2 Pollution Prevention
HXD must comply with applicable regulations pertaining to the use, storage, and disposal of hazardous materials as outlined in FAA Order 1050.10B, Prevention, Control and Abatement of Environmental Pollution at FAA Facilities; FAA Order 1050.14A, Polychlorinated Biphenyls (PCB) in the National Airspace System; FAA Order 1050.15A, Underground Storage Tanks at FAA Facilities; FAA Order 1050.18, Chlorofluorocarbons and Halon Use at FAA Facilities; and FAA Advisory Circular 150/5320-15 – Management of Airport Industrial Wastes. This compliance can be in the form of a Spill Prevention, Control, and Countermeasures Plan (SPCC).43
Although each SPCC is unique to the facility, there are certain elements that must be included in order for the SPCC Plan to comply with the provisions of 40 CFR 112, Oil Pollution Prevention. Three areas which should be addressed in the Plan are:
1) Operating procedures the facility implements to prevent oil spills
2) Control measures installed to prevent oil from entering navigable waters or adjoining shorelines
43Code of Federal Regulations, “Title 40, Protection of Environment, Part 112 – Oil Pollution Prevention,” <http://ecfr.gpoaccess.gov/>, accessed September 15, 2009.
3) Countermeasures to contain, clean up, and mitigate the effects of an oil spill that has an impact on navigable waters or adjoining shorelines. Other important elements of a SPCC include, but are not limited to, the following: professional engineer certification, notification requirements in the event of a spill, and reporting requirements for spills of various quantities
The Plan must follow the sequence of 40 CFR 112.7, General Requirements for Spill Prevention, Control, and Countermeasures Plans or provide cross-references to the requirements in 40 CFR 112.7, General Requirements for Spill Prevention, Control, and Countermeasures Plans:
• Facility diagram
• Oil spill predictions
• Facility drainage
• Facility inspections
• Site security
• Five-year plan review
• Management approval
• Appropriate secondary containment or diversionary structures
• Loading/unloading requirements and procedures for tank trucks
• Personnel training and oil discharge prevention briefings
• Bulk storage container compliance
• Transfer procedures and equipment (including piping)
6.9.3 Solid Waste
Development of the proposed projects outlined on the ALP would not have a direct effect on solid waste collection or disposal, other than during actual construction of the proposed projects. Building and hangar development would generate solid waste for disposal and would be the responsibility of the occupants of the facilities. The collection and disposal of solid waste is provided by private companies that contract with businesses and residents on the Island to collect waste and remove it to disposal facilities. Solid waste is disposed of at the Hickory Hill Landfill in Jasper County, which has an estimated 20-year lifespan remaining. Construction and demolition material is disposed of at either Barnwell Resources, in Beaufort County, or the Oakwood Landfill, in Jasper County.
6.10 HISTORICAL, ARCHITECTURAL, ARCHAEOLOGICAL, AND CULTURAL RESOURCES
Section 106 of the National Historic Preservation Act of 1966, as amended through 1992 (16 USC 470), and the Archeological and Historic Preservation Act of 1974 requires that a state or federal agency with jurisdiction over a specific project must identify and evaluate affected cultural resources, assess the project’s effect on such resources, and grant opportunity for comment. Cultural resources are evaluated by their eligibility for placement on the National Register of Historic Places (NRHP).
6.10.1 History of Hilton Head Island44
Hilton Head Island is a sea island or large barrier island in the Atlantic Ocean. Due to its size (the second largest on the east coast) and strategic location near Port Royal Sound, Charleston, and Savannah, the Island played an important role in early Indian settlement, plantation agriculture, the American Revolutionary War, and the Civil War. After the Civil War, Islanders maintained a rural subsistence economy until the mid-1950s. At that time, developers, noting the natural beauty of the Island, began to create master planned resort and residential communities. The Town of Hilton Head Island was incorporated in 1983 in an effort to better manage the increasing development and protect the beauty of the Island.
6.10.2 Mitchelville45
Mitchelville (Figure 6.10.2-1, page 61), which was established in October 1862, was the Union’s first chance to demonstrate how to treat the black man with the respect due all men and was formed with three goals in mind:
• To alleviate problems associated with a large number of idle contrabands in the post Hilton Head and surrounding military encampments
• To provide adequate living conditions for said contrabands
• To develop skills of self-management and self-control among the contrabands
44Town of Hilton Head Island, “Town of Hilton Head Island Comprehensive Plan, Cultural Resources Element,” Adopted March 16, 2004, <http://service2.hiltonheadislandsc.gov/>, accessed September 15, 2009. 45Brockington and Associates, Inc., “Contraband, Refugee, Freedman: Archaeological and Historical Investigations of the Western Fringe of Mitchelville, Hilton Head, South Carolina,” prepared for Greenwood Development Corporation, 1991.
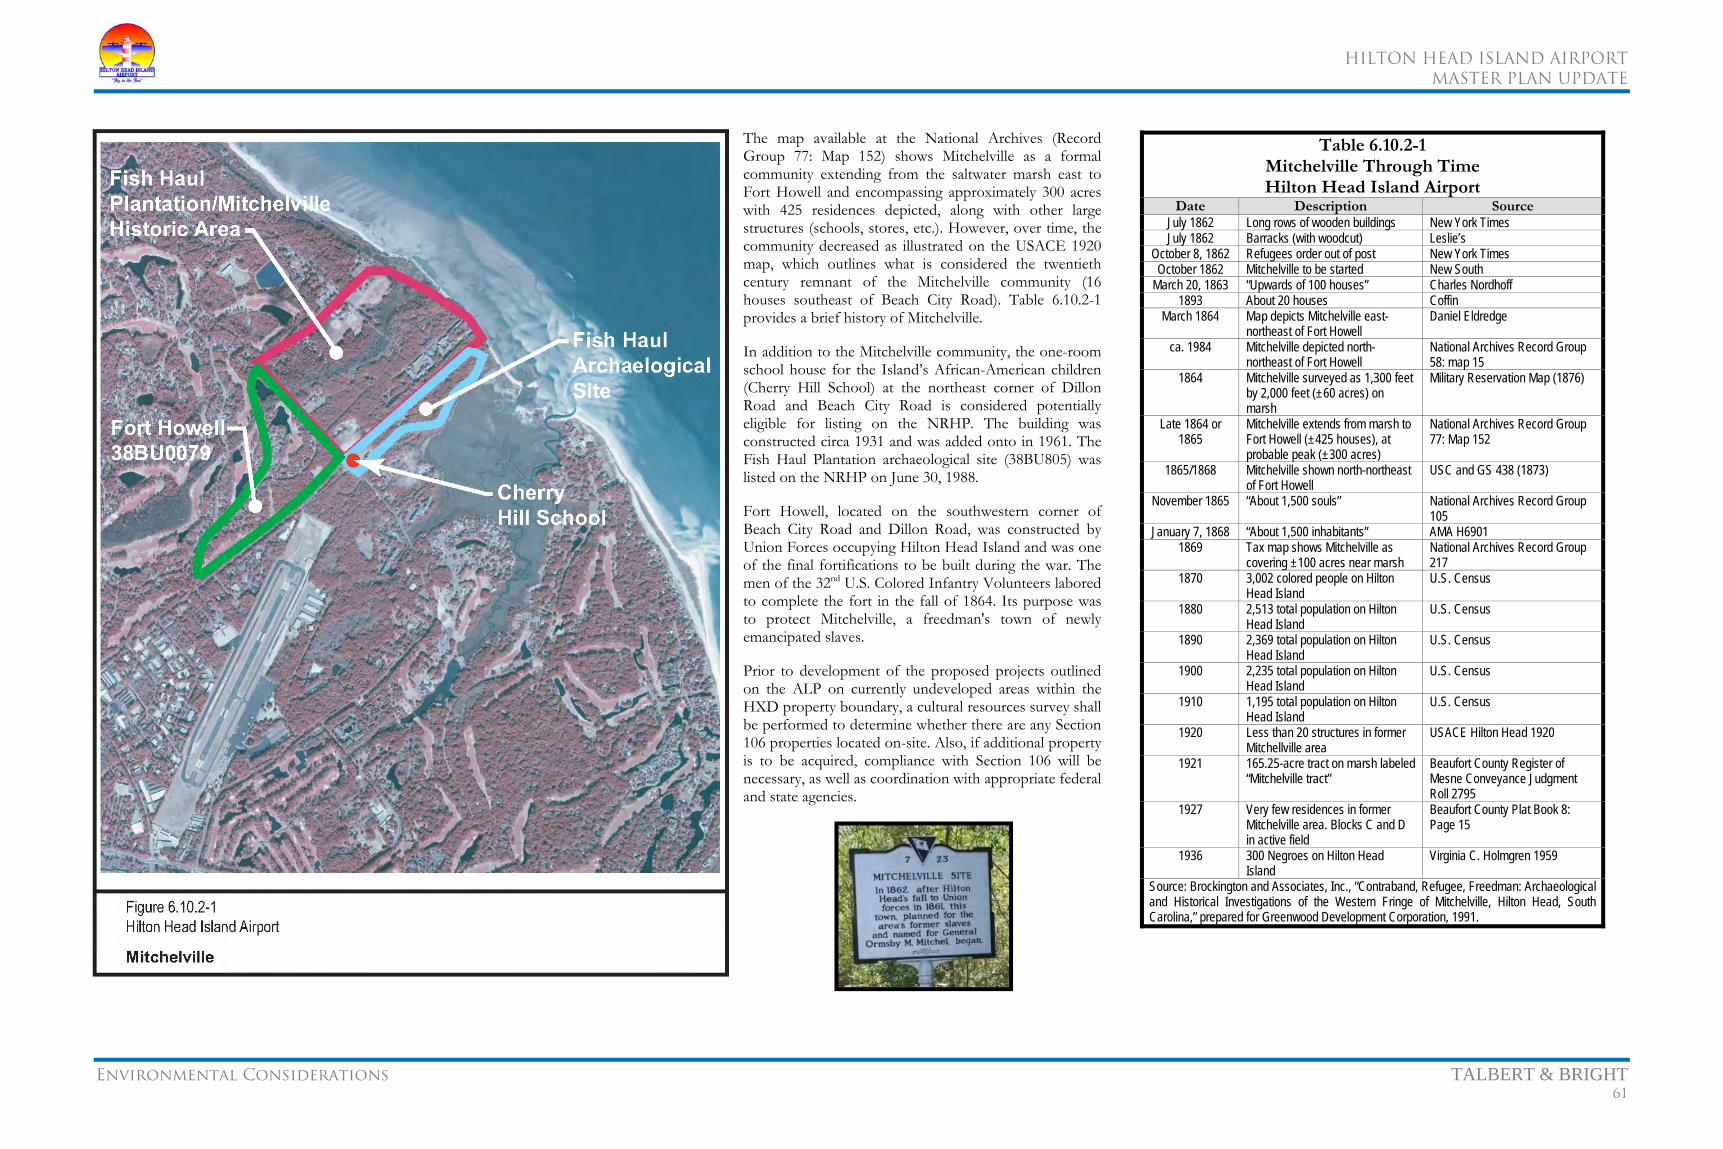
HILTON HEAD ISLAND AIRPORT
MASTER PLAN UPDATE
Environmental Considerations TALBERT & BRIGHT 61
The map available at the National Archives (Record Group 77: Map 152) shows Mitchelville as a formal community extending from the saltwater marsh east to Fort Howell and encompassing approximately 300 acres with 425 residences depicted, along with other large structures (schools, stores, etc.). However, over time, the community decreased as illustrated on the USACE 1920 map, which outlines what is considered the twentieth century remnant of the Mitchelville community (16 houses southeast of Beach City Road). Table 6.10.2-1 provides a brief history of Mitchelville.
In addition to the Mitchelville community, the one-room school house for the Island’s African-American children (Cherry Hill School) at the northeast corner of Dillon Road and Beach City Road is considered potentially eligible for listing on the NRHP. The building was constructed circa 1931 and was added onto in 1961. The Fish Haul Plantation archaeological site (38BU805) was listed on the NRHP on June 30, 1988.
Fort Howell, located on the southwestern corner of Beach City Road and Dillon Road, was constructed by Union Forces occupying Hilton Head Island and was one of the final fortifications to be built during the war. The men of the 32nd U.S. Colored Infantry Volunteers labored to complete the fort in the fall of 1864. Its purpose was to protect Mitchelville, a freedman's town of newly emancipated slaves.
Prior to development of the proposed projects outlined on the ALP on currently undeveloped areas within the HXD property boundary, a cultural resources survey shall be performed to determine whether there are any Section 106 properties located on-site. Also, if additional property is to be acquired, compliance with Section 106 will be necessary, as well as coordination with appropriate federal and state agencies.
Table 6.10.2-1 Mitchelville Through Time Hilton Head Island Airport
Date Description Source July 1862 Long rows of wooden buildings New York Times July 1862 Barracks (with woodcut) Leslie’s
October 8, 1862 Refugees order out of post New York Times October 1862 Mitchelville to be started New South
March 20, 1863 “Upwards of 100 houses” Charles Nordhoff 1893 About 20 houses Coffin
March 1864 Map depicts Mitchelville east-northeast of Fort Howell
Daniel Eldredge
ca. 1984 Mitchelville depicted north-northeast of Fort Howell
National Archives Record Group 58: map 15
1864 Mitchelville surveyed as 1,300 feet by 2,000 feet (±60 acres) on marsh
Military Reservation Map (1876)
Late 1864 or 1865
Mitchelville extends from marsh to Fort Howell (±425 houses), at probable peak (±300 acres)
National Archives Record Group 77: Map 152
1865/1868 Mitchelville shown north-northeast of Fort Howell
USC and GS 438 (1873)
November 1865 “About 1,500 souls” National Archives Record Group 105
January 7, 1868 “About 1,500 inhabitants” AMA H6901 1869 Tax map shows Mitchelville as
covering ±100 acres near marsh National Archives Record Group 217
1870 3,002 colored people on Hilton Head Island
U.S. Census
1880 2,513 total population on Hilton Head Island
U.S. Census
1890 2,369 total population on Hilton Head Island
U.S. Census
1900 2,235 total population on Hilton Head Island
U.S. Census
1910 1,195 total population on Hilton Head Island
U.S. Census
1920 Less than 20 structures in former Mitchellville area
USACE Hilton Head 1920
1921 165.25-acre tract on marsh labeled “Mitchelville tract”
Beaufort County Register of Mesne Conveyance Judgment Roll 2795
1927 Very few residences in former Mitchelville area. Blocks C and D in active field
Beaufort County Plat Book 8: Page 15
1936 300 Negroes on Hilton Head Island
Virginia C. Holmgren 1959
Source: Brockington and Associates, Inc., “Contraband, Refugee, Freedman: Archaeological and Historical Investigations of the Western Fringe of Mitchelville, Hilton Head, South Carolina,” prepared for Greenwood Development Corporation, 1991.

HILTON HEAD ISLAND AIRPORT
MASTER PLAN UPDATE
Environmental Considerations TALBERT & BRIGHT 62
6.10.3 Previously Identified Cultural Resources46
Table 6.10.3-1 summarizes previously identified cultural resources in the area. The discussion following the table goes into detail about the resources.
Trinkley’s (1987) survey of Hilton Head Island resulted in the identification of five sites (38BU805, 38BU806, 38BU807, 38BU808, and 38BU811) within one mile of the project tract. In addition, earlier investigators had recorded three sites within the same area (38BU78, 38BU79, and 38BU80). These sites were later given other site numbers by the Lowcountry Council of Governments (1979), resulting in their current designations. These sites are primarily associated with the antebellum and Civil War occupations of Hilton Head Island, although 38BU805 and 38BU811 contain shell middens associated with Pre-Contact Native American occupations. Trinkley (1986) conducted extensive excavations at 38BU805, examining the Ceramic Late
46Brockington and Associates, Inc. (Josh Fletcher), “Hilton Head Airport,” e-mail message, February 10, 2010.
Archaic component and the Civil War-era freedman’s village of Mitchelville component.
Espenshade and Grunden (1989, 1991) surveyed the Palmetto Headlands/Hall Tract, identifying 38BU963, 38BU965, and 38BU966; this tract also contained 38BU79/1151 and 38BU811. The first three sites reflect late nineteenth to early twentieth century African-American occupations on Hilton Head Island and include two houses and one school. Site 38BU79/1151 contains deposits related to the Civil War occupation of Hilton Head Island, including Fort Howell, Camp Baird, and portions of Mitchelville. Site 38BU811 is an extensive Pre-Contact shell midden. Data recovery investigations examined three components of these occupations, including Camp Baird (Legg et al. 1991), the postbellum African Americans (Kennedy et al. 1991), and the freedman’s village of Mitchelville (Espenshade and Grunden 1990).
Trinkley (1989) and Green (2002) examined portions of the Town of Hilton Head Island’s Barker Field project. Trinkley (1989) encountered portions of 38BU806, the remnants of a slave settlement associated with the former Fish Haul Plantation during Drayton’s management. Green (2002) identified three sites in the area he examined (38BU1966, 38BU1967, and 38BU1968); site 38BU1967 is potentially eligible for the NRHP. Webb (2002) assessed the proposed location of a cell tower to the north of the project tract; he considered the resources within one mile of the proposed location. Trinkley and Southerland (2001) examined the proposed Dillon Road Pathway prior to its construction; they identified two sites (38BU1931 and 38BU1932). Site 38BU1931 is a scatter of nineteenth century artifacts that may be associated with the slave settlement within 38BU806. Spirek et al. (1999) identified site 38BU1818 (a group of pilings on the edge of Port Royal Sound) to the northeast of the project tract; they recommended the site potentially eligible for the NRHP.
The South Carolina State Historic Preservation Office (SHPO) has defined a potential historic property, Fish Haul Plantation/Mitchelville, as the portion of Hilton Head Island bounded by the marshes of Coggin Creek south of Beach City Road, with Dillon Road as the west boundary, Mitchelville Road as the north boundary, and Port Royal Sound to the east. This potential historic property contains a number of archaeological sites, some of which could contribute to the NRHP eligibility of the larger property. Agha et al. (2006) surveyed a small parcel of land along Beach City Road that lies across the street from 38BU805. Investigators identified two sites (38BU2163 and 38BU2164) during these investigations. Site 38BU2163 is an unknown Pre-Contact and nineteenth/twentieth century scatter recommended not eligible for the NRHP. Site 38BU2164 has contexts relating to Mitchelville and was recommended potentially eligible for the NRHP. This site is being preserved in place.
6.11 LIGHT EMISSIONS AND VISUAL IMPACTS
6.11.1 Light Emissions
Currently there are two main sources of light emissions from HXD:
• A rotating beacon with alternating white and green lights located east of the end of Runway 03
• MIRLs and REILs on Runway 03/21.
Prior to development of the proposed projects outlined on the ALP on currently undeveloped areas within the HXD property boundary or acquired property, a light emissions impact analysis will be performed to determine the extent of potential impacts.
6.11.2 Visual Impacts
Visual impacts are identified by examining the visual view-shed of the airport and its surrounding environs. The visual view-shed, which takes into account the entire landscape, is comprised of two main aspects: views to and views from the proposed projects.
Prior to development of the proposed projects outlined on the ALP on currently undeveloped areas within the HXD property boundary or acquired property, a visual impact analysis will be performed to determine the extent of potential visual impacts.
6.12 NATURAL RESOURCES AND ENERGY SUPPLY
Executive Order 13123, Greening the Government through Efficient Energy Management,47 encourages each federal agency to expand the use of renewable energy within its facilities and in its activities. Executive Order 13123, Greening the Government through Efficient Energy Management, also requires each federal agency to reduce petroleum use, total energy use and associated air emissions, and water consumption in its facilities.
The assessment of natural resources and energy supply generally entails altered requirements for stationary facilities. Energy consumption impacts associated with the development of the proposed projects outlined on the ALP consider the direct consumption of energy required to construct the facility.
47Federal Register, Vol. 64, No. 109, June 8, 1999, “Greening the Government through Efficient Energy Management,” <http://www.ofee.gov/>, accessed June 15, 2009.
Table 6.10.3-1 Previously Investigated Sites Near the Airport
Hilton Head Island Airport Site Number Name/Description Site Type NRHP Status
38BU78/1155/1156 Ft Sherman and Lines Post-Contact Potentially Eligible 38BU79/1151 Fort Howell/Mitchelville Post-Contact Eligible 38BU80/1153/1154/1155 Ft Walker Post-Contact Not Eligible 38BU805 Fish Haul Pre-Contact/Post-Contact Listed 38BU806 Drayton Fish Haul Slave Row Post-Contact Eligible 38BU807 Midden Post-Contact Potentially Eligible 38BU808 Civil War Camp Post-Contact Potentially Eligible 38BU811 Shell Midden Pre-Contact Eligible 38BU963 Tenant House Post-Contact Not Eligible 38BU965 School Post-Contact Eligible 38BU966 Tenant House Post-Contact Eligible 38BU1818 Pilings Post-Contact Potentially Eligible 38BU1931 Scatter Post-Contact Potentially Eligible 38BU1932 Shell Midden Pre-Contact Not Eligible 38BU1966 Tenant House Post-Contact Not Eligible 38BU1967 Scatter Pre/Post-Contact Potentially Eligible 38BU1968 Scatter Pre/Post-Contact Not Eligible 38BU2163 Scatter Pre/Post-Contact Not Eligible 38BU2164 Scatter/homesite(?) Post-Contact Potentially Eligible Source: Brockington and Associates, Inc. (Josh Fletcher), “Hilton Head Airport,” e-mail message, February 10, 2010.

HILTON HEAD ISLAND AIRPORT
MASTER PLAN UPDATE
Environmental Considerations TALBERT & BRIGHT 63
Prior to development of the proposed projects outlined on the ALP on currently undeveloped areas within the HXD property boundary or acquired property, an energy analysis will be performed to determine the extent of potential impacts.
6.13 NOISE
6.13.1 Definition of Noise
Noise is comprised of three characteristics: frequency (or pitch), amplitude (or loudness), and intensity. Frequency relates to whether noise has a high pitch, low pitch, or contains a combination of pitches ranging from low (rumble) to high (squeal) and is measured in cycles per seconds, or Hertz units. The human ear is capable of discerning noise in the range of 20 to 20,000 Hertz. Various frequencies of noise allow identification of the source. For example, a door slamming shut would produce noise identified with the action.
The intensity of noise is a measure of the magnitude of the sound pressure level (SPL). The ear is responsive to sounds having a tremendous range in intensity. For this reason and because the sensitivity of the ear is more logarithmic than linear in its response, sound levels are expressed on a logarithmic scale. Using a base 10 logarithm to measure relative sound pressure, the range is compressed to a scale of 0 to 9. Thus, this is a system based on the number of tenfold increases, rather than on the actual number itself. The numbers 0 to 9 represent relative quantities, and the quantity measured on this scale is referred to as a level.
Scientists and engineers work with energy quantities that would be proportional to the square of the sound pressure rather than the sound pressure itself. This presents no difficulty, since the logarithm of a squared number is two times the logarithm of the original number; therefore, instead of a range of levels from 0 to 9, the range runs from 0 to 18 for sound pressure squared. The unit on this scale is called a bel. The bel has been divided into 10 smaller units known as decibels (dB), so that the range of sound pressures from the approximate threshold of hearing to rocket noise runs from 0 to 180 decibels. The decibel is the common term used for noise density. Human hearing is less sensitive at low and high frequencies than in the frequency mid-range; therefore, the A-weighted system favoring mid-range frequencies is used to determine how frequencies impact human hearing. The use of this system is denoted as dBA. Increases in noise levels produce varying effects. For example, a 1-dBA increase, except in controlled laboratory conditions, cannot be perceived; a 3-dBA increase is considered barely noticeable in exterior environments; and a 5-dBA increase is considered noticeable in exterior environments.
Since noise varies over time, a statistical parameter, known as the equivalent sound level L(eq), has been developed to quantify the time-varying pattern of noise, or the intensity of the noise. Noise levels are based on an L(eq) descriptor, which refers to the steady-state (constant sound) A-weighted sound level. This sound level contains the same acoustic energy as the actual time-varying sound levels during the same time period. In other words, the fluctuating sound levels of traffic noise over a period of time are represented in terms of a constant noise level with the same energy content.
Noise, often defined as unwanted sound, is one of the most common environmental issues associated with aircraft operations. Aircraft are not the only sources of noise in an urban or suburban surrounding, where interstate and local roadway traffic, rail, industrial, and neighborhood sources also intrude on the everyday quality of life. Sound is a physical phenomenon consisting of minute vibrations that travel through a medium, such as air, and are sensed by the human ear. Whether that sound is interpreted as pleasant or unpleasant depends largely on the listener's current activity, past experience, and attitude toward the source of that sound.
The measurement and human perception of sound involve two basic physical characteristics: intensity and frequency (pitch). Intensity is a measure of the acoustic energy of sound vibrations and is expressed in terms of sound pressure. The higher the sound pressure, the more energy carried by the sound and the louder the perception of that sound. The second important physical characteristic is sound frequency, which is the number of times per second the air vibrates or oscillates. Low-frequency sounds are characterized as rumbles or roars, while high-frequency sounds are typified by sirens or screeches (Figure 6.13-1).
A logarithmic unit known as the dB is used to represent the intensity of a sound. Such a representation is called a sound level. Because of the logarithmic nature of the dB unit, sound levels cannot be added or subtracted directly. However, if a sound's intensity is doubled, the sound level increases by three dB, regardless of the initial sound level. But the total sound level produced by two sounds of different levels is usually only slightly more than the higher of the two. Measured in decibels, the 65 DNL ambient noise contour is compatible with all land uses.

HILTON HEAD ISLAND AIRPORT
MASTER PLAN UPDATE
Environmental Considerations TALBERT & BRIGHT 64
6.13.2 Hilton Head Island Airport Noise Assessment
An assessment of airport noise establishes a baseline of existing and future noise impacts relative to the alternatives considered (expressed in day-night average sound level). This analysis identifies potential increases in noise levels resulting from operations and need for mitigation. Noise contours were developed for the baseline case (existing 2009 conditions) and the 2029 contours depicting the future runway alternative at the Hilton Head Island Airport.
The Hilton Head Island Airport has a noise abatement program in place to limit noise impacts on the local residences from aircraft operating to and from the Airport. The intent is to identify a common takeoff procedure for pilots to use to help reduce the noise effects.
For the noise analysis, the FAA computer-generated Integrated Noise Model (INM Version 7.0A) was used to evaluate aircraft noise at HXD based on 2009 and 2029 activity levels, from which a Noise Exposure Map (NEM) was prepared for the existing and future airfield configurations. Measured in decibels, the 65 DNL ambient noise contour is compatible with land uses; however, the 60 DNL was also calculated and is shown on the exhibits. The DNL is determined from a cumulative exposure of sound (time and level), measured in decibels, and averaged over the span of one year.
Typically, noise sensitive areas include residential areas within the 65 DNL and above, and public facilities including schools, hospitals, churches, and recreational areas. The 2029 operations numbers represent the anticipated noise exposure from the development of the 5,400-foot future runway. The 2009 noise exposure represents a baseline from which to compare the current and anticipated noise levels. Noise levels were modeled using the total number of daily operations averaged over each of the approach and departure tracks for existing and future traffic.
Table 6.13.2-1 lists the operations by aircraft type and Table 6.13.2-2 describes the assigned civilian aircraft used for the 2009 and 2029 NEMs. In 2009, annual aircraft operations at HXD totaled 38,237 and are forecast to reach 56,901 by 2029. Of these future operations, approximately 32 percent were to be performed by single-engine aircraft, 20 percent by twin-engine aircraft, 35 percent by turboprop aircraft, and 10 percent by jets. Rotorcraft operations, which utilize the airfield differently than fixed-wing aircraft, were projected to account for approximately 3 percent of the annual operations.
Table 6.13.2-3 describes the flight tracks used to prepare the NEM. The NEMs generated for HXD involved developing conditions to resemble actual noise conditions. The assignment of runway use and flight tracks was determined using information from the 2008 FAR Part 150 Noise Study for
the Hilton Head Airport.48 Three touch and go flight tracks were used to approximate the noise impact from training flights at the Airport.
Table 6.13.2-1 Operations Forecast by Aircraft Type
Year
Single-Engine (32%)
Multi-Engine (20%)
Turboprop (35%)
Jet (10%)
Helicopter (3%)
Total (100%)
2009 12,236 7,647 13,383 3,824 1,147 38,237 2029 18,208 11,380 19,915 5,690 1,707 56,901
Source: Talbert & Bright, Inc., January 2010.
Table 6.13.2-2 Assigned Integrated Noise Model Aircraft
Hilton head Island Airport
Aircraft Category Aircraft Type
Equivalent INM Aircraft
INM Aircraft
DesignationSmall single-engine propeller
4 to 6 seat cabin constant-speed propeller
Composite single-engine family
GASEPF
Small single-engine propeller
4 to 6 seat cabin variable-speed propeller
Composite single-engine family
GASEPV
Small twin-engine propeller
6 to 8 seat cabin constant-speed propeller
Beechcraft Baron BEC58P
Medium-cabin turboprop
20 to 30 seat cabin turbine propeller
De Havilland DHC-8 “Dash 8”
DHC8
Small-cabin business jet
4 to 8 seat cabin turbofan
Cessna Citation 550 Series
CNA55B
Medium-cabin business jet
8 to 12 seat cabin turbofan
Learjet 30, 40, 50 Series
LEAR35
Business-class helicopter
4 to 6 seat cabin turbine propeller
Bell Jet Ranger Series
B206L
Note: The INM aircraft database does not contain all aircraft. A FAA-approved list of aircraft has been identified to serve as substitutes for equivalent aircraft based on the number of seats and engines, type of propulsion system, and aircraft weight. Source: Talbert & Bright, Inc., January 2010.
The following assumptions were used to determine the noise contours:
• 3 percent of the operations occur at night (10 p.m. to 7 a.m.)
• 66 percent of the operations occur on Runway 21 with 34 percent on Runway 03
48ESA Airports and Wilbur Smith Associates, “Hilton Head Island Airport FAR Part 150 Noise and Land Use Compatibility Study, Noise Exposure Maps and Noise Compatibility Program,” prepared for Beaufort County and Hilton Head Island Airport, January 2008.
• 5 percent of the single-engine and multi-engine reciprocating aircraft operations were touch and go’s
• 50 percent of the operations are takeoffs and 50 percent are landings
Table 6.13.2-3 Assigned Integrated Noise Model Flight Tracks
Hilton Head Island Airport Runway End Departure Track1 Arrival Track1 Helicopter TrackRunway 03 Straight departure
(50 NM) Straight arrival (50 NM)
Approaches from south, departures to the north
Runway 21 Straight departure (50 NM)
Straight arrival (50 NM)
Approaches from south, departures to the north
Note: 1Under visual flight conditions, aircraft arrive and depart the airport traffic area along unspecified vectors. For the purpose of the INM, it is assumed arriving and departing itinerant traffic fly the runway heading. It should be noted that changes in the track configuration (traffic pattern) have relatively small impacts on the noise contours, since the most significant noise incidents are caused at the point of takeoff and during the initial climb out beyond the opposite runway threshold. Source: ESA Airports and Wilbur Smith Associates, “Hilton Head Island Airport FAR Part 150 Noise and Land Use Compatibility Study, Noise Exposure Maps and Noise Compatibility Program,” prepared for Beaufort County and Hilton Head Island Airport, January 2008. Talbert & Bright, Inc., January 2010.
These assumptions are based on recorded flight operations data, as well as the 2008 FAR Part 150 Noise Study, and represent the current and projected runway utilization at HXD.
The existing and future operations were divided among the runway ends as per the aforementioned assumptions. These operations were then divided amongst the arrival and departure tracks. The final categorization of the operations was among aircraft type approach and arrival flight tracks at HXD. The single-engine propeller operations and jet operations were split amongst the two types of aircraft in each of these categories; i.e., 50 percent operations for the GASEPF and 50 percent for the GASEPV.
The operations for each arrival and departure tracks were calculated for 2009 and 2029.
The jet aircraft used in INM were chosen based on existing and proposed aircraft operating at HXD. The Learjet 35 was chosen to represent 50 percent of the operations because it is one of the louder business jets currently flying and an effort was made to not underestimate the noise impact by this category of aircraft.
The INM program is also able to simulate the noise impact from rotorcraft operations. These operations are represented by the Bell 206 Jet Ranger. This
HILTON HEAD ISLAND AIRPORT
MASTER PLAN UPDATE
Environmental Considerations TALBERT & BRIGHT 65
helicopter was chosen due to its high level of use among general aviation operators.
Noise levels higher than 65 db DNL, including occasional flights generating higher than normal single-noise event levels, were not expected to contribute to substantial noise impacts based on the projected frequency of larger aircraft using HXD. Commonly, the noise generated during the aircraft’s approach exceeds that of the takeoff.
With respect to departures, typically, higher performance aircraft are capable of much steeper departure angles than single- and twin-engine aircraft, which result in lower noise exposure due to superior climb performance. The transition to more frequent turbine traffic, including small- to medium-cabin business jets, does not significantly add to noise levels at HXD. When assessed as a single-noise event, turbine aircraft produce a DNL of 75 decibels to 95 decibels, which is equivalent to noise along a busy urban street. These noise levels do not extend beyond the airfield taxiway system. Noise from turbine aircraft is largely a function of aircraft model, engine type, and pilot operating characteristics, including the use of power settings that are largely based on payload weight, flap settings, and use of thrust-reversers. Also, the new generation of Stage 3 jets is quieter than the predominant fleet of Stage 2 business jets. As a matter of comparison, the quieter Stage 2 and 3 business jets, such as the Citation Excel and Hawker 1000, have a noise level equal to that of the medium to large turboprop planes, such as the De Havilland Dash 8 and Beechcraft King Air aircraft, which currently conduct several thousand operations a year at HXD.
Cumulative noise levels at HXD would be consistent with an increase in total operations, as the larger noise footprint in the future would be attributed from both local and transient flights.
It is desirable that the airport acquires areas impacted by the 70 DNL contour or greater. Typically, this level of noise impact beyond airport property is associated with large, high-activity airports. For airports with low activity, noise contours of 70 DNL and above are usually contained within airport property. Often, the 65 DNL noise contour extends off airport property. Land uses that should not be located within areas exposed to 65 DNL and above include all residential development. When public institutions, such as schools, hospitals, and churches, are constructed within noise contours of 65 DNL or higher, measures should be taken to achieve reduced noise levels. Most land uses are compatible in areas impacted by noise levels less than 65 DNL.
Tables 6.13.2-4 and 6.13.2-5 (page 66) outline aircraft operation forecasts from the forecast section (pages 17 through 23) used to create the noise contours to evaluate potential noise impacts for existing and future operations using the flight tracks from the FAR Part 150 Noise and Land Use Compatibility Study (Figure 6.13.2-1, page 67).
The existing noise contours show no significant noise impact to the areas adjacent to HXD (Figure 5.1.2-1, page 41). The 65 DNL sound exposure contour encompasses 126.5 acres, of which 32.2 acres extend off existing airport property.
The future operations forecast shows an increase in runway usage; therefore, the future sound exposure level increased in size (135.3 acres) over the existing baseline model (Figure 5.1.4-1, page 44). This increase can be attributed to an increase in the total number of operations and a slight increase in operations by heavier aircraft. The future 65 DNL noise contour extends 13.5 acres outside the existing property line on the Runway 21 end; however, this property will be acquired as part of the runway extension and RPZ requirements. The 65 DNL extends 27.5 acres outside the existing property on the Runway 03. The model showed no significant impact on adjacent areas. The future airport boundaries would either include this land in fee simple ownership or the Airport would control the land by avigation easement. Other adjacent parcels, upon which the 65 DNL noise contours overlap, are undeveloped. Therefore, all land use adjacent to airport property would be considered compatible according to FAA guidelines.
6.13.3 Noise Compatibility Study49
The FAR Part 150 Noise and Land Use Compatibility Study performed at the Hilton Head Island Airport made the following recommendations:
• Continue to encourage the use of the Broad Creek noise abatement approach to Runway 03 (Figure 2.2.5.5-2, page 10) to the greatest extent possible
• Ensure that land use planning and control continue within the flight close-in to the Airport. It was recommended that the AOD discretionary noise level be revised from 60 DNL to 55 DNL. It was recommended that the AOD significant noise level of 65 DNL remain the same because it is an FAA definition
• Consider the voluntary sound insulation of St. James Baptist Church. It would be decided by the church whether or not it wanted to participate in the sound insulation program
• Prepare a noise compatibility plan brochure that identifies the noise abatement program. The brochure would be made available to:
Pilots who fly in and out of the Airport
ATCT
Land use planners
Public
49Ibid.
• Continuation of the Airport noise complaint hotline
The study was submitted to the FAA in 2008 for review and approval.
6.14 SECONDARY (INDUCED) IMPACTS
Positive economic impacts, due to development of the proposed projects outlined on the ALP, could include an increase in business locations in the vicinity of HXD, as well as economic development because of new businesses locating to the region. Construction of the proposed projects outlined on the ALP could also directly benefit local retailers and commercial establishments particularly those providing construction equipment and materials. In addition, the proposed projects would create temporary employment opportunities for laborers, equipment operators, and other construction-type employees.
Also during the construction period, retail and service facilities in the vicinity of the HXD should experience an increase in sales from construction employees.
Negative impacts would result from the expenditure of public funds for construction and long-term maintenance of the proposed projects outlined on the ALP. Regardless of how the facility is funded, there would be an additional economic burden imposed on the general public.
Overall, any principle negative social impacts on existing or planned property from the proposed projects outlined on the ALP are not expected to cause shifts in population patterns or growth or place demands on public services, as outlined in FAA Order 1050.1E Change 1 Environmental Impacts: Policies and Procedures (March 20, 2006), Appendix A, Section 15.
6.15 SOCIOECONOMIC IMPACTS, ENVIRONMENTAL JUSTICE, AND CHILDREN'S ENVIRONMENTAL HEALTH AND SAFETY RISKS
6.15.1 Socioeconomic Impacts
The population of Beaufort County and the Town of Hilton Head Island was 139,333 and 33,913, respectively, in 2008 according to the South Carolina Budget and Control Board, Office of Research and Statistics. Current projections anticipate that Beaufort County will increase its population an additional 3.0 percent by 2010. From 2000 to 2035, it is expected to increase an additional 90.4 percent, as illustrated in the Table 6.15.1-1 (page 68).
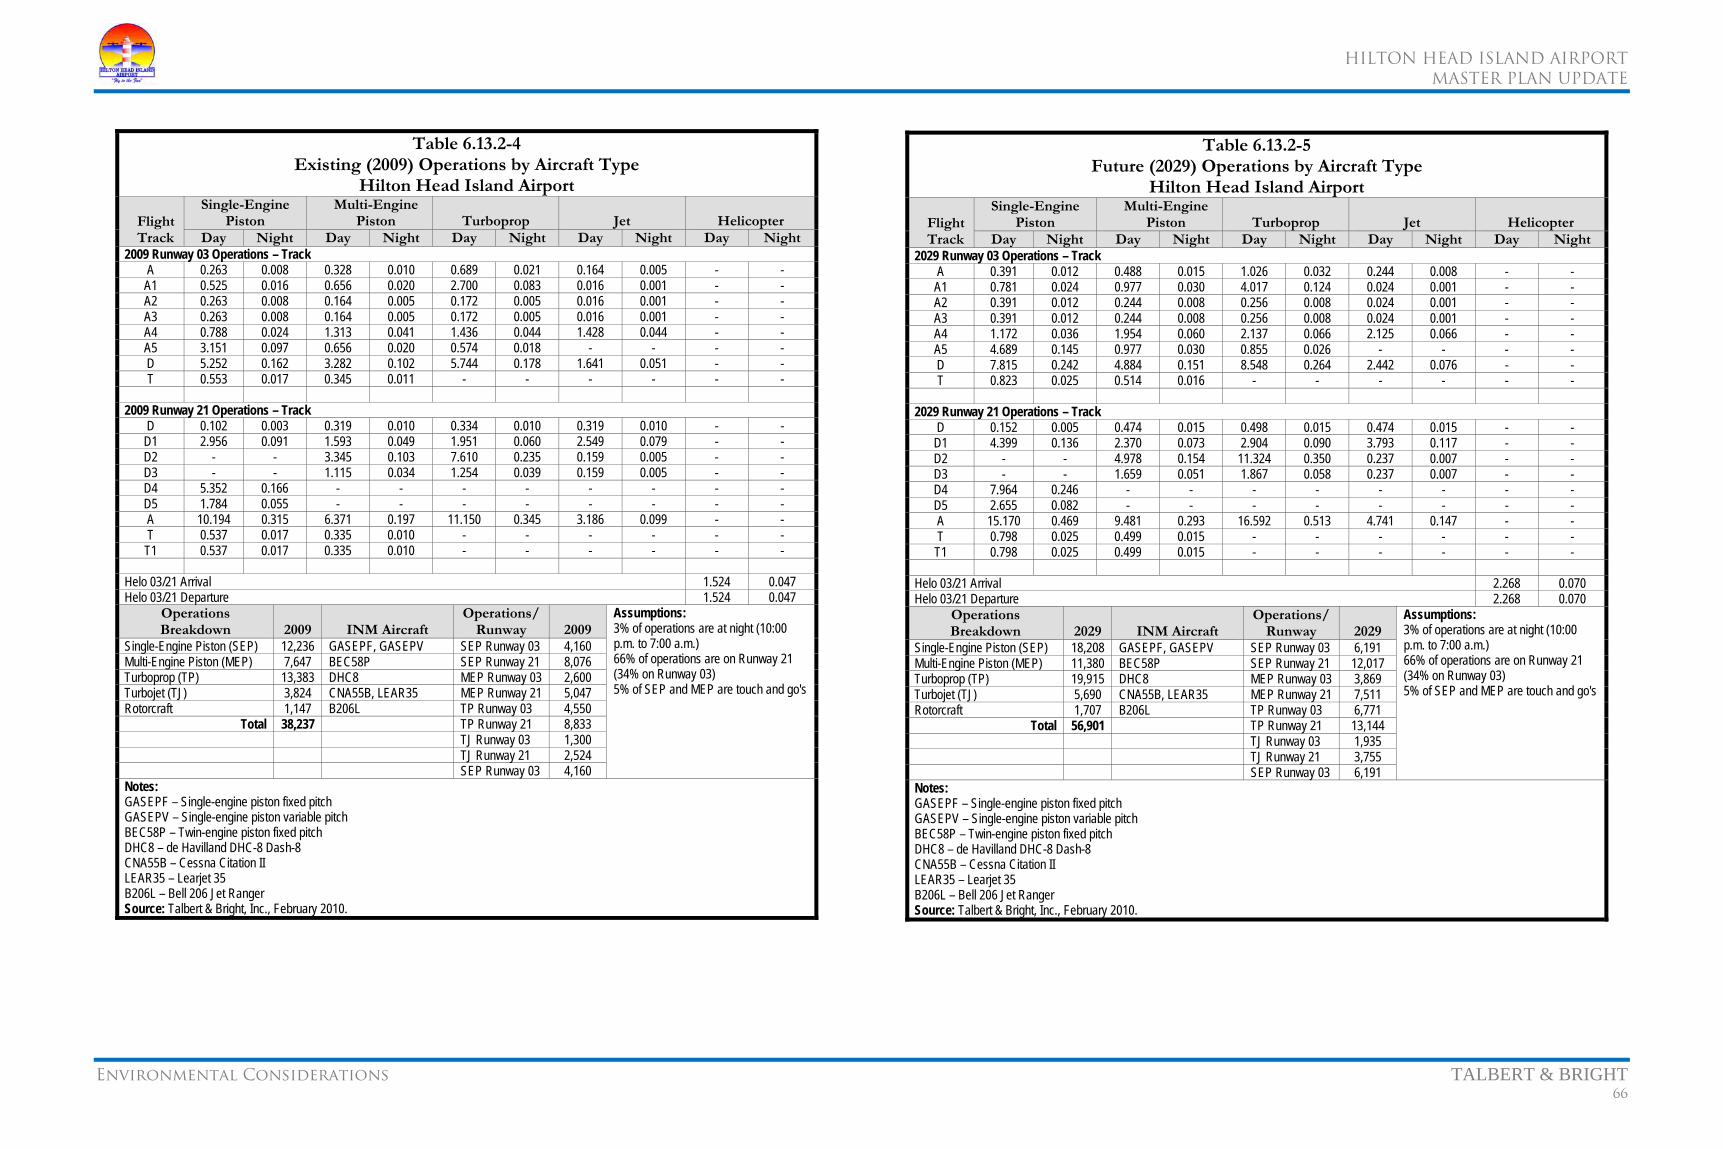
HILTON HEAD ISLAND AIRPORT
MASTER PLAN UPDATE
Environmental Considerations TALBERT & BRIGHT 66
Table 6.13.2-4 Existing (2009) Operations by Aircraft Type
Hilton Head Island Airport
Flight Track
Single-Engine Piston
Multi-Engine Piston Turboprop Jet Helicopter
Day Night Day Night Day Night Day Night Day Night2009 Runway 03 Operations – Track
A 0.263 0.008 0.328 0.010 0.689 0.021 0.164 0.005 - - A1 0.525 0.016 0.656 0.020 2.700 0.083 0.016 0.001 - - A2 0.263 0.008 0.164 0.005 0.172 0.005 0.016 0.001 - - A3 0.263 0.008 0.164 0.005 0.172 0.005 0.016 0.001 - - A4 0.788 0.024 1.313 0.041 1.436 0.044 1.428 0.044 - - A5 3.151 0.097 0.656 0.020 0.574 0.018 - - - - D 5.252 0.162 3.282 0.102 5.744 0.178 1.641 0.051 - - T 0.553 0.017 0.345 0.011 - - - - - -
2009 Runway 21 Operations – Track
D 0.102 0.003 0.319 0.010 0.334 0.010 0.319 0.010 - - D1 2.956 0.091 1.593 0.049 1.951 0.060 2.549 0.079 - - D2 - - 3.345 0.103 7.610 0.235 0.159 0.005 - - D3 - - 1.115 0.034 1.254 0.039 0.159 0.005 - - D4 5.352 0.166 - - - - - - - - D5 1.784 0.055 - - - - - - - - A 10.194 0.315 6.371 0.197 11.150 0.345 3.186 0.099 - - T 0.537 0.017 0.335 0.010 - - - - - - T1 0.537 0.017 0.335 0.010 - - - - - -
Helo 03/21 Arrival 1.524 0.047 Helo 03/21 Departure 1.524 0.047
Operations Breakdown 2009 INM Aircraft
Operations/Runway 2009
Assumptions: 3% of operations are at night (10:00 p.m. to 7:00 a.m.) 66% of operations are on Runway 21 (34% on Runway 03) 5% of SEP and MEP are touch and go's
Single-Engine Piston (SEP) 12,236 GASEPF, GASEPV SEP Runway 03 4,160 Multi-Engine Piston (MEP) 7,647 BEC58P SEP Runway 21 8,076 Turboprop (TP) 13,383 DHC8 MEP Runway 03 2,600 Turbojet (TJ) 3,824 CNA55B, LEAR35 MEP Runway 21 5,047 Rotorcraft 1,147 B206L TP Runway 03 4,550
Total 38,237 TP Runway 21 8,833 TJ Runway 03 1,300 TJ Runway 21 2,524 SEP Runway 03 4,160
Notes: GASEPF – Single-engine piston fixed pitch GASEPV – Single-engine piston variable pitch BEC58P – Twin-engine piston fixed pitch DHC8 – de Havilland DHC-8 Dash-8 CNA55B – Cessna Citation II LEAR35 – Learjet 35 B206L – Bell 206 Jet Ranger Source: Talbert & Bright, Inc., February 2010.
Table 6.13.2-5 Future (2029) Operations by Aircraft Type
Hilton Head Island Airport
Flight Track
Single-Engine Piston
Multi-Engine Piston Turboprop Jet Helicopter
Day Night Day Night Day Night Day Night Day Night2029 Runway 03 Operations – Track
A 0.391 0.012 0.488 0.015 1.026 0.032 0.244 0.008 - - A1 0.781 0.024 0.977 0.030 4.017 0.124 0.024 0.001 - - A2 0.391 0.012 0.244 0.008 0.256 0.008 0.024 0.001 - - A3 0.391 0.012 0.244 0.008 0.256 0.008 0.024 0.001 - - A4 1.172 0.036 1.954 0.060 2.137 0.066 2.125 0.066 - - A5 4.689 0.145 0.977 0.030 0.855 0.026 - - - - D 7.815 0.242 4.884 0.151 8.548 0.264 2.442 0.076 - - T 0.823 0.025 0.514 0.016 - - - - - -
2029 Runway 21 Operations – Track
D 0.152 0.005 0.474 0.015 0.498 0.015 0.474 0.015 - - D1 4.399 0.136 2.370 0.073 2.904 0.090 3.793 0.117 - - D2 - - 4.978 0.154 11.324 0.350 0.237 0.007 - - D3 - - 1.659 0.051 1.867 0.058 0.237 0.007 - - D4 7.964 0.246 - - - - - - - - D5 2.655 0.082 - - - - - - - - A 15.170 0.469 9.481 0.293 16.592 0.513 4.741 0.147 - - T 0.798 0.025 0.499 0.015 - - - - - - T1 0.798 0.025 0.499 0.015 - - - - - -
Helo 03/21 Arrival 2.268 0.070 Helo 03/21 Departure 2.268 0.070
Operations Breakdown 2029 INM Aircraft
Operations/Runway 2029
Assumptions: 3% of operations are at night (10:00 p.m. to 7:00 a.m.) 66% of operations are on Runway 21 (34% on Runway 03) 5% of SEP and MEP are touch and go's
Single-Engine Piston (SEP) 18,208 GASEPF, GASEPV SEP Runway 03 6,191 Multi-Engine Piston (MEP) 11,380 BEC58P SEP Runway 21 12,017 Turboprop (TP) 19,915 DHC8 MEP Runway 03 3,869 Turbojet (TJ) 5,690 CNA55B, LEAR35 MEP Runway 21 7,511 Rotorcraft 1,707 B206L TP Runway 03 6,771
Total 56,901 TP Runway 21 13,144 TJ Runway 03 1,935 TJ Runway 21 3,755 SEP Runway 03 6,191
Notes: GASEPF – Single-engine piston fixed pitch GASEPV – Single-engine piston variable pitch BEC58P – Twin-engine piston fixed pitch DHC8 – de Havilland DHC-8 Dash-8 CNA55B – Cessna Citation II LEAR35 – Learjet 35 B206L – Bell 206 Jet Ranger Source: Talbert & Bright, Inc., February 2010.

HILTON HEAD ISLAND AIRPORT
MASTER PLAN UPDATE
Environmental Considerations TALBERT & BRIGHT 67

HILTON HEAD ISLAND AIRPORT
MASTER PLAN UPDATE
Environmental Considerations TALBERT & BRIGHT 68
Table 6.15.1-1 Population Projections
Hilton Head Island Airport
Year
Hilton Head Island Beaufort County South Carolina
Population Percent Change Population
Percent Change Population
Percent Change
1970 – – 51,136 – 2,590,516 – 1980 11,344 – 65,364 27.8% 3,121,820 20.5% 1990 23,694 108.9% 86,425 32.2% 3,486,703 11.7% 2000 33,862 42.9% 120,937 39.9% 4,012,012 15.1% 2005 34,855 2.9% 139,333 15.2% 4,254,989 6.1% 2008 33,913 -2.7% 150,415 8.0% 4,479,800 5.3% 2010 – – 156,070 3.8% 4,549,150 1.5% 2015 – – 170,640 9.3% 4,784,700 5.2% 2020 – – 185,220 8.5% 5,020,400 4.9% 2025 – – 199,780 7.9% 5,256,080 4.7% 2030 – – 215,270 7.8% 5,488,460 4.4% 2035 – – 230,240 7.0% 5,722,720 4.3% Source: South Carolina Budget and Control Board, Office of Research and Statistics, “The South Carolina Statistical Abstract 2008,” <http://www.ors2.state.sc.us/>accessed September 15, 2009.
Table 6.15.1-2 illustrates the current demographic characteristics for Beaufort County. Table 6.15.1-3 illustrates the major employers for Beaufort County.
Prior to development of the proposed projects outlined on the ALP or additional property to be acquired, an analysis will be performed to determine whether there will be any impacts to the socioeconomics of the area.
6.15.2 Environmental Justice
Executive Order 12898, Federal Actions to Address Environmental Justice in Minority Populations and Low-Income Populations,50 states that to the greatest extent practicable and permitted by law, each federal agency shall make achieving environmental justice part of its mission by identifying and addressing, as appropriate, disproportionately high and adverse human health or environmental effects of its programs, policies, and activities on minority and low-income populations.
Disproportionate can mean that an impact occurs predominantly in environmental justice populations (those populations with percentages of low-income and/or minority individuals above the percentages for the county in which the individuals live) or that the impact is more severe in
50Federal Register, Vol. 59, No. 32, February 16, 1994, “Federal Actions To Address Environmental Justice in Minority Populations and Low-Income Populations,” <http://www.epa.gov/>, accessed September 15, 2009.
Table 6.15.1-2 General Demographic Characteristics (2000)
Hilton Head Island Airport
Subject
Hilton Head Island
Beaufort County
South Carolina
Population Total population 33,862 120,937 4,012,012
Sex and Age Male 16,947 61,193 1,948,929Female 16,915 59,744 2,063,083Under 5 years 1,502 8,110 264,6795 to 9 years 1,671 8,033 285,24310 to 14 years 1,736 7,747 290,47915 to 19 years 1,557 8,722 295,37720 to 24 years 1,714 10,002 281,71425 to 34 years 3,985 16,434 560,83135 to 44 years 4,319 16,433 625,12445 to 54 years 4,433 14,019 550,32155 to 59 years 2,359 6,397 206,76260 to 64 years 2,336 6,286 166,14965 to 74 years 4,744 11,329 270,04875 to 84 years 2,653 5,913 165,01685 years and over 753 1,512 50,269Median age (years) 46.0 35.8 35.418 years and over 28,004 92,794 3,002,371Male 13,931 46,859 1,432,4113Female 14,073 45,935 1,569,958Average household size 2.32 2.51 2.53Average family size 2.68 2.90 3.02
Housing Occupancy Total housing units 24,647 60,509 1,753,670Occupied housing units 14,408 45,532 1,533,854Vacant housing units 10,239 14,977 219,816For seasonal, recreational, or occasional use 7,360 9,613 70,198Homeowner vacancy rate (percent) 1.5 1.6 1.9Rental vacancy rate (percent) 40.6 19.2 12.0Occupied housing units 14,408 45,532 1,533,854Owner-occupied housing units 11,191 33,338 1,107,617Renter-occupied housing units 3,217 12,194 426,237Average household size of owner-occupied unit 2.21 2.44 2.59Average household size of renter-occupied unit 2.70 2.71 2.37
Source: U.S. Census Bureau, Census 2000, “Profiles of General Demographic Characteristics 2000 Census of Population and Housing, South Carolina,” <http://www2.census.gov/>, accessed September 15, 2009.
Table 6.15.1-3 Major Employers in Beaufort
County Hilton Head Island Airport
CompanyBeaufort County School District Beaufort Jasper Water & Sewer Authority Beaufort County Government Beaufort Memorial Hospital Callaswassie Island Co. LP CareCore National, LLC Columbia Sussex Corp. Cypress Club, Inc. Department of Defense Hargray Communications Group, Inc. Lowes Home Centers, Inc. Marine Corps Community Services Marriott Resorts Hospitality Corp. National Health Corp. OS Restaurant Services, Inc. Publix Supermarkets Sea Pines Resort, LLC Starwood Hotels and Resorts Technical College of the Lowcountry Tenet Health System, Hilton Head, Inc. The Greenery, Inc. University of South Carolina Beaufort Wal-Mart Associates, Inc. Source: Lowcountry Economic Network (Angela Williams, Director of Communications and Research, “Key Employers,” e-mail message, September 16, 2009.
these populations than non-environmental justice populations. The terms minority persons, minority population, low-income persons, and low-income populations, as defined are useful in understanding environmental justice.
• Minority populations are
Origins of any of the black racial groups from Africa
Hispanic origins such as Mexican, Puerto Rican, Cuban, Central or South American, or other Spanish culture or origin, regardless of race
Asian origins such as any of the original peoples of the Far East, Southeast Asia, or the Indian subcontinent
America Indian and Alaskan Native people such as those with origins in any of the original people of North America and who
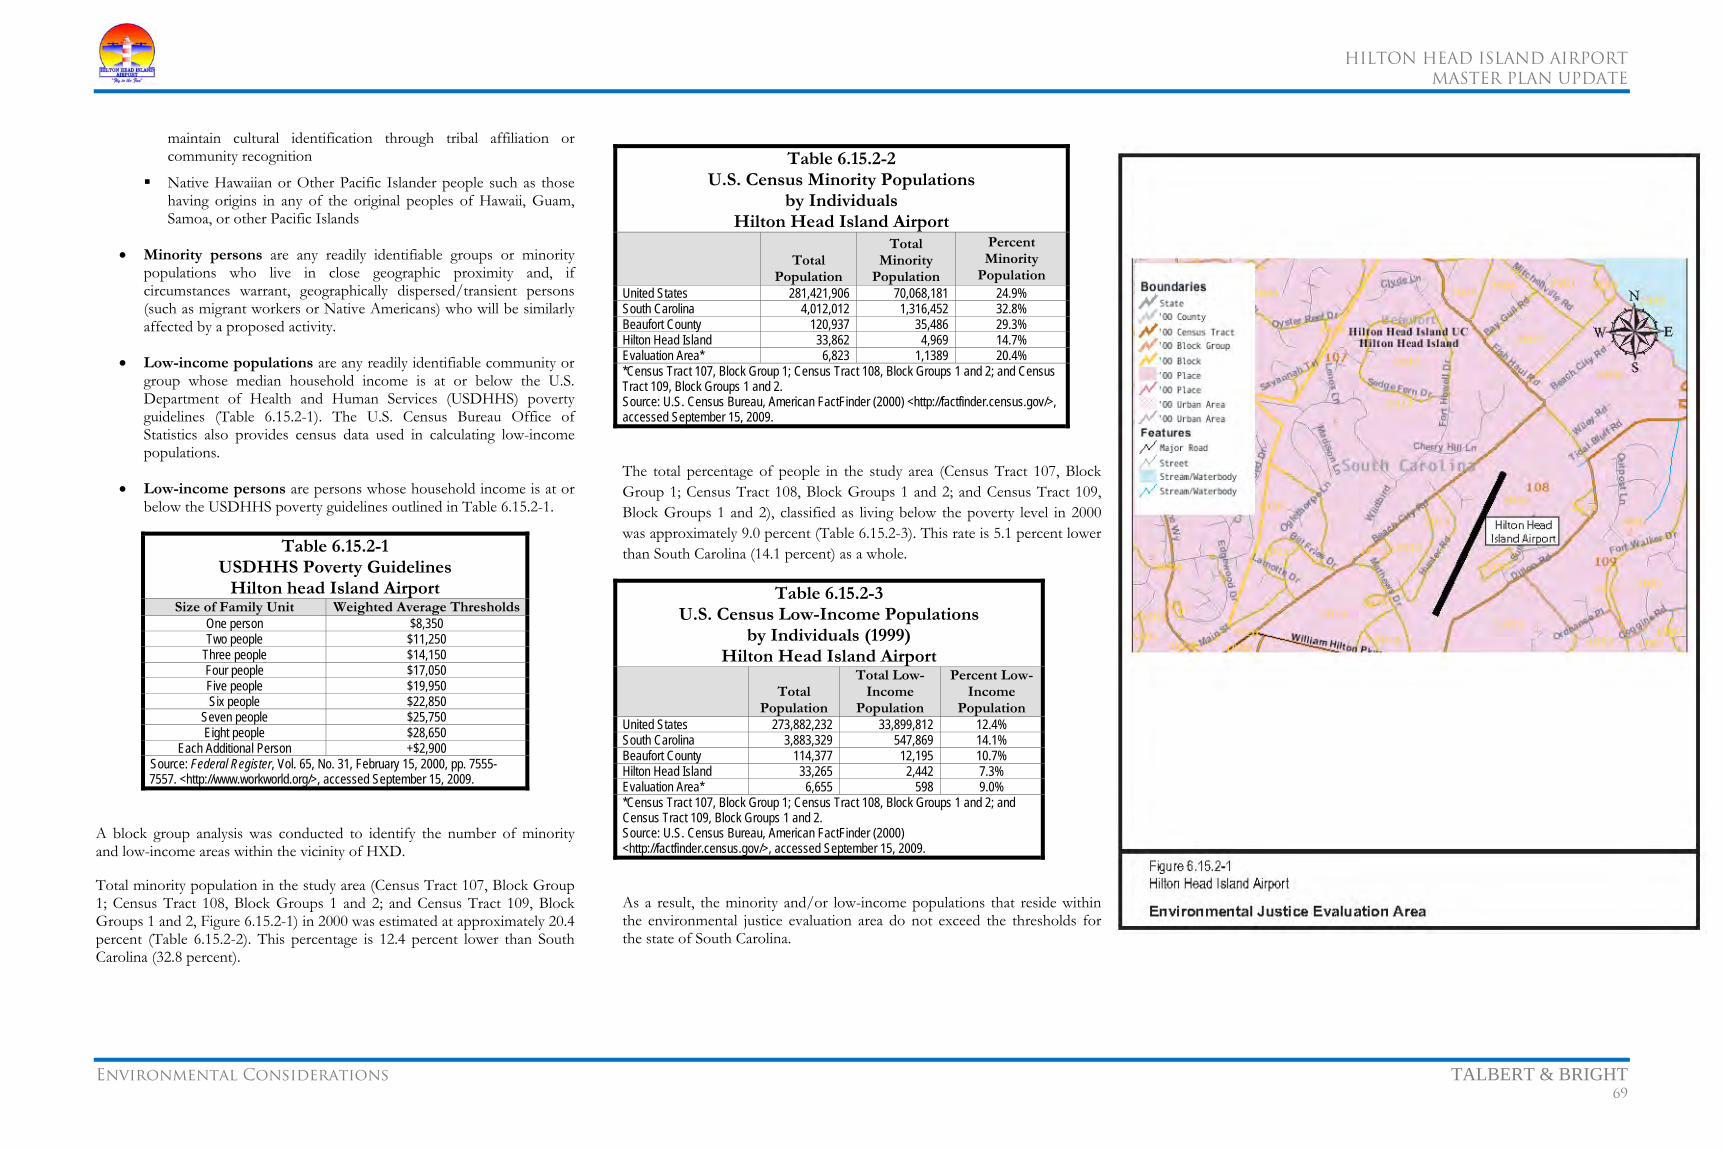
HILTON HEAD ISLAND AIRPORT
MASTER PLAN UPDATE
Environmental Considerations TALBERT & BRIGHT 69
maintain cultural identification through tribal affiliation or community recognition
Native Hawaiian or Other Pacific Islander people such as those having origins in any of the original peoples of Hawaii, Guam, Samoa, or other Pacific Islands
• Minority persons are any readily identifiable groups or minority populations who live in close geographic proximity and, if circumstances warrant, geographically dispersed/transient persons (such as migrant workers or Native Americans) who will be similarly affected by a proposed activity.
• Low-income populations are any readily identifiable community or group whose median household income is at or below the U.S. Department of Health and Human Services (USDHHS) poverty guidelines (Table 6.15.2-1). The U.S. Census Bureau Office of Statistics also provides census data used in calculating low-income populations.
• Low-income persons are persons whose household income is at or below the USDHHS poverty guidelines outlined in Table 6.15.2-1.
Table 6.15.2-1 USDHHS Poverty Guidelines
Hilton head Island Airport Size of Family Unit Weighted Average Thresholds
One person $8,350 Two people $11,250
Three people $14,150 Four people $17,050 Five people $19,950 Six people $22,850
Seven people $25,750 Eight people $28,650
Each Additional Person +$2,900 Source: Federal Register, Vol. 65, No. 31, February 15, 2000, pp. 7555-7557. <http://www.workworld.org/>, accessed September 15, 2009.
A block group analysis was conducted to identify the number of minority and low-income areas within the vicinity of HXD.
Total minority population in the study area (Census Tract 107, Block Group 1; Census Tract 108, Block Groups 1 and 2; and Census Tract 109, Block Groups 1 and 2, Figure 6.15.2-1) in 2000 was estimated at approximately 20.4 percent (Table 6.15.2-2). This percentage is 12.4 percent lower than South Carolina (32.8 percent).
Table 6.15.2-2 U.S. Census Minority Populations
by Individuals Hilton Head Island Airport
Total
Population
Total Minority
Population
Percent Minority
Population United States 281,421,906 70,068,181 24.9% South Carolina 4,012,012 1,316,452 32.8% Beaufort County 120,937 35,486 29.3% Hilton Head Island 33,862 4,969 14.7% Evaluation Area* 6,823 1,1389 20.4% *Census Tract 107, Block Group 1; Census Tract 108, Block Groups 1 and 2; and Census Tract 109, Block Groups 1 and 2. Source: U.S. Census Bureau, American FactFinder (2000) <http://factfinder.census.gov/>, accessed September 15, 2009.
The total percentage of people in the study area (Census Tract 107, Block Group 1; Census Tract 108, Block Groups 1 and 2; and Census Tract 109, Block Groups 1 and 2), classified as living below the poverty level in 2000 was approximately 9.0 percent (Table 6.15.2-3). This rate is 5.1 percent lower than South Carolina (14.1 percent) as a whole.
Table 6.15.2-3 U.S. Census Low-Income Populations
by Individuals (1999) Hilton Head Island Airport
Total
Population
Total Low-Income
Population
Percent Low-Income
Population United States 273,882,232 33,899,812 12.4% South Carolina 3,883,329 547,869 14.1% Beaufort County 114,377 12,195 10.7% Hilton Head Island 33,265 2,442 7.3% Evaluation Area* 6,655 598 9.0% *Census Tract 107, Block Group 1; Census Tract 108, Block Groups 1 and 2; and Census Tract 109, Block Groups 1 and 2. Source: U.S. Census Bureau, American FactFinder (2000) <http://factfinder.census.gov/>, accessed September 15, 2009.
As a result, the minority and/or low-income populations that reside within the environmental justice evaluation area do not exceed the thresholds for the state of South Carolina.
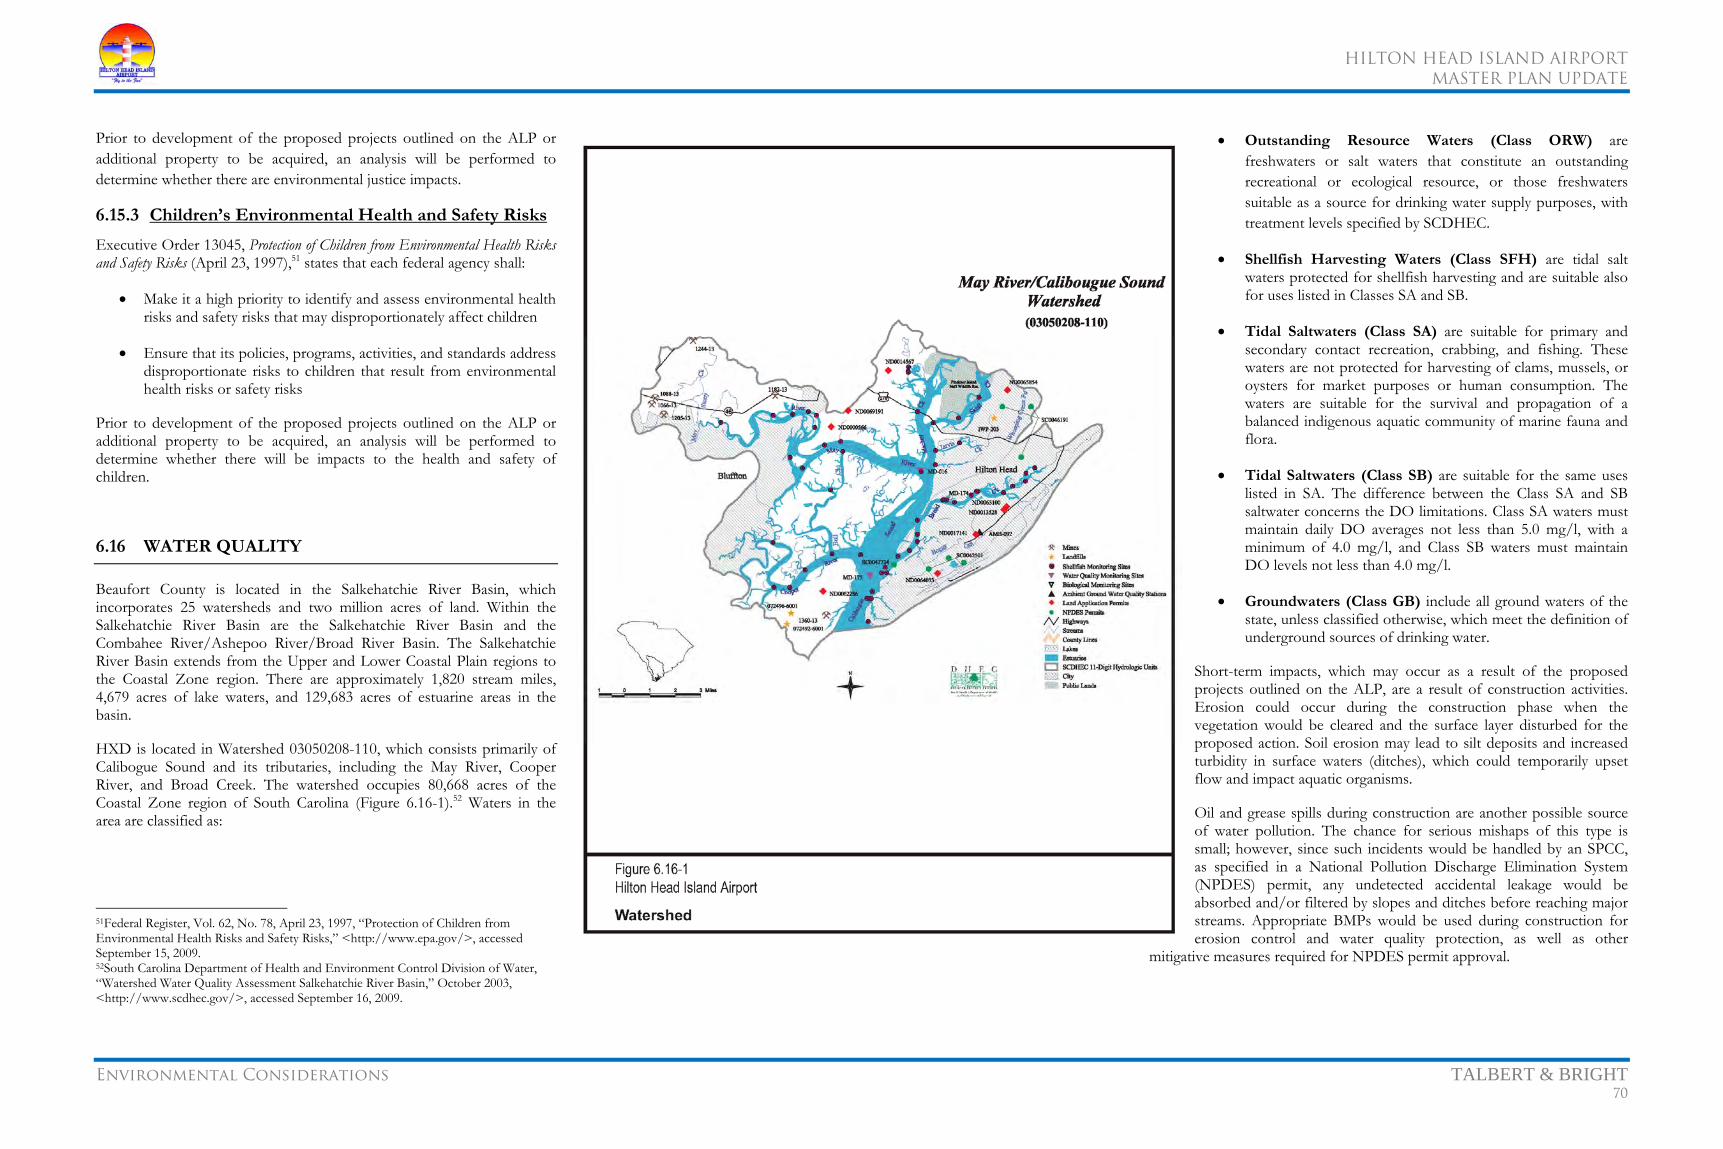
HILTON HEAD ISLAND AIRPORT
MASTER PLAN UPDATE
Environmental Considerations TALBERT & BRIGHT 70
Prior to development of the proposed projects outlined on the ALP or additional property to be acquired, an analysis will be performed to determine whether there are environmental justice impacts.
6.15.3 Children’s Environmental Health and Safety Risks
Executive Order 13045, Protection of Children from Environmental Health Risks and Safety Risks (April 23, 1997),51 states that each federal agency shall:
• Make it a high priority to identify and assess environmental health risks and safety risks that may disproportionately affect children
• Ensure that its policies, programs, activities, and standards address disproportionate risks to children that result from environmental health risks or safety risks
Prior to development of the proposed projects outlined on the ALP or additional property to be acquired, an analysis will be performed to determine whether there will be impacts to the health and safety of children.
6.16 WATER QUALITY
Beaufort County is located in the Salkehatchie River Basin, which incorporates 25 watersheds and two million acres of land. Within the Salkehatchie River Basin are the Salkehatchie River Basin and the Combahee River/Ashepoo River/Broad River Basin. The Salkehatchie River Basin extends from the Upper and Lower Coastal Plain regions to the Coastal Zone region. There are approximately 1,820 stream miles, 4,679 acres of lake waters, and 129,683 acres of estuarine areas in the basin.
HXD is located in Watershed 03050208-110, which consists primarily of Calibogue Sound and its tributaries, including the May River, Cooper River, and Broad Creek. The watershed occupies 80,668 acres of the Coastal Zone region of South Carolina (Figure 6.16-1).52 Waters in the area are classified as:
51Federal Register, Vol. 62, No. 78, April 23, 1997, “Protection of Children from Environmental Health Risks and Safety Risks,” <http://www.epa.gov/>, accessed September 15, 2009. 52South Carolina Department of Health and Environment Control Division of Water, “Watershed Water Quality Assessment Salkehatchie River Basin,” October 2003, <http://www.scdhec.gov/>, accessed September 16, 2009.
• Outstanding Resource Waters (Class ORW) are freshwaters or salt waters that constitute an outstanding recreational or ecological resource, or those freshwaters suitable as a source for drinking water supply purposes, with treatment levels specified by SCDHEC.
• Shellfish Harvesting Waters (Class SFH) are tidal salt waters protected for shellfish harvesting and are suitable also for uses listed in Classes SA and SB.
• Tidal Saltwaters (Class SA) are suitable for primary and secondary contact recreation, crabbing, and fishing. These waters are not protected for harvesting of clams, mussels, or oysters for market purposes or human consumption. The waters are suitable for the survival and propagation of a balanced indigenous aquatic community of marine fauna and flora.
• Tidal Saltwaters (Class SB) are suitable for the same uses listed in SA. The difference between the Class SA and SB saltwater concerns the DO limitations. Class SA waters must maintain daily DO averages not less than 5.0 mg/l, with a minimum of 4.0 mg/l, and Class SB waters must maintain DO levels not less than 4.0 mg/l.
• Groundwaters (Class GB) include all ground waters of the state, unless classified otherwise, which meet the definition of underground sources of drinking water.
Short-term impacts, which may occur as a result of the proposed projects outlined on the ALP, are a result of construction activities. Erosion could occur during the construction phase when the vegetation would be cleared and the surface layer disturbed for the proposed action. Soil erosion may lead to silt deposits and increased turbidity in surface waters (ditches), which could temporarily upset flow and impact aquatic organisms.
Oil and grease spills during construction are another possible source of water pollution. The chance for serious mishaps of this type is small; however, since such incidents would be handled by an SPCC, as specified in a National Pollution Discharge Elimination System (NPDES) permit, any undetected accidental leakage would be absorbed and/or filtered by slopes and ditches before reaching major streams. Appropriate BMPs would be used during construction for erosion control and water quality protection, as well as other
mitigative measures required for NPDES permit approval.
HILTON HEAD ISLAND AIRPORT
MASTER PLAN UPDATE
Environmental Considerations TALBERT & BRIGHT 71
Long-term water quality impact that may result from the proposed projects outlined on the ALP would be pollutant wash off. The primary components of pollutant wash off include the following potential contaminants: biochemical oxygen demand, chemical oxygen demand, volatile suspended solids, oil, grease, pesticides, polychlorinated biphenyls, total and suspended solids, algal nutrients, heavy metals, salts, asbestos, and coliform bacterial indicators. Pollutant concentration and discharge rates of runoff are dependent on rainfall rates. Rainfall energy dislodges deposited particles on the impervious surfaces, which are then conveyed in stormwater runoff to the receiving drainage appurtenances.
However, BMPs based on NDPES requirements would be implemented to reduce introduction of contaminants to adjacent surface water resources.
Detention basins, if necessary, would be designed to provide the level of treatment necessary to ensure that stormwater discharges would not result in degradation of the physical, chemical, or biological integrity of the receiving waters; i.e., Grants Creek. Detention basins use a temporary pool of water as the primary mechanism to treat stormwater. The pool of water allows settling of sediments (including fine sediments) and removal of soluble pollutants.
Detention basins also can be used to control the peak rate of stormwater runoff. In addition, swales for collecting and conveying stormwater runoff can be an effective BMP for water quality enhancement. The primary components of swales for water quality enhancement are the length of the swale and the velocity of the stormwater runoff as it travels through the swale; pollutant removal efficiency of grass swales increases proportionately to their length.
Prior to development of the proposed projects outlined on the ALP on currently undeveloped areas within the HXD property or additional property to be acquired, compliance with the Clean Water Act will be necessary, as well as coordination with appropriate federal and state agencies regarding potential water quality impacts.
6.17 WETLANDS
Executive Order 11990, Protection of Wetlands,53 requires federally supported projects to preserve wetlands and avoid and minimize wetland impacts to the maximum extent practicable. In addition, Section 404 of the Clean Water Act requires regulation for the fill or discharge of materials into waters of the United States. Water bodies, such as rivers, lakes, and streams, as well as wetlands, are subject to jurisdictional consideration under the Section 404 program. Although the principal administrative agency of the Clean Water 53Federal Register, Vol. 42, Pg. 26961, May 24, 1977, “Protection of Wetlands,” <https://propertydisposal.gsa.gov/>, accessed June 15, 2009.
Act is the USEPA, the USACE has the major responsibility for implementing, permitting, and enforcing provisions of the Clean Water Act. The USACE regulatory program is defined in 33 CFR Parts 320-330.54
As of June 5, 2007, the USEPA and USACE have issued guidance concerning coordination on jurisdictional area delineations under the Clean Water Act Section 404 in light of SWANCC and Rapanos Supreme Court Decisions. The new regulatory guidance (RGL 07-01)55 is currently being interpreted and implemented by USACE field representatives.56, 57
The currently accepted methods of wetland determination described in the 1987 United States Army Corps of Engineers Manual for Identifying and Delineating Wetland Areas will be utilized. The manual states that under normal circumstances, an area must demonstrate the presence of three components to be declared a jurisdictional wetland: 1) hydrophytic vegetation, 2) hydric soils, and 3) wetland hydrology. In accordance with the three-component approach to identifying wetland areas, soils, hydrology, and vegetation will be simultaneously characterized at each observation point (sample location). The collected field data will then be utilized to make a routine wetland determination. Upland/wetland boundaries will be determined by proceeding away from the wetlands toward uplands and noting any changes in soil, vegetation, and hydrology. The boundaries of any wetland areas, identified within the proposed projects outlined on the ALP, will be flagged at the locations where hydrophytic vegetation and/or hydric soils give way to non-hydrophytic vegetation and/or non-hydric soils. When the three components test positive, a wetland designation will be assigned. The specific testing conducted at each sample location will be as follows:
• Vegetation – vegetation in each stratum will be examined at each sample location. Herbaceous vegetation, saplings, and shrubs will be examined within a 5-foot radius. Trees and woody vines will be examined within a 30-foot radius. Dominant plant species will be identified in each stratum. The wetland indicator status for each dominant plant was recorded using the USFWS National List of Plant Species that Occur in Wetlands (1996). Where greater than 50 percent of
54Code of Federal Regulations, “Title 33 Navigation and Navigable Waters, Parts 320-330, U.S. Army Corps of Engineers Regulatory Program Regulations,” <http://www.usace.army.mil/>, accessed September 15, 2009. 55Clean Water Act Jurisdiction following the U.S. Supreme Court’s Decision in Rapanos vs. United States and Carabell vs. United States. 56U.S. Army Corps of Engineers, “Interim Regional Supplement to the Corps of Engineers Wetland Delineation Manual: Atlantic and Gulf Coastal Plain Region, ERDC/EL TR-08-30, October 2008,” <http://el.erdc.usace.army.mil/elpubs/pdf/trel08-30.pdf>, accessed December 14, 2009. 57U.S. Army Corps of Engineers, “DRAFT Interim Regional Supplement to the Corps of Engineers Wetland Delineation Manual: Eastern Mountains and Piedmont Region, Draft for Peer Review and Field Testing 6-25-2009,” <http://www.usace.army.mil/CECW/ Documents/cecwo/reg/EMP_Peer_Rev.pdf>, accessed December 14, 2009.
the dominant species will be identified as OBL,58 facultative (FAC, excluding FAC-),59 or facultative wetlands (FACW, including FACW- and FACW+),60 the sample location will be considered to have hydrophytic vegetation.
• Soils – excavations with a Dutch auger will be made by hand to a depth of approximately 16 inches at each sample location. Soil below the ‘A’ horizon will be examined at a depth of 12 inches to 16 inches and compared to the following hydric soil indicators:
gleying (gray coloring) matrix chroma of two or fewer in both mottled and unmottled
mineral soils high organic content in the upper layers organic streaking (sandy soils) iron and manganese concretions
Soil colors will be evaluated using Munsell Soil Color Charts. Additional soil characteristics, including texture, soil series, and drainage class, will also be examined at each sample location.
• Hydrology – each sample location will be examined for indicators of wetland hydrology, especially inundation, soil saturation of the upper 16 inches, drift lines, drainage patterns, watermarks, and sediment deposits.
Based on review of aerial photography, the U.S. Geologic Survey 7.5-minute topographic map, the Beaufort County Soil Survey, and the USFWS National Wetland Inventory map, the Hilton Head Island Airport contains the potential for wetlands (Figure 6.17-1, page 72). Potential wetlands are located on the northern, eastern, and western portions of the Airport property. These wetland areas are underlain by Polowana and Rosedhu soil series, which are listed as hydric soils and very poorly drained.
Prior to development of the proposed projects outlined on the ALP on currently undeveloped areas within the HXD property or additional property to be acquired, compliance with the Clean Water Act will be necessary, as well as coordination with appropriate federal and state agencies regarding potential wetland impacts.
58OBL, Obligate Wetland, occurs almost always (estimated probability 99 percent) under natural conditions in wetlands, <http://plants.usda.gov/>, accessed September 17, 2009. 59FAC, Facultative, equally likely to occur in wetlands or non-wetlands (estimated probability 34 percent to 66 percent), <http://plants.usda.gov/>, accessed September 17, 2009. 60FACW, Facultative Wetland, usually occurs in wetlands (estimated probability 67 percent to 99 percent), but occasionally found in non-wetlands, <http://plants.usda.gov/>, accessed September 17, 2009.
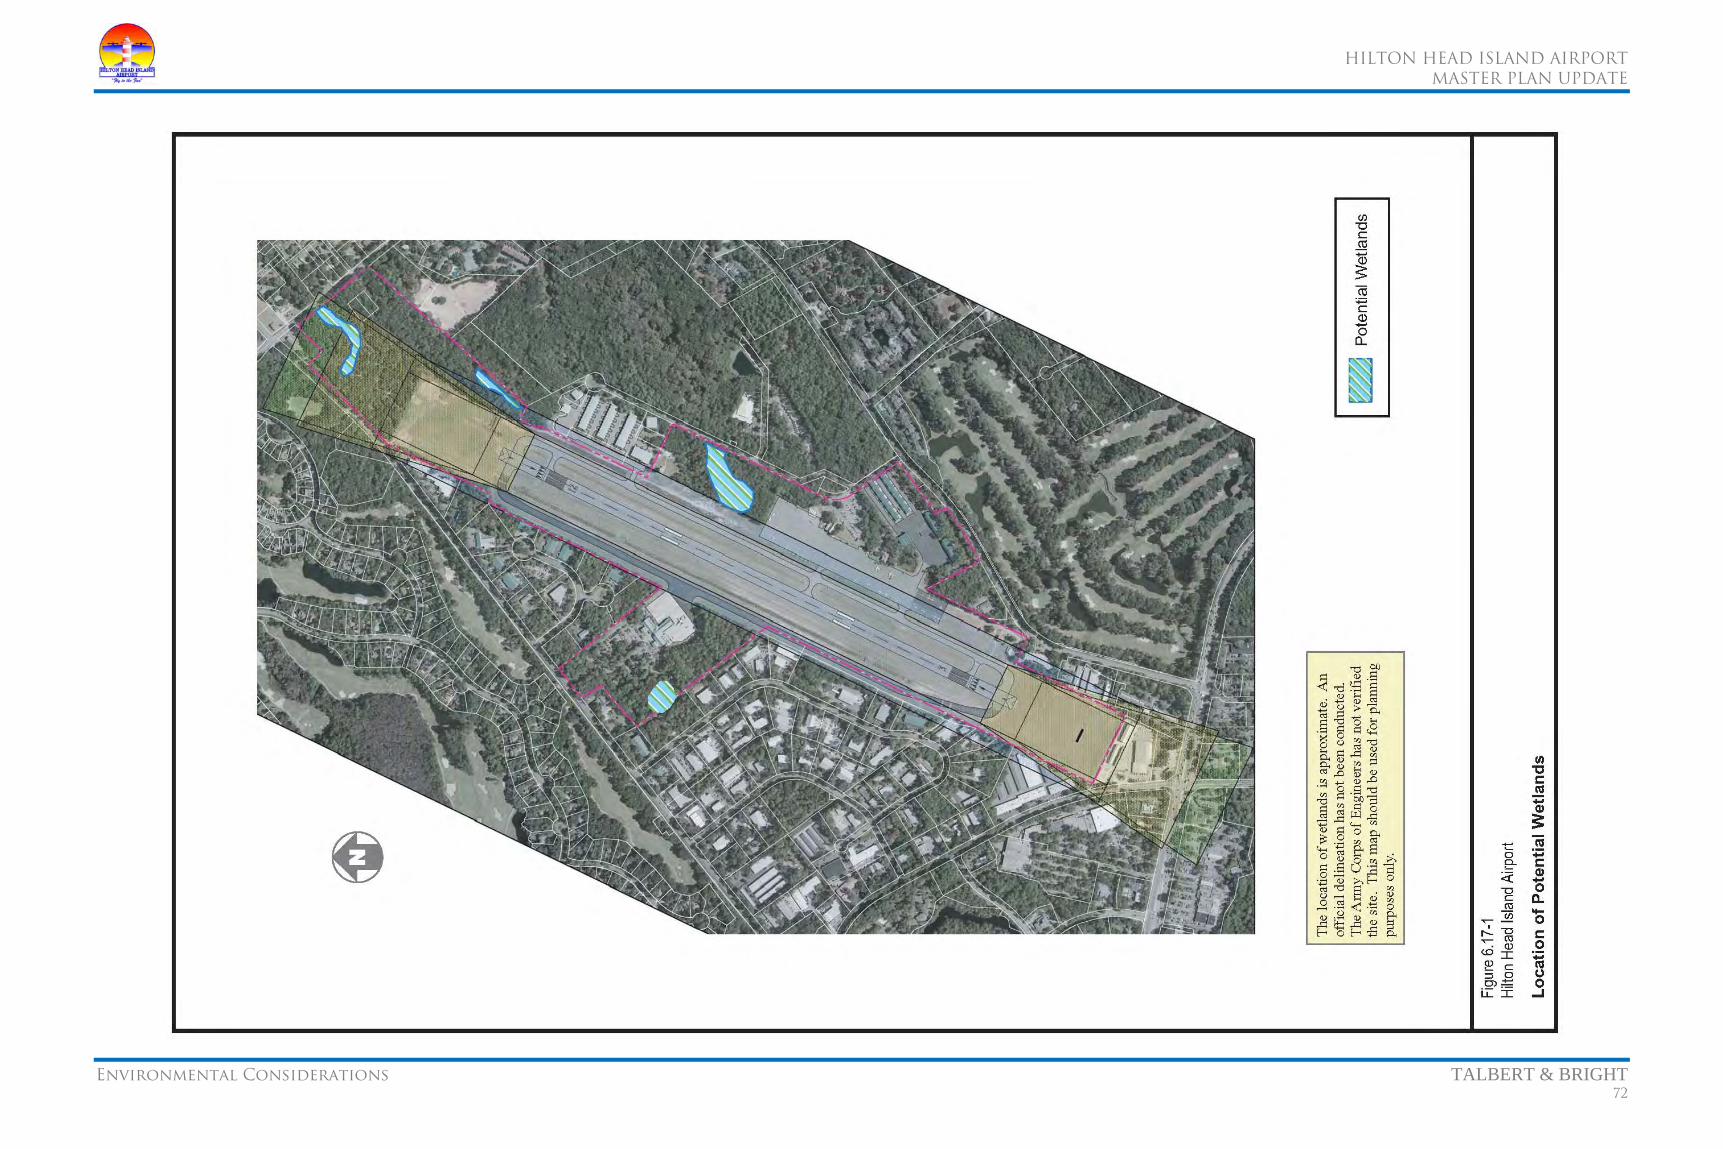
HILTON HEAD ISLAND AIRPORT
MASTER PLAN UPDATE
Environmental Considerations TALBERT & BRIGHT 72

HILTON HEAD ISLAND AIRPORT
MASTER PLAN UPDATE
Environmental Considerations TALBERT & BRIGHT 73
6.18 WILD AND SCENIC RIVERS
The Wild and Scenic Rivers Act (P.L. 90-542, as amended, 16 USC 1271-1287) established the National Wild and Scenic Rivers System and prescribed the methods and standards through which rivers were identified and added to the system. The Act authorizes the Secretaries of the Interior and Agriculture to study areas and submit proposals for addition to the system. It describes procedures and limitations for control of lands in federally administered components of the system and for dealing with disposition of lands and minerals under federal ownership. Rivers are classified as wild, scenic, or recreational. Definitions of each are presented below:
• Wild river areas are rivers or sections of rivers that are free of impoundments and generally inaccessible except by trail, with watersheds or shorelines essentially primitive and waters unpolluted. These represent vestiges of primitive America.
• Scenic river areas are rivers or sections of rivers that are free of impoundments, with shorelines or watersheds still largely primitive and shorelines largely undeveloped, but accessible in places by roads.
• Recreational river areas are rivers or sections of rivers that are readily accessible by road or railroad, may have some development along their shorelines, and may have undergone some impoundment or diversion in the past.
There is currently one river, or portions thereof, in South Carolina listed as a federal wild and scenic river – Chattooga River (P.L .93-279 – May 10, 1974).
In addition, South Carolina enacted the South Carolina Scenic Rivers Act of 1989 (SC Code of Laws Title 49 – Waters, Water Resources and Drainage, Chapter 29 – South Carolina Scenic Rivers Act), which protects unique or outstanding scenic, recreational, geologic, botanical, fish, wildlife, historic or cultural values of selected rivers or segments of rivers in the state. Rivers or portions thereof, protected by this Act include:
• Ashley River – 24-mile segment extending from Sland's Bridge (U.S. Highway 17A) near Summerville to the Mark Clark Expressway (I-526) bridge in Charleston.
• Black River – 75-mile segment beginning at S-14-40 in Clarendon County and extends southeast through Williamsburg County to Pea House Landing at the end of S-22-38 in Georgetown County.
• Broad River – 15-mile segment extending from the 99 Islands dam to the confluence with the Pacolet River.
• Great Pee Dee River – 70-mile segment extending from U.S. Highway 378 Bridge between Florence and Marion Counties to the U.S. Highway 17 bridge in Georgetown.
• Little Pee Dee River – 14-mile segment from U.S. Highway 378 to the confluence with the Great Pee Dee River and a 48-mile segment through Dillon County from the Marlboro County line above Parish Mill Bridge on S-17-363 to the confluence with Buck Swamp at the Marion County line.
• Lower Saluda River – 10-mile segment beginning one mile below Lake Murray Dam to its confluence with the Broad River.
• Lynches River – 54-mile segment between U.S. Highway 15 in Lee County and the eastern boundary of Lynches River State Park.
• Middle Saluda River – 5-mile segment, extending from U.S. Highway 276 to a point about one mile upstream of the abandoned Cleveland Fish Hatchery in Greenville County.
There are no rivers listed on the National Wild and Scenic Rivers System or South Carolina Scenic Rivers Act located on Hilton Head Island; therefore, compliance with the National Wild and Scenic Rivers Act is not required for development projects outlined on the ALP.
6.19 INDIRECT AND CUMULATIVE IMPACTS
Impacts to the human and natural environment are studied through detailed analyses, as required by the Council on Environmental Quality (CEQ). There are three types of impacts that may occur when an action takes place: direct, indirect, and cumulative.
• Direct impacts are caused by the proposed projects and occur at the same time and place (e.g., sediment runoff associated with construction)
• Indirect impacts area caused by the proposed projects and are later in time and farther removed in distance, but are still reasonably foreseeable. Indirect impacts may include growth inducing effects and other effects related to induced changes in the pattern of land use, population density, or growth rate, and the related impacts on air and water and other natural systems, including ecosystems (e.g. runoff associated with future taxiway use)
• Cumulative impacts are impacts on the environment, which results from the incremental impact of the projects when added to other past, present, and reasonably foreseeable future actions regardless of what agency (federal or non-federal) or person undertakes such other
actions. Cumulative impacts can result from individually minor but collectively significant actions taking place over a period of time (e.g., impacts to wetlands associated with other aviation-related projects and/or private development projects).
Indirect impacts may include growth of the community and changes in land use, demographics, and socioeconomics that are created as a by-product of the projects proposed in the Master Plan Update.
Cumulative impacts could result from individual projects that are each minor in nature, but together create a combined effect that may be considered significant. Cumulative impacts would be addressed as each project is developed in the required environmental documentation.
HILTON HEAD ISLAND AIRPORT
MASTER PLAN UPDATE
Airport Layout Plans TALBERT & BRIGHT 74
The purpose of this section is to present the graphic representation of the items addressed and recommended in the Facility Requirements (page 24). The ALP drawing set components consist of the following:
• Cover Sheet
• Airport Layout Plan
• Terminal Area Plan
• Runway 03 Inner Approach Surfaces – Plan and Profile
• Runway 21 Inner Approach Surfaces – Plan and Profile
• Airport Airspace Drawing – Plan
• Airport Airspace Drawing – Profile
• Land Use Plan
• Airport Property Map (Exhibit ‘A’)
7.1 COVER SHEET
The cover sheet is included as the first drawing of the ALP drawing set. The cover sheet includes the following information:
• Project Title
• Airport Name
• Location
• Sponsor
• Funding Agency Project Identification Numbers
• Preparer’s Project Identification Number
• Date
• Sheet Index
• Preparer
• Vicinity Map
• Location Map
7.2 AIRPORT LAYOUT PLAN
The ALP drawing represents a 20-year, three-phased program, which is required to support the projected activity for HXD. Data blocks on the drawing present pertinent information including wind coverage, airport elevations, navigational aids, pavement data, selected design standards, approach data, approach zone dimensions, runway declared distances, runway coordinates, plan drawing legends, and other data. The HXD ALP is designed as a C-II ARC. This dictates several of the plan’s development elements including the following:
• T-Hangars and Corporate Hangar Areas
• Apron Expansion
• Land Acquisition
• Taxiway ‘A’ Relocation (compliance)
The ALP is shown on Drawing Nos. 2, 3, 4, and 5 of 14 (pages 79 through 82) and presented at a scale of 1 inch = 400 feet and a contour interval of 5 feet, provided by aerial photography.
7.3 TERMINAL AREA PLAN
The Terminal Area Plan (TAP) is a larger-scaled representation of the ALP, focusing on development around the terminal building. The TAP includes such features as existing and proposed aprons, buildings, hangars, parking lots, etc., and their locations. The various phases for each improvement project are also shown on this plan. The TAP is presented at a scale of 1 inch = 200 feet and is shown on Drawing Nos. 10 and 11 of 14 (pages 87 and 88).
The improvements represented on this drawing include the following:
• New Terminal Area
• T-Hangars and Corporate Hangar Areas
• Apron Expansion
• New Automobile Parking Areas
7.4 AIRPORT AIRSPACE PROFILE AND INNER APPROACH SURFACE DRAWING
This drawing illustrates the Part 77 approaches in profile as well as approaches for displaced thresholds. The inner approach surface drawing depicts the “close-in” approach surfaces and runway protection zones. The surfaces are imposed over the existing terrain to determine the number and magnitude of any penetrations to the surfaces. The drawing includes the proposed conditions (Drawing Nos. 6, 7, 8, and 9 of 14; pages 83 through 85).
7.5 AIRPORT AIRSPACE DRAWING
The airport airspace surface drawing depicts the proposed FAR Part 77 imaginary surfaces for the Airport. The drawing includes topography, which underlies the FAR Part 77 surfaces, and a graphical and tabular representation of the surfaces. The surrounding topography was taken from USGS quadrangle sheets and encompasses the area within the proposed FAR Part 77 imaginary surfaces. Beyond 3,500 feet from the runway ends, the search for possible surface penetrations was centered around manmade structures, such as towers, buildings, power lines, etc. (Drawing No. 12 of 14, page 89).
7.6 LAND USE PLAN
The land use plan is a graphic representation, to scale, of airport facilities overlaid on the current land use as provided by the Beaufort County and the Town of Hilton Head Island. The land uses are depicted by general land use categories (i.e., residential, recreational, industrial, commercial, etc.). This drawing has been developed to show both existing and recommended land use conditions (Drawing No. 13 of 14, page 90).
7.7 AIRPORT PROPERTY MAP
The airport property map (Exhibit ‘A’) illustrates ownership or interest in each tract within the airport boundaries. How and when the airport property was obtained is noted by parcel number and described separately in tabular form. Exhibit ‘A’ is prepared at a scale of 1 inch = 400 feet on Drawing No. 14 of 14 (page 91).

HILTON HEAD ISLAND AIRPORT
MASTER PLAN UPDATE
Airport Layout Plans TALBERT & BRIGHT 75
7.8 CHECKLIST
In order to ensure that complete and appropriate information is included in the ALP drawing set, the following checklist provided by the FAA was utilized to construct and check the drawings included in this document.
U.S. Department of TransportationFederal Aviation Administration
Southern Region – Airports DivisionEffective Date: 10/2010
Airport Layout Plan Drawing Set Checklist Name of Airport: Hilton Head Island Airport Location of Airport: Hilton Head Island, Beaufort County, South Carolina Date of Review: Reviewed by: Significant Development Changes Since Previous ALP Approval/or Narrative 1. Refer to Master Plan Update Report 2. 3. 4. 5. 6. In order to protect the airspace for future conditions, complete the following information: Future Airport Reference Point (ARP) (if same as existing, provide existing ARP) Existing Refer to data tables on ALP drawing ARP Latitude ARP Longitude
Proposed ARP Latitude ARP Longitude Future RWY End Coordinates & RWY End Elevation (if same as existing, provide existing coordinates) Existing Refer to data tables on ALP drawing RWY End 03 Latitude Longitude Elevation RWY End 21 Latitude Longitude Elevation Proposed Refer to data tables on ALP drawing
RWY End 03 Latitude Longitude Elevation RWY End 21 Latitude Longitude Elevation Existing and Proposed Modification of Standards (MoDS) – Show Table on ALP Sheet Existing Deviation of Standard/FAA Approved MoDS FAA Approval Date (if any) Expiration Date (if any) 1. Taxiway ‘A’ separation 200' instead of 240' AS No: 00-ASO-082-NRA 2. 3. Proposed Deviation of Standard/FAA Modification of Standards 1. Permit the use of declared distance runway standards 2. Permit the use if EMA RSA/OFA standards 3. Permit 50' taxiway widths for new construction 4. Runway Safety Area Re-Evaluations (X) Concur with Runway Safety Area Determination currently on file with FAA. (X) Reevaluation of Runway Safety Area Determination completed as part of planning document and shown on this ALP set.
Yes No Comments Narrative Report Report Provided (X) ( ) Refer to Master Plan Update ReportAeronautical Forecasts (X) ( ) Refer to Master Plan Update Report- 0-5 yrs., 6-10 yrs., 10-20 yrs (X) ( ) Refer to Master Plan Update Report- Total annual operations (X) ( ) Refer to Master Plan Update Report- Annual itinerant operations (X) ( ) Refer to Master Plan Update Report- Based aircraft (X) ( ) Refer to Master Plan Update Report- Annual instrument approaches (if applicable) (X) ( ) Refer to Master Plan Update Report- Annual itinerant operations by critical aircraft (X) ( ) Refer to Master Plan Update Report- Annual itinerant operations by more demanding aircraft (X) ( ) Refer to Master Plan Update ReportProposed Development Justification (X) ( ) Refer to Master Plan Update ReportSpecial Issues (MoDS, etc.) (X) ( ) Refer to Master Plan Update ReportDevelopment Schedule and Graphics (X) ( ) Refer to Master Plan Update ReportProper Agency Coordination (sponsor, local, state) (X) ( ) Master Plan Update Report being reviewed by
agencies
Airport Layout Drawing Proper Agency Approval (sponsor, local, state) ( ) (X) Master Plan Update Report being reviewed by
agenciesSheet Size - 24" x 36"/22" x 34" (X) ( ) 24" x 36"Scale 1" = 200' - 600' (X) ( ) Scale 1" = 400'2' - 10' Labeled Contours (X) ( ) 5' contour interval (no labeled)North Arrow - True & magnetic (X) ( ) - Declination w/annual rate of change (X) ( ) Wind Rose - Source & time period (X) ( ) - MPH & knots (X) ( ) - 10.5 Knot individual & combined coverage (X) ( ) - 13 Knot individual & combined coverage (X) ( ) Airport Reference Point (ARP) - Existing w/Lat./Long. (NAD 83) (X) ( ) - Ultimate w/Lat./Long/ (NAD 83) (X) ( ) Elevations (Existing & Ultimate) - Existing runway ends (X) ( ) - Displaced thresholds (X) ( ) - Ultimate runway ends (X) ( ) - Runway intersections ( ) ( ) Not applicable- Runway high & low points (X) ( ) Low point is the threshold of RWY 21 Location
of high point is not available- Touchdown zone elevation (highest RWY elevation in first
3,000' of any RWY having published or planned straight-in minima)
( ) (X) Information is not available
Drawing Lines - Existing property boundary (X) ( ) - Ultimate property boundary ( ) (X) Update as property is acquired- Building restriction line (both sides) (X) ( ) - Existing development shown as solid (X) ( ) - Future development shown as dashed/shaded (X) ( ) - ILS Critical Areas (LOC & GS) ( ) ( )

HILTON HEAD ISLAND AIRPORT
MASTER PLAN UPDATE
Airport Layout Plans TALBERT & BRIGHT 76
Yes No Comments - Survey Monuments (PACS/SACS) ( ) ( ) - Runway Visibility Zones ( ) ( ) Runway Drawing Details (Existing & Ultimate) - Runway(s) depiction (X) ( ) - Length & width (X) ( ) Refer to data tables - End numbers (X) ( ) Refer to data tables - True bearing (nearest sec.) (X) ( ) Refer to data tables - Markings (basic, NPI, PIR) (X) ( ) NPI - Lighting (thresholds only) (X) ( ) - Threshold lat/long & elevations (X) ( ) Refer to data tables - Displaced threshold lat/long & elevations (X) ( ) Refer to data tables - Runway safety areas & dimensions (X) ( ) Refer to data tables - Runway obstacle free areas & dimensions (X) ( ) Refer to data tables - Runway obstacle free zones (X) ( ) - Centerline w/true bearing (X) ( ) - Approach aids indicated (ILS, REILS, etc.) (X) ( ) - Lat/long & elevation for non-federal on-airport NAVAIDS
(used for instrument approach procedure) ( ) (X)
Taxiway Details (Existing & Ultimate) - Taxiway widths (X) ( ) - Designations (X) ( ) - Separation Dimensions to:
Runway centerline(s) (X) ( ) Parallel taxiway(s) (X) ( ) Aircraft parking area(s) (X) ( )
Aircraft Parking Aprons - Existing & ultimate aprons shown (X) ( ) - Dimensions ( ) (X) - Tie-down layout/locations ( ) (X) Runway protection Zones (RPZs) - Existing & ultimate RPZs shown (Type of Ownership) (X) ( ) - Dimensions (X) ( ) - Approach slope (20:1, 34:1, 50:1) (X) ( ) Refer to data tables Title & Revision Blocks - Name and location of airport (X) ( ) - Name of preparer (X) ( ) - Date of drawing (X) ( ) - Drawing title (X) ( ) - Revision block (X) ( ) - FAA disclaimer (X) ( ) - Sponsor approval block (X) ( ) Airport Data Block (Existing & Ultimate) - Airport elevation (MSL) (X) ( ) - Airport reference point (ARP) data ( ) ( ) - Airport & terminal NAVAIDS (beacon, ILS) (X) ( ) - Mean maximum temperature (X) ( )
Yes No Comments - Airport reference code (ARC) for each runway ( ) ( ) - Design aircraft for each runway (X) ( ) - Identify GPS at airport ( ) ( ) Not applicableRunway Data Block (Existing & Ultimate) - % effective gradient (X) ( ) - % wind coverage (MPH & knots) (X) ( ) - Maximum elevation above MSL (X) ( ) - Runway length (X) ( ) - Runway width (X) ( ) - Runway surface type (turf asphalt…) (X) ( ) - Runway strength (SWG, DWG, or PCN if required…) (X) ( ) - Part 77 approach category (visual, NPI, PIR) (X) ( ) - Type instrument approach (ILS, GPS…) (X) ( ) - Approach slope (20:1, 34:1, 50:1) (X) ( ) - Runway lighting (HIRL, MIRL, LIRL) (X) ( ) MIRL- Runway marking (PIR, NPI, BCS) (X) ( ) NPI- NAVAIDS & visual aids (X) ( ) - Runway safety area dimensions (standard and non-standard) (X) ( ) Miscellaneous - Airport facility/building list (existing & future) (X) ( ) - Standard legend ( ) ( ) - Location map (X) ( ) On cover drawing- Vicinity map (X) ( ) On cover drawing- Roadways, traverse ways identified (X) ( ) Additional Comments: ** Existing and proposed declared distance figures for each runway (ASDA, LDA, TORA, TODA) ** Obstacle Free X=Zone (OFZ) Penetrations Table – If none, State “No OFZ Penetrations” ** Threshold Siting Surfaces (TSS) Object Penetrations Table – If none, State “No TSS Penetrations” Airport Airspace Drawing Ultimate Runway Length Plan View of Surfaces (X) ( ) Profile View of Ultimate Runway Lengths (X) ( ) Obstruction Data Tables ( ) (X) Obstruction information is not available Sheet Size Same as ALP (X) ( ) Plan View Scale 1" = 2,000' (X) ( ) Profile View Scale 1" = 1,000' Horizontal, 1" = 100' Vertical (X) ( ) Approach Plan View Details - USGS base map ( ) (X) Aerial photography - Runway end numbers shown (X) ( ) - Elevation contours of 50' on all slopes (X) ( ) - Show most demanding surface lines as solid and others as
dashed(X) ( )
- Identify penetrating objects & top elevations (for those in inner approach add note, “Refer to the inner portion of the approach surface plan view details for close-in obstructions.”)
( ) (X) Obstruction information is not available.
- Show PIR approach of 50,000 on separate sheet as necessary ( ) (X) Not Applicable
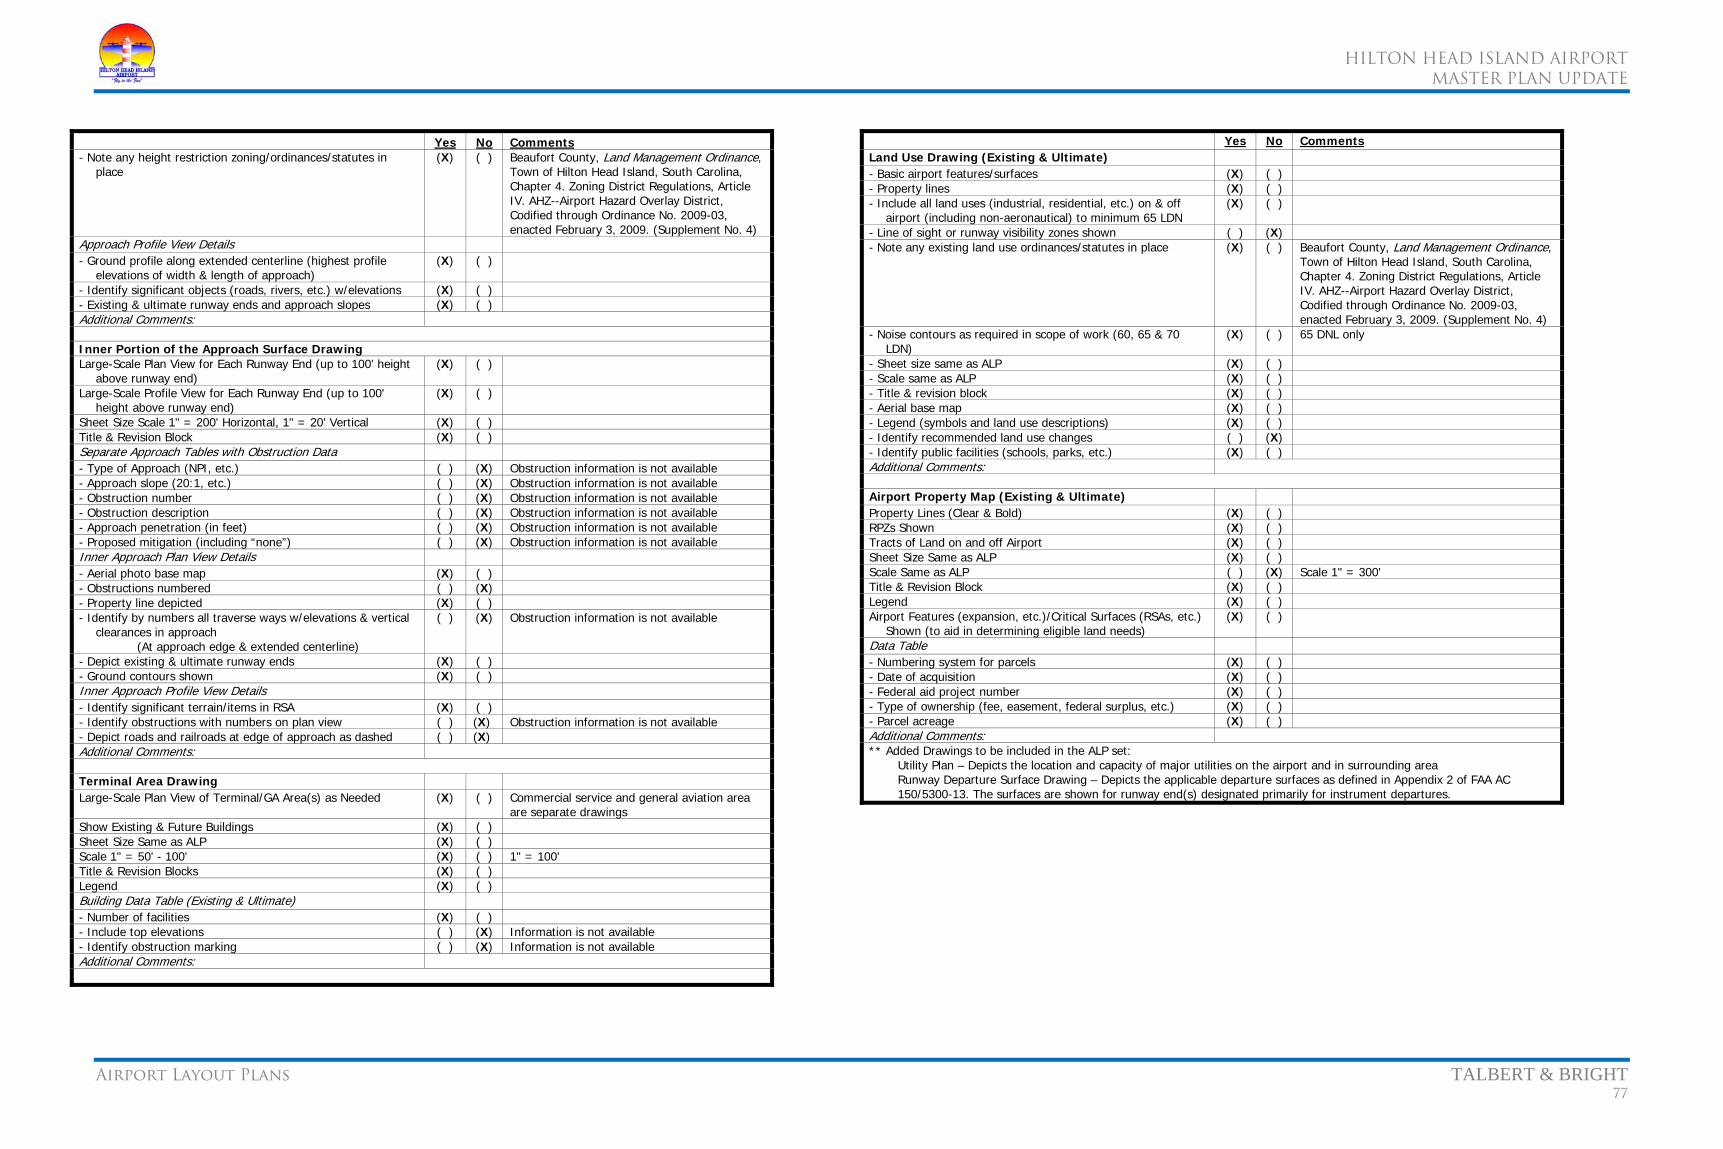
HILTON HEAD ISLAND AIRPORT
MASTER PLAN UPDATE
Airport Layout Plans TALBERT & BRIGHT 77
Yes No Comments - Note any height restriction zoning/ordinances/statutes in
place (X) ( ) Beaufort County, Land Management Ordinance,
Town of Hilton Head Island, South Carolina, Chapter 4. Zoning District Regulations, Article IV. AHZ--Airport Hazard Overlay District, Codified through Ordinance No. 2009-03, enacted February 3, 2009. (Supplement No. 4)
Approach Profile View Details - Ground profile along extended centerline (highest profile
elevations of width & length of approach) (X) ( )
- Identify significant objects (roads, rivers, etc.) w/elevations (X) ( ) - Existing & ultimate runway ends and approach slopes (X) ( ) Additional Comments: Inner Portion of the Approach Surface Drawing Large-Scale Plan View for Each Runway End (up to 100' height
above runway end) (X) ( )
Large-Scale Profile View for Each Runway End (up to 100' height above runway end)
(X) ( )
Sheet Size Scale 1" = 200' Horizontal, 1" = 20' Vertical (X) ( ) Title & Revision Block (X) ( ) Separate Approach Tables with Obstruction Data - Type of Approach (NPI, etc.) ( ) (X) Obstruction information is not available - Approach slope (20:1, etc.) ( ) (X) Obstruction information is not available - Obstruction number ( ) (X) Obstruction information is not available - Obstruction description ( ) (X) Obstruction information is not available - Approach penetration (in feet) ( ) (X) Obstruction information is not available - Proposed mitigation (including “none”) ( ) (X) Obstruction information is not available Inner Approach Plan View Details - Aerial photo base map (X) ( ) - Obstructions numbered ( ) (X) - Property line depicted (X) ( ) - Identify by numbers all traverse ways w/elevations & vertical
clearances in approach (At approach edge & extended centerline)
( ) (X) Obstruction information is not available
- Depict existing & ultimate runway ends (X) ( ) - Ground contours shown (X) ( ) Inner Approach Profile View Details - Identify significant terrain/items in RSA (X) ( ) - Identify obstructions with numbers on plan view ( ) (X) Obstruction information is not available - Depict roads and railroads at edge of approach as dashed ( ) (X) Additional Comments: Terminal Area Drawing Large-Scale Plan View of Terminal/GA Area(s) as Needed (X) ( ) Commercial service and general aviation area
are separate drawings Show Existing & Future Buildings (X) ( ) Sheet Size Same as ALP (X) ( ) Scale 1" = 50' - 100' (X) ( ) 1" = 100' Title & Revision Blocks (X) ( ) Legend (X) ( ) Building Data Table (Existing & Ultimate) - Number of facilities (X) ( ) - Include top elevations ( ) (X) Information is not available - Identify obstruction marking ( ) (X) Information is not available Additional Comments:
Yes No Comments Land Use Drawing (Existing & Ultimate) - Basic airport features/surfaces (X) ( ) - Property lines (X) ( ) - Include all land uses (industrial, residential, etc.) on & off
airport (including non-aeronautical) to minimum 65 LDN (X) ( )
- Line of sight or runway visibility zones shown ( ) (X) - Note any existing land use ordinances/statutes in place
(X) ( ) Beaufort County, Land Management Ordinance, Town of Hilton Head Island, South Carolina, Chapter 4. Zoning District Regulations, Article IV. AHZ--Airport Hazard Overlay District, Codified through Ordinance No. 2009-03, enacted February 3, 2009. (Supplement No. 4)
- Noise contours as required in scope of work (60, 65 & 70 LDN)
(X) ( ) 65 DNL only
- Sheet size same as ALP (X) ( ) - Scale same as ALP (X) ( ) - Title & revision block (X) ( ) - Aerial base map (X) ( ) - Legend (symbols and land use descriptions) (X) ( ) - Identify recommended land use changes ( ) (X) - Identify public facilities (schools, parks, etc.) (X) ( ) Additional Comments: Airport Property Map (Existing & Ultimate) Property Lines (Clear & Bold) (X) ( ) RPZs Shown (X) ( ) Tracts of Land on and off Airport (X) ( ) Sheet Size Same as ALP (X) ( ) Scale Same as ALP ( ) (X) Scale 1" = 300' Title & Revision Block (X) ( ) Legend (X) ( ) Airport Features (expansion, etc.)/Critical Surfaces (RSAs, etc.)
Shown (to aid in determining eligible land needs) (X) ( )
Data Table - Numbering system for parcels (X) ( ) - Date of acquisition (X) ( ) - Federal aid project number (X) ( ) - Type of ownership (fee, easement, federal surplus, etc.) (X) ( ) - Parcel acreage (X) ( ) Additional Comments: ** Added Drawings to be included in the ALP set:
Utility Plan – Depicts the location and capacity of major utilities on the airport and in surrounding area Runway Departure Surface Drawing – Depicts the applicable departure surfaces as defined in Appendix 2 of FAA AC 150/5300-13. The surfaces are shown for runway end(s) designated primarily for instrument departures.
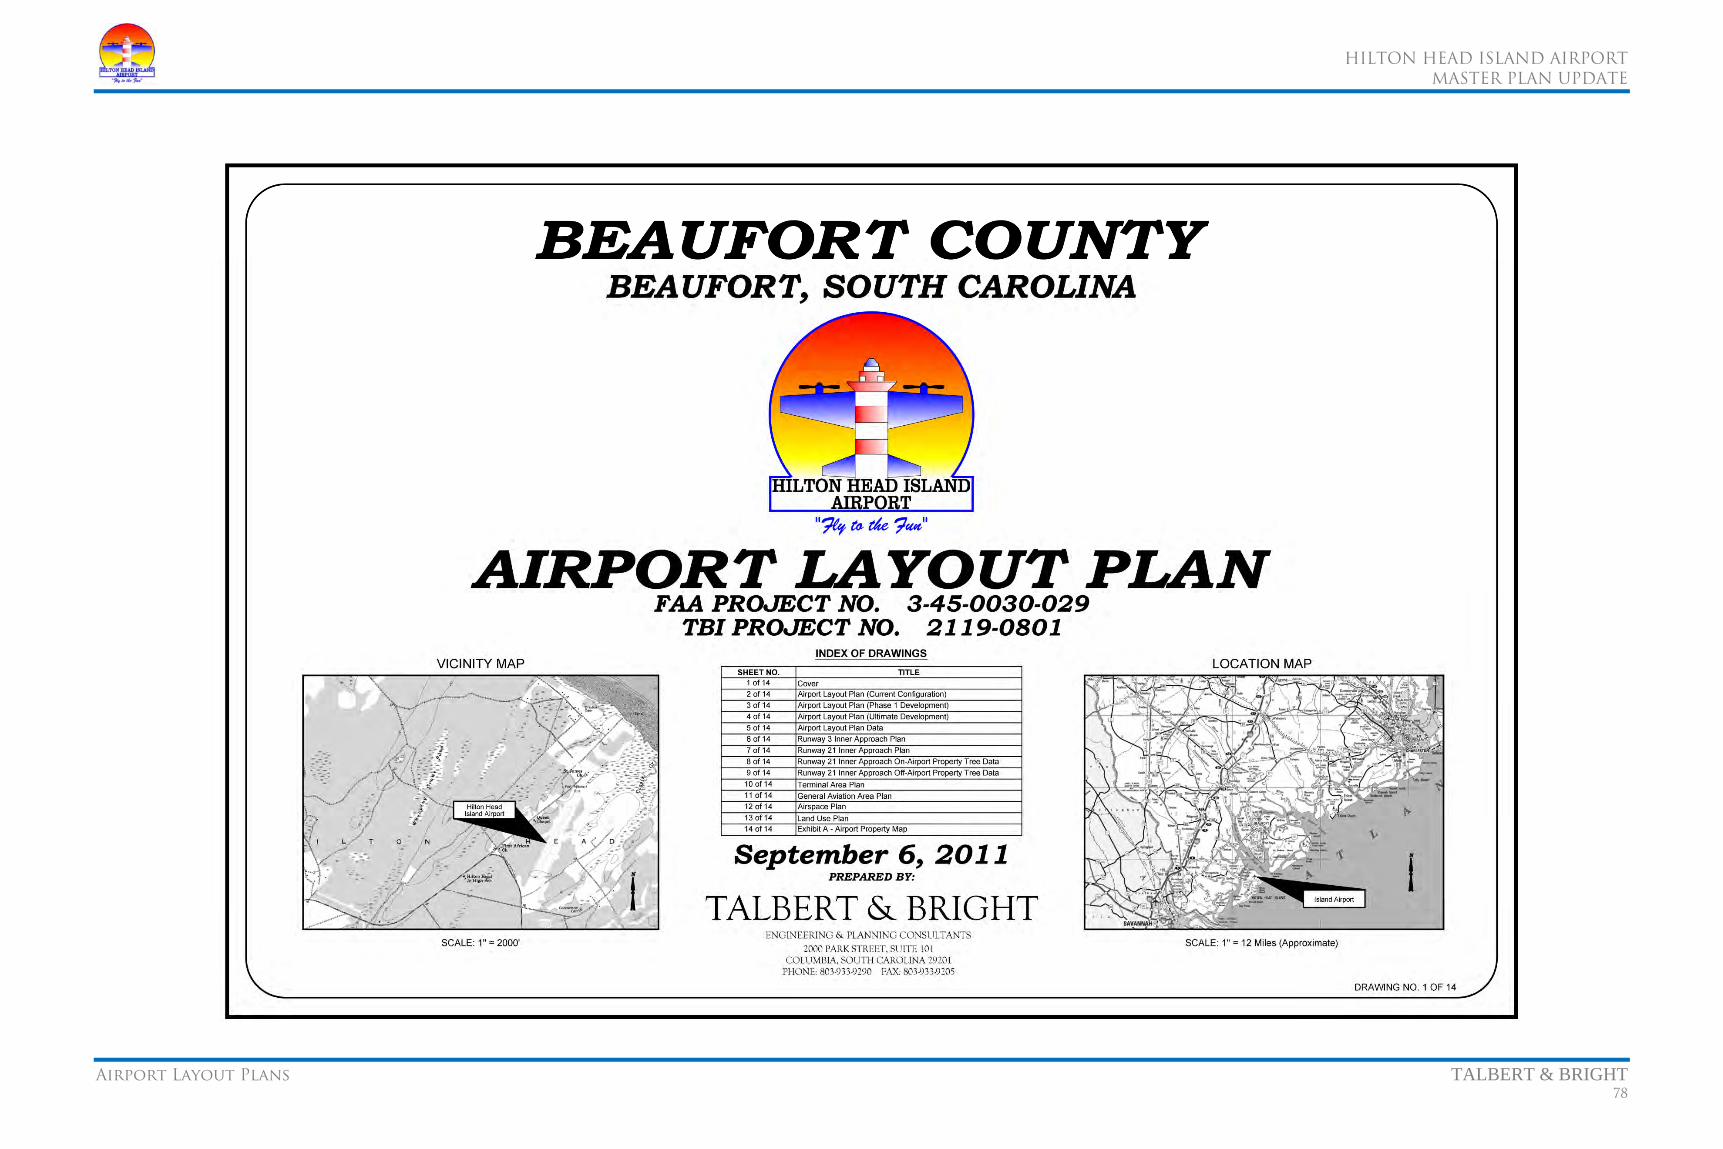
HILTON HEAD ISLAND AIRPORT
MASTER PLAN UPDATE
Airport Layout Plans TALBERT & BRIGHT 78

HILTON HEAD ISLAND AIRPORT
MASTER PLAN UPDATE
Airport Layout Plans TALBERT & BRIGHT 79

HILTON HEAD ISLAND AIRPORT
MASTER PLAN UPDATE
Airport Layout Plans TALBERT & BRIGHT 80
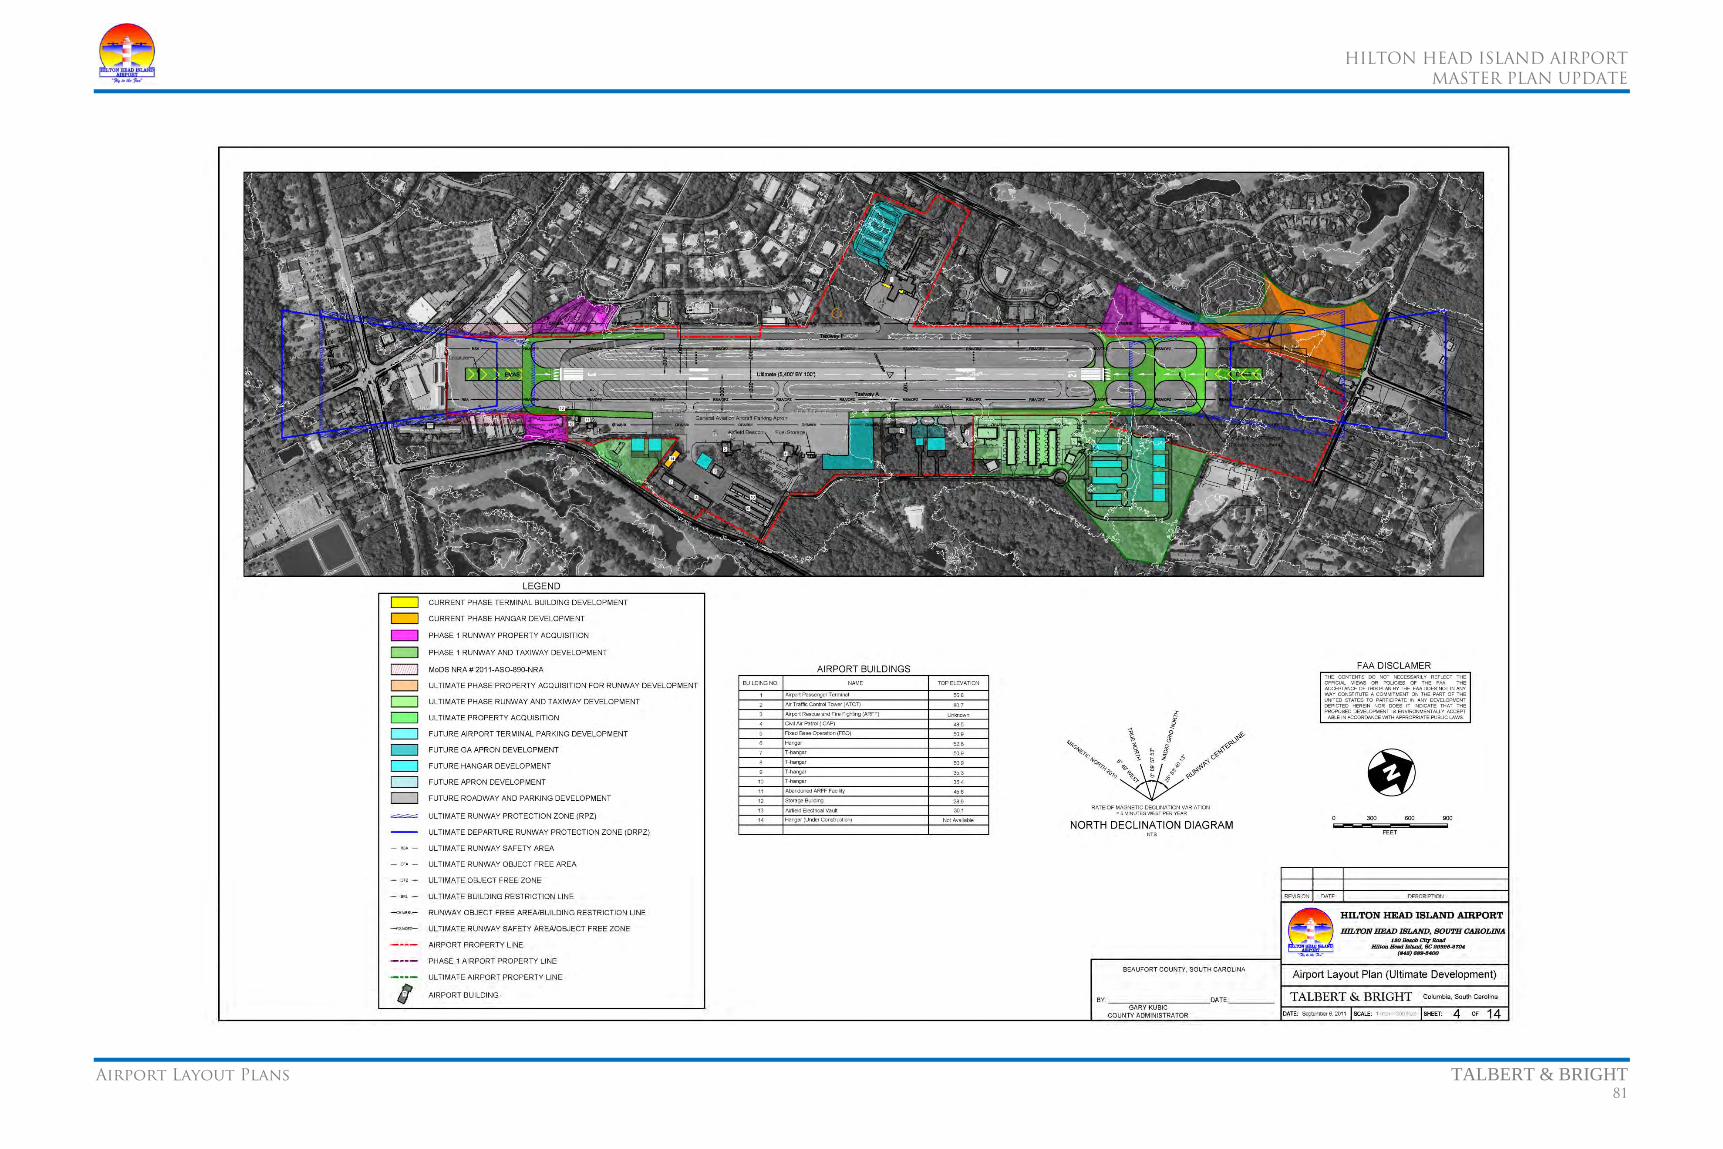
HILTON HEAD ISLAND AIRPORT
MASTER PLAN UPDATE
Airport Layout Plans TALBERT & BRIGHT 81
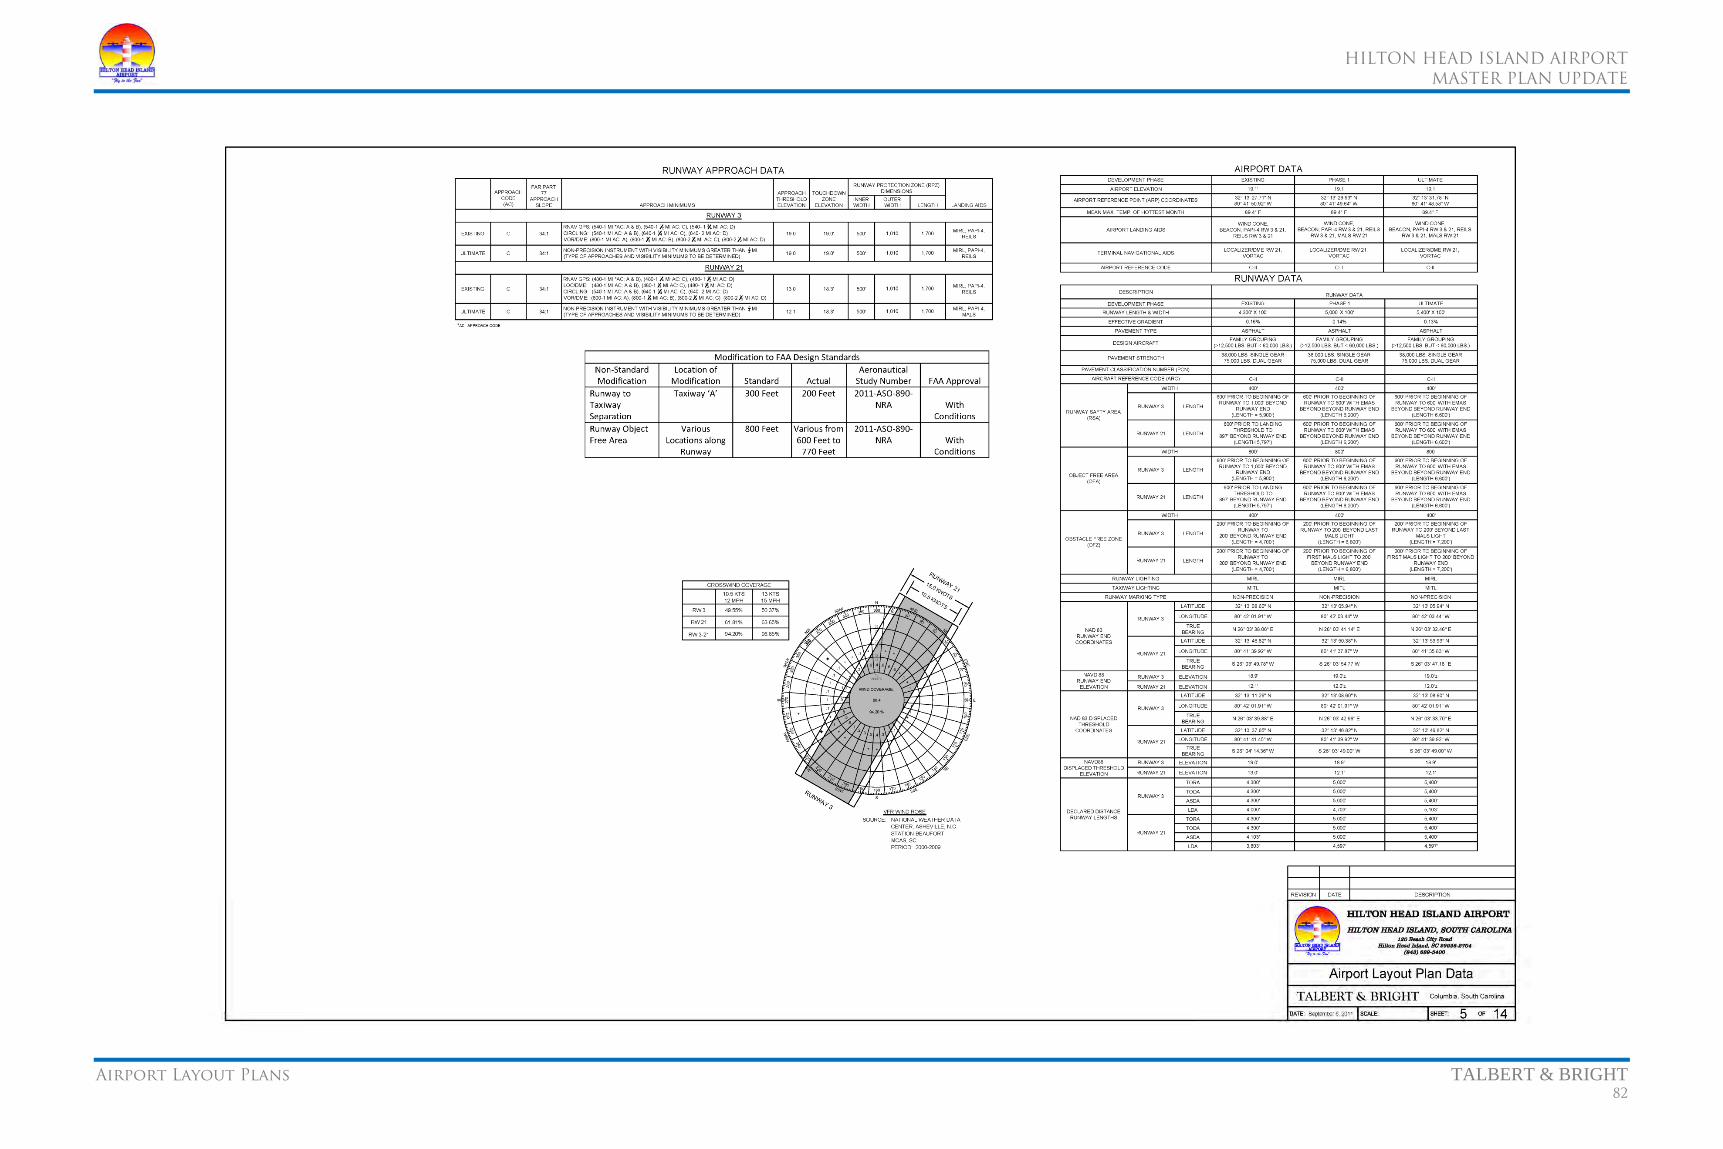
HILTON HEAD ISLAND AIRPORT
MASTER PLAN UPDATE
Airport Layout Plans TALBERT & BRIGHT 82

HILTON HEAD ISLAND AIRPORT
MASTER PLAN UPDATE
Airport Layout Plans TALBERT & BRIGHT 83

HILTON HEAD ISLAND AIRPORT
MASTER PLAN UPDATE
Airport Layout Plans TALBERT & BRIGHT 84

HILTON HEAD ISLAND AIRPORT
MASTER PLAN UPDATE
Airport Layout Plans TALBERT & BRIGHT 85
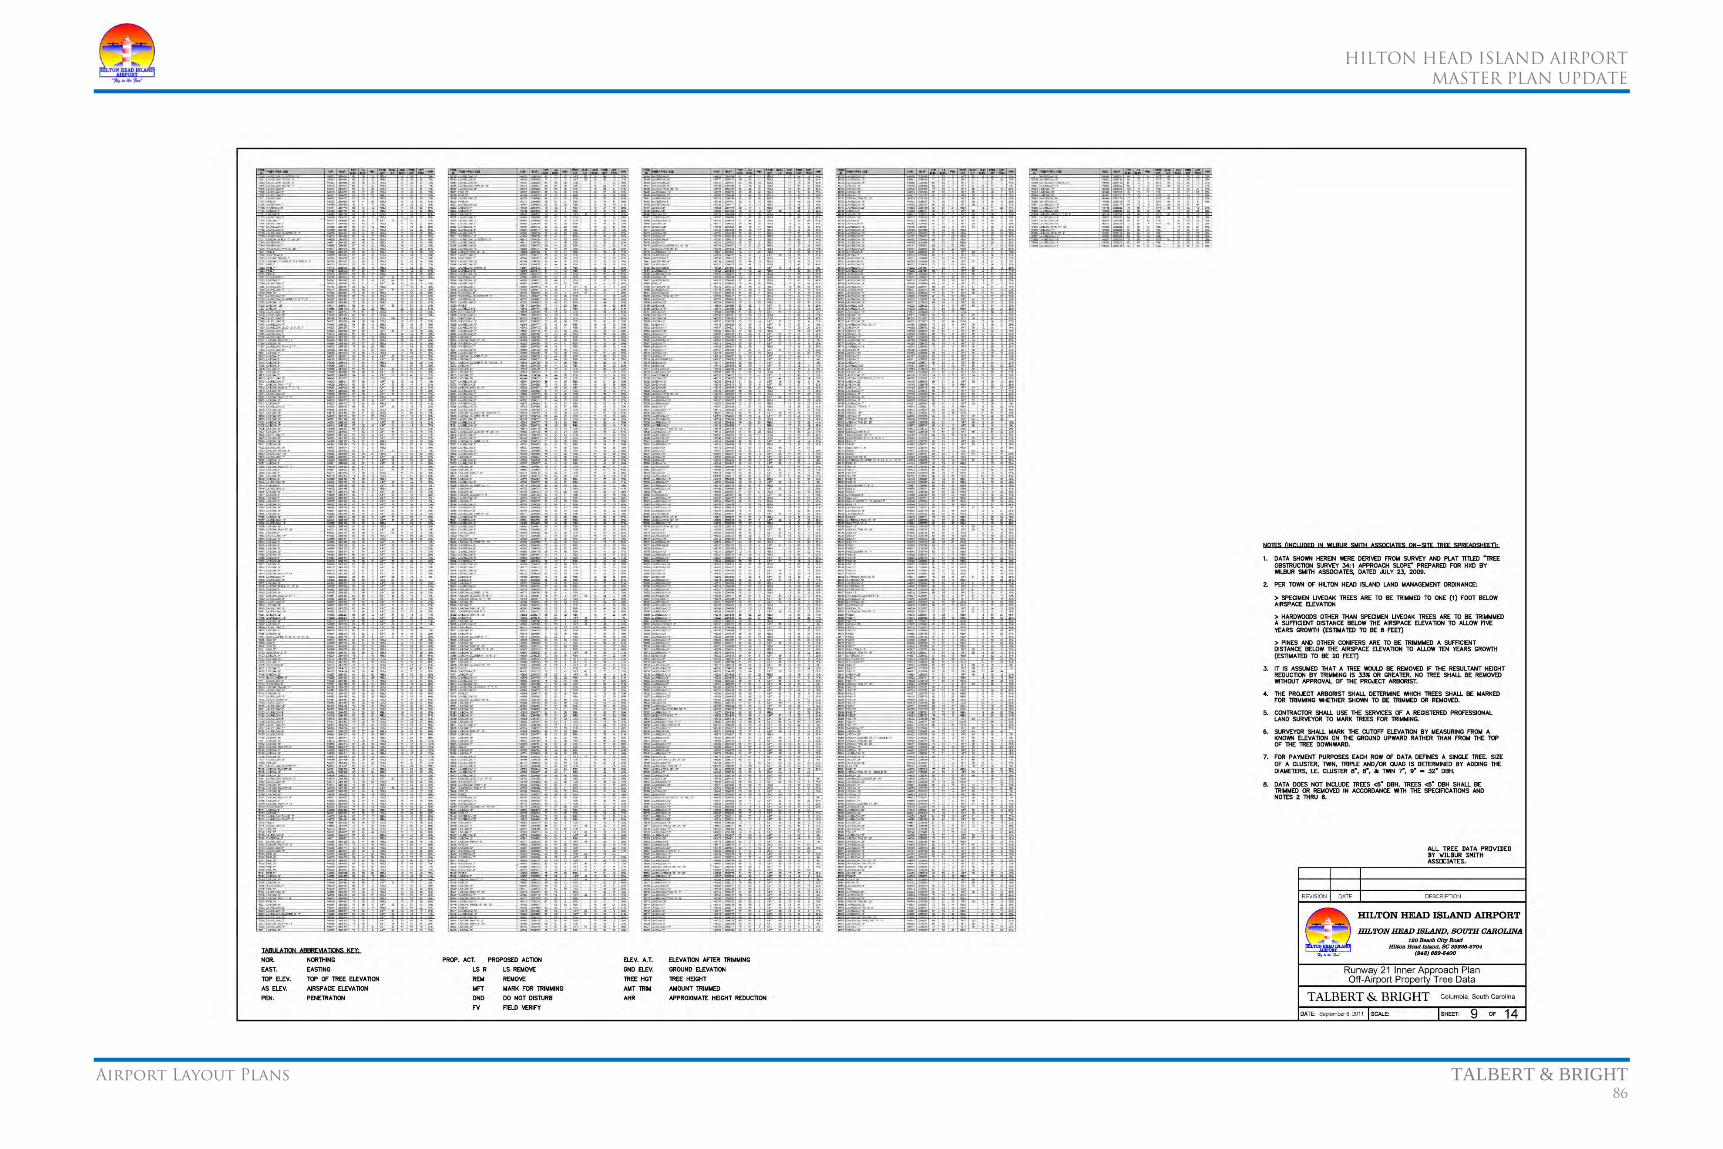
HILTON HEAD ISLAND AIRPORT
MASTER PLAN UPDATE
Airport Layout Plans TALBERT & BRIGHT 86

HILTON HEAD ISLAND AIRPORT
MASTER PLAN UPDATE
Airport Layout Plans TALBERT & BRIGHT 87
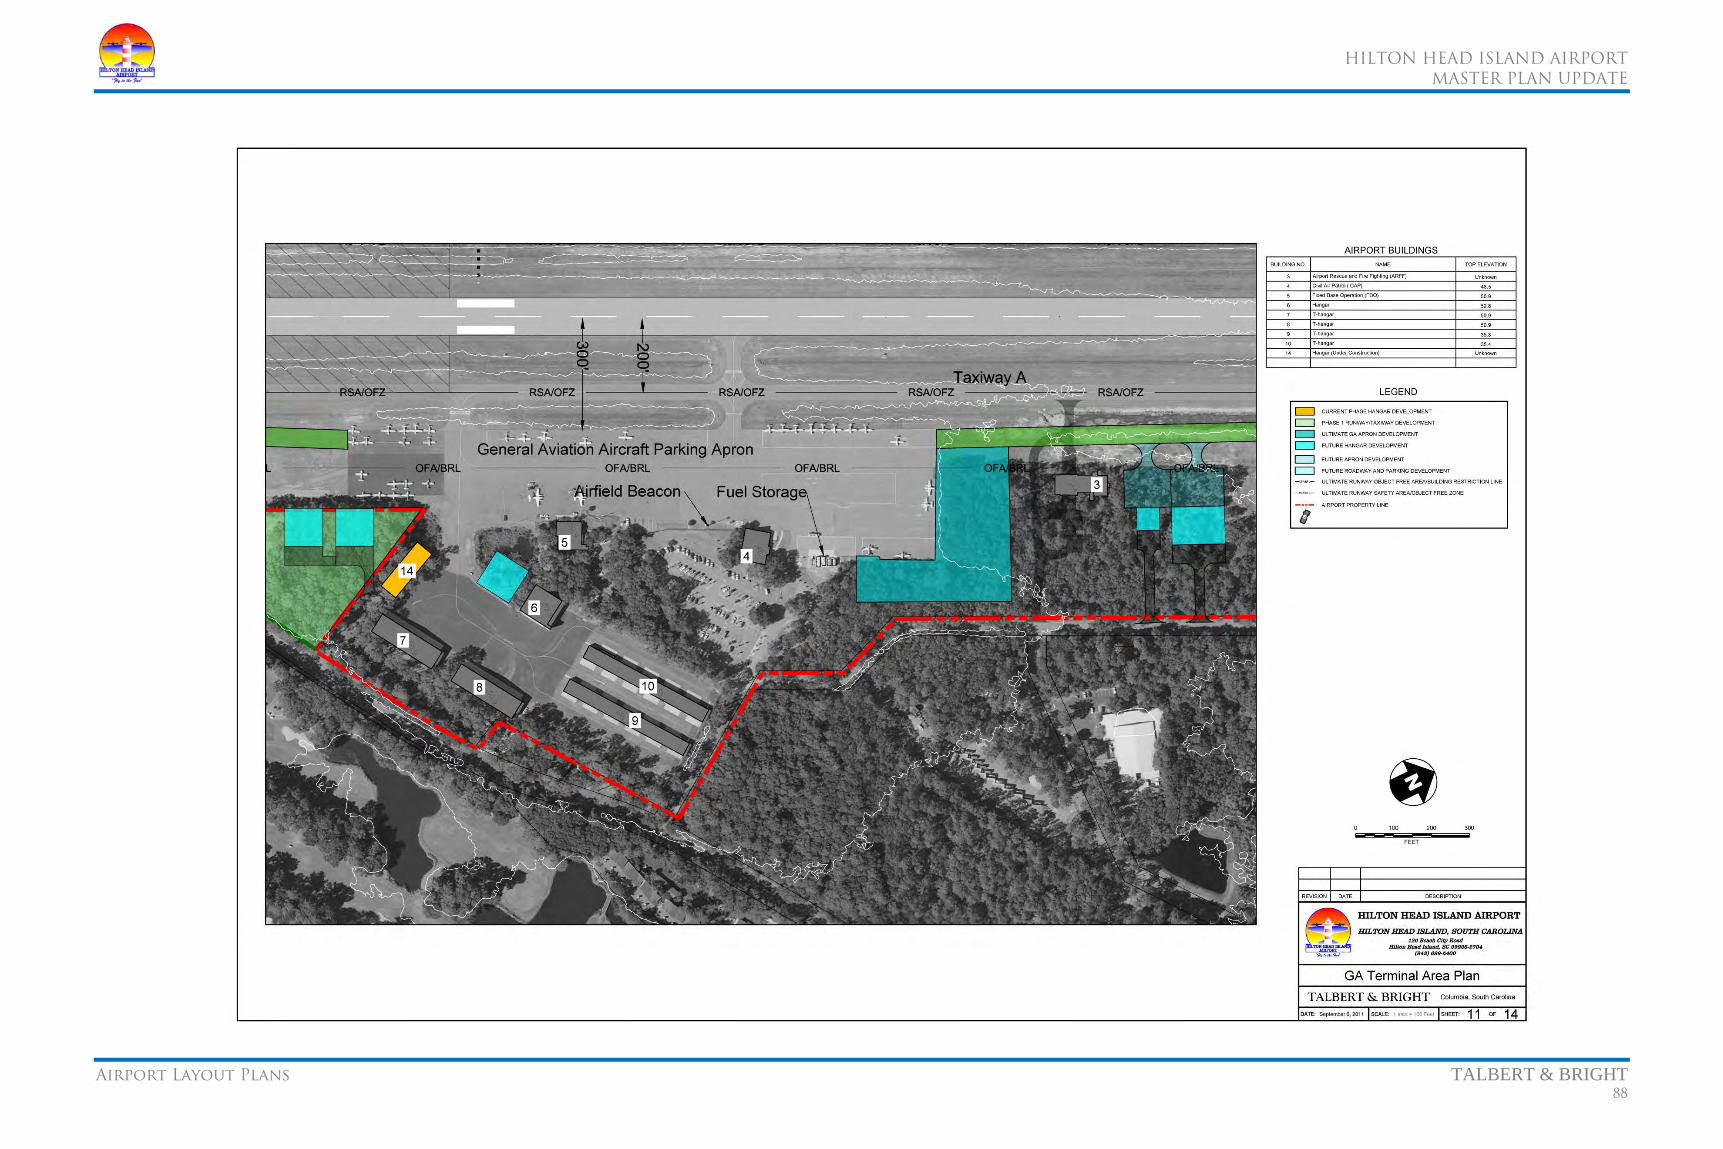
HILTON HEAD ISLAND AIRPORT
MASTER PLAN UPDATE
Airport Layout Plans TALBERT & BRIGHT 88
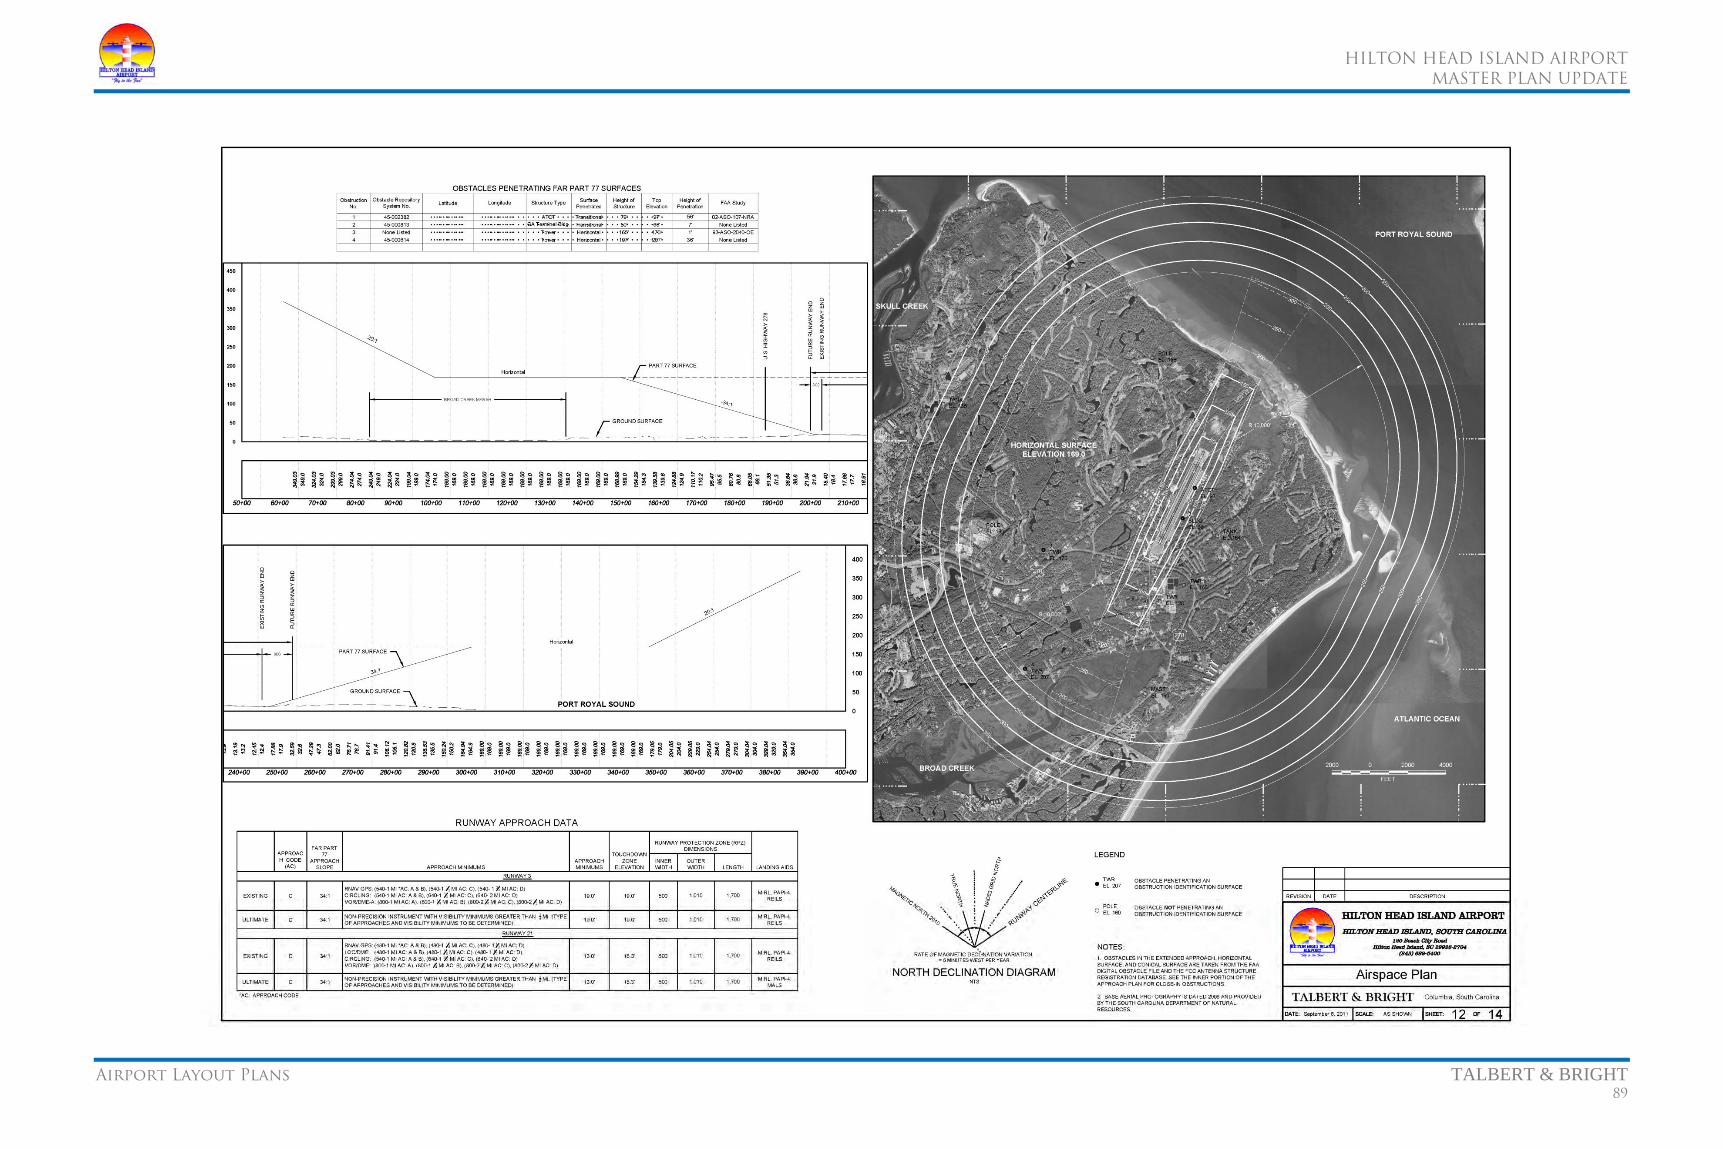
HILTON HEAD ISLAND AIRPORT
MASTER PLAN UPDATE
Airport Layout Plans TALBERT & BRIGHT 89
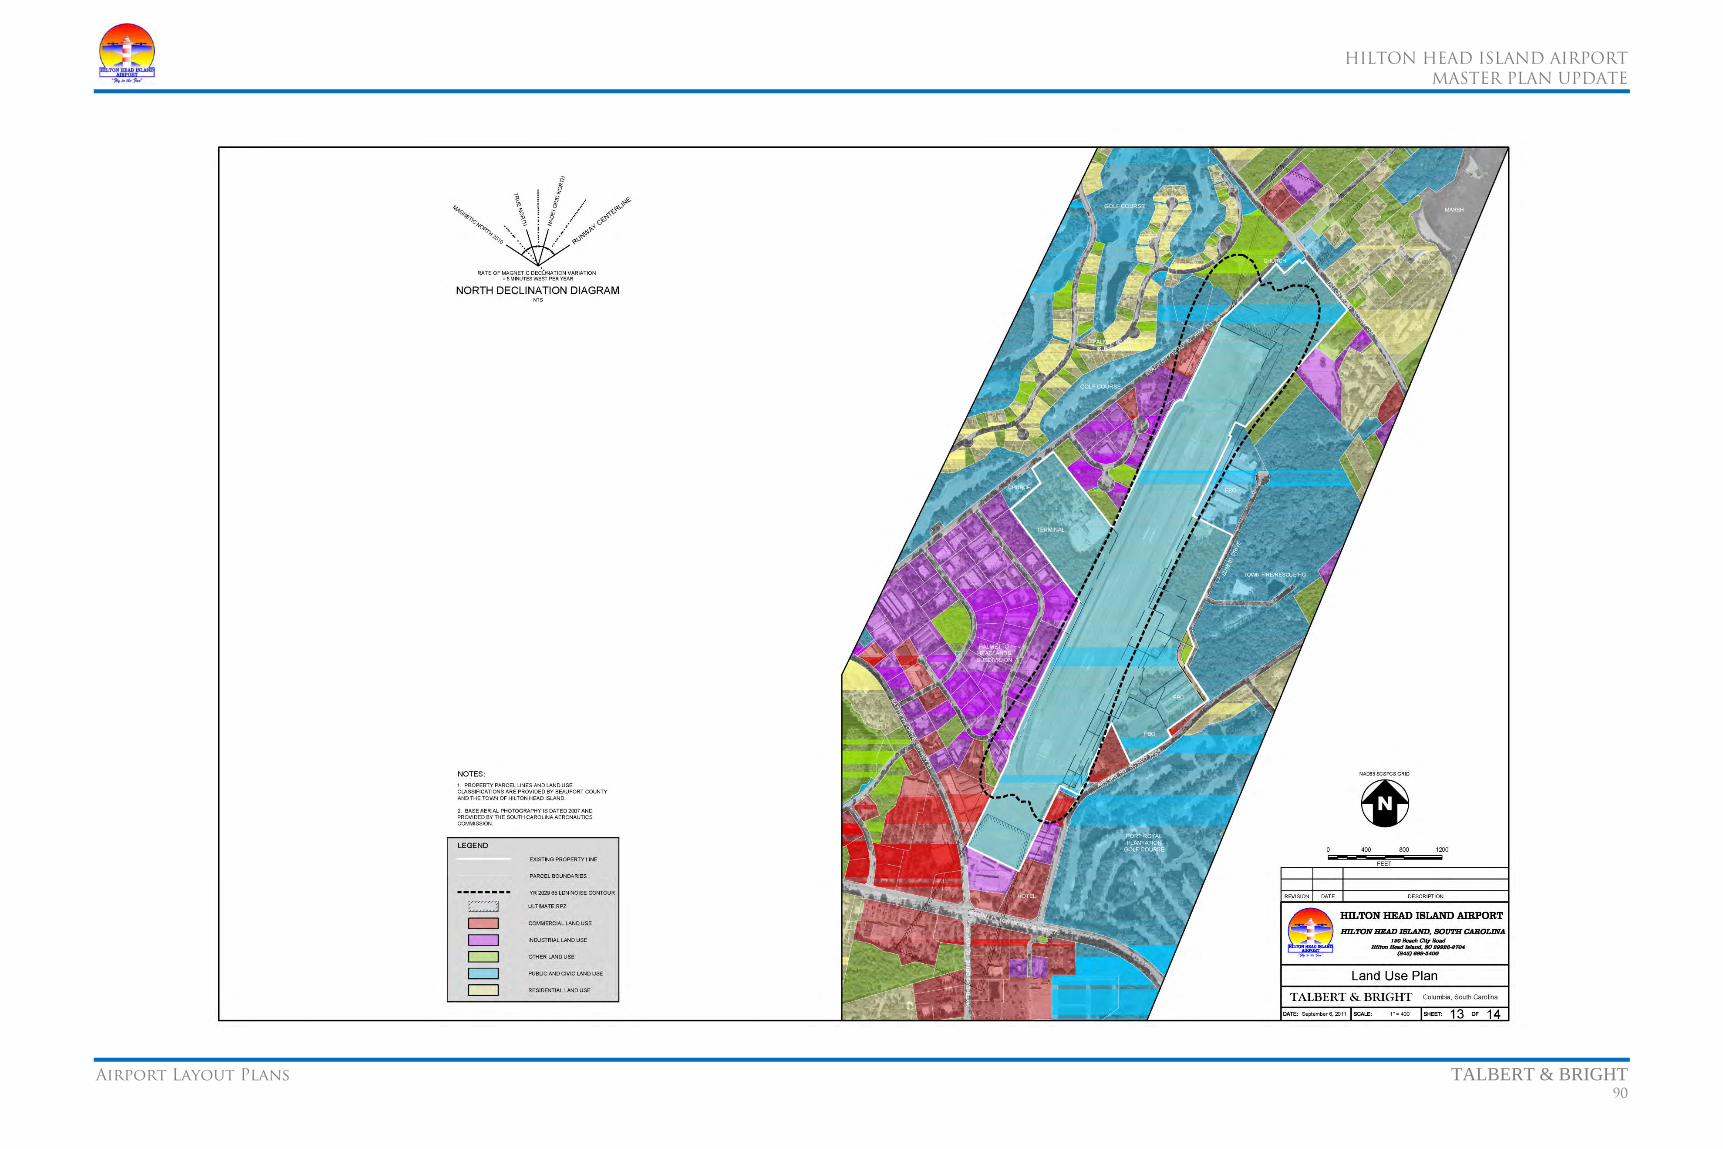
HILTON HEAD ISLAND AIRPORT
MASTER PLAN UPDATE
Airport Layout Plans TALBERT & BRIGHT 90

HILTON HEAD ISLAND AIRPORT
MASTER PLAN UPDATE
Airport Layout Plans TALBERT & BRIGHT 91

HILTON HEAD ISLAND AIRPORT
MASTER PLAN UPDATE
Facilities implementation Plan TALBERT & BRIGHT 92
This chapter details the various projects required for continued improvement and operation of Hilton Head Island Airport for a period of 20 years (2010-2029). These projects, by phase (time period), include estimates of probable construction costs in constant 2010 dollars. These planning cost estimates are intended as order of magnitude costs only. More detailed project definitions and associated estimates must be developed prior to implementation of any project identified herein.
The 20-year airport improvement program is broken into one of the three following development phases:
• Phase I (2010-2014)
• Phase II (2014-2019)
• Phase III (2020-2029)
A brief description of each improvement is provided for each development phase, as illustrated on the ALP. The recommended staging is not absolute, and changes in demand, priorities, economy, or funding may alter the need or timing of each proposed development.
The estimated costs include various equipment, construction, and development items scheduled for each phase, along with estimated costs at 2010 constant dollars. These costs should be periodically reviewed and updated to account for inflation and other changing conditions. Each figure represents an order of magnitude estimate of the total project cost for each item, including not only construction, but also incidental expenses such as engineering, planning, construction administration, surveying, and testing. Since these are preliminary order of magnitude estimates for planning purposes, a contingency amount was added to each cost item to cover unforeseen conditions, which may occur during actual development. This approach is an industry standard used to prepare preliminary planning estimates and, though somewhat conservative, reduces the likelihood of budget overruns when detailed design is completed and bids received.
8.1 AIRPORT DEVELOMENT PROGRAM
This section lists each future airport improvement project by phase for the 20-year planning period (2010-2029). Planning estimates of probable construction cost are listed on Table 8.1-1, as well as a breakdown of potential FAA, state, and local funding sources, and Appendix F.
Table 8.1-1 Preliminary Project Cost Estimates (2010 $)*
Hilton Head Island Airport Phase Project Cost Federal State Local
I Commercial Service Terminal Expansion $1,900,000 $1,805,000 $0 $95,000 I Land Acquisition for Airfield Deficiency Correction $3,600,000 $3,420,000 $0 $180,000 I Airfield Deficiency Correction $2,041,400 $1,939,330 $51,035 $51,035 I Runway 03 EMAS $2,000,000 $1,900,000 $50,000 $50,000 I Runway Extension Benefit Cost Analysis/Environmental
Documentation $500,000 $475,000 $12,500 $12,500
I Land Acquisition for Runway Extension and Road Relocation $5,500,000 $5,225,000 $0 $275,000 I 700' Runway Extension Design and Construction $2,245,200 $2,132,940 $56,130 $56,130 I 400' Runway Extension Design and Construction $925,000 $878,750 $23,125 $23,125 I Runway 21 EMAS $2,000,000 $1,900,000 $50,000 $50,000 I Relocation of Beach City Road Design and Construction $750,000 $712,500 $18,750 $18,750 I Runway 03 34:1 Obstruction Removal (trees) $1,500,000 $1,425,000 $37,500 $37,500 I Transitional Surface Obstruction Removal (trees) $2,000,000 $1,900,000 $50,000 $50,000 TOTAL $24,961,600 $23,713,520 $349,040 $899,040 II Avigation Easements within Runway 21 RPZ $1,145,000 $1,087,750 $0 $57,250 II Commercial Service Parking Lot Expansion (120 spaces) $922,100 $0 $0 $922,100 II General Aviation Apron Expansion (18,500 sq yd) $1,600,000 $1,520,000 $40,000 $40,000 II 10-Unit T-Hangar $1,350,000 $1,282,500 $33,750 $33,750 II Conventional Hangars (2) $2,830,000 $2,688,500 $70,750 $70,750 II Land Acquisition General Aviation Side $3,335,000 $3,168,250 $0 $83,375 TOTAL $11,182,100 $9,747,000 $144,500 $1,207,225
III 10-Unit T-Hangar (2) $2,660,000 $2,527,000 $66,500 $66,500 III Conventional Hangars (2) $2,450,000 $2,327,500 $61,250 $61,250 III General Aviation Apron Expansion (17,000 sq yd) $1,520,000 $1,444,000 $38,000 $38,000 III Commercial Service Parking Lot Expansion (150 spaces) $720,000 $0 $0 $720,000 III Land Acquisition (Exec Air) $9,400,000 $8,930,000 $0 $470,000 TOTAL $16,750,000 $15,228,500 $165,750 $1,355,750 GRAND TOTAL $52,893,700 $48,689,020 $659,290 $3,462,015
* - These are estimations only and are not to be relied on without further confirmation. Source: Talbert & Bright, Inc. October 2010.

HILTON HEAD ISLAND AIRPORT
MASTER PLAN UPDATE
Financial Feasibility Analysis TALBERT & BRIGHT 93
This section presents an analysis to determine the financial overview of the capital improvements proposed for the Hilton Head Island Airport over the 20-year planning period. The analyses presented in this section assess the financial implications of the Airport undertaking the proposed Master Plan Update improvement program. The Airport’s ability to generate future revenues in excess of projected future operating expenses, any new debt service, and proposed capital projects are examined. The financial overview was conducted as follows:
• The Airport’s existing financial structure was examined to determine its primary revenue generating sources, as well as major expenses.
• A phasing plan (a schedule of proposed capital projects) was previously prepared to illustrate the staging of the projects recommended for the Airport throughout the 20-year planning period. This 20-year period was further subdivided into three planning periods: short-term (2010-2014), intermediate-term (2015-2019), and long-term (2020-2029).
• Funding sources, including the FAA and SCAC, were examined based on eligibility guidelines contained in the FAA’s Airport Improvement Program and SCAC guidelines. Options for funding the local share of project costs, such as general obligation or revenue bonds or passenger facility charge (PFC) revenue, were also explored.
• Projections of revenues and expenses, as they relate to the operation of the Airport, were produced. An analysis of the Airport’s future operating income/deficit was developed to determine an estimate of net remaining revenues available to meet projected capital costs.
Given the number of variables involved in an airport’s financial environment, such as the entry or exit of airlines, financial projections beyond five years tend to be speculative and of little practical value. In addition, capital projects beyond five years are often uncertain and can change in their order of importance and priority. Therefore, this analysis focused primarily on the short-term planning period (2011-2015).
This section, which presents the results of the financial overview, is organized as follows:
• Airport Financial Structure
• Capital Improvement Program (CIP)
• Development Plan Financing
• Historical Financial Information
• Pro Forma Cash Flow Analysis
• Summary and Recommendations
9.1 AIRPORT FINANCIAL STRUCTURE
The Airport operates on a fiscal year (FY) ending June 30. Revenues and expenses are recorded on an accrual basis. Accordingly, revenues are recorded when they are earned, and expenses are recognized when they are incurred. The Airport's revenues, expenses, and other financial transactions are recorded in the Beaufort County’s financial records as a part of the County’s general fund. For this financial overview analysis, revenues and expenses have been depicted based on specific revenue and expense categories as recorded by Beaufort County.
9.2 CAPITAL IMPROVEMENT PROGRAM
Prudent financial planning requires the use of quality, order of magnitude project cost estimates, as well as conservative funding and financing assumptions. Based on the recommended capital improvement program (CIP) developed as part of this Master Plan Update (Table 8.1-1, page 92), a phasing plan and cost estimates were prepared to illustrate the timing and relative magnitude of the capital expenditures required to fully implement the CIP. As previously mentioned, emphasis was placed on the short-term planning period projects and the intermediate- and long-term planning period projects were discussed in general.
The cost estimates associated with the recommended projects in the Master Plan Update are intended to be order of magnitude and presented in 2010 construction year dollars. The cost estimates are based on traditional design, bid, and build and include an allowance for professional design, construction administration, building permits, and testing and inspection, as well as a 10 percent construction contingency.
As depicted on Table 9.2-1 (page 94), the proposed projects are summarized into the following project categories: airfield, general aviation, and commercial service passenger terminal area projects.
9.3 DEVELOPMENT PLAN FINANCING
9.3.1 Potential Funding Sources
An airport typically does not provide all the needed capital development funds from internal sources. Federal, state, and private funding together with airport funds and bond proceeds (supported by airport revenues and/or municipal support) are usually combined to produce the total funds required to undertake a CIP. Typically, these sources include: FAA, state, private funds (tenant or third-party provided), airport funds, PFCs, loans or bond
proceeds, among other sources of capital funding. These sources are heavily relied upon by commercial airports for funding support, although several of these key sources are subject to change by Congress or other political entities. Some, such as the FAA Airport Improvement Program, have been modified significantly from time to time. One source, the Passenger Facility Charge program, was authorized by Congress in 1991 and has become a major source of capital funds for airport development.
In identifying potential sources of funds, it is necessary to examine each project element to determine its eligibility for each program or funding source. It is also important to consider the availability of funds for each funding source. The following paragraphs briefly describe the primary external funding sources, which may be available to provide funding for projects recommended in this Master Plan Update.
9.3.2 Federal Aviation Administration – Aviation Trust
Fund
Congress began appropriating money for airport development in 1946 through the enactment of the Federal Airport Act. Since that time, Congress has passed multiple legislative measures intended to develop the national air transportation system in the United States. Congress enacted the Airport and Airway Revenue Act of 1970, which established the Airport and Airways Trust Fund. The Trust Fund is intended to provide the primary source of funding for FAA operations, facilities, and equipment and to provide funding for the development of certain public use airports. The Trust Fund is supported by a series of aviation-related excise taxes through charges on passenger tickets, cargo waybills, and aviation gasoline and jet fuel.
The majority of the Trust Fund is supported by passenger ticket taxes paid by users of the commercial airline industry. As a result, the amount of aviation taxes generated in a given year to support the Trust Fund is dependent on the national level of commercial aviation activity and total revenues generated from these activities.
The revenues supporting the Trust Fund come from a variety of aviation user fees and fuel taxes. These tax revenues were authorized until September 30, 2007, by the Taxpayer Relief Act of 1997 (P.L. 105-34). The authority for these taxes has been extended through December 31, 2010. Revenue sources include:
• 7.5 percent ticket tax
• $3.60 flight segment tax61
• 6.25 percent tax on cargo waybills 61 A flight segment is defined as “a single takeoff and a single landing.” The flight segment fee has been inflation adjusted (rounded off to the nearest dime) on an annual basis since January 1, 2004.
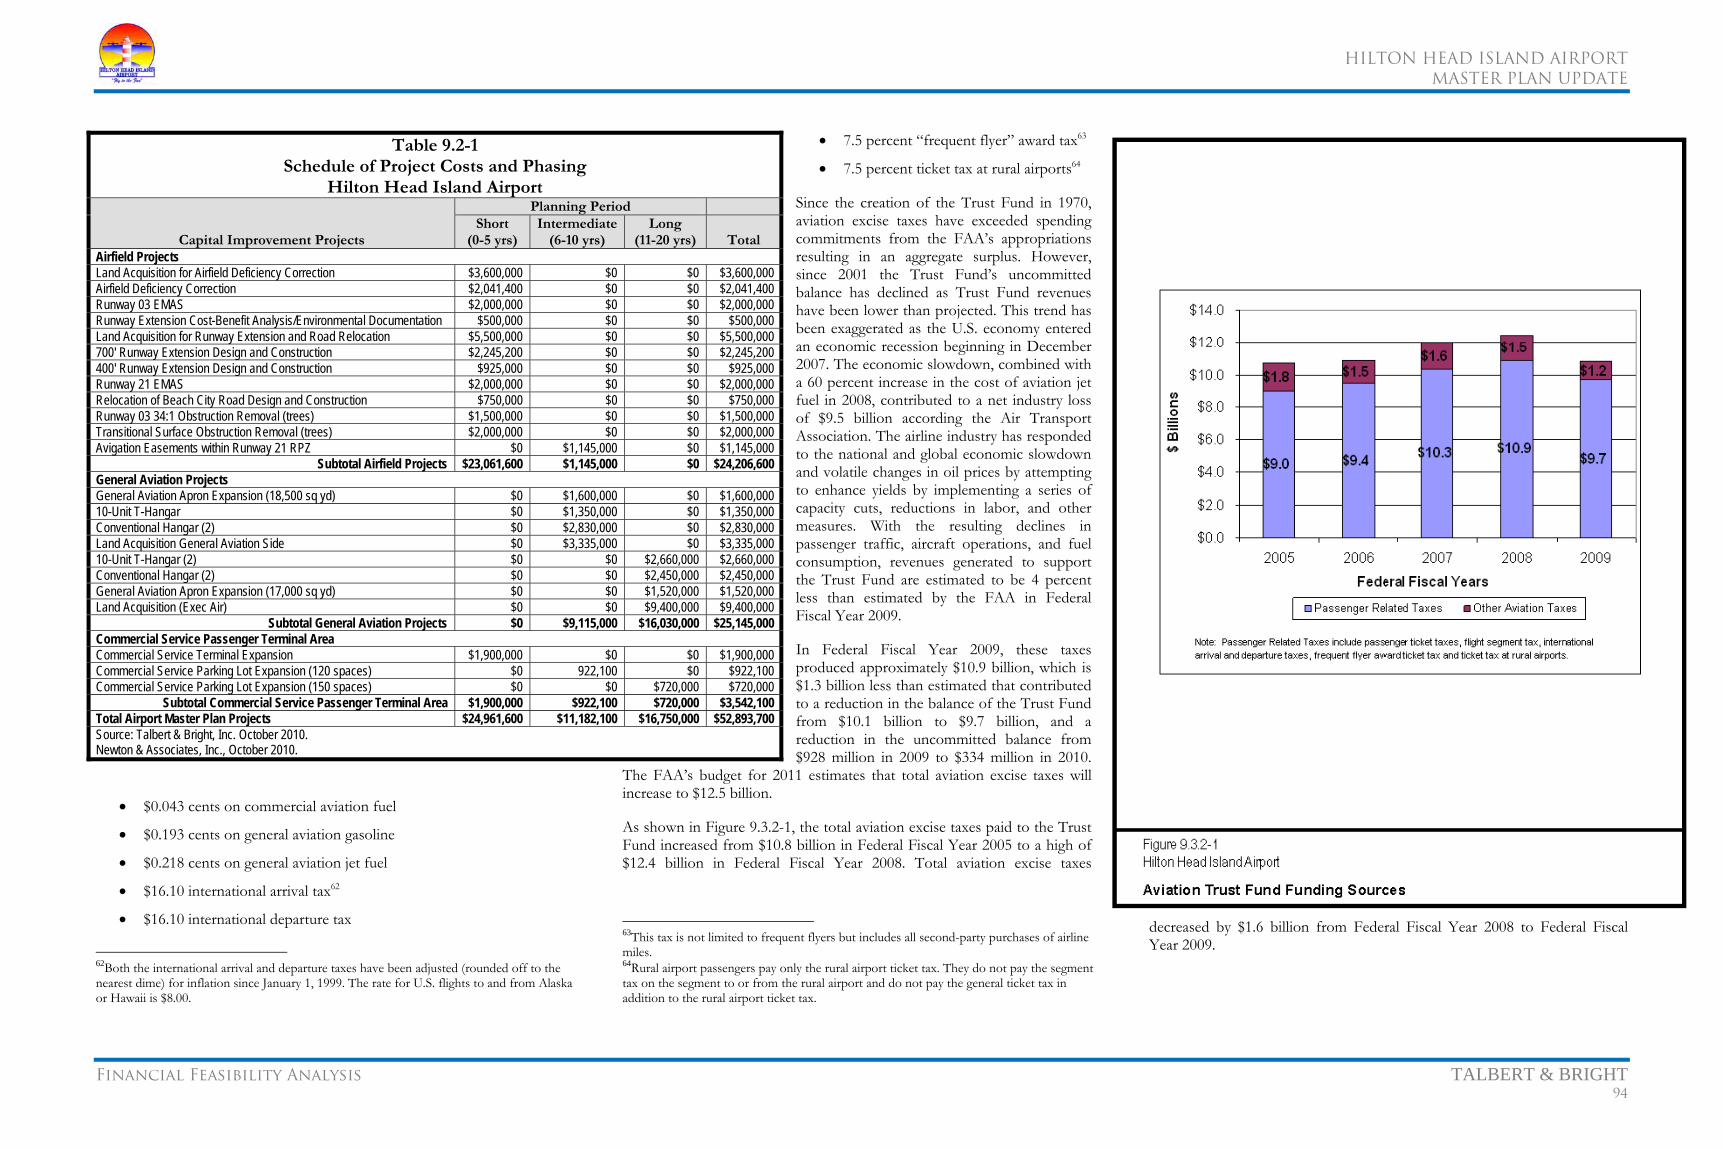
HILTON HEAD ISLAND AIRPORT
MASTER PLAN UPDATE
Financial Feasibility Analysis TALBERT & BRIGHT 94
• $0.043 cents on commercial aviation fuel
• $0.193 cents on general aviation gasoline
• $0.218 cents on general aviation jet fuel
• $16.10 international arrival tax62
• $16.10 international departure tax
62Both the international arrival and departure taxes have been adjusted (rounded off to the nearest dime) for inflation since January 1, 1999. The rate for U.S. flights to and from Alaska or Hawaii is $8.00.
• 7.5 percent “frequent flyer” award tax63
• 7.5 percent ticket tax at rural airports64
Since the creation of the Trust Fund in 1970, aviation excise taxes have exceeded spending commitments from the FAA’s appropriations resulting in an aggregate surplus. However, since 2001 the Trust Fund’s uncommitted balance has declined as Trust Fund revenues have been lower than projected. This trend has been exaggerated as the U.S. economy entered an economic recession beginning in December 2007. The economic slowdown, combined with a 60 percent increase in the cost of aviation jet fuel in 2008, contributed to a net industry loss of $9.5 billion according the Air Transport Association. The airline industry has responded to the national and global economic slowdown and volatile changes in oil prices by attempting to enhance yields by implementing a series of capacity cuts, reductions in labor, and other measures. With the resulting declines in passenger traffic, aircraft operations, and fuel consumption, revenues generated to support the Trust Fund are estimated to be 4 percent less than estimated by the FAA in Federal Fiscal Year 2009.
In Federal Fiscal Year 2009, these taxes produced approximately $10.9 billion, which is $1.3 billion less than estimated that contributed to a reduction in the balance of the Trust Fund from $10.1 billion to $9.7 billion, and a reduction in the uncommitted balance from $928 million in 2009 to $334 million in 2010.
The FAA’s budget for 2011 estimates that total aviation excise taxes will increase to $12.5 billion.
As shown in Figure 9.3.2-1, the total aviation excise taxes paid to the Trust Fund increased from $10.8 billion in Federal Fiscal Year 2005 to a high of $12.4 billion in Federal Fiscal Year 2008. Total aviation excise taxes
63This tax is not limited to frequent flyers but includes all second-party purchases of airline miles. 64Rural airport passengers pay only the rural airport ticket tax. They do not pay the segment tax on the segment to or from the rural airport and do not pay the general ticket tax in addition to the rural airport ticket tax.
decreased by $1.6 billion from Federal Fiscal Year 2008 to Federal Fiscal Year 2009.
Table 9.2-1 Schedule of Project Costs and Phasing
Hilton Head Island Airport
Capital Improvement Projects
Planning Period Short
(0-5 yrs) Intermediate
(6-10 yrs) Long
(11-20 yrs) TotalAirfield Projects Land Acquisition for Airfield Deficiency Correction $3,600,000 $0 $0 $3,600,000 Airfield Deficiency Correction $2,041,400 $0 $0 $2,041,400 Runway 03 EMAS $2,000,000 $0 $0 $2,000,000 Runway Extension Cost-Benefit Analysis/Environmental Documentation $500,000 $0 $0 $500,000 Land Acquisition for Runway Extension and Road Relocation $5,500,000 $0 $0 $5,500,000 700' Runway Extension Design and Construction $2,245,200 $0 $0 $2,245,200 400' Runway Extension Design and Construction $925,000 $0 $0 $925,000 Runway 21 EMAS $2,000,000 $0 $0 $2,000,000 Relocation of Beach City Road Design and Construction $750,000 $0 $0 $750,000 Runway 03 34:1 Obstruction Removal (trees) $1,500,000 $0 $0 $1,500,000 Transitional Surface Obstruction Removal (trees) $2,000,000 $0 $0 $2,000,000 Avigation Easements within Runway 21 RPZ $0 $1,145,000 $0 $1,145,000
Subtotal Airfield Projects $23,061,600 $1,145,000 $0 $24,206,600 General Aviation Projects General Aviation Apron Expansion (18,500 sq yd) $0 $1,600,000 $0 $1,600,000 10-Unit T-Hangar $0 $1,350,000 $0 $1,350,000 Conventional Hangar (2) $0 $2,830,000 $0 $2,830,000 Land Acquisition General Aviation Side $0 $3,335,000 $0 $3,335,000 10-Unit T-Hangar (2) $0 $0 $2,660,000 $2,660,000 Conventional Hangar (2) $0 $0 $2,450,000 $2,450,000 General Aviation Apron Expansion (17,000 sq yd) $0 $0 $1,520,000 $1,520,000 Land Acquisition (Exec Air) $0 $0 $9,400,000 $9,400,000
Subtotal General Aviation Projects $0 $9,115,000 $16,030,000 $25,145,000 Commercial Service Passenger Terminal Area Commercial Service Terminal Expansion $1,900,000 $0 $0 $1,900,000 Commercial Service Parking Lot Expansion (120 spaces) $0 922,100 $0 $922,100 Commercial Service Parking Lot Expansion (150 spaces) $0 $0 $720,000 $720,000
Subtotal Commercial Service Passenger Terminal Area $1,900,000 $922,100 $720,000 $3,542,100 Total Airport Master Plan Projects $24,961,600 $11,182,100 $16,750,000 $52,893,700 Source: Talbert & Bright, Inc. October 2010. Newton & Associates, Inc., October 2010.
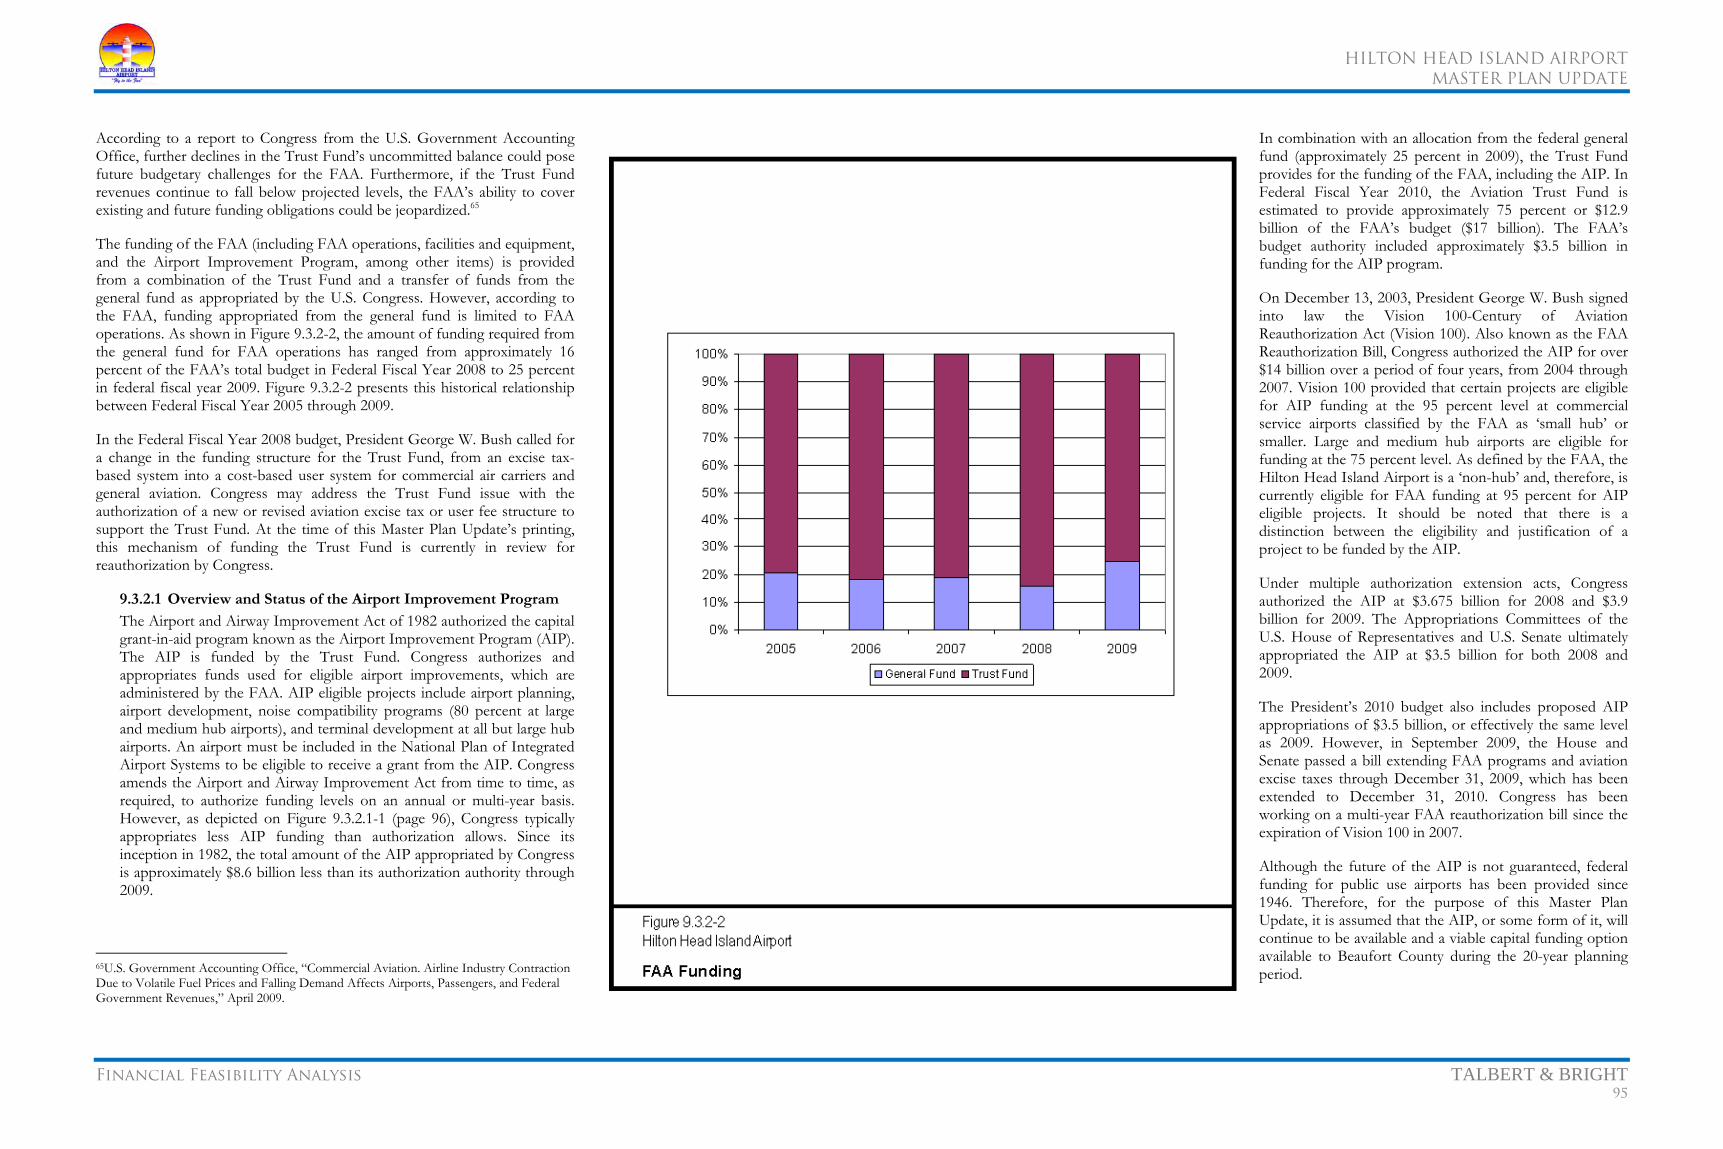
HILTON HEAD ISLAND AIRPORT
MASTER PLAN UPDATE
Financial Feasibility Analysis TALBERT & BRIGHT 95
According to a report to Congress from the U.S. Government Accounting Office, further declines in the Trust Fund’s uncommitted balance could pose future budgetary challenges for the FAA. Furthermore, if the Trust Fund revenues continue to fall below projected levels, the FAA’s ability to cover existing and future funding obligations could be jeopardized.65
The funding of the FAA (including FAA operations, facilities and equipment, and the Airport Improvement Program, among other items) is provided from a combination of the Trust Fund and a transfer of funds from the general fund as appropriated by the U.S. Congress. However, according to the FAA, funding appropriated from the general fund is limited to FAA operations. As shown in Figure 9.3.2-2, the amount of funding required from the general fund for FAA operations has ranged from approximately 16 percent of the FAA’s total budget in Federal Fiscal Year 2008 to 25 percent in federal fiscal year 2009. Figure 9.3.2-2 presents this historical relationship between Federal Fiscal Year 2005 through 2009.
In the Federal Fiscal Year 2008 budget, President George W. Bush called for a change in the funding structure for the Trust Fund, from an excise tax-based system into a cost-based user system for commercial air carriers and general aviation. Congress may address the Trust Fund issue with the authorization of a new or revised aviation excise tax or user fee structure to support the Trust Fund. At the time of this Master Plan Update’s printing, this mechanism of funding the Trust Fund is currently in review for reauthorization by Congress.
9.3.2.1 Overview and Status of the Airport Improvement Program
The Airport and Airway Improvement Act of 1982 authorized the capital grant-in-aid program known as the Airport Improvement Program (AIP). The AIP is funded by the Trust Fund. Congress authorizes and appropriates funds used for eligible airport improvements, which are administered by the FAA. AIP eligible projects include airport planning, airport development, noise compatibility programs (80 percent at large and medium hub airports), and terminal development at all but large hub airports. An airport must be included in the National Plan of Integrated Airport Systems to be eligible to receive a grant from the AIP. Congress amends the Airport and Airway Improvement Act from time to time, as required, to authorize funding levels on an annual or multi-year basis. However, as depicted on Figure 9.3.2.1-1 (page 96), Congress typically appropriates less AIP funding than authorization allows. Since its inception in 1982, the total amount of the AIP appropriated by Congress is approximately $8.6 billion less than its authorization authority through 2009.
65U.S. Government Accounting Office, “Commercial Aviation. Airline Industry Contraction Due to Volatile Fuel Prices and Falling Demand Affects Airports, Passengers, and Federal Government Revenues,” April 2009.
In combination with an allocation from the federal general fund (approximately 25 percent in 2009), the Trust Fund provides for the funding of the FAA, including the AIP. In Federal Fiscal Year 2010, the Aviation Trust Fund is estimated to provide approximately 75 percent or $12.9 billion of the FAA’s budget ($17 billion). The FAA’s budget authority included approximately $3.5 billion in funding for the AIP program.
On December 13, 2003, President George W. Bush signed into law the Vision 100-Century of Aviation Reauthorization Act (Vision 100). Also known as the FAA Reauthorization Bill, Congress authorized the AIP for over $14 billion over a period of four years, from 2004 through 2007. Vision 100 provided that certain projects are eligible for AIP funding at the 95 percent level at commercial service airports classified by the FAA as ‘small hub’ or smaller. Large and medium hub airports are eligible for funding at the 75 percent level. As defined by the FAA, the Hilton Head Island Airport is a ‘non-hub’ and, therefore, is currently eligible for FAA funding at 95 percent for AIP eligible projects. It should be noted that there is a distinction between the eligibility and justification of a project to be funded by the AIP.
Under multiple authorization extension acts, Congress authorized the AIP at $3.675 billion for 2008 and $3.9 billion for 2009. The Appropriations Committees of the U.S. House of Representatives and U.S. Senate ultimately appropriated the AIP at $3.5 billion for both 2008 and 2009.
The President’s 2010 budget also includes proposed AIP appropriations of $3.5 billion, or effectively the same level as 2009. However, in September 2009, the House and Senate passed a bill extending FAA programs and aviation excise taxes through December 31, 2009, which has been extended to December 31, 2010. Congress has been working on a multi-year FAA reauthorization bill since the expiration of Vision 100 in 2007.
Although the future of the AIP is not guaranteed, federal funding for public use airports has been provided since 1946. Therefore, for the purpose of this Master Plan Update, it is assumed that the AIP, or some form of it, will continue to be available and a viable capital funding option available to Beaufort County during the 20-year planning period.

HILTON HEAD ISLAND AIRPORT
MASTER PLAN UPDATE
Financial Feasibility Analysis TALBERT & BRIGHT 96
9.3.2.2 Obligations and Assurances
The Airport and Airways Improvements Act of 1982, among other things, requires airport sponsors to provide certain assurances (sponsor’s assurances) that it will comply with federal law and regulation in using FAA AIP grant funds and in operating the airport. The airport sponsor must comply with the sponsor’s assurances in the performance of grant agreements for airport development, airport planning, and noise compatibility program grants. The sponsor’s assurances are required to be submitted as part of the project application by airport sponsors requesting funds under the provisions of Title 49, U.S.C., subtitle VII, as amended.
As of the date of this Master Plan Update, there are 37 sponsor’s assurances. Among these sponsor’s assurances is the assurance that the airport operator will (i) make the airport available as an airport for public use on fair and reasonable terms without unjust discrimination (Assurance 22); (ii) permit no exclusive aeronautical rights for use of the airport (Assurance 23); and (iii) maintain a fee and rental structure, consistent with Assurances 22 and 23, for facilities and services being provided to the airport users that will make the airport as financially self-sustaining as possible under the circumstances existing at the particular airport (Assurance 24).
9.3.3 Airport Improvement Program -
Funding Sources
Grants administered by the FAA through the AIP represent a critical capital funding source for Beaufort County to accomplish the projects recommended in this Master Plan Update. However, given the uncertainty of the future status of the AIP Program, it is not possible to confirm the level of future AIP grants available to provide funding for the recommended projects. Notwithstanding, for the purpose of this Master Plan Update, it is assumed that the AIP will continue to be authorized and appropriated at levels reasonably consistent with the Congressional authorization Vision 100 and the 2010 AIP appropriation.
Within the existing AIP authorization, there are two major subcategories that are generally used for improvement programs: entitlement grant and discretionary grant programs.
9.3.3.1 Passenger Entitlement Grants
One of the most common types of federal funding available for commercial service airports in the United States is passenger entitlement grants (entitlement grants) funded through the AIP and administered by the FAA. Entitlement grants are essentially an allocation of certain AIP funds based upon an airport’s total number of annual enplaned passengers in a given year. Only airports defined by the FAA as primary airports (those having 10,000 or more enplanements) are eligible to receive AIP entitlement grants. Hilton Head Island Airport is classified by the FAA as a primary airport. Pursuant to Vision 100, in any federal fiscal year in which Congress appropriates funding for the AIP program at the $3.2 billion level or more, then primary airports receive apportionments based on the following number of enplaned passengers:
• $15.60 for each of the first 50,000 enplanements
• $10.40 for each of the next 50,000 enplanements
• $5.20 for each of the next 400,000 enplanements
• $1.20 for each additional enplanement
Given the AIP appropriation level of $3.5 billion in 2009 and 2010, Vision 100 provides primary airports with a minimum of $1.0 million per federal fiscal year. For the purpose of determining passenger entitlements grants apportioned in 2011, the FAA uses the number of passengers enplaned at each airport in calendar year 2009. According to the FAA, the Hilton Head Island Airport enplaned 66,893 passengers in calendar year 2009. This difference from the 75,453 enplanements described in Section 3.3.2 – Commercial Service Air Carrier Enplanement Forecast Scenarios (page 18) may be explained by charter and other unscheduled enplanement activity occurring at the Airport. Based on the number of enplaned passengers in calendar year 2009 according to the FAA, the AIP passenger entitlement grant apportionment formula yields $955,687 per year. However, given the 2010 AIP appropriation level, the FAA has apportioned a minimum of $1.0 million in AIP passenger entitlement grants to the Hilton Head Island Airport.
Actual final amounts of AIP passenger entitlement grants may be affected by the total amounts periodically authorized and appropriated by Congress for this program. Entitlement grants may be carried over from one year to the next, used to pay eligible debt service on bonds issued to finance eligible projects; and among other provisions, future allocation may be earmarked for repayment of current expenditures if the FAA concurs and issues a letter of intent.
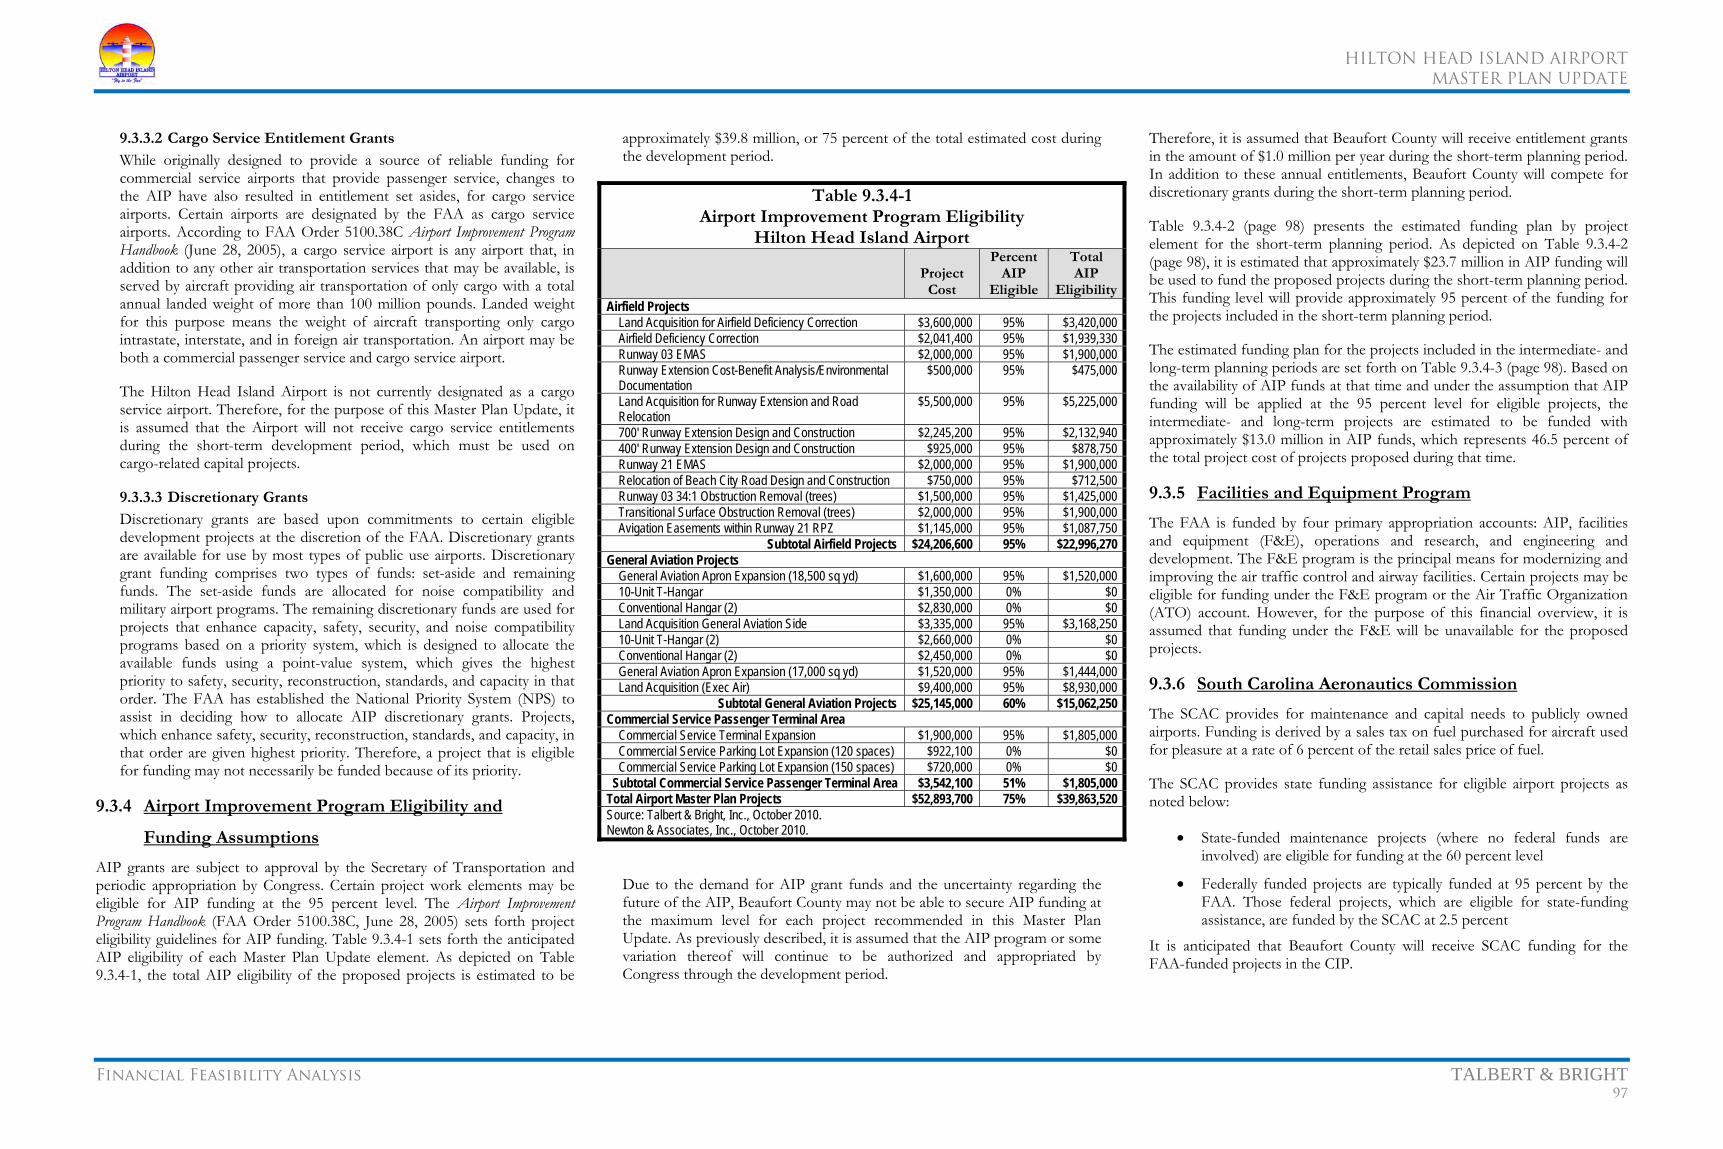
HILTON HEAD ISLAND AIRPORT
MASTER PLAN UPDATE
Financial Feasibility Analysis TALBERT & BRIGHT 97
9.3.3.2 Cargo Service Entitlement Grants
While originally designed to provide a source of reliable funding for commercial service airports that provide passenger service, changes to the AIP have also resulted in entitlement set asides, for cargo service airports. Certain airports are designated by the FAA as cargo service airports. According to FAA Order 5100.38C Airport Improvement Program Handbook (June 28, 2005), a cargo service airport is any airport that, in addition to any other air transportation services that may be available, is served by aircraft providing air transportation of only cargo with a total annual landed weight of more than 100 million pounds. Landed weight for this purpose means the weight of aircraft transporting only cargo intrastate, interstate, and in foreign air transportation. An airport may be both a commercial passenger service and cargo service airport.
The Hilton Head Island Airport is not currently designated as a cargo service airport. Therefore, for the purpose of this Master Plan Update, it is assumed that the Airport will not receive cargo service entitlements during the short-term development period, which must be used on cargo-related capital projects.
9.3.3.3 Discretionary Grants
Discretionary grants are based upon commitments to certain eligible development projects at the discretion of the FAA. Discretionary grants are available for use by most types of public use airports. Discretionary grant funding comprises two types of funds: set-aside and remaining funds. The set-aside funds are allocated for noise compatibility and military airport programs. The remaining discretionary funds are used for projects that enhance capacity, safety, security, and noise compatibility programs based on a priority system, which is designed to allocate the available funds using a point-value system, which gives the highest priority to safety, security, reconstruction, standards, and capacity in that order. The FAA has established the National Priority System (NPS) to assist in deciding how to allocate AIP discretionary grants. Projects, which enhance safety, security, reconstruction, standards, and capacity, in that order are given highest priority. Therefore, a project that is eligible for funding may not necessarily be funded because of its priority.
9.3.4 Airport Improvement Program Eligibility and
Funding Assumptions
AIP grants are subject to approval by the Secretary of Transportation and periodic appropriation by Congress. Certain project work elements may be eligible for AIP funding at the 95 percent level. The Airport Improvement Program Handbook (FAA Order 5100.38C, June 28, 2005) sets forth project eligibility guidelines for AIP funding. Table 9.3.4-1 sets forth the anticipated AIP eligibility of each Master Plan Update element. As depicted on Table 9.3.4-1, the total AIP eligibility of the proposed projects is estimated to be
approximately $39.8 million, or 75 percent of the total estimated cost during the development period.
Due to the demand for AIP grant funds and the uncertainty regarding the future of the AIP, Beaufort County may not be able to secure AIP funding at the maximum level for each project recommended in this Master Plan Update. As previously described, it is assumed that the AIP program or some variation thereof will continue to be authorized and appropriated by Congress through the development period.
Therefore, it is assumed that Beaufort County will receive entitlement grants in the amount of $1.0 million per year during the short-term planning period. In addition to these annual entitlements, Beaufort County will compete for discretionary grants during the short-term planning period.
Table 9.3.4-2 (page 98) presents the estimated funding plan by project element for the short-term planning period. As depicted on Table 9.3.4-2 (page 98), it is estimated that approximately $23.7 million in AIP funding will be used to fund the proposed projects during the short-term planning period. This funding level will provide approximately 95 percent of the funding for the projects included in the short-term planning period.
The estimated funding plan for the projects included in the intermediate- and long-term planning periods are set forth on Table 9.3.4-3 (page 98). Based on the availability of AIP funds at that time and under the assumption that AIP funding will be applied at the 95 percent level for eligible projects, the intermediate- and long-term projects are estimated to be funded with approximately $13.0 million in AIP funds, which represents 46.5 percent of the total project cost of projects proposed during that time.
9.3.5 Facilities and Equipment Program
The FAA is funded by four primary appropriation accounts: AIP, facilities and equipment (F&E), operations and research, and engineering and development. The F&E program is the principal means for modernizing and improving the air traffic control and airway facilities. Certain projects may be eligible for funding under the F&E program or the Air Traffic Organization (ATO) account. However, for the purpose of this financial overview, it is assumed that funding under the F&E will be unavailable for the proposed projects.
9.3.6 South Carolina Aeronautics Commission
The SCAC provides for maintenance and capital needs to publicly owned airports. Funding is derived by a sales tax on fuel purchased for aircraft used for pleasure at a rate of 6 percent of the retail sales price of fuel.
The SCAC provides state funding assistance for eligible airport projects as noted below:
• State-funded maintenance projects (where no federal funds are involved) are eligible for funding at the 60 percent level
• Federally funded projects are typically funded at 95 percent by the FAA. Those federal projects, which are eligible for state-funding assistance, are funded by the SCAC at 2.5 percent
It is anticipated that Beaufort County will receive SCAC funding for the FAA-funded projects in the CIP.
Table 9.3.4-1 Airport Improvement Program Eligibility
Hilton Head Island Airport
Project Cost
Percent AIP
Eligible
Total AIP
EligibilityAirfield Projects
Land Acquisition for Airfield Deficiency Correction $3,600,000 95% $3,420,000 Airfield Deficiency Correction $2,041,400 95% $1,939,330 Runway 03 EMAS $2,000,000 95% $1,900,000 Runway Extension Cost-Benefit Analysis/Environmental Documentation
$500,000 95% $475,000
Land Acquisition for Runway Extension and Road Relocation
$5,500,000 95% $5,225,000
700' Runway Extension Design and Construction $2,245,200 95% $2,132,940 400' Runway Extension Design and Construction $925,000 95% $878,750 Runway 21 EMAS $2,000,000 95% $1,900,000 Relocation of Beach City Road Design and Construction $750,000 95% $712,500 Runway 03 34:1 Obstruction Removal (trees) $1,500,000 95% $1,425,000 Transitional Surface Obstruction Removal (trees) $2,000,000 95% $1,900,000 Avigation Easements within Runway 21 RPZ $1,145,000 95% $1,087,750
Subtotal Airfield Projects $24,206,600 95% $22,996,270 General Aviation Projects
General Aviation Apron Expansion (18,500 sq yd) $1,600,000 95% $1,520,000 10-Unit T-Hangar $1,350,000 0% $0 Conventional Hangar (2) $2,830,000 0% $0 Land Acquisition General Aviation Side $3,335,000 95% $3,168,250 10-Unit T-Hangar (2) $2,660,000 0% $0 Conventional Hangar (2) $2,450,000 0% $0 General Aviation Apron Expansion (17,000 sq yd) $1,520,000 95% $1,444,000 Land Acquisition (Exec Air) $9,400,000 95% $8,930,000
Subtotal General Aviation Projects $25,145,000 60% $15,062,250 Commercial Service Passenger Terminal Area
Commercial Service Terminal Expansion $1,900,000 95% $1,805,000 Commercial Service Parking Lot Expansion (120 spaces) $922,100 0% $0 Commercial Service Parking Lot Expansion (150 spaces) $720,000 0% $0
Subtotal Commercial Service Passenger Terminal Area $3,542,100 51% $1,805,000 Total Airport Master Plan Projects $52,893,700 75% $39,863,520 Source: Talbert & Bright, Inc., October 2010. Newton & Associates, Inc., October 2010.

HILTON HEAD ISLAND AIRPORT
MASTER PLAN UPDATE
Financial Feasibility Analysis TALBERT & BRIGHT 98
9.3.7 Third-Party/Tenant Financing
Funding by third-party/tenant financing (or third-party/tenant funding) is another important source of funding for certain of the proposed project elements. This source of funding is facility-related and directly reduces the amount that must be funded by the County. Third-party/tenant funding is a particularly important financing arrangement to pay the cost of proprietary facilities that may be ineligible for FAA- and/or state-funding participation and are capital investment by third parties, existing tenants, or prospective tenants.
Third-party/tenant funding may take many forms depending upon the particular facility to be constructed. The third party or tenant may either pay for facilities directly or pledge to pay debt service on municipal or special facility bonds issued to construct the proposed facilities. For instance, one option in this regard would be to request proposals for the development of the general aviation hangars that will be built at the Hilton Head Island Airport in the intermediate- and long-term development plan by Beaufort County. A proposal could be structured to allow non-tenant investors the opportunity to build and lease certain facilities, which would otherwise be funded by the tenant or the owner. This would require a minimum initial capital investment from the County and other local sources.
It should be noted that for facilities financed by tenant/investors, through use of industrial development bonds or special facility bonds, that the third party/tenant would likely require a long-term lease of up to 30 years to ensure the third party or tenant’s (investor’s) recovery of its investment in the facility. The Airport would collect a land rental and benefit from the residual value of the facility remaining upon expiration of the lease.
Beaufort County may manage the quality and services provided in the general aviation hangar facilities through the development and implementation of a set of minimum standards. The minimum standards are a way to establish the minimum threshold entry requirements for those wishing to provide commercial aeronautical services to the public and to ensure that those who have undertaken to provide commodities and services are not exposed to unfair or irresponsible competition. Therefore, the minimum standards would help protect the third-party/tenant investor while protecting the quality of aeronautical services offered at the Hilton Head Island Airport.
9.3.8 Non-Traditional Funding Sources
There are a number of other potential non-traditional funding sources, which the County may consider, to be used for funding various portions of the proposed projects. At the federal level, these may include agencies dealing with transportation (highways), soil conservation, forestry, multi-modal transportation, environmental mitigation, or waste management. State and regional agencies may be involved with economic development,
transportation, agricultural diversity, or various environmental concerns and other agencies, which may have crossover-funding potential. Because of the uncertain nature of these sources of funding, the financial overview assumes that the Hilton Head Island Airport will not receive any such funds. Nevertheless, Beaufort County should thoroughly examine these potential sources to fund the proposed projects in the Master Plan Update and to reduce the County’s local funding requirement.
Table 9.3.4-2 Short-Term Projects Funding Plan
Hilton Head Island Airport Fiscal Year
Project Cost
FAAState LocalEntitlement Discretionary Total
Airfield Projects Land Acquisition for Airfield Deficiency Correction 2013 $3,600,000 $1,000,000 $2,420,000 $3,420,000 $90,000 $90,000 Airfield Deficiency Correction 2013 $2,041,400 $500,000 $1,439,330 $1,939,330 $51,035 $51,035 Runway 03 EMAS 2013 $2,000,000 $0 $1,900,000 $1,900,000 $50,000 $50,000 Runway Extension Cost-Benefit Analysis/Environmental Documentation
2011 $500,000 $0 $475,000 $475,000 $12,500 $12,500
Land Acquisition for Runway Extension and Road Relocation 2012 $5,500,000 $0 $5,225,000 $5,225,000 $137,500 $137,500 700' Runway Extension Design and Construction 2013 $2,245,200 $1,000,000 $1,132,940 $2,132,940 $56,130 $56,130 400' Runway Extension Design and Construction 2015 $925,000 $878,750 $0 $878,750 $23,125 $23,125 Runway 21 EMAS 2015 $2,000,000 $0 $1,900,000 $1,900,000 $50,000 $50,000 Relocation of Beach City Road Design and Construction 2014 $750,000 $0 $712,500 $712,500 $18,750 $18,750 Runway 03 34:1 Obstruction Removal (trees) 2011 $1,500,000 $0 $1,425,000 $1,425,000 $37,500 $37,500 Transitional Surface Obstruction Removal (trees) 2012 $2,000,000 $0 $1,900,000 $1,900,000 $50,000 $50,000
Subtotal Airfield Projects $23,061,600 $3,378,750 $18,529,770 $21,908,520 $576,540 $576,538 Commercial Service Passenger Terminal Area
Commercial Service Terminal Expansion 2011 $1,900,000 $1,805,000 $0 $1,805,000 $47,500 $47,500 Subtotal Commercial Service Passenger Terminal Area $1,900,000 $1,805,000 $0 $1,805,000 $47,500 $47,500
Total Short-Term Projects $24,961,600 $5,183,750 $18,529,770 $23,713,520 $624,040 $624,038 Percent of Total 95.0% 2.5% 2.5% Source: Talbert & Bright, Inc., October 2010. Newton & Associates, Inc., October 2010.
Table 9.3.4-3 Intermediate- and Long-Term Projects Funding Plan
Hilton Head Island Airport Project
CostFAA
State LocalEntitlement Discretionary Total Airfield Projects
Avigation Easements within Runway 21 RPZ $1,145,000 $1,087,750 $0 $1,087,750 $28,625 $28,625 Subtotal Airfield Projects $1,145,000 $1,087,750 $0 $1,087,750 $28,625 $28,625
General Aviation Projects General Aviation Apron Expansion (18,500 sq yd) $1,600,000 $0 $1,520,000 $1,520,000 $40,000 $40,000 10-Unit T-Hangar $1,350,000 $0 $0 $0 $0 $1,350,000 Conventional Hangar (2) $2,830,000 $0 $0 $0 $0 $2,830,000 Land Acquisition General Aviation Side $3,335,000 $0 $3,168,250 $3,168,250 $0 $166,750 10-Unit T-Hangar (2) $2,660,000 $0 $0 $0 $0 $2,660,000 Conventional Hangar (2) $2,450,000 $0 $0 $0 $0 $2,450,000 General Aviation Apron Expansion (17,000 sq yd) $1,520,000 $0 $1,444,000 $1,444,000 $38,000 $38,000 Land Acquisition (Exec Air) $9,400,000 $0 $8,930,000 $8,930,000 $235,000 $234,999
Subtotal General Aviation Projects $25,145,000 $0 $15,062,250 $15,062,250 $313,000 $9,769,749 Commercial Service Passenger Terminal Area
Commercial Service Parking Lot Expansion (120 spaces) $922,100 $0 $0 $0 $0 $922,100 Commercial Service Parking Lot Expansion (150 spaces) $720,000 $0 $0 $0 $0 720,000
Subtotal Commercial Service Passenger Terminal Area $1,642,100 $0 $0 $0 $0 $1,642,100 Total Intermediate- and Long-Term Projects $27,932,100 $1,087,750 $15,062,250 $16,150,000 $341,625 $11,440,474 Percent of Total 58% 1% 41% Source: Talbert & Bright, Inc., October 2010. Newton & Associates, Inc., October 2010.
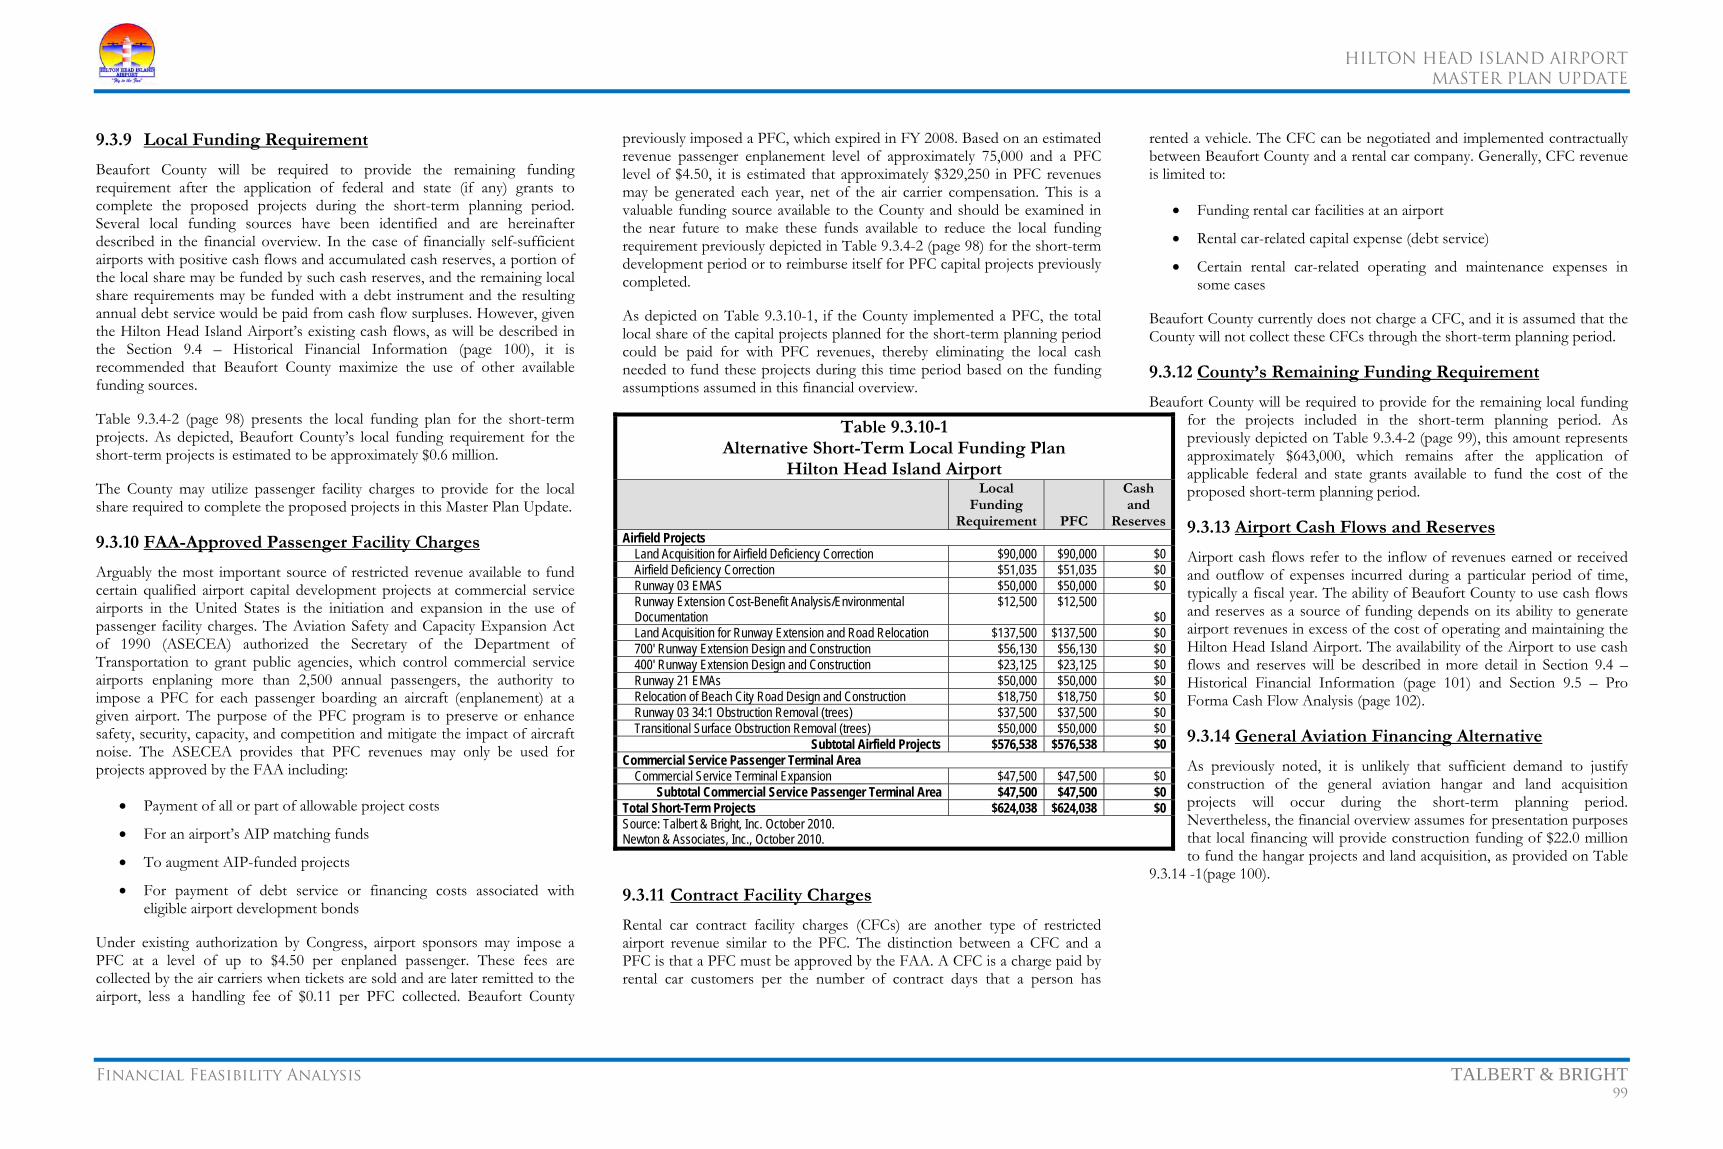
HILTON HEAD ISLAND AIRPORT
MASTER PLAN UPDATE
Financial Feasibility Analysis TALBERT & BRIGHT 99
9.3.9 Local Funding Requirement
Beaufort County will be required to provide the remaining funding requirement after the application of federal and state (if any) grants to complete the proposed projects during the short-term planning period. Several local funding sources have been identified and are hereinafter described in the financial overview. In the case of financially self-sufficient airports with positive cash flows and accumulated cash reserves, a portion of the local share may be funded by such cash reserves, and the remaining local share requirements may be funded with a debt instrument and the resulting annual debt service would be paid from cash flow surpluses. However, given the Hilton Head Island Airport’s existing cash flows, as will be described in the Section 9.4 – Historical Financial Information (page 100), it is recommended that Beaufort County maximize the use of other available funding sources.
Table 9.3.4-2 (page 98) presents the local funding plan for the short-term projects. As depicted, Beaufort County’s local funding requirement for the short-term projects is estimated to be approximately $0.6 million.
The County may utilize passenger facility charges to provide for the local share required to complete the proposed projects in this Master Plan Update.
9.3.10 FAA-Approved Passenger Facility Charges
Arguably the most important source of restricted revenue available to fund certain qualified airport capital development projects at commercial service airports in the United States is the initiation and expansion in the use of passenger facility charges. The Aviation Safety and Capacity Expansion Act of 1990 (ASECEA) authorized the Secretary of the Department of Transportation to grant public agencies, which control commercial service airports enplaning more than 2,500 annual passengers, the authority to impose a PFC for each passenger boarding an aircraft (enplanement) at a given airport. The purpose of the PFC program is to preserve or enhance safety, security, capacity, and competition and mitigate the impact of aircraft noise. The ASECEA provides that PFC revenues may only be used for projects approved by the FAA including:
• Payment of all or part of allowable project costs
• For an airport’s AIP matching funds
• To augment AIP-funded projects
• For payment of debt service or financing costs associated with eligible airport development bonds
Under existing authorization by Congress, airport sponsors may impose a PFC at a level of up to $4.50 per enplaned passenger. These fees are collected by the air carriers when tickets are sold and are later remitted to the airport, less a handling fee of $0.11 per PFC collected. Beaufort County
previously imposed a PFC, which expired in FY 2008. Based on an estimated revenue passenger enplanement level of approximately 75,000 and a PFC level of $4.50, it is estimated that approximately $329,250 in PFC revenues may be generated each year, net of the air carrier compensation. This is a valuable funding source available to the County and should be examined in the near future to make these funds available to reduce the local funding requirement previously depicted in Table 9.3.4-2 (page 98) for the short-term development period or to reimburse itself for PFC capital projects previously completed.
As depicted on Table 9.3.10-1, if the County implemented a PFC, the total local share of the capital projects planned for the short-term planning period could be paid for with PFC revenues, thereby eliminating the local cash needed to fund these projects during this time period based on the funding assumptions assumed in this financial overview.
9.3.11 Contract Facility Charges
Rental car contract facility charges (CFCs) are another type of restricted airport revenue similar to the PFC. The distinction between a CFC and a PFC is that a PFC must be approved by the FAA. A CFC is a charge paid by rental car customers per the number of contract days that a person has
rented a vehicle. The CFC can be negotiated and implemented contractually between Beaufort County and a rental car company. Generally, CFC revenue is limited to:
• Funding rental car facilities at an airport
• Rental car-related capital expense (debt service)
• Certain rental car-related operating and maintenance expenses in some cases
Beaufort County currently does not charge a CFC, and it is assumed that the County will not collect these CFCs through the short-term planning period.
9.3.12 County’s Remaining Funding Requirement
Beaufort County will be required to provide for the remaining local funding for the projects included in the short-term planning period. As previously depicted on Table 9.3.4-2 (page 99), this amount represents approximately $643,000, which remains after the application of applicable federal and state grants available to fund the cost of the proposed short-term planning period.
9.3.13 Airport Cash Flows and Reserves
Airport cash flows refer to the inflow of revenues earned or received and outflow of expenses incurred during a particular period of time, typically a fiscal year. The ability of Beaufort County to use cash flows and reserves as a source of funding depends on its ability to generate airport revenues in excess of the cost of operating and maintaining the Hilton Head Island Airport. The availability of the Airport to use cash flows and reserves will be described in more detail in Section 9.4 – Historical Financial Information (page 101) and Section 9.5 – Pro Forma Cash Flow Analysis (page 102).
9.3.14 General Aviation Financing Alternative
As previously noted, it is unlikely that sufficient demand to justify construction of the general aviation hangar and land acquisition projects will occur during the short-term planning period. Nevertheless, the financial overview assumes for presentation purposes that local financing will provide construction funding of $22.0 million to fund the hangar projects and land acquisition, as provided on Table
9.3.14 -1(page 100).
Table 9.3.10-1 Alternative Short-Term Local Funding Plan
Hilton Head Island Airport Local
Funding Requirement PFC
Cash and
Reserves Airfield Projects
Land Acquisition for Airfield Deficiency Correction $90,000 $90,000 $0 Airfield Deficiency Correction $51,035 $51,035 $0 Runway 03 EMAS $50,000 $50,000 $0 Runway Extension Cost-Benefit Analysis/Environmental Documentation
$12,500 $12,500 $0
Land Acquisition for Runway Extension and Road Relocation $137,500 $137,500 $0 700' Runway Extension Design and Construction $56,130 $56,130 $0 400' Runway Extension Design and Construction $23,125 $23,125 $0 Runway 21 EMAs $50,000 $50,000 $0 Relocation of Beach City Road Design and Construction $18,750 $18,750 $0 Runway 03 34:1 Obstruction Removal (trees) $37,500 $37,500 $0 Transitional Surface Obstruction Removal (trees) $50,000 $50,000 $0
Subtotal Airfield Projects $576,538 $576,538 $0 Commercial Service Passenger Terminal Area
Commercial Service Terminal Expansion $47,500 $47,500 $0 Subtotal Commercial Service Passenger Terminal Area $47,500 $47,500 $0
Total Short-Term Projects $624,038 $624,038 $0 Source: Talbert & Bright, Inc. October 2010. Newton & Associates, Inc., October 2010.
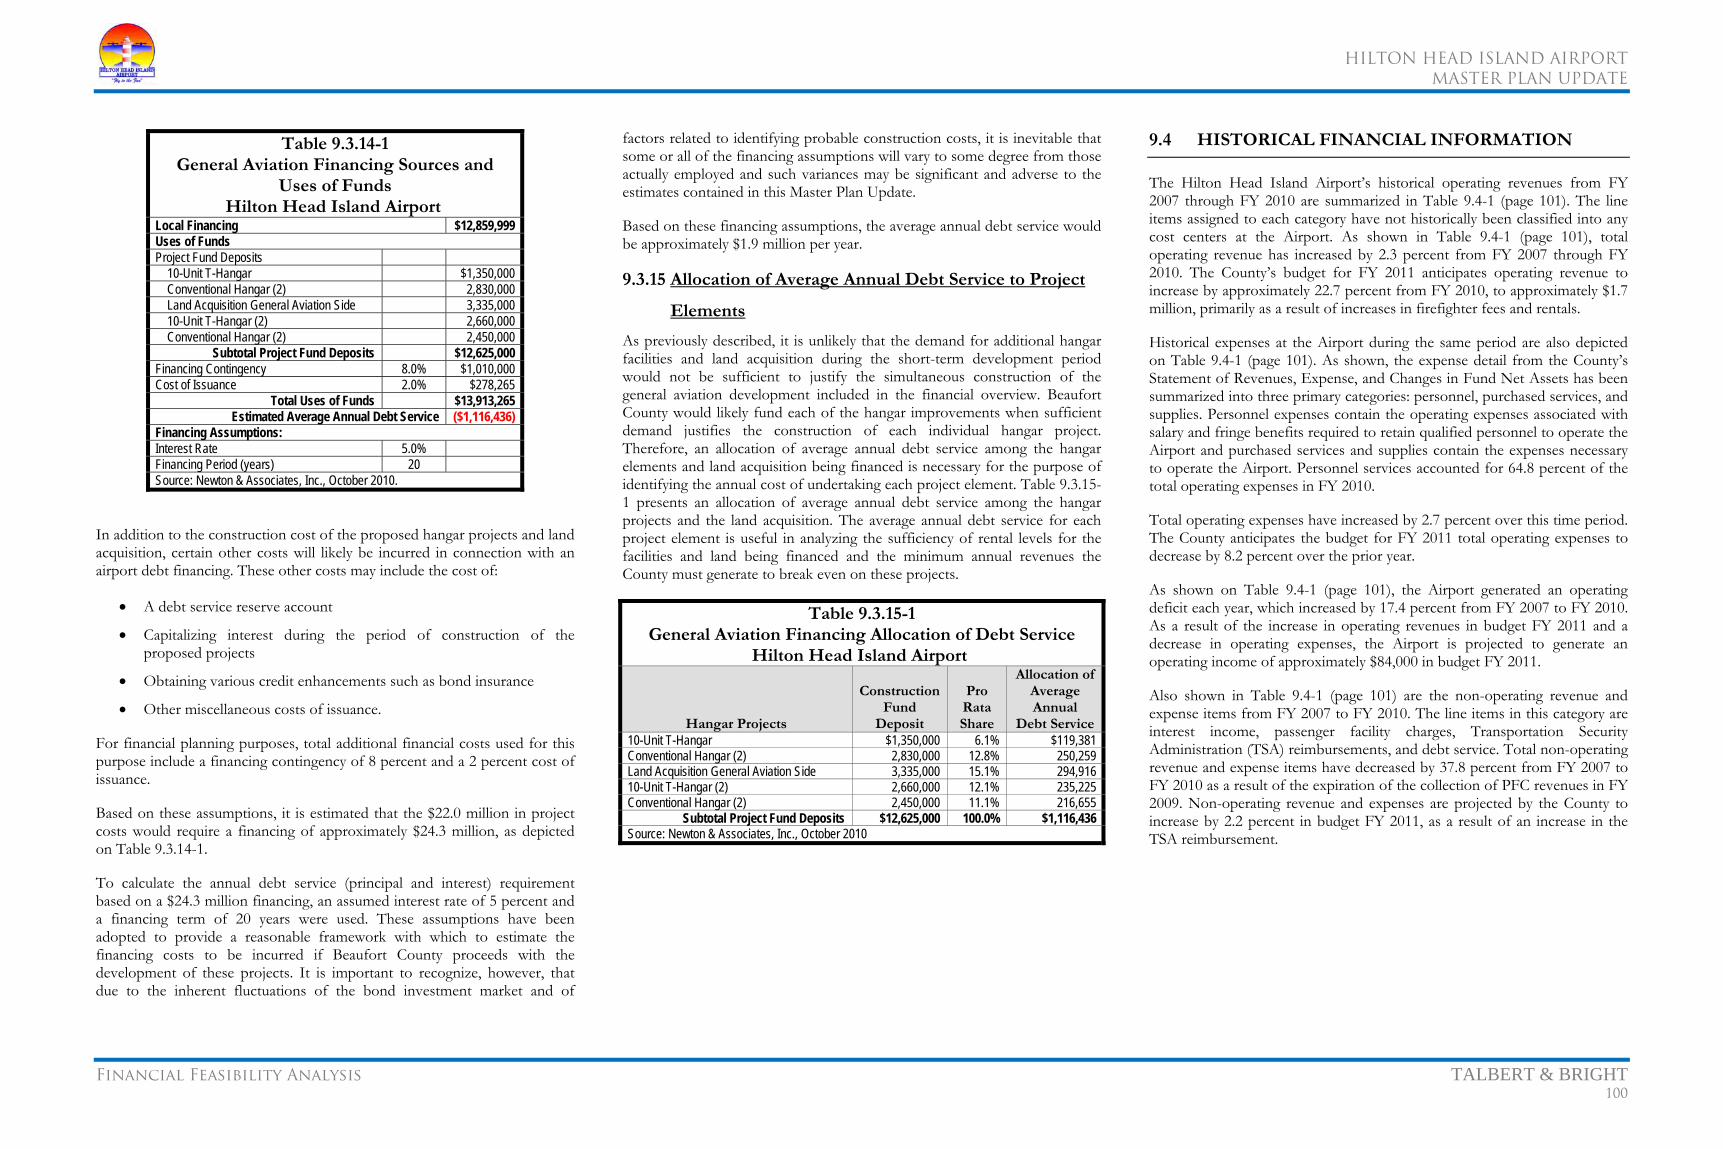
HILTON HEAD ISLAND AIRPORT
MASTER PLAN UPDATE
Financial Feasibility Analysis TALBERT & BRIGHT 100
Table 9.3.14-1 General Aviation Financing Sources and
Uses of Funds Hilton Head Island Airport
Local Financing $12,859,999 Uses of Funds Project Fund Deposits
10-Unit T-Hangar $1,350,000 Conventional Hangar (2) 2,830,000 Land Acquisition General Aviation Side 3,335,000 10-Unit T-Hangar (2) 2,660,000 Conventional Hangar (2) 2,450,000
Subtotal Project Fund Deposits $12,625,000 Financing Contingency 8.0% $1,010,000 Cost of Issuance 2.0% $278,265
Total Uses of Funds $13,913,265 Estimated Average Annual Debt Service ($1,116,436)
Financing Assumptions: Interest Rate 5.0% Financing Period (years) 20 Source: Newton & Associates, Inc., October 2010.
In addition to the construction cost of the proposed hangar projects and land acquisition, certain other costs will likely be incurred in connection with an airport debt financing. These other costs may include the cost of:
• A debt service reserve account
• Capitalizing interest during the period of construction of the proposed projects
• Obtaining various credit enhancements such as bond insurance
• Other miscellaneous costs of issuance.
For financial planning purposes, total additional financial costs used for this purpose include a financing contingency of 8 percent and a 2 percent cost of issuance.
Based on these assumptions, it is estimated that the $22.0 million in project costs would require a financing of approximately $24.3 million, as depicted on Table 9.3.14-1.
To calculate the annual debt service (principal and interest) requirement based on a $24.3 million financing, an assumed interest rate of 5 percent and a financing term of 20 years were used. These assumptions have been adopted to provide a reasonable framework with which to estimate the financing costs to be incurred if Beaufort County proceeds with the development of these projects. It is important to recognize, however, that due to the inherent fluctuations of the bond investment market and of
factors related to identifying probable construction costs, it is inevitable that some or all of the financing assumptions will vary to some degree from those actually employed and such variances may be significant and adverse to the estimates contained in this Master Plan Update.
Based on these financing assumptions, the average annual debt service would be approximately $1.9 million per year.
9.3.15 Allocation of Average Annual Debt Service to Project
Elements
As previously described, it is unlikely that the demand for additional hangar facilities and land acquisition during the short-term development period would not be sufficient to justify the simultaneous construction of the general aviation development included in the financial overview. Beaufort County would likely fund each of the hangar improvements when sufficient demand justifies the construction of each individual hangar project. Therefore, an allocation of average annual debt service among the hangar elements and land acquisition being financed is necessary for the purpose of identifying the annual cost of undertaking each project element. Table 9.3.15-1 presents an allocation of average annual debt service among the hangar projects and the land acquisition. The average annual debt service for each project element is useful in analyzing the sufficiency of rental levels for the facilities and land being financed and the minimum annual revenues the County must generate to break even on these projects.
Table 9.3.15-1 General Aviation Financing Allocation of Debt Service
Hilton Head Island Airport
Hangar Projects
ConstructionFund
Deposit
Pro Rata Share
Allocation ofAverage Annual
Debt Service10-Unit T-Hangar $1,350,000 6.1% $119,381 Conventional Hangar (2) 2,830,000 12.8% 250,259 Land Acquisition General Aviation Side 3,335,000 15.1% 294,916 10-Unit T-Hangar (2) 2,660,000 12.1% 235,225 Conventional Hangar (2) 2,450,000 11.1% 216,655
Subtotal Project Fund Deposits $12,625,000 100.0% $1,116,436 Source: Newton & Associates, Inc., October 2010
9.4 HISTORICAL FINANCIAL INFORMATION
The Hilton Head Island Airport’s historical operating revenues from FY 2007 through FY 2010 are summarized in Table 9.4-1 (page 101). The line items assigned to each category have not historically been classified into any cost centers at the Airport. As shown in Table 9.4-1 (page 101), total operating revenue has increased by 2.3 percent from FY 2007 through FY 2010. The County’s budget for FY 2011 anticipates operating revenue to increase by approximately 22.7 percent from FY 2010, to approximately $1.7 million, primarily as a result of increases in firefighter fees and rentals.
Historical expenses at the Airport during the same period are also depicted on Table 9.4-1 (page 101). As shown, the expense detail from the County’s Statement of Revenues, Expense, and Changes in Fund Net Assets has been summarized into three primary categories: personnel, purchased services, and supplies. Personnel expenses contain the operating expenses associated with salary and fringe benefits required to retain qualified personnel to operate the Airport and purchased services and supplies contain the expenses necessary to operate the Airport. Personnel services accounted for 64.8 percent of the total operating expenses in FY 2010.
Total operating expenses have increased by 2.7 percent over this time period. The County anticipates the budget for FY 2011 total operating expenses to decrease by 8.2 percent over the prior year.
As shown on Table 9.4-1 (page 101), the Airport generated an operating deficit each year, which increased by 17.4 percent from FY 2007 to FY 2010. As a result of the increase in operating revenues in budget FY 2011 and a decrease in operating expenses, the Airport is projected to generate an operating income of approximately $84,000 in budget FY 2011.
Also shown in Table 9.4-1 (page 101) are the non-operating revenue and expense items from FY 2007 to FY 2010. The line items in this category are interest income, passenger facility charges, Transportation Security Administration (TSA) reimbursements, and debt service. Total non-operating revenue and expense items have decreased by 37.8 percent from FY 2007 to FY 2010 as a result of the expiration of the collection of PFC revenues in FY 2009. Non-operating revenue and expenses are projected by the County to increase by 2.2 percent in budget FY 2011, as a result of an increase in the TSA reimbursement.

HILTON HEAD ISLAND AIRPORT
MASTER PLAN UPDATE
Financial Feasibility Analysis TALBERT & BRIGHT 101
9.5 PRO FORMA CASH FLOW ANALYSIS
A Pro Forma cash flow analysis was developed to project the operating revenues and operating expenses over the short-term planning period to determine the operating income/deficit that will be available to meet the local funding requirement to meet the projected capital costs over the short-term planning period.
9.5.1 Operating Revenues
Projected operating revenues for the short-term planning period are presented in Table 9.5.1-1 (page 102) and were projected based on historical trends. As shown on Table 9.5.1-1 (page 102), total operating revenue is projected to increase from $1.7 million in budget FY 2011 to $1.9 million in
FY 2015, representing an average annual growth rate of 2.0 percent over this time period.
9.5.2 Operating Expenses
Estimates of the Airport’s future operating expenses were based on a review of historical trends from FY 2007 to FY 2010 and the impacts of inflation. Projected operating expenses for the short-term planning period are also presented in Table 9.5.1-1 (page 103).
As shown, the Hilton Head Island Airport records its operating expenses according to the following categories:
• Personnel Services
• Purchased Services
• Supplies
The following operating expense categories represent the Airport’s operations and maintenance (O&M) expenses associated with the day-to-day operations. Each expense category and the assumptions used to project
expenses for each are discussed in the following subsections.
9.5.2.1 Personnel Services
Personnel services at the Airport represent expenses related to Airport employee salaries and benefits, employer taxes, employee health insurance, etc. Personnel services account for the Airport’s largest expense, which is common for airports of similar size.
Between FY 2007 and FY 2010, personnel services increased at an average annual growth rate of 5.3 percent, increasing from $813,000 in FY 2007 to $949,000 in FY 2010. Budget FY 2011 personnel services O&M expenses are projected by the County to decrease by 1.8 percent in budget FY 2011.
Based on historical growth, future personnel services O&M expenses are projected to increase from $837,000 in FY 2011 to $1.0 million in FY 2015, representing an average annual growth rate of 5.0 percent during this time period.
9.5.2.2 Other Operating Expenses
Purchased services and supplies at the Airport include items such as office supplies, utilities, professional fees, travel and training expenses, vehicle insurance, buildings and equipment maintenance, dues and subscriptions, material and supplies, and other items necessary to operate the Airport on an annual basis. Historically, these expenses decreased from $536,000 in FY 2007 to $514,000 in FY 2010, representing an average annual decrease of 1.4 percent. Other operating expenses are projected to decrease by 1.5 percent in budget FY 2011 from the actual expenses in FY 2010.
As shown in Table 9.5.1-1 (page 102), future other operating expenses are projected to increase from $506,000 in FY 2011 to $581,000 in FY 2015, representing an average annual growth rate of 3.5 percent over the short-term planning period.
Historical trend analysis has shown that total O&M expenses at the Airport have increased by 2.7 percent from FY 2007 to FY 2010. As a result of the projections discussed above, total operating expenses are projected to increase from $1.3 million in FY 2011 to $1.6 million in FY 2015, representing an average annual growth rate of 4.4 percent over the short-term planning period, slightly higher than the historical growth of O&M expenses at the Airport.
9.5.3 Non-Operating Revenue and Expense
Interest income and debt service were held constant over the short-term planning period based on the levels the County anticipates in budget FY 2011. TSA reimbursements were projected to increase by 2.0 percent over the same time period. As a result, total non-operating revenue and expense are projected to increase by 2.9 percent over the short-term planning period.
9.5.4 Capital Improvement Program – Local Share
As previously discussed in Section 9.3.9 – Local Funding Requirement (page 99) and presented on Table 9.3.4-2 (page 98), the local funding requirement for the short-term planning period projects is reduced by federal and state funding. The remaining local share is assumed to be reimbursed by the County and/or the Airport’s annual cash flow. As a result, the operating income/(deficit) each year is further reduced by the remaining local share for each project over the short-term planning period previously presented in Table 9.3.4-2 (page 98).
Table 9.4-1 Historical Revenues and Expenses
Hilton Head Island Airport
Description Actual
FY 2007 Actual
FY 2008 Actual
FY 2009 Actual
FY 2010
2007-2010Average Annual Growth
Budget FY 2011
2010-2011Average Annual Growth
Operating Revenue Hangar Leases $0 $30,000 $111,631 $122,721 NA $128,500 4.7% FBO Ground Lease $0 $0 $34,331 $40,681 NA $44,892 10.4% FBO Concessions $0 $22,005 $38,722 $7,816 NA $18,500 136.7% FBO Fuel Commission $0 $96,985 $86,141 $90,699 NA $100,800 11.1% Concession Sales $38,300 $0 $0 $0 -100.0% $0 NA Firefighting Fees $292,661 $267,911 $333,731 $297,755 0.6% $346,650 16.4% Landing Fees $162,981 $196,266 $164,011 $151,128 -2.5% $161,370 6.8% Parking/Taxi Fees $21,123 $45,245 $32,505 $43,419 27.1% $55,000 26.7% Rentals $755,064 $827,399 $670,526 $616,093 -6.6% $826,718 34.2% Other Charges $44,519 $22,657 $2,360 $37,212 -5.8% $45,064 21.1%
Total Operating Revenue $1,314,648 $1,508,468 $1,473,958 $1,407,524 2.3% $1,727,494 22.7% Operating Expenses
Personnel Services $813,400 $936,470 $964,510 $949,357 5.3% $837,175 -11.8% Purchased Services $480,063 $579,634 $519,099 $478,361 -0.1% $458,775 -4.1% Supplies $55,748 $54,939 $43,529 $35,793 -13.7% $47,582 32.9%
Total Operating Expenses $1,349,211 $1,571,043 $1,527,138 $1,463,511 2.7% $1,343,532 -8.2% Operating Income/(Deficit) ($34,563) ($62,575) ($53,180) ($55,987) 17.4% $383,962 585.8% Non-Operating Revenue (Expense)
Interest Income $144,917 $67,079 $29,052 $36,194 -37.0% $35,000 -3.3% Passenger Facility Charges $171,145 $101,257 $0 $0 -100.0% $0 NA TSA Reimbursement $47,934 $143,211 $124,881 $133,223 40.6% 152,688 14.6% Debt Service ($15,301) ($94,181) ($87,413) ($85,419) 77.4% ($83,325) -2.5% Non-Operating Revenue (Expense) $348,695 $217,366 $66,520 $83,998 -37.8% $104,363 24.2%
Net Remaining Revenue/(Deficit) $314,132 $154,791 $13,340 $28,011 -55.3% $488,325 1,643.3% Source: Hilton Head Island Airport Records, September 2010. Newton & Associates, Inc., October 2010.
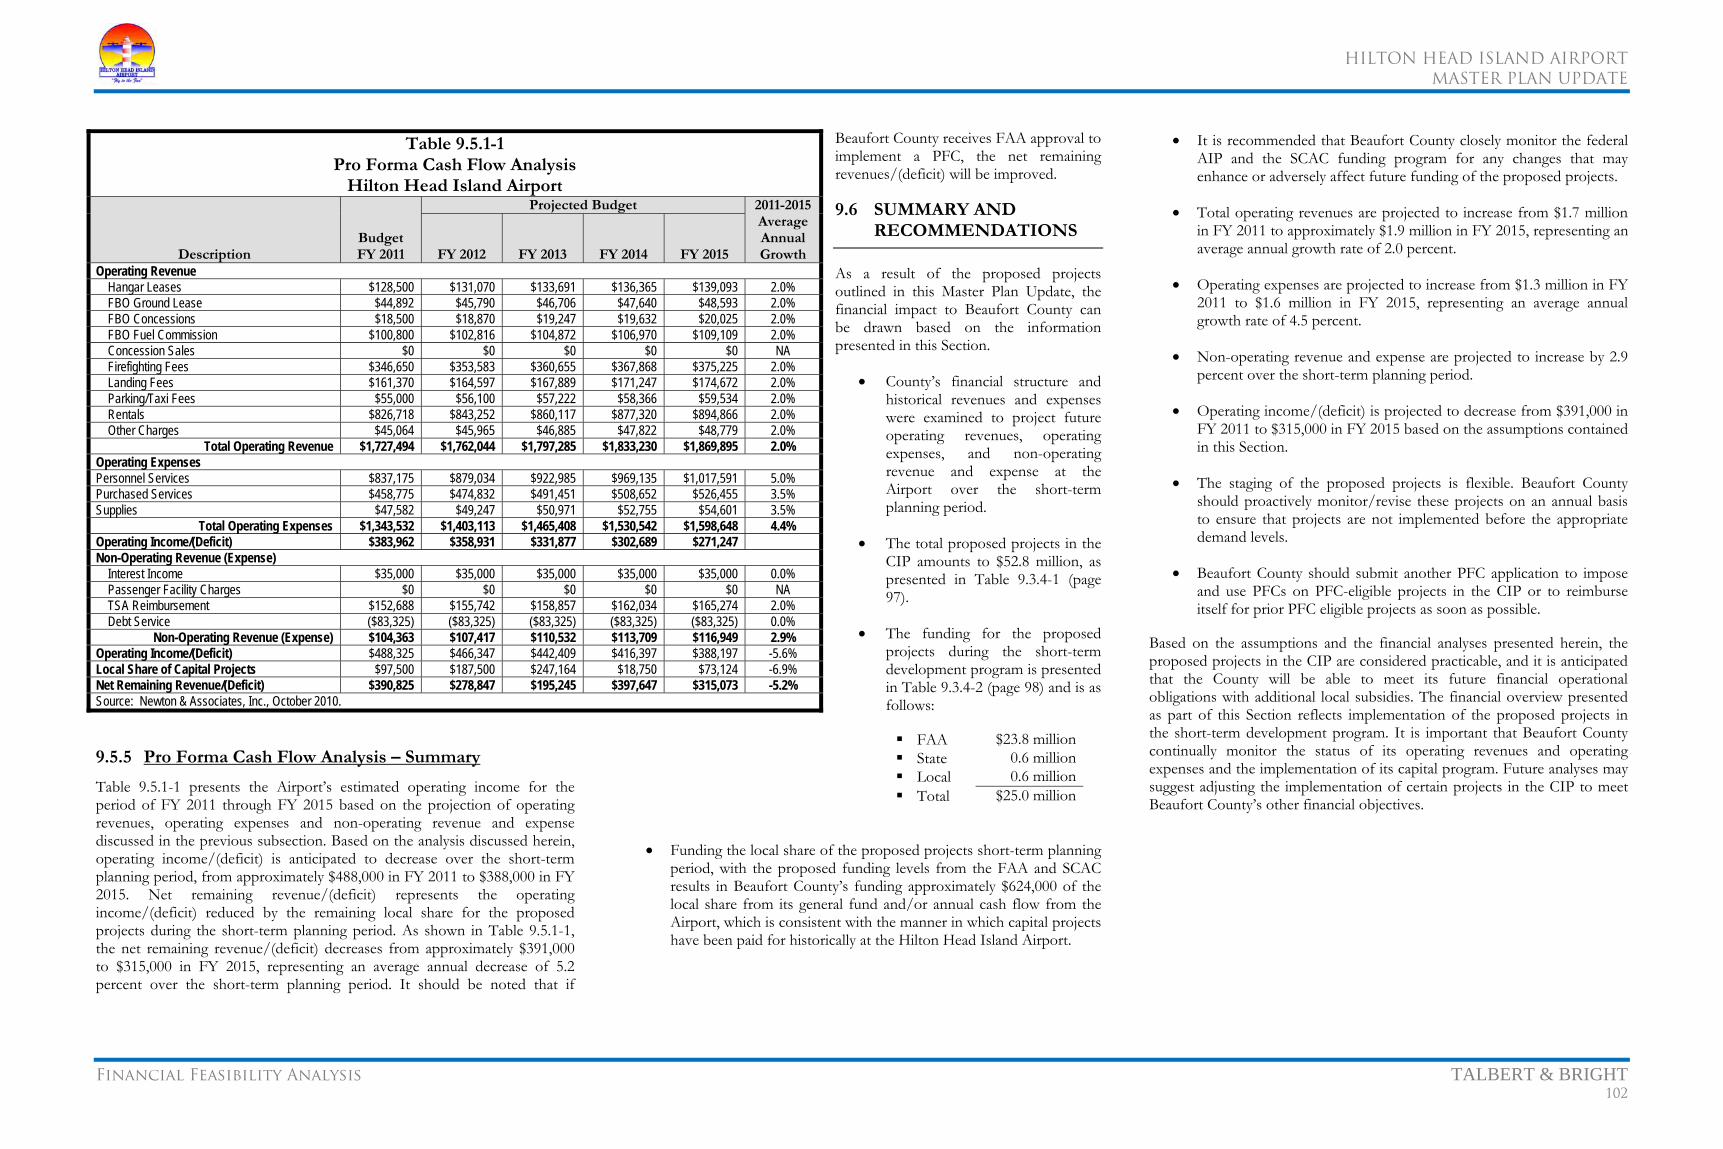
HILTON HEAD ISLAND AIRPORT
MASTER PLAN UPDATE
Financial Feasibility Analysis TALBERT & BRIGHT 102
9.5.5 Pro Forma Cash Flow Analysis – Summary
Table 9.5.1-1 presents the Airport’s estimated operating income for the period of FY 2011 through FY 2015 based on the projection of operating revenues, operating expenses and non-operating revenue and expense discussed in the previous subsection. Based on the analysis discussed herein, operating income/(deficit) is anticipated to decrease over the short-term planning period, from approximately $488,000 in FY 2011 to $388,000 in FY 2015. Net remaining revenue/(deficit) represents the operating income/(deficit) reduced by the remaining local share for the proposed projects during the short-term planning period. As shown in Table 9.5.1-1, the net remaining revenue/(deficit) decreases from approximately $391,000 to $315,000 in FY 2015, representing an average annual decrease of 5.2 percent over the short-term planning period. It should be noted that if
Beaufort County receives FAA approval to implement a PFC, the net remaining revenues/(deficit) will be improved.
9.6 SUMMARY AND RECOMMENDATIONS
As a result of the proposed projects outlined in this Master Plan Update, the financial impact to Beaufort County can be drawn based on the information presented in this Section.
• County’s financial structure and historical revenues and expenses were examined to project future operating revenues, operating expenses, and non-operating revenue and expense at the Airport over the short-term planning period.
• The total proposed projects in the CIP amounts to $52.8 million, as presented in Table 9.3.4-1 (page 97).
• The funding for the proposed projects during the short-term development program is presented in Table 9.3.4-2 (page 98) and is as follows:
FAA $23.8 million State 0.6 million Local 0.6 million Total $25.0 million
• Funding the local share of the proposed projects short-term planning period, with the proposed funding levels from the FAA and SCAC results in Beaufort County’s funding approximately $624,000 of the local share from its general fund and/or annual cash flow from the Airport, which is consistent with the manner in which capital projects have been paid for historically at the Hilton Head Island Airport.
• It is recommended that Beaufort County closely monitor the federal AIP and the SCAC funding program for any changes that may enhance or adversely affect future funding of the proposed projects.
• Total operating revenues are projected to increase from $1.7 million in FY 2011 to approximately $1.9 million in FY 2015, representing an average annual growth rate of 2.0 percent.
• Operating expenses are projected to increase from $1.3 million in FY 2011 to $1.6 million in FY 2015, representing an average annual growth rate of 4.5 percent.
• Non-operating revenue and expense are projected to increase by 2.9 percent over the short-term planning period.
• Operating income/(deficit) is projected to decrease from $391,000 in FY 2011 to $315,000 in FY 2015 based on the assumptions contained in this Section.
• The staging of the proposed projects is flexible. Beaufort County should proactively monitor/revise these projects on an annual basis to ensure that projects are not implemented before the appropriate demand levels.
• Beaufort County should submit another PFC application to impose and use PFCs on PFC-eligible projects in the CIP or to reimburse itself for prior PFC eligible projects as soon as possible.
Based on the assumptions and the financial analyses presented herein, the proposed projects in the CIP are considered practicable, and it is anticipated that the County will be able to meet its future financial operational obligations with additional local subsidies. The financial overview presented as part of this Section reflects implementation of the proposed projects in the short-term development program. It is important that Beaufort County continually monitor the status of its operating revenues and operating expenses and the implementation of its capital program. Future analyses may suggest adjusting the implementation of certain projects in the CIP to meet Beaufort County’s other financial objectives.
Table 9.5.1-1 Pro Forma Cash Flow Analysis
Hilton Head Island Airport
Description Budget FY 2011
Projected Budget 2011-2015Average Annual GrowthFY 2012 FY 2013 FY 2014 FY 2015
Operating Revenue Hangar Leases $128,500 $131,070 $133,691 $136,365 $139,093 2.0% FBO Ground Lease $44,892 $45,790 $46,706 $47,640 $48,593 2.0% FBO Concessions $18,500 $18,870 $19,247 $19,632 $20,025 2.0% FBO Fuel Commission $100,800 $102,816 $104,872 $106,970 $109,109 2.0% Concession Sales $0 $0 $0 $0 $0 NA Firefighting Fees $346,650 $353,583 $360,655 $367,868 $375,225 2.0% Landing Fees $161,370 $164,597 $167,889 $171,247 $174,672 2.0% Parking/Taxi Fees $55,000 $56,100 $57,222 $58,366 $59,534 2.0% Rentals $826,718 $843,252 $860,117 $877,320 $894,866 2.0% Other Charges $45,064 $45,965 $46,885 $47,822 $48,779 2.0%
Total Operating Revenue $1,727,494 $1,762,044 $1,797,285 $1,833,230 $1,869,895 2.0% Operating Expenses Personnel Services $837,175 $879,034 $922,985 $969,135 $1,017,591 5.0% Purchased Services $458,775 $474,832 $491,451 $508,652 $526,455 3.5% Supplies $47,582 $49,247 $50,971 $52,755 $54,601 3.5%
Total Operating Expenses $1,343,532 $1,403,113 $1,465,408 $1,530,542 $1,598,648 4.4% Operating Income/(Deficit) $383,962 $358,931 $331,877 $302,689 $271,247 Non-Operating Revenue (Expense)
Interest Income $35,000 $35,000 $35,000 $35,000 $35,000 0.0% Passenger Facility Charges $0 $0 $0 $0 $0 NA TSA Reimbursement $152,688 $155,742 $158,857 $162,034 $165,274 2.0% Debt Service ($83,325) ($83,325) ($83,325) ($83,325) ($83,325) 0.0%
Non-Operating Revenue (Expense) $104,363 $107,417 $110,532 $113,709 $116,949 2.9% Operating Income/(Deficit) $488,325 $466,347 $442,409 $416,397 $388,197 -5.6% Local Share of Capital Projects $97,500 $187,500 $247,164 $18,750 $73,124 -6.9% Net Remaining Revenue/(Deficit) $390,825 $278,847 $195,245 $397,647 $315,073 -5.2% Source: Newton & Associates, Inc., October 2010.

HILTON HEAD ISLAND AIRPORT
MASTER PLAN UPDATE
Appendix A – Acronyms and Abbreviations TALBERT & BRIGHT A-1
µg microgram 3J1 Ridgeland Airport AAC Aircraft Approach Category ADAP Airport Deveopment-Aid Program ADG Airplane Design Group AFD Airport/Facility Directory AGC Allegheny County Airport AGL Above Ground Level AIP Airport Improvement Program ALP Airport Layout Plan AMSL Above Mean Sea Level AOC Airport Operating Certificates AOD Airport Overlay District APF Naples Municipal Airport ARC Airport Reference Code ARFF Airport Rescue and Firefighting Facilities ARP Airport Reference Point ARW Beaufort County Airport ASA Airport Service Area ASECEA Aviation Safety and Capacity Expansion Act ASTM Americal Society of Testing and Materials ASV Annual Service Volume ATC Air Traffic Control ATCT Air Traffic Control Tower ATL Atlanta Hartsfield International Airport ATO Air Traffic Organization AWOS Automated Weather Observing System B206L Bell 206 Jet Ranger Ba Baratari fine sand, 0% to 2% slopes BCT Boca Raton Airport Airport BEC58P Twin-engine piston fixed pitch BED Laurence G. Hanscom Field Airport BGEPA Bald and Golden Eagle Protection Act BHM Birmingham-Shuttlesworth International Airport BKL Burke Lakefront Airport BMG Monroe County Airport BMP Best Management Practice BNA Nashville International Airport CAE Columbia Metropolitan Airport CBRA Coastal Barrier Resource Act CC Commercial Center District CE Capers association, 0% to 2% slopes CEQ Council on Environmental Quality CERCLA Comprehensive Environmental Response, Compensation, and Liability Act CFC Contract Facility Charges CHA Lovell Field Airport CHS Charleston International Airport CID Eastern Iowa Airport
CIP Capital Improvement Program CLT Charlotte-Douglas International Airport CMH Port Columbus International Airport CNA55B Cessna Citation II CO Carbon Monoxide CRJ Canadair Regional Jet dB Decibel DHC8 de Havilland DHC-8 Dash-8 DME Distance Measuring Equipment DNL Day-Night Average Sound Level E Endangered EAC Early Action Compact EMAS Engineered Materials Arresting System ESA Environmental Site Assessment F&E Facilities and Equipment FAA Federal Aviation Administration FAAP Federal-Aid Airport Program FAC Facultative FACW Facultative Wetland FBO Fixed Base Operator FEMA Federal Emergency Management Agency FLL Fort Lauderdale-Hollywood International Airport FPPA Farmland Protection Policy Act FTY Fulton County-Brown Field Airport FTZ Free Trade Zone FY Fiscal Year GA General Aviation gal Gallon GAPC Geographical Areas of Particular Concenr GASEPF Single-engine piston fixed pitch GASEPV Single-engine piston variable pitch GB Groundwater GMU Greenville Downtown Airport GPS Global Positioning System GSO Piedmont Triad International Airport HAP Hazardous Air Pollutant HMZ Bedford County Airport HPN Westchester County Airport HXD Hilton Head Island Airport IAD Washington-Dulles International Airport IFR Instrument Flight Rules IL Light Industrial/Commercial Distribution District ILS Instrument Landing System INM Integrated Noise Model INT Smith Reynolds Airport ISO International Standard Observation JAX Jacksonville International Airport JNX Johnston County Airport Airport

HILTON HEAD ISLAND AIRPORT
MASTER PLAN UPDATE
Appendix A – Acronyms and Abbreviations TALBERT & BRIGHT A-2
JZI Charleston Executive Airport KIAS Knot Indicated Air Speed L(eq) Equivalent Sound Level LEAR35 Learjet 35 LED Light-Emitting Diode LPV Localizer Performance with Vertical Guidance LUK Cincinnati Municipal-Luken Field Airport m3 Cubic Meter MALSR Medium Intensity Approach Lighting System with Runway Alignment Indicator Lights MCO Orlando International Airport MDW Chicago Midway International Airport Mg Milligram MIRL Medium Intensity Runway Lights MITL Medium Intensity Taxiway Lights MKL McKellar-Sipes Regional Airport MMU Morristown Municipal Airport MOA Military Operations Area MP Master Plan N/A Not Applicable N94 Carlisle Airport NAAQS National Ambient Air Quality Standards NEM Noise Exposure Map NH3 Ammonia NLR Noise Level Reduction NM Nautical Mile NMFS National Marine Fisheries Service NO2 Nitrogen Dioxide NOx Nitrogen Oxide NPDES National Pollution Discharge Elimination System NPIAS National Plan of Integrated Airport Systems NPS National Priority System NRCS Natural Resources Conservation Service NRHP National Register of Historic Places O&D Origin and Destination O&M Operations and Maintenance O3 Ozone OBL Obligate Wetland OFA Obstacle Free Area OFZ Obstacle Free Zone ORL Orlando Executive Airport ORW Outstanding Resource Waters OSU Ohio State University Airport PAPI Precision Approach Path Indicators Pb Lead PBI Palm Beach International Airport PCB Polychlorinated Biphenyls PD-1 Planned Unit Devleopment PDK DeKalb-Peachtree Airport
PFC Passenger Facility Charge PGP Planning Grant Program PL Public Law PM Particulate Matter Po Polowana loamy fine sand, 0% to 2% slopes POFZ Precision Obstacle Free Zone POU Duchess County Airport ppm Parts per Million PVD Theodore Francis Green State Airport PWK Chicago Executive Airport RBW Lowcountry Regional Airport Rd Ridgeland fine sand, 0% to 2% slopes RDU Raleigh-Durham International Airport REC Recognized Environmental Condition REIL Runway End Identifier Lights RIC Richmond International Airport RM-12 Moderate to High Density Residential District (12 units per acre) RM-4 Low to Moderate Density Residential District (4 to 8 units per acre) RNAV Area Navigation Ro Rosedhu fine sand, 0% to 2% slopes ROFA Runway Obstacle Free Area ROFZ Runway Obstacle Free Zone RPZ Runway Protection Zone RSA Runway Safety Area RYY Cobb County-McCollum Field Airport SA Tidal Saltwaters SAV Savannah-Hilton Head International Airport SB Tidal Saltwaters SC South Carolina SCAC South Carolina Aeronautics Commission SCASP South Carolina Airports System Plan SCCMP South Carolina Costal Management Plan SCDHEC-DAQ South Carolina Department of Health and Environment Concern Division of Air Quality SCDHEC-OCRM South Carolina Department of Health and Environment Concern Office of Coastal
Resource Management SCDNR South Carolina Department of Natural Resources SCHTP South Carolina Heritage Trust Program sf Square Feet SFH Shellfish Harvesting Waters SHPO State Historic Preservation Office SIP State Implementation Plan Sk Seabrook fine sand, 0% to 2% slopes SO2 Sulfur Dioxide SOx Sulfur Oxide SPCC Spill Prevention, Control, and Countermeasure Plan SPL Sound Pressure Level SRQ Sarasota-Bradenton International Airport SSI Malcolm McKinnon Airport

HILTON HEAD ISLAND AIRPORT
MASTER PLAN UPDATE
Appendix A – Acronyms and Abbreviations TALBERT & BRIGHT A-3
SUA Witham Field Airport SUS Spirit of St. Louis Airport T Threatened TAF Terminal Area Forecast TAP Terminal Area Plan TEB Teterboro Airport TERPS Terminal Instrument Procedures TMDL Total Maximum Daily Load TRI Tri-Cities Regional Airport TSA Transportation Security Administration TTN Trenton-Mercer Airport TVI Thomasville Regional Airport TYS McGhee Tyson Airport UGN Waukegan Regional Airport U.S. United States USACE United States Army Corps of Engineers USC United States Code USCG United States Coast Guard USDA United States Department of Agriculture USDHHS United States Department of Health and Human Services USDOT United States Department of Transportation USEPA United States Environmental Protection Agency USFWS United States Fish and Wildlife Service VFR Visual Flight Rule VOC Volatile Organic Compound VOR VHF Omni-Directional Radio Range Wd Wando fine sand, 0% to 6% slopes

HILTON HEAD ISLAND AIRPORT
MASTER PLAN UPDATE
Appendix B – Public Involvement TALBERT & BRIGHT B-1
B.1 PUBLIC INVOLVEMENT
Public participation is an essential element in FAA AC 150/5070-6B, Airport Master Plans, and is proportional to the complexity of the study. For the preparation of the Hilton Head Island Airport Master Plan Update, public participation was considered to be an integral part of the process because of the ongoing issues of the economical viability of the Airport to the Town of Hilton Head Island and Beaufort County.
B.1.1 How was public participation accomplished for the Master Plan Update?
The intent of public involvement is to encourage and facilitate public input and comments in the decision-making process of the project. The opportunities for input incorporated several methods including use of the media, public comment meetings, and public information meetings, coupled with a project web site maintained by Beaufort County.
B.1.2 What are the goals of public involvement?
It is the goal of the project team, which included the FAA, SCAC, Beaufort County, Town of Hilton Head Island, and the consultant team led by Talbert & Bright, Inc., to inform, educate, and seek input from the public about the project. To achieve this goal, the project team:
• Created an open and objective environment to allow the public to understand the project and provide their opinions
• Integrated citizen concerns and needs into the project development process
• Educated the public on the Airport
• Invited the public to provide input on the project
The public was provided three opportunities to comment on the project, summaries of which are provided below.
B.2 AUGUST 27-28, 2009, PUBLIC COMMENT MEETING
B.2.1 What was the purpose of the public comment meeting?
The public comment meeting was the first step to introduce the project to the public. These meetings occurred at the beginning of the project before the preparation of the aviation operations forecasts and demand capacity
analysis and facility requirements. The meetings allowed the project team to provide an opportunity for the public to participate in the project development process by providing input on issues such as adequacy of existing facilities, concerns within the vicinity of the Airport, and the range of alternatives the public believed should be considered in the preparation of the Master Plan Update. To facilitate this input process, each attendee was asked to complete a public input survey form. These forms were either completed at the public comment meeting or mailed or e-mailed.
The meeting took place over a two-day period (Thursday, August 27, 2009, from 1:30 p.m. to 8:00 p.m. and Friday, August 28, 2009, from 9:00 a.m. to 12:00 p.m. and 1:30 p.m. to 3:00 p.m.) at the Hilton Head Island Library, 11 Beach City Road on Hilton Head Island, approximately one mile from the Hilton Head Island Airport. The project team set up displays that included the Master Plan Update process chart, land use map, zoning map, and an existing airport facilities map. Project team representatives were available to answer questions. A table was set up for those who wished to fill out the public input survey at the meeting. In addition, a series of blank sheets were taped on the wall, which allowed the public to provide their comments on five by eight cards, a summary of which is provided in the following sections. The following questions were asked:
• How does the public view this airport?
• Who uses the airport?
• What are the issues as you see it?
• Is the 25 percent decline in tourists a concern?
• What are the questions?
Three hundred and sixty-seven (367) people attended the public comment meetings. Four hundred and seventy one (471) comments were turned in at the meetings, 97 surveys and five letters were received by mail, seven e-mail surveys were received from the Beaufort County web survey, and 335 e-mail surveys were received from the Hilton Head Island-Bluffton Chamber of Commerce web survey.
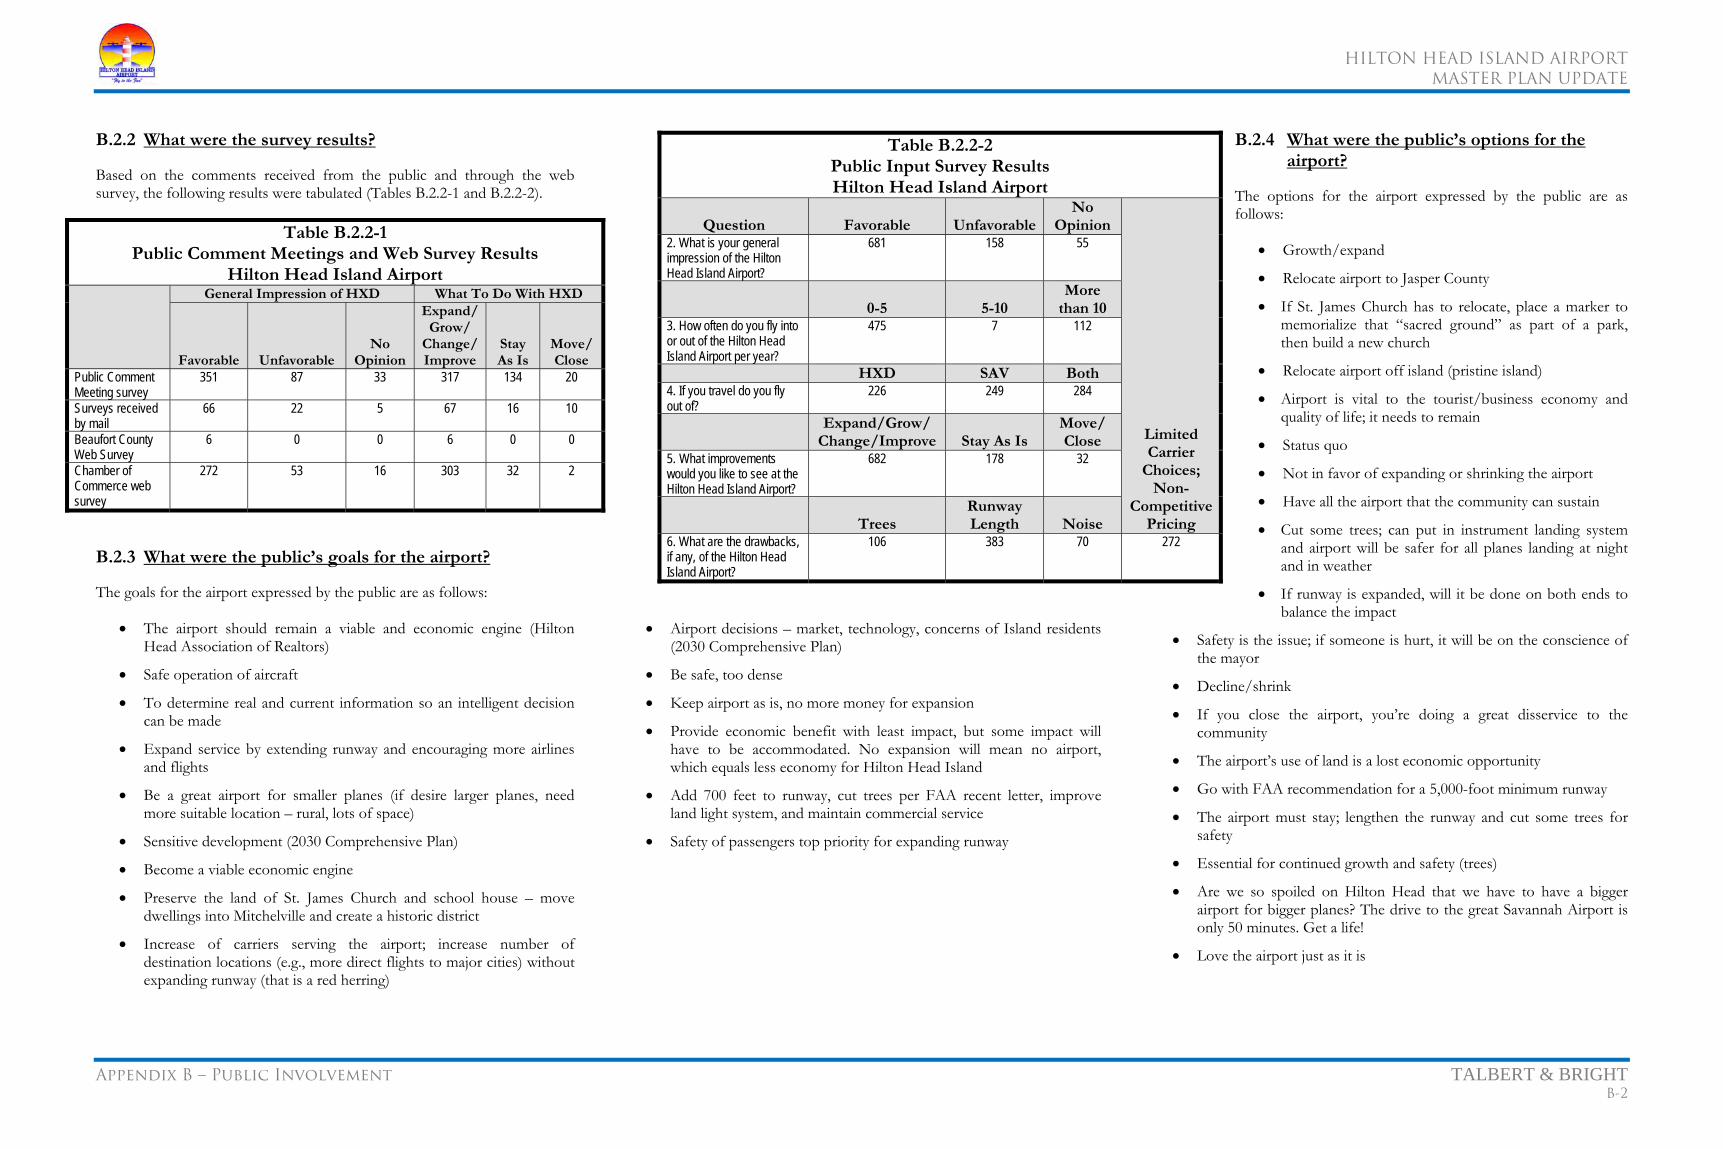
HILTON HEAD ISLAND AIRPORT
MASTER PLAN UPDATE
Appendix B – Public Involvement TALBERT & BRIGHT B-2
B.2.2 What were the survey results?
Based on the comments received from the public and through the web survey, the following results were tabulated (Tables B.2.2-1 and B.2.2-2).
B.2.3 What were the public’s goals for the airport?
The goals for the airport expressed by the public are as follows:
• The airport should remain a viable and economic engine (Hilton Head Association of Realtors)
• Safe operation of aircraft
• To determine real and current information so an intelligent decision can be made
• Expand service by extending runway and encouraging more airlines and flights
• Be a great airport for smaller planes (if desire larger planes, need more suitable location – rural, lots of space)
• Sensitive development (2030 Comprehensive Plan)
• Become a viable economic engine
• Preserve the land of St. James Church and school house – move dwellings into Mitchelville and create a historic district
• Increase of carriers serving the airport; increase number of destination locations (e.g., more direct flights to major cities) without expanding runway (that is a red herring)
• Airport decisions – market, technology, concerns of Island residents (2030 Comprehensive Plan)
• Be safe, too dense
• Keep airport as is, no more money for expansion
• Provide economic benefit with least impact, but some impact will have to be accommodated. No expansion will mean no airport, which equals less economy for Hilton Head Island
• Add 700 feet to runway, cut trees per FAA recent letter, improve land light system, and maintain commercial service
• Safety of passengers top priority for expanding runway
B.2.4 What were the public’s options for the airport?
The options for the airport expressed by the public are as follows:
• Growth/expand
• Relocate airport to Jasper County
• If St. James Church has to relocate, place a marker to memorialize that “sacred ground” as part of a park, then build a new church
• Relocate airport off island (pristine island)
• Airport is vital to the tourist/business economy and quality of life; it needs to remain
• Status quo
• Not in favor of expanding or shrinking the airport
• Have all the airport that the community can sustain
• Cut some trees; can put in instrument landing system and airport will be safer for all planes landing at night and in weather
• If runway is expanded, will it be done on both ends to balance the impact
• Safety is the issue; if someone is hurt, it will be on the conscience of the mayor
• Decline/shrink
• If you close the airport, you’re doing a great disservice to the community
• The airport’s use of land is a lost economic opportunity
• Go with FAA recommendation for a 5,000-foot minimum runway
• The airport must stay; lengthen the runway and cut some trees for safety
• Essential for continued growth and safety (trees)
• Are we so spoiled on Hilton Head that we have to have a bigger airport for bigger planes? The drive to the great Savannah Airport is only 50 minutes. Get a life!
• Love the airport just as it is
Table B.2.2-1 Public Comment Meetings and Web Survey Results
Hilton Head Island Airport General Impression of HXD What To Do With HXD
Favorable Unfavorable No
Opinion
Expand/ Grow/
Change/ Improve
Stay As Is
Move/ Close
Public Comment Meeting survey
351 87 33 317 134 20
Surveys received by mail
66 22 5 67 16 10
Beaufort County Web Survey
6 0 0 6 0 0
Chamber of Commerce web survey
272 53 16 303 32 2
Table B.2.2-2 Public Input Survey Results Hilton Head Island Airport
Question Favorable UnfavorableNo
Opinion
Limited Carrier
Choices; Non-
Competitive Pricing
2. What is your general impression of the Hilton Head Island Airport?
681 158 55
0-5 5-10
More than 10
3. How often do you fly into or out of the Hilton Head Island Airport per year?
475 7 112
HXD SAV Both 4. If you travel do you fly out of?
226 249 284
Expand/Grow/ Change/Improve Stay As Is
Move/ Close
5. What improvements would you like to see at the Hilton Head Island Airport?
682 178 32
Trees
Runway Length Noise
6. What are the drawbacks, if any, of the Hilton Head Island Airport?
106 383 70 272

HILTON HEAD ISLAND AIRPORT
MASTER PLAN UPDATE
Appendix B – Public Involvement TALBERT & BRIGHT B-3
• Support the airport as a viable service for residents, visitors, and business and expand service
• We’ve been able to co-exist with status quo. Oppose any expansion from the St. James end
• Keep airport as is
• Longer runway is safer for executive jets, commercial, and residents
• Keep current airport for private use, move commercial/longer runway off Island with less density (population), small island
• Investigate a second bridge off the Island from Beach City to St. Helena and a new site for the airport
• Airport in Bluffton
B.2.5 What were the public’s issues of the airport?
The issues for the airport expressed by the public are as follows:
• Safety
• Noise
• Economic development
• Better enforcement of flight paths
• Airport landlocked
• Find a way to expand the airport
• Meeting/event planning decisions to come to Hilton Head directly affected by runway length
• Too many cancellations to HXD due to equipment used and aircraft reliability
• Airport’s capacity has a direct impact on Hilton Head’s economy
• Hangars – rent deficit in quantity, property tax – aircraft and buildings
• Landing fees for general aviation aircraft would drive away aircraft
• Potential impact on historical areas by airport expansion
• Hurricane recovery using airport
• Business (potential) relocation linked to accessibility of airport
• This level of tourism impairs the quality of life
• Aircraft noise over Matthews Drive (residential area – life-long resident)
• Airport is a convenience but not a necessity
• Expand air service with longer runway
• Does anyone know anything about safety of an airport? It is obvious not
• HXD is a vital community asset that needs to be protected; please address the runway and trees as soon as possible
• Extend it or we lose it – that simple
• The airport debate resembles the one over the cross island expressway; extend the runway
• It’s dangerous to drive to Savannah for a 6:00 a.m. flight (must leave Hilton Head at 4:30 a.m.) and the drive home from business meetings in Savannah at 11:00 p.m. in darkness (and intoxicated drivers – see crosses on the road)
• Better enforcement of fly zones
• Have public hearings at key points in the process – not just at the beginning and end
• Keep out big jets and big noise. Don’t lengthen the runway for corporate jets
• Corporate jets are not big
• Modern airport with longer runway needed – tourism, commercial service, evacuation of sick people, and resupply and reconstruction after storm. Substitutes won’t work
• We have enough
• Much greater noise impact every hour with incessant landscape blowers and tractors than any plane
• Air pollution: what about the impact the airport has on air quality? Pollution caused by aircraft and ground support equipment must be factored into the equation
• Savannah is a nice airport, but it already takes 45 minutes to drive and will likely to get longer with increased development in Jasper County, Bluffton, etc., i.e., 1.5 hours
• Loss of commercial services leading to loss of FAA funding places burden on citizens
• NetJets will not use Hilton Head Island Airport (runway has to be 5,000 feet)
• The airport is an important business asset
• I wouldn’t have moved 80 jobs and created 300 jobs without the Hilton Head Island Airport
• It is a luxury not a vital necessity; Savannah is only one hour away and very safe
• Extend Runway to 5,000 feet, cut trees to clear vertical obstacles, put in precision approach to extent possible, and entice airlines to service Hilton Head with commercial incentives
• We live in Port Royal Plantation, and noise is not a problem
• To fly to Savannah is one of the top five most expensive airports in the country (USA Today)
• Concern for continued economic vitality
• While Savannah Airport is safe, the drive to it is very dangerous
• Savannah is a great airport, easy to use, more flights, cheaper, and easy to get to
• Savannah hasn’t moved, but it’s getting further away (travel time) every day
• Go to Delta and find out what it takes to get them to return
• If there are lane closures on I-95, it can take 2-3 hours to get to Savannah Airport. You can’t anticipate road problems
B.2.6 What were the public’s facts on the airport?
The facts for the airport expressed by the public are as follows:
• Hilton Head Island: 23,000 acres (36 square miles)
• Hilton Head Island population is 33,944 (2007, SC Statistical Abstract)
• No longer a “low-cost” carrier in the area
• We consider Savannah to be the best “local” airport that we’ve ever experienced
• Requirements: disaster relief, ramp space, economic development, and precision approach
• 2.6% of visitors use HXD (not including residents (2005 Wilder Smith)
• Hilton Head Island Airport’s runway is the shortest commercial one in South Carolina
• Property values are supported by ability to land aircraft at the airport
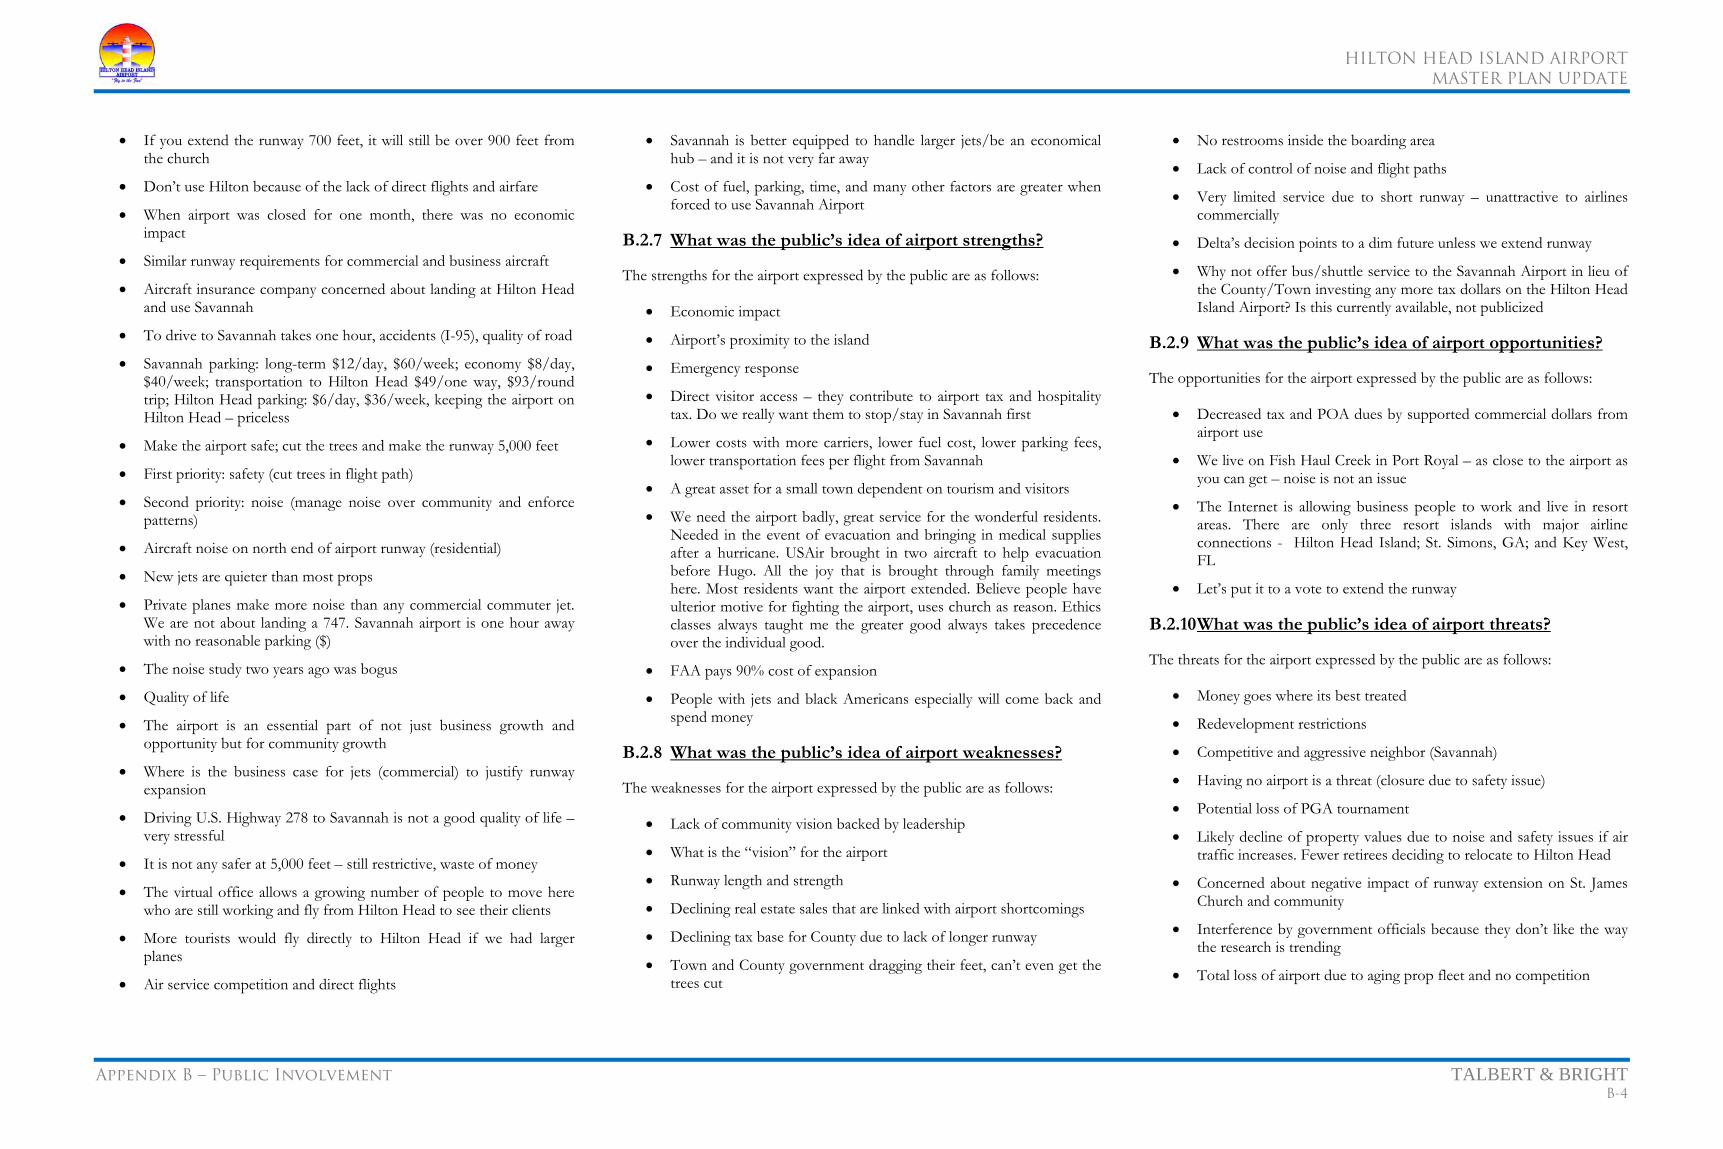
HILTON HEAD ISLAND AIRPORT
MASTER PLAN UPDATE
Appendix B – Public Involvement TALBERT & BRIGHT B-4
• If you extend the runway 700 feet, it will still be over 900 feet from the church
• Don’t use Hilton because of the lack of direct flights and airfare
• When airport was closed for one month, there was no economic impact
• Similar runway requirements for commercial and business aircraft
• Aircraft insurance company concerned about landing at Hilton Head and use Savannah
• To drive to Savannah takes one hour, accidents (I-95), quality of road
• Savannah parking: long-term $12/day, $60/week; economy $8/day, $40/week; transportation to Hilton Head $49/one way, $93/round trip; Hilton Head parking: $6/day, $36/week, keeping the airport on Hilton Head – priceless
• Make the airport safe; cut the trees and make the runway 5,000 feet
• First priority: safety (cut trees in flight path)
• Second priority: noise (manage noise over community and enforce patterns)
• Aircraft noise on north end of airport runway (residential)
• New jets are quieter than most props
• Private planes make more noise than any commercial commuter jet. We are not about landing a 747. Savannah airport is one hour away with no reasonable parking ($)
• The noise study two years ago was bogus
• Quality of life
• The airport is an essential part of not just business growth and opportunity but for community growth
• Where is the business case for jets (commercial) to justify runway expansion
• Driving U.S. Highway 278 to Savannah is not a good quality of life – very stressful
• It is not any safer at 5,000 feet – still restrictive, waste of money
• The virtual office allows a growing number of people to move here who are still working and fly from Hilton Head to see their clients
• More tourists would fly directly to Hilton Head if we had larger planes
• Air service competition and direct flights
• Savannah is better equipped to handle larger jets/be an economical hub – and it is not very far away
• Cost of fuel, parking, time, and many other factors are greater when forced to use Savannah Airport
B.2.7 What was the public’s idea of airport strengths?
The strengths for the airport expressed by the public are as follows:
• Economic impact
• Airport’s proximity to the island
• Emergency response
• Direct visitor access – they contribute to airport tax and hospitality tax. Do we really want them to stop/stay in Savannah first
• Lower costs with more carriers, lower fuel cost, lower parking fees, lower transportation fees per flight from Savannah
• A great asset for a small town dependent on tourism and visitors
• We need the airport badly, great service for the wonderful residents. Needed in the event of evacuation and bringing in medical supplies after a hurricane. USAir brought in two aircraft to help evacuation before Hugo. All the joy that is brought through family meetings here. Most residents want the airport extended. Believe people have ulterior motive for fighting the airport, uses church as reason. Ethics classes always taught me the greater good always takes precedence over the individual good.
• FAA pays 90% cost of expansion
• People with jets and black Americans especially will come back and spend money
B.2.8 What was the public’s idea of airport weaknesses?
The weaknesses for the airport expressed by the public are as follows:
• Lack of community vision backed by leadership
• What is the “vision” for the airport
• Runway length and strength
• Declining real estate sales that are linked with airport shortcomings
• Declining tax base for County due to lack of longer runway
• Town and County government dragging their feet, can’t even get the trees cut
• No restrooms inside the boarding area
• Lack of control of noise and flight paths
• Very limited service due to short runway – unattractive to airlines commercially
• Delta’s decision points to a dim future unless we extend runway
• Why not offer bus/shuttle service to the Savannah Airport in lieu of the County/Town investing any more tax dollars on the Hilton Head Island Airport? Is this currently available, not publicized
B.2.9 What was the public’s idea of airport opportunities?
The opportunities for the airport expressed by the public are as follows:
• Decreased tax and POA dues by supported commercial dollars from airport use
• We live on Fish Haul Creek in Port Royal – as close to the airport as you can get – noise is not an issue
• The Internet is allowing business people to work and live in resort areas. There are only three resort islands with major airline connections - Hilton Head Island; St. Simons, GA; and Key West, FL
• Let’s put it to a vote to extend the runway
B.2.10 What was the public’s idea of airport threats?
The threats for the airport expressed by the public are as follows:
• Money goes where its best treated
• Redevelopment restrictions
• Competitive and aggressive neighbor (Savannah)
• Having no airport is a threat (closure due to safety issue)
• Potential loss of PGA tournament
• Likely decline of property values due to noise and safety issues if air traffic increases. Fewer retirees deciding to relocate to Hilton Head
• Concerned about negative impact of runway extension on St. James Church and community
• Interference by government officials because they don’t like the way the research is trending
• Total loss of airport due to aging prop fleet and no competition
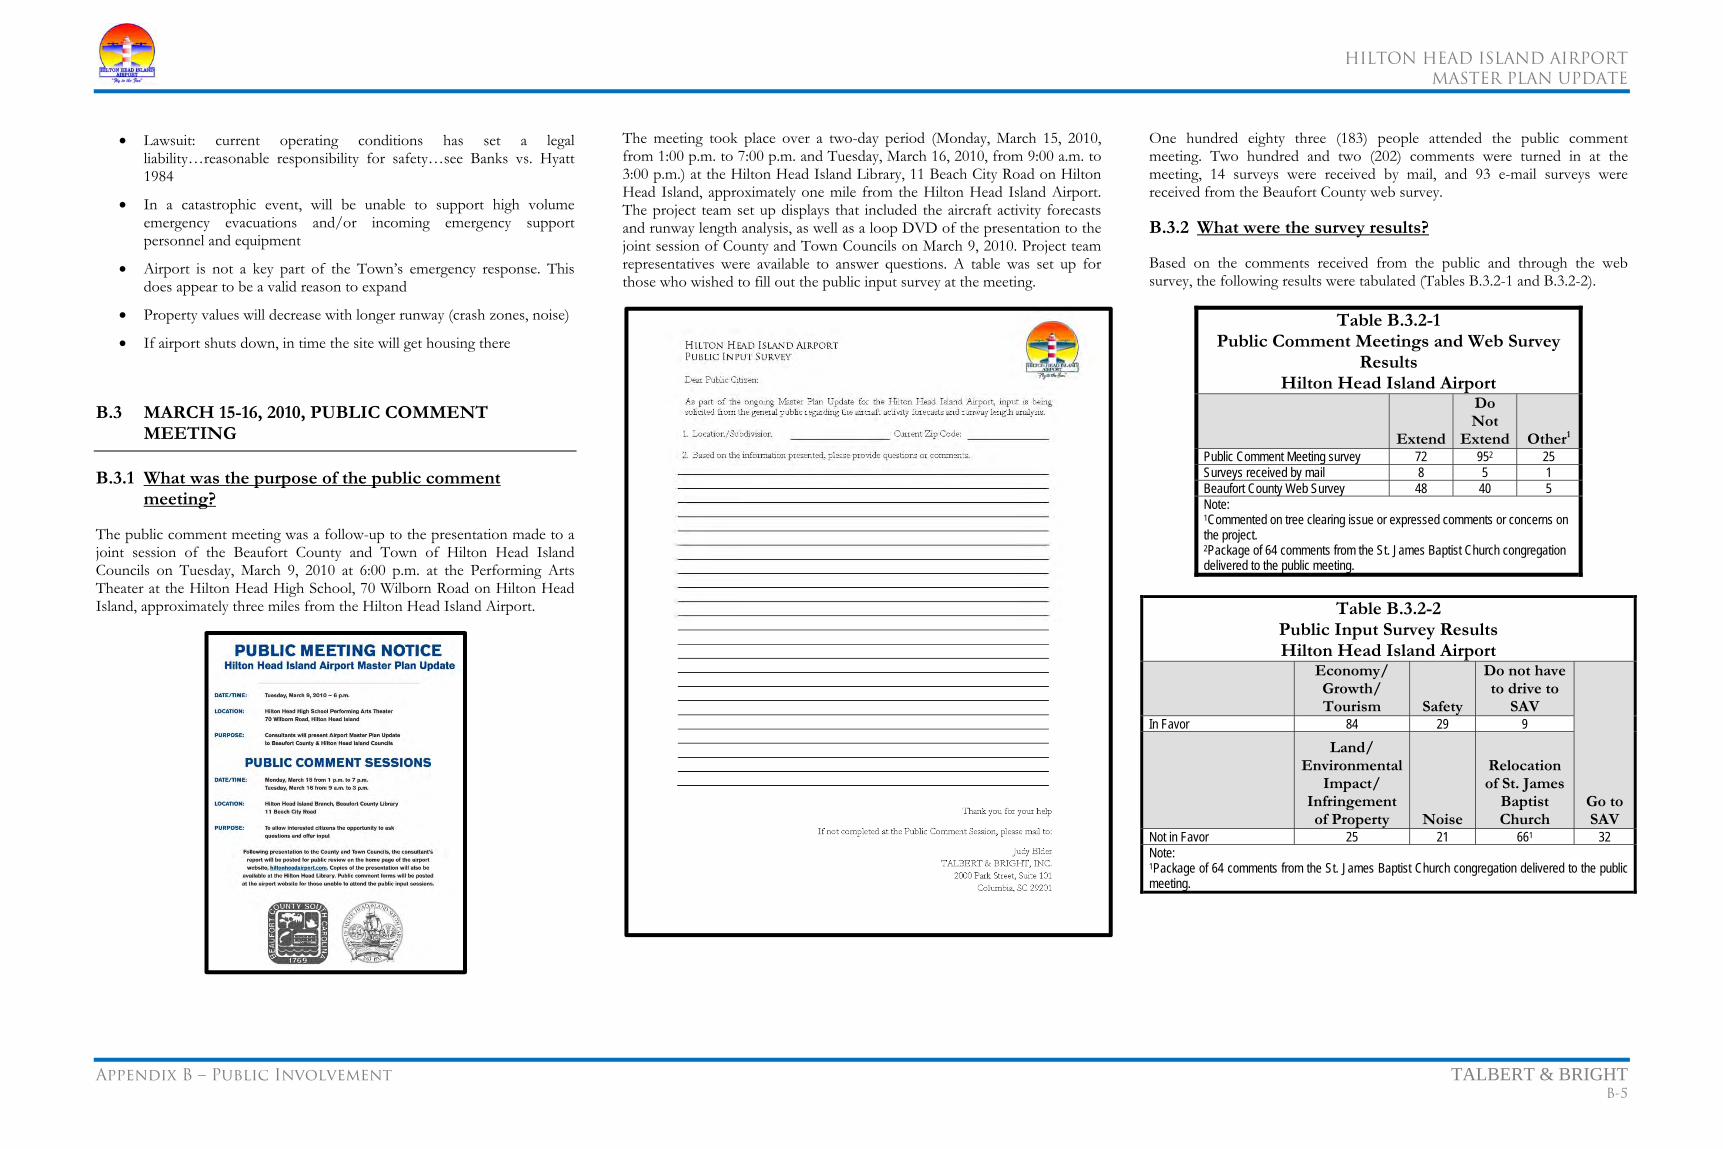
HILTON HEAD ISLAND AIRPORT
MASTER PLAN UPDATE
Appendix B – Public Involvement TALBERT & BRIGHT B-5
• Lawsuit: current operating conditions has set a legal liability…reasonable responsibility for safety…see Banks vs. Hyatt 1984
• In a catastrophic event, will be unable to support high volume emergency evacuations and/or incoming emergency support personnel and equipment
• Airport is not a key part of the Town’s emergency response. This does appear to be a valid reason to expand
• Property values will decrease with longer runway (crash zones, noise)
• If airport shuts down, in time the site will get housing there
B.3 MARCH 15-16, 2010, PUBLIC COMMENT MEETING
B.3.1 What was the purpose of the public comment meeting?
The public comment meeting was a follow-up to the presentation made to a joint session of the Beaufort County and Town of Hilton Head Island Councils on Tuesday, March 9, 2010 at 6:00 p.m. at the Performing Arts Theater at the Hilton Head High School, 70 Wilborn Road on Hilton Head Island, approximately three miles from the Hilton Head Island Airport.
The meeting took place over a two-day period (Monday, March 15, 2010, from 1:00 p.m. to 7:00 p.m. and Tuesday, March 16, 2010, from 9:00 a.m. to 3:00 p.m.) at the Hilton Head Island Library, 11 Beach City Road on Hilton Head Island, approximately one mile from the Hilton Head Island Airport. The project team set up displays that included the aircraft activity forecasts and runway length analysis, as well as a loop DVD of the presentation to the joint session of County and Town Councils on March 9, 2010. Project team representatives were available to answer questions. A table was set up for those who wished to fill out the public input survey at the meeting.
One hundred eighty three (183) people attended the public comment meeting. Two hundred and two (202) comments were turned in at the meeting, 14 surveys were received by mail, and 93 e-mail surveys were received from the Beaufort County web survey.
B.3.2 What were the survey results?
Based on the comments received from the public and through the web survey, the following results were tabulated (Tables B.3.2-1 and B.3.2-2).
Table B.3.2-1 Public Comment Meetings and Web Survey
Results Hilton Head Island Airport
Extend
Do Not
Extend Other1
Public Comment Meeting survey 72 952 25 Surveys received by mail 8 5 1 Beaufort County Web Survey 48 40 5 Note: 1Commented on tree clearing issue or expressed comments or concerns on the project. 2Package of 64 comments from the St. James Baptist Church congregation delivered to the public meeting.
Table B.3.2-2
Public Input Survey Results Hilton Head Island Airport
Economy/ Growth/ Tourism Safety
Do not have to drive to
SAV
Go to SAV
In Favor 84 29 9 Land/
Environmental Impact/
Infringement of Property Noise
Relocation of St. James
Baptist Church
Not in Favor 25 21 661 32 Note: 1Package of 64 comments from the St. James Baptist Church congregation delivered to the public meeting.

HILTON HEAD ISLAND AIRPORT
MASTER PLAN UPDATE
Appendix B – Public Involvement TALBERT & BRIGHT B-6
B.3.3 Response to Questions
As part of the master planning process, Talbert & Bright, Inc. (TBI) has received questions and comments from the public as a result of the public comment meetings over the past several months. TBI is in the process of answering these questions, which will be posted on the Beaufort County web site. Copies of questions and comments will be appended to the Final Master Plan Report.
During the past several months, TBI has received questions from specific individuals and elected officials of the Town of Hilton Head Island and Beaufort County. TBI has been directed by Beaufort County to respond to these questions. As of today’s date, the study is approximately 70 percent complete and is expected to be finished within the next four months. TBI is currently at the alternatives analysis phase of the 20-year Master Plan, and the development costs, financial considerations, and Airport Layout Plan drawing set, as well as other items, remain to be completed. Because the study is not complete at this time, responses to the questions are subject to the following conditions:
1. The answers given today are subject to change as additional analysis is performed and the study is completed
2. Some questions cannot be answered as the pertinent portions of the study have not been completed
3. Some information requested is outside of the scope of the study
4. Some questions need clarification
The answers to the questions received from the March 15-16, 2010, public meeting are provided below.
B.3.3.1 Economy
Why throw good money after bad – is the airport at current levels of profitable?
TBI is in the process of the financial portion of the Master Plan, and the information will be included in the Final Master Plan Report.
Are we charging appropriate fee’s for planes landing, taking off, or staying?
TBI is in the process of the financial portion of the Master Plan, and the information will be included in the Final Master Plan Report.
Has the possible economic impact been studied and if yes has the idea above been included in these studies?
TBI is in the process of the financial portion of the Master Plan, and financial information will be included in the Final Master Plan Report.
However, the economic impact to Hilton Head Island as a result of the runway extension will not be reported as part of the Master Plan Study.
Why are we spending the money to lengthen the runway in order to cater to a very small special interest group on the island?
The recommended runway length was determined from FAA requirements using the family of aircraft that currently utilizes the Hilton Head Island Airport, as presented in the March 9, 2010, presentation.
How will taxes be covered if we don’t invest for the future of this resort community?
This question is outside of the scope of the Master Plan Study.
What is the economic impact to Hilton Head if the runway is increased in length?
TBI is in the process of the financial portion of the Master Plan, and financial information will be included in the Final Master Plan Report. However, the economic impact to Hilton Head Island as a result of the runway extension will not be reported as part of the Master Plan Study.
B.3.3.2 Environment
Why disrupt our Hilton Head environment to please a few people that make all this noise?
The recommended runway length was determined from FAA requirements using the family of aircraft that currently utilizes the Hilton Head Island Airport, as presented in the March 9, 2010, presentation.
How will clear cutting affect the noise level?
The noise contours for the proposed alternatives were created using the FAA’s Integrated Noise Modeling (INM) program for the family of aircraft currently using the Hilton Head Island Airport. These contours were developed independently of the proposed tree-cutting project.
What will clear cutting do to the waterways and wildlife on the property?
This question is outside of the scope of the Master Plan Study.
Why has there been no recommendation by anyone that the impact of the master plan could and would affect the currently proposed FAA & MPAC scope of work requiring cut backs and repetitious tree work?
This question needs clarification; however; questions concerning tree cutting are outside of the scope of the Master Plan Study.
B.3.3.3 Multiple Questions
Why not build an airport in Bluffton (there is plenty of land to make a larger airport and it will create more jobs) rather than creating more noise for HHI?)
This is a decision that needs to be made by the Town of Hilton Head Island and Beaufort County. However, at the May 19, 2010, presentation, TBI discussed the relocation of the Airport, and TBI’s recommendation is that relocation is not feasible.
Does it make sense to disrupt the tranquility (this is what attracts vacationers) of vacationers and residents for the convenience of a few?
The master planning process will conclude with a 20-year development plan for the Hilton Head Island Airport. It will be the decision of the Airport Sponsor on when and how to implement the elements of the Master Plan.
I know of no one who wants to live or vacation near an airport. So why on earth do we want to put our entire economy of our island at risk?
The master planning process will conclude with a 20-year development plan for the Hilton Head Island Airport. It will be the decision of the Airport Sponsor on when and how to implement the elements of the Master Plan.
Why is there very little said about the private aircraft that truly make the most noise?
The noise contours for the proposed alternatives were created using the FAA’s INM program for the family of aircraft currently using the Hilton Head Island Airport.
Why has there been no mention about the value of homes that will be affected by the increases of air traffic and noise?
The noise contours for the proposed alternatives were created using the FAA’s Integrated Noise Modeling (INM) program for the family of aircraft currently using the Hilton Head Island Airport.
Is the tourist move more important than the family dwelling that surround the airport?
The master planning process will conclude with a 20-year development plan for the Hilton Head Island Airport. It will be the decision of the Airport Sponsor on when and how to implement the elements of the Master Plan.
Why don’t you just move the airport and be done with this problem?
This is a decision that needs to be made by the Town of Hilton Head Island and Beaufort County. However, at the May 19, 2010, presentation, TBI discussed the relocation of the Airport, and TBI’s recommendation is that relocation is not feasible.

HILTON HEAD ISLAND AIRPORT
MASTER PLAN UPDATE
Appendix B – Public Involvement TALBERT & BRIGHT B-7
Why not build a larger airport somewhere else?
This is a decision that needs to be made by the Town of Hilton Head Island and Beaufort County. However, at the May 19, 2010, presentation, TBI discussed the relocation of the Airport, and TBI’s recommendation is that relocation is not feasible.
Is it time to consider a second bridge to the mainland on the south end of HHI with fasters access to SAV?
This question is outside of the scope of the Master Plan Study.
What sacrifice is being made for an airport that provides service to 2.6% of travelers to and from the greater HH area?
The master planning process will conclude with a 20-year development plan for the Hilton Head Island Airport. It will be the decision of the Airport Sponsor on when and how to implement the elements of the Master Plan.
What is the taxpayer burden?
TBI is in the process of the financial portion of the Master Plan, and the information will be included in the Final Master Plan Report.
What sacrifices are island residents making?
This question is outside of the scope of the Master Plan Study.
How many people does the airport really benefit given the cost to the taxpayer, environment, residents, wildlife, and air quality?
This question is outside of the scope of the Master Plan Study.
How much does the airport cost the taxpayers to keep open each year?
TBI is in the process of the financial portion of the Master Plan, and the information will be included in the Final Master Plan Report.
Considering the preponderance of private traffic and limited commercial traffic, i.e., Delta and U.S. Air, who really benefits the taxpayer expense?
This question is outside of the scope of the Master Plan Study.
Do we want commercial airline service to HHI or not?
This is a decision that needs to be made by the Town of Hilton Head Island and Beaufort County.
How can we shift to a different type of economy – not tourist driven – if we lack commercial airline service?
This question is outside of the scope of the Master Plan Study.
What do carriers project for traffic if new Regional Jets are used?
TBI does not have that information at this time. TBI is continuing to gather information from the airlines serving Hilton Head Island, and this information will be included in the Final Master Plan Report.
Who is going to pay for it?
It is assumed that this question addresses capital improvements at the Airport. Typically, qualifying projects are paid for in the following manner: FAA 95 percent, State of South Carolina 2.5 percent, and Beaufort County 2.5 percent.
How many more people will use it on a day to day basis?
A forecast of enplanements and operations was provided at the March 9, 2010, presentation and is available for review on the Beaufort County web site and will be included in the Final Master Plan Report.
What about noise level changes?
Noise contours were developed for each development alternative and provided in the May 19, 2010, presentation, which is available for review on the Beaufort County web site and will be included in the Final Master Plan Report.
Will it employ more people?
This question is outside of the scope of the Master Plan Study.
Is the consultant prepared to counter the political position of the mayor (as is evidence by the current zoning at 4300 ft) in discussion of alternatives?
TBI has recommended a runway length of 5,400 feet and has analyzed alternatives for implementation; however, the runway length to be developed remains a local decision.
Our news paper is not an advocate for the island airport, why?
This question needs to be asked of the newspaper.
Our Chamber of Commerce is not an advocate for the island airport, why?
This question needs to be asked of the Chamber of Commerce.
What are the numbers of planes by weight class predicted for this airport by year?
A forecast of enplanements and operations was provided at the March 9, 2010, presentation and is available for review on the Beaufort County web site and will be included in the Final Master Plan Report.
What seat percentage capacity in commercial planes corresponds to the 60% useful load figure used?
The 60 percent useful load figure does not correspond with seat capacity in commercial aircraft.
What is the maximum length available to commercial planes on the existing airport property?
TBI assumes that the question means fully developed within airport property. Alternative 2, Phase I (5,000 feet), as shown in the May 19, 2010, presentation, utilizes airport property available without acquisition of adjacent property and relocation of existing businesses.
For that length, what are the hazard and safety zone lengths on the existing property?
TBI assumes that the question means fully developed within airport property. Alternative 2, Phase I (5,000 feet), as shown in the May 19, 2010, presentation, utilizes airport property available without acquisition of adjacent property and relocation of existing businesses. If an EMAS is utilized, the runway safety area would be approximately 600 feet.
For that length what are the vertical clearances to the St. James Church, Pineland Station, homes, etc.?
The vertical clearances at the St. James Baptist Church and Pineland Station for the Phase I (5,000 feet) option are 12.5 feet and 20.7 feet, respectively, with a 34:1 approach.
What and where are the tree impacts resulting from that length?
The runway extension alternatives were developed utilizing the proposed tree-clearing project.
What are the noise impacts form that length and where?
The results of FAA Integrated Noise Model (INM) were illustrated on each of the alternatives at the May 19, 2010, presentation. The extent of the 65 DNL does not impact land uses that are considered incompatible with the noise model. The noise contours can be reviewed on the Beaufort County web site.
What steps can be taken to better keep planes on their recommended approach and departure routes?
The steps that can be taken include continued encouragement of the use of the Broad Creek noise abatement approach to Runway 03 to the greatest extent possible.
When can we have radar at this airport? If no, why not?
Yes.
What are the vertical impacts of the precision approach being considered? Will this cause a new round of tree and building elimination?

HILTON HEAD ISLAND AIRPORT
MASTER PLAN UPDATE
Appendix B – Public Involvement TALBERT & BRIGHT B-8
The runway extension alternatives were developed utilizing the proposed tree-clearing project.
Is the cost in dollars to expand the airport justified by the expected return in dollars?
There is a series of steps that are required, once the Airport Layout Plan (ALP) is “conditionally approved” by the FAA, for the implementation of a runway extension program at Hilton Head Island Airport; these may include the preparation of a benefit-cost analysis.
Are we a “fly to” resort or a “family drive to” vacation spot?
This question is outside of the scope of the Master Plan Study.
Will we expand our major industry, tourism, by expanding the runway? By how much?
This question is outside of the scope of the Master Plan Study.
Would it be more economically sound to provide regularly scheduled reasonable transportation between Savannah Hilton Head Airport and Hilton Head Island?
This question is outside of the scope of the Master Plan Study.
In the past this type of transportation system between Savannah and HHI has existed but stopped due to a lack of passengers. Is there anything different now that would change this picture?
This question is outside of the scope of the Master Plan Study.
What’s this we are hearing about a little publicized plan to re-align the runway at such an angle that homes would have to be removed from HHP? Another plan to angle it such that it is aimed more E&W, perhaps directly at our house?
The realignment of the runway was considered as one of the development alternatives presented in the May 19, 2010, presentation and can be viewed on the Beaufort County web site. This alternative was not chosen due to the impact it would have on the existing facilities at the Airport.
B.3.3.4 Airport/Airline
The 2007 recommendation by Wilber Smith proposed 5020ft. Did this need more airport property or was this the max available on then current property?
TBI did not participate in the development of documents produced by Wilbur Smith.
What length runway is needed to keep HHI compliant with FAA?
TBI recommends a runway length of 5,400 feet for the Hilton Head Island Airport. This length was determined using the Airport’s existing family of aircraft operating at 60 percent useful load and the procedures provided in FAA’s Advisory Circular 150/5325-4B.
What length runway is needed to make HHI a viable destination?
TBI recommends a runway length of 5,400 feet for the Hilton Head Island Airport. This length was determined using the Airport’s existing family of aircraft operating at 60 percent useful load and the procedures provided in FAA’s Advisory Circular 150/5325-4B.
Would 4800ft be enough to do what is needed?
TBI recommends a runway length of 5,400 feet for the Hilton Head Island Airport. This length was determined using the Airport’s existing family of aircraft operating at 60 percent useful load and the procedures provided in FAA’s Advisory Circular 150/5325-4B.
What length runway is needed for new quieter jets?
TBI recommends a runway length of 5,400 feet for the Hilton Head Island Airport. This length was determined using the Airport’s existing family of aircraft operating at 60 percent useful load and the procedures provided in FAA’s Advisory Circular 150/5325-4B.
Are you sure you need this length if you can’t get anyone to land here?
TBI recommends a runway length of 5,400 feet for the Hilton Head Island Airport. This length was determined using the Airport’s existing family of aircraft operating at 60 percent useful load and the procedures provided in FAA’s Advisory Circular 150/5325-4B.
Have we approached Bombardier, Embraer, Gulf Stream, etc. about a new class of Regional Jet that would be compatible with HHI as well as many of potential new markets?
Discussions have been held with the airlines that provide commercial service to Hilton Head Island Airport, not with manufacturers of aircraft.
What happened to Delta Turbo Prop 2008 and before?
This question is outside of the scope of the Master Plan Study.
Would there be room if the runway was in a different direction?
The realignment of the runway was considered as one of the development alternatives presented in the May 19, 2010, presentation and can be viewed on the Beaufort County web site. This alternative was not chosen due to the impact it would have on the existing facilities at the Airport.
Why does the local news paper claim that Turbo Props will not be operating in 20yrs?
This question needs to be asked of the newspaper.
Where is the air service going to come from when Delta and US Air retire the SAAB 340 and the ATR 42/72?
Delta Airlines (Mesaba Airlines) has indicated that they will go to a regional jet. US Airways (Piedmont Airlines) does not have Saab 340 or ATR 42/72 in its fleet.
Are there existing commitments from other commercial entities?
TBI is not aware of any commitments from other commercial entities.
B.3.3.5 Location/Other
Why don’t we plan to move the airport to Savannah?
This is a decision that needs to be made by the Town of Hilton Head Island and Beaufort County. However, at the May 19, 2010, presentation, TBI discussed the relocation of the Airport, and TBI’s recommendation is that relocation is not feasible.
Why are we trying to duplicate the airports of either Myrtle Beach or Atlantic City NJ?
This question is outside of the scope of the Master Plan Study.
Why not travel to Savannah Airport as we all had to do in our former residences in other states?
This question is outside of the scope of the Master Plan Study.
Has anyone seriously considered moving the airport?
This is a decision that needs to be made by the Town of Hilton Head Island and Beaufort County. However, at the May 19, 2010, presentation, TBI discussed the relocation of the Airport, and TBI’s recommendation is that relocation is not feasible.
How many of nonresident owners intend to retire to HHI and use the home here as their residence?
This question is outside of the scope of the Master Plan Study.
Why has it taken 3-4 Years to resolve the true issue?
This question is outside of the scope of the Master Plan Study.
Why send the jobs created by our travel to Georgia?
This question is outside of the scope of the Master Plan Study.
Why this location?
This is a decision that needs to be made by the Town of Hilton Head Island and Beaufort County. However, at the May 19, 2010, presentation, TBI discussed the relocation of the Airport, and TBI’s recommendation is that relocation is not feasible.

HILTON HEAD ISLAND AIRPORT
MASTER PLAN UPDATE
Appendix B – Public Involvement TALBERT & BRIGHT B-9
B.4 MAY 24-25, 2010, PUBLIC MEETING
B.4.1 What was the purpose of the public comment meeting?
The public comment meeting was a follow-up to the presentation made to a joint session of the Beaufort County and Town of Hilton Head Island Councils on Wednesday, May 19, 2010, at 6:00 p.m. at the Performing Arts Theater at the Hilton Head High School, 70 Wilborn Road on Hilton Head Island, approximately three miles from the Hilton Head Island Airport.
The meeting took place over a two-day period (Monday, May 24, 2010, from 1:00 p.m. to 7:00 p.m. and Tuesday, May 25, 2010, from 9:00 a.m. to 3:00 p.m.) at the Hilton Head Island Library, 11 Beach City Road on Hilton Head Island, approximately one mile from the Hilton Head Island Airport. The project team set up displays that included the runway length development alternatives, as well as a loop DVD of the presentation to the joint session of County and Town Councils on May 19, 2010. Project team representatives were available to answer questions. A table was set up for those who wished to fill out the public input survey at the meeting.
One hundred seventeen (117) people attended the public comment meeting. Seventy nine (79) comments were turned in at the meeting, 53 surveys were received by mail, and 5 e-mail surveys were received from the Beaufort County web survey.
B.4.2 What were the survey results?
Based on the comments received from the public and through the web survey, the following results were tabulated (Tables B.4.2-1 and B.4.2-2).
Table B.4.2-1 Public Comment Meetings and Web Survey
Results Hilton Head Island Airport
Extend
Do Not Extend Other
Public Comment Meeting survey 46 15 18 Surveys received by mail 35 15 3 Beaufort County Web Survey 0 2 3
Table B.4.2-2 Public Input Survey Results Hilton Head Island Airport
Survey Not in favor of expansion 24 Close/Relocate Airport 6 Favor Expansion 14
Development Alternative
1
2
3 Phase I
Only Phases I and II
Phase II Only
Survey 3 4 34 24 0
B.4.3 Response to Questions
As part of the master planning process, Talbert & Bright, Inc. has received questions and comments from the public as a result of the public comment meetings over the past several months. TBI is in the process of answering these questions, which will be posted on the Beaufort County web site. Copies of questions and comments will be appended to the Final Master Plan Report.
During the past several months, TBI has received questions from specific individuals and elected officials of the Town of Hilton Head Island and Beaufort County. TBI has been directed by Beaufort County to respond to these questions. As of today’s date, the study is approximately 70 percent complete and is expected to be finished within the next four months. TBI is currently at the alternatives analysis phase of the 20-year Master Plan, and the development costs, financial considerations, and Airport Layout Plan
drawing set, as well as other items, remain to be completed. Because the study is not complete at this time, responses to the questions are subject to the following conditions:
1. The answers given today are subject to change as additional analysis is performed and the study is completed
2. Some questions cannot be answered as the pertinent portions of the study have not been completed
3. Some information requested is outside of the scope of the study
4. Some questions need clarification

HILTON HEAD ISLAND AIRPORT
MASTER PLAN UPDATE
Appendix B – Public Involvement TALBERT & BRIGHT B-10
The answers to the questions received from the May 24 - 25, 2010, public meeting are provided below.
What is the next step to making alternative 2 work?
The next steps for Alternative 2 is to complete the Master Plan and receive approval from the Town of Hilton Head Island and Beaufort County, then submit the Airport Layout Plan to the FAA for “conditional approval.” After that, the environmental and design process for Alternative 2 should be added to the Airport’s capital improvement program (CIP), through which projects are funded by the FAA.
How does the FAA view a 2 phase development by the following: • Procedures, environmental studies, cost thresholds,
approval potential (plus/minus), land acquisition scheduling, EMAS relocation at north end for phase 2.
There is a series of steps required after the approval of the Master Plan for the project to move forward. The first step is that the project needs to be put on the Airport’s capital improvement program, which is submitted to the FAA by December 31 of each year. This program outlines the projects the Airport would like to conduct over the next five years. Upon FAA funding approval, the steps required for the runway extension include the preparation of an environmental assessment, determination of the properties impacted, and performance of appraisals and review appraisals in order to offer the affected property owners fair market value for the properties, design of the project and then implementation. At the present time, the FAA will provide 95 percent of the project cost; the South Carolina Aeronautics Commission will provide 2.5 percent of the project cost (with the exception of land acquisition). The schedule of the project will be dependent on how the project is presented in the Airport’s capital improvement program.
Does the OFA require no vertical structures? (ie: buildings)
The definition of the obstacle free area (OFA) is an area on the ground centered on a runway, taxiway, or taxilane centerline provided to enhance the safety of aircraft operations by having the area free of objects, except for objects that need to be located in the OFA for air navigation or aircraft ground maneuvering purposes. The FAA has agreed to waive the current encroachments of the OFA; however, any new construction would be required to meet the requirements of the OFA.
What is the goal of the expansion? (to accommodate more gulfstream aircraft or size of commercial aircraft)
The goal of the expansion is to accommodate the family of aircraft, as well as commercial service aircraft, currently using the facility and for the next 20 years.
What would the revised overlay district be?
This would be a question for the Town of Hilton Head Island.
What about the increased noise that will result from increased private jet traffic?
Noise contours were developed for each development alternative and provided in the May 19, 2010, presentation, which is available for review on the Beaufort County web site and will be included in the Final Master Plan Report.
What economic benefit (or benefit at all) to the community of HHI will an expanded airport bring?
This question is outside of the scope of the Master Plan Study.
Is the airport generating enough revenue to support its existence?
TBI is in the process of the financial portion of the Master Plan, and the information will be included in the Final Master Plan Report.
Pros and cons of the runway remaining at 4300 feet?
Current airport users within the family of aircraft representing 100 percent of the fleet operating at 60 percent useful load may be required to operate with restrictions.
Financial impact upon Beaufort County tax payers?
TBI is in the process of the financial portion of the Master Plan, and the information will be included in the Final Master Plan Report.
Has no runway extension, but bringing the airport configuration in compliance with FAA guidelines been considered?
Bringing the Airport into compliance is part of the Airport Master Plan, and any expansion plans would be determined by the Airport Sponsor.
Has the FAA guaranteed its participation in both phases?
The FAA has stated that if there is a consensus between Beaufort County and the Town of Hilton Head Island regarding the future of the Airport that allows for continued growth and expansion, they would participate in the development if funds are available.
What exactly was the consultant charged to study in detail?
The scope of work for the preparation of the Master Plan is available for review on the County’s web site and is in compliance with FAA Advisory Circular 150/5070-6B – Airport Mater Plans (July 29, 2005).
How many private (non commercial, non pilot) citizens involved? What is the make- up of committees?
Before the Master Plan process began, a decision was made by the Town of Hilton Head Island and Beaufort County that the Council members would serve as the Master Plan Advisory Committee (MPAC). TBI has presented to both Councils at four public meetings as part of the process to date.
What larger/noisier airplanes would 5000/5400 runways accommodate?
TBI recommends a runway length of 5,400 feet for the Hilton Head Island Airport. This length was determined using the Airport’s existing family of aircraft operating at 60 percent useful load and the procedures provided in FAA’s Advisory Circular 150/5325-4B.
Is the devaluation of property being considered?
Based on the preliminary design of Alternative 2, it is estimated that five properties would be impacted by the recommended runway extension. Under federal programs, the acquisition of property and provisions for relocation must follow the Uniform Relocation Assistance and Real Property Acquisition Policies Act of 1970, as outlined in FAA AC 150/5100-17 Land Acquisition and Relocation Assistance for Airport Improvement Program Assisted Projects.
Financial factor been considered?
TBI is in the process of the financial portion of the Master Plan, and the information will be included in the Final Master Plan Report.
Has a survey of passengers been done, with full public disclosure, to determine the tourism impact of the airport with regard to passengers who are residents, passengers who are visiting family or friends, and passengers who are arriving for vacation/convention purposes?
A passenger survey was conducted at the Hilton Head Island Airport between the dates of July 22 - 26, 2009. The surveys were taken for eight-hour periods over a five-day time frame by representatives of TBI at the commercial service terminal and the general aviation terminal. The results of the surveys taken are as follows:
Commercial Service Terminal
General Aviation Terminal
• Total Residents: 54 (16%) • Personal: 19 (22%) • Total Visitors: 292 (84%) • Business: 36 (41%)
• Golf/Beach Vacation: 25 (28%)• Military: 2 (2%) • Other: 6 (7%)
The surveys were taken to determine the type of traveler using the Airport and reasons for their visit and the type of aircraft landing at the Airport. Copies of the blank survey forms used are attached. All the results of the survey will be included in the Master Plan Report.

HILTON HEAD ISLAND AIRPORT
MASTER PLAN UPDATE
Appendix B – Public Involvement TALBERT & BRIGHT B-11
Although a technical presentation was made with regard to what technically could be done for runway length, is it not reasonable to provide the benefits of the alternatives such that local decisions can be made on the alternatives? This is required by the county residents to make the decision to justify further use of local tax dollars, although it appears that the FAA funds projects without a complete cost/benefits analysis. What is the cost of the recommended alternative 2, such that the local share can be determined?
Typically, qualifying projects are paid for in the following manner: FAA 95 percent, State of South Carolina 2.5 percent, and Beaufort County 2.5 percent. Requirements for a cost benefit analysis are determined by the FAA in accordance with the FAA Airport Benefit-Cost Analysis Guidance (December 15, 1999) and submitted during the federal grant application process.
Since nothing definitive has been presented, what is the impact on the community of the recommended alternative 2?
This question is outside of the scope of the Master Plan Study.
Why can’t the runway be lengthened all at once instead of piecemeal?
The runway can be lengthened all at once, but that is a decision to be made by the FAA and the Airport Sponsor.
More information detailing potential economic impact, both in the air and environs and not directly related to the airport operations.
This question is outside of the scope of the Master Plan Study.
While safety is the #1 concern, what changes will be likely to surrounding property - Highways and roads, commercial buildings with airport connections - fuel storage, parking, etc.?
Changes expected based on the runway extension will be shown on the Airport Layout Plan and will include such things as the acquisition of five parcels of property along Beach City Road and the relocation of Beach City Road from an area in the vicinity of Fort Howell to its intersection with Fish Haul and Dillon Roads. Development on airport property will also be shown on the ALP and includes, but is not limited to, the expansion of the aircraft parking apron on the general aviation side of the airport, as well as the construction of new hangars to accommodate aircraft. The Master Plan will recommend that the commercial service terminal undergo renovation and that the public parking area for the commercial side of the Airport will be improved.
B.5 PRESENTATIONS TO BEAUFORT COUNTY AND HILTON HEAD ISLAND TOWN COUNCILS
Status updates and presentations were given to Beaufort County and Hilton Head Island Town Councils on the following dates:
• Hilton Head Island Town Council, November 17, 2009, regarding the scope of work, master plan process, results of the August 27-28, 2009, public meeting, and existing conditions inventory (presentation materials outlined in Exhibit B.1)
• Beaufort County Council, November 23, 2009, regarding the scope of work, master plan process, results of the August 27-28, 2009, public meeting, and existing conditions inventory (presentation materials outlined in Exhibit B.1)
• Joint session of Councils, March 9, 2010, regarding the aircraft activity forecasts and runway length analysis (presentation materials outlined in Exhibit B.2)
• Joint session of Councils, May 19, 2010, regarding the runway length development alternatives (presentation materials outlined in Exhibit B.3)
• Joint session of Councils, July 12, 2010, regarding the runway length development alternatives (responses to consolidated list of questions from Councils outlined in Exhibits B.4 and B.5)
• Joint session of Councils, October 27, 2010, regarding the summary of the results of the Master Plan Update (presentation materials outlined in Exhibit B.6)
B.6 MEETINGS WITH AND PRESENTATIONS TO FAA AND SCAC
Status updates, meetings, and presentations were given to the FAA and SCAC on the following dates:
• FAA and SCAC, October 28, 2009, regarding results of the August 27-28, 2009, public meeting, existing conditions inventory, and aircraft activity forecasts
• FAA (with Beaufort County Council Chairman, Beaufort County Administrator, Hilton Head Island Airport Manager, and Mayor of the Town of Hilton Head Island), January 26, 2010, regarding the results of the runway length analysis. A letter of concurrence was received from the FAA on February 9, 20101
• FAA, May 5, 2010, regarding the runway length development alternatives
• FAA, June 24, 2010, regarding the runway development alternatives and consolidated list of questions from Councils.
1Scott L. Seritt, Manager, Federal Aviation Administration Atlanta Airports District Office, Runway Length Determination, Hilton Head Island Airport (HXD), letter, addressed to Gary Kubic, Beaufort County Administrator, February 9, 2010.
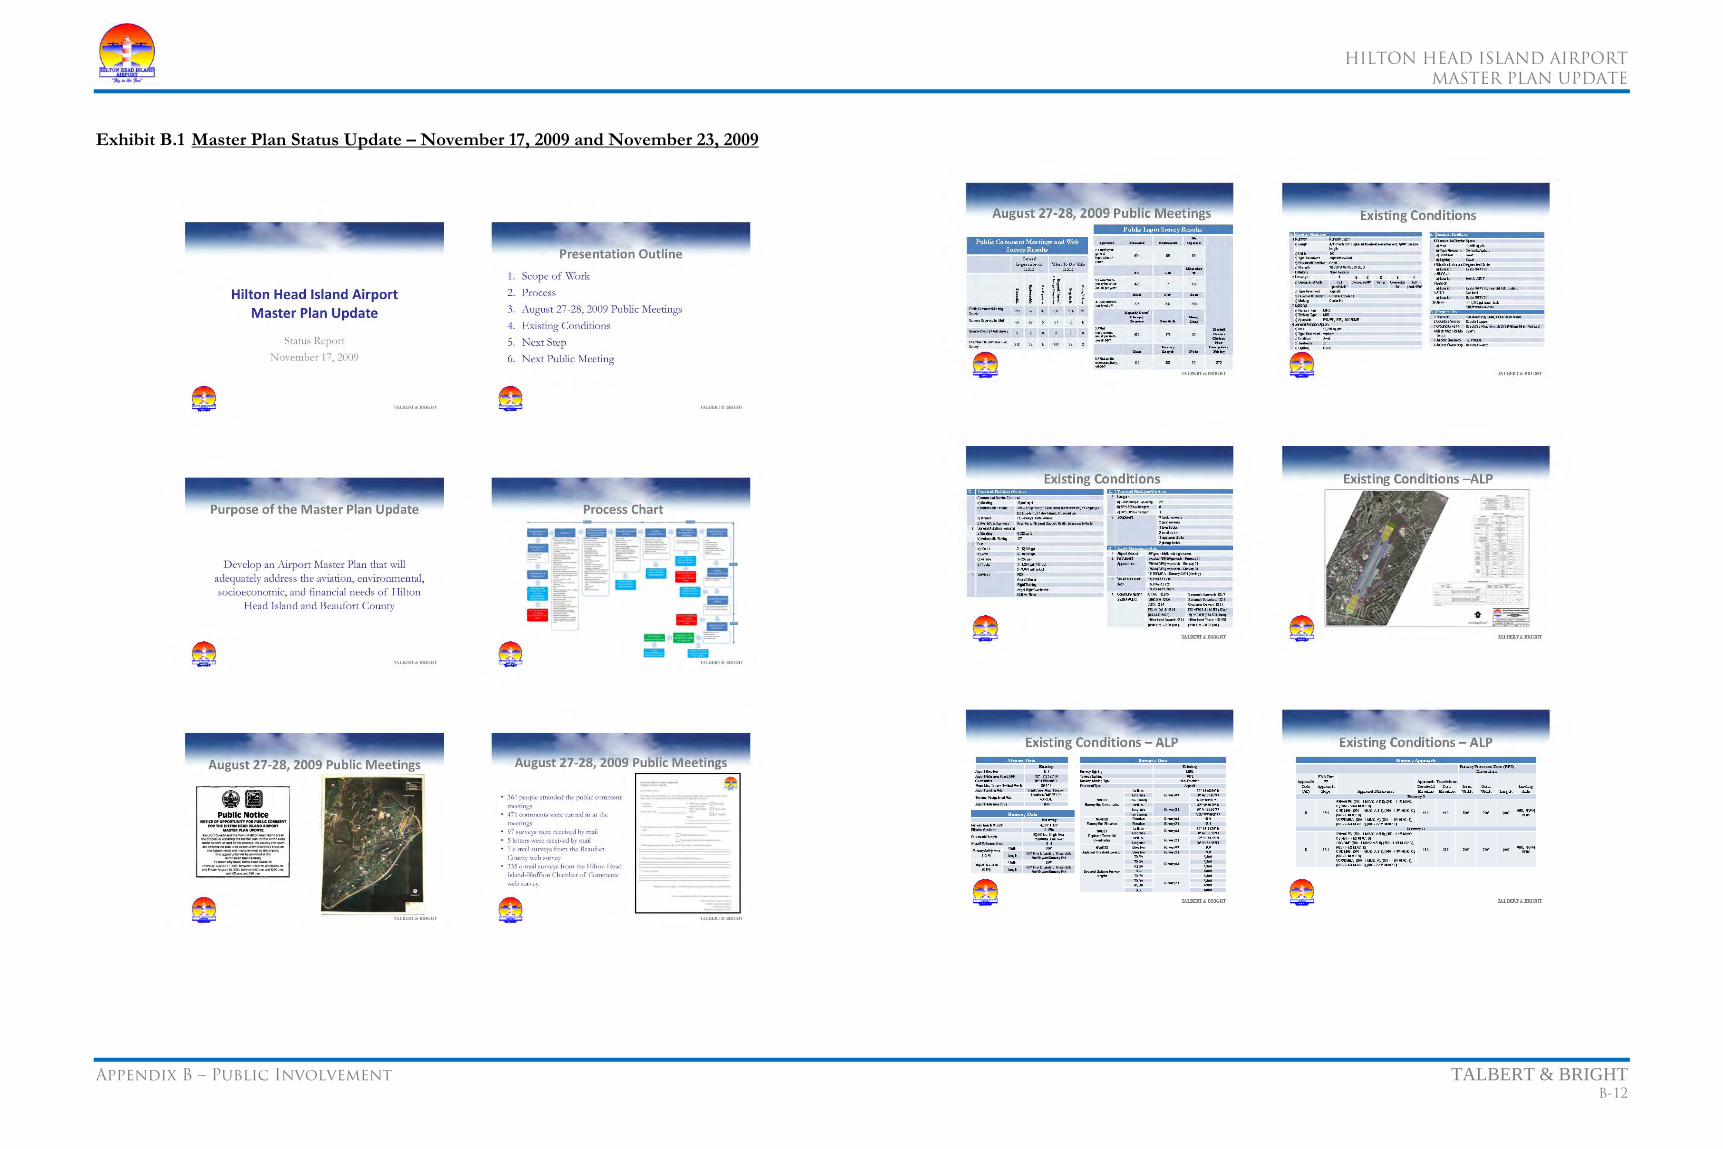
HILTON HEAD ISLAND AIRPORT
MASTER PLAN UPDATE
Appendix B – Public Involvement TALBERT & BRIGHT B-12
Exhibit B.1 Master Plan Status Update – November 17, 2009 and November 23, 2009
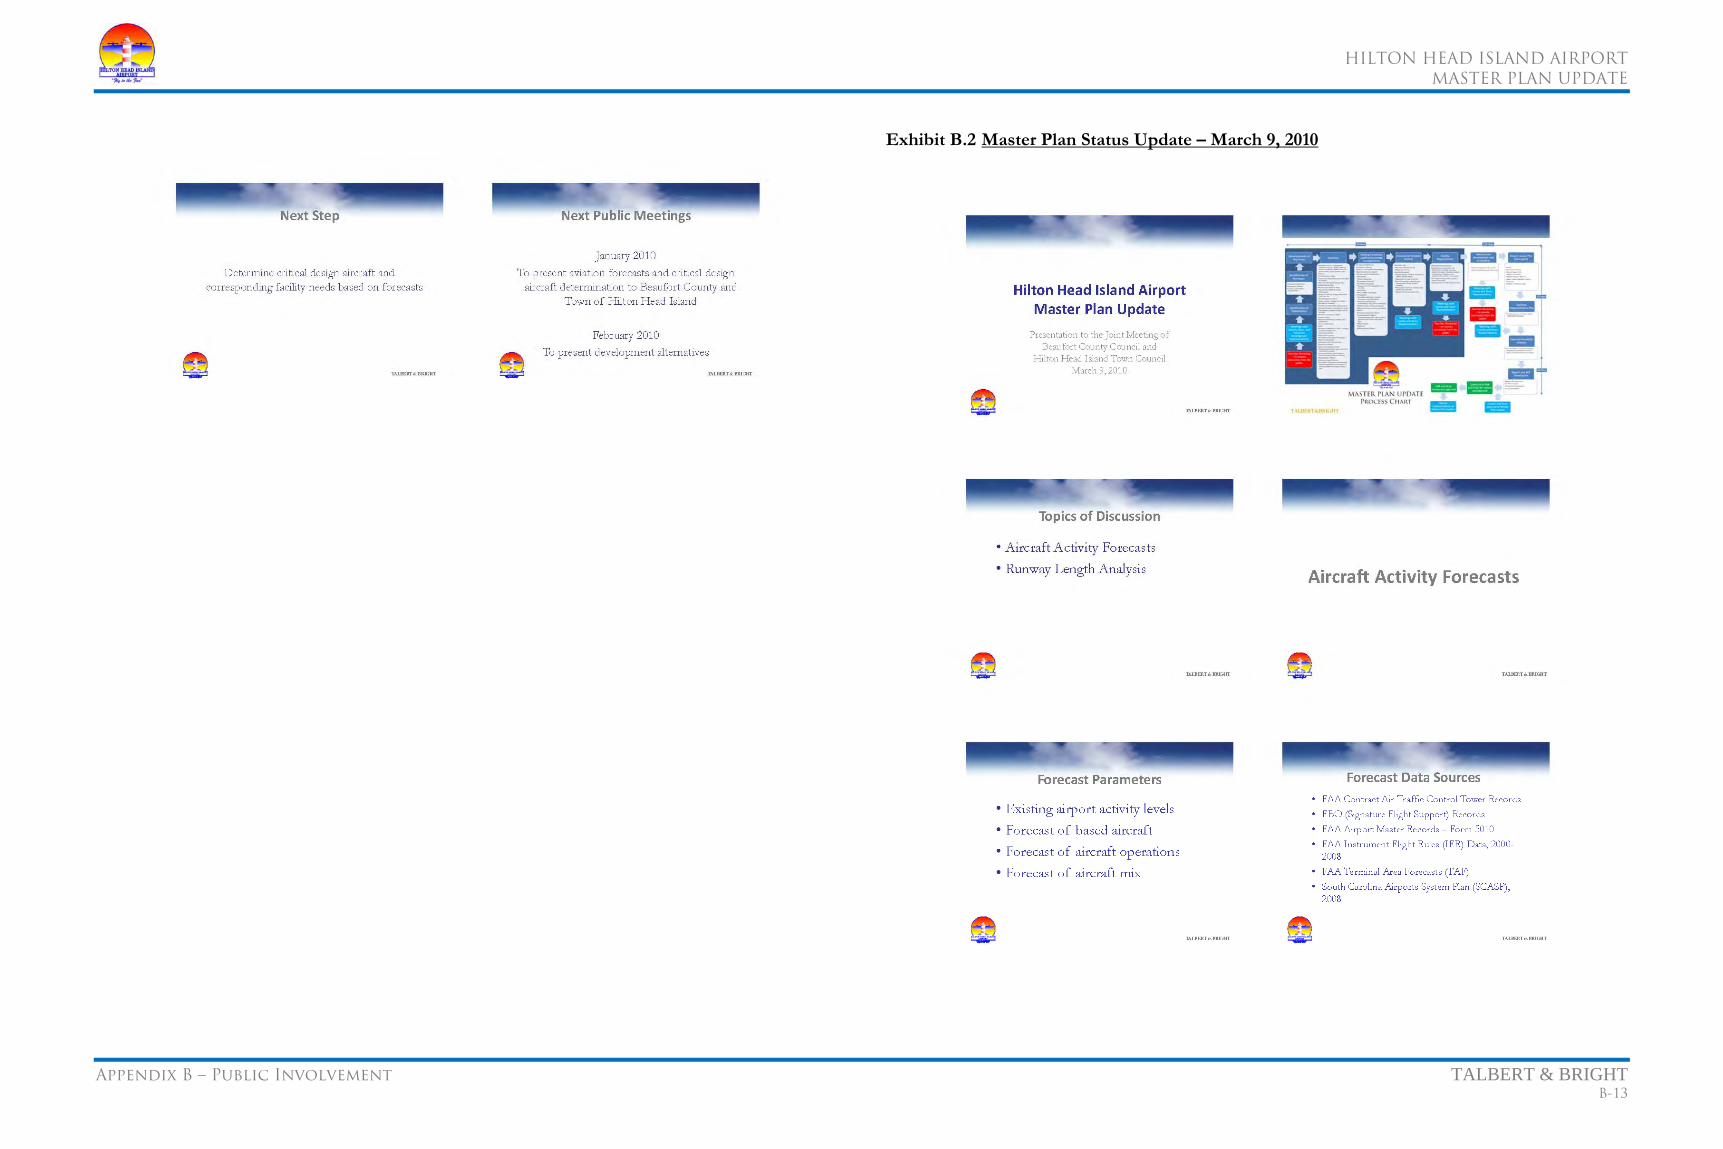
HILTON HEAD ISLAND AIRPORT
MASTER PLAN UPDATE
Appendix B – Public Involvement TALBERT & BRIGHT B-13
Exhibit B.2 Master Plan Status Update – March 9, 2010

HILTON HEAD ISLAND AIRPORT
MASTER PLAN UPDATE
Appendix B – Public Involvement TALBERT & BRIGHT B-14

HILTON HEAD ISLAND AIRPORT
MASTER PLAN UPDATE
Appendix B – Public Involvement TALBERT & BRIGHT B-15
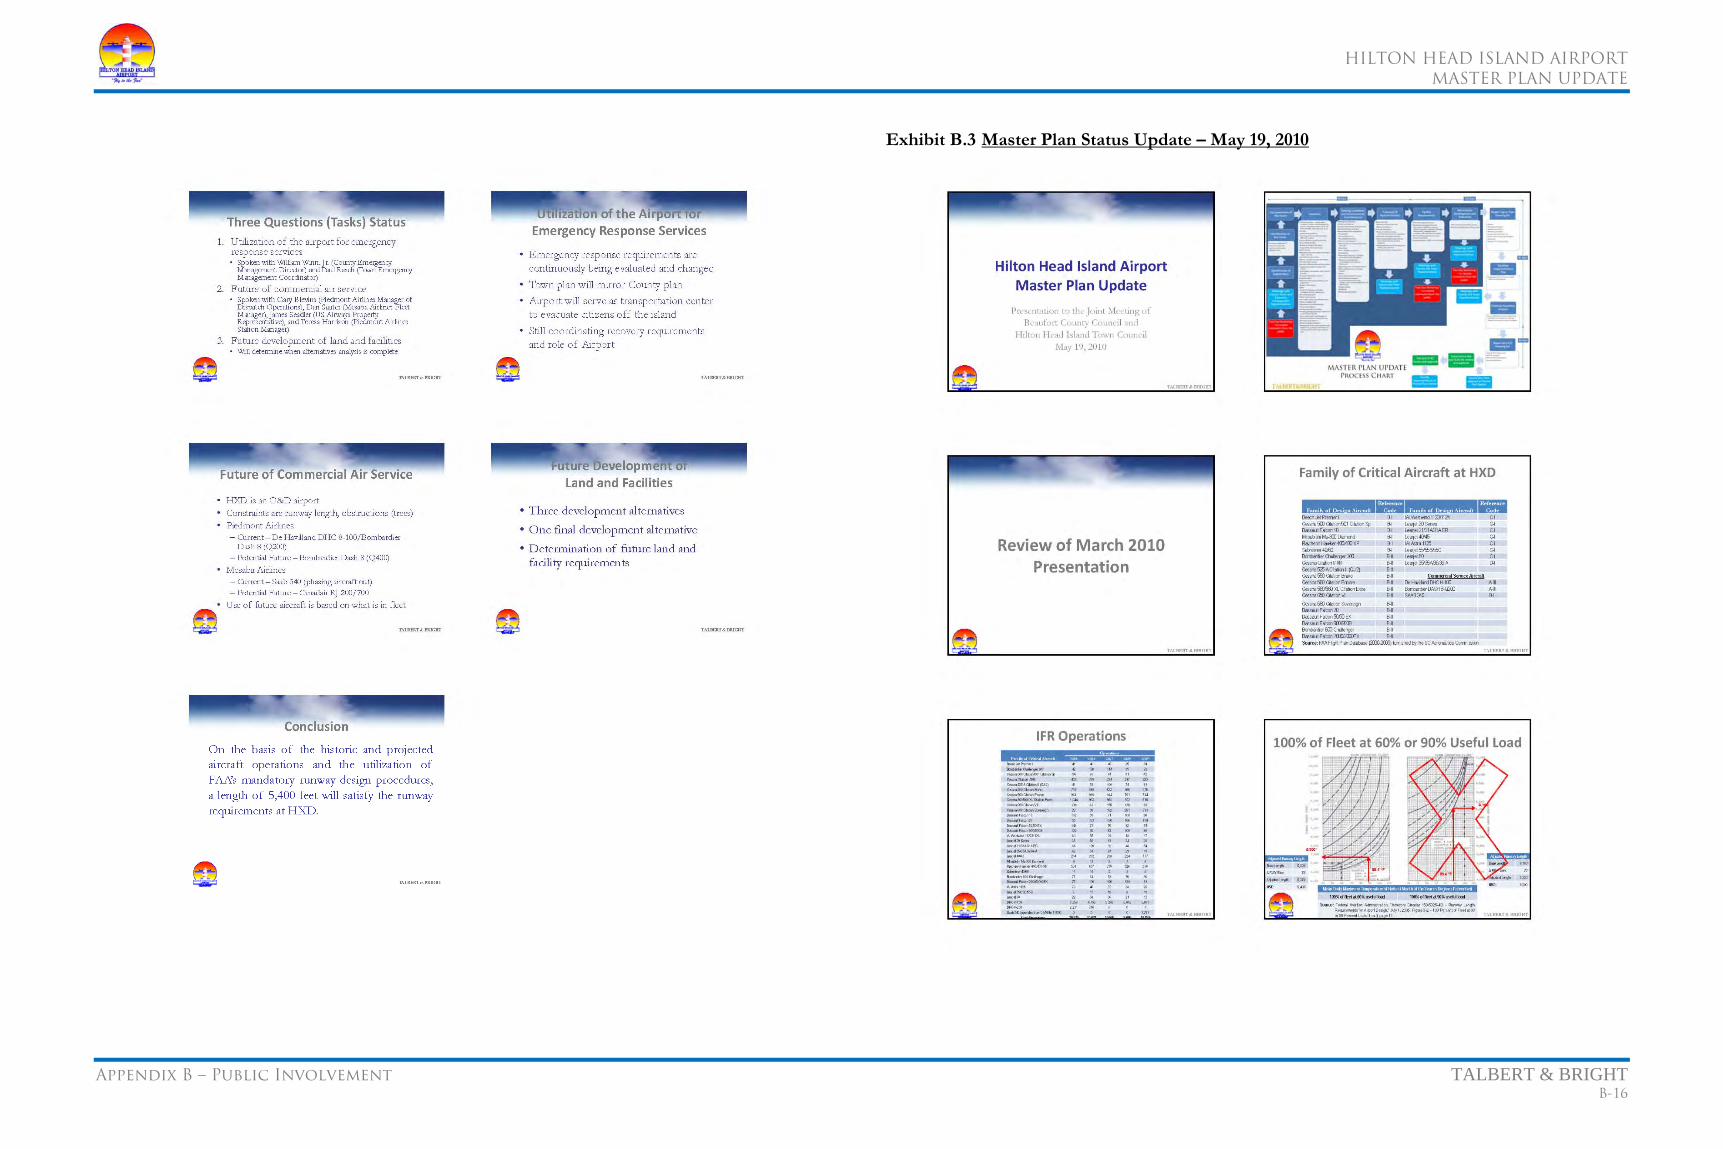
HILTON HEAD ISLAND AIRPORT
MASTER PLAN UPDATE
Appendix B – Public Involvement TALBERT & BRIGHT B-16
Exhibit B.3 Master Plan Status Update – May 19, 2010

HILTON HEAD ISLAND AIRPORT
MASTER PLAN UPDATE
Appendix B – Public Involvement TALBERT & BRIGHT B-17
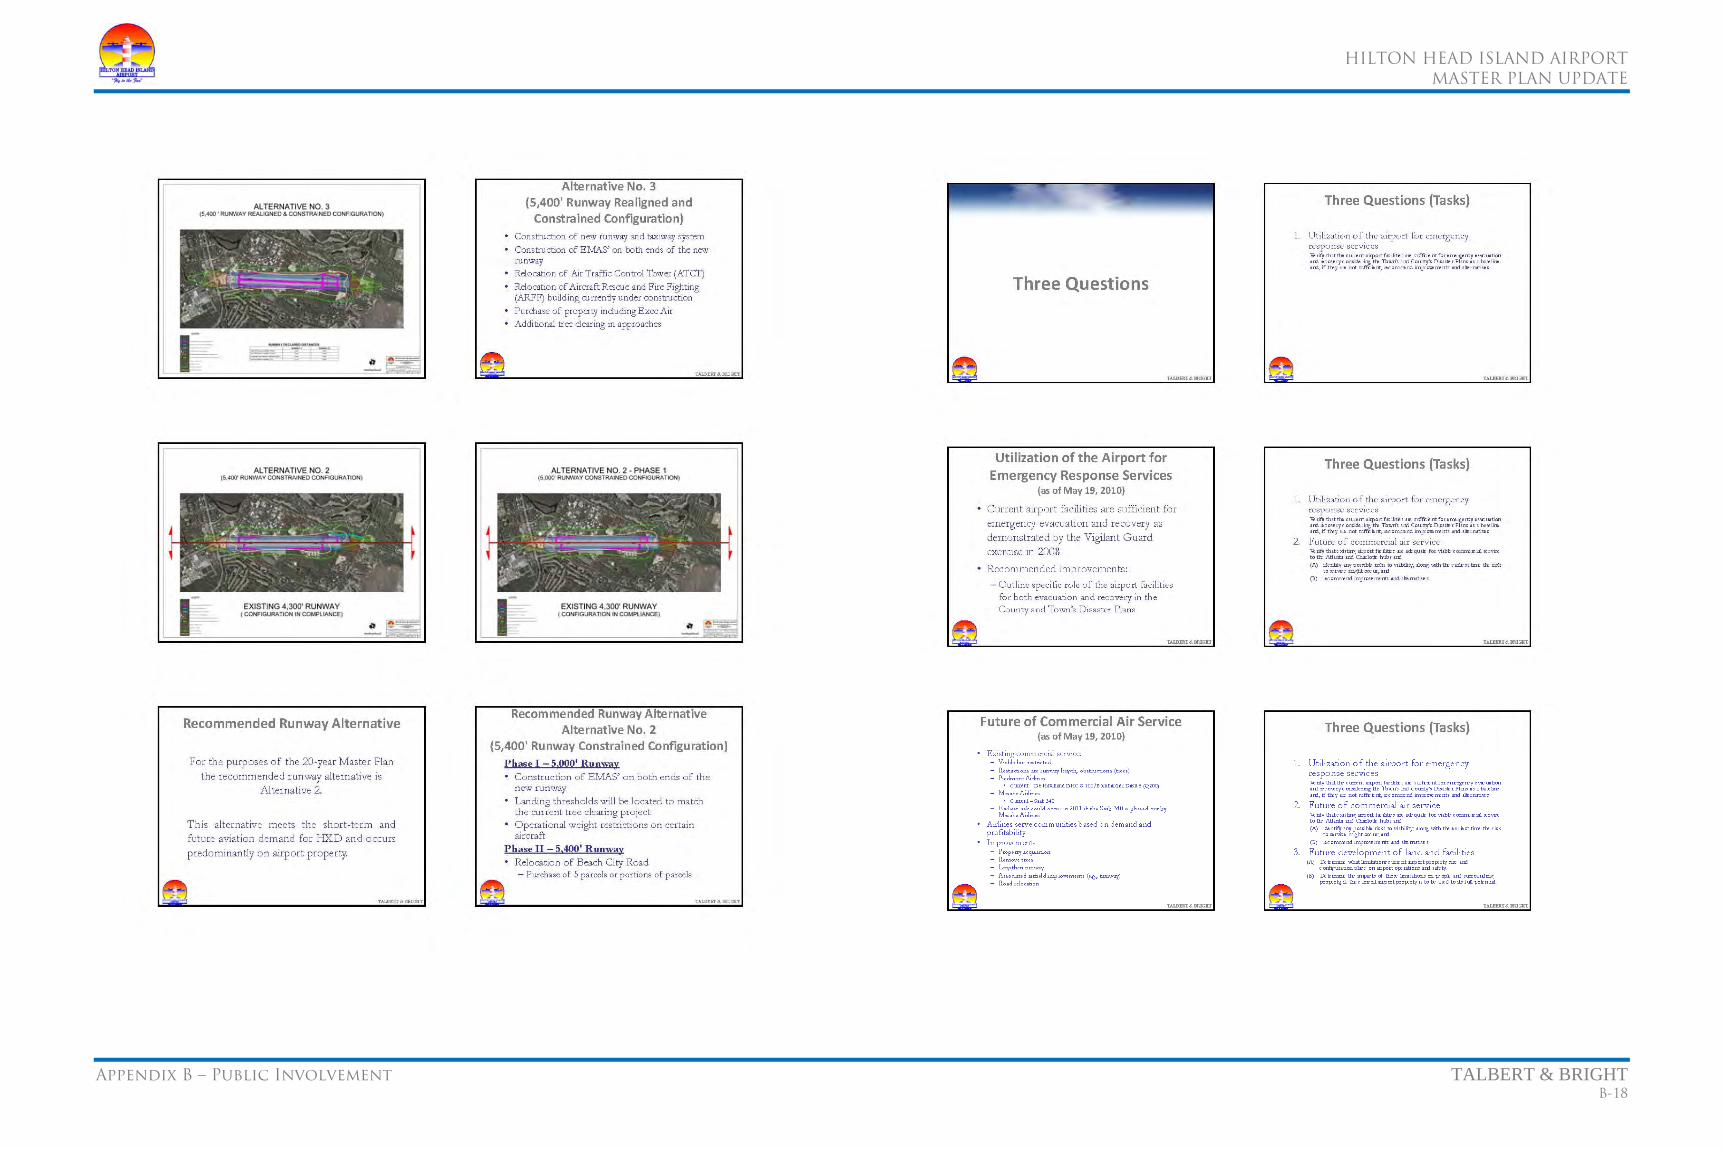
HILTON HEAD ISLAND AIRPORT
MASTER PLAN UPDATE
Appendix B – Public Involvement TALBERT & BRIGHT B-18
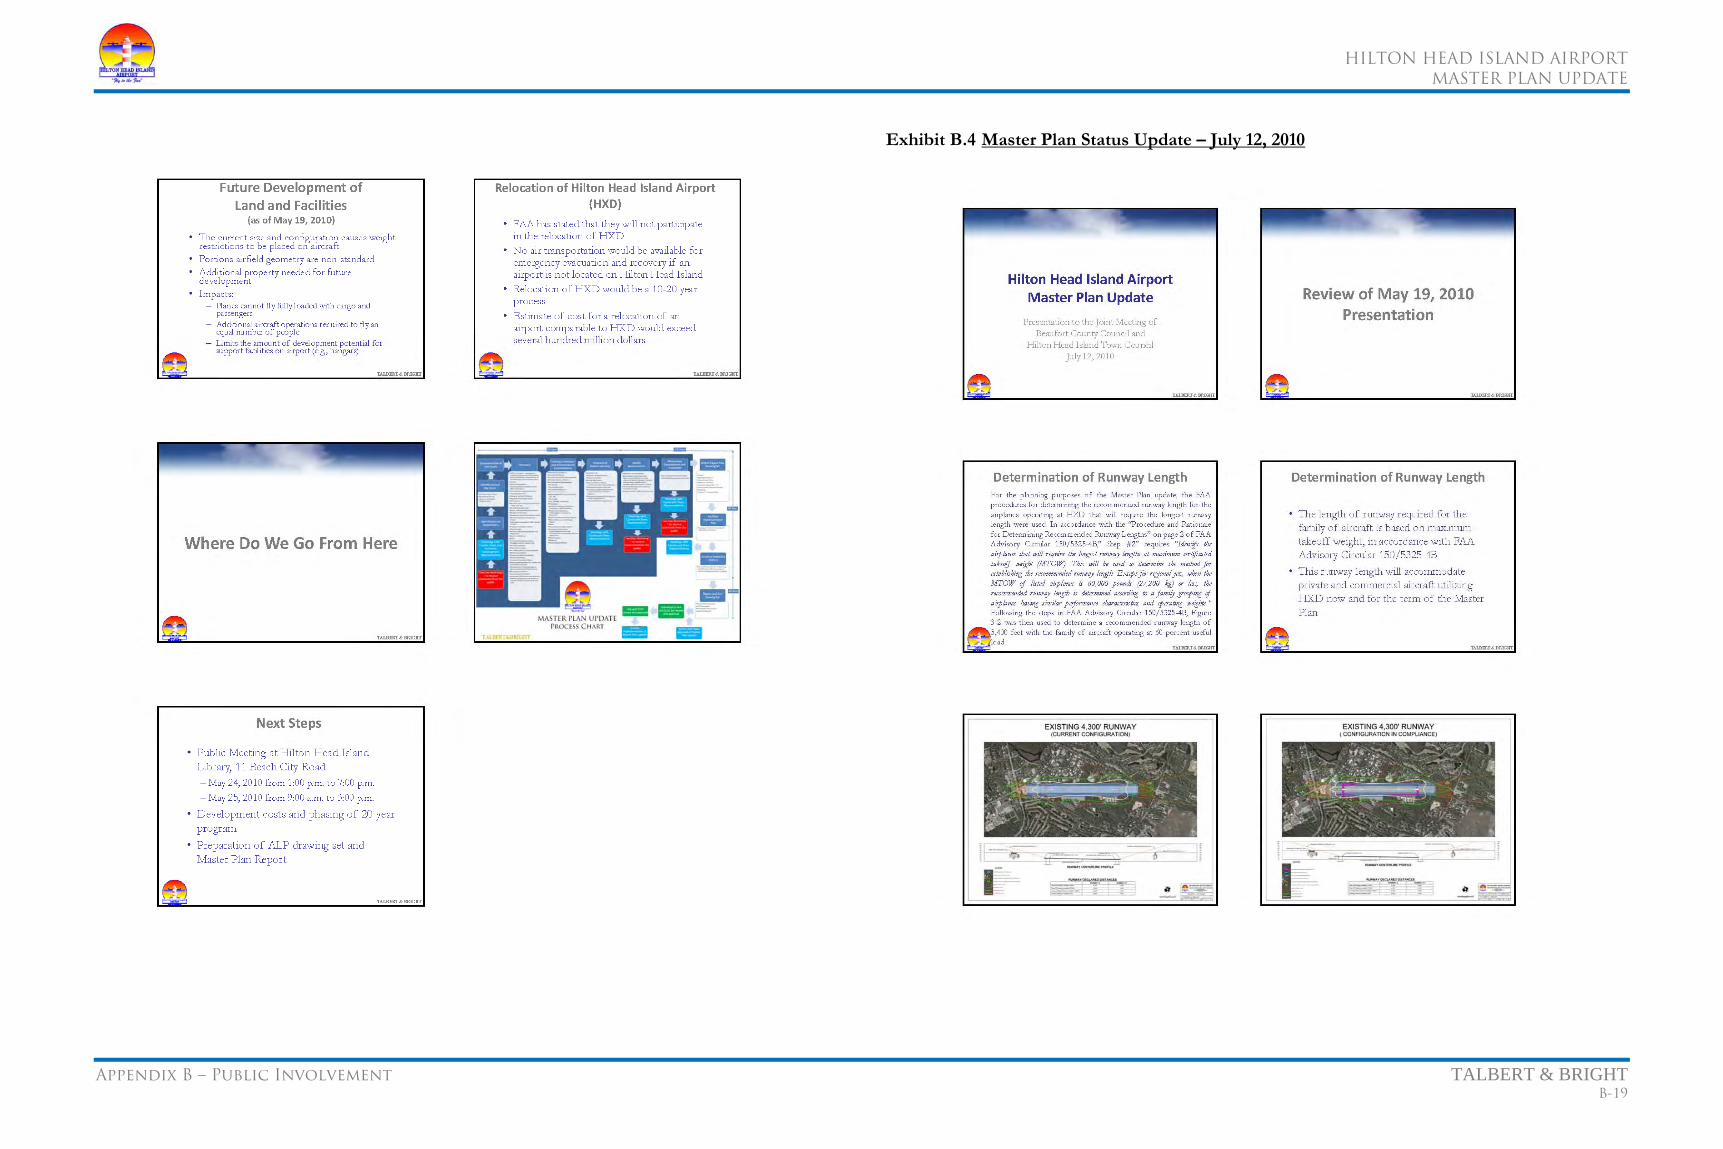
HILTON HEAD ISLAND AIRPORT
MASTER PLAN UPDATE
Appendix B – Public Involvement TALBERT & BRIGHT B-19
Exhibit B.4 Master Plan Status Update – July 12, 2010
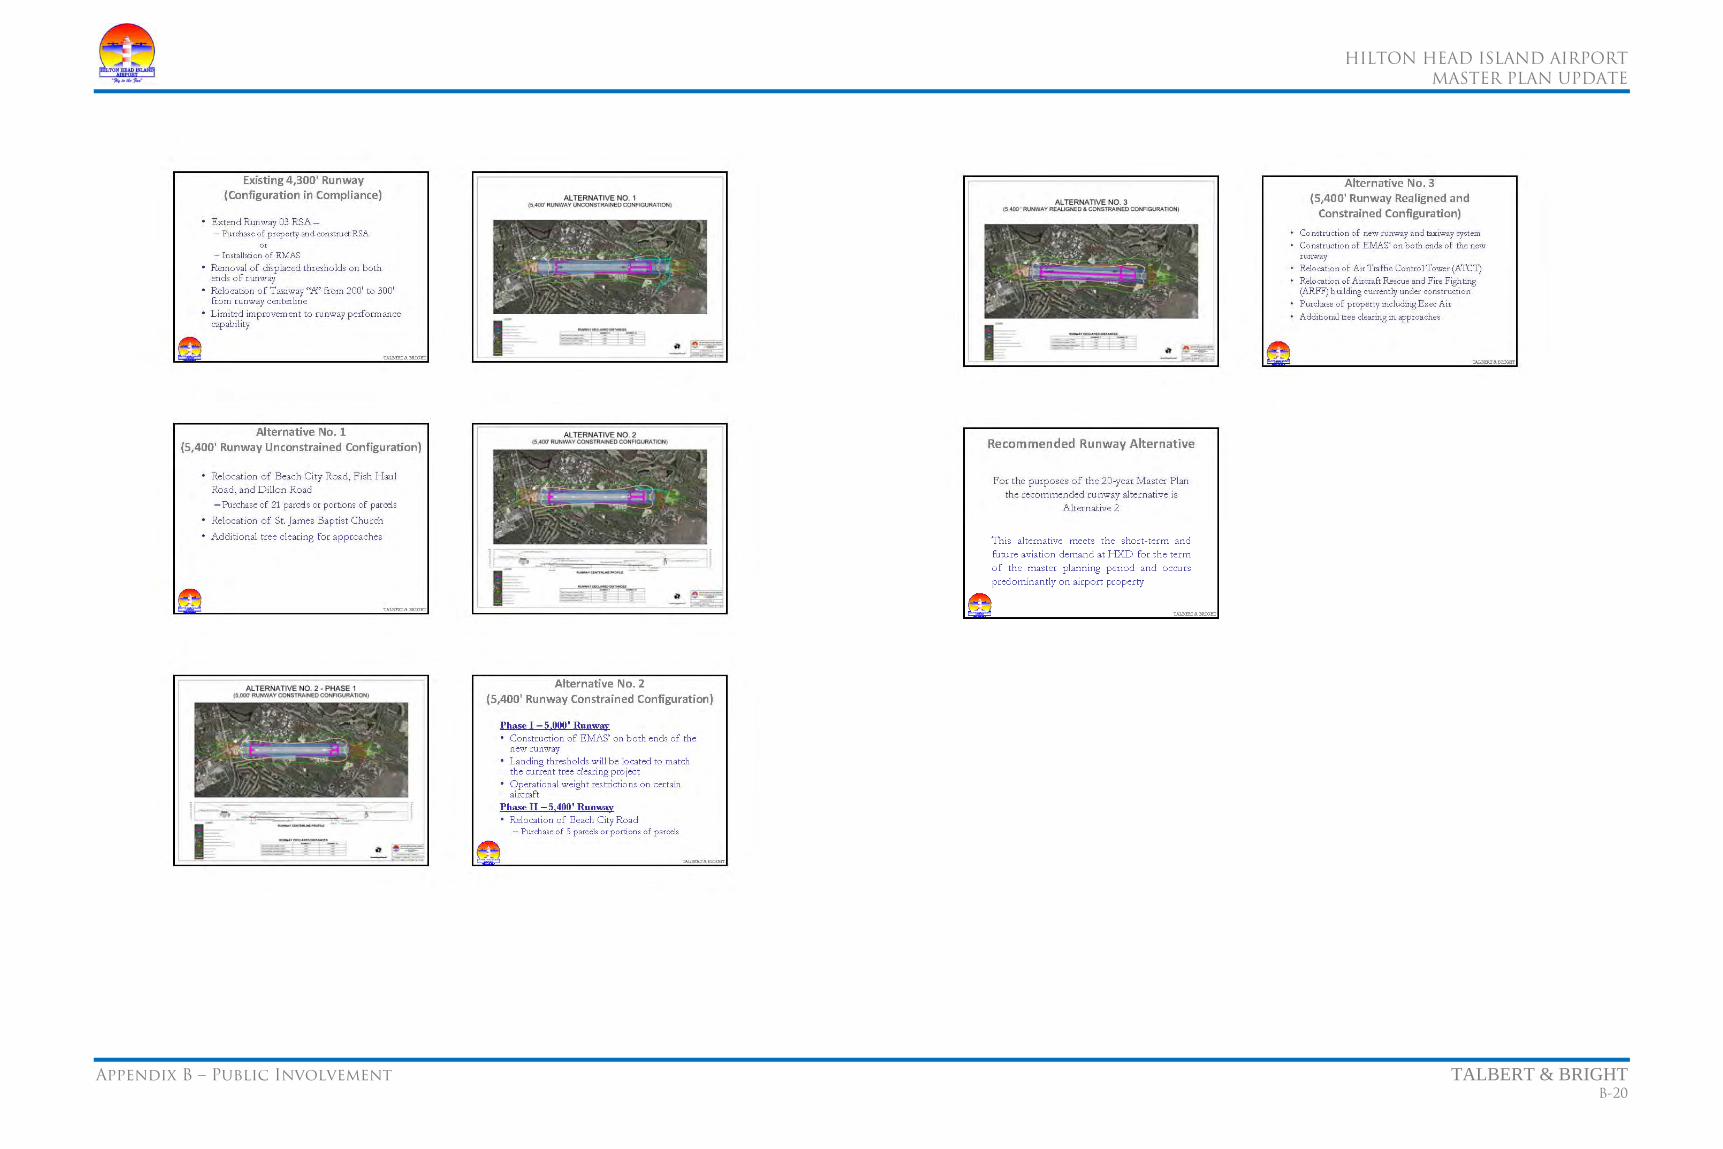
HILTON HEAD ISLAND AIRPORT
MASTER PLAN UPDATE
Appendix B – Public Involvement TALBERT & BRIGHT B-20
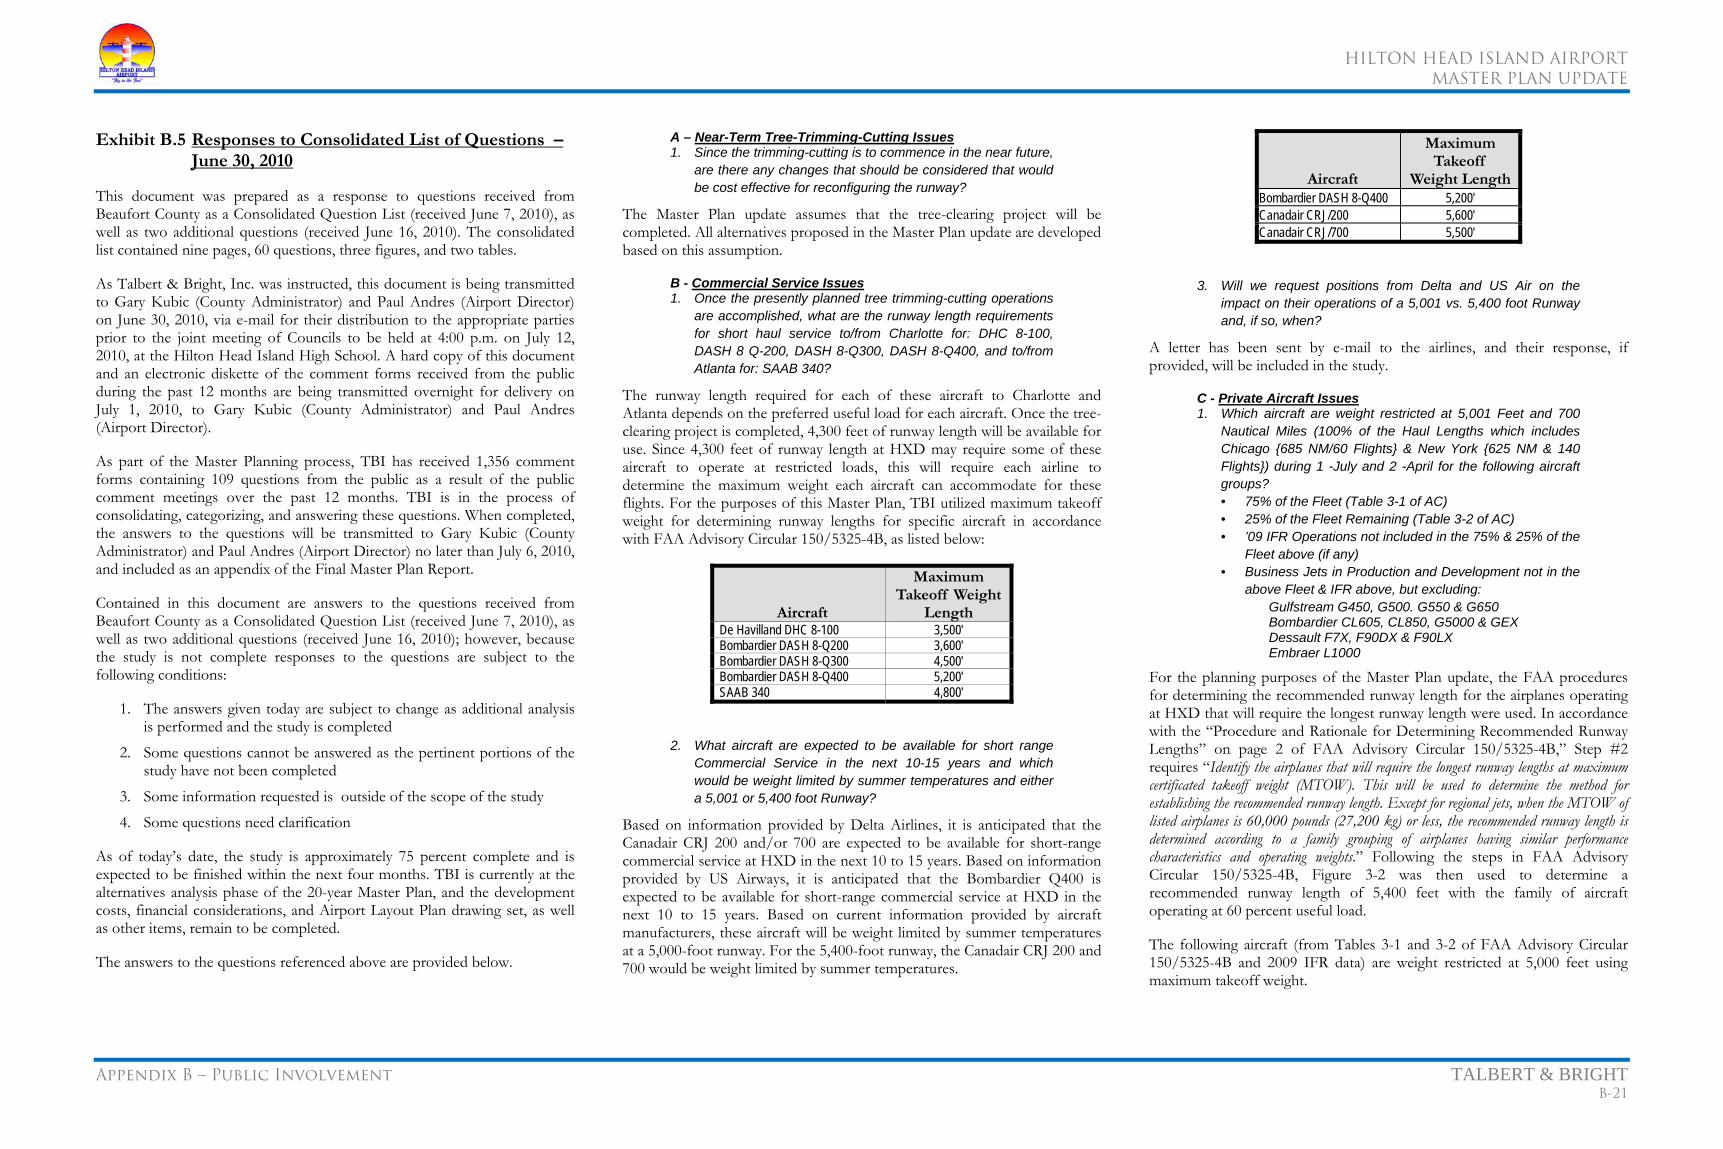
HILTON HEAD ISLAND AIRPORT
MASTER PLAN UPDATE
Appendix B – Public Involvement TALBERT & BRIGHT B-21
Exhibit B.5 Responses to Consolidated List of Questions – June 30, 2010
This document was prepared as a response to questions received from Beaufort County as a Consolidated Question List (received June 7, 2010), as well as two additional questions (received June 16, 2010). The consolidated list contained nine pages, 60 questions, three figures, and two tables.
As Talbert & Bright, Inc. was instructed, this document is being transmitted to Gary Kubic (County Administrator) and Paul Andres (Airport Director) on June 30, 2010, via e-mail for their distribution to the appropriate parties prior to the joint meeting of Councils to be held at 4:00 p.m. on July 12, 2010, at the Hilton Head Island High School. A hard copy of this document and an electronic diskette of the comment forms received from the public during the past 12 months are being transmitted overnight for delivery on July 1, 2010, to Gary Kubic (County Administrator) and Paul Andres (Airport Director).
As part of the Master Planning process, TBI has received 1,356 comment forms containing 109 questions from the public as a result of the public comment meetings over the past 12 months. TBI is in the process of consolidating, categorizing, and answering these questions. When completed, the answers to the questions will be transmitted to Gary Kubic (County Administrator) and Paul Andres (Airport Director) no later than July 6, 2010, and included as an appendix of the Final Master Plan Report.
Contained in this document are answers to the questions received from Beaufort County as a Consolidated Question List (received June 7, 2010), as well as two additional questions (received June 16, 2010); however, because the study is not complete responses to the questions are subject to the following conditions:
1. The answers given today are subject to change as additional analysis is performed and the study is completed
2. Some questions cannot be answered as the pertinent portions of the study have not been completed
3. Some information requested is outside of the scope of the study
4. Some questions need clarification
As of today’s date, the study is approximately 75 percent complete and is expected to be finished within the next four months. TBI is currently at the alternatives analysis phase of the 20-year Master Plan, and the development costs, financial considerations, and Airport Layout Plan drawing set, as well as other items, remain to be completed.
The answers to the questions referenced above are provided below.
A – Near-Term Tree-Trimming-Cutting Issues 1. Since the trimming-cutting is to commence in the near future,
are there any changes that should be considered that would be cost effective for reconfiguring the runway?
The Master Plan update assumes that the tree-clearing project will be completed. All alternatives proposed in the Master Plan update are developed based on this assumption.
B - Commercial Service Issues 1. Once the presently planned tree trimming-cutting operations
are accomplished, what are the runway length requirements for short haul service to/from Charlotte for: DHC 8-100, DASH 8 Q-200, DASH 8-Q300, DASH 8-Q400, and to/from Atlanta for: SAAB 340?
The runway length required for each of these aircraft to Charlotte and Atlanta depends on the preferred useful load for each aircraft. Once the tree-clearing project is completed, 4,300 feet of runway length will be available for use. Since 4,300 feet of runway length at HXD may require some of these aircraft to operate at restricted loads, this will require each airline to determine the maximum weight each aircraft can accommodate for these flights. For the purposes of this Master Plan, TBI utilized maximum takeoff weight for determining runway lengths for specific aircraft in accordance with FAA Advisory Circular 150/5325-4B, as listed below:
Aircraft
Maximum Takeoff Weight
Length De Havilland DHC 8-100 3,500′ Bombardier DASH 8-Q200 3,600′ Bombardier DASH 8-Q300 4,500′ Bombardier DASH 8-Q400 5,200′ SAAB 340 4,800′
2. What aircraft are expected to be available for short range Commercial Service in the next 10-15 years and which would be weight limited by summer temperatures and either a 5,001 or 5,400 foot Runway?
Based on information provided by Delta Airlines, it is anticipated that the Canadair CRJ 200 and/or 700 are expected to be available for short-range commercial service at HXD in the next 10 to 15 years. Based on information provided by US Airways, it is anticipated that the Bombardier Q400 is expected to be available for short-range commercial service at HXD in the next 10 to 15 years. Based on current information provided by aircraft manufacturers, these aircraft will be weight limited by summer temperatures at a 5,000-foot runway. For the 5,400-foot runway, the Canadair CRJ 200 and 700 would be weight limited by summer temperatures.
Aircraft
Maximum Takeoff
Weight LengthBombardier DASH 8-Q400 5,200′ Canadair CRJ/200 5,600′ Canadair CRJ/700 5,500′
3. Will we request positions from Delta and US Air on the impact on their operations of a 5,001 vs. 5,400 foot Runway and, if so, when?
A letter has been sent by e-mail to the airlines, and their response, if provided, will be included in the study.
C - Private Aircraft Issues 1. Which aircraft are weight restricted at 5,001 Feet and 700
Nautical Miles (100% of the Haul Lengths which includes Chicago {685 NM/60 Flights} & New York {625 NM & 140 Flights}) during 1 -July and 2 -April for the following aircraft groups? • 75% of the Fleet (Table 3-1 of AC) • 25% of the Fleet Remaining (Table 3-2 of AC) • ’09 IFR Operations not included in the 75% & 25% of the
Fleet above (if any) • Business Jets in Production and Development not in the
above Fleet & IFR above, but excluding: Gulfstream G450, G500. G550 & G650 Bombardier CL605, CL850, G5000 & GEX Dessault F7X, F90DX & F90LX Embraer L1000
For the planning purposes of the Master Plan update, the FAA procedures for determining the recommended runway length for the airplanes operating at HXD that will require the longest runway length were used. In accordance with the “Procedure and Rationale for Determining Recommended Runway Lengths” on page 2 of FAA Advisory Circular 150/5325-4B,” Step #2 requires “Identify the airplanes that will require the longest runway lengths at maximum certificated takeoff weight (MTOW). This will be used to determine the method for establishing the recommended runway length. Except for regional jets, when the MTOW of listed airplanes is 60,000 pounds (27,200 kg) or less, the recommended runway length is determined according to a family grouping of airplanes having similar performance characteristics and operating weights.” Following the steps in FAA Advisory Circular 150/5325-4B, Figure 3-2 was then used to determine a recommended runway length of 5,400 feet with the family of aircraft operating at 60 percent useful load.
The following aircraft (from Tables 3-1 and 3-2 of FAA Advisory Circular 150/5325-4B and 2009 IFR data) are weight restricted at 5,000 feet using maximum takeoff weight.
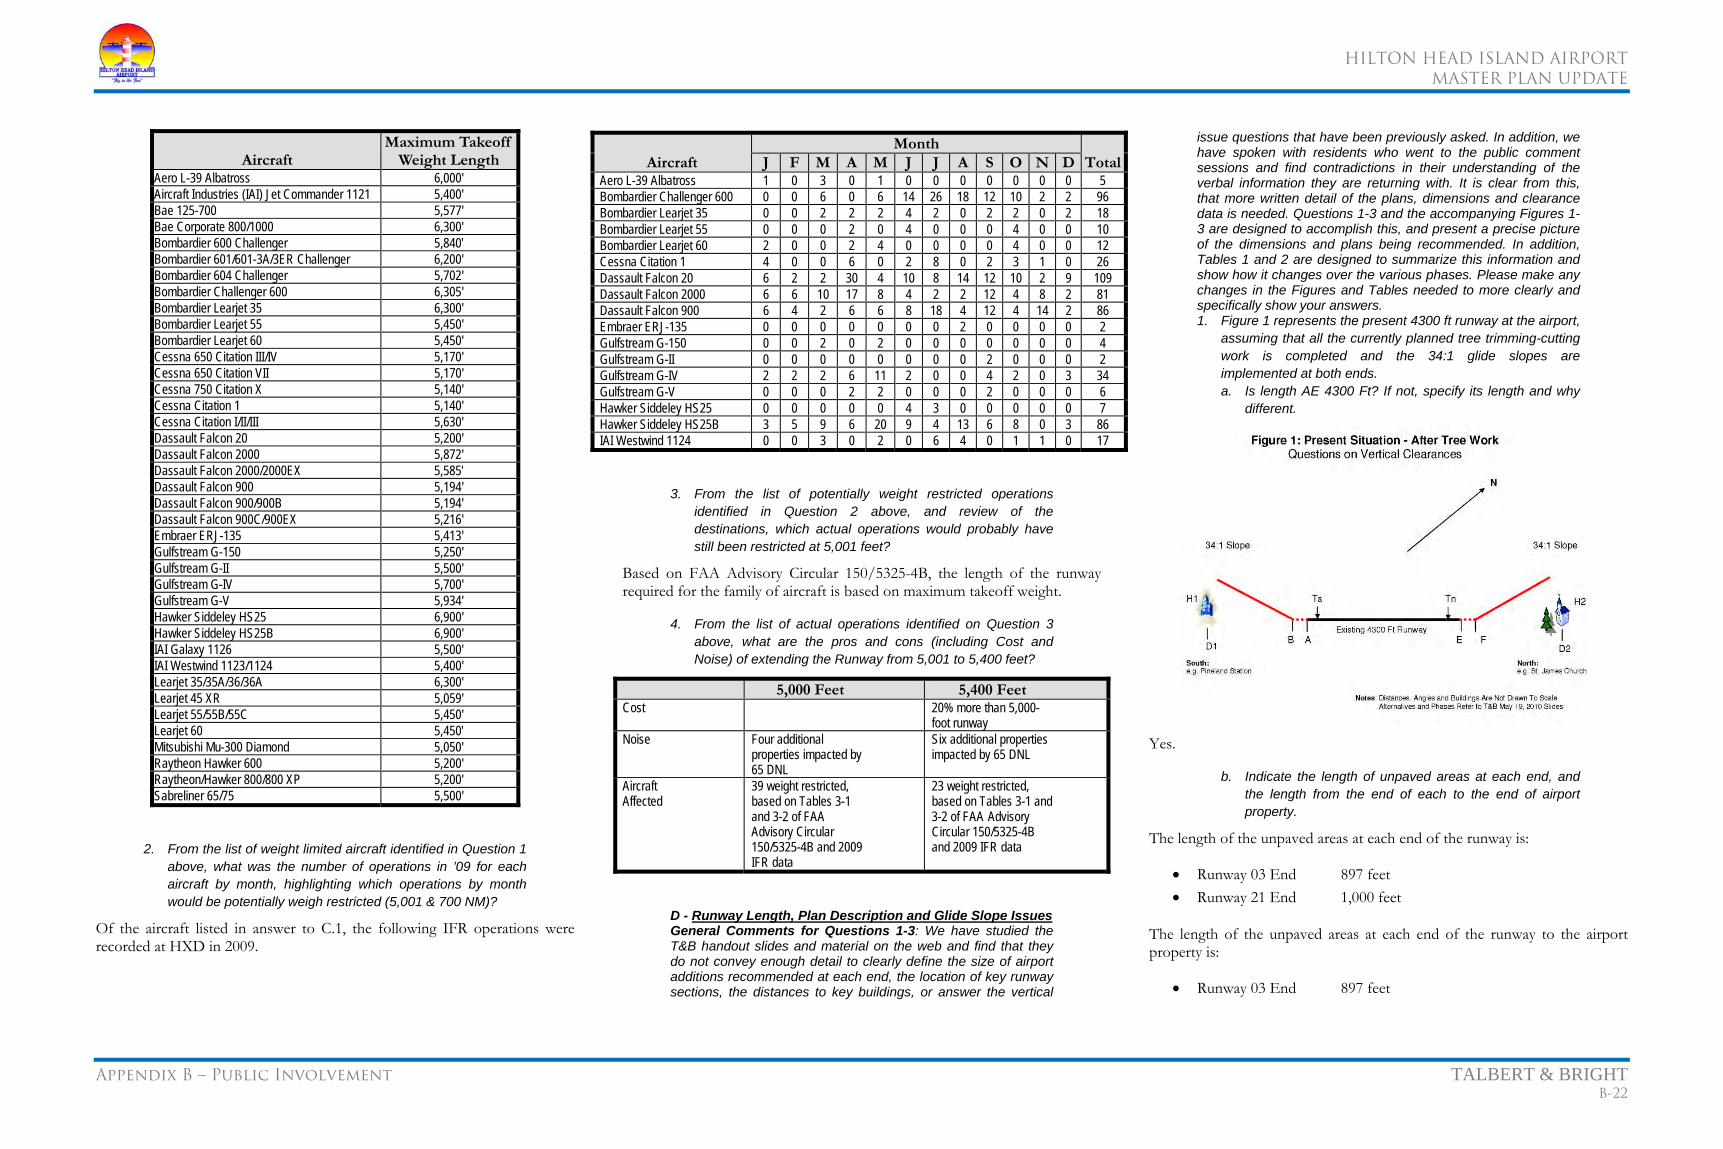
HILTON HEAD ISLAND AIRPORT
MASTER PLAN UPDATE
Appendix B – Public Involvement TALBERT & BRIGHT B-22
Aircraft Maximum Takeoff
Weight Length Aero L-39 Albatross 6,000' Aircraft Industries (IAI) Jet Commander 1121 5,400' Bae 125-700 5,577' Bae Corporate 800/1000 6,300' Bombardier 600 Challenger 5,840′ Bombardier 601/601-3A/3ER Challenger 6,200' Bombardier 604 Challenger 5,702' Bombardier Challenger 600 6,305' Bombardier Learjet 35 6,300' Bombardier Learjet 55 5,450' Bombardier Learjet 60 5,450' Cessna 650 Citation III/IV 5,170' Cessna 650 Citation VII 5,170' Cessna 750 Citation X 5,140' Cessna Citation 1 5,140' Cessna Citation I/II/III 5,630' Dassault Falcon 20 5,200' Dassault Falcon 2000 5,872' Dassault Falcon 2000/2000EX 5,585′ Dassault Falcon 900 5,194' Dassault Falcon 900/900B 5,194' Dassault Falcon 900C/900EX 5,216' Embraer ERJ-135 5,413' Gulfstream G-150 5,250' Gulfstream G-II 5,500' Gulfstream G-IV 5,700' Gulfstream G-V 5,934' Hawker Siddeley HS25 6,900' Hawker Siddeley HS25B 6,900' IAI Galaxy 1126 5,500' IAI Westwind 1123/1124 5,400' Learjet 35/35A/36/36A 6,300' Learjet 45 XR 5,059' Learjet 55/55B/55C 5,450' Learjet 60 5,450′ Mitsubishi Mu-300 Diamond 5,050' Raytheon Hawker 600 5,200' Raytheon/Hawker 800/800 XP 5,200' Sabreliner 65/75 5,500'
2. From the list of weight limited aircraft identified in Question 1 above, what was the number of operations in ’09 for each aircraft by month, highlighting which operations by month would be potentially weigh restricted (5,001 & 700 NM)?
Of the aircraft listed in answer to C.1, the following IFR operations were recorded at HXD in 2009.
3. From the list of potentially weight restricted operations identified in Question 2 above, and review of the destinations, which actual operations would probably have still been restricted at 5,001 feet?
Based on FAA Advisory Circular 150/5325-4B, the length of the runway required for the family of aircraft is based on maximum takeoff weight.
4. From the list of actual operations identified on Question 3 above, what are the pros and cons (including Cost and Noise) of extending the Runway from 5,001 to 5,400 feet?
5,000 Feet 5,400 Feet Cost 20% more than 5,000-
foot runway Noise Four additional
properties impacted by 65 DNL
Six additional properties impacted by 65 DNL
Aircraft Affected
39 weight restricted, based on Tables 3-1 and 3-2 of FAA Advisory Circular 150/5325-4B and 2009 IFR data
23 weight restricted, based on Tables 3-1 and 3-2 of FAA Advisory Circular 150/5325-4B and 2009 IFR data
D - Runway Length, Plan Description and Glide Slope Issues General Comments for Questions 1-3: We have studied the T&B handout slides and material on the web and find that they do not convey enough detail to clearly define the size of airport additions recommended at each end, the location of key runway sections, the distances to key buildings, or answer the vertical
issue questions that have been previously asked. In addition, we have spoken with residents who went to the public comment sessions and find contradictions in their understanding of the verbal information they are returning with. It is clear from this, that more written detail of the plans, dimensions and clearance data is needed. Questions 1-3 and the accompanying Figures 1-3 are designed to accomplish this, and present a precise picture of the dimensions and plans being recommended. In addition, Tables 1 and 2 are designed to summarize this information and show how it changes over the various phases. Please make any changes in the Figures and Tables needed to more clearly and specifically show your answers. 1. Figure 1 represents the present 4300 ft runway at the airport,
assuming that all the currently planned tree trimming-cutting work is completed and the 34:1 glide slopes are implemented at both ends. a. Is length AE 4300 Ft? If not, specify its length and why
different.
Yes.
b. Indicate the length of unpaved areas at each end, and the length from the end of each to the end of airport property.
The length of the unpaved areas at each end of the runway is:
• Runway 03 End 897 feet • Runway 21 End 1,000 feet
The length of the unpaved areas at each end of the runway to the airport property is:
• Runway 03 End 897 feet
Aircraft Month
TotalJ F M A M J J A S O N DAero L-39 Albatross 1 0 3 0 1 0 0 0 0 0 0 0 5 Bombardier Challenger 600 0 0 6 0 6 14 26 18 12 10 2 2 96 Bombardier Learjet 35 0 0 2 2 2 4 2 0 2 2 0 2 18 Bombardier Learjet 55 0 0 0 2 0 4 0 0 0 4 0 0 10 Bombardier Learjet 60 2 0 0 2 4 0 0 0 0 4 0 0 12 Cessna Citation 1 4 0 0 6 0 2 8 0 2 3 1 0 26 Dassault Falcon 20 6 2 2 30 4 10 8 14 12 10 2 9 109 Dassault Falcon 2000 6 6 10 17 8 4 2 2 12 4 8 2 81 Dassault Falcon 900 6 4 2 6 6 8 18 4 12 4 14 2 86 Embraer ERJ-135 0 0 0 0 0 0 0 2 0 0 0 0 2 Gulfstream G-150 0 0 2 0 2 0 0 0 0 0 0 0 4 Gulfstream G-II 0 0 0 0 0 0 0 0 2 0 0 0 2 Gulfstream G-IV 2 2 2 6 11 2 0 0 4 2 0 3 34 Gulfstream G-V 0 0 0 2 2 0 0 0 2 0 0 0 6 Hawker Siddeley HS25 0 0 0 0 0 4 3 0 0 0 0 0 7 Hawker Siddeley HS25B 3 5 9 6 20 9 4 13 6 8 0 3 86 IAI Westwind 1124 0 0 3 0 2 0 6 4 0 1 1 0 17
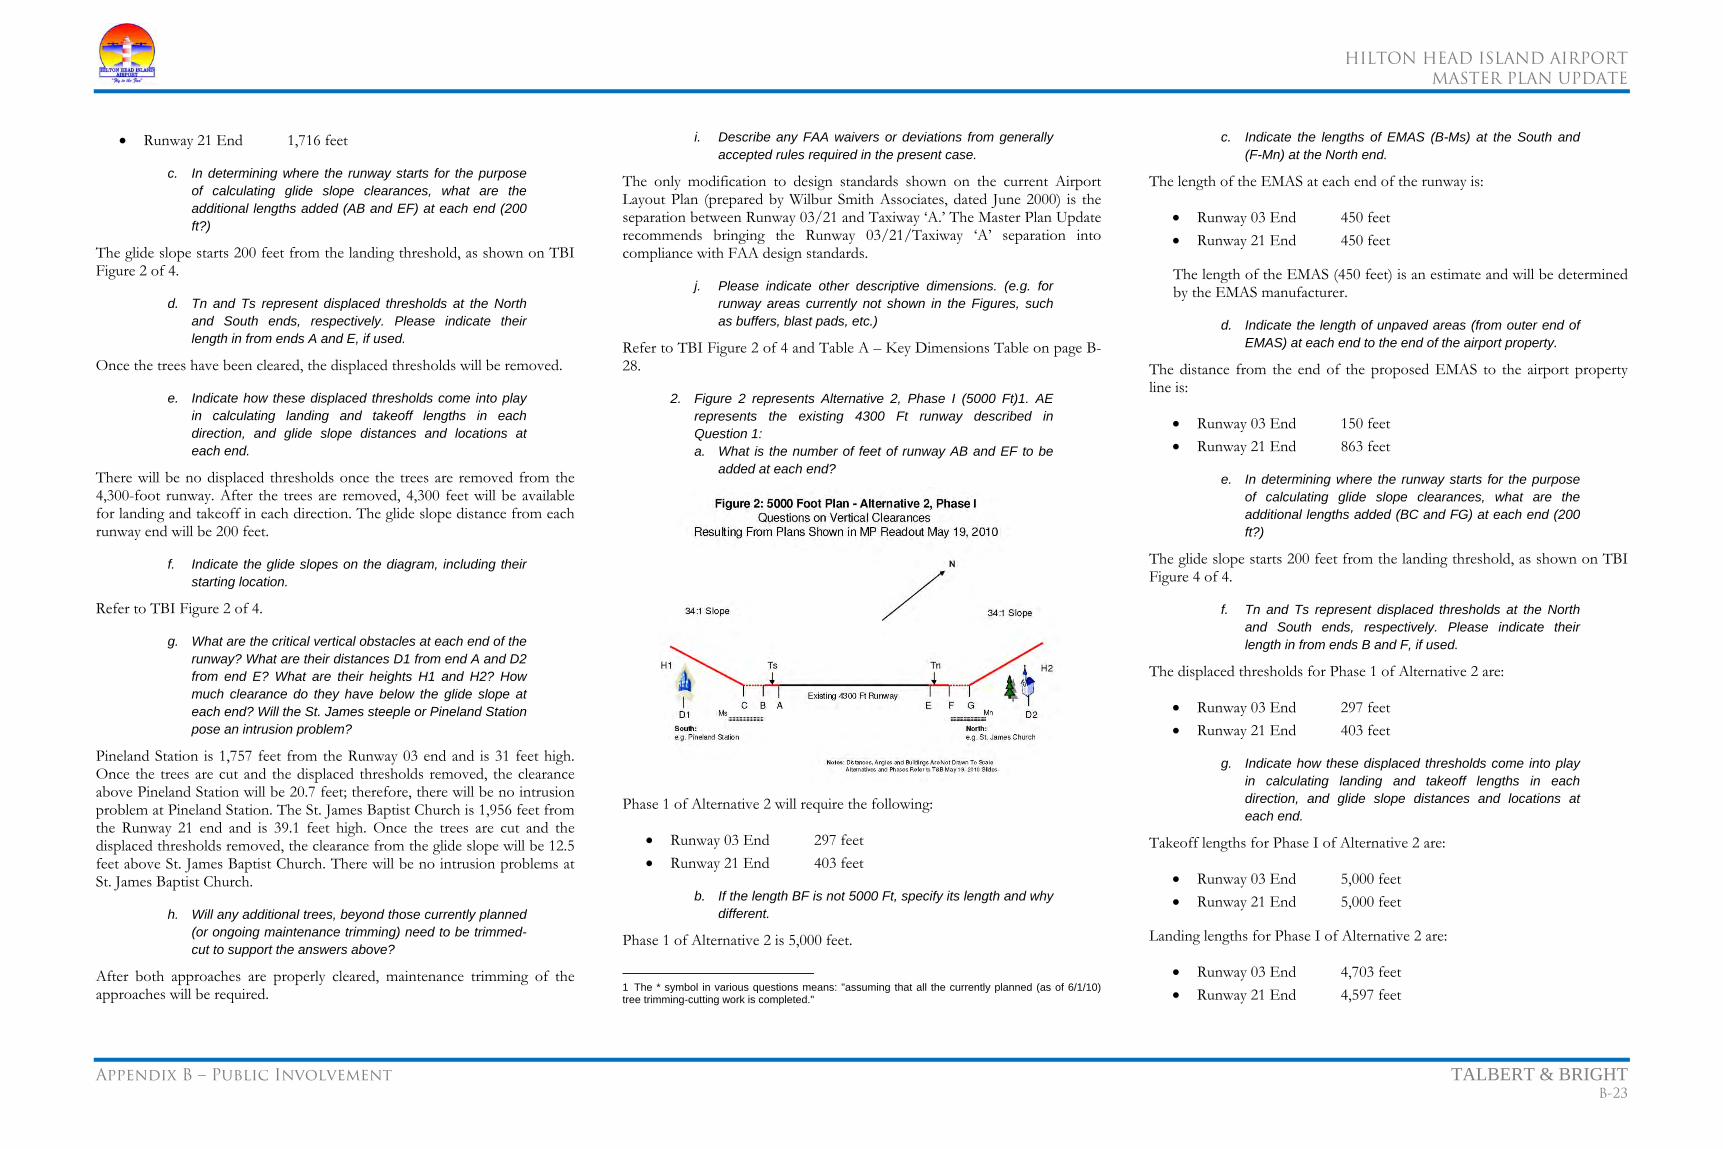
HILTON HEAD ISLAND AIRPORT
MASTER PLAN UPDATE
Appendix B – Public Involvement TALBERT & BRIGHT B-23
• Runway 21 End 1,716 feet
c. In determining where the runway starts for the purpose of calculating glide slope clearances, what are the additional lengths added (AB and EF) at each end (200 ft?)
The glide slope starts 200 feet from the landing threshold, as shown on TBI Figure 2 of 4.
d. Tn and Ts represent displaced thresholds at the North and South ends, respectively. Please indicate their length in from ends A and E, if used.
Once the trees have been cleared, the displaced thresholds will be removed.
e. Indicate how these displaced thresholds come into play in calculating landing and takeoff lengths in each direction, and glide slope distances and locations at each end.
There will be no displaced thresholds once the trees are removed from the 4,300-foot runway. After the trees are removed, 4,300 feet will be available for landing and takeoff in each direction. The glide slope distance from each runway end will be 200 feet.
f. Indicate the glide slopes on the diagram, including their starting location.
Refer to TBI Figure 2 of 4.
g. What are the critical vertical obstacles at each end of the runway? What are their distances D1 from end A and D2 from end E? What are their heights H1 and H2? How much clearance do they have below the glide slope at each end? Will the St. James steeple or Pineland Station pose an intrusion problem?
Pineland Station is 1,757 feet from the Runway 03 end and is 31 feet high. Once the trees are cut and the displaced thresholds removed, the clearance above Pineland Station will be 20.7 feet; therefore, there will be no intrusion problem at Pineland Station. The St. James Baptist Church is 1,956 feet from the Runway 21 end and is 39.1 feet high. Once the trees are cut and the displaced thresholds removed, the clearance from the glide slope will be 12.5 feet above St. James Baptist Church. There will be no intrusion problems at St. James Baptist Church.
h. Will any additional trees, beyond those currently planned (or ongoing maintenance trimming) need to be trimmed-cut to support the answers above?
After both approaches are properly cleared, maintenance trimming of the approaches will be required.
i. Describe any FAA waivers or deviations from generally accepted rules required in the present case.
The only modification to design standards shown on the current Airport Layout Plan (prepared by Wilbur Smith Associates, dated June 2000) is the separation between Runway 03/21 and Taxiway ‘A.’ The Master Plan Update recommends bringing the Runway 03/21/Taxiway ‘A’ separation into compliance with FAA design standards.
j. Please indicate other descriptive dimensions. (e.g. for runway areas currently not shown in the Figures, such as buffers, blast pads, etc.)
Refer to TBI Figure 2 of 4 and Table A – Key Dimensions Table on page B-28.
2. Figure 2 represents Alternative 2, Phase I (5000 Ft)1. AE represents the existing 4300 Ft runway described in Question 1: a. What is the number of feet of runway AB and EF to be
added at each end?
Phase 1 of Alternative 2 will require the following:
• Runway 03 End 297 feet • Runway 21 End 403 feet
b. If the length BF is not 5000 Ft, specify its length and why different.
Phase 1 of Alternative 2 is 5,000 feet.
1
The * symbol in various questions means: "assuming that all the currently planned (as of 6/1/10) tree trimming-cutting work is completed."
c. Indicate the lengths of EMAS (B-Ms) at the South and (F-Mn) at the North end.
The length of the EMAS at each end of the runway is:
• Runway 03 End 450 feet • Runway 21 End 450 feet
The length of the EMAS (450 feet) is an estimate and will be determined by the EMAS manufacturer.
d. Indicate the length of unpaved areas (from outer end of EMAS) at each end to the end of the airport property.
The distance from the end of the proposed EMAS to the airport property line is:
• Runway 03 End 150 feet • Runway 21 End 863 feet
e. In determining where the runway starts for the purpose of calculating glide slope clearances, what are the additional lengths added (BC and FG) at each end (200 ft?)
The glide slope starts 200 feet from the landing threshold, as shown on TBI Figure 4 of 4.
f. Tn and Ts represent displaced thresholds at the North and South ends, respectively. Please indicate their length in from ends B and F, if used.
The displaced thresholds for Phase 1 of Alternative 2 are:
• Runway 03 End 297 feet • Runway 21 End 403 feet
g. Indicate how these displaced thresholds come into play in calculating landing and takeoff lengths in each direction, and glide slope distances and locations at each end.
Takeoff lengths for Phase I of Alternative 2 are:
• Runway 03 End 5,000 feet • Runway 21 End 5,000 feet
Landing lengths for Phase I of Alternative 2 are:
• Runway 03 End 4,703 feet • Runway 21 End 4,597 feet
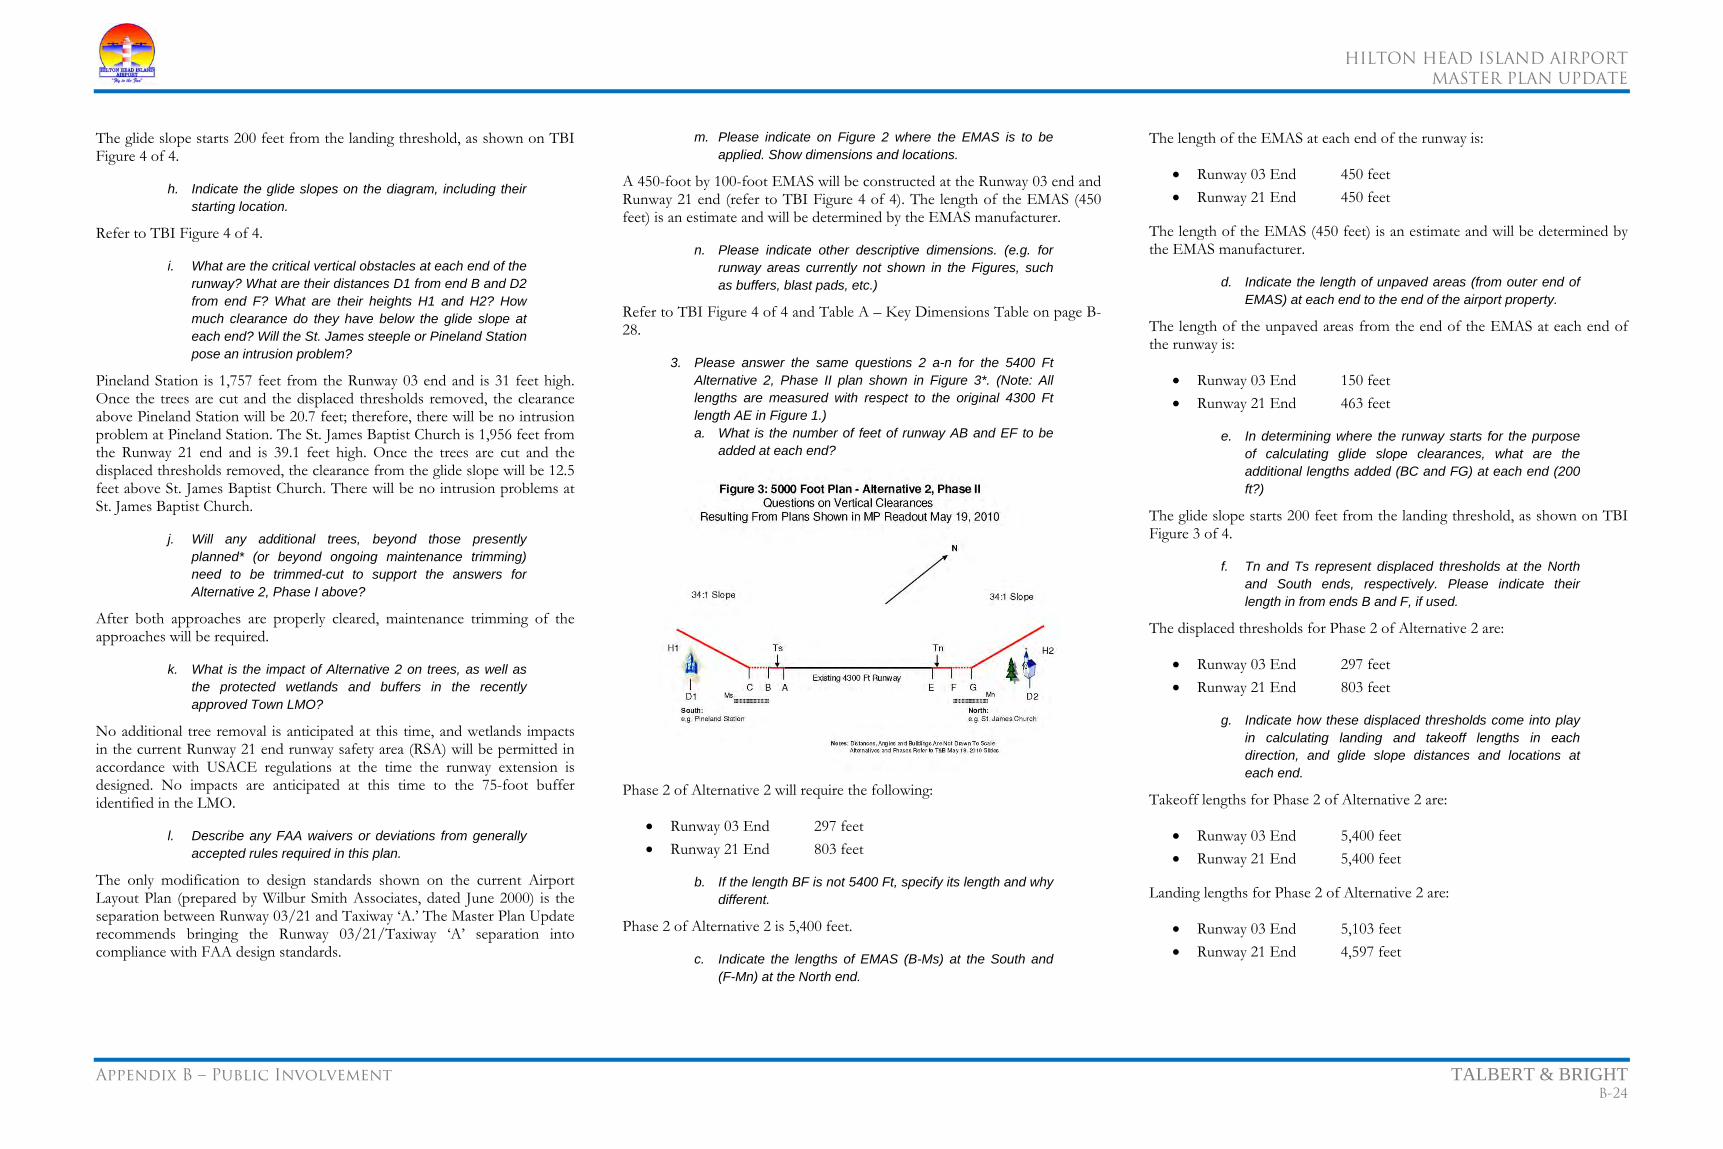
HILTON HEAD ISLAND AIRPORT
MASTER PLAN UPDATE
Appendix B – Public Involvement TALBERT & BRIGHT B-24
The glide slope starts 200 feet from the landing threshold, as shown on TBI Figure 4 of 4.
h. Indicate the glide slopes on the diagram, including their starting location.
Refer to TBI Figure 4 of 4.
i. What are the critical vertical obstacles at each end of the runway? What are their distances D1 from end B and D2 from end F? What are their heights H1 and H2? How much clearance do they have below the glide slope at each end? Will the St. James steeple or Pineland Station pose an intrusion problem?
Pineland Station is 1,757 feet from the Runway 03 end and is 31 feet high. Once the trees are cut and the displaced thresholds removed, the clearance above Pineland Station will be 20.7 feet; therefore, there will be no intrusion problem at Pineland Station. The St. James Baptist Church is 1,956 feet from the Runway 21 end and is 39.1 feet high. Once the trees are cut and the displaced thresholds removed, the clearance from the glide slope will be 12.5 feet above St. James Baptist Church. There will be no intrusion problems at St. James Baptist Church.
j. Will any additional trees, beyond those presently planned* (or beyond ongoing maintenance trimming) need to be trimmed-cut to support the answers for Alternative 2, Phase I above?
After both approaches are properly cleared, maintenance trimming of the approaches will be required.
k. What is the impact of Alternative 2 on trees, as well as the protected wetlands and buffers in the recently approved Town LMO?
No additional tree removal is anticipated at this time, and wetlands impacts in the current Runway 21 end runway safety area (RSA) will be permitted in accordance with USACE regulations at the time the runway extension is designed. No impacts are anticipated at this time to the 75-foot buffer identified in the LMO.
l. Describe any FAA waivers or deviations from generally accepted rules required in this plan.
The only modification to design standards shown on the current Airport Layout Plan (prepared by Wilbur Smith Associates, dated June 2000) is the separation between Runway 03/21 and Taxiway ‘A.’ The Master Plan Update recommends bringing the Runway 03/21/Taxiway ‘A’ separation into compliance with FAA design standards.
m. Please indicate on Figure 2 where the EMAS is to be applied. Show dimensions and locations.
A 450-foot by 100-foot EMAS will be constructed at the Runway 03 end and Runway 21 end (refer to TBI Figure 4 of 4). The length of the EMAS (450 feet) is an estimate and will be determined by the EMAS manufacturer.
n. Please indicate other descriptive dimensions. (e.g. for runway areas currently not shown in the Figures, such as buffers, blast pads, etc.)
Refer to TBI Figure 4 of 4 and Table A – Key Dimensions Table on page B-28.
3. Please answer the same questions 2 a-n for the 5400 Ft Alternative 2, Phase II plan shown in Figure 3*. (Note: All lengths are measured with respect to the original 4300 Ft length AE in Figure 1.) a. What is the number of feet of runway AB and EF to be
added at each end?
Phase 2 of Alternative 2 will require the following:
• Runway 03 End 297 feet • Runway 21 End 803 feet
b. If the length BF is not 5400 Ft, specify its length and why different.
Phase 2 of Alternative 2 is 5,400 feet.
c. Indicate the lengths of EMAS (B-Ms) at the South and (F-Mn) at the North end.
The length of the EMAS at each end of the runway is:
• Runway 03 End 450 feet • Runway 21 End 450 feet
The length of the EMAS (450 feet) is an estimate and will be determined by the EMAS manufacturer.
d. Indicate the length of unpaved areas (from outer end of EMAS) at each end to the end of the airport property.
The length of the unpaved areas from the end of the EMAS at each end of the runway is:
• Runway 03 End 150 feet • Runway 21 End 463 feet
e. In determining where the runway starts for the purpose of calculating glide slope clearances, what are the additional lengths added (BC and FG) at each end (200 ft?)
The glide slope starts 200 feet from the landing threshold, as shown on TBI Figure 3 of 4.
f. Tn and Ts represent displaced thresholds at the North and South ends, respectively. Please indicate their length in from ends B and F, if used.
The displaced thresholds for Phase 2 of Alternative 2 are:
• Runway 03 End 297 feet • Runway 21 End 803 feet
g. Indicate how these displaced thresholds come into play in calculating landing and takeoff lengths in each direction, and glide slope distances and locations at each end.
Takeoff lengths for Phase 2 of Alternative 2 are:
• Runway 03 End 5,400 feet • Runway 21 End 5,400 feet
Landing lengths for Phase 2 of Alternative 2 are:
• Runway 03 End 5,103 feet • Runway 21 End 4,597 feet
HILTON HEAD ISLAND AIRPORT
MASTER PLAN UPDATE
Appendix B – Public Involvement TALBERT & BRIGHT B-25
The glide slope starts 200 feet from the landing threshold, as shown on TBI Figure 3 of 4.
h. Indicate the glide slopes on the diagram, including their starting location.
Refer to TBI Figure 3 of 4.
i. What are the critical vertical obstacles at each end of the runway? What are their distances D1 from end B and D2 from end F? What are their heights H1 and H2? How much clearance do they have below the glide slope at each end? Will the St. James steeple or Pineland Station pose an intrusion problem?
Pineland Station is 1,757 feet from the Runway 03 end and is 31 feet high. Once the trees are cut and the displaced thresholds removed, the clearance above Pineland Station will be 20.7 feet; therefore, there will be no intrusion problem at pineland Station. The St. James Baptist Church is 1,956 feet from the Runway 21 end and is 39.1 feet high. Once the trees are cut and the displaced thresholds removed, the clearance from the glide slope will be 12.5 feet above St. James Baptist Church. There will be no intrusion problems at St. James Baptist Church.
j. Will any additional trees, beyond those presently planned* (or beyond ongoing maintenance trimming) need to be trimmed-cut to support the answers for Alternative 2, Phase I above?
After both approaches are properly cleared, maintenance trimming of the approaches will be required.
k. What is the impact of Alternative 2 on trees, as well as the protected wetlands and buffers in the recently approved Town LMO?
No additional tree removal is anticipated at this time, and wetlands impacts in the current Runway 21 end RSA will be permitted in accordance with USACE regulations at the time the runway extension is designed. The 75-foot buffer identified in the LMO along Beach City Road may be impacted by the proposed relocation of Beach City Road. Final design will determine the amount of impact, if any. If there are impacts, final design will incorporate areas to maintain a 75-foot buffer as required by the LMO.
l. Describe any FAA waivers or deviations from generally accepted rules required in this plan.
The only modification to design standards shown on the current Airport Layout Plan (prepared by Wilbur Smith Associates, dated June 2000) is the separation between Runway 03/21 and Taxiway ‘A.’ The Master Plan Update recommends bringing the Runway 03/21/Taxiway ‘A’ separation into compliance with FAA design standards.
m. Please indicate on Figure 2 where the EMAS is to be applied. Show dimensions and locations.
A 450-foot by 100-foot EMAS will be constructed at the Runway 03 end and Runway 21 end (refer to TBI Figure 3 of 4). The length of the EMAS (450 feet) is an estimate and will be determined by the EMAS manufacturer.
n. Please indicate other descriptive dimensions. (e.g. for runway areas currently not shown in the Figures, such as buffers, blast pads, etc.)
Refer to TBI Figure 3 of 4 and Table A – Key Dimensions Table on page B-28.
4. If displaced thresholds are used, what is to prevent aircraft from using the full runway length? By way of background, our experience with the use of published voluntary noise abatement routes, and airport operator/tower monitoring and feedback to improve compliance, is poor. What would make compliance in the use of displaced thresholds any better?
The displaced thresholds are in place for landing of aircraft. The approaches are cleared at 34:1 to these displaced thresholds for aircraft landing in either direction (refer to TBI Figure 3 of 4). Pilots not using these thresholds for landing may not have a 34:1 approach clearance. Visual approach aids will be installed to provide visual glide path guidance to pilots relative to the displaced thresholds.
5. If FAA waivers or deviations from standard glide slope procedures are used, what mechanisms are required to cause planes to use them and avoid hazards such as the Church steeple and Pineland Station? For example, during the day, how will planes be alerted as to where the glide slope starts, and how will this be enforced? At night, after the control tower is closed, how will this notification and enforcement occur?
HXD currently has visual approach aids. These visual approach aids will be incorporated as part of the runway extension project to provide glide path guidance for landing to pilots day or night. Special departure procedures will be developed as part of the runway extension project by the FAA Flight Procedures personnel, if required, to provide proper clearance over any critical objects. These special departure procedures will be published by the FAA and made available to pilots through standard aviation information distribution media.
6. Since Wilbur Smith (not T&B) performed a related study, and since Wilbur Smith is known to have made errors in previous calculations pertaining to glide slopes, how can we be certain that T&B has not relied on flawed data and that Alternative 2 will not pose a problem in that regard?
The decision was made by Beaufort County that TBI would be provided existing data developed by Wilbur Smith Associates and others. Up to this point in recommending Alternative 2, TBI has not relied on any data supplied by Wilbur Smith Associates (WSA); however, as directed by Beaufort County, TBI will be relying on information provided by the Airport developed by WSA regarding the tree and approach clearing. Unless TBI checks and verifies all data supplied, TBI cannot guarantee that this data is correct.
7. Mention of a Vertical Precision Approach has started to appear in airport discussions. What would be the impact on the glide slope, vertical clearances, and tree trimming-cutting if this were to occur?
From a planning standpoint, if the approaches are cleared to a 34:1 surface, additional tree trimming/cutting is not typically required for implementation of a precision approach.
8. Regarding Alternatives 2-I and 2-II, what are the advantages and disadvantages of a phased approach? Is there a strong argument to be made in favor of implementing Alternative 2 in one phase rather than two?
Two Phases for Runway Extension to 5,400 Feet
PROS: • Does not require immediate land acquisition and road relocation for
final phase to go to 5,400 feet. • Provides ability to go to 5,000-foot runway length on currently
owned airport property. • Requires smaller FAA funding grant and local match.
CONS: • Requires multiple impacts to airport operations each time phased
construction is undertaken. • Overall final cost is greater due to engineering costs required with
each phase and, similarly, with construction costs required for each phase.
• Current airport users within family of aircraft representing 100 percent of the fleet operating at 60 percent useful load could still be required to operate at useful loads of less than 60 percent.
One Phase for Runway Extension to 5,400 Feet
PROS: • Lower overall final cost for engineering and construction. • Minimizes impacts to airport operations during construction.

HILTON HEAD ISLAND AIRPORT
MASTER PLAN UPDATE
Appendix B – Public Involvement TALBERT & BRIGHT B-26
• Current airport users within family of aircraft representing 100 percent of the fleet should be able to operate at 60 percent useful load year-round.
CONS: • Requires additional land acquisition and road relocation to occur
on or before runway extension construction begins. • Requires larger FAA funding grant and local match.
E – Noise Related Issues 1. What is the projected Noise impact on the St James Baptist
Church of extending the runway from 4300 to 5000 feet in Alternative 2-I?
The St. James Baptist Church will be located within the 60 DNL noise contour based on the current operations at HXD.
2. Which buildings off airport property will be impacted by each phase of Alternative 2 and to what extent?
The properties within the 65 DNL noise contour are commercial, aviation-related, or undeveloped land, which are considered compatible land uses in accordance with FAA requirements. The following property parcels would be impacted by Phase 1 (5,000 feet) of Alternative 2 and Phase 2 (5,400 feet) of Alternative 2 (refer to TBI Figures 3 of 4, and Figure 4 of 4).
3. What is the projected Noise impact on the St James Baptist Church of extending the runway from 5,001 to 5,400 feet on departures and arrivals for both northbound and southbound operations, and can a highway-type noise barrier be cost effectively employed at the North End, upon completion of the tree-trimming-cutting, to reduce Noise at the Church?
The St. James Baptist Church will be located within the 60 DNL noise contour based on the current operations at HXD. From a planning standpoint, TBI would expect that noise barriers could be designed to reduce noise at specific locations around the Airport.
4. Noting that the residential areas near the Airport are at the North End, can the South End of the Runway be reconfigured to employ an extended “Displaced Threshold” (with South End noise barrier) to minimize Noise at the North End.
TBI has located the proposed end of Runway 03 as far south as possible to reduce the potential impact to the north end of the Airport.
5. Are there any advantages to performing a noise study prior to the implementation of the tree trimming-cutting plan and/or the installation of noise barriers?
Per FAA guidelines, the Airport has already performed a Part 150 Noise Compatibility Study (ESA Airports and Wilbur Smith Associates, “Hilton Head Island Airport FAR Part 150 Noise and Land Use Compatibility Study, Noise Exposure Maps and Noise Compatibility Program,” prepared for Beaufort County and Hilton Head Island Airport, January 2008) and an Environmental Assessment for the Tree Clearing project (Wilbur Smith Associates in association with Ward Edwards, “Final Environmental Assessment for Removal of Tree Obstructions, Hilton Head Island Airport, Beaufort County, South Carolina,” prepared for Beaufort County, South Carolina, January 2010. Record of Decision and Finding of No Significant Impact issued by the FAA on March 4, 2010).
6. Assuming we move ahead with the tree-cutting plan, what is stopping us from designing and building noise mitigation barriers as soon as the tree-cutting is complete?
Noise mitigation barriers could be designed and constructed before, during, and after tree cutting is complete. A decision would have to be made by FAA regarding FAA’s funding participation in any noise mitigation barrier project.
7. Would a noise study be required during the design phase of a noise mitigation barrier project?
Per FAA guidelines, the Airport has already performed a Part 150 Noise Compatibility Study and an Environmental Assessment for the Tree Clearing project, as well as noise contour runs for the Master Plan Update. Further noise studies would not be required for the design and construction of a noise mitigation barrier; however, additional noise studies could be performed to determine noise levels before and after implementation of a noise barrier system.
F - Other Issues 1. We have heard that several residents were told by T&B that they had conducted a passenger survey at the airport. Was there such a survey? Who conducted it? What were the results? What was the time period covered and what was the methodology?
A passenger survey was conducted at the Hilton Head Island Airport between the dates of July 22-26, 2009. The surveys were taken for eight-hour periods over a five-day time frame by representatives of TBI at the commercial service terminal and the general aviation terminal. The results of the surveys taken are as follows:
Commercial Service Terminal
General Aviation Terminal
• Total Residents: 54 (16%) • Personal: 19 (22%) • Total Visitors: 292 (84%) • Business: 36 (41%)
• Golf/Beach Vacation: 25 (28%)• Military: 2 (2%) • Other: 6 (7%)
Alternative 2 (TBI Figure 3 of 4) and Alternative 2 Phase 1 (TBI Figure 4 of 4)
Parcel # Property Owner Acreage Use ALTERNATIVE 2, PHASE 1R510 008 000 221A 0000 MSC Hilton Head LLC 2.34 warehouses
Billing Address: 9801 Independence Point Parkway Matthews, NC 28105
Location: 17 Dillon Road R510 004 000 0304 0000 CNL Income Palmetto LLC 479.5 recreation
Billing Address: 12750 High Bluff Drive, 4th Floor San Diego, CA 92130
Location: 19 Oglethorpe Lane R510 004 000 0300 0000 Hilton Head Island Land Trust Inc 4.12 reserved vacant
Billing Address: P.O. Box 21058 Hilton Head Island, SC 29925
Location: Fort Howell Parcel R510 004 000 0328 0000 Hilton Head Island Land Trust Inc 1.42 access
easement Billing Address: P.O. Box 21058 Hilton Head Island, SC 29925
Location: Beach City Road (Fort Howell) ALTERNATIVE 2, PHASE 2 R510 005 000 0304 0000 Hilton Head Island Small Business Center 6.8 warehouse
Billing Address: P.O. Box 8 Hilton Head Island, SC 29938
Location: 159 Dillon Road R510 005 000 0278 0000 Palmetto Hall Plantation Home Owner's Association 10.16 recreation
Billing Address: 11 Palmetto Parkway Suite 204C Hilton Head Island, SC 29928
Location: 54 Tucker Ridge Court

HILTON HEAD ISLAND AIRPORT
MASTER PLAN UPDATE
Appendix B – Public Involvement TALBERT & BRIGHT B-27
The surveys were taken to determine the type of traveler using the Airport and reasons for their visit and the type of aircraft landing at the Airport. Copies of the blank survey forms used are attached. All the results of the survey will be included in the Master Plan report.
2. A detailed plan that would block the sound emitted by aircraft while on the ground and during takeoff. Such a plan should employ the latest technology to insure that any runway extension will not result in noise levels greater than we are now experiencing. Ideally, any new sound barriers will actually reduce noise from the current levels. We need to be assured this can be accomplished.
Per FAA guidelines, the Airport has already performed a Part 150 Noise Compatibility Study and an Environmental Assessment for the Tree Clearing project, as well as noise contour runs for the Master Plan Update. Further noise studies would not be required for the design and construction of a noise mitigation barrier; however, additional noise studies could be performed to determine noise levels before and after implementation of a noise barrier system.
3. Will the FAA examination of any request include a detailed financial cost/benefit analysis of a runway extension? We are proceeding on the assumption that the extension is worth the cost; not only to construct but also for the County to maintain. Given the sometimes confused state of the airport's finances, I suggest it might be prudent to be certain this extension makes financial sense. I suspect it does, but I am not aware of any firm data to support this investment.
Requirements for a cost benefit analysis are determined by the FAA in accordance with the FAA Airport Benefit-Cost Analysis Guidance (December 15, 1999) and submitted during the federal grant application process.

HILTON HEAD ISLAND AIRPORT
MASTER PLAN UPDATE
Appendix B – Public Involvement TALBERT & BRIGHT B-28
Table A Key Runway Dimensions
Existing Runway
Existing Runway In Compliance
Alternative No. 2
Alternative No. 2 Phase-1
Runway Dimensions Length 4,300' 4,300' 5,400' 5,000' Width 100' 100' 100' 100'
Displaced Threshold Runway 03 End 300' 0' 297' 297' Runway 21 End 300' 0' 803' 403'
EMAS (450' x 100') Runway 03 End No Yes Yes Yes Runway 21 End No No Yes Yes
Runway Safety Area (RSA)
Length 6,300' (Required) 6,197' (Actual) 5,900' 6,600' 6,200'
Width 400' 400' 400' 400' Obstacle Free Area (OFA)
Length 6,300' (Required) 6,197' (Actual) 5,900' 6,600' 6,200'
Width 800' 800' 800' 800' Approach Runway Protection Zone (RPZ)
Runway 03 End Length 1,700' 1,700' 1,700' 1,700' Inner Width 500' 500' 500' 500' Outer Width 1,010' 1,010' 1,010' 1,010'
Runway 21 End Length 1,700' 1,700' 1,700' 1,700' Inner Width 500' 500' 500' 500' Outer Width 1,010' 1,010' 1,010' 1,010'
Departure Runway Protection Zone (DRPZ) Runway 03 End
Length 1,700' 1,700' 1,700' 1,700' Inner Width 500' 500' 500' 500' Outer Width 1,010' 1,010' 1,010' 1,010'
Runway 21 End Length 1,700' 1,700' 1,700' 1,700' Inner Width 500' 500' 500' 500' Outer Width 1,010' 1,010' 1,010' 1,010'
Runway Approach Surface 34:1 Runway 03 End
Length 10,000' 10,000' 10,000' 10,000' Inner Width 500' 500' 500' 500' Outer Width 3,500' 3,500' 3,500' 3,500'
Runway 21 End Length 10,000' 10,000' 10,000' 10,000' Inner Width 500' 500' 500' 500' Outer Width 3,500' 3,500' 3,500' 3,500'
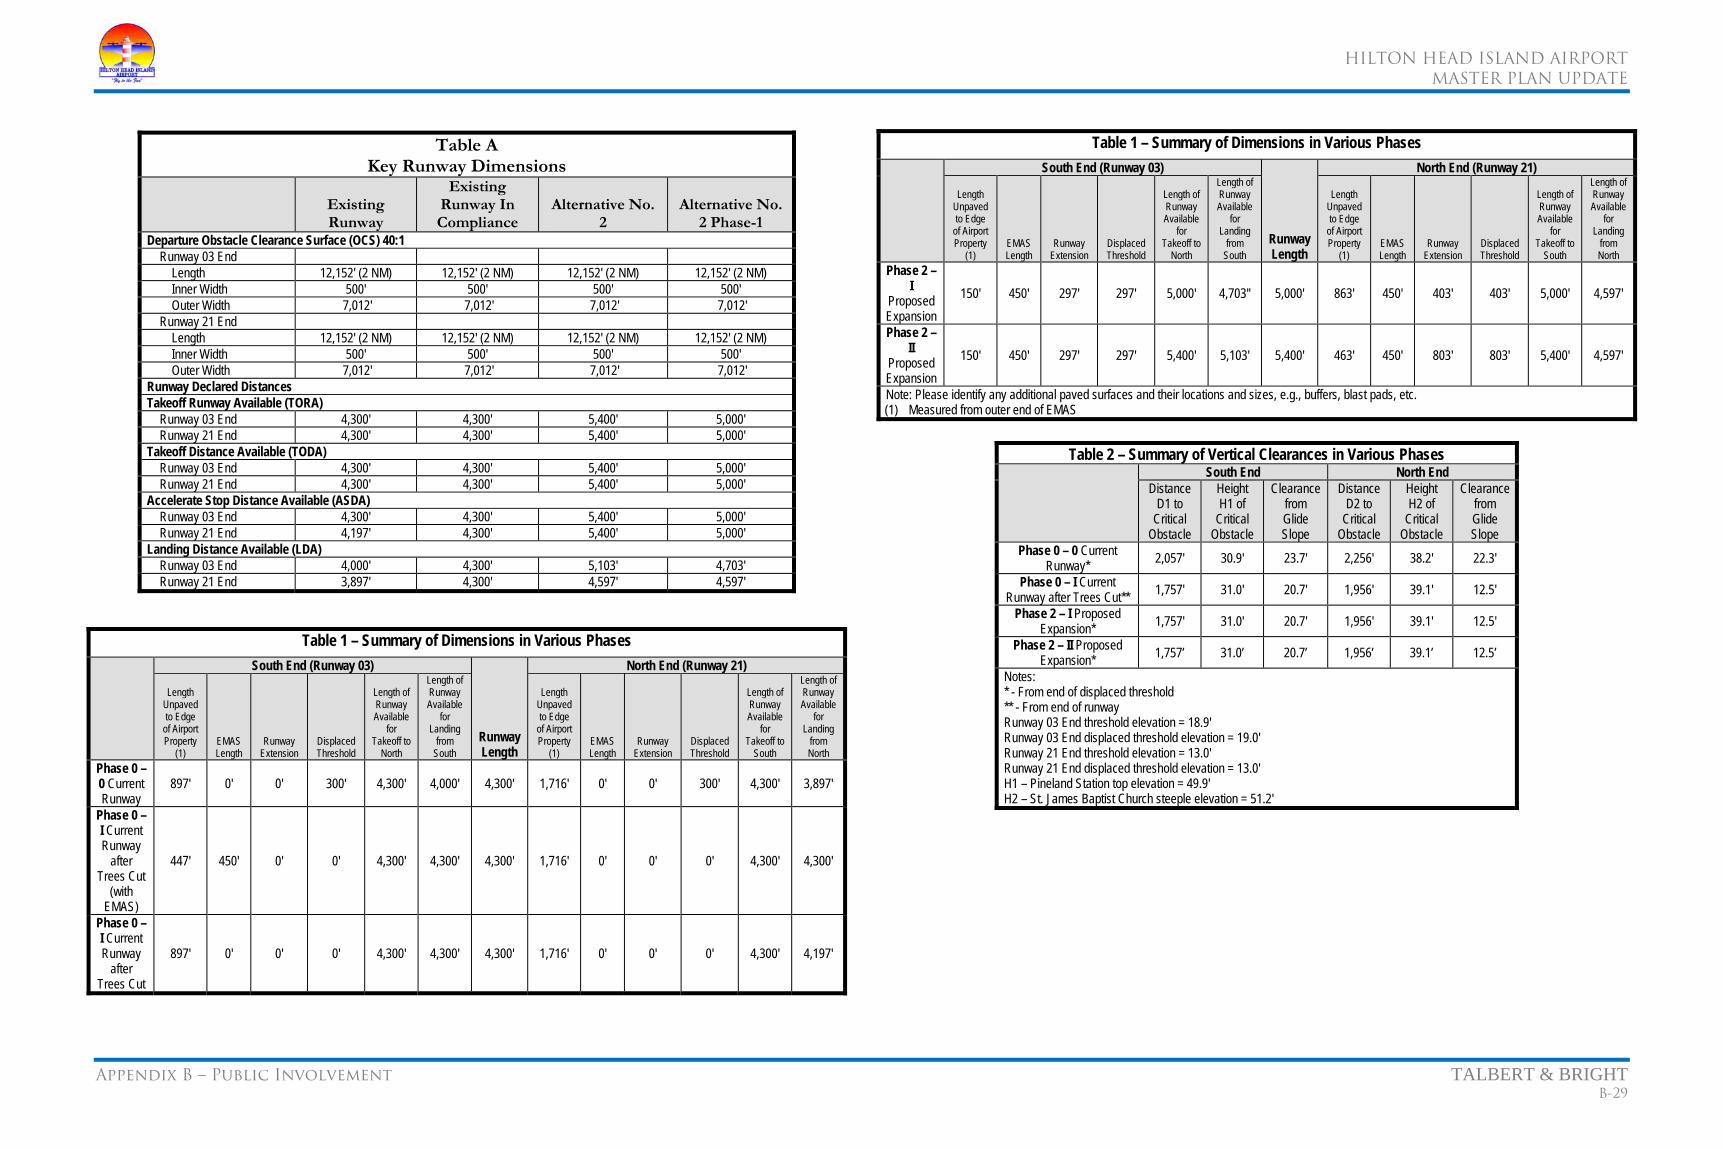
HILTON HEAD ISLAND AIRPORT
MASTER PLAN UPDATE
Appendix B – Public Involvement TALBERT & BRIGHT B-29
Table A Key Runway Dimensions
Existing Runway
Existing Runway In Compliance
Alternative No. 2
Alternative No. 2 Phase-1
Departure Obstacle Clearance Surface (OCS) 40:1 Runway 03 End
Length 12,152' (2 NM) 12,152' (2 NM) 12,152' (2 NM) 12,152' (2 NM) Inner Width 500' 500' 500' 500' Outer Width 7,012' 7,012' 7,012' 7,012'
Runway 21 End Length 12,152' (2 NM) 12,152' (2 NM) 12,152' (2 NM) 12,152' (2 NM) Inner Width 500' 500' 500' 500' Outer Width 7,012' 7,012' 7,012' 7,012'
Runway Declared Distances Takeoff Runway Available (TORA)
Runway 03 End 4,300' 4,300' 5,400' 5,000' Runway 21 End 4,300' 4,300' 5,400' 5,000'
Takeoff Distance Available (TODA) Runway 03 End 4,300' 4,300' 5,400' 5,000' Runway 21 End 4,300' 4,300' 5,400' 5,000'
Accelerate Stop Distance Available (ASDA) Runway 03 End 4,300' 4,300' 5,400' 5,000' Runway 21 End 4,197' 4,300' 5,400' 5,000'
Landing Distance Available (LDA) Runway 03 End 4,000' 4,300' 5,103' 4,703' Runway 21 End 3,897' 4,300' 4,597' 4,597'
Table 1 – Summary of Dimensions in Various Phases South End (Runway 03)
Runway Length
North End (Runway 21)
Length Unpaved to Edge
of Airport Property
(1) EMAS Length
Runway Extension
Displaced Threshold
Length of Runway Available
for Takeoff to
North
Length of Runway Available
for Landing
from South
Length Unpaved to Edge
of Airport Property
(1) EMAS Length
Runway Extension
Displaced Threshold
Length of Runway Available
for Takeoff to
South
Length of Runway Available
for Landing
from North
Phase 0 – 0 Current Runway
897' 0' 0' 300' 4,300' 4,000' 4,300' 1,716' 0' 0' 300' 4,300' 3,897'
Phase 0 – I Current Runway
after Trees Cut
(with EMAS)
447' 450' 0' 0' 4,300' 4,300' 4,300' 1,716' 0' 0' 0' 4,300' 4,300'
Phase 0 – I Current Runway
after Trees Cut
897' 0' 0' 0' 4,300' 4,300' 4,300' 1,716' 0' 0' 0' 4,300' 4,197'
Table 1 – Summary of Dimensions in Various Phases South End (Runway 03)
Runway Length
North End (Runway 21)
Length Unpaved to Edge
of Airport Property
(1) EMAS Length
Runway Extension
Displaced Threshold
Length of Runway Available
for Takeoff to
North
Length of Runway Available
for Landing
from South
Length Unpaved to Edge
of Airport Property
(1) EMAS Length
Runway Extension
Displaced Threshold
Length of Runway Available
for Takeoff to
South
Length of Runway Available
for Landing
from North
Phase 2 – I
Proposed Expansion
150' 450' 297' 297' 5,000' 4,703'' 5,000' 863' 450' 403' 403' 5,000' 4,597'
Phase 2 – II
Proposed Expansion
150' 450' 297' 297' 5,400' 5,103' 5,400' 463' 450' 803' 803' 5,400' 4,597'
Note: Please identify any additional paved surfaces and their locations and sizes, e.g., buffers, blast pads, etc. (1) Measured from outer end of EMAS
Table 2 – Summary of Vertical Clearances in Various Phases South End North End
Distance D1 to
Critical Obstacle
Height H1 of
Critical Obstacle
Clearance from Glide Slope
Distance D2 to
Critical Obstacle
Height H2 of
Critical Obstacle
Clearance from Glide Slope
Phase 0 – 0 Current Runway* 2,057' 30.9' 23.7' 2,256' 38.2' 22.3'
Phase 0 – I Current Runway after Trees Cut** 1,757' 31.0' 20.7' 1,956' 39.1' 12.5'
Phase 2 – I Proposed Expansion* 1,757' 31.0' 20.7' 1,956' 39.1' 12.5'
Phase 2 – II Proposed Expansion* 1,757’ 31.0’ 20.7’ 1,956’ 39.1’ 12.5’
Notes: * - From end of displaced threshold ** - From end of runway Runway 03 End threshold elevation = 18.9' Runway 03 End displaced threshold elevation = 19.0' Runway 21 End threshold elevation = 13.0' Runway 21 End displaced threshold elevation = 13.0' H1 – Pineland Station top elevation = 49.9' H2 – St. James Baptist Church steeple elevation = 51.2'

HILTON HEAD ISLAND AIRPORT
MASTER PLAN UPDATE
Appendix B – Public Involvement TALBERT & BRIGHT B-30
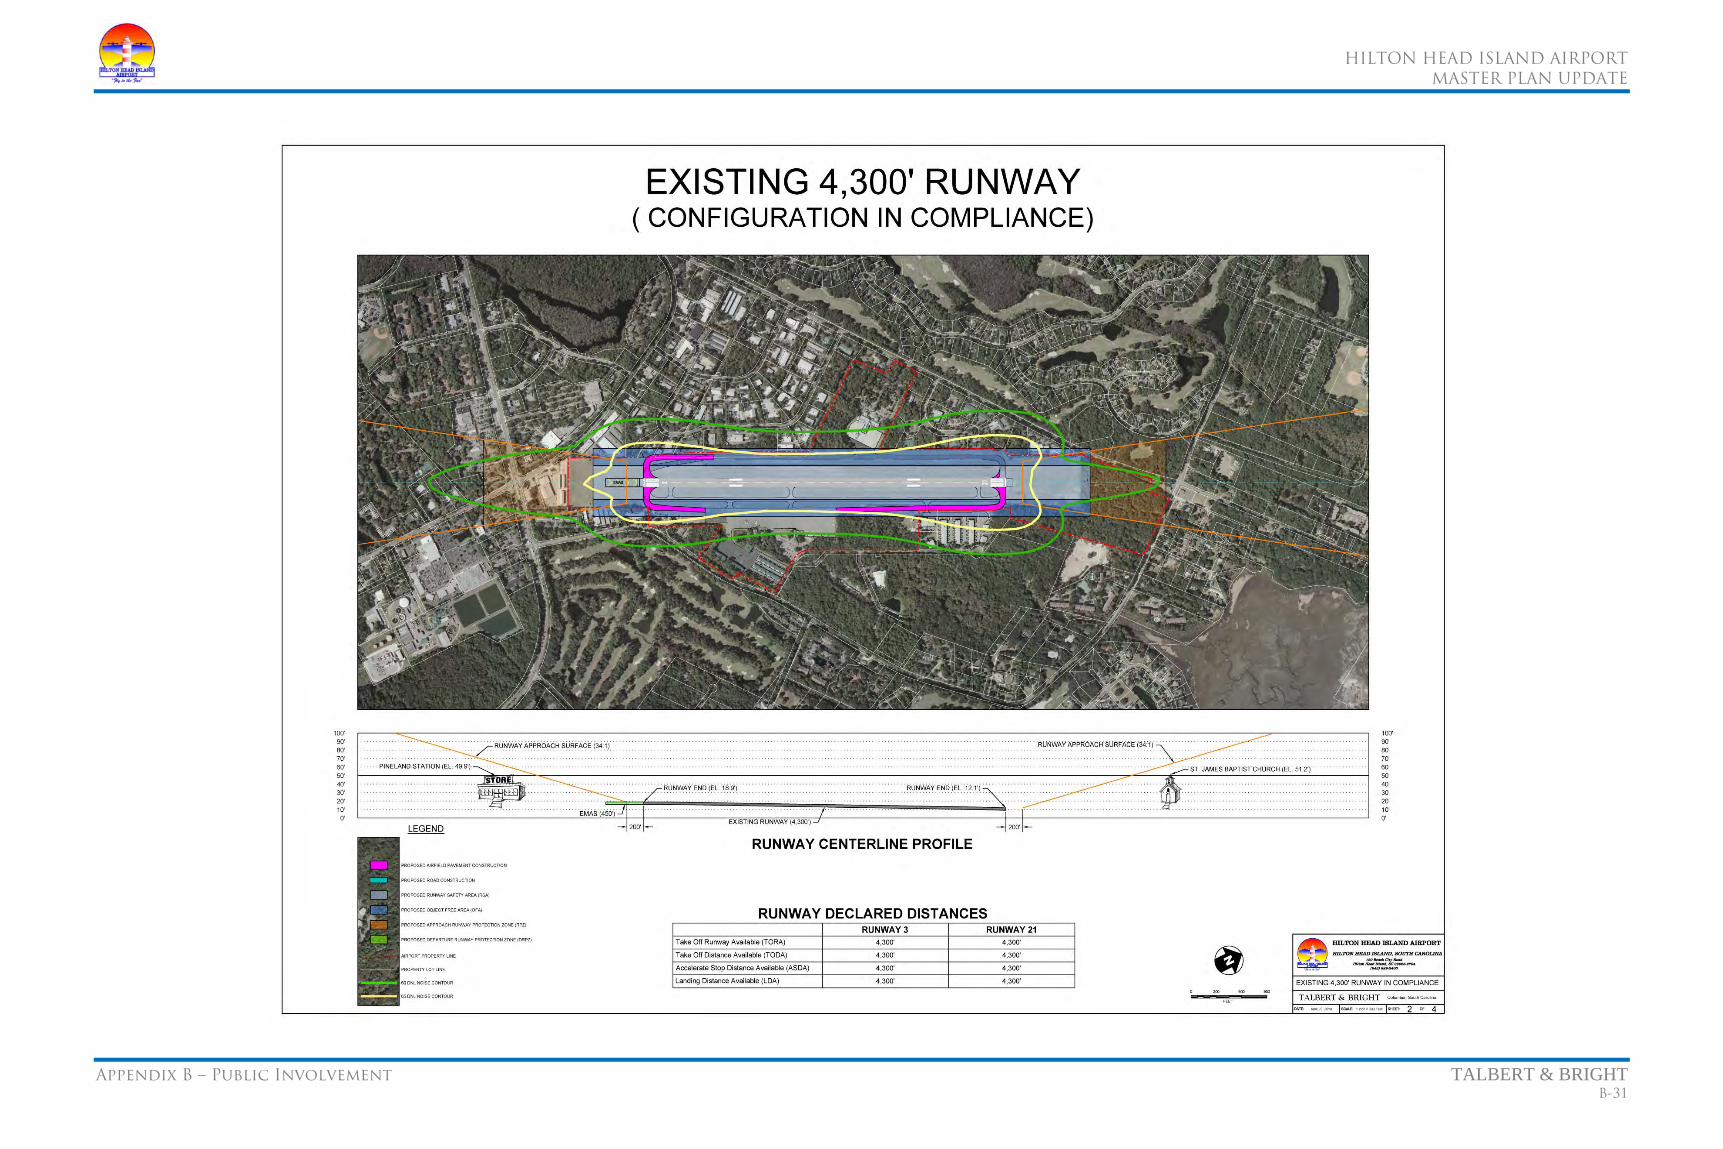
HILTON HEAD ISLAND AIRPORT
MASTER PLAN UPDATE
Appendix B – Public Involvement TALBERT & BRIGHT B-31
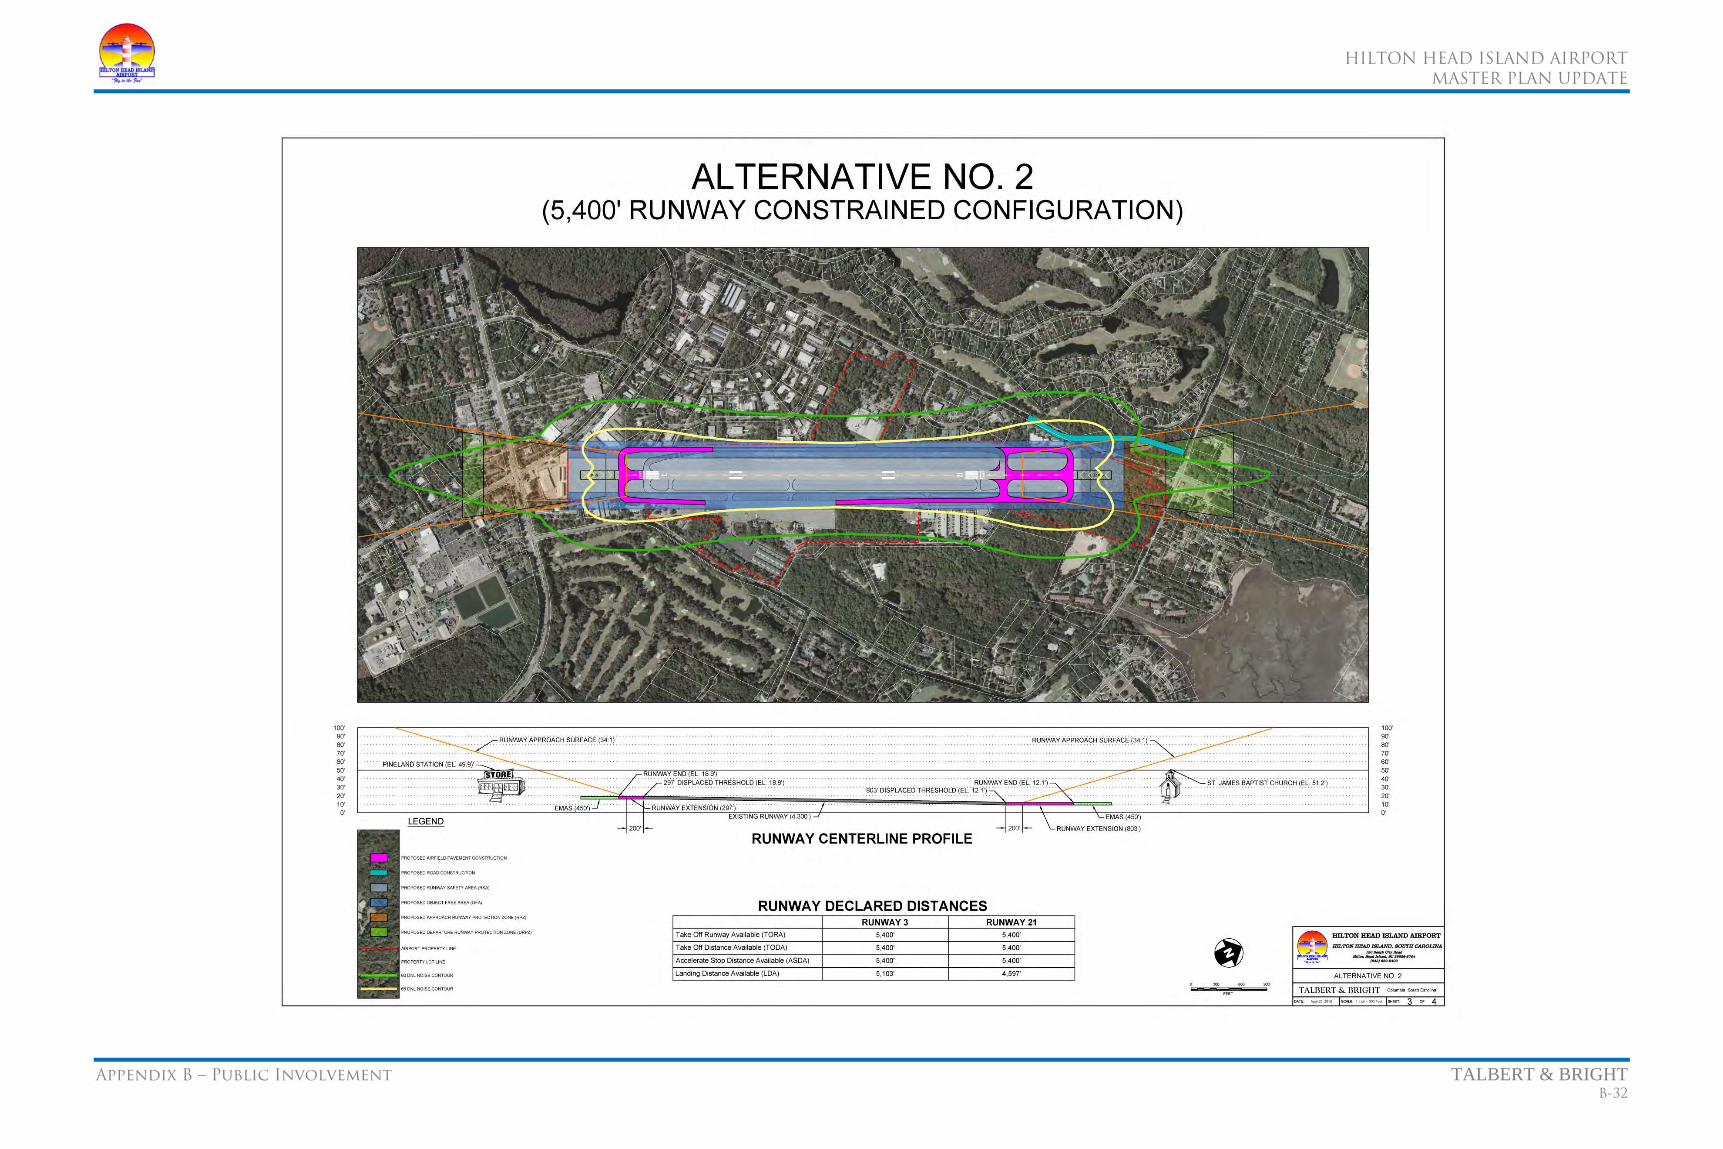
HILTON HEAD ISLAND AIRPORT
MASTER PLAN UPDATE
Appendix B – Public Involvement TALBERT & BRIGHT B-32

HILTON HEAD ISLAND AIRPORT
MASTER PLAN UPDATE
Appendix B – Public Involvement TALBERT & BRIGHT B-33
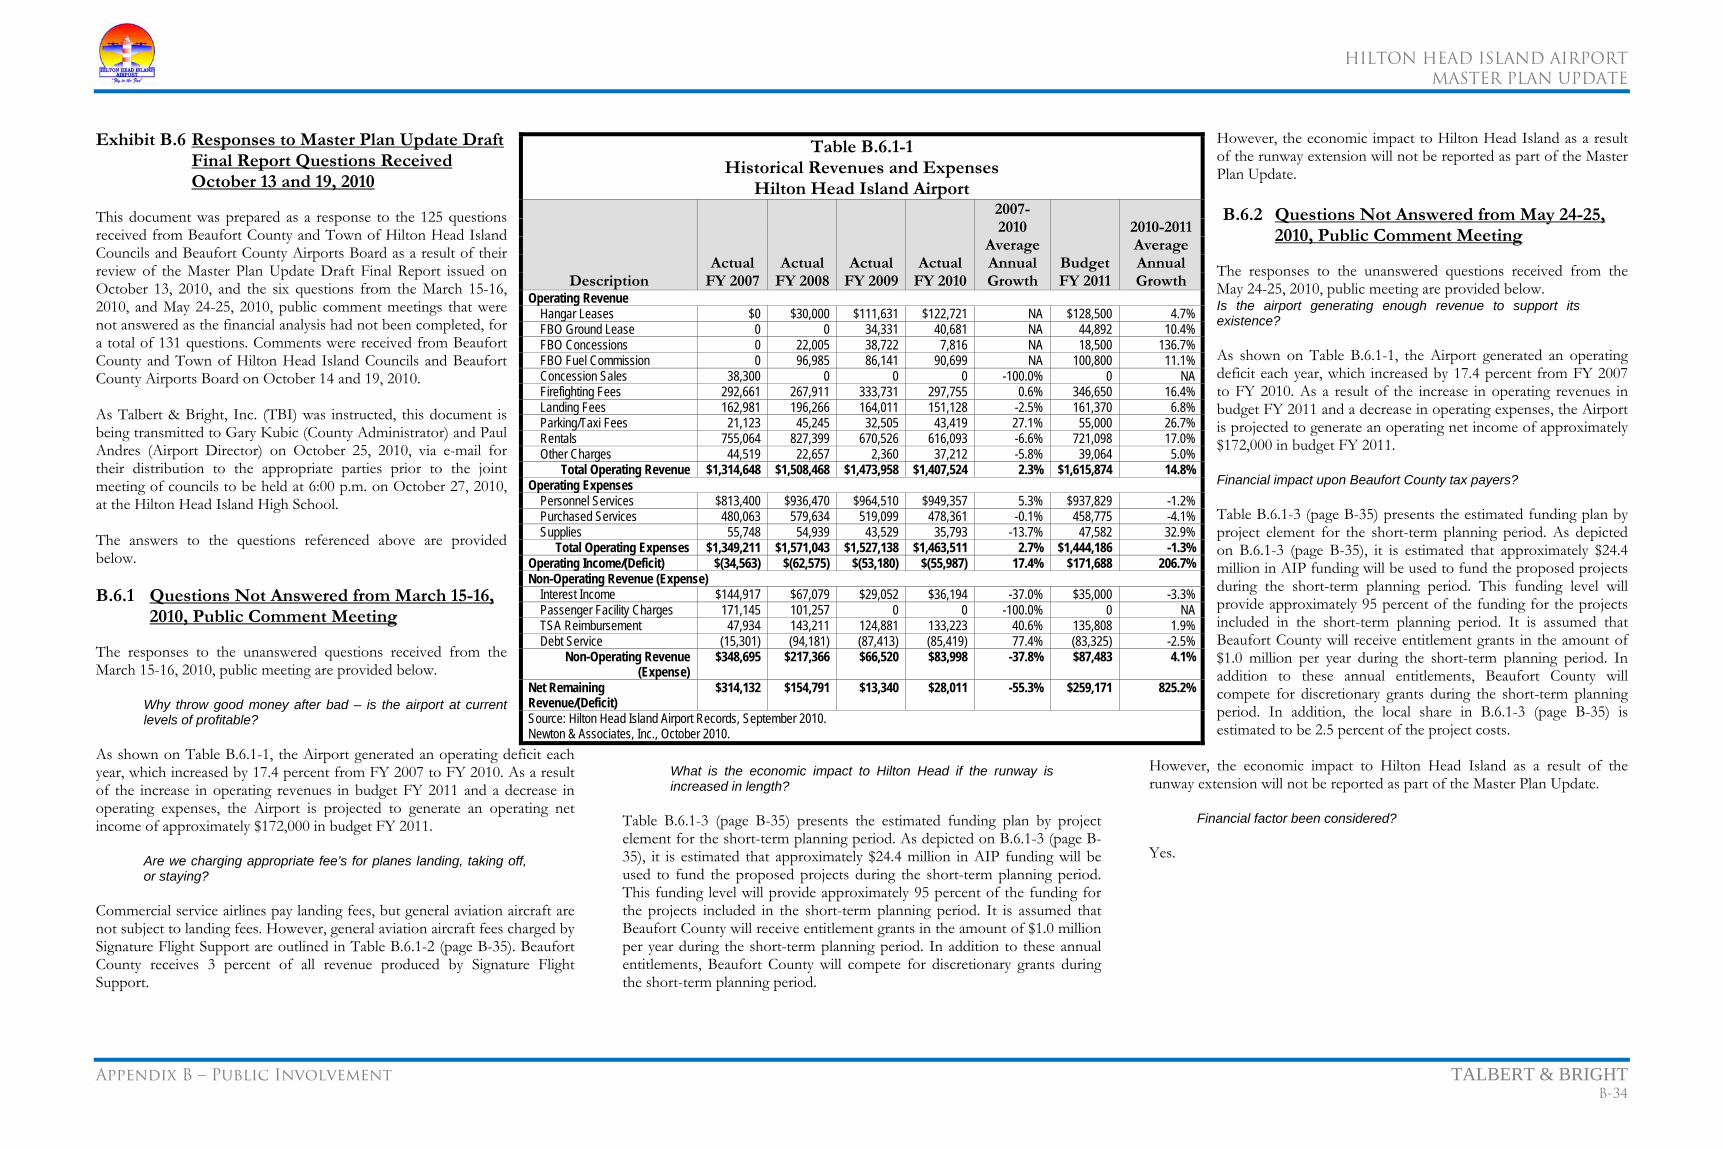
HILTON HEAD ISLAND AIRPORT
MASTER PLAN UPDATE
Appendix B – Public Involvement TALBERT & BRIGHT B-34
Exhibit B.6 Responses to Master Plan Update Draft Final Report Questions Received October 13 and 19, 2010
This document was prepared as a response to the 125 questions received from Beaufort County and Town of Hilton Head Island Councils and Beaufort County Airports Board as a result of their review of the Master Plan Update Draft Final Report issued on October 13, 2010, and the six questions from the March 15-16, 2010, and May 24-25, 2010, public comment meetings that were not answered as the financial analysis had not been completed, for a total of 131 questions. Comments were received from Beaufort County and Town of Hilton Head Island Councils and Beaufort County Airports Board on October 14 and 19, 2010. As Talbert & Bright, Inc. (TBI) was instructed, this document is being transmitted to Gary Kubic (County Administrator) and Paul Andres (Airport Director) on October 25, 2010, via e-mail for their distribution to the appropriate parties prior to the joint meeting of councils to be held at 6:00 p.m. on October 27, 2010, at the Hilton Head Island High School. The answers to the questions referenced above are provided below. B.6.1 Questions Not Answered from March 15-16,
2010, Public Comment Meeting
The responses to the unanswered questions received from the March 15-16, 2010, public meeting are provided below.
Why throw good money after bad – is the airport at current levels of profitable?
As shown on Table B.6.1-1, the Airport generated an operating deficit each year, which increased by 17.4 percent from FY 2007 to FY 2010. As a result of the increase in operating revenues in budget FY 2011 and a decrease in operating expenses, the Airport is projected to generate an operating net income of approximately $172,000 in budget FY 2011.
Are we charging appropriate fee’s for planes landing, taking off, or staying?
Commercial service airlines pay landing fees, but general aviation aircraft are not subject to landing fees. However, general aviation aircraft fees charged by Signature Flight Support are outlined in Table B.6.1-2 (page B-35). Beaufort County receives 3 percent of all revenue produced by Signature Flight Support.
What is the economic impact to Hilton Head if the runway is increased in length?
Table B.6.1-3 (page B-35) presents the estimated funding plan by project element for the short-term planning period. As depicted on B.6.1-3 (page B-35), it is estimated that approximately $24.4 million in AIP funding will be used to fund the proposed projects during the short-term planning period. This funding level will provide approximately 95 percent of the funding for the projects included in the short-term planning period. It is assumed that Beaufort County will receive entitlement grants in the amount of $1.0 million per year during the short-term planning period. In addition to these annual entitlements, Beaufort County will compete for discretionary grants during the short-term planning period.
However, the economic impact to Hilton Head Island as a result of the runway extension will not be reported as part of the Master Plan Update. B.6.2 Questions Not Answered from May 24-25,
2010, Public Comment Meeting
The responses to the unanswered questions received from the May 24-25, 2010, public meeting are provided below. Is the airport generating enough revenue to support its existence? As shown on Table B.6.1-1, the Airport generated an operating deficit each year, which increased by 17.4 percent from FY 2007 to FY 2010. As a result of the increase in operating revenues in budget FY 2011 and a decrease in operating expenses, the Airport is projected to generate an operating net income of approximately $172,000 in budget FY 2011. Financial impact upon Beaufort County tax payers? Table B.6.1-3 (page B-35) presents the estimated funding plan by project element for the short-term planning period. As depicted on B.6.1-3 (page B-35), it is estimated that approximately $24.4 million in AIP funding will be used to fund the proposed projects during the short-term planning period. This funding level will provide approximately 95 percent of the funding for the projects included in the short-term planning period. It is assumed that Beaufort County will receive entitlement grants in the amount of $1.0 million per year during the short-term planning period. In addition to these annual entitlements, Beaufort County will compete for discretionary grants during the short-term planning period. In addition, the local share in B.6.1-3 (page B-35) is estimated to be 2.5 percent of the project costs.
However, the economic impact to Hilton Head Island as a result of the runway extension will not be reported as part of the Master Plan Update.
Financial factor been considered? Yes.
Table B.6.1-1 Historical Revenues and Expenses
Hilton Head Island Airport
Description Actual
FY 2007Actual
FY 2008Actual
FY 2009Actual
FY 2010
2007-2010
Average Annual Growth
Budget FY 2011
2010-2011 Average Annual Growth
Operating Revenue Hangar Leases $0 $30,000 $111,631 $122,721 NA $128,500 4.7% FBO Ground Lease 0 0 34,331 40,681 NA 44,892 10.4% FBO Concessions 0 22,005 38,722 7,816 NA 18,500 136.7% FBO Fuel Commission 0 96,985 86,141 90,699 NA 100,800 11.1% Concession Sales 38,300 0 0 0 -100.0% 0 NA Firefighting Fees 292,661 267,911 333,731 297,755 0.6% 346,650 16.4% Landing Fees 162,981 196,266 164,011 151,128 -2.5% 161,370 6.8% Parking/Taxi Fees 21,123 45,245 32,505 43,419 27.1% 55,000 26.7% Rentals 755,064 827,399 670,526 616,093 -6.6% 721,098 17.0% Other Charges 44,519 22,657 2,360 37,212 -5.8% 39,064 5.0%
Total Operating Revenue $1,314,648 $1,508,468 $1,473,958 $1,407,524 2.3% $1,615,874 14.8% Operating Expenses
Personnel Services $813,400 $936,470 $964,510 $949,357 5.3% $937,829 -1.2% Purchased Services 480,063 579,634 519,099 478,361 -0.1% 458,775 -4.1% Supplies 55,748 54,939 43,529 35,793 -13.7% 47,582 32.9%
Total Operating Expenses $1,349,211 $1,571,043 $1,527,138 $1,463,511 2.7% $1,444,186 -1.3% Operating Income/(Deficit) $(34,563) $(62,575) $(53,180) $(55,987) 17.4% $171,688 206.7% Non-Operating Revenue (Expense)
Interest Income $144,917 $67,079 $29,052 $36,194 -37.0% $35,000 -3.3% Passenger Facility Charges 171,145 101,257 0 0 -100.0% 0 NA TSA Reimbursement 47,934 143,211 124,881 133,223 40.6% 135,808 1.9% Debt Service (15,301) (94,181) (87,413) (85,419) 77.4% (83,325) -2.5%
Non-Operating Revenue (Expense)
$348,695 $217,366 $66,520 $83,998 -37.8% $87,483 4.1%
Net Remaining Revenue/(Deficit)
$314,132 $154,791 $13,340 $28,011 -55.3% $259,171 825.2%
Source: Hilton Head Island Airport Records, September 2010. Newton & Associates, Inc., October 2010.

HILTON HEAD ISLAND AIRPORT
MASTER PLAN UPDATE
Appendix B – Public Involvement TALBERT & BRIGHT B-35
B.6.3 Stewart Rodman’s (Beaufort County Council) Questions (Received October 14, 2010)
At 5,000 feet which current or future commuter aircraft, if any, are weight restricted to ATL and CLT during July and August and, if restricted, by how many seats in each month?
Based on information provided by Delta Airlines, it is anticipated that the Canadair RJ 200 and/or 700 are expected to be available for short-range commercial service at HXD in the next 10 to 15 years. Based on information provided by US Airways, it is anticipated that the Bombardier Q400 is expected to be available for short-range commercial service at HXD in the next 10 to 15 years. Based on current information provided by aircraft manufacturers, these aircraft will be weight limited by summer temperatures at a 5,000-foot runway (Table B.6.3-1, page B-36). For the 5,400-foot runway
Table B.6.1-2 Signature Flight Support – Rates and Charges
Hilton Head Island Airport
Aircraft Type Fuel Handling Ramp Hangar Ramp – Month
Hangar –
MonthSuper Heavy Jet (Global Express, Gulfstream V, 500, 550) 500 gal $940 $250 $550 $2,700 $4,500 Heavy Jet (Challenger, Citation X, Sovereign 680, Gulfstream I, II, III, IV, 200, Embraer Legacy, Embraer 135, Falcon 50, 900, 2000, Hawker 4000 [Horizon])
400 gal $590 $180 $370 $2,000 $3,500
Medium Jet (Astra, Citation Jet III, VI, VII, Excel, Falcon 20, 200, G-100, 150, Hawkers 800-1000 Series, Lear 45, 55, 60, Sabreliner, Westwind)
300 gal $440 $100 $250 $1,000 $2,000
Light Jet (Beechjet/Diamond/Hawker 400, Citation I, II, Citation 550/560, Ultra, Encore, CJ 1, 2, & 3 (Ce-525), Falcon 10, 100, Lear 20, 30 Series & LR-40, Premier I, II)
175 gal $300 $70 $200 $750 $1,600
Very Light Jet (Adam 700, Citation Mustang, CE-510, Eclipse 500, Embraer Phenom 100)
70 gal $190 $50 $170 $450 $1,400
Heavy Turboprop (Atra, King Air 1900, DeHavilland, Embraer Brasilia)
120 gal $310 $100 $250 $1,000 $2,000
Medium Turboprop (Cheyenne 3, 4, King Air 200, 300, 350, Merlin, Piaggio Avanti, Pilatus)
120 gal $270 $80 $190 $450 $1,400
Light Turboprop (Cheyenne 1, 2, Conquest, King Air 90, 100, Meridian, Mu-2 (Marquise, Solitaire), Turbo Commander 690)
70 gal $190 $60 $150 $300 $1,000
Single-Engine Turboprop (Eads Socata TBM 700, 800, C-208 Caravan, Converted Piston A/C, Pa-46-500tp Meridian)
50 gal $90 $50 $115 $250 $750
Heavy Twin (Cessna 400 Series, Duke, Navajo, Twin Commander)
50 gal $160 $50 $115 $250 $750
Light Twin (Aerostar, Aztec, Baron, Dutchess, Cessna 300 Series, Seneca)
40 gal $70 $30 $105 $116 $600
Single-Engine 10 gal $30 $12 $65 $101 $400 Helicopter-Light Helicopter-Medium Helicopter-Heavy Note: The fuel is the minimum amount required to waive the handling fee. Source: Signature Flight Support (Michael Bennett, General Manager), “Ramp and Handling Fees, Effective May 17, 2010,” e-mail message, October 14, 2010.
Table B.6.1-3 Short-Term Projects Funding Plan
Hilton Head Island Airport FiscalYear
Project Cost
FAA State Local Entitlement Discretionary Total
Airfield Projects Land Acquisition for Airfield Deficiency Correction
2013 $3,600,000 $1,000,000 $2,420,000 $3,420,000 $90,000 $90,000
Airfield Deficiency Correction 2013 $1,750,000 $500,000 $1,162,500 $1,662,500 $43,750 $43,750 Runway Extension Cost-Benefit Analysis/Environmental Documentation
2011 $500,000 $0 $475,000 $475,000 $12,500 $12,500
Land Acquisition for Runway Extension and Road Relocation
2012 $5,500,000 $0 $5,225,000 $5,225,000 $137,500 $137,500
700' Runway Extension Design and Construction
2013 $3,540,000 $1,000,000 $2,363,000 $3,363,000 $88,500 $88,500
400' Runway Extension Design and Construction
2015 $2,925,000 $1,000,000 $1,778,750 $2,778,750 $73,125 $73,125
Relocation of Beach City Road Design and Construction
2014 $750,000 $0 $712,500 $712,500 $18,750 $18,750
Runway 03 34:1 Obstruction Removal (trees)
2011 $1,500,000 $0 $1,425,000 $1,425,000 $37,500 $37,500
Transitional Surface Obstruction Removal (trees)
2012 $2,000,000 $0 $1,900,000 $1,900,000 $50,000 $50,000
Subtotal Airfield Projects $22,065,000 $3,500,000 $17,461,750 $20,961,750 $551,625 $551,625 Commercial Service Passenger Terminal Area
Commercial Service Terminal Expansion
2011 $1,900,000 $1,805,000 $0 $1,805,000 $47,500 $47,500
Subtotal Commercial Service Passenger Terminal Area
$1,900,000 $1,805,000 $0 $1,805,000 $47,500 $47,500
Total Short-Term Projects $23,965,000 $5,305,000 $17,461,750 $22,766,750 $599,125 $599,125 Percent of Total 95.0% 2.5% 2.5% Source: Talbert & Bright, Inc., October 2010. Newton & Associates, Inc., October 2010.

HILTON HEAD ISLAND AIRPORT
MASTER PLAN UPDATE
Appendix B – Public Involvement TALBERT & BRIGHT B-36
the Canadair RJ 200 and 700 would be weight limited by summer temperatures.
Table B.6.3-1 Commercial Service Aircraft Hilton Head Island Airport
Aircraft
Maximum Takeoff
Weight Length Bombardier DASH 8-Q400 5,200′ Canadair CRJ/200 5,600′ Canadair CRJ/700 5,500′
At 5,000 feet which current or future general aviation aircraft, if any, are weight restricted for 700 Nautical Miles during July and April and, if restricted, by how many nautical miles in each month?
For the planning purposes of the Master Plan update, the FAA procedures for determining the recommended runway length for the airplanes operating at HXD that will require the longest runway length were used. In accordance with the “Procedure and Rationale for Determining Recommended Runway Lengths” on page 2 of FAA Advisory Circular 150/5325-4B,” Step #2” requires “Identify the airplanes that will require the longest runway lengths at maximum certificated takeoff weight (MTOW). This will be used to determine the method for establishing the recommended runway length. Except for regional jets, when the MTOW of listed airplanes is 60,000 pounds (27,200 kg) or less, the recommended runway length is determined according to a family grouping of airplanes having similar performance characteristics and operating weights.” Following the steps in FAA Advisory Circular 150/5325-4B, Figure 3-2 was then used to determine a recommended runway length of 5,400 feet with the family of aircraft operating at 60 percent useful load. Table B.6.3-2 outlines the aircraft (from Tables 3-1 and 3-2 of FAA Advisory Circular 150/5325-4B and 2009 IFR data) that are weight restricted at 5,000 feet using maximum takeoff weight.
What comprises the property acquisition ($8.8 million) in the 5,000-foot scenario in the Master Plan?
The property acquisition for that alternative comprises the $8.8 million and includes the following properties outlined in Table B.6.3-3 (page B-37).
Table B.6.3-2 General Aviation Aircraft
Hilton Head Island Airport
Aircraft Maximum Takeoff
Weight Length Aero L-39 Albatross 6,000' Aircraft Industries (IAI) Jet Commander 1121 5,400' Bae 125-700 5,577' Bae Corporate 800/1000 6,300' Bombardier 600 Challenger 5,840′ Bombardier 601/601-3A/3ER Challenger 6,200' Bombardier 604 Challenger 5,702' Bombardier Challenger 600 6,305' Bombardier Learjet 35 6,300' Bombardier Learjet 55 5,450' Bombardier Learjet 60 5,450' Cessna 650 Citation III/IV 5,170' Cessna 650 Citation VII 5,170' Cessna 750 Citation X 5,140' Cessna Citation 1 5,140' Cessna Citation I/II/III 5,630' Dassault Falcon 20 5,200' Dassault Falcon 2000 5,872' Dassault Falcon 2000/2000EX 5,585′ Dassault Falcon 900 5,194' Dassault Falcon 900/900B 5,194' Dassault Falcon 900C/900EX 5,216' Embraer ERJ-135 5,413' Gulfstream G-150 5,250' Gulfstream G-II 5,500' Gulfstream G-IV 5,700' Gulfstream G-V 5,934' Hawker Siddeley HS25 6,900' Hawker Siddeley HS25B 6,900' IAI Galaxy 1126 5,500' IAI Westwind 1123/1124 5,400' Learjet 35/35A/36/36A 6,300' Learjet 45 XR 5,059' Learjet 55/55B/55C 5,450' Learjet 60 5,450′ Mitsubishi Mu-300 Diamond 5,050' Raytheon Hawker 600 5,200' Raytheon/Hawker 800/800 XP 5,200' Sabreliner 65/75 5,500'
If the 5,400-foot option is eliminated, what is the cost (including compliance) to expand the runway to 5,000 feet?
The cost to extend the runway to 5,000 feet including the Runway Extension Cost-Benefit Analysis and Environmental Documentation is outlined in Table B.6.3-4.
If the number of aircraft restricted at 5,000 feet is minimal can the 5,400 foot Scenario be eliminated from the Master Plan?
It is the recommendation of the consultant that the Hilton Head Island Airport needs 5,400 feet to adequately serve the current and future aircraft fleet. The FAA has concurred with this recommendation on two occasions (February 9, 2010, and October 4, 2010).
Table B.6.3-4 Alternative No. 2 – Phase 1
(5,000-Foot Runway Constrained Configuration) Preliminary Estimate of Probable Construction Costs
Hilton Head Island Airport Local State Federal Total
Deficiency Correction and Related Property Acquisition
$223,750 $43,750 $5,082,500 $5,350,000
Property Acquisition $257,500 $0 $4,892,500 $5,150,000 Runway Extension Cost-Benefit Analysis/ Environmental Documentation
$12,500 $12,500 $475,000 $500,000
Construction $38,500 $38,500 $1,463,000 $1,540,000 EMAS Construction $50,000 $50,000 $1,900,000 $2,000,000 TOTAL $582,250 $144,750 $13,813,000 $14,540,000 Source: Talbert & Bright, Inc., September 2010.

HILTON HEAD ISLAND AIRPORT
MASTER PLAN UPDATE
Appendix B – Public Involvement TALBERT & BRIGHT B-37
Table B.6.3-3 Property Acquisition for the 5,000-Foot Alternative
Hilton Head Island Airport Parcel # Property Owner Parcel # Property Owner
Deficiency Correction 5,000-Foot Extension R510 008 000 0183 0000 AJA LLC John Antunes Distinctive R510 004 000 0359 0000 Brooklyn Bridge Ltd Co Billing Address: P.O. Box 23109 Billing Address: 17 Plumbridge Lane Hilton Head Island, SC 29925 Hilton Head Island, SC 29928 Location: 16 Hunter Road - has avigation easement Location: 160 Beach City Road - has avigation easement R510 008 000 0184 0000 Gochnauer LLC R510 004 000 0344 0000 Brooklyn Bridge Ltd Co Billing Address: 6 Pender Lane Billing Address: 17 Plumbridge Lane Hilton Head Island, SC 29928 Hilton Head Island, SC 29928 Location: 14 Hunter Road - has avigation easement Location: 154 Beach City Road - has avigation easement R510 008 000 184A 0000 Z Investments LLC R510 004 000 0344 0001 Hilton Head Deep Well Project Inc Billing Address: 20 Sea Olive Road Billing Address: P.O. Box 5543 Hilton Head Island, SC 29928 Hilton Head Island, SC 29938 Location: 12 Hunter Road - has avigation easement Location: 154 Beach City Road - Unit 1 R510 008 000 0221 0000 Island Storage and Development R510 004 000 0344 0002 Beach First National Bank Billing Address: 591 Wilmer Avenue Billing Address: 3751 Grissom Parkway Cincinnati, OH 45226 Myrtle Beach, SC 29577 Location: Airport Office Park (Dillon Road) - has
avigation easement Location: 154 Beach City Road - Unit 2
R510 008 000 0221 0001 Timothy M Reed R510 004 000 0344 0003 Tebrake Group LLC Billing Address: 29 Blue Heron Point Billing Address: 73 Skull Creek Drive #212B Hilton Head Island, SC 29926 Hilton Head Island, SC 29926 Location: Airport Office Park (Dillon Road) - Unit A Location: 154 Beach City Road - Unit 3 R510 008 000 0221 0002 Validation Technologies Inc R510 004 000 0344 0004 Leon Teodoro Jr Billing Address: 5 Baynard Park Road Billing Address: P.O. Box 23232 Hilton Head Island, SC 29928 Hilton Head Island, SC 29925 Location: Airport Office Park (Dillon Road) - Unit B Location: 154 Beach City Road - Unit 4 R510 008 000 0221 0003 Dennis B and Carol E Rogers Jtros R510 004 000 0344 0005 Nancy Osborne Billing Address: 134 Via Castilla Billing Address: 137 Cordillo Parkway #5401 Jupiter, FL 33458 Hilton Head Island, SC 29928 Location: Airport Office Park (Dillon Road) - Unit C Location: 154 Beach City Road - Unit 5 R510 008 000 0221 0004 Dennis B and Carol E Rogers Jtros R510 004 000 0344 0006 Nancy Osborne Billing Address: 134 Via Castilla Billing Address: 137 Cordillo Parkway #5401 Jupiter, FL 33458 Hilton Head Island, SC 29928 Location: Airport Office Park (Dillon Road) - Unit D Location: 154 Beach City Road - Unit 6 R510 008 000 0221 0005 Scacchi Enterprises LLC R510 004 000 0344 0007 Brooklyn Bridge Ltd Co Billing Address: 16 Kings Court Billing Address: 17 Plumbridge Lane Hilton Head Island, SC 29926 Hilton Head Island, SC 29928 Location: Airport Office Park (Dillon Road) - Unit E Location: 154 Beach City Road - Unit 7 R510 008 000 0221 0006 Esquivel Enterprises LLC R510 004 000 0344 0008 Garamound LLC Billing Address: 4 Fox Meadow Drive Billing Address: 154 Beach City Road Unit H Bluffton, SC 29910 Hilton Head Island, SC 29926
Table B.6.3-3 Property Acquisition for the 5,000-Foot Alternative
Hilton Head Island Airport Parcel # Property Owner Parcel # Property Owner
Deficiency Correction 5,000-Foot Extension Location: Airport Office Park (Dillon Road) - Unit F Location: 154 Beach City Road - Unit 8 R510 008 000 0221 0007 Fantasy Tan Air Brush Tanning System R510 004 000 0344 0009 Brooklyn Bridge Ltd Co Billing Address: P.O. Box 5370 Billing Address: 17 Plumbridge Lane Hilton Head Island, SC 29938 Hilton Head Island, SC 29928 Location: Airport Office Park (Dillon Road) - Unit G Location: 154 Beach City Road - Unit 9 R510 008 000 0221 0008 Susan K and Rickey E Hicks Jtros R510 004 000 0344 0010 Brooklyn Bridge Ltd Co Billing Address: 304 Mariners Cove Billing Address: 17 Plumbridge Lane Hilton Head Island, SC 29926 Hilton Head Island, SC 29928 Location: Airport Office Park (Dillon Road) - Unit H Location: 154 Beach City Road - Unit 10 R510 008 000 0221 0009 Susan K and Rickey E Hicks Jtros R510 004 000 0344 0011 Brooklyn Bridge Ltd Co Billing Address: 304 Mariners Cove Billing Address: 17 Plumbridge Lane Hilton Head Island, SC 29926 Hilton Head Island, SC 29928 Location: Airport Office Park (Dillon Road) - Unit I Location: 154 Beach City Road - Unit 11 R510 008 000 0221 0010 Barbara Baroni Trustee R510 004 000 0344 0012 Brooklyn Bridge Ltd Co Billing Address: 5 Turrett Shell Billing Address: 17 Plumbridge Lane Hilton Head Island, SC 29926 Hilton Head Island, SC 29928 Location: Airport Office Park (Dillon Road) - Unit J Location: 154 Beach City Road - Unit 12 R510 004 000 0344 0013 Brooklyn Bridge Ltd Co Billing Address: 17 Plumbridge Lane Hilton Head Island, SC 29928 Location: 154 Beach City Road - Unit 13 R510 004 000 0344 0014 Brooklyn Bridge Ltd Co
Billing Address: 17 Plumbridge Lane Hilton Head Island, SC 29928
Location: 154 Beach City Road - Unit 14
R510 004 000 0343 0000 Francis Marie Hartis Trustee Billing Address: 148 Beach City Road
Hilton Head Island, SC 29928 Location: 148 Beach City Road - has avigation easement

HILTON HEAD ISLAND AIRPORT
MASTER PLAN UPDATE
Appendix B – Public Involvement TALBERT & BRIGHT B-38
B.6.4 Rick Caporale’s (Beaufort County Council) Questions (Received October 14 and 19, 2010)
1. Page 7 of the July 3 Talbert & Bright response to questions received from Beaufort County as a Consolidated Question List, Item D. 1. i., notes the T&B recommendation to bring the Runway 03-21/Taxiway ‘A’ separation into compliance with FAA design standards.
What is the underlying reason for our current non-compliance? If we were not contemplating the extension of the runway to accommodate larger aircraft, would this project still be required?
Runway to taxiway separation standards are predicated on the airport reference code (ARC) and the existing/future visibility minimums expected. The higher the ARC and the lower the visibility minimums, the greater the runway to taxiway separation distances. For Hilton Head Island Airport, with an ARC of C-II and runways with instrument approach minimums as low as ¾-mile visibility, FAA Advisory Circular 150-5300-13 – Airport Design (as amended) includes a separation standard of 300 feet between the runway and taxiway. The Hilton Head Island Airport currently meets this standard for Taxiway ‘F’. However, Taxiway ‘A’ does not meet this standard since it is only 200 feet from the runway centerline. FAA policy requires that all deviations from standards be corrected prior to undertaking any other airfield development projects.
If the runway is not extended beyond its current 4,300', will the modification to the current separation be required? Can the existing Runway 03-21/Taxiway A separation remain as it is in this circumstance?
Runway to taxiway separation standards are predicated on the airport reference code (ARC) and the existing/future visibility minimums expected. The higher the ARC and the lower the visibility minimums, the greater the runway to taxiway separation distances. For Hilton Head Island Airport, with an ARC of C-II and runways with instrument approach minimums as low as ¾-mile visibility, FAA Advisory Circular 150-5300-13 – Airport Design (as amended) includes a separation standard of 300 feet between the runway and taxiway. The Hilton Head Island Airport currently meets this standard for Taxiway ‘F’. However, Taxiway ‘A’ does not meet this standard since it is only 200 feet from the runway centerline. FAA policy requires that all deviations from standards be corrected prior to undertaking any other airfield development projects.
If the runway is extended to 4,600', will the modification to the current separation be required? Why?
Runway to taxiway separation standards are predicated on the airport reference code (ARC) and the existing/future visibility minimums expected. The higher the ARC and the lower the visibility minimums, the greater the runway to taxiway separation distances. For Hilton Head Island Airport, with
an ARC of C-II and runways with instrument approach minimums as low as ¾-mile visibility, FAA Advisory Circular 150-5300-13 – Airport Design (as amended) includes a separation standard of 300 feet between the runway and taxiway. The Hilton Head Island Airport currently meets this standard for Taxiway ‘F’. However, Taxiway ‘A’ does not meet this standard since it is only 200 feet from the runway centerline. FAA policy requires that all deviations from standards be corrected prior to undertaking any other airfield development projects.
If the runway is extended to 5,000', will the modification to the current separation be required? Why?
Runway to taxiway separation standards are predicated on the airport reference code (ARC) and the existing/future visibility minimums expected. The higher the ARC and the lower the visibility minimums, the greater the runway to taxiway separation distances. For Hilton Head Island Airport, with an ARC of C-II and runways with instrument approach minimums as low as ¾-mile visibility, FAA Advisory Circular 150-5300-13 – Airport Design (as amended) includes a separation standard of 300 feet between the runway and taxiway. The Hilton Head Island Airport currently meets this standard for Taxiway ‘F’. However, Taxiway ‘A’ does not meet this standard since it is only 200 feet from the runway centerline. FAA policy requires that all deviations from standards be corrected prior to undertaking any other airfield development projects.
If the runway is extended to 5,400', will the modification to the current separation be required? Why?
Runway to taxiway separation standards are predicated on the airport reference code (ARC) and the existing/future visibility minimums expected. The higher the ARC and the lower the visibility minimums, the greater the runway to taxiway separation distances. For Hilton Head Island Airport, with an ARC of C-II and runways with instrument approach minimums as low as ¾-mile visibility, FAA Advisory Circular 150-5300-13 – Airport Design (as amended) includes a separation standard of 300 feet between the runway and taxiway. The Hilton Head Island Airport currently meets this standard for Taxiway ‘F’. However, Taxiway ‘A’ does not meet this standard since it is only 200 feet from the runway centerline. FAA policy requires that all deviations from standards be corrected prior to undertaking any other airfield development projects.
2. Page 8 of the Talbert & Bright response to questions received from Beaufort County as a consolidated Question List, Item D. 2. c., lists the length of the EMAS surfaces on both ends of the runway as 450'. You also make the statement that the length of the EMAS ..."is an estimate and will be determined by the EMAS manufacturer."...
Since the FAA recommended length of EMAS surfaces is 600' (although the FAA does acknowledge that lengths can be shorter
depending on circumstances), what are the ramifications if the manufacturer determines the EMAS needs to be longer?
The EMAS will always be shorter than the RSA limit and will never be longer than 600 feet for HXD. The 600-foot length is established by the FAA requirements for the runway safety area (RSA) and not the length of the EMAS. An RSA length, the distance from the end of the runway to the limit of the RSA, of 600 feet is allowable at HXD provided an EMAS is installed. If no EMAS is installed, the RSA length required would be 1,000 feet.
If on the South end (Runway 03), since space is absolutely limited by airport boundaries, would additional feet of EMAS length be subtracted from (and therefore limit) runway length on the south end, OR, would the additional Feet of EMAS length be added to the runway length on the North End (Runway 21)?
The length of the EMAS is established in accordance with FAA Advisory Circular 150/5220-22A – Engineered Materials Arresting Systems (EMAS). In no case will the EMAS exceed the RSA limit of 600 feet. The length of 450 feet was only an approximated length based on Figure A2-7 of FAA Advisory Circular 150/5220-22A – Engineered Materials Arresting Systems (EMAS) for a Gulfstream GW III. The design of the EMAS arresting bed would be adjusted in order to keep its length within the RSA.
Is it conceivable that IF the EMAS length were determined by the manufacturer to be 600' on both ends of the runway, that the 150' additional from the South and the 150' from the North would then dictate that the North End runway be lengthened the 150' from the South with the end result that the North end would increase its total paved space by an additional 300' (150' runway and 150' EMAS)?
No, this will never be the case. The EMAS will always be shorter than the RSA limit, and the distance on the south end from the property line to the end of Runway 3 can never be more than a total of 600 feet.
Runway Length Requirements (Pages 26-30) Chapter 4 of AC 150/5325-4B defines the runway length calculations for regional jets. There has been much discussion about the viability of the Bombardier Q 400 and the CRJ 200 as the aircraft that could provide future commercial service at the HXD. What would be the runway length requirements for these aircraft under the same assumptions (i.e., with temperature, % useful load, runway wind coverage, elevation above sea level, etc.) used in Section 4.2 of the master Plan Report?
On the basis of the historic and projected aircraft operations and the utilization of FAA’s mandatory runway design procedures, a length of 5,400 feet was determined to satisfy the runway requirements at HXD. As part of the determination for the runway length, the airport planning manuals for each of the commercial service aircraft that historically,
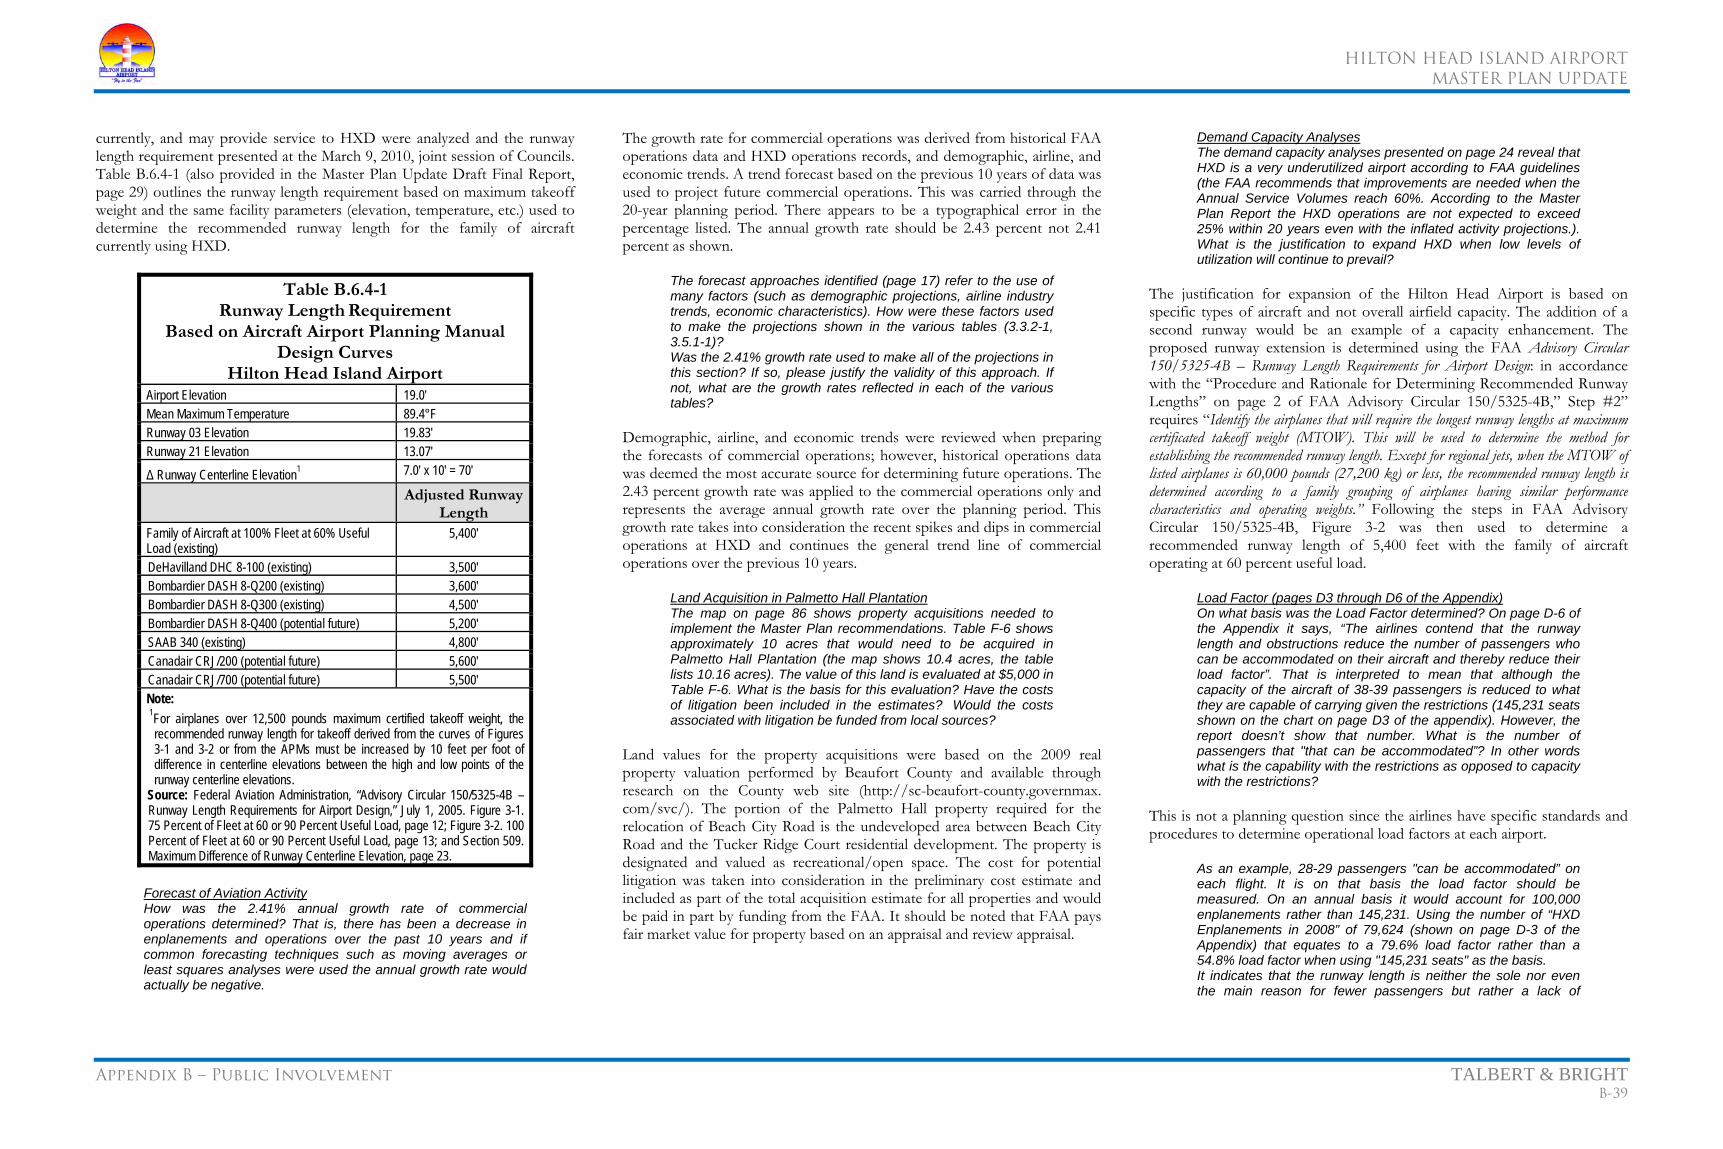
HILTON HEAD ISLAND AIRPORT
MASTER PLAN UPDATE
Appendix B – Public Involvement TALBERT & BRIGHT B-39
currently, and may provide service to HXD were analyzed and the runway length requirement presented at the March 9, 2010, joint session of Councils. Table B.6.4-1 (also provided in the Master Plan Update Draft Final Report, page 29) outlines the runway length requirement based on maximum takeoff weight and the same facility parameters (elevation, temperature, etc.) used to determine the recommended runway length for the family of aircraft currently using HXD.
Table B.6.4-1 Runway Length Requirement
Based on Aircraft Airport Planning Manual Design Curves
Hilton Head Island Airport Airport Elevation 19.0′ Mean Maximum Temperature 89.4°F Runway 03 Elevation 19.83′ Runway 21 Elevation 13.07′
Δ Runway Centerline Elevation1 7.0′ x 10′ = 70′
Adjusted Runway Length
Family of Aircraft at 100% Fleet at 60% Useful Load (existing)
5,400′
DeHavilland DHC 8-100 (existing) 3,500′ Bombardier DASH 8-Q200 (existing) 3,600′ Bombardier DASH 8-Q300 (existing) 4,500′ Bombardier DASH 8-Q400 (potential future) 5,200′ SAAB 340 (existing) 4,800′ Canadair CRJ/200 (potential future) 5,600′ Canadair CRJ/700 (potential future) 5,500′ Note: 1For airplanes over 12,500 pounds maximum certified takeoff weight, the recommended runway length for takeoff derived from the curves of Figures 3-1 and 3-2 or from the APMs must be increased by 10 feet per foot of difference in centerline elevations between the high and low points of the runway centerline elevations.
Source: Federal Aviation Administration, “Advisory Circular 150/5325-4B – Runway Length Requirements for Airport Design,” July 1, 2005. Figure 3-1. 75 Percent of Fleet at 60 or 90 Percent Useful Load, page 12; Figure 3-2. 100 Percent of Fleet at 60 or 90 Percent Useful Load, page 13; and Section 509. Maximum Difference of Runway Centerline Elevation, page 23.
Forecast of Aviation Activity How was the 2.41% annual growth rate of commercial operations determined? That is, there has been a decrease in enplanements and operations over the past 10 years and if common forecasting techniques such as moving averages or least squares analyses were used the annual growth rate would actually be negative.
The growth rate for commercial operations was derived from historical FAA operations data and HXD operations records, and demographic, airline, and economic trends. A trend forecast based on the previous 10 years of data was used to project future commercial operations. This was carried through the 20-year planning period. There appears to be a typographical error in the percentage listed. The annual growth rate should be 2.43 percent not 2.41 percent as shown.
The forecast approaches identified (page 17) refer to the use of many factors (such as demographic projections, airline industry trends, economic characteristics). How were these factors used to make the projections shown in the various tables (3.3.2-1, 3.5.1-1)? Was the 2.41% growth rate used to make all of the projections in this section? If so, please justify the validity of this approach. If not, what are the growth rates reflected in each of the various tables?
Demographic, airline, and economic trends were reviewed when preparing the forecasts of commercial operations; however, historical operations data was deemed the most accurate source for determining future operations. The 2.43 percent growth rate was applied to the commercial operations only and represents the average annual growth rate over the planning period. This growth rate takes into consideration the recent spikes and dips in commercial operations at HXD and continues the general trend line of commercial operations over the previous 10 years.
Land Acquisition in Palmetto Hall Plantation The map on page 86 shows property acquisitions needed to implement the Master Plan recommendations. Table F-6 shows approximately 10 acres that would need to be acquired in Palmetto Hall Plantation (the map shows 10.4 acres, the table lists 10.16 acres). The value of this land is evaluated at $5,000 in Table F-6. What is the basis for this evaluation? Have the costs of litigation been included in the estimates? Would the costs associated with litigation be funded from local sources?
Land values for the property acquisitions were based on the 2009 real property valuation performed by Beaufort County and available through research on the County web site (http://sc-beaufort-county.governmax. com/svc/). The portion of the Palmetto Hall property required for the relocation of Beach City Road is the undeveloped area between Beach City Road and the Tucker Ridge Court residential development. The property is designated and valued as recreational/open space. The cost for potential litigation was taken into consideration in the preliminary cost estimate and included as part of the total acquisition estimate for all properties and would be paid in part by funding from the FAA. It should be noted that FAA pays fair market value for property based on an appraisal and review appraisal.
Demand Capacity Analyses The demand capacity analyses presented on page 24 reveal that HXD is a very underutilized airport according to FAA guidelines (the FAA recommends that improvements are needed when the Annual Service Volumes reach 60%. According to the Master Plan Report the HXD operations are not expected to exceed 25% within 20 years even with the inflated activity projections.). What is the justification to expand HXD when low levels of utilization will continue to prevail?
The justification for expansion of the Hilton Head Airport is based on specific types of aircraft and not overall airfield capacity. The addition of a second runway would be an example of a capacity enhancement. The proposed runway extension is determined using the FAA Advisory Circular 150/5325-4B – Runway Length Requirements for Airport Design: in accordance with the “Procedure and Rationale for Determining Recommended Runway Lengths” on page 2 of FAA Advisory Circular 150/5325-4B,” Step #2” requires “Identify the airplanes that will require the longest runway lengths at maximum certificated takeoff weight (MTOW). This will be used to determine the method for establishing the recommended runway length. Except for regional jets, when the MTOW of listed airplanes is 60,000 pounds (27,200 kg) or less, the recommended runway length is determined according to a family grouping of airplanes having similar performance characteristics and operating weights.” Following the steps in FAA Advisory Circular 150/5325-4B, Figure 3-2 was then used to determine a recommended runway length of 5,400 feet with the family of aircraft operating at 60 percent useful load.
Load Factor (pages D3 through D6 of the Appendix) On what basis was the Load Factor determined? On page D-6 of the Appendix it says, “The airlines contend that the runway length and obstructions reduce the number of passengers who can be accommodated on their aircraft and thereby reduce their load factor”. That is interpreted to mean that although the capacity of the aircraft of 38-39 passengers is reduced to what they are capable of carrying given the restrictions (145,231 seats shown on the chart on page D3 of the appendix). However, the report doesn’t show that number. What is the number of passengers that "that can be accommodated”? In other words what is the capability with the restrictions as opposed to capacity with the restrictions?
This is not a planning question since the airlines have specific standards and procedures to determine operational load factors at each airport.
As an example, 28-29 passengers "can be accommodated” on each flight. It is on that basis the load factor should be measured. On an annual basis it would account for 100,000 enplanements rather than 145,231. Using the number of “HXD Enplanements in 2008” of 79,624 (shown on page D-3 of the Appendix) that equates to a 79.6% load factor rather than a 54.8% load factor when using "145,231 seats" as the basis. It indicates that the runway length is neither the sole nor even the main reason for fewer passengers but rather a lack of

HILTON HEAD ISLAND AIRPORT
MASTER PLAN UPDATE
Appendix B – Public Involvement TALBERT & BRIGHT B-40
demand. The reason that Delta stops winter service is a lack of demand not the runway length. Please explain why the report does not show the number of passengers who, "can be accommodated" that would show the capability of the aircraft with the restrictions?
This is not a planning question since the airlines have specific standards and procedures to determine operational load factors at each airport.
Passenger Facility Charges The consultant recommends that PFCs, which are a surcharge on commercial airline tickets, be used to implement capital requirements of the Master Plan (page 93). What affect will this have on the price competiveness of the HHI Airport in comparison with ticket prices for flights out of Hilton Head Savannah International Airport? What affect will the PFCs have on maintaining commercial airline service to HHI?
Charleston International Airport, South Carolina and Savannah-Hilton Head International Airport, Georgia, both have a PFC in place. Initiating a PFC at HXD will not have a material effect on maintaining commercial service at the Airport. The effect will be that implementing a PFC will create a revenue stream that will assist in allowing the Airport to implement some of the projects outlined in the Master Plan Update.
General Aviation Survey What did the analyses of the General Aviation Survey (page B-28) show? This survey should reveal many insights about the economic impacts of the Hilton Head Airport (i.e., purpose of travel, expenditures on HHI, etc.). Why were the results of these surveys not presented within the Master Plan Report?
The general aviation surveys were used to determine the type of aircraft and frequency of general aviation operations at HXD. This information was used to assist in the determination for future airport facility improvements/additions. Copies of the surveys received will be included in electronic format in the Final Master Plan Update Report.
1. Can you supply a thorough cost-benefit analysis for each of the potential alternatives for runway expansion? − Please include Substantiated monetary benefits are shown for expansion alternatives. Complete cost for the expansion alternatives Including. Important costs such as: Reduced property values on homes and real estate properties in close proximity to the expanded runway options Reduced tax revenues to the Town and County from the reduces property values Costs incurred to negotiate and complete the multiple avigation agreements needed with communities impacted by expansion alternatives.
A cost-benefit analysis is not included as part of the Master Plan scope of work. This analysis is typically performed when a major project (project exceeding $5 million) is identified to outline costs for the design and construction phases of the project.
2. Can you supply analysis of the role of turboprop aircraft in future commercial aviation? Please address a fact that airlines are moving away from regional jet options and toward turboprop options for hub-spoke operations.
This task is not included as part of the Master Plan scope of work.
3. Can you comment on the recent acquisition of Mesaba by Pinnacle and the possible impact on the use of Q400 turboprop aircraft? Is it true that they have many in service and ordered for future use?
This question should be answered by Pinnacle Airlines.
4. Can you clearly define whether any of the runway extension options can/will address runway lengths needed by regional jet aircraft.
Based on runway length requirements provided by Bombardier with aircraft operating at maximum takeoff weight and a mean maximum temperature of 89.4°F, the CRJ-200 will need 5,600 feet of takeoff length and the CRJ-700 will need 5,500 feet of takeoff length. Based on this information, it is anticipated that the CRJ-200 and CRJ-700 should be able to operate on a 5,400-foot runway length at a reduced load factor as determined by the airlines.
5. Please comment on the probability of your forecast passenger enplanements; can you supply an analysis on enplanement estimates over a range of probabilities?
The standard deviation for the forecast of annual enplanements is 15,019 with a probability of 94.6 percent of 124,056 annual enplanements occurring in 2029. The range for this probability analysis is based on the maximum and minimum enplanement from 1998 to 2008 (61,419 to 103,028).
6. What is your source for the data concerning the reliance of the Town and County tourist industry on Airport commercial and general aviation operations?
Sources that were reviewed include:
• Surveys performed by the Savannah-Hilton Head Island International Airport
• Hilton Head Island Chamber of Commerce • Lowcountry Regional Council of Government
• Beaufort County Comprehensive Plan • Town of Hilton Head Island Comprehensive Plan
7. Can you include the environmental impact to communities from increased noise due to each expansion option? Also what likely impact will the ongoing Noise Study or the commitment to noise mitigation have on your cost estimates for each alternative?
The 65 DNL noise contour encompasses the following acreage:
• 4,300-foot runway – 126.5 acres • 4,600-foot runway – 127.8 acres (1.3-acre increase) • 5,000-foot runway – 130.8 acres (4.3-acre increase) • 5,400-foot runway – 135.3 acres (8.8-acre increase)
The Master Plan Update assumes that all trees will be cleared to 34:1. There currently is no commitment to noise mitigation in the cost estimates for each alternative as the 65 DNL noise contour does not impact incompatible land use in accordance with FAA Part 150 requirements. This will be evaluated in detail when the runway extension project is identified for design and construction and the environmental documentation is performed.
B.6.5 Joe Zimmerman’s (Beaufort County Airports Board) Questions (Received October 19, 2010)
1. Table 3.5.1-1, Commercial Service Operations Forecast on page 20 shows operations increasing from 7,208 in 2009 to 15,069, an increase of 109.1%. The historical/forecast column on Table 3.3.2-1, Enplanements Forecast Comparison on page 18, however, shows enplanements increasing from 75,073 in 2009 to 124,056 in 2029, an increase of 65%. Put another way, if we take 50% of the commercial operations in 2009 and 2029 (to account only for the departures), and divide those into the enplanements for the same years, we have an average enplanements per operation of 21 in 2009 and 16.5 in 2029. The two forecasts show, then, that we will have more flights but fewer passengers per flight. Does this resemble something the airlines would find acceptable?
The commercial operations and annual enplanements forecasts were developed independently using historical data. It is true that there exists a relationship between these two airport activity forecasts; however, an enplanements per commercial operations analysis is not included as part of the forecasts due to changes in commercial aircraft capacities. An example of
HILTON HEAD ISLAND AIRPORT
MASTER PLAN UPDATE
Appendix B – Public Involvement TALBERT & BRIGHT B-41
this scenario would be the introduction of a "feeder" service airline flying smaller aircraft between hub and non-hub airports.
2. Table 3.5.1-1, Commercial Service Operations Forecast on page 20 lists 7,208 commercial service operations in 2009. Table 3.5.3-1, Annual Operations By Type, lists 9,353 commercial operations. What is the cause for this difference?
Table 3.5.3-1 includes commercial operations from air carrier and air taxi operations. The commercial service operations forecast in Table 3.5.1-1 include only air carrier operations. The air taxi and air carrier operations were summed so that they could be compared to the FAA Terminal Area Forecasts, which list annual operations in this format.
3. Page 31 has a section discussing the Runway Obstacle Free Area (ROFA). The verbiage below Table 4.2.8-1 states that the FAA has stated it would provide a waiver for the existing ROFA. It goes on to say that …”any new construction would require ROFA compliance and would require purchase of property.”… Would you please explain this in more detail. Is it referring to any new construction and what triggers the “purchase of property?”
FAA Advisory Circular 150/5300-13 – Airport Design (as amended), paragraph 307 – Object Free Area (page 23) states:
The runway OFA clearing standard requires clearing the OFA of aboveground objects protruding above the runway safety area edge elevation.
4. Page 34 discusses various storage requirements. Relative to
Table 4.3.1.4-1, and Table 4.3.1.5-1, they indicate that approximately 4.5 acres of new apron for based and transient aircraft will be required by 2029. Have the projected cost estimates for this new apron space presented later in the document taken into account the increased drainage requirements all of this new concrete will require? If so, what will it cost?
No, these costs were not included in the draft report, but a preliminary opinion of these costs will be estimated and provided in the final Master Plan Update Report.
5. Table 4.3.2.3-1, Commercial Service Terminal Automobile Parking Space Requirements, indicates that parking spaces will grow from 325 to 590 by 2029. Will the additional spaces be able to be placed on currently existing airport property?
Will there be any impact from them on the church which lies close to the current parking lot?
Yes. Based on the Town’s buffer requirements, there is no anticipated impact to the church.
6. Page 39 begins the Runway Extension Alternatives Analysis. In Section 5.1.2, Existing 4,300-Foot Runway (Configuration in Compliance), in relation to current deficiencies, you state: …”Regardless of what alternative is chosen to address the need of the critical aircraft currently using HXD, these deficiencies SHOULD be addressed.”… If there were no changes to the runway length, would these compliance issues HAVE to be addressed; or, could the current waivers remain in place?
Runway to taxiway separation standards are predicated on the airport reference code (ARC) and the existing/future visibility minimums expected. The higher the ARC and the lower the visibility minimums, the greater the runway to taxiway separation distances. For Hilton Head Island Airport, with an ARC of C-II and runways with instrument approach minimums as low as ¾-mile visibility, FAA Advisory Circular 150-5300-13 – Airport Design (as amended) includes a separation standard of 300 feet between the runway and taxiway. The Hilton Head Island Airport currently meets this standard for Taxiway ‘F’. However, Taxiway ‘A’ does not meet this standard since it is only 200 feet from the runway centerline. FAA policy requires that all deviations from standards be corrected prior to undertaking any other airfield development projects.
7. Also in Section 5.1.2, Section 5.1.4, Section 5.1.4.1 and Section 5.1.4.2, reference is made to the EMAS being 600’ wherever it is used. The overhead pictures on pages 41, 44, and 45, however, all show the EMAS installation at 450’ Which is correct? Since the generally recommended length of EMAS installations is 600’, wouldn’t it be more conservative to produce the Plan with that length in mind? If 600’ is the correct number, what implications does that have, given the airport’s constricted available space, on runway length and positioning?
The reference applies to the length of the runway safety area (RSA) being 600 feet. The length of the EMAS is 450 feet, which is an approximated length based on Figure A2-7 of FAA Advisory Circular 150/5220-22A – Engineered Materials Arresting Systems (EMAS) for a Gulfstream GW III. The design of the EMAS arresting bed would be adjusted in order to keep its length within the RSA.
8. Sections 5.1.2, and Section 5.1.4 contain various cost estimates for different runway length alternatives. Within
each separate alternative Table, there is a one-line item entitled “Construction.” There is no detail breakdown in the Master Plan as to what makes up this number. In other words, how much is for concrete/asphalt, how much for drainage work, how much for lighting, etc. The document provides detailed projections for the future hangars and apron work but not for the runway length alternatives. Can you provide this data?
Tables B.6.5-1 (page B-41), B.6.5-2 (page B-41), B.6.5-3 (page B-42), and B.6.5-4 (page B-42) provides the preliminary project cost estimate for each alternative without construction of the EMAS. This data will be included in the final report. It should be noted that these costs and the costs presented in the Master Plan Update Draft Final Report are preliminary estimates and not detailed engineering costs based on detailed design work. Detailed engineering costs will be provided when a specific project is identified for design and construction.
9. On pages 8 & 9 – Grant History, on which of the grants which are listed have the federal “strings” expired? In other words, it has been 26 years since the first grant was issued. Does this grant still carry requirements/obligations which could trigger a “claw-back” of any of the funds issued pursuant to that grant?
In accordance with FAA Terms and Conditions of Accepting Airport Improvement Program Grants (December 15, 2009); the terms, conditions, and assurances of the grant agreement shall remain in full force and effect throughout the useful life of the facilities developed or equipment acquired for an airport development or noise compatibility program project, or throughout the useful life of the project items installed within a facility under a noise compatibility program project, but in any event not to exceed 20 years from the date of acceptance of a grant offer of federal funds for the project. However, there shall be no limit on the duration of the assurances regarding exclusive rights and airport revenue so long as the airport is used as an airport. There shall be no limit on the duration of the terms, conditions, and assurances with respect to real property acquired with federal funds. Furthermore, the duration of the Civil Rights assurance shall be specified in the assurances.
10. Section 9.3.1 on page 88 begins the discussion of Potential Funding Sources. There is no mention of a General Aviation landing fee. What is your opinion of the potential revenue to be gained by implementing such a fee?
Commercial service airlines pay landing fees, but general aviation aircraft are not subject to landing fees.However, general aviation aircraft fees charged by Signature Flight Support are outlined in Table B.6.1-2 (page B-35). Beaufort County receives 3 percent of all revenue produced by Signature Flight

HILTON HEAD ISLAND AIRPORT
MASTER PLAN UPDATE
Appendix B – Public Involvement TALBERT & BRIGHT B-42
Table B.6.5-1 Preliminary Project Cost Estimate*
Existing 4,300-Foot Runway (Configuration in Compliance) Hilton Head Island Airport
Item No.
Spec No. Description Qty Unit
Unit Price Total
1 P-150 Mobilization 1 LS $62,000 $62,000 2 Rep Pavement Removal 25,700 SY $2.60 $66,820 3 P-151 Clearing and Grubbing 5 AC $2,000 $10,000 4 P-152 Excavation 25,000 CY $5 $125,000 5 P-156 Erosion and Sediment Control 1 LS $50,000 $50,000 6 P-209 Crushed Aggregate Base Course 7,400 CY $13 $96,200 7 P-401 Bituminous Asphaltic Surface Course 6,000 TN $85 $510,000 8 P-620 Pavement Markings 6,000 SF $2 $12,000 9 D-701 15" RCP, Class IV 600 LF $37.50 $22,500 10 D-701 24" RCP, Class IV 900 LF $45 $40,500 11 D-701 36" RCP, Class IV 500 LF $65 $32,500 12 D-751 Drop Inlet 12 EA $4,000 $48,000 13 D-751 Storm Drainage Manhole 4 EA $4,000 $16,000 14 D-751 Flared End Section 6 EA $2,500 $15,000 15 L-108 Trenching, Cable, Counterpoise, Conduit 9,500 LF $10 $95,000 16 L-125 Taxiway Lights 60 EA $900 $54,000 17 L-125 Miscellaneous Electrical 1 LS $34,000 $34,000 18 T-901 Seeding 20 AC $1,000 $20,000 19 T-908 Mulching 20 AC $1,000 $20,000 10% Contingency $127,000
Construction Total $1,456,520 Topographic Survey, Design, Bidding, Construction Administration, Inspection, and Testing $293,480
Project Total $1,750,000 *These are estimations only and are not to be relied on without further confirmation. Source: Talbert & Bright, Inc., October 2010.
Table B.6.5-2 Preliminary Project Cost Estimate*
Alternative No. 2 – Phase 1a (4,600-Foot Runway Constrained Configuration)
Hilton Head Island Airport Item No.
Spec No. Description Qty Unit
Unit Price Total
1 P-150 Mobilization 1 LS $79,000.00 $79,000 2 Rep Pavement Removal 26,000 SY $2.50 $65,000 3 P-151 Clearing and Grubbing 5 AC $2,000.00 $10,000 4 P-152 Excavation 30,000 CY $5.00 $150,000 5 P-156 Erosion and Sediment Control 1 LS $50,000.00 $50,000 6 P-209 Crushed Aggregate Base Course 10,200 CY $13.00 $132,600 7 P-401 Bituminous Asphaltic Surface Course 8,200 TN $85.00 $697,000 8 P401 Pavement Grooving 2,670 SY $1.50 $4,005 9 P-620 Pavement Markings 6,800 SF $2.00 $13,600 10 D-701 15" RCP, Class IV 725 LF $37.00 $26,825 11 D-701 24" RCP, Class IV 950 LF $45.00 $42,750 12 D-701 36" RCP, Class IV 500 LF $65.00 $32,500 13 D-751 Drop Inlet 15 EA $4,000.00 $60,000 14 D-751 Storm Drainage Manhole 4 EA $4,000.00 $16,000 15 D-751 Flared End Section 6 EA $2,500.00 $15,000 16 L-108 Trenching, Cable, Counterpoise, Conduit 10,500 LF $10.00 $105,000 17 L-125 Taxiway Lights 70 EA $900.00 $63,000 18 L-125 Runway Lights 6 EA $1,000.00 $6,000 19 L-125 L-858 Airfield Guidance Sign 2 EA $4,000.00 $8,000 20 L-125 Miscellaneous Electrical 1 LS $40,000.00 $40,000 21 T-901 Seeding 23 AC $1,000.00 $23,000 22 T-908 Mulching 23 AC $1,000.00 $23,000 10% Contingency $158,000
Construction Total $1,820,280 Topographic Survey, Design, Bidding, Construction Administration, Inspection, And Testing $362,720
Project Total $2,183,000 *These are estimations only and are not to be relied on without further confirmation. Source: Talbert & Bright, Inc., October 2010.

HILTON HEAD ISLAND AIRPORT
MASTER PLAN UPDATE
Appendix B – Public Involvement TALBERT & BRIGHT B-43
Table B.6.5-3 Preliminary Project Cost Estimate*
Alternative No. 2 – Phase 1 (5,000-Foot Runway Constrained Configuration)
Hilton Head Island Airport Item No.
Spec No. Description Qty Unit
Unit Price Total
1 P-150 Mobilization 1 LS $120,000.00 $120,000 2 Rep Pavement Removal 26,000 SY $2.50 $65,000 3 P-151 Clearing and Grubbing 9 AC $2,000.00 $18,000 4 P-152 Excavation 45,000 CY $5.00 $225,000 5 P-156 Erosion and Sediment Control 1 LS $125,000.00 $125,000 6 P-209 Crushed Aggregate Base Course 15,450 CY $13.00 $200,850 7 P-401 Bituminous Asphaltic Surface Course 12,400 TN $85.00 $1,054,000 8 P-401 Pavement Grooving 6,230 SY $1.50 $9,345 9 P-620 Pavement Markings 8,200 SF $2.00 $16,400 10 D-701 15" RCP, Class IV 1,050 LF $37.00 $38,850 11 D-701 24" RCP, Class IV 1,250 LF $45.00 $56,250 12 D-701 36" RCP, Class IV 900 LF $65.00 $58,500 13 D-751 Drop Inlet 24 EA $4,000.00 $96,000 14 D-751 Storm Drainage Manhole 6 EA $4,000.00 $24,000 15 D-751 Flared End Section 12 EA $2,500.00 $30,000 16 L-108 Trenching, Cable, Counterpoise, Conduit 13,500 LF $10.00 $135,000 17 L-125 Taxiway Lights 90 EA $900.00 $81,000 18 L-125 Runway Lights 16 EA $1,000.00 $16,000 19 L-125 L-858 Airfield Guidance Sign 4 EA $4,000.00 $16,000 20 L-125 Miscellaneous Electrical 1 LS $70,000.00 $70,000 21 T-901 Seeding 28 AC $1,000.00 $28,000 22 T-908 Mulching 28 AC $1,000.00 $28,000 10% Contingency $120,000.00 $239,000
Construction Total $2,750,195 Topographic Survey, Design, Bidding, Construction Administration, Inspection, And Testing $539,805
Project Total $3.290,000 *These are estimations only and are not to be relied on without further confirmation. Source: Talbert & Bright, Inc., October 2010.
Table B.6.5-4 Preliminary Project Cost Estimate*
Alternative No. 2 (5,400-Foot Runway Constrained Configuration) Hilton Head Island Airport
Item No.
Spec No. Description Qty Unit
Unit Price Total
1 P-150 Mobilization 1 LS $153,000.00 $153,000 2 Rep Pavement Removal 26,000 SY $2.50 $65,000 3 P-151 Clearing and Grubbing 14 AC $2,000.00 $28,000 4 P-152 Excavation 60,000 CY $5.00 $300,000 5 P-156 Erosion and Sediment Control 1 LS $160,000.00 $160,000 6 P-209 Crushed Aggregate Base Course 20,100 CY $13.00 $261,300 7 P-401 Bituminous Asphaltic Surface Course 16,200 TN $85.00 $1,377,000 8 P-402 Pavement Grooving 9,790 SY $1.50 $14,685 9 P-620 Pavement Markings 9,500 SF $2.00 $19,000 10 D-701 15" RCP, Class IV 1,250 LF $37.00 $46,250 11 D-701 24" RCP, Class IV 1,500 LF $45.00 $67,500 12 D-701 36" RCP, Class IV 1,100 LF $65.00 $71,500 13 D-751 Drop Inlet 34 EA $4,000.00 $136,000 14 D-751 Storm Drainage Manhole 8 EA $4,000.00 $32,000 15 D-751 Flared End Section 16 EA $2,500.00 $40,000 16 L-108 Trenching, Cable, Counterpoise, Conduit 16,000 LF $10.00 $160,000 17 L-125 Taxiway Lights 110 EA $900.00 $99,000 18 L-125 Runway Lights 22 EA $1,000.00 $22,000 19 L-125 L-858 Airfield Guidance Sign 4 EA $4,000.00 $16,000 20 L-125 Miscellaneous Electrical 1 LS $85,000.00 $85,000 21 T-901 Seeding 33 AC $1,000.00 $33,000 22 T-908 Mulching 33 AC $1,000.00 $33,000 10% Contingency $307,000
Construction Total $3,526,235 Topographic Survey, Design, Bidding, Construction Administration, Inspection, And Testing $688,765
Project Total $4,215,000 *These are estimations only and are not to be relied on without further confirmation. Source: Talbert & Bright, Inc., October 2010.

HILTON HEAD ISLAND AIRPORT
MASTER PLAN UPDATE
Appendix B – Public Involvement TALBERT & BRIGHT B-44
Support. It is the opinion of TBI that general aviation aircraft fees charged by Signature Flight Support are in line with industry standards.
11. Section 9.3.10 discusses Passenger Facility Charges. If the decision is made to go forward with this type of funding, can it be done independently of the Master Plan noted projects, or must the PFC be tied to specific projects?
A PFC can be done independently of a Master Plan; however, depending on the projects submitted in a PFC application, certain projects must be on the current ALP and have air space and environmental studies completed.
12. On pages D.3. and D.4., there is a discussion of Airline Activity, Demand Profile and Load Factors. On page D.4. you make the statement: …”The decline in load factor at HXD is primarily attributable to the load restrictions placed on the commercial airlines operating at HXD as a result of the runway length and obstructions.”… In Figure D.2.4-1, Airport Load Factor, the lighter colored bars show a significant increase in seats offered in the market in the years 2007 and 2008. Enplanements, the darker colored bars, remained virtually the same in both of those years. It would appear to the uninitiated that the airlines miscalculated demand by a large margin and put a lot more seats into the market than they could fill, regardless of restrictions. If it were simply the restrictions caused by runway length and trees, I suspect the load factors in 2007 and 2008 would have much more closely resembled those in the earlier years. It would appear that the airlines learned a lesson, and also reflected the economic situation, because in 2009, they cut back on the number of seats. Unfortunately, the economic downturn’s effect on individuals caused a more precipitous decline in enplanements, and the load factor, while approximately the same as in 2008, didn’t return to 2004 -2006 levels. My question is: is it also reasonable to attribute a meaningful portion of the decline in load factor to airline miscalculation of demand and the economy, as well as the aforementioned restrictions?
Load factors decreased in 2007 and 2008 following a downward trend that began in 2005.
13. On page D-4, in the paragraph below Table D.2.5-1, you comment that 70% of the theoretical local demand is being served elsewhere. Your basis for this comment is a calculation performed by taking the population of Beaufort County and multiplying it by 1.5 (the average enplanements for the United States population). You also define elsewhere that the ASA for HXD is Beaufort County. I would submit to
you that the ASA is more reasonably the area of Beaufort County south of the Broad River. Airline passengers north of the Broad can only get to HXD by traveling down Route 170 to Route 278. Once they reach that intersection, they have a much easier trip to Savannah than to HXD. Coupled with the greater number of locations served out of Savannah, they have a much greater incentive to head that way. On the positive side, the demographics south of the Broad (age and discretionary dollars available to spend) would argue for a higher multiplier than the 1.5. Regardless, a demand number of 227,000 appears grossly overstated under any circumstances. Can you, using real world assumptions, develop a more reasonable estimate of demand?
Using the per capita ratio as a basis for estimating demand at the Airport is consistent with industry standards.
14. Can you please assess, on a realistic basis, the potential use of Regional Jets at HXD. This is a major point of contention. Can a CRJ 200 safely land from the North on Runway 21’s, displaced threshold-limited 4,597’? If so, will the passenger load be limited? This is important because, I believe the majority of landings occur from the North. Also, if, as we read, 50 seat RJ’s are being phased out, what is the most likely replacement and will it be able to land under the above-noted conditions?
It is TBI’s opinion that it is possible for Delta Airlines (Mesaba Airlines) to use regional jets at HXD with load restrictions, provided that the runway is extended to the recommended 5,400 feet. Landing the CRJ-200 and CRJ-700 aircraft on 4,597 feet is possible with load restrictions. With respect to the 50-seat CRJ, TBI has not received any information from the airlines regarding replacement of those aircraft.
B.6.6 Ken Heitzke’s (Town of Hilton Head Island Council) Questions (Received October 19, 2010)
Commercial Service Questions -On page D-6, T&B states the CONCLUSION that “Due to the constraints of runway length and obstructions at HXD (HH Airport), the existing airport facilities (4300 feet) are MARGINALLY ADEQUATE for viable service to the Charlotte and Atlanta hubs at this time”, 1. Is it not correct that with the existing 4300 foot runway, AFTER the tree obstructions are resolved, will be even more viable service for the foreseeable future?
It is TBI’s opinion that even after the tree removal the existing facilities are marginally adequate for the current level of commercial service and the foreseeable future.
2. If not, is it not correct that with an airport runway extension of 300 feet to 4600’, even expanded service to other location should be available for the foreseeable future?
It is TBI’s opinion that the runway at HXD needs to be 5,400 feet in length to provide viable commercial service.
-Since one of the key issues for the master plan was support of commercial aviation, and on page 87 there is a one line entry for “Commercial Service Terminal Expansion” costing $1.9, is there a description of this project and a backup detail for this project since this is a benefit that would have considerable support in the community?
The terminal renovation project began in August 2008, and the budget was $1.9 million. It is TBI’s understanding that there is an existing scope of work that described the details of the project.
-Since the use of regional jets (CRJ) for commercial aviation at the Hilton Head Island Airport has been debated for years in our community, and it must be clearly defined to stop the future arguments, and the issue is now more complex since Mr. Fred Seritt was quoted this month in the Island Packet as saying regional jets need “6500 feet or longer” which is in direct conflict with the T&B study (Table 4.2.2.2-3) which states that a 5600 foot runway is needed for CRJ 200 and 5500 feet for a CRJ700, 1. Is the difference of opinion the load factor (available seats that can be filled) for the CRJ?
TBI’s information was derived from the CRJ-200 and CRJ-700 Airport Planning Manuals provided by Bombardier.
2. If the CRJ load factor is only approximately 60% on the 70 seat CRJ 700, and although is this plane technically available to land using a 5,400 foot runway but will it be profitable for the airline to provide service to our hub cities of Atlanta and Charlotte, considering that on page d-4, it states that the national load levels increased to 79.3 in 2008?
This is not a planning question since the airlines have specific standards and procedures to determine operational load factors at each airport.
3. Considering that the landing distances due to the fixed obstructions (church at one end and office building on the other end) are only 4597 of available feet (see page B-24), would you provide a definitive statement to clear the air on this issue once and for all for commercial aviation?

HILTON HEAD ISLAND AIRPORT
MASTER PLAN UPDATE
Appendix B – Public Involvement TALBERT & BRIGHT B-45
Each airline has its own standard operating procedures; this question needs to be addressed to the airlines.
-Since it is a well known fact that on 7/1/10 Delta sold (www.pncl.com) its regional partner, Mesaba, who provide service to HH Island airport, to Pinnacle Airlines, please provide the T&B best guess of a replacement aircraft that will be used by Pinnacle for HH Airport service? Since Pinnacle also owns Cogan Air, anther regional airlines, does Pinnacle have Dash8, Model 400 aircraft in it existing fleet, and how many are already on order? Would it not be more proper to calculate the airport runway length based on this data, and not the CRJ200 and CRJ700 aircraft that Delta planned for use to replace the current Delta Saab 340 aircraft?
TBI is unable to answer this question; and any questions regarding use of particular aircraft needs to be addressed to the airlines.
-On page D-4, T&B states that the “decline in load factor at HXD is primarily attributable to the load restriction placed on commercial airlines operating at HXD as a result of the runway length and obstructions”. Since this was a key question before the study began, 1. What supporting documentation can be provided to justify this conclusion since many people are aware that the lack of demand is the primary problem with load factors?
Please see quotation from interview with James Seadler of US Airways in section D.2.6 (page D-5) of the report:
For planning purposes, the airlines operating at HXD use a load factor of 60 percent for determining aircraft fleet to meet the air service demand at HXD. This is a result of the operational constraints at HXD (obstructions and runway length). In general, the airlines use 75 percent as a load factor to right size the market with the appropriate aircraft specifically when there are no operational constraints.
Please also see letters from Gary Blevins of Piedmont Airlines (US Airways) and from Dan Sauter of Mesaba Airlines (Delta Airlines).
2. Which is the largest problem for seat restrictions, obstructions or runway length, for USAir? For Delta/Pinnacle?
Based on comments and letters received from representatives of US Airways and Delta Airlines, it is TBI’s understanding that both runway length and obstructions are problems at HXD. Please see quotation from interview with James Seadler of US Airways in section D.2.6 (page D-5) of the report:
For planning purposes, the airlines operating at HXD use a load factor of 60 percent for determining aircraft fleet to
meet the air service demand at HXD. This is a result of the operational constraints at HXD (obstructions and runway length). In general, the airlines use 75 percent as a load factor to right size the market with the appropriate aircraft specifically when there are no operational constraints.
Please also see letters from Gary Blevins of Piedmont Airlines (US Airways) and from Dan Sauter of Mesaba Airlines (Delta Airlines).
-Since on Page D-4, T&B states that the “for service at HXD is negatively affected by the marketing efforts and level of air service at the Savannah/Hilton Head International Airport”, is this a clear statement that the PRIMARY problem with the empty seats at Hilton Head Airport is NOT runway length but the competition from our other airport as result of lower pricing, direct connections, and location of growth areas such as Bluffton?
TBI does not have any data that supports the thesis that runway length is not a problem and that competition from the Savannah-Hilton Head International Airport is the primary problem. Because of the runway length and obstructions that have existed, the type of aircraft and number of seats available have been limited in comparison to SAV. It is difficult to accurately determine what passengers would have done if more seats and less expensive had been available to purchase from Hilton Head when compared to Savannah's available flights and seats.
-On page D-5, since the population of 151,334 used for ASA (Airport Service Area) calculations includes all of Beaufort County including HHI, Beaufort, and Bluffton, is it not more realistic to calculate this based on the population of just Hilton Head Island since other locations of the county will use our airport, the Savannah/Hilton Head Airport since it has the benefits of lower pricing, direct connections, and is a close in terms of driving distances.
Passengers choose their flights and the airport to fly from based on cost, connections, schedule, convenience, participation in airline affinity programs, and good or bad experiences with various airports. It is very likely that potential passengers would travel to the Hilton Head Island Airport from well beyond the Beaufort County line if the flights available met their needs. For this reason, using the 151,334 ASA population is a conservative number on which to base our calculations.
-In order to provide a full understanding of the costs and benefits of the master plan with respect to commercial aviation and general aviation, what is the percentage of probable costs in Table 8.1.1 on Page 97 that are for the benefit of: 1. Commercial aviation?
Twenty eight (28) percent of the probable costs are for commercial aviation projects; 35 percent is shared between commercial service and general aviation for the runway extension.
2. General aviation? Thirty seven (37) percent of the probable costs are for general aviation projects; 35 percent is shared between commercial service and general aviation for the runway extension.
-Since NO discussion or and NO presentation were PREVIOUSLY MADE in any T&B updates on the Master Plan regarding the newly disclosed plans for the over $18 million FOR HANGARS, APRON EXPANSION AND PARKING LOT EXPANSION OF THE GENERAL AVIATION FACILITIES, and this is clearly outside the locally defined objectives of supporting commercial aviation, would these project not be considered EARMARKS buried under the umbrella of expansion for commercial aviation? Since these projects have a severe negative impact on Port Royal plantation due to the loss of over 30 acres of trees (see page 83, and page 86), is there a separate cost/benefits analysis to support the funding of these projects?
No. No.
Other Questions: -Since runway extension construction costs appear to be low, and since and the tables in Section F show most of the other costs breakdowns except for the 4600 foot, 5000 foot, and 5400 foot construction costs, what is in the detail construction costs, including drainage, signage, lighting, tree cutting, legal fees, etc., for: a. the 4600 alternative?
Table B.6.5-2 (page B-41) provides the preliminary project cost estimate without construction of the EMAS. It should be noted, that these costs and the costs presented in the Master Plan Update Draft Final Report are preliminary estimates and not detailed engineering costs based on detailed design work. Detailed engineering costs will be provided when a specific project is identified for design and construction. An additional 20 percent will be added to the construction cost estimate for tree cutting/mitigation, stormwater/environmental mitigation, legal fees, etc., in the final report.
b. the 5000 foot alternative? Table B.6.5-3 (page B-42) provides the preliminary project cost estimate without construction of the EMAS. It should be noted, that these costs and the costs presented in the Master Plan Update Draft Final Report are preliminary estimates and not detailed engineering

HILTON HEAD ISLAND AIRPORT
MASTER PLAN UPDATE
Appendix B – Public Involvement TALBERT & BRIGHT B-46
costs based on detailed design work. Detailed engineering costs will be provided when a specific project is identified for design and construction. An additional 20 percent will be added to the construction cost estimate for tree cutting/mitigation, stormwater/environmental mitigation, legal fees, etc., in the final report.
c. the 5400 foot alternative? Table B.6.5-4 (page B-42) provides the preliminary project cost estimate without construction of the EMAS’. It should be noted that these costs and the costs presented in the Master Plan Update Draft Final Report are preliminary estimates and not detailed engineering costs based on detailed design work. Detailed engineering costs will be provided when a specific project is identified for design and construction. An additional 20 percent will be added to the construction cost estimate for tree cutting/mitigation, stormwater/environmental mitigation, legal fees, etc., in the final report.
-What are the benefits of each of the above alternatives achieved based on: a. 4300 foot runway with trees cut
Page 39 of the Master Plan Update Draft Final Report states:
This alternative leaves HXD in its current configuration, avoiding projects that would result in land disturbances and/or construction impacts extending beyond the control of the existing airport boundary. The property, acquired to bring the taxiways to standard separation, is needed to comply with FAA clearance requirements. Projects that resolve FAA safety matters are implemented to the extent that modifications of FAA airport planning and design standards are avoided. Under this alternative, safety deficiencies based on current FAA standards would be corrected. Overall, this alternative results in increasing the available runway landing length to 4,300 feet of usable runway. However, regaining the total landing length of the existing runway does not address the needs of the critical aircraft currently using HXD.
b. 4600 feet?
Page 46 of the Master Plan Update Draft Final Report states:
Alternative No. 2 – Phase 1a (4,600-foot runway constrained configuration) does not fully address the needs of the critical
aircraft currently using HXD, as outlined in Section 4.2.2 Runway Length requirements (page 26), and therefore was not considered a viable development alternative. c. 5000 feet?
Page 42 of the Master Plan Update Draft Final Report states:
Although Alternative No. 2 – Phase 1 (5,000-foot runway constrained configuration) does not fully address the needs of the critical aircraft currently using HXD, as outlined in Section 4.2.2 Runway Length requirements (page 26), it could be considered as an interim step to achieving a total extension length of 5,400 feet. d. 5400 feet?
Page 42 of the Master Plan Update Draft Final Report states:
Alternative No. 2 (5,400-foot runway constrained configuration) addresses the needs of the critical aircraft currently using HXD, as outlined in Section 4.2.2 Runway Length requirements (page 26). -If the decision is to not extend runway, or extend 300 feet, are all expenses listed in the “Compliance” Table 5.1.2-1 still required or waivers possible? Is the separation of runway and taxiway only a consideration based on the addition of larger jets, and landing speeds, to be accommodated with the longer runway?
No. Runway to taxiway separation standards are predicated on the airport reference code (ARC) and the existing/future visibility minimums expected. The higher the ARC and the lower the visibility minimums, the greater the runway to taxiway separation distances. For Hilton Head Island Airport, with an ARC of C-II and runways with instrument approach minimums as low as ¾-mile visibility, FAA Advisory Circular 150-5300-13 – Airport Design (as amended) includes a separation standard of 300 feet between the runway and taxiway. The Hilton Head Island Airport currently meets this standard for Taxiway ‘F’. However, Taxiway ‘A’ does not meet this standard since it is only 200 feet from the runway centerline. FAA policy requires that all deviations from standards be corrected prior to undertaking any other airfield development projects.
-Why is the EMAS cost not included in Table 9.3.4-1 as an Airfield Project?
The EMAS is included in the runway extension project.
-In table 9.2-1 total costs for runway extensions are listed as
1. 700’ runway extension (extension from 4300’ to 5000’) design and construction” $5.27 million, and 2. 400’ runway extension (extension from 5000’ to 5400’) design and construction: $3.337 million Since these costs do not tie back to “construction” numbers provided in tables 5.1.4.1-1 and tables 5.1.4-1, what is included in these numbers to account for the difference in construction costs?
These numbers have been reviewed and reconciled in the final report.
The “Construction” costs in Table 9.2-1 are $5,270,000 for a 700 ft. extension and $3,337,000 for a 400 ft. extension. Why are these amounts different from Table 5.1.4.1-1 (5,000 ft) and Table 5.1.4-1 for a 5400 ft. runway? Do these costs include runway and taxiway (GA and Commercial) construction, drainage, signage, markings, lighting, and tree cutting?
These numbers have been reviewed and reconciled in the final report.
Why is not the “Avigation Easement for Runway 21-RPZ” (Runway Protection Zone) costing $1.145 in Table 8.1-1 not included in phase 1 with all the runway expansion projects? Should not this be essential to do in phase 1 with the runway expansion and not later with parking lot expansion and general aviation projects?
Beaufort County has been actively trying to obtain avigation easements around the Airport. While the FAA prefers the Sponsor to own the RPZ in fee simple acquisition, it will accept avigation easements (FAA Advisory Circular 150-5300-13 – Airport Design [as amended]). It is not mandatory that Beaufort County have avigation easements for the Runway 21 RPZ prior to the extension of the runway, which is why the acquisition of avigation easements is slated to be performed in later years.
Environmental Questions: -Although the master plan has been clearly developed to keep the “runway expansion” within the airport property footprint, does page 86 clearly show 40.37 acres of property acquisitions to EXPAND THE AIRPORT FOOTPRINT?
Yes, the Master Plan Update does expand the airport footprint to accommodate the obstacle free areas for the runway extension and relocation of Taxiway ‘A’ and ‘F’ (as required by FAA Advisory Circular 150-5300-13 – Airport Design [as amended]), as well as the relocation of Beach City Road, and the purchase of property to expand the general aviation side of the airport.
Since an environmental study (page 87: cost estimate $500,000) will be needed for the master plan projects, and if the master plan is trimmed down to what projects the community can support, is it not a fact that the environmental study could be less
HILTON HEAD ISLAND AIRPORT
MASTER PLAN UPDATE
Appendix B – Public Involvement TALBERT & BRIGHT B-47
costly, have less opposition, and cut a considerable time off the project?
The $500 thousand estimate is for the environmental and benefit-cost analysis studies for the runway extension project only and does not include the other “Master Plan Projects,” as outlined in the Master Plan Update. This estimate of $500 thousand is consistent with the cost of this type of project for a runway extension at Hilton Head Island Airport to a length of 5,000 or 5,400 feet.
-Since the loss of trees will have a direct affect on the noise levels to the surrounding residents and businesses, and may exceed 10,000 to 15,000, what is a rough estimate of the trees lost for these airport expansion projects that do not have a direct impact on the runway length for: a. trees lost with the replacement of the GA parking apron?
The number of trees to be lost has not been quantified; however, an additional 20 percent will be added to the construction cost estimate for tree cutting/mitigation, stormwater/environmental mitigation, legal fees, etc., in the final report.
b. trees lost with the expansion of the GA parking apron? The number of trees to be lost has not been quantified; however, an additional 20 percent will be added to the construction cost estimate for tree cutting/mitigation, stormwater/environmental mitigation, legal fees, etc., in the final report.
c. trees lost to expand the commercial parking lot? The number of trees to be lost has not been quantified; however, an additional 20 percent will be added to the construction cost estimate for tree cutting/mitigation, stormwater/environmental mitigation, legal fees, etc., in the final report.
d. trees lost to provide more General Aviation hangars? The number of trees to be lost has not been quantified; however, an additional 20 percent will be added to the construction cost estimate for tree cutting/mitigation, stormwater/environmental mitigation, legal fees, etc., in the final report.
e. trees lost from projects not mentioned above, and excluding trees obstruction projects.
The number of trees to be lost has not been quantified; however, an additional 20 percent will be added to the construction cost estimate for tree cutting/mitigation, stormwater/environmental mitigation, legal fees, etc., in the final report.
-What is the estimated cost of tree mitigation for the trees lost ON AIRPORT PROPERTY for: a. trees lost with the RELOCATION of the GA parking apron?
The number of trees to be lost has not been quantified; however, an additional 20 percent will be added to the construction cost estimate for tree cutting/mitigation, stormwater/environmental mitigation, legal fees, etc., in the final report.
b. trees lost to provide more General Aviation hangars? (page 81)
The number of trees to be lost has not been quantified; however, an additional 20 percent will be added to the construction cost estimate for tree cutting/mitigation, stormwater/environmental mitigation, legal fees, etc., in the final report.
c. trees lost to expand the commercial parking lot? (page 82) The number of trees to be lost has not been quantified; however, an additional 20 percent will be added to the construction cost estimate for tree cutting/mitigation, stormwater/environmental mitigation, legal fees, etc., in the final report.
d. trees lost to expand the General Aviation parking (page 83) The number of trees to be lost has not been quantified; however, an additional 20 percent will be added to the construction cost estimate for tree cutting/mitigation, stormwater/environmental mitigation, legal fees, etc., in the final report.
e. trees lost from projects not mentioned above, and excluding trees obstruction projects?
The number of trees to be lost has not been quantified; however, an additional 20 percent will be added to the construction cost estimate for tree cutting/mitigation, stormwater/environmental mitigation, legal fees, etc., in the final report.
-Although it appears that over 40 acres of property OUTSIDE THE AIRPORT PROPERTY (see page 86) is being targeted for land acquisition, what is the actual acreage for; a. airport runway expansion by alternative, compliance, 4600, 5000, and 5400 feet?
The estimated land acquisition acreage for the compliance alternative is 10.72 acres, and for the runway extension and relocation of Beach City Road, 16.37 acres will be required for a total of 27.09 acres.
b. other projects included in the proposal by project?
The estimated land acquisition acreage for the other projects is 29.0 acres.
-Since in the previous the Environment Study for trees for the north end stated that according to FAA guidelines, trees are not a factor in an environmental impact analysis, and thus mitigation may or may not be paid for by the FAA for the projects listed above? 1. Is not mitigation expense an expense of the county and not the FAA?
Depending on the type of mitigation (such as wetlands, etc.), the FAA does participate at a 95 percent ratio. Mitigation requirements for each specific project would be determined during the environmental documentation phase of the project.
2. How will mitigation be done what is the best guess that the new DNL lines for the expansion that is the basis for requiring the buyer of the property to acknowledge noise and safety issues related to the purchase of properties surrounding the airport?
The basis for requiring the buyer of the property to acknowledge noise and safety issues related to the purchase of properties surrounding the Airport is not considered the responsibility of the Airport but is the responsibility of the Town of Hilton Head Island and the requirements outlined in the Town’s Airport Overlay District.
3. Is the FAA timing such that a community approves the master plan first, and does the environmental impact later?
The Sponsor would approve the Master Plan Update, and the environmental documentation is performed on a project-by-project basis.
General Questions: -Although anyone who is attempting to review the proposal find themselves buried in the mountain of paper, would it be possible to do a 1-3 page executive summary of the proposal?
Yes, an executive summary will be included in the final approved report.
-Would T&B provide an advance copy of slides to be presented on October 27th, to be included with responses to council questions due on October 25th, since it is assumed that this format would summarize the findings in the proposal?
A copy of the slide presentation will be posted on the County’s web site after the October 27, 2010, joint council meeting. Advanced copies of the presentation slides will not be available.
-For the next draft update of the Master Plan, would T&B provide the next update of the report using standard 8X11 page format such that the general public can review the proposal?
HILTON HEAD ISLAND AIRPORT
MASTER PLAN UPDATE
Appendix B – Public Involvement TALBERT & BRIGHT B-48
There will be no more draft updates; the October 27, 2010, presentation to the joint session of councils will be the final meeting.
-Would T&B revise the draft Master Plan format the address the 3 local general questions as stated in the Scope of Work before getting into the details of the FAA mandated Airport Layout Plan?
The three questions are answered in the Master Plan Update in Appendix D.
B.6.7 Steve Baer’s (Beaufort County Council) Questions (Received October 19, 2010)
A - Present Airport Configuration 1 - We understand that the current airport is 92 acres in size. Section 2.2.1, page 5 indicates 175.05 acres. Which is correct, and what causes this significant difference?
The airport property is 175.05 acres based on the recorded property plat provided by the County (Plat Book 00106, Page 0142).
B - Forecasts and Demand Profile 1 -The 9/15/10 HH Airport report shows 66,151 Enplanements in 2009. (The MP on page 91 shows 66,893) However, the MP actually uses 75,073 in its forecast on page 18. There is a brief discussion of this difference on page 91, but no data is provided. It appears that the 66,151 is the correct commercial number and should be used for the commercial forecast. Please show how the 8922 (13%) additional enplanements were derived and why they should be included in the commercial forecast base.
The forecasts were developed before final 2009 enplanement numbers were available. The 75,073 annual enplanements shown in 2009 represent the first year of the forecasts.
2 - If the extra commercial numbers described in Question 1 above are based on charter-private use, explain the logic for the migration of customers to the commercial side, and their use (to inflate) the commercial base forecast. This appears to be an invalid assumption.
The forecasts were developed before final 2009 enplanement numbers were available. The 75,073 annual enplanements shown in 2009 represent the first year of the forecasts.
3 - The 2004-2009 Enplanement annual growth rate (AGR) according to the airport's data is about 1% per year. The MP seems to use a much higher number, 2.54% to reach 124,000 by 2029, as claimed. The actual forecast track is not specifically described. Which of the columns in Table 3.3.2-1 or trajectories in Figure 3.3.2-1 was actually used as the MP commercial forecast?
The growth rate for annual enplanements does not include 2009 end of year enplanement data as it was not available when the forecasts were developed. The 2.54 percent annual growth rate was carried through the 20-year planning period and can been seen as the dark blue line on Figure 3.3.2-1 (page 19 of the Master Plan Update Draft Final Report).
4 - The net result of the issues raised in Q1 - Q3 is that the MP starts with an elevated commercial passenger base and uses an elevated AGR. That will lead to a large over-forecast of commercial passengers, as we have seen in previous master plans. How does the MP justify this? (Ref. Page 18)
The forecasts represent a projection from a specific point in time. These forecast numbers utilize all available data when they are produced. A "living" forecast would have the benefit of being continuously updated to reflect the latest changes in airport activity levels.
5 - Sections D.2.5 and D.2.7 suggest that 70% of local demand is being served elsewhere and mentions some 'leakage' to Savannah. The addition of a low cost airline at Savannah or Charleston would make this leakage worse. One of the main reasons for the leakage is that customers prefer the number of direct routes available from Savannah. This is a natural consequence of Savannah drawing from a much larger serving area than HXD, and hence being able to aggregate enough business to get over the economic break point for a new route. (61% of Savannah customers are not from HH.) An effort to reproduce some of these direct routes from HXD would not only run into runway length problems caused by added weight for the higher fuel loads, but would first be constrained by the splintering of ultimate destinations for the O&D passengers at HXD, causing many - all of such direct routes to be uneconomic. Since some are using this MP report to promote expansion for the sake of customer recapture from Savannah, what are the number of passengers per year from HXD to each of the top 10 ultimate destination airports from HXD?
Estimating the number of passengers for the top ten markets was not part of the scope for the Master Plan Update.
6 - What are typical numbers of passengers each way per year used by airlines to economically justify a direct route to another city?
The number of passengers to profitably serve a new market requires an air service study question, which was not part of the scope for the Master Plan Update.
C - EMAS 1 - The T/B plans are highly dependent on the performance of the proposed EMAS. For example, if the EMAS required were to be 600' instead of the 450' claimed, the runway length options
would be severely constrained. How confident is T/B in the viability of the 450' EMAS?
The EMAS will always be shorter than the RSA limit and will never be longer than 600 feet for HXD. The 600-foot length is established by the FAA requirements for the runway safety area (RSA) and not the length of the EMAS. An RSA length, the distance from the end of the runway to the limit of the RSA, of 600 feet is allowable at HXD provided an EMAS is installed. If no EMAS is installed the RSA length required would be 1,000 feet.
2 - What steps will be taken and when to verify these EMAS length assumptions?
The length of the EMAS is established in accordance with FAA Advisory Circular 150/5220-22A – Engineered Materials Arresting Systems (EMAS). In no case will the EMAS exceed the RSA limit of 600 feet. The length of 450 feet was only an approximated length based on Figure A2-7 of FAA Advisory Circular 150/5220-22A – Engineered Materials Arresting Systems (EMAS) for a Gulfstream GW III. The design of the EMAS arresting bed would be adjusted in order to keep its length within the RSA.
3 - Page 39 says that a 600' EMAS is added in the compliance configuration. The diagram on page 41 shows 450'. Which is correct?
The EMAS will always be shorter than the RSA limit and will never be longer than 600 feet for HXD. The 600-foot length is established by the FAA requirements for the runway safety area (RSA) and not the length of the EMAS. An RSA length, the distance from the end of the runway to the limit of the RSA, of 600 feet is allowable at HXD provided an EMAS is installed. If no EMAS is installed the RSA length required would be 1,000 feet.
4 - Page 42 says that a 600' EMAS is added at each end in the constrained 5400' configuration. The diagram on page 44 shows 450'. Which is correct?
The EMAS will always be shorter than the RSA limit and will never be longer than 600 feet for HXD. The 600-foot length is established by the FAA requirements for the runway safety area (RSA) and not the length of the EMAS. An RSA length, the distance from the end of the runway to the limit of the RSA, of 600 feet is allowable at HXD provided an EMAS is installed. If no EMAS is installed the RSA length required would be 1,000 feet.
5 - If the EMAS requirement were indeed to be 600', or some other number, show the runway lengths actually available for that EMAS length in the various options, and what would have to be done to achieve them.
The EMAS will always be shorter than the RSA limit and can never be more than a total of 600 feet.

HILTON HEAD ISLAND AIRPORT
MASTER PLAN UPDATE
Appendix B – Public Involvement TALBERT & BRIGHT B-49
D - Costs 1 - Is the $19.107 M cost of the constrained 5400' alternative - Table 5.1.4-1 (page 42) in addition to the compliance costs in table 5.1.2-1 on the same page, or the total including the compliance quantities?
Total including the compliance quantities.
2 - Same questions for 4600' alternative. Total including the compliance quantities.
3 - Same questions for 5000' alternative. Total including the compliance quantities.
4 - What are the incremental costs: 4300' today to 4300' complaint; 4300' complaint to 4600'; 4600' to 5000'; 5000' to 5400'?
The incremental costs are as outlined in Table B.6.7-1.
Table B.6.7-1 Incremental Costs
Hilton Head Island Airport
Preliminary Costs
Runway Length
4,300 Feet 4,600 Feet 5,000 Feet
5,400 Feet
Land Acquisition $3,600,000 $3,600,000 $8,750,000 $9,100,000 Avigation Easements $1,145,000 $1,145,000 $1,145,000 $1,145,000 Construction $1,750,000 $2,183,000 $3,290,000 $4,215,000 EMAS $2,000,000 $2,000,000 $2,000,000 $4,000,000 Beach City Road Relocation $0 $0 $0 $750,000 Total $8,495,000 $8,928,000 $15,185,000 $19,210,000 Costs between 4,300' and 5,400' $0 $433,000 $6,690,000 $10,715,000 Incremental Costs $433,000 $6,257,000 $4,025,000
5 - Do the costs provided in Section 5.1 and other economic analyses in the document include such items as: Storm water mitigation, environmental mitigation and expected legal costs for easements and land acquisition?
An additional 20 percent will be added to the construction cost estimate for tree cutting/mitigation, stormwater/environmental mitigation, legal fees, etc., in the final report.
6 - It is difficult to correlate the costs on Table 8.1-1, page 87 with those in section 5.1. For example, Table 8.1-1 does not call out the EMAS of Section 5.1, yet shows other more discretionary expenses. A more descriptive and detailed Table 8.1-1 is needed that can be directly correlated with the various tables in Section
5.1, while also showing the phases and less critical items, such as new hangars.
All tables will be reviewed and updated in the final report to have consistent format and information.
7 - In Section 9.3 it is interesting to see that there are several funding sources mentioned as having the potential to help with plan's funding, including the $12.7 million of general aviation (GA) intermediate and long term improvements. These include County bonds, passenger facility fees, rental car fees etc. Since some of these enhancements benefit general aviation, it is curious that taxpayers and commercial passengers were sources specifically enumerated to pay additional costs, but GA via landing or additional fees were not. This is a noticeable and significant gap, especially considering that $12.7 of the improvements benefit GA uniquely. Why were GA landing and other new fees not included?
Commercial service airlines pay landing fees, but general aviation aircraft are not subject to landing fees. However, general aviation aircraft fees charged by Signature Flight Support are outlined in Table B.6.1-2 (page B-35). Beaufort County receives 3 percent of all revenue produced by Signature Flight Support. It is the opinion of TBI that general aviation aircraft fees charged by Signature Flight Support are consistent with industry standards.
8 - Section 9.5.2 dealing with operating expense seems to use a historic trend analysis as the basis for expense projections. However, according to the plan, the airport and its buildings will grow significantly in size, with much more area, facilities and complexity. Hence, we need to see expense projections that specifically include all the airports new facilities (i.e. - a bottoms up operations cost analysis) and not just projections based on old historic trends. Otherwise we may find that we have many facilities but lack the operations funds to maintain them. We appear to already be experiencing this today with our hangar and terminal maintenance.
The size of the Airport and buildings will not increase over the short-term planning period as suggested in the question. New facilities will be constructed in the intermediate- and long-term planning periods. O&M costs were only described in the short-term; therefore, intermediate- and long-term O&M expenses (or additional revenues) for those facilities are not accounted for in the financial section.
E - Environment, Noise and Zoning 1 - Section 6.1, page 48 states that no air quality analysis is required for HXD. Yet we hear reports from North-end residents of particulate or liquid dropping on them from planes. How do you reconcile those two statements?
TBI is not aware of particulate or liquid dropping from planes. As stated on page 48 of the Master Plan Update Draft Final Report:
Determination of the need for an air quality analysis at an airport is based on the ultimate forecast level of aircraft operations. FAA Order 1050.1E Change 1 Environmental Impacts: Policies and Procedures (March 20, 2006), Appendix A, Section 2.4b states that for detailed guidance on air quality procedures see FAA’s report “Air Quality for Civilian Airports and Air Force Bases.” The report states that “if the level of annual enplanements exceeds 1,300,000, the level of general aviation and air taxi activity exceeds 180,000 operations per year or a combination thereof, a NAAQS assessment should be considered.” Forecasts for HXD indicate a total of approximately 56,901 annual operations by 2029 (Table 3.5.2-2, page 22), which is well below the minimum operations threshold requiring an air quality analysis.
This determination will be reassessed by the FAA when the runway extension project is identified for design and construction and the environmental documentation is performed.
2 - How do you envision that the airport overlay district will have to changed from the present state under the 4 options: 4300' compliant, 4600', 5000', 5400'? Note that Section 6.13.2, Page 64 indicates that the 65 DNL area will grow from 126.8 acres calculated existing to 171.9 acres forecast due to increased runway usage and heavier planes in the new MP.
The 65 DNL noise contour encompasses the following acreage:
• 4,300-foot runway – 126.5 acres • 4,600-foot runway – 127.8 acres (1.3-acre increase) • 5,000-foot runway – 130.8 acres (4.3-acre increase) • 5,400-foot runway – 135.3 acres (8.8-acre increase)
The existing and future noise contours outlined in the Master Plan Update are within the existing airport overlay district contours. TBI does not recommend changing the existing airport overlay district until the runway extension project is identified for design and construction and the environmental documentation is performed.
3 - It has long been felt by many residents that the FAA noise models include data that represents a 'best case effort' by engine and airplane manufacturers, aircraft operators, airport operators, pilots, and other aviation industry members to produce studies putting them in the best light to promulgate their sales and plans. (This is analogous to the early Federal gas mileage models which grossly over-stated expected automobile gas mileage.) There seem to be no studies of actual (vs. theoretic) noise performance to determine if modeled values are actually obtained in the real world. To provide a baseline on actual noise, a set of North-end noise measurements were paid for by the

HILTON HEAD ISLAND AIRPORT
MASTER PLAN UPDATE
Appendix B – Public Involvement TALBERT & BRIGHT B-50
Town of HHI and Beaufort County under an expansion of the T/B MP contract, and taken on approximately September 11-13, 2010. Given the fact that approval of this MP will extend the number of flights, weight of aircraft, and intrusion into communities, the evaluation of any real and current noise data (as opposed to just the theoretic models in this report) is important. Why is the new September 2010 noise data not included or referenced in the current document? (Note: This data was also requested via a Freedom of Information Act letter to Beaufort County on October 5, 2010.)
The Master Plan Update includes output from the FAA Integrated Noise Model (INM) in the form of day/night sound level (DNL) noise contours. INM is the FAA-preferred computer model that evaluates aircraft noise impacts in the vicinity of airports and is based on the algorithm and framework using the SAE AIR 1845 standard. DNL is the average noise level over a 24-hour period with proper day-night weighting as adopted by the USEPA. The FAA has refined the INM with input from a broad range of users (i.e., government agencies, air carriers, consultants, and airframe manufactures). Comparisons of modeled and measured noise levels at a broad range of airports have shown very good agreement between the modeled noise levels and the measured noise levels. The FAA does not permit users of the INM to substitute measured data for the standard data that are in the INM. An independent noise study, separate from the Master Plan Update, was authorized by Beaufort County and the Town of Hilton Head Island to be performed in two phases to determine if any differences occur between noise of single events (arrivals, departures, and run-ups) expressed as sound exposure level (SEL) before and after completion of the Runway 21 tree removal/trimming project. The field measurements of aircraft operation sound levels for the first phase of this study performed during September 11-14, 2010, will be compared to the field measurements taken in the same locations under similar conditions after the Runway 21 tree removal/trimming project is complete. The tree removal project and the associated independent noise study are separate ongoing projects and not included as part the Master Plan Update. The measurements from the SEL cannot be used to “adjust” the DNL contours for a Master Plan or a Part 150 Noise Compatibility Study in accordance with FAA requirements. The Freedom of Information Act letter to Beaufort County on October 5, 2010, was responded to on October 25, 2010, via email to Paul Andres (Airport Director).
F - Lighting and Guidance 1 - To what extent will lights and other navigation devices have to be placed on or near the St. James Church Steeple and Pineland Station buildings (in all options) in order to alert planes of their location and height? Note the new reduced vertical
clearances from the Glide Slopes to the Church Steeple (reduced from 22.3' to 12.5') and Pineland Station (reduced from 23.7' to 20.7') recommended by this MP.
None, because they do not penetrate the 34:1 approach surface.
2 - Describe the approach lighting system (mentioned in Section 4.2.7, page 31) planned for the Runway 21 approach. What building changes, and land control are required?
The likely approach lighting system planned for Runway 21 is the omni-directional approach lighting system (ODALs) and will not require any building or land control changes. The length of the system is 1,500 feet long and can be installed within the existing airport property.
3 - What are factors preventing the creation of an ILS and/or vertical precision approach (VP)? Are there adequate distances and clearances to permit this to happen with any of the MP options?
For an ILS precision approach, a glide slope antenna must be installed to provide vertical guidance to complement the existing localizer approach. Glide slope installations meeting FAA standards require adequate ground areas free of taxiways, taxiing aircraft, and other features that could cause undesirable reflection of the glide slope antenna signals. At a minimum, this would require relocation of the parallel taxiway on the Runway 21 end. Adequate land is not currently available on airport property to accommodate this. For a GPS approach with vertical guidance, it is anticipated that the proposed tree removal/trimming project will provide the required clear approach surface.
4 - Describe any changes required to achieve the ILS/VP requirements. What additional trees or buildings would have to be removed? What existing and additional land must be controlled, and how?
For the ILS glide slope option, additional land must be purchased and buildings/trees must be removed from the glide slope ground plane area, at a minimum, on the west side of Taxiway ‘F’ on the Runway 21 end; Taxiway ‘F’ will need to be relocated on the Runway 21 end; the proposed tree removal/trimming project must be completed; and an approach lighting system is recommended by the FAA. The runway pavement markings would also need to be upgraded to “precision” markings. For a GPS approach with vertical guidance, it is anticipated that the proposed tree removal/trimming project will provide the required clear approach surface for a vertically guided GPS approach. An approach lighting system is required for instrument approach minimums of less than ¾-mile
visibility. The runway pavement markings would also need to be upgraded to “precision” markings.
5 - We have heard that commercial planes may use the full runway landing length for landing rather than the displaced thresholds. Is this true and permitted? What are the safety implications?
This statement is not true, and commercial service aircraft are required to land on displaced thresholds as required of all aircraft.
G - Maps and Diagrams 1 - The color coding on Exhibit A - Property Map, page 86 is not complete or accurate. For example: avigation easements B39-B50 have no color shading on the drawing; future developments B31-B33 and B36 - B37 have colors not defined on the legend. This may only be a partial list of examples.
Issue resolved.
H - Load Factors and Aircraft 1 - Section D.2.9 and earlier parts of section D reference Delta service to Atlanta. When did Delta service start at HXD Airport?
Delta Connection (Atlantic Southeast Airlines [ASA]) began March 17, 2007, and ended on November 30, 2008. Delta Connection (Mesaba Airlines) began March 2, 2009, and suspended on November 2, 2009. Delta Connection (Mesaba Airlines) resumed March 4, 2010, and will suspend on November 1, 2010.
2 - If Delta service were to be discontinued at HXD (e.g. due to lack of a suitable aircraft or lack of runway length sufficient for a CRJ), would not some of those passengers utilize the other carrier (assuming it had aircraft better suited to our runway length, and we did the compliance tree work to improve their carrying capability), and hence improve the business case for that carrier? This is analogous to trimming the weaker branches of a tree to let the stronger branch thrive.
This question needs to be addressed by the airlines.
3 - Section D.2.6 indicates that the airlines presently use a 60% load factor at HXD rather than the 75% standard due to obstructions and runway length. Then Section D.2.7 states that removal of the tree obstacles would allow the airlines to improve their load factors on existing aircraft. Considering that any change at HXD presents costs, benefits and pain, the analysis of potential load factor improvements is an extremely important input to local government's rigorous analysis of plan options. However, despite a related question appearing in our statement

HILTON HEAD ISLAND AIRPORT
MASTER PLAN UPDATE
Appendix B – Public Involvement TALBERT & BRIGHT B-51
of work, and several repeats of this question thereafter, the T/B MP report provides no related data to support our decisions, based on the capabilities of commercial aircraft for service on the actual existing routes to CLT and ATL. These are the key commercial markets in our decision making process, yet the MP is silent on the actual aircraft requirements to serve them. Using the following table representing the actual condition in the options in this MP, what is the expected load factor capability (seats usable/seats total) for the following planes at HH at (30 C) 86 F in commercial service to Atlanta and Charlotte? (Assume that trees cut/trimmed and the 34:1 GS and other factors are in place per the compliance plan; important - consider the landing and takeoff lengths, including displaced thresholds, and vertical obstacles such as trees and buildings in the plans in the MP document.) Table 1 - Expected Load Factor Capability (seats usable/seats total) for Commercial Service to Charlotte and Atlanta. Notes: T = 30C (86F); Uses landing and takeoff lengths, including displaced thresholds, and vertical obstacles in the plans in the MP document; Assume Q400 = 70 seat version
Table B.6.7-2
Expected Load Factor Capability (seats usable/seats total) for Commercial Service to Charlotte and Atlanta
(Based on Maximum Takeoff Weight) Hilton Head Island Airport
Plane Type
Runway Length 4,300'
Compliant 4,600' 5,000' 5,400' Dash 8-200 Yes Yes Yes Yes Dash 8-300 No Yes Yes Yes Q400 No No No Yes SAAB 340 No No Yes Yes CRJ-200 No No No No CRJ-700 No No No No
4 - Some expansion advocates have stated the viability of the CRJ - 200 and CRJ - 700 at 5000' or 5400' in our HXD environment that would exist per this MP (including the vertical obstacles and displaced thresholds). What commercial airports in the US have these or any Regional Jets operating with either 5000' or 5400' takeoff length and 4597' landing length (Parameters from the 5400' compliant plan)? What type planes are used for these lengths?
Table B.6.7-3 lists the commercial service airports that have runways of less than 5,000 feet that receive commercial regional jet operations.
Table B.6.7-3 Commercial Service Airports with Runway Lengths Less Than 5,400 Feet
Hilton Head Island Airport
Airport/Runway Length
Aircraft Takeoff LandingEYW Key West International, Key West, FL – 09/27 4,801' 4801' CRJ-200/700/900, Boeing
737-700, ATR-72-210, ATR-42-320, ERJ 170/175
DCA Ronald Reagan Washington National, Washington, DC ERJ, CRJ-200 15/33 5,204' 5,204'' 04/22 4,911' 4,911'
MDW Chicago Midway International, Chicago, IL ERJ-145/175, CRJ-200/700/900, Q-400, Boeing
737-300/500/700 04L 5,507' 4,749' 22R 5,507' 4,629' 13L 5,141' 4,389' 31R 5,141' 5,141'
ISP Long Island Mac Arthur, New York, NY Boeing 737-300/500/700, CRJ-200, Dash 8-100/300 10/28 5,034' 5,034'
15L/33R 3,175' 3,175' 15R/33L 5,186' 5,186'
BOS General Edward Lawrence Logan International, Boston, MA – 14/32
5,000' 5,000' ERJ-135/140/145
RUT Rutland - Southern Vermont Regional Airport, Rutland, VT ATR-42-320, Embraer 190 01/19 5,000' 5,000' 13/31 3,170' 3,170'
This is a partial list for illustration and does not include all airports.
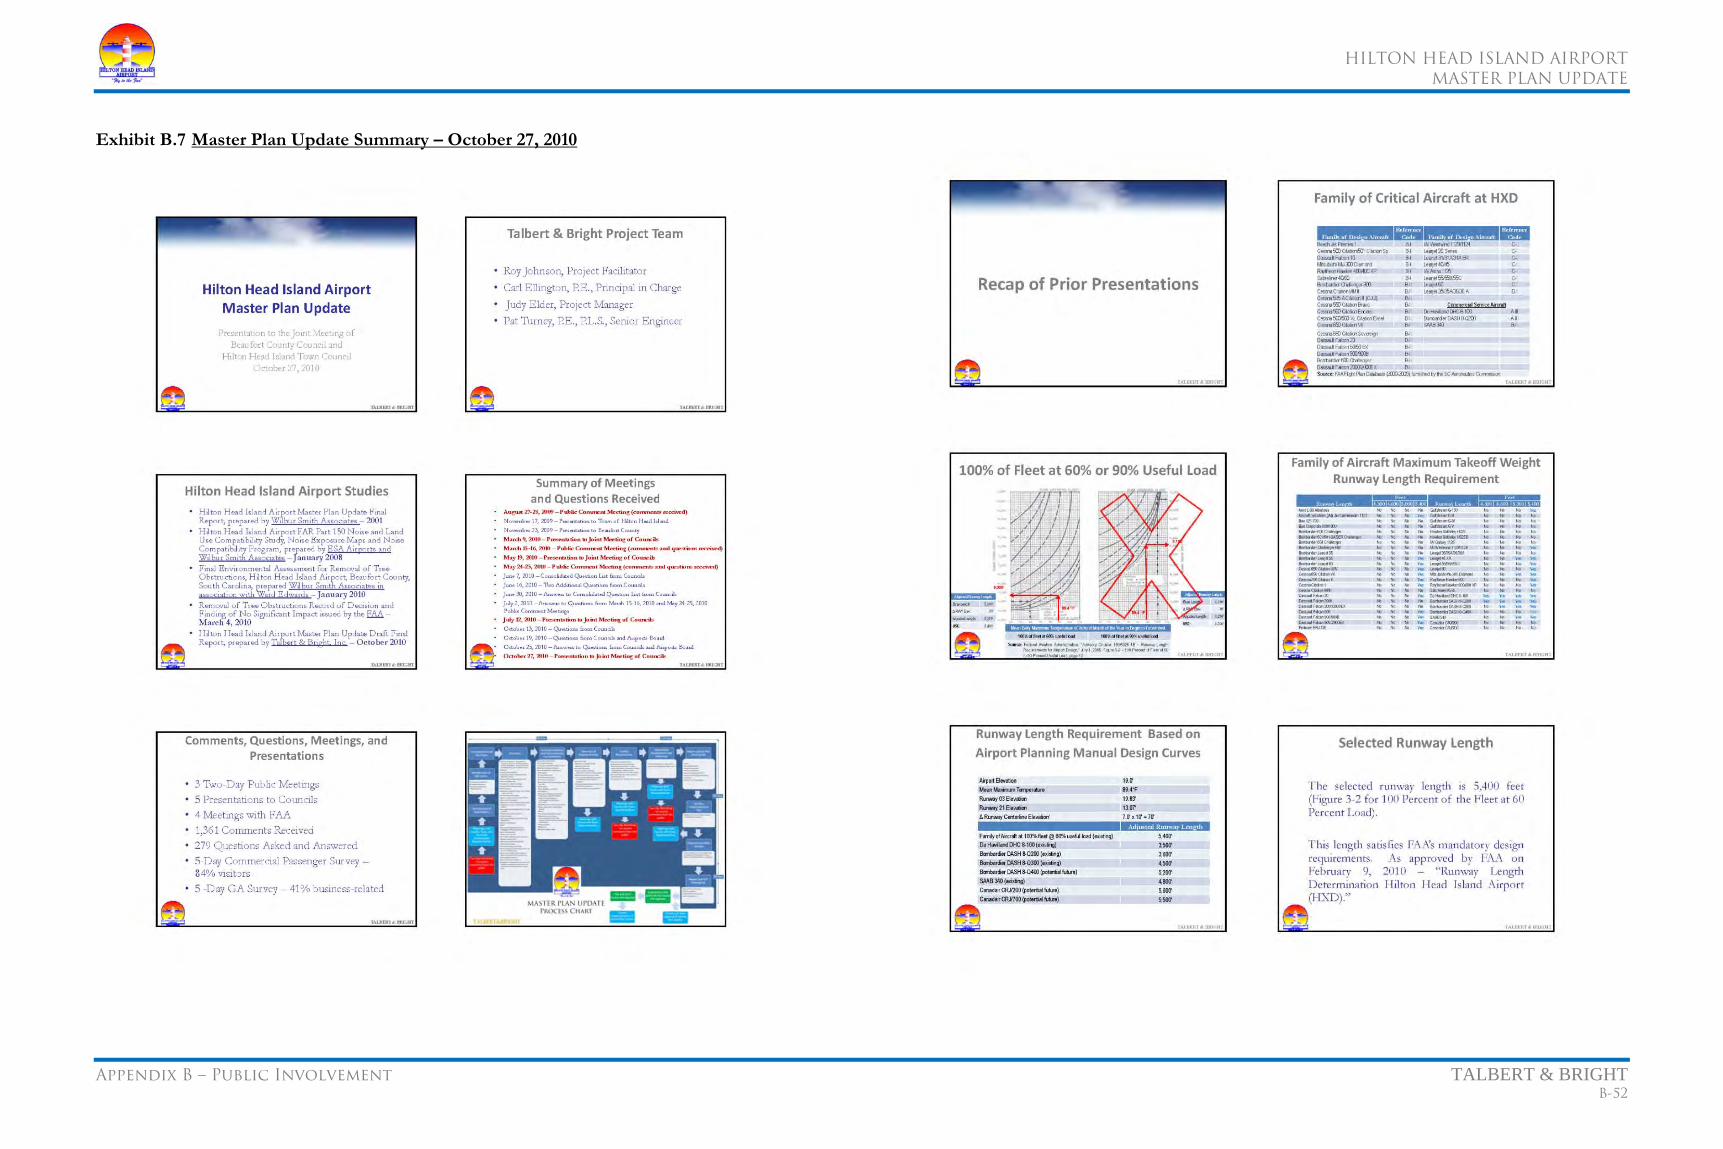
HILTON HEAD ISLAND AIRPORT
MASTER PLAN UPDATE
Appendix B – Public Involvement TALBERT & BRIGHT B-52
Exhibit B.7 Master Plan Update Summary – October 27, 2010
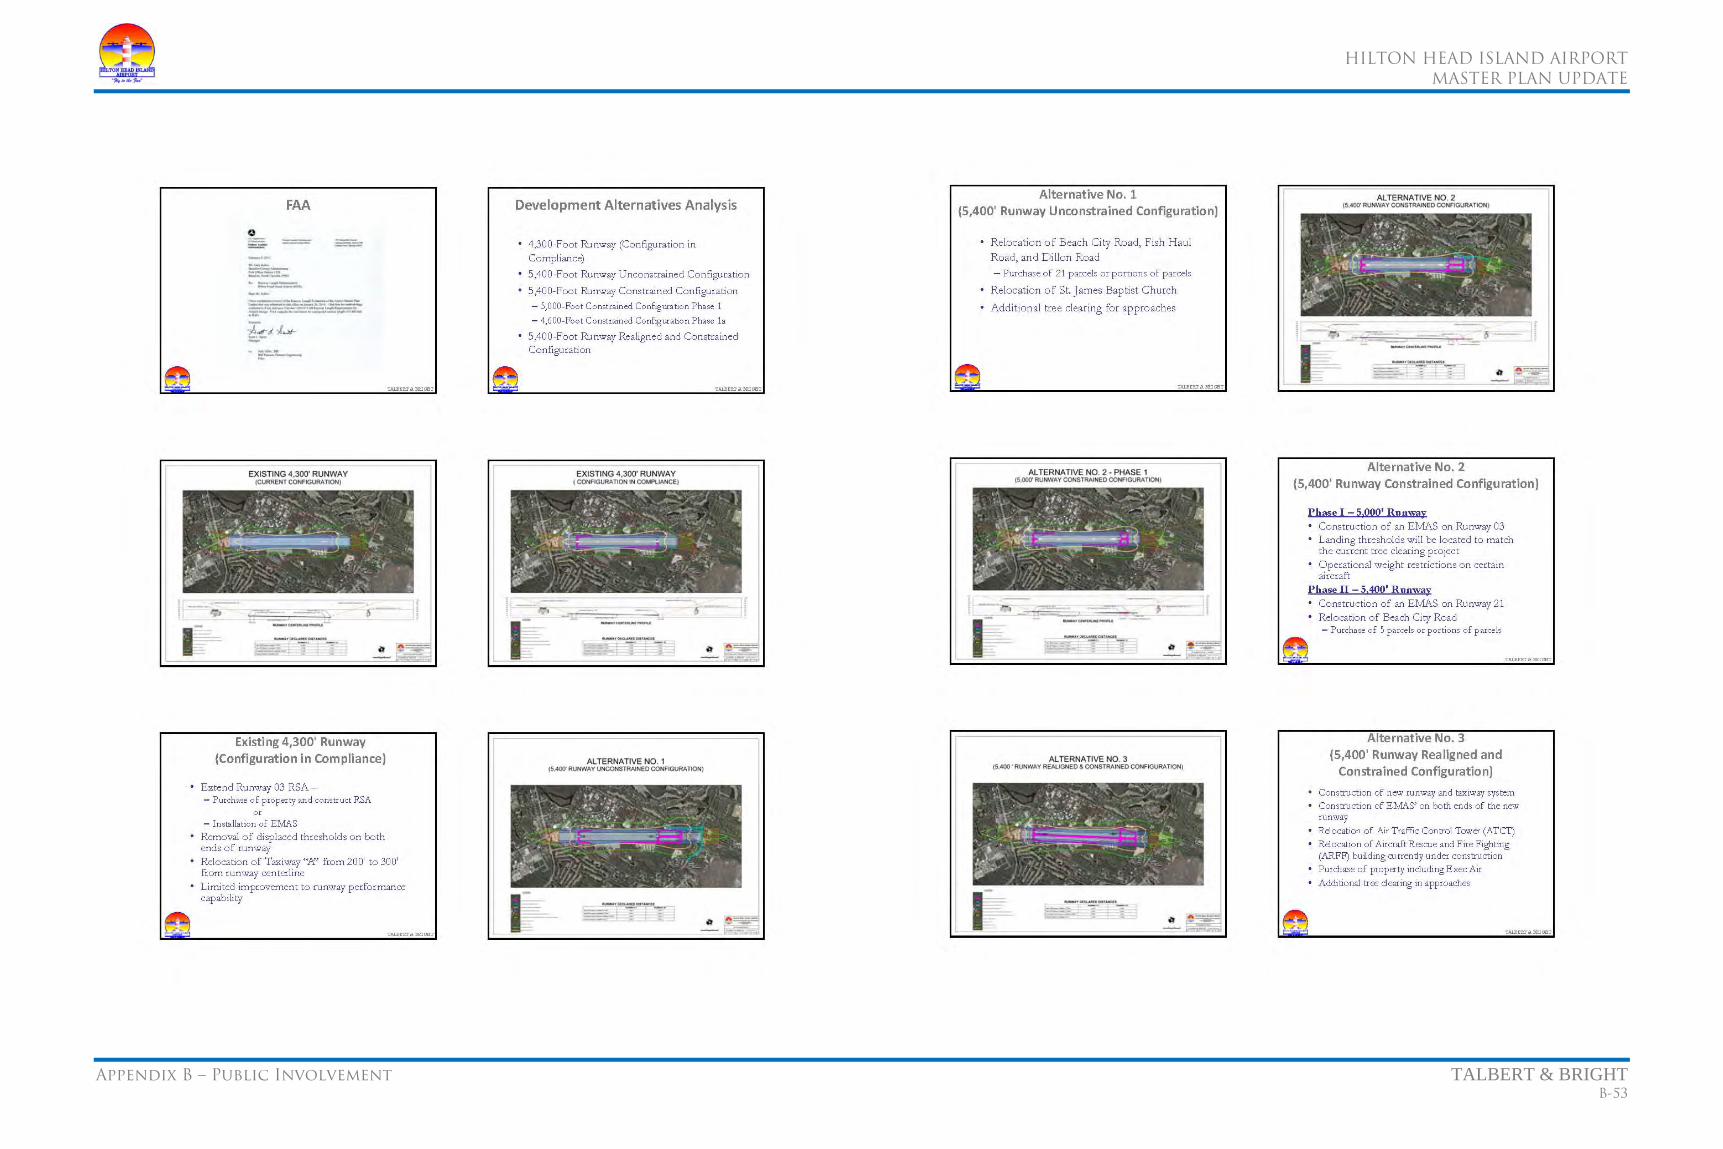
HILTON HEAD ISLAND AIRPORT
MASTER PLAN UPDATE
Appendix B – Public Involvement TALBERT & BRIGHT B-53

HILTON HEAD ISLAND AIRPORT
MASTER PLAN UPDATE
Appendix B – Public Involvement TALBERT & BRIGHT B-54
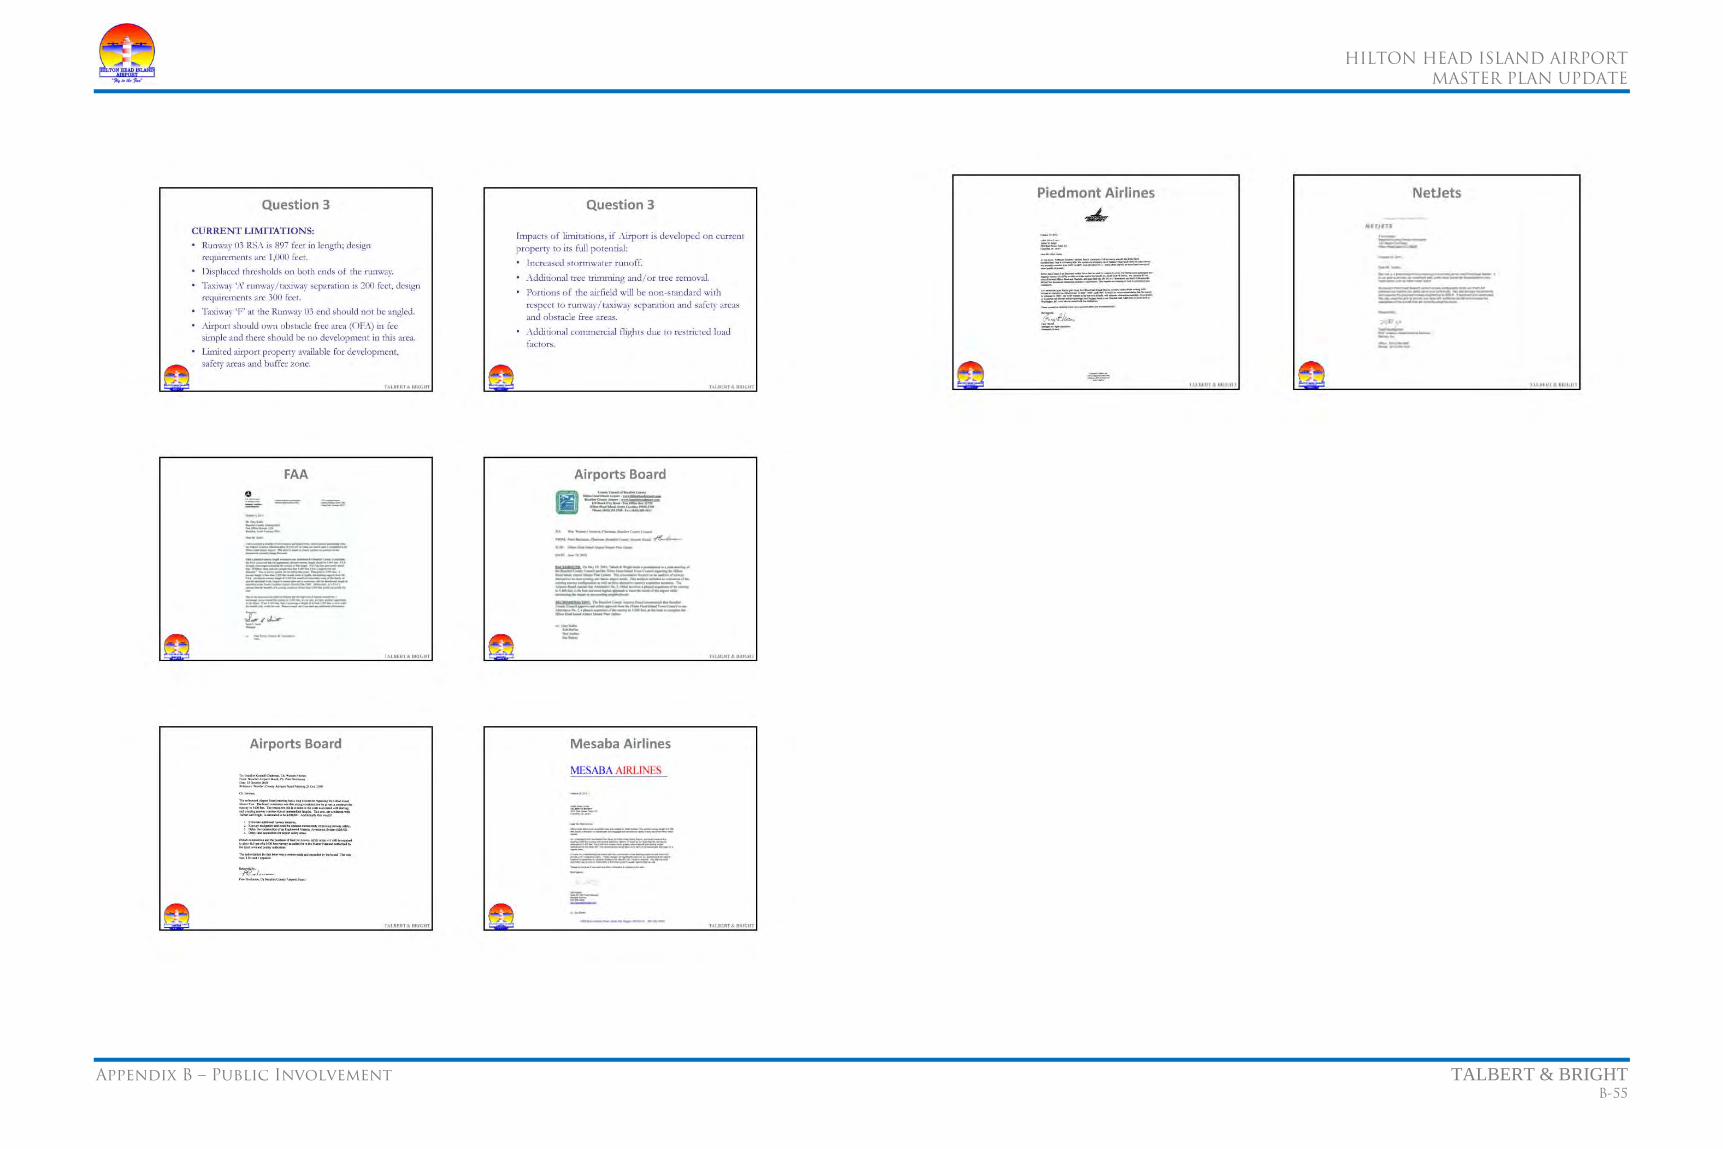
HILTON HEAD ISLAND AIRPORT
MASTER PLAN UPDATE
Appendix B – Public Involvement TALBERT & BRIGHT B-55

HILTON HEAD ISLAND AIRPORT
MASTER PLAN UPDATE
Appendix B – Public Involvement TALBERT & BRIGHT B-56
Exhibit B.8 Concurrence Correspondence and Resolutions
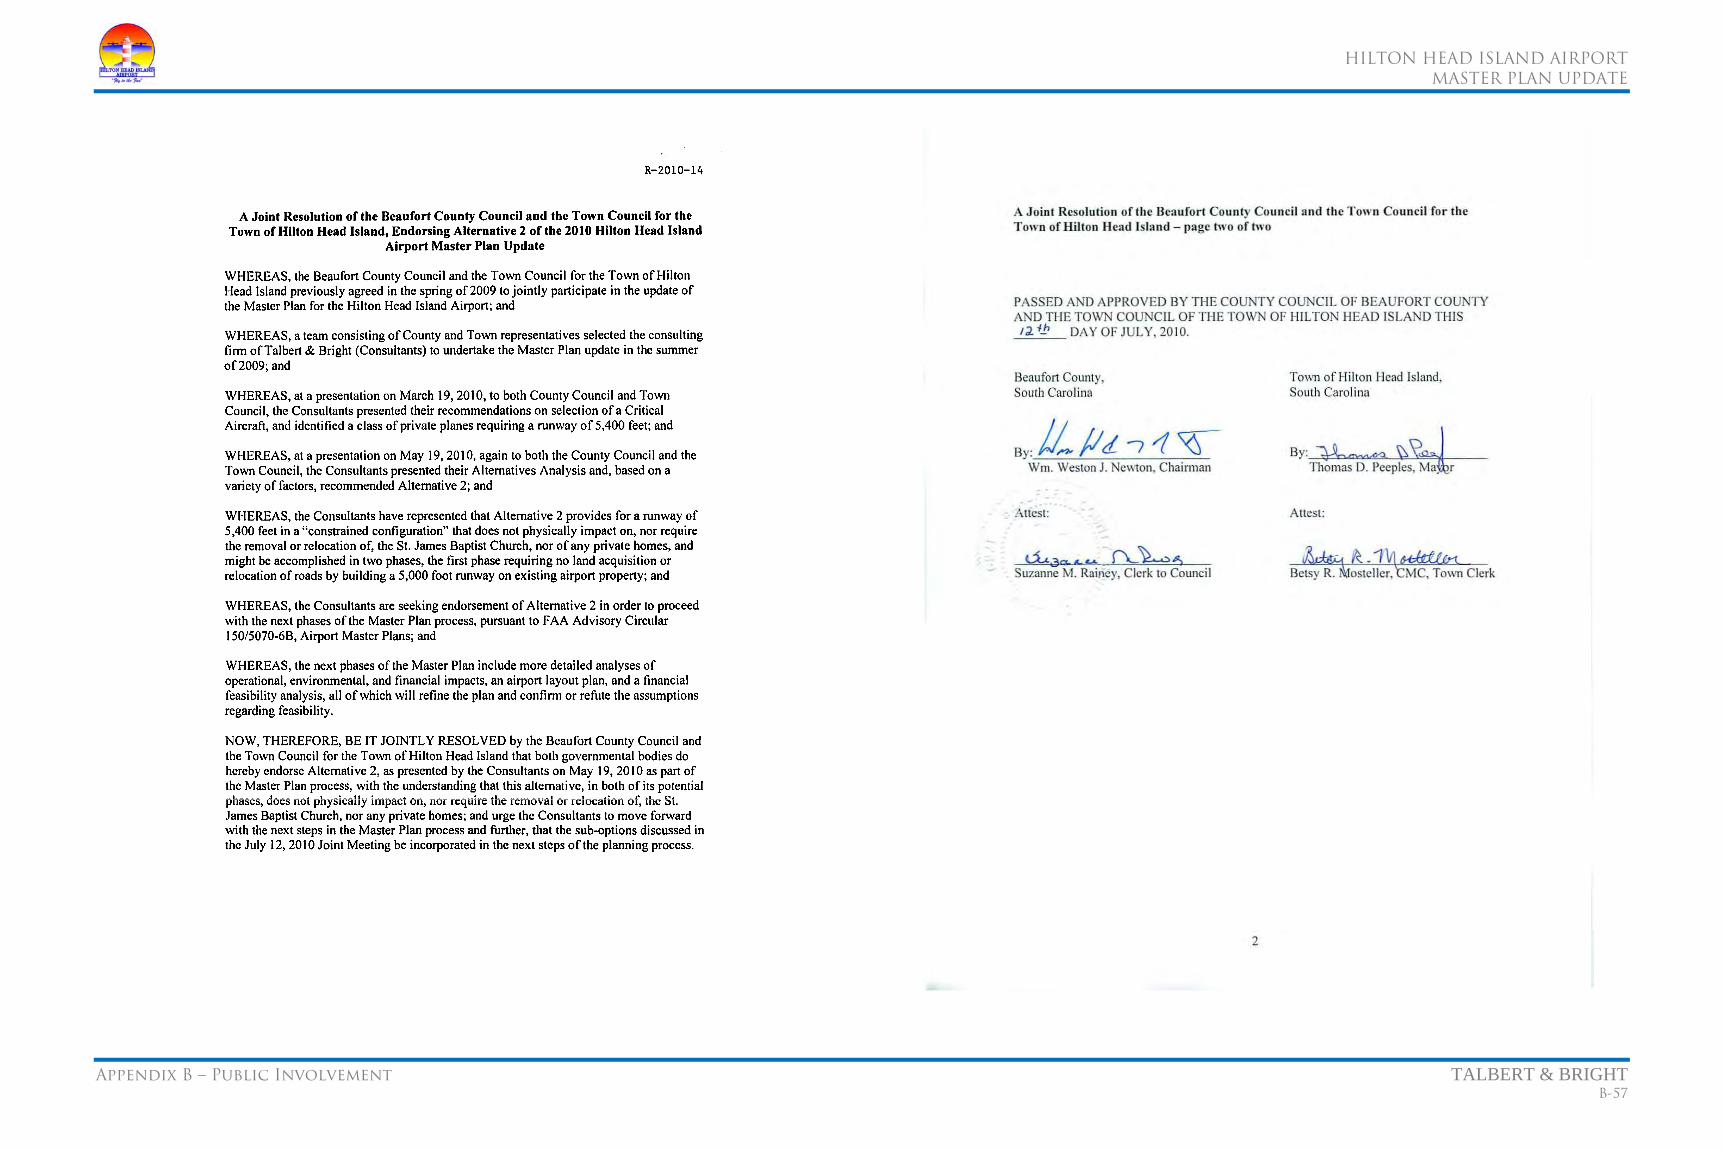
HILTON HEAD ISLAND AIRPORT
MASTER PLAN UPDATE
Appendix B – Public Involvement TALBERT & BRIGHT B-57
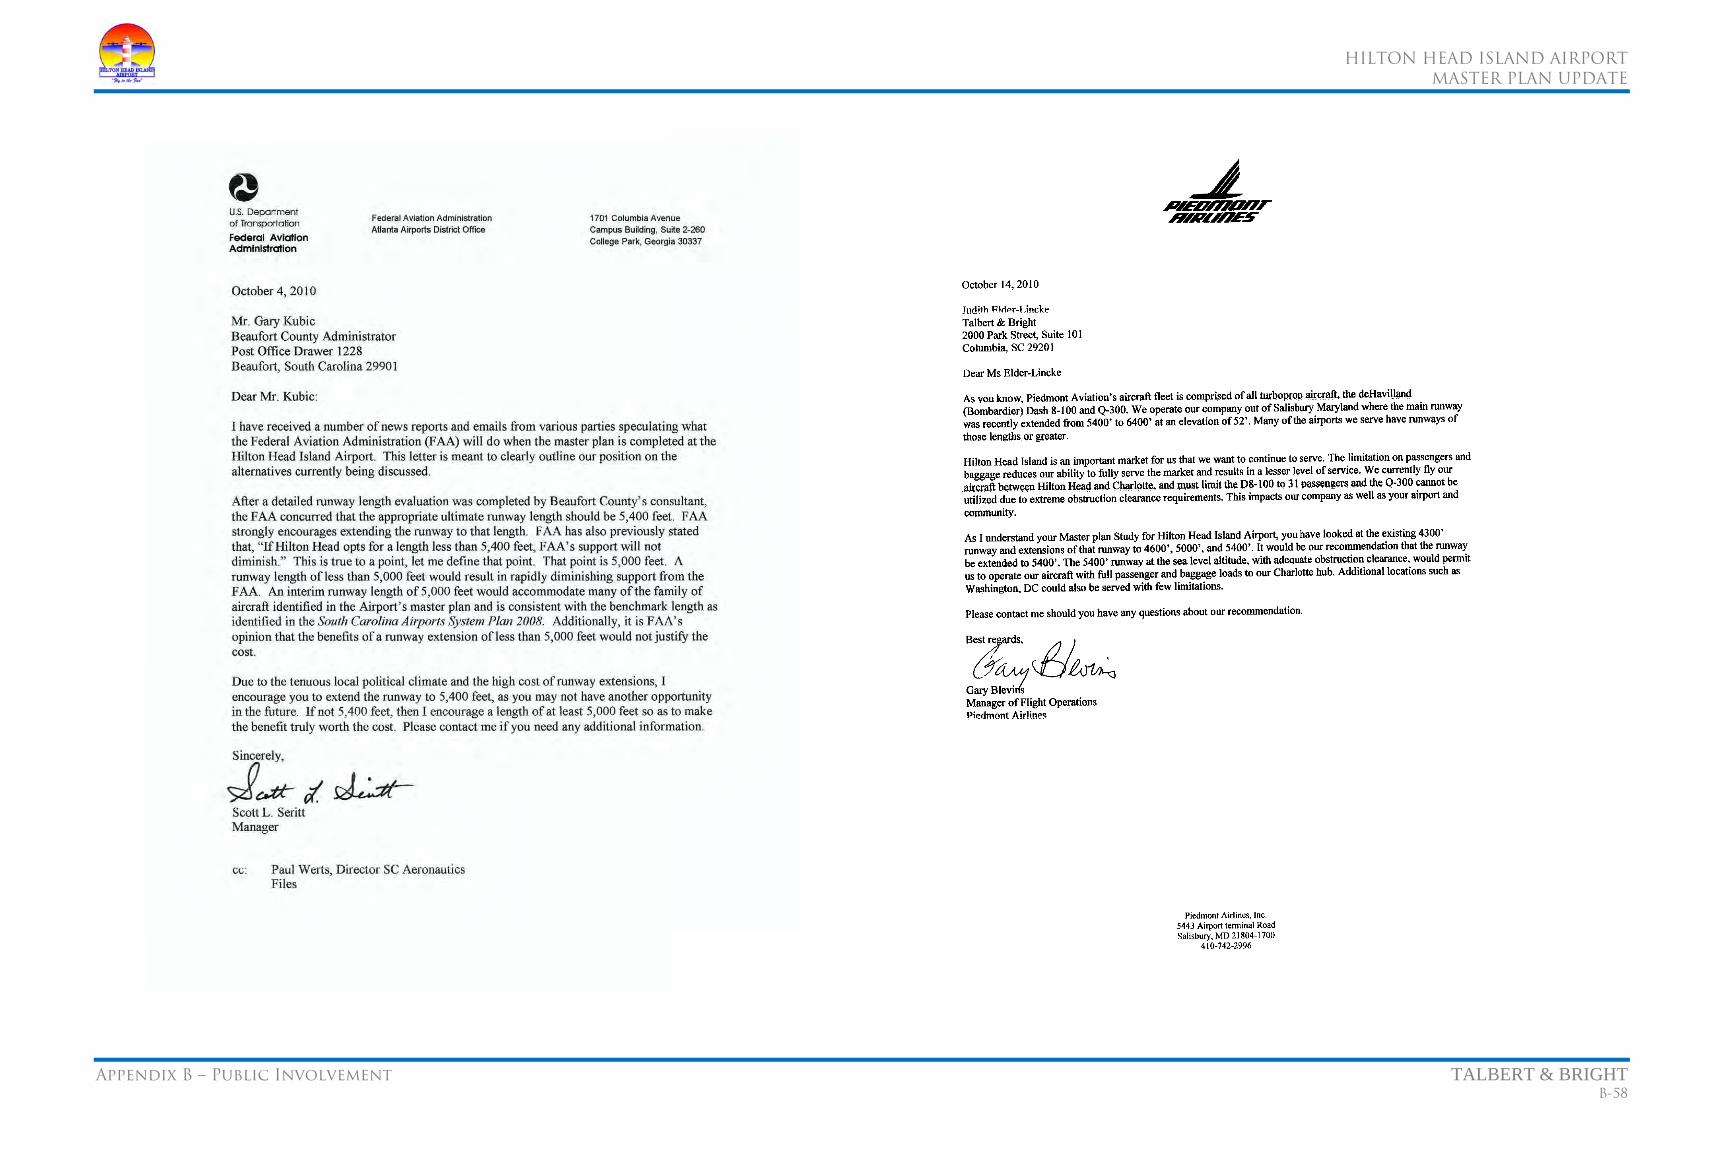
HILTON HEAD ISLAND AIRPORT
MASTER PLAN UPDATE
Appendix B – Public Involvement TALBERT & BRIGHT B-58
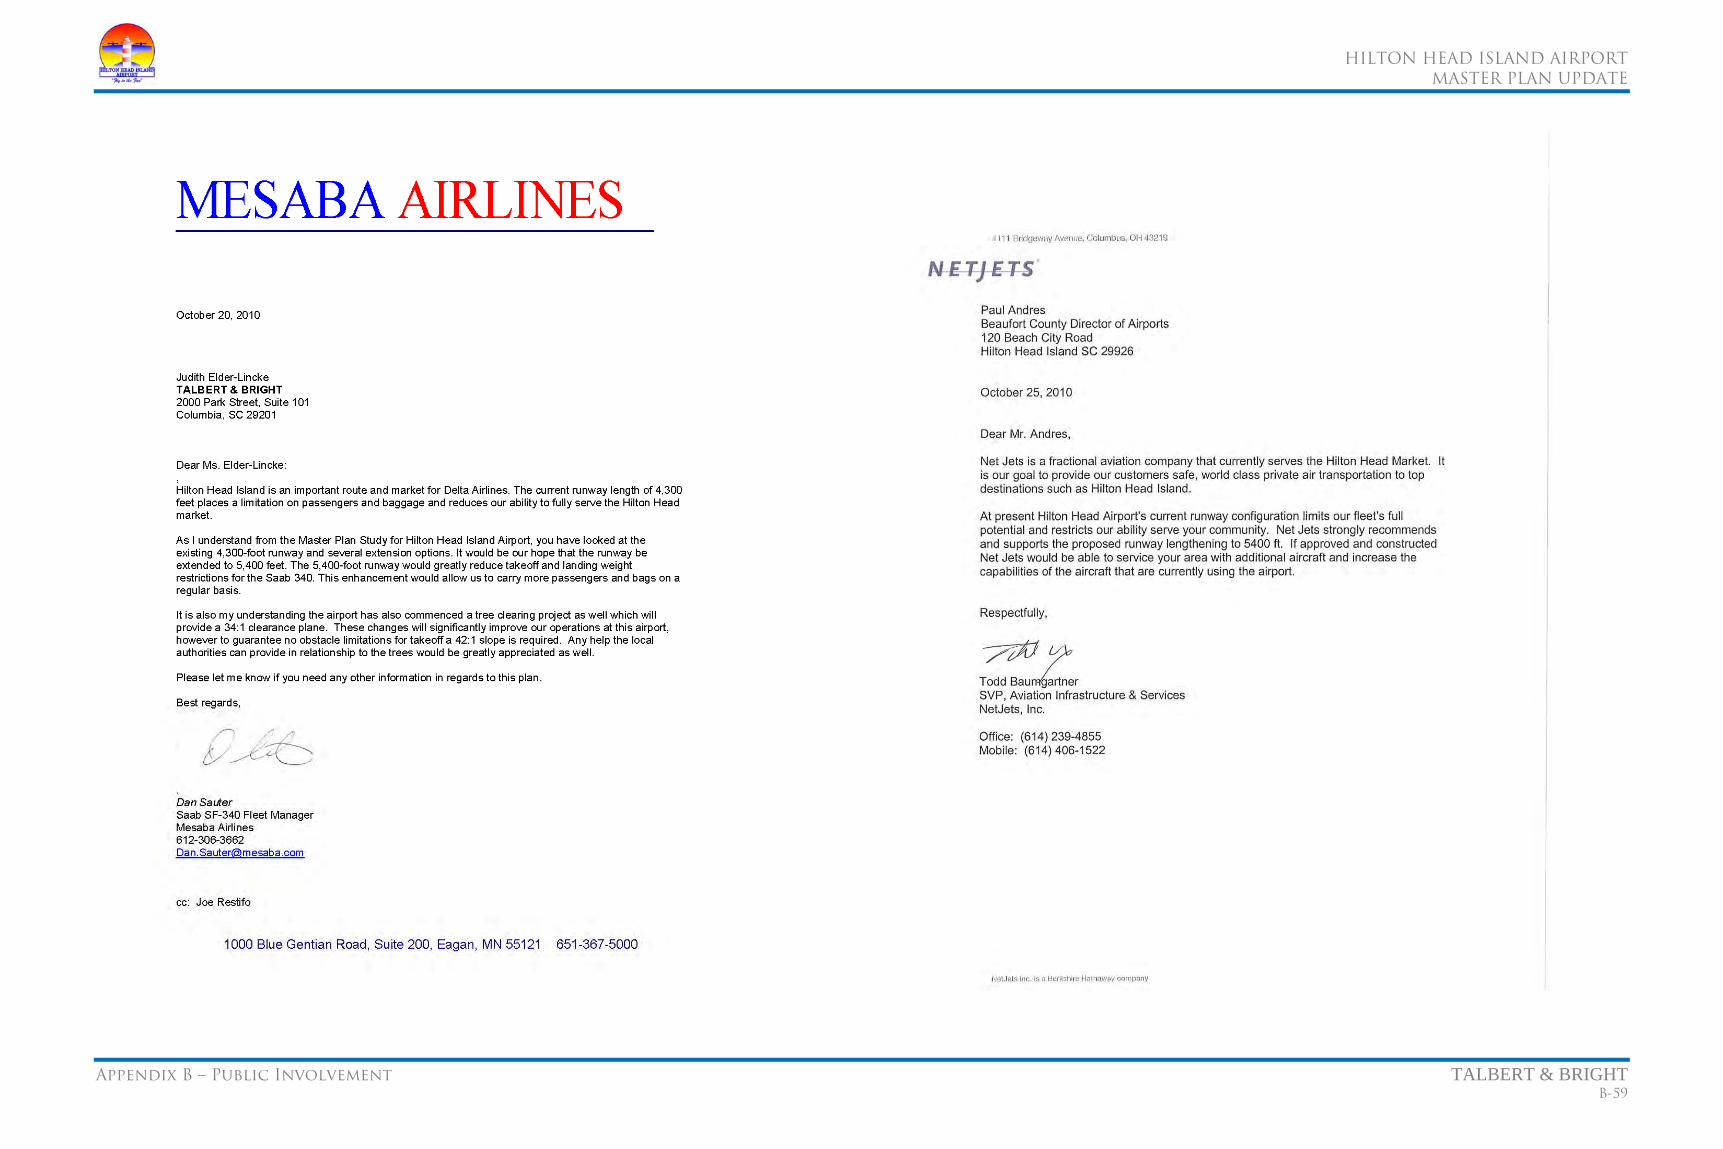
HILTON HEAD ISLAND AIRPORT
MASTER PLAN UPDATE
Appendix B – Public Involvement TALBERT & BRIGHT B-59

HILTON HEAD ISLAND AIRPORT
MASTER PLAN UPDATE
Appendix B – Public Involvement TALBERT & BRIGHT B-60
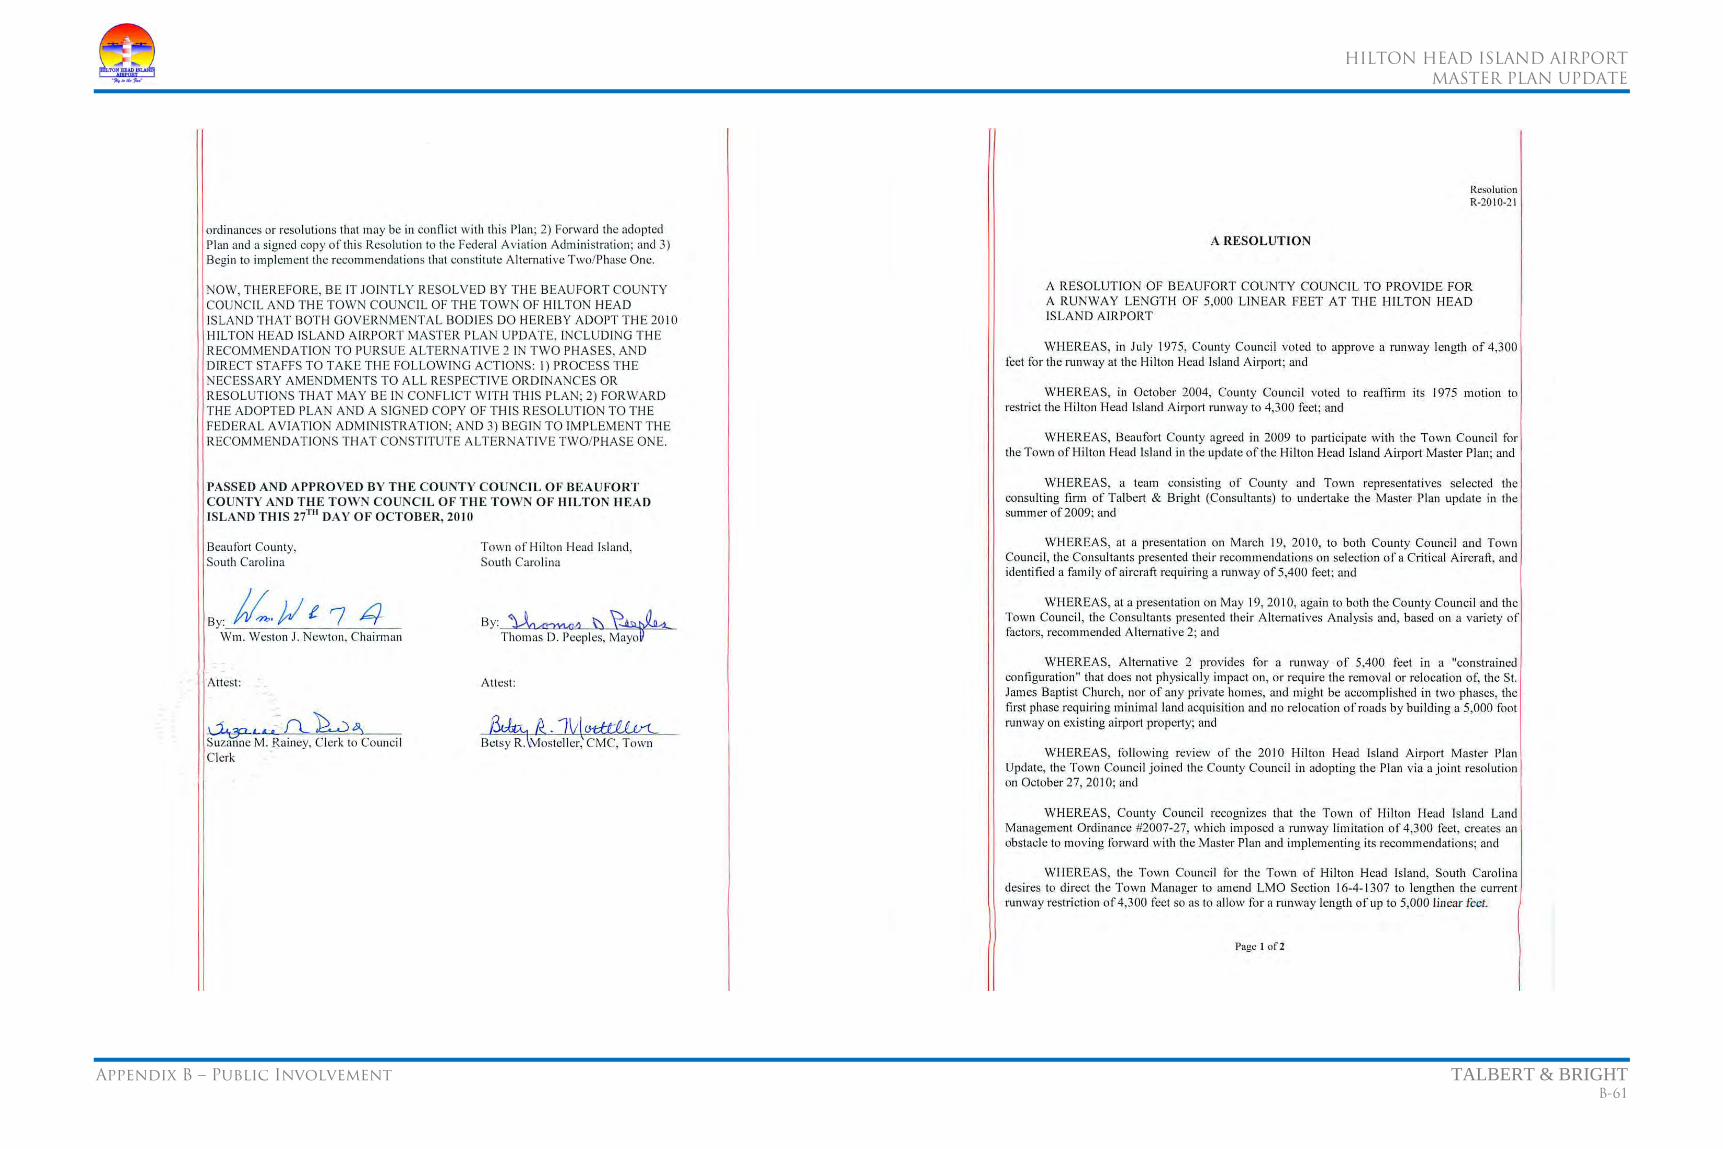
HILTON HEAD ISLAND AIRPORT
MASTER PLAN UPDATE
Appendix B – Public Involvement TALBERT & BRIGHT B-61

HILTON HEAD ISLAND AIRPORT
MASTER PLAN UPDATE
Appendix B – Public Involvement TALBERT & BRIGHT B-62
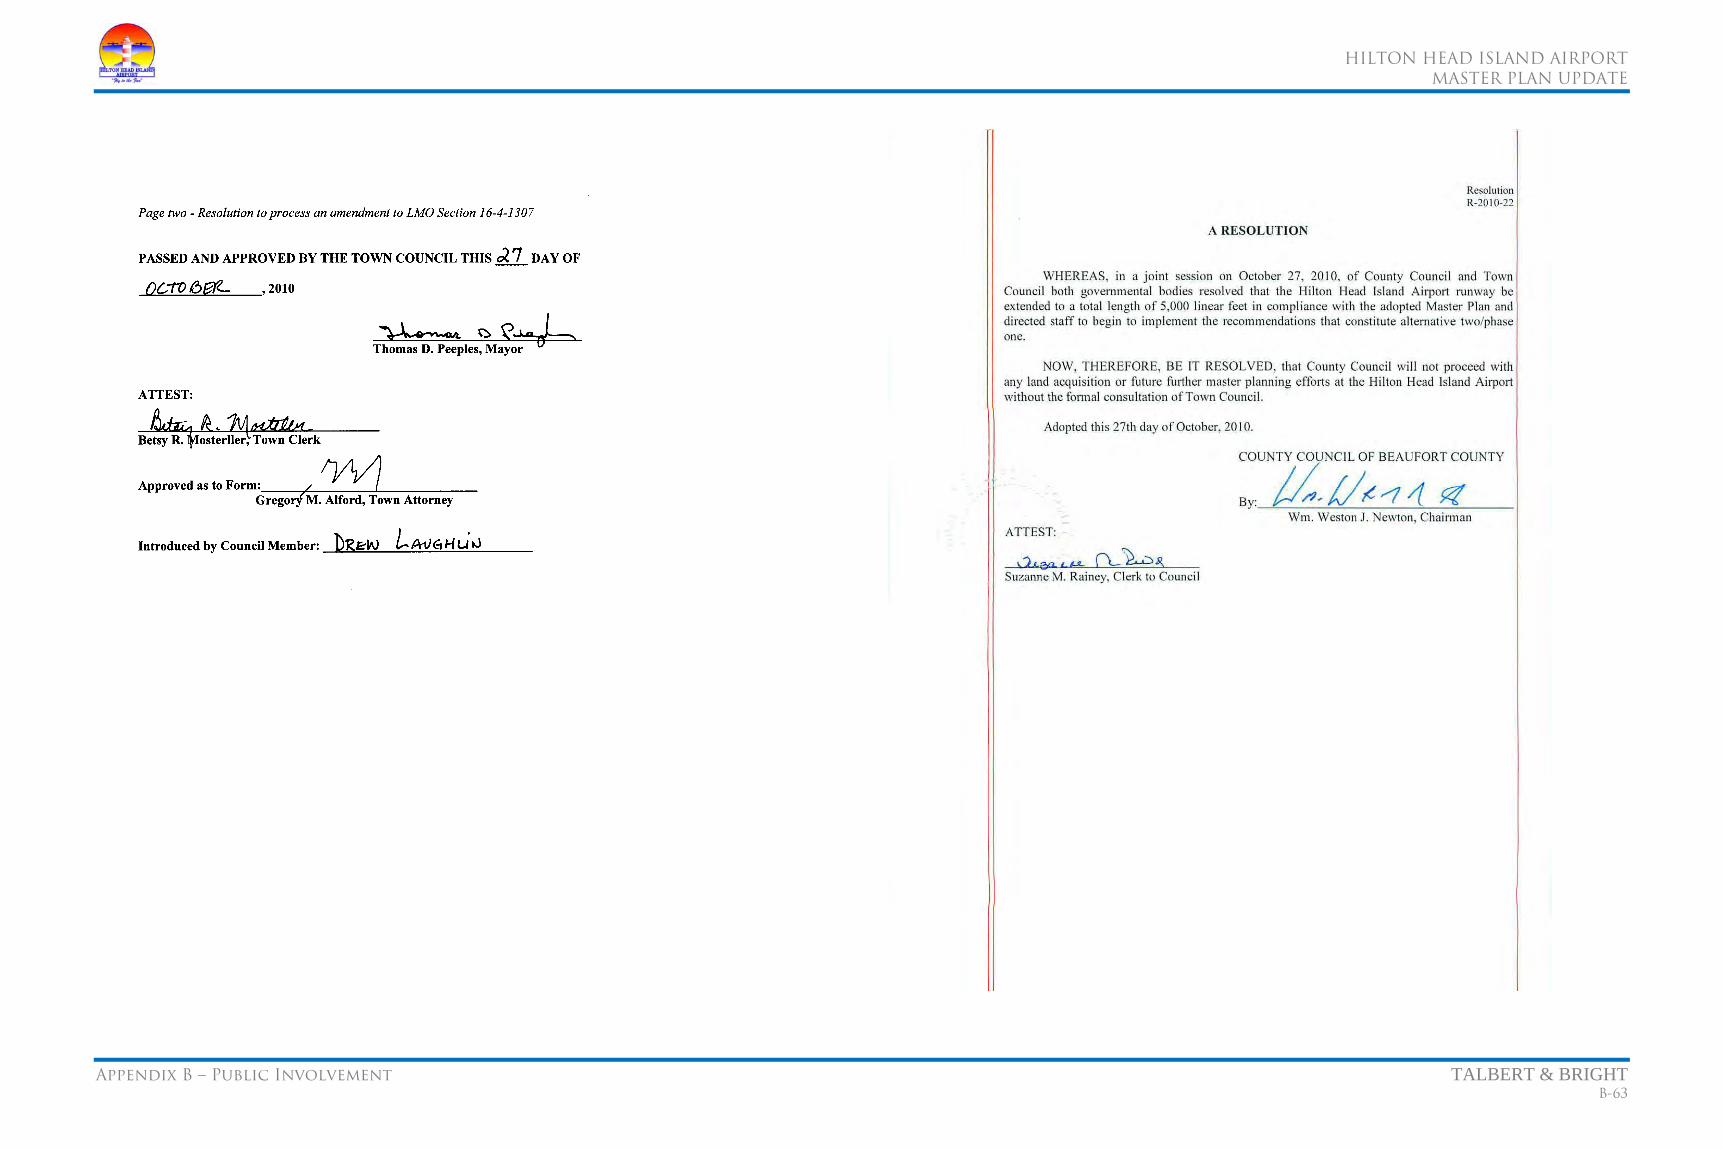
HILTON HEAD ISLAND AIRPORT
MASTER PLAN UPDATE
Appendix B – Public Involvement TALBERT & BRIGHT B-63

HILTON HEAD ISLAND AIRPORT
MASTER PLAN UPDATE
Appendix C – Instrument Flight Rules Data TALBERT & BRIGHT C-1
The instrument flight rules (IFR) data presented below was provided by the FAA to the SCAC for use in the South Carolina Airports System Plan. This information is updated annually.
C.1 IFR OPERATIONS AT HXD IN 2009
HXD INSTRUMENT FLIGHT RULE OPERATIONS - YEAR 2009 Total IFR Ops: 23,876
Single-Engine Piston Multi-Engine Piston TurbopropA28A 0 F8L 0 P28R 60 AC50 0 AC43 0 DO32 0 AA1 0 FDCT 0 P28T 13 AC6L 0 AC80 0 E110 0 AA5 23 GA8 0 P32 2 AEST 44 AC90 25 E120 0 AA5A 2 GC1 2 P32A 2 BE18 2 AC95 4 E2 0 AA5B 2 GLAS 7 P32G 0 BE50 3 AN12 0 E2C 0 AC11 61 HUSK 6 P32R 136 BE55 124 AN24 0 F27 0 AC12 1 HXB 26 P32T 5 BE56 0 AT42 0 F406 0 AC14 2 HXP 0 PA2 0 BE58 692 AT43 0 F50 0 AC23 0 LA25 0 PA22 0 BE60 13 AT72 0 HXC 3 B36 1 LA4 7 PA24 62 BE65 2 ATR4 0 JS31 0 BE19 0 LANC 0 PA28 270 BE76 23 B10 0 JS32 0 BE23 13 LC40 8 PA2T 0 BE95 4 B190 2 MU2 6 BE24 13 LC42 0 PA32 1,109 BE99 0 B200 0 P180 72 BE33 145 LEG2 0 PA46 66 C303 2 B300 0 P3 0 BE35 202 LGEZ 0 PARO 0 C310 96 B350 211 P46 0 BE36 593 LNC2 0 R20 0 C320 4 B36T 2 P46T 73 BL17 9 LNC4 11 R90R 0 C335 5 B90 0 PAY1 22 BL8 2 LNCE 0 RANG 2 C337 32 B9L 0 PAY2 77 C10T 0 M020 0 RV10 4 C340 49 BE3L 0 PAY3 11 C150 19 M20 11 RV6 3 C401 3 BE10 31 PAY4 0 C152 24 M20A 2 RV7 8 C402 2 BE20 597 PAYE 4 C172 586 M20C 1 RV8 2 C404 0 BE30 66 PC12 314 C177 12 M20F 0 SR20 209 C414 204 BE9 0 PC6T 0 C180 10 M20J 13 SR22 1,131 C421 191 BE90 8 RC70 0 C182 460 M20K 0 SRT2 0 CE25 0 BE9L 514 SC7 0 C185 0 M20M 0 STIN 1 DA42 16 BE9T 32 SF34 1,767 C195 0 M20P 128 SYMP 0 DEF1 0 BL9 0 SH33 0 C205 0 M20R 3 T18 0 GA7 0 C130 0 SH36 0 C206 78 M20T 55 T206 0 P34 0 C2 0 SW3 8 C207 0 M22 0 T34 1 P44 0 C208 480 SW4 0 C210 183 M5 0 T34P 0 P68 2 C212 0 T34P 0 C72R 9 M7 0 TB10 0 PA23 8 C425 52 T34T 0 C77R 20 MO20 96 TB20 0 PA27 35 C441 24 T6 0 C82 0 MO21 1 TOBA 0 PA30 90 CA12 0 TB20 0 C82R 10 MO2C 0 TRIN 10 PA31 201 CN35 0 TBM7 18 C82T 3 MO2P 0 VELO 26 PA34 198 CV58 0 TEX2 0 CH2T 0 NAV 0 VFR 0 PA39 12 CVLT 0 COL3 21 NAV1 0 Z43 0 PA43 0 D328 0 COL4 97 P210 2 PA44 59 DH8A 5,070 COUR 0 P28 16 PA58 0 DH8B 0 DA40 99 P28A 269 PA60 1 DH8C 4
HXD INSTRUMENT FLIGHT RULE OPERATIONS - YEAR 2009 Total IFR Ops: 23,876
Single-Engine Piston Multi-Engine Piston TurbopropE400 0 P28B 26 PASE 9 DHC6 0 F33A 0 P28P 0 T303 0 DO28 0
Total Single Engine 6,512 Total Multi-Engine 2,126 Total Turboprops 9,497 % of Total Ops 27.3% % of Total Ops 8.9% % of Total Ops 39.8%
HXD INSTRUMENT FLIGHT RULE OPERATIONS - YEAR 2009 Total IFR Ops: 23,876
Jet Aircraft HelicoptersA10 0 CARJ 0 GLEX 0 A109 1 A124 0 CH35 0 GLF2 2 AS33 0 A225 0 CL30 62 GLF3 0 B06 0 A306 0 CL60 96 GLF4 34 CH53 0 A310 0 CL6T 0 GLF5 6 H47 0 A318 0 CRG2 0 GLX 0 H60 1 A319 0 CRJ 0 H25 0 HELO 9 A320 0 CRJ1 0 H25A 7 HU65 0 A321 0 CRJ2 0 H25B 86 S76 0 AGEN 0 CRJ7 0 H25C 0 S92 1 AS65 0 CRJ9 0 HAR 0 UH60 0 ASTR 26 CRL2 0 HS25 0 V22 0 B230 0 DC10 0 J328 0 B703 0 DC86 0 JET 0 B712 0 DC87 0 K35R 0 B721 0 DC9 0 L29B 0 B722 0 DC91 0 L39 5 B72Q 0 DC93 0 LGE2 0 B732 0 DC94 0 LJ24 2 B733 0 DC95 0 LJ25 28 B734 0 DC9Q 0 LJ31 54 B735 0 DV20 51 LJ35 18 B737 0 E135 2 LJ40 74 B738 0 E145 0 LJ45 103 B73Q 0 E170 0 LJ55 10 B741 0 E175 0 LJ60 12 B742 0 E45X 0 LR25 0 B743 0 E6 0 LR35 0 B744 0 EA50 107 LR40 0 B747 0 EA6 0 LR45 0 B752 1 F15 0 LR60 0 B753 0 F16 0 MD11 0 B762 0 F18 0 MD80 0 B763 0 F260 0 MD82 0 BE40 566 F2TH 81 MD83 0 C17 0 F900 86 MD87 0 C21 0 FA10 90 MD88 0 C25A 81 FA18 0 MU30 6 C25B 238 FA20 109 PR1 0 C40 0 FA2O 0 PRM1 94

HILTON HEAD ISLAND AIRPORT
MASTER PLAN UPDATE
Appendix C – Instrument Flight Rules Data TALBERT & BRIGHT C-2
HXD INSTRUMENT FLIGHT RULE OPERATIONS - YEAR 2009 Total IFR Ops: 23,876
Jet Aircraft HelicoptersC500 26 FA50 74 R722 0 C501 16 FA90 0 SB20 0 C510 14 G150 4 SBR1 0 C525 225 G159 0 SBR2 0 C526 0 G2 0 T1 0 C550 236 G200 0 T2 0 C551 2 G4 0 T2P 0 C560 744 G400 0 T24C 0 C56X 695 G5 0 T37 0 C650 80 GALX 7 T38 0 C680 291 GL4 0 WW24 17 C722 0 GL5T 0 XL2 11 C750 0 GLAX 0
Total Jets 4,579 Total Helos 12
% of Total Ops 19.2% % of Total Ops 0.5%
C.2 IFR OPERATIONS AT HXD IN 2008
HXD INSTRUMENT FLIGHT RULE OPERATIONS - YEAR 2008 Total IFR Ops: 24,377
Single-Engine Piston Multi-Engine Piston Turboprop A28A 0 F8L 0 P28R 71 AC50 7 AC43 0 DO32 0 AA1 1 FDCT 0 P28T 10 AC6L 0 AC80 0 E110 5 AA5 37 GA8 2 P32 1 AEST 76 AC90 31 E120 4 AA5A 1 GC1 0 P32A 0 BE18 0 AC95 16 E2 0 AA5B 4 GLAS 6 P32G 0 BE50 1 AN12 0 E2C 0 AC11 35 HUSK 1 P32R 146 BE55 178 AN24 0 F27 0 AC12 2 HXB 1 P32T 1 BE56 0 AT42 0 F406 0 AC14 0 HXP 0 PA2 0 BE58 610 AT43 0 F50 0 AC23 0 LA25 0 PA22 3 BE60 9 AT72 1,629 HXC 5 B36 1 LA4 0 PA24 37 BE65 0 ATR4 0 JS31 2 BE19 0 LANC 0 PA28 200 BE76 26 B10 0 JS32 0 BE23 20 LC40 2 PA2T 0 BE95 11 B190 15 MU2 14 BE24 2 LC42 0 PA32 1,244 BE99 2 B200 0 P180 118 BE33 105 LEG2 2 PA46 45 C303 4 B300 2 P3 0 BE35 184 LGEZ 0 PARO 7 C310 98 B350 261 P46 0 BE36 471 LNC2 4 R20 0 C320 2 B36T 1 P46T 50 BL17 7 LNC4 11 R90R 0 C335 6 B90 0 PAY1 44 BL8 1 LNCE 0 RANG 2 C337 16 B9L 0 PAY2 77 C10T 2 M020 4 RV10 1 C340 57 BE3L 0 PAY3 53 C150 17 M20 9 RV6 9 C401 3 BE10 91 PAY4 6 C152 15 M20A 0 RV7 7 C402 7 BE20 729 PAYE 5 C172 755 M20C 1 RV8 12 C404 0 BE30 116 PC12 357 C177 29 M20F 2 SR20 147 C414 329 BE9 0 PC6T 0 C180 2 M20J 11 SR22 1,490 C421 198 BE90 20 RC70 1 C182 470 M20K 1 SRT2 0 CE25 0 BE9L 640 SC7 0 C185 2 M20M 0 STIN 0 DA42 4 BE9T 57 SF34 2
HXD INSTRUMENT FLIGHT RULE OPERATIONS - YEAR 2008 Total IFR Ops: 24,377
Single-Engine Piston Multi-Engine Piston Turboprop C195 0 M20P 99 SYMP 0 DEF1 0 BL9 0 SH33 2 C205 0 M20R 5 T18 0 GA7 0 C130 0 SH36 0 C206 114 M20T 43 T206 0 P34 0 C2 0 SW3 3 C207 3 M22 0 T34 0 P44 0 C208 535 SW4 4 C210 267 M5 0 T34P 0 P68 0 C212 2 T34P 0 C72R 5 M7 0 TB10 0 PA23 20 C425 95 T34T 0 C77R 10 MO20 54 TB20 0 PA27 27 C441 16 T6 0 C82 0 MO21 2 TOBA 6 PA30 73 CA12 0 TB20 0 C82R 20 MO2C 0 TRIN 14 PA31 252 CN35 0 TBM7 36 C82T 0 MO2P 0 VELO 40 PA34 224 CV58 0 TEX2 0 CH2T 1 NAV 0 VFR 0 PA39 0 CVLT 0 COL3 19 NAV1 0 Z43 0 PA43 0 D328 0 COL4 104 P210 2 PA44 32 DH8A 5,015 COUR 2 P28 8 PA58 0 DH8B 0 DA40 64 P28A 161 PA60 1 DH8C 24 E400 0 P28B 29 PASE 6 DHC6 0 F33A 0 P28P 0 T303 0 DO28 24
Total Single Engine 6,725 Total Multi-Engine 2,279 Total Turboprops 10,107 % of Total Ops 27.6% % of Total Ops 9.3% % of Total Ops 41.5%
HXD INSTRUMENT FLIGHT RULE OPERATIONS - YEAR 2008 Total IFR Ops: 24,377
Jet HelicoptersA10 0 CARJ 0 GLEX 2 A109 4 A124 0 CH35 0 GLF2 0 AS33 0 A225 0 CL30 95 GLF3 0 B06 0 A306 0 CL60 70 GLF4 39 CH53 0 A310 0 CL6T 0 GLF5 8 H47 0 A318 0 CRG2 0 GLX 0 H60 0 A319 0 CRJ 0 H25 1 HELO 12 A320 0 CRJ1 0 H25A 0 HU65 0 A321 0 CRJ2 0 H25B 93 S76 4 AGEN 0 CRJ7 0 H25C 2 S92 1 AS65 0 CRJ9 0 HAR 0 UH60 0 ASTR 38 CRL2 0 HS25 1 V22 0 B230 0 DC10 0 J328 0 B703 0 DC86 0 JET 0 B712 0 DC87 0 K35R 0 B721 0 DC9 0 L29B 0 B722 0 DC91 0 L39 4 B72Q 0 DC93 0 LGE2 0 B732 0 DC94 0 LJ24 0 B733 0 DC95 0 LJ25 27 B734 0 DC9Q 0 LJ31 48 B735 0 DV20 13 LJ35 29 B737 0 E135 0 LJ40 67 B738 0 E145 0 LJ45 157 B73Q 0 E170 0 LJ55 8 B741 0 E175 0 LJ60 17

HILTON HEAD ISLAND AIRPORT
MASTER PLAN UPDATE
Appendix C – Instrument Flight Rules Data TALBERT & BRIGHT C-3
HXD INSTRUMENT FLIGHT RULE OPERATIONS - YEAR 2008 Total IFR Ops: 24,377
Jet Helicopters B742 0 E45X 0 LR25 7 B743 0 E6 0 LR35 0 B744 0 EA50 153 LR40 0 B747 0 EA6 0 LR45 0 B752 0 F15 0 LR60 4 B753 0 F16 0 MD11 0 B762 0 F18 0 MD80 0 B763 0 F260 0 MD82 0 BE40 526 F2TH 139 MD83 0 C17 0 F900 100 MD87 0 C21 0 FA10 108 MD88 0 C25A 74 FA18 0 MU30 4 C25B 235 FA20 106 PR1 0 C40 0 FA2O 0 PRM1 35 C500 37 FA50 82 R722 0 C501 44 FA90 0 SB20 0 C510 12 G150 0 SBR1 8 C525 287 G159 0 SBR2 0 C526 2 G2 1 T1 0 C550 466 G200 1 T2 0 C551 0 G4 0 T2P 0 C560 761 G400 0 T24C 0 C56X 922 G5 0 T37 0 C650 130 GALX 0 T38 0 C680 261 GL4 0 WW24 18 C722 0 GL5T 0 XL2 3 C750 0 GLAX 0
Total Jets 5,245 Total Helios 21 % of Total Ops 21.5% % of Total Ops 0.0%
C.3 IFR OPERATIONS AT HXD IN 2007
HXD INSTRUMENT FLIGHT RULE OPERATIONS - YEAR 2007 Total IFR Ops: 25,391
Single-Engine Piston Multi-Engine Piston Turboprop A28A 0 F8L 0 P28R 76 AC50 0 AC43 0 DO32 0 AA1 0 FDCT 0 P28T 18 AC6L 2 AC80 0 E110 18 AA5 18 GA8 2 P32 3 AEST 101 AC90 52 E120 2 AA5A 3 GC1 0 P32A 0 BE18 5 AC95 16 E2 0 AA5B 0 GLAS 0 P32G 0 BE50 0 AN12 0 E2C 0 AC11 18 HUSK 0 P32R 124 BE55 176 AN24 0 F27 0 AC12 0 HXB 12 P32T 17 BE56 0 AT42 0 F406 0 AC14 1 HXP 0 PA2 0 BE58 838 AT43 0 F50 0 AC23 0 LA25 2 PA22 0 BE60 28 AT72 1,922 HXC 0 B36 0 LA4 1 PA24 38 BE65 4 ATR4 0 JS31 2 BE19 4 LANC 0 PA28 26 BE76 26 B10 0 JS32 0 BE23 6 LC40 2 PA2T 0 BE95 9 B190 4 MU2 28 BE24 4 LC42 0 PA32 1,149 BE99 0 B200 0 P180 182
HXD INSTRUMENT FLIGHT RULE OPERATIONS - YEAR 2007 Total IFR Ops: 25,391
Single-Engine Piston Multi-Engine Piston Turboprop BE33 97 LEG2 2 PA46 78 C303 0 B300 0 P3 1 BE35 178 LGEZ 0 PARO 3 C310 174 B350 262 P46 1 BE36 523 LNC2 2 R20 0 C320 0 B36T 1 P46T 90 BL17 9 LNC4 9 R90R 0 C335 8 B90 0 PAY1 29 BL8 0 LNCE 0 RANG 0 C337 5 B9L 1 PAY2 125 C10T 0 M020 0 RV10 2 C340 94 BE3L 0 PAY3 91 C150 8 M20 1 RV6 3 C401 1 BE10 131 PAY4 16 C152 0 M20A 0 RV7 5 C402 8 BE20 952 PAYE 6 C172 223 M20C 2 RV8 0 C404 0 BE30 185 PC12 402 C177 22 M20F 0 SR20 167 C414 250 BE9 1 PC6T 0 C180 5 M20J 3 SR22 1,273 C421 222 BE90 6 RC70 5 C182 451 M20K 0 SRT2 0 CE25 0 BE9L 860 SC7 0 C185 3 M20M 0 STIN 0 DA42 4 BE9T 100 SF34 0 C195 0 M20P 106 SYMP 0 DEF1 0 BL9 0 SH33 0 C205 0 M20R 0 T18 2 GA7 0 C130 0 SH36 0 C206 187 M20T 67 T206 0 P34 0 C2 0 SW3 0 C207 0 M22 0 T34 0 P44 0 C208 539 SW4 4 C210 220 M5 0 T34P 0 P68 1 C212 0 T34P 0 C72R 4 M7 2 TB10 1 PA23 16 C425 115 T34T 0 C77R 11 MO20 10 TB20 0 PA27 37 C441 57 T6 0 C82 0 MO21 1 TOBA 4 PA30 57 CA12 0 TB20 0 C82R 12 MO2C 0 TRIN 16 PA31 289 CN35 0 TBM7 38 C82T 1 MO2P 0 VELO 82 PA34 258 CV58 0 TEX2 0 CH2T 4 NAV 0 VFR 0 PA39 0 CVLT 0 COL3 23 NAV1 0 Z43 0 PA43 0 D328 0 COL4 43 P210 11 PA44 17 DH8A 5,263 COUR 0 P28 2 PA58 0 DH8B 0 DA40 30 P28A 120 PA60 1 DH8C 23 E400 0 P28B 26 PASE 1 DHC6 0 F33A 0 P28P 0 T303 0 DO28 0
Total Single Engine 5,578 Total Multi-Engine 2,632 Total Turboprops 11,530 % of Total Ops 22.0% % of Total Ops 10.4% % of Total Ops 45.4%
HXD INSTRUMENT FLIGHT RULE OPERATIONS - YEAR 2007 Total IFR Ops: 25,391
Jet HelicoptersA10 0 CARJ 0 GLEX 0 A109 0 A124 0 CH35 0 GLF2 0 AS33 0 A225 0 CL30 114 GLF3 2 B06 0 A306 0 CL60 79 GLF4 34 CH53 0 A310 0 CL6T 0 GLF5 6 H47 0 A318 0 CRG2 0 GLX 0 H60 0 A319 0 CRJ 0 H25 0 HELO 0 A320 0 CRJ1 0 H25A 10 HU65 0 A321 0 CRJ2 0 H25B 104 S76 2 AGEN 0 CRJ7 0 H25C 0 S92 0 AS65 0 CRJ9 0 HAR 0 UH60 0 ASTR 32 CRL2 0 HS25 3 V22 0 B230 0 DC10 0 J328 0

HILTON HEAD ISLAND AIRPORT
MASTER PLAN UPDATE
Appendix C – Instrument Flight Rules Data TALBERT & BRIGHT C-4
HXD INSTRUMENT FLIGHT RULE OPERATIONS - YEAR 2007 Total IFR Ops: 25,391
Jet Helicopters B703 0 DC86 0 JET 0 B712 0 DC87 0 K35R 0 B721 0 DC9 0 L29B 0 B722 0 DC91 0 L39 6 B72Q 0 DC93 0 LGE2 0 B732 0 DC94 0 LJ24 0 B733 0 DC95 0 LJ25 18 B734 0 DC9Q 0 LJ31 92 B735 0 DV20 0 LJ35 24 B737 0 E135 0 LJ40 65 B738 0 E145 0 LJ45 163 B73Q 0 E170 0 LJ55 15 B741 0 E175 0 LJ60 36 B742 0 E45X 0 LR25 0 B743 0 E6 0 LR35 0 B744 0 EA50 0 LR40 3 B747 0 EA6 0 LR45 7 B752 0 F15 0 LR60 0 B753 0 F16 0 MD11 0 B762 0 F18 0 MD80 0 B763 0 F260 0 MD82 0 BE40 730 F2TH 100 MD83 0 C17 0 F900 63 MD87 0 C21 0 FA10 71 MD88 0 C25A 100 FA18 0 MU30 8 C25B 200 FA20 150 PR1 0 C40 0 FA2O 0 PRM1 46 C500 33 FA50 70 R722 0 C501 41 FA90 0 SB20 0 C510 9 G150 2 SBR1 2 C525 321 G159 0 SBR2 0 C526 6 G2 0 T1 0 C550 633 G200 0 T2 0 C551 0 G4 0 T2P 0 C560 944 G400 0 T24C 0 C56X 958 G5 0 T37 0 C650 155 GALX 2 T38 0 C680 162 GL4 0 WW24 28 C722 0 GL5T 0 XL2 2 C750 0 GLAX 0
Total Jets 5,649 Total Helios 2 % of Total Ops 22.2% % of Total Ops 0.0%
C.4 IFR OPERATIONS AT HXD IN 2006
HXD INSTRUMENT FLIGHT RULE OPERATIONS - YEAR 2006 Total IFR Ops: 23,801
Single-Engine Piston Multi-Engine Piston TurbopropA28A 0 F8L 0 P28R 75 AC50 0 AC43 0 DO32 0 AA1 0 FDCT 0 P28T 32 AC6L 0 AC80 0 E110 7 AA5 16 GA8 0 P32 3 AEST 117 AC90 74 E120 4 AA5A 1 GC1 0 P32A 1 BE18 7 AC95 21 E2 0 AA5B 1 GLAS 0 P32G 0 BE50 0 AN12 0 E2C 0 AC11 32 HUSK 1 P32R 82 BE55 141 AN24 0 F27 0 AC12 0 HXB 70 P32T 13 BE56 1 AT42 0 F406 0 AC14 0 HXP 0 PA2 0 BE58 818 AT43 0 F50 0 AC23 0 LA25 2 PA22 0 BE60 23 AT72 0 HXC 3 B36 0 LA4 0 PA24 47 BE65 2 ATR4 0 JS31 0 BE19 0 LANC 0 PA28 26 BE76 37 B10 0 JS32 0 BE23 5 LC40 5 PA2T 0 BE95 1 B190 11 MU2 45 BE24 19 LC42 0 PA32 1,315 BE99 0 B200 1 P180 152 BE33 113 LEG2 0 PA46 95 C303 8 B300 0 P3 3 BE35 177 LGEZ 0 PARO 1 C310 218 B350 247 P46 3 BE36 577 LNC2 2 R20 0 C320 3 B36T 2 P46T 171 BL17 11 LNC4 53 R90R 2 C335 0 B90 0 PAY1 26 BL8 0 LNCE 0 RANG 0 C337 20 B9L 2 PAY2 214 C10T 2 M020 0 RV10 0 C340 117 BE3L 0 PAY3 109 C150 5 M20 10 RV6 5 C401 1 BE10 130 PAY4 11 C152 5 M20A 0 RV7 0 C402 12 BE20 1,020 PAYE 3 C172 254 M20C 0 RV8 2 C404 0 BE30 141 PC12 318 C177 19 M20F 1 SR20 146 C414 246 BE9 2 PC6T 0 C180 0 M20J 3 SR22 916 C421 151 BE90 24 RC70 2 C182 344 M20K 3 SRT2 0 CE25 0 BE9L 625 SC7 4 C185 0 M20M 0 STIN 0 DA42 0 BE9T 65 SF34 0 C195 0 M20P 135 SYMP 4 DEF1 0 BL9 0 SH33 0 C205 0 M20R 1 T18 0 GA7 0 C130 1 SH36 3 C206 232 M20T 61 T206 0 P34 2 C2 0 SW3 4 C207 1 M22 0 T34 2 P44 0 C208 564 SW4 18 C210 332 M5 0 T34P 1 P68 2 C212 0 T34P 1 C72R 0 M7 2 TB10 1 PA23 37 C425 48 T34T 2 C77R 3 MO20 7 TB20 1 PA27 35 C441 37 T6 0 C82 0 MO21 0 TOBA 2 PA30 80 CA12 0 TB20 1 C82R 27 MO2C 0 TRIN 13 PA31 339 CN35 0 TBM7 52 C82T 1 MO2P 0 VELO 61 PA34 229 CV58 0 TEX2 0 CH2T 4 NAV 0 VFR 0 PA39 0 CVLT 0 COL3 20 NAV1 0 Z43 0 PA43 0 D328 0 COL4 16 P210 4 PA44 39 DH8A 4,792 COUR 1 P28 0 PA58 0 DH8B 786 DA40 38 P28A 114 PA60 2 DH8C 16 E400 0 P28B 29 PASE 2 DHC6 0 F33A 0 P28P 0 T303 0 DO28 0
Total Single Engine 5,605 Total Multi-Engine 2,690 Total Turboprops 9,765 % of Total Ops 23.5% % of Total Ops 11.3% % of Total Ops 41.0%

HILTON HEAD ISLAND AIRPORT
MASTER PLAN UPDATE
Appendix C – Instrument Flight Rules Data TALBERT & BRIGHT C-5
HXD INSTRUMENT FLIGHT RULE OPERATIONS - YEAR 2006Total IFR Ops: 23,801
Jet HelicoptersA10 0 CARJ 0 GLEX 2 A109 0 A124 0 CH35 0 GLF2 1 AS33 0 A225 0 CL30 120 GLF3 2 B06 0 A306 0 CL60 84 GLF4 56 CH53 0 A310 0 CL6T 0 GLF5 8 H47 0 A318 0 CRG2 0 GLX 0 H60 1 A319 0 CRJ 0 H25 0 HELO 1 A320 0 CRJ1 0 H25A 14 HU65 0 A321 0 CRJ2 0 H25B 98 S76 1 AGEN 0 CRJ7 0 H25C 0 S92 1 AS65 2 CRJ9 0 HAR 0 UH60 0 ASTR 40 CRL2 0 HS25 2 V22 0 B230 0 DC10 0 J328 2 B703 0 DC86 0 JET 0 B712 0 DC87 0 K35R 0 B721 0 DC9 0 L29B 0 B722 0 DC91 0 L39 4 B72Q 0 DC93 0 LGE2 0 B732 0 DC94 0 LJ24 16 B733 0 DC95 0 LJ25 40 B734 0 DC9Q 0 LJ31 120 B735 0 DV20 0 LJ35 34 B737 0 E135 0 LJ40 61 B738 0 E145 0 LJ45 198 B73Q 0 E170 0 LJ55 15 B741 0 E175 0 LJ60 33 B742 0 E45X 0 LR25 0 B743 0 E6 0 LR35 0 B744 0 EA50 0 LR40 1 B747 0 EA6 0 LR45 2 B752 0 F15 1 LR60 1 B753 0 F16 3 MD11 0 B762 0 F18 0 MD80 0 B763 1 F260 0 MD82 0 BE40 607 F2TH 100 MD83 0 C17 0 F900 92 MD87 0 C21 0 FA10 99 MD88 0 C25A 58 FA18 0 MU30 19 C25B 69 FA20 123 PR1 0 C40 0 FA2O 0 PRM1 40 C500 20 FA50 74 R722 0 C501 56 FA90 0 SB20 0 C510 0 G150 0 SBR1 16 C525 399 G159 0 SBR2 0 C526 9 G2 0 T1 0 C550 886 G200 0 T2 0 C551 4 G4 0 T2P 0 C560 910 G400 0 T24C 0 C56X 963 G5 0 T37 1 C650 63 GALX 2 T38 1 C680 98 GL4 0 WW24 55
HXD INSTRUMENT FLIGHT RULE OPERATIONS - YEAR 2006Total IFR Ops: 23,801
Jet HelicoptersC722 0 GL5T 0 XL2 0 C750 12 GLAX 0
Total Jets 5,737 Total Helios 4 % of Total Ops 24.1% % of Total Ops 0.0%
C.5 IFR OPERATIONS AT HXD IN 2005
HXD INSTRUMENT FLIGHT RULE OPERATIONS - YEAR 2005 Total IFR Ops: 22,581
Single-Engine Piston Multi-Engine Piston Turboprop A28A 0 F8L 0 P28R 100 AC50 4 AC43 0 DO32 0 AA1 0 FDCT 0 P28T 45 AC6L 0 AC80 0 E110 12 AA5 17 GA8 0 P32 12 AEST 112 AC90 80 E120 0 AA5A 0 GC1 0 P32A 21 BE18 3 AC95 20 E2 0 AA5B 0 GLAS 2 P32G 0 BE50 1 AN12 0 E2C 0 AC11 34 HUSK 2 P32R 167 BE55 212 AN24 0 F27 0 AC12 0 HXB 4 P32T 9 BE56 0 AT42 0 F406 0 AC14 0 HXP 0 PA2 0 BE58 746 AT43 0 F50 0 AC23 0 LA25 2 PA22 0 BE60 38 AT72 0 HXC 5 B36 3 LA4 0 PA24 47 BE65 4 ATR4 0 JS31 1 BE19 1 LANC 0 PA28 68 BE76 29 B10 0 JS32 0 BE23 3 LC40 1 PA2T 0 BE95 6 B190 7 MU2 185 BE24 20 LC42 2 PA32 889 BE99 0 B200 1 P180 219 BE33 93 LEG2 2 PA46 141 C303 9 B300 4 P3 0 BE35 182 LGEZ 0 PARO 3 C310 198 B350 230 P46 0 BE36 683 LNC2 0 R20 0 C320 0 B36T 0 P46T 129 BL17 12 LNC4 1 R90R 0 C335 18 B90 0 PAY1 28 BL8 0 LNCE 0 RANG 2 C337 16 B9L 1 PAY2 282 C10T 1 M020 0 RV10 0 C340 81 BE3L 0 PAY3 63 C150 0 M20 14 RV6 0 C401 1 BE10 116 PAY4 11 C152 0 M20A 0 RV7 2 C402 16 BE20 907 PAYE 1 C172 188 M20C 1 RV8 0 C404 0 BE30 216 PC12 197 C177 20 M20F 0 SR20 43 C414 237 BE9 0 PC6T 0 C180 2 M20J 6 SR22 367 C421 175 BE90 37 RC70 0 C182 379 M20K 3 SRT2 0 CE25 0 BE9L 664 SC7 0 C185 1 M20M 0 STIN 0 DA42 0 BE9T 69 SF34 2 C195 0 M20P 163 SYMP 0 DEF1 0 BL9 0 SH33 0 C205 0 M20R 2 T18 0 GA7 1 C130 0 SH36 0 C206 118 M20T 71 T206 0 P34 0 C2 0 SW3 0 C207 2 M22 0 T34 2 P44 0 C208 527 SW4 15 C210 169 M5 0 T34P 0 P68 0 C212 0 T34P 0 C72R 6 M7 5 TB10 2 PA23 22 C425 33 T34T 0 C77R 7 MO20 12 TB20 0 PA27 56 C441 24 T6 0 C82 0 MO21 0 TOBA 0 PA30 53 CA12 0 TB20 0 C82R 42 MO2C 0 TRIN 26 PA31 321 CN35 0 TBM7 141 C82T 1 MO2P 0 VELO 0 PA34 300 CV58 0 TEX2 0 CH2T 0 NAV 0 VFR 0 PA39 0 CVLT 0 COL3 18 NAV1 0 Z43 0 PA43 0 D328 0

HILTON HEAD ISLAND AIRPORT
MASTER PLAN UPDATE
Appendix C – Instrument Flight Rules Data TALBERT & BRIGHT C-6
HXD INSTRUMENT FLIGHT RULE OPERATIONS - YEAR 2005 Total IFR Ops: 22,581
Single-Engine Piston Multi-Engine Piston Turboprop COL4 1 P210 1 PA44 27 DH8A 3,356 COUR 1 P28 3 PA58 0 DH8B 2,231 DA40 21 P28A 135 PA60 0 DH8C 27 E400 0 P28B 16 PASE 0 DHC6 0 F33A 0 P28P 0 T303 0 DO28 0
Total Single Engine 4,419 Total Multi-Engine 2,686 Total Turboprops 9,841 % of Total Ops 19.6% % of Total Ops 11.9% % of Total Ops 43.6%
HXD INSTRUMENT FLIGHT RULE OPERATIONS - YEAR 2005 Total IFR Ops: 22,581
Jet HelicoptersA10 0 CARJ 0 GLEX 0 A109 2 A124 0 CH35 0 GLF2 0 AS33 0 A225 0 CL30 42 GLF3 0 B06 0 A306 0 CL60 77 GLF4 64 CH53 0 A310 0 CL6T 0 GLF5 12 H47 0 A318 0 CRG2 0 GLX 0 H60 2 A319 0 CRJ 0 H25 3 HELO 0 A320 0 CRJ1 0 H25A 12 HU65 0 A321 0 CRJ2 0 H25B 100 S76 1 AGEN 0 CRJ7 0 H25C 0 S92 0 AS65 0 CRJ9 0 HAR 0 UH60 0 ASTR 70 CRL2 0 HS25 4 V22 0 B230 0 DC10 0 J328 0 B703 0 DC86 0 JET 0 B712 0 DC87 0 K35R 0 B721 0 DC9 0 L29B 0 B722 0 DC91 0 L39 3 B72Q 0 DC93 0 LGE2 0 B732 0 DC94 0 LJ24 0 B733 0 DC95 0 LJ25 36 B734 0 DC9Q 0 LJ31 68 B735 0 DV20 0 LJ35 62 B737 0 E135 0 LJ40 18 B738 0 E145 0 LJ45 243 B73Q 0 E170 0 LJ55 6 B741 0 E175 0 LJ60 22 B742 0 E45X 0 LR25 0 B743 0 E6 0 LR35 0 B744 0 EA50 0 LR40 0 B747 0 EA6 1 LR45 3 B752 0 F15 1 LR60 0 B753 0 F16 0 MD11 0 B762 0 F18 3 MD80 0 B763 0 F260 0 MD82 0 BE40 531 F2TH 75 MD83 0 C17 1 F900 120 MD87 0 C21 0 FA10 162 MD88 0 C25A 41 FA18 0 MU30 4
HXD INSTRUMENT FLIGHT RULE OPERATIONS - YEAR 2005 Total IFR Ops: 22,581
Jet HelicoptersC25B 8 FA20 50 PR1 0 C40 0 FA2O 0 PRM1 41 C500 37 FA50 143 R722 0 C501 149 FA90 0 SB20 0 C510 0 G150 0 SBR1 11 C525 422 G159 0 SBR2 0 C526 1 G2 0 T1 1 C550 758 G200 0 T2 0 C551 3 G4 0 T2P 0 C560 964 G400 0 T24C 0 C56X 1,044 G5 0 T37 0 C650 109 GALX 0 T38 1 C680 20 GL4 0 WW24 60 C722 0 GL5T 0 XL2 0 C750 24 GLAX 0
Total Jets 5,630 Total Helios 5 % of Total Ops 24.9% % of Total Ops 0.0%
C.6 IFR OPERATIONS AT HXD IN 2004
HXD INSTRUMENT FLIGHT RULE OPERATIONS - YEAR 2004 Total IFR Ops: 22,559
Single-Engine Piston Multi-Engine Piston Turboprop A28A 0 F8L 0 P28R 100 AC50 4 AC43 0 DO32 0 AA1 0 FDCT 0 P28T 72 AC6L 0 AC80 2 E110 0 AA5 23 GA8 0 P32 9 AEST 119 AC90 70 E120 0 AA5A 4 GC1 0 P32A 10 BE18 0 AC95 12 E2 0 AA5B 2 GLAS 0 P32G 0 BE50 9 AN12 0 E2C 0 AC11 52 HUSK 0 P32R 162 BE55 203 AN24 0 F27 0 AC12 1 HXB 4 P32T 5 BE56 0 AT42 0 F406 0 AC14 0 HXP 0 PA2 0 BE58 668 AT43 0 F50 0 AC23 0 LA25 1 PA22 0 BE60 28 AT72 0 HXC 6 B36 4 LA4 0 PA24 55 BE65 4 ATR4 0 JS31 2 BE19 2 LANC 0 PA28 53 BE76 24 B10 0 JS32 4 BE23 5 LC40 11 PA2T 0 BE95 11 B190 4 MU2 94 BE24 25 LC42 1 PA32 843 BE99 0 B200 0 P180 275 BE33 140 LEG2 0 PA46 144 C303 18 B300 1 P3 1 BE35 232 LGEZ 0 PARO 1 C310 175 B350 248 P46 1 BE36 638 LNC2 5 R20 0 C320 0 B36T 0 P46T 108 BL17 3 LNC4 4 R90R 0 C335 0 B90 0 PAY1 39 BL8 0 LNCE 0 RANG 1 C337 22 B9L 0 PAY2 274 C10T 0 M020 0 RV10 0 C340 119 BE3L 0 PAY3 36 C150 2 M20 8 RV6 2 C401 1 BE10 140 PAY4 27 C152 0 M20A 0 RV7 0 C402 14 BE20 938 PAYE 3 C172 248 M20C 3 RV8 0 C404 2 BE30 171 PC12 190 C177 11 M20F 1 SR20 43 C414 206 BE9 0 PC6T 0 C180 2 M20J 2 SR22 241 C421 180 BE90 90 RC70 4 C182 391 M20K 3 SRT2 0 CE25 0 BE9L 973 SC7 0

HILTON HEAD ISLAND AIRPORT
MASTER PLAN UPDATE
Appendix C – Instrument Flight Rules Data TALBERT & BRIGHT C-7
HXD INSTRUMENT FLIGHT RULE OPERATIONS - YEAR 2004 Total IFR Ops: 22,559
Single-Engine Piston Multi-Engine Piston Turboprop C185 4 M20M 0 STIN 0 DA42 0 BE9T 64 SF34 0 C195 0 M20P 148 SYMP 0 DEF1 0 BL9 0 SH33 0 C205 0 M20R 6 T18 0 GA7 0 C130 0 SH36 0 C206 87 M20T 111 T206 0 P34 0 C2 0 SW3 7 C207 0 M22 0 T34 11 P44 0 C208 551 SW4 18 C210 246 M5 0 T34P 1 P68 0 C212 0 T34P 1 C72R 4 M7 1 TB10 2 PA23 54 C425 22 T34T 2 C77R 7 MO20 15 TB20 5 PA27 37 C441 11 T6 0 C82 4 MO21 0 TOBA 1 PA30 82 CA12 0 TB20 5 C82R 21 MO2C 0 TRIN 48 PA31 290 CN35 0 TBM7 78 C82T 0 MO2P 0 VELO 0 PA34 247 CV58 0 TEX2 0 CH2T 2 NAV 0 VFR 0 PA39 0 CVLT 0 COL3 15 NAV1 0 Z43 0 PA43 0 D328 0 COL4 0 P210 1 PA44 30 DH8A 2,928 COUR 0 P28 9 PA58 0 DH8B 1,952 DA40 13 P28A 115 PA60 8 DH8C 248 E400 0 P28B 18 PASE 1 DHC6 0 F33A 1 P28P 0 T303 0 DO28 0
Total Single Engine 4,465 Total Multi-Engine 2,556 Total Turboprops 9,600 % of Total Ops 19.8% % of Total Ops 11.3% % of Total Ops 42.6%
HXD INSTRUMENT FLIGHT RULE OPERATIONS - YEAR 2004Total IFR Ops: 22,559
Jet Helicopters A10 1 CARJ 0 GLEX 4 A109 2 A124 0 CH35 0 GLF2 9 AS33 0 A225 0 CL30 15 GLF3 5 B06 1 A306 0 CL60 41 GLF4 65 CH53 0 A310 0 CL6T 0 GLF5 3 H47 1 A318 0 CRG2 0 GLX 0 H60 1 A319 0 CRJ 0 H25 2 HELO 0 A320 0 CRJ1 0 H25A 15 HU65 0 A321 0 CRJ2 0 H25B 160 S76 0 AGEN 0 CRJ7 0 H25C 0 S92 2 AS65 2 CRJ9 0 HAR 0 UH60 0 ASTR 71 CRL2 0 HS25 3 V22 0 B230 0 DC10 0 J328 0 B703 0 DC86 0 JET 0 B712 0 DC87 0 K35R 0 B721 0 DC9 0 L29B 6 B722 0 DC91 0 L39 4 B72Q 0 DC93 0 LGE2 0 B732 1 DC94 0 LJ24 2 B733 0 DC95 0 LJ25 26 B734 0 DC9Q 0 LJ31 144 B735 0 DV20 0 LJ35 111 B737 0 E135 1 LJ40 20 B738 0 E145 0 LJ45 296 B73Q 0 E170 0 LJ55 8
HXD INSTRUMENT FLIGHT RULE OPERATIONS - YEAR 2004Total IFR Ops: 22,559
Jet HelicoptersB741 0 E175 0 LJ60 28 B742 0 E45X 0 LR25 0 B743 0 E6 0 LR35 1 B744 0 EA50 0 LR40 1 B747 0 EA6 0 LR45 4 B752 0 F15 1 LR60 0 B753 0 F16 3 MD11 0 B762 0 F18 3 MD80 0 B763 1 F260 0 MD82 0 BE40 533 F2TH 58 MD83 0 C17 0 F900 134 MD87 0 C21 0 FA10 161 MD88 0 C25A 30 FA18 0 MU30 17 C25B 0 FA20 101 PR1 0 C40 0 FA2O 0 PRM1 32 C500 41 FA50 229 R722 0 C501 86 FA90 1 SB20 0 C510 0 G150 0 SBR1 18 C525 426 G159 0 SBR2 0 C526 6 G2 0 T1 0 C550 868 G200 0 T2 0 C551 6 G4 1 T2P 0 C560 970 G400 0 T24C 0 C56X 899 G5 1 T37 0 C650 195 GALX 2 T38 0 C680 0 GL4 0 WW24 20 C722 0 GL5T 0 XL2 0 C750 39 GLAX 0
Total Jets 5,931 Total Helios 7 % of Total Ops 26.3% % of Total Ops 0.0%
C.7 IFR OPERATIONS AT HXD IN 2003
HXD INSTRUMENT FLIGHT RULE OPERATIONS - YEAR 2003 Total IFR Ops: 22,289
Single-Engine Piston Multi-Engine Piston Turboprop A28A 0 F8L 0 P28R 77 AC50 0 AC43 0 DO32 0 AA1 0 FDCT 0 P28T 39 AC6L 0 AC80 2 E110 0 AA5 30 GA8 0 P32 14 AEST 111 AC90 52 E120 0 AA5A 6 GC1 0 P32A 1 BE18 0 AC95 9 E2 0 AA5B 4 GLAS 0 P32G 0 BE50 16 AN12 0 E2C 0 AC11 56 HUSK 0 P32R 117 BE55 205 AN24 0 F27 0 AC12 0 HXB 1 P32T 6 BE56 0 AT42 0 F406 0 AC14 1 HXP 0 PA2 0 BE58 665 AT43 0 F50 1 AC23 0 LA25 2 PA22 0 BE60 11 AT72 0 HXC 1 B36 3 LA4 0 PA24 35 BE65 0 ATR4 0 JS31 4 BE19 0 LANC 0 PA28 73 BE76 34 B10 0 JS32 0 BE23 7 LC40 5 PA2T 0 BE95 23 B190 0 MU2 44

HILTON HEAD ISLAND AIRPORT
MASTER PLAN UPDATE
Appendix C – Instrument Flight Rules Data TALBERT & BRIGHT C-8
HXD INSTRUMENT FLIGHT RULE OPERATIONS - YEAR 2003 Total IFR Ops: 22,289
Single-Engine Piston Multi-Engine Piston Turboprop BE24 16 LC42 0 PA32 919 BE99 0 B200 0 P180 236 BE33 150 LEG2 0 PA46 188 C303 9 B300 0 P3 2 BE35 206 LGEZ 0 PARO 0 C310 165 B350 220 P46 2 BE36 636 LNC2 5 R20 0 C320 2 B36T 0 P46T 92 BL17 5 LNC4 1 R90R 0 C335 0 B90 0 PAY1 15 BL8 0 LNCE 0 RANG 2 C337 16 B9L 2 PAY2 137 C10T 0 M020 0 RV10 0 C340 114 BE3L 0 PAY3 23 C150 6 M20 22 RV6 0 C401 1 BE10 155 PAY4 2 C152 3 M20A 0 RV7 0 C402 7 BE20 956 PAYE 4 C172 271 M20C 2 RV8 0 C404 2 BE30 172 PC12 188 C177 12 M20F 2 SR20 32 C414 267 BE9 11 PC6T 0 C180 5 M20J 10 SR22 150 C421 287 BE90 97 RC70 0 C182 421 M20K 4 SRT2 0 CE25 0 BE9L 1,102 SC7 0 C185 2 M20M 0 STIN 0 DA42 0 BE9T 72 SF34 0 C195 0 M20P 154 SYMP 0 DEF1 0 BL9 2 SH33 0 C205 0 M20R 2 T18 0 GA7 2 C130 0 SH36 0 C206 50 M20T 77 T206 0 P34 2 C2 0 SW3 20 C207 0 M22 0 T34 4 P44 0 C208 561 SW4 8 C210 268 M5 0 T34P 5 P68 0 C212 1 T34P 5 C72R 2 M7 9 TB10 0 PA23 46 C425 15 T34T 4 C77R 9 MO20 16 TB20 2 PA27 45 C441 33 T6 0 C82 4 MO21 1 TOBA 0 PA30 81 CA12 0 TB20 2 C82R 12 MO2C 0 TRIN 8 PA31 398 CN35 0 TBM7 95 C82T 0 MO2P 0 VELO 2 PA34 293 CV58 0 TEX2 3 CH2T 2 NAV 0 VFR 0 PA39 0 CVLT 0 COL3 3 NAV1 0 Z43 0 PA43 0 D328 0 COL4 0 P210 7 PA44 25 DH8A 2,689 COUR 0 P28 7 PA58 0 DH8B 2,429 DA40 6 P28A 138 PA60 2 DH8C 258 E400 0 P28B 22 PASE 1 DHC6 0 F33A 2 P28P 0 T303 0 DO28 0
Total Single Engine 4,359 Total Multi-Engine 2,830 Total Turboprops 9,726 % of Total Ops 19.6% % of Total Ops 12.7% % of Total Ops 43.6%
HXD INSTRUMENT FLIGHT RULE OPERATIONS - YEAR 2003Total IFR Ops: 22,289
Jet Helicopters A10 0 CARJ 0 GLEX 0 A109 0 A124 0 CH35 0 GLF2 2 AS33 0 A225 0 CL30 0 GLF3 6 B06 0 A306 0 CL60 34 GLF4 64 CH53 0 A310 0 CL6T 0 GLF5 0 H47 0 A318 0 CRG2 0 GLX 0 H60 0 A319 0 CRJ 0 H25 2 HELO 0 A320 0 CRJ1 0 H25A 11 HU65 0 A321 0 CRJ2 0 H25B 161 S76 1 AGEN 0 CRJ7 0 H25C 0 S92 0 AS65 0 CRJ9 0 HAR 1 UH60 0 ASTR 72 CRL2 0 HS25 3 V22 0 B230 0 DC10 0 J328 0
HXD INSTRUMENT FLIGHT RULE OPERATIONS - YEAR 2003Total IFR Ops: 22,289
Jet Helicopters B703 0 DC86 0 JET 0 B712 0 DC87 0 K35R 0 B721 0 DC9 0 L29B 2 B722 0 DC91 0 L39 2 B72Q 0 DC93 0 LGE2 0 B732 0 DC94 0 LJ24 14 B733 0 DC95 0 LJ25 63 B734 0 DC9Q 0 LJ31 175 B735 0 DV20 0 LJ35 98 B737 0 E135 0 LJ40 0 B738 0 E145 0 LJ45 198 B73Q 0 E170 0 LJ55 12 B741 0 E175 0 LJ60 11 B742 1 E45X 0 LR25 5 B743 0 E6 0 LR35 5 B744 0 EA50 0 LR40 0 B747 0 EA6 0 LR45 1 B752 0 F15 2 LR60 0 B753 0 F16 5 MD11 0 B762 0 F18 2 MD80 0 B763 0 F260 0 MD82 0 BE40 421 F2TH 69 MD83 0 C17 0 F900 108 MD87 0 C21 0 FA10 140 MD88 0 C25A 13 FA18 0 MU30 33 C25B 0 FA20 81 PR1 0 C40 0 FA2O 0 PRM1 16 C500 21 FA50 214 R722 0 C501 64 FA90 1 SB20 0 C510 0 G150 0 SBR1 17 C525 376 G159 0 SBR2 3 C526 22 G2 0 T1 0 C550 749 G200 0 T2 1 C551 4 G4 0 T2P 0 C560 933 G400 0 T24C 0 C56X 857 G5 0 T37 3 C650 199 GALX 0 T38 0 C680 0 GL4 0 WW24 25 C722 0 GL5T 0 XL2 0 C750 51 GLAX 0
Total Jets 5,373 Total Helios 1 % of Total Ops 24.1% % of Total Ops 0.0%

HILTON HEAD ISLAND AIRPORT
MASTER PLAN UPDATE
Appendix C – Instrument Flight Rules Data TALBERT & BRIGHT C-9
C.8 IFR OPERATIONS AT HXD IN 2002
HXD INSTRUMENT FLIGHT RULE OPERATIONS - YEAR 2002 Total IFR Ops: 22,922
Single-Engine Piston Multi-Engine Piston Turboprop A28A 0 F8L 0 P28R 137 AC50 8 AC43 0 DO32 0 AA1 0 FDCT 0 P28T 31 AC6L 0 AC80 0 E110 5 AA5 13 GA8 0 P32 16 AEST 75 AC90 57 E120 0 AA5A 5 GC1 0 P32A 2 BE18 0 AC95 4 E2 0 AA5B 2 GLAS 0 P32G 0 BE50 9 AN12 0 E2C 0 AC11 76 HUSK 0 P32R 81 BE55 227 AN24 0 F27 0 AC12 3 HXB 0 P32T 3 BE56 0 AT42 0 F406 0 AC14 5 HXP 0 PA2 0 BE58 729 AT43 0 F50 0 AC23 0 LA25 1 PA22 0 BE60 26 AT72 0 HXC 3 B36 2 LA4 3 PA24 38 BE65 4 ATR4 0 JS31 0 BE19 3 LANC 0 PA28 85 BE76 45 B10 1 JS32 12 BE23 12 LC40 0 PA2T 0 BE95 8 B190 1 MU2 64 BE24 26 LC42 0 PA32 500 BE99 0 B200 0 P180 149 BE33 225 LEG2 0 PA46 150 C303 0 B300 0 P3 0 BE35 200 LGEZ 1 PARO 12 C310 177 B350 274 P46 1 BE36 672 LNC2 3 R20 0 C320 4 B36T 0 P46T 50 BL17 5 LNC4 0 R90R 0 C335 0 B90 1 PAY1 23 BL8 0 LNCE 0 RANG 2 C337 11 B9L 0 PAY2 139 C10T 0 M020 0 RV10 0 C340 98 BE3L 0 PAY3 12 C150 1 M20 18 RV6 0 C401 2 BE10 178 PAY4 6 C152 4 M20A 0 RV7 0 C402 10 BE20 1,033 PAYE 7 C172 278 M20C 0 RV8 1 C404 0 BE30 176 PC12 90 C177 33 M20F 2 SR20 29 C414 387 BE9 3 PC6T 0 C180 6 M20J 15 SR22 65 C421 347 BE90 50 RC70 4 C182 375 M20K 7 SRT2 0 CE25 0 BE9L 925 SC7 0 C185 4 M20M 0 STIN 0 DA42 0 BE9T 65 SF34 0 C195 0 M20P 113 SYMP 0 DEF1 0 BL9 0 SH33 2 C205 0 M20R 2 T18 0 GA7 0 C130 0 SH36 2 C206 25 M20T 51 T206 0 P34 1 C2 0 SW3 34 C207 1 M22 0 T34 1 P44 0 C208 557 SW4 6 C210 309 M5 2 T34P 0 P68 1 C212 0 T34P 0 C72R 3 M7 24 TB10 3 PA23 40 C425 38 T34T 2 C77R 5 MO20 29 TB20 8 PA27 49 C441 29 T6 0 C82 1 MO21 1 TOBA 4 PA30 127 CA12 0 TB20 8 C82R 22 MO2C 0 TRIN 20 PA31 397 CN35 0 TBM7 65 C82T 0 MO2P 0 VELO 0 PA34 271 CV58 0 TEX2 0 CH2T 1 NAV 0 VFR 0 PA39 1 CVLT 0 COL3 0 NAV1 0 Z43 0 PA43 0 D328 0 COL4 0 P210 8 PA44 48 DH8A 2,245 COUR 6 P28 5 PA58 0 DH8B 4,135 DA40 0 P28A 101 PA60 9 DH8C 36 E400 0 P28B 20 PASE 0 DHC6 0 F33A 0 P28P 0 T303 0 DO28 0
Total Single Engine 3,917 Total Multi-Engine 3,111 Total Turboprops 10,492 % of Total Ops 17.1% % of Total Ops 13.6% % of Total Ops 45.8%
HXD INSTRUMENT FLIGHT RULE OPERATIONS - YEAR 2002 Total IFR Ops: 22,922
Jet HelicoptersA10 0 CARJ 0 GLEX 0 A109 3 A124 0 CH35 0 GLF2 4 AS33 0 A225 0 CL30 0 GLF3 2 B06 0 A306 0 CL60 53 GLF4 41 CH53 0 A310 0 CL6T 0 GLF5 2 H47 0 A318 0 CRG2 0 GLX 0 H60 0 A319 0 CRJ 0 H25 0 HELO 0 A320 0 CRJ1 0 H25A 30 HU65 0 A321 0 CRJ2 0 H25B 175 S76 0 AGEN 0 CRJ7 0 H25C 2 S92 0 AS65 2 CRJ9 0 HAR 0 UH60 0 ASTR 74 CRL2 0 HS25 7 V22 0 B230 0 DC10 0 J328 2 B703 0 DC86 0 JET 0 B712 0 DC87 0 K35R 0 B721 0 DC9 0 L29B 2 B722 0 DC91 0 L39 5 B72Q 0 DC93 0 LGE2 0 B732 0 DC94 0 LJ24 21 B733 0 DC95 0 LJ25 57 B734 0 DC9Q 0 LJ31 208 B735 0 DV20 0 LJ35 119 B737 0 E135 0 LJ40 0 B738 0 E145 0 LJ45 245 B73Q 0 E170 0 LJ55 13 B741 0 E175 0 LJ60 19 B742 0 E45X 0 LR25 2 B743 0 E6 0 LR35 1 B744 0 EA50 0 LR40 0 B747 0 EA6 0 LR45 13 B752 0 F15 0 LR60 1 B753 0 F16 1 MD11 0 B762 0 F18 0 MD80 0 B763 0 F260 0 MD82 0 BE40 517 F2TH 67 MD83 0 C17 0 F900 112 MD87 0 C21 0 FA10 147 MD88 0 C25A 11 FA18 0 MU30 23 C25B 0 FA20 107 PR1 0 C40 0 FA2O 0 PRM1 15 C500 34 FA50 167 R722 0 C501 94 FA90 0 SB20 0 C510 0 G150 0 SBR1 15 C525 350 G159 0 SBR2 2 C526 20 G2 0 T1 0 C550 817 G200 0 T2 0 C551 8 G4 0 T2P 0 C560 870 G400 0 T24C 0 C56X 603 G5 0 T37 2 C650 232 GALX 2 T38 0

HILTON HEAD ISLAND AIRPORT
MASTER PLAN UPDATE
Appendix C – Instrument Flight Rules Data TALBERT & BRIGHT C-10
HXD INSTRUMENT FLIGHT RULE OPERATIONS - YEAR 2002 Total IFR Ops: 22,922
Jet Helicopters C680 0 GL4 0 WW24 45 C722 0 GL5T 0 XL2 0 C750 38 GLAX 0
Total Jets 5,399 Total Helios 3
% of Total Ops 23.6% % of Total Ops 0.0%
C.9 IFR OPERATIONS AT HXD IN 2001
HXD INSTRUMENT FLIGHT RULE OPERATIONS - YEAR 2001 Total IFR Ops: 22,223
Single-Engine Piston Multi-Engine Piston TurbopropA28A 0 F8L 0 P28R 99 AC50 5 AC43 0 DO32 0 AA1 0 FDCT 0 P28T 16 AC6L 0 AC80 0 E110 0 AA5 21 GA8 0 P32 12 AEST 95 AC90 36 E120 0 AA5A 6 GC1 0 P32A 0 BE18 0 AC95 8 E2 0 AA5B 11 GLAS 0 P32G 0 BE50 15 AN12 0 E2C 0 AC11 72 HUSK 1 P32R 71 BE55 198 AN24 0 F27 0 AC12 8 HXB 0 P32T 1 BE56 0 AT42 0 F406 0 AC14 6 HXP 0 PA2 0 BE58 734 AT43 0 F50 0 AC23 0 LA25 0 PA22 0 BE60 13 AT72 0 HXC 0 B36 0 LA4 0 PA24 48 BE65 1 ATR4 0 JS31 16 BE19 0 LANC 0 PA28 134 BE76 30 B10 0 JS32 18 BE23 5 LC40 0 PA2T 0 BE95 10 B190 0 MU2 314 BE24 32 LC42 0 PA32 391 BE99 0 B200 0 P180 51 BE33 158 LEG2 0 PA46 144 C303 9 B300 0 P3 0 BE35 155 LGEZ 0 PARO 30 C310 191 B350 261 P46 2 BE36 702 LNC2 0 R20 0 C320 7 B36T 0 P46T 15 BL17 10 LNC4 4 R90R 0 C335 1 B90 0 PAY1 18 BL8 0 LNCE 0 RANG 1 C337 27 B9L 0 PAY2 120 C10T 0 M020 2 RV10 0 C340 118 BE3L 0 PAY3 14 C150 4 M20 32 RV6 0 C401 6 BE10 236 PAY4 6 C152 6 M20A 0 RV7 0 C402 2 BE20 1,046 PAYE 37 C172 248 M20C 4 RV8 0 C404 0 BE30 169 PC12 89 C177 17 M20F 3 SR20 19 C414 444 BE9 6 PC6T 0 C180 3 M20J 11 SR22 21 C421 349 BE90 154 RC70 0 C182 342 M20K 5 SRT2 0 CE25 0 BE9L 881 SC7 0 C185 8 M20M 2 STIN 0 DA42 0 BE9T 65 SF34 0 C195 0 M20P 69 SYMP 0 DEF1 0 BL9 0 SH33 0 C205 2 M20R 11 T18 0 GA7 0 C130 0 SH36 0 C206 21 M20T 41 T206 0 P34 6 C2 0 SW3 64 C207 0 M22 0 T34 3 P44 0 C208 181 SW4 6 C210 297 M5 0 T34P 0 P68 1 C212 0 T34P 0 C72R 4 M7 12 TB10 0 PA23 25 C425 16 T34T 1 C77R 2 MO20 36 TB20 4 PA27 46 C441 46 T6 0 C82 2 MO21 1 TOBA 0 PA30 121 CA12 0 TB20 4 C82R 23 MO2C 0 TRIN 12 PA31 645 CN35 0 TBM7 20 C82T 0 MO2P 0 VELO 0 PA34 402 CV58 0 TEX2 0
HXD INSTRUMENT FLIGHT RULE OPERATIONS - YEAR 2001 Total IFR Ops: 22,223
Single-Engine Piston Multi-Engine Piston TurbopropCH2T 0 NAV 0 VFR 0 PA39 0 CVLT 0 COL3 0 NAV1 0 Z43 0 PA43 0 D328 2 COL4 0 P210 7 PA44 53 DH8A 4,659 COUR 2 P28 22 PA58 0 DH8B 1,835 DA40 0 P28A 35 PA60 8 DH8C 1 E400 0 P28B 10 PASE 5 DHC6 0 F33A 2 P28P 0 T303 0 DO28 0
Total Single Engine 3,483 Total Multi-Engine 3,567 Total Turboprops 10,397 % of Total Ops 15.7% % of Total Ops 16.1% % of Total Ops 46.8%
HXD INSTRUMENT FLIGHT RULE OPERATIONS - YEAR 2001 Total IFR Ops: 22,223
Jet HelicoptersA10 0 CARJ 0 GLEX 0 A109 0 A124 0 CH35 0 GLF2 9 AS33 0 A225 0 CL30 0 GLF3 17 B06 0 A306 0 CL60 25 GLF4 37 CH53 0 A310 0 CL6T 0 GLF5 6 H47 0 A318 0 CRG2 0 GLX 0 H60 0 A319 0 CRJ 0 H25 3 HELO 0 A320 0 CRJ1 0 H25A 4 HU65 0 A321 0 CRJ2 0 H25B 160 S76 0 AGEN 0 CRJ7 0 H25C 0 S92 0 AS65 1 CRJ9 0 HAR 0 UH60 0 ASTR 61 CRL2 0 HS25 15 V22 0 B230 0 DC10 0 J328 0 B703 0 DC86 0 JET 0 B712 0 DC87 0 K35R 0 B721 0 DC9 0 L29B 2 B722 0 DC91 0 L39 3 B72Q 0 DC93 0 LGE2 0 B732 0 DC94 0 LJ24 19 B733 0 DC95 0 LJ25 103 B734 0 DC9Q 0 LJ31 198 B735 0 DV20 0 LJ35 123 B737 0 E135 0 LJ40 0 B738 0 E145 0 LJ45 150 B73Q 0 E170 0 LJ55 12 B741 0 E175 0 LJ60 19 B742 0 E45X 0 LR25 4 B743 0 E6 0 LR35 7 B744 0 EA50 0 LR40 0 B747 0 EA6 0 LR45 3 B752 0 F15 0 LR60 0 B753 0 F16 0 MD11 0 B762 0 F18 0 MD80 0 B763 0 F260 0 MD82 0 BE40 532 F2TH 15 MD83 0 C17 0 F900 86 MD87 0
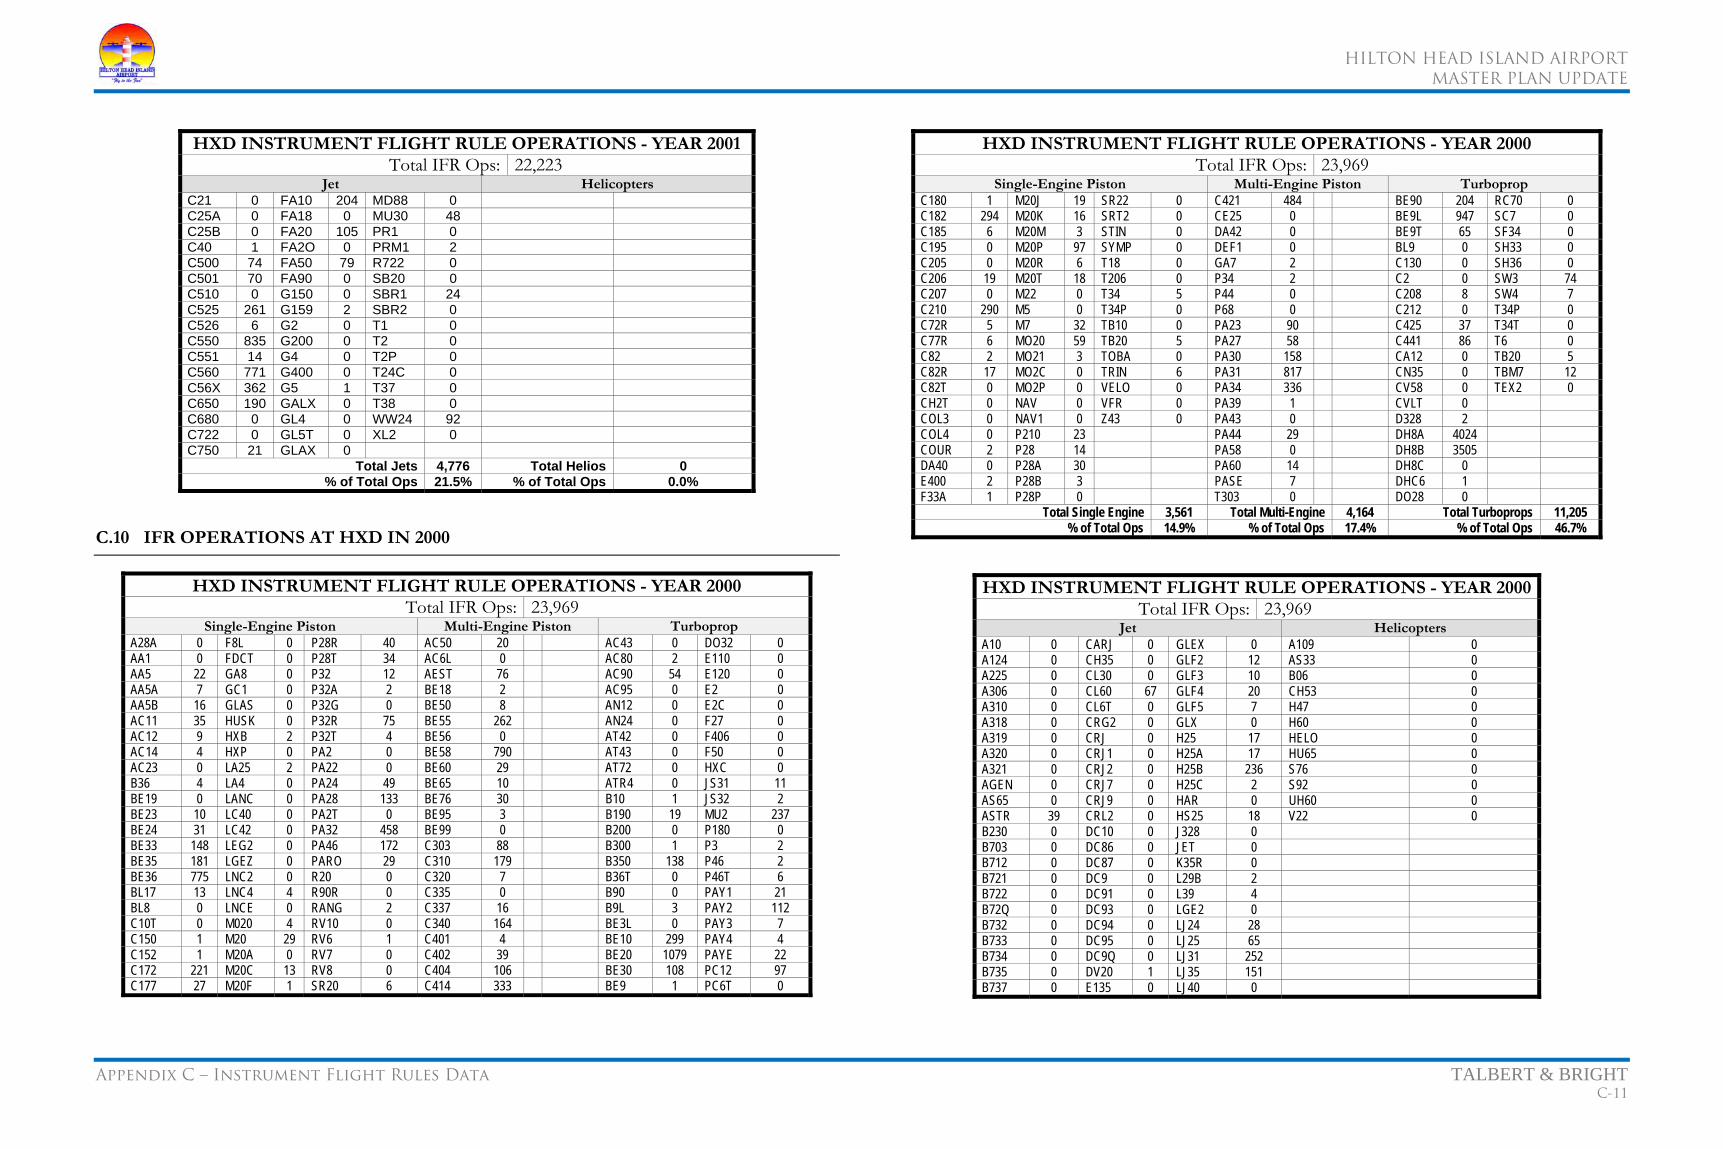
HILTON HEAD ISLAND AIRPORT
MASTER PLAN UPDATE
Appendix C – Instrument Flight Rules Data TALBERT & BRIGHT C-11
HXD INSTRUMENT FLIGHT RULE OPERATIONS - YEAR 2001 Total IFR Ops: 22,223
Jet Helicopters C21 0 FA10 204 MD88 0 C25A 0 FA18 0 MU30 48 C25B 0 FA20 105 PR1 0 C40 1 FA2O 0 PRM1 2 C500 74 FA50 79 R722 0 C501 70 FA90 0 SB20 0 C510 0 G150 0 SBR1 24 C525 261 G159 2 SBR2 0 C526 6 G2 0 T1 0 C550 835 G200 0 T2 0 C551 14 G4 0 T2P 0 C560 771 G400 0 T24C 0 C56X 362 G5 1 T37 0 C650 190 GALX 0 T38 0 C680 0 GL4 0 WW24 92 C722 0 GL5T 0 XL2 0 C750 21 GLAX 0
Total Jets 4,776 Total Helios 0 % of Total Ops 21.5% % of Total Ops 0.0%
C.10 IFR OPERATIONS AT HXD IN 2000
HXD INSTRUMENT FLIGHT RULE OPERATIONS - YEAR 2000 Total IFR Ops: 23,969
Single-Engine Piston Multi-Engine Piston TurbopropA28A 0 F8L 0 P28R 40 AC50 20 AC43 0 DO32 0 AA1 0 FDCT 0 P28T 34 AC6L 0 AC80 2 E110 0 AA5 22 GA8 0 P32 12 AEST 76 AC90 54 E120 0 AA5A 7 GC1 0 P32A 2 BE18 2 AC95 0 E2 0 AA5B 16 GLAS 0 P32G 0 BE50 8 AN12 0 E2C 0 AC11 35 HUSK 0 P32R 75 BE55 262 AN24 0 F27 0 AC12 9 HXB 2 P32T 4 BE56 0 AT42 0 F406 0 AC14 4 HXP 0 PA2 0 BE58 790 AT43 0 F50 0 AC23 0 LA25 2 PA22 0 BE60 29 AT72 0 HXC 0 B36 4 LA4 0 PA24 49 BE65 10 ATR4 0 JS31 11 BE19 0 LANC 0 PA28 133 BE76 30 B10 1 JS32 2 BE23 10 LC40 0 PA2T 0 BE95 3 B190 19 MU2 237 BE24 31 LC42 0 PA32 458 BE99 0 B200 0 P180 0 BE33 148 LEG2 0 PA46 172 C303 88 B300 1 P3 2 BE35 181 LGEZ 0 PARO 29 C310 179 B350 138 P46 2 BE36 775 LNC2 0 R20 0 C320 7 B36T 0 P46T 6 BL17 13 LNC4 4 R90R 0 C335 0 B90 0 PAY1 21 BL8 0 LNCE 0 RANG 2 C337 16 B9L 3 PAY2 112 C10T 0 M020 4 RV10 0 C340 164 BE3L 0 PAY3 7 C150 1 M20 29 RV6 1 C401 4 BE10 299 PAY4 4 C152 1 M20A 0 RV7 0 C402 39 BE20 1079 PAYE 22 C172 221 M20C 13 RV8 0 C404 106 BE30 108 PC12 97 C177 27 M20F 1 SR20 6 C414 333 BE9 1 PC6T 0
HXD INSTRUMENT FLIGHT RULE OPERATIONS - YEAR 2000 Total IFR Ops: 23,969
Single-Engine Piston Multi-Engine Piston TurbopropC180 1 M20J 19 SR22 0 C421 484 BE90 204 RC70 0 C182 294 M20K 16 SRT2 0 CE25 0 BE9L 947 SC7 0 C185 6 M20M 3 STIN 0 DA42 0 BE9T 65 SF34 0 C195 0 M20P 97 SYMP 0 DEF1 0 BL9 0 SH33 0 C205 0 M20R 6 T18 0 GA7 2 C130 0 SH36 0 C206 19 M20T 18 T206 0 P34 2 C2 0 SW3 74 C207 0 M22 0 T34 5 P44 0 C208 8 SW4 7 C210 290 M5 0 T34P 0 P68 0 C212 0 T34P 0 C72R 5 M7 32 TB10 0 PA23 90 C425 37 T34T 0 C77R 6 MO20 59 TB20 5 PA27 58 C441 86 T6 0 C82 2 MO21 3 TOBA 0 PA30 158 CA12 0 TB20 5 C82R 17 MO2C 0 TRIN 6 PA31 817 CN35 0 TBM7 12 C82T 0 MO2P 0 VELO 0 PA34 336 CV58 0 TEX2 0 CH2T 0 NAV 0 VFR 0 PA39 1 CVLT 0 COL3 0 NAV1 0 Z43 0 PA43 0 D328 2 COL4 0 P210 23 PA44 29 DH8A 4024 COUR 2 P28 14 PA58 0 DH8B 3505 DA40 0 P28A 30 PA60 14 DH8C 0 E400 2 P28B 3 PASE 7 DHC6 1 F33A 1 P28P 0 T303 0 DO28 0
Total Single Engine 3,561 Total Multi-Engine 4,164 Total Turboprops 11,205 % of Total Ops 14.9% % of Total Ops 17.4% % of Total Ops 46.7%
HXD INSTRUMENT FLIGHT RULE OPERATIONS - YEAR 2000Total IFR Ops: 23,969
Jet HelicoptersA10 0 CARJ 0 GLEX 0 A109 0 A124 0 CH35 0 GLF2 12 AS33 0 A225 0 CL30 0 GLF3 10 B06 0 A306 0 CL60 67 GLF4 20 CH53 0 A310 0 CL6T 0 GLF5 7 H47 0 A318 0 CRG2 0 GLX 0 H60 0 A319 0 CRJ 0 H25 17 HELO 0 A320 0 CRJ1 0 H25A 17 HU65 0 A321 0 CRJ2 0 H25B 236 S76 0 AGEN 0 CRJ7 0 H25C 2 S92 0 AS65 0 CRJ9 0 HAR 0 UH60 0 ASTR 39 CRL2 0 HS25 18 V22 0 B230 0 DC10 0 J328 0 B703 0 DC86 0 JET 0 B712 0 DC87 0 K35R 0 B721 0 DC9 0 L29B 2 B722 0 DC91 0 L39 4 B72Q 0 DC93 0 LGE2 0 B732 0 DC94 0 LJ24 28 B733 0 DC95 0 LJ25 65 B734 0 DC9Q 0 LJ31 252 B735 0 DV20 1 LJ35 151 B737 0 E135 0 LJ40 0

HILTON HEAD ISLAND AIRPORT
MASTER PLAN UPDATE
Appendix C – Instrument Flight Rules Data TALBERT & BRIGHT C-12
HXD INSTRUMENT FLIGHT RULE OPERATIONS - YEAR 2000Total IFR Ops: 23,969
Jet HelicoptersB738 0 E145 0 LJ45 49 B73Q 0 E170 0 LJ55 23 B741 0 E175 0 LJ60 32 B742 0 E45X 0 LR25 5 B743 0 E6 0 LR35 5 B744 0 EA50 0 LR40 0 B747 0 EA6 0 LR45 6 B752 0 F15 0 LR60 2 B753 0 F16 0 MD11 0 B762 0 F18 0 MD80 0 B763 0 F260 0 MD82 0 BE40 516 F2TH 18 MD83 0 C17 0 F900 95 MD87 0 C21 0 FA10 144 MD88 0 C25A 0 FA18 0 MU30 62 C25B 0 FA20 106 PR1 0 C40 0 FA2O 0 PRM1 0 C500 103 FA50 97 R722 0 C501 134 FA90 0 SB20 0 C510 3 G150 0 SBR1 26 C525 301 G159 6 SBR2 2 C526 2 G2 3 T1 0 C550 769 G200 0 T2 0 C551 8 G4 1 T2P 0 C560 1,030 G400 0 T24C 0 C56X 61 G5 0 T37 0 C650 322 GALX 1 T38 0 C680 0 GL4 0 WW24 117 C722 0 GL5T 0 XL2 0 C750 42 GLAX 0
Total Jets 5,039 Total Helios 0 % of Total Ops 21.0% % of Total Ops 0.0%
C.11 SINGLE-ENGINE PISTON AIRCRAFT
Single-Engine Piston Aircraft Recorded in SC Abbreviation Manufacturer Model A28A Cessna 172RG Skyhawk AA1 Grumman AA1 Yankee AA5 Grumman AA5 Tiger AA5A Grumman AA5A Cheetah AA5B Grumman AA5B Tiger AC11 Rockwell AC-11 Commander AC12 Rockwell AC-12 Commander AC14 Rockwell 114 Commander AC23 Beechcraft 23
Single-Engine Piston Aircraft Recorded in SC Abbreviation Manufacturer ModelB36 Beechcraft 36 Bonanza BE19 Beechcraft B36TC Bonanza BE23 Piper PA-28R Cherokee Arrow BE24 Beechcraft F33 Bonanza BE33 Beechcraft A36 Bonanza BE35 Piper PA-46 Malibu Mirage BE36 Piper PA-26 Dakota BL17 Piper PA-28 Archer BL8 Velocity XLRG C10T Cessna 210T Centurion C150 Cessna 150 C152 Cessna 152 C172 Cessna 172 Skyhawk C177 Cessna 177 Cardinal
Single-Engine Piston Aircraft Recorded in SC Abbreviation Manufacturer ModelC180 Cessna 180 Skywagon C182 Cessna 182 Skylane C185 Cessna 185 Skywagon C195 Cessna 195 C205 Cessna 205 Super Skywagon C206 Cessna 206 Stationair C207 Cessna 207 Skywagon C210 Cessna 210 Centurion C72R Cessna 172R Skyhawk C77R Cessna 177 Cardinal C82 Cessna 182 Skylane C82R Cessna 182R Skylane C82T Cessna 182T Skylane CH2T Zenair CH2T

HILTON HEAD ISLAND AIRPORT
MASTER PLAN UPDATE
Appendix C – Instrument Flight Rules Data TALBERT & BRIGHT C-13
Single-Engine Piston Aircraft Recorded in SC Abbreviation Manufacturer Model COL3 Cirrus SR22 COL4 Cessna 172S Skyhawk COUR Helio H-295 Courier DA40 Diamond DA40 Katana E400 Extra E400 F33A Beechcraft F33A Bonanza F8L Aviamilano F-8L Falco FDCT Flight Design CTSW GA8 Gippsland GA8 Airvan GC1 Globe GC-1 Swift GLAS Glasair III HUSK Aviat A-1 Husky HXB Experimental Aircraft Cruise IAS > 100 and < 201 Kt. HXP Zenith Aircraft CH 601XL LA25 Lake Aircraft LA-250 LA4 Lake LA-4 Buccaneer LA25 Lake LA-250 Renegade LANC Lancair IV LC42 Columbia 400 LEG2 Lancair Legacy LGEZ Rutan Long-EZ LNC2 Lancair 200 LNC4 Lancair 4 LNCE Lancair Super ES M020 Mooney M20 M20 Mooney M20 M20A Mooney M20A M20C Mooney M20C M20F Mooney M20F M20J Mooney M20J M20K Mooney M20K M20M Mooney M20M Bravo M20P Mooney M20P M20R Mooney M20R Ovation M20T Mooney M20T Acclaim M22 Mooney M22 Mustang M5 Maule M5 M7 Maule M7 MO20 Mooney M20F MO21 Pegasus 503 Sport MO2C Mooney M20C MO2P Mooney M20P NAV Ryan L-17 Navion NAV1 Ryan L-17 Navion P210 Cessna P210 Centurion P28 Piper PA-28 Cherokee P28A Piper PA-28A Cherokee P28B Piper PA-28B Dakota
Single-Engine Piston Aircraft Recorded in SC Abbreviation Manufacturer ModelP28P Piper PA-28B Dakota P28R Piper PA-28R Cherokee Arrow P28T Piper PA-28T P32 Piper PA-32A Cherokee Six P32A Piper PA-32A Cherokee Six P32R Piper PA-32R Lance P32T Piper PA-32T Lance P46T Piper PA-46T Malibu Meridian PA2 Piper PA-2 Super Cruiser PA22 Piper PA-22 Tri-Pacer PA24 Piper PA-24 Comanche PA28 Piper PA-28 Cherokee PA2T Piper PA-2T Archer II PA32 Piper PA-32 Saratoga PA46 Piper PA-46 Malibu PARO Beechcraft F33A Bonanza R20 Taylorcraft 12 R90R Ruschmeyer R90R RANG Cessna 182P Skylane RV10 Van's RV-10 RV6 Van's RV-6 RV7 Van's RV-7 RV8 Van's RV-8 SR20 Cirrus SR20 SR22 Cirrus SR22 SRT2 Cirrus SR22 STIN Stinson Reliant SYMP Symphony OMF T18 Thorp T-18 Tiger T206 Cessna Turbo 206 T34 Beechcraft T-34 Mentor T34P Beechcraft T-34 Mentor TB10 Socata TB10 Tobago TB20 Socata TB20 Trinidad TOBA Socata TB10 Tobago TRIN Socata TB20 Trinidad VELO Velocity XL VFR Bellanca 17-30 Viking Z43 Zlin Z-43 Source: Talbert & Bright, Inc., “South Carolina Airports System Plan,” 2008, prepared for the South Carolina Department of Commerce, Division of Aeronautics.
C.12 MULTI-ENGINE PISTON AIRCRAFT
Multi-Engine Piston Aircraft Recorded in SC Abbreviation Manufacturer Model
AC50 Piper PA-30 Twin Comanche AC6L Beechcraft 58 Baron AEST Beechcraft E55 Baron BE18 Beechcraft 18 BE50 Piper PA-31 Navajo BE55 Beechcraft E55 Baron BE56 Beechcraft 56 Baron BE58 Beechcraft 58 Baron BE60 Beechcraft 58P Baron BE65 Beechcraft 65 Queen Air BE76 Beechcraft 76 Duchess BE95 Beechcraft 95 Travel Air BE99 Beechcraft 99 Airliner C303 Cessna 303 Crusader C310 Cessna 310 C320 Cessna 320 Skynight C335 Cessna 335 C337 Cessna 337 Skymaster C340 Cessna 340 C401 Cessna 401 C402 Cessna 402 Utililiner C404 Cessna 404 Titan C414 Cessna 414 C421 Cessna 421 Golden Eagle CE25 Chernov Che-25 DA42 Diamond DA-42 Twin Star DEF1 Britten-Norman Defender GA7 Grumman GA-7 Cougar P34 Piper PA-34 Seneca P44 Piper PA-44 Seminole P68 Partenavia P68 Observer PA23 Piper PA-23 Apache/Aztec PA27 Piper PA-27 Aztec PA30 Piper PA-30 Twin Comanche PA31 Piper PA-31 Chieftain PA34 Piper PA-34 Seneca PA39 Piper PA-39 Twin Comanche PA43 Piper PA-43 Seminole PA44 Piper PA-44 Seminole PA58 Piper PA-60 Aerostar PA60 Piper PA-60 Aerostar PASE Piper PA-34 Seneca T303 Cessna T303 Crusader Source: Talbert & Bright, Inc., “South Carolina Airports System Plan,” 2008, prepared for the South Carolina Department of Commerce, Division of Aeronautics.
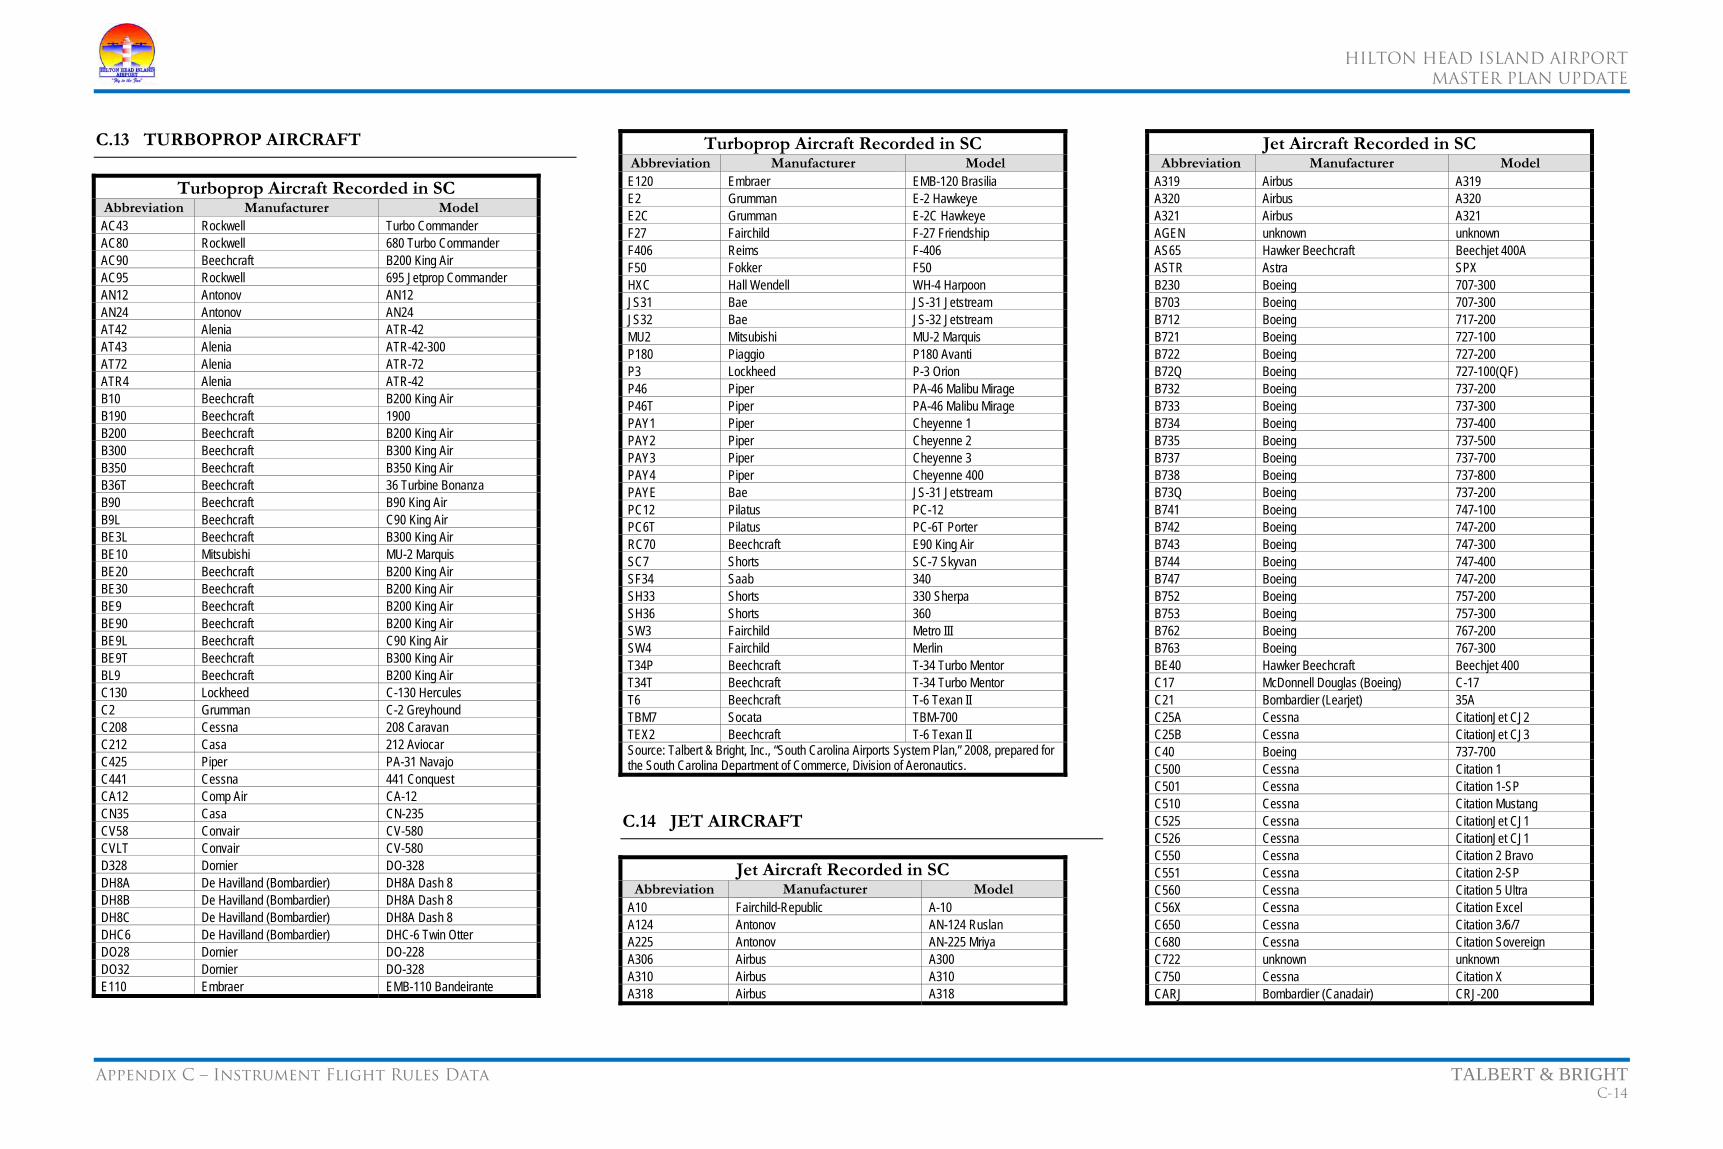
HILTON HEAD ISLAND AIRPORT
MASTER PLAN UPDATE
Appendix C – Instrument Flight Rules Data TALBERT & BRIGHT C-14
C.13 TURBOPROP AIRCRAFT
Turboprop Aircraft Recorded in SC Abbreviation Manufacturer Model AC43 Rockwell Turbo Commander AC80 Rockwell 680 Turbo Commander AC90 Beechcraft B200 King Air AC95 Rockwell 695 Jetprop Commander AN12 Antonov AN12 AN24 Antonov AN24 AT42 Alenia ATR-42 AT43 Alenia ATR-42-300 AT72 Alenia ATR-72 ATR4 Alenia ATR-42 B10 Beechcraft B200 King Air B190 Beechcraft 1900 B200 Beechcraft B200 King Air B300 Beechcraft B300 King Air B350 Beechcraft B350 King Air B36T Beechcraft 36 Turbine Bonanza B90 Beechcraft B90 King Air B9L Beechcraft C90 King Air BE3L Beechcraft B300 King Air BE10 Mitsubishi MU-2 Marquis BE20 Beechcraft B200 King Air BE30 Beechcraft B200 King Air BE9 Beechcraft B200 King Air BE90 Beechcraft B200 King Air BE9L Beechcraft C90 King Air BE9T Beechcraft B300 King Air BL9 Beechcraft B200 King Air C130 Lockheed C-130 Hercules C2 Grumman C-2 Greyhound C208 Cessna 208 Caravan C212 Casa 212 Aviocar C425 Piper PA-31 Navajo C441 Cessna 441 Conquest CA12 Comp Air CA-12 CN35 Casa CN-235 CV58 Convair CV-580 CVLT Convair CV-580 D328 Dornier DO-328 DH8A De Havilland (Bombardier) DH8A Dash 8 DH8B De Havilland (Bombardier) DH8A Dash 8 DH8C De Havilland (Bombardier) DH8A Dash 8 DHC6 De Havilland (Bombardier) DHC-6 Twin Otter DO28 Dornier DO-228 DO32 Dornier DO-328 E110 Embraer EMB-110 Bandeirante
Turboprop Aircraft Recorded in SC Abbreviation Manufacturer ModelE120 Embraer EMB-120 Brasilia E2 Grumman E-2 Hawkeye E2C Grumman E-2C Hawkeye F27 Fairchild F-27 Friendship F406 Reims F-406 F50 Fokker F50 HXC Hall Wendell WH-4 Harpoon JS31 Bae JS-31 Jetstream JS32 Bae JS-32 Jetstream MU2 Mitsubishi MU-2 Marquis P180 Piaggio P180 Avanti P3 Lockheed P-3 Orion P46 Piper PA-46 Malibu Mirage P46T Piper PA-46 Malibu Mirage PAY1 Piper Cheyenne 1 PAY2 Piper Cheyenne 2 PAY3 Piper Cheyenne 3 PAY4 Piper Cheyenne 400 PAYE Bae JS-31 Jetstream PC12 Pilatus PC-12 PC6T Pilatus PC-6T Porter RC70 Beechcraft E90 King Air SC7 Shorts SC-7 Skyvan SF34 Saab 340 SH33 Shorts 330 Sherpa SH36 Shorts 360 SW3 Fairchild Metro III SW4 Fairchild Merlin T34P Beechcraft T-34 Turbo Mentor T34T Beechcraft T-34 Turbo Mentor T6 Beechcraft T-6 Texan II TBM7 Socata TBM-700 TEX2 Beechcraft T-6 Texan II Source: Talbert & Bright, Inc., “South Carolina Airports System Plan,” 2008, prepared for the South Carolina Department of Commerce, Division of Aeronautics.
C.14 JET AIRCRAFT
Jet Aircraft Recorded in SC Abbreviation Manufacturer Model
A10 Fairchild-Republic A-10 A124 Antonov AN-124 Ruslan A225 Antonov AN-225 Mriya A306 Airbus A300 A310 Airbus A310 A318 Airbus A318
Jet Aircraft Recorded in SC Abbreviation Manufacturer Model
A319 Airbus A319 A320 Airbus A320 A321 Airbus A321 AGEN unknown unknown AS65 Hawker Beechcraft Beechjet 400A ASTR Astra SPX B230 Boeing 707-300 B703 Boeing 707-300 B712 Boeing 717-200 B721 Boeing 727-100 B722 Boeing 727-200 B72Q Boeing 727-100(QF) B732 Boeing 737-200 B733 Boeing 737-300 B734 Boeing 737-400 B735 Boeing 737-500 B737 Boeing 737-700 B738 Boeing 737-800 B73Q Boeing 737-200 B741 Boeing 747-100 B742 Boeing 747-200 B743 Boeing 747-300 B744 Boeing 747-400 B747 Boeing 747-200 B752 Boeing 757-200 B753 Boeing 757-300 B762 Boeing 767-200 B763 Boeing 767-300 BE40 Hawker Beechcraft Beechjet 400 C17 McDonnell Douglas (Boeing) C-17 C21 Bombardier (Learjet) 35A C25A Cessna CitationJet CJ2 C25B Cessna CitationJet CJ3 C40 Boeing 737-700 C500 Cessna Citation 1 C501 Cessna Citation 1-SP C510 Cessna Citation Mustang C525 Cessna CitationJet CJ1 C526 Cessna CitationJet CJ1 C550 Cessna Citation 2 Bravo C551 Cessna Citation 2-SP C560 Cessna Citation 5 Ultra C56X Cessna Citation Excel C650 Cessna Citation 3/6/7 C680 Cessna Citation Sovereign C722 unknown unknown C750 Cessna Citation X CARJ Bombardier (Canadair) CRJ-200
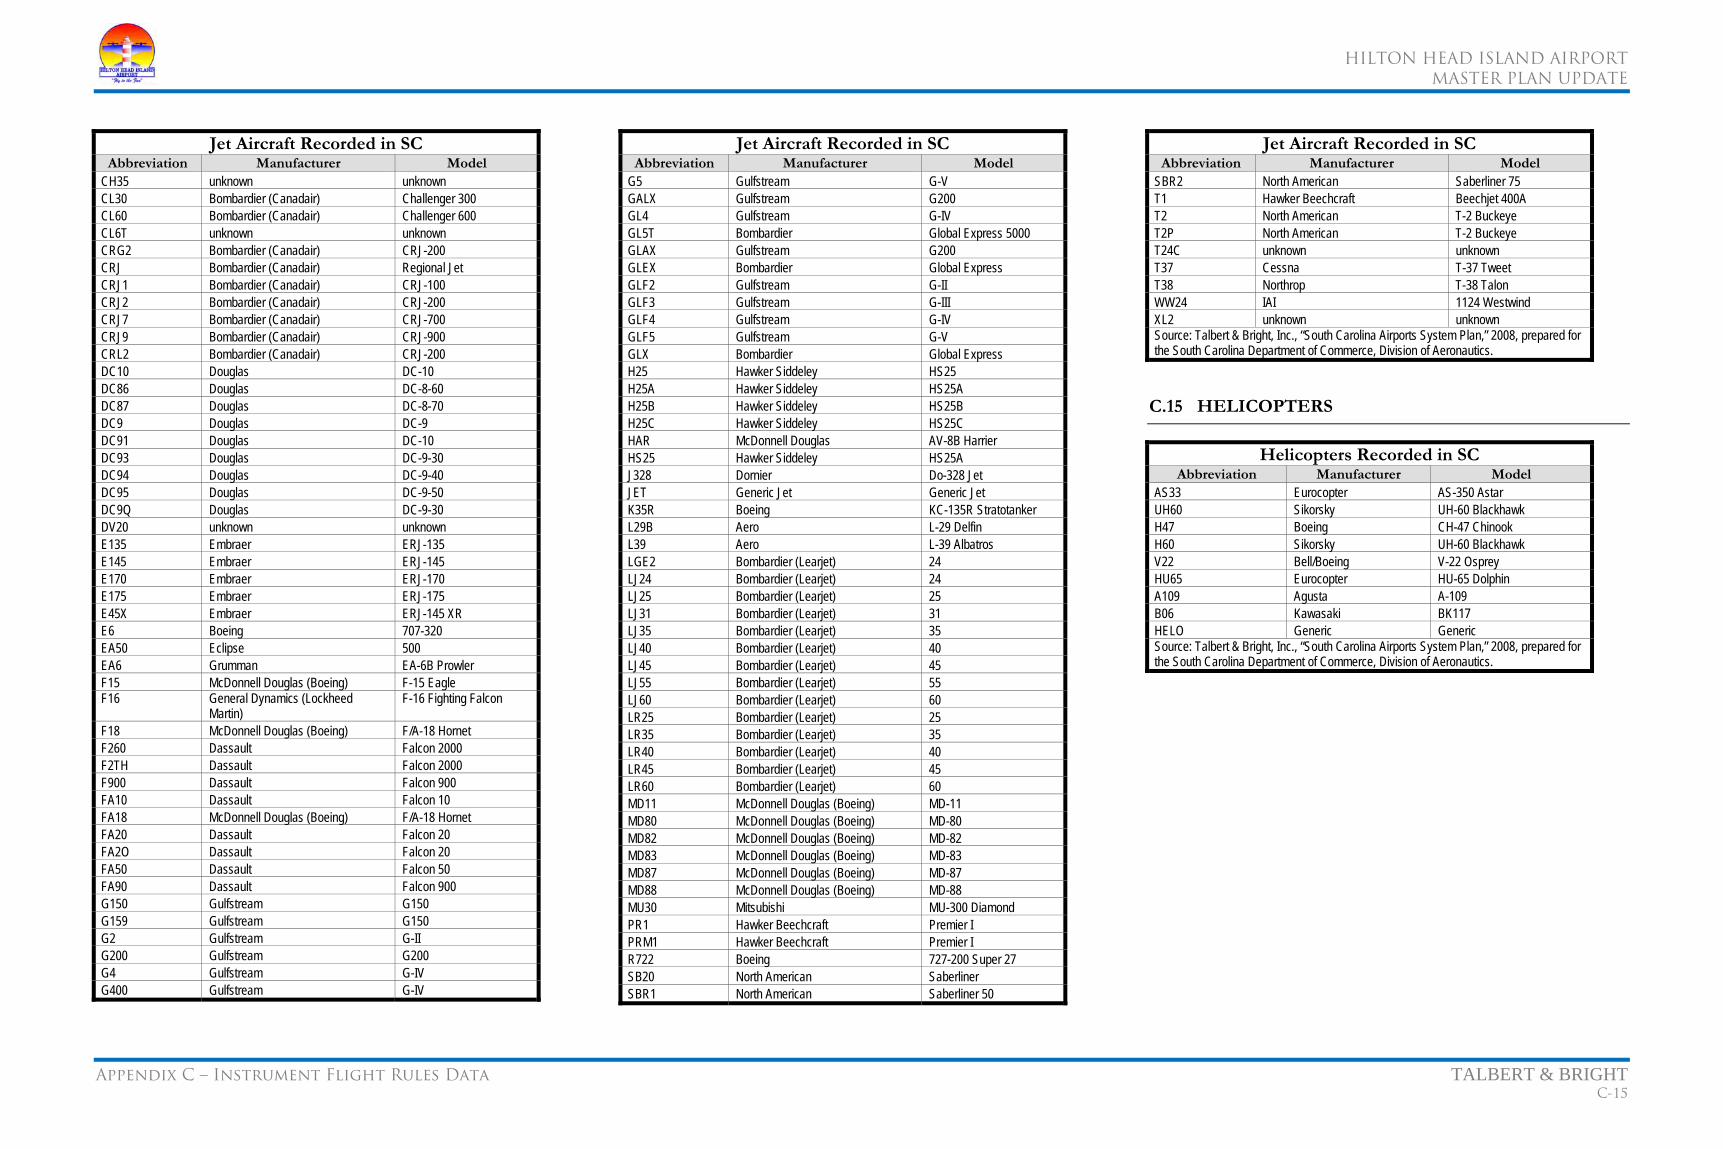
HILTON HEAD ISLAND AIRPORT
MASTER PLAN UPDATE
Appendix C – Instrument Flight Rules Data TALBERT & BRIGHT C-15
Jet Aircraft Recorded in SC Abbreviation Manufacturer Model
CH35 unknown unknown CL30 Bombardier (Canadair) Challenger 300 CL60 Bombardier (Canadair) Challenger 600 CL6T unknown unknown CRG2 Bombardier (Canadair) CRJ-200 CRJ Bombardier (Canadair) Regional Jet CRJ1 Bombardier (Canadair) CRJ-100 CRJ2 Bombardier (Canadair) CRJ-200 CRJ7 Bombardier (Canadair) CRJ-700 CRJ9 Bombardier (Canadair) CRJ-900 CRL2 Bombardier (Canadair) CRJ-200 DC10 Douglas DC-10 DC86 Douglas DC-8-60 DC87 Douglas DC-8-70 DC9 Douglas DC-9 DC91 Douglas DC-10 DC93 Douglas DC-9-30 DC94 Douglas DC-9-40 DC95 Douglas DC-9-50 DC9Q Douglas DC-9-30 DV20 unknown unknown E135 Embraer ERJ-135 E145 Embraer ERJ-145 E170 Embraer ERJ-170 E175 Embraer ERJ-175 E45X Embraer ERJ-145 XR E6 Boeing 707-320 EA50 Eclipse 500 EA6 Grumman EA-6B Prowler F15 McDonnell Douglas (Boeing) F-15 Eagle F16 General Dynamics (Lockheed
Martin) F-16 Fighting Falcon
F18 McDonnell Douglas (Boeing) F/A-18 Hornet F260 Dassault Falcon 2000 F2TH Dassault Falcon 2000 F900 Dassault Falcon 900 FA10 Dassault Falcon 10 FA18 McDonnell Douglas (Boeing) F/A-18 Hornet FA20 Dassault Falcon 20 FA2O Dassault Falcon 20 FA50 Dassault Falcon 50 FA90 Dassault Falcon 900 G150 Gulfstream G150 G159 Gulfstream G150 G2 Gulfstream G-II G200 Gulfstream G200 G4 Gulfstream G-IV G400 Gulfstream G-IV
Jet Aircraft Recorded in SC Abbreviation Manufacturer Model
G5 Gulfstream G-V GALX Gulfstream G200 GL4 Gulfstream G-IV GL5T Bombardier Global Express 5000 GLAX Gulfstream G200 GLEX Bombardier Global Express GLF2 Gulfstream G-II GLF3 Gulfstream G-III GLF4 Gulfstream G-IV GLF5 Gulfstream G-V GLX Bombardier Global Express H25 Hawker Siddeley HS25 H25A Hawker Siddeley HS25A H25B Hawker Siddeley HS25B H25C Hawker Siddeley HS25C HAR McDonnell Douglas AV-8B Harrier HS25 Hawker Siddeley HS25A J328 Dornier Do-328 Jet JET Generic Jet Generic Jet K35R Boeing KC-135R Stratotanker L29B Aero L-29 Delfin L39 Aero L-39 Albatros LGE2 Bombardier (Learjet) 24 LJ24 Bombardier (Learjet) 24 LJ25 Bombardier (Learjet) 25 LJ31 Bombardier (Learjet) 31 LJ35 Bombardier (Learjet) 35 LJ40 Bombardier (Learjet) 40 LJ45 Bombardier (Learjet) 45 LJ55 Bombardier (Learjet) 55 LJ60 Bombardier (Learjet) 60 LR25 Bombardier (Learjet) 25 LR35 Bombardier (Learjet) 35 LR40 Bombardier (Learjet) 40 LR45 Bombardier (Learjet) 45 LR60 Bombardier (Learjet) 60 MD11 McDonnell Douglas (Boeing) MD-11 MD80 McDonnell Douglas (Boeing) MD-80 MD82 McDonnell Douglas (Boeing) MD-82 MD83 McDonnell Douglas (Boeing) MD-83 MD87 McDonnell Douglas (Boeing) MD-87 MD88 McDonnell Douglas (Boeing) MD-88 MU30 Mitsubishi MU-300 Diamond PR1 Hawker Beechcraft Premier I PRM1 Hawker Beechcraft Premier I R722 Boeing 727-200 Super 27 SB20 North American Saberliner SBR1 North American Saberliner 50
Jet Aircraft Recorded in SC Abbreviation Manufacturer Model
SBR2 North American Saberliner 75 T1 Hawker Beechcraft Beechjet 400A T2 North American T-2 Buckeye T2P North American T-2 Buckeye T24C unknown unknown T37 Cessna T-37 Tweet T38 Northrop T-38 Talon WW24 IAI 1124 Westwind XL2 unknown unknown Source: Talbert & Bright, Inc., “South Carolina Airports System Plan,” 2008, prepared for the South Carolina Department of Commerce, Division of Aeronautics.
C.15 HELICOPTERS
Helicopters Recorded in SC Abbreviation Manufacturer Model
AS33 Eurocopter AS-350 Astar UH60 Sikorsky UH-60 Blackhawk H47 Boeing CH-47 Chinook H60 Sikorsky UH-60 Blackhawk V22 Bell/Boeing V-22 Osprey HU65 Eurocopter HU-65 Dolphin A109 Agusta A-109 B06 Kawasaki BK117 HELO Generic Generic Source: Talbert & Bright, Inc., “South Carolina Airports System Plan,” 2008, prepared for the South Carolina Department of Commerce, Division of Aeronautics.
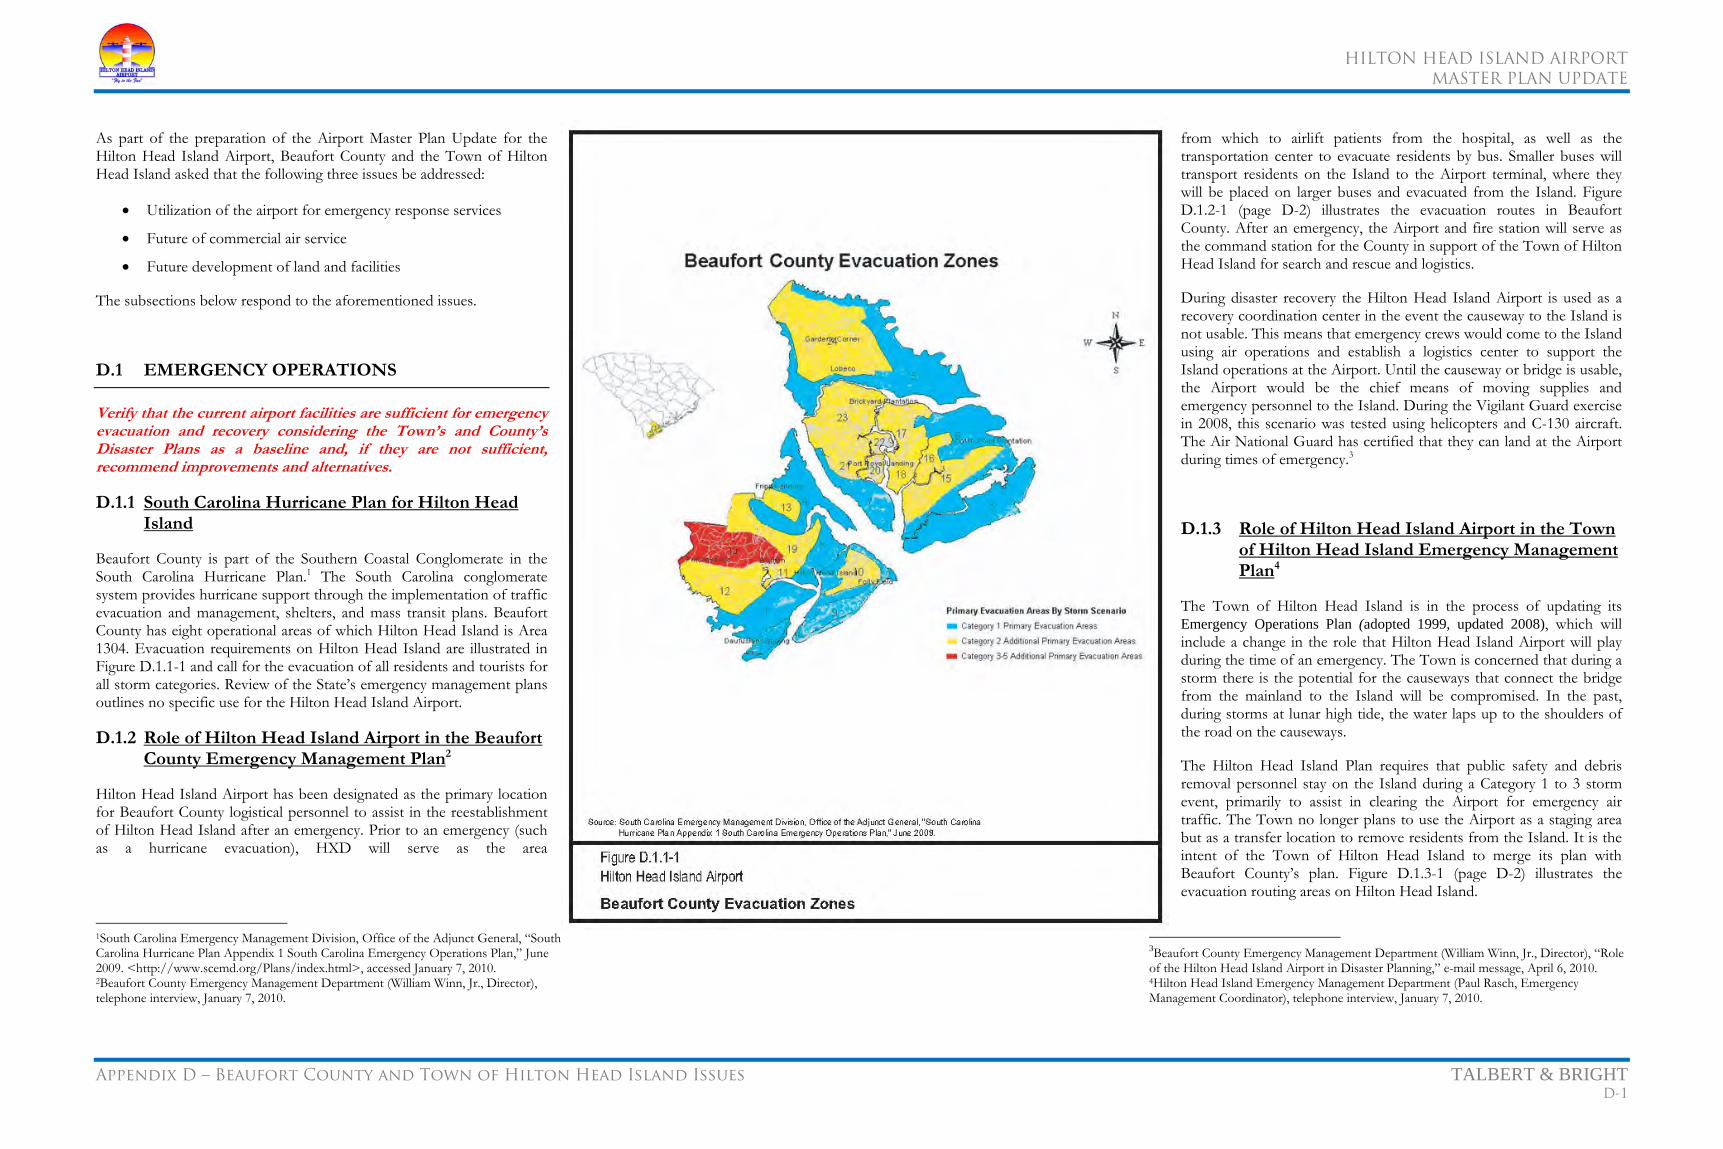
HILTON HEAD ISLAND AIRPORT
MASTER PLAN UPDATE
Appendix D – Beaufort County and Town of Hilton Head Island Issues TALBERT & BRIGHT D-1
As part of the preparation of the Airport Master Plan Update for the Hilton Head Island Airport, Beaufort County and the Town of Hilton Head Island asked that the following three issues be addressed:
• Utilization of the airport for emergency response services
• Future of commercial air service
• Future development of land and facilities
The subsections below respond to the aforementioned issues.
D.1 EMERGENCY OPERATIONS
Verify that the current airport facilities are sufficient for emergency evacuation and recovery considering the Town’s and County’s Disaster Plans as a baseline and, if they are not sufficient, recommend improvements and alternatives.
D.1.1 South Carolina Hurricane Plan for Hilton Head Island
Beaufort County is part of the Southern Coastal Conglomerate in the South Carolina Hurricane Plan.1 The South Carolina conglomerate system provides hurricane support through the implementation of traffic evacuation and management, shelters, and mass transit plans. Beaufort County has eight operational areas of which Hilton Head Island is Area 1304. Evacuation requirements on Hilton Head Island are illustrated in Figure D.1.1-1 and call for the evacuation of all residents and tourists for all storm categories. Review of the State’s emergency management plans outlines no specific use for the Hilton Head Island Airport.
D.1.2 Role of Hilton Head Island Airport in the Beaufort County Emergency Management Plan2
Hilton Head Island Airport has been designated as the primary location for Beaufort County logistical personnel to assist in the reestablishment of Hilton Head Island after an emergency. Prior to an emergency (such as a hurricane evacuation), HXD will serve as the area
1South Carolina Emergency Management Division, Office of the Adjunct General, “South Carolina Hurricane Plan Appendix 1 South Carolina Emergency Operations Plan,” June 2009. <http://www.scemd.org/Plans/index.html>, accessed January 7, 2010. 2Beaufort County Emergency Management Department (William Winn, Jr., Director), telephone interview, January 7, 2010.
from which to airlift patients from the hospital, as well as the transportation center to evacuate residents by bus. Smaller buses will transport residents on the Island to the Airport terminal, where they will be placed on larger buses and evacuated from the Island. Figure D.1.2-1 (page D-2) illustrates the evacuation routes in Beaufort County. After an emergency, the Airport and fire station will serve as the command station for the County in support of the Town of Hilton Head Island for search and rescue and logistics.
During disaster recovery the Hilton Head Island Airport is used as a recovery coordination center in the event the causeway to the Island is not usable. This means that emergency crews would come to the Island using air operations and establish a logistics center to support the Island operations at the Airport. Until the causeway or bridge is usable, the Airport would be the chief means of moving supplies and emergency personnel to the Island. During the Vigilant Guard exercise in 2008, this scenario was tested using helicopters and C-130 aircraft. The Air National Guard has certified that they can land at the Airport during times of emergency.3
D.1.3 Role of Hilton Head Island Airport in the Town of Hilton Head Island Emergency Management Plan4
The Town of Hilton Head Island is in the process of updating its Emergency Operations Plan (adopted 1999, updated 2008), which will include a change in the role that Hilton Head Island Airport will play during the time of an emergency. The Town is concerned that during a storm there is the potential for the causeways that connect the bridge from the mainland to the Island will be compromised. In the past, during storms at lunar high tide, the water laps up to the shoulders of the road on the causeways.
The Hilton Head Island Plan requires that public safety and debris removal personnel stay on the Island during a Category 1 to 3 storm event, primarily to assist in clearing the Airport for emergency air traffic. The Town no longer plans to use the Airport as a staging area but as a transfer location to remove residents from the Island. It is the intent of the Town of Hilton Head Island to merge its plan with Beaufort County’s plan. Figure D.1.3-1 (page D-2) illustrates the evacuation routing areas on Hilton Head Island.
3Beaufort County Emergency Management Department (William Winn, Jr., Director), “Role of the Hilton Head Island Airport in Disaster Planning,” e-mail message, April 6, 2010. 4Hilton Head Island Emergency Management Department (Paul Rasch, Emergency Management Coordinator), telephone interview, January 7, 2010.

HILTON HEAD ISLAND AIRPORT
MASTER PLAN UPDATE
Appendix D – Beaufort County and Town of Hilton Head Island Issues TALBERT & BRIGHT D-2
D.1.4 Conclusion
With the Hilton Head Island Airport identified as the logistics center and a transfer location during an emergency, it is imperative that the commercial terminal building, air traffic control tower, airfield lighting power supply, and fire station remain operational during an emergency. In order to do this, emergency backup generators are required to maintain power for these facilities. Currently, all of the above facilities have emergency backup generator power except the commercial terminal building.
Space will be required during an emergency response to accommodate helicopter traffic. It is anticipated that commercial fixed-wing aircraft would depart the Airport prior to an emergency, which would free up space on the commercial aircraft parking apron for emergency helicopter operations.
D.1.5 Recommendation for the Role of Hilton Head Island Airport
Critical facilities at the Hilton Head Island Airport that are listed above will need to remain operational throughout an emergency response, and portions of the Airport need to be reserved for specific uses during the response. Specific recommendations for the commercial terminal building and commercial aircraft parking apron are provided below.
A new emergency backup generator is required to supply power for the entire commercial terminal building during an emergency. It is recommended that the renovation project for the commercial terminal scheduled in the near future include an emergency backup generator.

HILTON HEAD ISLAND AIRPORT
MASTER PLAN UPDATE
Appendix D – Beaufort County and Town of Hilton Head Island Issues TALBERT & BRIGHT D-3
Space needs to be reserved and designated on the commercial aircraft parking apron for helicopter operations during an emergency response.
After the proposed merger of the Town and County Emergency Operations Plan is complete, a review is recommended to determine if additional improvements are needed to address the facility use identified in the Plan.
D.2 COMMERCIAL SERVICE
Verify that existing airport facilities are adequate for viable commercial service to the Atlanta and Charlotte hubs and
(A) identify any possible risks to viability; along with the earliest time the risk to service might occur; and
(B) recommend improvements and alternatives.
D.2.1 Air Service Analysis Introduction5
As part of the Master Plan Update, certain questions regarding the operational characteristics at the Hilton Head Island Airport were analyzed. Specifically, the questions consisted of the following:
1. What controls the number of flights to HXD?
2. What percentage of passengers are origin or destination ticket buyers?
3. How many passengers start at HXD?
4. What is the market – are the airlines filling the aircraft or is the demand more than the aircraft being used?
5. What length runway would the airlines want if things were unconstrained at HXD?
6. What are the future aircraft that might service HXD?
7. If the runway were longer, would the number of flights to HXD increase?
8. If the runway length at HXD is adequate, what are the reasons the airlines do not fly fully loaded?
In order to respond to these questions several sources were researched. These sources were the air service demand at HXD, certain industry data to determine the number of origin and destination passengers at HXD, and the airline load factors over the last five calendar years serving HXD were analyzed. In addition, interviews were conducted with individuals from US 5Newton & Associates, Inc., “Hilton Head Island Airport Air Service Analysis,” January 19, 2010, prepared for Talbert & Bright, Inc.
Airways and Delta Airlines. Representatives from US Airways and its affiliate Piedmont Airlines included the following:
• US Airways’ Property Representative
• HXD Station Manager, US Airways Express, Piedmont Airlines
• Piedmont Airlines Manager of Dispatch Operations
• US Airways Manager of Express Planning and Fleet Coordination
In addition, interviews were conducted with individuals from Delta Airlines and Mesaba Airlines. Representatives from Delta Airlines and Mesaba Airlines included the following:
• Delta Air Lines Property Representative
• Delta Air Lines Director of Fleet Planning
• Mesaba Airlines Director of Flight Operations
The following sections will respond to the questions above and summarize the results in the summary section.
D.2.2 Air Service Demand and the Air Service Area
The availability and frequency of scheduled commercial air transportation at an airport are largely dependent on the demand for air service to and from the geographic area served by the airport. The geographical area served by an airport is often referred to as the airport service area (ASA). For the purpose of this analysis, Beaufort County, South Carolina, is assumed to represent the vast majority of air service demand at HXD. Although some of HXD’s air service demand may be generated from areas located outside the ASA, the primary demand for air service at HXD is generated by persons who work, reside, or visit within Beaufort County.
The demand for air service at an airport is based on a number of factors including the cost of air travel (air fares), state of the local and national economy, alternative or competing airports, level of non-stop service, and type of equipment (aircraft). However, the supply of aircraft and seat capacity in the national passenger air transportation system is both a finite and scarce commodity. Airlines place aircraft assets in particular markets with the objective to maximize profitability. Therefore, demand for air service does not necessarily result in the decision of the airlines to serve a given market at a guaranteed level.
D.2.3 Airline Service Patterns
Since the airline industry was deregulated in 1978, airlines have developed a hub-and-spoke system to maximize aircraft loads with revenue passengers. In a hub-and-spoke system, passengers from numerous cities throughout an
airline’s network are directed each day into a small number of hub airports, where they connect on flights to spoke airports in other cities, thereby creating economies of scale and allowing airlines to increase frequency and profitability and serve cities that would otherwise not receive airline service in a point-to-point system. Within this system of hub-and-spoke airports, the Hilton Head Island Airport is considered a spoke or O&D airport, where it is expected that 100 percent of passengers either begin or end their trips at the airport.
Piedmont Airlines (doing business as US Airways Express) provides a minimum of five daily non-stop departures to US Airways primary hub in Charlotte, North Carolina, with turboprop Bombardier Dash 8 aircraft. It should be noted that during the busy season, US Airways Express supplies approximately 11 daily departures on the same equipment that it currently provides at HXD. Mesaba Airlines (doing business as Delta Connection) provides from March through October seasonal service to HXD, with four daily departures to Delta’s primary hub in Atlanta, Georgia, with Saab 340 turboprop aircraft.
D.2.4 Historical Airline Activity
An analysis of HXD’s historical passenger activity is a useful guide in estimating historical demand for commercial passenger air transportation and in projecting future levels of passenger activity. Table D.2.4-1 (page D-4) depicts enplanement activity at HXD from calendar year 2004 through 2008. As shown on Table D.2.4-1, total passenger enplanements have grown at an average annual rate of 6.0 percent from 2004 through 2008.
Table D.2.4-1 Historical Load Factor
Hilton Head Island Airport
Calendar Year
HXD Enplanements1
HXD Seats1
HXDLoad
Factor
IndustryLoad
Factor2
2004 63,167 95,431 66.2% 74.0% 2005 67,135 102,783 65.3% 75.9% 2006 62,022 103,075 60.2% 78.7% 2007 84,604 159,733 53.0% 79.8% 2008 79,624 145,231 54.8% 79.3%
Average Annual Growth Rate 6.0% 11.1% 1Department of Transportation, T-100 database provided by Database Products, Inc. 2Federal Aviation Administration, Aerospace Forecast, FY 2009-2025, March 15, 2009. Source: Database Products, Inc., “Airport data DOT T-100 database.” FAA Aerospace Forecast, “Industry Data FY 2009-2025,” March 15, 2009. Newton & Associates, Inc., January 2010.
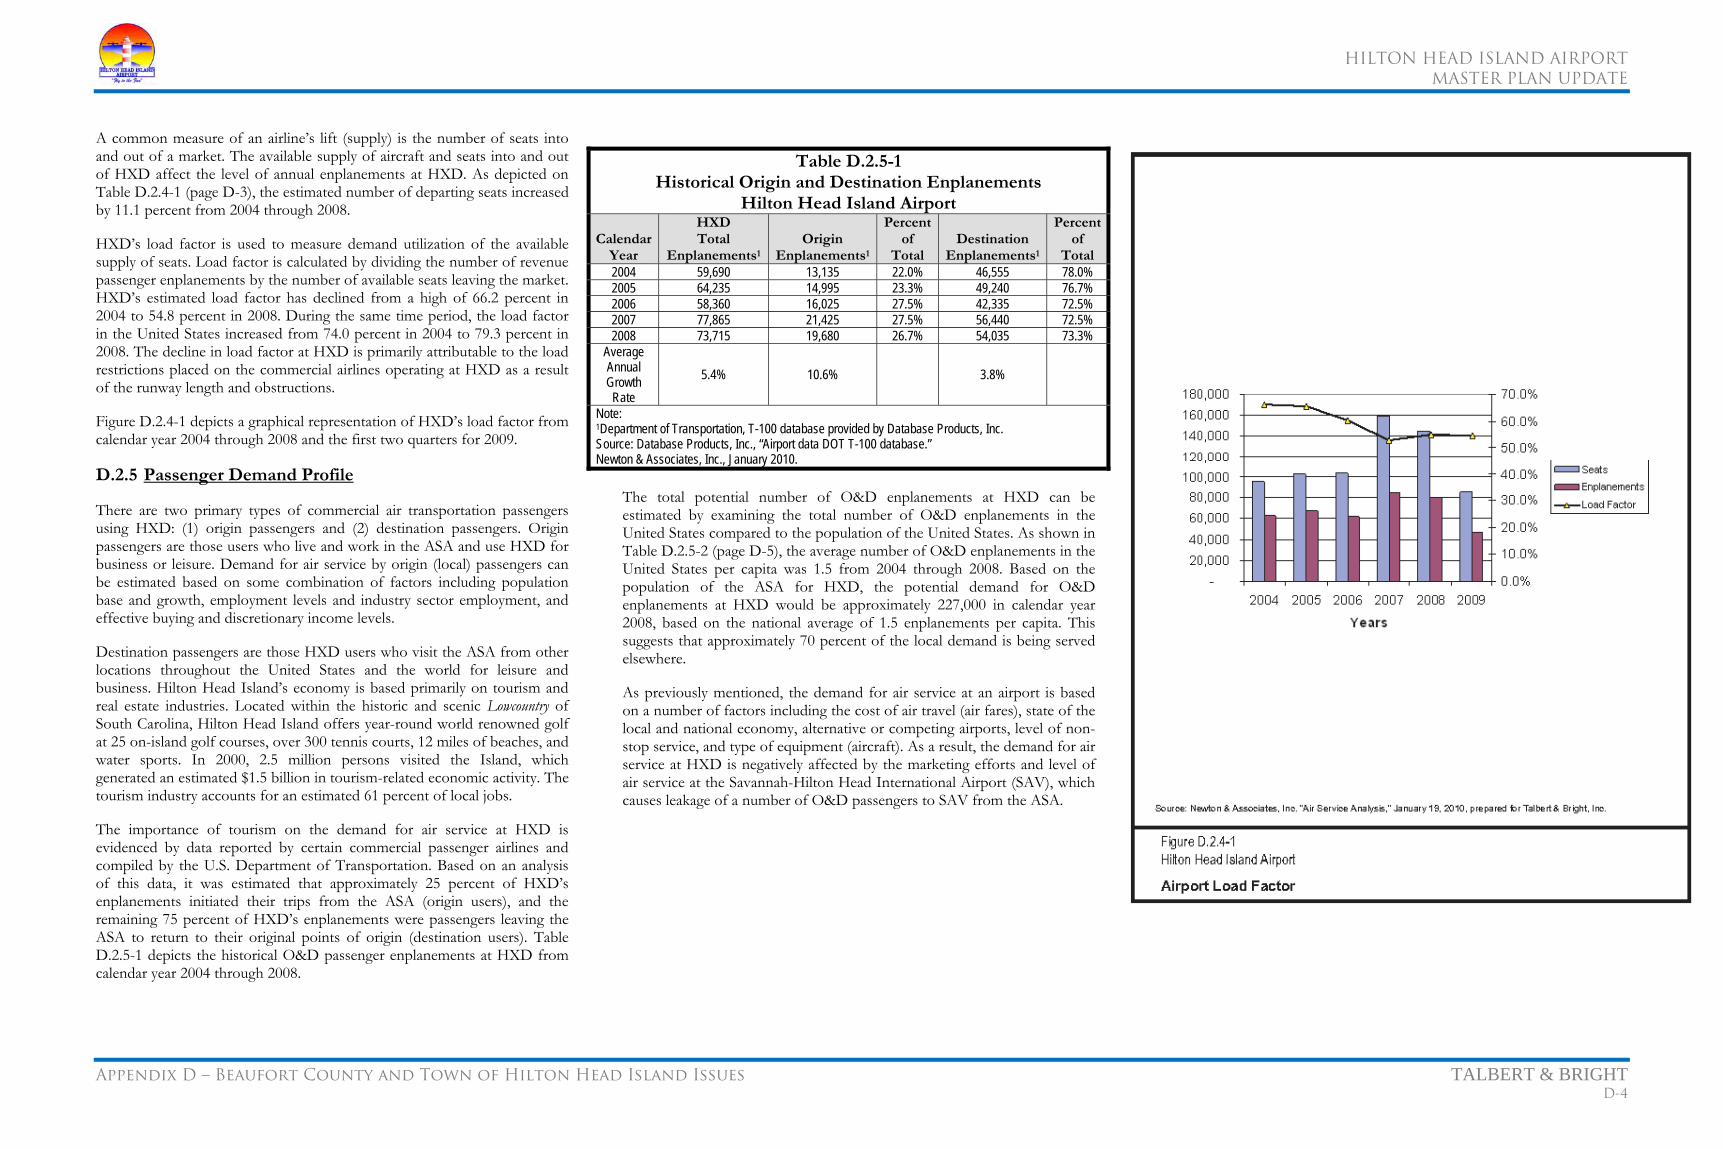
HILTON HEAD ISLAND AIRPORT
MASTER PLAN UPDATE
Appendix D – Beaufort County and Town of Hilton Head Island Issues TALBERT & BRIGHT D-4
A common measure of an airline’s lift (supply) is the number of seats into and out of a market. The available supply of aircraft and seats into and out of HXD affect the level of annual enplanements at HXD. As depicted on Table D.2.4-1 (page D-3), the estimated number of departing seats increased by 11.1 percent from 2004 through 2008.
HXD’s load factor is used to measure demand utilization of the available supply of seats. Load factor is calculated by dividing the number of revenue passenger enplanements by the number of available seats leaving the market. HXD’s estimated load factor has declined from a high of 66.2 percent in 2004 to 54.8 percent in 2008. During the same time period, the load factor in the United States increased from 74.0 percent in 2004 to 79.3 percent in 2008. The decline in load factor at HXD is primarily attributable to the load restrictions placed on the commercial airlines operating at HXD as a result of the runway length and obstructions.
Figure D.2.4-1 depicts a graphical representation of HXD’s load factor from calendar year 2004 through 2008 and the first two quarters for 2009.
D.2.5 Passenger Demand Profile
There are two primary types of commercial air transportation passengers using HXD: (1) origin passengers and (2) destination passengers. Origin passengers are those users who live and work in the ASA and use HXD for business or leisure. Demand for air service by origin (local) passengers can be estimated based on some combination of factors including population base and growth, employment levels and industry sector employment, and effective buying and discretionary income levels.
Destination passengers are those HXD users who visit the ASA from other locations throughout the United States and the world for leisure and business. Hilton Head Island’s economy is based primarily on tourism and real estate industries. Located within the historic and scenic Lowcountry of South Carolina, Hilton Head Island offers year-round world renowned golf at 25 on-island golf courses, over 300 tennis courts, 12 miles of beaches, and water sports. In 2000, 2.5 million persons visited the Island, which generated an estimated $1.5 billion in tourism-related economic activity. The tourism industry accounts for an estimated 61 percent of local jobs.
The importance of tourism on the demand for air service at HXD is evidenced by data reported by certain commercial passenger airlines and compiled by the U.S. Department of Transportation. Based on an analysis of this data, it was estimated that approximately 25 percent of HXD’s enplanements initiated their trips from the ASA (origin users), and the remaining 75 percent of HXD’s enplanements were passengers leaving the ASA to return to their original points of origin (destination users). Table D.2.5-1 depicts the historical O&D passenger enplanements at HXD from calendar year 2004 through 2008.
The total potential number of O&D enplanements at HXD can be estimated by examining the total number of O&D enplanements in the United States compared to the population of the United States. As shown in Table D.2.5-2 (page D-5), the average number of O&D enplanements in the United States per capita was 1.5 from 2004 through 2008. Based on the population of the ASA for HXD, the potential demand for O&D enplanements at HXD would be approximately 227,000 in calendar year 2008, based on the national average of 1.5 enplanements per capita. This suggests that approximately 70 percent of the local demand is being served elsewhere.
As previously mentioned, the demand for air service at an airport is based on a number of factors including the cost of air travel (air fares), state of the local and national economy, alternative or competing airports, level of non-stop service, and type of equipment (aircraft). As a result, the demand for air service at HXD is negatively affected by the marketing efforts and level of air service at the Savannah-Hilton Head International Airport (SAV), which causes leakage of a number of O&D passengers to SAV from the ASA.
Table D.2.5-1 Historical Origin and Destination Enplanements
Hilton Head Island Airport
Calendar Year
HXDTotal
Enplanements1
Origin Enplanements1
Percentof
TotalDestination
Enplanements1
Percentof
Total2004 59,690 13,135 22.0% 46,555 78.0% 2005 64,235 14,995 23.3% 49,240 76.7% 2006 58,360 16,025 27.5% 42,335 72.5% 2007 77,865 21,425 27.5% 56,440 72.5% 2008 73,715 19,680 26.7% 54,035 73.3%
Average Annual Growth Rate
5.4% 10.6% 3.8%
Note: 1Department of Transportation, T-100 database provided by Database Products, Inc. Source: Database Products, Inc., “Airport data DOT T-100 database.” Newton & Associates, Inc., January 2010.

HILTON HEAD ISLAND AIRPORT
MASTER PLAN UPDATE
Appendix D – Beaufort County and Town of Hilton Head Island Issues TALBERT & BRIGHT D-5
D.2.6 Airport Constraints
The airline load factors are restricted by the runway length and obstructions caused by trees, which penetrate Part 77 surfaces at HXD. These restrictions inhibit the airlines’ ability to serve the market in an efficient manner.
Representatives from US Airways and Delta Airlines were contacted in order to determined the effect that these existing restrictions have on their airlines. The following representatives were contacted:
• James Seadler – US Airways Property Representative
• Teresa Harrison – Piedmont Airlines Station Manager
• Gary Blevins – Piedmont Airlines Manager of Dispatch Operations
• Dan Sauter – Mesaba Airlines Fleet Manager
The following summarizes information received from telephone calls and emails from airline representatives:
• During peak season, when US Airways Express operates 11 flights per day, the capacity constraints cause airline customers to wait for a later flight.6
• If the capacity constraint issue were resolved, the airlines would initially increase the load factors on their existing aircraft and then increase the gauge (size) of the aircraft prior to adding additional flights. The next generation of Bombardier Dash 8 (Q400) would be a great fit for future operations at HXD.7
• Mesaba Airlines indicated that the Saab 340 would likely continue to operate on a seasonal basis between March and October. In the future, it anticipates that the Canadair Regional Jet (CRJ) 200 would replace the Saab 340 in this market.8
• The airlines indicated a runway length of 5,000 feet to 5,500 feet would be preferred, provided the obstruction issue is resolved.9,10
6Piedmont Airlines (Teresa Harrison, Station Manager), personal interview, November 25, 2009. 7US Airways (James Seadler, Property Representative), personal interview, November 20, 2009. 8Mesaba Airlines (Dan Sauter, Fleet Manager), personal interview, January 15, 2010. 9Piedmont Airlines (Gary Blevins, Manager of Dispatch Operations), personal interview, November 30, 2009. 10Mesaba Airlines (Dan Sauter, Fleet Manager), personal interview, January 15, 2010.
• The existing aircraft (some versions of Bombardier) serving the market will eventually be removed from service, which may cause problems in the future if the capacity constraints are not resolved.11
• For planning purposes, the airlines operating at HXD use a load factor of 60 percent for determining aircraft fleet to meet the air service demand at HXD. This is a result of the operational constraints at HXD (obstructions and runway length). In general, the airlines use 75 percent as a load factor to right size the market with the appropriate aircraft specifically when there are no operational constraints.12
• The obstructions caused from the trees are a significant impediment to commercial aircraft operations.13,14
D.2.7. Analysis Summary
Based on the analysis contained herein, the following summary can be made.
1. The number of flights at HXD is controlled by a number of factors including the local and destination demand for air service to the Hilton Head Island area. O&D passengers are affected by the level of air service at competing airports, particularly the Savannah-Hilton Head International Airport located in Savannah, Georgia, which causes a leakage of demand to that airport.
2. The airlines determine the number of flights at HXD based on the fleet requirements and load factor restrictions caused by the length of the runway and the obstructions caused by trees penetrating the Part 77 surfaces at HXD, thereby reducing the number of passengers they are able to place in their aircraft. This reduced load factor causes an increase in the number of flights at HXD to meet the demand for air service at HXD.
3. It is assumed that the passengers at HXD are O&D passengers. The number of passengers who begin their trip from HXD (origin passengers) was determined to be approximately 25 percent of the total enplanements at HXD between 2004 and 2008, ranging from a low of 13,135 enplanements in 2004 to a high of 21,425 in 2007. The remaining 75 percent of the enplanements are destination passengers who used HXD to visit the ASA during the same time period.
11Piedmont Airlines (Gary Blevins, Manager of Dispatch Operations), personal interview, November 30, 2009. 12US Airways (James Seadler, Property Representative), personal interview, November 25, 2009. 13Piedmont Airlines (Gary Blevins, Manager of Dispatch Operations), personal interview, November 30, 2009. 14Mesaba Airlines (Dan Sauter, Fleet Manager), personal interview, January 15, 2010.
Table D.2.5-2 Potential Origin and Destination Enplanements
Hilton Head Island Airport
Calendar Year
U.S. Total O&D
Enplanements1 US
Population2
U.S. O&D Enplanements
per Population
ASA Total Population2
[A] Potential
HXD O&D Enplanements
[B]Actual
HXD O&D Enplanements
[B]/[A]"Captured"
Percent of Total
2004 426,150,430 293,191,500 1.45 134,910 202,516 59,690 29.5% 2005 450,952,890 295,895,900 1.52 139,333 209,155 64,235 30.7% 2006 459,132,640 298,754,800 1.54 143,614 215,582 58,360 27.1% 2007 464,085,160 301,621,200 1.54 147,316 221,139 77,865 35.2% 2008 442,437,870 304,579,200 1.45 151,331 227,166 73,715 32.4%
Average Annual Growth Rate
0.9% 1.0% 2.9% 5.4%
Average 1.50 Notes: 1Bureau of Transportation Statistics, OD1B Database, <www.transstats.bts.gov>. 2Woods and Poole Economics, “Complete Economic and Demographic Data Source.” Source: Bureau of Transportation Statistics, “D1B Database,” <www.transstats.bts.gov>. Woods and Poole Economics, “Complete Economic and Demographic Data Source.” Newton & Associates, Inc., January 2010.

HILTON HEAD ISLAND AIRPORT
MASTER PLAN UPDATE
Appendix D – Beaufort County and Town of Hilton Head Island Issues TALBERT & BRIGHT D-6
4. The airlines contend that the runway length and obstructions at HXD require the airlines to artificially reduce the number of passengers who can be accommodated on their aircraft and thereby reduce their load factor. The load factor at HXD averaged 60 percent from 2004 through 2008, which is considerably lower than the industry load factor of 78 percent over the same time period.
5. The potential air service demand for the ASA was estimated based on an analysis of the total O&D enplanements per capita for the United States compared to the population of the ASA. The per capita O&D enplanements in the United States were determined to be 1.5 between 2004 and 2008. Based on this relationship, the number of enplanements at HXD in 2008 would surpass 225,000, which indicates that HXD only captured approximately 32 percent of the potential enplanements. It should be noted that this capture percentage is affected by the primary competing airport (SAV) in addition to the operational constraints at HXD.
6. The airlines indicated that a runway length of 5,000 feet to 5,500 feet would be preferred, provided the obstructions are removed.
7. If the obstruction constraints were removed at HXD, the airlines would first increase the load factors of the existing aircraft operating at HXD. The airlines indicated that the Bombardier Dash 8 Q400 or a CRJ 200 would be a perfect fit for HXD. However, Piedmont Airlines does not currently have any of the Bombardier Dash 8 Q400 aircraft in its fleet, but Mesaba has CRJ aircraft available that could be used in the Hilton Head Island market in the future.
D.2.8 Conclusion
Due to the constraints of runway length and obstructions at HXD, the existing airport facilities are marginally adequate for viable service to the Charlotte and Atlanta hubs at this time. US Airways (Piedmont Airlines) and Delta Airlines (Mesaba Airlines) currently operate aircraft from their Charlotte and Atlanta hubs that require significant operational restrictions on their load factors. It has been discussed that Delta Airlines will cease turboprop service to HXD, which could occur as early as 2012. If this occurs, the only aircraft identified in Delta’s current fleet to resume service is the CRJ 200. The CRJ 200 is more demanding on runway length for takeoff and landing and cannot operate at the current runway length. Additionally, it is uncertain about what type of aircraft US Airways will continue to operate because some versions of the Dash 8 are scheduled to be removed from service. Failure to make airfield improvements, as outlined in the Master Plan Update, could result in the loss of service from Delta Airlines and direct flights to its Atlanta hub and reduction of service by US Airways from its Charlotte hub as early as 2012.
D.2.9 Recommendation
In order to maintain viable service to the Atlanta and Charlotte hubs, as well as other airlines that may desire to serve the Hilton Head Island market, it is recommended that the runway be extended to 5,400 feet, an EMAS be installed on each runway end, and obstructions to the runway approaches be removed as mandated by the FAA to achieve a clear 34:1 approach surface. Also recommended is the relocation of the parallel taxiway serving the general aviation side of the Airport to a separation of 300 feet from the runway centerline. Acquisition of property and relocation of Beach City Road are also recommended to achieve the required runway and taxiway safety/obstacle free areas for the 5,400-foot runway and relocated taxiway.
D.3 LAND AND FACILITY REQUIREMENTS
(A) Determine what limitations current airport property size and configuration place on airport operations and safety.
(B) Determine the impacts of those limitations on people and surrounding property, if the current airport property is to be used to its full potential.
D.3.1 Airport Property Limitations
Current limitations at HXD, based on FAA design requirements include (as shown on the Airport Layout Plan on page 79 of the Master Plan Update Report):
• Runway 03 RSA is 897 feet in length; design requirements are 1,000 feet
• Displaced thresholds on both ends of the runway
• Taxiway ‘A’ runway/taxiway separation is 200 feet; design requirements are 300 feet
• Taxiway ‘F’ at the Runway 03 end should not be angled
• Airport should own the obstacle free area (OFA) in fee simple, and there should be no development in this area
• Limited airport property available for additional hangars, apron, parking, airfield development, safety areas, and buffer zones
D.3.2 Impact of Airport Property Limitations
For the purposes of this question, the “current Airport property” is deemed to consist of the existing airport property and any additional property acquisition required to bring the Airport into compliance with FAA design standards.
• Restricted airline load factors will continue to require less than full flights with the current runway length and obstructions, resulting in the continued potential for passenger “bumping” to later flights.
• More flights per day will likely be required due to load restrictions with the current runway length and obstructions in order to meet the passenger demand.
• As shown on the Airport Layout Plan on page 79 of the Master Plan Update Report, the “current Airport property” limits the proposed runway extension to 5,000 feet.
• The integrated noise contours would change on the north and south ends of the Airport when the proposed runway extension to 5,000 feet is complete as shown in the Master Plan Report.
• With a runway extension to a length of 5,000 feet, the future of Delta Airlines service to its Atlanta hub remains in question, resulting in potentially longer travel times for passengers using Delta Airlines.
• Potential for increased vehicular traffic on U.S. Highway 278 for airline passenger traffic leakage to Savannah-Hilton Head Island Airport.
• Less potential for increased property tax revenue due to lack of available area for additional T-hangar and conventional hangar development.
• Minimal buffer areas available around perimeter of airport property.
• Storm drainage
• Tree removal
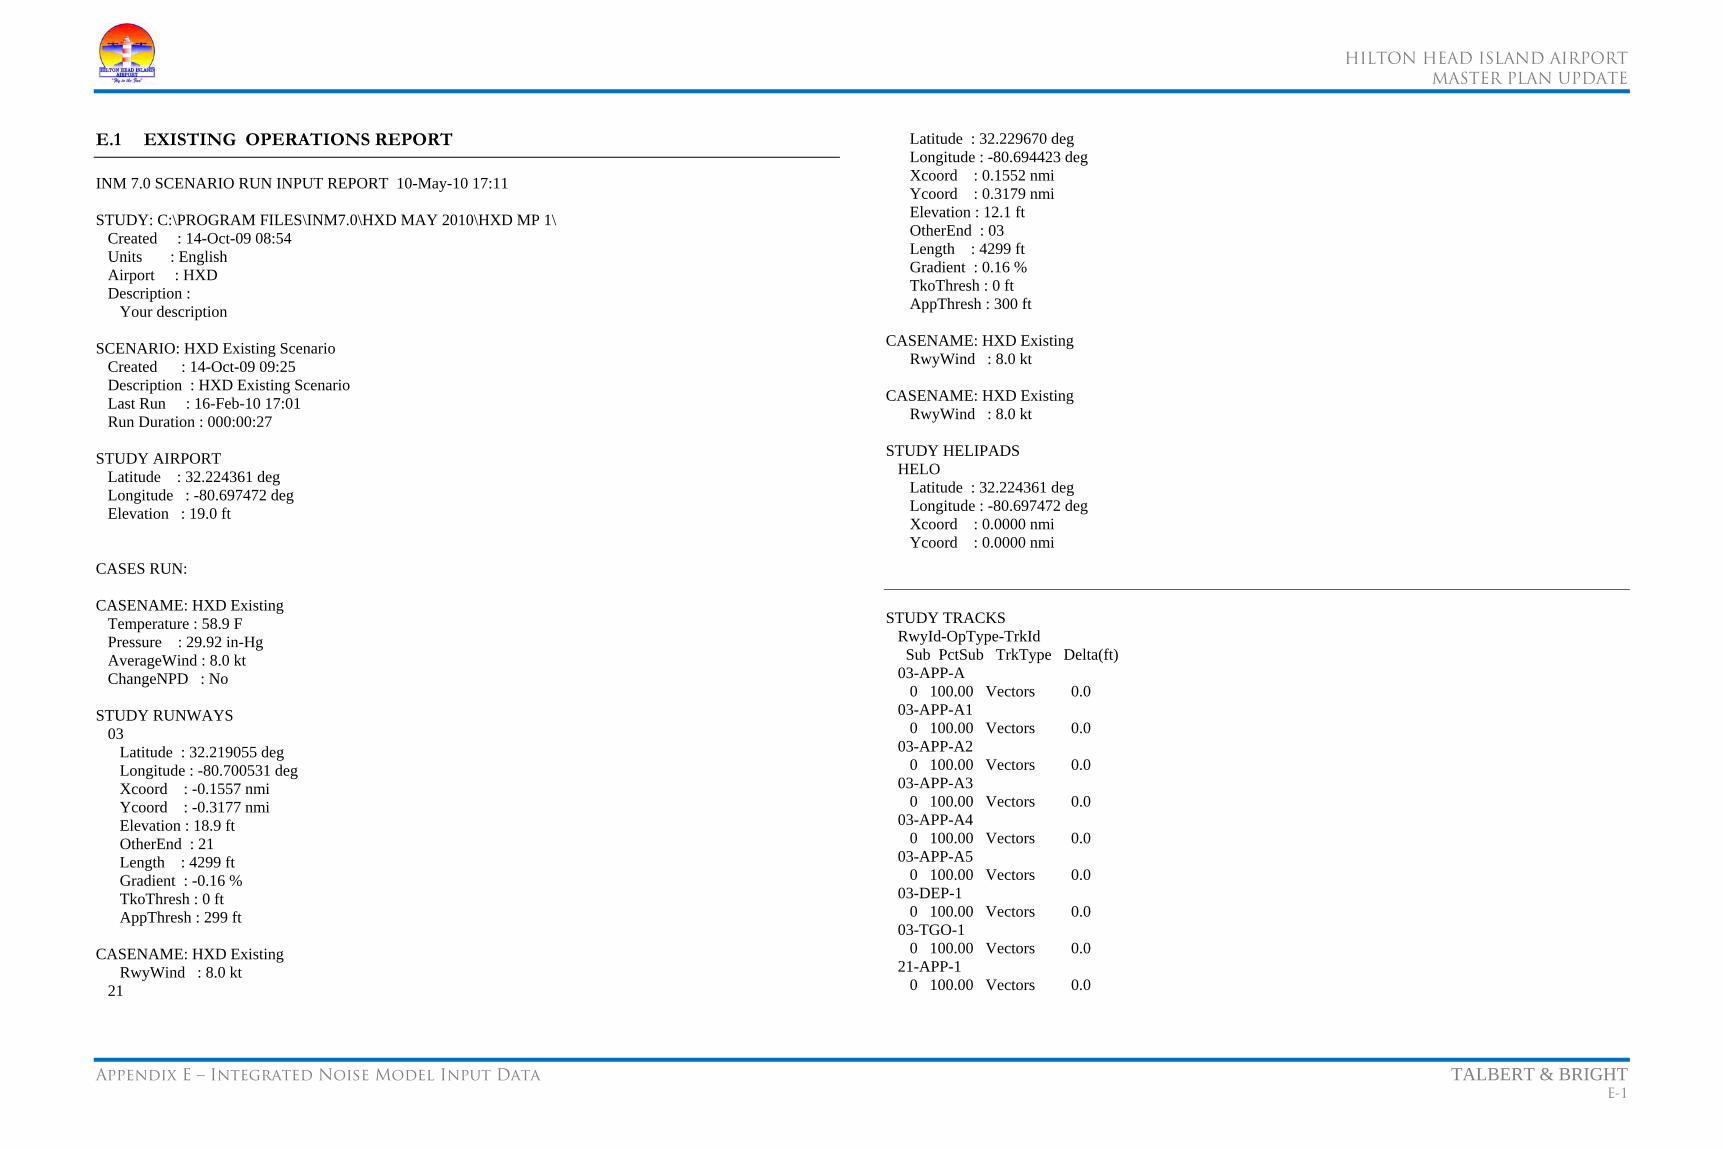
HILTON HEAD ISLAND AIRPORT
MASTER PLAN UPDATE
Appendix E – Integrated Noise Model Input Data TALBERT & BRIGHT E-1
E.1 EXISTING OPERATIONS REPORT
INM 7.0 SCENARIO RUN INPUT REPORT 10-May-10 17:11 STUDY: C:\PROGRAM FILES\INM7.0\HXD MAY 2010\HXD MP 1\ Created : 14-Oct-09 08:54 Units : English Airport : HXD Description : Your description SCENARIO: HXD Existing Scenario Created : 14-Oct-09 09:25 Description : HXD Existing Scenario Last Run : 16-Feb-10 17:01 Run Duration : 000:00:27 STUDY AIRPORT Latitude : 32.224361 deg Longitude : -80.697472 deg Elevation : 19.0 ft CASES RUN: CASENAME: HXD Existing Temperature : 58.9 F Pressure : 29.92 in-Hg AverageWind : 8.0 kt ChangeNPD : No STUDY RUNWAYS 03 Latitude : 32.219055 deg Longitude : -80.700531 deg Xcoord : -0.1557 nmi Ycoord : -0.3177 nmi Elevation : 18.9 ft OtherEnd : 21 Length : 4299 ft Gradient : -0.16 % TkoThresh : 0 ft AppThresh : 299 ft CASENAME: HXD Existing RwyWind : 8.0 kt 21
Latitude : 32.229670 deg Longitude : -80.694423 deg Xcoord : 0.1552 nmi Ycoord : 0.3179 nmi Elevation : 12.1 ft OtherEnd : 03 Length : 4299 ft Gradient : 0.16 % TkoThresh : 0 ft AppThresh : 300 ft CASENAME: HXD Existing RwyWind : 8.0 kt CASENAME: HXD Existing RwyWind : 8.0 kt STUDY HELIPADS HELO Latitude : 32.224361 deg Longitude : -80.697472 deg Xcoord : 0.0000 nmi Ycoord : 0.0000 nmi STUDY TRACKS RwyId-OpType-TrkId Sub PctSub TrkType Delta(ft) 03-APP-A 0 100.00 Vectors 0.0 03-APP-A1 0 100.00 Vectors 0.0 03-APP-A2 0 100.00 Vectors 0.0 03-APP-A3 0 100.00 Vectors 0.0 03-APP-A4 0 100.00 Vectors 0.0 03-APP-A5 0 100.00 Vectors 0.0 03-DEP-1 0 100.00 Vectors 0.0 03-TGO-1 0 100.00 Vectors 0.0 21-APP-1 0 100.00 Vectors 0.0

HILTON HEAD ISLAND AIRPORT
MASTER PLAN UPDATE
Appendix E – Integrated Noise Model Input Data TALBERT & BRIGHT E-2
21-DEP-D 0 100.00 Vectors 0.0 21-DEP-D1 0 100.00 Vectors 0.0 21-DEP-D2 0 100.00 Vectors 0.0 21-DEP-D3 0 100.00 Vectors 0.0 21-DEP-D4 0 100.00 Vectors 0.0 21-DEP-D5 0 100.00 Vectors 0.0 21-TGO-1 0 100.00 Vectors 0.0 21-TGO-2 0 100.00 Vectors 0.0 HELO-APP-1 0 100.00 Vectors 27.0 HELO-DEP-1 0 100.00 Vectors 207.0 STUDY TRACK DETAIL RwyId-OpType-TrkId-SubTrk # SegType Dist/Angle Radius(nmi) 03-APP-A-0 1 Straight 50.0000 nmi 03-APP-A1-0 1 Straight 50.0000 nmi 2 Left-Turn 136.0000 deg 0.5000 3 Straight 1.0000 nmi 4 Left-Turn 44.0000 deg 0.5000 5 Straight 1.8100 nmi 03-APP-A2-0 1 Straight 50.0000 nmi 2 Right-Turn 136.0000 deg 0.5000 3 Straight 1.0000 nmi 4 Right-Turn 44.0000 deg 0.5000 5 Straight 1.2300 nmi 03-APP-A3-0 1 Straight 50.0000 nmi 2 Right-Turn 180.0000 deg 1.0000 3 Straight 1.0000 nmi 4 Right-Turn 117.0000 deg 0.2000 5 Straight 1.2300 nmi 03-APP-A4-0 1 Straight 50.0000 nmi 2 Left-Turn 10.0000 deg 1.0000
3 Straight 2.0000 nmi 4 Left-Turn 44.0000 deg 0.5000 5 Straight 2.0000 nmi 03-APP-A5-0 1 Straight 50.0000 nmi 2 Right-Turn 10.0000 deg 1.0000 3 Straight 2.5000 nmi 4 Right-Turn 20.0000 deg 1.0000 5 Straight 1.5000 nmi 6 Left-Turn 93.0000 deg 0.2000 7 Straight 1.2300 nmi 03-DEP-1-0 1 Straight 50.0000 nmi 03-TGO-1-0 1 Straight 0.9000 nmi 2 Left-Turn 90.0000 deg 0.2500 3 Straight 0.5000 nmi 4 Left-Turn 90.0000 deg 0.2500 5 Straight 1.7000 nmi 6 Left-Turn 90.0000 deg 0.2500 7 Straight 0.5000 nmi 8 Left-Turn 90.0000 deg 0.2500 9 Straight 0.8000 nmi 21-APP-1-0 1 Straight 50.0000 nmi 21-DEP-D-0 1 Straight 50.0000 nmi 21-DEP-D1-0 1 Straight 2.7000 nmi 2 Right-Turn 44.0000 deg 0.5000 3 Straight 1.5000 nmi 4 Right-Turn 10.0000 deg 1.0000 5 Straight 50.0000 nmi 21-DEP-D2-0 1 Straight 2.6000 nmi 2 Right-Turn 44.0000 deg 0.5000 3 Straight 1.0000 nmi 4 Right-Turn 136.0000 deg 0.5000 5 Straight 50.0000 nmi 21-DEP-D3-0 1 Straight 2.0000 nmi 2 Left-Turn 44.0000 deg 0.5000 3 Straight 1.0000 nmi 4 Left-Turn 136.0000 deg 0.5000 5 Straight 50.0000 nmi 21-DEP-D4-0 1 Straight 1.3000 nmi
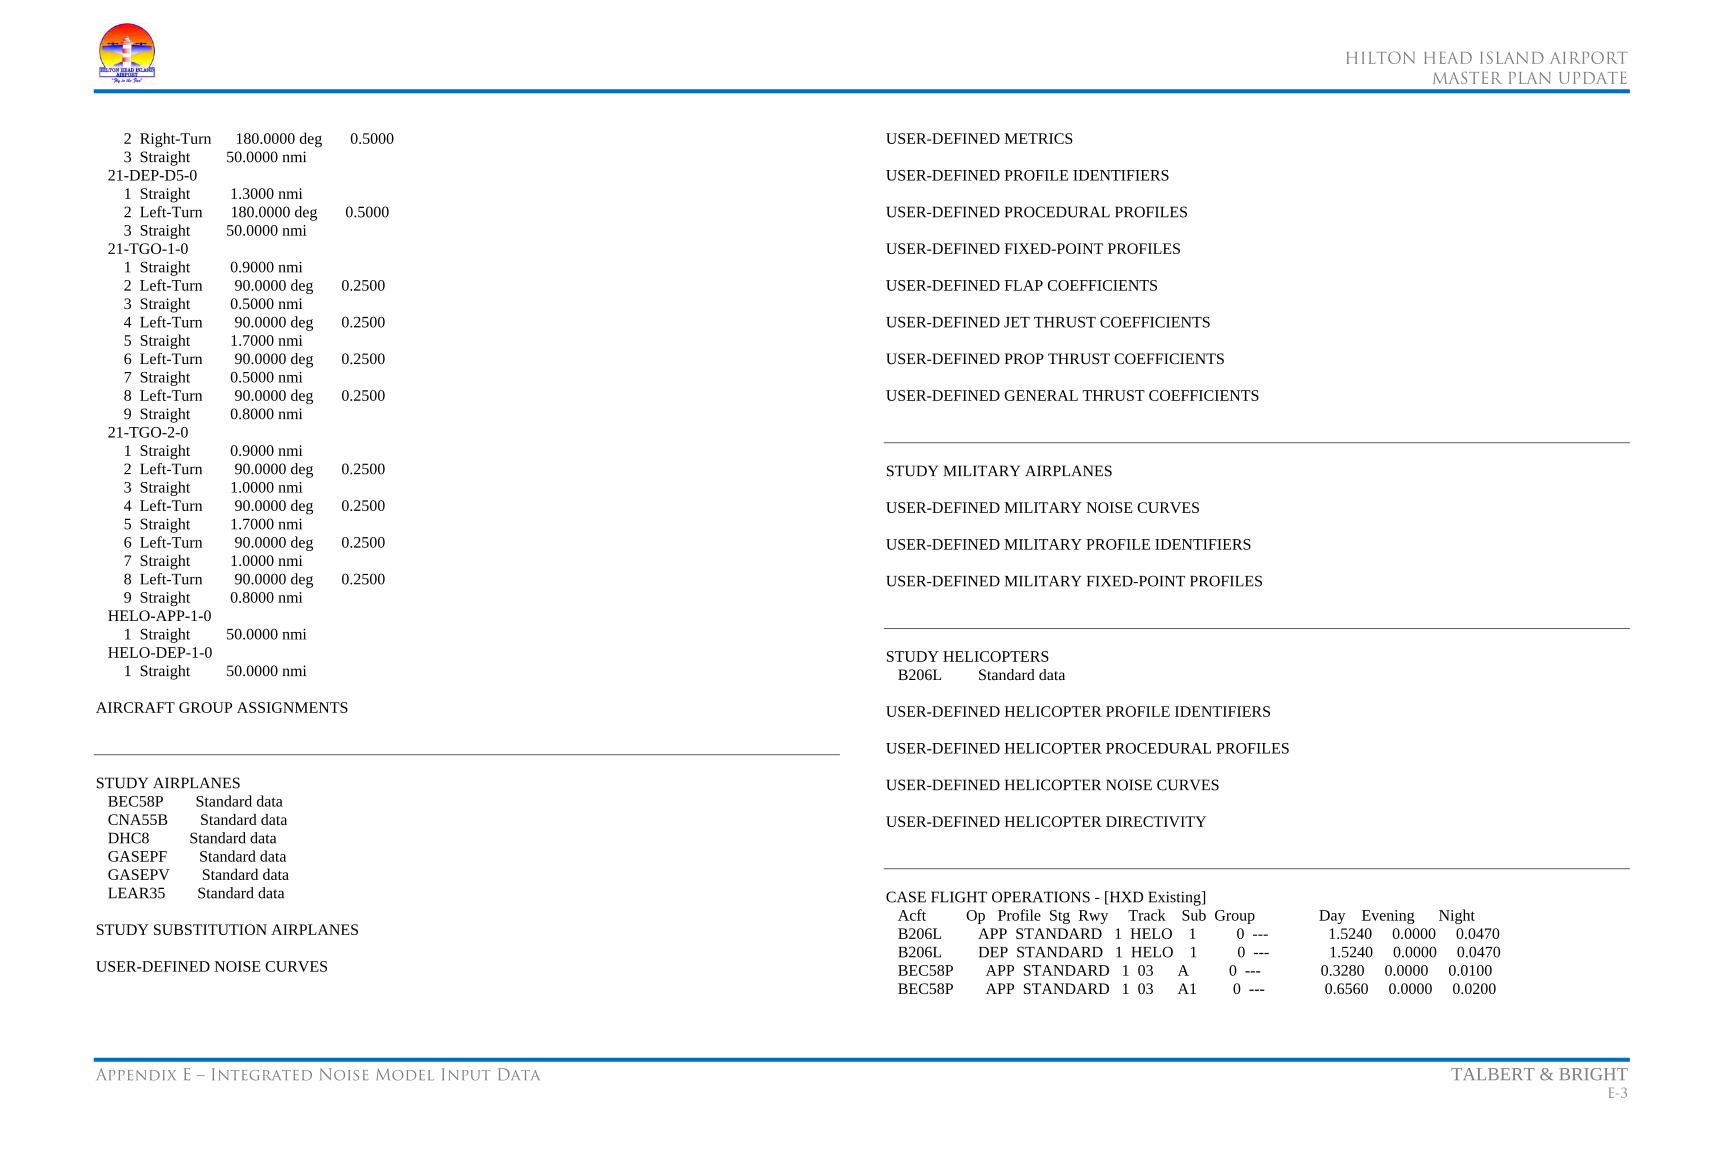
HILTON HEAD ISLAND AIRPORT
MASTER PLAN UPDATE
Appendix E – Integrated Noise Model Input Data TALBERT & BRIGHT E-3
2 Right-Turn 180.0000 deg 0.5000 3 Straight 50.0000 nmi 21-DEP-D5-0 1 Straight 1.3000 nmi 2 Left-Turn 180.0000 deg 0.5000 3 Straight 50.0000 nmi 21-TGO-1-0 1 Straight 0.9000 nmi 2 Left-Turn 90.0000 deg 0.2500 3 Straight 0.5000 nmi 4 Left-Turn 90.0000 deg 0.2500 5 Straight 1.7000 nmi 6 Left-Turn 90.0000 deg 0.2500 7 Straight 0.5000 nmi 8 Left-Turn 90.0000 deg 0.2500 9 Straight 0.8000 nmi 21-TGO-2-0 1 Straight 0.9000 nmi 2 Left-Turn 90.0000 deg 0.2500 3 Straight 1.0000 nmi 4 Left-Turn 90.0000 deg 0.2500 5 Straight 1.7000 nmi 6 Left-Turn 90.0000 deg 0.2500 7 Straight 1.0000 nmi 8 Left-Turn 90.0000 deg 0.2500 9 Straight 0.8000 nmi HELO-APP-1-0 1 Straight 50.0000 nmi HELO-DEP-1-0 1 Straight 50.0000 nmi AIRCRAFT GROUP ASSIGNMENTS STUDY AIRPLANES BEC58P Standard data CNA55B Standard data DHC8 Standard data GASEPF Standard data GASEPV Standard data LEAR35 Standard data STUDY SUBSTITUTION AIRPLANES USER-DEFINED NOISE CURVES
USER-DEFINED METRICS USER-DEFINED PROFILE IDENTIFIERS USER-DEFINED PROCEDURAL PROFILES USER-DEFINED FIXED-POINT PROFILES USER-DEFINED FLAP COEFFICIENTS USER-DEFINED JET THRUST COEFFICIENTS USER-DEFINED PROP THRUST COEFFICIENTS USER-DEFINED GENERAL THRUST COEFFICIENTS STUDY MILITARY AIRPLANES USER-DEFINED MILITARY NOISE CURVES USER-DEFINED MILITARY PROFILE IDENTIFIERS USER-DEFINED MILITARY FIXED-POINT PROFILES STUDY HELICOPTERS B206L Standard data USER-DEFINED HELICOPTER PROFILE IDENTIFIERS USER-DEFINED HELICOPTER PROCEDURAL PROFILES USER-DEFINED HELICOPTER NOISE CURVES USER-DEFINED HELICOPTER DIRECTIVITY CASE FLIGHT OPERATIONS - [HXD Existing] Acft Op Profile Stg Rwy Track Sub Group Day Evening Night B206L APP STANDARD 1 HELO 1 0 --- 1.5240 0.0000 0.0470 B206L DEP STANDARD 1 HELO 1 0 --- 1.5240 0.0000 0.0470 BEC58P APP STANDARD 1 03 A 0 --- 0.3280 0.0000 0.0100 BEC58P APP STANDARD 1 03 A1 0 --- 0.6560 0.0000 0.0200
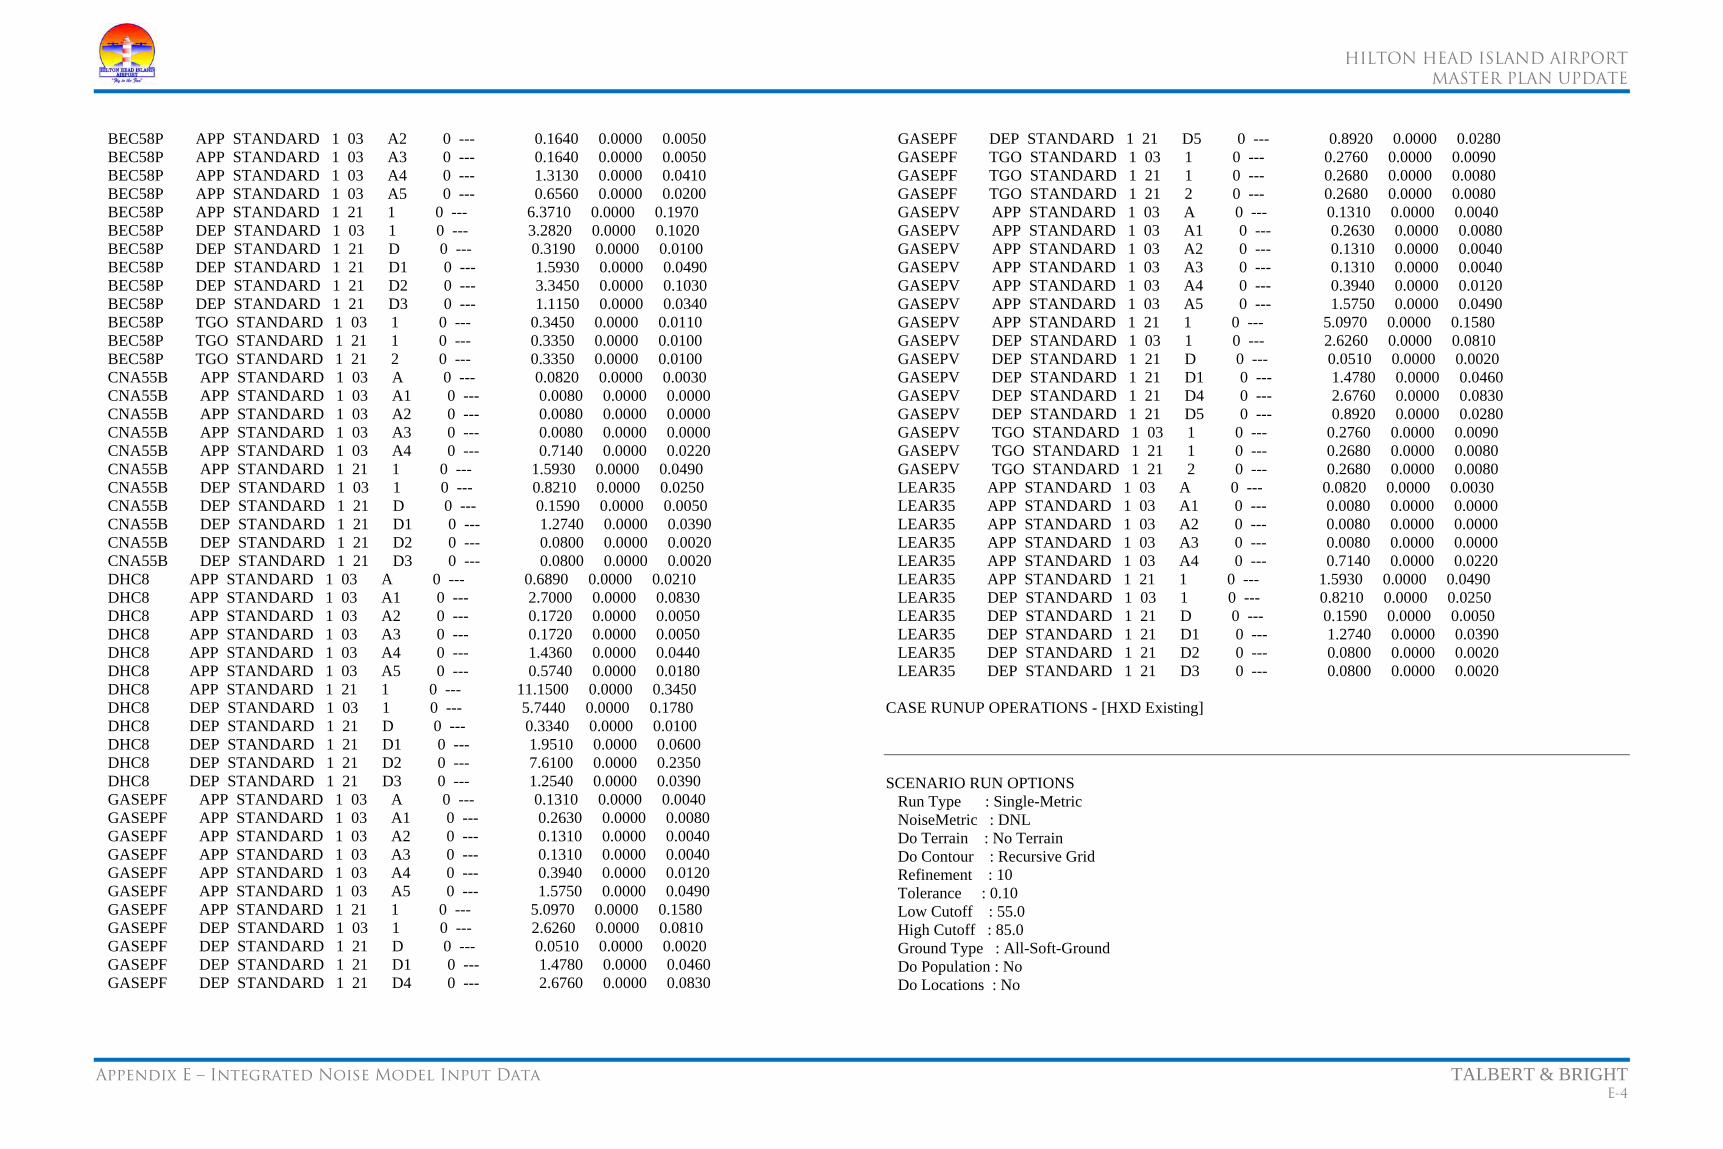
HILTON HEAD ISLAND AIRPORT
MASTER PLAN UPDATE
Appendix E – Integrated Noise Model Input Data TALBERT & BRIGHT E-4
BEC58P APP STANDARD 1 03 A2 0 --- 0.1640 0.0000 0.0050 BEC58P APP STANDARD 1 03 A3 0 --- 0.1640 0.0000 0.0050 BEC58P APP STANDARD 1 03 A4 0 --- 1.3130 0.0000 0.0410 BEC58P APP STANDARD 1 03 A5 0 --- 0.6560 0.0000 0.0200 BEC58P APP STANDARD 1 21 1 0 --- 6.3710 0.0000 0.1970 BEC58P DEP STANDARD 1 03 1 0 --- 3.2820 0.0000 0.1020 BEC58P DEP STANDARD 1 21 D 0 --- 0.3190 0.0000 0.0100 BEC58P DEP STANDARD 1 21 D1 0 --- 1.5930 0.0000 0.0490 BEC58P DEP STANDARD 1 21 D2 0 --- 3.3450 0.0000 0.1030 BEC58P DEP STANDARD 1 21 D3 0 --- 1.1150 0.0000 0.0340 BEC58P TGO STANDARD 1 03 1 0 --- 0.3450 0.0000 0.0110 BEC58P TGO STANDARD 1 21 1 0 --- 0.3350 0.0000 0.0100 BEC58P TGO STANDARD 1 21 2 0 --- 0.3350 0.0000 0.0100 CNA55B APP STANDARD 1 03 A 0 --- 0.0820 0.0000 0.0030 CNA55B APP STANDARD 1 03 A1 0 --- 0.0080 0.0000 0.0000 CNA55B APP STANDARD 1 03 A2 0 --- 0.0080 0.0000 0.0000 CNA55B APP STANDARD 1 03 A3 0 --- 0.0080 0.0000 0.0000 CNA55B APP STANDARD 1 03 A4 0 --- 0.7140 0.0000 0.0220 CNA55B APP STANDARD 1 21 1 0 --- 1.5930 0.0000 0.0490 CNA55B DEP STANDARD 1 03 1 0 --- 0.8210 0.0000 0.0250 CNA55B DEP STANDARD 1 21 D 0 --- 0.1590 0.0000 0.0050 CNA55B DEP STANDARD 1 21 D1 0 --- 1.2740 0.0000 0.0390 CNA55B DEP STANDARD 1 21 D2 0 --- 0.0800 0.0000 0.0020 CNA55B DEP STANDARD 1 21 D3 0 --- 0.0800 0.0000 0.0020 DHC8 APP STANDARD 1 03 A 0 --- 0.6890 0.0000 0.0210 DHC8 APP STANDARD 1 03 A1 0 --- 2.7000 0.0000 0.0830 DHC8 APP STANDARD 1 03 A2 0 --- 0.1720 0.0000 0.0050 DHC8 APP STANDARD 1 03 A3 0 --- 0.1720 0.0000 0.0050 DHC8 APP STANDARD 1 03 A4 0 --- 1.4360 0.0000 0.0440 DHC8 APP STANDARD 1 03 A5 0 --- 0.5740 0.0000 0.0180 DHC8 APP STANDARD 1 21 1 0 --- 11.1500 0.0000 0.3450 DHC8 DEP STANDARD 1 03 1 0 --- 5.7440 0.0000 0.1780 DHC8 DEP STANDARD 1 21 D 0 --- 0.3340 0.0000 0.0100 DHC8 DEP STANDARD 1 21 D1 0 --- 1.9510 0.0000 0.0600 DHC8 DEP STANDARD 1 21 D2 0 --- 7.6100 0.0000 0.2350 DHC8 DEP STANDARD 1 21 D3 0 --- 1.2540 0.0000 0.0390 GASEPF APP STANDARD 1 03 A 0 --- 0.1310 0.0000 0.0040 GASEPF APP STANDARD 1 03 A1 0 --- 0.2630 0.0000 0.0080 GASEPF APP STANDARD 1 03 A2 0 --- 0.1310 0.0000 0.0040 GASEPF APP STANDARD 1 03 A3 0 --- 0.1310 0.0000 0.0040 GASEPF APP STANDARD 1 03 A4 0 --- 0.3940 0.0000 0.0120 GASEPF APP STANDARD 1 03 A5 0 --- 1.5750 0.0000 0.0490 GASEPF APP STANDARD 1 21 1 0 --- 5.0970 0.0000 0.1580 GASEPF DEP STANDARD 1 03 1 0 --- 2.6260 0.0000 0.0810 GASEPF DEP STANDARD 1 21 D 0 --- 0.0510 0.0000 0.0020 GASEPF DEP STANDARD 1 21 D1 0 --- 1.4780 0.0000 0.0460 GASEPF DEP STANDARD 1 21 D4 0 --- 2.6760 0.0000 0.0830
GASEPF DEP STANDARD 1 21 D5 0 --- 0.8920 0.0000 0.0280 GASEPF TGO STANDARD 1 03 1 0 --- 0.2760 0.0000 0.0090 GASEPF TGO STANDARD 1 21 1 0 --- 0.2680 0.0000 0.0080 GASEPF TGO STANDARD 1 21 2 0 --- 0.2680 0.0000 0.0080 GASEPV APP STANDARD 1 03 A 0 --- 0.1310 0.0000 0.0040 GASEPV APP STANDARD 1 03 A1 0 --- 0.2630 0.0000 0.0080 GASEPV APP STANDARD 1 03 A2 0 --- 0.1310 0.0000 0.0040 GASEPV APP STANDARD 1 03 A3 0 --- 0.1310 0.0000 0.0040 GASEPV APP STANDARD 1 03 A4 0 --- 0.3940 0.0000 0.0120 GASEPV APP STANDARD 1 03 A5 0 --- 1.5750 0.0000 0.0490 GASEPV APP STANDARD 1 21 1 0 --- 5.0970 0.0000 0.1580 GASEPV DEP STANDARD 1 03 1 0 --- 2.6260 0.0000 0.0810 GASEPV DEP STANDARD 1 21 D 0 --- 0.0510 0.0000 0.0020 GASEPV DEP STANDARD 1 21 D1 0 --- 1.4780 0.0000 0.0460 GASEPV DEP STANDARD 1 21 D4 0 --- 2.6760 0.0000 0.0830 GASEPV DEP STANDARD 1 21 D5 0 --- 0.8920 0.0000 0.0280 GASEPV TGO STANDARD 1 03 1 0 --- 0.2760 0.0000 0.0090 GASEPV TGO STANDARD 1 21 1 0 --- 0.2680 0.0000 0.0080 GASEPV TGO STANDARD 1 21 2 0 --- 0.2680 0.0000 0.0080 LEAR35 APP STANDARD 1 03 A 0 --- 0.0820 0.0000 0.0030 LEAR35 APP STANDARD 1 03 A1 0 --- 0.0080 0.0000 0.0000 LEAR35 APP STANDARD 1 03 A2 0 --- 0.0080 0.0000 0.0000 LEAR35 APP STANDARD 1 03 A3 0 --- 0.0080 0.0000 0.0000 LEAR35 APP STANDARD 1 03 A4 0 --- 0.7140 0.0000 0.0220 LEAR35 APP STANDARD 1 21 1 0 --- 1.5930 0.0000 0.0490 LEAR35 DEP STANDARD 1 03 1 0 --- 0.8210 0.0000 0.0250 LEAR35 DEP STANDARD 1 21 D 0 --- 0.1590 0.0000 0.0050 LEAR35 DEP STANDARD 1 21 D1 0 --- 1.2740 0.0000 0.0390 LEAR35 DEP STANDARD 1 21 D2 0 --- 0.0800 0.0000 0.0020 LEAR35 DEP STANDARD 1 21 D3 0 --- 0.0800 0.0000 0.0020 CASE RUNUP OPERATIONS - [HXD Existing] SCENARIO RUN OPTIONS Run Type : Single-Metric NoiseMetric : DNL Do Terrain : No Terrain Do Contour : Recursive Grid Refinement : 10 Tolerance : 0.10 Low Cutoff : 55.0 High Cutoff : 85.0 Ground Type : All-Soft-Ground Do Population : No Do Locations : No

HILTON HEAD ISLAND AIRPORT
MASTER PLAN UPDATE
Appendix E – Integrated Noise Model Input Data TALBERT & BRIGHT E-5
Do Standard : No Do Detailed : No Compute System Metrics: DNL : No CNEL : No LAEQ : No LAEQD : No LAEQN : No SEL : No LAMAX : No TALA : No NEF : No WECPNL : No EPNL : No PNLTM : No TAPNL : No CEXP : No LCMAX : No TALC : No SCENARIO GRID DEFINITIONS Name Type X(nmi) Y(nmi) Ang(deg) DisI(nmi) DisJ(nmi) NI NJ Thrsh dAmb (hr) CONTOUR Contour -8.0000 -8.0000 0.0 16.0000 16.0000 2 2 85.0 0.0 0.00 E.2 FUTURE OPERATIONS REPORT
INM 7.0 SCENARIO RUN INPUT REPORT 10-May-10 17:11 STUDY: C:\PROGRAM FILES\INM7.0\HXD MAY 2010\HXD MP 5\ Created : 14-Oct-09 08:54 Units : English Airport : HXD Description : Your description SCENARIO: HXD Existing Scenario Created : 14-Oct-09 09:25 Description : HXD Existing Scenario Last Run : 07-May-10 15:22 Run Duration : 000:00:34 STUDY AIRPORT Latitude : 32.224361 deg Longitude : -80.697472 deg Elevation : 19.0 ft
CASES RUN: CASENAME: HXD Existing Temperature : 58.9 F Pressure : 29.92 in-Hg AverageWind : 8.0 kt ChangeNPD : No STUDY RUNWAYS 03 Latitude : 32.218308 deg Longitude : -80.700945 deg Xcoord : -0.1768 nmi Ycoord : -0.3624 nmi Elevation : 18.9 ft OtherEnd : 21 Length : 4999 ft Gradient : -0.14 % TkoThresh : 0 ft AppThresh : 0 ft CASENAME: HXD Existing RwyWind : 8.0 kt 21 Latitude : 32.230659 deg Longitude : -80.693859 deg Xcoord : 0.1839 nmi Ycoord : 0.3771 nmi Elevation : 12.1 ft OtherEnd : 03 Length : 4999 ft Gradient : 0.14 % TkoThresh : 0 ft AppThresh : 0 ft CASENAME: HXD Existing RwyWind : 8.0 kt CASENAME: HXD Existing RwyWind : 8.0 kt STUDY HELIPADS HELO Latitude : 32.224361 deg Longitude : -80.697472 deg Xcoord : 0.0000 nmi

HILTON HEAD ISLAND AIRPORT
MASTER PLAN UPDATE
Appendix E – Integrated Noise Model Input Data TALBERT & BRIGHT E-6
Ycoord : 0.0000 nmi STUDY TRACKS RwyId-OpType-TrkId Sub PctSub TrkType Delta(ft) 03-APP-A 0 100.00 Vectors 0.0 03-APP-A1 0 100.00 Vectors 0.0 03-APP-A2 0 100.00 Vectors 0.0 03-APP-A3 0 100.00 Vectors 0.0 03-APP-A4 0 100.00 Vectors 0.0 03-APP-A5 0 100.00 Vectors 0.0 03-DEP-1 0 100.00 Vectors 0.0 03-TGO-1 0 100.00 Vectors 0.0 21-APP-1 0 100.00 Vectors 0.0 21-DEP-D 0 100.00 Vectors 0.0 21-DEP-D1 0 100.00 Vectors 0.0 21-DEP-D2 0 100.00 Vectors 0.0 21-DEP-D3 0 100.00 Vectors 0.0 21-DEP-D4 0 100.00 Vectors 0.0 21-DEP-D5 0 100.00 Vectors 0.0 21-TGO-1 0 100.00 Vectors 0.0 21-TGO-2 0 100.00 Vectors 0.0 HELO-APP-1 0 100.00 Vectors 27.0 HELO-DEP-1 0 100.00 Vectors 207.0 STUDY TRACK DETAIL
RwyId-OpType-TrkId-SubTrk # SegType Dist/Angle Radius(nmi) 03-APP-A-0 1 Straight 50.0000 nmi 03-APP-A1-0 1 Straight 50.0000 nmi 2 Left-Turn 136.0000 deg 0.5000 3 Straight 1.0000 nmi 4 Left-Turn 44.0000 deg 0.5000 5 Straight 1.8100 nmi 03-APP-A2-0 1 Straight 50.0000 nmi 2 Right-Turn 136.0000 deg 0.5000 3 Straight 1.0000 nmi 4 Right-Turn 44.0000 deg 0.5000 5 Straight 1.2300 nmi 03-APP-A3-0 1 Straight 50.0000 nmi 2 Right-Turn 180.0000 deg 1.0000 3 Straight 1.0000 nmi 4 Right-Turn 117.0000 deg 0.2000 5 Straight 1.2300 nmi 03-APP-A4-0 1 Straight 50.0000 nmi 2 Left-Turn 10.0000 deg 1.0000 3 Straight 2.0000 nmi 4 Left-Turn 44.0000 deg 0.5000 5 Straight 2.0000 nmi 03-APP-A5-0 1 Straight 50.0000 nmi 2 Right-Turn 10.0000 deg 1.0000 3 Straight 2.5000 nmi 4 Right-Turn 20.0000 deg 1.0000 5 Straight 1.5000 nmi 6 Left-Turn 93.0000 deg 0.2000 7 Straight 1.2300 nmi 03-DEP-1-0 1 Straight 50.0000 nmi 03-TGO-1-0 1 Straight 0.9000 nmi 2 Left-Turn 90.0000 deg 0.2500 3 Straight 0.5000 nmi 4 Left-Turn 90.0000 deg 0.2500 5 Straight 1.7000 nmi 6 Left-Turn 90.0000 deg 0.2500 7 Straight 0.5000 nmi 8 Left-Turn 90.0000 deg 0.2500
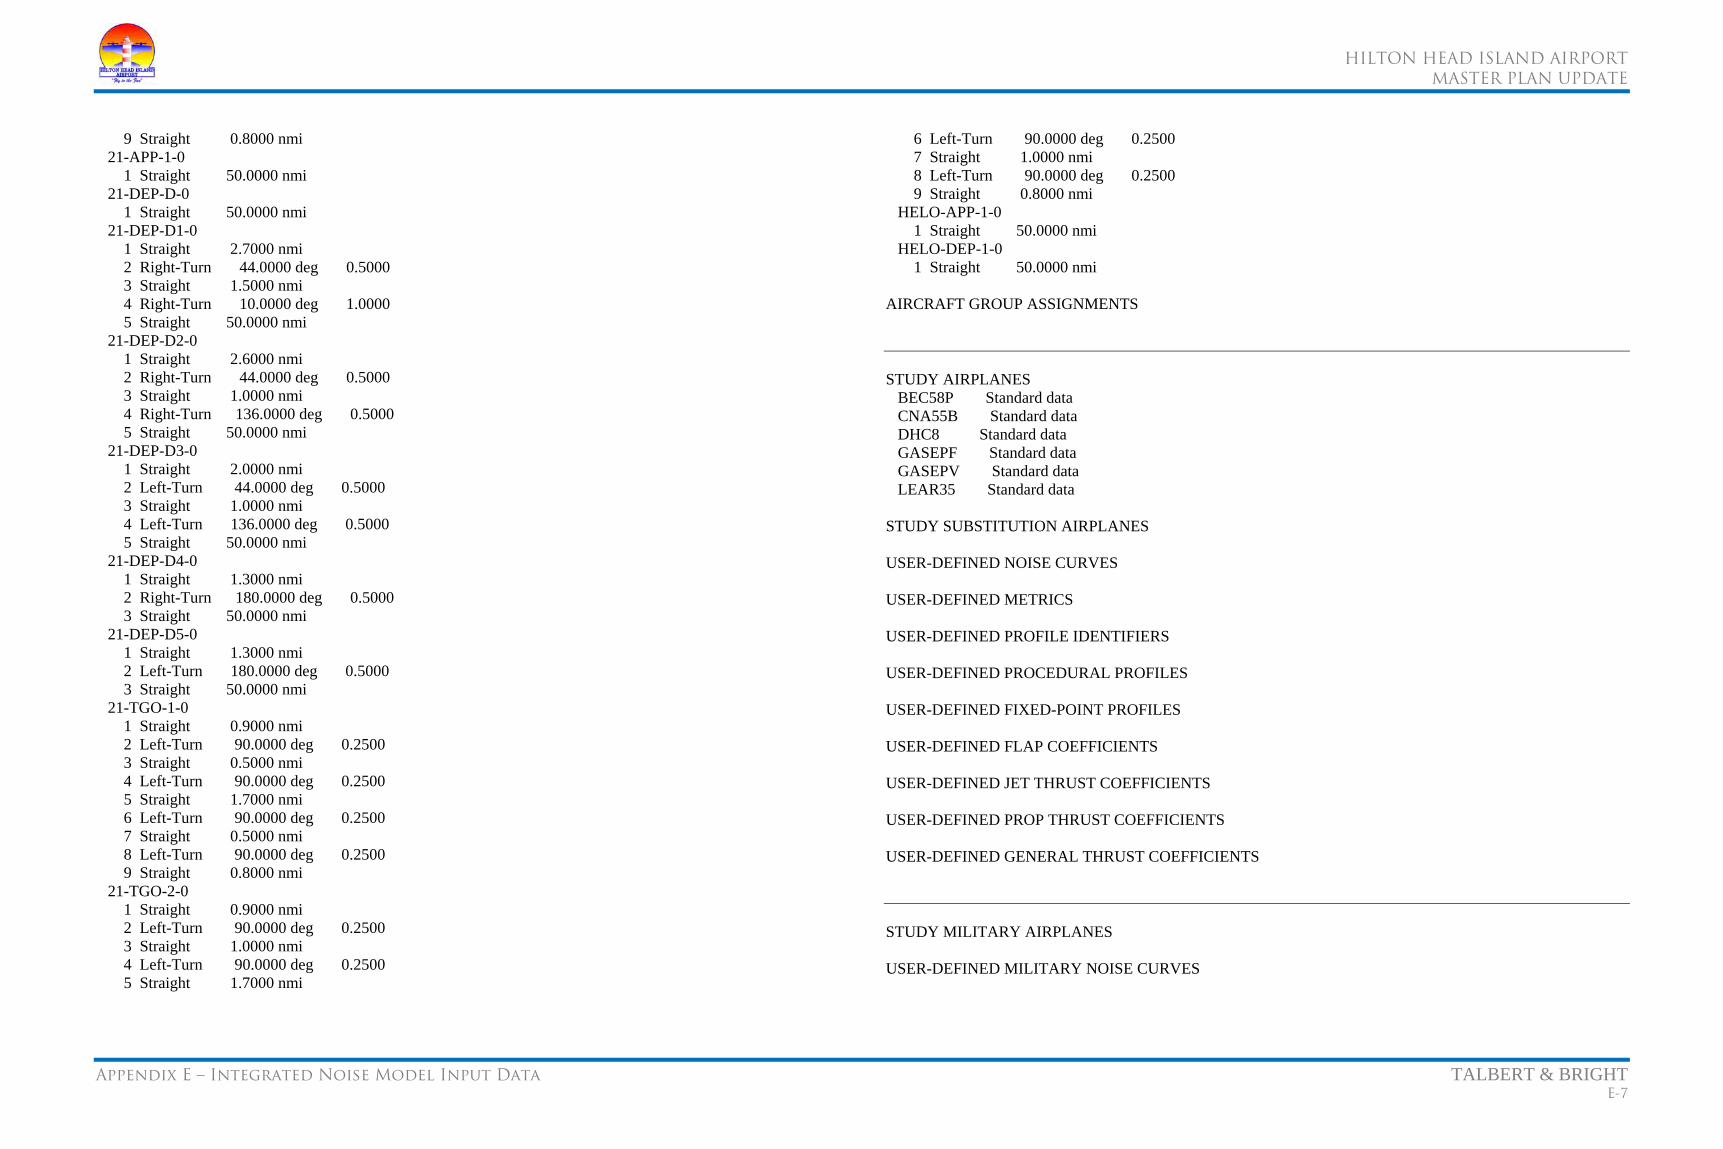
HILTON HEAD ISLAND AIRPORT
MASTER PLAN UPDATE
Appendix E – Integrated Noise Model Input Data TALBERT & BRIGHT E-7
9 Straight 0.8000 nmi 21-APP-1-0 1 Straight 50.0000 nmi 21-DEP-D-0 1 Straight 50.0000 nmi 21-DEP-D1-0 1 Straight 2.7000 nmi 2 Right-Turn 44.0000 deg 0.5000 3 Straight 1.5000 nmi 4 Right-Turn 10.0000 deg 1.0000 5 Straight 50.0000 nmi 21-DEP-D2-0 1 Straight 2.6000 nmi 2 Right-Turn 44.0000 deg 0.5000 3 Straight 1.0000 nmi 4 Right-Turn 136.0000 deg 0.5000 5 Straight 50.0000 nmi 21-DEP-D3-0 1 Straight 2.0000 nmi 2 Left-Turn 44.0000 deg 0.5000 3 Straight 1.0000 nmi 4 Left-Turn 136.0000 deg 0.5000 5 Straight 50.0000 nmi 21-DEP-D4-0 1 Straight 1.3000 nmi 2 Right-Turn 180.0000 deg 0.5000 3 Straight 50.0000 nmi 21-DEP-D5-0 1 Straight 1.3000 nmi 2 Left-Turn 180.0000 deg 0.5000 3 Straight 50.0000 nmi 21-TGO-1-0 1 Straight 0.9000 nmi 2 Left-Turn 90.0000 deg 0.2500 3 Straight 0.5000 nmi 4 Left-Turn 90.0000 deg 0.2500 5 Straight 1.7000 nmi 6 Left-Turn 90.0000 deg 0.2500 7 Straight 0.5000 nmi 8 Left-Turn 90.0000 deg 0.2500 9 Straight 0.8000 nmi 21-TGO-2-0 1 Straight 0.9000 nmi 2 Left-Turn 90.0000 deg 0.2500 3 Straight 1.0000 nmi 4 Left-Turn 90.0000 deg 0.2500 5 Straight 1.7000 nmi
6 Left-Turn 90.0000 deg 0.2500 7 Straight 1.0000 nmi 8 Left-Turn 90.0000 deg 0.2500 9 Straight 0.8000 nmi HELO-APP-1-0 1 Straight 50.0000 nmi HELO-DEP-1-0 1 Straight 50.0000 nmi AIRCRAFT GROUP ASSIGNMENTS STUDY AIRPLANES BEC58P Standard data CNA55B Standard data DHC8 Standard data GASEPF Standard data GASEPV Standard data LEAR35 Standard data STUDY SUBSTITUTION AIRPLANES USER-DEFINED NOISE CURVES USER-DEFINED METRICS USER-DEFINED PROFILE IDENTIFIERS USER-DEFINED PROCEDURAL PROFILES USER-DEFINED FIXED-POINT PROFILES USER-DEFINED FLAP COEFFICIENTS USER-DEFINED JET THRUST COEFFICIENTS USER-DEFINED PROP THRUST COEFFICIENTS USER-DEFINED GENERAL THRUST COEFFICIENTS STUDY MILITARY AIRPLANES USER-DEFINED MILITARY NOISE CURVES
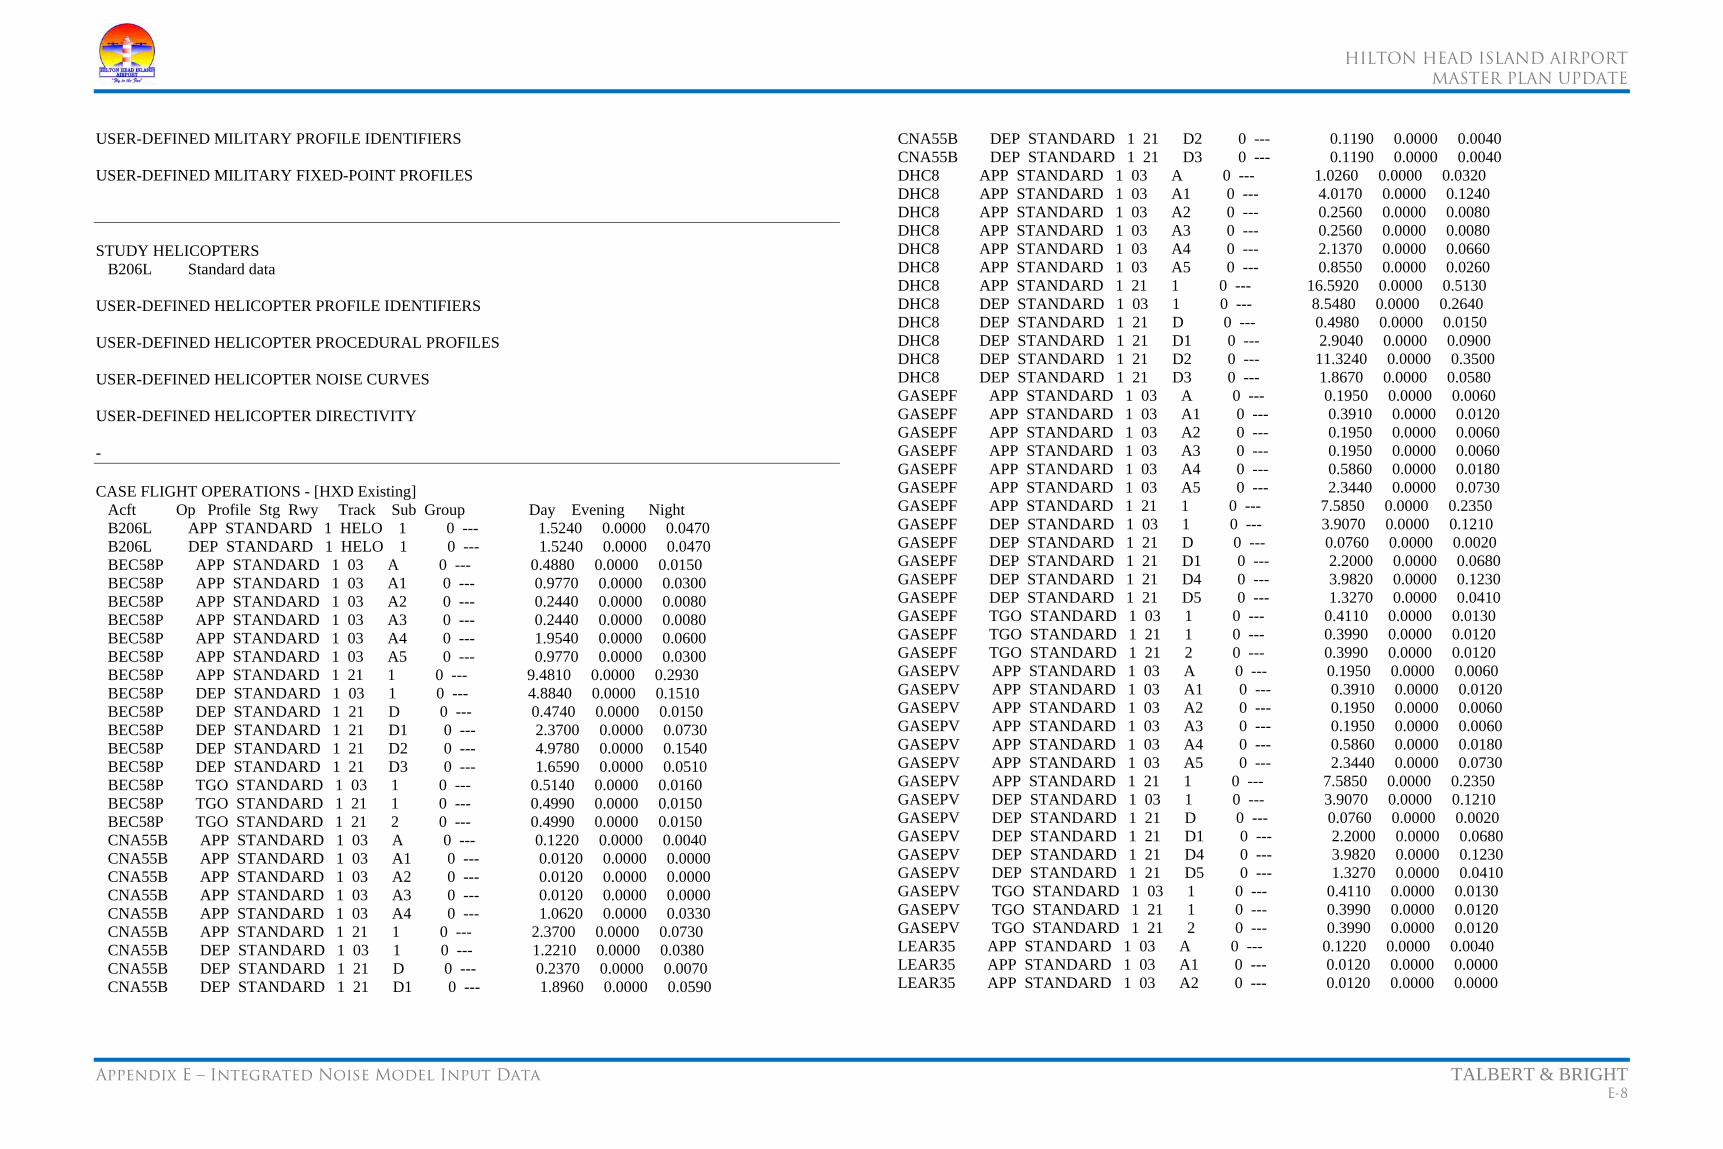
HILTON HEAD ISLAND AIRPORT
MASTER PLAN UPDATE
Appendix E – Integrated Noise Model Input Data TALBERT & BRIGHT E-8
USER-DEFINED MILITARY PROFILE IDENTIFIERS USER-DEFINED MILITARY FIXED-POINT PROFILES STUDY HELICOPTERS B206L Standard data USER-DEFINED HELICOPTER PROFILE IDENTIFIERS USER-DEFINED HELICOPTER PROCEDURAL PROFILES USER-DEFINED HELICOPTER NOISE CURVES USER-DEFINED HELICOPTER DIRECTIVITY - CASE FLIGHT OPERATIONS - [HXD Existing] Acft Op Profile Stg Rwy Track Sub Group Day Evening Night B206L APP STANDARD 1 HELO 1 0 --- 1.5240 0.0000 0.0470 B206L DEP STANDARD 1 HELO 1 0 --- 1.5240 0.0000 0.0470 BEC58P APP STANDARD 1 03 A 0 --- 0.4880 0.0000 0.0150 BEC58P APP STANDARD 1 03 A1 0 --- 0.9770 0.0000 0.0300 BEC58P APP STANDARD 1 03 A2 0 --- 0.2440 0.0000 0.0080 BEC58P APP STANDARD 1 03 A3 0 --- 0.2440 0.0000 0.0080 BEC58P APP STANDARD 1 03 A4 0 --- 1.9540 0.0000 0.0600 BEC58P APP STANDARD 1 03 A5 0 --- 0.9770 0.0000 0.0300 BEC58P APP STANDARD 1 21 1 0 --- 9.4810 0.0000 0.2930 BEC58P DEP STANDARD 1 03 1 0 --- 4.8840 0.0000 0.1510 BEC58P DEP STANDARD 1 21 D 0 --- 0.4740 0.0000 0.0150 BEC58P DEP STANDARD 1 21 D1 0 --- 2.3700 0.0000 0.0730 BEC58P DEP STANDARD 1 21 D2 0 --- 4.9780 0.0000 0.1540 BEC58P DEP STANDARD 1 21 D3 0 --- 1.6590 0.0000 0.0510 BEC58P TGO STANDARD 1 03 1 0 --- 0.5140 0.0000 0.0160 BEC58P TGO STANDARD 1 21 1 0 --- 0.4990 0.0000 0.0150 BEC58P TGO STANDARD 1 21 2 0 --- 0.4990 0.0000 0.0150 CNA55B APP STANDARD 1 03 A 0 --- 0.1220 0.0000 0.0040 CNA55B APP STANDARD 1 03 A1 0 --- 0.0120 0.0000 0.0000 CNA55B APP STANDARD 1 03 A2 0 --- 0.0120 0.0000 0.0000 CNA55B APP STANDARD 1 03 A3 0 --- 0.0120 0.0000 0.0000 CNA55B APP STANDARD 1 03 A4 0 --- 1.0620 0.0000 0.0330 CNA55B APP STANDARD 1 21 1 0 --- 2.3700 0.0000 0.0730 CNA55B DEP STANDARD 1 03 1 0 --- 1.2210 0.0000 0.0380 CNA55B DEP STANDARD 1 21 D 0 --- 0.2370 0.0000 0.0070 CNA55B DEP STANDARD 1 21 D1 0 --- 1.8960 0.0000 0.0590
CNA55B DEP STANDARD 1 21 D2 0 --- 0.1190 0.0000 0.0040 CNA55B DEP STANDARD 1 21 D3 0 --- 0.1190 0.0000 0.0040 DHC8 APP STANDARD 1 03 A 0 --- 1.0260 0.0000 0.0320 DHC8 APP STANDARD 1 03 A1 0 --- 4.0170 0.0000 0.1240 DHC8 APP STANDARD 1 03 A2 0 --- 0.2560 0.0000 0.0080 DHC8 APP STANDARD 1 03 A3 0 --- 0.2560 0.0000 0.0080 DHC8 APP STANDARD 1 03 A4 0 --- 2.1370 0.0000 0.0660 DHC8 APP STANDARD 1 03 A5 0 --- 0.8550 0.0000 0.0260 DHC8 APP STANDARD 1 21 1 0 --- 16.5920 0.0000 0.5130 DHC8 DEP STANDARD 1 03 1 0 --- 8.5480 0.0000 0.2640 DHC8 DEP STANDARD 1 21 D 0 --- 0.4980 0.0000 0.0150 DHC8 DEP STANDARD 1 21 D1 0 --- 2.9040 0.0000 0.0900 DHC8 DEP STANDARD 1 21 D2 0 --- 11.3240 0.0000 0.3500 DHC8 DEP STANDARD 1 21 D3 0 --- 1.8670 0.0000 0.0580 GASEPF APP STANDARD 1 03 A 0 --- 0.1950 0.0000 0.0060 GASEPF APP STANDARD 1 03 A1 0 --- 0.3910 0.0000 0.0120 GASEPF APP STANDARD 1 03 A2 0 --- 0.1950 0.0000 0.0060 GASEPF APP STANDARD 1 03 A3 0 --- 0.1950 0.0000 0.0060 GASEPF APP STANDARD 1 03 A4 0 --- 0.5860 0.0000 0.0180 GASEPF APP STANDARD 1 03 A5 0 --- 2.3440 0.0000 0.0730 GASEPF APP STANDARD 1 21 1 0 --- 7.5850 0.0000 0.2350 GASEPF DEP STANDARD 1 03 1 0 --- 3.9070 0.0000 0.1210 GASEPF DEP STANDARD 1 21 D 0 --- 0.0760 0.0000 0.0020 GASEPF DEP STANDARD 1 21 D1 0 --- 2.2000 0.0000 0.0680 GASEPF DEP STANDARD 1 21 D4 0 --- 3.9820 0.0000 0.1230 GASEPF DEP STANDARD 1 21 D5 0 --- 1.3270 0.0000 0.0410 GASEPF TGO STANDARD 1 03 1 0 --- 0.4110 0.0000 0.0130 GASEPF TGO STANDARD 1 21 1 0 --- 0.3990 0.0000 0.0120 GASEPF TGO STANDARD 1 21 2 0 --- 0.3990 0.0000 0.0120 GASEPV APP STANDARD 1 03 A 0 --- 0.1950 0.0000 0.0060 GASEPV APP STANDARD 1 03 A1 0 --- 0.3910 0.0000 0.0120 GASEPV APP STANDARD 1 03 A2 0 --- 0.1950 0.0000 0.0060 GASEPV APP STANDARD 1 03 A3 0 --- 0.1950 0.0000 0.0060 GASEPV APP STANDARD 1 03 A4 0 --- 0.5860 0.0000 0.0180 GASEPV APP STANDARD 1 03 A5 0 --- 2.3440 0.0000 0.0730 GASEPV APP STANDARD 1 21 1 0 --- 7.5850 0.0000 0.2350 GASEPV DEP STANDARD 1 03 1 0 --- 3.9070 0.0000 0.1210 GASEPV DEP STANDARD 1 21 D 0 --- 0.0760 0.0000 0.0020 GASEPV DEP STANDARD 1 21 D1 0 --- 2.2000 0.0000 0.0680 GASEPV DEP STANDARD 1 21 D4 0 --- 3.9820 0.0000 0.1230 GASEPV DEP STANDARD 1 21 D5 0 --- 1.3270 0.0000 0.0410 GASEPV TGO STANDARD 1 03 1 0 --- 0.4110 0.0000 0.0130 GASEPV TGO STANDARD 1 21 1 0 --- 0.3990 0.0000 0.0120 GASEPV TGO STANDARD 1 21 2 0 --- 0.3990 0.0000 0.0120 LEAR35 APP STANDARD 1 03 A 0 --- 0.1220 0.0000 0.0040 LEAR35 APP STANDARD 1 03 A1 0 --- 0.0120 0.0000 0.0000 LEAR35 APP STANDARD 1 03 A2 0 --- 0.0120 0.0000 0.0000
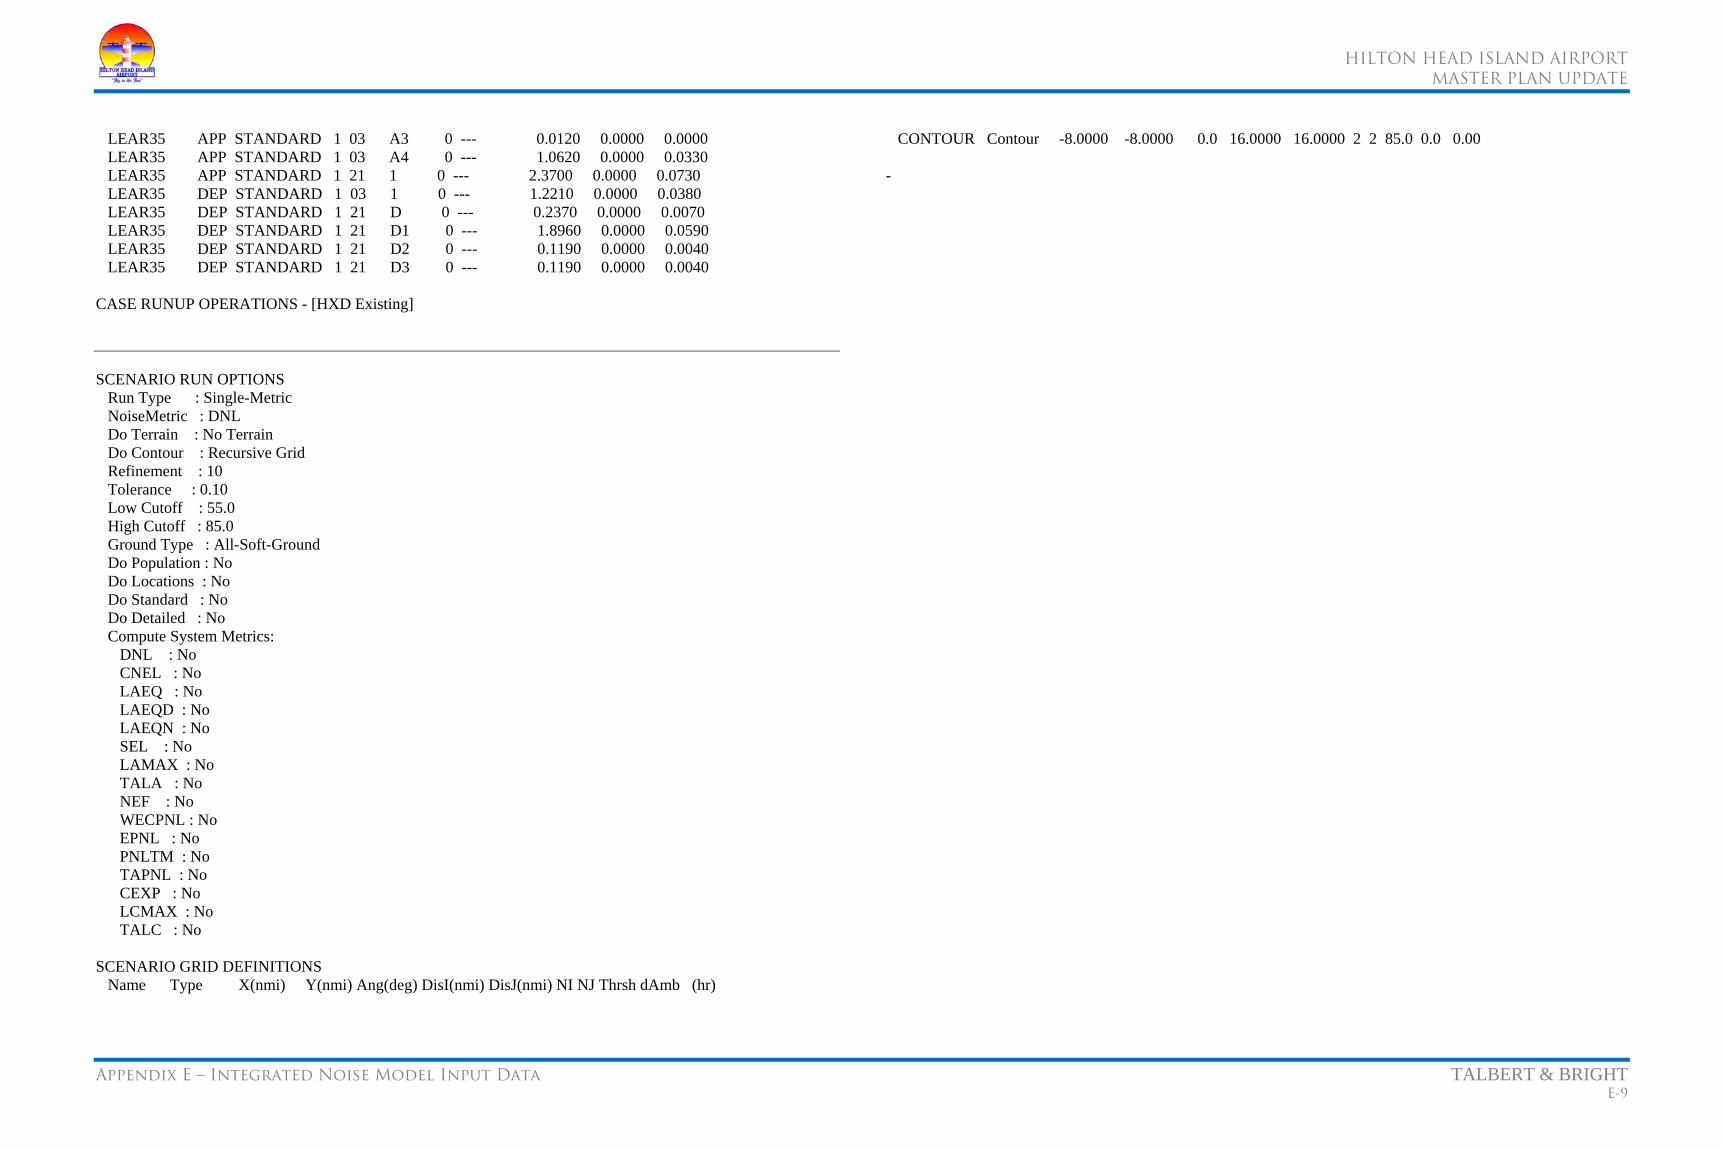
HILTON HEAD ISLAND AIRPORT
MASTER PLAN UPDATE
Appendix E – Integrated Noise Model Input Data TALBERT & BRIGHT E-9
LEAR35 APP STANDARD 1 03 A3 0 --- 0.0120 0.0000 0.0000 LEAR35 APP STANDARD 1 03 A4 0 --- 1.0620 0.0000 0.0330 LEAR35 APP STANDARD 1 21 1 0 --- 2.3700 0.0000 0.0730 LEAR35 DEP STANDARD 1 03 1 0 --- 1.2210 0.0000 0.0380 LEAR35 DEP STANDARD 1 21 D 0 --- 0.2370 0.0000 0.0070 LEAR35 DEP STANDARD 1 21 D1 0 --- 1.8960 0.0000 0.0590 LEAR35 DEP STANDARD 1 21 D2 0 --- 0.1190 0.0000 0.0040 LEAR35 DEP STANDARD 1 21 D3 0 --- 0.1190 0.0000 0.0040 CASE RUNUP OPERATIONS - [HXD Existing] SCENARIO RUN OPTIONS Run Type : Single-Metric NoiseMetric : DNL Do Terrain : No Terrain Do Contour : Recursive Grid Refinement : 10 Tolerance : 0.10 Low Cutoff : 55.0 High Cutoff : 85.0 Ground Type : All-Soft-Ground Do Population : No Do Locations : No Do Standard : No Do Detailed : No Compute System Metrics: DNL : No CNEL : No LAEQ : No LAEQD : No LAEQN : No SEL : No LAMAX : No TALA : No NEF : No WECPNL : No EPNL : No PNLTM : No TAPNL : No CEXP : No LCMAX : No TALC : No SCENARIO GRID DEFINITIONS Name Type X(nmi) Y(nmi) Ang(deg) DisI(nmi) DisJ(nmi) NI NJ Thrsh dAmb (hr)
CONTOUR Contour -8.0000 -8.0000 0.0 16.0000 16.0000 2 2 85.0 0.0 0.00 -

HILTON HEAD ISLAND AIRPORT
MASTER PLAN UPDATE
Appendix F– Preliminary Project Cost Estimates TALBERT & BRIGHT F-1
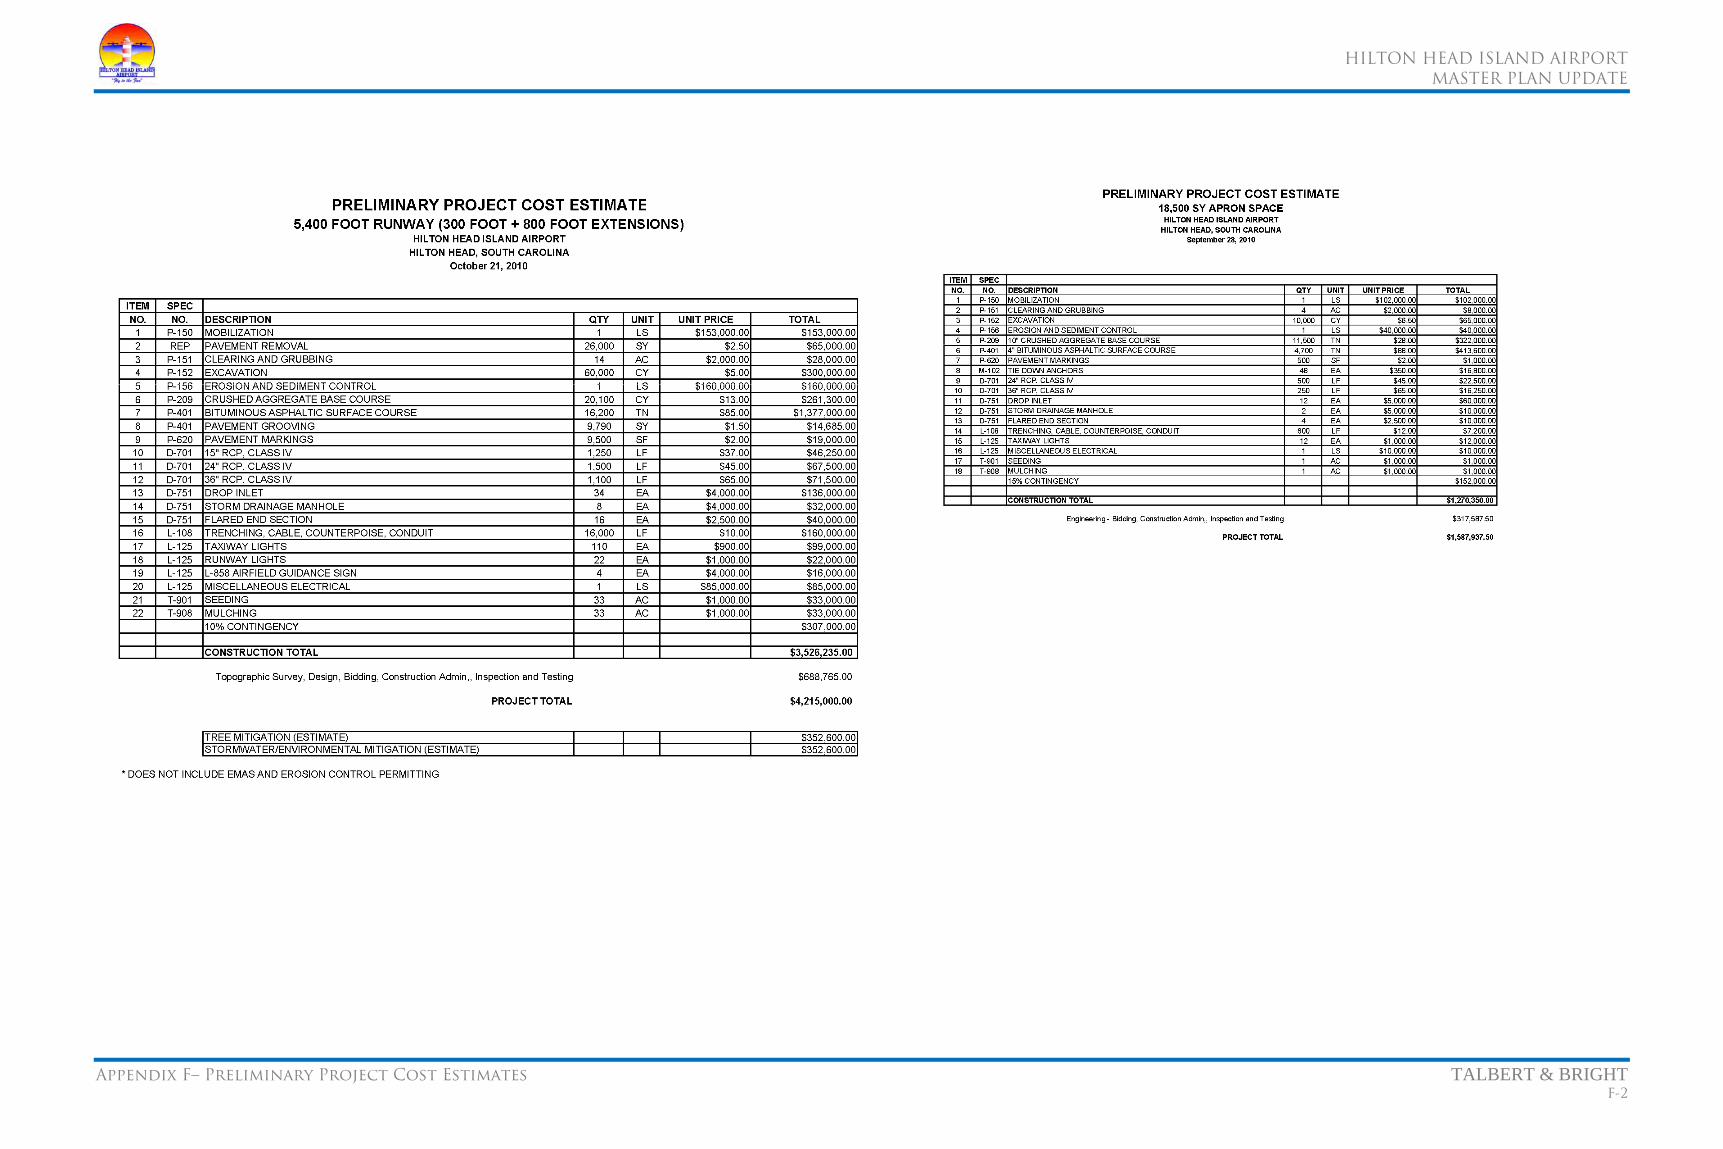
HILTON HEAD ISLAND AIRPORT
MASTER PLAN UPDATE
Appendix F– Preliminary Project Cost Estimates TALBERT & BRIGHT F-2

HILTON HEAD ISLAND AIRPORT
MASTER PLAN UPDATE
Appendix F– Preliminary Project Cost Estimates TALBERT & BRIGHT F-3

HILTON HEAD ISLAND AIRPORT
MASTER PLAN UPDATE
Appendix F– Preliminary Project Cost Estimates TALBERT & BRIGHT F-4
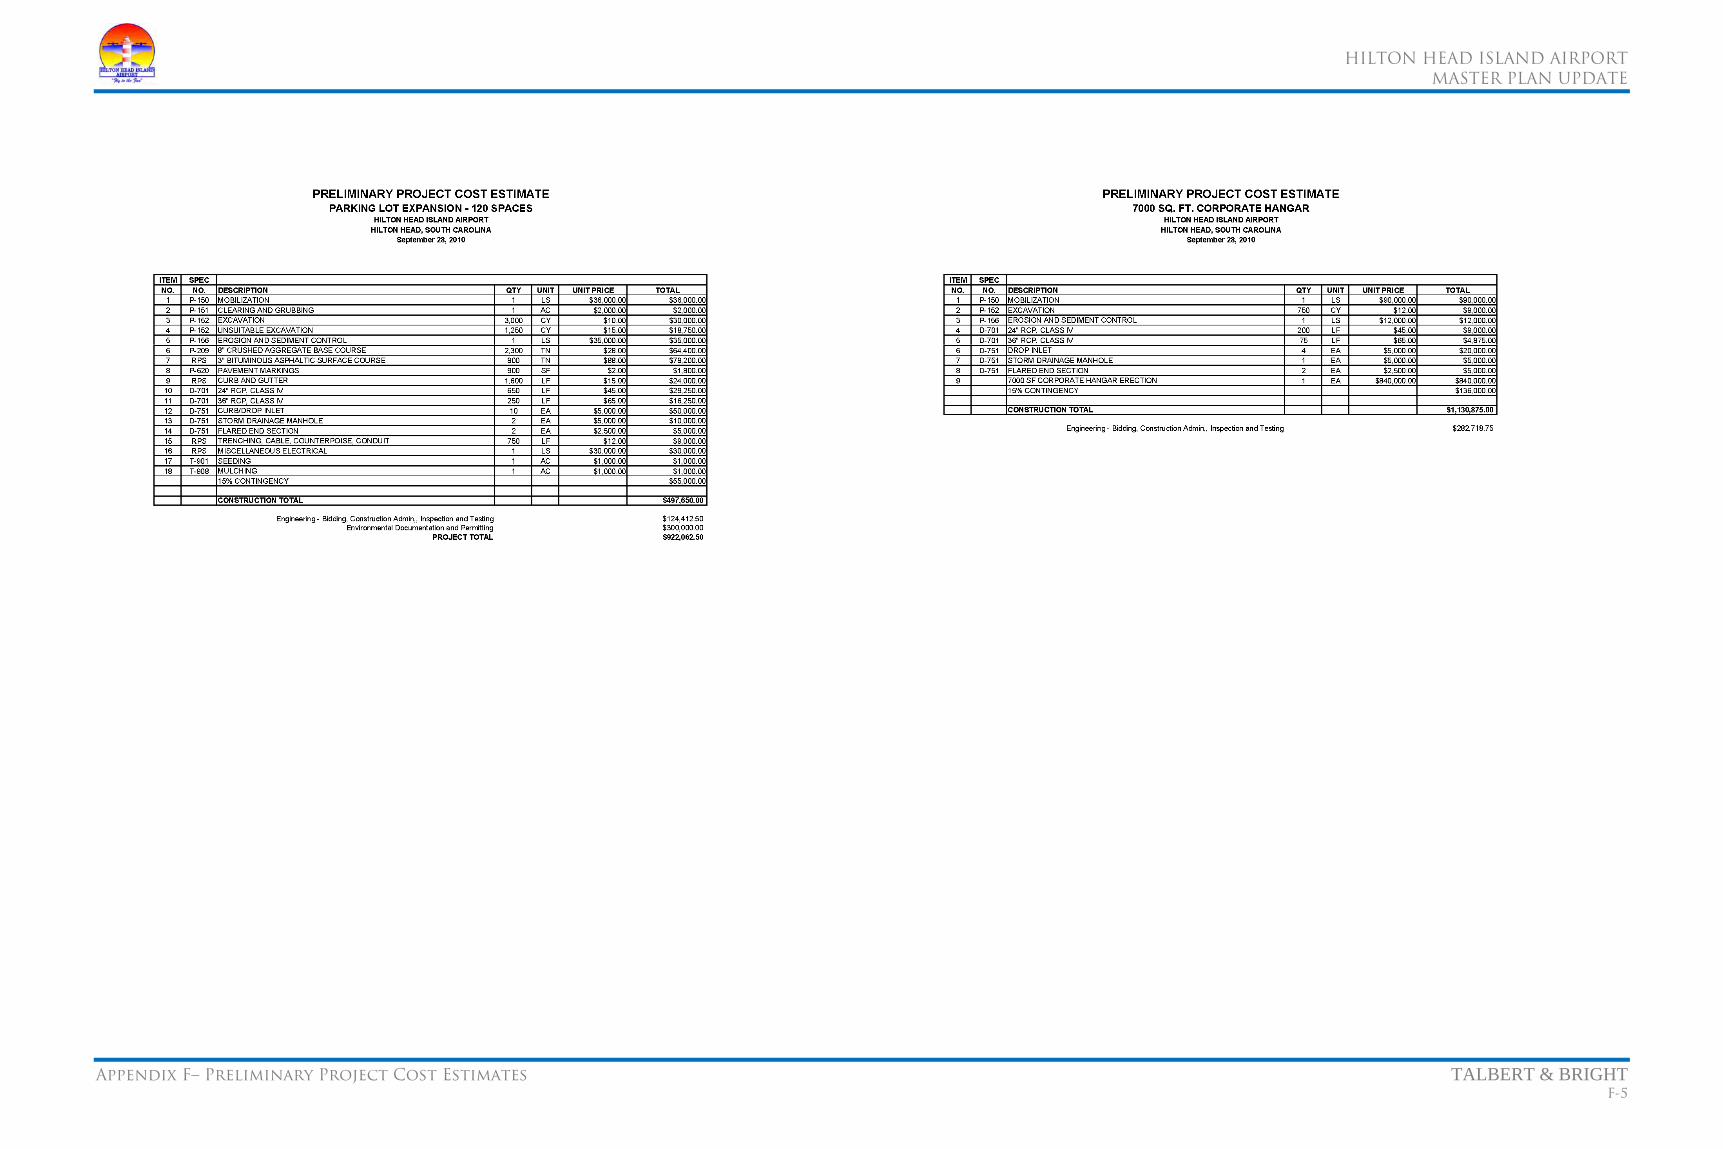
HILTON HEAD ISLAND AIRPORT
MASTER PLAN UPDATE
Appendix F– Preliminary Project Cost Estimates TALBERT & BRIGHT F-5
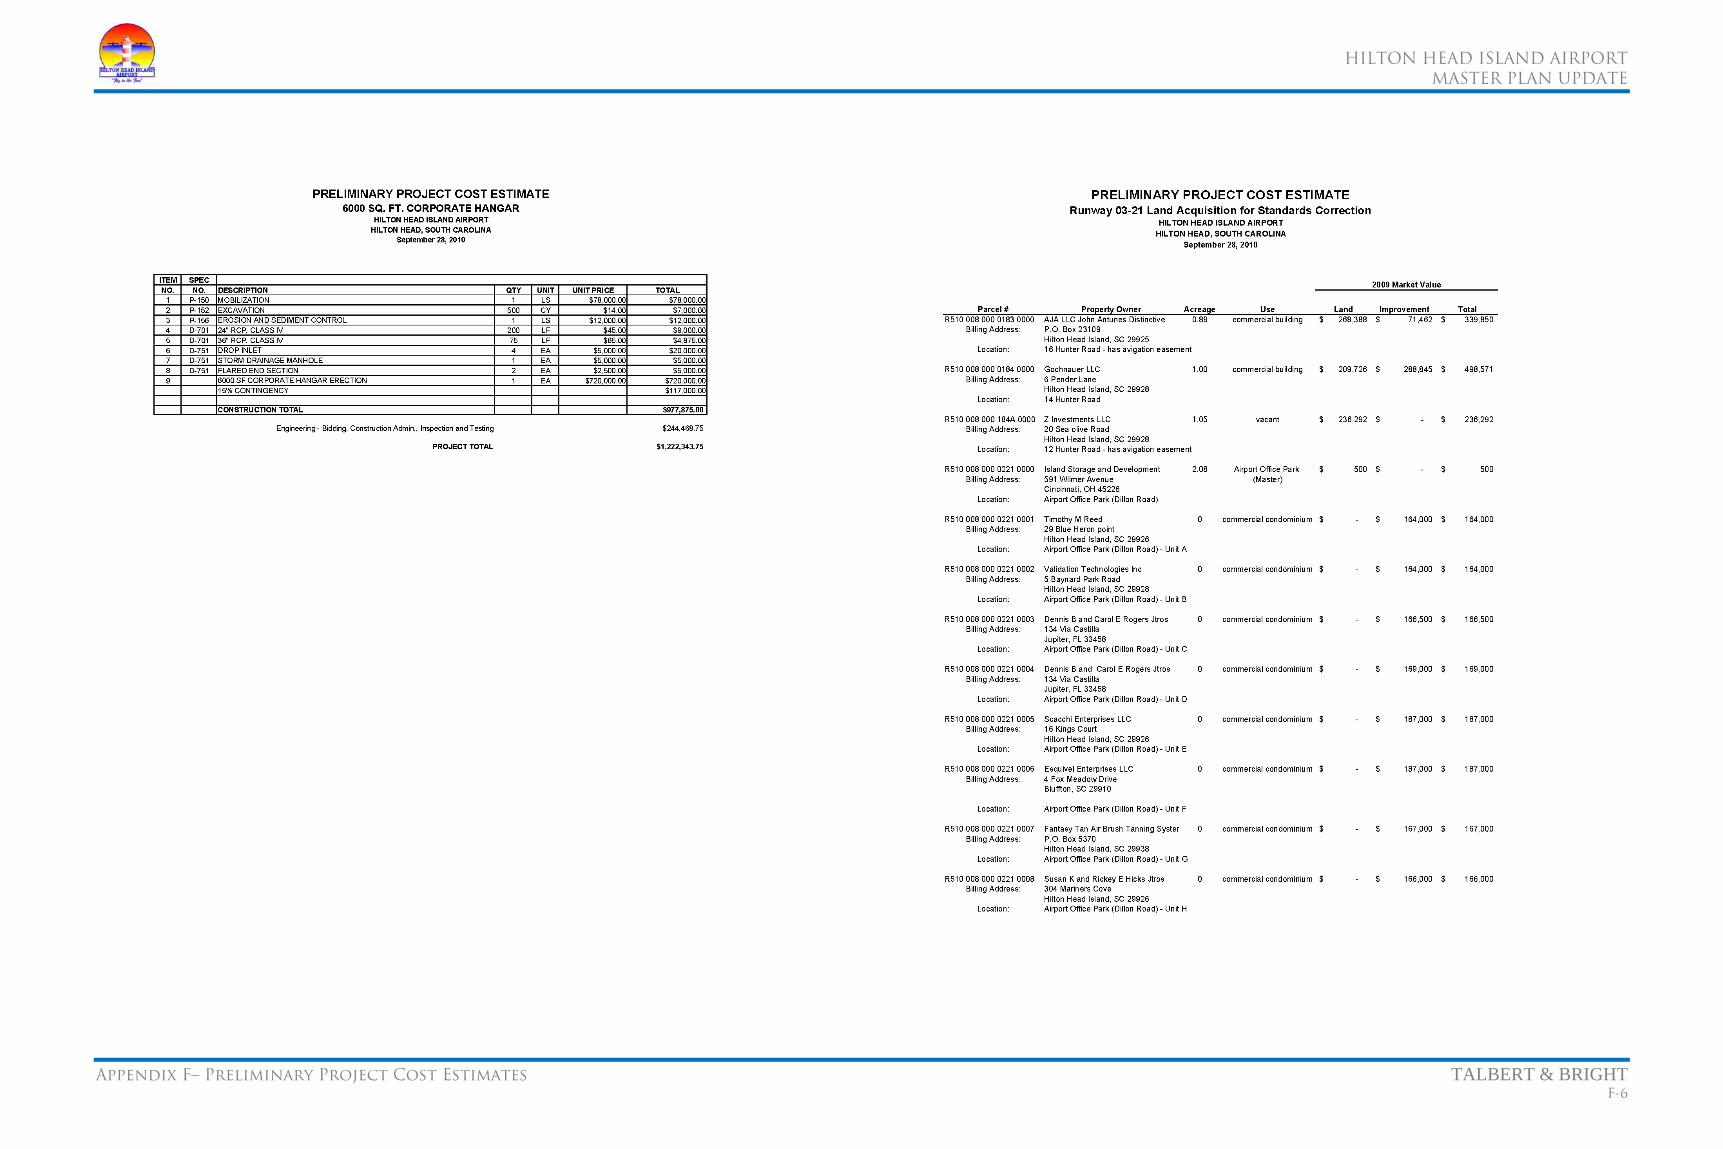
HILTON HEAD ISLAND AIRPORT
MASTER PLAN UPDATE
Appendix F– Preliminary Project Cost Estimates TALBERT & BRIGHT F-6
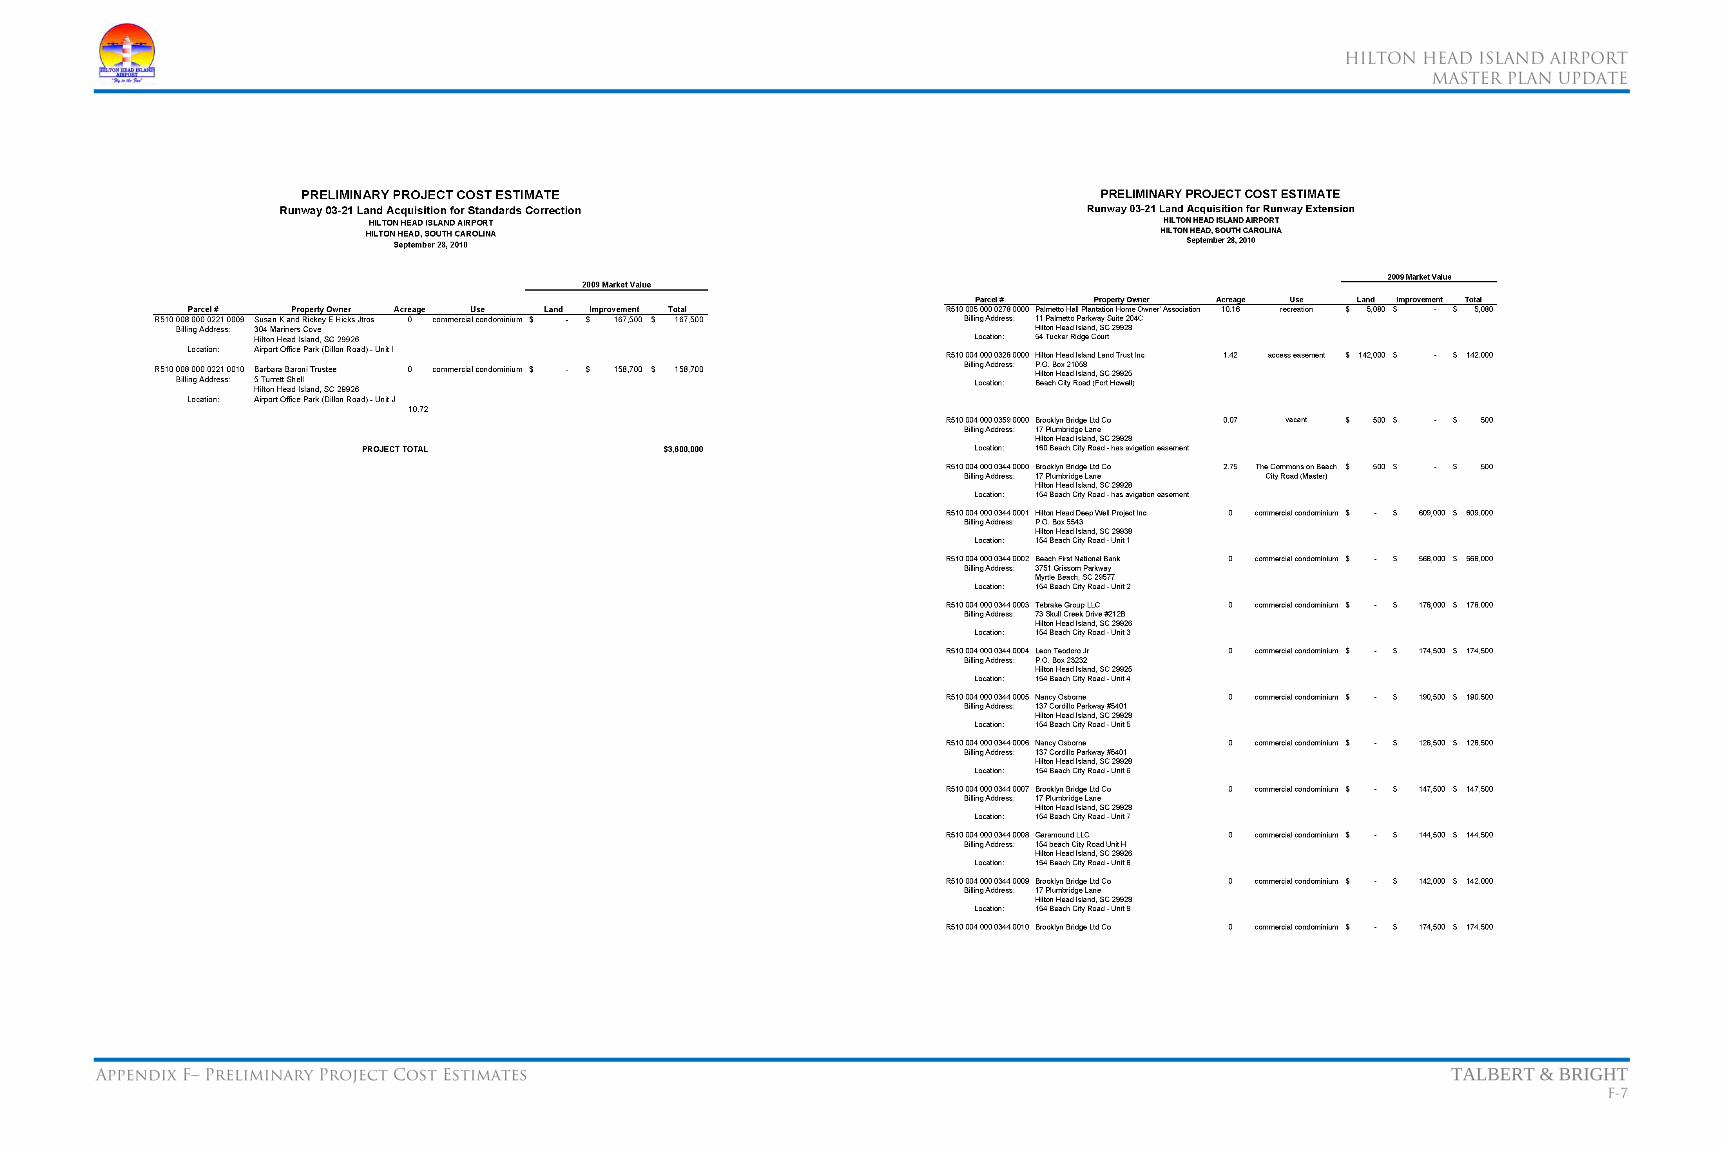
HILTON HEAD ISLAND AIRPORT
MASTER PLAN UPDATE
Appendix F– Preliminary Project Cost Estimates TALBERT & BRIGHT F-7
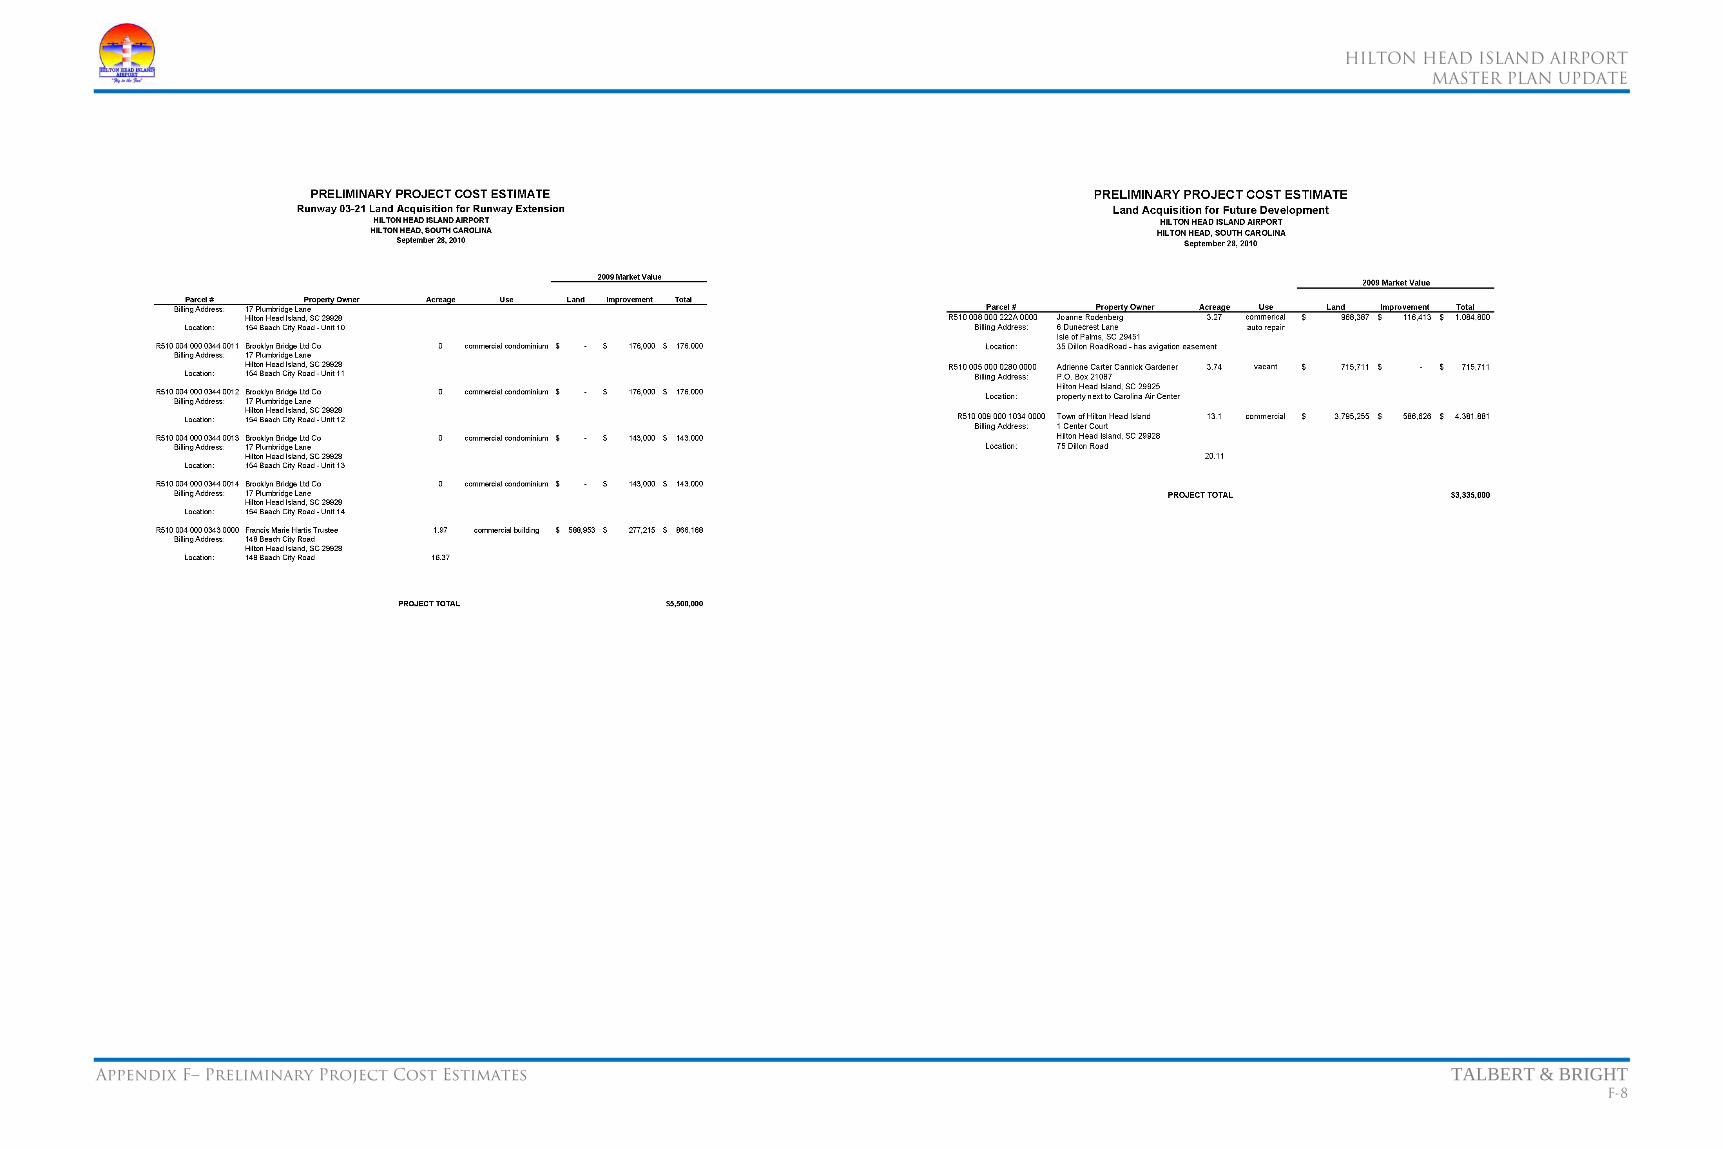
HILTON HEAD ISLAND AIRPORT
MASTER PLAN UPDATE
Appendix F– Preliminary Project Cost Estimates TALBERT & BRIGHT F-8

HILTON HEAD ISLAND AIRPORT
MASTER PLAN UPDATE
Appendix F– Preliminary Project Cost Estimates TALBERT & BRIGHT F-9

HILTON HEAD ISLAND AIRPORT
MASTER PLAN UPDATE
Appendix F– Preliminary Project Cost Estimates TALBERT & BRIGHT F-10


![[2009] NTMC 003 PARTIES: EMMA HILTON v KOVIT ...](https://static.fdokumen.com/doc/165x107/631914160255356abc081ccd/2009-ntmc-003-parties-emma-hilton-v-kovit-.jpg)