November Commission Presentation - Boise Airport
16
November Commission Presentation Director’s Report Rebecca Hupp Boise Airport Director NOVEMBER 3, 2016
-
Upload
khangminh22 -
Category
Documents
-
view
0 -
download
0
Transcript of November Commission Presentation - Boise Airport

November Commission PresentationDirector’s Report
Rebecca HuppBoise Airport Director
NOVEMBER 3, 2016

Airport Operations Update• October 13
The TSA and Boise Airport hosted a Tenant Security Meeting
• October 14Boise Airport Operations hosted Ada County Dispatch for a tour
• October 17Boise Airport Ops facilitated annual security exercise

Master Plan Study Update• Open House #1, November 16
• Boise River Room, 5:30pm – 7:00pm• Goals of a master plan• Key subjects of a master plan• Public involvement schedule
• Open House #2, December 14• Boise River Room, 5:30pm – 7:00pm
• Inventory of existing facilities• Forecasts of future aviation activity

Fuel Farm Goals
• Access and Reliability
• Fuel Pricing
• Safety
• Environmental Compliance
• Regulatory Compliance
• Security
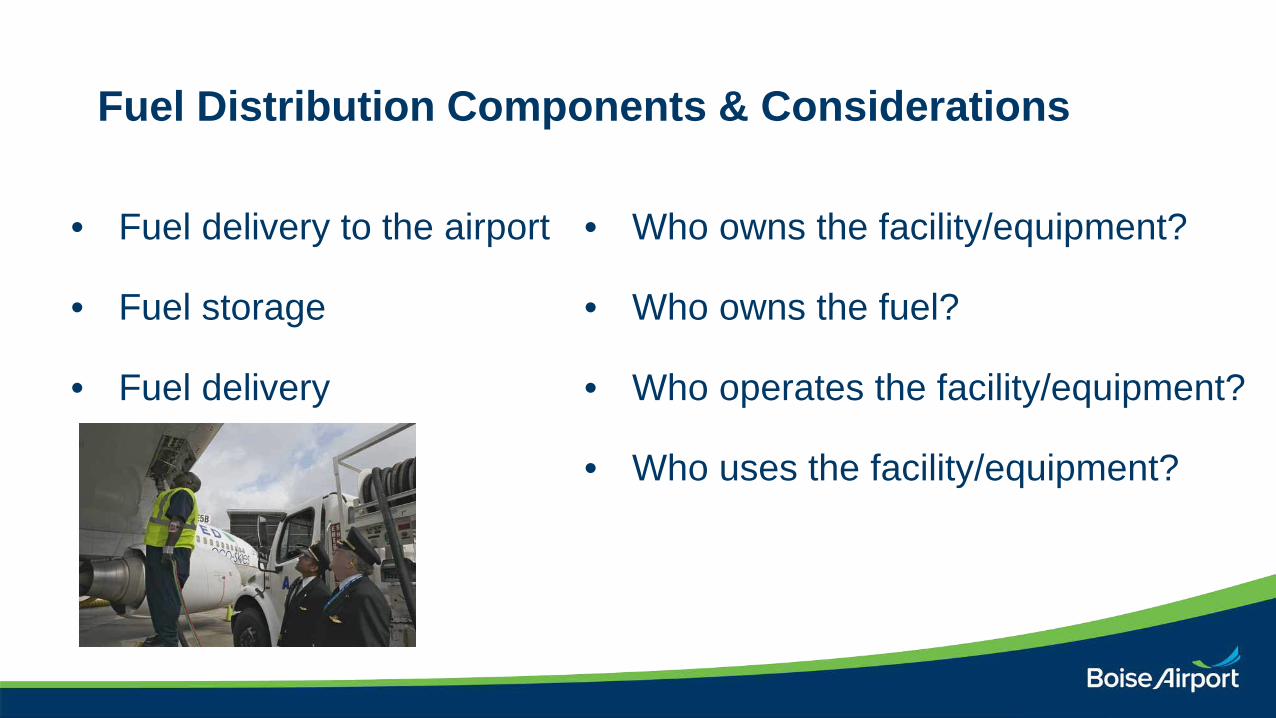
Fuel Distribution Components & Considerations
• Fuel delivery to the airport
• Fuel storage
• Fuel delivery
• Who owns the facility/equipment?
• Who owns the fuel?
• Who operates the facility/equipment?
• Who uses the facility/equipment?

Operating Models• Airport Sponsor-Owned and Operated
• Airport Sponsor-Owned and Privately Operated (Management Contract)
• Airport Sponsor-Owned and Privately Operated (Lease Agreement)
• Privately Owned and Operated

Other Considerations• FAA Grant Assurances
• Tort and Liability Laws
• Environmental Laws (Citing and Operating)
• Business Risk
• Antitrust Laws

Rotunda Floor• Installation has begun
• Expected completion is late February
• Will have five phases
• Will not impede the travelling public

Power Redundancy Project• Redundancy added as another safeguard
towards power outages
• Will allow maintenance to occur on current electrical equipment, without impacting airport operations
• Spring 2017 is the target completion date

United Way Fundraising Activities
Pancake Breakfast – October 12 Potato Bar – October 26

Customer Satisfaction SurveyItems Scoring Less Than 80
Friendliness of staff (retail) 79
Speed of service (food & beverage) 77
Cleanliness of taxi 72
Variety of food options 69
Availability of electrical outlets 66
Availability of healthy foods 61
Overall Airport Satisfaction
Feeling of safety and security 94
Friendliness of airport staff 93
Quality of air service 89
Overall Boise Airport experience 95
Top Four Suggestions to Improve Airport Experience
Flights Food
Outlets Options

Top 10 Operating Revenue Description FY 2016 FY 2015 $ Change % Change
Parking Lot $ 9,698,634 $ 8,910,816 $ 787,818 9%
Rental Car Concession $ 4,495,543 $ 4,000,959 $ 494,584 12%
Terminal Rent – Airlines $ 3,893,332 $ 3,785,550 $ 107,782 3%
Industrial Land Rent $ 3,343,787 $ 1,903,531 $ 1,440,256 76%
Signatory Airline Landing Fees $ 3,098,444 $ 2,701,871 $ 396,573 15%
Terminal Concession – Food/Beverage $ 1,005,082 $ 851,709 $ 153,373 18%
Terminal Concession – Retail $ 846,422 $ 713,210 $ 133,212 19%
Landings/Freight $ 752,710 $ 670,422 $ 82,288 12%
Terminal Rent – Nonairline $ 497,569 $ 491,072 $ 6,497 1%
Advertising $ 358,705 $ 310,651 $ 48,054 15%
Total Top 10 Operating Revenue $ 27,990,228 $ 24,339,791 $ 3,650,437
Other Operating Revenue $ 2,789,500 $ 3,013,103 $ (223,603)
Total Operating Revenue $ 30,779,728 $ 27,352,894 $ 3,426,834 13%

Top 10 Operating Expenses Description FY 2016 FY 2015 $ Change % Change
Personnel $ 6,733,317 $ 6,382,302 $ 351,015 5%
Fire Service $ 2,439,952 $ 2,279,244 $ 160,708 7%
Policing Service $ 2,382,499 $ 2,364,773 $ 17,726 1%
Indirect Cost Reimbursement $ 1,053,334 $ 1,114,086 $ (60,752) -5%
Power $ 864,968 $ 891,984 $ (27,016) -3%
Parking Management $ 834,974 $ 803,929 $ 31,045 4%
Chemicals $ 729,984 $ 423,176 $ 306,808 73%
R/M – Structural/Electrical/Plumbing $ 728,569 $ 781,572 $ (53,003) -7%
Credit Card Fees $ 266,394 $ 231,060 $ 35,334 15%
R/M - Terminal $ 241,393 $ 170,643 $ 70,750 41%
Total Top 10 Operating Expenses $ 16,275,384 $ 15,442,769
Other Operating Expense $ 3,313,200 $ 3,635,357 $ (322,157) -9%
Total Operating Expense $ 19,588,584 $ 19,078,126 $ 510,458 3%

September EnplanementsUp 6% September 2016 over September 2015
105,600 105,562113,146
125,472133,567
0
20,000
40,000
60,000
80,000
100,000
120,000
140,000
160,000
2012 2013 2014 2015 2016
Total Enplanements

2016 YTD Total PassengersUp 9% YTD
1,952,664 1,951,029 2,032,6352,190,667
2,396,071
0
500,000
1,000,000
1,500,000
2,000,000
2,500,000
3,000,000
2012 2013 2014 2015 2016
Total Passengers
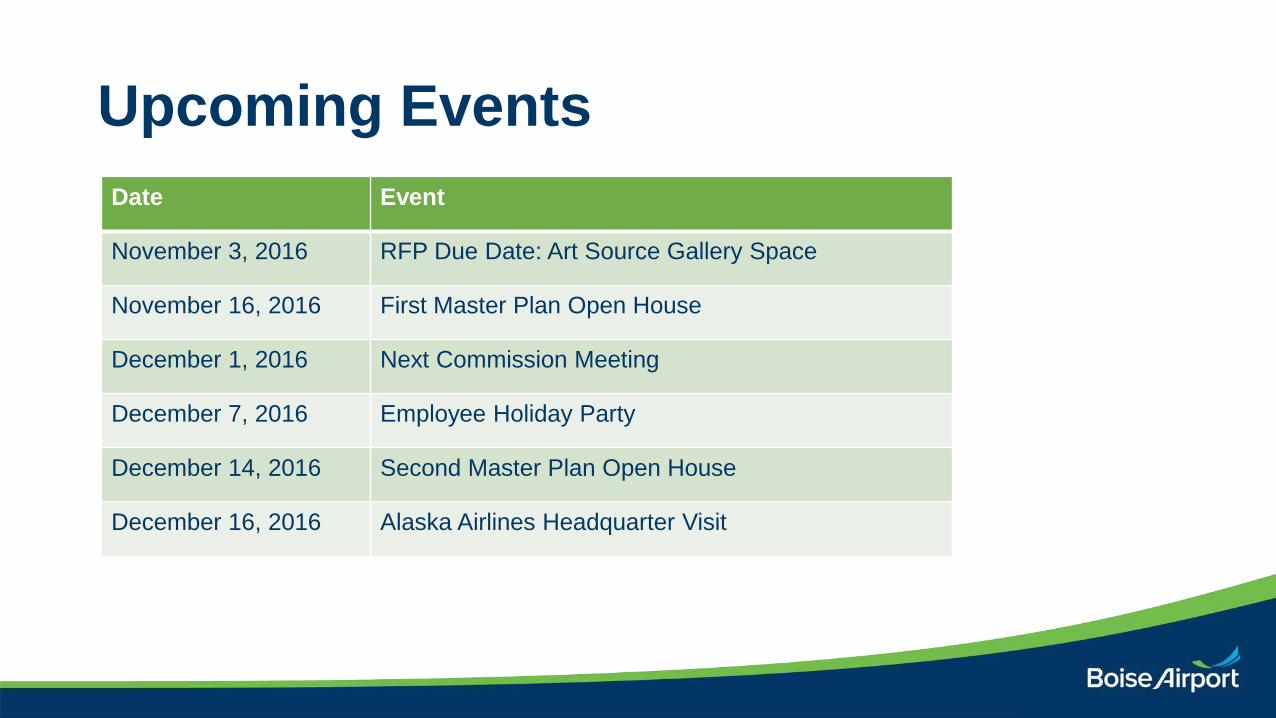
Upcoming EventsDate Event
November 3, 2016 RFP Due Date: Art Source Gallery Space
November 16, 2016 First Master Plan Open House
December 1, 2016 Next Commission Meeting
December 7, 2016 Employee Holiday Party
December 14, 2016 Second Master Plan Open House
December 16, 2016 Alaska Airlines Headquarter Visit