MANASSAS REGIONAL AIRPORT OCTOBER 2002
105
MANASSAS REGIONAL AIRPORT HARRY P. DAVIS FIELD AIRPORT LAYOUT PLAN TECHNICAL REPORT OCTOBER 2002 Prepared For: Manassas Regional Airport Commission Prepared By: The Campbell and Paris Team Campbell and Paris Engineers, P.C. VETTRA, Inc.
-
Upload
khangminh22 -
Category
Documents
-
view
1 -
download
0
Transcript of MANASSAS REGIONAL AIRPORT OCTOBER 2002
MANASSAS REGIONAL AIRPORT HARRY P. DAVIS FIELD
AIRPORT LAYOUT PLAN TECHNICAL REPORT
OCTOBER 2002
Prepared For: Manassas Regional Airport Commission
Prepared By: The Campbell and Paris Team
Campbell and Paris Engineers, P.C. VETTRA, Inc.

TABLE OF CONTENTS
SECTION PAGE
EXECUTIVE SUMMARY
1. EXISTING CONDITIONS 1
1.1 PURPOSE OF ALP UPDATE AND MAJOR PLANNING ISSUES 1
1.2 HISTORY OF MANASSAS REGIONAL AIRPORT 4
1.3 AIRPORT FACILITIES INVENTORY 7
1.3.1 Runway and Taxiway Facilities 7
1.3.2 On-Airport Navigational Facilities 7
1.3.3 Landside Facilities 8
1.3.4 Fuel Storage Facilities 8
1.3.5 Helicopter Facilities 8
1.4 EXISTING AIRPORT ACTIVITY 9
1.4.1 Based Aircraft 9
1.4.2 Aircraft Operations 12
1.4.3 Existing Peaking Conditions 13
1.4.4 Types of Aircraft Operations 13
1.4.5 Observed Runway Usage 14
1.4.6 Published Approaches 14
1.4.7 Instrument Operations 15
1.4.8 Military Operations 15
1.5 SCHEDULED AND NON-SCHEDULED COMMERCIAL SERVICE 16
1.5.1 Scheduled Service 16
1.5.2 Non Scheduled Service 16
1.6 WEATHER AND WIND ANALYSIS 16
1.6.1 General 16
1.6.2 Local Climate 16
1.6.3 Wind Rose Analysis 17
1.6.4 Crosswind Coverage 17
1.7 AIRPORT SERVICE AREA AND ENVIRONMENT 20

1.7.1 Service Area 20
1.7.2 Area Population, Income and Employment 20
1.7.3 Area Land Use 22
1.7.4 Local Environment 23
1.7.5 Area Airports 23
1.7.6 September 11, 2001 25
1.7.7 Airspace 26
1.7.8 Surface Access and Ground Transportation 28
2. FORECAST OF AVIATION DEMAND 34
2.1 NATIONAL TRENDS 34
2.2 VATSP FORECAST OF AVIATION DEMAND 35
2.2.1 Based Aircraft 35
2.2.2 Operations 35
2.3 FAA-TAF FORECAST OF AVIATION DEMAND 36
2.3.1 Based Aircraft 36
2.3.2 Operations 36
2.4 REGRESSION ANALYSIS FORECAST OF AVIATION DEMAND 37
2.4.1 Operations 37
2.4.2 Based Aircraft 37
2.5 RECOMMENDED FORECAST OF AVIATION DEMAND 38
2.6 FORECASTED OPERATIONS MIX 39
2.6.1 Itinerant and Local Operations 39
2.6.2 Operations by Type of Aircraft 40
2.6.3 Instrument Operations 41
2.6.4 Charter Operations 41
2.6.5 Military Operations 42
2.7 PEAKING CHARACTERISTICS 42
2.7.1 Total Operations 42
2.7.2 Instrument Operations 44
2.8 SCHEDULED SERVICE 44
2.9 FORECASTED AUTOMOBILE TRAFFIC ACTIVITY 45
3. DEMAND/CAPACITY ANALYSIS AND FACILITY REQUIREMENTS 47
3.1 RUNWAY AND TAXIWAY SYSTEM CAPACITY 47
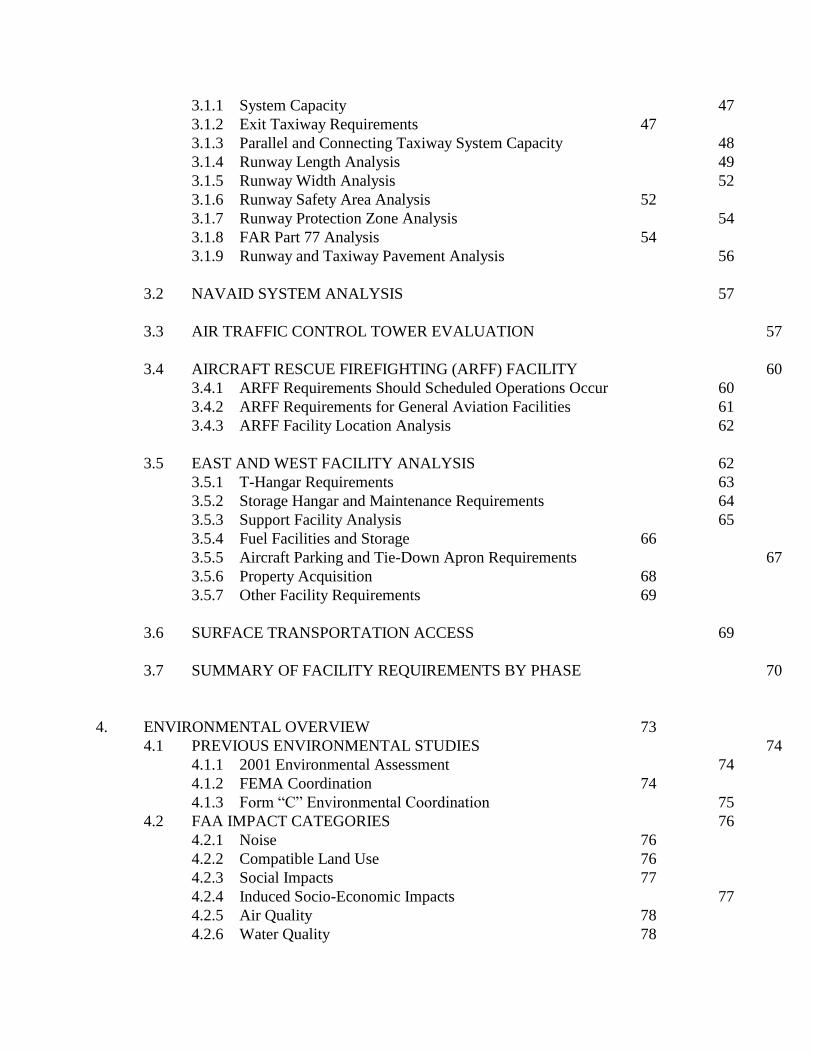
3.1.1 System Capacity 47
3.1.2 Exit Taxiway Requirements 47
3.1.3 Parallel and Connecting Taxiway System Capacity 48
3.1.4 Runway Length Analysis 49
3.1.5 Runway Width Analysis 52
3.1.6 Runway Safety Area Analysis 52
3.1.7 Runway Protection Zone Analysis 54
3.1.8 FAR Part 77 Analysis 54
3.1.9 Runway and Taxiway Pavement Analysis 56
3.2 NAVAID SYSTEM ANALYSIS 57
3.3 AIR TRAFFIC CONTROL TOWER EVALUATION 57
3.4 AIRCRAFT RESCUE FIREFIGHTING (ARFF) FACILITY 60
3.4.1 ARFF Requirements Should Scheduled Operations Occur 60
3.4.2 ARFF Requirements for General Aviation Facilities 61
3.4.3 ARFF Facility Location Analysis 62
3.5 EAST AND WEST FACILITY ANALYSIS 62
3.5.1 T-Hangar Requirements 63
3.5.2 Storage Hangar and Maintenance Requirements 64
3.5.3 Support Facility Analysis 65
3.5.4 Fuel Facilities and Storage 66
3.5.5 Aircraft Parking and Tie-Down Apron Requirements 67
3.5.6 Property Acquisition 68
3.5.7 Other Facility Requirements 69
3.6 SURFACE TRANSPORTATION ACCESS 69
3.7 SUMMARY OF FACILITY REQUIREMENTS BY PHASE 70
4. ENVIRONMENTAL OVERVIEW 73
4.1 PREVIOUS ENVIRONMENTAL STUDIES 74
4.1.1 2001 Environmental Assessment 74
4.1.2 FEMA Coordination 74
4.1.3 Form “C” Environmental Coordination 75
4.2 FAA IMPACT CATEGORIES 76
4.2.1 Noise 76
4.2.2 Compatible Land Use 76
4.2.3 Social Impacts 77
4.2.4 Induced Socio-Economic Impacts 77
4.2.5 Air Quality 78
4.2.6 Water Quality 78
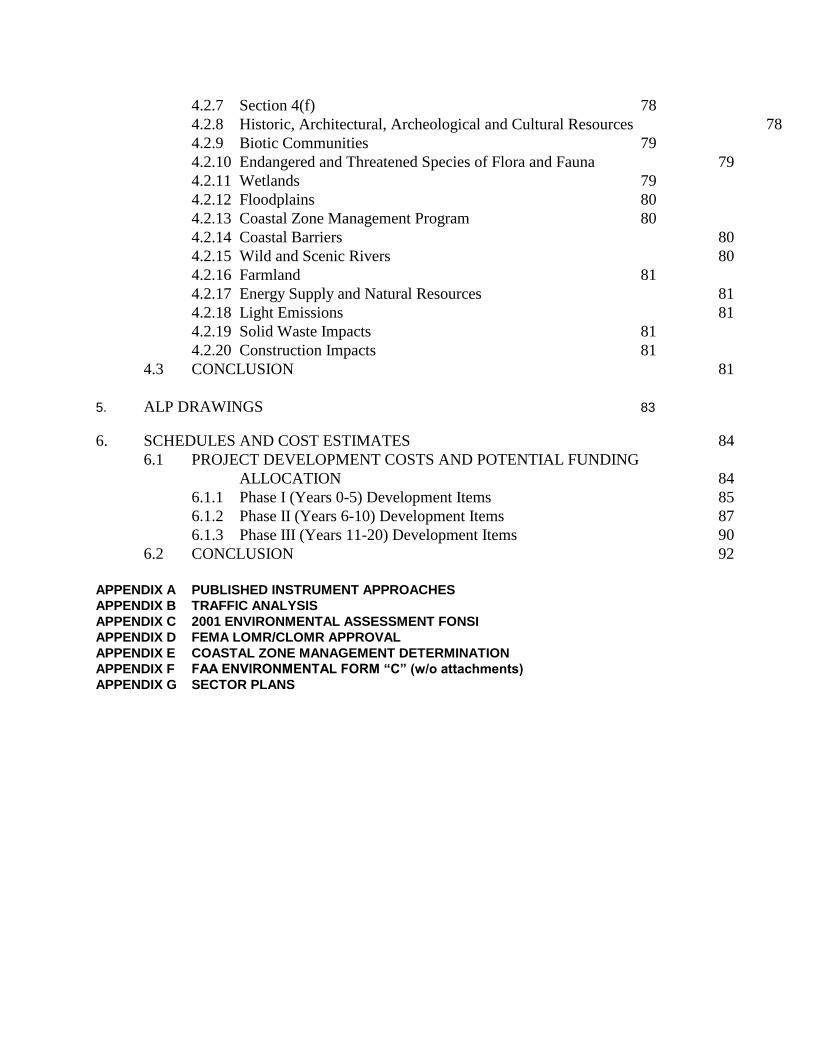
4.2.7 Section 4(f) 78
4.2.8 Historic, Architectural, Archeological and Cultural Resources 78
4.2.9 Biotic Communities 79
4.2.10 Endangered and Threatened Species of Flora and Fauna 79
4.2.11 Wetlands 79
4.2.12 Floodplains 80
4.2.13 Coastal Zone Management Program 80
4.2.14 Coastal Barriers 80
4.2.15 Wild and Scenic Rivers 80
4.2.16 Farmland 81
4.2.17 Energy Supply and Natural Resources 81
4.2.18 Light Emissions 81
4.2.19 Solid Waste Impacts 81
4.2.20 Construction Impacts 81
4.3 CONCLUSION 81
5. ALP DRAWINGS 83
6. SCHEDULES AND COST ESTIMATES 84
6.1 PROJECT DEVELOPMENT COSTS AND POTENTIAL FUNDING
ALLOCATION 84
6.1.1 Phase I (Years 0-5) Development Items 85
6.1.2 Phase II (Years 6-10) Development Items 87
6.1.3 Phase III (Years 11-20) Development Items 90
6.2 CONCLUSION 92
APPENDIX A PUBLISHED INSTRUMENT APPROACHES
APPENDIX B TRAFFIC ANALYSIS
APPENDIX C 2001 ENVIRONMENTAL ASSESSMENT FONSI
APPENDIX D FEMA LOMR/CLOMR APPROVAL
APPENDIX E COASTAL ZONE MANAGEMENT DETERMINATION
APPENDIX F FAA ENVIRONMENTAL FORM “C” (w/o attachments)
APPENDIX G SECTOR PLANS

INDEX OF TABLES
TABLE PAGE 1.1 Major Airfield Facilities Available at Manassas Regional Airport - 2001 7 1.2 Historical Based Aircraft Population at Manassas Regional Airport 9 1.3 Historical Fleet Mix by Aircraft Type - 1990 and 1999 10 1.4 Based Aircraft Distribution on East/West Complexes 11 1.5 Historical Annual Operations at Manassas Regional Airport 12 1.6 Historical Peaking Characteristics at Manassas Regional Airport 13 1.7 Published Approaches to Manassas Regional Airport 15 1.8 Recorded Weather Observations by NOAA Weather Classifications: 1991 to 2000
Dulles International Airport Weather Reporting Station 17 1.9 Runway 16L-34R and 16R-34L Crosswind Coverages 20 1.10 Population Trends for Virginia, Prince William County and City of
Manassas: 1990-2000 21 1.11 Employment Trends for Virginia, Prince William County and City of
Manassas: 1990-2000 22 1.12 Area Airport Activity - 1999 24 1.13 Publicly Owned/Public Use Airports Affected by “No-fly Zone” Around
DCA VOR 26 2.1 VATSP Forecast of Aviation Demand for Manassas Regional Airport 35 2.2 FAA-TAF Forecast of Aviation Demand for Manassas Regional Airport 36 2.3 Regression Analysis Forecast of Aviation Demand for Manassas Regional Airport 38 2.4 Comparison of Forecasted Demand for Aviation Facilities at Manassas
Regional Airport 39 2.5 Historical and Current Operations Mix at Manassas Regional Airport 41 2.6 Part 135 Operations and Enplanement Forecasts 42 2.7 Recommended Forecast of Peaking Characteristics for Manassas Regional Airport 43 2.8 Recommended Forecast of IFR Peaking Characteristics for Manassas
Regional Airport 44 2.9 Forecast of Airport Related Automobile Traffic 45 2.10 Summary Table of Forecasts Prepared for Manassas Regional Airport 46 3.1 Parallel Runway System Capacity and Forecasted Demand/Capacity Ratio for Annual
VFR and IFR Conditions 48 3.2 FAA Airport Design Computer Program Runway Length Analysis 50 3.3 Runway Safety Area Analysis 53 3.4 Alternative Cab Heights for Tower Line-of-Site to Selected Areas of the Airport 59 3.5 Forecasted T-Hangar Facility Requirements by Planning Year 63 3.6 Forecasted Storage/Maintenance Hangar Facility Requirements by Planning Year 65 3.7 Forecasted Fuel Farm Facility Requirements by Planning Year for 10-day Jet A and
15-day AvGas Supply 67 3.8 Summary of Facility Requirements by Planning Year - VATSP Forecasts 70
3.9 Summary of Facility Requirements by Planning Year - Regression Forecasts 71 6.1 Development Items Identified for Phase I Construction 86 6.2 Estimated Development Costs for Items Identified for Phase I Construction 87 6.3 Development Items Identified for Phase II Construction 88 6.4 Estimated Development Costs for Items Identified for Phase II Construction 89 6.5 Development Items Identified for Phase III Construction 91 6.6 Estimated Development Costs for Items Identified for Phase III Construction 92 6.7 Total Estimated Development Costs for Phases I, II and III 93
MANASSAS REGIONAL AIRPORT
OCTOBER 2002
1
SECTION ONE:
EXISTING CONDITIONS
Manassas Regional Airport - Harry P. Davis Field (HEF) is located on approximately 850-acres of land
within the incorporated limits of the City of Manassas and central Prince William County (see Figure
1.1). The airport is approximately 15 air miles to the south of Washington-Dulles International Airport
and 28 air miles to the southwest of Washington-Reagan National Airport. The airport is designated
as a general aviation reliever airport in the National Plan of Integrated Airport Systems (NPIAS) and is
designed in part to provide capacity relief for the heavily congested airspace around Reagan-National
and Dulles International Airports.
1.1_ PURPOSE OF ALP UPDATE AND MAJOR PLANNING ISSUES
The purpose of this Airport Layout Plan Update (ALP) is to re-examine and update the
existing approved Airport Layout Plan prepared originally with the 1990 Master Plan Update
Study. Specifically, this effort will result in updated forecasts of the anticipated aviation
activities that will then be used to identify what types and sizes of facilities will likely be
required to meet those demands over the next ten to twenty year planning horizon. An
updated Airport Layout Plan will then be prepared to show where and how these facilities
should be developed on the remaining undeveloped areas of airport property to promote its
continued safe and efficient operation. The assessment of these updated facility
requirements will also be used to determine whether any additional property may be required
beyond the existing boundaries of airport property to accommodate the anticipated aviation
activities.
While the development plan prepared with the 1990 Airport Master Plan Update included a
variety of recommended landside and airside facility improvements in both the East and West
Complexes, many of the plan recommendations have already been implemented. In fact by
the time that study was completed, the West Complex had already been substantially built-out
leaving limited space for any additional t-hangars and apron facility development on that side of the
airfield. Likewise, most of the basic airside infra-structure was also already in place by 1990 so the
only major long term airside facility expansion identified by the approved Airport Layout Plan was the
1,000-foot extension of the Runway 16L-34R system. As a result, most of the recommended
MANASSAS REGIONAL AIRPORT
OCTOBER 2002
2
improvements from the 1990 study focused on the development of a new terminal area and additional
FBO/hangar areas on the East Complex with the attendant mixture of tie-down and transient apron
expansions necessary to support these activities. Much of that facility development has now been
implemented as well. And while many of the same issues originally identified in that study will be
reviewed again, this ALP Update effort report is not to be considered a complete Master Plan
Update. No major change in the types of aircraft using the facility is expected nor is the service role
of the airport in the national airport system anticipated to change. No significant airside facility
development is anticipated beyond that already conceptually identified in the 1990 Master Plan. This
updated study will purposely focus on how to optimize
Figure 1.1 - Airport Location
MANASSAS REGIONAL AIRPORT
AIRPORT LAYOUT PLAN UPDATE REPORT
MANASSAS REGIONAL AIRPORT
OCTOBER 2002
3
the use of the existing infra-structure (i.e., how much runway length is really necessary) and how to
arrange the development of the traditional general aviation and business aircraft facilities (i.e.,
hangars, t-hangars, aprons, taxiways, etc.) on the available property to meet the forecasted aviation
needs while balancing the non-aviation needs and concerns of the entire community affected by the
airport. One of the important goals of the recommended plan will also be to have a plan flexible
enough to respond to change and to enable the City to take advantage of unanticipated economic
development opportunities that could not have been forecasted. While no major changes affecting
the airport development plans are anticipated, the recommendations flowing from this study effort will
be just as valuable in guiding the airport development over the next ten to twenty years as the 1990
study was to this date.
Major planning issues to be examined in the Technical Report include:
Activity Planning Forecasts: Forecasts of based aircraft and operations at Manassas
Regional Airport (HEF) will be updated (from the 1990 Master Plan) as part of this study
taking into account the most recent Terminal Area Forecast prepared by the FAA and the
forecasts prepared by the Virginia Department of Aviation (DOAV) for the most recent
update of the Virginia Air Transportation System Plan (VATSP).
Ultimate Runway Length Requirements: An updated assessment of the ultimate
runway length requirements will be prepared based on the updated activity forecasts and
critical aircraft determination.
Airport Reference Code (ARC): The 1990 ALP and Master Plan indicate that the
airport is
designed to accommodate ARC C-II/III aircraft. This ALP Update will examine the
potential and physical requirements/costs/benefits of planning facilities to accommodate
general aviation and business aircraft types in the C-III category in an effort to meet both
experienced and anticipated demand.
Obstruction Analysis: Using aerial photogrammetry conducted on June 17, 2001, a
re-evaluation of existing and future FAR Part 77 surfaces surrounding the airport will be
completed to identify any existing or potential obstructions to air navigation and identify
any mitigation measures.
Land Acquisition/Release: This report will examine the need for additional property
acquisition to support forecasted and/or potential aeronautical and aeronautical related
uses. Two potential areas have already been identified during the scoping for the study.
One identified study area is a 10-15 acre portion of adjacent property east of Wakeman
Drive near the fuel farm and planned Route 234 connector which is ―isolated‖ to some
extent by the Cannon Branch flood plain and the alignment of the Prince William County
Service Authority‗s Area 6 Interceptor sewer easement/corridor. A second study area is
the ±20 acre property northwest of the intersection of Observation Road and Piper Lane
adjacent to the Virginia Railway Express (VRE) station.
Long-term Development of Vacant Land: Development alternatives will be examined to
optimize the remaining available land within airport property. The uses and general
configuration of proposed development, as described on the 1990 ALP, will be
re-evaluated for its ability to meet the updated facility requirements.
MANASSAS REGIONAL AIRPORT
AIRPORT LAYOUT PLAN UPDATE REPORT
MANASSAS REGIONAL AIRPORT
OCTOBER 2002
4
Airport Access: The new airport access connection with the Route 234 Bypass will
change surface transportation patterns and could result in additional commuters using
airport owned/maintained roads to access the VRE station in the northwest quadrant of
the airport. The results of a surface traffic study will be included in the report.
Taxiway Improvements: Based on the updated facility requirements, the ALP will identify
necessary taxiway system improvements to support the development plans.
Feasibility of Potential Commercial Service: Facility and operational improvements
required to meet requirements of FAR Part 139 will be examined and briefly evaluated for
potential feasibility and cost vs. benefits.
Tower Location: A cursory review of the existing tower location and height will be
examined to identify any line-of-sight considerations affecting the recommended
development plans and any proposed extension of Runway 16L-34R.
1.2 HISTORY OF MANASSAS REGIONAL AIRPORT
Manassas Regional Airport was originally constructed in 1928 on 98-acres of land which has
subsequently been developed as the Manaport Plaza Shopping Center on Route 234 (Sudley Road).
The original facility consisted of two intersecting turf runways approximately 2,000-feet in length. The
land was purchased by a group of prominent local businessmen and citizens who saw a need for an
airport in the vicinity of Manassas. With urban growth pressures, primarily residential and commercial
uses encroaching upon the airport, the town realized that the 1928 site could no longer support the
airport. After 34 years of continuous service at the original site, Manassas Airport was relocated in
1964 to a 268-acre site at its present location. Mayor Harry P. Davis, whom the airport was named
after, was an ardent supporter of the original airport site and was instrumental in the purchase of the
land for the original and relocated airport sites. Mr. Davis was the mayor of Manassas for over 40
years, serving from 1921-1967 and always believed that the airport would make Manassas more than
a bedroom community of the Washington, D.C. area.
Initial airport construction on the new site consisted of a 3,700-foot runway, stub taxiway, and a
150-foot by 300-foot apron. The construction of initial airport facilities was completed in October 1964
(FAA Project No. 9-44-015-D301). An early photograph of the 1964 facility is included in the
appendix. The following is a list of some of the major items of development that have been
accomplished since 1964:
1964: 30 T-hangars, maintenance hangar, administration building and sewage
treatment facilities (sand filter)
1967: Parallel taxiway (FAA Project No. 9-44-015-D702)
1968: Apron extension (FAA Project No. 9-44-015-D803)
1972: Runway, stub taxiway and apron strengthening and apron extension
(ADAP Project No. 8-15-0030-01-71)
1974: Apron extension, parallel taxiway strengthening, high speed exits and an
additional land acquisition of 214 acres (ADAP Project 5-51-0030-02)
1975: Additional FBO storage hangar
1976: Apron and access road strengthening (ADA Project No. 5-51-0030-03)
1977: Apron expansion, taxiway strengthening and access road extension
MANASSAS REGIONAL AIRPORT
AIRPORT LAYOUT PLAN UPDATE REPORT
MANASSAS REGIONAL AIRPORT
OCTOBER 2002
5
(ADAP Project No. 5-51-0030-04)
1979: Apron expansion and taxiway signage (ADAP Project No. 5-51-0030-05)
1979: Parallel (4,000-foot by 100-foot) runway 16L-34R and taxiway
construction (ADAP Project No. 5-51-0030-06)
1980: 30 T-hangar units (West Complex)
1981: Perimeter access road and an additional land acquisition of 20-acres
(ADAP Project No. 5-51-0030-08)
1981: Instrument landing system - Runway 16L
1982: 1,700-foot extension to Runway 16L-34R and taxiway, east apron
strengthening and additional land acquisition of 188-acres (AIP 3-51-0030-01/02)
1984: New airport entrance road - Wakeman Drive (AIP 3-51-0030-03)
1985: Public water and sewer utilities for East Complex area
1986: Rehabilitate north apron - West Complex (AIP 3-51-0030-04)
1987: East Complex common taxiway (AIP 3-51-0030-05)
1988: Expand East Complex apron (AIP 3-51-0030-06)
1988: East Complex t-hangars (53 units) East Complex storage hangars (3)
1989: Update Airport Master Plan and Part 150 Noise Study (AIP 3-51-0030-07)
1990: East Complex taxiway extension and East and West Complex access
road extension (AIP 3-51-0030-08).
1992: Air Traffic Control Tower (Purchased/Relocated from Colorado)
1992 Initial Construction-Central Fuel Storage Facility (DOAV Grant Funds)
1992: East Complex FBO Common Taxiway (AIP 3-51-0030-08)
1993: West Apron Rehabilitation (AIP 3-51-0030-09)
1993: Lighting and Beacon Improvements (AIP 3-51-0030-011)
1993: Property acquisition for Approach Protection (AIP 3-51-0030-012)
1995: Business/General Aviation Passenger Terminal Complex (DOAV Grant
Funds)
1996: East Apron Tie-Downs
1996: Part 150 property acquisition (AIP 3-51-0030-013)
1997: Part 150 property acquisition (AIP 3-51-0030-014)
1997: New airfield electrical vault, Runway 16L PAPI, Segmented Circle (AIP
3-51-0030-015)
1998: Corporate Hangar Development - East Complex
2000: Runway 16L-34R Reconstruction (AIP 3-51-0030-016)
2000: Taxiway Alpha Rehabilitation (AIP 3-51-0030-017)
2000: Southwest T-Hangar Development
2000: Acquire Part 150 Property (AIP 3-51-0030-018)
Manassas Regional Airport represents a tremendous investment of capital for the region and the
returns on this investment are not only seen in the revenue generated from the airport itself, but also
by the businesses that are attracted to the Manassas area and the economic benefits that they bring
to the city through tax revenue and
local employment. The history of careful and thoughtful improvements at the airport has also
demonstrated a level of sensitivity toward surrounding communities and has promoted the overall
MANASSAS REGIONAL AIRPORT
AIRPORT LAYOUT PLAN UPDATE REPORT
MANASSAS REGIONAL AIRPORT
OCTOBER 2002
6
safety of the traveling public in the air and on the ground.
Figure 1.2 - Existing Airfield
MANASSAS REGIONAL AIRPORT
AIRPORT LAYOUT PLAN UPDATE REPORT
MANASSAS REGIONAL AIRPORT
OCTOBER 2002
7
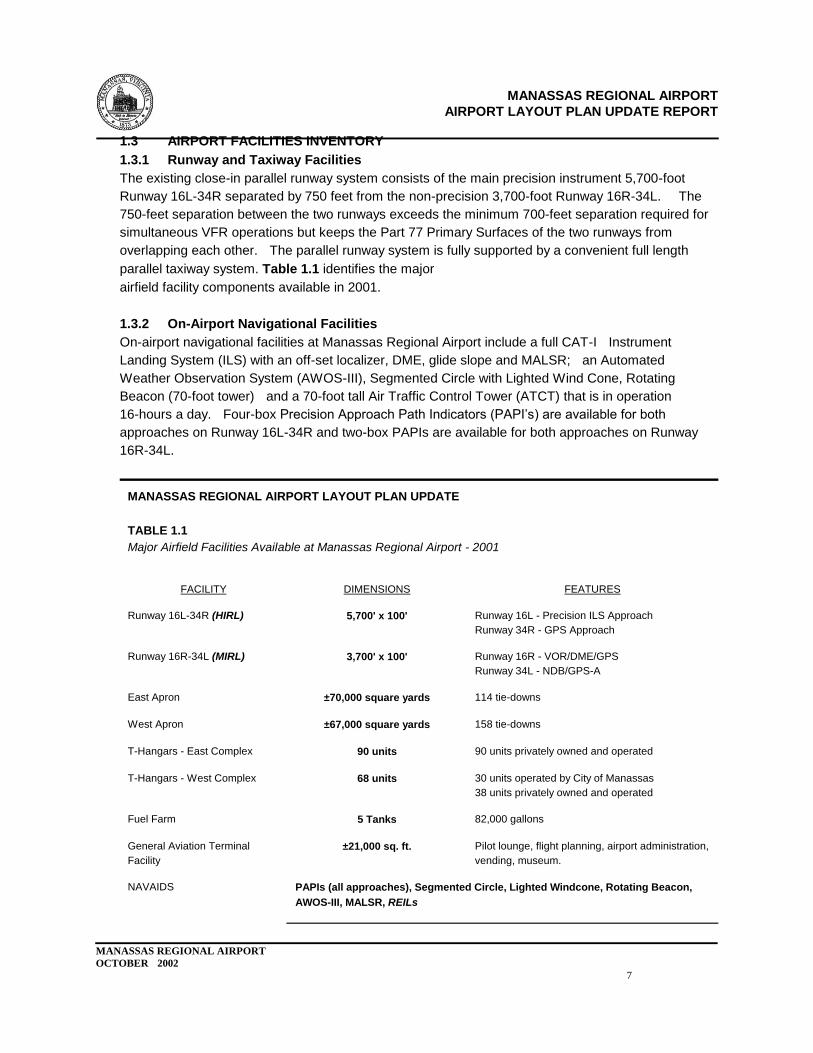
1.3 AIRPORT FACILITIES INVENTORY
1.3.1 Runway and Taxiway Facilities
The existing close-in parallel runway system consists of the main precision instrument 5,700-foot
Runway 16L-34R separated by 750 feet from the non-precision 3,700-foot Runway 16R-34L. The
750-feet separation between the two runways exceeds the minimum 700-feet separation required for
simultaneous VFR operations but keeps the Part 77 Primary Surfaces of the two runways from
overlapping each other. The parallel runway system is fully supported by a convenient full length
parallel taxiway system. Table 1.1 identifies the major
airfield facility components available in 2001.
1.3.2 On-Airport Navigational Facilities
On-airport navigational facilities at Manassas Regional Airport include a full CAT-I Instrument
Landing System (ILS) with an off-set localizer, DME, glide slope and MALSR; an Automated
Weather Observation System (AWOS-III), Segmented Circle with Lighted Wind Cone, Rotating
Beacon (70-foot tower) and a 70-foot tall Air Traffic Control Tower (ATCT) that is in operation
16-hours a day. Four-box Precision Approach Path Indicators (PAPI‘s) are available for both
approaches on Runway 16L-34R and two-box PAPIs are available for both approaches on Runway
16R-34L.
MANASSAS REGIONAL AIRPORT LAYOUT PLAN UPDATE
TABLE 1.1
Major Airfield Facilities Available at Manassas Regional Airport - 2001
FACILITY
DIMENSIONS
FEATURES
Runway 16L-34R (HIRL)
5,700' x 100'
Runway 16L - Precision ILS Approach
Runway 34R - GPS Approach
Runway 16R-34L (MIRL)
3,700' x 100'
Runway 16R - VOR/DME/GPS
Runway 34L - NDB/GPS-A
East Apron
±70,000 square yards
114 tie-downs
West Apron
±67,000 square yards
158 tie-downs
T-Hangars - East Complex
90 units
90 units privately owned and operated
T-Hangars - West Complex
68 units
30 units operated by City of Manassas
38 units privately owned and operated
Fuel Farm
5 Tanks
82,000 gallons
General Aviation Terminal
Facility
±21,000 sq. ft.
Pilot lounge, flight planning, airport administration,
vending, museum.
NAVAIDS
PAPIs (all approaches), Segmented Circle, Lighted Windcone, Rotating Beacon,
AWOS-III, MALSR, REILs
MANASSAS REGIONAL AIRPORT
AIRPORT LAYOUT PLAN UPDATE REPORT
MANASSAS REGIONAL AIRPORT
OCTOBER 2002
8
Air Traffic Control Tower Relocated from Centennial Airport, Colorado
Source:
Manassas Regional Airport 2002
1.3.3 Landside Facilities
Landside facilities at the airport include the traditional mixture of t-hangar and larger group storage
and corporate hangars (see Figure 1.2). Approximately 158 individual t-hangar units located in 12
buildings are distributed relatively evenly between the East (7 Bldgs- 90-units) and West (5
Bldgs-68-units) Complexes. The t-hangar units are generally large enough to house most of the
single-engine Group I (wingspans less than 49-foot) aircraft. Ownership of the t-hangars is
predominantly through condominium management (T-Hangars of Virginia and Airframe Hangars, Inc)
with the airport owning two hangar buildings with 30-units located within the West Complex.
Approximately 200,000 square feet of large hangar space exists in (12) large group storage and
corporate hangar facilities ranging in size from 10,000 to 28,000 square feet (Aerographics) located
within leased areas on the East (±145,000-square feet in nine buildings) and West (±50,000-square
feet in three buildings) Complexes.
Approximately 272 apron tie-down positions are available at Manassas Regional Airport with the West
Complex having a majority of the available tie-downs (158). Tie-downs located in the West Complex
are accommodated in two aprons; the west apron, located in front of Dulles Aviation, and the
southwest apron, located south of the ATCT. The remaining 114 tie-downs available are located in
the East Apron.
A two-story terminal/administration building was constructed in 1995 on the East Complex. A public
lobby area, flight planning area, vending and pilot lounge are all provided for on the first floor of the
terminal facility. Airport administration offices and conference room are provided on the second floor
of the terminal facility. Leased space is provided on the first floor only. In addition to the facilities
necessary for operation of the airport, the first floor of the terminal building is temporarily housing the
Freedom Museum until a more permanent location can be developed.
1.3.4 Fuel Storage Facilities
The central fuel storage complex was originally constructed in 1992 at its present site as a
replacement for underground storage tanks that were removed in order to comply with EPA
requirements (see Figure 1.2) The facilities consist of five (5) above ground storage tanks which were
constructed and are owned/leased by the FBO‘s who have fueling lease rights (i.e., Dulles Aviation,
Falconhead/Jet Services and Geneva Aviation). Three Jet A tanks have a total capacity of 52,000
gallons while two (2) AvGas 100LL tanks have a total capacity of 30,000 gallons. Into-plane aircraft
fueling is a service provided by the authorized FBOs using their own fuel tenders.
1.3.5 Helicopter Facilities
Several marked landing spots and pads are designated as helicopter landing areas by the ATCT;
however, no separate rotor-wing FBO and/or helicopter storage facilities are located on the airport.
MANASSAS REGIONAL AIRPORT
AIRPORT LAYOUT PLAN UPDATE REPORT
MANASSAS REGIONAL AIRPORT
OCTOBER 2002
9
Helicopters are occasionally stored with fixed wing aircraft in some of the other group hangars. The
single helicopter landing pad located near the south end of the t-hangar area on the East Complex is
primarily used by the Virginia State Police and other governmental helicopter activities. A second
stand alone helicopter landing facility is located just south of the East Apron.
1.4 EXISTING AIRPORT ACTIVITY
An integral part in determining any future needs in airport facilities is an understanding of historical
trends at the airport. Traditional measures of historical airport activity are based aircraft and levels
of aircraft operations.
1.4.1 Based Aircraft
According to airport administration, there are 343 aircraft permanently based at the airport on
tie-down aprons or in hangars as of August 2001. When compared to the first recorded based
aircraft count of 61 in 1964, the net increase to date represents a very impressive annualized growth
rate of 4.8-percent over the 37 year history of the airport at its present site. This overall growth rate is
however somewhat misleading when you consider the fact that since reaching a reported peak of 445
based aircraft in 1995, the based aircraft population has actually declined by more than 100 aircraft
during the last five years (See Table 1.2). A possible explanation for this is that record keeping may
have been suspect prior to the establishment of the ATCT.
Even with the most robust national economy and the traditionally stronger Northern Virginia economy,
it was nearly impossible to expect the double digit annual growth rate from 1964 to 1995 to continue
unimpeded. The
MANASSAS REGIONAL AIRPORT LAYOUT PLAN UPDATE
TABLE 1.2
Historical Based Aircraft Population at Manassas Regional Airport
YEAR
REPORTED POPULATION
GROWTH INDEX
1964
61
1.00
1970
160
2.62
1980
216
3.54
1990
400
6.56
1995
445
7.30
19991
369
6.05
20002
315
5.16
MANASSAS REGIONAL AIRPORT
AIRPORT LAYOUT PLAN UPDATE REPORT
MANASSAS REGIONAL AIRPORT
OCTOBER 2002
10
20013
343
5.62
Annualized Rate of Growth
(1964-2001)
4.78%
Sources:
1990 Manassas Municipal Airport Master Plan 1 2001 Federal Aviation Administration Terminal Area Forecast 2 VATSP 2001 Update 3 Manassas Regional Airport
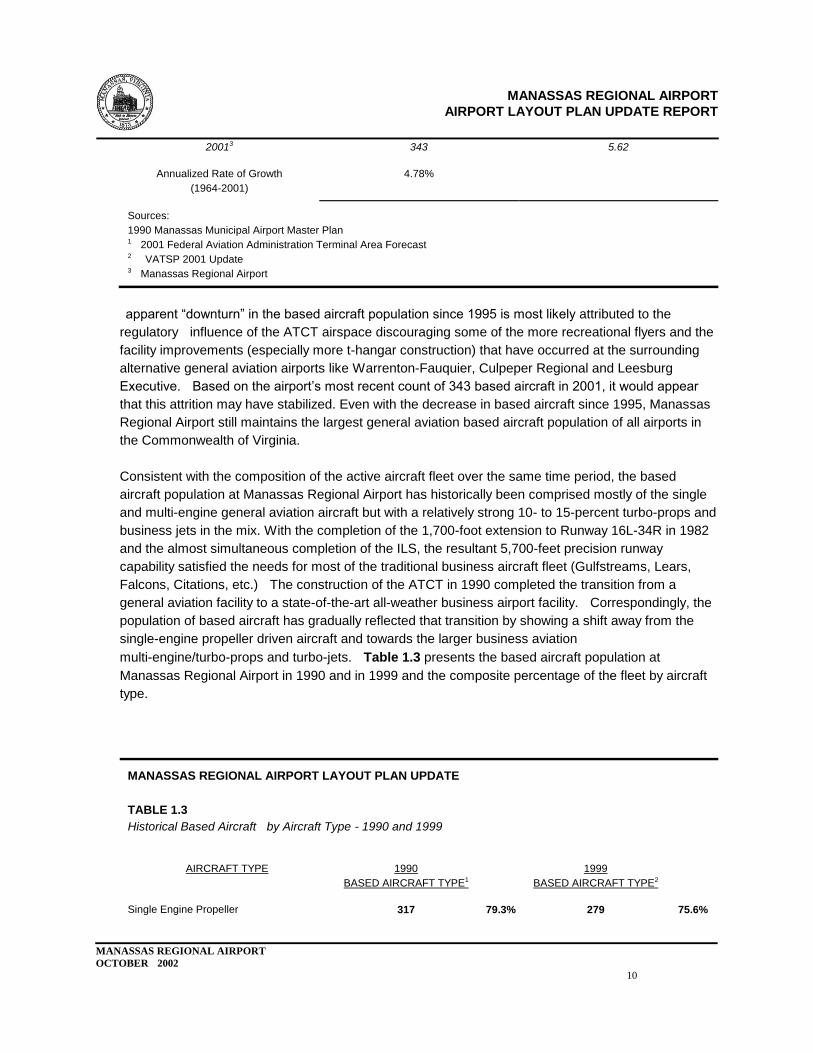
apparent ―downturn‖ in the based aircraft population since 1995 is most likely attributed to the
regulatory influence of the ATCT airspace discouraging some of the more recreational flyers and the
facility improvements (especially more t-hangar construction) that have occurred at the surrounding
alternative general aviation airports like Warrenton-Fauquier, Culpeper Regional and Leesburg
Executive. Based on the airport‘s most recent count of 343 based aircraft in 2001, it would appear
that this attrition may have stabilized. Even with the decrease in based aircraft since 1995, Manassas
Regional Airport still maintains the largest general aviation based aircraft population of all airports in
the Commonwealth of Virginia.
Consistent with the composition of the active aircraft fleet over the same time period, the based
aircraft population at Manassas Regional Airport has historically been comprised mostly of the single
and multi-engine general aviation aircraft but with a relatively strong 10- to 15-percent turbo-props and
business jets in the mix. With the completion of the 1,700-foot extension to Runway 16L-34R in 1982
and the almost simultaneous completion of the ILS, the resultant 5,700-feet precision runway
capability satisfied the needs for most of the traditional business aircraft fleet (Gulfstreams, Lears,
Falcons, Citations, etc.) The construction of the ATCT in 1990 completed the transition from a
general aviation facility to a state-of-the-art all-weather business airport facility. Correspondingly, the
population of based aircraft has gradually reflected that transition by showing a shift away from the
single-engine propeller driven aircraft and towards the larger business aviation
multi-engine/turbo-props and turbo-jets. Table 1.3 presents the based aircraft population at
Manassas Regional Airport in 1990 and in 1999 and the composite percentage of the fleet by aircraft
type.
MANASSAS REGIONAL AIRPORT LAYOUT PLAN UPDATE
TABLE 1.3
Historical Based Aircraft by Aircraft Type - 1990 and 1999
AIRCRAFT TYPE
1990
BASED AIRCRAFT TYPE1
1999
BASED AIRCRAFT TYPE2
Single Engine Propeller
317
79.3%
279
75.6%
MANASSAS REGIONAL AIRPORT
AIRPORT LAYOUT PLAN UPDATE REPORT
MANASSAS REGIONAL AIRPORT
OCTOBER 2002
11
Multi-Engine Propeller
& Turbo-Prop3
60 15.0% 56 15.2%
Turbo-Jet
12
3.0%
15
4.1%
Helicopters/Others
11
2.8%
19
5.1%
TOTAL
400
100%
369
100%
Sources: 1 1990 Manassas Municipal Airport Master Plan 2 2001 Federal Aviation Administration Terminal Area Forecast 3 FAA 5010 does not distinguish between multi-engine and turbo-prop aircraft.
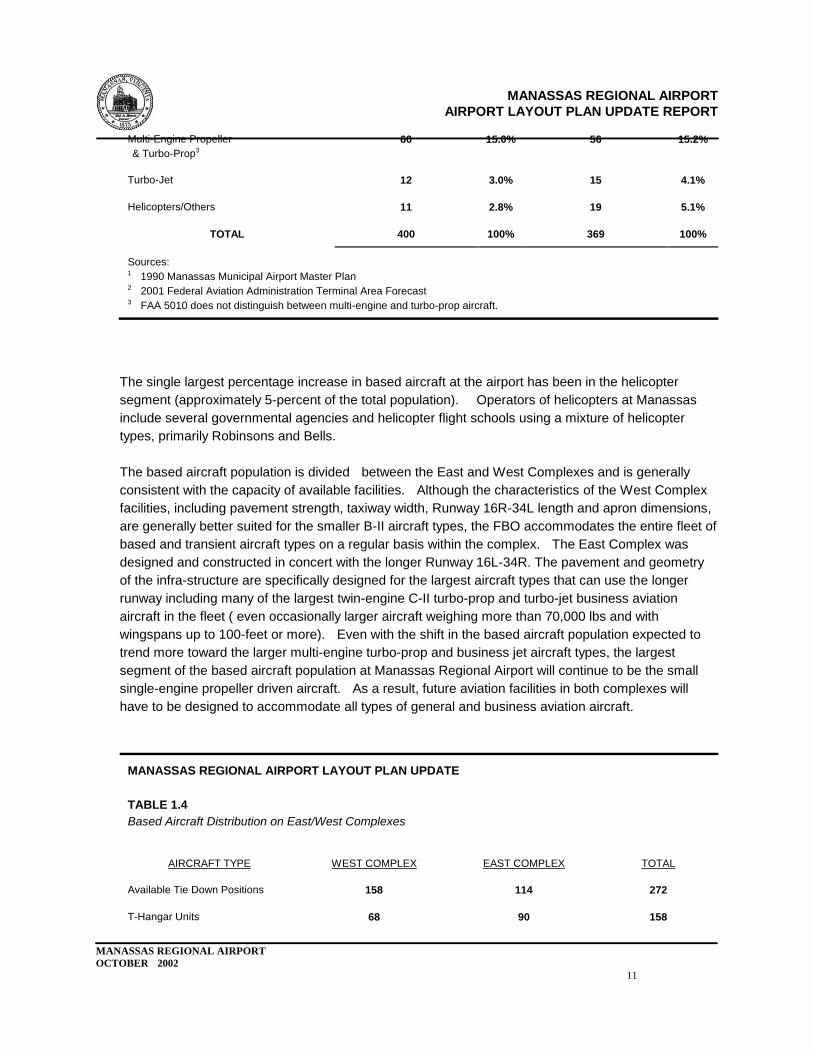
The single largest percentage increase in based aircraft at the airport has been in the helicopter
segment (approximately 5-percent of the total population). Operators of helicopters at Manassas
include several governmental agencies and helicopter flight schools using a mixture of helicopter
types, primarily Robinsons and Bells.
The based aircraft population is divided between the East and West Complexes and is generally
consistent with the capacity of available facilities. Although the characteristics of the West Complex
facilities, including pavement strength, taxiway width, Runway 16R-34L length and apron dimensions,
are generally better suited for the smaller B-II aircraft types, the FBO accommodates the entire fleet of
based and transient aircraft types on a regular basis within the complex. The East Complex was
designed and constructed in concert with the longer Runway 16L-34R. The pavement and geometry
of the infra-structure are specifically designed for the largest aircraft types that can use the longer
runway including many of the largest twin-engine C-II turbo-prop and turbo-jet business aviation
aircraft in the fleet ( even occasionally larger aircraft weighing more than 70,000 lbs and with
wingspans up to 100-feet or more). Even with the shift in the based aircraft population expected to
trend more toward the larger multi-engine turbo-prop and business jet aircraft types, the largest
segment of the based aircraft population at Manassas Regional Airport will continue to be the small
single-engine propeller driven aircraft. As a result, future aviation facilities in both complexes will
have to be designed to accommodate all types of general and business aviation aircraft.
MANASSAS REGIONAL AIRPORT LAYOUT PLAN UPDATE
TABLE 1.4
Based Aircraft Distribution on East/West Complexes
AIRCRAFT TYPE
WEST COMPLEX
EAST COMPLEX
TOTAL
Available Tie Down Positions
158
114
272
T-Hangar Units
68
90
158
MANASSAS REGIONAL AIRPORT
AIRPORT LAYOUT PLAN UPDATE REPORT
MANASSAS REGIONAL AIRPORT
OCTOBER 2002
12
Conventional Hangar Capacity
50,000
(16 A/C)
148,000
(50 A/C)
198,000
(66 A/C)
Total Based Aircraft Capacity
242
250
496
Total Based Aircraft (2001)
189
154
343
Positions Available for
Transient Aircraft
53
96
153
Source:
Manassas Regional Airport
Note: Split of based aircraft estimated by airport management
1.4.2 Aircraft Operations
An aircraft operation is defined as either an aircraft takeoff or landing. A ―touch and go‖ is reported as
two operations. The Air Traffic Control Tower maintains an accurate and reliable count of all aircraft
operations. However, prior to the ATCT becoming operational in 1990, determining the actual
volume of aircraft activity at the airport proved to be difficult as no formal mechanism existed at the
airport to count aircraft operations. Typically, planning documents had to rely on an extrapolation
of one or two week traffic counts that may have been observed at various times during the census
year and may not have accounted for yearly variations in activity levels. As a result, historical aircraft
operations reported for the airport show a rather large variation in operation levels. This large
variation may be attributable to a significant level of flight training and other local operations which are
dependent upon weather conditions and subsequently may or may not have been counted in the
two-week observations. Table 1.5 presents the reported historical operational activity at Manassas
Regional Airport since it relocated to its present site in 1964.
Dividing the number of operations in a certain year by the number of based aircraft in that same year
results in what is referred to as the ―operations per based aircraft‖ or OPBA. The number of
operations per based aircraft
MANASSAS REGIONAL AIRPORT LAYOUT PLAN UPDATE
TABLE 1.5
Historical Annual Operations at Manassas Regional Airport
YEAR
REPORTED ANNUAL OPERATIONS
GROWTH INDEX
19641
40,000
1.00
19721
121,500
3.04
19802
106,000
2.65
MANASSAS REGIONAL AIRPORT
AIRPORT LAYOUT PLAN UPDATE REPORT
MANASSAS REGIONAL AIRPORT
OCTOBER 2002
13
19903
146,800
3.67
19953
136,353
3.41
19993
119,007
2.98
20004
136,650
3.42
2001
139,709
3.49
Annualized Rate of Growth
(1964-2001)
3.44%
Sources: 1 1973 Airport Master Plan 2 1986 Federal Aviation Administration Terminal Area Forecast 3 2001 Federal Aviation Administration Terminal Area Forecast 4 FAA ATCT Airport Traffic Record.
Note:
For 2001 operations, percent change between Jan-Aug 2001 and Jan.-Aug 2000 was applied to reported Sept.-Dec. 2000
activity levels to determine predicted Sept. - Dec. 2001 activity levels which were then added back to YTD 2001 activity.
at the airport in 1990 was 369 which increased to 434 operations per based aircraft in 2000. The
OPBA is an accepted planning tool to forecasting aircraft operations and will be used in the Forecast
of Aviation Demand in this Airport Layout Plan Update Report.
1.4.3 Existing Peaking Conditions
Peaking characteristics at an airport are typically measured in three ways: peak month, average day
of the peak month (ADPM) and peak-hour of the average-day. FAA Advisory Circular 150/5060-5
―Airport Capacity and Delay‖ provides guidance in establishing these peaking characteristics.
Generally, the peak days of activity would be clustered around the weekends which reflects the high
levels of flight training and local operations. Based on 2000 operations reported by the Federal
Aviation Administration Airport Traffic Record, the estimated average day of peak month activity in
2000 would have approximately 471 operations (annual demand/290). Average peak hour of activity
would be estimated at 52 operations (average daily demand/9).
1.4.4 Operations by Type of Aircraft
For this study, the Air Traffic Control Tower provided two weeks of ―tower strips‖ that were analyzed to
determine operations by type of aircraft. Based on the two-week observation period in July 2001, the
single-
MANASSAS REGIONAL AIRPORT LAYOUT PLAN UPDATE
TABLE 1.6
Historical Peaking Characteristics at Manassas Regional Airport
MANASSAS REGIONAL AIRPORT
AIRPORT LAYOUT PLAN UPDATE REPORT
MANASSAS REGIONAL AIRPORT
OCTOBER 2002
14
YEAR
ANNUAL
OPERATIONS
PEAK MONTH
ACTIVITY
AVERAGE DAILY
ACTIVITY
PEAK HOUR OF AVERAGE
DAILY ACTIVITY
19641
40,000
4,280
138
15
19721
121,000
12,947
417
46
19802
106,000
11,342
366
41
19903
146,800
15,708
506
56
19953
136,353
14,590
470
52
19993
119,007
12,734
410
46
20004
136,650
14,576
471
52
Sources: 1 1973 Airport Master Plan 2 1986 Federal Aviation Administration Terminal Area Forecast 3 2001 Federal Aviation Administration Terminal Area Forecast 4 Manassas Regional Airport
Note: July is the historical peak month of activity at the airport and generally represents 11-percent of total annual
operations.
engine propeller driven aircraft represented approximately 78.6-percent of total operations while
multi-engine aircraft represented approximately 6.8-percent. Turbo-prop and turbo-jet aircraft
represented approximately 4.2-percent of total operations, helicopter activity represented an additional
8.2-percent of total operations and ―other‖ (i.e., military, blimp activity, etc.) accounted for 2.2-percent.
Applying these percentages to 2000 total operations results in 107,000 single-engine operations in
2000, approximately 9,300 multi-engine operations, 5,700 turbo-prop and turbo-jet operations and
11,200 helicopter operations and 3,000 ―other‖ operations.
1.4.5 Observed Runway Usage
Runway utilization at the airport was determined from data collected from Air Traffic Control Tower
flight strips. These strips typically record the tail number (or ―N‖ number) of the aircraft, what runway
the aircraft utilized, and whether the aircraft was inbound or outbound.
Historically, the shorter west side Runway 16R-34L handles more activity than the longer east side
runway. The 1990 Master Plan Update reported that Runway 16R-34L accommodated 68-percent of
total operations. The patterns observed in July 2001 remain generally consistent (61% favored
Runway 16R-34L) with the earlier observations. This use pattern has usually been explained by the
fact the largest majority of the based aircraft population are the single and light twin engine aircraft
which can comfortably operate on the 3,700-foot length and perhaps prefer the west side runway
because most of these aircraft have historically been located in the West Complex.
The observed runway usage during this period indicated a slight preference (54% vs 46%) for
MANASSAS REGIONAL AIRPORT
AIRPORT LAYOUT PLAN UPDATE REPORT
MANASSAS REGIONAL AIRPORT
OCTOBER 2002
15
approaches from the north which is somewhat contrary to the historical data for prevailing wind
direction favoring a southerly approach during VFR conditions in the summer season. The two
weeks worth of ―unofficial‖ data should not be considered significant enough to draw any conclusions
that would dispute the ten years worth of NOAA wind observations to the contrary. The availability of
the ILS to Runway 16L for training and traffic management considerations by the ATCT during calm
wind periods (reported to account for more than 10% of the time) are just two obvious factors that can
certainly influence the data for this very short observation period.
1.4.6 Instrument Approaches
Manassas Regional Airport enjoys excellent instrument approach capability from the south and north.
Table 1.7 (Figures A.1 thru A.2 in Appendix A) identifies the ceiling and visibility minimums for each
of the instrument approaches. Despite the airport‘s proximity with the Dulles and Reagan National
airspace and the active area of restricted airspace (R6608) and associated MOA located only 5 miles
south of the airport, all four runway thresholds have at least one instrument approach available.
The approach from the south with the best visibility minimums is the GPS to Runway 34R and from
the north is the GPS approach to Runway 16L. While Runway 16L is equipped with a precision
instrument ILS approach with an offset localizer (with DME), glide slope antenna, outer marker
(located 6.4 nautical miles from the threshold to Runway 16L) and a medium intensity approach
lighting system with runway alignment identification lights (MALSR). This type of equipment is
approved for Category I Instrument Landing System approaches and would theoretically allow
MANASSAS REGIONAL AIRPORT LAYOUT PLAN UPDATE
TABLE 1.7
Published Approaches to Manassas Regional Airport (Elev. 192 M.S.L.)
APPROACH
APPROACH
TYPE
RUNWAY
ESTABLISHED MINIMUMS CEILING-VISIBILITY
(FEET (M.S.l.) -MILES)
ILS
Straight
16L
442-3/4
VOR/DME/GPS
Straight
16R
680-1
NDB/GPS-A
Circling
ALL
920-1
GPS
Straight
16L
640-1/2
GPS
Straight
34R
620-1
Sources:
U.S. Department of Commerce, National Oceanic and Atmospheric Administration
U.S. Terminal Procedures, 25 January 2001
minimums down to ½-mile visibility and 200-feet height above threshold (HAT). However, the
―penalty‖ associated with the off-set localizer and apparent course roughness associated with the
relatively old localizer equipment prevents the airport from achieving the best minimums possible.
MANASSAS REGIONAL AIRPORT
AIRPORT LAYOUT PLAN UPDATE REPORT
MANASSAS REGIONAL AIRPORT
OCTOBER 2002
16
Periodic maintenance performed by FAA Airways and Facilities could remove the course roughness
and provide the ILS approach with a ½ mile visibility minimum, however, the 250-foot HAT minimum
would stay in effect until the localizer could be placed on centerline.
1.4.7 Instrument Operations
Instrument operations can occur either during instrument meteorological conditions (IMC) or visual
meteorological conditions (VMC). The ATCT traffic records for 2000 indicate that approximately
10-percent of all operations were instrument operations (13,400 instrument operations). It should be
noted that this observation is very consistent with the local weather patterns which indicate that
instrument meteorological conditions also occur approximately 10-percent of the time. The peak
month of instrument operations in 2000 was July with 1,476 instrument operations, however,
instrument operations accounted for the largest percentage of monthly operations in April
(11.4-percent of total monthly operations). Reduced visibility in July and prolonged periods of rain in
April tend to result in these months having a higher amount of IMC weather.
1.4.8 Military Operations
Military operations at Manassas Regional Airport have historically represented less than 1-percent of
total operations. According to the ATCT, this trend continued in 2000 with a total of 377 operations
(less than one half of one percent). Typical military operations by small fixed-wing and helicopter
military aircraft included flight training and local mission support activities.
1.5 SCHEDULED AND NON-SCHEDULED COMMERCIAL SERVICE
1.5.1 Scheduled Service
No scheduled commercial service operates through Manassas Regional Airport. Commercial service
(i.e., using small 15 to 30 seat turbo-prop aircraft) was provided by Colgan Airlines from 1971 until it
was discontinued in 1986. Colgan Airways (now operating Beach 1900 and Saab 340s through a
code sharing agreement as U.S. Airways Express) does maintain a 15,000 square foot corporate
headquarters and maintenance facility on the airport.
1.5.2 Non-Scheduled Service
Part 135 charter operations originate from both the East and West Complexes and utilize a wide
variety of business aviation aircraft. Approximately 2,500 Part 135 charter operations representing
about 1.8-percent of the total annual operations were reported for 2000. Monthly activity ranged from
a low of 148 operations in August to a peak of 303 operations in November 2000.
1.6 WEATHER AND WIND ROSE DATA
1.6.1 General
The nearest official National Oceanic and Atmospheric Administration (NOAA) weather recording
station is located at Dulles International Airport approximately 15 air miles north of Manassas Regional
Airport. A total of 82,805 observations of wind speed and direction were collected from 1991 to 2000
in four ceiling and visibility classes. Although weather conditions at Dulles International Airport can
MANASSAS REGIONAL AIRPORT
AIRPORT LAYOUT PLAN UPDATE REPORT
MANASSAS REGIONAL AIRPORT
OCTOBER 2002
17
be different from weather conditions at Manassas Regional Airport at any given point in time (i.e.,
microclimate conditions), the wind and other climatological data collected at the Dulles weather
reporting station is generally assumed to represent reliable data for the analysis of average weather
conditions for the region including conditions at Manassas Regional Airport. While Manassas
Regional Airport does have an Automated Weather Observation Station (AWOS) Level III located in
the midfield, historical weather information was not available for this analysis.
1.6.2 Local Climate
Manassas Regional Airport is located in the Virginia Piedmont approximately 25-miles to the east of
the Blue Ridge Mountains and 15-miles east of the Bull Run Mountains. The established airport
elevation at Manassas Regional Airport is 192-feet above sea level. The terrain in the immediate
proximity of the airport is mostly level with approximately half of the airport property lying in the
100-year flood plain for Broad Run. The proximity of Broad Run does result in the frequent
formation of localized ground level fog.
The location of Manassas Regional Airport in the middle latitudes facilitates a weather pattern that is
characterized by four distinct seasons. The average daily maximum temperature of the hottest
month in 2001 was 87-degrees Fahrenheit (July) while the average daily minimum temperature of the
coldest month (January) was 21-degrees Fahrenheit. Springs and Falls are characterized by cool
mornings (averaging 42-degrees for nighttime lows) and warm days (averaging 66-degrees for
daytime highs). Precipitation is distributed rather evenly throughout the year with the wettest months
occurring in the Summer with an average of 3.7-inches of rain each month. The total annual average
precipitation for any given year in the Manassas area is 40.2-inches comprised of 17.4-inches of rain
and 22.8-inches of snowfall. On average, the region experiences either cloudy or partly cloudy days
273 days out of the year. Prevailing winds are from the south except during the cold winter months
when a north wind is predominant.
1.6.3 Wind Rose Analysis
Wind roses were evaluated for four ceiling and visibility categories corresponding to weather
conditions requiring visual flight rules (VFR), non-precision instrument flight rules (IFR) and precision
instrument flight rules (IFR) for aircraft activity at Manassas Regional Airport. The type and direction
of any approach to the airport is dependent upon the prevailing wind, ceiling and visibility conditions at
the time of the approach. Minimum ceiling and visibility conditions have been established for each
VFR and IFR approach into the airport based on available navigation aids, airspace and local terrain
considerations (see Figure A.1-A.5 and Section 1.4.6). The wind data used for the analysis has been
collected and categorized into the four classes defined by the ceiling-visibility criteria presented in
Table 1.8. VFR conditions exist 90.3-percent of the time which means that IFR conditions occur
approximately 35 days out of the year (see Figures 1.3-1.4).
1.6.4 Crosswind Coverage
Wind conditions affect all airplanes in varying degrees, generally, the smaller the aircraft, the greater
the effect of wind velocity and the corresponding crosswind component (the resulting vector that acts
at a 90-degree angle to the path of flight). With this in mind, the FAA has established allowable
MANASSAS REGIONAL AIRPORT
AIRPORT LAYOUT PLAN UPDATE REPORT
MANASSAS REGIONAL AIRPORT
OCTOBER 2002
18
crosswind components based on aircraft type. Ideally, the primary runway at an airport should
provide 95-percent wind coverage in all weather conditions. Based on this information and the
climatological data obtained from the National Climatic Data Center in Asheville, North Carolina, the
wind analysis for Manassas Regional Airport is summarized in Table 1.9. Based on the wind rose
analysis, Manassas Regional Airport has adequate crosswind coverage for all crosswind components
and in all types of weather conditions.
MANASSAS REGIONAL AIRPORT LAYOUT PLAN UPDATE
TABLE 1.8
Recorded Weather Observations by NOAA Weather Classification: 1991 to 2000 Dulles International Airport
Weather Reporting Station
WEATHER
CLASS
CRITERIA
RECORDED
OBSERVATIONS
%
OCCURRENCE
All Weather
All ceiling and visibility weather conditions
82,805
100.00%
VFR
Ceiling 1,000' and visibility 3 miles
74,830
90.37%
Non-Precision
IFR
Ceiling 200' and <1000 feet
and
Visibility ½ mile and <3 miles
7,226
8.73%
Precision IFR
Ceiling <200' and/or visibility <½ mile
735
0.89%
Sources:
NOAA
Airman‘s Information Manual (FAR-AIM 2000)
Figure 1.3 Wind Rose #1
MANASSAS REGIONAL AIRPORT
AIRPORT LAYOUT PLAN UPDATE REPORT
MANASSAS REGIONAL AIRPORT
OCTOBER 2002
19
Figure 1.4 Wind Rose #2
MANASSAS REGIONAL AIRPORT
AIRPORT LAYOUT PLAN UPDATE REPORT
MANASSAS REGIONAL AIRPORT
OCTOBER 2002
20
MANASSAS REGIONAL AIRPORT LAYOUT PLAN UPDATE
TABLE 1.9
Runway 16L-34R and 16R-34L Crosswind Coverages
CROSSWIND
VFR
NON-PRECISION IFR
PRECISION IFR
ALL WEATHER
10.5 kt
96.8%
97.4%
98.8%
96.8%
13.0 kt
98.8%
98.6%
99.4%
98.8%
16.0 kt
99.7%
99.6%
99.7%
99.7%
20.0 kt
99.9%
99.9%
99.9%
99.9%
Source:
NOAA
1.7 AIRPORT SERVICE AREA AND ENVIRONMENT
1.7.1 Service Area
The airport service area for a general aviation airport is generally defined by a 30-minute drive time
around the facility. Likewise a commercial airport facility typically defines its service area by a
60-minute drive time. More detailed analyses can be performed to better define these areas when
necessary but it is reasonable to conclude that at least some portions of the service area for
Manassas Regional Airport overlap with the service areas for Dulles, Reagan National, Leesburg
Executive, Warrenton-Fauquier, Culpeper Regional and the recently opened Stafford Regional
Airport. And while a certain percentage of the potential users within the Manassas Airport Service
Area may choose to operate from one of the other facilities, the predominant service area for
Manassas Regional Airport will continue to be defined as the Manassas-Manassas Park-Prince
William County region.
1.7.2 Area Population, Income and Employment
Demographic data for the airport service area is presented in Tables 1.10 and 1.11. Historically,
the City of Manassas has enjoyed a relatively high rate of growth in population which continued in the
1990s with an annualized rate of growth of 2.3-percent. This rate of growth in population is less
than the rate of growth for Prince William County but is greater than the rate of growth for the
Commonwealth of Virginia which had annual rates of growth of 2.7-percent and 1.4-percent
respectively.
The region has also experienced a corresponding increase in the employment levels since 1990.
Table 1.11 presents the historical employment levels for the Commonwealth of Virginia, Prince
William County and the City of Manassas as well as a list of major employers in the City of Manassas.
Since 1990, the total number of employed persons in the Commonwealth of Virginia increased from
3.1 million to 3.6 million which is a 1.4-percent annualized rate of growth. Both Prince William County
and the City of Manassas have experienced a greater annualized growth rate than the
MANASSAS REGIONAL AIRPORT
AIRPORT LAYOUT PLAN UPDATE REPORT
MANASSAS REGIONAL AIRPORT
OCTOBER 2002
21
Commonwealth. Total employed persons in Prince William County increased from 114,900 to
142,900 (+2.2-percent annually) and in the City of Manassas from 16,000 to 20,900 (+2.7-percent
annually) over the same period.
MANASSAS REGIONAL AIRPORT LAYOUT PLAN UPDATE
TABLE 1.10
Population Trends for Virginia, Prince William County and City of Manassas: 1990-2000
Year
Virginia
Prince William
County
City of Manassas
City of Manassas Population
As Percentage of
PWC
As Percentage of
Virginia
1990
6,187,358
215,677
27,957
12.96%
0.45%
1991
6,283,853
223,457
29,000
12.98%
0.46%
1992
6,383,315
227,930
30,100
13.21%
0.47%
1993
6,464,795
235,766
30,900
13.11%
0.48%
1994
6,536,774
243,559
31,700
13.02%
0.48%
1995
6,601,392
249,968
32,000
12.80%
0.48%
1996
6,665,491
257,633
32,700
12.69%
0.49%
1997
6,732,878
265,664
33,600
12.65%
0.50%
1998
6,789,225
273,745
34,300
12.53%
0.51%
1999
6,872,912
282,060
34,800
12.34%
0.51%
2000
7,078,515
280,813
35,135
12.51%
0.50%
Annual Rate of
Growth
1.35%
2.67%
2.31%
Sources:
Weldon-Cooper Center for Public Service, University of Virginia, 2000 Virginia Statistical Abstract.
Prince William County, Virginia
City of Manassas, Virginia
MANASSAS REGIONAL AIRPORT
AIRPORT LAYOUT PLAN UPDATE REPORT
MANASSAS REGIONAL AIRPORT
OCTOBER 2002
22
MANASSAS REGIONAL AIRPORT LAYOUT PLAN UPDATE
TABLE 1.11
Employment Trends for Virginia, Prince William County and City of Manassas: 1990-2000
Year
Virginia
Prince William
County
City of
Manassas
Largest Employers
2000
Number of
Employees
1990
3,098,145
114,870
16,070
Lockheed Martin
2,000
1991
3,148,851
116,750
16,393
Dominion Semicond.
1,150
1992
3,180,803
118,640
16,797
Prince William Hosp.
1,000
1993
3,207,393
121,200
17,274
Annaburg Manor
330
1994
3,250,202
124,180
17,817
Giant Food
302
1995
3,325,234
126,531
18,147
Merchant‘s, Inc.
265
1996
3,241,326
124,259
17,810
Metro Technologies
175
1997
3,277,714
126,721
18,375
SWIFT
160
1998
3,386,333
132,239
19,176
Didlake, Inc.
115
1999
3,424,001
134,879
19,730
Battlefield Ford
106
2000
3,565,389
142,936
20,909
GTE
95
Annual Rate
of Growth
1.41%
2.21%
2.67%
5,698
Sources:
Virginia Employment Commission, Virginia‘s Electronic Labor Market Access (VELMA)
City of Manassas Community and Economic Development
Note: 2000 Employment figures are for October 2000 reporting period
1.7.3 Area Land Use
Although airport property is almost entirely contained within the City limits, the airport facility is
bordered by Prince William County on three sides. Subsequently, land use planning in the vicinity of
the airport is the responsibility of both the City of Manassas and Prince William County (see Figure
1.1).
The City has adopted an Airport Overlay District which provides guidelines to assure both land use
and Part 77 height compatibility for the surrounding land uses. Specifically, most of the City property in
the vicinity of the airport is planned for compatible light industrial (I-1) and general industrial (I-2)
land-uses. The single largest land-use in the vicinity of the airport is associated with the Gateway
Business Park located to the northeast of the airport.
MANASSAS REGIONAL AIRPORT
AIRPORT LAYOUT PLAN UPDATE REPORT
MANASSAS REGIONAL AIRPORT
OCTOBER 2002
23
Within Prince William County, a majority of the existing land-use surrounding the airport consists of
agricultural, residential and commercial uses. The commercial land-uses generally border State
Route 28 to the north of the airport with residential land-uses located to the east of the airport and
agricultural land uses located to the south and southwest of the airport. Similar to the City, the
County has established an Airport Safety Overlay District which assures both land use and Part 77
height compatibility for the surrounding land uses.
1.7.4 Local Environment
The local airport area environment can be characterized as a mixture of urban and rural. To the
north and east of the airport lies the urbanized and developed areas of the City of Manassas and
Prince William County while to the south and west of the airport is primarily undeveloped agricultural,
heavily forested and low density residential development. Although most of the nearest residential
development would be classified as relatively low density, residents in some of the subdivisions (i.e.,
Windy Hill, Moor Green, etc.) have voiced their concerns about airport noise.
The 850-acre airport site is located within the Potomac River Basin part of the larger protected
watershed for the Chesapeake Bay. Much of the immediate airport property is impacted by the Broad
Run flood plain and to a lesser extent the Cannon Branch flood plain. The Broad Run stream itself
travels south and east around and through the airport property until reaching the confluence with the
Occoquan River (about 5 miles downstream) and the Lake Jackson/Occoquan Reservoir area
(about 8 miles downstream) which is a major source of drinking water for many portions of Northern
Virginia. These environmental features and the attendant flood plain, wetland and water quality
considerations obviously influence facility planning and require all development at the airport to strictly
adhere to a rigid environmental approval process.
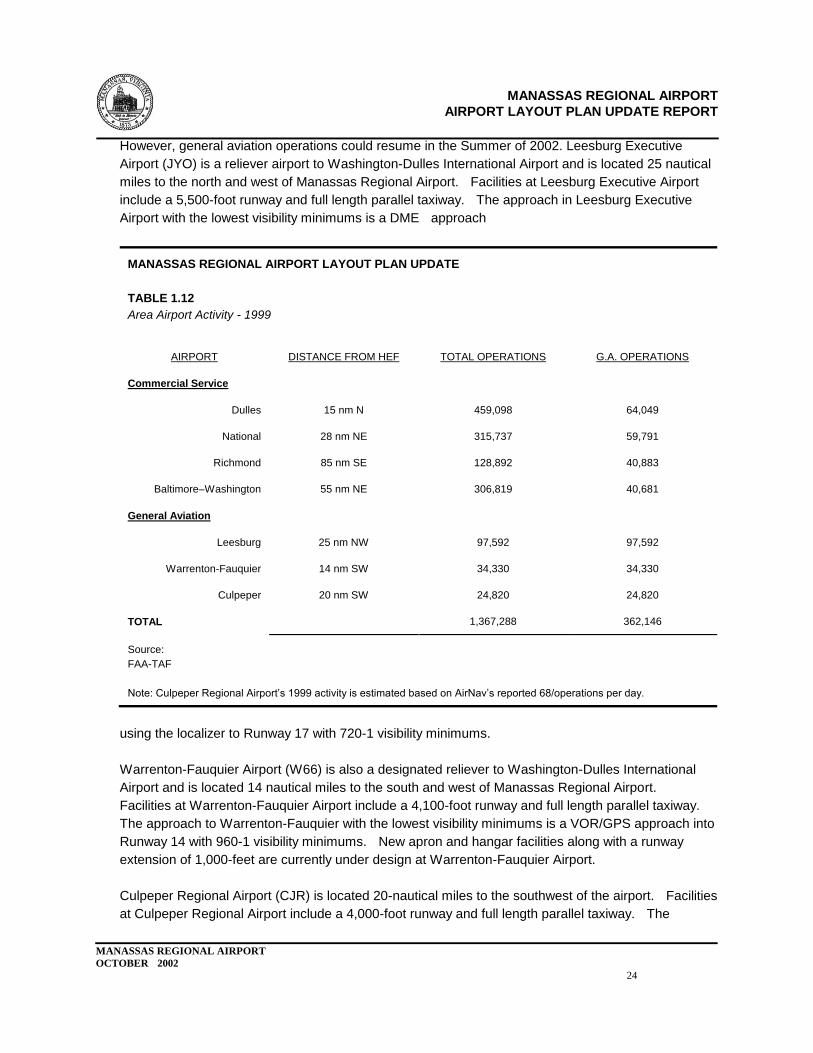
1.7.5 Area Airports
The Northern Virginia region has a variety of commercial service, general aviation and military
facilities that have some influence on the operations and to varying degrees overlap the service area
for Manassas Regional Airport. Recent activity levels for these airports are presented in Table
1.12.
Commercial service airports in the immediate vicinity of Manassas Regional Airport include two
large hub airports: Washington-Dulles International Airport (15 air miles north) and
Washington-Reagan National Airport (28 air miles northeast). Other commercial service airports in
the region include Baltimore-Washington International Airport (55 air miles to the north and east) and
Richmond International Airport (85 air miles to the south and east). In addition to scheduled
commercial service, all of these airports provide general aviation facilities.
General Aviation airports in the region include three NPIAS designated Reliever Airports to either
Washington-Dulles International (IAD) or Washington-Reagan National (DCA). It is important to note
that since September 11, 2001 all general aviation operations have been restricted at
Washington-Reagan National Airport. These restrictions have been set up to provide increased
security for governmental buildings and national security agencies located in Washington D.C.
MANASSAS REGIONAL AIRPORT
AIRPORT LAYOUT PLAN UPDATE REPORT
MANASSAS REGIONAL AIRPORT
OCTOBER 2002
24
However, general aviation operations could resume in the Summer of 2002. Leesburg Executive
Airport (JYO) is a reliever airport to Washington-Dulles International Airport and is located 25 nautical
miles to the north and west of Manassas Regional Airport. Facilities at Leesburg Executive Airport
include a 5,500-foot runway and full length parallel taxiway. The approach in Leesburg Executive
Airport with the lowest visibility minimums is a DME approach
MANASSAS REGIONAL AIRPORT LAYOUT PLAN UPDATE
TABLE 1.12
Area Airport Activity - 1999
AIRPORT
DISTANCE FROM HEF
TOTAL OPERATIONS
G.A. OPERATIONS
Commercial Service
Dulles
15 nm N
459,098
64,049
National
28 nm NE
315,737
59,791
Richmond
85 nm SE
128,892
40,883
Baltimore–Washington
55 nm NE
306,819
40,681
General Aviation
Leesburg
25 nm NW
97,592
97,592
Warrenton-Fauquier
14 nm SW
34,330
34,330
Culpeper
20 nm SW
24,820
24,820
TOTAL
1,367,288
362,146
Source:
FAA-TAF
Note: Culpeper Regional Airport‘s 1999 activity is estimated based on AirNav‘s reported 68/operations per day.
using the localizer to Runway 17 with 720-1 visibility minimums.
Warrenton-Fauquier Airport (W66) is also a designated reliever to Washington-Dulles International
Airport and is located 14 nautical miles to the south and west of Manassas Regional Airport.
Facilities at Warrenton-Fauquier Airport include a 4,100-foot runway and full length parallel taxiway.
The approach to Warrenton-Fauquier with the lowest visibility minimums is a VOR/GPS approach into
Runway 14 with 960-1 visibility minimums. New apron and hangar facilities along with a runway
extension of 1,000-feet are currently under design at Warrenton-Fauquier Airport.
Culpeper Regional Airport (CJR) is located 20-nautical miles to the southwest of the airport. Facilities
at Culpeper Regional Airport include a 4,000-foot runway and full length parallel taxiway. The
MANASSAS REGIONAL AIRPORT
AIRPORT LAYOUT PLAN UPDATE REPORT
MANASSAS REGIONAL AIRPORT
OCTOBER 2002
25
approach to Culpeper Regional Airport with the lowest visibility minimums is a VOR/DME RNAV or
GPS approach into Runway 22 with 820-1 visibility minimums. Similar to Warrenton-Fauquier
Airport, new apron, hangars and a 1,000-foot runway extension are under design at Culpeper
Regional Airport.
A third designated reliever airport in the vicinity of Manassas Regional Airport started operations on
December 13, 2001. The new Stafford Regional Airport is a designated reliever to
Washington-Reagan National Airport and is located 20-nautical miles to the south and east of
Manassas Regional Airport. Facilities at Stafford Regional Airport include a 5,000-foot runway (with
potential for a CAT-I ILS) with a full length parallel taxiway and an assortment of hangars and aircraft
tie-down facilities.
Military airfields in the vicinity of Manassas Regional Airport include Davidson Airfield (Ft. Belvoir)
located 15 air miles to the north and east of Manassas Regional Airport, Quantico Marine Corps Base
located 20 miles south and east, Andrews Air Force Base located 35 air miles to the east and
Patuxent River Naval Air Station located 60 miles to the south and east.
1.7.6 September 11, 2001
The events of September 11, 2001 and the subsequent national security decisions warrant
examination as operational decisions at airports in the region have had an impact on the future
demand for aviation facilities at Manassas Regional Airport. In the wake of the terrorist attacks on
the World Trade Center, the Pentagon and in Southwest Pennsylvania, the Federal Aviation
Administration, upon recommendation from the National Security Council, established a 25-mile
radius (subsequently reduced to 18-miles) around the DCA VOR that effectively represents a ―no fly
zone.‖ In addition to the 25-mile radius, all flights at Washington-Reagan National Airport (DCA)
were suspended (see Figure 1.5).
In the days following the terrorist attacks, operations at Manassas Regional Airport changed from
primarily single-engine operations to almost all multi-engine and turbo-jet operations as a result of the
FAA allowing only IFR operations and no VFR operations to occur in the United States. The result of
having only IFR operations at the airport was a 200-percent increase in IFR traffic over pre-September
11th levels. As many single-engine pilots are not instrument rated, they could not operate their aircraft
under the restrictions. Additionally, since Washington-Reagan National Airport was closed, many
corporate jets that were located at DCA relocated to Manassas Regional Airport and Leesburg
Executive Airport in the interim. When DCA was re-opened only to commercial activity, many of
these corporate jets faced the possibility of relocating to one of the other airports in the Northern
Virginia region.
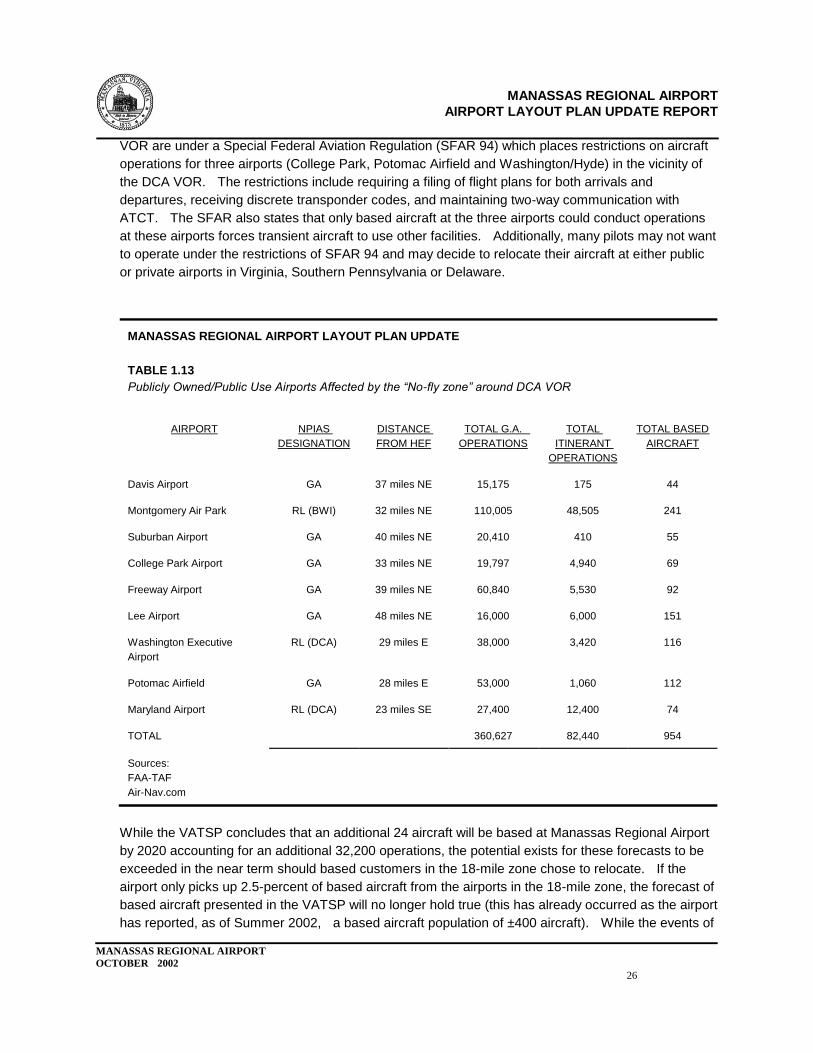
However, the potential impact to Manassas Regional Airport may not only be limited to corporate
aircraft. Within the 18-mile radius around the DCA VOR are approximately nine (9) publicly
owned/public use airports. The 1999 activity and based aircraft levels as reported in the FAA-TAF for
the publicly owned/public use airports is presented in Table 1.13.
The 18-mile ―no-fly zone‖ has subsequently been lifted, however operations in the vicinity of the DCA
MANASSAS REGIONAL AIRPORT
AIRPORT LAYOUT PLAN UPDATE REPORT
MANASSAS REGIONAL AIRPORT
OCTOBER 2002
26
VOR are under a Special Federal Aviation Regulation (SFAR 94) which places restrictions on aircraft
operations for three airports (College Park, Potomac Airfield and Washington/Hyde) in the vicinity of
the DCA VOR. The restrictions include requiring a filing of flight plans for both arrivals and
departures, receiving discrete transponder codes, and maintaining two-way communication with
ATCT. The SFAR also states that only based aircraft at the three airports could conduct operations
at these airports forces transient aircraft to use other facilities. Additionally, many pilots may not want
to operate under the restrictions of SFAR 94 and may decide to relocate their aircraft at either public
or private airports in Virginia, Southern Pennsylvania or Delaware.
MANASSAS REGIONAL AIRPORT LAYOUT PLAN UPDATE
TABLE 1.13
Publicly Owned/Public Use Airports Affected by the “No-fly zone” around DCA VOR
AIRPORT
NPIAS
DESIGNATION
DISTANCE
FROM HEF
TOTAL G.A.
OPERATIONS
TOTAL
ITINERANT
OPERATIONS
TOTAL BASED
AIRCRAFT
Davis Airport
GA
37 miles NE
15,175
175
44
Montgomery Air Park
RL (BWI)
32 miles NE
110,005
48,505
241
Suburban Airport
GA
40 miles NE
20,410
410
55
College Park Airport
GA
33 miles NE
19,797
4,940
69
Freeway Airport
GA
39 miles NE
60,840
5,530
92
Lee Airport
GA
48 miles NE
16,000
6,000
151
Washington Executive
Airport
RL (DCA)
29 miles E
38,000
3,420
116
Potomac Airfield
GA
28 miles E
53,000
1,060
112
Maryland Airport
RL (DCA)
23 miles SE
27,400
12,400
74
TOTAL
360,627
82,440
954
Sources:
FAA-TAF
Air-Nav.com
While the VATSP concludes that an additional 24 aircraft will be based at Manassas Regional Airport
by 2020 accounting for an additional 32,200 operations, the potential exists for these forecasts to be
exceeded in the near term should based customers in the 18-mile zone chose to relocate. If the
airport only picks up 2.5-percent of based aircraft from the airports in the 18-mile zone, the forecast of
based aircraft presented in the VATSP will no longer hold true (this has already occurred as the airport
has reported, as of Summer 2002, a based aircraft population of ±400 aircraft). While the events of
MANASSAS REGIONAL AIRPORT
AIRPORT LAYOUT PLAN UPDATE REPORT
MANASSAS REGIONAL AIRPORT
OCTOBER 2002
27
September 11, 2001 were impossible to predict, the potential outcome of the events needs to be
acknowledged as they may well alter the demand for aviation facilities at Manassas Regional Airport.
1.7.7 Airspace
While the airspace around Manassas Regional Airport is complicated by the proximity of
Washington-Dulles and Reagan National Airports, the local ATCT provides convenient traffic
management services for the airport users so that airspace issues don‘t impede the use and
development of the facility. Specifically, the local traffic area (10-mile diameter) and ILS approach
area surrounding Manassas Regional Airport is Class D airspace with a ceiling elevation up to but not
including 2,000-feet msl. Overlaying the Class D airspace for Manassas
Figure 1.5 Sectional Chart
MANASSAS REGIONAL AIRPORT
AIRPORT LAYOUT PLAN UPDATE REPORT
MANASSAS REGIONAL AIRPORT
OCTOBER 2002
28
Regional Airport is the Class B airspace associated with Dulles International Airport. The Class B
airspace above Manassas Regional Airport is controlled from 2,500-feet msl to 10,000-feet msl. In
addition to controlled airspace for commercial service airports, a military restricted area (R6608) and
adjacent MOA (DEMO) associated with Quantico Marine Corps Base is located approximately 5-air
miles to the south of Manassas Regional Airport (see Figure 1.5).
A major airspace redesign effort is currently being pursued by the FAA for the Baltimore-Washington
area. The redesign effort is studying the impacts of consolidating five independent TRACON
(Terminal RAdar CONtrol) facilities into a combined facility located in Vint Hill, Virginia. This new
facility, called the Potomac Consolidated TRACON, or PCT, is needed to meet the projected growth in
aviation demand while minimizing delays, resolve current air traffic control inefficiencies, and
modifying aircraft routes and altitudes.
The PCT facility is currently undergoing a tiered environmental impact study. The first EIS had a FAA
ROD issued on June 3, 1999 while a second EIS is currently in the Draft EIS stage. While the EIS
and the PCT affect the four primary airports under study in the region (IAD, DCA, BWI and ADW), the
EIS does mention 35 other airports in the region. However, the EIS does not give much
consideration to the operational characteristics of these airports in the overall model. With TRACON
facilities typically controlling aircraft between 5 and 50 miles of an airport (the ATCT controls aircraft
within 5 miles and ARTCCs control aircraft outside of 50 miles), any airspace redesign could impact
operations at Manassas Regional Airport. With the continuing increase in popularity of the airport,
the demand for airspace will only increase. Coordination between the City and the FAA is
recommended so that the airspace needs of Manassas are adequately addressed in the EIS for the
PCT.
A local traffic pattern at Manassas Regional Airport has been adopted using non-standard right turns
for traffic using the opposing thresholds to separate the parallel runway traffic and keep arriving and
departing traffic streams from crossing. In order to segregate the slower single-engine aircraft from
the heavier and faster turbo-prop and turbo-jet aircraft, two local traffic patterns have been established
at different elevations. The established local traffic pattern for single-engine and other light aircraft is
1,200-feet msl (1,000-feet agl) while the local traffic pattern for turbo-props and turbo-jets has been
established at 1,700-feet msl (1,500-feet agl). Helicopter operations have an established local traffic
pattern of 800-feet msl (600-feet agl).
1.7.8 Surface Access and Ground Transportation
Manassas Regional Airport is well served by the local and regional surface transportation system.
Primary access routes to Manassas Regional Airport include a convenient choice of access corridors.
Primary access is available from Route 28 (Nokesville Road) via Godwin Drive (Rte 661) and
Gateway Boulevard. Secondary access from Route 28 is also available using Piper Lane. Indirect
access using Pennsylvania Avenue is also available from Route 28.
The internal ―on-airport‖ surface transportation routes consist of Piper Lane, Observation Road and
Wakeman Drive. Piper Lane provides access to the West Complex while Wakeman Drive provides
access to the East Complex. Observation Road connects the East and West Complexes and
MANASSAS REGIONAL AIRPORT
AIRPORT LAYOUT PLAN UPDATE REPORT
MANASSAS REGIONAL AIRPORT
OCTOBER 2002
29
provides a cross-field access route for users and tenants of the airport.
Consistent with the ALP and under study for the last ten years, the new airport access road
connecting the East Complex terminal area directly with the recently completed Route 234 Bypass is
scheduled to begin construction in the spring 2002. This connection will facilitate high speed access
between the airport and I-66 to the north and I-95 to the east. This more convenient and direct
connection in addition to the increased surface traffic anticipated as a result of increased airport
activities is expected to change the surface traffic patterns for the internal airport access roads.
The construction of the Virginia Railway Express (VRE) Airport/Broad Run Station in the early 1990s
introduced a significant trip generator for non-airport related commuter traffic on Observation Road.
Given the recently completed expansion of the VRE Station parking and the overall increased
ridership forecasts for the entire rail system, there is an obvious concern that the new Route 234
Bypass access road will also provide a convenient connection for those commuters as well potentially
affecting the distribution of non-airport related traffic on the airport road system.
To examine the effects, a surface traffic study was conducted as part of the ALP Update to determine
the origin and destination of automobile traffic in the airport area and to predict the effects of the new
connection to Route 234. Traffic counts were obtained between July 12 and July 15, 2001 for several
road segments and key intersections on and near the airport road system. Recorded peak hour
turning movements are presented in Figures 1.6-1.9. The results of the analysis confirmed that the
peak hour traffic is significantly influenced by the users of the VRE Station. In fact, over 80-percent
of the morning traffic and 60-percent of the evening traffic on Observation Road appears to be
associated with VRE train activity.
The 24-hour road counts also confirmed the influence of the VRE activity. On Thursday July 12,
2001, approximately 3,567 vehicle trips were observed entering or leaving the airport road system.
By comparison, traffic levels on Saturday, July 14, 2001, presumably without the VRE traffic (and
perhaps fewer airport employee trips), totaled approximately 1,550 vehicle trips or less than
44-percent of the week day totals. According to the ATCT, there were 590 aircraft operations on July
14th which yields an average of about 2.6 vehicle trips per operation, a rate which is generally
consistent with the range of observed trip generation rates documented by the ITE Trip Generation
Manual for GA airports.
Observation Road was originally constructed as a cross-field connector intended to be used
exclusively by airport related vehicles. With the construction of the VRE station in the 1990s and the
apparent use of the roadway by VRE commuters, the eligibility of the road for future federal
participation in projects for the road is brought into question. Because of this potential to lose federal
participation, the popularity of the road by VRE commuters and the potential for increased use of the
Observation Road by VRE commuters after the connection between Route 234 bypass and Wakeman
Road is established; the City has decided to release the road to the public roadway system.
MANASSAS REGIONAL AIRPORT
AIRPORT LAYOUT PLAN UPDATE REPORT
MANASSAS REGIONAL AIRPORT
OCTOBER 2002
30
Figure 1.6 Overall Locations
MANASSAS REGIONAL AIRPORT
AIRPORT LAYOUT PLAN UPDATE REPORT
MANASSAS REGIONAL AIRPORT
OCTOBER 2002
31
Figure 1.7 Intersection traffic counts

MANASSAS REGIONAL AIRPORT
AIRPORT LAYOUT PLAN UPDATE REPORT
MANASSAS REGIONAL AIRPORT
OCTOBER 2002
32
Figure 1.8 Intersection traffic counts

MANASSAS REGIONAL AIRPORT
AIRPORT LAYOUT PLAN UPDATE REPORT
MANASSAS REGIONAL AIRPORT
OCTOBER 2002
33
Figure 1.9 Intersection traffic counts
MANASSAS REGIONAL AIRPORT
OCTOBER 2002
34
SECTION TWO:
FORECAST OF AVIATION DEMAND
The primary airport service area for Manassas Regional Airport is generally defined as the
Manassas-Manassas Park-Prince William County region. The following forecast section will present
forecasts of business/general aviation activity and will provide the basis for the determination of facility
requirements necessary to accommodate the forecasted demand. The recommended study
forecasts presented below are based on forecasts prepared as part of the Virginia Air Transportation
System Plan (VATSP) published by the Virginia Department of Aviation (DOAV). Additional forecast
elements included are the Terminal Area Forecast (TAF) prepared by the Federal Aviation
Administration and a multi-variate regression analysis using published socio-economic data for the
Northern Virginia region. In light of the events of September 11, 2001 and the subsequent
restrictions on aviation activity, airports within Northern Virginia have a potential of eclipsing the
forecasted levels of aviation demand presented in the TAF and VATSP. For this reason, the
multi-variate regression analysis is presented to provide potential demand should the TAF and VATSP
forecasts be eclipsed in the short-term.
2.1 NATIONAL TRENDS
Since the late 1980s, the shipment of new business/general aviation aircraft into the national fleet has
been approximately 1,000 aircraft a year. While business and general aviation aircraft shipments
decreased as a result of the national recession in the early 1990s, the passage of the General
Aviation Revitalization Act of 1994 and the national economic rebound later in the decade helped to
boost the manufacturing of new aircraft, aircraft utilization, hours flown and pilot population. This
trend is expected to continue with the introduction of new aircraft types such as the Embraer Legacy,
Cessna X and the Eclipse 500 into the active fleet of general aviation aircraft.
The FAA considers an aircraft ―active‖ if it flew more than one hour during the entire calendar year.
The active fleet is a function of the new aircraft introduced into the national fleet added to the previous
year‘s population of aircraft less those aircraft retired from the system. In 2000, single-engine
general aviation aircraft continue to be the backbone of the national fleet and account for 70.5-percent
of the active fleet. Multi-engine aircraft account for 9.1-percent of the national active fleet and
experimental aircraft account for 8.1-percent of the national active fleet. Turboprops, turbojets and
rotorcraft comprise 9.6-percent of the national fleet. The based active fleet at Manassas Regional
MANASSAS REGIONAL AIRPORT
OCTOBER 2002
35
Airport is consistent with national trends.
2.2 VATSP FORECAST OF AVIATION DEMAND
2.2.1 Based Aircraft
While the based aircraft population at Manassas Regional Airport has remained relatively stable over
the last twenty years with an annual rate of growth of 2.2-percent (see Table 1.2), the continued
development and improvement of facilities at the airport and the overall increase in the number of
aircraft in the airport service area will more than likely result in an increase in based business/general
aviation aircraft. The VATSP projects a total based aircraft population of 344 aircraft in 2020 which
represents a 0.45-percent annual rate of growth over the reported 2000 based aircraft in the 2001
VATSP Update (see Table 2.1). The actual based aircraft count (343) reported by the airport for
2001 has already reached the 2020 forecast level presented in the preliminary VATSP updated
information. As of Summer 2002, the airport reported a based aircraft population of ±400 aircraft,
probably as a result of regional airport closures in the wake of September 11, 2001.
2.2.2 Operations
The usual method for developing the operations forecast for an airport is to project an average
number of operations per based aircraft for each forecast year and to then apply that rate to the based
aircraft forecast. This methodology is grounded in studies accomplished at general aviation and air
carrier airports which have derived empirical relationships between based aircraft and operations.
According to VATSP data, Manassas Regional Airport was estimated to have 434 operations per
based aircraft in 2000. This rate was calculated by dividing the VATSP estimate of 2000 operations
(136,046) by the number of based aircraft for 2000 (315).
MANASSAS REGIONAL AIRPORT LAYOUT PLAN UPDATE
TABLE 2.1
VATSP Forecast of Aviation Demand for Manassas Regional Airport
TOTAL OPERATIONS
BASED AIRCRAFT
OPERATIONS PER BASED
AIRCRAFT
2000
136,650
315
434
2005
137,604
309*
445
2010
147,585
321
460
2015
157,566
332
475
2020
168,298
344
489
FORECASTED ROG
1.05%
0.44%
0.60%
Sources:
FAA Airport Traffic Records
VATSP 2001 Update
Note:
MANASSAS REGIONAL AIRPORT
AIRPORT LAYOUT PLAN UPDATE REPORT
MANASSAS REGIONAL AIRPORT
OCTOBER 2002
36
2000 Total Operations from 2000 Airport Traffic Records for Manassas Regional Airport
* Due to the opening of Stafford Regional Airport, short-term demand will be temporarily reduced.
Historically at the airport, the single-engine piston aircraft has dominated the operations at the airport.
While the single-engine aircraft should still represent the majority of the based aircraft population and
activity at the airport, the level of activity by single-engine aircraft is decreasing and will more than
likely continue to decrease over the planning horizon. Several distinct reasons account for this.
First, as more turbo-prop aircraft use Manassas Regional Airport over Dulles International Airport,
more single-engine pilots will feel ―uncomfortable‖ operating with the faster and heavier business
aviation aircraft. Second, with Stafford Regional Airport opening in December 2001, some aircraft
(15-20) may relocate from Manassas to Stafford, particularly the operators who live closer to Stafford.
2.3 FAA-TAF FORECAST OF AVIATION DEMAND
2.3.1 Based Aircraft
The FAA Terminal Area Forecasts (TAF) utilizes historical information on passenger enplanements,
aircraft operations, and based aircraft to forecast future activity at an airport. Generally, an FAA-TAF
forecast is prepared for every airport that is receiving federal funds. As a result of the FAA-TAF
ending in 2010, an extrapolation of the forecasted annualized rate of growth prepared in the TAF was
applied to 2010 forecasted
based aircraft and operations. The FAA forecasts based aircraft at Manassas Regional Airport to
increase to 457 by 2020 which equates to an annualized rate of growth of 1.02-percent.
2.3.2 Operations
The annualized rate of growth in operations at Manassas Regional Airport included in the FAA-TAF is
greater than the rate of growth in operations included in the VATSP. The FAA-TAF forecasts
operations at the airport to total 155,000 which is an annualized rate of growth of 1.27-percent. It
should be noted that while the annualized rate of growth for the FAA TAF is greater than the VATSP,
the total forecasted operations in 2020 in the FAA-TAF is lower than in the VATSP since the FAA rate
of growth is determined on a base year of 1999.
MANASSAS REGIONAL AIRPORT LAYOUT PLAN UPDATE
TABLE 2.2
FAA-TAF Forecast of Aviation Demand for Manassas Regional Airport
TOTAL OPERATIONS
BASED AIRCRAFT
OPERATIONS PER BASED
AIRCRAFT
1999
119,007
369
323
2005
128,935
393
328
2010
137,698
413
333
2015
146,088
434
336
MANASSAS REGIONAL AIRPORT
AIRPORT LAYOUT PLAN UPDATE REPORT
MANASSAS REGIONAL AIRPORT
OCTOBER 2002
37
2020
154,990
457
339
FORECASTED ROG
1.27%
1.02%
0.24%
Source:
2000 FAA-TAF
2.4 REGRESSION ANALYSIS FORECAST OF AVIATION DEMAND
The regression analysis forecast of aviation demand utilizes data from several publications: The
Virginia Statistical Abstract published by the Weldon-Cooper Center for Public Service at the
University of Virginia, the Virginia Electronic Labor Market Access (VELMA) database managed by the
Virginia Employment Commission, the Geospatial and Statistical Data Center at the University of
Virginia, the 1990 Airport Master Plan Update and the Virginia Air Transportation System Plan
(VATSP).
The regression analysis tested data from various geographic regions in the Northern Virginia area in
order to determine what measurement best predicted future demand for aviation facilities at
Manassas Regional Airport. Four geographic regions were tested 1) data for the City of Manassas, 2)
data for Prince William County, 3) data for the Northern Virginia Regional Commission, and 4) data for
the Virginia portion of the Washington, D.C.-Baltimore PMSA. For each of these four levels of
measurement, both regression and multi-variate regression models were performed to determine the
―fit‖ of the data. The statistical measurement of the ―fit‖ of the data is termed the coefficient of
determination and is expressed in statistical terms as r-squared (R2). The general hypothesis was
that operations at Manassas Regional Airport were dependent upon population, employment and
income levels in Prince William County.
2.4.1 Operations
An R2 value of 0.97 results from the multi-variate regression performed on population, employment
and income levels for Prince William County which means that 98.5-percent of the variance in the
historical operations can be explained by variance in the historical levels of population, employment
and income in Prince William County.
While forecasts for employment and income are not readily available, using the last six years of data
(1995-2000) results in a annualize rate of growth that ―captures‖ yearly variations. Applying this
annualized rate of growth to 2000 levels of data provides a reasonable determination of future
employment levels and per capita income. Future population was determined from published
population figures in the Virginia Statistical Abstract and extrapolated out to 2020 to normalize the
data. Using these forecasts of the three demographic measurements and solving the regression
equation presented in Table 2.3 results in a reasonably accurate prediction of future operations if the
predicted values of the demographic measurements are realized. The multi-variate regression
equation predicts future operations to total 180,000 by 2020.
2.4.2 Based Aircraft
Regression analysis was performed on based aircraft as well. The historical based aircraft
MANASSAS REGIONAL AIRPORT
AIRPORT LAYOUT PLAN UPDATE REPORT
MANASSAS REGIONAL AIRPORT
OCTOBER 2002
38
correlated well with historic population levels in Prince William County. The R
2 value was 0.47 which
means that approximately
68-percent of the variance in historical based aircraft can be explained by the variance in historic
population levels. Using these forecasts and the projected population levels for Prince William
County and solving the regression equation presented in Table 2.3 results in a reasonably accurate
prediction of future based aircraft if the predicted population in Prince William County is realized. The
regression analysis predicts future based aircraft at Manassas Regional Airport to total 550 by 2020. MANASSAS REGIONAL AIRPORT LAYOUT PLAN UPDATE
TABLE 2.3
Regression Analysis Forecast of Aviation Demand at Manassas Regional Airport
TOTAL OPERATIONS
BASED AIRCRAFT
OPERATIONS PER BASED
AIRCRAFT
2000
136,650
343
398
2005
138,068
458
301
2010
146,802
485
303
2015
159,811
517
309
2020
180,021
550
327
FORECASTED ROG
1.39%
2.39%
-0.98%
Source:
Campbell & Paris Engineers, P.C. 2002
REGRESSION EQUATIONS:
OPERATIONS:
O = (-1.64P + -1.04E + 1.07C) + 407396
WHERE:
O = Future Operations
P = Projected Population
E = Projected Employment
C = Projected Per Capita Income
BASED AIRCRAFT:
BA = .0011P + 106.7
WHERE:
BA = Future Based Aircraft
P = Projected Population
NOTE:
2000 operations are from the 2000 FAA Airport Traffic Records for HEF
The results of the regression analysis for operations and based aircraft results in a decrease in
operations per based aircraft from the reported 398 OPBA in the VATSP to 327 OPBA in 2020. This
MANASSAS REGIONAL AIRPORT
AIRPORT LAYOUT PLAN UPDATE REPORT
MANASSAS REGIONAL AIRPORT
OCTOBER 2002
39
OPBA is consistent with the statewide OPBA for general aviation airports with over 100 based aircraft
(379). Furthermore, this OPBA is consistent with airports that have a majority of single-engine based
aircraft.
2.5 RECOMMENDED FORECAST OF AVIATION DEMAND
Table 2.4 compares the three forecasts of aviation demand at Manassas Regional Airport. The
three forecasts examine different aspects of the region that could influence the demand for aviation
facilities at the airport. The recommended forecast for the purposes of determining facility
requirements will be the previously
MANASSAS REGIONAL AIRPORT LAYOUT PLAN UPDATE
TABLE 2.4
Comparison of Forecasted Demand for Aviation Facilities at Manassas Regional Airport
FORECAST
YEAR
VATSP
FAA-TAF
REGRESSION ANALYSIS
TOTAL
OPERATIONS
BASED
AIRCRAFT
TOTAL
OPERATIONS
BASED
AIRCRAFT
TOTAL
OPERATIONS
BASED
AIRCRAFT
2000
136,650
315
119,007*
369*
136,650
343
2005
137,604
309
128,935
393
138,068
458
2010
147,585
321
137,698
413
146,802
485
2015
157,566
332
146,088
434
159,811
517
2020
168,298
344
154,990
457
180,021
550
FORECASTE
D ROG
1.05%
0.44%
1.27%
1.02%
1.39%
2.39%
NOTE:
*FAA TAF Base year is 1999
Source:
Campbell & Paris Engineers, P.C. 2002
established VATSP forecasts.
The based aircraft population at Manassas Regional Airport will remain predominantly the
single-engine general aviation aircraft which is expected to account for approximately 75-percent of
the based aircraft population by 2020. The remaining segments of the based aircraft population
(multi-engine, turbo-prop/turbo-jet, and helicopter) are expected to represent between 7- and
10-percent of the based aircraft population. The largest of these remaining segments is the
multi-engine piston based aircraft (10-percent) with helicopters expected to account for 8-percent and
MANASSAS REGIONAL AIRPORT
AIRPORT LAYOUT PLAN UPDATE REPORT
MANASSAS REGIONAL AIRPORT
OCTOBER 2002
40
turbo-prop/turbo-jet expected to account for 7-percent.
2.6 FORECASTED OPERATIONS MIX
2.6.1 Itinerant and Local Operations
A local operation is defined by the FAA as ―arrivals and departures of aircraft which operate in the
local traffic pattern or within sight of the tower and are known to be departing for or arriving from flights
in local practice areas within a 20-mile radius of the airport, plus simulated instrument approaches or
low passes executed by any aircraft.‖ An itinerant operation is any other type of operation not
included in the local definition. Because of the presence of several airports within a 20-nautical mile
radius of Manassas (i.e., Warrenton-Fauquier and Dulles International), some local operations are
conducted by transient aircraft which would require transient facilities at Manassas Regional Airport.
Typically, local operations are conducted by aircraft based at the airport while itinerant operations are
conducted by transient and some based aircraft at the airport. The 2000Airport Traffic Records from
the Air Traffic Control Tower indicate that approximately 79-percent of all operations at Manassas
Regional Airport in 2000 were itinerant and 21-percent of all operations were local. However, the
FAA ATCT reports ―full stop taxi backs,‖ or FSTBs, as an itinerant operation. An FSTB operation is
when an aircraft touches down, rolls-out, taxiis off the runway and back up the taxiway to the
approach end for another departure. Since FSTB operations are generally conducted by students
and stay in the local traffic pattern, they could be considered local operations. According to the
two-week tower strip data, pattern (including FSTBs) and touch-and-go activity accounted for
approximately 50-percent of total operations recorded during the two-week period. Assuming that the
remainder of the total operations during the two-weeks followed the 79-percent itinerant and
21-percent local split, then a revised itinerant/local operations mix can be determined. Using this
methodology, the itinerant/local operations mix at Manassas Regional Airport is determined to be
40-percent itinerant and 60-percent local.
2.6.2 Operations by Type of Aircraft
Operations by type of aircraft were development using the trend data in the 2001 VATSP and other
national FAA forecast reports. Overall, the growth in the turboprop and turbojet market is expected to
continue and exceed the growth in all other fixed wing aircraft categories. Nationally, the Federal
Aviation Administration expects annual aircraft utilization to increase through the forecast period with
single-engine aircraft utilization rates increasing 1.0-percent to an average of 145 annual hours and
multi-engine utilization rates increasing by an annual average of 0.3-percent to 159 annual hours.
Turbo-prop utilization rates decreased by nine hours from 1997 to 1998 and are expected to increase
slightly by 2011. The largest increase in aircraft utilization rates in 1998 was in the turbo-jet segment
from 330 annual hours in 1997 to 367 annual hours. This segment is forecasted to continue a
relatively high rate of growth of 2.6-percent to an average utilization of 512 annual hours by 2011.
Data collected during two weeks of aircraft activity at Manassas Regional Airport provides a useful tool
in determining actual number of operations by type of aircraft. The type of aircraft was determined by
entering
tail registration numbers into a public access database. Consistent with many general aviation
airports, the single-engine aircraft population represented a majority (79-percent) of total operations
MANASSAS REGIONAL AIRPORT
AIRPORT LAYOUT PLAN UPDATE REPORT
MANASSAS REGIONAL AIRPORT
OCTOBER 2002
41
during the two week period.
The multi-engine aircraft population represented 6.8-percent while the turbo-prop population
represented 1.3-percent and the turbo-jet population represented 2.9-percent of total operations.
These percentages are consistent with the anticipated operations mix presented in the 1990 Master
Plan for Manassas Regional Airport. When the operations mix for the two week period are compared
with the operations mix in 1988 (based on a similar two week survey period), the relative percentage
of operations by the traditional single engine general aviation aircraft has decreased from 86.0-percent
of operations to approximately 79.0-percent of operations. Conversely, the turbo-jet operations has
increased from 2.0-percent in 1988 to 3.0-percent of operations (see Table 2.5). Forecasted
operations mix continue the historical trend of decreasing operations by single-engine aircraft
(75-percent of total operations by 2020) and increasing operations by the other segments of the
aircraft population, particularly turbo-prop and turbo-jet aircraft (7-percent of operations by 2020).
MANASSAS REGIONAL AIRPORT LAYOUT PLAN UPDATE
TABLE 2.5
Historical and Current Operations Mix at Manassas Regional Airport
AIRCRAFT TYPE
1988 OPERATIONS (%)1
2000 OPERATIONS (%)2
% INCREASE/DECREASE
Single Engine Piston
107,500
(86.0%)
104.960
(79.0%)
-2.4%
Multi Engine Piston
7,500
(6.0%)
9,030
(6.8%)
20.4%
Turboprop
3,125
(2.5%)
1,730
(1.3%)
-44.6%
Turbojet
2,500
(2.0%)
3,850
(2.9%)
54.0%
Helicopter
4,375
(3.5%)
10,890
(8.2%)
149%
Totals:
125,000 (100.00%)
132,860
Source: 1 1990 Master Plan Update 2 Campbell & Paris Engineers, P.C. 2002
NOTE:
2000 Operations were determined by extrapolating number of recorded operations from the average operations per day
during the two-week observation period (avg ops/day x 365).
2.6.3 Instrument Operations
The 1990 Airport Master Plan Update predicted that the amount of instrument activity at Manassas
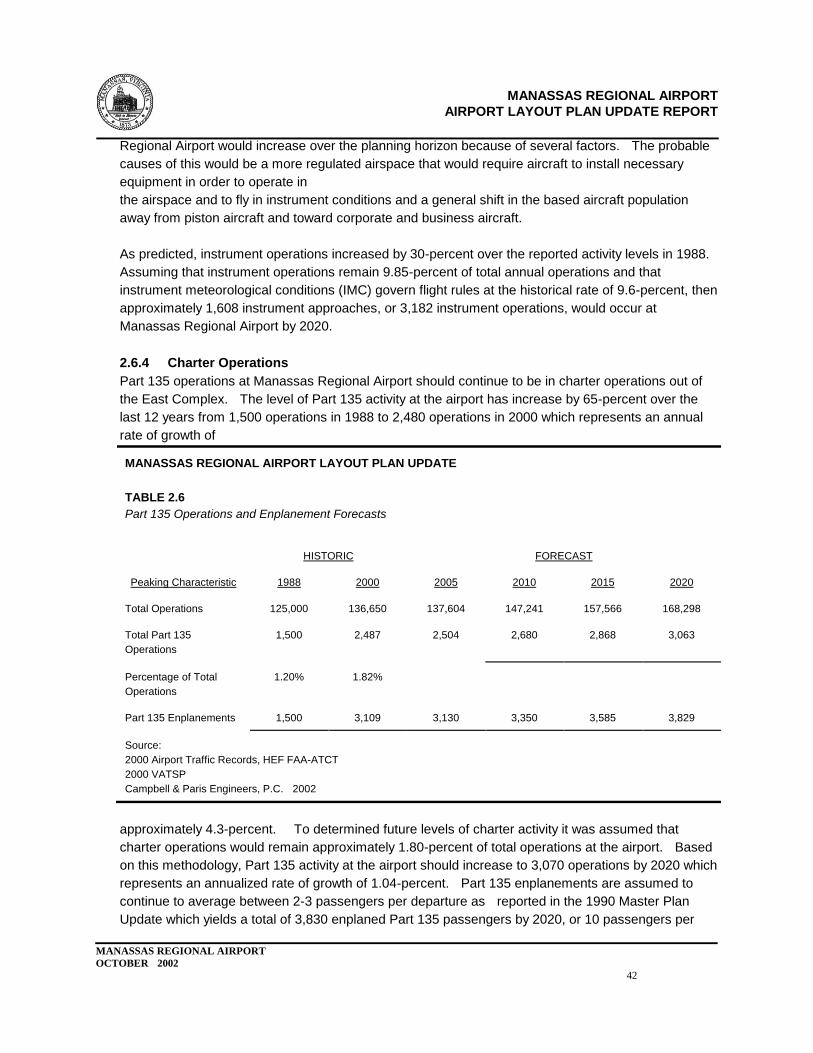
MANASSAS REGIONAL AIRPORT
AIRPORT LAYOUT PLAN UPDATE REPORT
MANASSAS REGIONAL AIRPORT
OCTOBER 2002
42
Regional Airport would increase over the planning horizon because of several factors. The probable
causes of this would be a more regulated airspace that would require aircraft to install necessary
equipment in order to operate in
the airspace and to fly in instrument conditions and a general shift in the based aircraft population
away from piston aircraft and toward corporate and business aircraft.
As predicted, instrument operations increased by 30-percent over the reported activity levels in 1988.
Assuming that instrument operations remain 9.85-percent of total annual operations and that
instrument meteorological conditions (IMC) govern flight rules at the historical rate of 9.6-percent, then
approximately 1,608 instrument approaches, or 3,182 instrument operations, would occur at
Manassas Regional Airport by 2020.
2.6.4 Charter Operations
Part 135 operations at Manassas Regional Airport should continue to be in charter operations out of
the East Complex. The level of Part 135 activity at the airport has increase by 65-percent over the
last 12 years from 1,500 operations in 1988 to 2,480 operations in 2000 which represents an annual
rate of growth of MANASSAS REGIONAL AIRPORT LAYOUT PLAN UPDATE
TABLE 2.6
Part 135 Operations and Enplanement Forecasts
HISTORIC
FORECAST
Peaking Characteristic
1988
2000
2005
2010
2015
2020
Total Operations
125,000
136,650
137,604
147,241
157,566
168,298
Total Part 135
Operations
1,500
2,487
2,504
2,680
2,868
3,063
Percentage of Total
Operations
1.20%
1.82%
Part 135 Enplanements
1,500
3,109
3,130
3,350
3,585
3,829
Source:
2000 Airport Traffic Records, HEF FAA-ATCT
2000 VATSP
Campbell & Paris Engineers, P.C. 2002
approximately 4.3-percent. To determined future levels of charter activity it was assumed that
charter operations would remain approximately 1.80-percent of total operations at the airport. Based
on this methodology, Part 135 activity at the airport should increase to 3,070 operations by 2020 which
represents an annualized rate of growth of 1.04-percent. Part 135 enplanements are assumed to
continue to average between 2-3 passengers per departure as reported in the 1990 Master Plan
Update which yields a total of 3,830 enplaned Part 135 passengers by 2020, or 10 passengers per
MANASSAS REGIONAL AIRPORT
AIRPORT LAYOUT PLAN UPDATE REPORT
MANASSAS REGIONAL AIRPORT
OCTOBER 2002
43
day.
2.6.5 Military Operations
Consistent with the 1990 Master Plan Update, the military operations at Manassas Regional Airport
accounted for less than 0.5-percent of total annual operations in 2000. A total of 377 military
operations occurred in 2000 (79.3-percent of which were itinerant in nature). Nationally, military
operations at non-military airfields is expected to remain relatively stable reflecting a ―no-growth‖
scenario. Similarly, there is no basis to expect military activity to increase at Manassas Regional
Airport over the next 20 years, thus, the military activity levels are expected to remain below 500
operations a year (less than 0.5-percent of total operations) for the duration of the planning horizon.
2.7 PEAKING CHARACTERISTICS
2.7.1 Total Operations
The peak period of activity at general aviation airports typically coincides with periods of sustained
―good‖ weather (visual meteorological conditions (VMC) prevail) which supports flight training activity,
recreational flights as well as the typical compliment of corporate and business aviation activity. The
weather analysis indicates that VFR conditions exist approximately 90.3-percent of the year or about
330 out of 365 days. The remainder of the year, instrument meteorological conditions (IMC) prevail.
Instrument activity in 2000 accounted for approximately 9.85-percent of total operations. Since
instrument operations can occur in either VMC or IMC conditions, a necessary parameter is the
amount of time that IMC conditions prevail. The weather analysis presented in Table 1.8 suggests
that less than 10-percent of all instrument operations were conducted in IMC. With 13,462
instrument operations recorded in 2000 and instrument weather occurring 9.6-percent of the time, only
1,295 instrument operations occurred during the 35 days of IFR weather, or 37 IFR operations/IFR
day. Based on this information, it would be reasonable to expect that at least 99-percent of annual
operations would occur during the 330 VFR days, which would yield approximately 410 operations per
average VFR day.
Traditional measurements of peak operational activity include the peak month, average day of the
peak month and the peak hour of the average day. The Air Traffic Control Tower at Manassas
Regional Airport provides an Airport Traffic Record for each month which details the number of
operations by type (i.e., local versus itinerant) of operation and who is performing the operation (i.e.,
general aviation, air taxi, military, etc. . .).
According to the 2000 Airport Traffic Reports, the peak month of activity at Manassas Regional Airport
occurred in July 2000 with a reported 14,576 operations. The peak day of the peak month was on
July 8, 2000 with a reported 664 operations which accounted for 4.6-percent of the total monthly
operations. The forecasted peaking characteristics at Manassas Regional Airport will help determine
the level of required development for such facilities as tie-downs, hangars and fuel. Using the
forecasted level of operations found in the 2000 VATSP and the percentage of operations the peak
month, peak day and peak hour represented in 2000, the forecasted peaking characteristics for
Manassas Regional Airport are presented in Table 2.7. This analysis assumes that the proportion of
activity found in each peaking characteristics remains constant with a 1.04-percent annualized rate of
growth for total operations.
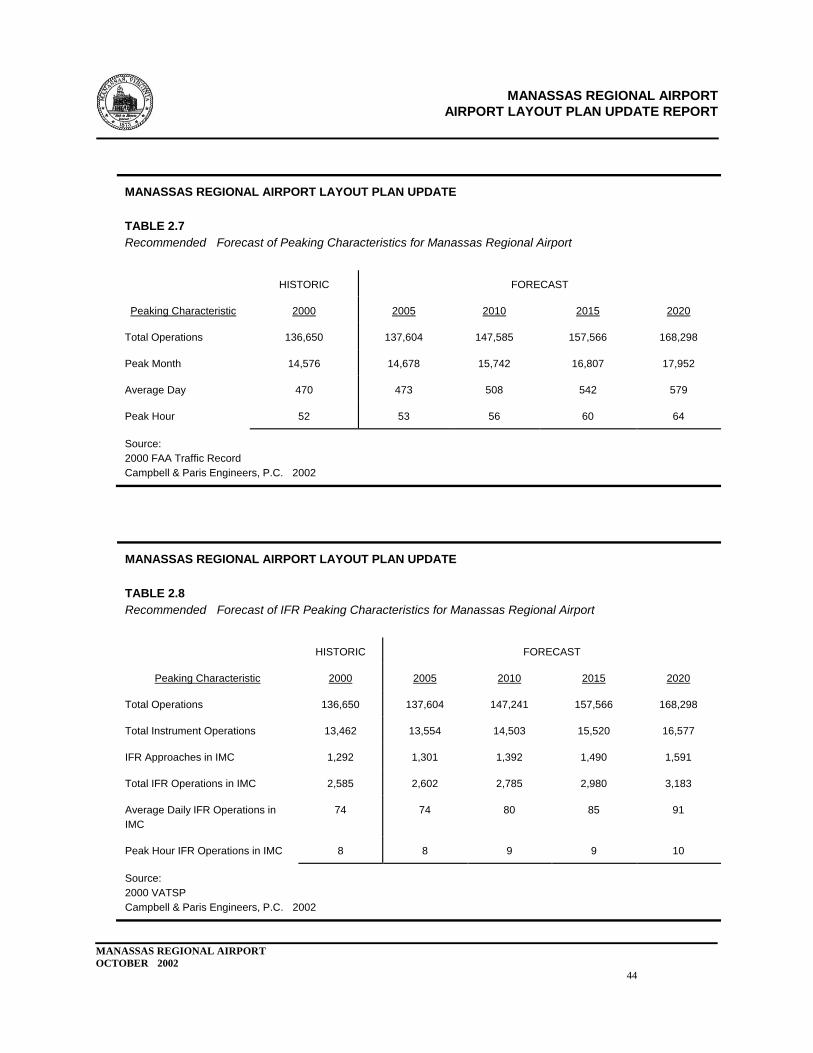
MANASSAS REGIONAL AIRPORT
AIRPORT LAYOUT PLAN UPDATE REPORT
MANASSAS REGIONAL AIRPORT
OCTOBER 2002
44
MANASSAS REGIONAL AIRPORT LAYOUT PLAN UPDATE
TABLE 2.7
Recommended Forecast of Peaking Characteristics for Manassas Regional Airport
HISTORIC
FORECAST
Peaking Characteristic
2000
2005
2010
2015
2020
Total Operations
136,650
137,604
147,585
157,566
168,298
Peak Month
14,576
14,678
15,742
16,807
17,952
Average Day
470
473
508
542
579
Peak Hour
52
53
56
60
64
Source:
2000 FAA Traffic Record
Campbell & Paris Engineers, P.C. 2002
MANASSAS REGIONAL AIRPORT LAYOUT PLAN UPDATE
TABLE 2.8
Recommended Forecast of IFR Peaking Characteristics for Manassas Regional Airport
HISTORIC
FORECAST
Peaking Characteristic
2000
2005
2010
2015
2020
Total Operations
136,650
137,604
147,241
157,566
168,298
Total Instrument Operations
13,462
13,554
14,503
15,520
16,577
IFR Approaches in IMC
1,292
1,301
1,392
1,490
1,591
Total IFR Operations in IMC
2,585
2,602
2,785
2,980
3,183
Average Daily IFR Operations in
IMC
74
74
80
85
91
Peak Hour IFR Operations in IMC
8
8
9
9
10
Source:
2000 VATSP
Campbell & Paris Engineers, P.C. 2002
MANASSAS REGIONAL AIRPORT
AIRPORT LAYOUT PLAN UPDATE REPORT
MANASSAS REGIONAL AIRPORT
OCTOBER 2002
45
2.7.2 Instrument Operations
The peak periods for instrument operations is important to the determination of any further
instrumentation of the approaches to an airport. Table 2.8 presents the forecasted peaking
characteristics for instrument operations at Manassas Regional Airport. With a forecast of 3,180
instrument operations occurring during IMC in 2020, the average IFR day would have 91 instrument
operations, or 10 instrument operations during the peak hour of the average day.
2.8 SCHEDULED SERVICE
While commercial air service has had a presence at Manassas in the past, both roadway and airport
improvement projects promise to provide better connectivity between Manassas and Dulles and
lessen the perceived travel time advantage. Major roadway projects in the Manassas-Prince
William-Fairfax County region should reduce ground travel time between the Manassas area and
Dulles International. The intersection improvement at Route 234 and Route 29 and the construction
of a grade separated interchange between Route 28 and Route 29 and the construction of the Route
234 bypass should result in quicker travel times to Dulles for the population in the airport service area
for Manassas Regional Airport.
In addition to the surface transportation improvements and the resulting decrease in ground travel
time, projects included as part of the $3.4 billion Dulles Development should reduce airside and
landside congestion and travel delays. The replacement of the ―Mobile Lounges‖ with an
underground rail system and the construction of an additional runway could increase the capacity of
the airport and reduce delays. Additional projects included in the Dulles Development program that
would reduce both airside and landside congestion are new terminal piers and several parking
garages close to the main terminal building.
2.9 FORECASTED AUTOMOBILE TRAFFIC ACTIVITY
The forecasts of automobile traffic activity at Manassas Regional Airport considered the results of the
24-hour road counts, projected growth in VRE ridership at the Broad Run Station, projected growth in
airport operations (including transient operations), and growth in the businesses and tenants located
on the airport. The results of the forecast of automobile traffic activity are presented in Table 2.9.
The VRE average daily ridership for 2000 was approximately 9,800 riders system wide. Various
capital improvement programs and operational improvements are scheduled to meet a forecasted
ridership level of 16,000 daily riders by 2010 (4.8-percent annualized rate of growth). One capital
improvement program recently completed was a doubling of parking capacity at the Broad Run station
from 300 parking spaces to 600 parking spaces. Operational changes on the Manassas Line of the
VRE include an increase in the use of ―double-decker‖ trains to meet limited train storage capacity and
increased ridership levels. The VRE expects a need to expand the existing train yard to allow for
additional overnight train storage at the Broad Run station.
The VATSP annualized rate of growth in operations over the next twenty years is 1.05-percent (see
Table 2.1 and Section 2.2.2). The continued use of the airport by transient aircraft will also generate
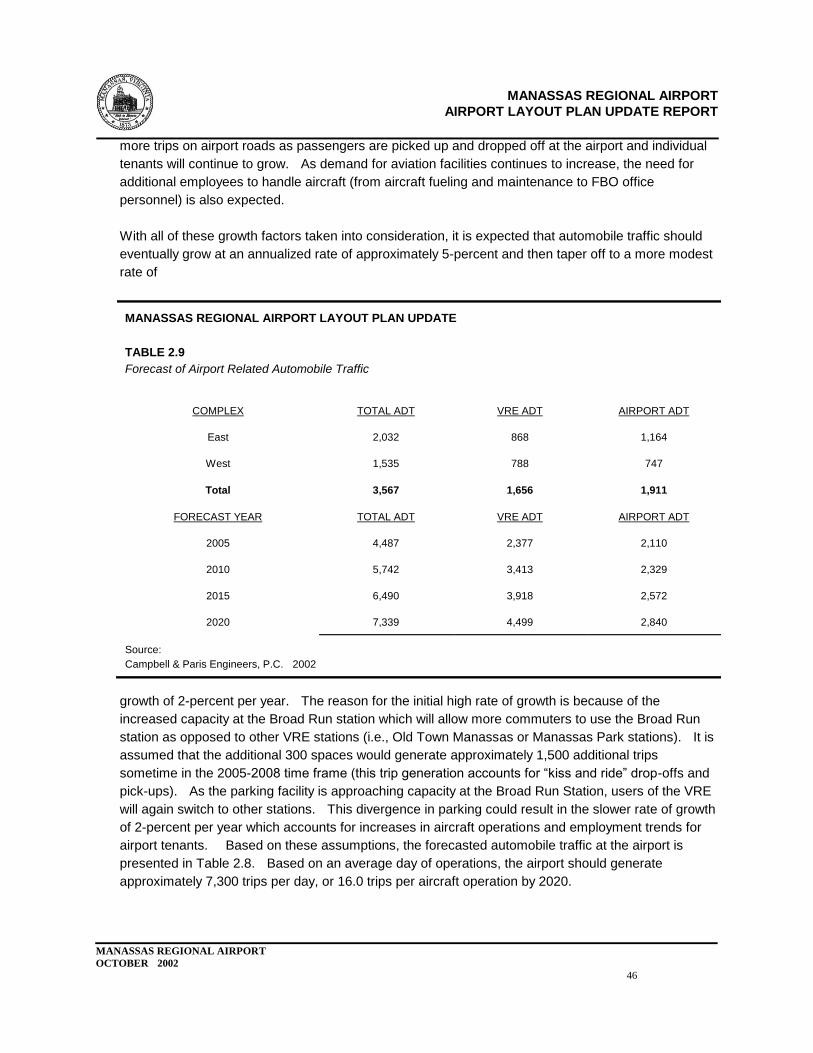
MANASSAS REGIONAL AIRPORT
AIRPORT LAYOUT PLAN UPDATE REPORT
MANASSAS REGIONAL AIRPORT
OCTOBER 2002
46
more trips on airport roads as passengers are picked up and dropped off at the airport and individual
tenants will continue to grow. As demand for aviation facilities continues to increase, the need for
additional employees to handle aircraft (from aircraft fueling and maintenance to FBO office
personnel) is also expected.
With all of these growth factors taken into consideration, it is expected that automobile traffic should
eventually grow at an annualized rate of approximately 5-percent and then taper off to a more modest
rate of
MANASSAS REGIONAL AIRPORT LAYOUT PLAN UPDATE
TABLE 2.9
Forecast of Airport Related Automobile Traffic
COMPLEX
TOTAL ADT
VRE ADT
AIRPORT ADT
East
2,032
868
1,164
West
1,535
788
747
Total
3,567
1,656
1,911
FORECAST YEAR
TOTAL ADT
VRE ADT
AIRPORT ADT
2005
4,487
2,377
2,110
2010
5,742
3,413
2,329
2015
6,490
3,918
2,572
2020
7,339
4,499
2,840
Source:
Campbell & Paris Engineers, P.C. 2002
growth of 2-percent per year. The reason for the initial high rate of growth is because of the
increased capacity at the Broad Run station which will allow more commuters to use the Broad Run
station as opposed to other VRE stations (i.e., Old Town Manassas or Manassas Park stations). It is
assumed that the additional 300 spaces would generate approximately 1,500 additional trips
sometime in the 2005-2008 time frame (this trip generation accounts for ―kiss and ride‖ drop-offs and
pick-ups). As the parking facility is approaching capacity at the Broad Run Station, users of the VRE
will again switch to other stations. This divergence in parking could result in the slower rate of growth
of 2-percent per year which accounts for increases in aircraft operations and employment trends for
airport tenants. Based on these assumptions, the forecasted automobile traffic at the airport is
presented in Table 2.8. Based on an average day of operations, the airport should generate
approximately 7,300 trips per day, or 16.0 trips per aircraft operation by 2020.
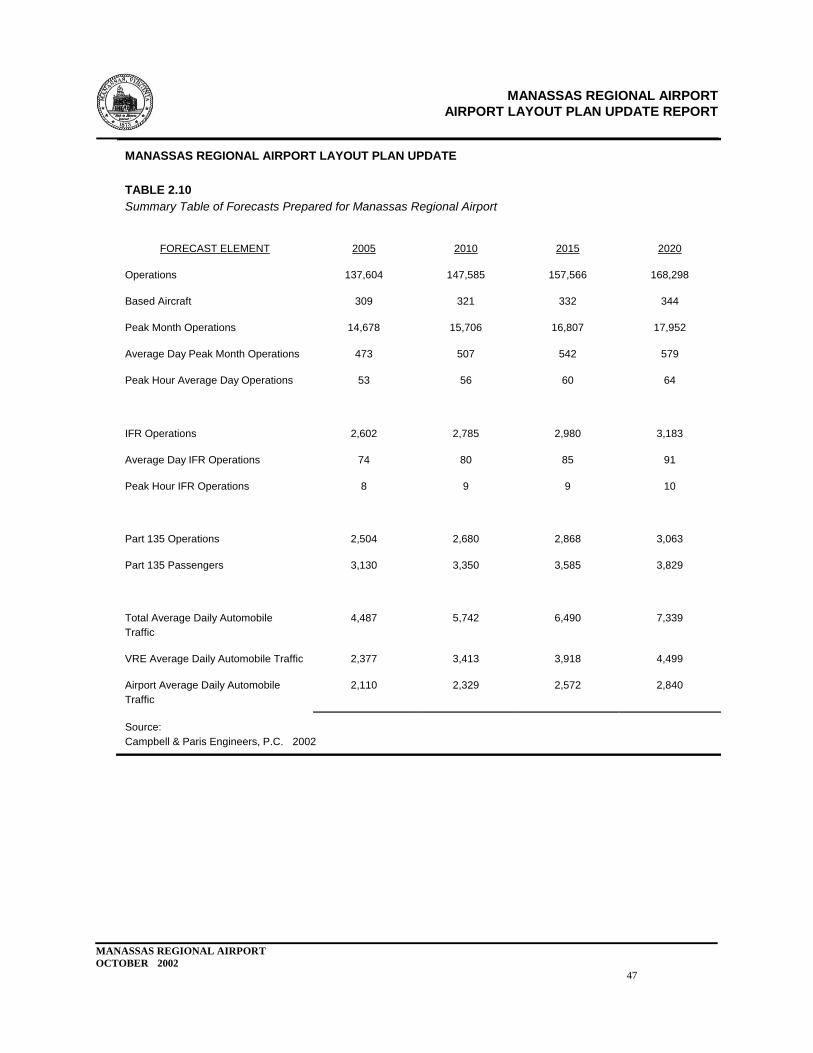
MANASSAS REGIONAL AIRPORT
AIRPORT LAYOUT PLAN UPDATE REPORT
MANASSAS REGIONAL AIRPORT
OCTOBER 2002
47
MANASSAS REGIONAL AIRPORT LAYOUT PLAN UPDATE
TABLE 2.10
Summary Table of Forecasts Prepared for Manassas Regional Airport
FORECAST ELEMENT
2005
2010
2015
2020
Operations
137,604
147,585
157,566
168,298
Based Aircraft
309
321
332
344
Peak Month Operations
14,678
15,706
16,807
17,952
Average Day Peak Month Operations
473
507
542
579
Peak Hour Average Day Operations
53
56
60
64
IFR Operations
2,602
2,785
2,980
3,183
Average Day IFR Operations
74
80
85
91
Peak Hour IFR Operations
8
9
9
10
Part 135 Operations
2,504
2,680
2,868
3,063
Part 135 Passengers
3,130
3,350
3,585
3,829
Total Average Daily Automobile
Traffic
4,487
5,742
6,490
7,339
VRE Average Daily Automobile Traffic
2,377
3,413
3,918
4,499
Airport Average Daily Automobile
Traffic
2,110
2,329
2,572
2,840
Source:
Campbell & Paris Engineers, P.C. 2002
MANASSAS REGIONAL AIRPORT
OCTOBER 2002
48
SECTION THREE:
DEMAND/CAPACITY ANALYSIS AND FACILITY
REQUIREMENTS
With the forecasted aviation demand established for Manassas Regional Airport, a demand/capacity
analysis was prepared to determine facilities necessary to accommodate the forecasted aviation
activity. In order to accomplish this, each component of the airport has been evaluated for its ability
to satisfy the existing and forecasted demand for facilities and services. In order to provide the
recommended development plan with flexibility, facility requirements have been developed for both
the VATSP forecasts and the higher growth regression forecasts prepared in Section Two. With the
VATSP forecasting a low rate of growth in aviation activity, the recommended development plan for
the airport identifies facility layouts that are flexible enough to accommodate based aircraft above
those solely accounted for in the VATSP forecasts. The facility requirements for each component are
identified by phase in an appropriate level of detail corresponding to the short-term (Years 0-5),
mid-term (Years 6-10) and long-term (Years 11-20) planning horizons.
3.1 RUNWAY AND TAXIWAY SYSTEM CAPACITY
3.1.1 System Capacity
The airfield capacity at Manassas Regional Airport was determined by using the procedures and
guidance found in FAA AC 150/5060-5 ―Airport Capacity and Delay.‖ Generally, the capacity of an
airport is a function of the number of runways, the orientation of the runways, type of aircraft using the
runways, touch and go activity, location of taxiways and exit taxiways, and weather conditions. The
annual service volume (ASV) of the airport has been determined to be approximately 355,000 annual
operations which is consistent with the approved 1990 Airport Master Plan Update. Hourly capacity
of the airfield is estimated at 197 operations during VMC (two runways in use) and 59 operations
during IMC (single runway in use). This analysis assumes that the dual runway configuration is in
use as much as 80-percent of the time. The demand/capacity information for the runway system at
Manassas Regional Airport is presented in Table 3.1. In general, the runway capacity is sufficient to
accommodate the forecasted operations throughout the planning period. The forecasted
demand/capacity ratio is 47-percent by the end of the planning horizon
3.1.2 Exit Taxiway Requirements
According to an analysis of Air Traffic Control Tower flight strips from the Manassas ATCT, the aircraft
mix
MANASSAS REGIONAL AIRPORT LAYOUT PLAN UPDATE
TABLE 3.1
Parallel Runway System Capacity and Forecasted Demand/Capacity Ratio For Annual, VFR and
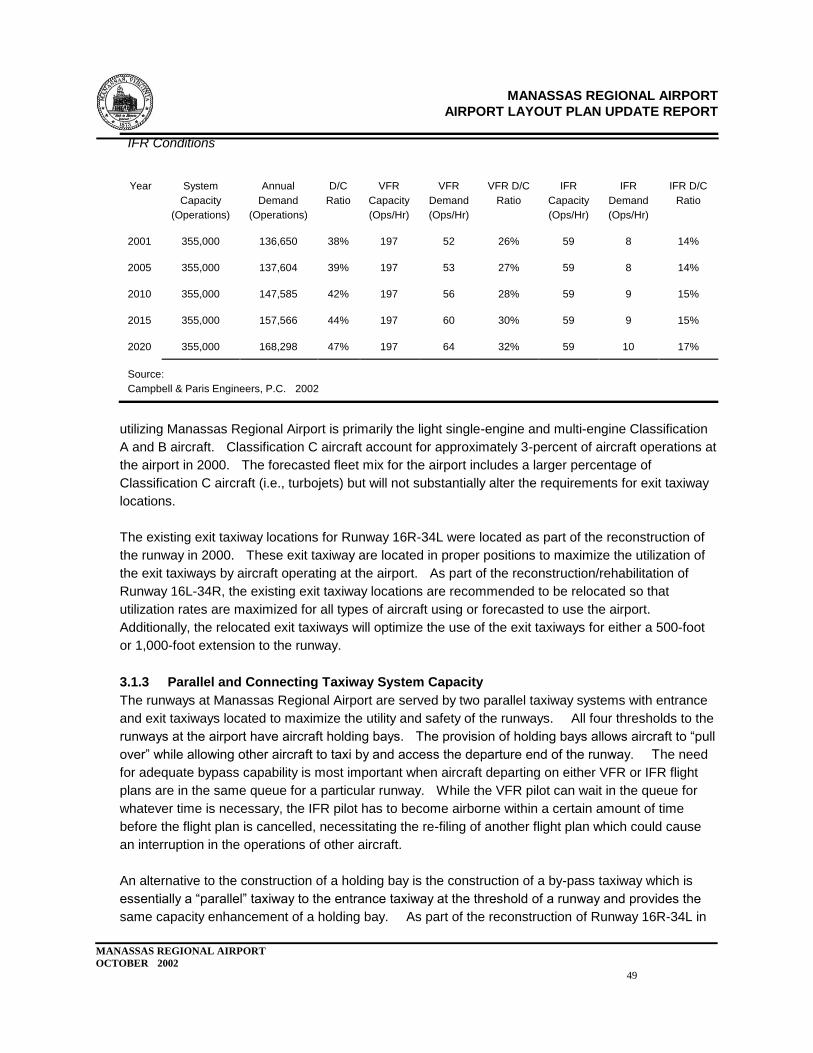
MANASSAS REGIONAL AIRPORT
AIRPORT LAYOUT PLAN UPDATE REPORT
MANASSAS REGIONAL AIRPORT
OCTOBER 2002
49
IFR Conditions
Year
System
Capacity
(Operations)
Annual
Demand
(Operations)
D/C
Ratio
VFR
Capacity
(Ops/Hr)
VFR
Demand
(Ops/Hr)
VFR D/C
Ratio
IFR
Capacity
(Ops/Hr)
IFR
Demand
(Ops/Hr)
IFR D/C
Ratio
2001
355,000
136,650
38%
197
52
26%
59
8
14%
2005
355,000
137,604
39%
197
53
27%
59
8
14%
2010
355,000
147,585
42%
197
56
28%
59
9
15%
2015
355,000
157,566
44%
197
60
30%
59
9
15%
2020
355,000
168,298
47%
197
64
32%
59
10
17%
Source:
Campbell & Paris Engineers, P.C. 2002
utilizing Manassas Regional Airport is primarily the light single-engine and multi-engine Classification
A and B aircraft. Classification C aircraft account for approximately 3-percent of aircraft operations at
the airport in 2000. The forecasted fleet mix for the airport includes a larger percentage of
Classification C aircraft (i.e., turbojets) but will not substantially alter the requirements for exit taxiway
locations.
The existing exit taxiway locations for Runway 16R-34L were located as part of the reconstruction of
the runway in 2000. These exit taxiway are located in proper positions to maximize the utilization of
the exit taxiways by aircraft operating at the airport. As part of the reconstruction/rehabilitation of
Runway 16L-34R, the existing exit taxiway locations are recommended to be relocated so that
utilization rates are maximized for all types of aircraft using or forecasted to use the airport.
Additionally, the relocated exit taxiways will optimize the use of the exit taxiways for either a 500-foot
or 1,000-foot extension to the runway.
3.1.3 Parallel and Connecting Taxiway System Capacity
The runways at Manassas Regional Airport are served by two parallel taxiway systems with entrance
and exit taxiways located to maximize the utility and safety of the runways. All four thresholds to the
runways at the airport have aircraft holding bays. The provision of holding bays allows aircraft to ―pull
over‖ while allowing other aircraft to taxi by and access the departure end of the runway. The need
for adequate bypass capability is most important when aircraft departing on either VFR or IFR flight
plans are in the same queue for a particular runway. While the VFR pilot can wait in the queue for
whatever time is necessary, the IFR pilot has to become airborne within a certain amount of time
before the flight plan is cancelled, necessitating the re-filing of another flight plan which could cause
an interruption in the operations of other aircraft.
An alternative to the construction of a holding bay is the construction of a by-pass taxiway which is
essentially a ―parallel‖ taxiway to the entrance taxiway at the threshold of a runway and provides the
same capacity enhancement of a holding bay. As part of the reconstruction of Runway 16R-34L in
MANASSAS REGIONAL AIRPORT
AIRPORT LAYOUT PLAN UPDATE REPORT
MANASSAS REGIONAL AIRPORT
OCTOBER 2002
50
2000, a by-pass taxiway was constructed at the approach end to Runway 16R with a 176-foot
centerline to centerline separation. The placement of the full length crossfield connector/by-pass
taxiway should have a similar centerline to centerline separation as the bypass taxiway for Runway
16R-34L. The location of the full length crossfield connector/by-pass taxiway with this
centerline-to-centerline separation would result in aircraft taxiing through the Glideslope Critical Area
(GCA) necessitating the placement of holdmarkings on the taxiway pavement identifying the limits of
the GCA.
3.1.4 Runway Length Analysis
The forecasted increase in the level of turbo-jet activity at the airport, coupled with the increasing
demand for limited capacity at Washington-Dulles International Airport, makes the facilities at
Manassas Regional Airport more attractive to potential corporate tenants. However, operations of
potential corporate tenants could have payload restrictions if a runway extension of appropriate length
is not provided at the airport. While any facility requirement is ultimately driven by demand,
insufficient facilities detract from the ability of the airport to market the facility to potential corporate jet
operators that require the full stage length capability of the most modern business jet aircraft types.
The required runway length at any airport is a function of temperature, altitude, runway gradient,
weather conditions, stage lengths and all the performance capabilities of the critical aircraft at the
airport. The physical characteristics considered in the runway length analysis at Manassas Regional
Airport are identified in Table 3.2.
Two methodologies exist to determine a runway length that is sufficient enough to accommodate the
types of aircraft operating at the airport. The first methodology, and typically used as an initial
determination of runway length, is the FAA methodology developed for different groups of aircraft
based on approach speed and size. These recommendations are prepared from a family of
representative aircraft types within each group. The results of this type of analysis is also presented
in Table 3.2.
Runway 16L-34R at Manassas Regional Airport is designed for large aircraft (60,000 pounds and
greater gross weights). According to the FAA methodology, for the large aircraft group, the runway
length at an airport should accommodate 75-percent of operations at a useful load (i.e. payload) of
60-percent. This criteria would include most general aviation turbine powered aircraft types including
Lears, Gulfstreams and Cessna aircraft. The FAA analysis suggests that, for a stage length of 2,000
nautical miles (equal to the distance between Manassas and Los Angeles), the runway length should
be, at a minimum, 5,400-feet in length.
Although the FAA methodology results in a generalized runway length based on certain groups of
aircraft, the aircraft performance data in the FAA database is relatively dated and does not include
some of the more modern ultra-long range aircraft types (i.e. Gulfstream G-VSP, Boeing Business Jet,
Bombardier Challenger/Global Express). A more accurate determination of facility requirements is
typically through a ―critical aircraft‖ determination. A critical aircraft, for the purposes of runway length
analysis, is defined as the most demanding aircraft expected to use the runway on a regular basis (i.e.
MANASSAS REGIONAL AIRPORT
AIRPORT LAYOUT PLAN UPDATE REPORT
MANASSAS REGIONAL AIRPORT
OCTOBER 2002
51
500 itinerant operations or more per year). The critical aircraft for Manassas Regional Airport for
runway length determination is the Gulfstream V that is based in the East Complex.
MANASSAS REGIONAL AIRPORT LAYOUT PLAN UPDATE
TABLE 3.2
FAA Airport Design Computer Program Runway Length Analysis
Given Information
Airport Elevation
192-feet msl
Mean Daily Max. Temperature of the Hottest Month
87 F
Maximum Difference in Runway Centerline Elevation
Runway 16L-34R: 17-feet
Length of haul for airplanes more than 60,000 lbs.
2290 miles
Category
Runway 16L-34R
Suggested Runway Length
Wet Runway
Small Airplanes with approach speeds less than 30 kts
310'
Small airplanes with approach speeds less than 50 kts
820'
Small airplanes with less than 10 passenger seats
75% of these small airplanes
2,530'
95% of these small airplanes
3,090'
100% of these small airplanes
3,670'
Small airplanes with 10 or more passenger seats
4,240'
Large airplanes of 60,000 pounds or less
75% of these large airplanes at 60% useful load
5,360'
75% of these large airplanes at 90 % useful load
7,000'
100% of these large airplanes at 60% useful load
5,500'
100% of these large airplanes at 90% useful load
8,260'
Airplanes more than 60,000 pounds
8,130'
Source:
FAA Airport Design computer software, Version 4.2D
FAA AC 150/5235-4A ―Runway Length Requirements for Airport Design‖ No Changes included

MANASSAS REGIONAL AIRPORT
AIRPORT LAYOUT PLAN UPDATE REPORT
MANASSAS REGIONAL AIRPORT
OCTOBER 2002
52
The published balanced runway length required at MTOW for the G-V on a standard day is 6,000-feet,
which, increasing by 15-percent to accommodate for hot days, would be approximately 6,900-feet.
Considering the G-V would not be typically operating at maximum takeoff weight, the runway length
requirement would be less than the 6,900-foot length. Using published performance criteria from
Gulfstream, a theoretical operating weight of an aircraft out of Manassas Regional Airport could be
determined using the following:
Maximum Zero Fuel Weight
54,500 pounds
Maximum Payload
6,500 pounds
Fuel Requirement:
Fuel burn rate @ 488 kts
480 gallons/hour
Flight time from HEF to LAX @460 kts
5.0 hours
30-minute reserve
5.5 hours
Total gallons of fuel
2640
Pounds per gallon of fuel
6.8
Total weight of fuel
17,952
18,000
Typical Operating Weight of G-V at HEF
79,000
Sources:
Gulfstream web page (www.gulfstream.com)
AR Group webpage (www.ar-group.com)
Note: Trip time between KHEF and KLAX is rounded to the nearest whole hour
Thus, the theoretical operating weight of a G-V out of Manassas Regional Airport would be
approximately 80,000 pounds, or 88-percent of MTOW which would require a runway length of
5,400-feet at a 10-degree flap setting at an ambient temperature of 30-degrees Celsius. Aircraft in
general require a longer runway length for operations during wet and slippery conditions. FAA AC
150/5325-4A ―Runway Length Requirements for Airport Design‖ states that the runway length derived
from performance curves for a specific aircraft should be increased by 15-percent to account for
poorer performance when a runway is wet and slippery. Increasing the 5,400-foot runway length by
15% would result in a recommended runway length of 6,200-feet.
Another way of understanding the benefit received by corporate aircraft operators currently based at
the airport would be to examine the payload restrictions placed by the existing runway length of
5,700-feet. During wet and slippery conditions, the effective runway length at Manassas Regional
Airport would be reduced to 5,000-feet (5,700/1.15). Assuming a flap setting of 10-degrees, the
maximum takeoff weight of a G-V accommodated by a 5,000-foot runway would be approximately
77,000 pounds, or 3,000 pounds less of usable load (fuel and/or passengers/cargo). The provision of
an additional 500-feet of runway length would allow a G-V (assuming the additional 3,000 pounds is
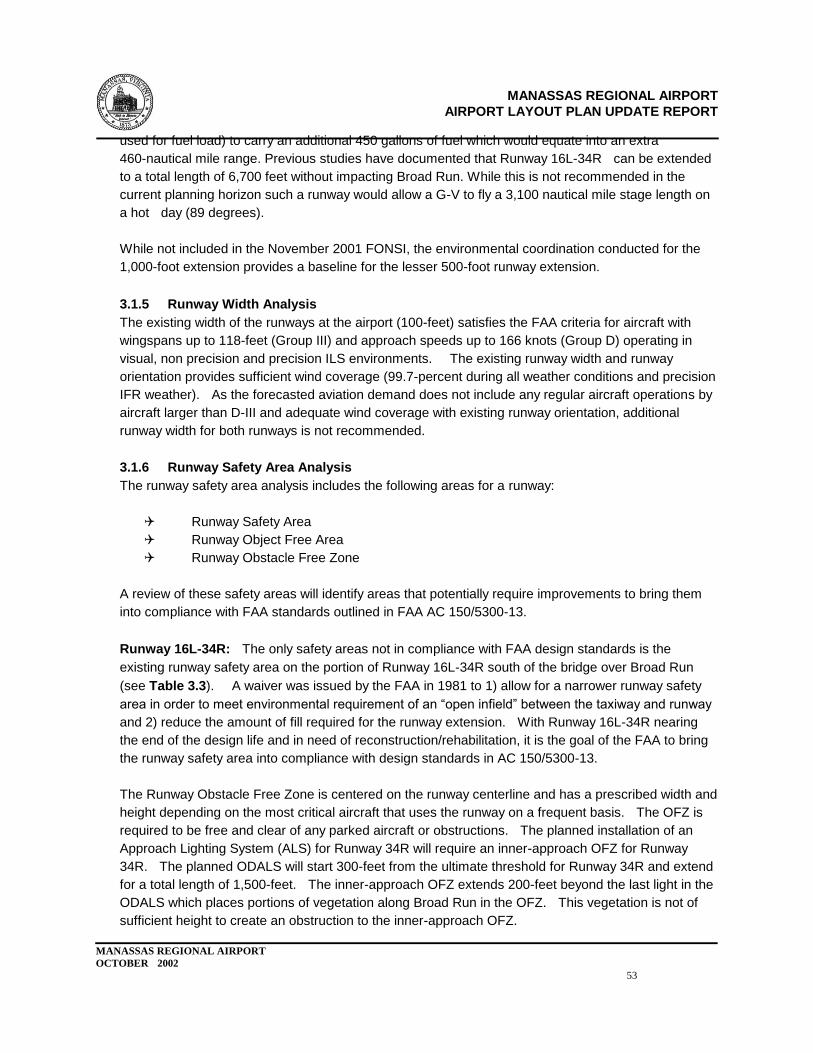
MANASSAS REGIONAL AIRPORT
AIRPORT LAYOUT PLAN UPDATE REPORT
MANASSAS REGIONAL AIRPORT
OCTOBER 2002
53
used for fuel load) to carry an additional 450 gallons of fuel which would equate into an extra
460-nautical mile range. Previous studies have documented that Runway 16L-34R can be extended
to a total length of 6,700 feet without impacting Broad Run. While this is not recommended in the
current planning horizon such a runway would allow a G-V to fly a 3,100 nautical mile stage length on
a hot day (89 degrees).
While not included in the November 2001 FONSI, the environmental coordination conducted for the
1,000-foot extension provides a baseline for the lesser 500-foot runway extension.
3.1.5 Runway Width Analysis
The existing width of the runways at the airport (100-feet) satisfies the FAA criteria for aircraft with
wingspans up to 118-feet (Group III) and approach speeds up to 166 knots (Group D) operating in
visual, non precision and precision ILS environments. The existing runway width and runway
orientation provides sufficient wind coverage (99.7-percent during all weather conditions and precision
IFR weather). As the forecasted aviation demand does not include any regular aircraft operations by
aircraft larger than D-III and adequate wind coverage with existing runway orientation, additional
runway width for both runways is not recommended.
3.1.6 Runway Safety Area Analysis
The runway safety area analysis includes the following areas for a runway:
Runway Safety Area
Runway Object Free Area
Runway Obstacle Free Zone
A review of these safety areas will identify areas that potentially require improvements to bring them
into compliance with FAA standards outlined in FAA AC 150/5300-13.
Runway 16L-34R: The only safety areas not in compliance with FAA design standards is the
existing runway safety area on the portion of Runway 16L-34R south of the bridge over Broad Run
(see Table 3.3). A waiver was issued by the FAA in 1981 to 1) allow for a narrower runway safety
area in order to meet environmental requirement of an ―open infield‖ between the taxiway and runway
and 2) reduce the amount of fill required for the runway extension. With Runway 16L-34R nearing
the end of the design life and in need of reconstruction/rehabilitation, it is the goal of the FAA to bring
the runway safety area into compliance with design standards in AC 150/5300-13.
The Runway Obstacle Free Zone is centered on the runway centerline and has a prescribed width and
height depending on the most critical aircraft that uses the runway on a frequent basis. The OFZ is
required to be free and clear of any parked aircraft or obstructions. The planned installation of an
Approach Lighting System (ALS) for Runway 34R will require an inner-approach OFZ for Runway
34R. The planned ODALS will start 300-feet from the ultimate threshold for Runway 34R and extend
for a total length of 1,500-feet. The inner-approach OFZ extends 200-feet beyond the last light in the
ODALS which places portions of vegetation along Broad Run in the OFZ. This vegetation is not of
sufficient height to create an obstruction to the inner-approach OFZ.
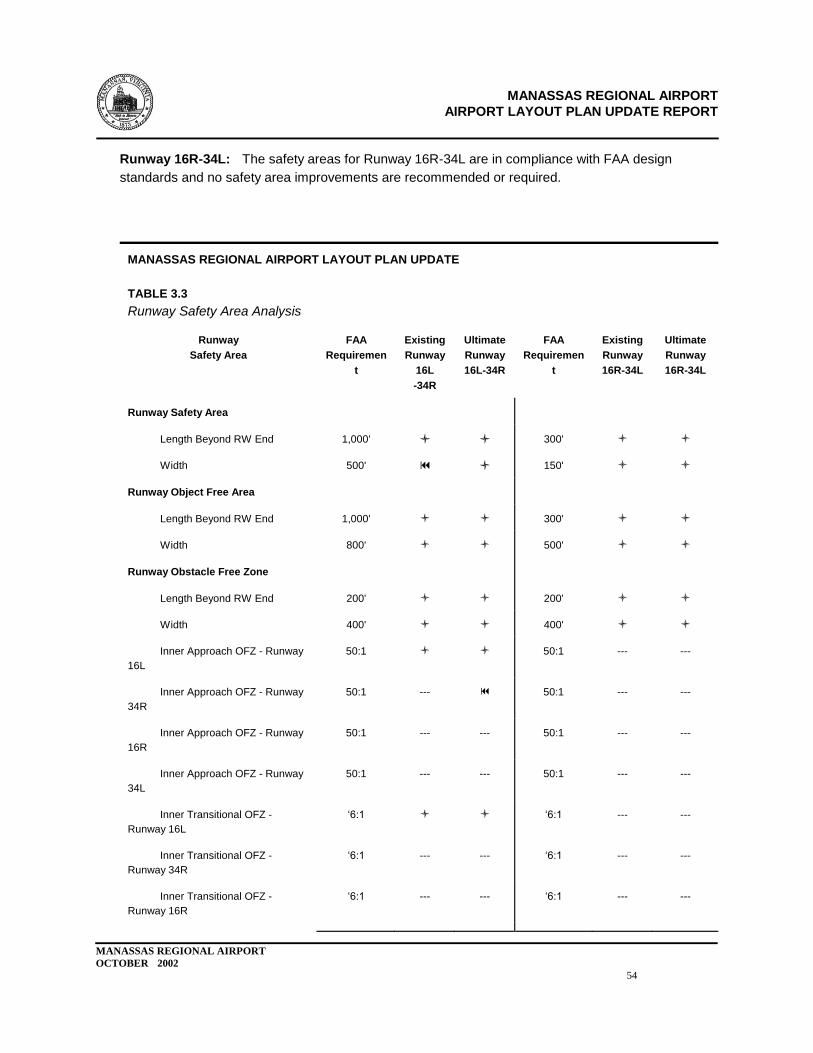
MANASSAS REGIONAL AIRPORT
AIRPORT LAYOUT PLAN UPDATE REPORT
MANASSAS REGIONAL AIRPORT
OCTOBER 2002
54
Runway 16R-34L: The safety areas for Runway 16R-34L are in compliance with FAA design
standards and no safety area improvements are recommended or required.
MANASSAS REGIONAL AIRPORT LAYOUT PLAN UPDATE
TABLE 3.3
Runway Safety Area Analysis
Runway
Safety Area
FAA
Requiremen
t
Existing
Runway
16L
-34R
Ultimate
Runway
16L-34R
FAA
Requiremen
t
Existing
Runway
16R-34L
Ultimate
Runway
16R-34L
Runway Safety Area
Length Beyond RW End
1,000'
300'
Width
500'
150'
Runway Object Free Area
Length Beyond RW End
1,000'
300'
Width
800'
500'
Runway Obstacle Free Zone
Length Beyond RW End
200'
200'
Width
400'
400'
Inner Approach OFZ - Runway
16L
50:1
50:1
---
---
Inner Approach OFZ - Runway
34R
50:1
---
50:1
---
---
Inner Approach OFZ - Runway
16R
50:1
---
---
50:1
---
---
Inner Approach OFZ - Runway
34L
50:1
---
---
50:1
---
---
Inner Transitional OFZ -
Runway 16L
‗6:1
‗6:1
---
---
Inner Transitional OFZ -
Runway 34R
‗6:1
---
---
‗6:1
---
---
Inner Transitional OFZ -
Runway 16R
‗6:1
---
---
‗6:1
---
---
MANASSAS REGIONAL AIRPORT
AIRPORT LAYOUT PLAN UPDATE REPORT
MANASSAS REGIONAL AIRPORT
OCTOBER 2002
55
Inner Transitional OFZ -
Runway 34L
‗6:1 --- --- ‗6:1 --- ---
Notes:
Runway 16L-34R designed for D-III aircraft, Runway 16R-34L designed for B-II aircraft with visibility minimums not lower
than 3/4-mile.
Runway Safety Area from Broad Run Bridge south to Runway 34R is only 300-feet in width.
= satisfies FAA criteria
= does not satisfy FAA criteria
— = Not applicable
Sources:
FAA AC 150/5300-13
Campbell&Paris Engineers, P.C. 2002
3.1.7 Runway Protection Zones Analysis
Runways 16L and 16R: The runway protection zones (RPZs) on the north approach to the airport
(Runway 16L and Runway 16R) are not anticipated to change during the planning horizon. The
existing precision instrument approach to Runway 16L requires a RPZ geometry of 1,000-foot inner
width, 2,500-foot length and
1,750-foot outer width. Runway 16R is not recommended to have any further instrumentation or
runway lighting and will continue to provide non-precision approach capabilities with visibility
minimums greater than 1-mile which requires a RPZ geometry of 500-foot inner width, 1,000-foot
length and 700-foot outer width. The airport has adequate interest in property within the portion of the
RPZs that are located off airport property. Through avigation easements and the Airport Overlay
District in the City of Manassas Zoning Code, the airport has control over the type and intensity of
development within the RPZs.
Runways 34L and 34R: The runway protection zone for Runway 34R is expected to change in
response to the planned change in runway length and installation of an approach lighting system.
While further instrumentation of the approaches to Runway 34R is not recommended because of the
location of restricted airspace and military operation areas to the south, the potential extension to
Runway 16L-34R and placement of an ODALS would require the relocation and widening of the
associated RPZ. The existing non-precision approaches to Runway 34R accommodate visibility
down to one mile and requires a RPZ geometry of 500-foot inner width, 1,700-foot length and
1,010-foot outer width, however, with a 1/4-mile visibility credit associated with the ODALS (if
approved), the ultimate RPZ dimensions would change to 1,000-foot inner width, 1,700-foot length,
and 1,510-foot outer width. Recent land acquisitions completed as part of the approved FAR Part
150 Noise Compatibility Program has resulted in the City having adequate property interest in land
within the ultimate RPZ. For Runway 34L, the existing non-precision instrumentation requires a RPZ
geometry of 500-foot inner width, 1000-foot length and 700-foot outer width. No further
instrumentation, approach aids or runway length is recommended on Runway 34L. A portion of the
existing runway protection zone (±12-acres) is located off airport property but does have an avigation
easement (40:1) covering much of the off-airport portion of the RPZ. In accordance with
recommendations in the Airport Master Plan, the City has identified this portion of land in the approved
MANASSAS REGIONAL AIRPORT
AIRPORT LAYOUT PLAN UPDATE REPORT
MANASSAS REGIONAL AIRPORT
OCTOBER 2002
56
5-year Airport Capital Improvement Program (ACIP) for purchase in fee simple. Until the property is
owned in fee simple, the airport has control, through the avigation easement and the Airport Overlay
District in the Prince William County Zoning Code; over the type and intensity of development within
the RPZs
3.1.8 FAR Part 77 Analysis
The Federal Aviation Administration has defined five imaginary surfaces that surround airports
receiving federal funding. The five imaginary surfaces are defined in FAR Part 77 and include the
primary surface, approach surface, transitional surface, horizontal surface and conical surface. Each
surface has different dimensional characteristics that are defined by visibility minimums and are
required to be free of any obstructions to air navigation. An obstruction to air navigation is any natural
or man-made object that penetrates any imaginary surface. It should be the goal of any airport to
remove any identified obstruction to air navigation so that safe operation of aircraft can continue and
operational minimums are not impacted.
The primary surface is a rectangular surface that is longitudinally centered on the runway centerline.
The elevation of any point of the primary surface is equal to the elevation of the nearest point on the
runway centerline. The width of the primary surface is dependent upon the type of approach existing
and planned for the runway and the visibility minimums. For runways with a specially prepared hard
surface, the primary surface extends 200-feet beyond the physical end of the runway.
Runway 16L-34R: With published minimums as low as 1/2-mile and a precision instrument
approach capability, the existing primary surface for Runway 16L-34R has a width of 1,000-feet
and a length of 6,100-feet (5,700-feet plus 200-feet off each runway end). With the planned
extension of the runway by 500-feet in the short-term, the ultimate primary surface for Runway
16L-34R will increase to 6,600-feet (6,200-feet plus 200-feet off each runway end) in length and
will continue to have a width of 1,000-feet. The existing and ultimate primary surface at the
airport for Runway 16L-34R appears to be free and clear of any obstructions.
Runway 16R-34L: The primary surface for Runway 16R-34L is 500-feet in width as only
non-precision instrument approaches are published for the runway. The total length of the
existing primary surface for Runway 16R-34L is 4,100-feet (3,700-feet plus 200-feet off each end
of the runway). The existing primary surface at the airport for Runway 16R-34L appears to be
free and clear of any obstructions.
The approach surface is a trapezoidal shaped plane, longitudinally centered on the extended runway
centerline and extends outward and upward from each end of the primary surface. The dimensions
and slope of the approach surface are determined by the approach planned or available for the
runway and visibility minimums.
Runway 16L-34R: As the primary surface for Runway 16L-34R is 1,000-feet in width, the inner
width of the approach surfaces are also 1,000-feet in width. The precision instrument approach
capability provided by the CAT I ILS results in the approach surface for Runway 16L having a 50:1
slope. The approach slope for Runway 16L extends for a horizontal distance of 10,000-feet at a
MANASSAS REGIONAL AIRPORT
AIRPORT LAYOUT PLAN UPDATE REPORT
MANASSAS REGIONAL AIRPORT
OCTOBER 2002
57
50:1 slope and at a 40:1 slope for an additional 40,000-feet. The outer width of the precision
approach slope is 16,000-feet. The non-precision instrument approach on Runway 34R has a
34:1 slope and extends for a horizontal distance of 10,000-feet with an outer width of 3,500-feet.
With the placement of the ODALS on Runway 34R and the potential 1/4-mile reduction in visibility
minimums, the outer width of the approach surface for Runway 34R could change to 4,000-feet.
An area of natural (vegetative) obstructions off the approach end of Runway 34R penetrates the
existing 34:1 non-precision approach surface. Approximately 36 acres of obstructions exist
within the approach surface and are recommended for removal in the short term planning period
(Years 0-5). The removal of the vegetative obstructions to Runway 34R will require coordination
with City, County and State agencies as a portion of the obstructions are located within the
Protection Area Site Analysis (PASA - conducted as part of the 2001 Environment Assessment)
defined limits of the Resource Protection Area associated with Broad Run. Should Runway
16L-34R be extended by 1,000-feet, an additional 63-acres of obstructions would require removal,
however, the additional areas of obstructions are outside the defined limits of the resource
protection area and are located on airport controlled property. The existing and ultimate
approach surfaces for Runway 34R have vegetative obstructions that need to be removed. The
latest photo-slopes for Runway 16L indicate minor penetrations to the existing and ultimate 50:1
precision approach surface. The city of Manassas is currently in the process of clearing these
penetrations .
Runway 16R-34L: The approach surfaces for Runway 16R and 34L at Manassas Regional
Airport are non-precision with 34:1 approach slopes. The inner width of the non-precision
approach surfaces for Runways 16R and 34L have inner widths of 500-feet and extend for a
horizontal distance of 10,000-feet and have outer widths of 3,500-feet. The existing and ultimate
approach surfaces for Runway 16R-34L appear to be clear of obstructions.
The transitional surface rises at a slope of one-foot vertically for every seven-feet of horizontal
distance (7:1) as measured at 90-degree angles from the edge of the primary surface and extended
runway centerline. The transitional surface continues at the 7:1 slope until intersecting the horizontal
surface at an elevation of 150-feet above the established airport elevation (192-feet msl). The only
obstruction to the transitional surfaces at Manassas Regional Airport appears to be the existing FAA
Air Traffic Control Tower which penetrates the FAR Part 77 Transitional Surface for Runway 16R-34L
by approximately ±20-feet.
The horizontal surface is a horizontal plane located 150-feet above the established airport elevation
and is longitudinally centered on each runway. The perimeter of the horizontal surface is formed by
swinging arcs of specified radii from the center of each end of the primary surface. The radii for the
swinging arcs is 5,000-feet for all runways designated as visual or utility and 10,000-feet for all other
runways. The existing and ultimate horizontal surfaces for the airport appear to be clear of
obstructions.
The conical surface extends outward and upward from the periphery of the horizontal surface at a
slope of one-foot vertical for every twenty-feet of horizontal distance (20:1). This conical surface
MANASSAS REGIONAL AIRPORT
AIRPORT LAYOUT PLAN UPDATE REPORT
MANASSAS REGIONAL AIRPORT
OCTOBER 2002
58
extends for a horizontal distance of 4,000-feet and has an ultimate elevation of 350-feet above the
established airport elevation. The existing and ultimate conical surfaces appear to be clear of
obstructions.
3.1.9 Runway and Taxiway Pavement Analysis
The recent reconstruction of Runway 16R-34L and the design efforts for Runway 16L-34R have
provided pavement analysis for both runways and the associated taxiway systems.
Runway 16R-34L: Runway 16R-34L was constructed during the original airport development in
1964 and then strengthened with a simple overlay in 1971. The runway was reconstructed in
2000 and the pavement is in excellent condition.
Runway 16L-34R: Nondestructive tests conducted as part of the preliminary engineering for the
reconstruction of Runway 16L-34R generally found the existing pavements in good structural
condition with the exception of a couple of areas of concern. The good overall structural
condition of the pavement can mainly be attributed to the existing cement treated base course
which exists under all of the tested pavements. In most cases, the NDT found the in-situ
strength of the CTB sufficient for that layer to be considered a fully functioning stabilized base.
However, some localized weaknesses were evident on the runway, Taxiway Bravo, Taxiway B2,
Taxiway Foxtrot and the hold apron on Taxiway Kilo. The preliminary design for the
reconstruction of Runway 16L-34R generally includes 4-inches of bituminous over 5-inches of
cement treated base course on top of the existing Runway 16L-34R pavement section, although
some sections will require a thicker pavement section in order to bring existing grades to the
required 0.8-percent over the last quarter of a runway designed for Category C/D aircraft.
3.2 NAVAIDS SYSTEM ANALYSIS
Since the 1990 Master Plan Update, several navigational aids have been implemented at the airport
including a precision instrument landing system, an Automated Weather Observation System level III
(AWOS-III), PAPI installation, and an Air Traffic Control Tower (ATCT). Subsequent FAA Flight
Checks for the ILS have indicated roughness in the localizer signal which has resulted in the visibility
minimums remaining at 3/4-mile instead of the 1/2-mile visibility minimums typically associated with
a CAT I ILS. Since the ILS is a federal facility, coordination with the FAA Airways & Facilities Division
should be taken in order to remove the course roughness and lower the visibility minimums for
Runway 16L to the standard 1/2-mile.
With the continuing increase in the use of the facility by business aviation users, additional visual
navigation aids should be considered in order to enhance the safety of operations. Specifically,
supplemental windcones and an approach lighting system should be installed at the airport.
A supplemental windcone provides pilots with a ―last minute‖ check of wind conditions on the runway
as they may have changed since receiving weather information from either the on-field AWOS or
lighted windcone. With the location of Manassas Regional Airport in close proximity to topographical
features that could influence the wind patterns at the airport, it is recommended that all four
approaches to the airport have a supplemental wind cone in the short-term (Years 0-5). Typically a

MANASSAS REGIONAL AIRPORT
AIRPORT LAYOUT PLAN UPDATE REPORT
MANASSAS REGIONAL AIRPORT
OCTOBER 2002
59
supplemental wind cone is sited in an area that is 500- to 1,000-feet down from the threshold and 250-
to 450-feet off of the runway centerline.
The implementation of an ODALS will provide pilots on approach to Runway 34R with guidance and
facilitate in the identification of the runway against other competing light sources. As further
instrumentation of the runway is not practical because of restricted airspace and military airspace to
the south, an approach lighting system is the most practical means to improve the safety of the
approach to the runway. The installation of the ODALS is recommended in the mid-term (Years
6-10). While the installation of the ODALS would improve approaches from the south in the
short-term, the ODALS is placed in the mid-term to allow sufficient time in the short-term (Years 0-5)
for the planning, design and construction of the recommended 500-foot runway extension.
Associated with the installation of the ODALS are dimensional changes for the RPZ, FAR Part 77
Approach Surface and Runway Obstacle Free Zone (OFZ). State and City funds would be required
for the ODALS. FAA AIP funds are not anticipated unless the installation of the approach lighting
system meets FAA APS-1 criteria.
3.3 AIR TRAFFIC CONTROL TOWER EVALUATION
The existing Manassas Regional Airport Air Traffic Control Tower was relocated from Centennial
Airport in Colorado in 1990. The placement of the ATCT was determined in the 1990 Master Plan
Update after considering multiple locations on the airport property. The existing location was chosen
because of the eastern view provided to the controllers.
The existing ATCT site results in a relatively narrow apron depth of 200-feet which only
accommodates seven (7) tie-down positions. The line of sight of a controller in a 58-foot tower height
(equal to the tower cab height of the existing ATCT assuming the controller is 15-feet below the
surveyed height of the ATCT) currently intersects the existing holding bay associated with Taxiway
Bravo at 1-degree and the ultimate holding bay (location 6 on Figure 3-1) at 49-minutes.
To determine an appropriate site for a potential relocation of the ATCT, mandatory and
non-mandatory siting requirements established by the FAA were used:
Mandatory Requirements
A clear, unobstructed and direct view to each approach area, runway, taxiway and other
operations areas requiring control must be available.
The site must be able to accommodate required facilities (i.e., parking, access, tower
building, etc.). Utilities must be provided.
Height limitations imposed by FAR Part 77 must be adhered to unless deviations are
absolutely necessary to satisfy other mandatory siting criteria.
The tower must be sited so existing or planned electronic navigational facilities will not be
impacted.
Non-Mandatory Requirements
Depth perception of all surface areas to be controlled should be available. Perception is
enhanced where the controller‘s line of site is perpendicular or oblique, not parallel, to the
MANASSAS REGIONAL AIRPORT
AIRPORT LAYOUT PLAN UPDATE REPORT
MANASSAS REGIONAL AIRPORT
OCTOBER 2002
60
aircraft movement areas and where the line of sight intersects the airport surface at a
vertical angle greater than 35-minutes (0.58-degrees).
The tower cab should be oriented to face north or, alternatively east, south or west in that
order of preference. Avoid orientations that will place a view of the runway approach in
line with a rising or setting sun.
Visibility should not be impaired by direct or indirect external ight sources. Exterior noise
should be at a minimum.
FIGURE 3-1
Areas of Manassas Regional Airport Analyzed for ATCT Line-of-Sight Requirements
Access to a site should avoid crossing areas of aircraft operations and should function
with planned expansion of airport facilities in the future.
As the existing tower is located in the West Complex and provides a clear and unobstructed view of
the aircraft operating area, the search area for an appropriate new tower location focused on the West
Complex. Available land for parking, administrative area and the tower base and cab totaled
approximately 1/2-acre of land. The recommended location is approximately 380-feet to the west of
the existing tower location on the opposite side of Observation Road. This would preserve as much
airside access for apron operations as possible and move the tower far enough to the west to no
longer be a FAR Part 77 Transitional Surface penetration. The line-of-sight criteria was analyzed by
identifying both existing and planned critical aircraft movement areas on the airport. Eight locations
were analyzed to see if the controller line-of-sight intersected these points above the 35-minute
mandatory threshold (see Table 3.4 and Figure 3-1). The eight locations included five threshold
crossings (one for each existing threshold, plus the potential 1,000-foot relocated threshold for
Runway 34R) and three aircraft movement areas. The most distant location from the ATCT was the
MANASSAS REGIONAL AIRPORT
AIRPORT LAYOUT PLAN UPDATE REPORT
MANASSAS REGIONAL AIRPORT
OCTOBER 2002
61
area near the existing Wakeman Drive/Observation Road intersection that could support additional
airside apron development in the long-term. As can be seen in Table 3.4, the minimum height of
the relocated ATCT is 52-feet agl. At the
MANASSAS REGIONAL AIRPORT LAYOUT PLAN UPDATE
TABLE 3.4
Alternative Cab Heights Analyzed for Tower Line-of-Sight to Selected Areas of the
Airport
Location
Number on
Figure 3-1
Approximate
Elevation
Distance from
Proposed Tower
Location
Required
Cab Height
(agl)
Threshold to Runway 16L
1
192.5
2,957
30.00
Threshold to Runway 16R
2
185.2
2,590
26.00
Threshold to Runway 34L
3
177.4
1,659
17.00
Threshold to Existing Runway 34R
4
177.6
3,748
38.00
Threshold to 6,700-foot Runway
34R
5
177.6
4,658
47.00
Taxiway Bravo Holding Bay
6
177.6
4,890
50.00
Apron in front of Aurora
7
195.3
4,491
46.00
―Northwest‖ Apron Development
8
190.0
5,113
52.00
Notes:
Northwest Apron Development assumed to be 190-feet msl
New threshold to 34R assumed to carry 0.0-percent slope from existing threshold
Source:
Campbell&Paris Engineers, P.C. 2002
proposed location of the ATCT, the transitional surface has an elevation of 105-feet agl. Thus, it is
recommended that in the mid-term planning period, the ATCT be reconstructed in the new location
with a tower height between 52- and 105-feet agl.
There are several benefits associated with the relocation of the ATCT by 380-feet to the west. The
primary benefit is related to removing the ATCT from the airside and to the landside, thus creating
more airside land for development. The relocation of the ATCT and the demolition of the existing
13,400-square foot building would allow for a 350-foot deep apron and create 33 more tie-down
positions. Secondary benefits include the removal of a penetration to the FAR Part 77 Transitional
Surface for Runway 16R-34L. While the existing ATCT is fixed by function and appropriately marked
MANASSAS REGIONAL AIRPORT
AIRPORT LAYOUT PLAN UPDATE REPORT
MANASSAS REGIONAL AIRPORT
OCTOBER 2002
62
as an obstruction, the removal of the ATCT would increase the safety of operations at the airport. The
relocation of ATCT could mean possible ―cost sharing‖ or contract
tower options. The Investment Reform Act of the 21st century (Air-21) allows the cost sharing program
to share cost of air traffic modernization projects, under which airport/airline joint ventures may
procure and install facilities and equipment in cooperation with the FAA.
It is recommended that the construction of a new tower be placed in the mid-term (Years 6-10)
planning horizon. The forecasted increase in use of the airport by business aviation turbo-jets (i.e.,
Gulfstream V, BBJ), coupled with the expected 3.5-percent annual rate of growth in operations
handled at the Dulles International Tower over by the planning horizon further qualifies the need for a
replacement tower at the airport. Should a new tower not be constructed, all airspace issues would
revert back to Dulles International Airport which would further increase the workload for Dulles
controllers.
3.4 AIRCRAFT RESCUE AND FIREFIGHTING (ARFF) FACILITY
The FAA requirement that airports provide adequate Aircraft Rescue and Firefighting (ARFF) facilities is outlined in Federal Aviation Regulation (FAR) Part 139. The FAA issued a Notice of Proposed
Rule Making (NPRM) in June 2000 that would substantially revise which airports would need to
adhere to Part 139. As of the date of this report, Part 139 is applicable to land airports which serve
any scheduled or unscheduled passenger operation conducted with aircraft having a seating capacity
of more than 30 passengers. Should the NPRM take effect, this threshold would be reduced from
30 passengers to 10 passengers. While Manassas Regional Airport currently does not have
scheduled commercial service with aircraft having 10 or more seats, the potential change in Part 139
would make the potential of Manassas Regional Airport having to adhere to Part 139 more probable.
The type of fire extinguishing agents and equipment used to comply with FAA requirements is based
on the size of the aircraft providing service to the airport. While Manassas Regional Airport does not
meet the criteria for Part 139, the City has an intergovernmental agreement with Prince William
County to provide emergency response services at the airport. Two scenarios were modeled to
determine adequate ARFF facilities: scheduled operations at Manassas Regional Airport and
continued general aviation operations with a higher mix of business aviation aircraft.
3.4.1 ARFF Requirements Should Scheduled Operations Occur
While the forecasts of future aviation activity does not specifically identify any future activity by
commercial aircraft at Manassas Regional Airport, the possibility of some type of scheduled
commercial service in the future has been acknowledged. Should commercial aircraft activity occur
at the airport, the type of facilities would probably limit the aircraft to those identified as Index A
(aircraft less than 90-feet in length) in FAA AC 150/5210-6C ―Aircraft Fire and Rescue Facilities and
Extinguishing Agents.‖ The ARFF requirements for Index A is as follows:
One vehicle carrying at least 500 pounds of sodium-based dry chemical or halon 1211; or
One vehicle carrying at least 450 pounds of potassium-based dry chemical and water with
a commensurate quantity of AFFF (Aqueous Film Forming Foam) to total 100 gallons, for
simultaneous dry chemical and AFFF foam application
MANASSAS REGIONAL AIRPORT
AIRPORT LAYOUT PLAN UPDATE REPORT
MANASSAS REGIONAL AIRPORT
OCTOBER 2002
63
Be able to respond to the mid-point of the furthest runway serving air carrier aircraft within
3 minutes.
3.4.2 ARFF Requirements for General Aviation Facilities
Should no commercial aircraft operations occur at Manassas Regional Airport to warrant the
placement of a dedicated ARFF facility, FAA AC 150/5210-6C provides non-regulatory guidance for
ARFF facilities at airports serving general aviation aircraft. For general aviation airports, the
response index is based on annual operations and not on average daily departures. The FAA has
established two response indices:
FIGURE 3-2
ARFF Locations Analyzed for Response Times
Index 1: general aviation airports that have more than 1,825 annual departures of aircraft
more than 30-feet in length but not more than 45-feet in length; and
Index 2: general aviation airports that have more than 1,825 annual departures of aircraft
more than 45-feet in length but not more than 60-feet in length.
With the forecasted operations by turbo-prop and turbo-jet aircraft (which are typically between 46-feet
in length (King Air 350) and 96-feet in length (G-V)) forecasted to total ±12,500 operations by 2020,
MANASSAS REGIONAL AIRPORT
AIRPORT LAYOUT PLAN UPDATE REPORT
MANASSAS REGIONAL AIRPORT
OCTOBER 2002
64
Manassas Regional Airport falls into response Index 2 for general aviation airports. The primary
firefighting agent can either be AFFF or Protein Foam with dry chemicals comprising the secondary
firefighting agent. Only one response vehicle is required and should have a capacity of at least 190
gallons of water for foam production and
300 pounds for dry chemical agent storage.
3.4.3 ARFF Facility Location Analysis
The ARFF facility should be located so that an ARFF vehicle can reach the midpoint of the furthest
runway within 3 minutes of an alarm. Radio communication equipment in the ARFF vehicle should
include a standard two-way radio in order to communicate with other response vehicles and the
ATCT. The most advantageous location of an ARFF facility would be in a location with direct access
to the crossfield connector taxiways, which minimizes the need for turning movements and optimizes
the responsiveness of ARFF vehicles. Assuming a standard response vehicle travel speed of
45-miles per hour (or 3,960-feet per minute), three alternative locations for the ARFF station were
identified and are presented in Figure 3-2.
All locations analyzed had response times below3-minutes. Thus, the optimum location of anARFF
facility is in a location that does not hinder future development of aviation facilities. It is
recommended that an ARFF facility be constructed in Location 1 during the mid-term (Years 6-10).
This location would have to include traffic signalization for Wakeman Drive.
3.5 EAST AND WEST COMPLEX FACILITIES ANALYSIS
The following section will present the recommended facility requirements based on the aviation activity
forecasts presented in Section Two. Two sets of facility requirements are presented for each of the
major facilities at the airport: hangars, aprons, and fuel farm. One set of facility requirements is
based on the forecasts presented in the Virginia Air Transportation System Plan published by the
Virginia Department of Aviation (DOAV) and a second set of facility requirements is based on the
regression forecasts of aviation demand presented in Table 2.3. Each set of facility requirements will
be presented for the next twenty years using short-term (Years 0-5), mid-term (Years 6-10) and
long-term (Years 11-20). By presenting these two levels of facility requirements, flexibility is provided
for the airport to meet localized demand in response to potential tenant inquiries or growth in based
aircraft and operations greater than that accounted for by the VATSP.
Planning factors have been developed for all of the major aviation facilities at the airport and are
presented in the following sections. Space requirements have been analyzed based on the size of
the various aircraft types (single-engine, multi-engine, turbo-prop and turbo-jet, and helicopter)
expected to use Manassas Regional Airport. Tie-down positions for based aircraft assume nested
tie-down positions and power-in/power-out tie-down positions for transient aircraft. Similarly, hangar
space requirements for storage and maintenance have been developed including associated office
support space needs and automobile parking requirements. Fuel consumption associated with
based and transient aircraft operations have been estimated using historical fuel consumption and
operation levels at the airport.
3.5.1 T-Hangar Requirements
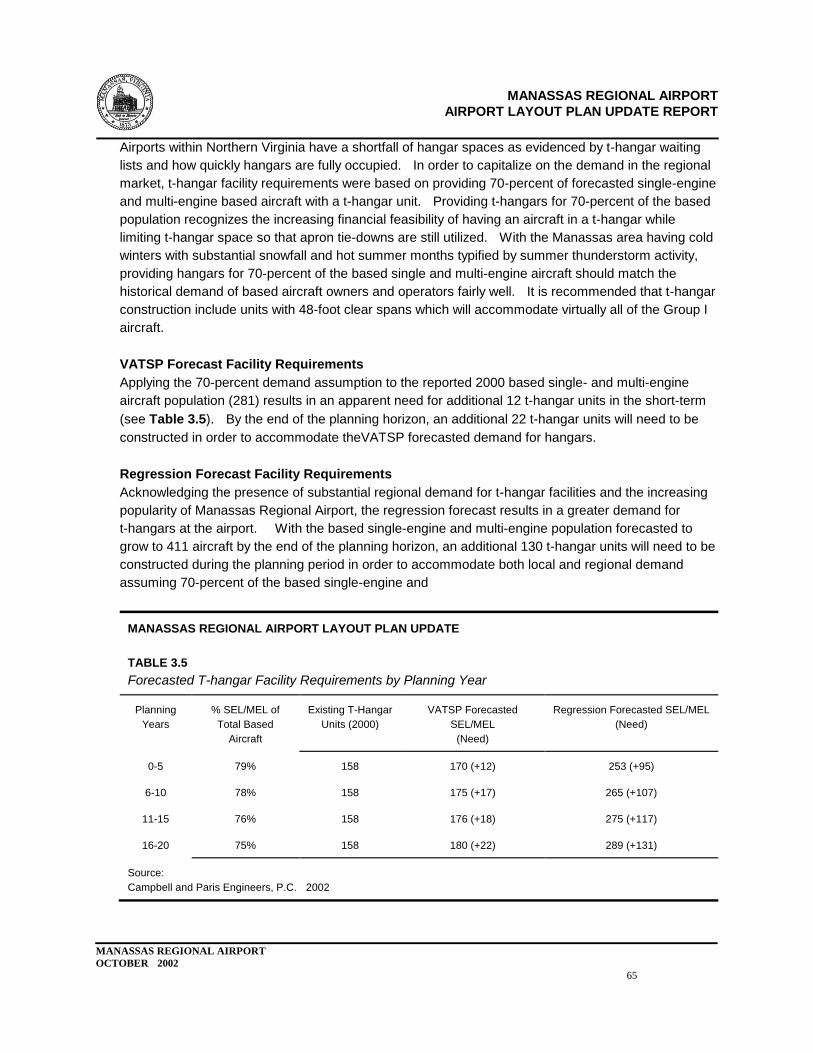
MANASSAS REGIONAL AIRPORT
AIRPORT LAYOUT PLAN UPDATE REPORT
MANASSAS REGIONAL AIRPORT
OCTOBER 2002
65
Airports within Northern Virginia have a shortfall of hangar spaces as evidenced by t-hangar waiting
lists and how quickly hangars are fully occupied. In order to capitalize on the demand in the regional
market, t-hangar facility requirements were based on providing 70-percent of forecasted single-engine
and multi-engine based aircraft with a t-hangar unit. Providing t-hangars for 70-percent of the based
population recognizes the increasing financial feasibility of having an aircraft in a t-hangar while
limiting t-hangar space so that apron tie-downs are still utilized. With the Manassas area having cold
winters with substantial snowfall and hot summer months typified by summer thunderstorm activity,
providing hangars for 70-percent of the based single and multi-engine aircraft should match the
historical demand of based aircraft owners and operators fairly well. It is recommended that t-hangar
construction include units with 48-foot clear spans which will accommodate virtually all of the Group I
aircraft.
VATSP Forecast Facility Requirements
Applying the 70-percent demand assumption to the reported 2000 based single- and multi-engine
aircraft population (281) results in an apparent need for additional 12 t-hangar units in the short-term
(see Table 3.5). By the end of the planning horizon, an additional 22 t-hangar units will need to be
constructed in order to accommodate theVATSP forecasted demand for hangars.
Regression Forecast Facility Requirements
Acknowledging the presence of substantial regional demand for t-hangar facilities and the increasing
popularity of Manassas Regional Airport, the regression forecast results in a greater demand for
t-hangars at the airport. With the based single-engine and multi-engine population forecasted to
grow to 411 aircraft by the end of the planning horizon, an additional 130 t-hangar units will need to be
constructed during the planning period in order to accommodate both local and regional demand
assuming 70-percent of the based single-engine and
MANASSAS REGIONAL AIRPORT LAYOUT PLAN UPDATE
TABLE 3.5
Forecasted T-hangar Facility Requirements by Planning Year
Planning
Years
% SEL/MEL of
Total Based
Aircraft
Existing T-Hangar
Units (2000)
VATSP Forecasted
SEL/MEL
(Need)
Regression Forecasted SEL/MEL
(Need)
0-5
79%
158
170 (+12)
253 (+95)
6-10
78%
158
175 (+17)
265 (+107)
11-15
76%
158
176 (+18)
275 (+117)
16-20
75%
158
180 (+22)
289 (+131)
Source:
Campbell and Paris Engineers, P.C. 2002
MANASSAS REGIONAL AIRPORT
AIRPORT LAYOUT PLAN UPDATE REPORT
MANASSAS REGIONAL AIRPORT
OCTOBER 2002
66
multi-engine aircraft will require hangar space. In the short-term (Years 0-5), an additional 95
t-hangar units will need to be constructed in order to accommodate local and regional demand (see
Table 3.5).
3.5.2 Storage Hangar and Maintenance Requirements
The forecasted demand for storage and maintenance space results in an apparent market for an
additional 10,000 to 40,000 square feet of hangar space at the airport. However, simply reserving
space for a hangar of sufficient size to meet the forecasted demand would ignore market competition.
Recognizing that multiple hangars could be constructed to meet the forecasted demand, the plan
identifies facilities above and beyond the facility requirements.
Typically the owners and operators of larger and more expensive corporate turbo-prop, turbo-jet and
helicopters prefer to store their aircraft in corporate hangars. Typical dimensions of these hangars
are around 100-feet in depth and 150-200-feet in width (between 10,000 and 20,000-square feet).
The larger corporate turbo-jets require door heights of approximately 30-feet in order to provide
adequate tail clearances. In order to provide necessary wingtip clearances and enough capacity to
store maintenance equipment and provide space to maneuver around the aircraft, space
requirements for the aircraft were assumed to be two times the hangar space requirement. The
space requirements for each type of aircraft is as follows:
Single/Multi-engine
aircraft (35-foot to
45-foot wingspan):
3,600 square
feet each
Turbo-prop (i.e., Beech
King Air 350):
7,800
square feet each
Turbo-jet (i.e.,
Gulfstream V):
7,800 square
feet each
Helicopter (i.e.,
Robinsons):
3,600 square
feet each
Additionally, assumptions were used to determine the demand for storage space for the various
aircraft groups. Using a similar approach as that used in the development of demand for t-hangar
units, the following planning factors were used to forecast the demand for corporate hangar space:
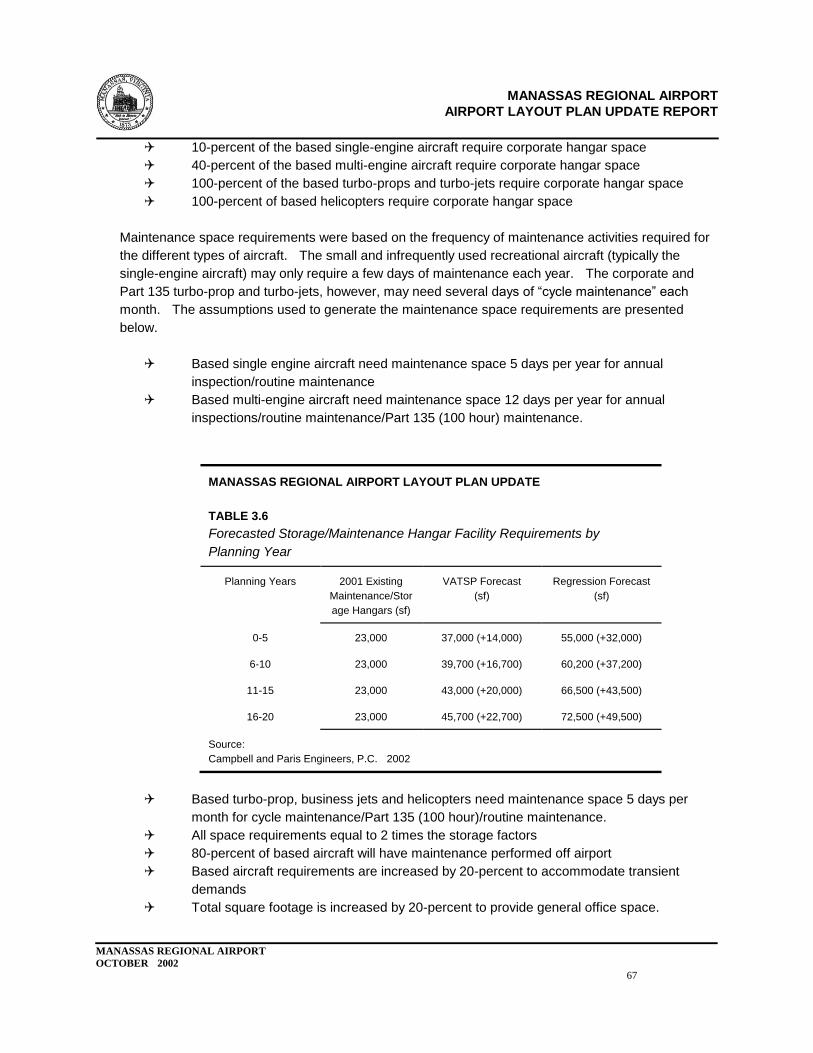
MANASSAS REGIONAL AIRPORT
AIRPORT LAYOUT PLAN UPDATE REPORT
MANASSAS REGIONAL AIRPORT
OCTOBER 2002
67
10-percent of the based single-engine aircraft require corporate hangar space
40-percent of the based multi-engine aircraft require corporate hangar space
100-percent of the based turbo-props and turbo-jets require corporate hangar space
100-percent of based helicopters require corporate hangar space
Maintenance space requirements were based on the frequency of maintenance activities required for
the different types of aircraft. The small and infrequently used recreational aircraft (typically the
single-engine aircraft) may only require a few days of maintenance each year. The corporate and
Part 135 turbo-prop and turbo-jets, however, may need several days of ―cycle maintenance‖ each
month. The assumptions used to generate the maintenance space requirements are presented
below.
Based single engine aircraft need maintenance space 5 days per year for annual
inspection/routine maintenance
Based multi-engine aircraft need maintenance space 12 days per year for annual
inspections/routine maintenance/Part 135 (100 hour) maintenance.
MANASSAS REGIONAL AIRPORT LAYOUT PLAN UPDATE
TABLE 3.6
Forecasted Storage/Maintenance Hangar Facility Requirements by
Planning Year
Planning Years
2001 Existing
Maintenance/Stor
age Hangars (sf)
VATSP Forecast
(sf)
Regression Forecast
(sf)
0-5
23,000
37,000 (+14,000)
55,000 (+32,000)
6-10
23,000
39,700 (+16,700)
60,200 (+37,200)
11-15
23,000
43,000 (+20,000)
66,500 (+43,500)
16-20
23,000
45,700 (+22,700)
72,500 (+49,500)
Source:
Campbell and Paris Engineers, P.C. 2002
Based turbo-prop, business jets and helicopters need maintenance space 5 days per
month for cycle maintenance/Part 135 (100 hour)/routine maintenance.
All space requirements equal to 2 times the storage factors
80-percent of based aircraft will have maintenance performed off airport
Based aircraft requirements are increased by 20-percent to accommodate transient
demands
Total square footage is increased by 20-percent to provide general office space.
MANASSAS REGIONAL AIRPORT
AIRPORT LAYOUT PLAN UPDATE REPORT
MANASSAS REGIONAL AIRPORT
OCTOBER 2002
68
VATSP Forecast Facility Requirements
Applying these planning factors to the VATSP forecasted demand of aviation results in the total need
for approximately 37,000 square feet of maintenance/storage hangar space by the end of the
short-term planning period. By the end of the planning horizon, local and regional demand would
require approximately 9,000 square feet of additional maintenance/storage hangar space for a total of
46,000 square feet (see Table 3.6).
Regression Forecast Facility Requirements
With a more aggressive forecast of based aircraft, the regression model results in a need for more
maintenance/storage hangar space than the VATSP forecast. Applying the planning factors to the
regression forecasts of based aircraft results in the need for a total of 55,000 square feet of
maintenance/storage space by the end of the short-term planning period which is ±32,000 square feet
more than the existing maintenance/storage space at the airport. By the end of the planning horizon,
local and regional demand would require approximately 37,500-square feet of additional
maintenance/storage space than is available today (see Table 3.6).
3.5.3 Support Facility Analysis
Office and administrative space is typically required to support the storage and maintenance hangar
functions. Typical hangar development projects at Manassas Regional Airport have provided
administrative/office space immediately adjacent to the hangar itself and represent between 20-
and30-percent of total hangar space. With the office and administrative space and hangar
development, automobile parking requirements need to be evaluated to determine any potential
deficits in parking spaces for employee and visitor parking. The automobile parking demand was
developed based on the following planning factors:
One space required for each 1,000 square feeet of storage and maintenance hangar
space
One space required for each 300 feet of office support space
One space per peak hour operation
One space per three apron tie-downs
Applying these planning factors to the existing hangar development results in no apparent need for
additional automobile parking facilities in the short-term. While the airport has sufficient parking in
total, the distribution of parking spaces results in relatively underutilized parking spaces (i.e., near the
ATCT) that would be better utilized in other locations (i.e., near Aerographics). As additional facilities
are constructed at the airport, appropriate levels of automobile parking should also be constructed
adjacent to the office and hangar components. This would minimize walking distances for both
employees and visitors and would promote a more efficient distribution of parking spaces.
3.5.4 Fuel Facilities and Storage
Fuel sales at Manassas Regional Airport in calendar year 2000 totaled 1.7 million gallons, of which,
approximately 76-percent was AvGas and 24-percent was JetA. Fuel sales for calendar year 2001
(up to August) were on pace to equal the total for calendar year 2000. Average daily consumption of
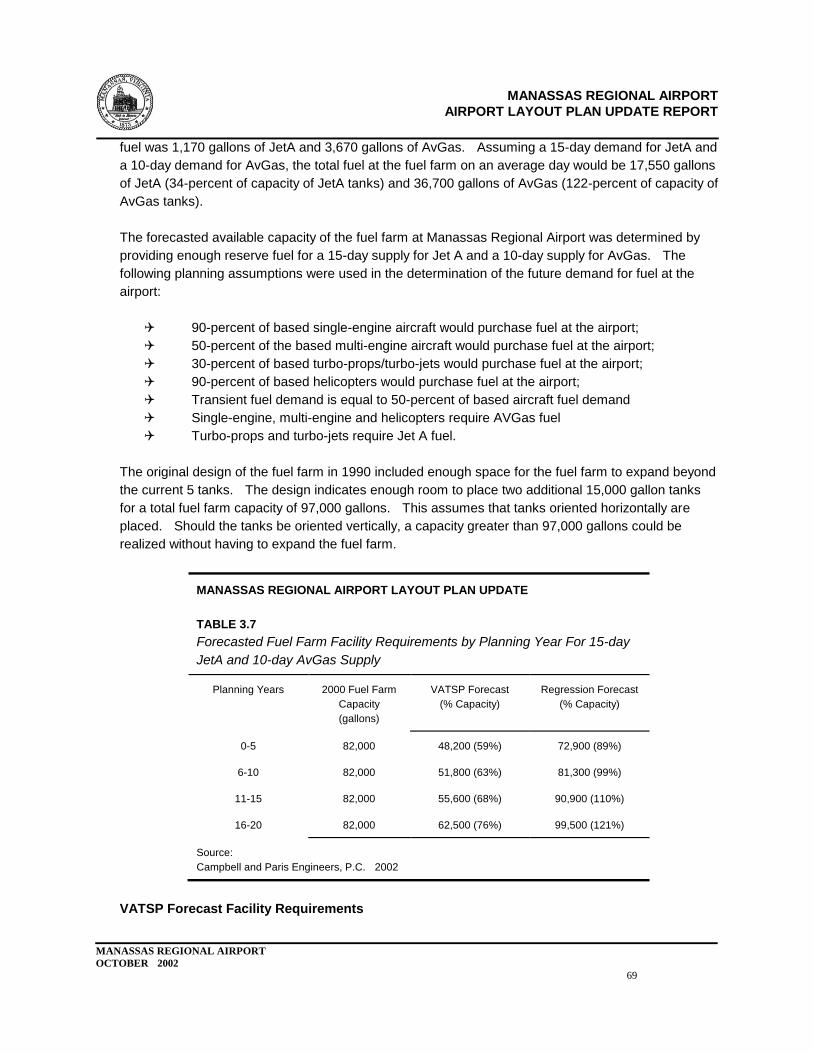
MANASSAS REGIONAL AIRPORT
AIRPORT LAYOUT PLAN UPDATE REPORT
MANASSAS REGIONAL AIRPORT
OCTOBER 2002
69
fuel was 1,170 gallons of JetA and 3,670 gallons of AvGas. Assuming a 15-day demand for JetA and
a 10-day demand for AvGas, the total fuel at the fuel farm on an average day would be 17,550 gallons
of JetA (34-percent of capacity of JetA tanks) and 36,700 gallons of AvGas (122-percent of capacity of
AvGas tanks).
The forecasted available capacity of the fuel farm at Manassas Regional Airport was determined by
providing enough reserve fuel for a 15-day supply for Jet A and a 10-day supply for AvGas. The
following planning assumptions were used in the determination of the future demand for fuel at the
airport:
90-percent of based single-engine aircraft would purchase fuel at the airport;
50-percent of the based multi-engine aircraft would purchase fuel at the airport;
30-percent of based turbo-props/turbo-jets would purchase fuel at the airport;
90-percent of based helicopters would purchase fuel at the airport;
Transient fuel demand is equal to 50-percent of based aircraft fuel demand
Single-engine, multi-engine and helicopters require AVGas fuel
Turbo-props and turbo-jets require Jet A fuel.
The original design of the fuel farm in 1990 included enough space for the fuel farm to expand beyond
the current 5 tanks. The design indicates enough room to place two additional 15,000 gallon tanks
for a total fuel farm capacity of 97,000 gallons. This assumes that tanks oriented horizontally are
placed. Should the tanks be oriented vertically, a capacity greater than 97,000 gallons could be
realized without having to expand the fuel farm.
MANASSAS REGIONAL AIRPORT LAYOUT PLAN UPDATE
TABLE 3.7
Forecasted Fuel Farm Facility Requirements by Planning Year For 15-day
JetA and 10-day AvGas Supply
Planning Years
2000 Fuel Farm
Capacity
(gallons)
VATSP Forecast
(% Capacity)
Regression Forecast
(% Capacity)
0-5
82,000
48,200 (59%)
72,900 (89%)
6-10
82,000
51,800 (63%)
81,300 (99%)
11-15
82,000
55,600 (68%)
90,900 (110%)
16-20
82,000
62,500 (76%)
99,500 (121%)
Source:
Campbell and Paris Engineers, P.C. 2002
VATSP Forecast Facility Requirements
MANASSAS REGIONAL AIRPORT
AIRPORT LAYOUT PLAN UPDATE REPORT
MANASSAS REGIONAL AIRPORT
OCTOBER 2002
70
Applying the planning assumptions to the VATSP forecasts, the demand for fuel at the airport would
increase to approximately 63,000 gallons by 2020 which is approximately 77-percent of the existing
capacity of the fuel
farm (82,000 gallons). The 15-day demand for Jet A fuel for turbo-prop and turbo-jet aircraft is
expected to total 33,400 gallons by 2020 which is 64-percent of capacity. The 10-day demand for
AvGas fuel for single-engine, multi-engine and helicopter aircraft is expected to total approximately
29,000 gallons which is 97-percent of capacity. It is recommended that an additional 15,000 gallon
AvGas fuel tanks be placed at the fuel farm in the long-term(Years 16-20) period.
Regression Forecast Facility Requirements
Applying the planning assumptions to the regression forecasts results in a higher demand for fuel
facilities than the VATSP forecasts. By the end of the planning horizon, the demand for fuel could be
115-percent of available capacity in 2000. The 10-day demand for AvGas could total 46,000 gallons
which is 153-percent of available capacity (+16,000 gallons) while the 15-day demand for JetA fuel
could total 53,000 gallons which is 102-percent of available capacity (+1,000 gallons). Assuming no
capacity increases, the demand for AvGas will exceed capacity somewhere in the short-term (Years
0-5). It is recommended that an additional 15,000 gallon AvGas tank be constructed in the
short-term with an additional 15,000 gallon AvGas fuel tank and 12,000 gallon JetA fuel take being
placed at the airport in the long-term (Years 16-20).
The forecasted demand for fuel resulting in an additional 42,000 gallons of capacity, the capacity of
the existing fuel farm will need to be increased A detailed planning analysis should be conducted
when the demand for fuel reaches 80-percent of the capacity of the existing fuel farm capacity.
3.5.5 Aircraft Parking and Tie-Down Apron Requirements
A certain segment of the based aircraft population will require paved apron tie-downs versus storing
their aircraft in a hangar unit. In order to determine the required apron tie-downs, the following
planning assumptions were made:
30-percent of based single-engine aircraft will require a paved tie-down
30-percent of based multi-engine aircraft will require a paved tie-down
Each based aircraft requiring a paved tie-down will need 450-square yards of apron
VATSP Forecast Facility Requirements
Using the forecast of based aircraft presented in Section Two, the total tie-down space required for all
based aircraft will total ±39,000-square yards by 2020. While only a small percentage of based
aircraft will require a paved tie-down area, virtually all transient aircraft will require a tie-down since
they are aircraft not based at the airport. Transient aircraft tie-down requirements were determined
by the following planning assumptions:
Transient aircraft will account for approximately 40-percent of average day operations
during the peak month (equivalent to local versus itinerant operations mix);
MANASSAS REGIONAL AIRPORT
AIRPORT LAYOUT PLAN UPDATE REPORT
MANASSAS REGIONAL AIRPORT
OCTOBER 2002
71
Total ―transient‖ average day operations are divided by 2 to determine total number of
transient aircraft;
Approximately 85-percent of transient aircraft will require a tie-down;
Transient aircraft fleet mix assumed to equal fleet mix of based aircraft;
Transient single-engine/multi-engine aircraft will require 600 sy each for
power-in/power-out
Transient turbo-prop, turbo-jet and helicopters will require 1,750 sy each for
power-in/power-out.
Based on these assumptions, the transient aircraft will require an additional ±76,000 square yards of
apron for a total apron requirement of ±115,000 square yards by 2020 for both based and transient
aircraft. Typical demand/capacity guidance from the FAA states that when demand for a particular
facility reaches 60- to 80-percent of the capacity, then the planning and design of capacity enhancing
projects should begin. To accommodate for seasonal peaks, unexpected growth in either based
aircraft or transient activity at the airport, or to accommodate any potential t-hangar deficits; the
apron demand/capacity ratio should not exceed 80-percent. With the forecasted based aircraft and
operations presented in the VATSP and the application of the above mentioned planning
assumptions, the apron demand/capacity ratio will exceed 80-percent sometime in the long-term
planning period (Years 16-20).
Regression Forecast Facility Requirements
With a more aggressive forecast of based aircraft, the regression forecast facility requirements for
apron space are higher than the VATSP forecasts. The transient demand for apron tie-downs is
approximately the same since the regression and VATSP operations forecasts are similar. By the
end of the planning horizon, the apron requirement for based and transient aircraft will total
approximately 144,500 square yards which is approximately 6,500 square yards more than the apron
available in 2000. With the forecasted based aircraft and operations presented in the regression
analysis, the apron demand/capacity ratio will exceed 80-percent sometime in the short-term planning
period (Years 0-5).
3.5.6 Property Acquisition
The airport has identified several parcels of land for potential property acquisition. Some of the
property acquisition is proposed so that the airport can have fee simple ownership of property located
in the Runway 34L runway protection zone (RPZ). The purchase of this property would have the
additional benefit of providing potential fill material for safety area improvements associated with
Runway 16L-34R. Additional parcels of land (approximately ±36 acres) are identified for acquisition
as these properties are within the 65 Ldn established as part of the established Part 150 study for the
airport. A third area of property acquisition is a ±15 acre parcel of land located to the east of
Wakeman Drive. This parcel of land is identified for non-airside dependent development and for a
potential Aircraft Rescue and Firefighting (ARFF) station (see Section 3.4.3).
3.5.7 Other Facility Requirements
MANASSAS REGIONAL AIRPORT
AIRPORT LAYOUT PLAN UPDATE REPORT
MANASSAS REGIONAL AIRPORT
OCTOBER 2002
72
The events of September 11, 2001 have placed additional importance on the security of not only
commercial service airports, but also general aviation airports. The Federal Aviation Administration
and the National Security Council have (as of the publication date of this report) not finalized any
security requirements for general aviation facilities. While the final FAA guidance on security at
general aviation airports will likely require both administrative/operational measures (e.g., badging of
employees) and physical measures (i.e., secure aprons), many of the traditional corporate aviation
airports throughout the country (i.e., Teterboro, Morristown, John Wayne, etc.) already implement
FAR Part 107 level security measures prior to September 11. While this is not necessarily
recommended for Manassas, there are several security measures that could be taken proactively in
order to provide owners and operators of aircraft at the airport with a high level of security.
The security improvements recommended for Manassas Regional Airport include the provision of
complete perimeter fencing with 3-strand barbed wire. As of 2001, the airport has approximately
13,500-linear feet of perimeter fencing. To completely enclose the airport with perimeter fencing
would require an additional 9,000-linear feet. Another security improvement is having restricted
access to aprons through the placement of card readers at each gate and the badging of airport
personnel.
3.6 SURFACE TRANSPORTATION ACCESS
An important surface transportation issue surrounds the use (both existing and forecasted) and the
potential reconstruction of Observation Road from Wakeman Drive to the Piper Lane intersection.
This section of Observation Road, as shown in Section 1.7.7, has a high percentage of morning and
afternoon peak hour traffic associated with VRE commuters and provides a good ―short-cut‖ for these
commuters. The Traffic Analysis Report (see Appendix B) forecasted the future traffic levels on
Observation Road and other internal and external roadways in the immediate vicinity of the airport.
This report concludes that traffic levels on Observation Road will total 3,260 trips by 2020, which is a
65-percent increase over 2001 traffic levels. The cumulative impact of additional commuters and
local surface transportation improvements on the airport access roads is show in Figure 3-3.
Observation Road is scheduled to be released to the public roadway system as a result of use of the
road by non-airport users (i.e., VRE commuters) and the probability of not receiving FAA funds for
projects associated with the road.
Other surface transportation projects recommended for the airport include extended Wakeman Drive
south of Geneva Aviation to provide access to the proposed t-hangar and aircraft maintenance hangar
located south of the East Apron. A portion of Observation Road, when reconstructed, is planned to
be relocated near the VRE station to provide adequate space for the planned Freedom Museum and
associated apron space. Additionally, Observation Road south of the intersection of Piper Lane is
recommended to be relocated further east so that the road is placed outside of the FEMA floodway as
defined through the 2001 FEMA coordination efforts. A portion (approximately 700 lf) of Observation
Road near the existing ATCT is also planned to be realigned in the mid term (Years 6-10) to allow for
the relocation/replacement of an existing 14,000-square foot hangar and the relocation of the ATCT
further west.
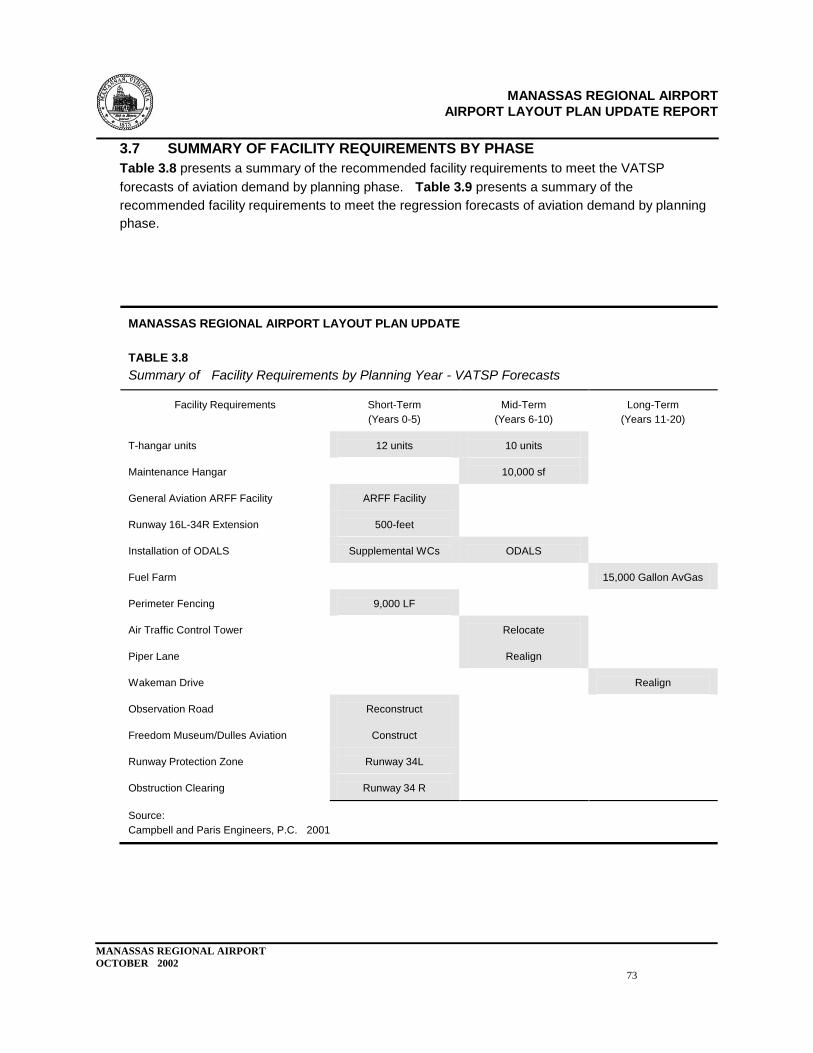
MANASSAS REGIONAL AIRPORT
AIRPORT LAYOUT PLAN UPDATE REPORT
MANASSAS REGIONAL AIRPORT
OCTOBER 2002
73
3.7 SUMMARY OF FACILITY REQUIREMENTS BY PHASE
Table 3.8 presents a summary of the recommended facility requirements to meet the VATSP
forecasts of aviation demand by planning phase. Table 3.9 presents a summary of the
recommended facility requirements to meet the regression forecasts of aviation demand by planning
phase.
MANASSAS REGIONAL AIRPORT LAYOUT PLAN UPDATE
TABLE 3.8
Summary of Facility Requirements by Planning Year - VATSP Forecasts
Facility Requirements
Short-Term
(Years 0-5)
Mid-Term
(Years 6-10)
Long-Term
(Years 11-20)
T-hangar units
12 units
10 units
Maintenance Hangar
10,000 sf
General Aviation ARFF Facility
ARFF Facility
Runway 16L-34R Extension
500-feet
Installation of ODALS
Supplemental WCs
ODALS
Fuel Farm
15,000 Gallon AvGas
Perimeter Fencing
9,000 LF
Air Traffic Control Tower
Relocate
Piper Lane
Realign
Wakeman Drive
Realign
Observation Road
Reconstruct
Freedom Museum/Dulles Aviation
Construct
Runway Protection Zone
Runway 34L
Obstruction Clearing
Runway 34 R
Source:
Campbell and Paris Engineers, P.C. 2001
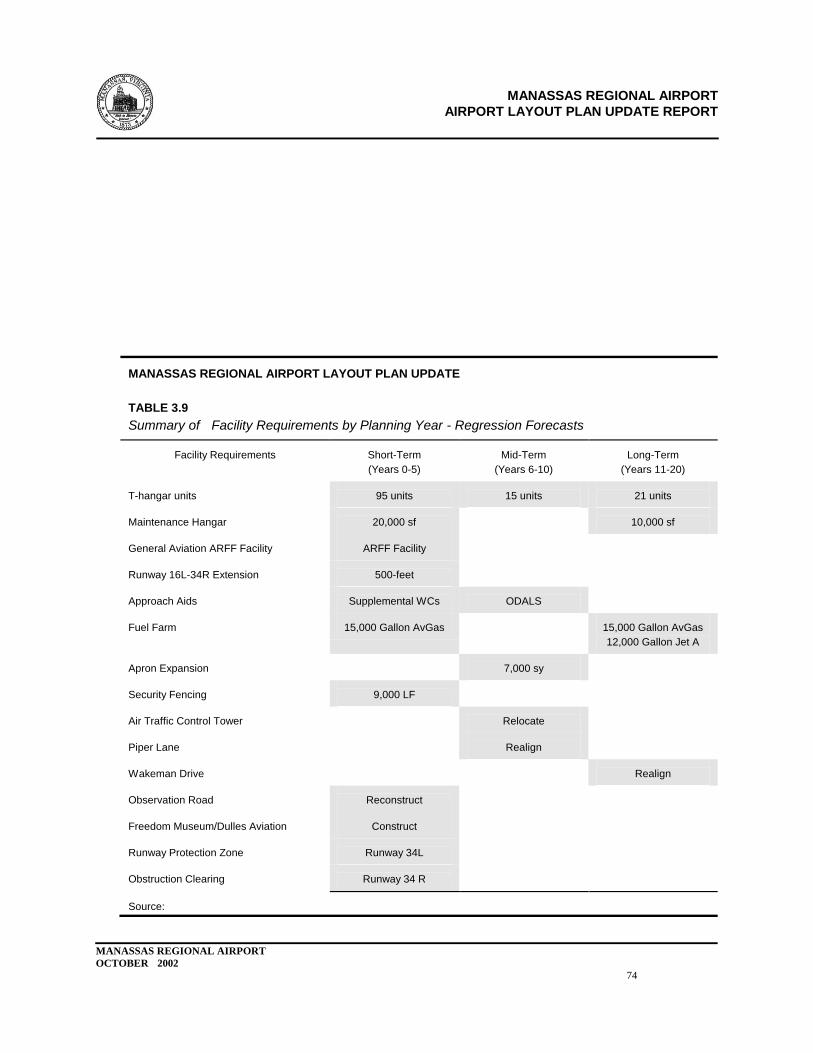
MANASSAS REGIONAL AIRPORT
AIRPORT LAYOUT PLAN UPDATE REPORT
MANASSAS REGIONAL AIRPORT
OCTOBER 2002
74
MANASSAS REGIONAL AIRPORT LAYOUT PLAN UPDATE
TABLE 3.9
Summary of Facility Requirements by Planning Year - Regression Forecasts
Facility Requirements
Short-Term
(Years 0-5)
Mid-Term
(Years 6-10)
Long-Term
(Years 11-20)
T-hangar units
95 units
15 units
21 units
Maintenance Hangar
20,000 sf
10,000 sf
General Aviation ARFF Facility
ARFF Facility
Runway 16L-34R Extension
500-feet
Approach Aids
Supplemental WCs
ODALS
Fuel Farm
15,000 Gallon AvGas
15,000 Gallon AvGas
12,000 Gallon Jet A
Apron Expansion
7,000 sy
Security Fencing
9,000 LF
Air Traffic Control Tower
Relocate
Piper Lane
Realign
Wakeman Drive
Realign
Observation Road
Reconstruct
Freedom Museum/Dulles Aviation
Construct
Runway Protection Zone
Runway 34L
Obstruction Clearing
Runway 34 R
Source:
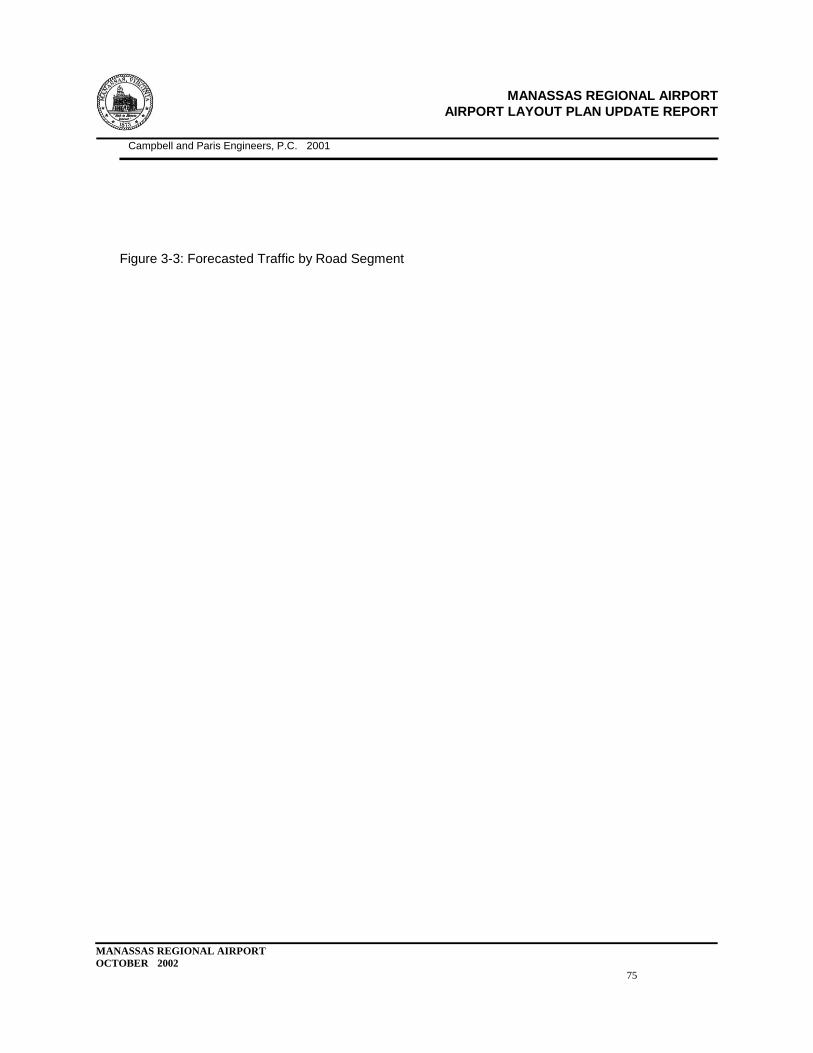
MANASSAS REGIONAL AIRPORT
AIRPORT LAYOUT PLAN UPDATE REPORT
MANASSAS REGIONAL AIRPORT
OCTOBER 2002
75
Campbell and Paris Engineers, P.C. 2001
Figure 3-3: Forecasted Traffic by Road Segment

MANASSAS REGIONAL AIRPORT
AIRPORT LAYOUT PLAN UPDATE REPORT
MANASSAS REGIONAL AIRPORT
OCTOBER 2002
76
SECTION FOUR:
ENVIRONMENTAL OVERVIEW
An important consideration in the development of aviation facilities is the potential impact to the
natural and social environment in the vicinity of the airport. The Federal Aviation Administration
identifies 20 impact categories that are required to be analyzed for potential impact associated with
airport development. These 20 impact categories are identified in FAA Order 5050.4a
―Environmental Handbook‖ and are listed below:
Noise
Compatible Land Use
Social Impacts
Induced Socio-Economic Impacts
Air Quality
Water Quality
Section 4(f)
Historic, Architectural, Archeological and Cultural Resources
Biotic Communities
Endangered and Threatened Species of Flora and Fauna
Wetlands
Floodplains
Coastal Zone Management Program
Coastal Barriers
Wild and Scenic Rivers
Farmland
Energy Supply and Natural Resources
MANASSAS REGIONAL AIRPORT
AIRPORT LAYOUT PLAN UPDATE REPORT
MANASSAS REGIONAL AIRPORT
OCTOBER 2002
77
Light Emissions
Solid Waste Impacts
Construction Impacts
Significant environmental coordination efforts have been accomplished at the airport since the
completion of the 1990 Airport Master Plan Update. The following environmental overview will
capitalize on these coordination efforts as the proposed development plan at the airport does not
substantially deviate from the proposed development plan contained in the 1990 Master Plan Update.
It should be noted that it is not the intent of this section to update environmental information included
in the 2001 Environmental Assessment for the airport. As such, no significant coordination efforts
were undertaken with regulatory agencies. Rather, the purpose of this chapter is to present
preliminary environmental information for those projects that are included on the Airport Layout Plan
but were not originally identified in the 1990 Airport Master Plan Update. A majority of the projects
included on the Airport Layout Plan are within the limits of study of the 2001 Environmental
Assessment. Special emphasis in the planning of facilities identified on the ALP was placed on the
objective to develop a plan that will enable the required facilities to be constructed without the need to
encroach upon additional wetlands, flood plain and archaeological resources already identified in the
EA.
4.1 PREVIOUS ENVIRONMENTAL STUDIES
Two significant pieces of the environmental coordination effort were the 2001 Federal Emergency
Management Agency (FEMA) Conditional Letter of Map Revision (CLOMR) and Letter of Map
Revision (LOMR) determinations and the issuance of a Finding of No Significant Impact (FONSI) for
the 2001 Environmental Assessment at the airport.
4.1.1 2001 Environmental Assessment
On November 23, 2001, the FAA issued a Finding of No Significant Impact (FONSI) for the
Environmental Assessment for Manassas Regional Airport. The EA was completed as part of the
overall planning effort for the airport and included the following projects:
East side apron/hangar facilities expansion (north and south of the terminal area)
East side aviation use facility development (i.e., helicopter)
Completion of terminal area buildout (i.e., expanded automobile parking)
West side apron/hangar facilities expansion (both north and south of the ATCT) including
Observation Road realignment
Additional Exit Taxiway Development (Runway 16L-34R)
Complete 500-foot wide Runway safety Area south of Broad Run for Runway 16L-34R
(with no modifications to the existing bridge structure)
Removal of Vegetative Obstructions to the Existing Runway 34R non-precision Approach
East-West by-Pass Taxiway Development (north-end)
Internal access road between east and west facilities.
MANASSAS REGIONAL AIRPORT
AIRPORT LAYOUT PLAN UPDATE REPORT
MANASSAS REGIONAL AIRPORT
OCTOBER 2002
78
The ―approval envelope‖ for Manassas Regional Airport generally includes the projects located north
of Broad Run (with the exception of the Runway Safety Area improvements).
4.1.2 FEMA Coordination
The FEMA coordination effort was initiated for two reasons: 1) The planned
reconstruction/rehabilitation of Runway 16L-34R and the associated runway safety area
improvements and 2) because development located south of Broad Run was not included in the
FONSI issued by the FAA for the 2001 Environmental Assessment. On February 12, 2002 and
February 13, 2002, FEMA issued a CLOMR and LOMR respectively. The CLOMR and the LOMR
issued by FEMA were based on updated hydraulic modeling using more detailed topographic
information, site conditions (i.e., cul-de-sac of Observation Road near the southwest t-hangars), using
a ―split flow‖ modeling technique and corrected modeling of the taxiway and runway bridges
associated with Runway 16L-34R. The following development items were included in the hydraulic
modeling:
All development items included in the 2001 Environmental Assessment
Providing full Group III Taxiway Safety Areas (118-feet) for Taxiway Bravo - including the
taxiway bridge over Broad Run
Providing full Group III Runway Safety Areas (500-feet) for Runway 16L-34R, including
the runway bridge over Broad Run
Provide a 1,000-foot extension to Runway 16L-34R and Taxiway Bravo using full Group III
design standards
Construct a ―southwest‖ partial parallel taxiway to Runway 16L-34R from existing Taxiway
Kilo to ultimate threshold for Runway 34R.
The results of the hydraulic modeling concluded that minor changes to the published Base Flood
Elevation (BFEs) for Broad Run would result from the proposed development (less than 3-feet).
While some changes to the base flood elevations resulted from the FEMA study, no significant
changes to the floodway as a result of the depicted development are expected. The FEMA study
also found that if a ridge near Runway 34R south of Broad Run were lowered by several feet then the
anticipated increase in the BFEs could be reduced or eliminated.
Because of the split-flow modeling, a side channel is depicted on the revised Flood Insurance Rate
Map (FIRM). The side channel is located between Runway 16L-34R and Bristow Road to the west of
the airport (approximately on the extended runway centerline of Runway 16R). This side channel
parallels Runway 16L-34R and results from the limited ability of the runway and taxiway bridge
culverts to accommodate floodwater. As floodwater ―builds up‖ against the runway culvert, some
water would use the side channel and eventually would ―reconnect‖ with the Broad Run floodway.
While the FEMA analysis indicated no significant impacts to BFEs or the floodway associated with
Broad Run as a result of the development included in the hydraulic model; additional local, state and
federal environmental coordination will be required before development could occur for those
development items not included in the 2001 FONSI.
MANASSAS REGIONAL AIRPORT
OCTOBER 2002
79
4.1.3 Form “C” Environmental Coordination
The Environmental Evaluation Form ―C‖ completed as part of the Route 234/Clover Hill/Wakeman
Drive connection is based upon the guidance in Federal Aviation Administration (FAA) Order 5050.4A,
―Airport Environmental Handbook‖. The project entails the construction of a 48-foot wide roadway
(with a 110-foot wide right-of-way) connecting Wakeman Drive to the newly completed Route 234
Bypass. This connection has been planned for over 10 years and has been included in local
comprehensive plans and the approved 1990 Airport Layout Plan. Additionally, this connection was
included in the Master Plan Development Program included in the 2001 Environmental Assessment
which received a FONSI from the FAA in November 2001. Although the project is county sponsored (no
FAA or DOAV funds were used for the project) and actual construction on airport property will only
encompass ±0.24-acres of previously disturbed land directly adjacent to Wakeman Drive, the FAA determined
the project to be a "Federal Action.” The resultant ALP update/change would then be required to have an
acceptable federal environmental Finding as to any potential environmental impacts before the FAA could
approve the connection of the road to airport property.
Generally, a Form C is to be used when a project cannot be categorically excluded (CATEX) from a
formal environmental assessment, but when the environmental impacts of the proposed projects are
expected to be minimal and a detailed EA would not be appropriate. Therefore, a Form C could be
considered a ―short EA‖ and satisfy the regulatory requirements of an EA. The proper completion of a
Form C provides the FAA with enough information to determine whether a short EA will suffice or
whether a detailed EA must be prepared. The FAA normally intends to use a Form C to support a
Finding of No Significant Impact (FONSI).
Overall, the findings of the Form C Environmental Assessment suggest that no significant impacts are
anticipated on airport property. While the project will impact some sensitive areas, all of these areas
are located outside of the airport and City property. The pertinent findings of the Form C
Environmental Assessment have been included in some of the sections of this Environmental
Overview.
4.2 FAA IMPACT CATEGORIES
4.2.1 Noise
The City of Manassas has strived to minimize the amount of incompatible land-uses in the vicinity of
the airport through pro-active planning. Evidence of this effort by the City is seen with the prevailance
of industrial zoning to the north and east of the airport. The enactment of an Airport Overlay
Protection District by the City of Manassas, the adoption of the FAR Part 150 Study in November
1994, pursuit of the recommended property acquisitions (±115 acres) and the cooperation of the
County with their Comprehensive Plan goals and Safety Overlay District requirements, clearly
demonstrate the City's intent and desire to maintain and promote compatible land uses within the
vicinity of the airport. Through similar proactive planning and mitigation, the City/County and airport
can continue to work together to maintain land use compatibility in the future.
As part of the 2001 Environmental Assessment, the noise contours generated in the 1994 Part 150
Study were re-examined in light of changing fleet mix and operations at the airport. When the Part
150 Study was conducted, no major changes were expected at the airport for the next five years,
however, the study did consider a growth in business jet activity for the forecast period.
MANASSAS REGIONAL AIRPORT
AIRPORT LAYOUT PLAN UPDATE REPORT
MANASSAS REGIONAL AIRPORT
OCTOBER 2002
80
The most interesting result was the 1,000-foot runway extension actually showed no real change in
the noise contours when compared to the noise contours prepared for the existing runway length.
This is because takeoffs are louder than landings at Manassas and with the extended runway, the
aircraft will have additional travel distance before they reach the residential areas. This additional
distance will allow the aircraft to climb higher thus actually reducing the noise in some areas.
Since the noise contours were originally developed as part of the 1994 Part 150 study, it is
recommended that updated noise contours be prepared as part of any future environmental
coordination efforts associated with the proposed 500-foot extension to Runway 16L-34R.
4.2.2 Compatible Land Use
Both the City of Manassas and Prince William County have adopted Airport Impact Overlay Districts
for parcels located under the established FAR Part 77 Surfaces. Coordination between the airport
and the City and County governments will be required so that any change in the Part 77 surfaces
would be reflected in the ordinances. With the establishment of these overlay districts, the City and
County have implemented land-use controls for property located in the district. These overlay
districts control both the type and height of development in the districts.
Additional environmental coordination resulting from the Form C Environmental Assessment
concluded that the Route 234 Connection would not have any impacts on compatible land use in the
vicinity of the airport. The Form C concluded that the proposed Route 234 Connection will not lead to
any disruption of communities and will have no impact on any residences or businesses. Other than
the impacts to the seven acres of forested land, there are no anticipated impacts to any of the area‘s
natural resources. Furthermore, the project will not create any wildlife attractants on or near airport
property.
4.2.3 Social Impacts
Aviation developments affects not only the environment but also the human surroundings. The
principal social impacts considered with airport proposed actions include: relocation of residences and
businesses; alteration of surface transportation patterns; disruption of established communities or
planned developments; and significant changes in employment. The 2001 Environmental
Assessment addressed the potential social impacts related to the development of aviation facilities a
the airport.
The airport has completed the acquisition of the approximately 115 acres of property south of Broad
Run that was identified in the 1994 Part 150 Study. Future property acquisition at the airport will be
related to the purchasing in fee simple ownership land located within the sections of RPZs that are
located off airport property. Alterations to surface transportation patterns will be limited to on-airport
roadways (primarily the release of Observation Road to the public roadway system). The 2001
Environmental Assessment concluded that the projections of automobile traffic could be
accommodated by the roads surrounding Manassas Regional Airport up to 2010. The recently
completed Route 234 Bypass added a significant amount of capacity to accommodate surface
transportation.

MANASSAS REGIONAL AIRPORT
AIRPORT LAYOUT PLAN UPDATE REPORT
MANASSAS REGIONAL AIRPORT
OCTOBER 2002
81
Additional environmental coordination resulting from the Form C Environmental Assessment
concluded that the Route 234 Connection would actually improve traffic circulation in and around the
airport. The proposed project would not result in the relocation of any businesses, homes or prime
agricultural lands caused by this project. A more direct and efficient circulation of airport user
automobile traffic would be provided which could reduce potential traffic delays. The 2001 Traffic
Study prepared in conjunction with this report indicated that as much as 64-percent of automobile
traffic using the connection would be non-airport user (i.e., commuter) traffic. The new bypass would
also improve emergency vehicle access and response times to the airport.
4.2.4 Induced Socio-Economic Impacts
Increased airport activities are expected to require support facilities, product suppliers, and
secondary/induced economic activity such as restaurants, offices, and warehouses etc. This
increased activity could generate additional job opportunities in the region by the year 2015.
Therefore, the proposed airport improvements are expected to create additional economic
opportunities for the region.
4.2.5 Air Quality
The Draft 1997 Environmental Assessment included a 1,000-foot runway extension at the airport.
Coordination with the Air Division of the Virginia Department of Environmental Quality, concluded with
the determination by the DEQ that proposed development was in compliance with the General
Conformity Rule for potential emissions and that little or no impact to air quality would occur as a
result of the airport development program depicted in the Draft 1997 EA.
The DEQ reconfirmed their previous findings during the 2001 Coastal Zone Management Consistency
Determination completed for the 2001 Environmental Assessment. As the proposed 500-foot runway
extension is less than the 1,000 foot runway extension originally proposed in the 1997 EA, further
detailed study of ambient air quality impact is not expected to be required.
4.2.6 Water Quality
The 2001 Environmental Assessment concluded that the proposed improvements at Manassas
Regional Airport should not adversely impact water quality in the area. Construction methods will
comply with Virginia Erosion and Sediment Control regulations to minimize erosion and siltation; and
all design plans will be reviewed by local authorities. Trimming/topping of trees in the Broad Run
Resource Protection Areas (RPAs) will reduce impacts to those regions protected by the Chesapeake
Bay Local Assistance Department (CBLAD). After trimming/topping of trees in the RPAs is
completed, ground cover will be replaced with compatible (i.e., low-growing and similar water filtration
qualities as the trees) vegetation to insure that water quality is not degraded.
4.2.7 Section 4(f)
The 2001 Environmental Assessment had a finding of no impact on the parks, wildlife and historical
sites in the area due to the proposed construction. As the proposed development plan depicted on
the Airport Layout Plan is with the development envelope established in the 2001 Environmental
Assessment, impacts to Section 4(f) lands are not expected.
MANASSAS REGIONAL AIRPORT
AIRPORT LAYOUT PLAN UPDATE REPORT
MANASSAS REGIONAL AIRPORT
OCTOBER 2002
82
The extension of Runway 16L-34R and the taxiway system (including safety areas and RPZ) will be
constructed on airport-owned land. The land associated with the safety areas has previously been
improved (i.e. graded) for the existing runway and taxiway while the RPZ is protected by the properties
acquired through the Part 150 land acquisition process. As a result, the likelihood of Section 4(f)
lands being impacted due to the extension of the runway and taxiway is minimal.
4.2.8 Historic, Architectural, Archeological and Cultural Resources
An Archaeological survey was completed on the airport site in 1994. Phase I of this survey
recommended some further research on one of the potential archaeological sites next to the
helicopter facilities on the West Complex. By reconfiguring the proposed facility, as shown on the
1990 ALP, impact to the historic resource (44PW729) will be avoided.
While the recommended use of this area as a helicopter facility has been changed to a planned use
for hangar and air traffic control by the ALP Update; the impact to the identified historical property will
be avoided. The limits of the planned area for an air traffic control tower and hangar building
respected the original limits of the helicopter facility.
A phase-I Archaeological Survey conducted in support of additional environmental coordination for the
Route 234 Connection concluded that no historically or culturally significant resources were within the
project area. The Virginia Department of Historic Resources and the VMNH supported this finding.
There are no anticipated impacts on any natural history resources within the project area.
4.2.9 Biotic Communities
The 2001 Environmental Assessment concluded that the proposed improvements will not involve any
publicly owned wildlife or waterfowl refuge of local, state or national significance. A mussel survey was
conducted to ensure that no living specimens of Alasmidonta varicosa, a state endangered species,
were found in the area. The study confirmed that the area did not have any living specimen of this
species of mussels.
A complete wetland delineation was completed for the airport property. Including the long term
potential (runway, taxiway extension and additional crossing of Broad Run) a total impact of less than
0.02 acres is expected. Therefore, no impacts to state or federal listed endangered species habitats
are expected due to the proposed improvement projects.
4.2.10 Endangered and Threatened Species of Flora and Fauna
The 2001 Environmental Assessment included coordination efforts with the Department of Games
and Inland Fisheries. According to the Department of Games and Inland Fisheries no impact is
expected on any federally listed species due to the proposed improvements. It was recommended that
strict erosion and sediment control measures be taken to minimize impact to the overall stream
habitat and water quality of Broad Run at and below airport property.
4.2.11 Wetlands
MANASSAS REGIONAL AIRPORT
AIRPORT LAYOUT PLAN UPDATE REPORT
MANASSAS REGIONAL AIRPORT
OCTOBER 2002
83
Minimal wetland loss(less than one acre) is expected due to the proposed improvements approved
in the 2001 FONSI. As none of this impact is expected within the next five years, the EA did not
suggest the establishment of a wetland mitigation program at this time. Any development beyond
Phase One (Years 0-5) would require a new assessment using rules that are in place at that time.
Appropriate mitigation measures would then be required for project specific impacts. Agency
coordination efforts during the 2001 EA required a jurisdictional determination of wetlands at the
airport. The previous JD from the USCOE was re-issued in June 2001 for wetlands on both sides of
Broad Run and expires in June 2006. The five-year development program included in the EA does
result in a small impact to a wetland associated with the outfall from a drainage pipe near the
proposed West FBO Apron Expansion. Because of the unavoidable impact and the size of the
wetland (approximately 0.02-acres), the USCOE has indicated that the wetland is eligible for a
nationwide permit.
Additional environmental coordination resulting from the Form C Environmental Assessment
concluded that the Route 234 Connection identified some wetland impact off airport property. The
USCOE has indicated that 0.35 acres of wetlands and 914lf of streambed would be impacted by the
roadway connection. No wetlands on the airport property will be impacted.
4.2.12 Floodplains
Since the publication of the 2001 Environmental Assessment, FEMA has issued a Conditional Letter
of Map Revision (CLOMR) for the proposed development items outlined in Section 4.1.2. The
extensive environmental coordination efforts associated with the FEMA study concluded that the
ultimate buildout of the airport (including a 6,700-foot Runway 16L-34R and full runway and taxiway
safety areas including the bridges) would not significantly impact the established floodplain or
floodway for Broad Run.
Additional environmental coordination resulting from the Form C Environmental Assessment
concluded that the Route 234 Connection would be located inside both the 100-year and 500-year
floodplains. Construction will take place in the 100-year floodplains associated with both Cannon
Branch and Broad Run. However, considering the planned finished elevations and the drainage
systems considered in the roadway design, this project should have no adverse impact on the
floodplains. Additionally, the proposed project will be located in the 500-year floodplain (as
designated by FEMA), however this project is not considered a ―critical action‖.
4.2.13 Coastal Zone Management Program
Prince William County is a participant in the Virginia Coastal Resources Management Program (VCP).
As a participant, all federal activities or federally licensed and permitted activities within Prince William
County must be constructed in a manner consistent with the VCP. The program is a network that
incorporates state permits and regulations as the enforceable policies of the program. The nine
regulatory programs comprising the VCP are as follows: Fisheries Management; Subaqueous Lands
Management; Wetlands Management; Dunes Management; Non-Point Source Pollution control; Point
Source Pollution Control; Shoreline Sanitation; Air Pollution Control and Coastal Lands Management.
Coordination with all these pertinent agencies was completed in 1997 EA and re-validated during the
2001 DEQ Consistency Certification review for the 2001 Environmental Assessment. Since the VCP
MANASSAS REGIONAL AIRPORT
AIRPORT LAYOUT PLAN UPDATE REPORT
MANASSAS REGIONAL AIRPORT
OCTOBER 2002
84
has no unique requirements of its own, and the project will comply with all of the permitting and
programs included in the coastal program, there are no expected adverse impacts to any coastal
zones.
Additional environmental coordination resulting from the Form C Environmental Assessment
concluded that the Route 234 Connection would occur in the limits of Virginia Coastal Resources
Management Program (VCP). The issuance of local and state development permits should ensure
that the project will meet all the requirements of the VCP.
4.2.14 Coastal Barriers
The 2001 Environmental Assessment concluded that, based on the location of the airport, there are
no coastal barrier impacts created by the proposed improvements of the facility.
4.2.15 Wild and Scenic Rivers
The 2001 Environmental Assessment concluded that, based on inspection of the USGS maps and
guidance from the Commonwealth of Virginia‘s Department of Conservation and Recreation, the
proposed improvements will not impact any streams on the National Park Service Nationwide
Inventory, potential State Scenic Rivers or existing or potential State Scenic Byways.
4.2.16 Farmland
The 2001 Environmental Assessment included coordination with Prince William County Soil and
Water Conservation Office. According to the wetland delineation and discussion with local Prince
William Soil and Water Conservation office, five different types of prime farmland soil types maybe
impacted by these proposed improvements. However, since the land is zoned for light industrial
purposes, the Farmland Protection Policy Act (FPPA) has no jurisdiction. Therefore, no conversion or
loss of prime farmland will occur due to the proposed improvements.
4.1.17 Energy Supply and Natural Resources
The current energy supply for the airport is handled by the City of Manassas. The 2001 Environmental
Assessment concluded that, although the proposed improvements will lead to additional energy
usage, the current power source is expected to be able to handle the additional demand. No changes
in primary power supplies are anticipated and no adverse impacts to energy supplies or natural
resources are foreseen.
4.2.18 Light Emissions
The 2001 Environmental Assessment concluded that new light emissions would be associated with
the installation of a High Intensity Runway Lighting system for the extended runway 34R and
accompanying taxiway. Although, the runway will easily be visible to approaching aircraft, the low
elevation of the edge lights along with the natural buffer provided by the Broad Run corridor will make
the additional lights almost indiscernible to the neighbors.
The proposed Omni-Directional Approach Lighting System (ODALS) for Runway 34R were not
included in the 2001 Environmental Assessment, and as such, would need to be included in a future
environmental analysis. However, with the airport owning property on the south side of Broad Run
MANASSAS REGIONAL AIRPORT
AIRPORT LAYOUT PLAN UPDATE REPORT
MANASSAS REGIONAL AIRPORT
OCTOBER 2002
85
(completed as part of the Part 150 land acquisition process), the impacts to residential areas are
anticipated to be minimal.
4.2.19 Solid Waste Impacts
The 2001 Environmental Assessment concluded that no solid waste impacts are anticipated as a
result of the proposed improvements to the airport. No landfills are located in the vicinity of the
airport, however, future environmental analysis would need to study the wetland bank constructed
southeast of the terminal building (north of Runway 16L-34R) as well as any other potential wetland
banks proposed for the area.
4.2.20 Construction Impacts
Strict adherence to the strategies identified in the Virginia Erosion and Sediment Control Handbook
will effectively minimize temporary impacts on the air, water and community environment during
construction. The preliminary design does not identify any other environmental consequences due to
construction activisties.
4.3 CONCLUSION
With the review envelope of the 2001 Environmental Assessment examining development north of
Broad Run, certain development items shown on the ALP will require further environmental review
and coordination with the FAA. Coordination with the FAA may identify development items on the
ALP that could be considered categorically excluded by the FAA.
Specific projects that will require further environment review and coordination include:
Proposed 500-foot extension to Runway 16L-34R
Approach Lighting System for Runway 34R
Localizer relocation onto extended centerline of Runway 16L.
Development of facilities north of Wakeman Drive and south of Cannon Branch
Relocation of Observation Road and Wakemen Drive
Acquisition of land south of Broad Run in the West Complex
MANASSAS REGIONAL AIRPORT
AIRPORT LAYOUT PLAN UPDATE REPORT
MANASSAS REGIONAL AIRPORT
OCTOBER 2002
86
SECTION FIVE:
AIRPORT LAYOUT PLAN DRAWINGS
MANASSAS REGIONAL AIRPORT
AIRPORT LAYOUT PLAN UPDATE REPORT
MANASSAS REGIONAL AIRPORT
OCTOBER 2002
87
SECTION SIX:
SCHEDULES AND COST ESTIMATES
6.1 PROJECT DEVELOPMENT COSTS AND POTENTIAL FUNDING ALLOCATION
Project costs estimates using typical unit price data for similar construction have been prepared for
each of the major facility requirements by phase as described in Section Three. The categorical
detail presented in Table 6.1 through Table 6.6 present an indexing of the identified development
MANASSAS REGIONAL AIRPORT
AIRPORT LAYOUT PLAN UPDATE REPORT
MANASSAS REGIONAL AIRPORT
OCTOBER 2002
88
items and preliminary cost estimates. When demand warrants further refinement of the preliminary
plan, more detailed and thorough cost estimates should be prepared.
Based on the total estimated development costs and analysis as to AIP eligibility, a potential funding
allocation (i.e., FAA, DOAV, City of Manassas and others) is presented in Table 6.2, Table 6.4 and
Table 6.6 for each phase of development assuming a maximum AIP funding of 90-percent throughout
the 20-year planning horizon. Where only a portion of a proposed development item is considered
eligible for AIP funding and DOAV funding, potential funding levels were estimated based on previous
experience in receiving funding from these agencies.
The planned development at Manassas Regional Airport is clustered around three distinct items
throughout the 20-year planning horizon: 1) hangar development, 2) support facilities and 3) surface
transportation. With a well-developed airfield and taxiway system in place at the airport, development
over the next twenty years includes significant landside development with a few major airside
developments. The continued development of hangar facilities and the requisite aprons will facilitate
the airport in accommodating the forecasted demand for aviation facilities. With the airport having
already (as of Summer 2002) eclipsed the 20-year forecasted based general aviation aircraft reported
in the Draft VATSP Update, the need for additional facilities beyond those called for in the VATSP is
apparent. Because of this inconsistency with the published VATSP forecasts, coupled with specific
inquiries into major facilities at the airport, the schedules and cost estimates have been developed to
accommodate demand greater than that solely anticipated in the VATSP Update.
The largest phase of development is planned to be Phase III with Phases I and II accounting for
approximately 30-percent of development costs each. Because of the magnitude of hangar and
associated apron development (which are not typically included under federal or state grants), a
decision has to be made by the sponsor and City to fund the development with City funds or enter into
a public/private partnership. This funding decision is best made under the auspices of a Business
Plan for the airport, which, as of Spring 2002, the airport is in the process of drafting. With this in
mind, the total combined funding sources over the 20-year development plan is anticipated to be
approximately 50-percent Federal, 14- percent State, 8- percent City and 28-percent public/private
partnership.
6.1.1 Phase I (Years 0-5) Development Items
The reconstruction of Runway 16L-34R and the construction of new acute angle exit taxiways is, as of
Summer 2002, in the final design stage and construction is expected to start in Fall 2002. Additional
projects
scheduled for Phase I could be constructed in the earlier stage of Phase I development. The
corporate hangar development on the Northeast Corporate Apron and the Northwest Corporate Apron
area are two major Phase I (Years 0-5) development items in the advanced planning stage (see
Sheet 3 of the ALP set in Section 5). Table 6.1 summarizes the projects and quantities identified for
Phase I development.
Total development costs for the items included in Phase I (Years 0-5) are expected to total
approximately $21.9 million. Two projects in Phase I have substantial building elements included in
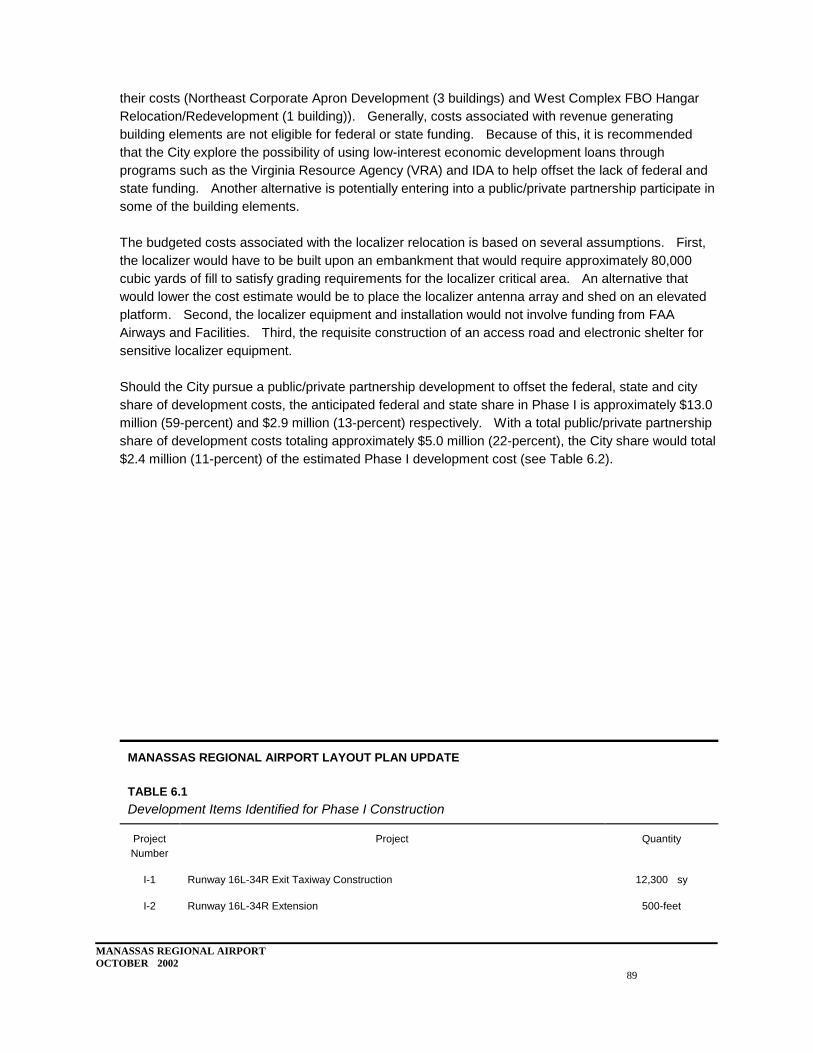
MANASSAS REGIONAL AIRPORT
OCTOBER 2002
89
their costs (Northeast Corporate Apron Development (3 buildings) and West Complex FBO Hangar
Relocation/Redevelopment (1 building)). Generally, costs associated with revenue generating
building elements are not eligible for federal or state funding. Because of this, it is recommended
that the City explore the possibility of using low-interest economic development loans through
programs such as the Virginia Resource Agency (VRA) and IDA to help offset the lack of federal and
state funding. Another alternative is potentially entering into a public/private partnership participate in
some of the building elements.
The budgeted costs associated with the localizer relocation is based on several assumptions. First,
the localizer would have to be built upon an embankment that would require approximately 80,000
cubic yards of fill to satisfy grading requirements for the localizer critical area. An alternative that
would lower the cost estimate would be to place the localizer antenna array and shed on an elevated
platform. Second, the localizer equipment and installation would not involve funding from FAA
Airways and Facilities. Third, the requisite construction of an access road and electronic shelter for
sensitive localizer equipment.
Should the City pursue a public/private partnership development to offset the federal, state and city
share of development costs, the anticipated federal and state share in Phase I is approximately $13.0
million (59-percent) and $2.9 million (13-percent) respectively. With a total public/private partnership
share of development costs totaling approximately $5.0 million (22-percent), the City share would total
$2.4 million (11-percent) of the estimated Phase I development cost (see Table 6.2).
MANASSAS REGIONAL AIRPORT LAYOUT PLAN UPDATE
TABLE 6.1
Development Items Identified for Phase I Construction
Project
Number
Project
Quantity
I-1
Runway 16L-34R Exit Taxiway Construction
12,300 sy
I-2
Runway 16L-34R Extension
500-feet
MANASSAS REGIONAL AIRPORT
OCTOBER 2002
90
I-3 T-Hangar Development 36 units
I-4
East Apron Expansion
35,000 sy
I-5
Northeast Corporate Hangar Development
38,500 sf
I-6
Northeast Corporate Apron Expansion
9,400 sy
I-7
Construction of Internal Connector Road
4,500 lf
I-8
Realignment of Observation Road
4,100 lf
I-9
West Complex FBO Relocation/Development
14,400 sf
I-10
West Apron Expansion
3,700 sy
I-11
Southwest Corporate Hangar Development
7 units
I-12
Southwest Apron Expansion
8,550 sy
I-13
Perimeter Fencing
26,400 lf
I-14
Localizer Relocation/Construction
1 localizer
I-15
Supplemental Windcones
4 windcones
I-16
Fuel farm expansion
12,000 gallon
Source:
Campbell and Paris Engineers, P.C. 2002
sy = square yards
sf = square feet
lf = linear feet
MANASSAS REGIONAL AIRPORT LAYOUT PLAN UPDATE
TABLE 6.2
Estimated Development Costs for Items Identified for Phase I Construction
Project
Number(s)
From Table
6.1
Project
Estimated
Cost
Federal
Share
State
Share
Local
Share
Other*
I-2
Runway 16L-34R Extension (500')
$3,600,000
$4,680,000
$416,000
$104,000
$0
I-4, I-3
East Apron Expansion and
T-Hangars
$4,900,000
$2,800,000
$250,000
$1,750,00
0
$0
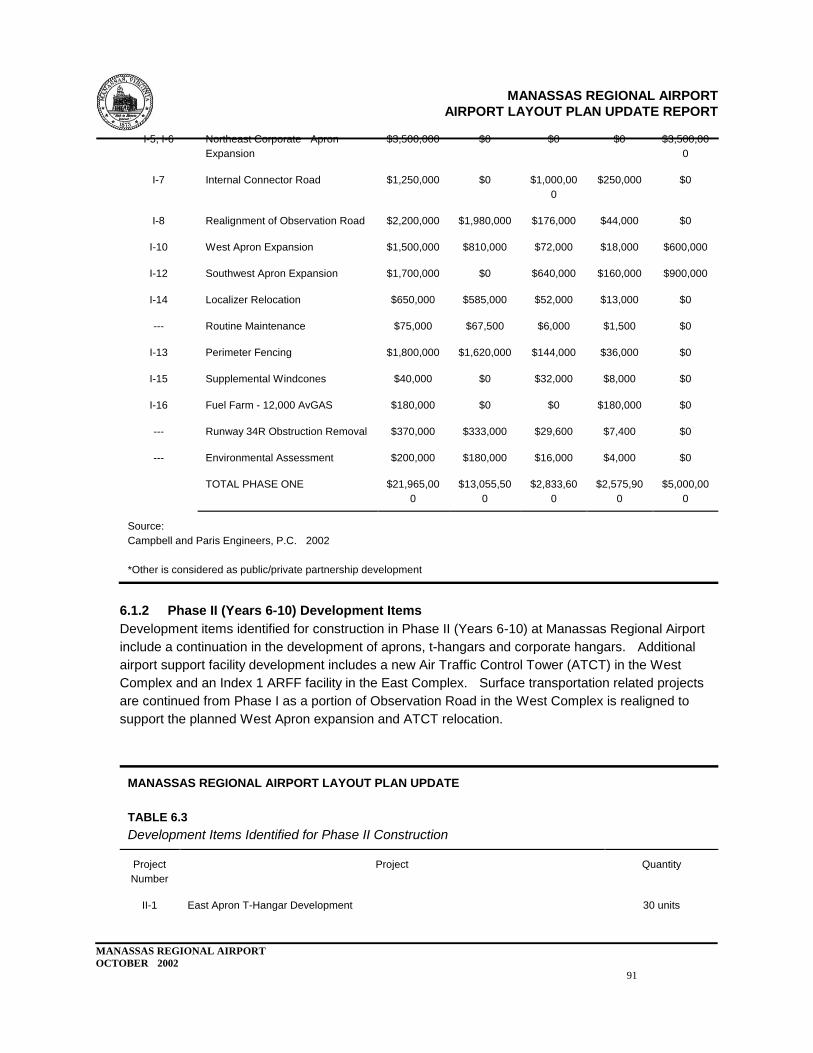
MANASSAS REGIONAL AIRPORT
AIRPORT LAYOUT PLAN UPDATE REPORT
MANASSAS REGIONAL AIRPORT
OCTOBER 2002
91
I-5, I-6 Northeast Corporate Apron
Expansion
$3,500,000 $0 $0 $0 $3,500,00
0
I-7
Internal Connector Road
$1,250,000
$0
$1,000,00
0
$250,000
$0
I-8
Realignment of Observation Road
$2,200,000
$1,980,000
$176,000
$44,000
$0
I-10
West Apron Expansion
$1,500,000
$810,000
$72,000
$18,000
$600,000
I-12
Southwest Apron Expansion
$1,700,000
$0
$640,000
$160,000
$900,000
I-14
Localizer Relocation
$650,000
$585,000
$52,000
$13,000
$0
---
Routine Maintenance
$75,000
$67,500
$6,000
$1,500
$0
I-13
Perimeter Fencing
$1,800,000
$1,620,000
$144,000
$36,000
$0
I-15
Supplemental Windcones
$40,000
$0
$32,000
$8,000
$0
I-16
Fuel Farm - 12,000 AvGAS
$180,000
$0
$0
$180,000
$0
---
Runway 34R Obstruction Removal
$370,000
$333,000
$29,600
$7,400
$0
---
Environmental Assessment
$200,000
$180,000
$16,000
$4,000
$0
TOTAL PHASE ONE
$21,965,00
0
$13,055,50
0
$2,833,60
0
$2,575,90
0
$5,000,00
0
Source:
Campbell and Paris Engineers, P.C. 2002
*Other is considered as public/private partnership development
6.1.2 Phase II (Years 6-10) Development Items
Development items identified for construction in Phase II (Years 6-10) at Manassas Regional Airport
include a continuation in the development of aprons, t-hangars and corporate hangars. Additional
airport support facility development includes a new Air Traffic Control Tower (ATCT) in the West
Complex and an Index 1 ARFF facility in the East Complex. Surface transportation related projects
are continued from Phase I as a portion of Observation Road in the West Complex is realigned to
support the planned West Apron expansion and ATCT relocation.
MANASSAS REGIONAL AIRPORT LAYOUT PLAN UPDATE
TABLE 6.3
Development Items Identified for Phase II Construction
Project
Number
Project
Quantity
II-1
East Apron T-Hangar Development
30 units
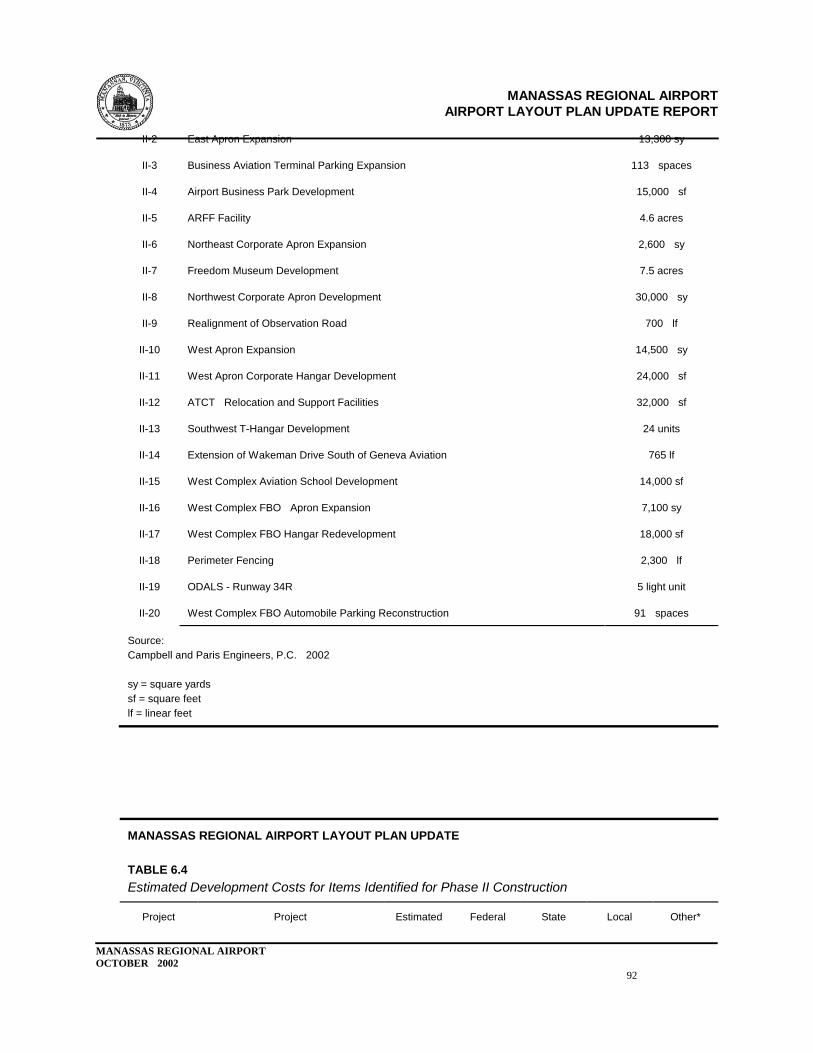
MANASSAS REGIONAL AIRPORT
AIRPORT LAYOUT PLAN UPDATE REPORT
MANASSAS REGIONAL AIRPORT
OCTOBER 2002
92
II-2 East Apron Expansion 13,300 sy
II-3
Business Aviation Terminal Parking Expansion
113 spaces
II-4
Airport Business Park Development
15,000 sf
II-5
ARFF Facility
4.6 acres
II-6
Northeast Corporate Apron Expansion
2,600 sy
II-7
Freedom Museum Development
7.5 acres
II-8
Northwest Corporate Apron Development
30,000 sy
II-9
Realignment of Observation Road
700 lf
II-10
West Apron Expansion
14,500 sy
II-11
West Apron Corporate Hangar Development
24,000 sf
II-12
ATCT Relocation and Support Facilities
32,000 sf
II-13
Southwest T-Hangar Development
24 units
II-14
Extension of Wakeman Drive South of Geneva Aviation
765 lf
II-15
West Complex Aviation School Development
14,000 sf
II-16
West Complex FBO Apron Expansion
7,100 sy
II-17
West Complex FBO Hangar Redevelopment
18,000 sf
II-18
Perimeter Fencing
2,300 lf
II-19
ODALS - Runway 34R
5 light unit
II-20
West Complex FBO Automobile Parking Reconstruction
91 spaces
Source:
Campbell and Paris Engineers, P.C. 2002
sy = square yards
sf = square feet
lf = linear feet
MANASSAS REGIONAL AIRPORT LAYOUT PLAN UPDATE
TABLE 6.4
Estimated Development Costs for Items Identified for Phase II Construction
Project
Project
Estimated
Federal
State
Local
Other*
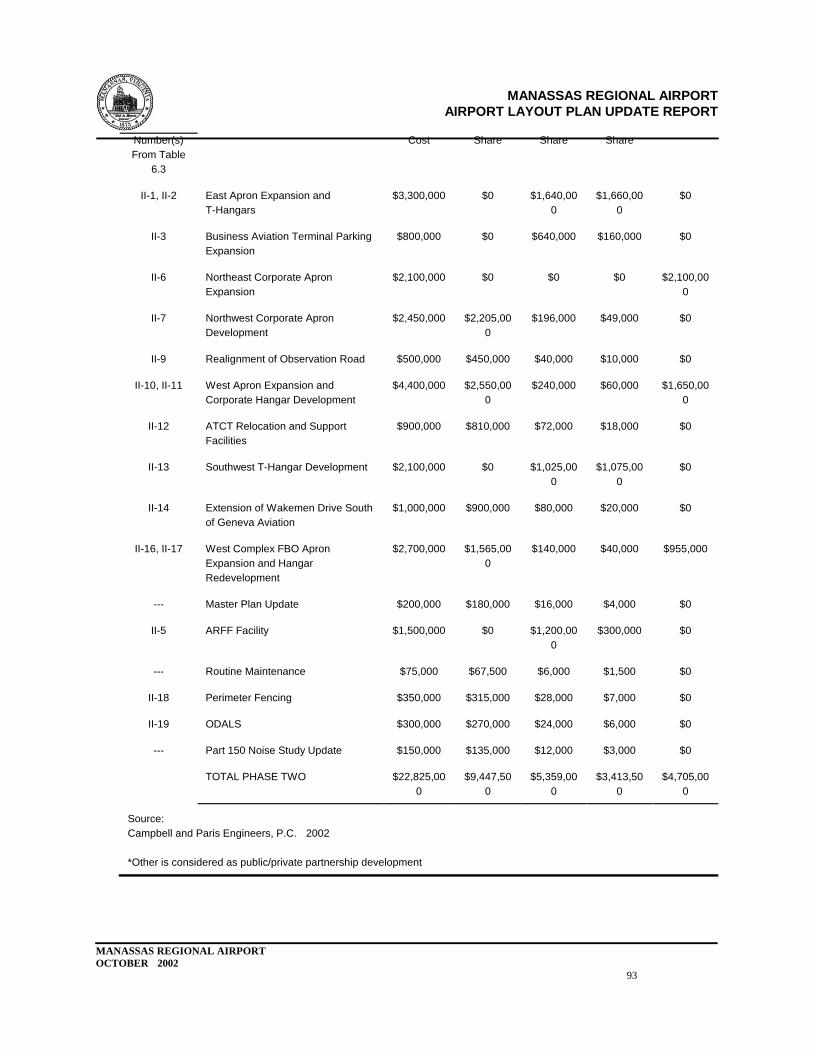
MANASSAS REGIONAL AIRPORT
AIRPORT LAYOUT PLAN UPDATE REPORT
MANASSAS REGIONAL AIRPORT
OCTOBER 2002
93
Number(s)
From Table
6.3
Cost Share Share Share
II-1, II-2
East Apron Expansion and
T-Hangars
$3,300,000
$0
$1,640,00
0
$1,660,00
0
$0
II-3
Business Aviation Terminal Parking
Expansion
$800,000
$0
$640,000
$160,000
$0
II-6
Northeast Corporate Apron
Expansion
$2,100,000
$0
$0
$0
$2,100,00
0
II-7
Northwest Corporate Apron
Development
$2,450,000
$2,205,00
0
$196,000
$49,000
$0
II-9
Realignment of Observation Road
$500,000
$450,000
$40,000
$10,000
$0
II-10, II-11
West Apron Expansion and
Corporate Hangar Development
$4,400,000
$2,550,00
0
$240,000
$60,000
$1,650,00
0
II-12
ATCT Relocation and Support
Facilities
$900,000
$810,000
$72,000
$18,000
$0
II-13
Southwest T-Hangar Development
$2,100,000
$0
$1,025,00
0
$1,075,00
0
$0
II-14
Extension of Wakemen Drive South
of Geneva Aviation
$1,000,000
$900,000
$80,000
$20,000
$0
II-16, II-17
West Complex FBO Apron
Expansion and Hangar
Redevelopment
$2,700,000
$1,565,00
0
$140,000
$40,000
$955,000
---
Master Plan Update
$200,000
$180,000
$16,000
$4,000
$0
II-5
ARFF Facility
$1,500,000
$0
$1,200,00
0
$300,000
$0
---
Routine Maintenance
$75,000
$67,500
$6,000
$1,500
$0
II-18
Perimeter Fencing
$350,000
$315,000
$28,000
$7,000
$0
II-19
ODALS
$300,000
$270,000
$24,000
$6,000
$0
---
Part 150 Noise Study Update
$150,000
$135,000
$12,000
$3,000
$0
TOTAL PHASE TWO
$22,825,00
0
$9,447,50
0
$5,359,00
0
$3,413,50
0
$4,705,00
0
Source:
Campbell and Paris Engineers, P.C. 2002
*Other is considered as public/private partnership development
MANASSAS REGIONAL AIRPORT
AIRPORT LAYOUT PLAN UPDATE REPORT
MANASSAS REGIONAL AIRPORT
OCTOBER 2002
94
Total development costs for the items included in Phase II (Years 6-10) are expected to total
approximately $22.5 million. Similar to Phase I development items, three development items in
Phase II have substantial building elements included in the cost. Development associated with the
Colgan Apron Expansion (1 building), West Apron Expansion (2 buildings) and the Dulles Aviation
Apron Expansion (1 building) are expected to total approximately $9.2 million with approximately $4.7
million in public/private partnership development. The federal and state share of the estimated
development cost in Phase II is approximately $9.2 million (41-percent) and $5.3 million (24-percent)
respectively. With an additional $4.7 million (21-percent) in public/private partnership development,
the estimated City is approximately $3.4 million (15-percent) of the Phase II development cost (see
Table 6.4).
The cost associated with the relocation of the ATCT does not include any costs associated with the
construction of the tower. The cost include site preparation and the development of an automobile
parking facility. The Freedom Museum Apron Development does not include any building elements
as the building is planned to be constructed by a third-party in a build/lease-back structure.
6.1.3 Phase III (Years 11-20) Development Items
Similar to the first two phases of development, the third phase of development at the airport includes
the development of aprons, t-hangars and corporate hangars. Surface transportation projects will
continue to be a major item of development as the realignment of Wakeman Drive near the Aurora
hangar will provide additional airside development space. A 2,500-foot partial parallel taxiway to
Runway 16L-34R is planned for construction that will provide additional taxiway capacity and eliminate
the need for aircraft to cross Runway 16L-34R to gain access to the threshold of Runway 34R.
Total development costs for the items included in Phase III (Years 11-20) are expected to total
approximately $30.6 million. The largest share (approximately $15.9 million) of the total development
cost is the planned midfield aircraft maintenance apron and hangar development. This planned
development includes 46,000 square yards of apron and 163,000 square feet of hangar space.
Federal and state participation could be expected for certain common use airfield elements (i.e.,
taxilanes etc. . ) but not to the exclusive use facilities (i.e, areas under lease hold). With this in mind,
the anticipated federal share is approximately $6.5 million, state share approximately $580,000, City
share approximately $150,000 and public/private partnership share development cost in Phase III is
$15.5 million (51-percent) and $2.4 million (7-percent) respectively. With an additional $12.1 million
(41-percent) in public/private partnership development, the estimated City share is approximately
$600,000 (2-percent) of the Phase III development cost (see Table 6.6).
MANASSAS REGIONAL AIRPORT
AIRPORT LAYOUT PLAN UPDATE REPORT
MANASSAS REGIONAL AIRPORT
OCTOBER 2002
95
MANASSAS REGIONAL AIRPORT LAYOUT PLAN UPDATE
TABLE 6.5
Development Items Identified for Phase III Construction
Project
Number
Project
Quantity
III-1
East Apron Expansion
46,000 sy
III-2
Aircraft Maintenance Hangar
163,000 sf
III-3
Business Aviation Terminal Parking Expansion
228 spaces
III-4
Northeast Corporate Hangar Development
15,000 sf
III-6
West Apron Expansion
24,000 sy
III-7
Phase III West Apron Corporate Hangar Development
54,000 sf
III-8
Taxiway Lima Construction
2,500 lf
III-9
Extension of Wakeman Drive South of Geneva Aviation
1,200 lf
III-10
Realignment of Wakeman Drive North of Aurora
2,200 lf
III-11
By-Pass Taxiway Construction between Runway 16L and Runway 16R
650 lf
III-12
Fuel Farm Expansion
27,000 gallons
III-13
West Apron Corporate Hangar Automobile Parking
175 spaces
Source:
Campbell and Paris Engineers, P.C. 2002
sy = square yards
sf = square feet
lf = linear feet
MANASSAS REGIONAL AIRPORT LAYOUT PLAN UPDATE
TABLE 6.6
Estimated Development Costs for Items Identified for Phase III Construction
Project
Project
Estimated
Federal
State
Local
Other*
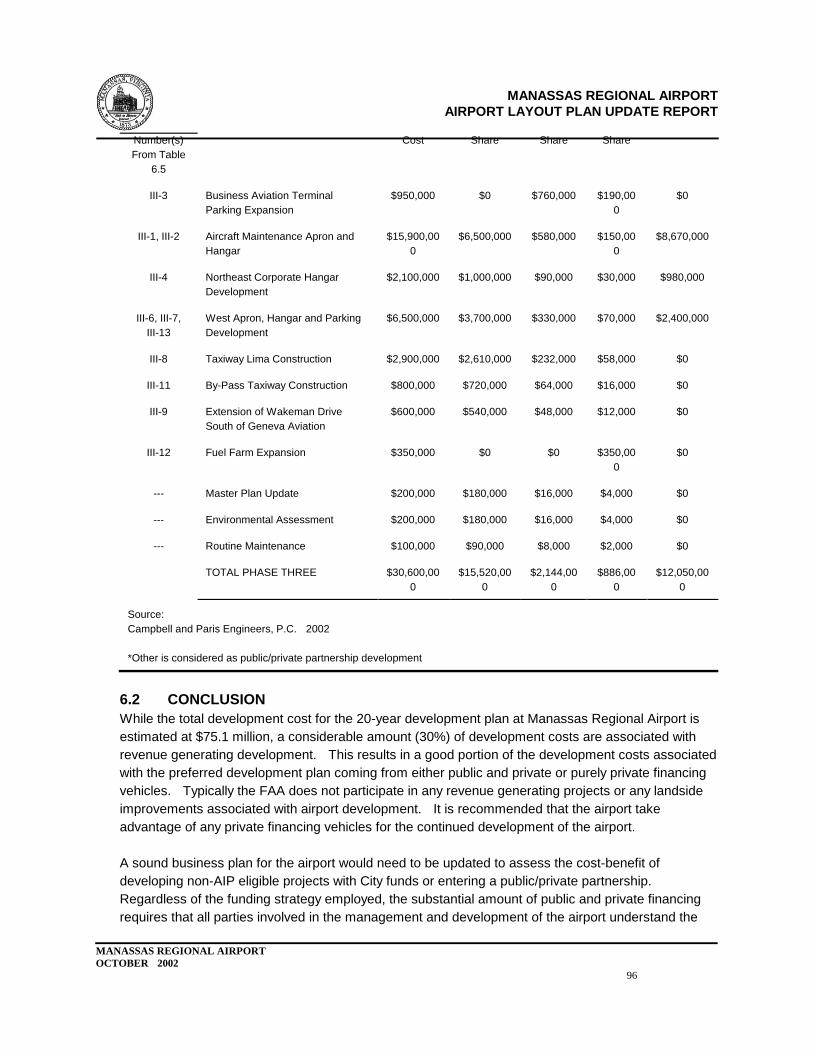
MANASSAS REGIONAL AIRPORT
AIRPORT LAYOUT PLAN UPDATE REPORT
MANASSAS REGIONAL AIRPORT
OCTOBER 2002
96
Number(s)
From Table
6.5
Cost Share Share Share
III-3
Business Aviation Terminal
Parking Expansion
$950,000
$0
$760,000
$190,00
0
$0
III-1, III-2
Aircraft Maintenance Apron and
Hangar
$15,900,00
0
$6,500,000
$580,000
$150,00
0
$8,670,000
III-4
Northeast Corporate Hangar
Development
$2,100,000
$1,000,000
$90,000
$30,000
$980,000
III-6, III-7,
III-13
West Apron, Hangar and Parking
Development
$6,500,000
$3,700,000
$330,000
$70,000
$2,400,000
III-8
Taxiway Lima Construction
$2,900,000
$2,610,000
$232,000
$58,000
$0
III-11
By-Pass Taxiway Construction
$800,000
$720,000
$64,000
$16,000
$0
III-9
Extension of Wakeman Drive
South of Geneva Aviation
$600,000
$540,000
$48,000
$12,000
$0
III-12
Fuel Farm Expansion
$350,000
$0
$0
$350,00
0
$0
---
Master Plan Update
$200,000
$180,000
$16,000
$4,000
$0
---
Environmental Assessment
$200,000
$180,000
$16,000
$4,000
$0
---
Routine Maintenance
$100,000
$90,000
$8,000
$2,000
$0
TOTAL PHASE THREE
$30,600,00
0
$15,520,00
0
$2,144,00
0
$886,00
0
$12,050,00
0
Source:
Campbell and Paris Engineers, P.C. 2002
*Other is considered as public/private partnership development
6.2 CONCLUSION
While the total development cost for the 20-year development plan at Manassas Regional Airport is
estimated at $75.1 million, a considerable amount (30%) of development costs are associated with
revenue generating development. This results in a good portion of the development costs associated
with the preferred development plan coming from either public and private or purely private financing
vehicles. Typically the FAA does not participate in any revenue generating projects or any landside
improvements associated with airport development. It is recommended that the airport take
advantage of any private financing vehicles for the continued development of the airport.
A sound business plan for the airport would need to be updated to assess the cost-benefit of
developing non-AIP eligible projects with City funds or entering a public/private partnership.
Regardless of the funding strategy employed, the substantial amount of public and private financing
requires that all parties involved in the management and development of the airport understand the
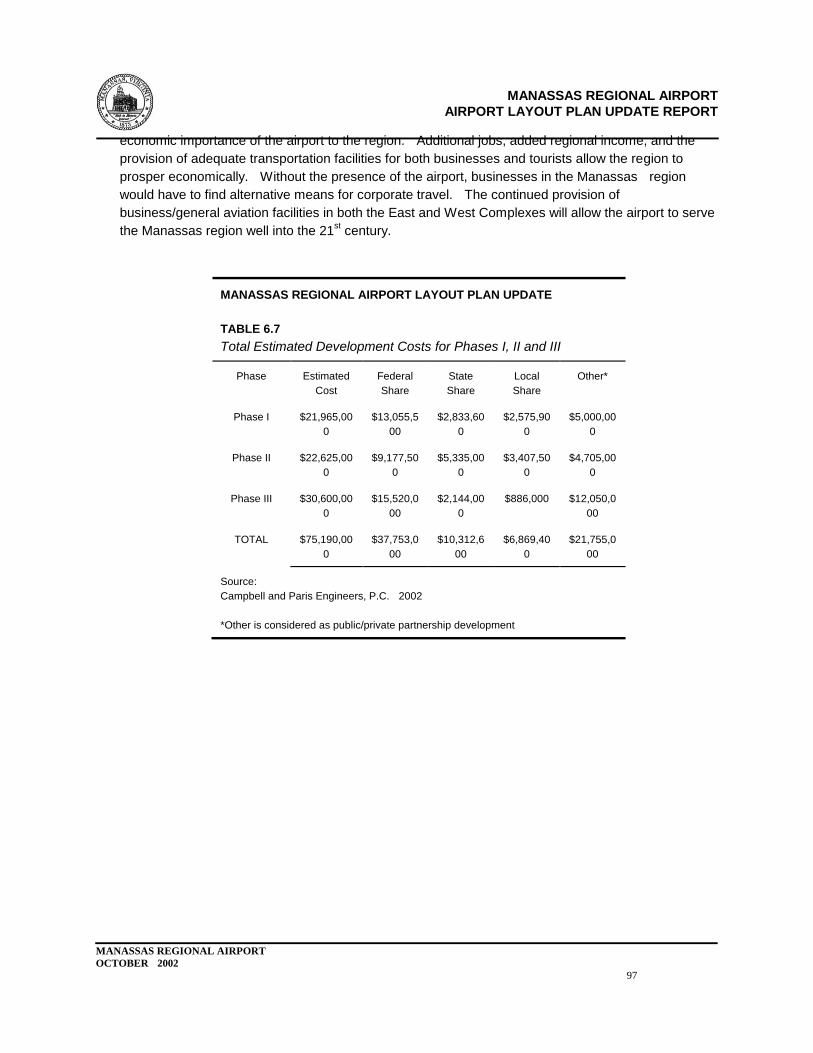
MANASSAS REGIONAL AIRPORT
AIRPORT LAYOUT PLAN UPDATE REPORT
MANASSAS REGIONAL AIRPORT
OCTOBER 2002
97
economic importance of the airport to the region. Additional jobs, added regional income, and the
provision of adequate transportation facilities for both businesses and tourists allow the region to
prosper economically. Without the presence of the airport, businesses in the Manassas region
would have to find alternative means for corporate travel. The continued provision of
business/general aviation facilities in both the East and West Complexes will allow the airport to serve
the Manassas region well into the 21st century.
MANASSAS REGIONAL AIRPORT LAYOUT PLAN UPDATE
TABLE 6.7
Total Estimated Development Costs for Phases I, II and III
Phase
Estimated
Cost
Federal
Share
State
Share
Local
Share
Other*
Phase I
$21,965,00
0
$13,055,5
00
$2,833,60
0
$2,575,90
0
$5,000,00
0
Phase II
$22,625,00
0
$9,177,50
0
$5,335,00
0
$3,407,50
0
$4,705,00
0
Phase III
$30,600,00
0
$15,520,0
00
$2,144,00
0
$886,000
$12,050,0
00
TOTAL
$75,190,00
0
$37,753,0
00
$10,312,6
00
$6,869,40
0
$21,755,0
00
Source:
Campbell and Paris Engineers, P.C. 2002
*Other is considered as public/private partnership development