Detecting runways in complex airport scenes
39
COMPUTER VISION, GRAPHICS, AND IMAGE PROCESSING 51, 107-145 (1990) Detecting Runways in Complex Airport Scenes* A. HUERTAS, W. COLE, AND R. NEVATIA Institute for Robotics and Intelligent Systems, School of Engineering, Powell Hall of Engineering University of Southern California, Los Angeles, California 90089-0273 Received March 29,198s; accepted July 14, 1989 Detection of runways in aerial images is part of a project to automatically map complex cultural areas such as a major commercial airport complex. This task is much more difficult than appears at first. Runways are not merely homogeneous strips in the image due to several markings on the surface, changes in the surface material and presence of other objects such as taxiways and aircraft. We use some generic sources of knowledge to help with these problems in a hypothesize and test paradigm. Hypotheses are formed by looking for instances of long rectangular shapes, possibly interrupted by other long rectangles. Runway markings, mandated by standards for runway construction, are used to verify our hypotheses. Our system gives good performance on a variety of complex scenes and does not rely on location specific knowledge. Q 1990 Academic press, hc. 1. INTRODUCTION In this paper, we describe techniques for detection of runways in aerial images of large, commercial airport complexes. This work is part of a larger project to develop automated techniques for mapping complex, cultural features from aerial photographs. The domain of major commercial airport complexes is one we have chosen because of its richness and availability of image data. Airports contain a variety of objects, such as the transportation network (runways, taxiways, and roads), building structures (hangars, terminals, storage warehouses), and mobile objects (automobiles, aircraft, humans), shown schematically in Fig. 1. The images themselves are rather complex due to the large number of objects present in them. Our motivation for this work is twofold. First, the specific tasks are of great practical significance for a variety of applications. Second, we believe that the problem domain provides a rich testbed for experiments in building high-perfor- mance visual “expert” systems. We do not necessarily imply that the exact algorithms developed for this task will also be useful for all other tasks, but merely the hope that the approach will carry over for similar tasks. We also believe that experience with specific domains is essential to development of more generic vision systems. Mapping requires dealing with a multiplicity and variety of objects in a natural environment that contains texture and markings. The solution requires use of powerful “bottom-up” descriptive techniques as well as the use of domain knowledge. Such capabilities are obviously going to be needed by vision systems in other domains also. *This research was supported by the Defense Advanced Research Projects Agency, monitored by the Air Force Wright Aeronautical Laboratories under Contracts F3361584-K-1404 and F33615-87-C-1436. 107 0734-189X/90 $3.00 Copyright 0 1990 by Academic Press, Inc. All rights of reproduction in any form resewed.
-
Upload
independent -
Category
Documents
-
view
0 -
download
0
Transcript of Detecting runways in complex airport scenes
COMPUTER VISION, GRAPHICS, AND IMAGE PROCESSING 51, 107-145 (1990)
Detecting Runways in Complex Airport Scenes*
A. HUERTAS, W. COLE, AND R. NEVATIA
Institute for Robotics and Intelligent Systems, School of Engineering, Powell Hall of Engineering University of Southern California, Los Angeles, California 90089-0273
Received March 29,198s; accepted July 14, 1989
Detection of runways in aerial images is part of a project to automatically map complex cultural areas such as a major commercial airport complex. This task is much more difficult than appears at first. Runways are not merely homogeneous strips in the image due to several markings on the surface, changes in the surface material and presence of other objects such as taxiways and aircraft. We use some generic sources of knowledge to help with these problems in a hypothesize and test paradigm. Hypotheses are formed by looking for instances of long rectangular shapes, possibly interrupted by other long rectangles. Runway markings, mandated by standards for runway construction, are used to verify our hypotheses. Our system gives good performance on a variety of complex scenes and does not rely on location specific knowledge. Q 1990 Academic press, hc.
1. INTRODUCTION
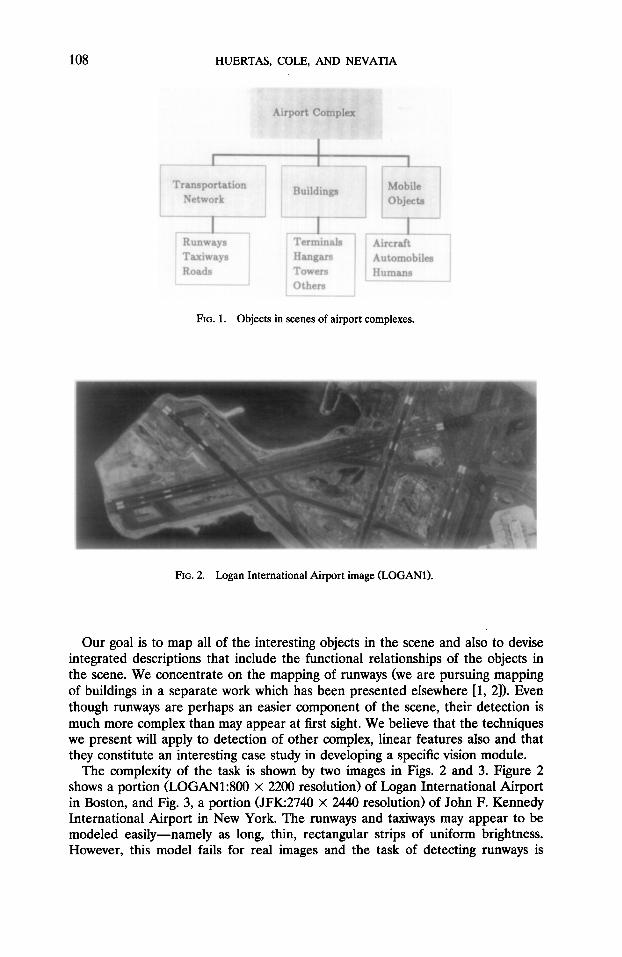
In this paper, we describe techniques for detection of runways in aerial images of large, commercial airport complexes. This work is part of a larger project to develop automated techniques for mapping complex, cultural features from aerial photographs. The domain of major commercial airport complexes is one we have chosen because of its richness and availability of image data. Airports contain a variety of objects, such as the transportation network (runways, taxiways, and roads), building structures (hangars, terminals, storage warehouses), and mobile objects (automobiles, aircraft, humans), shown schematically in Fig. 1. The images themselves are rather complex due to the large number of objects present in them.
Our motivation for this work is twofold. First, the specific tasks are of great practical significance for a variety of applications. Second, we believe that the problem domain provides a rich testbed for experiments in building high-perfor- mance visual “expert” systems. We do not necessarily imply that the exact algorithms developed for this task will also be useful for all other tasks, but merely the hope that the approach will carry over for similar tasks. We also believe that experience with specific domains is essential to development of more generic vision systems. Mapping requires dealing with a multiplicity and variety of objects in a natural environment that contains texture and markings. The solution requires use of powerful “bottom-up” descriptive techniques as well as the use of domain knowledge. Such capabilities are obviously going to be needed by vision systems in other domains also.
*This research was supported by the Defense Advanced Research Projects Agency, monitored by the Air Force Wright Aeronautical Laboratories under Contracts F3361584-K-1404 and F33615-87-C-1436.
107 0734-189X/90 $3.00 Copyright 0 1990 by Academic Press, Inc. All rights of reproduction in any form resewed.
108 HUERTAS, COLE, AND NEVATIA
I
Transp6rtation Network
I I
Buildings
I
Mobile Objecta
I Runways Taxiways Roads
I Terminals Hang- Towers Others
I Aircraft Automobiles Humana
FIG. 1. Objects in scenes of airport complexes.
FIG. 2. Logan International Airport image (LOGANI).
Our goal is to map all of the interesting objects in the scene and also to devise integrated descriptions that include the functional relationships of the objects in the scene. We concentrate on the mapping of runways (we are pursuing mapping of buildings in a separate work which has been presented elsewhere [l, 21). Even though runways are perhaps an easier component of the scene, their detection is much more complex than may appear at first sight. We believe that the techniques we present will apply to detection of other complex, linear features also and that they constitute an interesting case study in developing a specific vision module.
The complexity of the task is shown by two images in Figs. 2 and 3. Figure 2 shows a portion (LOGAN1:800 x 2200 resolution) of Logan International Airport in Boston, and Fig. 3, a portion (JFK2740 x 2440 resolution) of John F. Kennedy International Airport in New York. The runways and taxiways may appear to be modeled easily-namely as long, thin, rectangular strips of uniform brightness. However, this model fails for real images and the task of detecting runways is
RUNWAY DETECTION 109
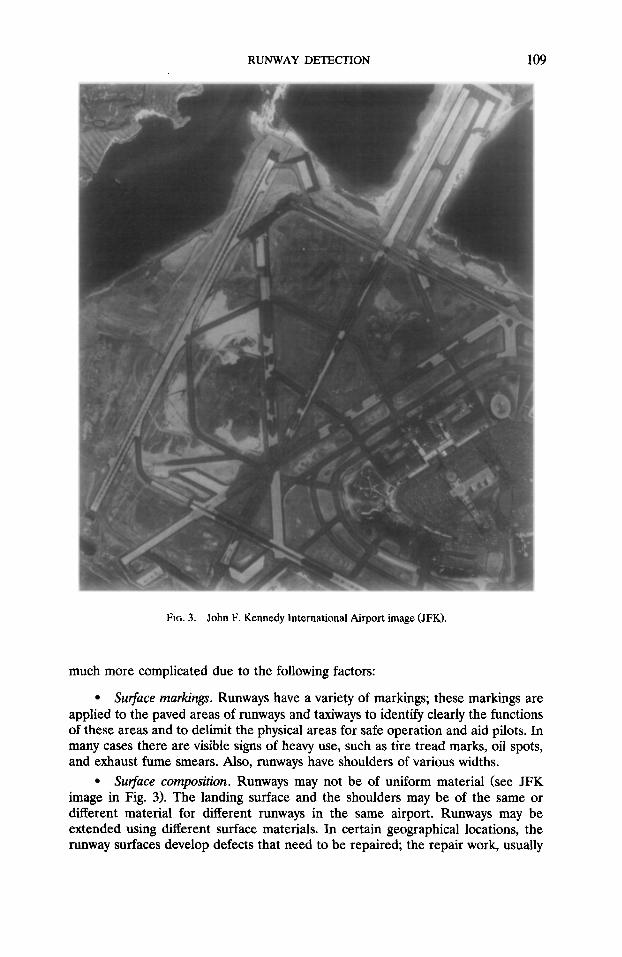
FIG. 3. John F. Kennedy International Airport image (JFK).
much more complicated due to the following factors:
l Su$uce markings. Runways have a variety of markings; these markings are applied to the paved areas of runways and taxiways to identify clearly the functions of these areas and to delimit the physical areas for safe operation and aid pilots. In many cases there are visible signs of heavy use, such as tire tread marks, oil spots, and exhaust fume smears. Also, runways have shoulders of various widths.
l Surface composition. Runways may not be of uniform material (see JFK image in Fig. 3). The landing surface and the shoulders may be of the same or different material for different runways in the same airport. Runways may be extended using different surface materials. In certain geographical locations, the runway surfaces develop defects that need to be repaired; the repair work, usually
110 HUERTAS, COLE, AND NEVATIA
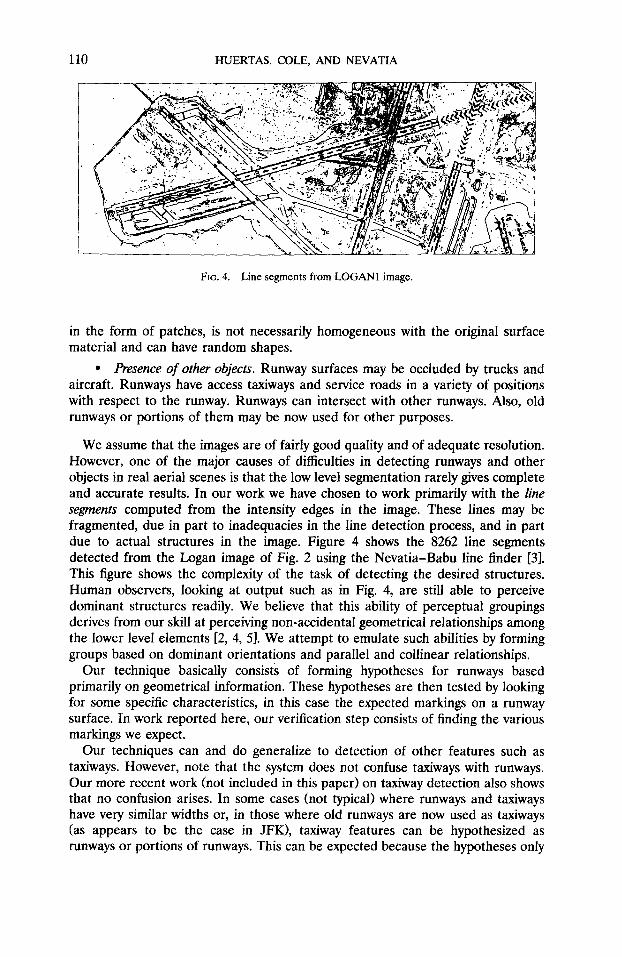
FIG. 4. Line segments from LOGAN1 image.
in the form of patches, is not necessarily homogeneous with the original surface material and can have random shapes.
l Presence of other objects. Runway surfaces may be occluded by trucks and aircraft. Runways have access taxiways and service roads in a variety of positions with respect to the runway. Runways can intersect with other runways. Also, old runways or portions of them may be now used for other purposes.
We assume that the images are of fairly good quality and of adequate resolution. However, one of the major causes of difficulties in detecting runways and other objects in real aerial scenes is that the low level segmentation rarely gives complete and accurate results. In our work we have chosen to work primarily with the line segments computed from the intensity edges in the image. These lines may be fragmented, due in part to inadequacies in the line detection process, and in part due to actual structures in the image. Figure 4 shows the 8262 line segments detected from the Logan image of Fig. 2 using the Nevatia-Babu line finder [3]. This figure shows the complexity of the task of detecting the desired structures. Human observers, looking at output such as in Fig. 4, are still able to perceive dominant structures readily. We believe that this ability of perceptual groupings derives from our skill at perceiving non-accidental geometrical relationships among the lower level elements [2, 4, 51. We attempt to emulate such abilities by forming groups based on dominant orientations and parallel and collinear relationships.
Our technique basically consists of forming hypotheses for runways based primarily on geometrical information. These hypotheses are then tested by looking for some specific characteristics, in this case the expected markings on a runway surface. In work reported here, our verification step consists of finding the various markings we expect.
Our techniques can and do generalize to detection of other features such as taxiways. However, note that the system does not confuse taxiways with runways. Our more recent work (not included in this paper) on taxiway detection also shows that no confusion arises. In some cases (not typical) where runways and taxiways have very similar widths or, in those where old runways are now used as taxiways (as appears to be the case in JFK), taxiway features can be hypothesized as runways or portions of runways. This can be expected because the hypotheses only
RUNWAY DETECTION 111
represent instances of the shape or portion of shape of the objects we are looking for. Characterization of these as one or the other comes only after the verification (or test) step is applied in terms of the attributes, that is, the surface markings, that are particular to each. The surface markings are very different (for safety) for runways and taxiways; they allow us to correctly disambiguate them if sufficient evidence of markings is found. Finding evidence or markings, depends mostly on image quality and resolution. Also, for these same reasons, the system will not confuse runways and nearby highways.
Further validation of the runway hypotheses should, ideally, take place in the context of the larger system that is also reasoning about other objects in the scene, such as the remainder of the transportation network, buildings, and the mobile objects. Location of these objects will mutually affect the confidence levels of the descriptions of other objects. Many interesting questions arise in the implementa- tion of such interactions, such as the nature of the interaction and the order in which it takes place (i.e., the control structure). We are investigating alternative techniques for this in our current work. The techniques described here should be viewed as a module for the larger system to operate on. Regardless of the fine structure of the larger system, it is our belief that the system needs modules which are fairly competent at finding the major, individual structures without the global context. The global context is useful to refme or confirm the initial hypotheses and in some cases to initiate new hypotheses but can not be a substitute for high quality description modules.
Other work related to the mapping of runways, airport complexes and aerial images in general has been reported extensively by McKeown at CMU (see, for example, [6, 71). His approach is based on region features and uses rule based systems in his work. Our work differs from McKeown’s work mostly in our use of generic knowledge rather than specific knowledge of the particular scene.
2. AN OVERVIEW AND ASSUMPTIONS
To deal with the fragmented segmentation and the complexities of the task outlined above, we use higher level perceptual organization techniques and some knowledge of the scene domain and the task. Our approach is to use generic modules wherever possible in preference to highly specific modules of a particular scene, as used in [6, 71 for example. Our method uses a “hypothesize and test” paradigm; our processes generate some hypotheses for the desired structures using generic techniques which are then validated or rejected by using more specific models of a runway. Our methods use the following sources of knowledge:
l Geometry and Shape. We know that we are looking for instances of objects whose outlines represent a rectangular shape having a large aspect ratio of length to width. We know that runways have ends as opposed to nearby straight stretches of highways and roads.
l Specific knowledge of airport design. We know the features that make a visible long strip in the image an airport runway: The standard markings applied to the surfaces, according to FAA specifications. From airport engineering we also know the range of angles between runways, typical distances between parallel runways, range of widths and so on.
112 HUERTAS, COLE, AND NEVATIA
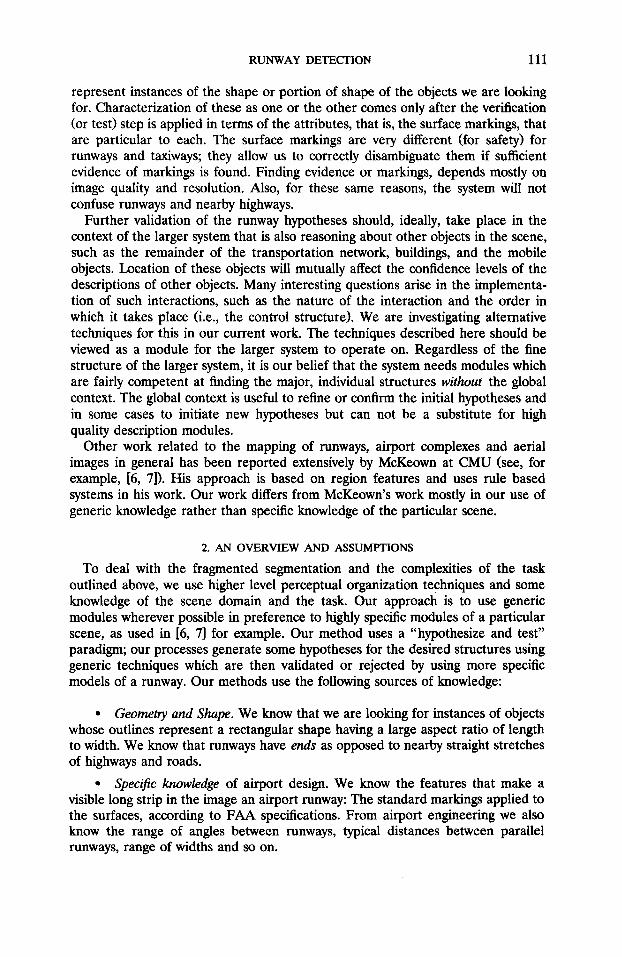
FIG. 5. Standard runway markings.
l Photometric Knowledge. Intensity data may be of some help in verifying runway hypotheses when runway markings are non existent or not available due to lack of contrast or lack of resolution. Our current implementation applies finer feature extraction techniques to selected portions of the image to try to locate missing evidence. Also we use image resolution information throughout the pro- cess.
As previously mentioned, we have chosen to work primarily with line segments extracted from the image. Geometric knowledge of the desired structures indicate that they should be characterized by parallel lines of opposite contrast. We call such pairs of lines “anti-parallel,” and abbreviate them as upurs. Apars form the basic unit of our further analysis.
In a complex scene like a major airport not all apars correspond to a runway or even to segments of the transportation network. Conversely, not all of the runway is likely to be included in one apar or even in a set of apars. Thus, an important aspect of our hypotheses formation process is that it is as non-committal as possible: if a line segment contributes to many apars, as is the case along runway features where there may be a large number of linear features parallel to the runway, such as runway shoulders, taxiways, and service roads, possibly having markings of their own, we allow the apar computation process to generate all the possible combinations. This leads to a large search space that must be focused on (reduced) in order to facilitate the detection of the desired structures.
The search space is reduced by computing estimates of the directions and widths of the runways, from the apars. We use these estimates to extract from the original set of apars those having a dominant orientation. The selected apars, for each dominant orientation, are then grouped according to their width. The apars in the
RUNWAY DETECTION 113
FIYPO’
I
DETECTION OF RUNWAYS
AIRPORT IMAGEI-4
ESES FORMATION - SEGMENTATION
t Reduce Search Space
+
Runway Hypotheses
,,ES ;IIFIC.;;;;d7 RESEGMENTATJON
Low Level Segmentation
- Line Segments - Anti-parallels
iCRIPTION
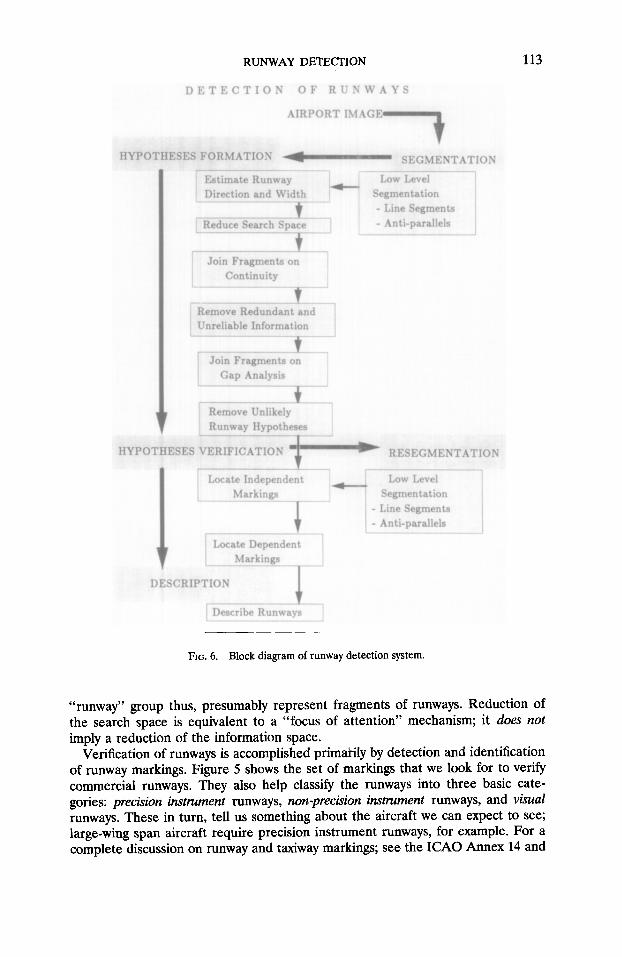
FIG. 6. Block diagram of runway detection system.
“runway” group thus, presumably represent fragments of runways. Reduction of the search space is equivalent to a “focus of attention” mechanism; it does not imply a reduction of the information space.
Verification of runways is accomplished primarily by detection and identification of runway markings. Figure 5 shows the set of markings that we look for to verify commercial runways. They also help classify the runways into three basic cate- gories: precision in+stnunent runways, non-precision instrument runways, and visual runways. These in turn, tell us something about the aircraft we can expect to see; large-wing span aircraft require precision instrument runways, for example. For a complete discussion on runway and taxiway markings; see the ICAO Annex 14 and
114 HUERTAS, COLE, AND NEVATIA
181. Our description relates to the FAA specifications, which are generally similar in function and form to the international standards; where differences occur, they are not sufficiently great to cause confusion [9].
The diagram depicted in Fig. 6 summarizes our technique:
A. Hypotheses formation. Finds all the instances of the desired shapes in the image, i.e., long thin rectangles.
1. Detect line segments and anti-parallelism. The line segments extracted ap- proximate the intensity edges in the image. The anti-paralZels represent the parallel relationships among pairs of segments of opposing contrast.
2. Estimate runway directions and widths. Apars are classified according to their orientation and width to obtain the dominant orientations and width groups of the linear features in the image.
3. Join apars based on continuity. Apars are combined into larger structures based on the continuity relationships of the underlying segments.
4. Remove apars with low aspect ratio. Unreliable small apars (with an aspect ratio of less than 0.25) are discarded.
5. Remove contained apars. Redundant information is discarded. 6. Join collinear apars. Apars are combined to form larger rectangular struc-
tures based on their parallel and collinear relationships.
B. Hypotheses verification. Finds evidence to support or reject hypotheses, i.e., runway markings. We look for thin bright apars representing:
1. Runway centerlines. Near the center of the hypothesized runway. 2. Side str@e markings. Along the sides of the hypothesized runways. These
delineate the runway landing surface. 3. Threshold markings. At the begin and end points of the hypothesized
runway, even though the paved surface may extend beyond these marks. 4. Touchdown markings. Near the threshold markings. 5. Large distance markings. Beyond the touchdown markings. 6. Small distance markings. Distributed along the landing surface. 7. Blast pad markings. At the end of the runways and beyond the threshold
markings. They are characterized by their arrangement into a “herringbone pattern.”
C. Re-segmentation. Recomputes segments and apars in small neighborhoods. We perform a local search to look for further evidence of missing markings as follows:
1. Recompute apars using lower edge magnitude thresholds in small windows along runway hypotheses, and look for additional markings.
2. Using knowledge of the position of detected centerlines and blastpad marks, estimate of the location of missing markings, recompute apars in small windows at these locations, and look for additional centerlines and blastpad marks. If necessary, repeat the process using the same windows at higher resolution (double in our current system).
RUNWAY DETECTION 115
D. Scene description and hypotheses evaluation. Generates a description of the runways in the scene.
For each runway we give its position, length, width, orientation, and associated markings. At this stage we could also assign a confidence level to each hypothesis based on how many of the expected markings are found. The information to do this is available to our system. However, we have chosen not to arbitrarily assign weights to the markings. Instead, our approach is to pass the whole description to the higher level which can use global context to make further judgements. The global context may consist of where the hypothesized runways lead to, for example.
3. DETAILS OF THE METHOD
We now give details of our method and its implementation.
3.1. Formation of Runway Hypotheses
3.1.1. Detection of Line Segments and Anti-parallels
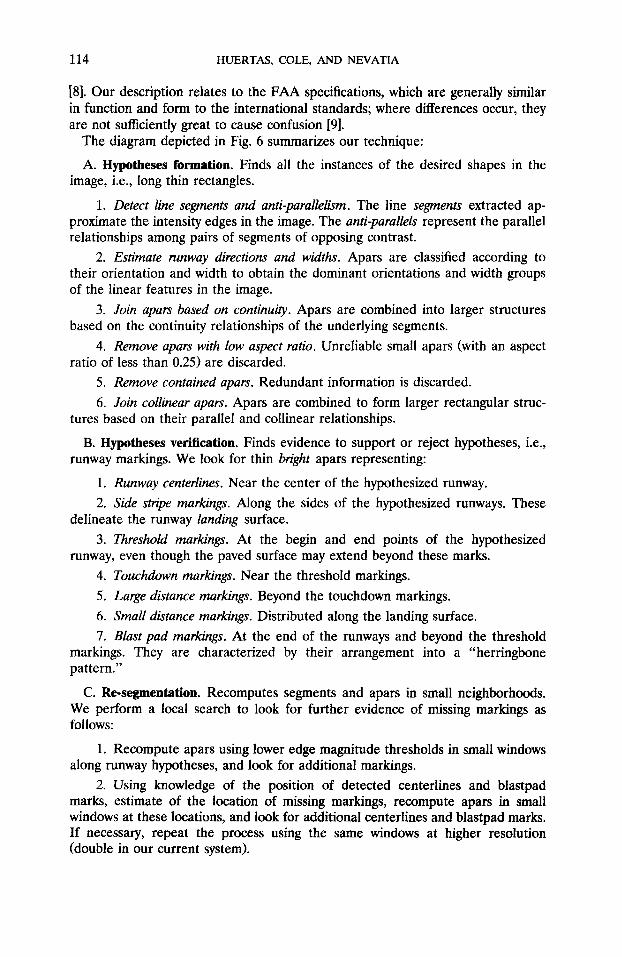
We use the USC “LINEAR” line detection system to obtain line segments. This system allows for the use of a variety of edge detectors at the low level, for example, the Nevatia-Babu [3], Marr-Hildreth [lo, 111, and Canny [12]. In this work, we have used the Nevatia-Babu detector (for an initial segmentation) and the Canny detector (for subsequent partial segmentations of portions of the image). Edges are thinned and linked to form continuous curves, which are in turn, approximated by piecewise linear segments. Each linear segment is described by its length, orientation, contrast, and position of its end points. Additionally, we also know if a segment connects to another segment at either end. Figure 4 shows the 8262 line segments computed from the image of LOGAN Airport in Fig. 2. The 9489 apars (anti-parallels) shown in Fig. 7 are computed from these segments by specifying the minimum (in our examples, 1 pixel) and maximum (60 pixels) distance between the anti-parallel pairs of segments. The range will be known in practice if the altitude of the aircraft and image resolution are known. The apars are described by their length, orientation, end points, width, and “color” (brighter or darker than surround).
FIG. 7. Anti-parallels from segments in LOGAN1 image.
116 HUERTAS, COLE, AND NEVATIA
: : : : ..i j -; _........ ..~.. .._ / / / / / / .y.-..?.y ~.........; .,.. . . . . . ~ .._ i : i . . . . i : : p ,-“......“““” : : : i j / . I:;r:: _ ..-... i.. ..__........ j : : : :
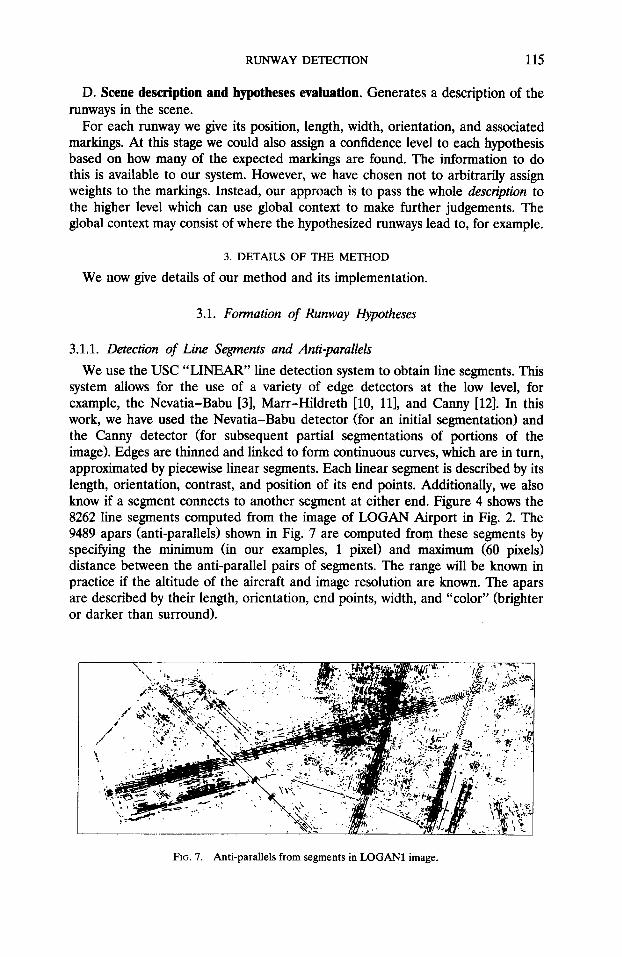
FIG. 8. Length weighted histogram of apar orientations.
3.1.2. Estimating Runway Orientations and Widths In this step we attempt to estimate the direction and width of the runways in the
image. We first estimate the direction of the runways by computing a length- weighted histogram of the orientation of the detected apars. The resulting his-
I
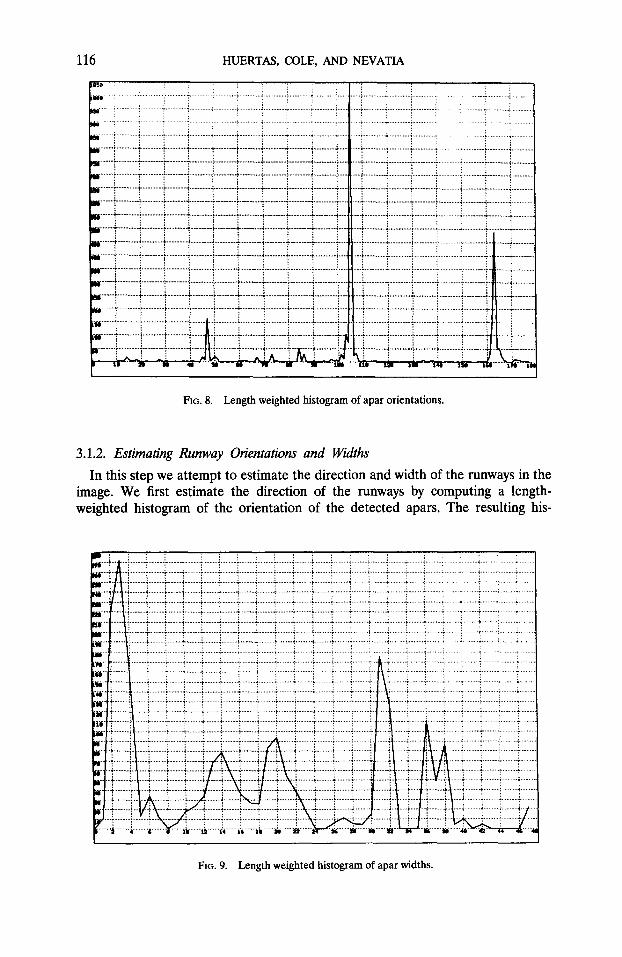
FIG. 9. Length weighted histogram of apar widths.
RUNWAY DETECXION 117
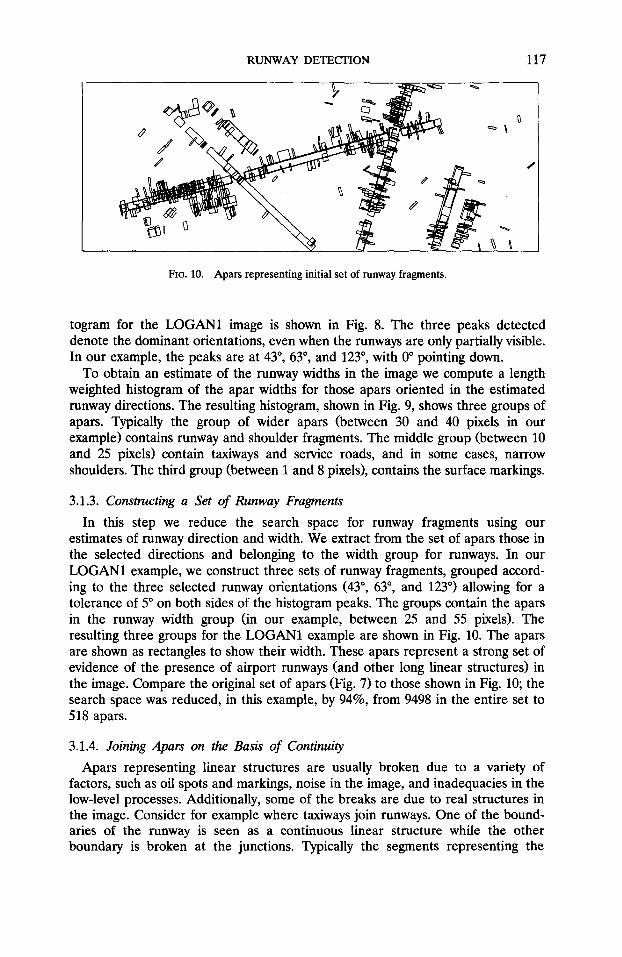
FIG. 10. Apars representing initial set of runway fragments.
togram for the LOGAN1 image is shown in Fig. 8. The three peaks detected denote the dominant orientations, even when the runways are only partially visible. In our example, the peaks are at 43”, 63”, and 123”, with 0” pointing down.
To obtain an estimate of the runway widths in the image we compute a length weighted histogram of the apar widths for those apars oriented in the estimated runway directions. The resulting histogram, shown in Fig. 9, shows three groups of apars. Typically the group of wider apars (between 30 and 40 pixels in our example) contains runway and shoulder fragments. The middle group (between 10 and 25 pixels) contain taxiways and service roads, and in some cases, narrow shoulders. The third group (between 1 and 8 pixels), contains the surface markings.
3.1.3. Constructing a Set of Runway Fragments
In this step we reduce the search space for runway fragments using our estimates of runway direction and width. We extract from the set of apars those in the selected directions and belonging to the width group for runways. In our LOGAN1 example, we construct three sets of runway fragments, grouped accord- ing to the three selected runway orientations (43”, 63”, and 123”) allowing for a tolerance of 5” on both sides of the histogram peaks. The groups contain the apars in the runway width group (in our example, between 25 and 55 pixels). The resulting three groups for the LOGAN1 example are shown in Fig. 10. The apars are shown as rectangles to show their width. These apars represent a strong set of evidence of the presence of airport runways (and other long linear structures) in the image. Compare the original set of apars (Fig. 7) to those shown in Fig. 10; the search space was reduced, in this example, by 94%, from 9498 in the entire set to 518 apars.
3.1.4. Joining Apars on the Basis of Continuity
Apars representing linear structures are usually broken due to a variety of factors, such as oil spots and markings, noise in the image, and inadequacies in the low-level processes. Additionally, some of the breaks are due to real structures in the image. Consider for example where taxiways join runways. One of the bound- aries of the runway is seen as a continuous linear structure while the other boundary is broken at the junctions. Typically the segments representing the
118 HUERTAS, COLE, AND NEVATIA
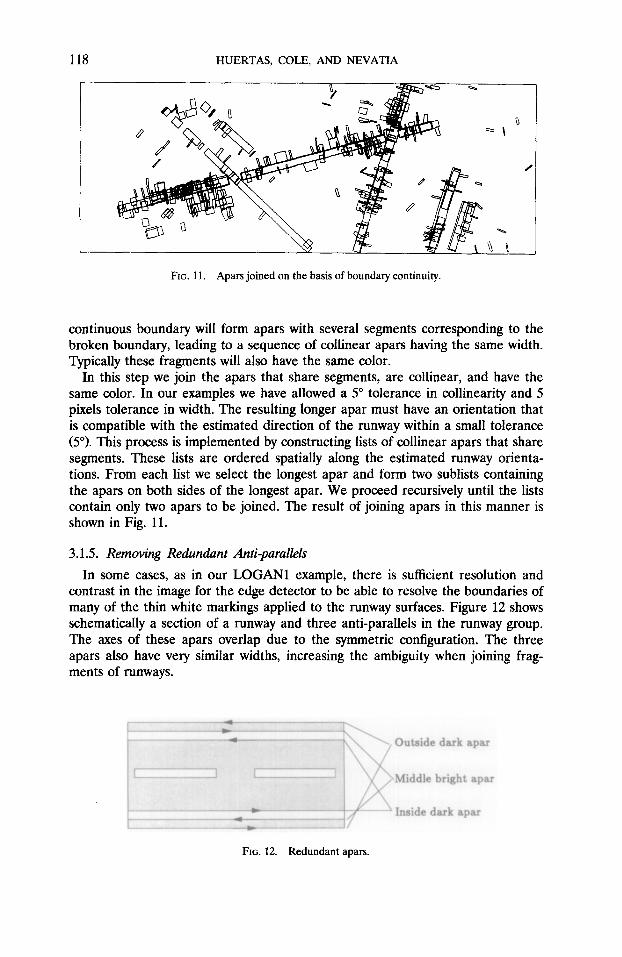
FIG. 11. Apars joined on the basis of boundary continuity.
continuous boundary will form apars with several segments corresponding to the broken boundary, leading to a sequence of collinear apars having the same width. Typically these fragments will also have the same color.
In this step we join the apars that share segments, are collinear, and have the same color. In our examples we have allowed a 5” tolerance in collinearity and 5 pixels tolerance in width. The resulting longer apar must have an orientation that is compatible with the estimated direction of the runway within a small tolerance (So). This process is implemented by constructing lists of collinear apars that share segments. These lists are ordered spatially along the estimated runway orienta- tions. From each list we select the longest apar and form two sublists containing the apars on both sides of the longest apar. We proceed recursively until the lists contain only two apars to be joined. The result of joining apars in this manner is shown in Fig. 11.
3.1.5. Removing Redundant Anti-parallels
In some cases, as in our LOGAN1 example, there is sufficient resolution and contrast in the image for the edge detector to be able to resolve the boundaries of many of the thin white markings applied to the runway surfaces. Figure 12 shows schematically a section of a runway and three anti-parallels in the runway group. The axes of these apars overlap due to the symmetric configuration. The three apars also have very similar widths, increasing the ambiguity when joining frag- ments of runways.
Outside dark apar
Middle bright apar
Inside dark apar
FIG. 12. Redundant apars.
RUNWAY DETECTION 119
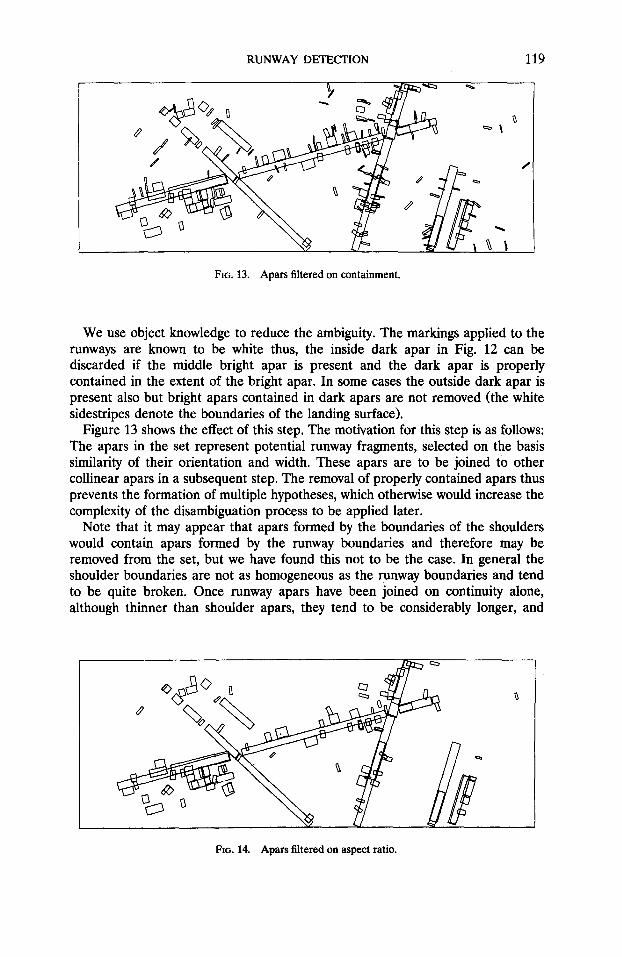
FIG. 13. Apars filtered on containment.
We use object knowledge to reduce the ambiguity. The markings applied to the runways are known to be white thus, the inside dark apar in Fig. 12 can be discarded if the middle bright apar is present and the dark apar is properly contained in the extent of the bright apar. In some cases the outside dark apar is present also but bright apars contained in dark apars are not removed (the white sidestripes denote the boundaries of the landing surface).
Figure 13 shows the effect of this step. The motivation for this step is as follows: The apars in the set represent potential runway fragments, selected on the basis similarity of their orientation and width. These apars are to be joined to other collinear apars in a subsequent step. The removal of properly contained apars thus prevents the formation of multiple hypotheses, which otherwise would increase the complexity of the disambiguation process to be applied later.
Note that it may appear that apars formed by the boundaries of the shoulders would contain apars formed by the runway boundaries and therefore may be removed from the set, but we have found this not to be the case. In general the shoulder boundaries are not as homogeneous as the runway boundaries and tend to be quite broken. Once runway apars have been joined on continuity alone, although thinner than shoulder apars, they tend to be considerably longer, and
FIG. 14. Apars filtered on aspect ratio.
120 HUERTAS, COLE, AND NEVATIA
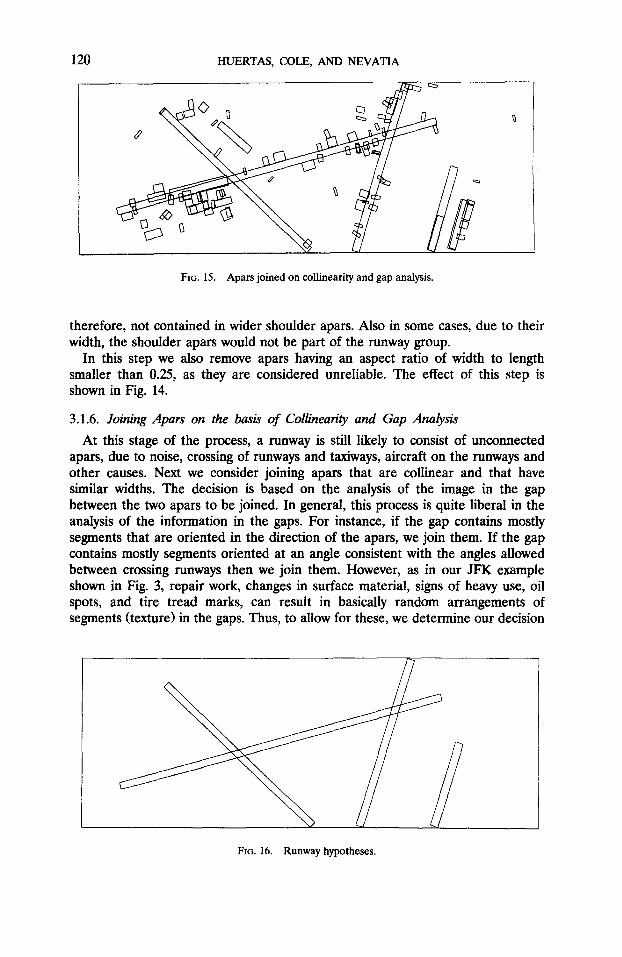
FIG. 15. Apars joined on collinearity and gap analysis.
therefore, not contained in wider shoulder apars. Also in some cases, due to their width, the shoulder apars would not be part of the runway group.
In this step we also remove apars having an aspect ratio of width to length smaller than 0.25, as they are considered unreliable. The effect of this step is shown in Fig. 14.
3.1.6. Joining Apars on the basis of Collinearity and Gap Analysis
At this stage of the process, a runway is still likely to consist of unconnected apars, due to noise, crossing of runways and taxiways, aircraft on the runways and other causes. Next we consider joining apars that are collinear and that have similar widths. The decision is based on the analysis of the image in the gap between the two apars to be joined. In general, this process is quite liberal in the analysis of the information in the gaps. For instance, if the gap contains mostly segments that are oriented in the direction of the apars, we join them. If the gap contains mostly segments oriented at an angle consistent with the angles allowed between crossing runways then we join them. However, as in our JFK example shown in Fig. 3, repair work, changes in surface material, signs of heavy use, oil spots, and tire tread marks, can result in basically random arrangements of segments (texture) in the gaps. Thus, to allow for these, we determine our decision
FIG. 16. Runway hypotheses.
RUNWAY DETECTION 121
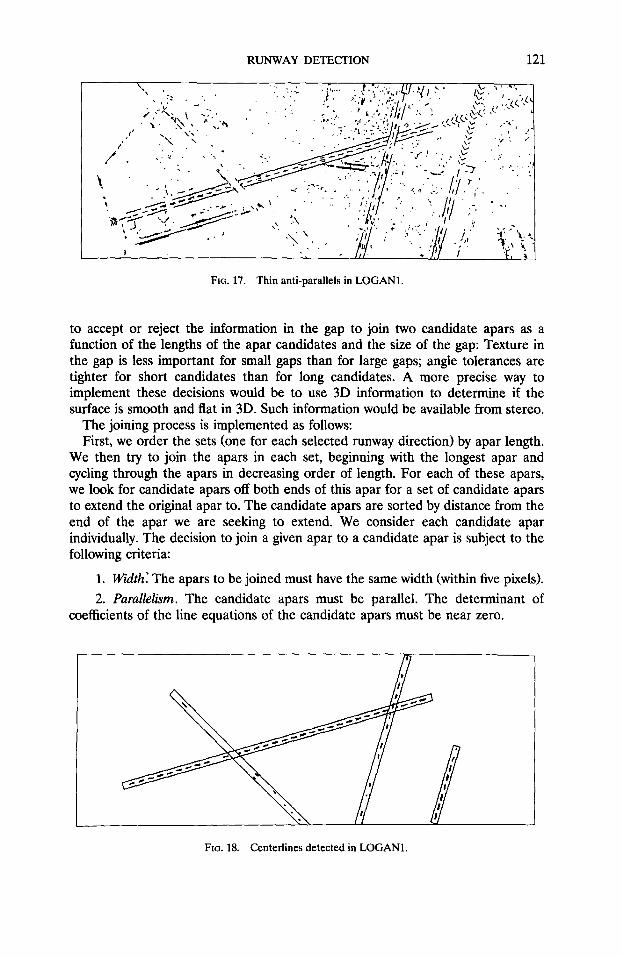
FIG. 17. Thin anti-parallels in LOGANl.
to accept or reject the information in the gap to join two candidate apars as a function of the lengths of the apar candidates and the size of the gap: Texture in the gap is less important for small gaps than for large gaps; angle tolerances are tighter for short candidates than for long candidates. A more precise way to implement these decisions would be to use 3D information to determine if the surface is smooth and flat in 3D. Such information would be available from stereo.
The joining process is implemented as follows: First, we order the sets (one for each selected runway direction) by apar length.
We then try to join the apars in each set, beginning with the longest apar and cycling through the apars in decreasing order of length. For each of these apars, we look for candidate apars off both ends of this apar for a set of candidate apars to extend the original apar to. The candidate apars are sorted by distance from the end of the apar we are seeking to extend. We consider each candidate apar individually. The decision to join a given apar to a candidate apar is subject to the following criteria:
1. width: The apars to be joined must have the same width (within five pixels). 2. Parallelism. The candidate apars must be parallel. The determinant of
coefficients of the line equations of the candidate apars must be near zero.
FIG. 18. Centerlines detected in LOGANl.
122 HUERTAS, COLE, AND NEVATIA
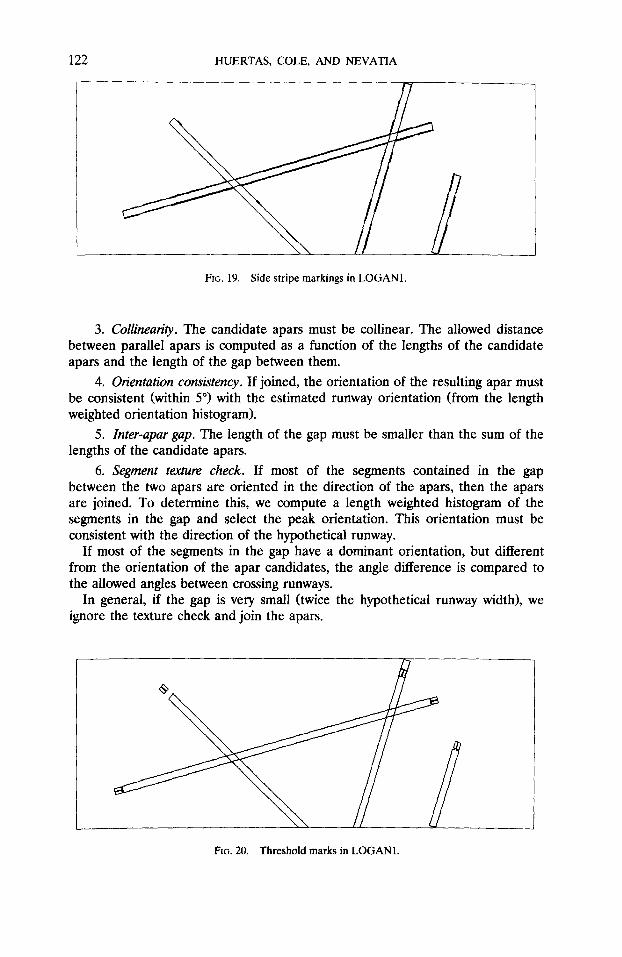
FIG. 19. Side stripe markings in LOGANI.
3. Collinearity. The candidate apars must be collinear. The allowed distance between parallel apars is computed as a function of the lengths of the candidate apars and the length of the gap between them.
4. Orientation consistency. If joined, the orientation of the resulting apar must be consistent (within 5”) with the estimated runway orientation (from the length weighted orientation histogram).
5. Inter-apargap. The length of the gap must be smaller than the sum of the lengths of the candidate apars.
6. Segment tex&re check. If most of the segments contained in the gap between the two apars are oriented in the direction of the apars, then the apars are joined. To determine this, we compute a length weighted histogram of the segments in the gap and select the peak orientation. This orientation must be consistent with the direction of the hypothetical runway.
If most of the segments in the gap have a dominant orientation, but different from the orientation of the apar candidates, the angle difference is compared to the allowed angles between crossing runways.
In general, if the gap is very small (twice the hypothetical runway width), we ignore the texture check and join the apars.
FIG. 20. Threshold marks in LOGANl.
RUNWAY DETECTION 123
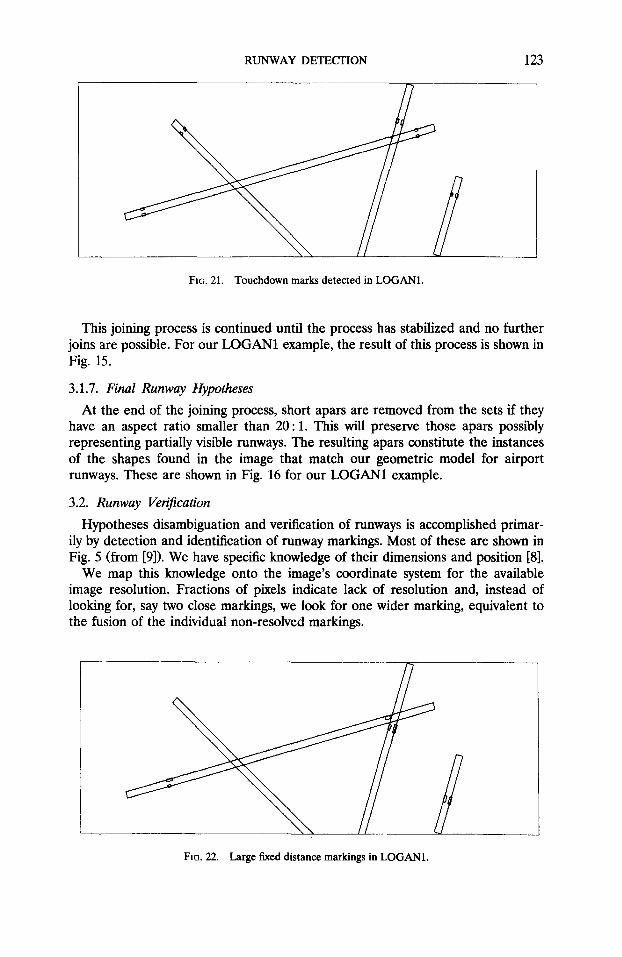
FIG. 21. Touchdown marks detected in LOGANl.
This joining process is continued until the process has stabilized and no further joins are possible. For our LOGAN1 example, the result of this process is shown in Fig. 15.
3.1.7. Final Runway Hypotheses
At the end of the joining process, short apars are removed from the sets if they have an aspect ratio smaller than 20 : 1. This will preserve those apars possibly representing partially visible runways. The resulting apars constitute the instances of the shapes found in the image that match our geometric model for airport runways. These are shown in Fig. 16 for our LOGAN1 example.
3.2. Runway Verification
Hypotheses disambiguation and verification of runways is accomplished primar- ily by detection and identification of runway markings. Most of these are shown in Fig. 5 (from [9]). We have specific knowledge of their dimensions and position [8].
We map this knowledge onto the image’s coordinate system for the available image resolution. Fractions of pixels indicate lack of resolution and, instead of looking for, say two close markings, we look for one wider marking, equivalent to the fusion of the individual non-resolved markings.
FIG. 22. Large fixed distance markings in LOGANl.
124 HUERTAS, COLE, AND NEVATIA
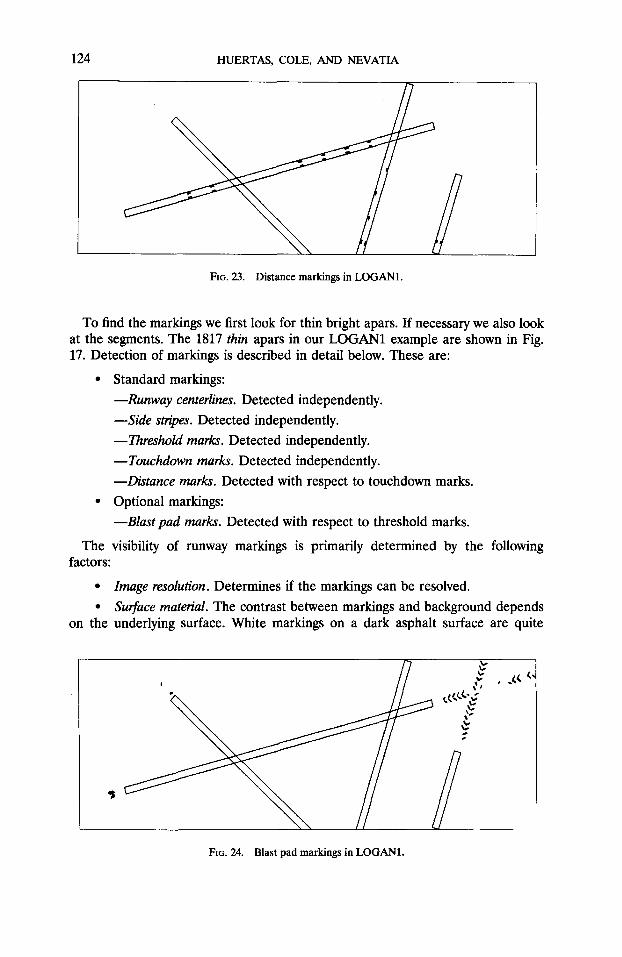
FIG. 23. Distance markings in LOGANl.
To find the markings we first look for thin bright apars. If necessary we also look at the segments. The 1817 thin apars in our LOGAN1 example are shown in Fig. 17. Detection of markings is described in detail below. These are:
l Standard markings: -R~nwuy centerlines. Detected independently. --Side stripes. Detected independently. --Threshold marks. Detected independently. --Touchdown marks. Detected independently. -Distance marks. Detected with respect to touchdown marks.
l Optional markings: -Blast pad marks. Detected with respect to threshold marks.
The visibility of runway markings is primarily determined by the following factors:
l Image resolution. Determines if the markings can be resolved. l Surface material. The contrast between markings and background depends
on the underlying surface. White markings on a dark asphalt surface are quite
FIG. 24. Blast pad markings in LOGANI.
RUNWAY DETECTION 125
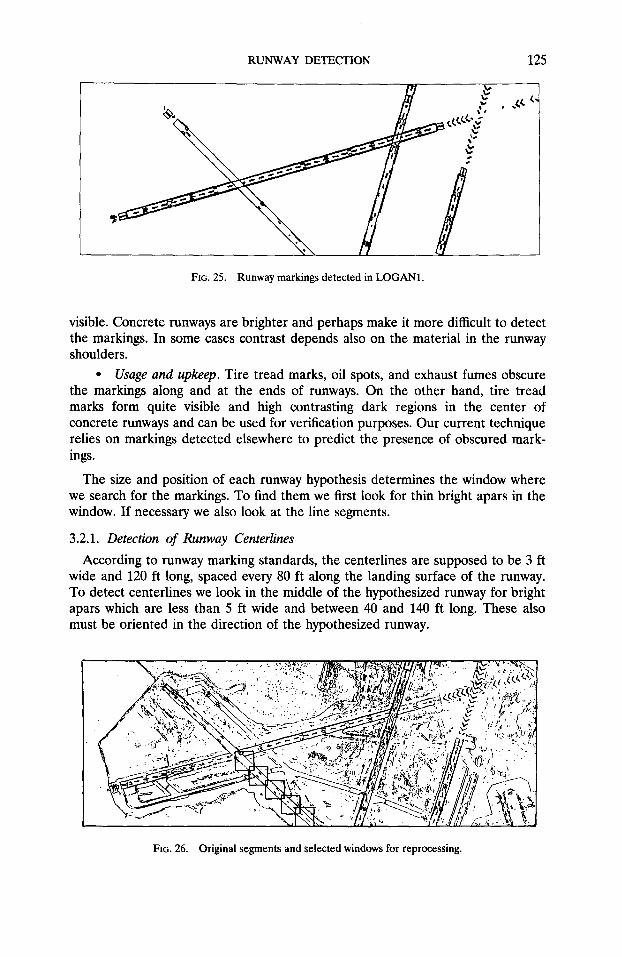
FIG. 25. Runway markings detected in LOGANl.
visible. Concrete runways are brighter and perhaps make it more difficult to detect the markings. In some cases contrast depends also on the material in the runway shoulders.
l Usage and upkeep. Tire tread marks, oil spots, and exhaust fumes obscure the markings along and at the ends of runways. On the other hand, tire tread marks form quite visible and high contrasting dark regions in the center of concrete runways and can be used for verification purposes. Our current technique relies on markings detected elsewhere to predict the presence of obscured mark- ings.
The size and position of each runway hypothesis determines the window where we search for the markings. To find them we first look for thin bright apars in the window. If necessary we also look at the line segments.
3.2.1. Detection of Runway Centerlines
According to runway marking standards, the centerlines are supposed to be 3 ft wide and 120 ft long, spaced every 80 ft along the landing surface of the runway. To detect centerlines we look in the middle of the hypothesized runway for bright apars which are less than 5 ft wide and between 40 and 140 ft long. These also must be oriented in the direction of the hypothesized runway.
FIG. 26. Original segments and selected windows for reprocessing.
126 HUERTAS, COLE, AND NEVATIA
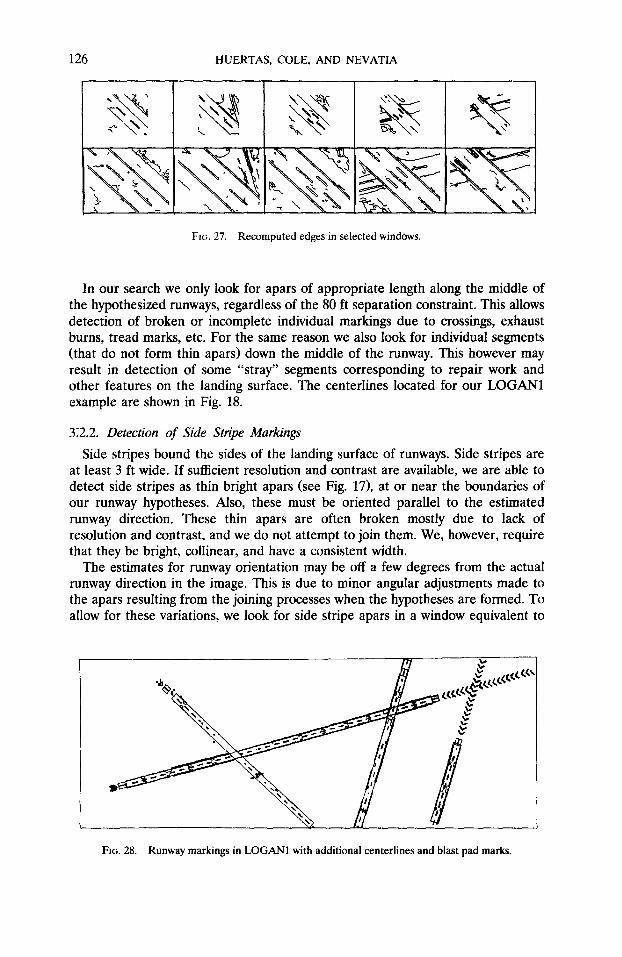
FIG. 27. Recomputed edges in selected windows.
In our search we only look for apars of appropriate length along the middle of the hypothesized runways, regardless of the 80 ft separation constraint. This allows detection of broken or incomplete individual markings due to crossings, exhaust burns, tread marks, etc. For the same reason we also look for individual segments (that do not form thin apars) down the middle of the runway. This however may result in detection of some “stray” segments corresponding to repair work and other features on the landing surface. The centerlines located for our LOGAN1 example are shown in Fig. 18.
312.2. Detection of Side Stripe Markings
Side stripes bound the sides of the landing surface of runways. Side stripes are at least 3 ft wide. If sufficient resolution and contrast are available, we are able to detect side stripes as thin bright apars (see Fig. 171, at or near the boundaries of our runway hypotheses. Also, these must be oriented parallel to the estimated runway direction. These thin apars are often broken mostly due to lack of resolution and contrast, and we do not attempt to join them. We, however, require that they be bright, collinear, and have a consistent width.
The estimates for runway orientation may be off a few degrees from the actual runway direction in the image. This is due to minor angular adjustments made to the apars resulting from the joining processes when the hypotheses are formed. To allow for these variations, we look for side stripe apars in a window equivalent to
FIG. 28. Runway markings in LOGAN1 with additional centerlines and blast pad marks.
RUNWAY DETECTION 127
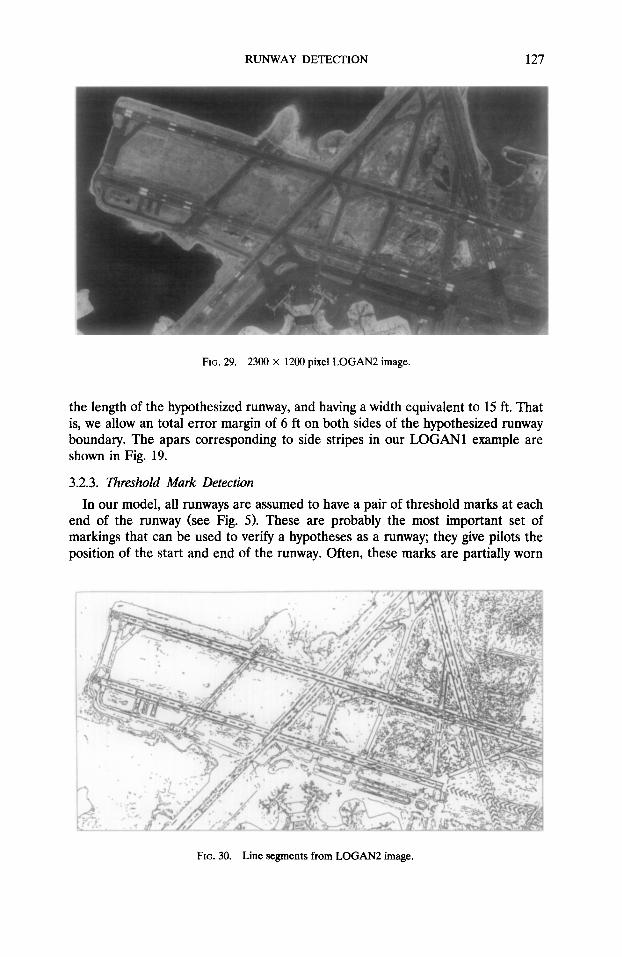
FIG. 29. 2300 x 1200 pixel LOGAN2 image.
the length of the hypothesized runway, and having a width equivalent to 15 ft. That is, we allow an total error margin of 6 ft on both sides of the hypothesized runway boundary. The apars corresponding to side stripes in our LOGAN1 example are shown in Fig. 19.
3.2.3. Threshold Mark Detection
In our model, all runways are assumed to have a pair of threshold marks at each end of the runway (see Fig. 5). These are probably the most important set of markings that can be used to verify a hypotheses as a runway; they give pilots the position of the start and end of the runway. Often, these marks are partially worn
FIG. 30. Line segments from LOGAN2 image.
128 HUERTAS, COLE, AND NEVATIA
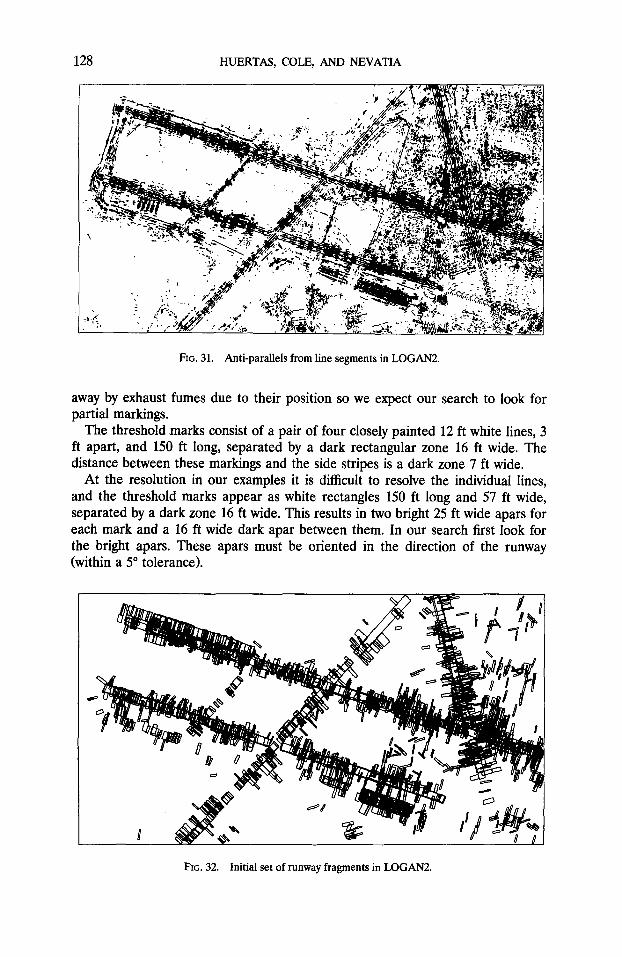
FIG. 31. Anti-parallels from line segments in LOGAN2.
away by exhaust fumes due to their position so we expect our search to look for partial markings.
The threshold marks consist of a pair of four closely painted 12 ft white lines, 3 ft apart, and 150 ft long, separated by a dark rectangular zone 16 ft wide. The distance between these markings and the side stripes is a dark zone 7 ft wide.
At the resolution in our examples it is difficult to resolve the individual lines, and the threshold marks appear as white rectangles 150 ft long and 57 ft wide, separated by a dark zone 16 ft wide. This results in two bright 25 ft wide apars for each mark and a 16 ft wide dark apar between them. In our search first look for the bright apars. These apars must be oriented in the direction of the runway (within a 5” tolerance).
FIG. 32. Initial set of runway fragments in LOGAN2.
RUNWAY DETECTION 129
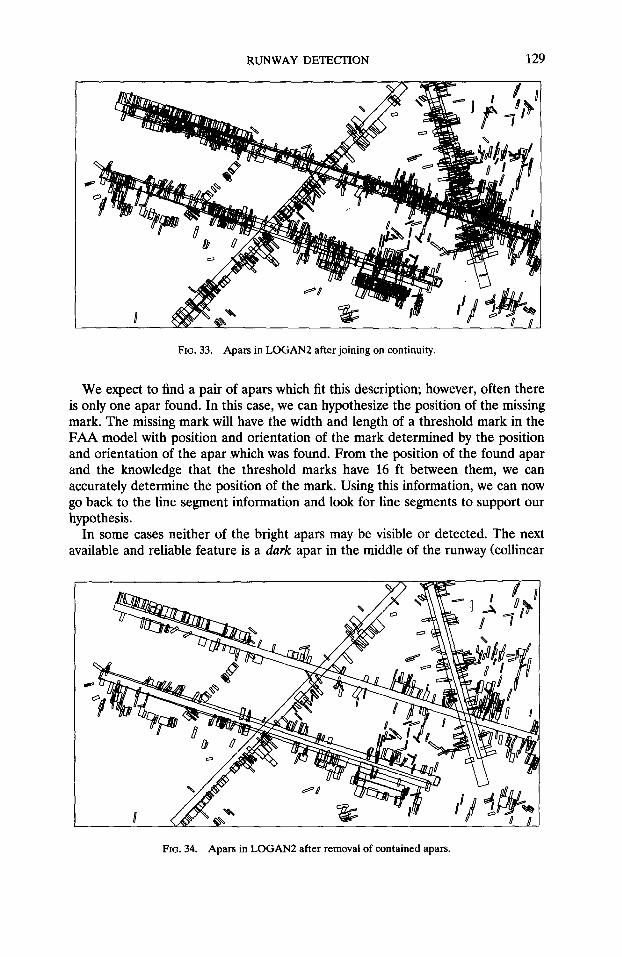
FIG. 33. Apars in LOGAN2 after joining on continuity.
We expect to find a pair of apars which fit this description; however, often there is only one apar found. In this case, we can hypothesize the position of the missing mark. The missing mark will have the width and length of a threshold mark in the FAA model with position and orientation of the mark determined by the position and orientation of the apar which was found. From the position of the found apar and the knowledge that the threshold marks have 16 ft between them, we can accurately determine the position of the mark. Using this information, we can now go back to the line segment information and look for line segments to support our hypothesis.
In some cases neither of the bright apars may be visible or detected. The next available and reliable feature is a dark apar in the middle of the runway (collinear
FIG. 34. Apars in LOGAN2 after removal of contained apars.
130 HUERTAS, COLE, AND NEVATIA
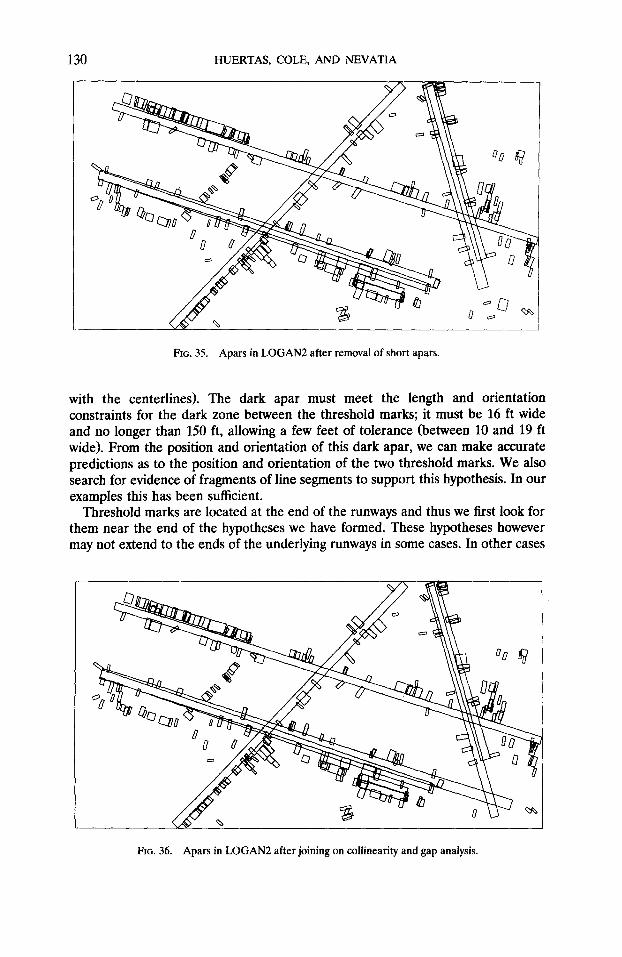
FIG. 35. Apars in LOGAN2 after removal of short apars.
with the centerlines). The dark apar must meet the length and orientation constraints for the dark zone between the threshold marks; it must be 16 ft wide and no longer than 150 ft, allowing a few feet of tolerance (between 10 and 19 ft wide). From the position and orientation of this dark apar, we can make accurate predictions as to the position and orientation of the two threshold marks. We also search for evidence of fragments of line segments to support this hypothesis. In our examples this has been sufficient.
Threshold marks are located at the end of the runways and thus we first look for them near the end of the hypotheses we have formed. These hypotheses however may not extend to the ends of the underlying runways in some cases. In other cases
FIG. 36. Apars in LOGAN2 after joining on collinearity and gap analysis.
RUNWAY DETECTION 131
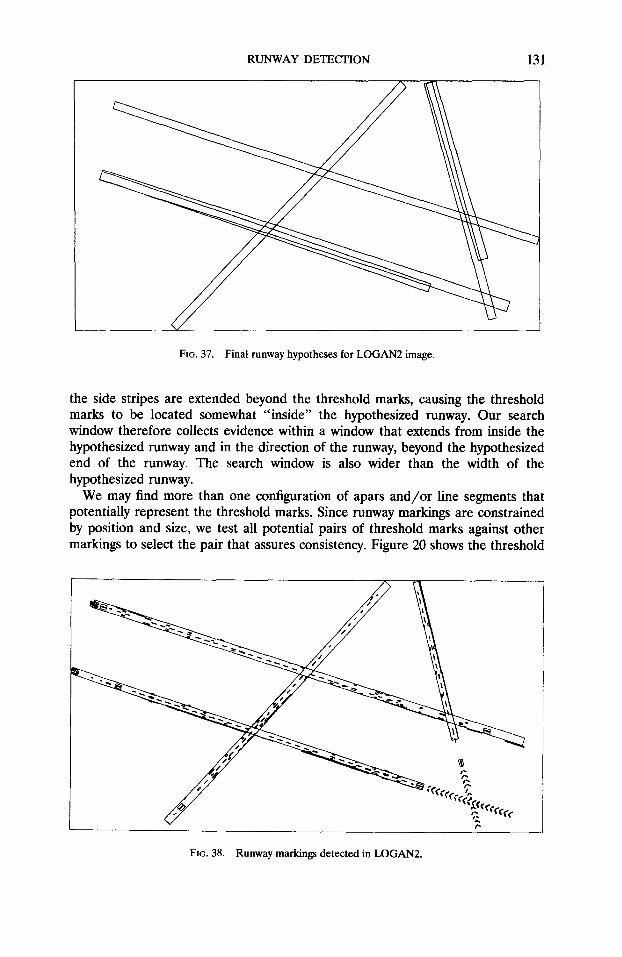
FIG. 37. Final runway hypotheses for LOGAN2 image.
the side stripes are extended beyond the threshold marks, causing the threshold marks to be located somewhat “inside” the hypothesized runway. Our search window therefore collects evidence within a window that extends from inside the hypothesized runway and in the direction of the runway, beyond the hypothesized end of the runway. The search window is also wider than the width of the hypothesized runway.
We may find more than one configuration of apars and/or line segments that potentially represent the threshold marks. Since runway markings are constrained by position and size, we test all potential pairs of threshold marks against other markings to select the pair that assures consistency. Figure 20 shows the threshold
FIG. 38. Runway markings detected in LOGAN2.
132 HUERTAS, COLE, AND NEVATIA
marks for our LOGAN1 example. Once a set of markings is found the runway hypothesis can then be updated.
3.2.4. Touchdown Mark Detection
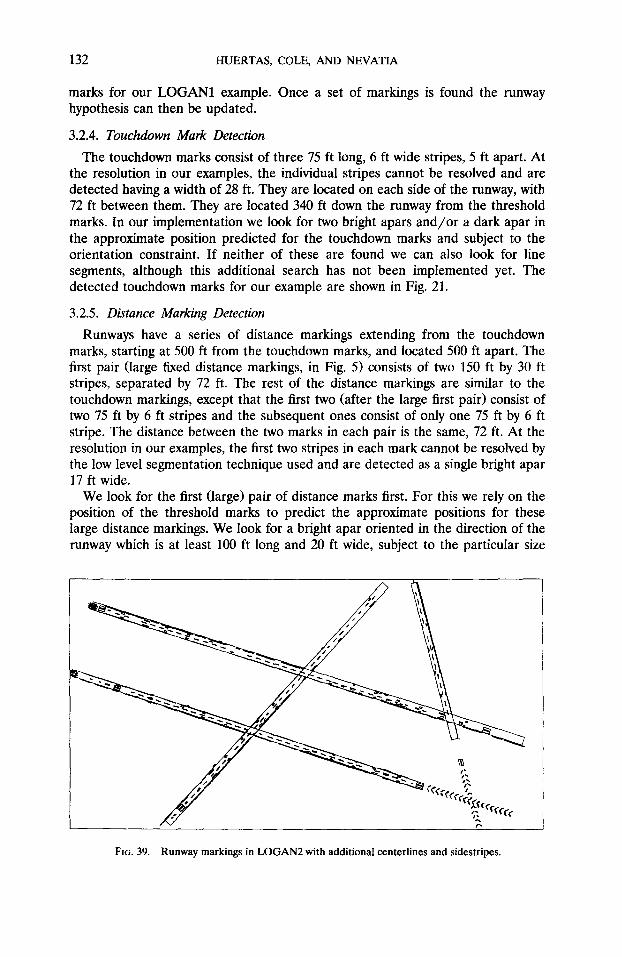
The touchdown marks consist of three 75 ft long, 6 ft wide stripes, 5 ft apart. At the resolution in our examples, the individual stripes cannot be resolved and are detected having a width of 28 ft. They are located on each side of the runway, with 72 ft between them. They are located 340 ft down the runway from the threshold marks. In our implementation we look for two bright apars and/or a dark apar in the approximate position predicted for the touchdown marks and subject to the orientation constraint. If neither of these are found we can also look for line segments, although this additional search has not been implemented yet. The detected touchdown marks for our example are shown in Fig. 21.
3.2.5. Distance Marking Detection
Runways have a series of distance markings extending from the touchdown marks, starting at 500 ft from the touchdown marks, and located 500 ft apart. The first pair (large fixed distance markings, in Fig. 5) consists of two 150 ft by 30 ft stripes, separated by 72 ft. The rest of the distance markings are similar to the touchdown markings, except that the first two (after the large first pair) consist of two 75 ft by 6 ft stripes and the subsequent ones consist of only one 75 ft by 6 ft stripe. The distance between the two marks in each pair is the same, 72 ft. At the resolution in our examples, the first two stripes in each mark cannot be resolved by the low level segmentation technique used and are detected as a single bright apar 17 ft wide.
We look for the first (large) pair of distance marks first. For this we rely on the position of the threshold marks to predict the approximate positions for these large distance markings. We look for a bright apar oriented in the direction of the runway which is at least 100 ft long and 20 ft wide, subject to the particular size
FIG. 39. Runway markings in LOGAN2 with additional centerlines and sidestripes.
RUNWAY DETECTION 133
constraints (it cannot be more than 150 ft long or 30 ft wide + 5 ft). We also allow a 5” tolerance in angles. As before, we choose among several candidates, if necessary, based on proximity to the predicted position.
Once we find large distance marks, we further refine our estimate of image resolution. Recall that the initial estimate of image resolution is based on a-phi knowledge of the widths of commercial runways compared to the hypothesized runway widths. However, it is possible that narrow shoulders be included in our initial runway hypotheses. These refinements are important to locate small and more difficult to detect markings.
Locating the other small distance markings proceeds in a similar manner. We estimate their position from the large distance marks (if these are available, otherwise we use the position of the threshold marks) and do a search in the area
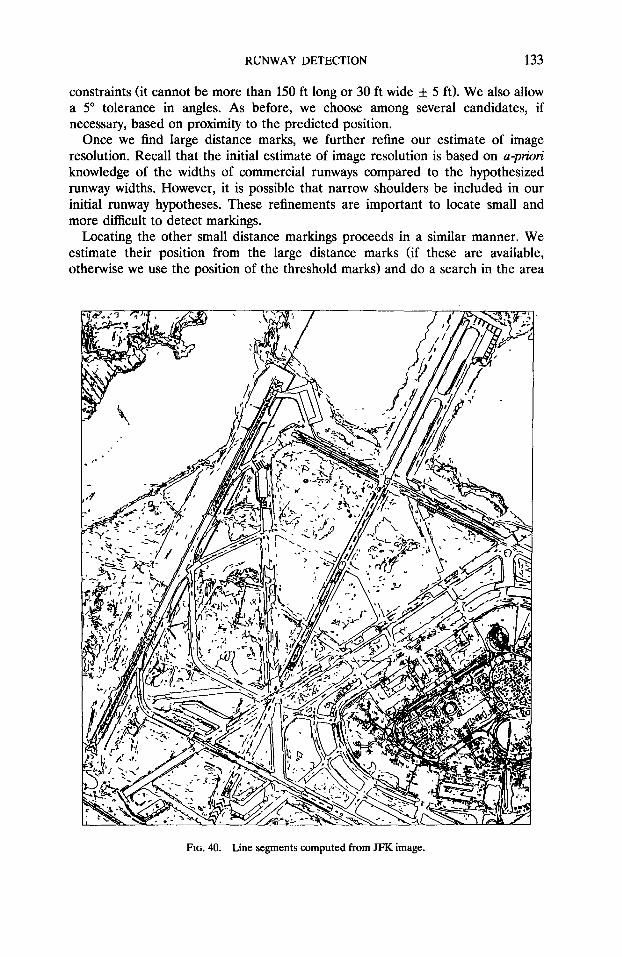
FIG. 40. Line segments computed from JFK image.
134 HUERTAS, COLE, AND NEVATIA
for an apar of the desired characteristics. The distance markings found for our LOGAN1 example are shown in Figs. 22 and 23.
3.2.6. Blast Pad Mark Detection
Blast pad markings are optionally located at the ends of runways. They consist of pairs of white lines oriented at 45” angles with respect to the runways and meet at the runway central axis. Also they do not extend beyond the width of the runway landing surface. The separation between these pairs of lines varies, thus we detect them by looking for thin bright apars in the proper configuration. The blast pad markings detected for LOGAN1 are shown in Fig. 24.
3.2.7. Summaly
Most markings are detected by independent processes and, thus, are applied in arbitrary order. We chose to look for centerlines first, as these help disambiguate
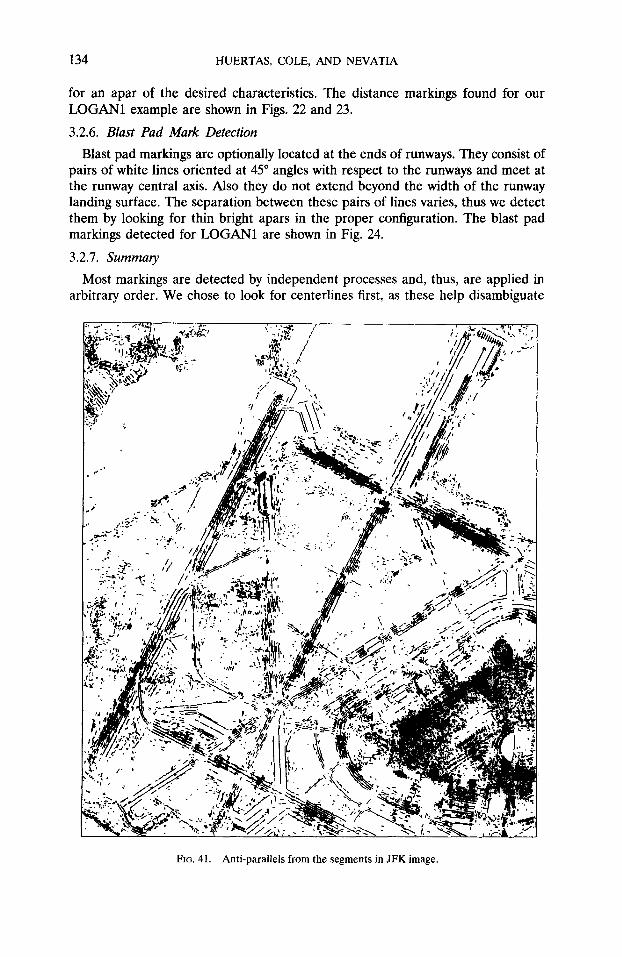
FIG. 41. Anti-parallels from the segments in JFK image.
RUNWAY DETECTION 135
multiple and possibly overlapping hypotheses early. The distance markings, how- ever, are located with respect to the threshold marks, and the blast pad marks are located at the ends of the runways. The resulting set of markings for our LOGAN1 example is shown in Fig. 25.
3.3. Additional Verification Mechanism
In some cases the reduced, or lack of evidence of, markings is due to the parameters associated with the low level segmentation technique applied to the image initially. For instance, we filter out weak edges arbitrarily to reduce the size of the input to the system. We know however that markings in certain positions of the runway become obscured and have reduced contrast. We prefer to proceed in a hierarchical manner, allowing the use of arbitrary thresholds during edge
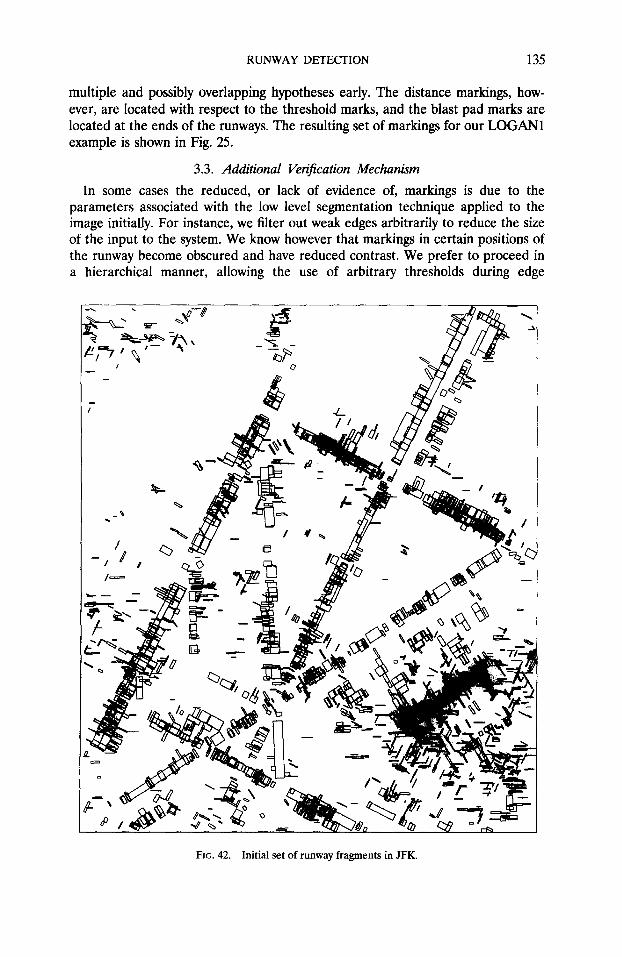
FIG. 42. Initial set of runway fragments in JFK.
136 HUERTAS, COLE, AND NEVATIA
detection plus a feedback mechanism to look for additional information. However, if the input to the system consists of segmentations which include aZl the edge information that can be computed from the image, then additional verification steps are not necessary.
In our system, we re-segment only small portions of the image along the runway hypotheses to obtain non-thresholded edges, segments, and thin apars. We can then apply the verification step using these apars. Some markings, such as the centerlines and the blastpad marks, appear with more regularity. In these cases the process uses the markings previously detected to guide the re-segmentation of only specific portions of the image where we determine that markings are missing as follows:
To look for additional centerlines, we compute a histogram of the separation between the centerlines found to compute and estimate of the distance between
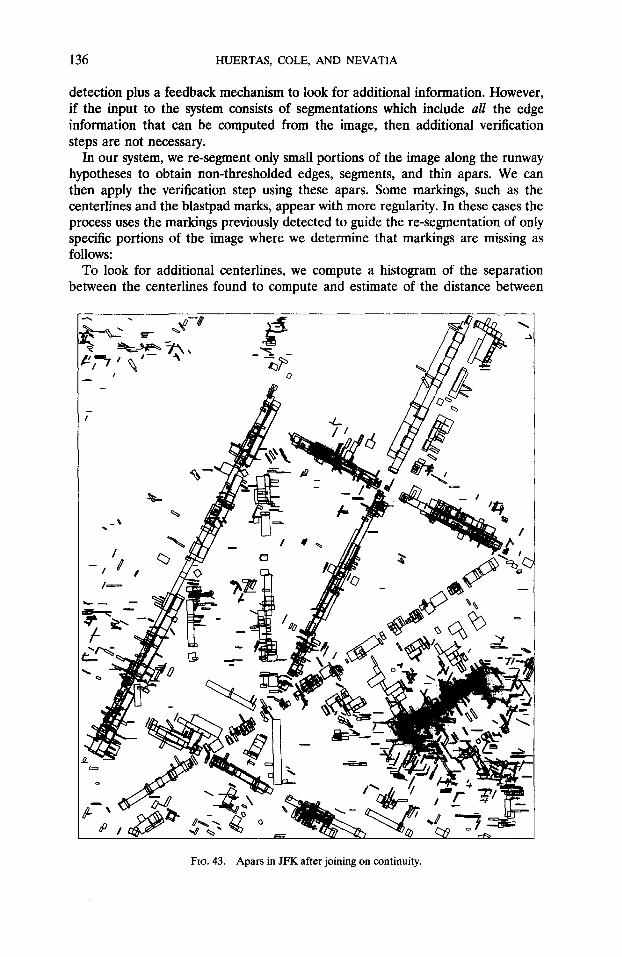
FIG. 43. Apars in JFK after joining on continuity.
RUNWAY DETECTION 137
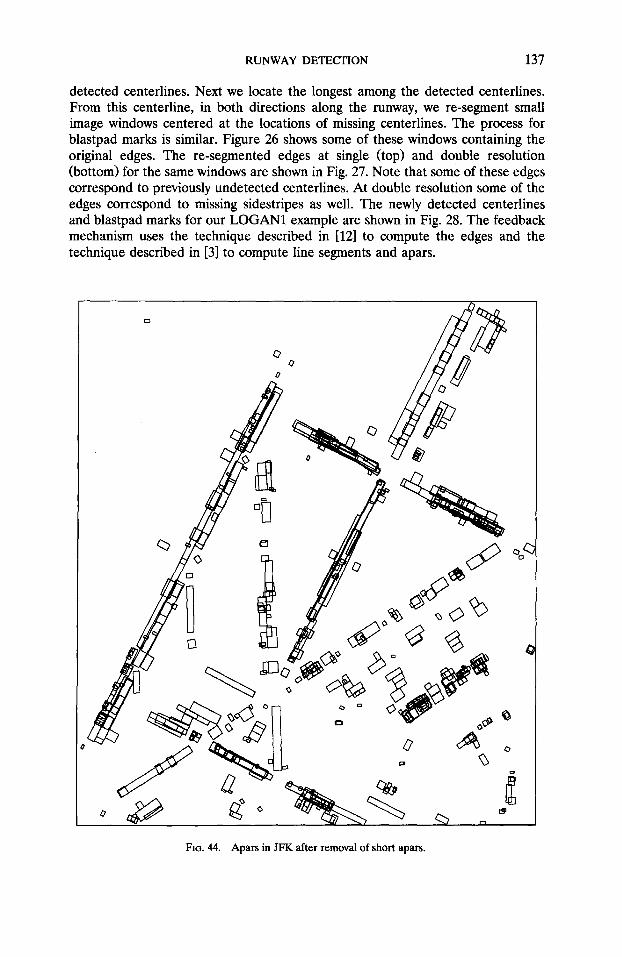
detected centerlines. Next we locate the longest among the detected centerlines. From this centerline, in both directions along the runway, we re-segment small image windows centered at the locations of missing centerlines. The process for blastpad marks is similar. Figure 26 shows some of these windows containing the original edges. The re-segmented edges at single (top) and double resolution (bottom) for the same windows are shown in Fig. 27. Note that some of these edges correspond to previously undetected centerlines. At double resolution some of the edges correspond to missing sidestripes as well. The newly detected centerlines and blastpad marks for our LOGAN1 example are shown in Fig. 28. The feedback mechanism uses the technique described in [12] to compute the edges and the technique described in [3] to compute line segments and apars.
FIG. 44. Apars in JFK after removal of short apars.
138 HUERTAS, COLE, AND NEVATIA
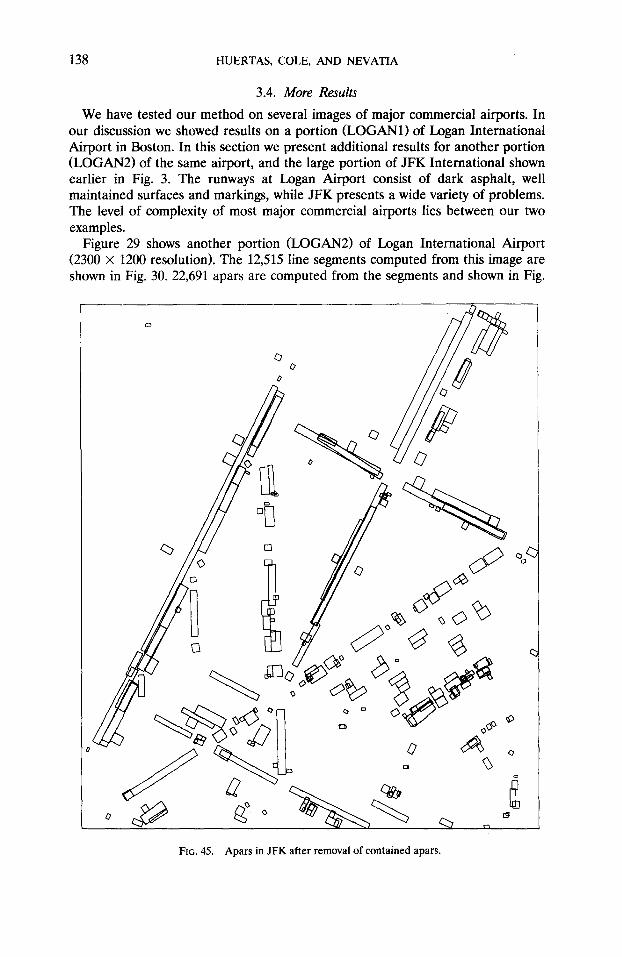
3.4. More Results
We have tested our method on several images of major commercial airports. In our discussion we showed results on a portion (LOGANl) of Logan International Airport in Boston. In this section we present additional results for another portion (LOGAN21 of the same airport, and the large portion of JFK International shown earlier in Fig. 3. The runways at Logan Airport consist of dark asphalt, well maintained surfaces and markings, while JFK presents a wide variety of problems. The level of complexity of most major commercial airports lies between our two examples.
Figure 29 shows another portion (LOGAN2) of Logan International Airport (2300 X 1200 resolution). The 12,515 line segments computed from this image are shown in Fig. 30. 22,691 apars are computed from the segments and shown in Fig.
FIG. 45. Apars in JFK after removal of contained apars.
RUNWAY DETECTION 139
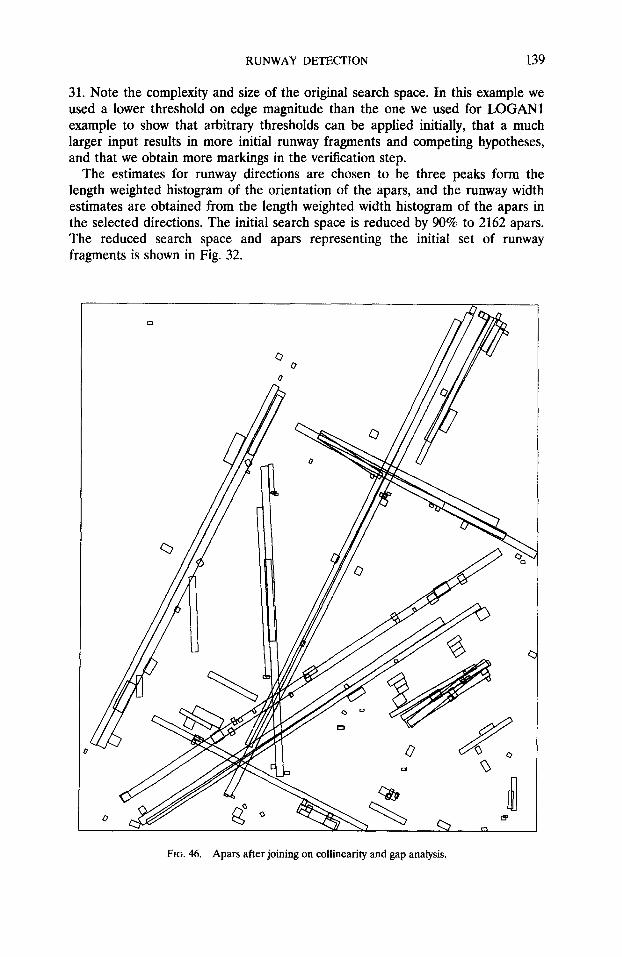
31. Note the complexity and size of the original search space. In this example we used a lower threshold on edge magnitude than the one we used for LOGAN1 example to show that arbitrary thresholds can be applied initially, that a much larger input results in more initial runway fragments and competing hypotheses, and that we obtain more markings in the verification step.
The estimates for runway directions are chosen to be three peaks form the length weighted histogram of the orientation of the apars, and the runway width estimates are obtained from the length weighted width histogram of the apars in the selected directions. The initial search space is reduced by 90% to 2162 apars. The reduced search space and apars representing the initial set of runway fragments is shown in Fig. 32.
FIG. 46. Apars after joining on collinearity and gap analysis.
140 HUERTAS, COLE, AND NEVATIA
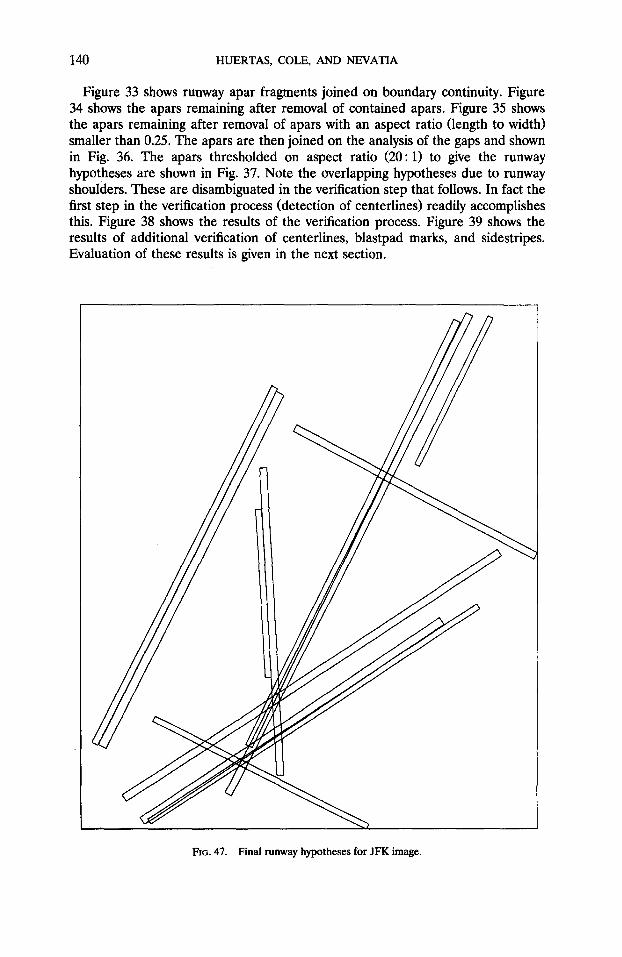
Figure 33 shows runway apar fragments joined on boundary continuity. Figure 34 shows the apars remaining after removal of contained apars. Figure 35 shows the apars remaining after removal of apars with an aspect ratio (length to width) smaller than 0.25. The apars are then joined on the analysis of the gaps and shown in Fig. 36. The apars thresholded on aspect ratio (20: 1) to give the runway hypotheses are shown in Fig. 37. Note the overlapping hypotheses due to runway shoulders. These are disambiguated in the verification step that follows. In fact the first step in the verification process (detection of centerlines) readily accomplishes this. Figure 38 shows the results of the verification process. Figure 39 shows the results of additional verification of centerlines, blastpad marks, and sidestripes. Evaluation of these results is given in the next section.
FIG. 47. Final runway hypotheses for JFK image.
RUNWAY DETECTION 141
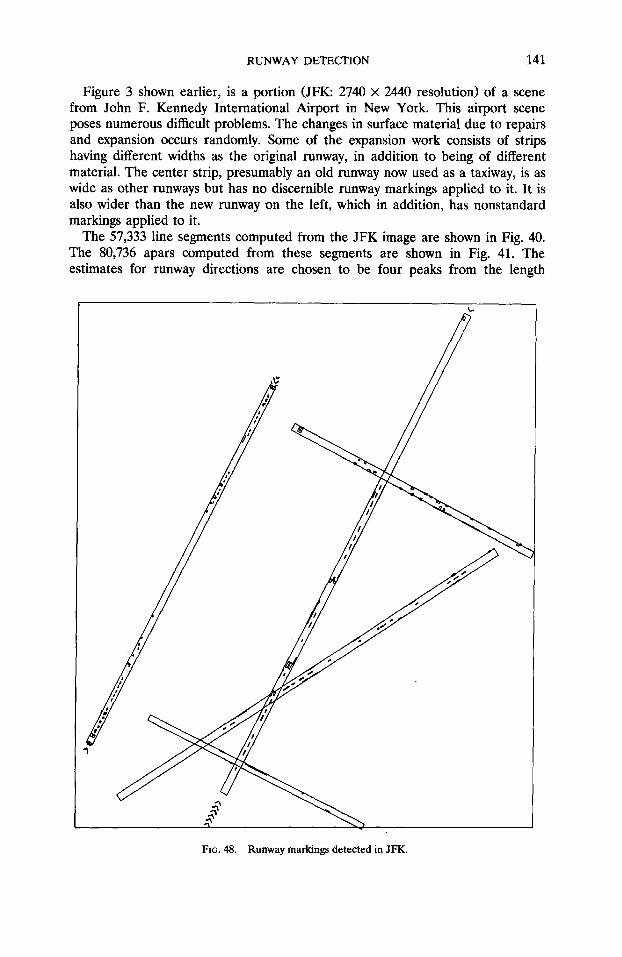
Figure 3 shown earlier, is a portion (JFK: 2740 X 2440 resolution) of a scene from John F. Kennedy International Airport in New York. This airport scene poses numerous difficult problems. The changes in surface material due to repairs and expansion occurs randomly. Some of the expansion work consists of strips having different widths as the original runway, in addition to being of different material. The center strip, presumably an old runway now used as a taxiway, is as wide as other runways but has no discernible runway markings applied to it. It is also wider than the new runway on the left, which in addition, has nonstandard markings applied to it.
The 57,333 line segments computed from the JFK image are shown in Fig. 40. The 80,736 apars computed from these segments are shown in Fig. 41. The estimates for runway directions are chosen to be four peaks from the length
FIG. 48. Runway markings detected in JFK.
142 HUERTAS, COLE, AND NEVATIA
weighted histogram of the orientation of the apars, and the runway width estimates are obtained from the length weighted width histogram of the apars in the selected directions. The initial search space is reduced by 97% to 2547 apars. The reduced search space and apars representing the initial set of runway fragments is shown in Fig. 42.
Figure 43 shows runway apar fragments joined on boundary continuity. Figure 44 shows the apars remaining after removal of the apars with an aspect ratio of smaller than 0.25. Figure 45 shows the apars remaining after removal of contained apars. The apars are then joined on the basis of analysis of the gaps between fragments. These are shown in Fig. 46. The thresholded apars on aspect ratio (20 : 1) give the runway hypotheses shown in Fig. 47. Note the multiple hypotheses
F'IG. 49. Runway markings in JFK with additional centerlines and sidestripes.
RUNWAY DETECTION 143
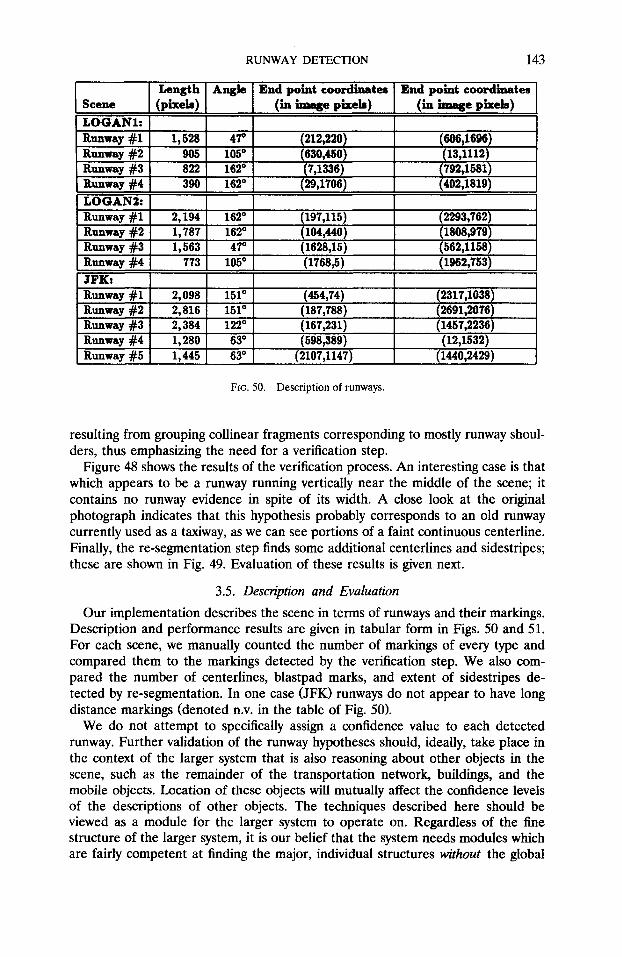
LOGAN& Runway #l Rmway #2 Runway #3
Runway #4 JFK: Runway #l Runway #2 Runway #3 Runway #4 Runway #5
2,194 162’ (197,115) (2293,762) 1,787 162” (104,440) (1808,979) 1,563 47” (1628&i) (562,1158)
773 105O (1768,5) (1962,753)
2,098 151° (454374) (2317.1038) 2,816 151° (187,788) (2691,2076) 2,384 122O (167,231) (1457,2236) 1,280 63’ (598,389) (12,1532) 1,445 63’ (2107,1147) (1440,2429)
FIG. 50. Description of runways.
resulting from grouping collinear fragments corresponding to mostly runway shoul- ders, thus emphasizing the need for a verification step.
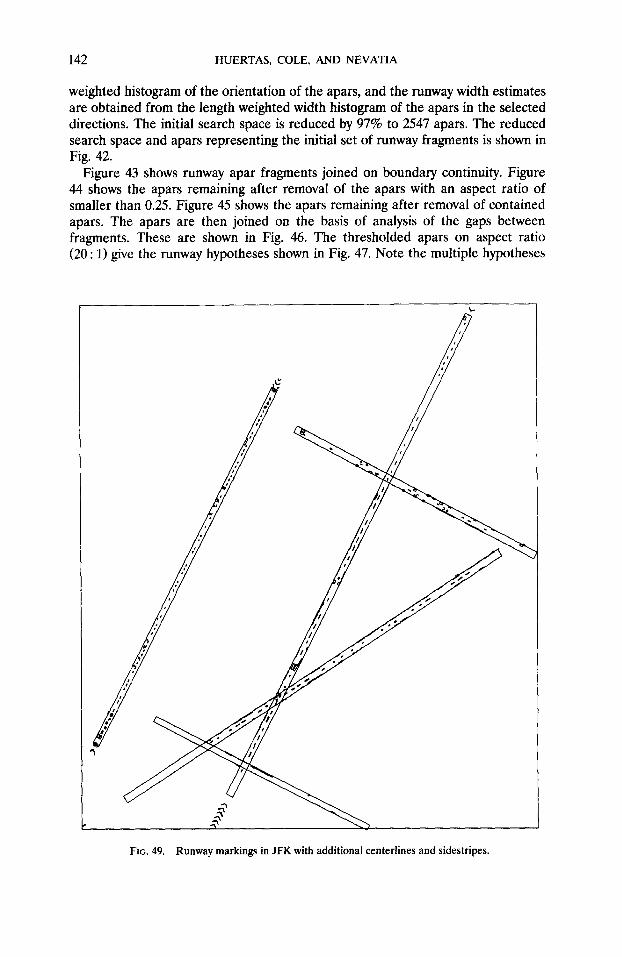
Figure 48 shows the results of the verification process. An interesting case is that which appears to be a runway running vertically near the middle of the scene; it contains no runway evidence in spite of its width. A close look at the original photograph indicates that this hypothesis probably corresponds to an old runway currently used as a taxiway, as we can see portions of a faint continuous centerline. Finally, the re-segmentation step finds some additional centerlines and sidestripes; these are shown in Fig. 49. Evaluation of these results is given next.
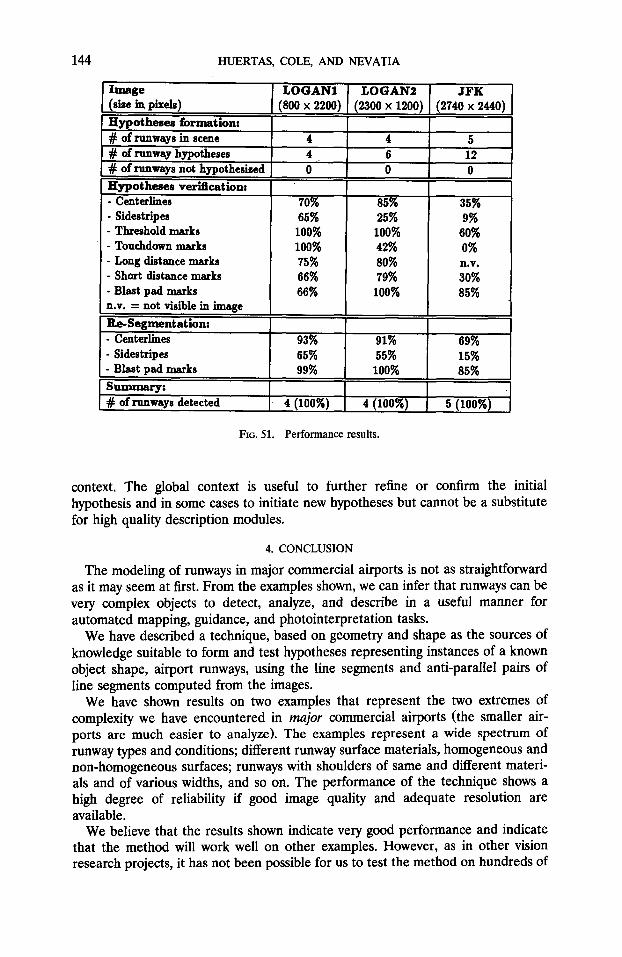
3.5. Description and Evaluation Our implementation describes the scene in terms of runways and their markings.
Description and performance results are given in tabular form in Figs. 50 and 51. For each scene, we manually counted the number of markings of every type and compared them to the markings detected by the verification step. We also com- pared the number of centerlines, blastpad marks, and extent of sidestripes de- tected by re-segmentation. In one case (JFK) runways do not appear to have long distance markings (denoted n.v. in the table of Fig. 50).
We do not attempt to specifically assign a confidence value to each detected runway. Further validation of the runway hypotheses should, ideally, take place in the context of the larger system that is also reasoning about other objects in the scene, such as the remainder of the transportation network, buildings, and the mobile objects. Location of these objects will mutually affect the confidence levels of the descriptions of other objects. The techniques described here should be viewed as a module for the larger system to operate on. Regardless of the fine structure of the larger system, it is our belief that the system needs modules which are fairly competent at finding the major, individual structures without the global
144 HUERTAS, COLE, AND NEVATIA
Image LOGAN1 LOGAN2 JFK (sise in pixels) (800 x 2200) (2300 x 1200) (2740 x 2440) Hypotheses formation: # of runways in scene 4 4 5 # of runway hypotheses 4 6 12 # of runways not hypothesized 0 0 0 Hypotheses veriflcat ion: - centerIiues 70% 85% 35% - Sidestripes 65% 25% 9% - Threshold marks 100% 100% 60% - Touchdown marks 100% 42% 0% - Long distance marks 75% 80% - Short distance marks 66% 79% % - Blast pad marks 66% 100% 85% n.v. = not visible in image IbSegxnentation: - Centerlines 93% 91% 69% - Sidestripes 65% 55% 15% - Blast pad marks 99% 100% 85% Summary: # of runways detected 4 (100%) 4 (100%) 5 (100%)
FIG. 51. Performance results.
context, The global context is useful to further refine or confirm the initial hypothesis and in some cases to initiate new hypotheses but cannot be a substitute for high quality description modules.
4. CONCLUSION
The modeling of runways in major commercial airports is not as straightforward as it may seem at first. From the examples shown, we can infer that runways can be very complex objects to detect, analyze, and describe in a useful manner for automated mapping, guidance, and photointerpretation tasks.
We have described a technique, based on geometry and shape as the sources of knowledge suitable to form and test hypotheses representing instances of a known object shape, airport runways, using the line segments and anti-parallel pairs of line segments computed from the images.
We have shown results on two examples that represent the two extremes of complexity we have encountered in major commercial airports (the smaller air- ports are much easier to analyze). The examples represent a wide spectrum of runway types and conditions; different runway surface materials, homogeneous and non-homogeneous surfaces; runways with shoulders of same and different materi- als and of various widths, and so on. The performance of the technique shows a high degree of reliability if good image quality and adequate resolution are available.
We believe that the results shown indicate very good performance and indicate that the method will work well on other examples. However, as in other vision research projects, it has not been possible for us to test the method on hundreds of
RUNWAY DETECTION 145
images, at least in part because of the difficulty in obtaining the images themselves. Also, it must be realized that it is not our contention that the runways can be analyzed in isolation. Their detection and description is dependent on the other objects in the scene such as the remainder of the transportation network, build- ings, and the mobile objects. Interaction among such objects is part of our current research. We do believe that the results presented indicate that our method will provide very high quality input to the larger system.
We also believe that our approach will apply to other linear features such as taxiways and major highways; our initial experiments are highly promising but not complete enough for presentation here. Of course, the verification procedure would require properties specific to these features. Taxiways have typically only very simple markings (or none at all) and further verification is likely to have to make more use of the context, such as whether they connect runways and buildings (either directly or through other taxiways). The hypotheses formation step may also need to be guided by context when the features are not very distinct. For taxiways, an excellent start may be with fragments that are parallel to the detected runways.
REFERENCES 1. A. Huertas and R. Nevatia, Detecting buildings in aerial images, Comput. Ksion Graphics Image
Process. 41, No. 2, 1988, 131-152. 2. R. Mohan and R. Nevatia, Perceptual grouping with applications to 3D shape extraction, in
Proceedings, IEEE Workshop on Computer Vi&m, Miami, December 1987. 3. R. Nevatia and R. Babu, Linear feature extraction and description, Comput. Vision Graphics Image
Process. 13, 1980, 251-269. 4. S. E. Palmer, The psychology of perceptual organization: A transformational approach, in Human
and Machine V&n (J. Beck et al., Eds.), Academic Press, New York/London, 1983. 5. D. E. Lowe, Perceptual Organization and Usual Recognition, Khrwer Academic, Hingham, MA,
1985. 6. D. M. MacKeown, W. A. Harvey and J. McDermott, Rule-based interpretation of aerial imagery,
IEEE Trans. Pattern Anal. Mach. Intell. 7, 1985, 570-585. 7. D. M. McKeown and W. A. Harvey, Automatic knowledge acquisition for aerial image interpreta-
tion, in Proceedings, DARPA Image Understanding Workshop, Vol. 1, February 1987, pp. 205-226.
8. Marking Paved Areas on Airports, FAA Advisory Circular AC 150/5340-lE, November 4, 1980; Wiley, New York, 1984.
9. N. Ashford and P. H. Wright, Airport Engineering, 2nd ed., Wiley, New York, 1984. 10. A. Huertas and G. Medioni, Detection of intensity changes with subpixel accuracy using
Laplacian-Gaussian masks, IEEE Trans. Pattern Anal. Mach. Intell. 5, 1986, 651-664. 11. J. Chen, A. Huertas and G. Medioni, Fast convolutions with Laplacian-of-Gaussian masks, IEEE
Trans. Pattern Anal. Mach. Intell. 9, 1987, 584-589. 12. J. Canny, A computational approach to edge detection, IEEE Trans. Pattern Anal. Mach. Intell. 8,
1986, 679-698.