2019 Travel Report - Heathrow Airport
30
Heathrow 2019 Travel Report
-
Upload
khangminh22 -
Category
Documents
-
view
2 -
download
0
Transcript of 2019 Travel Report - Heathrow Airport
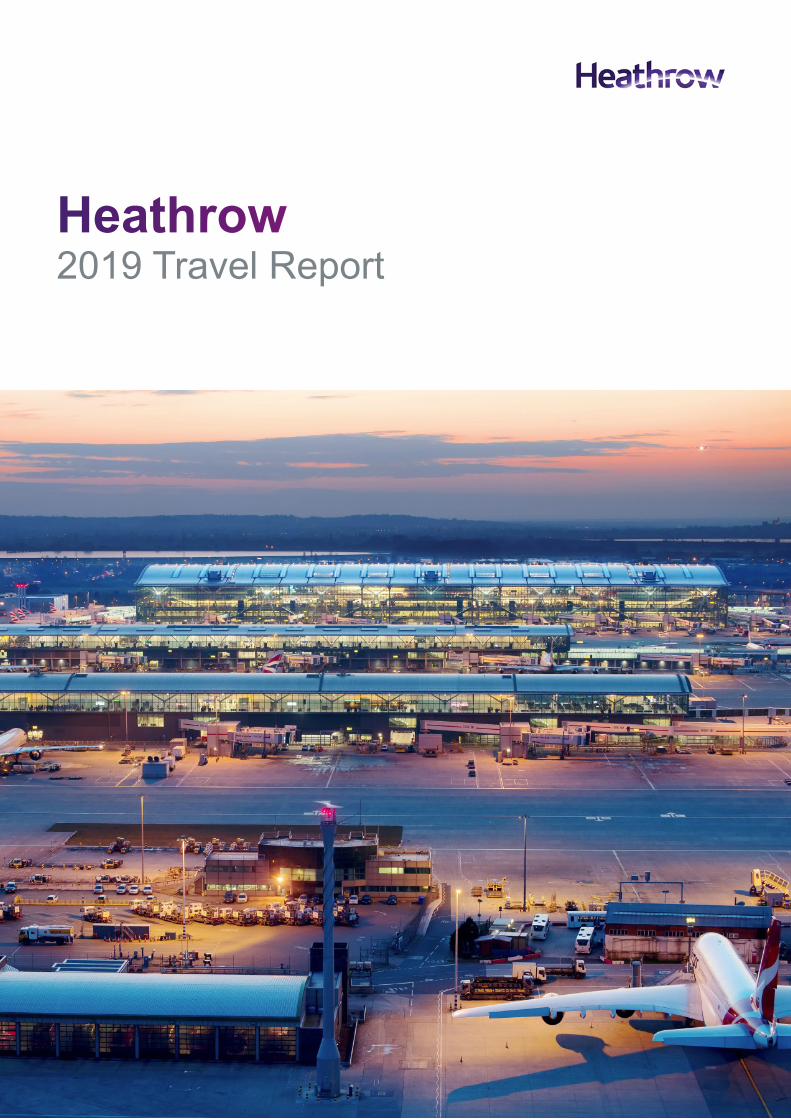
Heathrow 2019 Travel Report

Heathrow | 2019 Travel Report 3
Heathrow | 2019 Travel Report
FOREWORD
How people travel to and from Heathrow is critical for the airport’s operations and we are committed to improving the range of available travel options as well as the quality of each individual’s experience. Our vision for surface access is to transform journeys to and from Heathrow by making journeys faster, easier and more reliable. We want to cut carbon emissions, improve local air quality and the quality of life of our local communities, and increase our economic value to the UK. To do this, it is vital to understand how the surface access network is being used today.
The 2019 Travel Report is the first of its kind and provides information on the demand for surface access at Heathrow in 2019. We intend to periodically issue an updated Travel Report, providing a public record of our performance on surface access over time.
We provide information on a wide range of airport surface access metrics, with the intention that it can be used to understand travel patterns to and from the airport in 2019, and how we can improve the sustainability and overall experience of airport journeys. We saw an average of 39.3% of our passengers travelling by public transport, around 45,000 daily colleague car trips and just under 193,000 daily airport-related vehicle trips.
2019 was a busy year spent developing future plans, but also implementing a number of improvements to surface access through working closely with our partners. We started accepting contactless payments, including Oyster, on the Heathrow Express, put up speed cameras to ensure the safety of all road users on our perimeter road network, and delivered new bus and coach services to better connect our passengers, colleagues and local community with the airport.
We made good progress in 2019 but COVID-19 has had a significant impact on our ability to invest in subsequent years. We will need to be creative and work in partnership with our transport partners and Local Authorities to drive improvements on limited resources. We will need critical friends to challenge us where they think we could do something differently or where there are gaps and opportunities for partnership working. Transforming journeys to and from Heathrow in the coming years will not be easy, but by working together we can make the difference.
Tony CaccavoneSurface Access DirectorHeathrow Airport Limited

4Heathrow | 2019 Travel Report Heathrow | 2019 Travel Report
This report provides information on a wide range of airport surface access metrics, with the intention that it can be used to understand travel patterns to and from the airport in 2019, and how we can improve the sustainability and overall experience of airport journeys. While we appreciate that the COVID-19 pandemic has impacted air and surface travel significantly in 2020, we will not address these impacts in this report. There are three headline metrics that we believe underpin how we manage surface access now and in the future.
The first of these is air passenger public transport mode share. In 2019, this was 39.3% on average. This has stayed broadly consistent since 2013, despite increasing demand for private hire vehicle trips and ride-hailing services. This report sets out the improvements Heathrow made to public transport in 2019. We will continue to roll out public transport improvements to encourage a reduction in the number of car trips made by passengers, with the aim to reduce the impact of congestion and vehicle emissions on local communities.
The second metric is the number of average daily colleague car trips. As with passengers, we need to encourage colleagues to reduce the number of vehicle trips they take to work at the airport. The Heathrow Employment Survey was not conducted in 2019, so we use the latest available data from 2018 to estimate the average daily number of colleague car trips as 45,157. This is a reduction in the number of car trips made by colleagues since 2013, despite increased colleague numbers.
The final metric is the average daily number of landside airport-related vehicle trips (i.e. journeys that start or end at the airport). This is the primary metric used to measure progress against Heathrow’s pledge that an expanded airport would not introduce any more traffic on the roads. In 2019, this has been estimated as 192,596 and this will act as the baseline against which we will measure future progress. This has been calculated using bespoke surveys commissioned by Heathrow in 2019, and as such we do not have a direct comparison for previous years to judge this against. However, this establishes a robust baseline for potential future travel surveys.
EXECUTIVE SUMMARY
The 2019 Heathrow Travel Report is the first of its kind and provides information on the demand for surface access at Heathrow in 2019. Surface access refers to all the ways in which passengers, visitors, colleagues and goods travel to and from Heathrow. This includes travelling to or from Heathrow by public transport, taxis, private hire vehicles, cars, lorries, walking and cycling. It does not include trips by aircraft (e.g. transfer passengers).
We intend to periodically issue an updated Travel Report, providing a public record of our performance on surface access over time. However, at the time of writing, the COVID-19 pandemic was ongoing. This has led to significant changes to both demand for flights, and how Heathrow operates as an airport. As such, we do not intend at this stage to publish a Travel Report for 2020. Subsequent publication of an updated Travel Report will therefore be reviewed on an annual basis.
How people travel to and from Heathrow is critical for the airport’s operations and we are committed to improving the range of available travel options as well as the quality of each individual’s experience. Heathrow’s vision for surface access is to transform journeys to and from Heathrow by making journeys faster, easier and more reliable. To do this, it is vital to understand how the surface access network is being used today.

Heathrow | 2019 Travel Report Heathrow | 2019 Travel Report
CONTENTS
1. Introduction 11.1 What is the Heathrow Travel Report? 11.2 Why produce a Travel Report? 11.3 Structure of this document 31.4 Definitions and abbreviations 3
2. Surface access considerations at Heathrow 5
3. Methodology 93.1 Data sources 93.2 Data collection and analysis methodology 93.3 Data privacy and GDPR 10
4. Flights and airside travel demand 114.1 Flight statistics 114.2 Passenger statistics 124.3 Freight statistics 13
5. Surface access headline metrics 155.1 Introduction 155.2 Public transport mode share for passengers 155.3 Colleague car trips 165.4 Airport-related road traffic 17
6. Surface access infrastructure and services 196.1 Introduction 196.2 Heathrow by public transport 196.3 Heathrow by road 24
7. Surface access usage by passengers, colleagues, and freight 337.1 Introduction 337.2 Air passenger surface travel 337.3 Colleague surface travel 377.4 Freight and logistics surface travel 44
8. Improvements to surface access in 2019 478.1 Improvements to public transport 478.2 Improvements to road operations 48
9. Conclusions and closing remarks 49

1Heathrow | 2019 Travel Report
2Heathrow | 2019 Travel Report
1.1 What is the Heathrow Travel Report?
1.1.1 The 2019 Heathrow Travel Report is the first of its kind and provides information on the demand for surface access at Heathrow in 2019, as well as summarising the number of flights and passengers that give rise to this demand.
1.1.2 Surface access refers to all the ways in which passengers, visitors, colleagues1 and goods travel to and from Heathrow. This includes travelling by public transport, taxis, private hire vehicles (PHVs), cars, lorries, walking and cycling. It does not include trips by aircraft (e.g. transfer passengers).
1.1.3 This report brings together publicly available datasets and Heathrow-owned datasets to create the best possible insight into Heathrow-related surface transport. It establishes a baseline for surface access demand at Heathrow, against which data from future years can be compared.
1.1.4 While this report presents general passenger, colleague and freight statistics, it also examines airport-related vehicle trips through the airport boundary2.
1.1.5 Any data contained in this report has been collected in a way that can be replicated for future reports, enabling trends and patterns to be identified over time. We will endeavour to present data in the most appropriate format and medium available at the time of each publication, whilst maintaining consistency in the metrics and type of data. We may however choose to introduce new datasets in the future, as and when they become available.
1.1.6 At the time of writing, the COVID-19 pandemic was ongoing. This has led to significant changes to both demand for flights, and how Heathrow operates as an airport. As such, we believe that 2020 will not be representative of general travel patterns. Therefore, we do not intend to publish a Travel Report for 2020. Publication of an updated Travel Report in the future will be reviewed on an annual basis.
1.2 Why produce a Travel Report?
1.2.1 How people travel to and from Heathrow is critical for the airport’s operations. We are committed to improving the range of options for people travelling to and from Heathrow and improving the quality of their experience, particularly in relation to the speed, ease and reliability of journeys. Most importantly, this includes Heathrow’s aspiration to get passengers and colleagues travelling more sustainably to the airport, reducing the impact of congestion and emissions on the surrounding areas. To do this, it is vital to understand how people are using the surface access network today.
1.2.2 However, Heathrow cannot manage and improve surface access without the involvement of others. To this end, we work closely with the Heathrow Area Transport Forum (HATF). This is a body put in place following guidance in the Aviation Policy Framework3 by the Department for Transport (DfT) to bring together various organisations in the private and public sectors seeking to improve accessibility and increase public transport use to, from, and in the area around Heathrow.
1.2.3 The publication of the Travel Report provides HATF with transparency around the operation of surface access at Heathrow, and allows us to work closely with them to improve surface access around the airport today.
1.2.4 The Travel Report was also originally intended to establish a surface access baseline that could be used to underpin any application for the expansion of the airport. Prior to the judicial review challenge in February 2020, the Airports National Policy Statement (ANPS) set out that any application to expand the airport must include details of how Heathrow will:
1. “increase the proportion of journeys made to the airport by public transport, cycling and walking to achieve a passenger public transport mode share of at least 50% by 2030 and at least 55% by 2040”; and
2. demonstrate “how, from a 2013 baseline level, it will achieve a 25% reduction of all colleague car trips by 2030, and a reduction of 50% by 2040.”4
1.2.5 The ANPS also set out that Heathrow should continue to strive to meet its public pledge to have landside airport-related traffic no greater than today (2019).
1. INTRODUCTION
1 A colleague is defined as a person working within the airport boundary or travelling to the airport for employment within the aviation industry whether they are directly employed by Heathrow Airport Limited or not.
2 The “airport boundary” is defined as the cordon encapsulating all land accessible only via Heathrow-controlled roads (see Section 1.4).
This report brings together publicly available datasets and Heathrow-owned datasets to create the best possible insight
into Heathrow-related surface transport.
3 Aviation Policy Framework https://assets.publishing.service.gov.uk/government/uploads/system/uploads/attachment_data/file/153776/aviation-policy-framework.pdf
4 ANPS Paragraph 5.17
Most importantly, this includes Heathrow’s aspiration to get passengers and colleagues travelling more sustainably to the airport, reducing the impact of
congestion and emissions on the surrounding areas.
1. Introduction

3Heathrow | 2019 Travel Report
4Heathrow | 2019 Travel Report
1. Introduction 1. Introduction
3 4
1.2.6 While the targets set out in the ANPS are not currently applicable due to the judicial review halting plans for expansion, our aspirations and direction of travel encompassed in them remains a high priority for Heathrow. The Travel Report will therefore set out Heathrow’s performance in 2019 in these three areas. Further detail on this is included in Section 5.
1.2.7 The Travel Report also sets out Heathrow’s performance against the sustainability targets set out in our long term Sustainability Strategy, Heathrow 2.0. Heathrow 2.0 represents a step-change for our business and captures the momentum of an industry-wide shift towards a sustainable future for aviation. This strategy will also be refreshed as part of Heathrow’s revised business plan without expansion.
1.3 Structure of this document
1.3.1 There are six main sections to this document. Section 2 provides an overview of how surface access at Heathrow differs to traditional transport hubs, Section 3 sets out how we have collected and used data to inform this Travel Report, and Section 4 sets out the number of flights that used the airport in 2019, giving rise to surface access demand.
1.3.2 Sections 5 to 7 present the results of our surface access travel analysis. Section 5 outlines the data we have collected against the three key surface access metrics, relating to passenger public transport mode share, colleague car trips and airport-related landside traffic. Section 6 describes the surface access infrastructure available at the airport, the number of public transport services and vehicle trips that cross the airport boundary. Section 7 contains detail on surface access use by passengers, colleagues and freight vehicles. Finally, Section 8 describes the improvements we have made to surface access infrastructure and services in 2019.
1.4 Definitionsandabbreviations
1.4.1 To ensure clarity, below are key abbreviations and definitions used frequently within this document.
TERM DEFINITIONANPR Automatic Number Plate Recognition
ANPS Airports National Policy Statement
AVA Authorised Vehicle Area
CAA Civil Aviation Authority
DfT Department for Transport
EV Electric Vehicle
FTZ Free Travel Zone
GDPR General Data Protection Regulation
GTFS General Transit Feed Specification
GWR Great Western Rail
Table 1.1: Key abbreviations
Table 1.2: Key definitions
TERM DEFINITIONAirport boundary The cordon encapsulating all land accessible only via Heathrow-controlled roads.
Airport-related vehicle trip
Any journey by motorised road vehicle (which is not an internal trip, public transport vehicle trip, through-traffic trip, or expansion-related construction trip), which has an origin or destination on land that is accessible only by Heathrow-controlled roads.
Airport-related public transport vehicle trip
Any journey by a public service vehicle (which is not an internal trip, or construction trip), which has an origin or destination on land that is accessible only by Heathrow-controlled roads. For example, if a bus travels from Slough to the Heathrow Central Bus Station, this counts as a single airport-related public transport trip because the destination is the airport. If that same bus then leaves the airport to continue on to Hounslow, it is counted as a separate public transport trip originating at the airport.
Colleague A person working within the airport boundary or travelling to the airport for employment within the aviation industry whether they are directly employed by Heathrow Airport Limited or not.
Colleague car tripA colleague car trip is defined as a trip made by a colleague either to or from Heathrow for the purposes of work using a private vehicle. For example, a colleague travelling to Heathrow to begin work at 9am, who then parks during the day, and drives home after finishing work at 5pm, generates two colleague car trips.
Construction trip A journey by a motorised road vehicle carrying materials or workers to or from the airport.
Euro classThe Euro class of a vehicle is a classification established by the European Union in 1992 to define the acceptable limits for exhaust emissions for vehicles with different fuel types and combustion engines. In particular, the aim of the Euro emissions standards is to reduce the levels of Nitrogen oxides (NOx), Carbon monoxides (CO), Hydrocarbons (HC) and Particulate matter (PM) produced by road vehicles.
Heathrow-controlled roads
Any road owned and maintained by Heathrow and on which Heathrow exercises certain functions under the road traffic enactments.
Heavy Goods Vehicle (HGV)
HGV includes any goods vehicle with a gross vehicle weight of over 3.5 tonnes. This includes vehicles that fall into the OGV1 or OGV2 category, which generally includes lorries, large vans, tractors, rigid trucks and articulated vehicles5.
Internal trip A journey by a motorised road vehicle which is made entirely on land that is accessible only by Heathrow-controlled roads.
Light Goods Vehicle (LGV)
Includes all 2-axle goods vehicles up to 3.5 tonnes gross vehicle weight (with no rear-side windows). This includes delivery vans, small ambulances and small pick-ups.
Other Goods Vehicle (OGV)
OGVs are often divided into two classes: OGV1 and OGV2. OGV1 includes all larger rigid vehicles with 2- or 3-axles and gross vehicle weight over 3.5 tonnes, such as larger ambulances, tractors (without trailers), road rollers for tarmac pressing, box vans and mid-sized trucks which have double rear wheels. OGV2 includes all rigid vehicles with 4 or more axles and all articulated vehicles. An articulated vehicle is one that has a pivoting joint, which allows it to turn more sharpy. This includes OGV1 vehicles towing a caravan or trailer.
Plant vehicle
A plant vehicle is defined in regulation 3 (2) of the Road Vehicles (Construction and Use) Regulations 1986 as a motor vehicle or trailer specially designed and constructed for the special purposes of engineering operations. A plant vehicle is one that is not constructed primarily to carry a load other than a load being either excavated materials raised from the ground by apparatus on the motor vehicle or trailer, or materials which the vehicle or trailer is specially designed to treat while carried thereon. https://www.gov.uk/government/publications/engineering-plant-vehicles/engineering-plant-vehicles
Public service vehicle
This is a legally defined term set out in the Public Passenger Vehicles Act 1981, and defines which vehicles are private and which are public service vehicles. Broadly speaking, a vehicle is categorised as public service vehicle if it runs to a fixed schedule and is individually ticketed. This means, for example, that a privately chartered bus or coach would not be classed as public transport. Similarly, car sharing or shared ride hailing services would not be classified as public service vehicles under this definition.
Public transport trip A trip made by an individual via rail / underground, or within a ‘public service vehicle’ as defined in the Public Passenger Vehicles Act 1981.
Through-trafficVehicles that utilise Heathrow-controlled roads without accessing any terminal, cargo, operations and/or parking areas. This implies that both the origin and destination of any individual vehicle’s trip are not within the airport boundary.
5 Department for Transport, A simplified guide to lorry types and weights (2003), https://assets.publishing.service.gov.uk/government/uploads/system/uploads/attachment_data/file/211948/simplified-guide-to-lorry-types-and-weights.pdf
TERM DEFINITIONHAL Heathrow Airport Limited
HATF Heathrow Area Transport Forum
HGV Heavy Goods Vehicle
LGV Light Goods Vehicle
MAID Magnetic Anti-Intrusion Device
OGV Other Goods Vehicle
PHV Private Hire Vehicle
TfL Transport for London
TFP Taxi Feeder Park
VRN Vehicle Registration Number

5Heathrow | 2019 Travel Report
6Heathrow | 2019 Travel Report
2. Surface access at Heathrow
2. SURFACE ACCESS CONSIDERATIONS AT HEATHROW 2.1 Introduction
2.1.1 It is important to understand the drivers of surface access demand at the airport, in contrast with general travel demand in a city or town. Airports operate under different conditions to typical workplaces, requiring staff 24 hours a day. Many Heathrow colleagues work non-traditional shift patterns, starting early in the morning or finishing late at night. Similarly, flights arrive and depart the airport throughout the day. As such, passenger travel by surface access reflects this.
2.1.2 Traditionally, travel demand has two peaks, one in the morning and one in the evening, associated with commuters travelling to and from work and school. Graphic 2.1 shows a weighted index obtained from the DfT’s National Travel Survey showing the commuter trend on weekdays.
Graphic 2.1: UK Transport demand by time of day for a typical weekday6
2.1.3 By contrast, Heathrow tends to generate surface access travel outside of these traditional peaks. Graphic 2.2 shows the number of passengers arriving and departing by time of day. This demonstrates that in contrast to traditional demand, airport passenger demand for surface travel is slightly lower during AM and PM peak periods than at other times of the day. It remains fairly consistent throughout the day between peaks and declines significantly around 2am when flights do not arrive at or depart from the airport.
6 Graphic shows a weighted index reflecting the number of trips across all modes by time of day and day of week obtained from the 2019 UK DfT National Travel Survey.
Graphic 2.2: Number of arriving and departing passengers by time of day
2.1.4 Similarly, colleagues tend to access the airport at non-traditional hours, as shown in Graphic 2.3, which presents data from the 2017 Heathrow Employment Survey.
Graphic 2.3: Number of arriving and departing colleagues by time of day
00:0
0
01:0
0
02:0
0
03:0
0
04:0
0
05:0
0
06:0
0
07:0
0
08:0
0
09:0
0
10:0
0
11:0
0
12:0
0
13:0
0
14:0
0
15:0
0
16:0
0
17:0
0
18:0
0
19:0
0
20:0
0
21:0
0
22:0
0
23:0
0
00:0
0
01:0
0
02:0
0
03:0
0
04:0
0
05:0
0
06:0
0
07:0
0
08:0
0
09:0
0
10:0
0
11:0
0
12:0
0
13:0
0
14:0
0
15:0
0
16:0
0
17:0
0
18:0
0
19:0
0
20:0
0
21:0
0
22:0
0
23:0
0
0
500
1000
1500
2000
Num
ber o
f pas
seng
ers
Departing Arriving Total
00:0
0
01:0
0
02:0
0
03:0
0
04:0
0
05:0
0
06:0
0
07:0
0
08:0
0
09:0
0
10:0
0
11:0
0
12:0
0
13:0
0
14:0
0
15:0
0
16:0
0
17:0
0
18:0
0
19:0
0
20:0
0
21:0
0
22:0
0
23:0
0
0
2,000
4,000
5,000
6,000
10,000
12,000
14,000
16,000
Num
ber o
f col
leag
ues
Departing Arriving Total

2. Surface access at Heathrow
7Heathrow | 2019 Travel Report
8Heathrow | 2019 Travel Report
2. Surface access at Heathrow
Graphic 2.4: Total number of air passengers by month
2.1.5 Further to this, Heathrow sees peak demand for flights during holiday periods such as the school summer holidays, Christmas and New Year. This is when background demand for travel tends to be lower. As a result, a significant amount of surface access travel demand to and from Heathrow takes place when surface access networks are operating below their capacity.
2.1.6 Graphic 2.4 shows the seasonal variation of air passenger demand by month in 2019, which is indicative of surface access travel demand to and from Heathrow airport throughout the year.
2.1.7 Heathrow also acts as a hub for freight, with cargo movements being made 24 hours a day and 365 days a year. These movements are typically made on road by large vehicles such as HGV’s, LGV’s and OGV’s and as such require specific road provisions to ensure safe access to and from the airport.
2.1.8 It is clear that travel demand at the airport differs considerably to general demand in cities or towns, and provides a unique challenge for enabling fast, efficient, and reliable journeys across all users and all modes of surface access.
2.1.9 To meet this challenge, Heathrow must work closely with a number of public sector organisations, transport operators and airport stakeholders across rail, underground, bus, coach and roads. This is because although Heathrow provide and manage much of the surface access infrastructure within the airport (such as the internal perimeter roads, forecourts, and bus and rail stations), services are often run and operated by third parties.
2.1.10 A further discussion on the infrastructure and services available at Heathrow, as well as surface access usage across passengers, colleagues and freight is presented in Sections 6 and 7 respectively.
Janu
ary
Febr
uary
Mar
ch
April
May
June July
Augu
st
Sept
embe
r
Oct
ober
Nov
embe
r
Dec
embe
r
5,000,000
5,500,000
6,000,000
6,500,000
7,000,000
7,500,000
8,000,000
Num
ber o
f pas
seng
ers

9Heathrow | 2019 Travel Report
10Heathrow | 2019 Travel Report
3. METHODOLOGY
3.1 Data sources
3.1.1 The data and figures presented in this report are from a range of sources, including data from internal Heathrow systems, data purchased from independent providers, and other publicly available open data.
3.1.2 The table below summarises the primary data sources used in this report.
Table 3.1: Primary data sources
SOURCE DATAHeathrow Internal Systems - Flight and passenger statistics
- Number of Heathrow Colleague travel cards sold - Colleague cycle hub registrations and usage - Colleague on-site population (MAID)
ITO World - GTFS public transport schedules
Intelligent Data Collection Ltd - ANPR camera vehicle counts
UK CAA Departing Passenger Survey - Passenger mode share
Heathrow Employment Survey - Colleague mode share - Colleague car trips
Heathrow Express Internal Systems - Number of services - Colleague discount tickets sold
3.2 Data collection and analysis methodology
3.2.1 Several analytics studies were conducted to prepare the statistics shown in this report. A rigorous methodology was used to ensure accuracy, consistency, and validity of the results, as shown in Graphic 3.1.
Graphic 3.1: Data processing methodology
DEFINEREQUIREMENTS
IDENTIFY DATA
SOURCES
COLLECT ANDPROCESS
DATA
VALIDATE RESULTS
DRAW CONCLUSIONS
3.2.3 Once the requirements were clear, we performed a data audit to identify available data sources both internally and from external suppliers. We considered the accuracy of each dataset, the repeatability of data studies for future years, as well as data acquisition costs.
3.2.4 Once data was collected, we inspected it thoroughly, ensuring that it had been collected in a consistent, robust, and accurate way, and made sure to understand any assumptions or inherent limitations.
3.2.5 It is inevitable that there is some error or uncertainty in any data collection exercise. There are typically two sources of uncertainty: sampling and data capture errors.
3.2.6 Sampling errors can occur when we only capture data from a portion of a population rather than a complete enumeration. For example, when running a survey, we may choose to interview a representative portion of the population and scale up the results to the full population.
3.2.7 Data capture errors refer to all the ways in which data could be incorrect, such as duplicate, incorrect, or missed data points. For example, ANPR cameras typically have a 90% capture rate for moving vehicles due to weather conditions or obscured VRNs, leading to missing or incorrect data points.
3.2.8 For each dataset that we analysed, we made sure to understand the sources of error and uncertainty. Where these existed, we made decisions about how to adjust or scale the data to ensure accuracy and reliability.
3.2.9 We employed advanced analytics techniques and performed statistical analyses to clean and process the data. Verification tests were conducted throughout the data cleaning and processing step to ensure that we continued to preserve the data’s integrity.
3.2.10 The results of each analytics study were validated by comparing the results to other independently collected datasets, as well as through peer review. Any discrepancies were investigated to understand the root cause. Where necessary, additional data was collected to close any data gaps.
3.2.11 Where data was purchased from a third party, we ensured that their data collection and analysis methodology met our standards.
3.3 Data privacy and GDPR
3.3.1 In all cases of data acquisition and storage, due care was taken to ensure that data collection, storage and processing complied with GDPR regulations and that all suppliers were GDPR compliant.
3.3.2 This means that no personally identifiable information, such as passenger and colleague names, addresses or contact details, were accessed during the processing and analysis of any of the data used in this report.
3.3.3 Furthermore, the data presented in this report is aggregated and scaled to a level of resolution that would not betray the security of any commercially sensitive or personally identifiable information.
3. Methodology
3.2.2 For each analytics study, we defined the requirements and business questions we would like to answer, such as ‘how many average daily airport-related vehicle trips were made in 2019?’ or ‘how do passengers arrive at the airport?’. We also defined the required resolution and granularity of the data.

12Heathrow | 2019 Travel Report
11Heathrow | 2019 Travel Report
4. FLIGHTS AND AIRSIDE TRAVEL DEMAND
4.1 Flight statistics
4.1.1 In 2019, 82 airlines operated at Heathrow, serving 206 regular7 destinations across 86 countries.
4.1.2 Flight statistics were sourced from Heathrow’s own internal system records. This data includes all recorded air traffic movements, including scheduled and charter flights, to and from Heathrow.
4.1.3 Heathrow is currently limited to a maximum of 480,000 air traffic movements per year. This is a condition of the planning permission that was granted for Terminal 5 in 2001.
4.1.4 While the airport is technically open 24 hours a day, it is capped to 5,800 night-time take-offs and landings per year between 23:30 and 06:00. Around 80% of the night flights at Heathrow are between 04:30 - 06:00 with an average of 16 aircraft arriving each day between these hours. Heathrow has a voluntary ban in place that prevents flights scheduled between 04:30 - 06:00 from landing before 04:30. Heathrow does not schedule any departures between 23:00 - 06:00.
4.1.5 Today, Heathrow is operating close to capacity with 475,874 flights in 2019. Graphic 4.1 contains the breakdown of these flights by annual average daily, total arriving and total departing numbers of flights.
Graphic 4.1: 2019 Heathrow flights
237,953Number of arriving flights
237,921Number of departing flights
1,304Daily average number of flights
In 2019, Heathrow recorded its busiest year ever with 80.9 million
air passengers
4.2 Passenger statistics
4.2.1 In 2019, Heathrow recorded its busiest year ever with 80.9 million air passengers, surpassing its previous record in 2018 of 80.1 million. Heathrow is the busiest airport in the UK by a large margin, with Gatwick Airport as the next busiest with a reported 46.6 million air passengers8.
4.2.2 Whilst the majority of passengers are making journeys that start or end at Heathrow, the airport’s hub role also means that there are a significant number of passengers connecting between flights without leaving the airport, known as transfer passengers.
4.2.3 Passenger statistics were also sourced from Heathrow’s own internal system records. These records consist of data on all ticketed passenger movements recorded across all flights in 2019.
4.2.4 Connecting passenger journeys are also included in this passenger data and recorded as either arriving or departing journeys, as shown in Graphic 4.2. The total number of passenger journeys in 2019 is therefore the sum of the departing and arriving passenger journeys.
Graphic 4.2: 2019 Air passenger number breakdown
40,928,602Number of arriving passenger journeys
18,568,834Number of connecting passenger journeys
39,958,069Number of departing passenger journeys
221,607Daily average number of passenger journeys
4. Flights and airside travel demand
7 Regular destinations are those with at least 4 flights per month for at least 5 months of the year. 8 Gatwick Airport Key Facts: https://www.gatwickairport.com/business-community/about-gatwick/company-information/gatwick-key-facts/

13Heathrow | 2019 Travel Report
14Heathrow | 2019 Travel Report
0.79 million metric tonnes
Volume of arriving cargo
0.80 million metric tonnes
Volume of departing cargo
2,639Number of dedicated cargo flights
Graphic 4.3: 2019 Freight volumes and number of flights
4.3 Freight statistics
4.3.1 Freight and cargo movements dropped slightly in 2019. Heathrow moved a total of 1.60 million metric tonnes of cargo, around a 10% decrease compared to the 1.70 million metric tonnes transported in 2018.
4.3.2 Graphic 4.3. presents the total volume of cargo moved through Heathrow broken down into arriving and departing metric tonnes, as well as the total number of cargo flights recorded in 2019. Approximately 95%9 of cargo moved through the airport is carried in the belly hold of passenger flights, rather than in dedicated cargo flights.
4. Flights and airside travel demand
9 https://mediacentre.heathrow.com/pressrelease/details/81/Corporate-operational-24/12446

15Heathrow | 2019 Travel Report
16Heathrow | 2019 Travel Report
5. SURFACE ACCESS HEADLINE METRICS
5.1 Introduction
5.1.1 This report provides information on a wide range of metrics related to travel to and from Heathrow, with the intention that it can be used to understand how people travel today, how we can reduce the environmental impact of that travel and how the experience of travelling to and from the airport can be improved. Within this information however, there are three headline metrics that we believe underpin how we manage surface access in future.
5.1.2 These three metrics reflect the requirements of the ANPS, prior to the judicial review challenge in February 2020. Although the ANPS has now been suspended, these metrics still form part of our surface access aspirations, and we will endeavour to record and track progress towards them year on year.
5.2 Public transport mode share for passengers
5.2.1 The Airports National Policy Statement required Heathrow to:
“increase the proportion of journeys made to the airport by public transport, cycling and walking to achieve a public transport mode share of at least 50% by 2030, and at least 55% by 2040 for passengers.”
5.2.2 If the number of passengers that use public transport to travel to and from the airport can be increased, the environmental impact on local communities will be limited by reducing the amount of congestion and emissions generated from private vehicle trips to and from Heathrow.
5.2.3 Data on passenger public transport mode share is collected by the CAA, who undertake an annual Departing Passenger Survey report. Through this report, the ‘final’ mode of surface transport has been recorded over a number of years.
5.2.4 For 2019, the public transport mode share for passengers was 39.3%. This is a very slight (0.1%) decrease from 2018. Of passengers arriving on public transport, just over half (51%) use the underground, 29% use bus and coach, and 20% use rail. For more detailed information on passenger surface access, please see Section 7.2.
Graphic 5.1: 2019 passenger public transport mode share
39.3%Passenger public
transport mode share
Public
Private
5.3 Colleague car trips
5.3.1 The Airports National Policy Statement required Heathrow to:
“from a 2013 baseline level… achieve a 25% reduction of all staff car trips by 2030, and a reduction of 50% by 2040”.
5.3.2 For the purposes of this target we had previously agreed a definition of ‘staff’ (colleagues) with the Department for Transport as being:
“persons working within the Airport boundary or travelling to the Airport for employment within the aviation industry whether they are directly employed by HAL or not”.
5.3.3 As with the passenger public transport mode share metric, reducing the number of car trips made by our colleagues is important to limit the impact of the airport’s operations on local communities. This is a particular issue for colleague journeys, as many Heathrow colleagues live locally and make regular trips to and from the airport.
5.3.3 As with the passenger public transport mode share metric, reducing the number of car trips made by our colleagues is important to limit the impact of the airport’s operations on local communities. This is a particular issue for colleague journeys, as many Heathrow colleagues live locally and make regular trips to and from the airport.
5.3.4 A colleague car trip is defined as a trip made by a colleague either to or from Heathrow for the purposes of work using a private vehicle.
5.3.5 Data on colleague car trips within this report is based on a combination of two data sources. The first of these is data obtained from the Heathrow MAID access pass system which provides detailed statistics of the number of colleagues accessing the airport each day. At the time of calculation, the latest MAID data was only available for 2018. The second data source is the Heathrow Employment Survey, which provides mode shares. The Heathrow Employment Survey was not carried out in 2019, so the latest mode
5. Surface access headline metrics

17Heathrow | 2019 Travel Report
18Heathrow | 2019 Travel Report
share data available at the time of calculation was from 2017. The number of average daily colleague car trips was therefore calculated by applying the 2017 car mode share percentage to the number of colleagues estimated to use MAID passes daily at the airport in 2018.
5.3.6 This analysis was done in 2013 and 201810. In 2013, the average number of colleague car trips was approximately 48,000 trips per day. In 2018, there was a moderate reduction in car trips to approximately 45,157. This represents a 5.4% reduction in the number of trips being made.
Graphic 5.2: 2018 average daily colleague car trips
45,157 Average daily colleague car trips
5.4 Airport-relatedroadtraffic
5.4.1 The ANPS stated that:
“Heathrow Airport should continue to strive to meet its public pledge to have landside airport-related traffic no greater than today”.
5.4.2 Whilst minimising the number of colleague car trips being made and increasing passenger public transport mode share will help to reduce the impact of airport operations on the local area, it is acknowledged that there are a number of other trips being made by road to and from Heathrow, for example by freight vehicles. As such, Heathrow previously pledged that in expanding the airport, steps would be taken to limit airport-related traffic to current levels.
5.4.3 In 2019, four two-week ANPR surveys were conducted on all roads along the airport boundary. Conducting the surveys at these intervals allowed us to capture a good range of demand variability due to different types of passengers travelling at different times of the year. These surveys provide a comprehensive baseline against which future performance against this pledge can be measured.
5.4.4 An airport-related vehicle trip is defined as a journey by a motorised road vehicle (which is not an internal trip, or a public transport trip) which has an origin or destination on land that is accessible only by Heathrow-controlled roads. For example, a passenger that gets dropped off by a family member in a private vehicle at the airport generates two airport-related vehicle trips; one terminating at the airport upon drop-off and one originating at the airport when leaving the boundary again. The table below sets out how vehicle types are classified to calculate the airport-related vehicle trip count.
Graphic 5.3: Average daily landside airport-related road trips (2019)
192,596Average daily landside
airport-related vehicle trips
10 The 2018 figure is a combination of 2018 MAID data with mode share percentage from the Heathrow Employment Survey 2017 applied.
5. Surface access headline metrics 5. Surface access headline metrics
Table 5.1: Vehicle classifications for inclusion in the airport-related vehicle trip count
Trip Purpose Methodofclassification Airport-related vehicle trip countScheduled public transport Vehicle identified as a scheduled public transport service and/
or vehicle registration captured by ANPR identified from known public transport provider registration database.
Excluded
Terminaltraffic Vehicle captured by ANPR, at specific terminal locations, recorded accessing a terminal area.
Included
Passengercarparktraffic Vehicle captured by ANPR, at specific passenger parking locations, recorded accessing a passenger car park.
Included
Colleague car trip Vehicle captured by ANPR, at specific colleague parking locations, recorded accessing a colleague car park.
Included
Through-traffic Vehicle not accessing any terminal, cargo or car park areas and exiting the Heathrow controlled road network from a different access point within an expected journey time11.
Excluded
Othertraffic All vehicle not otherwise classified. Included
5.4.5 In 2019, the average daily number of landside airport-related vehicle trips was approximately 192,596. Further information on the types of vehicles making these trips and the locations that vehicles are travelling to and from are also included in Section 6.3.
11 Expected journey times were calculated using the Google Directions API with an added margin of 10% to remain conservative.

19Heathrow | 2019 Travel Report
20Heathrow | 2019 Travel Report
6. SURFACE ACCESS INFRASTRUCTURE AND SERVICES 6.1 Introduction
6.1.1 There are several options available for travelling to and from Heathrow, including public transport and road access. Heathrow also provides parking and electric vehicle infrastructure on site, as well as dedicated areas for taxis and private hire vehicles. In this section, we describe the infrastructure and services available at Heathrow, explain how they are managed, and present statistics on how they are used.
6.2 Heathrow by public transport
Rail and undergound6.2.1 Heathrow benefits from a number of rail and London Underground links between the
airport and central London. These links are shown in Graphic 6.1, and include the Heathrow Express, the Piccadilly line and Heathrow Connect services. There are currently no direct rail links to areas outside London.
6. Surface access infrastructure and services
Graphic 6.1: Rail links at Heathrow in 2019
Heathrow ExpressUnderground
TfL RailUnderground
Heathrow ExpressTfL Rail Underground
TfL RailHeathrow Express
PICCADILLY LINE
Hatton Cross
TERMINAL 5
TERMINAL 4
TERMINAL 2 & 3
LEGEND
UNDERGROUND LINE
HEATHROW BOUNDARY
RAIL LINE
To London
6.2.2 Heathrow Express is a subsidiary of Heathrow Airport Limited, with Great Western Railway (GWR) managing the service. This arrangement will continue to at least 2028, with GWR introducing new rolling stock in 2020. Both the new contract and rolling stock aim to increase reliability and passenger experience.
6.2.3 In addition to the Heathrow Express service, there is a TfL Rail stopping service operating between the airport and London Paddington, having taken over the Heathrow Connect route in May 2018. TfL Rail is operated by TfL and incorporated into the TfL ticketing system and as such Oyster cards, contactless payment and London travelcards can all be used on these services.
6.2.4 In the future, the TfL Rail service will be incorporated into the Elizabeth line, with trains running through central London onto Shenfield (via Stratford) and Abbey Wood (via Canary Wharf).
6.2.5 The airport is also served by London Underground services, with the Piccadilly line providing a link from the airport to central, north and west London. These services are also managed by TfL.
Bus and coach6.2.6 Heathrow Central Bus Station is one of the UK’s busiest bus and coach stations,
with around 850 bus and 450 scheduled coach departures each day to over 1,000 destinations12. It is located between Terminals 2 and 3 and is open 24 hours a day. In addition, bus and coach stops are also provided outside Terminals 4 and 5. Heathrow manages the Central Bus Station and terminal bus stops but does not run bus or coach services itself.
6.2.7 There are 32 bus routes (including night buses) that serve the airport, five of which operate 24 hours a day (as at 31/12/19). The majority of these services are operated under contract by TfL, with a number of other operators running services to non-London destinations. In total, there are around 50 daytime bus departures in the peak hour from the Central Bus Station. Graphic 6.2 shows the routes that serve the airport.
12 Bus and coach timetable information stated from Q4 2019 timetables.

21Heathrow | 2019 Travel Report
22Heathrow | 2019 Travel Report
6. Surface access infrastructure and services 6. Surface access infrastructure and services
13 The Hotel Hoppa service is not a component of the Free Travel Zone
Graphic 6.2: Current bus services to Heathrow
6.2.8 Around 450 scheduled coach services depart from the Central Bus Station each day. Many services, depending on destination, go on to call at other terminals, with around 350 coaches per day departing from Terminal 5 and around 150 from Terminal 4. The majority of coach services to and from Heathrow are operated by National Express, supplemented by the Oxford ‘Airline’, RailAir and Megabus services. Destinations served by these routes are shown in Graphic 6.3.
Graphic 6.3: Coach routes to Heathrow in 2019
Free travel zone6.2.9 Heathrow also funds a Free Travel Zone (FTZ) in the vicinity of the airport. This allows
passengers to travel around the airport without charge on the Heathrow Express, TfL Rail, the Piccadilly line and most buses13. Transfer between terminals or between hotels and the airport when using these services is therefore free. Hatton Cross station is also part of the FTZ but only for buses and interchange between services on the Piccadilly line. The limits of the FTZ are shown in Graphic 6.4.
6.2.10 Airport colleagues are also able to travel around the airport free of charge by public transport as well as on the colleague shuttle bus service. The shuttle service operates on a frequent basis between Compass Centre and Terminals 2 and 3. There are also a number of other colleague bus services, such as the N4, N5 and PEX, which link the terminals with colleague car parks.

6. Surface access infrastructure and services
23Heathrow | 2019 Travel Report
24Heathrow | 2019 Travel Report
6. Surface access infrastructure and services
Graphic 6.4: The Heathrow Free Travel Zone
Public transport vehicle trips 6.2.11 Public transport timetable data was analysed to understand the total number of airport-
related bus, coach and underground trips in 201914. When considering bus and coach trips, this provided a good understanding of the proportion of public transport traffic in and around the airport (see Section 6.3 for more details).
6.2.12 It should be noted that the numbers in this table are the number of vehicle (or train) trips and not the number of person trips. The capacity of trains (both mainline and underground) is significantly greater than the capacity of buses or coaches, and as such although there are fewer underground services than there are bus or coach services, more passengers travel by this mode.
6.2.13 Graphic 6.5 shows that bus services are responsible for the majority of public transport movements across the Heathrow boundary. This is in large part due to the nature of the services, which in many cases cross in and out of the airport boundary multiple times on a single route. For example, the Hotel Hoppa services have a greater number of trips than all coach services combined. However, the Hotel Hoppa H54 service crosses the airport boundary four times in a 45-minute period each time the route is driven. The proportionate split between the different types of public transport service is shown in Graphic 6.5.
Graphic 6.5: Number of public transport vehicle trips to / from Heathrow by mode 2019
Annual airport-related public transport vehicle trips
Bus
Mod
e Coach
Underground
Rail
500,000 1,000,000 1,500,000 2,000,000 2,500,000
2,000,000
279,000
171,000
56,400
6.3 Heathrow by road
Overview6.3.1 Passengers, PHVs, taxis, colleagues and freight vehicles all make use of the road
network in and around Heathrow, making this a complex network to track and monitor.
6.3.2 There are three types of car trips made by passengers to Heathrow by car. The first of these is referred to in this document as ‘park and fly’. These are trips made by private car by passengers who park at the airport for the duration of their trips, normally in long-stay or business car parks.
6.3.3 The second type of trip is known as ‘kiss and fly’. These are trips made when passengers are picked up or dropped off in a private car driven by someone else, perhaps a family member or friend. Passengers can be dropped off by car at free set-down lanes located outside Departures at each of the terminals. However, if passengers are being picked up by car, waiting drivers must use one of the short-stay car parks adjacent to the terminals, or can park for free in the long-stay car parks for up to two hours.
6.3.4 The final type of car trip is when a passenger is picked up or dropped off by a taxi or PHV. Trips being made by PHV must be pre-booked. This includes vehicles booked using ride hailing services.
6.3.5 These arrangements are different from those for taxis (black cabs), which do not need to be pre-booked. Taxis can be hailed from dedicated ranks at each of the terminals. However, to manage taxi demand and prevent queuing back from the ranks onto the local road network, Heathrow operates a Taxi Feeder Park (TFP) provided with 450 spaces, also accessed from the Northern Perimeter Road. Taxis wait at the TFP before progressing to pick up passengers from a rank on a ‘first in, first out’ basis. The TFP also provides driver facilities, including a canteen.
6.3.6 Trips are also made by car by Heathrow colleagues who make use of the colleague car parks (discussed further in Section 7.3.)
6.3.7 Finally, trips are made by vehicles that move cargo and freight to and from the airport (discussed further in Section 7.4.).
14 It is important to note that this report reflects services as they were operating in 2019. At the time of writing a number of changes to services have had to be made in response to the coronavirus pandemic, but these are not considered here.
6. Surface access infrastructure and services
25Heathrow | 2019 Travel Report
26Heathrow | 2019 Travel Report
6. Surface access infrastructure and services
Road Network6.3.8 Heathrow has access to the national strategic road network with direct connections from
Terminal 5 to Junctions 14 and 14a of the M25, and from Terminals 2 and 3 to Junction 4 of the M4 via the M4 Spur. Terminals 4 and 5 can be accessed via the Southern Perimeter Road and Western Perimeter Road respectively due to their location on the edge of the airport, although Terminal 5 also has direct access from Junction 14a of the M25. Access into the Central Terminal Area (Terminals 2 and 3) is only possible via a tunnel beneath the northern runway, accessed from the Emirates Roundabout Junction, which connects the Northern Perimeter Road to the M4 Spur.
6.3.9 From here the wider motorway network can be accessed, with both the M3 (South West) and M40 (Birmingham) nearby. All motorways around the airport are managed by Highways England. Heathrow also has direct access from strategic local roads, including the A4 and A30, both of which are managed by TfL in the vicinity of the airport.
6.3.10 Heathrow acts as highway authority for a network of roads around and within the airport, including the Northern, Southern, Western and Eastern Perimeter Roads. As highway authority, Heathrow owns, maintains and manages these roads. Heathrow also enforces speed limits and parking regulations on these roads.
Graphic 6.6: Road network around Heathrow
Parking6.3.11 Heathrow operates passenger long-stay and short-stay car parks for Terminals 2 and
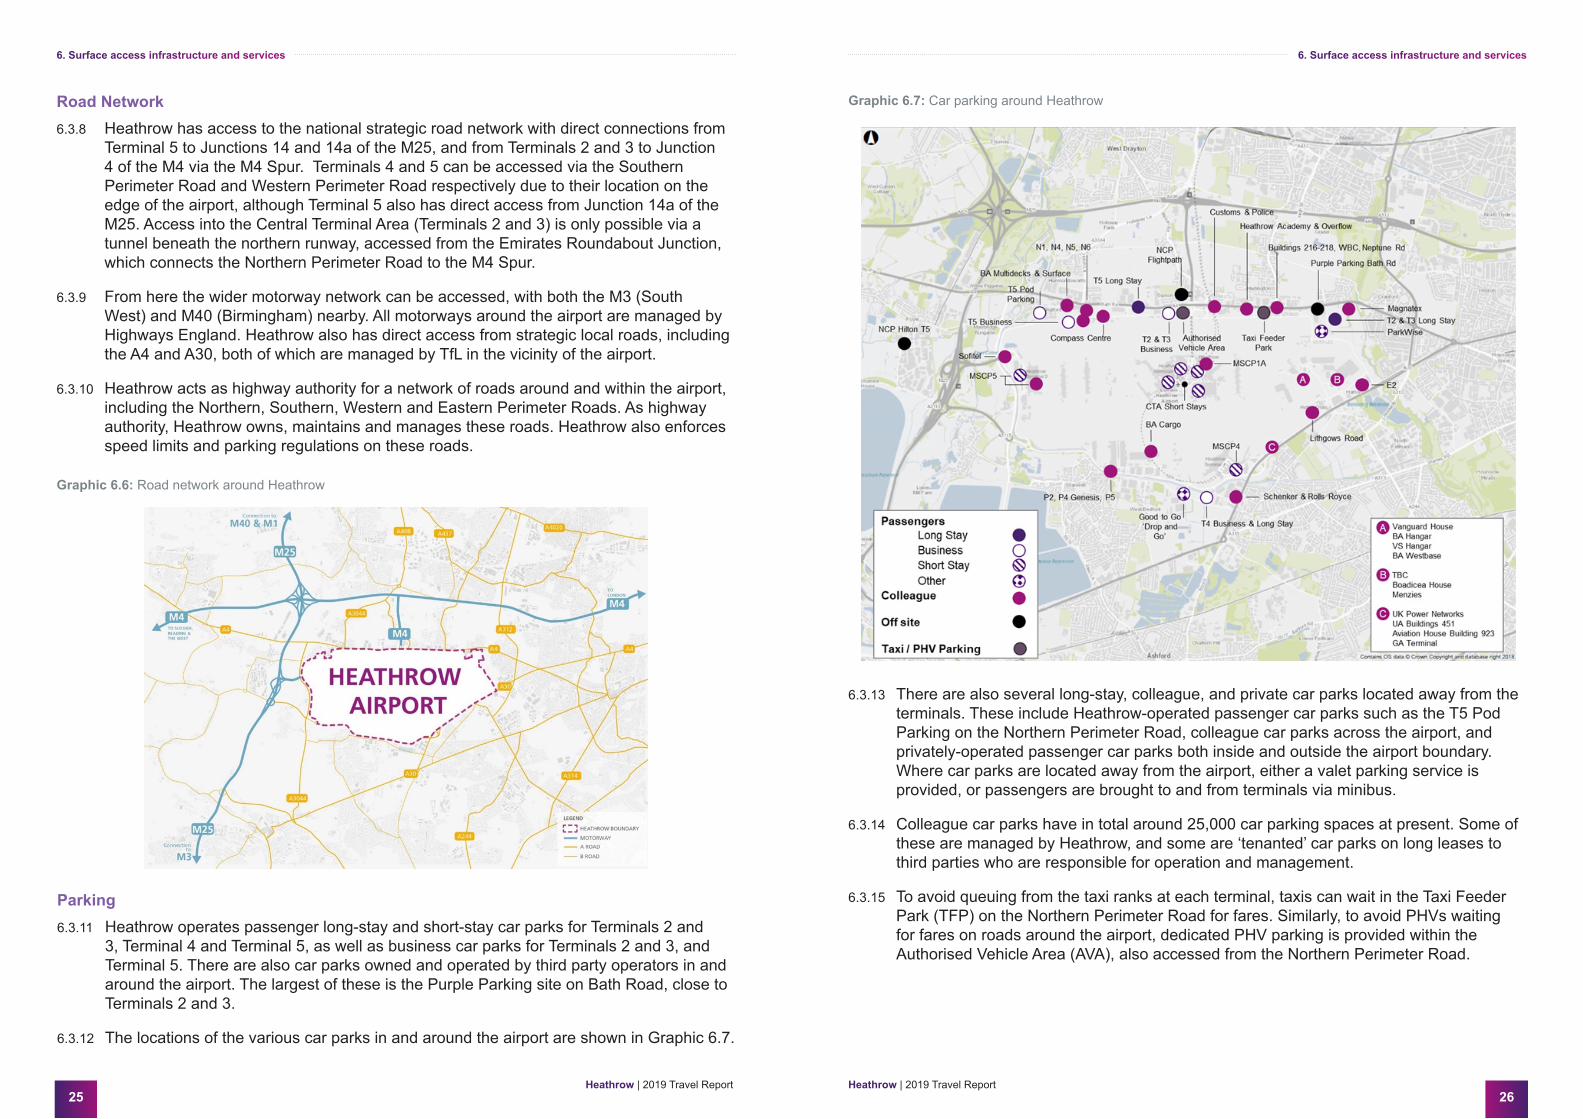
3, Terminal 4 and Terminal 5, as well as business car parks for Terminals 2 and 3, and Terminal 5. There are also car parks owned and operated by third party operators in and around the airport. The largest of these is the Purple Parking site on Bath Road, close to Terminals 2 and 3.
6.3.12 The locations of the various car parks in and around the airport are shown in Graphic 6.7.
Graphic 6.7: Car parking around Heathrow
6.3.13 There are also several long-stay, colleague, and private car parks located away from the terminals. These include Heathrow-operated passenger car parks such as the T5 Pod Parking on the Northern Perimeter Road, colleague car parks across the airport, and privately-operated passenger car parks both inside and outside the airport boundary. Where car parks are located away from the airport, either a valet parking service is provided, or passengers are brought to and from terminals via minibus.
6.3.14 Colleague car parks have in total around 25,000 car parking spaces at present. Some of these are managed by Heathrow, and some are ‘tenanted’ car parks on long leases to third parties who are responsible for operation and management.
6.3.15 To avoid queuing from the taxi ranks at each terminal, taxis can wait in the Taxi Feeder Park (TFP) on the Northern Perimeter Road for fares. Similarly, to avoid PHVs waiting for fares on roads around the airport, dedicated PHV parking is provided within the Authorised Vehicle Area (AVA), also accessed from the Northern Perimeter Road.
6. Surface access infrastructure and services
27Heathrow | 2019 Travel Report
28Heathrow | 2019 Travel Report
6. Surface access infrastructure and services
6.3.16 Heathrow introduced the Authorised Vehicle Area in 2016. This is a dedicated area providing 800 spaces for private hire vehicles to wait for fares, prior to meeting and picking up passengers from the designated pick-up area. This facility was developed after engagement and consultation with local communities, to stop private hire vehicles waiting in local residential areas.
6.3.17 Heathrow does not operate or licence taxis or PHVs, which is the responsibility of local councils, or in London, Transport for London.
6.3.18 Car hire facilities are largely concentrated on the Northern Perimeter Road, with passengers being bused to and from the various airport terminals.
Kiss and Fly6.3.19 The forecourts of each terminal are also managed by Heathrow and are used for drop-off
by private vehicles, taxis and PHVs. Whilst taxis can also pick up from ranks at each of the terminal forecourts, private vehicles and PHVs must pick up from within the short-stay car parks located at each terminal.
Electric vehicle infrastructure6.3.20 To encourage usage of electric vehicles (EV) to Heathrow, 88 EV charging points
have been installed across the campus (as of April 2019) with 69 of those being made accessible landside .
6.3.21 The majority of EV charging points provided for passengers, airside operations, landside operations and colleagues can recharge a 30kWh battery in 1-2 hours (22kW chargers) or 3-5 hours (7kW chargers). For taxis, rapid chargers (43-50 kW) are provided within the Taxi Feeder Park, capable of recharging 80% of the battery in 20-40 minutes.
6.3.22 The number of EV charging points available per user group is shown in Graphic 6.8, showing that the majority of EV facilities are for passengers and colleagues.
Graphic 6.8: Number of EV charging points by user groups
0 20 40 60 80 100
38 7 19 24
Passengers Taxi and PHVs Airside operations Landside operations / colleagues
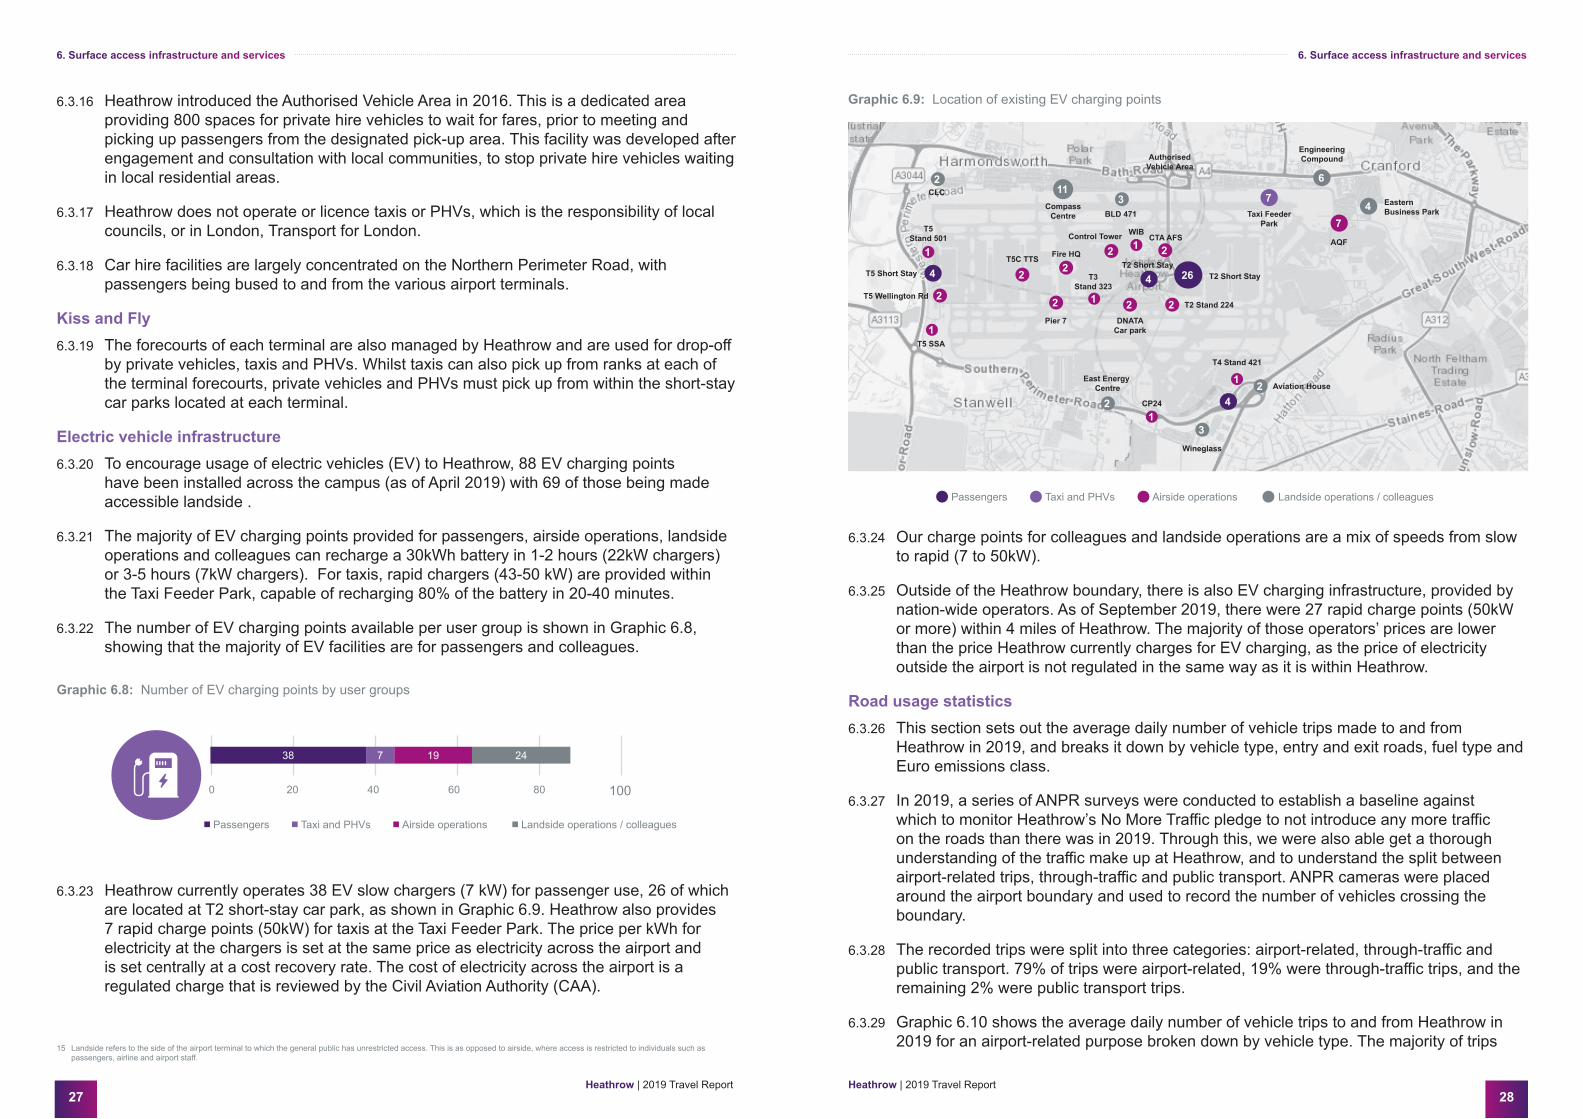
6.3.23 Heathrow currently operates 38 EV slow chargers (7 kW) for passenger use, 26 of which are located at T2 short-stay car park, as shown in Graphic 6.9. Heathrow also provides 7 rapid charge points (50kW) for taxis at the Taxi Feeder Park. The price per kWh for electricity at the chargers is set at the same price as electricity across the airport and is set centrally at a cost recovery rate. The cost of electricity across the airport is a regulated charge that is reviewed by the Civil Aviation Authority (CAA).
Graphic 6.9: Location of existing EV charging points
Passengers Taxi and PHVs Airside operations Landside operations / colleagues
113
2 6
4
2
3
2
1
1
1
2
2
2
2
21
2 21
2
1
7
7
4
4 4 26
CLCCompass
Centre BLD 471
Authorised Vehicle Area
Taxi Feeder Park
Engineering Compound
Eastern Business Park
AQFWIB
CTA AFS
T2 Short StayT2 Short Stay
T2 Stand 224
DNATA Car park
Control Tower
T5C TTS Fire HQ
T3 Stand 323
Pier 7
T5Stand 501
T5 Short Stay
T5 Wellington Rd
T5 SSA
T4 Stand 421
Aviation House
Wineglass
CP24
East Energy Centre
6.3.24 Our charge points for colleagues and landside operations are a mix of speeds from slow to rapid (7 to 50kW).
6.3.25 Outside of the Heathrow boundary, there is also EV charging infrastructure, provided by nation-wide operators. As of September 2019, there were 27 rapid charge points (50kW or more) within 4 miles of Heathrow. The majority of those operators’ prices are lower than the price Heathrow currently charges for EV charging, as the price of electricity outside the airport is not regulated in the same way as it is within Heathrow.
Road usage statistics 6.3.26 This section sets out the average daily number of vehicle trips made to and from
Heathrow in 2019, and breaks it down by vehicle type, entry and exit roads, fuel type and Euro emissions class.
6.3.27 In 2019, a series of ANPR surveys were conducted to establish a baseline against which to monitor Heathrow’s No More Traffic pledge to not introduce any more traffic on the roads than there was in 2019. Through this, we were also able get a thorough understanding of the traffic make up at Heathrow, and to understand the split between airport-related trips, through-traffic and public transport. ANPR cameras were placed around the airport boundary and used to record the number of vehicles crossing the boundary.
6.3.28 The recorded trips were split into three categories: airport-related, through-traffic and public transport. 79% of trips were airport-related, 19% were through-traffic trips, and the remaining 2% were public transport trips.
6.3.29 Graphic 6.10 shows the average daily number of vehicle trips to and from Heathrow in 2019 for an airport-related purpose broken down by vehicle type. The majority of trips 15 Landside refers to the side of the airport terminal to which the general public has unrestricted access. This is as opposed to airside, where access is restricted to individuals such as
passengers, airline and airport staff.

6. Surface access infrastructure and services
29Heathrow | 2019 Travel Report
30Heathrow | 2019 Travel Report
6. Surface access infrastructure and services
(85%) were made by car, including both private car and PHV trips. At present, there is no central register of licensed PHVs, which means it is difficult to distinguish PHVs from ANPR data. However, we estimate that 34% of car trips (or 29% of all trips) are PHV trips, with around 135,000 unique PHVs accessing the airport in 201916.
6.3.30 Around 8.5% of the trips made into or out of the airport were made by commercial vehicles, of which more than half were made by light vans (less than 3.5t). Only a small proportion were made by HGV, which is possibly due in large part to movement of cargo in and out of the airport.
Graphic 6.10: Proportion of average daily airport-related trips by vehicle type
Vehi
cle
type
0% 10% 20% 30% 40% 50% 60% 70% 80% 90%
Proportion (%) of average daily airport-related vechicle trips
Car/ PHV
LGV<3.5T
Taxi
HGV
Plant
Bus/ Coach
Other
Unknown
Motorcycle
84.8% / 163,000
4.4% / 8,500
3.6% / 6,900
2.6% / 4,900
1.5% / 2,800
1.4% / 2,700
1.1% / 2,000
0.7% / 1,300
0.1% / 116
6.3.31 Graphic 6.11 and Graphic 6.12 present the proportion of vehicle entries and exits geographically. From this, we can see that the majority of incoming and outgoing traffic to the airport goes through Tunnel Road at the north of the airport, which is also the primary access point to the Central Terminal Area (Terminals 2 and 3) as well as the perimeter roads around the airport. The M25 and Southern Perimeter Road (SW) also account for a large portion of traffic in the West. From this, we can conclude that the M4, connecting Tunnel Road, and the M25 are the most critical transport routes on the strategic highway network for road traffic to and from the airport.
Graphic 6.11: Proportion of vehicle entries per road to the Heathrow boundary
14.2%
13.2%
0.7%
10.2%
13%
0.1% 9.8%
7.5%
Southern Perimeter (SW)
M25
Western Perimeter
Bath Road (W) Tunnel Road Bath Road (E)
Hatton Cross
A30
Southern Perimeter (S)
Sanctuary Road
7% 24.3%
Graphic 6.12: Proportion of vehicle exits per road to the Heathrow boundary
15.5%
15.5%
0.7%12.5%
11.2%
0.1% 7.8%
8%
Southern Perimeter (SW)
M25
Western PerimeterBath Road (W) Tunnel Road Bath Road (E)
Hatton Cross
A30
Southern Perimeter (S)
Sanctuary Road
7.7% 20.9%
6.3.32 Graphic 6.13 presents the number of average daily airport-related car trips by fuel type.
6.3.33 This shows that the large majority (86%) of vehicles frequenting the airport are diesel (61%) and petrol (25%) vehicles, while 11% have an electric component.
16 Based on an analysis of vehicle driving patterns at the airport. Those vehicles which exhibited patterns indicative of PHV trips (e.g. Hybrid vehicles using the short-stay car parks multiple times) were identified as such. The analysis was validated against data collected from the CAA departing passenger survey, Heathrow Employment Survey, and PHV / taxi modelling).

31Heathrow | 2019 Travel Report
32Heathrow | 2019 Travel Report
Graphic 6.13: Proportion of average daily airport-related vehicle trips by fuel type 2019
Graphic 6.14: Comparison of fuel types between Heathrow and Great Britain, 2019
6. Surface access infrastructure and services 6. Surface access infrastructure and services
70%60%50%40%30%20%10%0%
Fuel
type
Proportion (%) of average daily airport-related vechicle trips
Diesel
Petrol
Electric/ Hybrid
Gas Bi-Fuel
Unknown
60.9% / 117,000
24.8% / 47,700
10.9% / 20,900
<0.1% / 61
3.5% / 6,700
70%60%50%40%30%20%10%0%
Fuel
type
Diesel
Petrol
Electric/ Hybrid
Gas Bi-Fuel
Proportion of vehicles in Great Britain
60.9% 45.1%
24.8% 52.8%
10.9% 2.0%
0.0% 0.1%
Heathrow Great Britain
6.3.34 For comparison, the proportion of different fuel types for vehicles within Great Britain is shown in Graphic 6.14. This data is published by the Department for Transport and represents all vehicles currently licensed (at the end of 2019). This shows that Heathrow attracts a higher proportion of both diesel / heavy oil powered vehicles, and hybrid/electric vehicles. This could potentially be due to the higher use of these types of fuel by taxi and PHV drivers, and the number of taxi and PHV movements associated with the airport, as well as the number of freight trips (which are generally made using diesel vehicles) associated with the airport.
6.3.35 The proportion of airport-related vehicle trips broken down by Euro class is presented in Graphic 6.15.
Graphic 6.15: Number of average daily airport-related vehicle trips by Euro class
50%40%30%20%10%0%
Euro
cla
ss
6
5
4
3
2
1
0 or unknown
Proportion (%) of average daily airport-related vehicle trips
43.8%
13.9%
30.3%
11.3%
0.6%
0.0%
0.0%

33Heathrow | 2019 Travel Report
34Heathrow | 2019 Travel Report
7. SURFACE ACCESS USAGE BY PASSENGERS, COLLEAGUES, AND FREIGHT 7.1 Introduction
7.1.1 There are three main groups of users who travel to the airport, all for different reasons and with different priorities. These user groups are air passengers, colleagues, and freight operators. This section considers how each of these user groups travel to and from the airport.
7.2 Air passenger surface travel
7.2.1 As set out in Section 5.2, the proportion of passengers using public transport to access the airport is a key metric for Heathrow. We are aiming to reduce our environmental impact on local communities by reducing the amount of congestion and emissions generated from private vehicle trips to and from Heathrow. Encouraging passengers to use public transport is key to this aim.
7.2.2 This section therefore examines the proportion of passengers who use public versus private transport to travel to the airport, and how this split is changing over time. This analysis is based on the CAA’s Departing Passenger Survey and reports the ‘final’ mode of surface transport (i.e. the last mode used to on a passenger’s journey to the airport).
7.2.3 We have analysed the ‘final’ mode statistics as this is the part of a passenger’s journey which is most interesting for us to understand, and which has the highest impact on the congestion surrounding the airport. For example, a passenger may travel by train to a London terminal and then take a taxi to the airport. Although the train journey may have been the main mode (i.e. the longest part of the journey), we are most interested in the taxi journey, as this is the part that most affects the airport and the surrounding areas.
7.2.4 It should be noted that mode share is determined from surveying departing passengers only. For weighting purposes, the CAA makes the assumption, that arriving and departing passengers share the same modal characteristics. This has been consistent throughout the CAA’s passenger survey work.
Graphic 7.1: Heathrow public vs private (final) mode share 2013-2019
7.2.6 This suggests that the split between public and private transport has not changed significantly over time, although the 2019 public transport mode share is 1.7% below its 2014 peak. There was however a more significant drop between 2014 and 2015, with a gradual climb in public transport mode share until 2017, and a very slight year on year reduction since then17.
7.2.7 To help understand why the split between private and public transport has changed over time, Graphic 7.2 present the final mode of surface transport broken down by specific type for each year.
17 In 2015, it should be noted that a lower public transport share was recorded in Q3. This was the result of the inclusion of sampling on days that were impacted by industrial action affecting London’s transport network.
We are aiming to reduce our environmental impact on local communities by reducing the amount of
congestion and emissions generated from private vehicle trips to and from Heathrow. Encouraging
passengers to use public transport is key to this aim.
7.2.5 The passenger mode share data for 2013 through to 2019 is summarised in Graphic 7.1
7. Surface access usage by passengers, colleagues, and freight
Mod
e sh
are
(%)
Year
Public Private Other
70%
60%
50%
40%
30%
20%
10%
0%0.3%
40.9%
58.8%
41.0%
58.6%
38.8%
60.9%
39.1%
60.7%
39.6%
60.2%
39.4%
60.3%
39.3%
60.5%
0.4% 0.3% 0.2% 0.2% 0.3% 0.2%
2013 2014 2015 2016 2017 2018 2019

35Heathrow | 2019 Travel Report
36Heathrow | 2019 Travel Report
Graphic7.2:Heathrow(final)modeoftransportbytype2013-2019
7.2.8 The biggest increases have been in underground and taxi / PHV use, with a corresponding decrease in rail use (and to a lesser extent, bus and coach). Anecdotally, these changes may be driven by the increased popularity of app-based ride-hailing services.
7.2.9 This hypothesis is backed up by data published by TfL as part of their annual ‘Travel in London’ report18. This shows that in London, whilst there has been a gradual decline in the number of licenced taxis operating, there has been significant growth in the number of PHVs. From 2008/09 to 2018/19 there has been a 78% increase in the number of PHVs licenced in London, although there has been a very slight decrease in numbers in the last year. There has however been a decline in the number of PHV operators, suggesting consolidation in the industry. This is potentially due to the increased prevalence of drivers using app-based ride-hailing services.
7.2.10 The Travel in London report suggests that from 2012/13 to 2018/19 the combined number of licenced taxis and PHVs in London has increased by just under 50%. However, in the same period, Taxi / PHV mode share at the airport has increased by just 11.5%. In this context, the fact that public transport mode share has stayed broadly constant over this period is considered to be positive in the face of this significant background growth in PHVs, and reflects well on the improvements to public transport made by Heathrow.
7.2.11 As part of their Departing Passenger Survey, the CAA also collect data on whether passengers live in the UK or abroad, and the purpose for which they are travelling. Graphic 7.3 presents this information19. This is important to understand in the context of surface access, as different user groups travel to and from the airport in different ways. For example, UK-based passengers may have access to cars and therefore might choose to drive to the airport and park, or be picked up or dropped off by friends or family members. By contrast, foreign passengers tend not to use private cars (although may, for example, be visiting family who might pick them up from the airport by car) and instead use rental cars, taxis, PHVs or public transport.
7.2.12 Similarly, different passenger groups have different priorities when it comes to surface access. Since 2015, Heathrow have undertaken over 30 customer research studies on surface access to understand these priorities, working with both internal and external stakeholders including the DfT, Transport Focus and TfL. An example of the outputs of this work is that business passengers may for example be able to charge travel to expenses, and therefore prioritise speed and directness over cost. This may see a greater use of modes such as taxi and the Heathrow Express, particularly given that many business trips are made to and from central London.
18 Travel in London 12 - http://content.tfl.gov.uk/travel-in-london-report-12.pdf. Data on Taxi / PHV is in Section 9.7. 19 Note: interviews were excluded in which passengers did not answer all the core questions of the survey.
Graphic 7.3: Proportion of passengers by origin country and trip purpose 2013-2019
7. Surface access usage by passengers, colleagues, and freight 7. Surface access usage by passengers, colleagues, and freight
7.2.13 This data shows a gradual decline over time in business travel and corresponding increase in leisure travel. This is consistent across both UK-based and foreign-based passengers. The demographic that has shown the largest increase is UK-based passengers travelling for leisure. Our analysis of CAA data shows that leisure passengers generally have a higher public transport mode share than business passengers (approximately 40% against 36%) and so from a surface access perspective this is positive.
Mod
e sh
are
(%)
Year
Taxi / PHV
Business (domestic) Business (foreign) Leisure (domestic) Leisure (foreign)
Car
Underground / Metro / Subway / Tram
Bus / Coach
Rail
Hire
Other
35%
30%
25%
20%
15%
10%
5%
0%2013 2014 2015 2016 2017 2018 2019
Prop
ortio
n of
pas
seng
ers
(%)
Year
35%
40%
45%
50%
30%
25%
20%
15%
12.1%
17.4%
27.7%
42.7% 42.4% 42.4%44.6% 43.4% 45.1% 43.6%
28.1%29.9% 29.0% 30.4% 29.4%
31.2%
17.3% 16.7% 15.6% 15.8% 15.3% 14.8%
12.3% 11.0% 10.7% 10.5% 10.2% 10.4%10%
5%
0%2013 2014 2015 2016 2017 2018 2019

37Heathrow | 2019 Travel Report
38Heathrow | 2019 Travel Report
7.2.14 The CAA also collects data from other airports across the UK, and these patterns are mirrored across the country as whole. The average proportion of trips being made for business has reduced from 22.4% nationwide in 2013 to 19% today, mirroring the pattern seen at Heathrow. Similarly, the proportion of UK-based travellers (across both business and leisure) has increased from 68.4% to 69.2%, with this slight increase following the pattern seen at Heathrow. As such, these changes in passenger home location and trip purpose seem reflective of wider societal changes across the UK and further afield, rather than being an issue that is specific to Heathrow.
7.3 Colleague surface travel
7.3.1 Heathrow is one of the largest single employment sites in the UK, with an estimated average of around 70,000 colleague trips made on all modes to and from the airport each day, by colleagues from over 400 different companies. As a result, travel by our colleagues makes up a major part of the total number of surface access vehicle trips made to and from the airport on any given day.
7.3.2 Almost 90% of these colleagues work non-standard shift patterns outside conventional hours, when the availability of public transport and attractiveness of walking and cycling is likely to be lower.
7.3.3 During 2019 we launched the ‘Way2Go’ colleague campaign as the first step in a long-term programme to get Heathrow colleagues travelling in more sustainable ways. The campaign focused on promoting the four alternative ‘ways’ to get to and from Heathrow (car share, public transport, active travel and agile working) highlighting the extensive but underused travel benefits already available to every colleague. These are described in this section, including detail about their usage during 2019.
7.3.4 This section contains a breakdown of colleague surface travel mode share, with further detail about initiatives to encourage more sustainable travel (e.g. public transport, active travel, and sustainable private car travel).
Overall mode share7.3.5 Data on colleague travel was collected as part of the Heathrow Employment Survey in
2017. The survey revealed that 249 companies reported a total of 72,711 colleagues that work in or around Heathrow. British Airways is by far the largest employer at the airport, with over 30,000 colleagues reported in the survey.
7.3.6 Using this data, we developed an understanding of how colleagues travel to and from the airport. The majority of colleagues use private transport modes, as shown in Graphic 7.4.
7.3.7 It should be noted that contrary to passenger mode share, which considers the last leg of the journey, colleague mode share is reported by main mode of transport. The main mode is the mode of transport used on the longest leg of a colleague’s journey by distance. We consider that main mode is the more appropriate way of measuring colleague trips which will generally be over a shorter distance than passenger trips.
During 2019 we launched the ‘Way2Go’ colleague campaign as the first step in a long-term programme to get Heathrow colleagues travelling in more sustainable ways.
Graphic 7.4: Colleague mode share 2017
Colleague mode share
Public 28%
Private 67%
Other 5%
7. Surface access usage by passengers, colleagues, and freight 7. Surface access usage by passengers, colleagues, and freight
7.3.8 Private mode share consists of car sharers (passengers and drivers), private single-occupancy car drivers, motorcycle and taxi / PHV users. Public mode share consists of local bus, underground, Heathrow Express, Heathrow Connect and air transport users. Other mode share is made up of walking, cycling, company transport and other unspecified modes.
7.3.9 A more detailed breakdown of colleague mode share is shown in Graphic 7.5. Single occupancy car use is the most used mode of transport by colleagues. This is something that Heathrow aims to reduce in the future by moving more colleagues onto public transport through various incentives and discount schemes and to encourage car sharing where possible.

39Heathrow | 2019 Travel Report
40Heathrow | 2019 Travel Report
Graphic 7.5: Detailed breakdown of colleague main mode share 2017
7.3.10 Of those colleagues who travel by public transport, the most commonly used mode is bus. This is likely to be because direct rail services into Heathrow focus on provision of links into central London, only serving areas to the east of the airport. By contrast, there is a comprehensive network of local bus routes serving all areas around the airport where colleagues are likely to live, as described in Section 6.2. It is also easier for bus operators to develop timetables that respond to the shift patterns of colleagues working at Heathrow, whereas rail and underground services often cannot operate overnight due to the need to carry out maintenance.
Graphic 7.6: Comparison of mode shares of Heathrow colleagues (2017) with the general population in Hillingdon (2011)20
20 2011 Census dataset WP703EW - Method of travel to work (2001 specification) (Workplace population for LB Hillingdon)
Public transport7.3.12 Heathrow encourages colleagues to travel to the airport by public transport as much as
possible. To make it more cost effective and convenient for commuting, colleagues have access to purchase a Travelcard, which is a monthly or annual season ticket which offers significant discounts when compared with the price of operators’ normal season tickets on Heathrow Express and selected bus and coach travel.
7.3.13 While bus and coach services can provide important links to areas local to the airport, some colleagues need to travel from elsewhere in Greater London. As well as the Heathrow Travelcard scheme, a 75% discount is also available on TfL Rail and GWR trains to or from Heathrow stations.
7.3.14 Different tiers of the Travelcard can be purchased for different transport network routes on an annual or monthly basis. In 2019, 10,503 Heathrow Travelcards were purchased by colleagues, of which 10,276 were monthly passes and 227 were annual passes.
7. Surface access usage by passengers, colleagues, and freight 7. Surface access usage by passengers, colleagues, and freight
7.3.11 Although it is now outdated (latest data collected in 2011), national Census data remains the most comprehensive dataset available on method of travel to work. Extracting this data for those people who work in the London Borough of Hillingdon (where the airport is located) shows that despite shift patterns making the use of public transport less attractive for some colleagues, Heathrow has a lower car mode share and higher public transport mode share than Hillingdon as a whole. However, the mode share for active travel (cycling and particularly walking) is lower, which may be reflective of limited cycle infrastructure and parking, no cycling access to Terminals 2 and 3, and shift patterns influencing propensity to drive.
Mai
n m
ode
of tr
avel
0% 10% 20% 30% 40% 50% 60% 70%
Proportion of colleagues (%)
Air
Private Car Share
Underground
Local Bus
Private Car (Single Occupancy)
Other
Work Bus / Company Transport
Bicycle
Motorcycle
Heathrow Connect
Heathrow Express
Taxi / PHV
Walking
2.4%
5.0%
6.1%
18.0%
59.8%
1.6%
1.4%
1.4%
1.3%
0.9%
0.8%
0.8%
0.5%
Mai
n m
ode
of tr
avel
0% 10% 20% 30% 40% 50% 60% 70%
Proportion of population (%)
Heathrow colleagues Hillingdon population
Taxi / Minicab
Rail
Other
Walking
Bicycle
Local Bus or Coach
Motorcycle
Underground
Car passenger
Car driver
0.8%
1.3%
1.4%
1.3%
1.7%
0.5%
6.1%
19.4%
4.0%
63.5%
0.3%
0.9%
1.5%
3.3%
3.4%
5.8%
6.5%
12.5%
0.4%
65.4%

41Heathrow | 2019 Travel Report
42Heathrow | 2019 Travel Report
7.3.15 The size of Team Heathrow is estimated to be approximately 73,000 colleagues working in and around the airport21. Therefore, assuming that monthly passes are purchased by the same colleagues each month, approximately 1.5% of colleagues are estimated to be making use of the discount scheme.
7.3.16 Graphic 7.7 shows the number of discounted Heathrow Express tickets sold from 2013 to 2019. This shows an increasing use of discounted colleague tickets, with particular increases from 2015 onwards. This increase is proportionally far greater than the increase in colleague numbers at the airport, showing either a greater propensity to travel by Heathrow Express, or a greater awareness of the discounts available. It should however be noted that the numbers below do not include any trips made by colleagues after 6pm on the Heathrow Express, for which they are not charged.
Graphic 7.7: Number of Heathrow Express colleague discount tickets sold
Table 7.9: Cycle Hub statistics
133Bikes sold
559Services undertaken
6,406Fob uses
7. Surface access usage by passengers, colleagues, and freight 7. Surface access usage by passengers, colleagues, and freight
Active travel7.3.17 As well as decreasing car use and the subsequent congestion and air quality impacts
on communities around the airport, increased levels of walking and cycling can have health and well-being benefits for our colleagues. To encourage greater use of active travel, Heathrow introduced a Cycle to Work scheme in 2011. In conjunction with this, the Heathrow Cycle Hub was also set up. The Cycle Hub is operated by Runway Cycling and is located in the Heathrow Academy on Newall Road, on the southern side of the Northern Perimeter Road. It is the first and only dedicated on-site bike shop at an airport in the UK.
7.3.18 Membership to the Heathrow Cycle Hub is free for colleagues and offers discounted bikes and cycling equipment, as well as access to a fully equipped cycle workshop offering free labour for servicing of registered bikes. It also provides secure cycle parking for members, who are able to use Heathrow shuttle buses or local buses operating within the Free Travel Zone to access other parts of the airport. There is also cycle parking
located at Terminals 4 and 5, at the Compass Centre in the north-west of the airport, and in some airport colleague car parks.
Num
ber o
f Hea
thro
w E
xpre
ss d
isco
unt t
icke
ts s
old
Year
350,000
300,000
250,000
200,000
150,000
100,000
50,000
100,80986,608
76,048
146,916
208,950
252,624
329,000
-2013 2014 2015 2016 2017 2018 2019
Graphic 7.8: Location of Heathrow Cycle Hub and cycle parking
SIPSONHARLINGTON
LONGFORD
HEATHROWPOINT WEST
WATERSIDE
STANWELL
FELTHAM
CRANFORD
HATTON
4
A315
A4
A4
A30
Colnbrook Bypass
Bath Road Bath Road
Stanw
ell M
oor R
oad
pson Road
F
Road
Hatch
Lane
High S
treet H
arlingt
on
Grea
t Sou
th W
est Ro
ad
Staines Road
Colleague commuter routes
On road
On pavement
Through parks
Cycle parking
Legend
TERMINAL 5
COMPASS CENTRE
TERMINALS 2 & 3
TERMINAL 4CARGO CENTRE
7.3.20 The monthly distribution of new Cycle Hub registrations in 2019 is shown in Graphic 7.10. As expected, there is a peak of registrations in May, which is reflective of colleagues wanting to take up cycling in the summer months when the weather is more pleasant.
7.3.19 Statistics on the number of bikes sold, services undertaken and total fob swipes used to access the bike parking facilities in 2019 is shown in Graphic 7.9.
21 2017 Heathrow Airport Employment Survey

43Heathrow | 2019 Travel Report
44Heathrow | 2019 Travel Report
Graphic 7.10: Number of cycle hub registrations per month in 2019
Num
ber o
f cyc
le h
ub re
gist
ratio
ns
Month
5
10
15
20
25
30
35
40
0
Janu
ary
May
Sept
embe
r
Febr
uary
June
Oct
ober
Mar
ch
July
Nov
embe
r
April
Augu
st
Dec
embe
r
10 1114 15
36
13
23
13
30
16
11 10
7.3.21 Through our Way2Go initiative, we are seeking to increase the use of the Cycle Hub year on year through highlighting the health benefits to colleagues of active travel, as well as the discounts available through the Cycle to Work scheme and Cycle Hub. We are helping direct colleagues towards wider information and support for cyclists, particularly as around 30,000 colleagues lived within a 40-minute cycle of the airport in 2019.
Private transport7.3.22 Whilst we encourage our colleagues to travel by public transport or active modes as far
as possible, we acknowledge that for some their home location, shift patterns or other responsibilities such as childcare make driving the only realistic option.
7.3.23 For those colleagues who choose to drive to Heathrow, passes are required to park in Heathrow car parks. The location of these car parks is shown in Graphic 6.7.
7.3.24 Parking passes can be requested and purchased by employers for their colleagues. Each employer is assigned a maximum parking quota, which is distributed across a number of on-campus car parks. There are two types of charges for parking permits: one for the perimeter car parks, and a variable higher charge for the multi-story car parks which are adjacent to the terminals.
7.3.25 One of the ways in which we can make travel to and from the airport by car more sustainable is through encouraging car sharing. The Heathrow car sharing scheme is an online matching tool, which is free to join and enables users to register their journeys on the Liftshare companion app.
7.3.26 Heathrow’s car sharing scheme is operated by Liftshare and has over 7,900 registered members; over 1,900 of which have actively participated in car sharing from over 250 companies22.
7.3.27 Commute journeys, occasional or shift journeys and one-off journeys can all be registered. The system looks for matches in the user’s area as well as matches that could be picked up en-route.
7.3.28 In 2019, 778 members registered for the car sharing scheme, 697 rides were requested and 619 lifts were offered.
7.3.29 Encouraging car sharing is an important part of Heathrow’s surface access strategy as it helps to reduce the overall number of colleague car trips generated to and from the airport, in turn aiding to reduce congestion and harmful emissions.
7.4 Freight and logistics surface travel
7.4.1 Heathrow is the UK’s largest port by value for trade, handling over £100 billion in goods per year23. This is more than the top three seaports combined. This cargo needs to be moved to and from the airport, which is done by road.
7.4.2 Graphic 7.11 shows, broadly and by category, where the majority of freight trips are generated from and where they are destined for. The freight categories are described as follows:
i. Air cargo refers to vehicle trips associated with goods that arrive at or depart from Heathrow by air. Cargo moved by air tends to be high value or time critical and smaller in size than that moved by road, rail or ship. It could include items such as medicines or other pharmaceuticals, jewellery, electronic equipment and mail.
ii. Airline servicing covers all vehicle movements in and out of the airport that are associated with in-flight catering. There are seven catering companies located around the airport that hold contracts with airlines flying from Heathrow.
iii. Airport servicing refers to vehicle trips related to Heathrow's continuous construction, maintenance and improvement projects as well as fuel rigs and other miscellaneous trip categories not included elsewhere. A significant proportion of these movements are routed via the Colnbrook Logistics Centre, where deliveries are security screened and consolidated (moved from multiple small loads on separate vehicles to a single full load).
iv. Retail trips are those associated with the retail units inside the passenger terminals, the majority of which are also consolidated at the Heathrow Retail Consolidation Centre at Stockley Park. The exceptions to this are certain food, drink and newspaper deliveries which are more time critical and are delivered directly to terminals.
v. Waste is removed from the airport and processed by Grundon in Colnbrook, who are Heathrow's sole partner for waste processing.
7. Surface access usage by passengers, colleagues, and freight 7. Surface access usage by passengers, colleagues, and freight
22 Liftshare website July 2020 https://liftshare.com/uk/community/heathrow-airport 23 HMRC UKTradeInfo, 2015 – 2017 average totals

45Heathrow | 2019 Travel Report
46Heathrow | 2019 Travel Report
7. Surface access usage by passengers, colleagues, and freight 7. Surface access usage by passengers, colleagues, and freight
Graphic 7.12: Euro class breakdown of average daily freight vehicles
24 The size of the circles are not representative of demand, but rather indicate where cargo is the primary activity at each specified location. 25 June 2018 ANPR and interview surveys26 Euro standards differ between cars / light commercial vehicles (Euro 1-6) and heavy commercial vehicles (Euro I-VI). For full details of the LEZ, see https://tfl.gov.uk/modes/driving/low-
emission-zone (link current as of July 2020)27 DfT dataset VEH0207 showed the average age of private cars in the UK was 8.3 years in 2019; the equivalent figure for vehicles over 3.5 tonnes (VEH0507) is 7.4 years
50% 60%40%30%20%10%0%
Euro
cla
ss
6
5
4
0 or unknown
3
2
1
Proportion (%) of average daily airport-related vehicle trips
47.7%
34.3%
9.2%
8.4%
0.2%
<0.1%
<0.1%
Graphic 7.11: Areas of freight activity adjacent to Heathrow24
Cargo Centre
Aircraft Stands
Aircraft StandsCTAT5
T4
Air cargo
Aircraft servicing (catering)
Airport servicing
Retail
Waste
Cargo Cresent
Heathrow Airport
7.4.3 Freight vehicle activity takes place at the airport 24 hours a day and for 365 days a year, with vehicles accessing the airport from all directions. Although freight vehicle trips represent only circa 6% of all Heathrow-related vehicle trips, they are estimated to generate around 36% of vehicle-related emissions. As such, understanding how freight is moving in and out of the airport is vital to ensure we can manage our impacts on local air quality and carbon emissions.
7.4.4 While some of this freight activity is associated directly with airport operations, for example through catering deliveries for flights or the removal of waste, the majority of freight trips are associated with the movement of cargo in and out of the airport.
7.4.5 Over two-thirds of cargo trips originate from within a five-mile radius of the airport. The remaining third travels from elsewhere within the UK and Europe25. The majority of cargo operations at the airport take place in the ‘cargo crescent’ along the southern edge of the airport, where a large proportion of the air freight operators are located.
7.4.6 Based on the ANPR survey conducted on the airport boundary (see Section 5.4), an average of 16,000 freight vehicle trips were made per day in 2019 (assuming that all LGV, OGV, HGV and Plant vehicles were carrying freight to and from Heathrow). Graphic 7.12 presents the Euro class breakdown of airport-related freight vehicle trips for 2019.
7.4.7 It should be noted that as Heathrow lies within the boundary of the Greater London Authority (GLA), commercial vehicles should comply with the TfL Low Emission Zone (LEZ). The LEZ was introduced in 2008 and broadly, requires larger vans and minibuses to meet the Euro 3 standard and larger lorries, buses and coaches to meet the Euro IV standard26. In 2021 these standards will be strengthened to require Euro VI for larger vehicles.
7.4.8 This data shows that the LEZ standards are having an effect, with at least 82% of vehicles complying with the latest emissions standards (Euro 5-6). This may also be a factor of the commercial vehicle fleet generally being newer than the private car fleet, and therefore more likely to meet newer emissions standards27.
7.4.9 The breakdown of average number of airport-related freight trips per day by vehicle type is shown in Graphic 7.13. This shows that just over half of trips made by commercial vehicles to and from the airport were made by light vans. There are also a significant number of plant movements. Plant vehicles are defined as HGVs that are not intended to carry loads and include vehicles such as mobile cranes and recovery vehicles.
Graphic 7.13: Vehicle type breakdown of average daily freight vehicle trips
50% 60%40%30%20%10%0%
Euro
Cla
ss
LGV <3.5T
OGV1
Plant
HGV 4 Axle
Proportion (%) of average daily airport-related vehicle trips
52.5%
26.9%
17.2%
3.3%

47Heathrow | 2019 Travel Report
48Heathrow | 2019 Travel Report
8. Improvements to surface access in 2019
8.1 Improvements to public transport
8.1.1 The provision of public transport to the airport has always been a vital part of what we offer to our passengers and colleagues. We have invested over £1 billion in rail infrastructure, including the rail link to the Great Western Main Line used by Heathrow Express and TfL Rail. We also provide £2.5 million of funding annually to encourage public transport use via the airport free travel zone (discussed in Section 2.2). We provide support for bus services and make contributions to local sustainable transport schemes.
8.1.2 In 2019, the main change to rail services related to ticketing on the Heathrow Express. In February 2019 Heathrow Express began accepting contactless payment, including Oyster, on services. We also introduced a system of dynamic pricing. This means we can adjust Heathrow Express fares on a regular basis based on demand, giving passengers more options, incentivising them to change their behaviours and travel choices. This means that fares can be lowered to encourage use at less busy times. In addition, we have continued to promote existing offers including duo and group save tickets, children under 15 travelling free with an adult, and the 75% discount on fares for colleagues.
8.1.3 A number of new bus and coach services were also introduced during 2019. This includes:
1. In July 2019, Heathrow launched a new RailAir RA2 service from Guildford to Terminal 5 and the Heathrow Central Bus Station. In common with other RailAir services, this allows a single ticket to be purchased to cover travel on the RailAir service and by rail, meaning that passengers and colleagues can travel to the airport from destinations such as Portsmouth and Petersfield on a single ticket. The service runs seven days a week, from early until late, using vehicles with free Wifi, USB power sockets and air-conditioning.
2. In August 2019, Heathrow worked with Carlone Coaches to make improvements to the 442 service connecting Staines, Ashford Hospital, Stanwell and Stanwell Moor to the airport. This included the provision of later services and a new service on Sundays and public holidays. At the same time, a new express X442 service was introduced linking Staines railway station to Terminal 5, operating up to every 30 minutes from Monday to Saturday and taking as little as 12 minutes. The Free Travel Zone was also extended to Stanwell Moor on an experimental basis.
3. In November 2019 we collaborated with Courtney Buses to deliver service improvements to Route 10, linking Dedworth, Windsor, Datchet and Wraysbury to the airport. Daytime frequencies were doubled, and the service now starts earlier throughout the week.
4. At the same time, in partnership with Slough Borough Council and Thames Valley Buses, we also introduced a new Route 459 linking Iver, Langley and Colnbrook to Terminal 5. Initially this service acted as a test bed for electric buses, and was free of charge to passengers.
5. A number of changes to services were made at the end of 2019. The first of these was introduced by TfL as part of a wider review of bus operations in west London. This review resulted in the introduction of two new routes, the X140 express service operating between Harrow Bus Station and the Central Bus Station, and the 278 route between Ruislip and the Central Bus Station.
6. Working with Carousel Buses, we also introduced an extension of the existing Chiltern Hundreds Route 102 from Uxbridge to Heathrow. This provides a bus link to the airport from High Wycombe, Beaconsfield and Gerrards Cross, operating seven days a week. It provides a link from Chiltern rail services at High Wycombe and Beaconsfield stations.
7. Finally, improvements were made to coach services to and from the north-west, with new coach links between the airport, Southport and Warrington. From December we also began increasing the frequency of coach services between the airport and Liverpool, from one service per day to seven per day.28
8.2 Improvements to road operations
8.2.1 In April 2019, in response to concerns raised by local residents, Heathrow installed an ANPR camera system to enforce the 30mph and 40mph speed limits on the Northern Perimeter Road, Eastern Perimeter Road, Southern Perimeter Road and Western Perimeter Road. The installation of these cameras reduced the number of vehicles recorded as travelling above the limit by around 50%.
8.2.2 It is anticipated that this initiative will also result in drivers having more time to recognise hazards, providing greater opportunities for road users to avoid collisions, or minimise the risks of drivers losing vehicle control29. The Metropolitan Police has reported a noticeable positive change in driving behaviours at Heathrow.
8. IMPROVEMENTS TO SURFACE ACCESS IN 2019
28 At the time of writing, the Southport and Warrington connection had been suspended due to COVID-19. Liverpool coach services had also been reduced to one per day. 29 WHO, 2008

49Heathrow | 2019 Travel Report
50Heathrow | 2019 Travel Report
9. Conclusions and closing remarks
9. CONCLUSIONS AND CLOSING REMARKS
9.1.1 The 2019 Heathrow Travel Report is the first of its kind and provides information on the demand for surface access at Heathrow in 2019, based on the best available data related to air and surface transport to and from Heathrow.
9.1.2 This report is the first of its kind and unique in its consolidation of Heathrow-related insight using publicly available and Heathrow-owned datasets. In future, this report will be used as the baseline against which to compare trends and changes in travel behaviour over time.
9.1.3 The data describing air traffic movements, passenger and freight volumes indicate that Heathrow is operating at near capacity for flights, while maintaining successful passenger and freight operations.
9.1.4 If Heathrow is to maintain its position as an important aviation hub for Europe, connecting people and goods across a variety of industries, focus must be placed on improving surface access links to the airport as well as investigating sustainable options for possible expansion. To this end, we have identified three key metrics against which to assess our surface access performance.
9.1.5 The first of these is passenger public transport mode share. In 2019, this was 39.3%. This has stayed broadly consistent since 2013. However, in the context of rapidly increasing numbers of PHVs in London, and the increased attractiveness of app-based ride-hailing operators, this is considered to be a positive achievement. We will be seeking to build on this through our work to maximise the impact of the Elizabeth line, which will provide a direct public transport link from the airport to the City, West End and Canary Wharf.
9.1.6 The second metric is the number of average daily colleague car trips. In 2018, this was 45,157. This is a reduction in the number of car trips made by colleagues since 2013, despite increased colleague numbers. In 2019 we launched our ‘Way2Go’ colleague travel initiative and our ongoing monitoring of colleague travel will provide valuable intelligence that we can use to determine the effectiveness of different interventions, allowing us to tailor our approach in future. The ongoing COVID-19 pandemic may also result in changes to colleague travel behaviour in future, with London generally seeing increased use of active travel and a greater amount of agile working.
9.1.7 The final metric is the average daily number of landside airport-related vehicle trips. In 2019 this has been estimated as 192,596. From more detailed interrogation of this data we believe that our data shows a higher proportion of taxi and PHV trips being made in and out of Heathrow in comparison with the national average. It also appears to show that the London LEZ is working, with a high proportion of commercial vehicle trips being made by lower emissions vehicles. As the LEZ becomes more stringent in 2021, we expect to see further shift towards low emissions vehicles in future.
9.1.8 As outlined in the introduction, we will not publish a Travel Report for 2020 due to changes in airport operations caused by the COVID-19 pandemic. However, we do plan to publish subsequent reports periodically at an appropriate point in the future.
9.1.9 Future travel reports can be used to judge the effectiveness of measures we have introduced in 2019, including contactless ticketing on Heathrow Express, additional bus and coach services, Way2Go and speed enforcement on airport roads. They may also provide information on the early usage of the Elizabeth line, which as an airport we will be preparing for over the next year.
9.1.10 For more information on the data contained in this report or to provide feedback, please contact [email protected].
8. Conclusions and closing remarks
This report is the first of its kind and unique in its consolidation of Heathrow-
related insight using publicly available and Heathrow-owned datasets. In future, this
report will be used as the baseline against which to compare trends and changes in
travel behaviour over time.

51Heathrow | 2019 Travel Report
© Heathrow Airport Limited 2020