Airport Runway Location and Orientation
87
Airport Runway Location and Orientation Dr. Antonio Trani with contributions by Julio Roa and Osama Alsalous Department of Civil and Environmental Engineering Virginia Tech
-
Upload
khangminh22 -
Category
Documents
-
view
0 -
download
0
Transcript of Airport Runway Location and Orientation
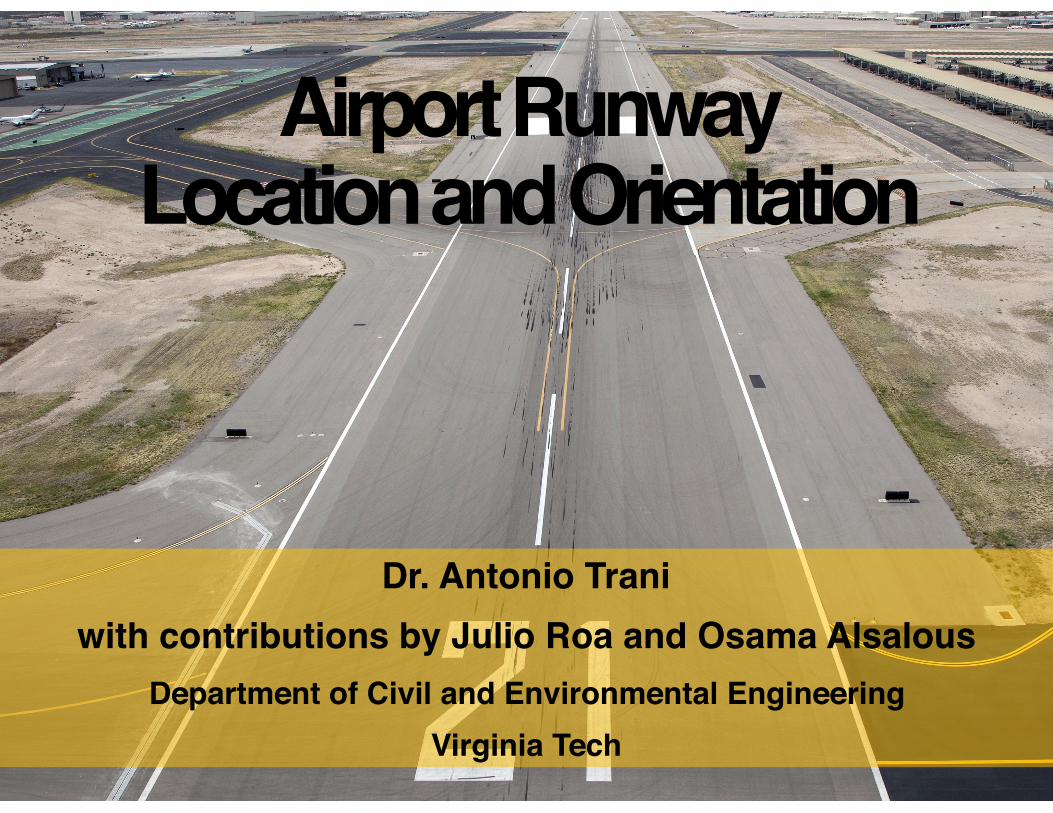
Airport Runway Location and Orientation
Dr. Antonio Traniwith contributions by Julio Roa and Osama Alsalous
Department of Civil and Environmental EngineeringVirginia Tech
Air Transportation Systems Laboratory 2
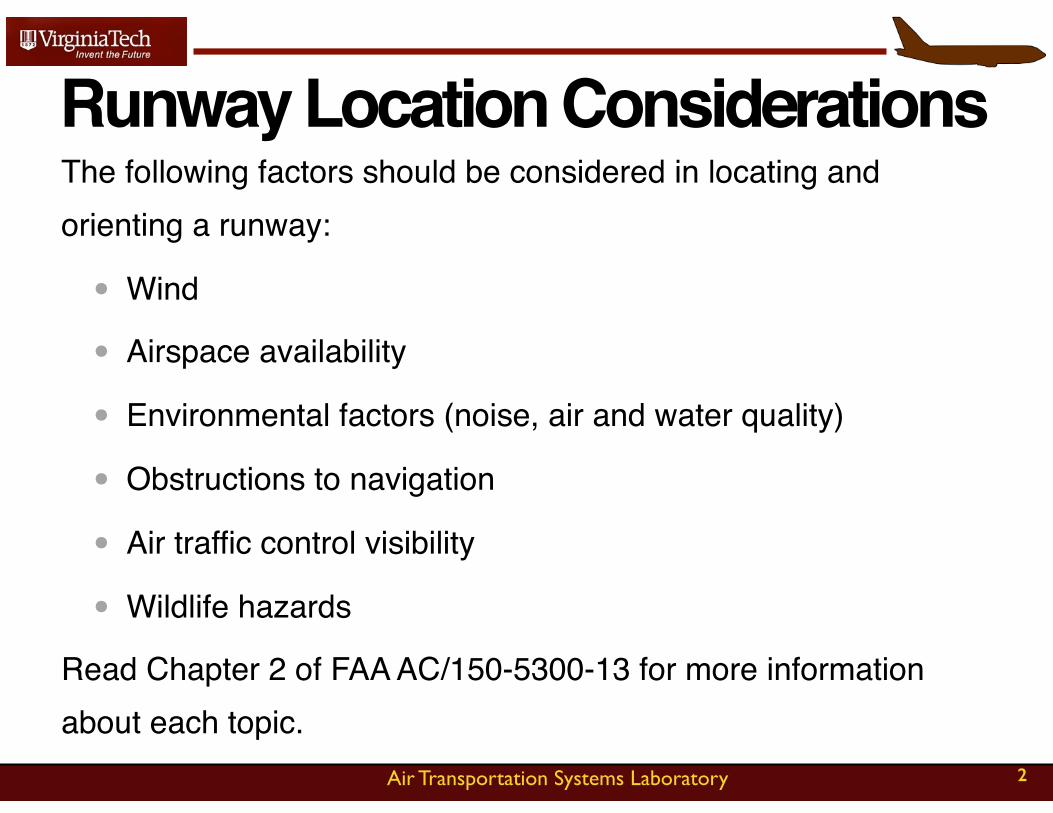
The following factors should be considered in locating and orienting a runway:
• Wind
• Airspace availability
• Environmental factors (noise, air and water quality)
• Obstructions to navigation
• Air traffic control visibility
• Wildlife hazards
Read Chapter 2 of FAA AC/150-5300-13 for more information about each topic.
Runway Location Considerations
Air Transportation Systems Laboratory 3
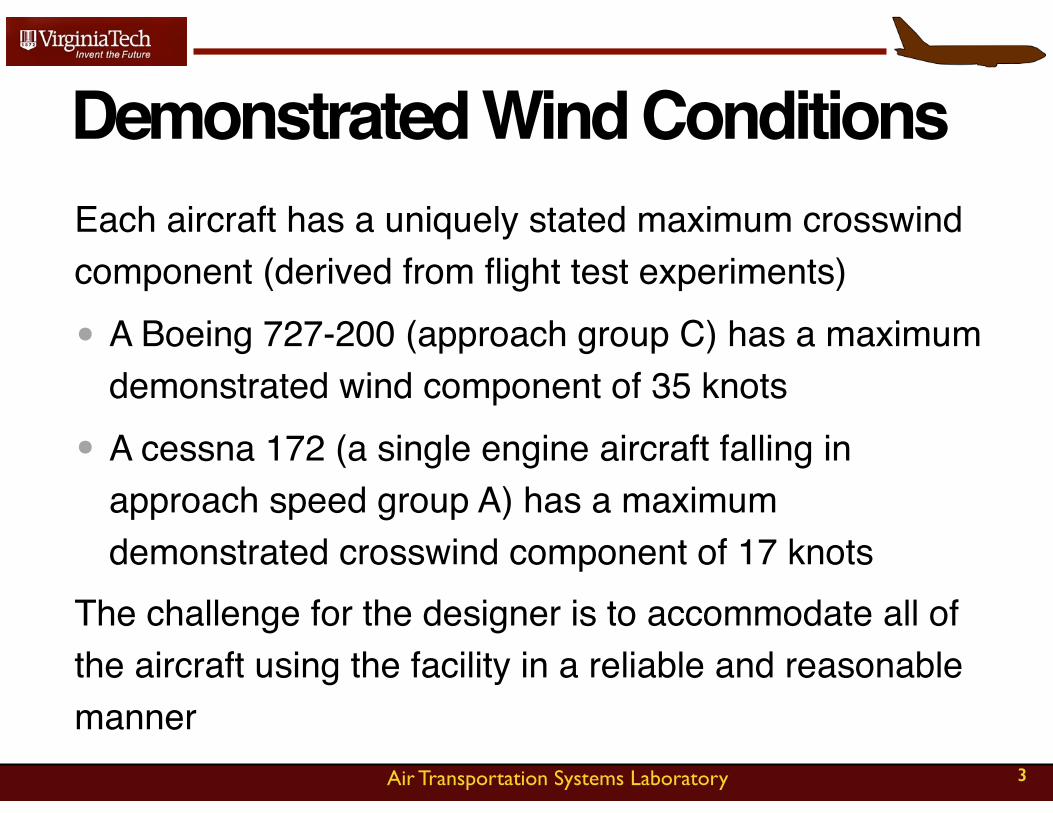
Each aircraft has a uniquely stated maximum crosswind component (derived from flight test experiments)
• A Boeing 727-200 (approach group C) has a maximum demonstrated wind component of 35 knots
• A cessna 172 (a single engine aircraft falling in approach speed group A) has a maximum demonstrated crosswind component of 17 knots
The challenge for the designer is to accommodate all of the aircraft using the facility in a reliable and reasonable manner
Demonstrated Wind Conditions
Air Transportation Systems Laboratory 4
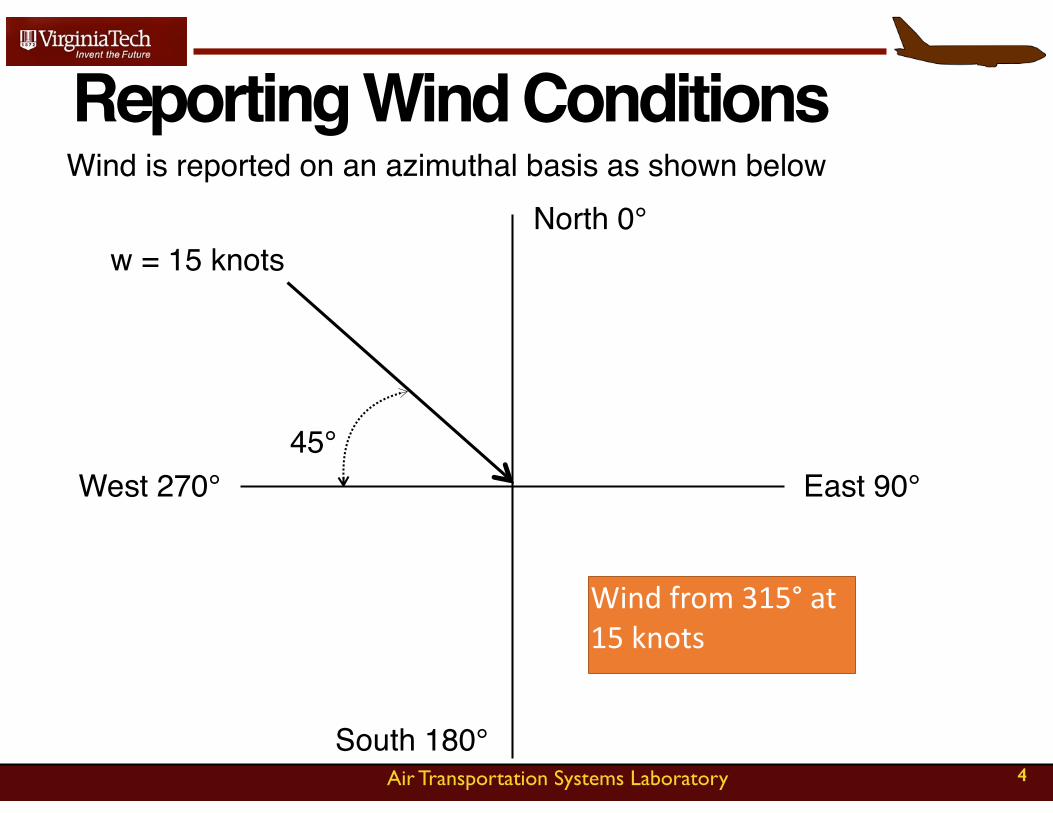
Wind is reported on an azimuthal basis as shown belowReporting Wind Conditions
w = 15 knots
45°West 270°
North 0°
East 90°
South 180°
Windfrom315°at15knots
Air Transportation Systems Laboratory 5
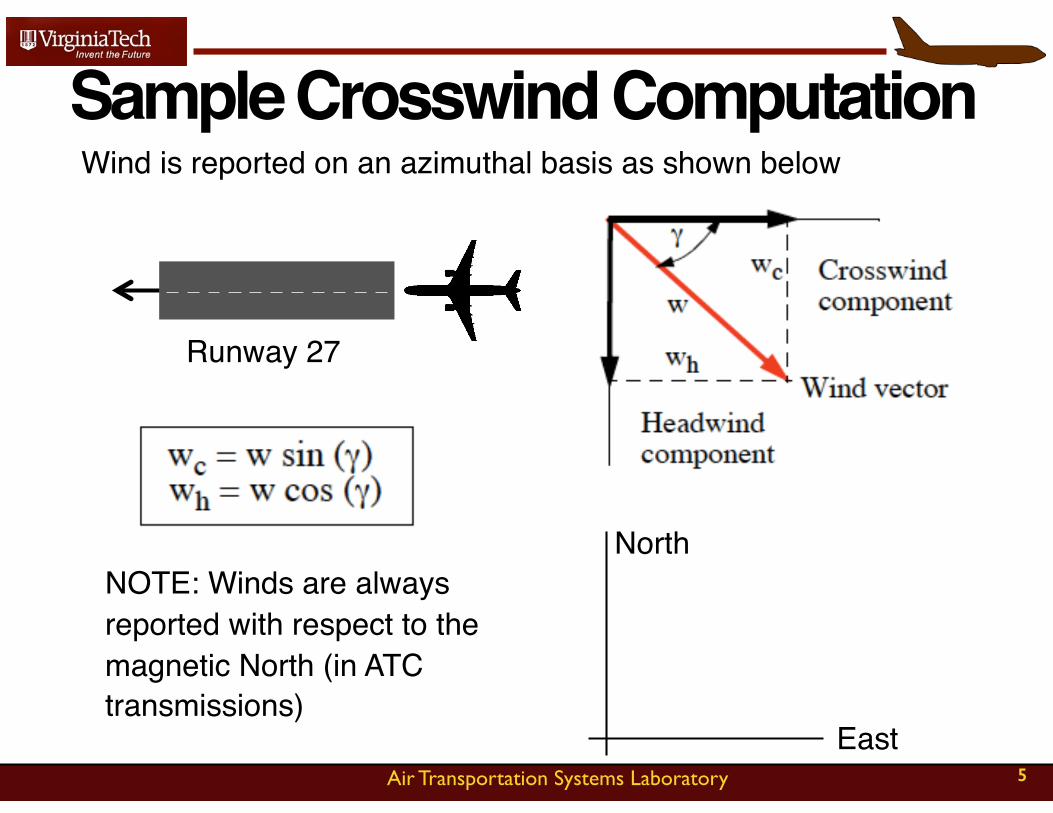
Wind is reported on an azimuthal basis as shown belowSample Crosswind Computation
North
East
Runway 27
NOTE: Winds are always reported with respect to the magnetic North (in ATC transmissions)
Air Transportation Systems Laboratory 6
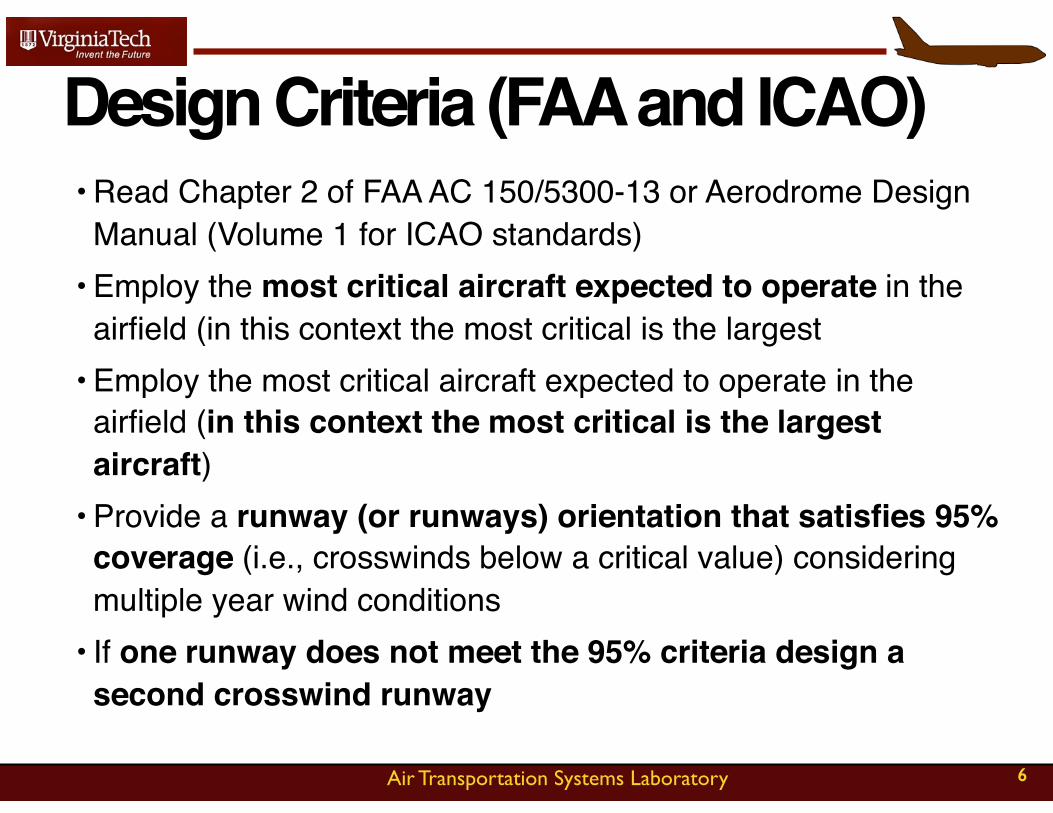
• Read Chapter 2 of FAA AC 150/5300-13 or Aerodrome Design Manual (Volume 1 for ICAO standards)
• Employ the most critical aircraft expected to operate in the airfield (in this context the most critical is the largest
• Employ the most critical aircraft expected to operate in the airfield (in this context the most critical is the largest aircraft)
• Provide a runway (or runways) orientation that satisfies 95% coverage (i.e., crosswinds below a critical value) considering multiple year wind conditions
• If one runway does not meet the 95% criteria design a second crosswind runway
Design Criteria (FAA and ICAO)
Air Transportation Systems Laboratory 7
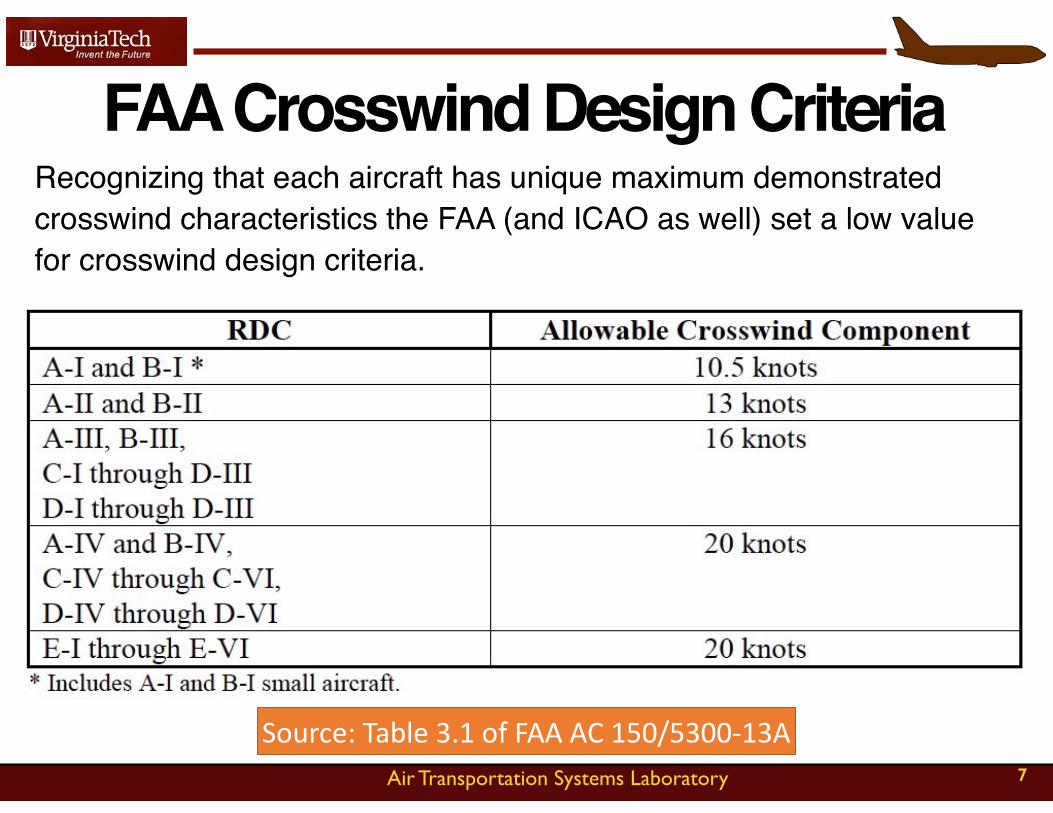
Recognizing that each aircraft has unique maximum demonstrated crosswind characteristics the FAA (and ICAO as well) set a low value for crosswind design criteria.
FAA Crosswind Design Criteria
Source:Table3.1ofFAAAC150/5300-13A
Air Transportation Systems Laboratory 8
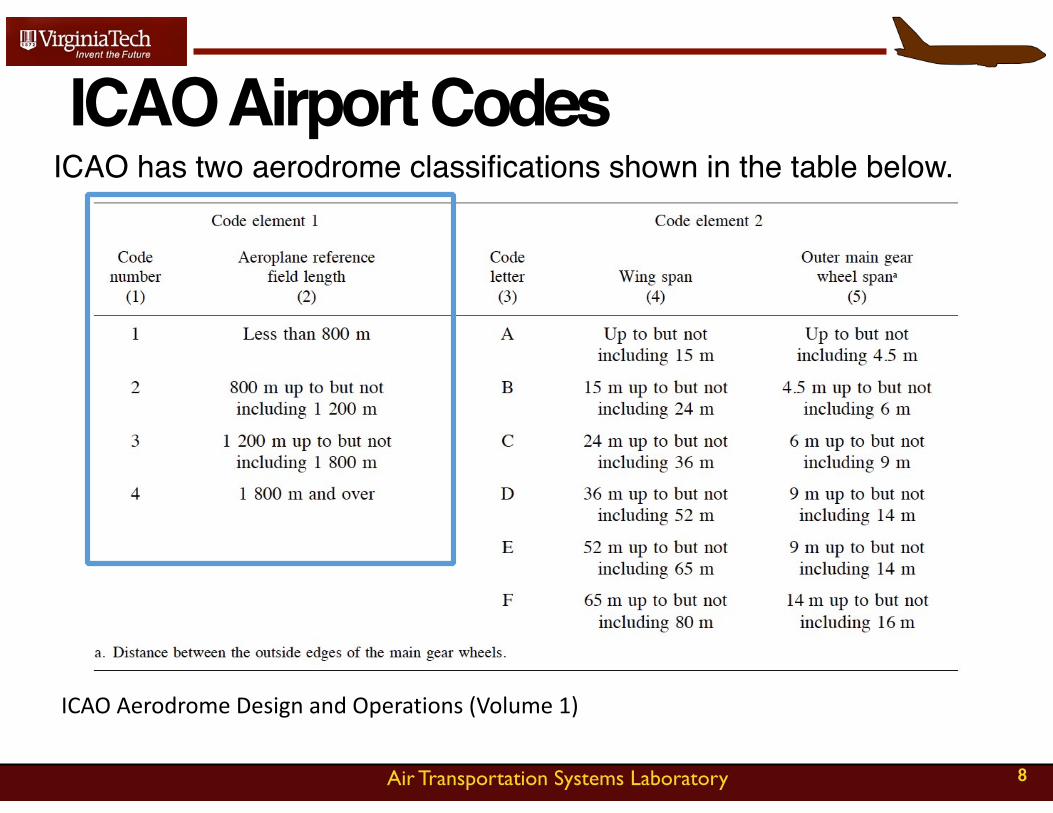
ICAO has two aerodrome classifications shown in the table below.ICAO Airport Codes
ICAOAerodromeDesignandOperations(Volume1)
Air Transportation Systems Laboratory 9
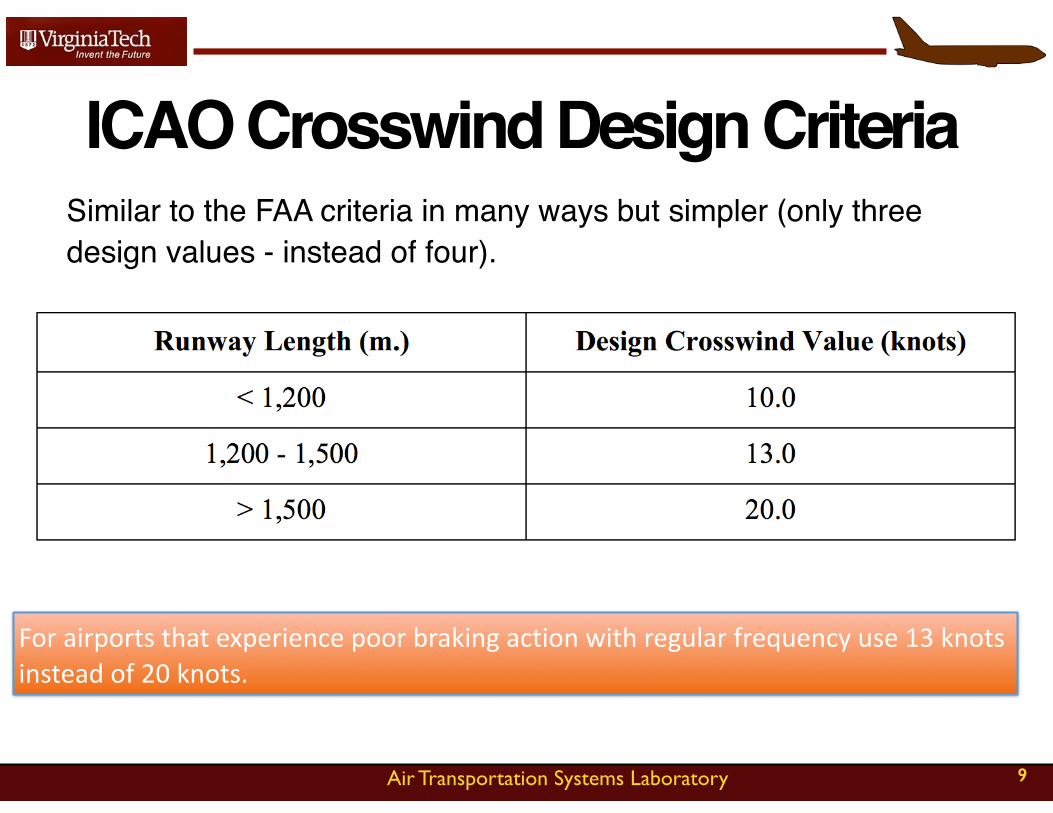
Similar to the FAA criteria in many ways but simpler (only three design values - instead of four).
ICAO Crosswind Design Criteria
Forairportsthatexperiencepoorbrakingactionwithregularfrequencyuse13knotsinsteadof20knots.
Air Transportation Systems Laboratory 10
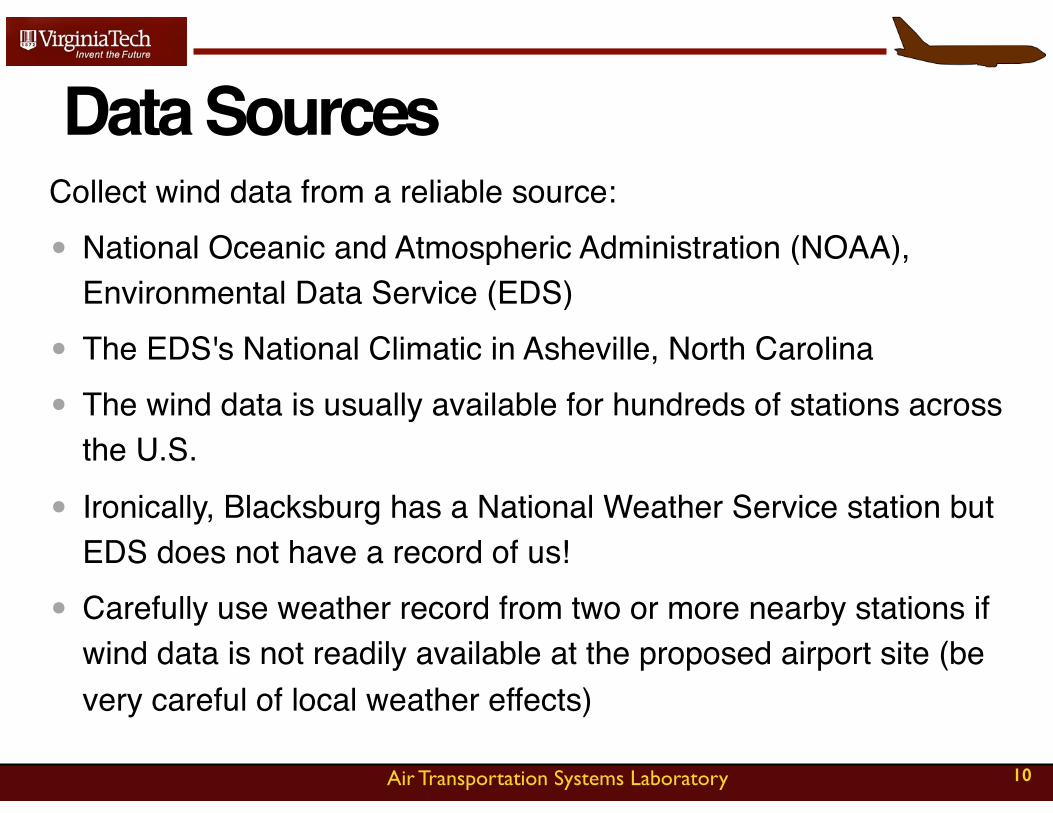
Collect wind data from a reliable source:
• National Oceanic and Atmospheric Administration (NOAA), Environmental Data Service (EDS)
• The EDS's National Climatic in Asheville, North Carolina
• The wind data is usually available for hundreds of stations across the U.S.
• Ironically, Blacksburg has a National Weather Service station but EDS does not have a record of us!
• Carefully use weather record from two or more nearby stations if wind data is not readily available at the proposed airport site (be very careful of local weather effects)
Data Sources
Air Transportation Systems Laboratory 11
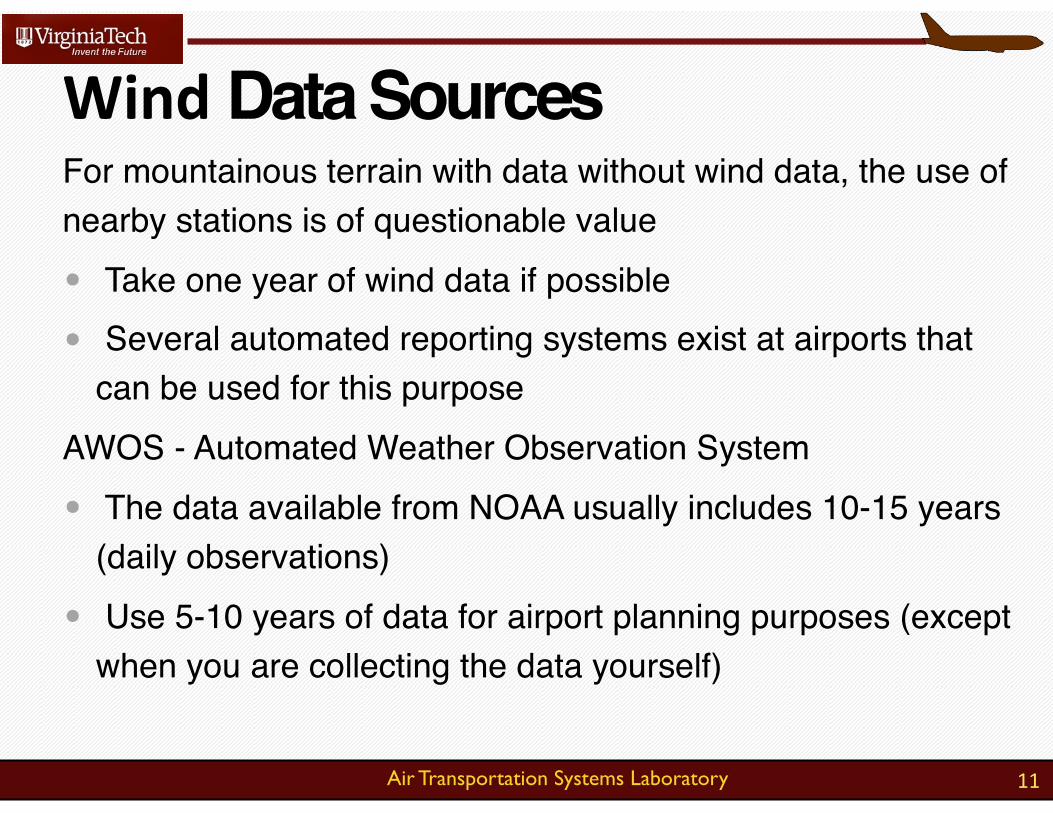
For mountainous terrain with data without wind data, the use of nearby stations is of questionable value
• Take one year of wind data if possible
• Several automated reporting systems exist at airports that can be used for this purpose
AWOS - Automated Weather Observation System
• The data available from NOAA usually includes 10-15 years (daily observations)
• Use 5-10 years of data for airport planning purposes (except when you are collecting the data yourself)
WindData Sources
Air Transportation Systems Laboratory 12
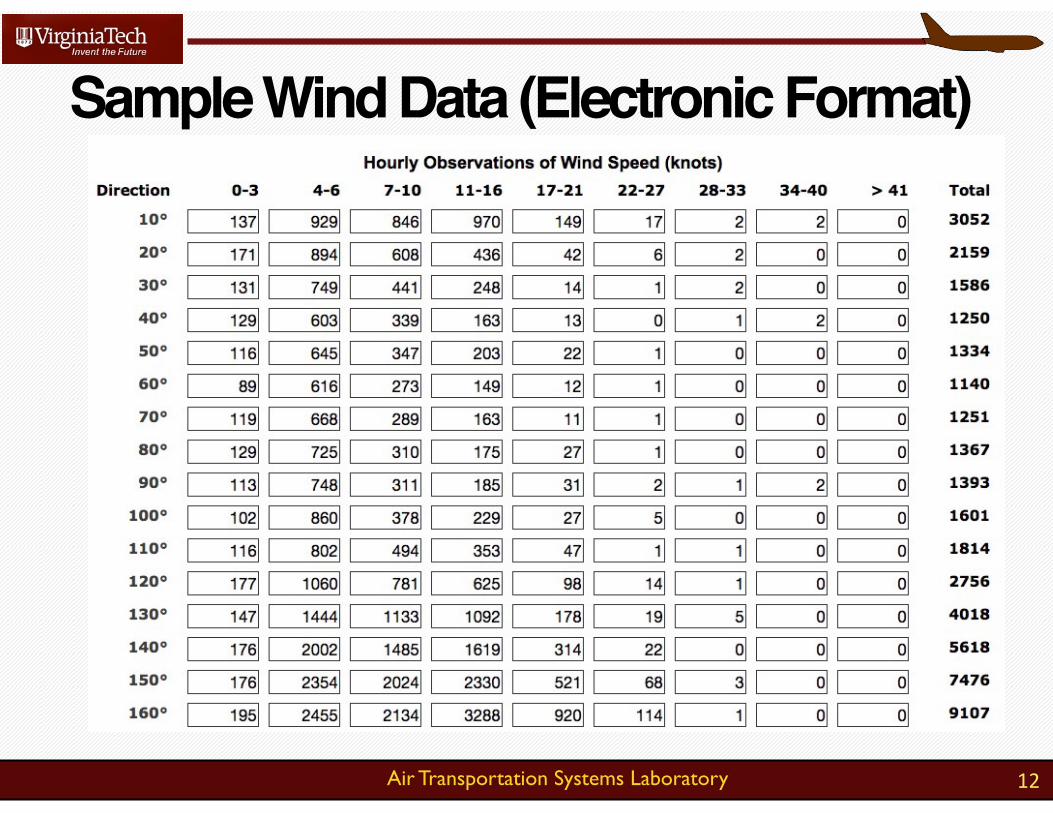
Sample Wind Data (Electronic Format)
Air Transportation Systems Laboratory
Issue About Wind Data• Unless noted, wind directions are always
reported with respect to the true North (0/360 degrees
• 0/360 true North
• 090 deg. is East
• 180 deg. is South
• and 360 deg. is North again
• When no specifications is given to you, assume True North directions
13
Air Transportation Systems Laboratory 14
• A clever way to portray all wind data in a graphical template
• Used to estimate the percent of time wind coverage satisfies a threshold crosswind value
• The wind rose is just a graphical way to decompose wind vector data
• The wind rose is populated with percentages derived from wind observations
• Wind rose is part of the data provided in the Airport Layout Plan (ALP)
Wind Rose Analysis
Air Transportation Systems Laboratory 15
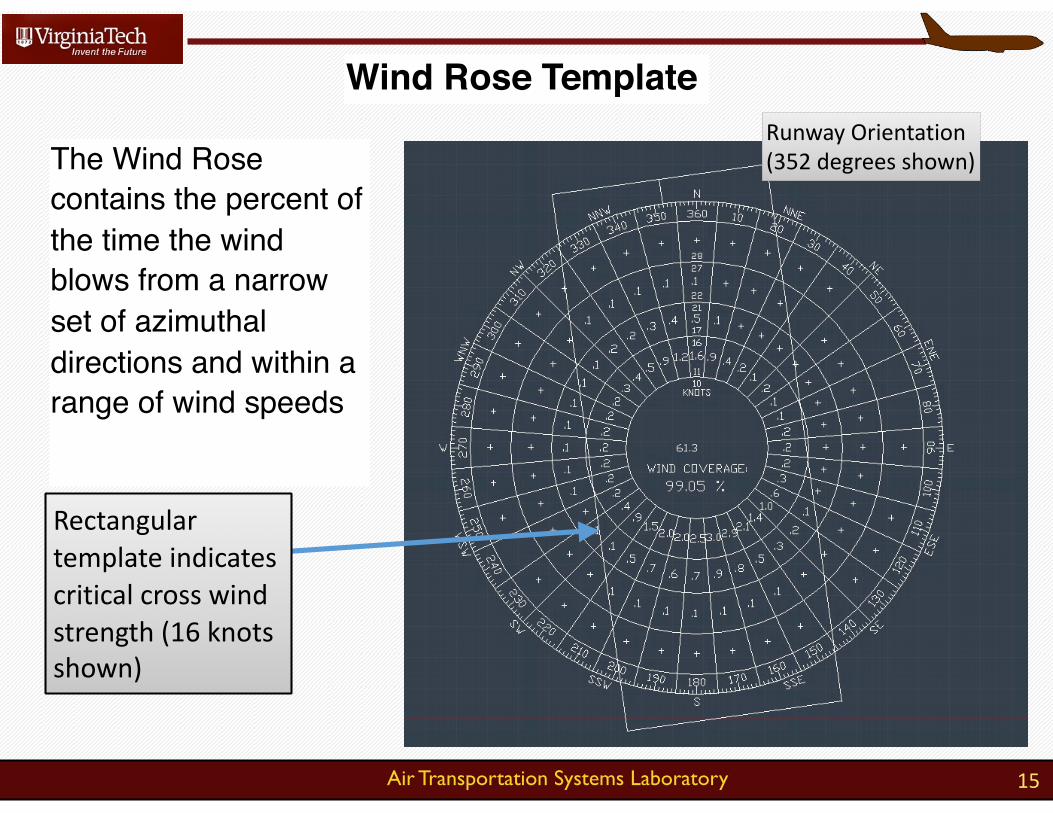
Wind Rose Template
The Wind Rose contains the percent of the time the wind blows from a narrow set of azimuthal directions and within a range of wind speeds
Rectangulartemplateindicatescriticalcrosswindstrength(16knotsshown)
RunwayOrientation(352degreesshown)
Air Transportation Systems Laboratory 16
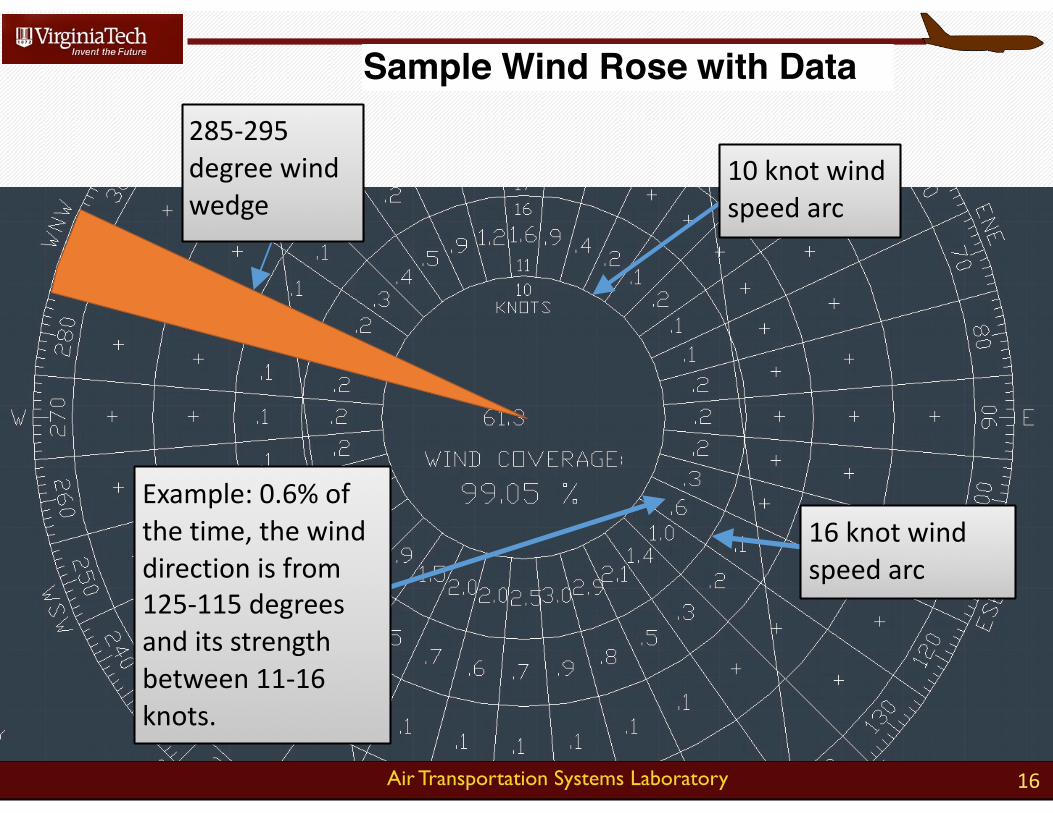
Sample Wind Rose with Data
Example:0.6%ofthetime,thewinddirectionisfrom125-115degreesanditsstrengthbetween11-16knots.
10knotwindspeedarc
16knotwindspeedarc
285-295degreewindwedge
Air Transportation Systems Laboratory 17
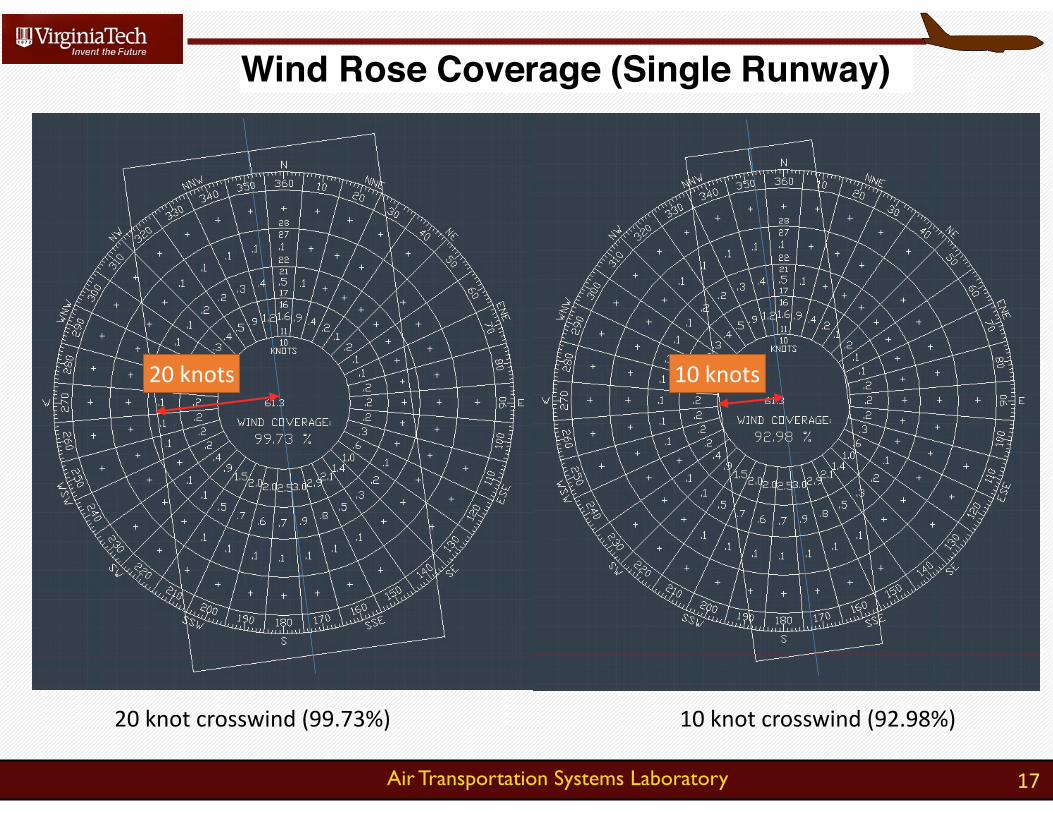
Wind Rose Coverage (Single Runway)
20knotcrosswind(99.73%) 10knotcrosswind(92.98%)
20knots 10knots
Air Transportation Systems Laboratory
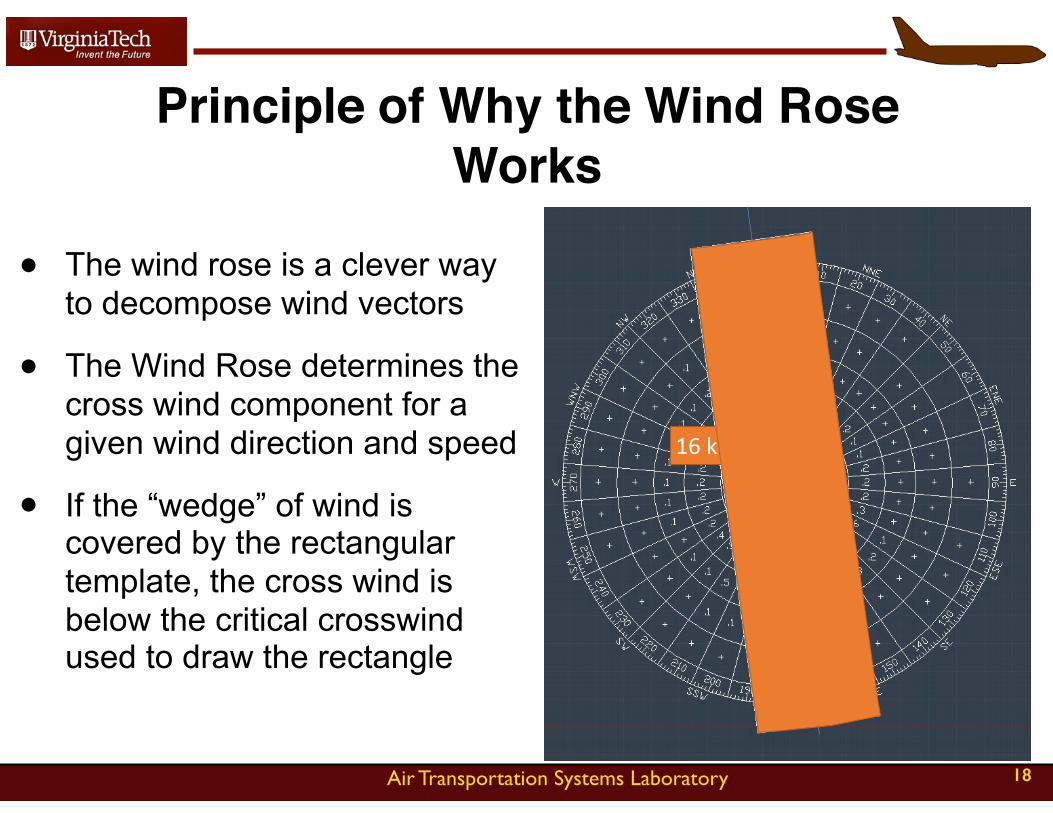
Principle of Why the Wind Rose Works
• The wind rose is a clever way to decompose wind vectors
• The Wind Rose determines the cross wind component for a given wind direction and speed
• If the “wedge” of wind is covered by the rectangular template, the cross wind is below the critical crosswind used to draw the rectangle
18
16knots
Air Transportation Systems Laboratory
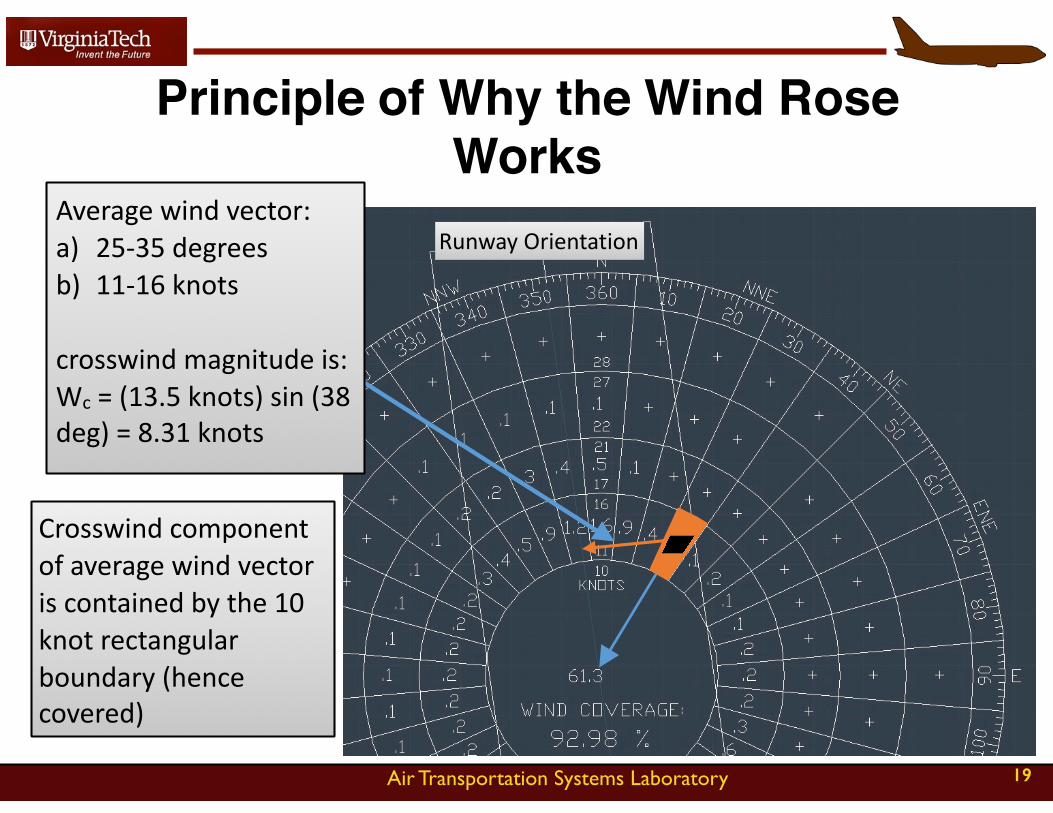
Principle of Why the Wind Rose Works
19
RunwayOrientation
Crosswindcomponentofaveragewindvectoriscontainedbythe10knotrectangularboundary(hencecovered)
Averagewindvector:a) 25-35degreesb) 11-16knots
crosswindmagnitudeis:Wc=(13.5knots)sin(38deg)=8.31knots
Air Transportation Systems Laboratory 20
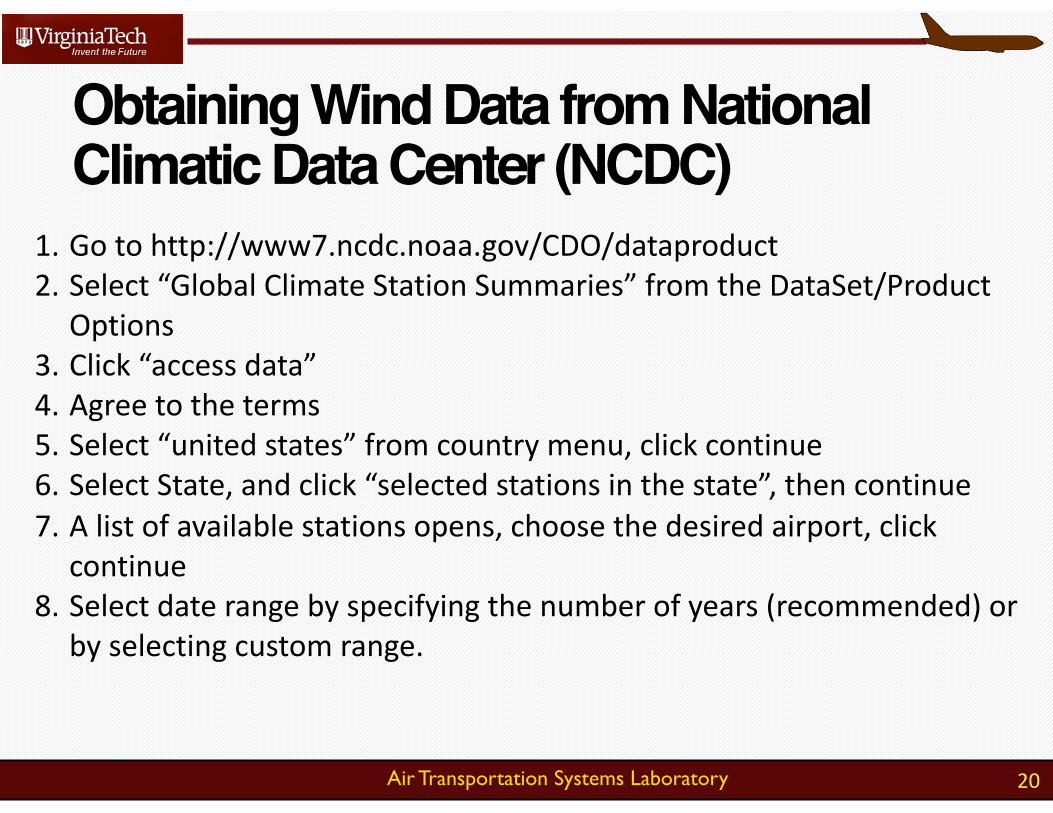
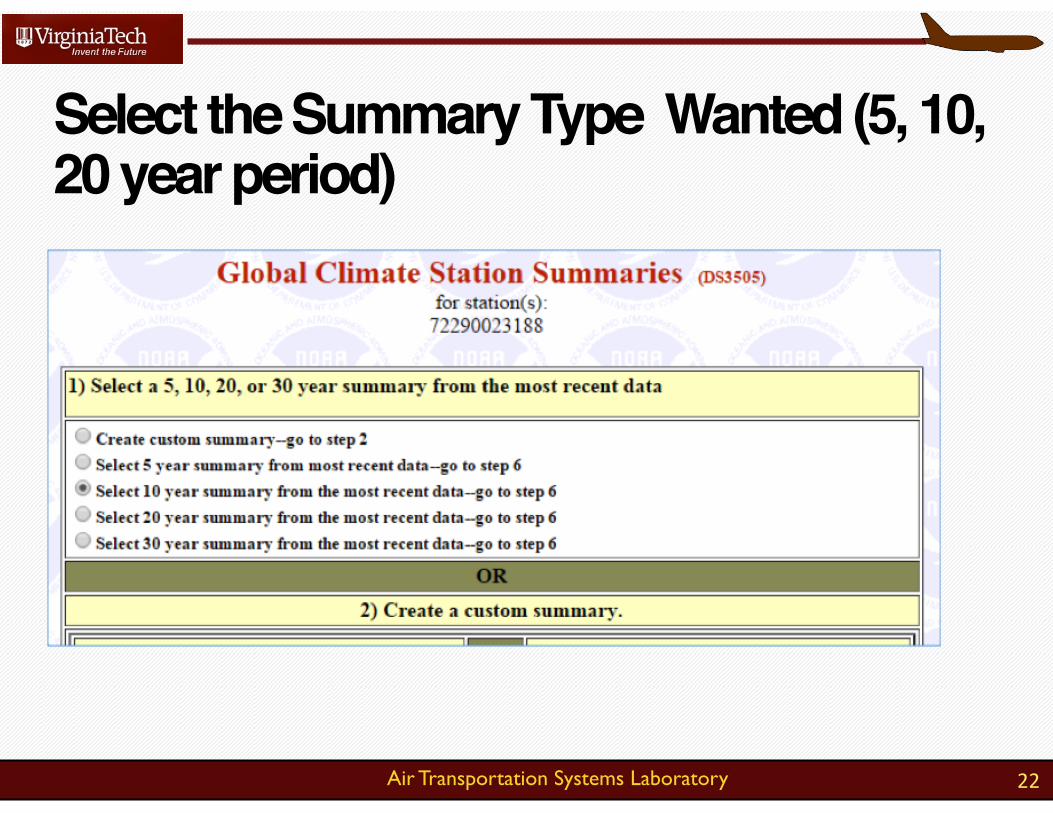
Obtaining Wind Data from National Climatic Data Center (NCDC)
1. Gotohttp://www7.ncdc.noaa.gov/CDO/dataproduct2. Select“GlobalClimateStationSummaries”fromtheDataSet/Product
Options3. Click“accessdata”4. Agreetotheterms5. Select“unitedstates”fromcountrymenu,clickcontinue6. SelectState,andclick“selectedstationsinthestate”,thencontinue7. Alistofavailablestationsopens,choosethedesiredairport,click
continue8. Selectdaterangebyspecifyingthenumberofyears(recommended)or
byselectingcustomrange.
Air Transportation Systems Laboratory 21
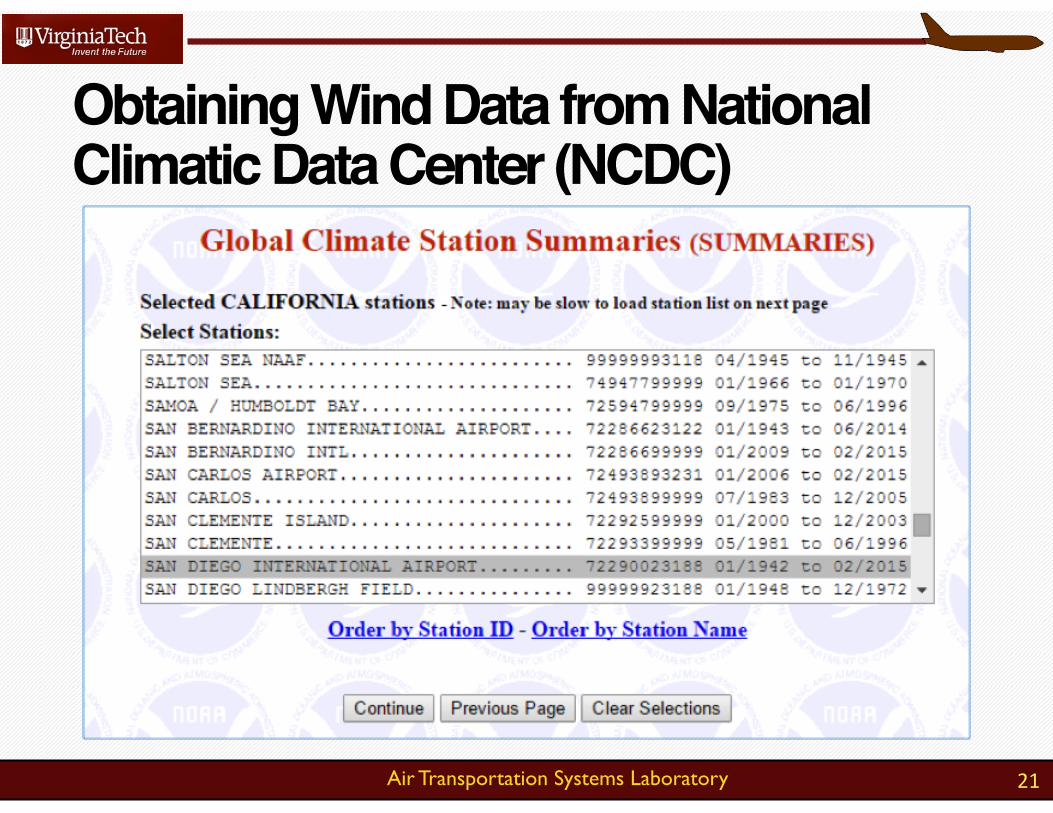
Obtaining Wind Data from National Climatic Data Center (NCDC)
Air Transportation Systems Laboratory 22
Select the Summary Type Wanted (5, 10, 20 year period)
Air Transportation Systems Laboratory 23
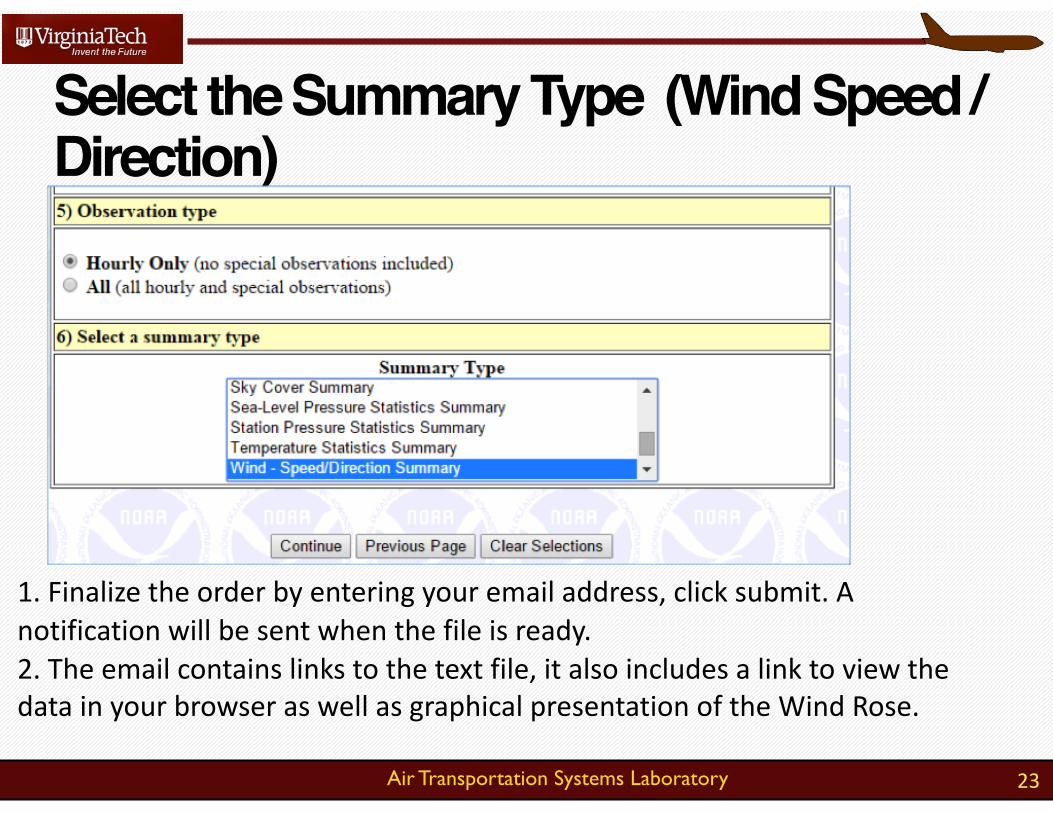
Select the Summary Type (Wind Speed / Direction)
1.Finalizetheorderbyenteringyouremailaddress,clicksubmit.Anotificationwillbesentwhenthefileisready.2.Theemailcontainslinkstothetextfile,italsoincludesalinktoviewthedatainyourbrowseraswellasgraphicalpresentationoftheWindRose.
Air Transportation Systems Laboratory 24
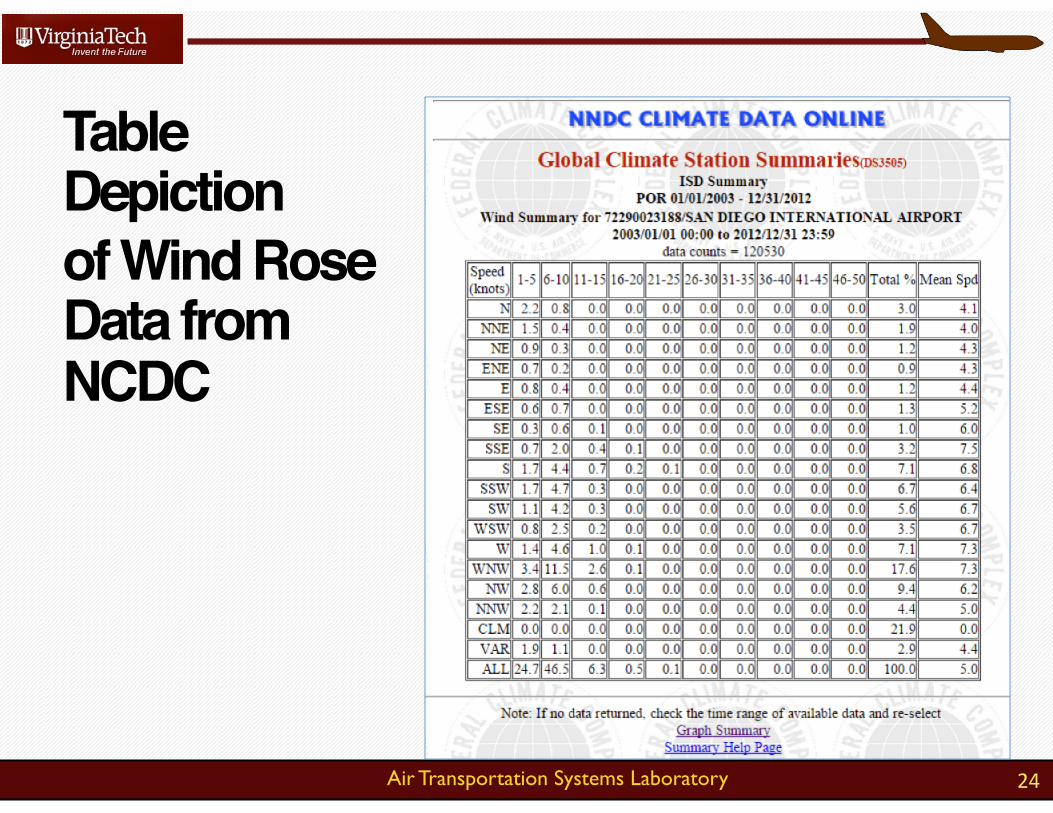
Table Depictionof Wind Rose Data from NCDC
Virginia Tech - Air Transportation Systems Laboratory
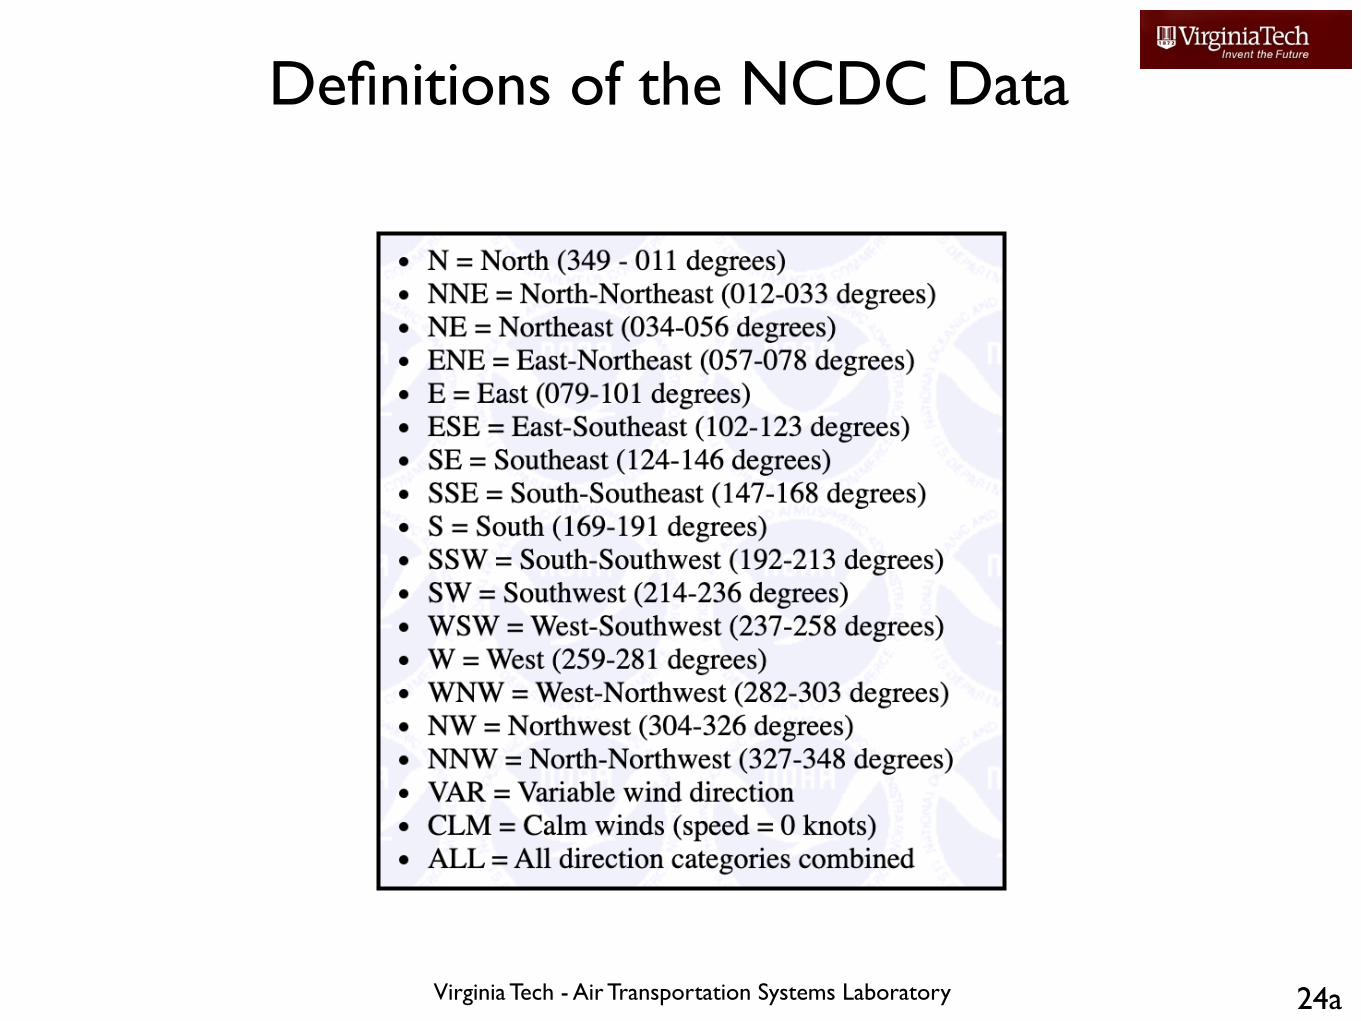
Definitions of the NCDC Data
24a
Air Transportation Systems Laboratory 25
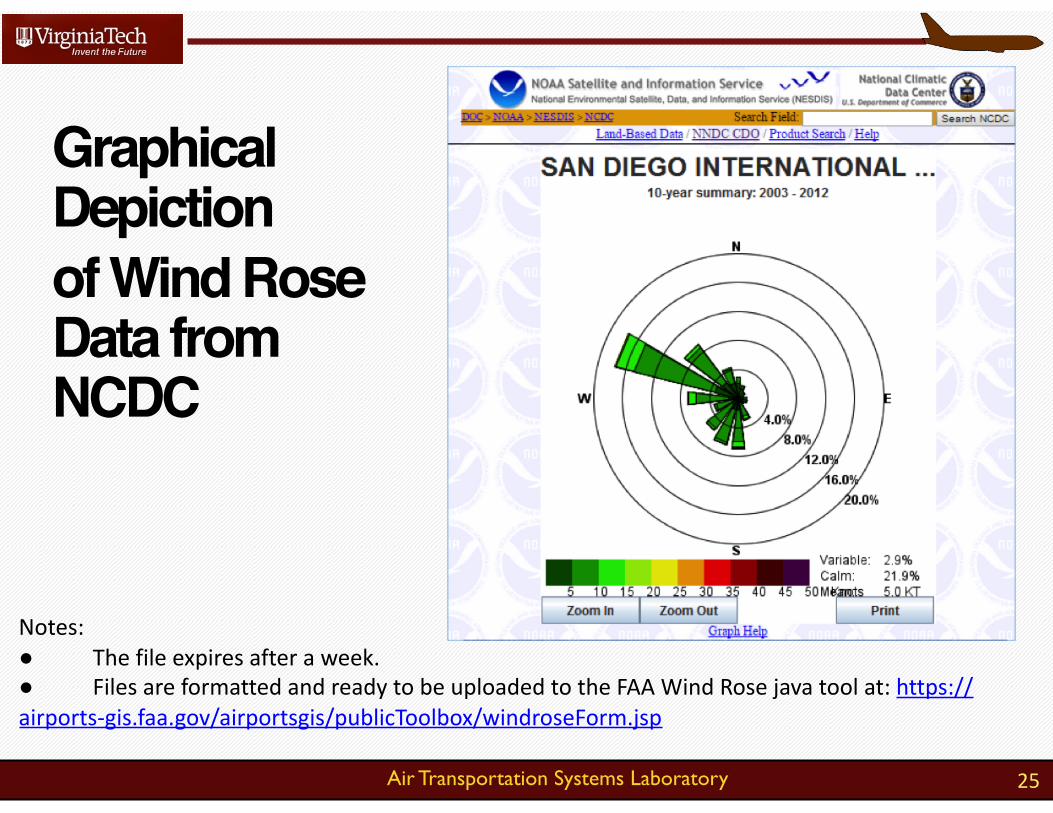
Graphical Depictionof Wind Rose Data from NCDC
Notes:● Thefileexpiresafteraweek.● FilesareformattedandreadytobeuploadedtotheFAAWindRosejavatoolat:https://airports-gis.faa.gov/airportsgis/publicToolbox/windroseForm.jsp
Air Transportation Systems Laboratory
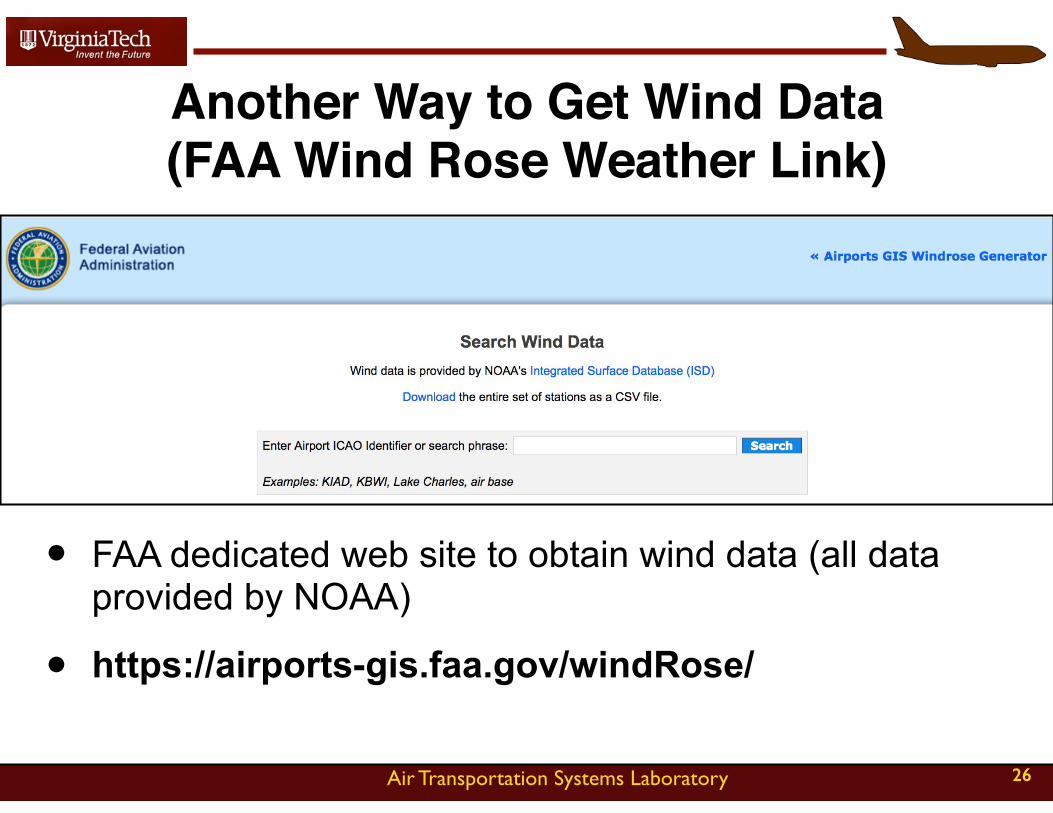
Another Way to Get Wind Data (FAA Wind Rose Weather Link)
• FAA dedicated web site to obtain wind data (all data provided by NOAA)
• https://airports-gis.faa.gov/windRose/
26
Air Transportation Systems Laboratory 27
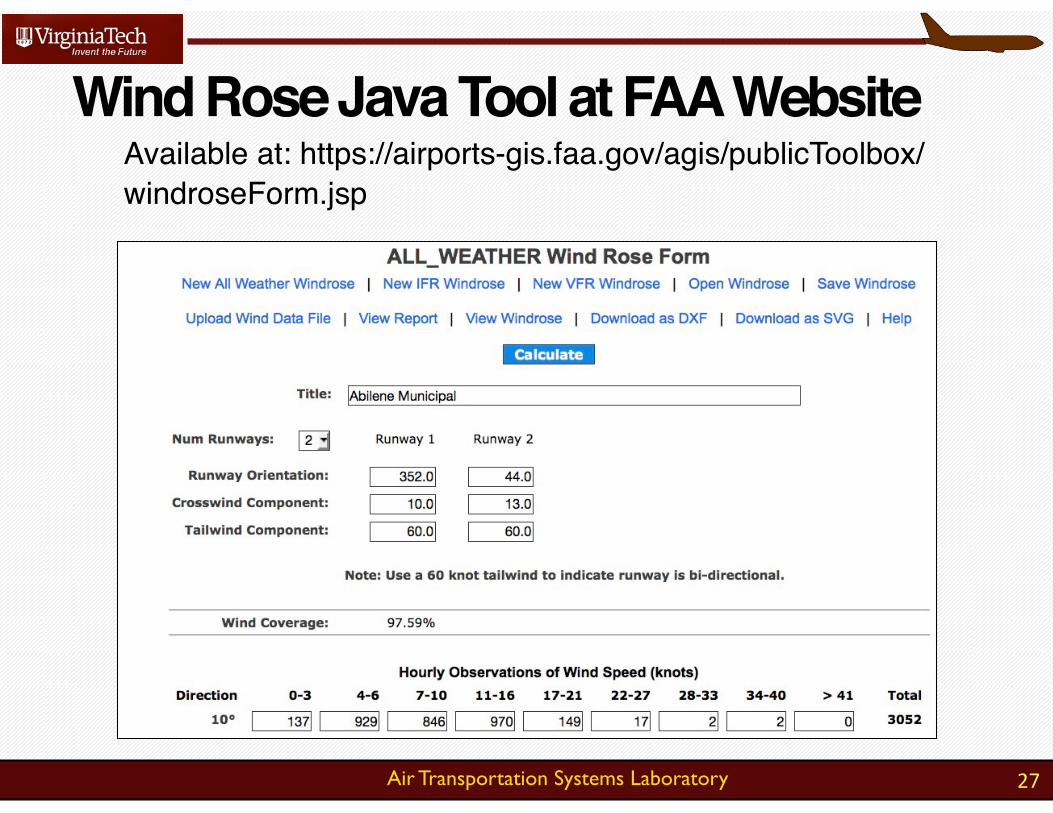
Available at: https://airports-gis.faa.gov/agis/publicToolbox/windroseForm.jsp
Wind Rose Java Tool at FAA Website
Virginia Tech - Air Transportation Systems Laboratory
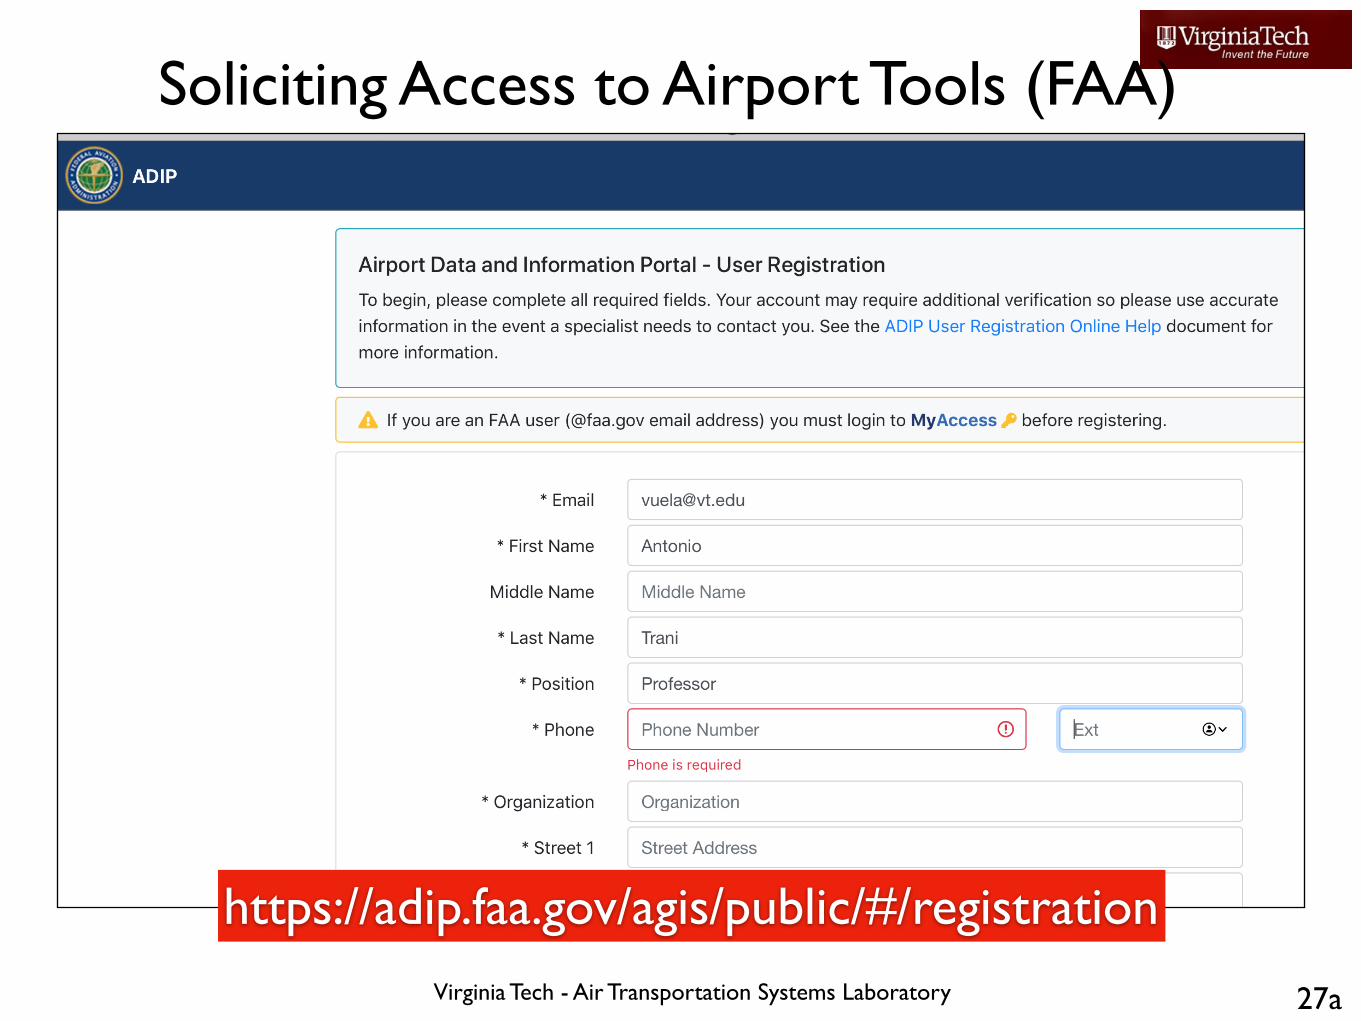
Soliciting Access to Airport Tools (FAA)
27a
https://adip.faa.gov/agis/public/#/registration
Virginia Tech - Air Transportation Systems Laboratory
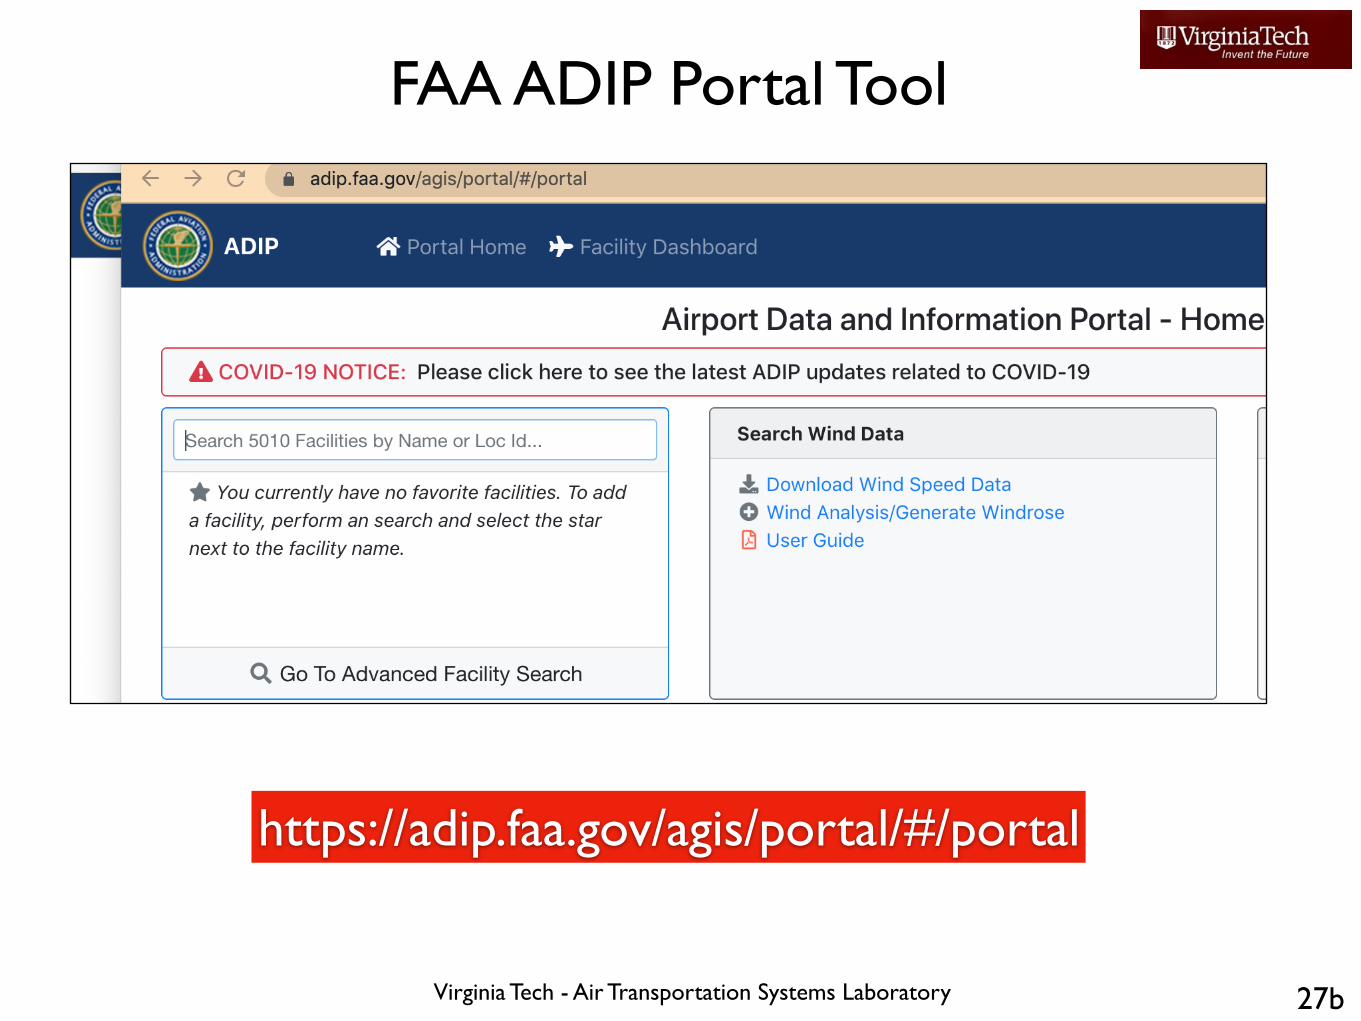
FAA ADIP Portal Tool
27b
https://adip.faa.gov/agis/portal/#/portal
Virginia Tech - Air Transportation Systems Laboratory
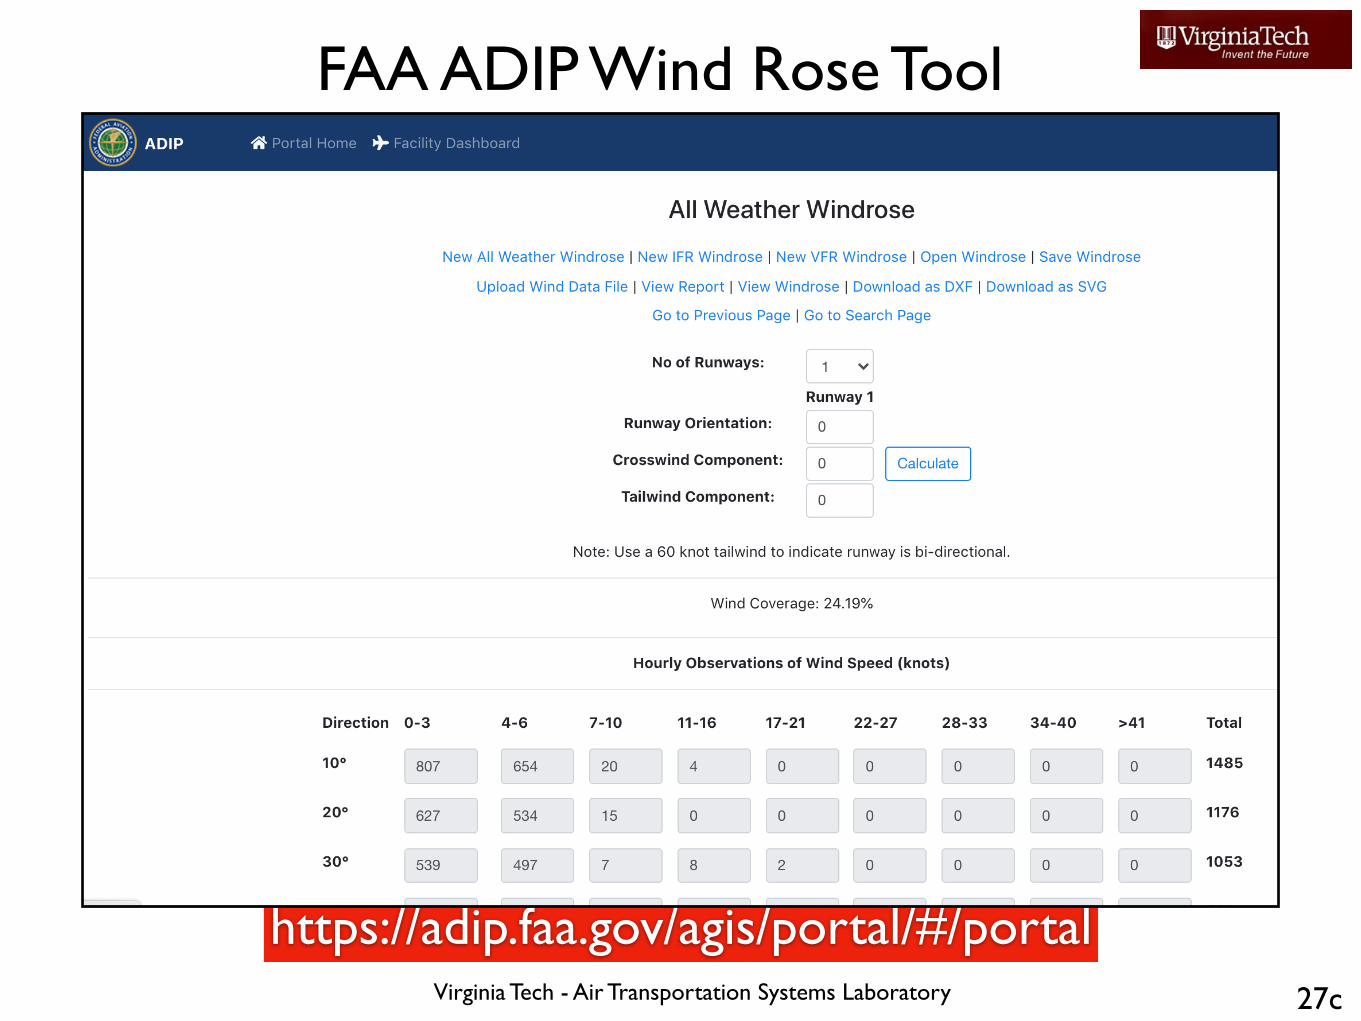
FAA ADIP Wind Rose Tool
27c
https://adip.faa.gov/agis/portal/#/portal
Virginia Tech - Air Transportation Systems Laboratory
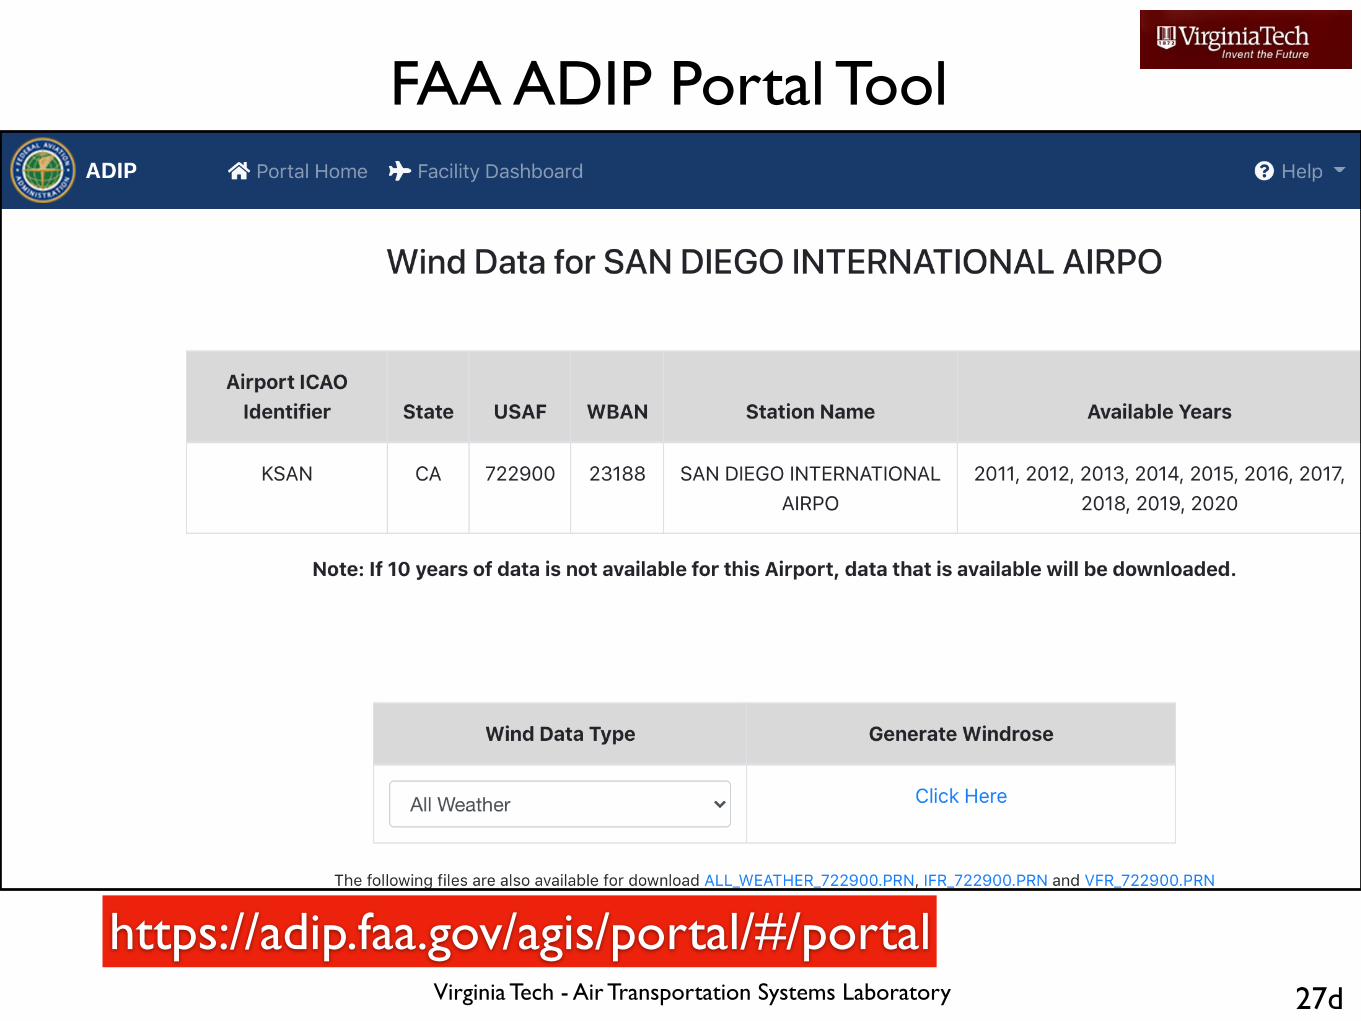
FAA ADIP Portal Tool
27d
https://adip.faa.gov/agis/portal/#/portal
Virginia Tech - Air Transportation Systems Laboratory
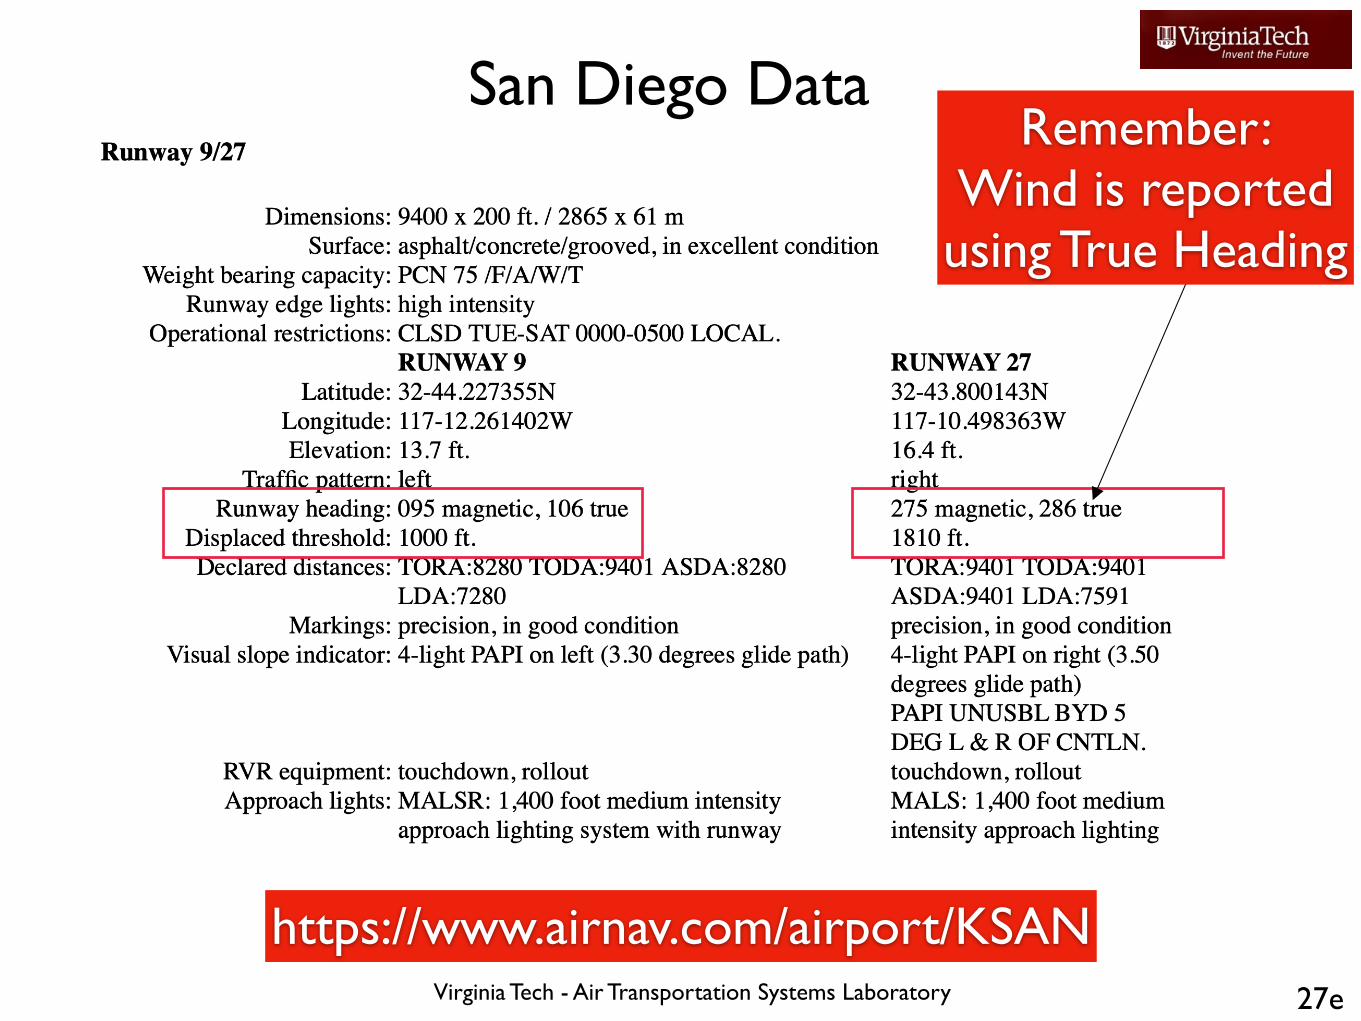
San Diego Data
27e
https://www.airnav.com/airport/KSAN
Remember:Wind is reportedusing True Heading
Virginia Tech - Air Transportation Systems Laboratory 27f
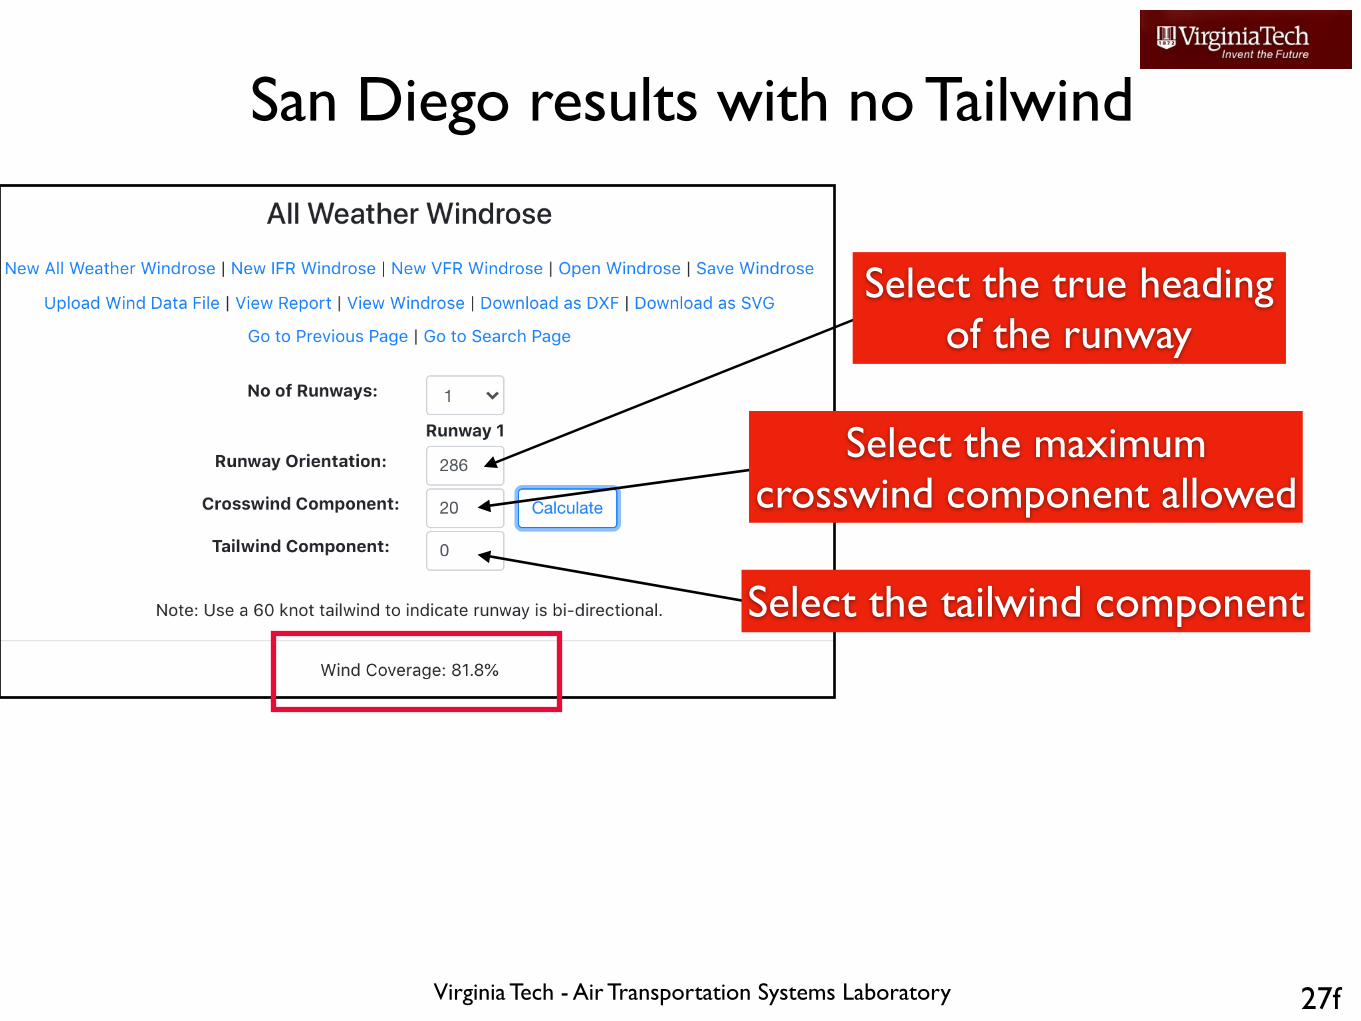
San Diego results with no Tailwind
Select the true headingof the runway
Select the maximum crosswind component allowed
Select the tailwind component
Virginia Tech - Air Transportation Systems Laboratory
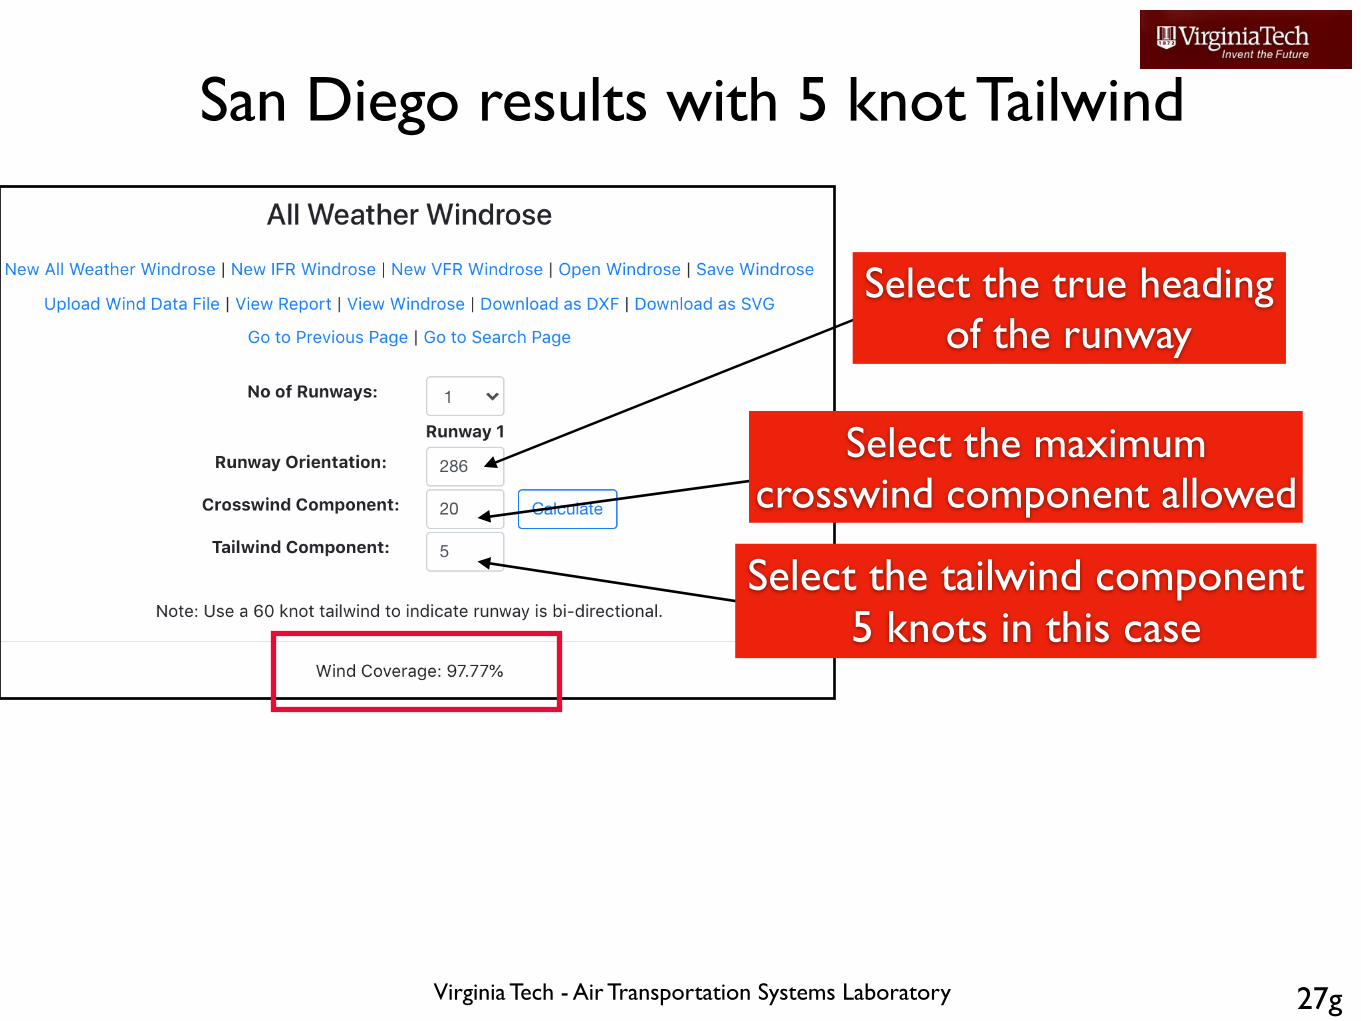
San Diego results with 5 knot Tailwind
27g
Select the true headingof the runway
Select the maximum crosswind component allowed
Select the tailwind component5 knots in this case
Virginia Tech - Air Transportation Systems Laboratory
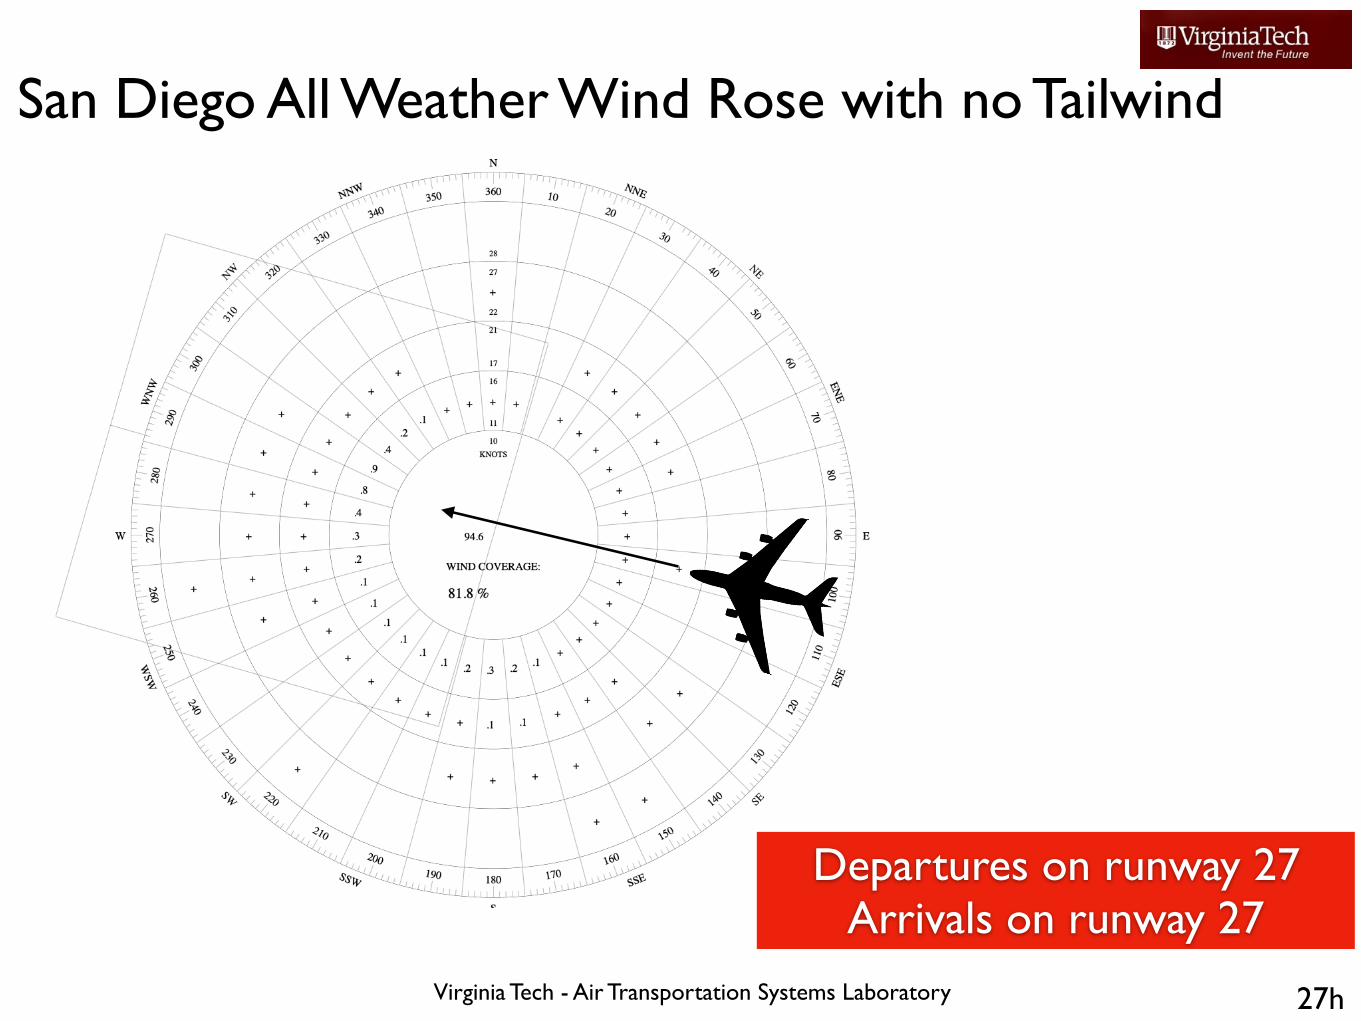
San Diego All Weather Wind Rose with no Tailwind
27h
Departures on runway 27Arrivals on runway 27
Virginia Tech - Air Transportation Systems Laboratory
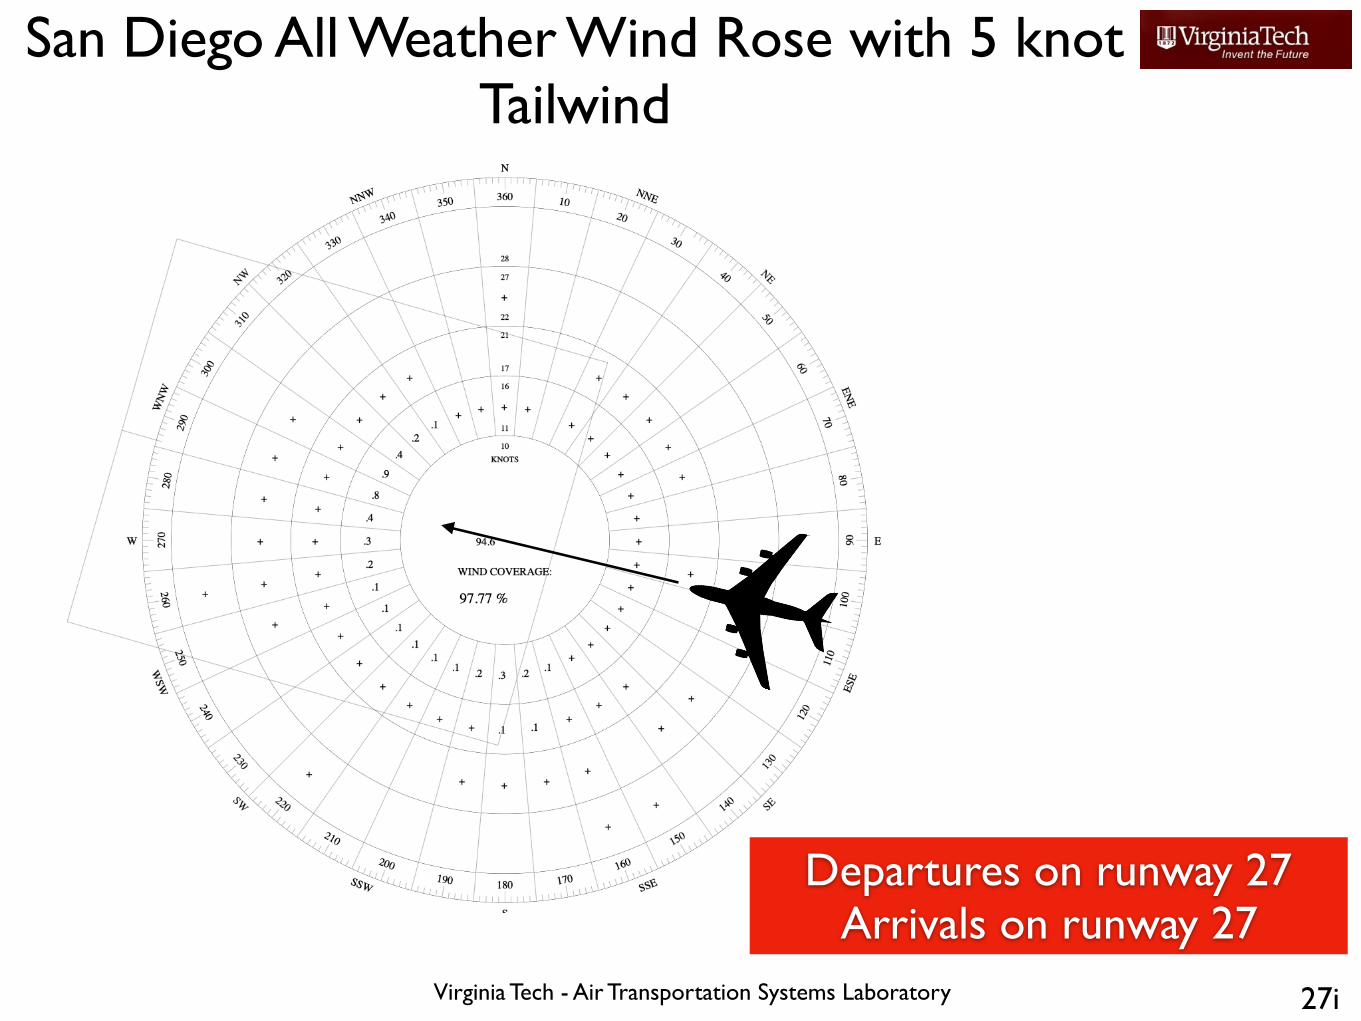
San Diego All Weather Wind Rose with 5 knot Tailwind
27i
Departures on runway 27Arrivals on runway 27
Virginia Tech - Air Transportation Systems Laboratory
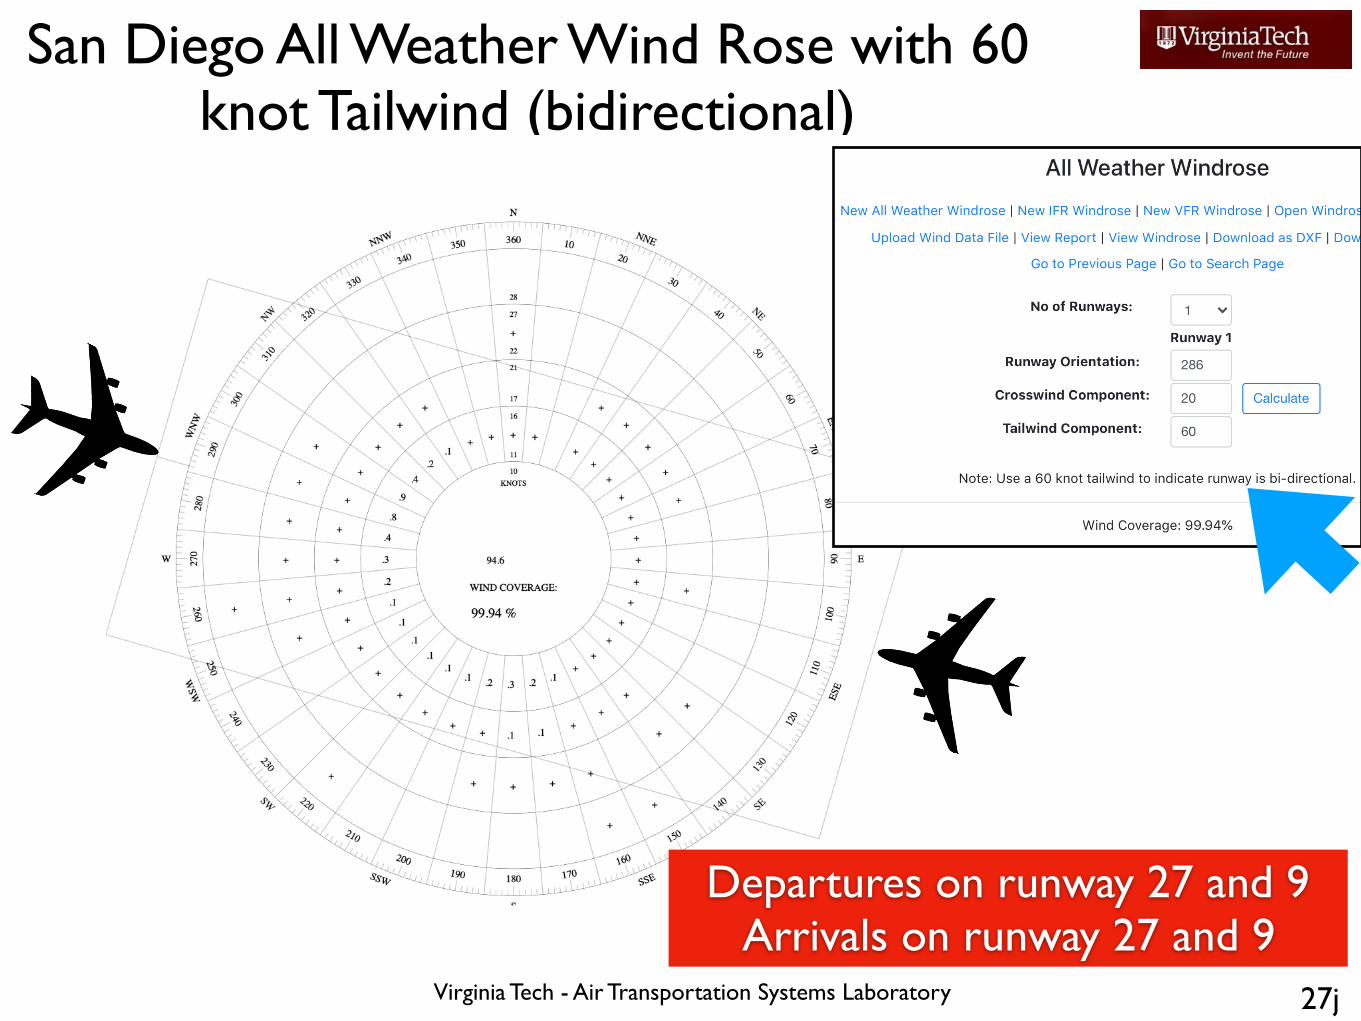
San Diego All Weather Wind Rose with 60 knot Tailwind (bidirectional)
27j
Departures on runway 27 and 9Arrivals on runway 27 and 9
Air Transportation Systems Laboratory
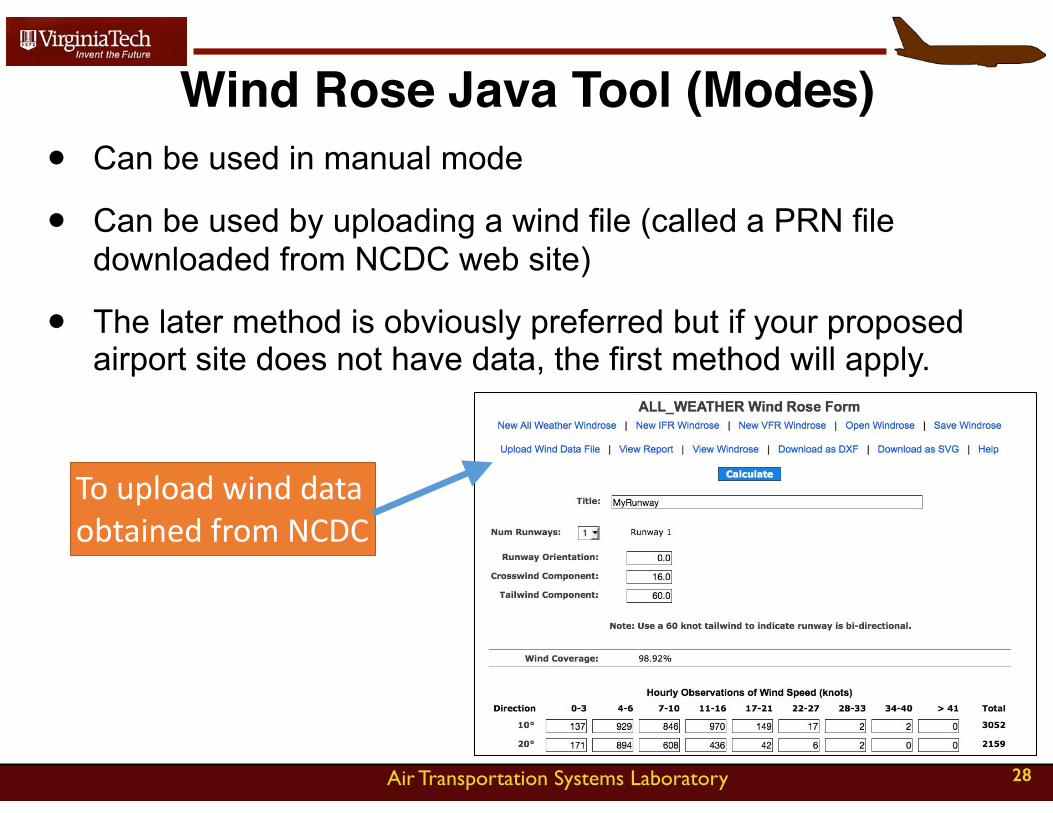
Wind Rose Java Tool (Modes)• Can be used in manual mode
• Can be used by uploading a wind file (called a PRN file downloaded from NCDC web site)
• The later method is obviously preferred but if your proposed airport site does not have data, the first method will apply.
28
TouploadwinddataobtainedfromNCDC
Air Transportation Systems Laboratory
Example Problem:Using Abilene Texas Municipal Airport Wind Data
29
Air Transportation Systems Laboratory
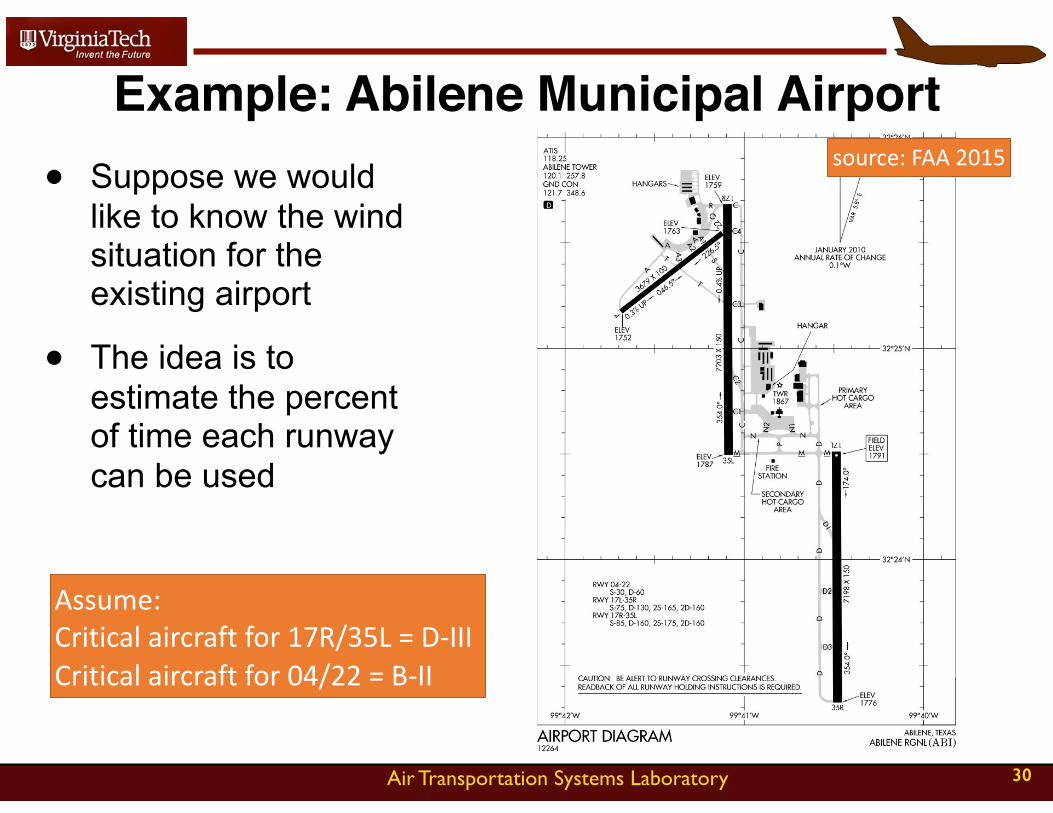
Example: Abilene Municipal Airport• Suppose we would
like to know the wind situation for the existing airport
• The idea is to estimate the percent of time each runway can be used
30
source:FAA2015
Assume:Criticalaircraftfor17R/35L=D-IIICriticalaircraftfor04/22=B-II
Air Transportation Systems Laboratory
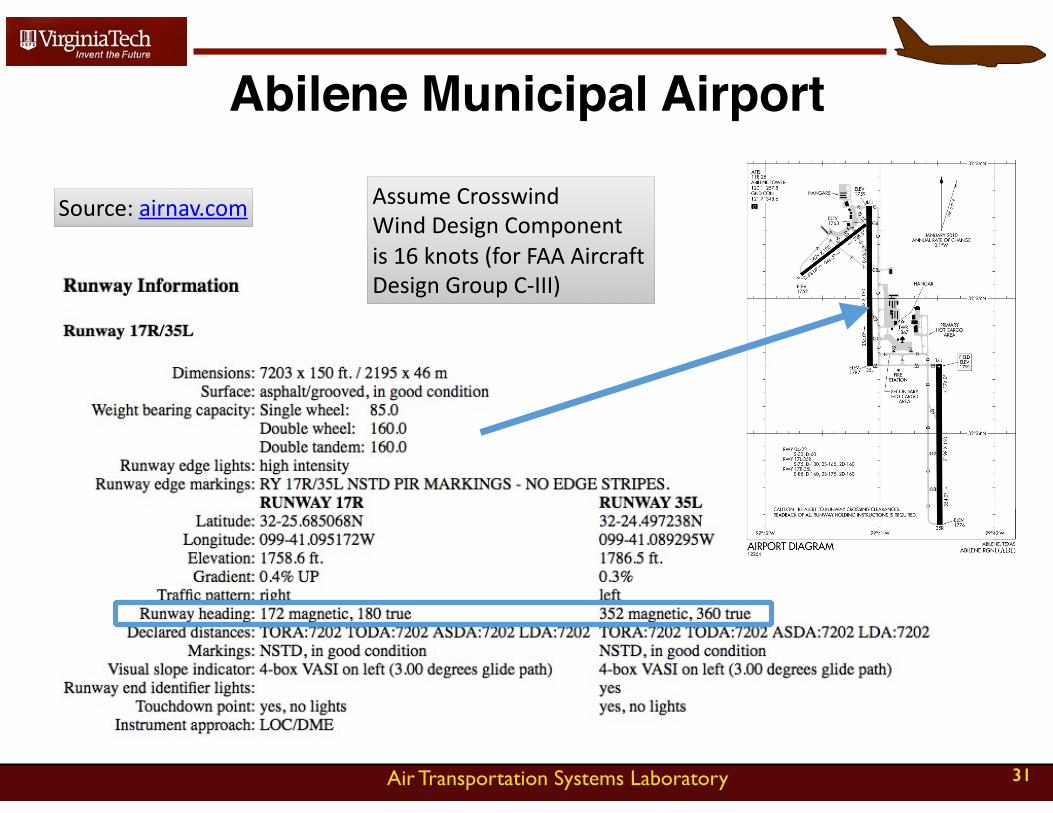
Abilene Municipal Airport
31
source:FAA2015
Source:airnav.com AssumeCrosswindWindDesignComponentis16knots(forFAAAircraftDesignGroupC-III)
Air Transportation Systems Laboratory
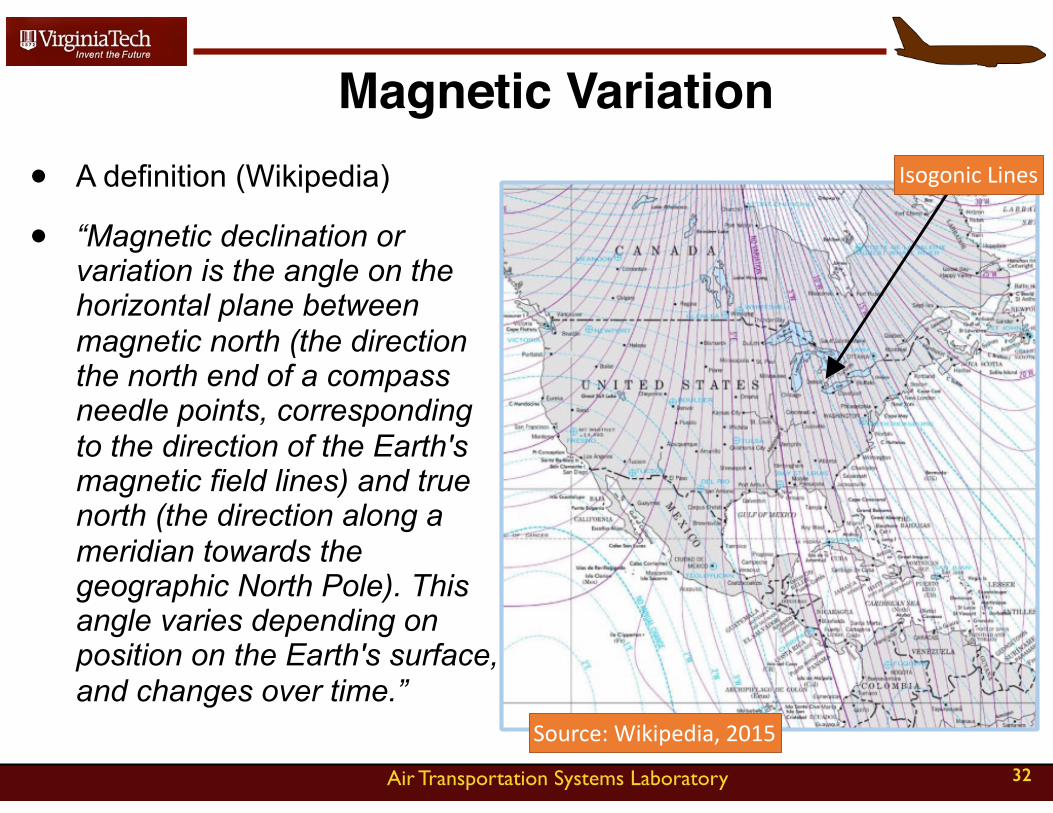
Magnetic Variation• A definition (Wikipedia)
• “Magnetic declination or variation is the angle on the horizontal plane between magnetic north (the direction the north end of a compass needle points, corresponding to the direction of the Earth's magnetic field lines) and true north (the direction along a meridian towards the geographic North Pole). This angle varies depending on position on the Earth's surface, and changes over time.”
32
Source:Wikipedia,2015
IsogonicLines
Air Transportation Systems Laboratory
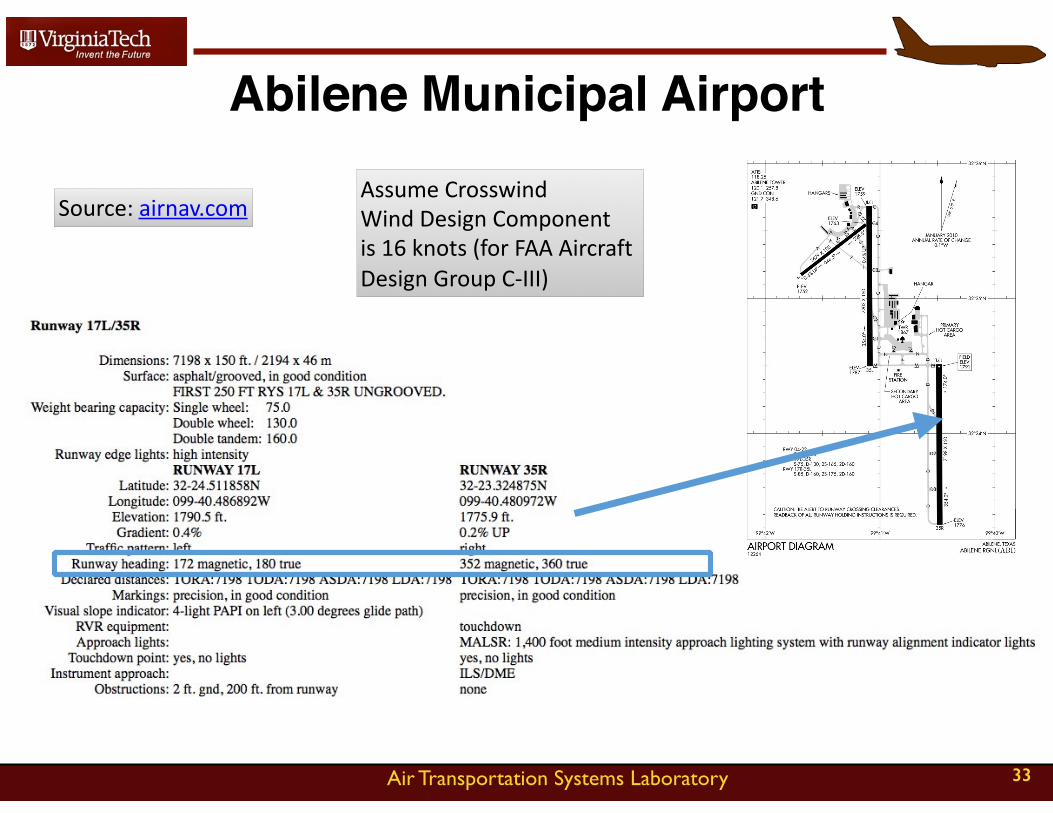
Abilene Municipal Airport
33
source:FAA2015
Source:airnav.comAssumeCrosswindWindDesignComponentis16knots(forFAAAircraftDesignGroupC-III)
Air Transportation Systems Laboratory
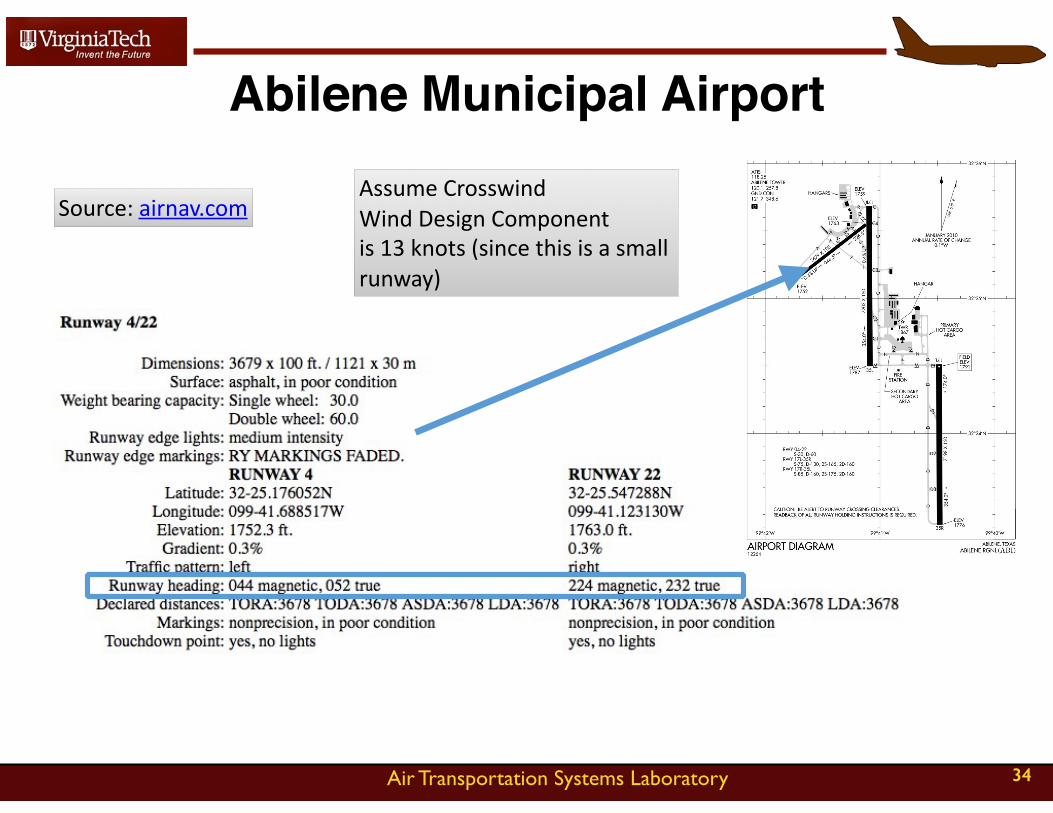
Abilene Municipal Airport
34
Source:airnav.comAssumeCrosswindWindDesignComponentis13knots(sincethisisasmallrunway)
Air Transportation Systems Laboratory
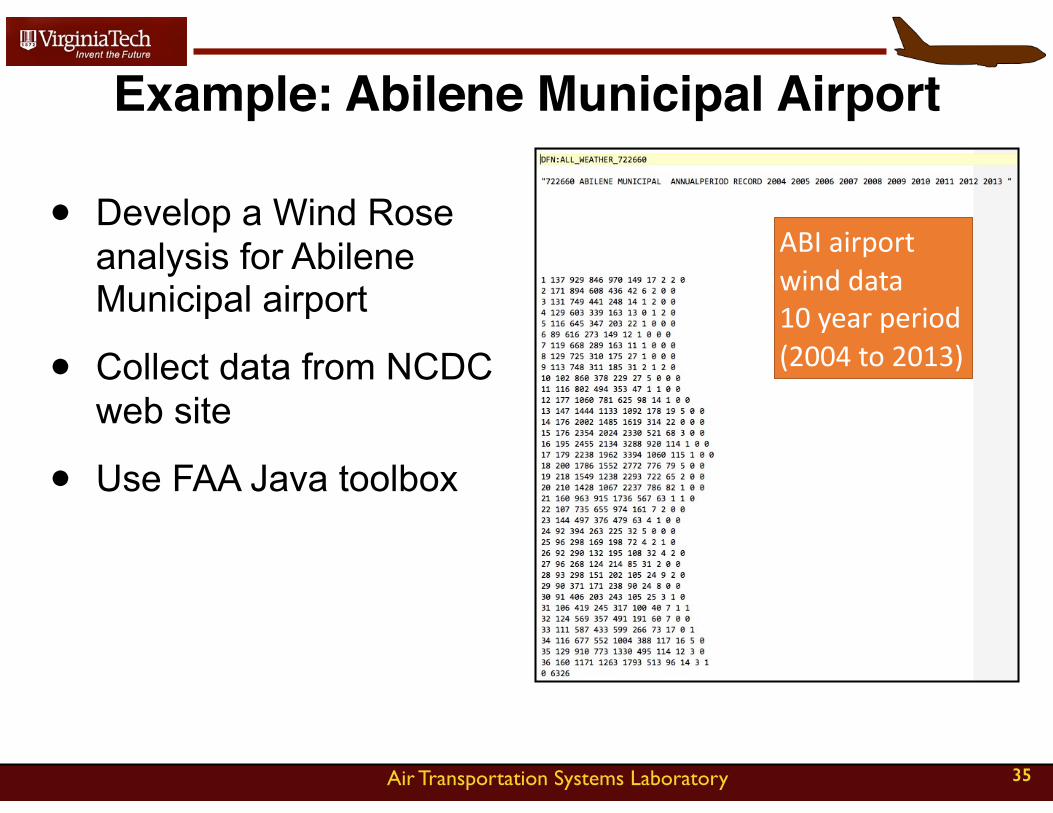
Example: Abilene Municipal Airport
• Develop a Wind Rose analysis for Abilene Municipal airport
• Collect data from NCDC web site
• Use FAA Java toolbox
35
ABIairportwinddata10yearperiod(2004to2013)
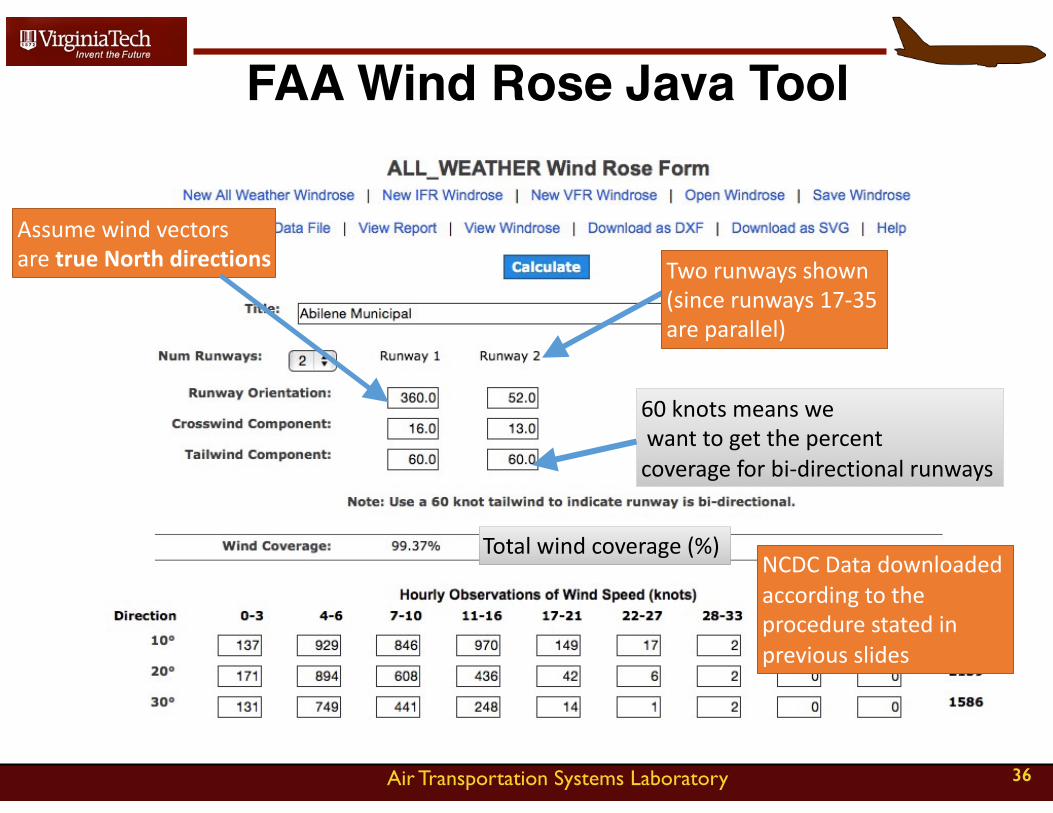
Air Transportation Systems Laboratory
AssumewindvectorsaretrueNorthdirections Tworunwaysshown
(sincerunways17-35areparallel)
FAA Wind Rose Java Tool
36
NCDCDatadownloadedaccordingtotheprocedurestatedinpreviousslides
60knotsmeanswewanttogetthepercentcoverageforbi-directionalrunways
Totalwindcoverage(%)
Air Transportation Systems Laboratory
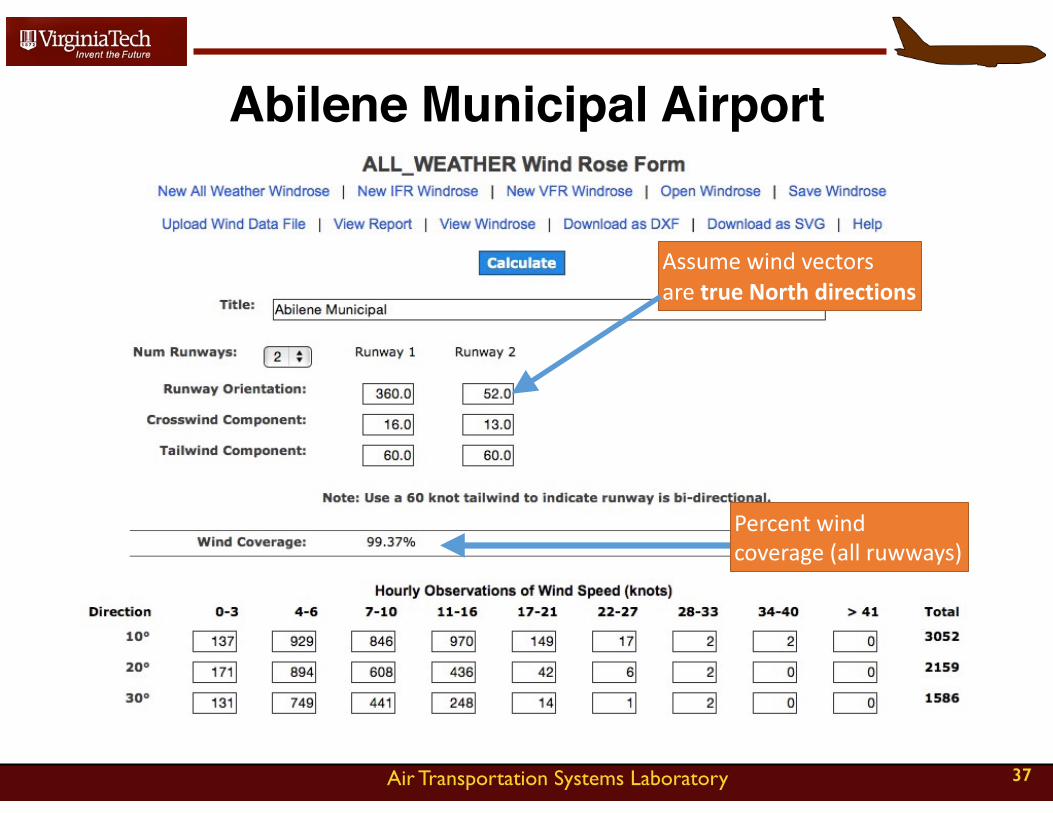
Abilene Municipal Airport
37
Percentwindcoverage(allruwways)
AssumewindvectorsaretrueNorthdirections
Air Transportation Systems Laboratory
Abilene Municipal Airport
38
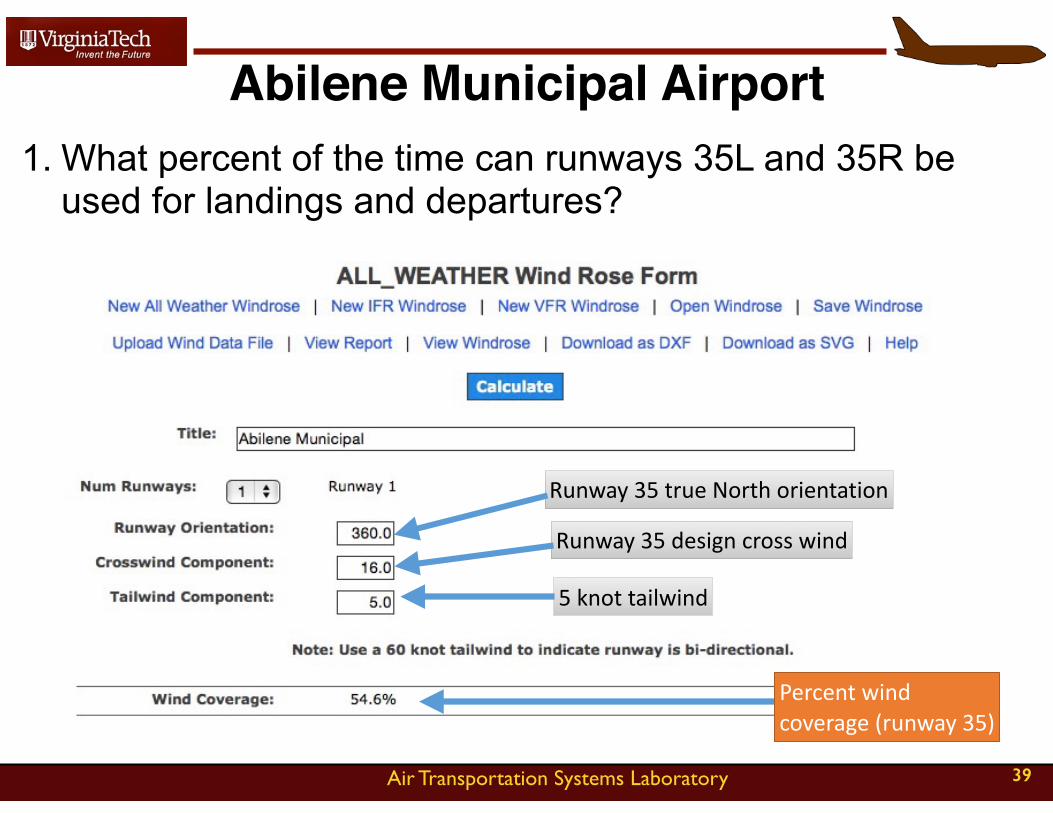
Some relevant questions:
1. What percent of the time can runways 35L and 35R be used?
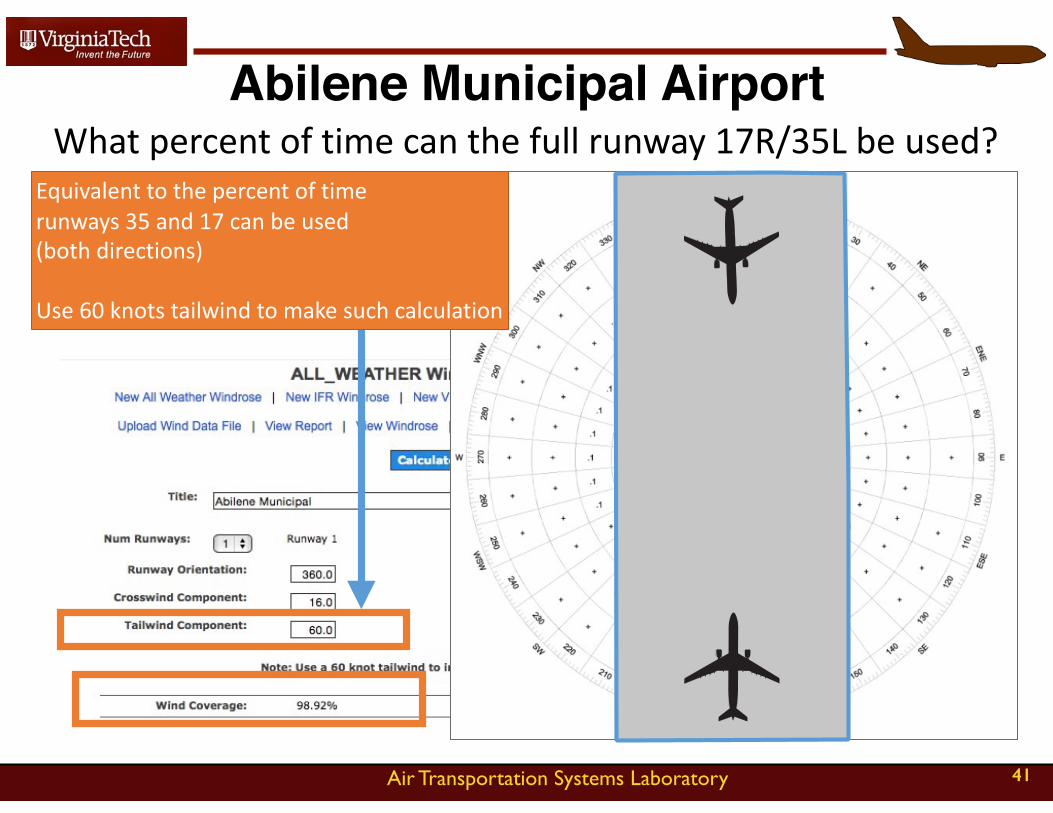
2. What percent of time can the full runway 17R/35L be used?
• In the analysis, assume a 5 knot tailwind component is allowed for the operations.
Air Transportation Systems Laboratory
Abilene Municipal Airport
39
1. What percent of the time can runways 35L and 35R be used for landings and departures?
Percentwindcoverage(runway35)
5knottailwind
Runway35trueNorthorientation
Runway35designcrosswind
Air Transportation Systems Laboratory
Abilene Municipal Airport
40
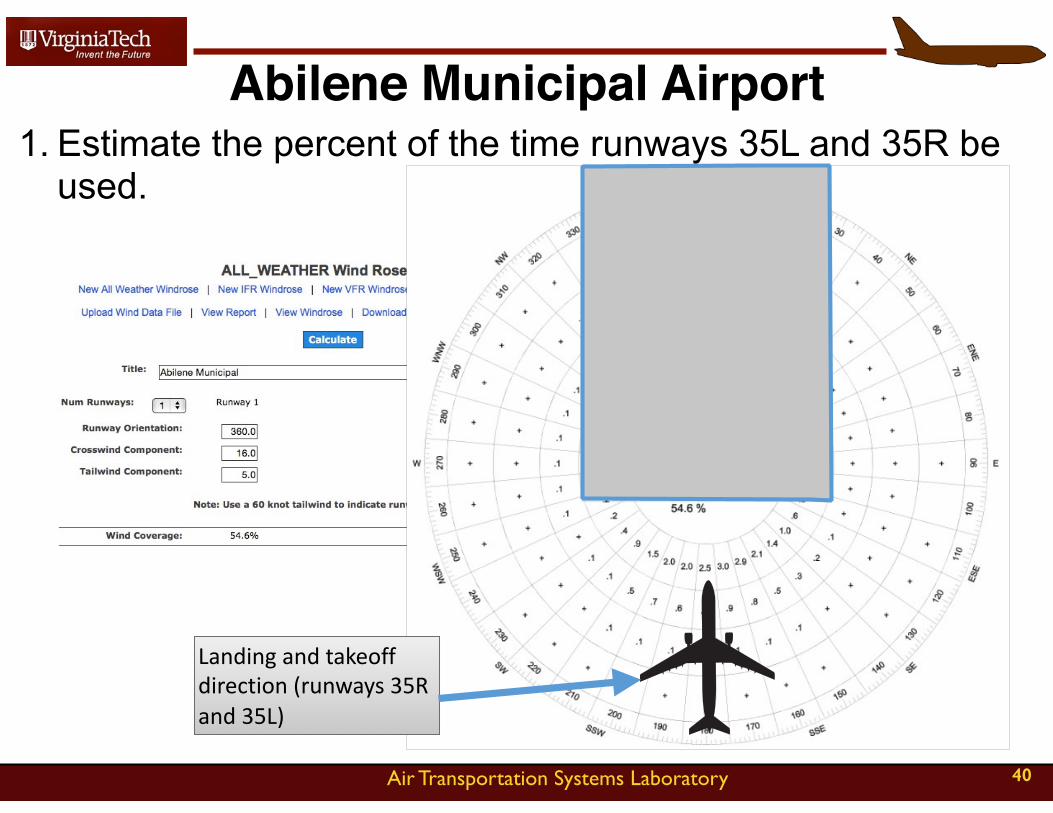
1. Estimate the percent of the time runways 35L and 35R be used.
Landingandtakeoffdirection(runways35Rand35L)
Air Transportation Systems Laboratory
Abilene Municipal Airport
41
Whatpercentoftimecanthefullrunway17R/35Lbeused?Equivalenttothepercentoftimerunways35and17canbeused(bothdirections)
Use60knotstailwindtomakesuchcalculation
Air Transportation Systems Laboratory
Abilene Municipal Airport
42
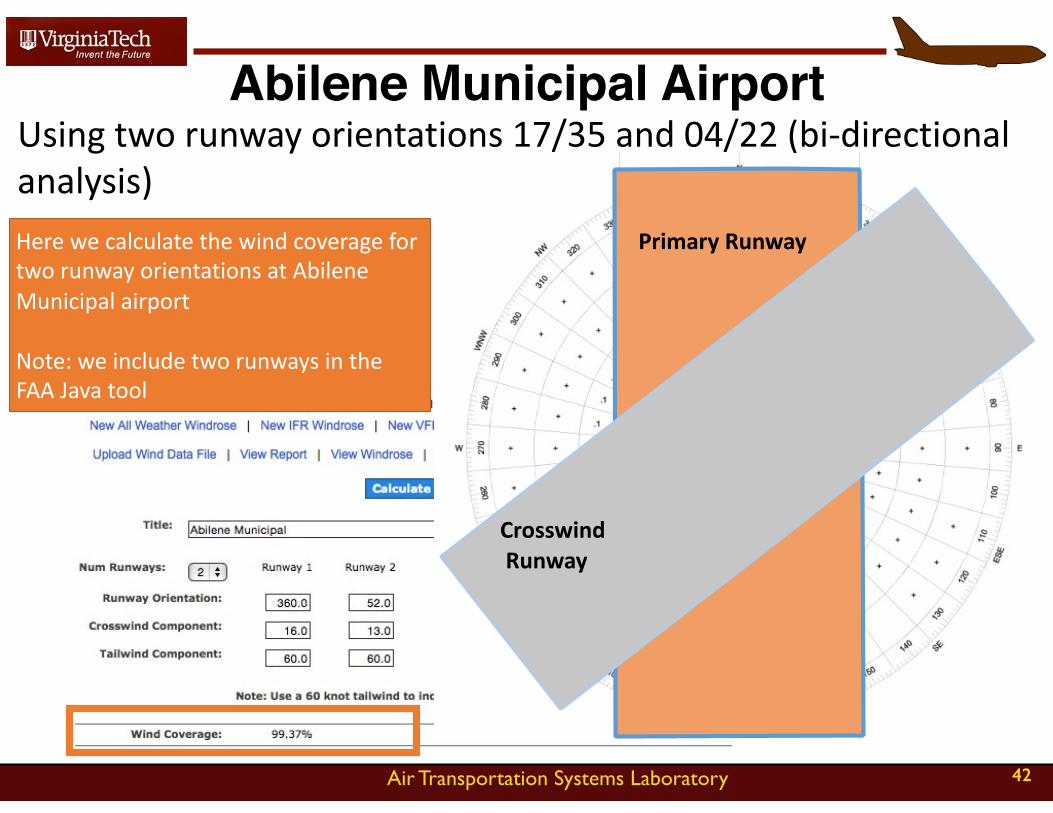
Usingtworunwayorientations17/35and04/22(bi-directionalanalysis)HerewecalculatethewindcoveragefortworunwayorientationsatAbileneMunicipalairport
Note:weincludetworunwaysintheFAAJavatool
PrimaryRunway
CrosswindRunway
Virginia Tech - Air Transportation Systems Laboratory
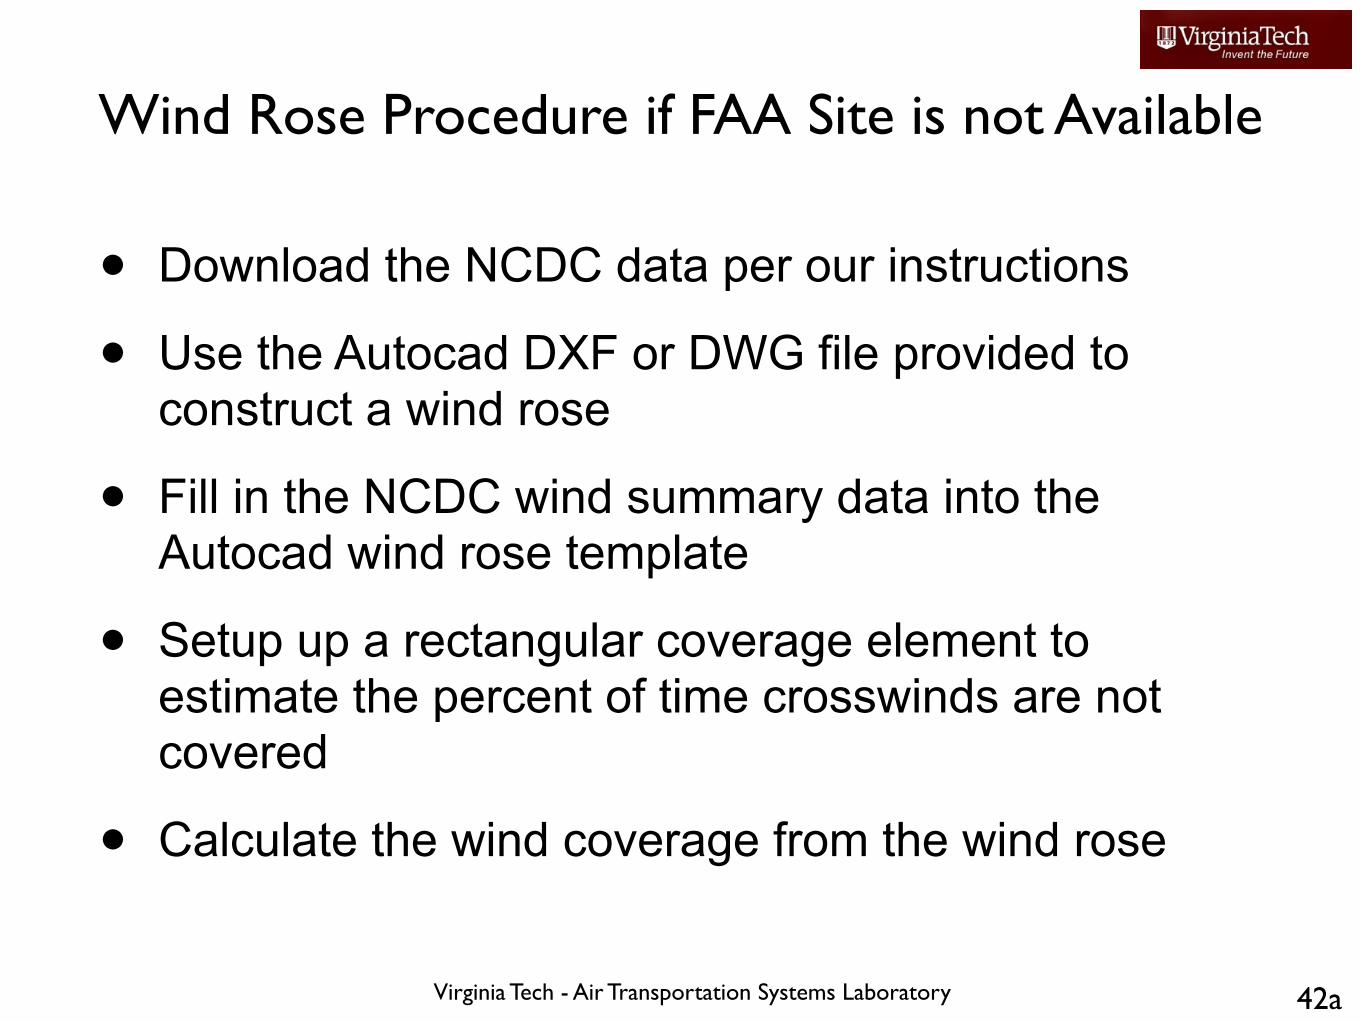
Wind Rose Procedure if FAA Site is not Available
• Download the NCDC data per our instructions
• Use the Autocad DXF or DWG file provided to construct a wind rose
• Fill in the NCDC wind summary data into the Autocad wind rose template
• Setup up a rectangular coverage element to estimate the percent of time crosswinds are not covered
• Calculate the wind coverage from the wind rose
42a
Virginia Tech - Air Transportation Systems Laboratory
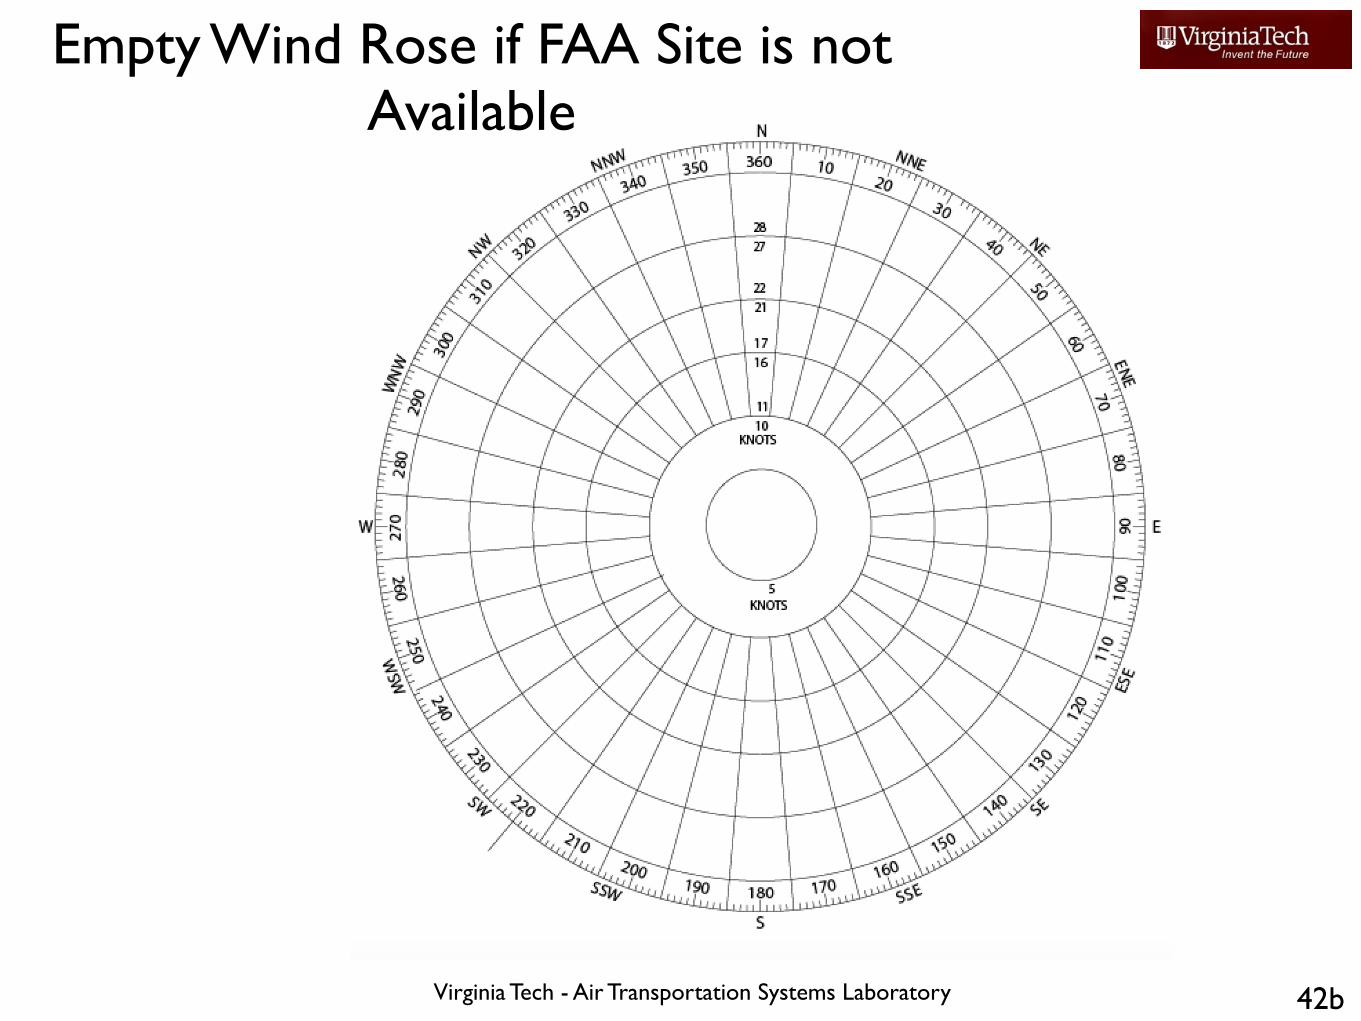
Empty Wind Rose if FAA Site is not Available
42b
Virginia Tech - Air Transportation Systems Laboratory
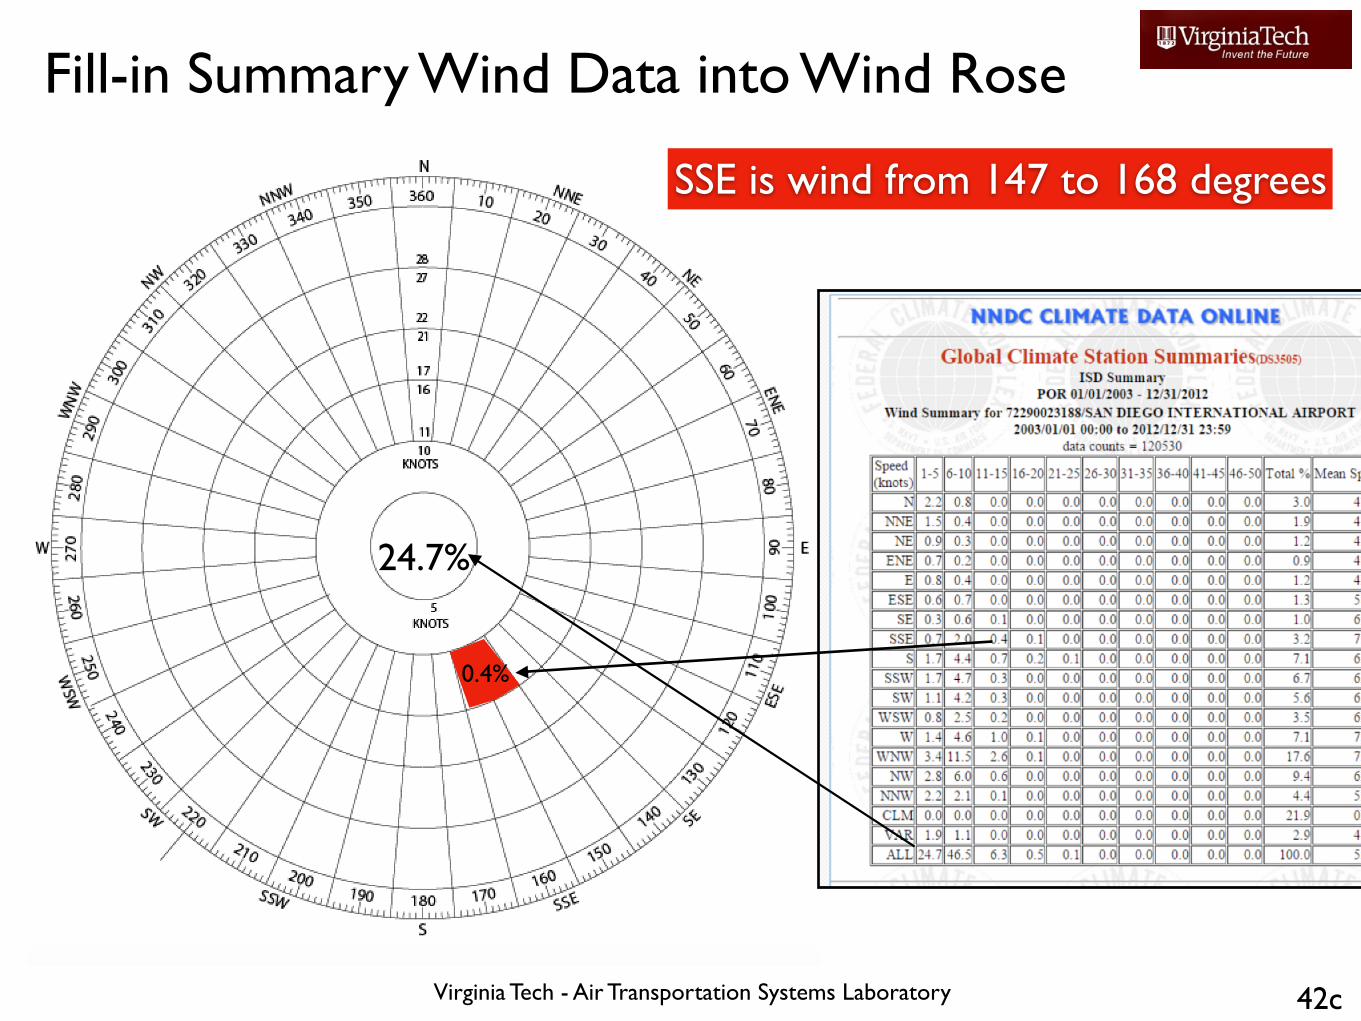
Fill-in Summary Wind Data into Wind Rose
42c
24.7%
0.4%
SSE is wind from 147 to 168 degrees
Virginia Tech - Air Transportation Systems Laboratory
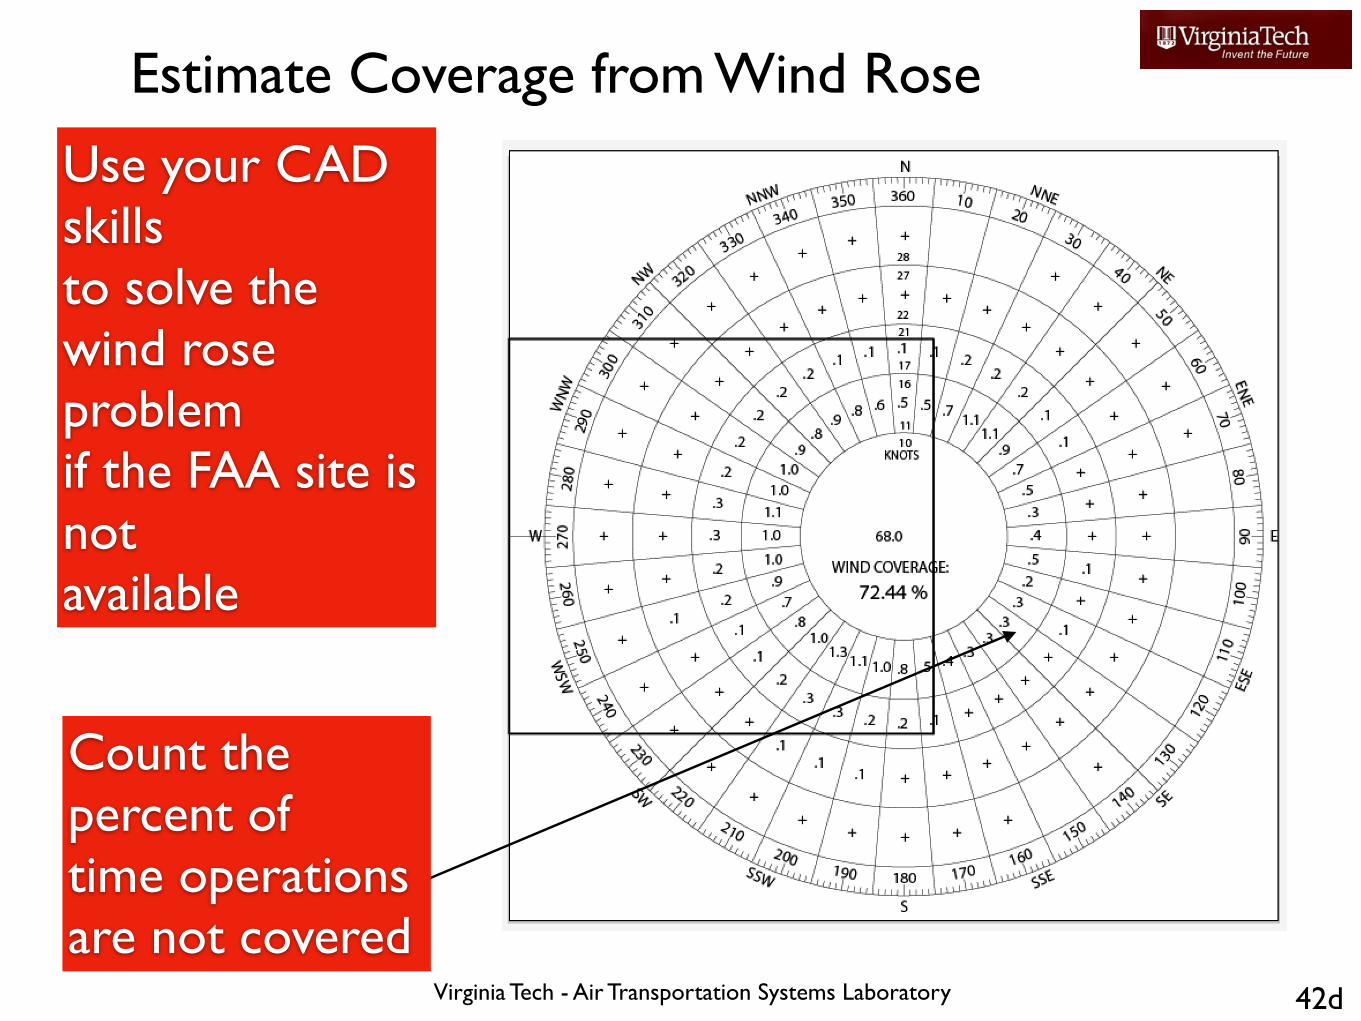
Estimate Coverage from Wind Rose
42d
Use your CAD skillsto solve the wind rose problemif the FAA site is notavailable
Count thepercent oftime operationsare not covered
Virginia Tech - Air Transportation Systems Laboratory 42e
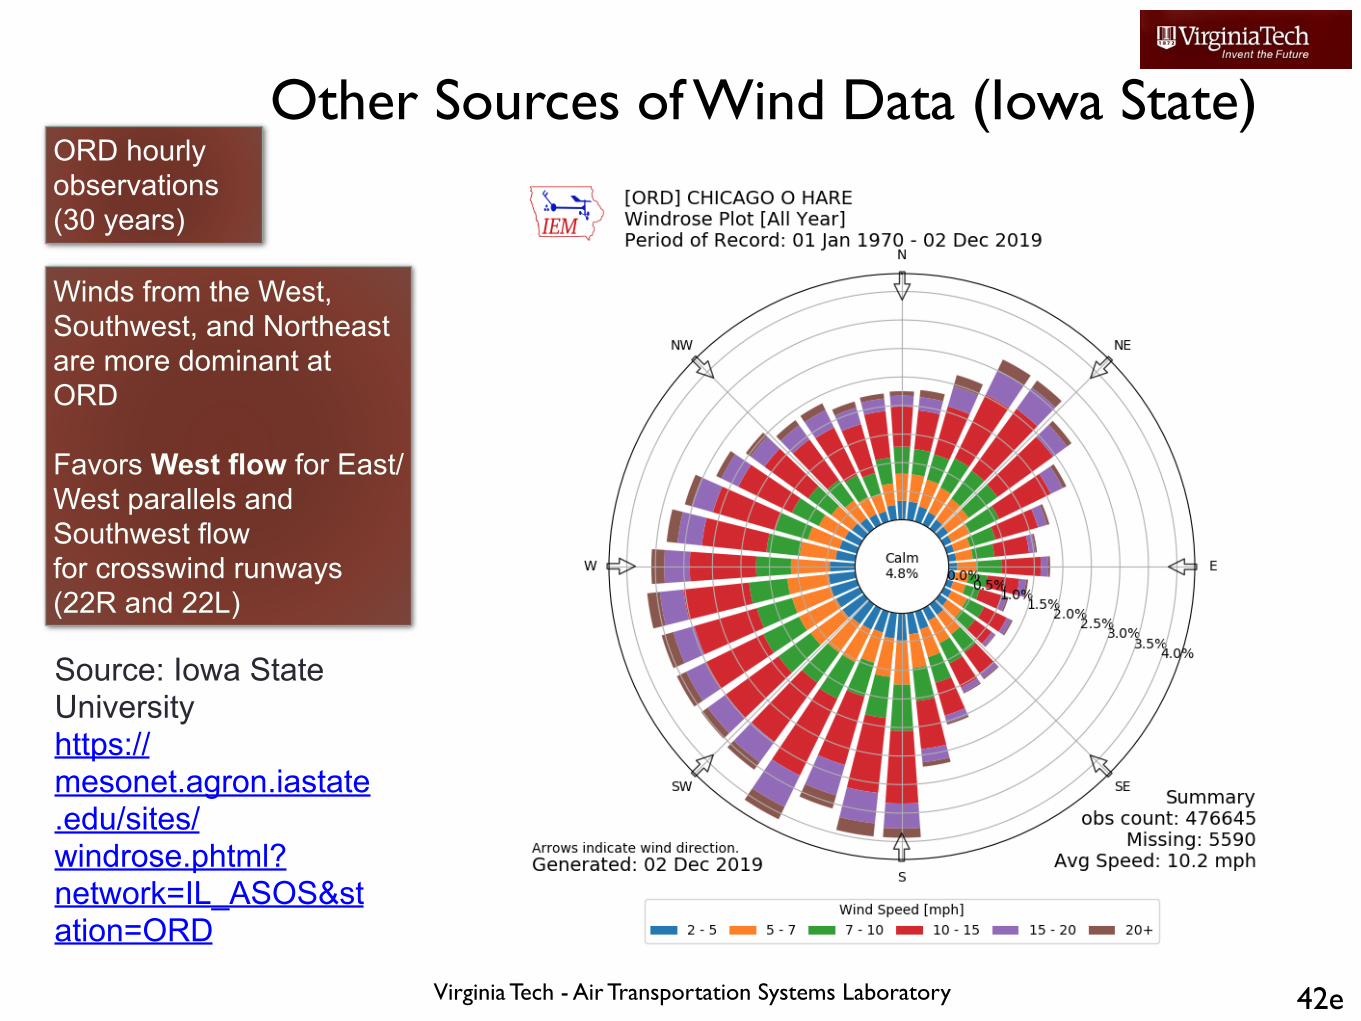
Other Sources of Wind Data (Iowa State)
Source: Iowa State University https://mesonet.agron.iastate.edu/sites/windrose.phtml?network=IL_ASOS&station=ORD
ORD hourly observations (30 years)
Winds from the West, Southwest, and Northeast are more dominant at ORD
Favors West flow for East/West parallels and Southwest flow for crosswind runways (22R and 22L)
Virginia Tech - Air Transportation Systems Laboratory 42f
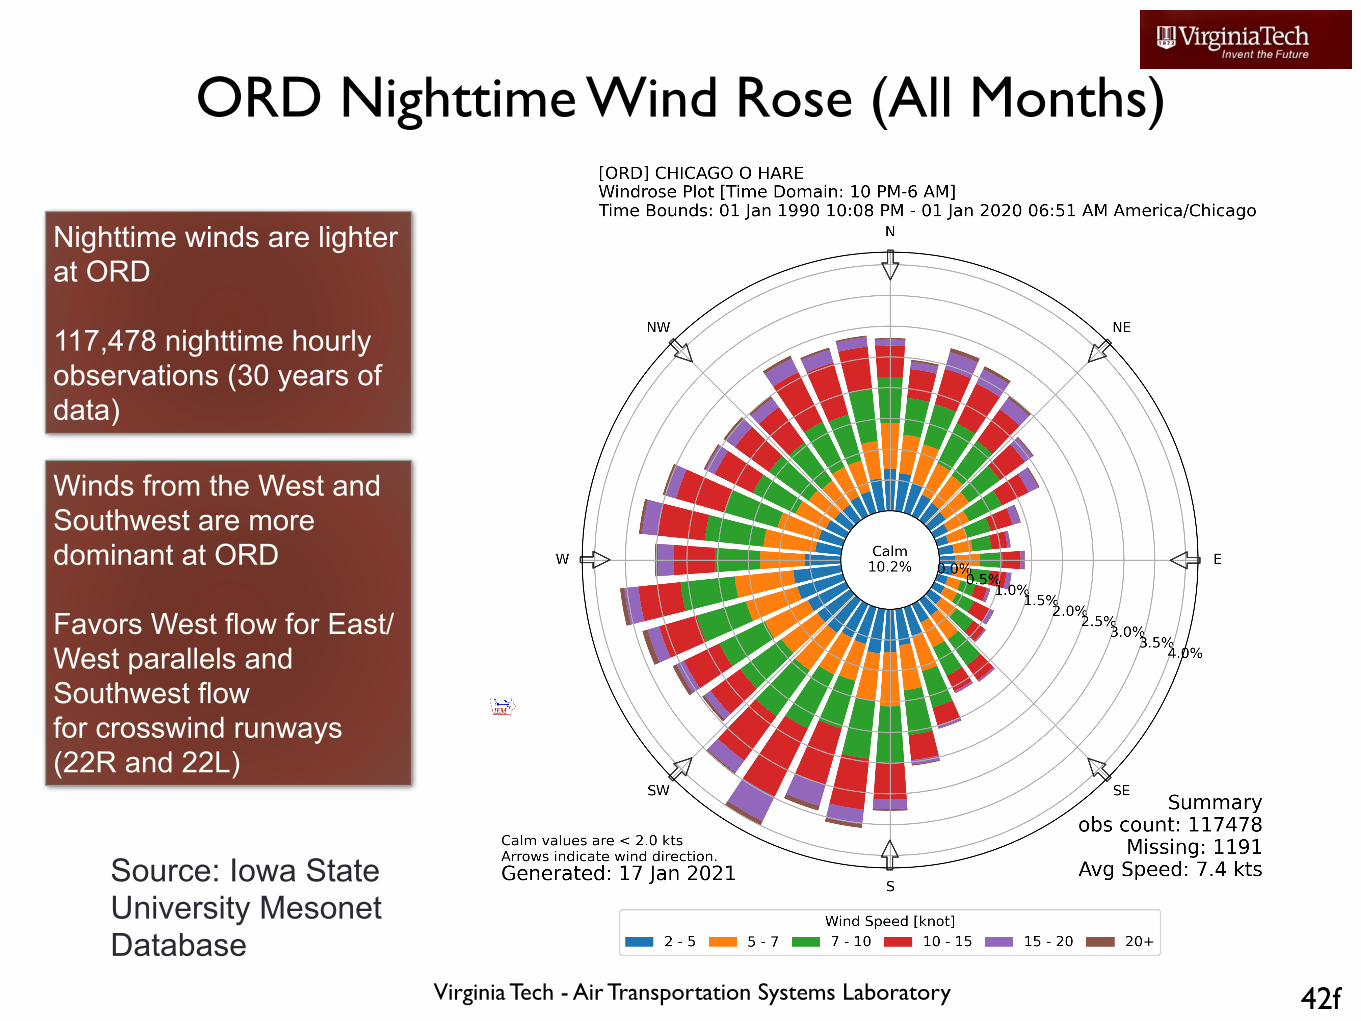
ORD Nighttime Wind Rose (All Months)
Source: Iowa State University Mesonet Database
Nighttime winds are lighter at ORD
117,478 nighttime hourly observations (30 years of data)
Winds from the West and Southwest are more dominant at ORD
Favors West flow for East/West parallels and Southwest flow for crosswind runways (22R and 22L)
Air Transportation Systems Laboratory 43
• When you want to know the percent of time a runway is used from both runway ends (bi-direccional analysis), use an artificially high value of tailwind (60 knots)
• Calculates in one step the percent of time the runway is usable from both approaches.
When Do I use a 60 knot Tailwind?
Air Transportation Systems Laboratory 44
Aircraft are expected to land and takeoff against the wind
• Under some conditions, pilots are allowed to operate with a small tailwind component
• The amount of tailwind varies from airline to airline but is seldom more than 8 knots (relatively small winds)
Implications of taking off with tailwinds
• longer runway length Implications of landing with tailwinds
• Faster approach speeds (i.e., ground speed)
• Longer landing runway requirements
Explanation About Tailwind Allowances
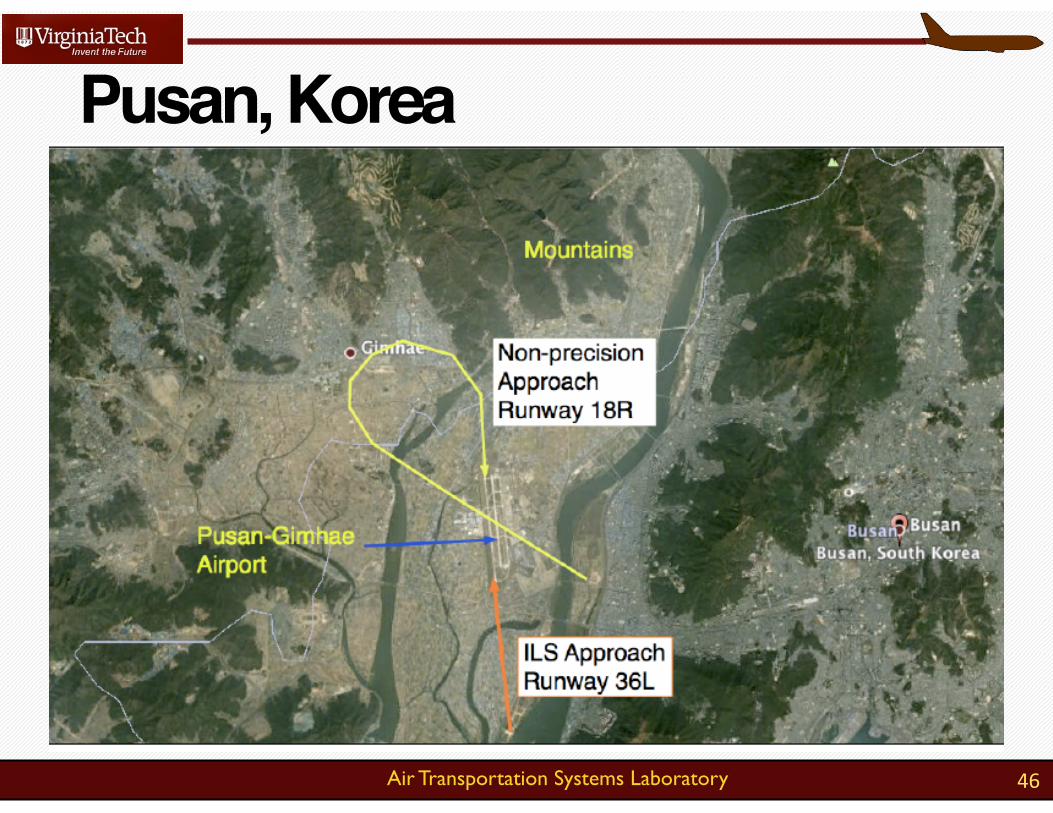
Air Transportation Systems Laboratory 45
• Pilots may prefer to use a higher precision approach by taking a small tailwind component while landing• Busan (Korea) accident (http://aviation-safety.net/database/record.php?id=20020415-0)
• Pilots landing at Kingston, Jamaica prefer runway 12 because it has an ILS approach
• Terrain in one of the approach forces a pilot to take a small tailwind
• For Design of Runway Orientation;• Use 5 knots of tailwind to estimate the percent of time a runway end is used.
Reasons for Tailwind Allowances
Air Transportation Systems Laboratory 46
Pusan, Korea
Air Transportation Systems Laboratory
Other Features• Wind Rose analyses can be saved in various file formats
including .tbw and .DXF
• PRN files contain wind summary information (can be loaded into the FAA Java tool)
• Wind Rose analysis can be partitioned into VFR and IFR analyses
• This requires information on visibility and ceiling beyond just wind direction and magnitude
• Visibility and ceiling data can be found at various web sites including:
• NOAA
• Weather underground47
Air Transportation Systems Laboratory 48
• Design the optimal runway orientation for an airport using FAA airport design code D-V
Solution:Step 1:
• Determine the design crosswind component
• D-V requires 20 knots of cross wind component (see FAA AC 150/5300-13)
Example Problem
Air Transportation Systems Laboratory 49
Step 2:
• Use the Java tool available at the FAA GIS website
• This steps requires that you estimate the percent coverage for each runway orientation
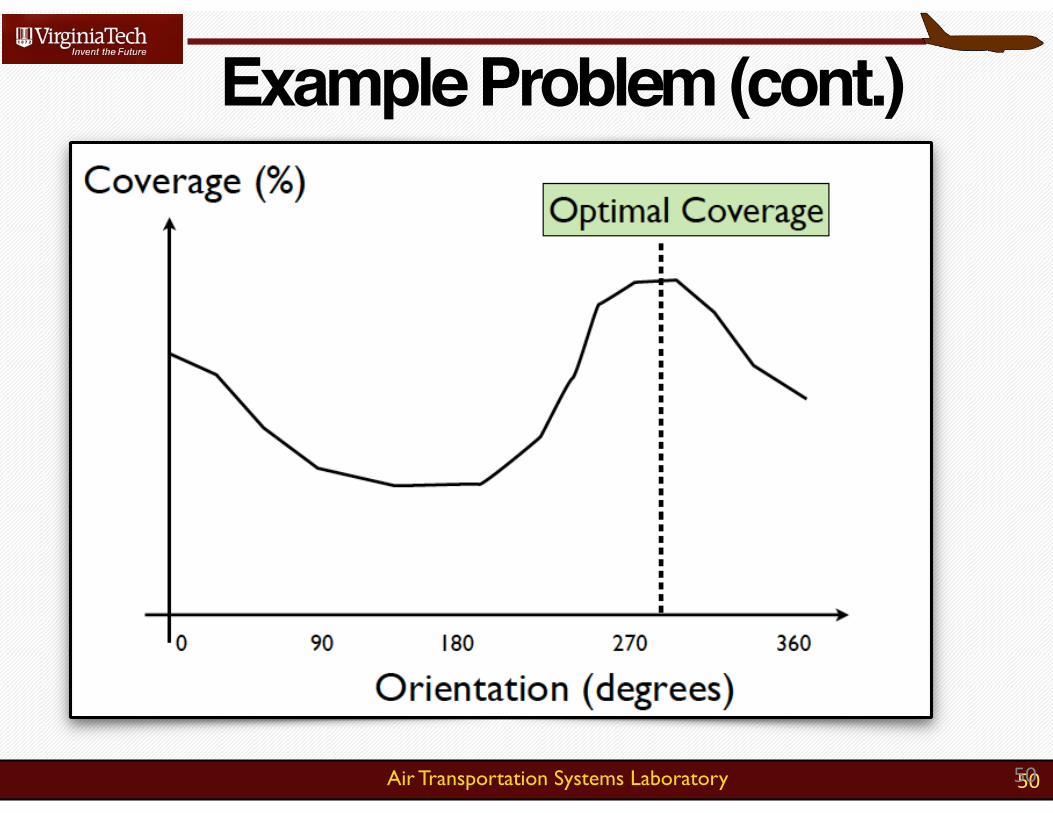
Step 3:
• Find the new coverage for each new runway orientation (say every 5 degrees)
• Create a plot with coverage vs runway orientation Step 4:
• Select the runway orientation that provides the highest coverage
Example Problem (cont.)
Air Transportation Systems Laboratory 5050
Example Problem (cont.)
Air Transportation Systems Laboratory 51
Step 5:
• Check is the coverage meets the 95% criteria required by FAA and ICAO
• If the 95% is met you are done
• Otherwise add a second (crosswind) runway repeating steps 1-4 until the 95% criteria is achieved
Example Problem (cont.)
Air Transportation Systems Laboratory
Old FAA Standalone Program (DOS Application)
52
Air Transportation Systems Laboratory 53
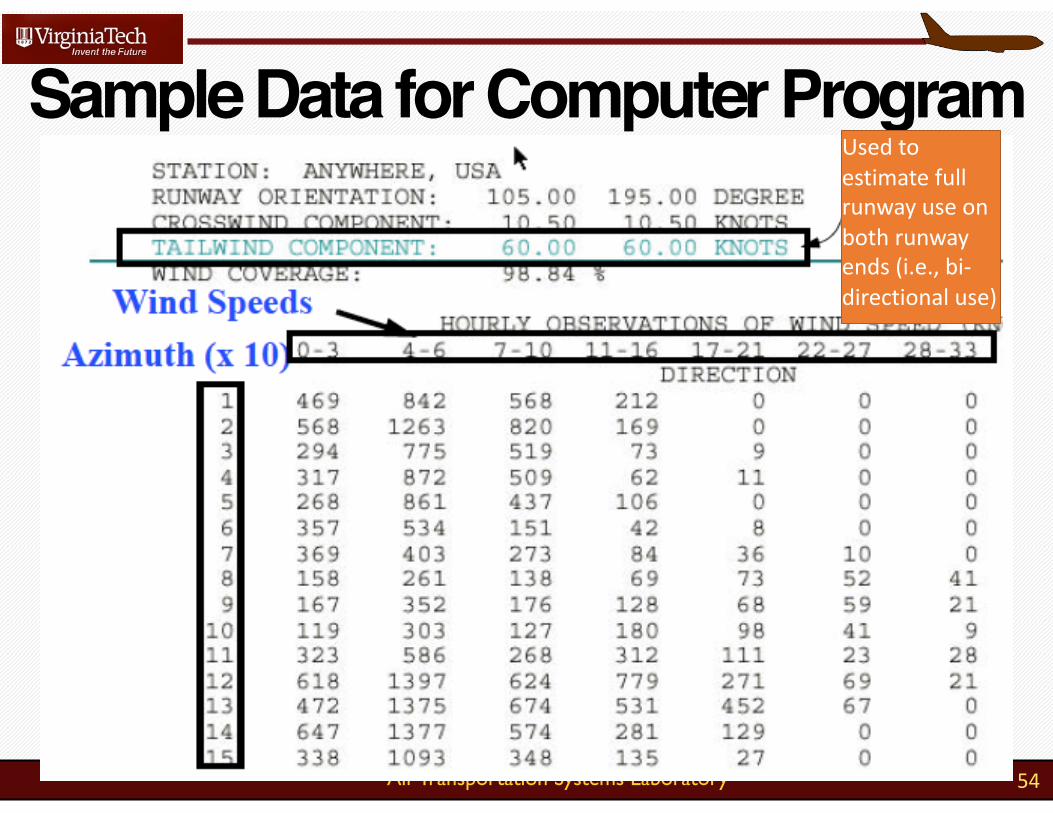
The FAA computer program companion to the AC 5300-13 can be used to study runway orientation coverages.
It requires a text file in a very specific format that contains number of wind observations from various azimuths and winds speeds (similar to the wind rose template described in the previous pages).
Use of FAA Computer Program (AD42.exe)
Air Transportation Systems Laboratory 54
Sample Data for Computer ProgramUsedtoestimatefullrunwayuseonbothrunwayends(i.e.,bi-directionaluse)
Air Transportation Systems Laboratory 55
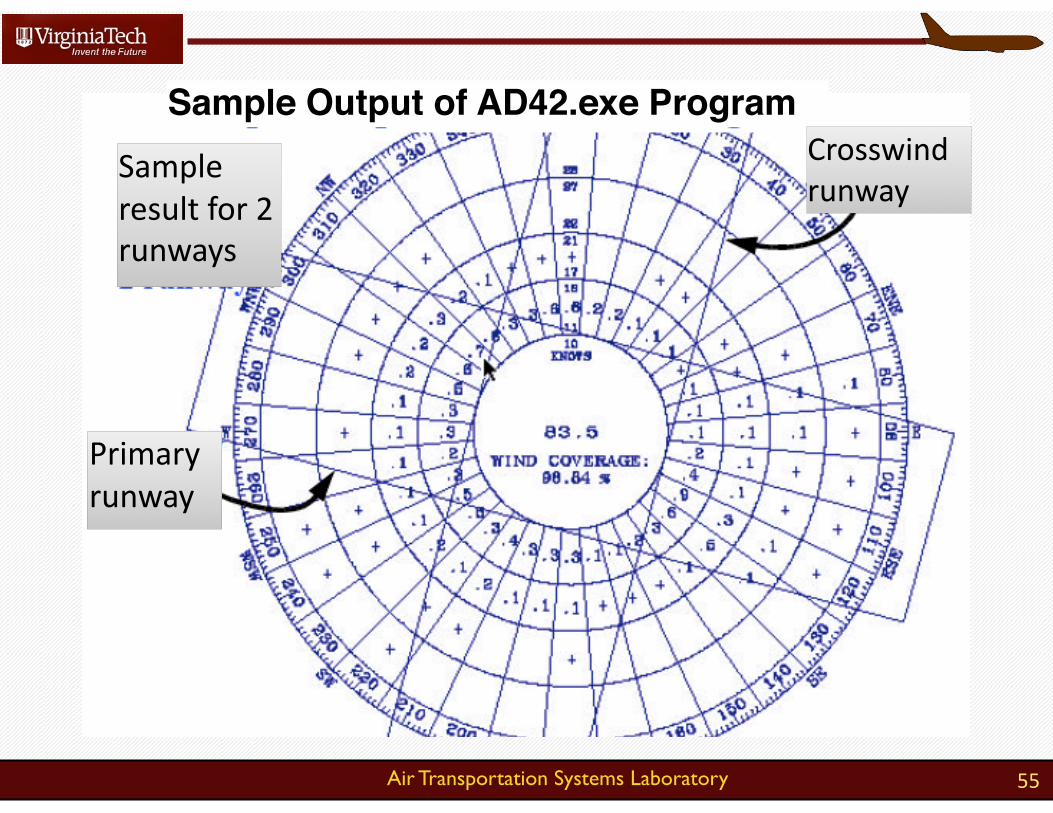
Sample Output of AD42.exe ProgramSampleresultfor2runways
Primaryrunway
Crosswindrunway
Air Transportation Systems Laboratory 56
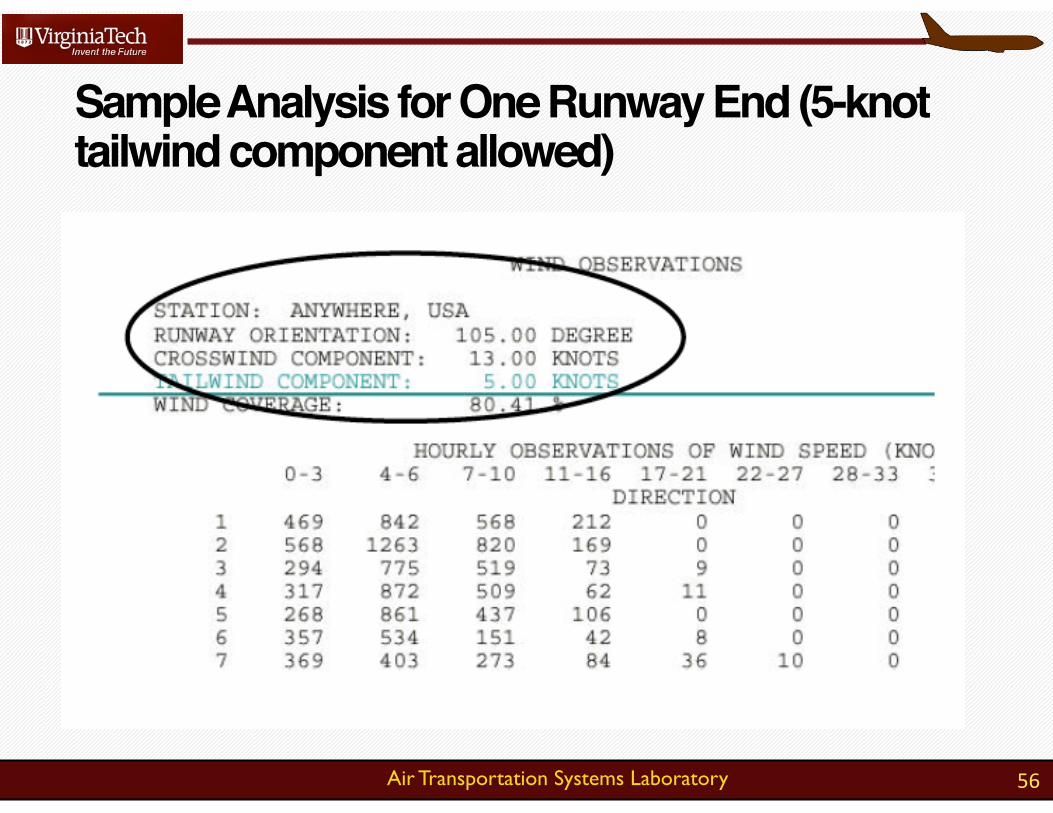
Sample Analysis for One Runway End (5-knot tailwind component allowed)
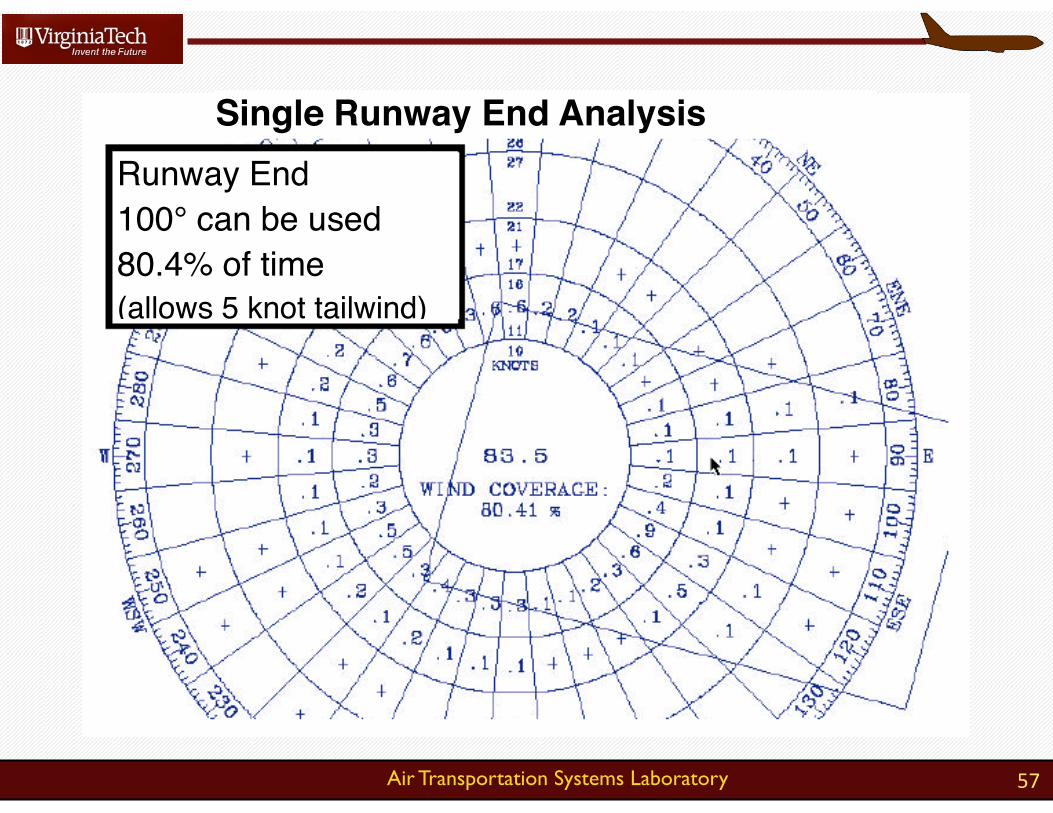
Air Transportation Systems Laboratory 57
Single Runway End AnalysisRunway End 100° can be used 80.4% of time (allows 5 knot tailwind)
Air Transportation Systems Laboratory
Runway Labels and Nomenclature
58
Air Transportation Systems Laboratory
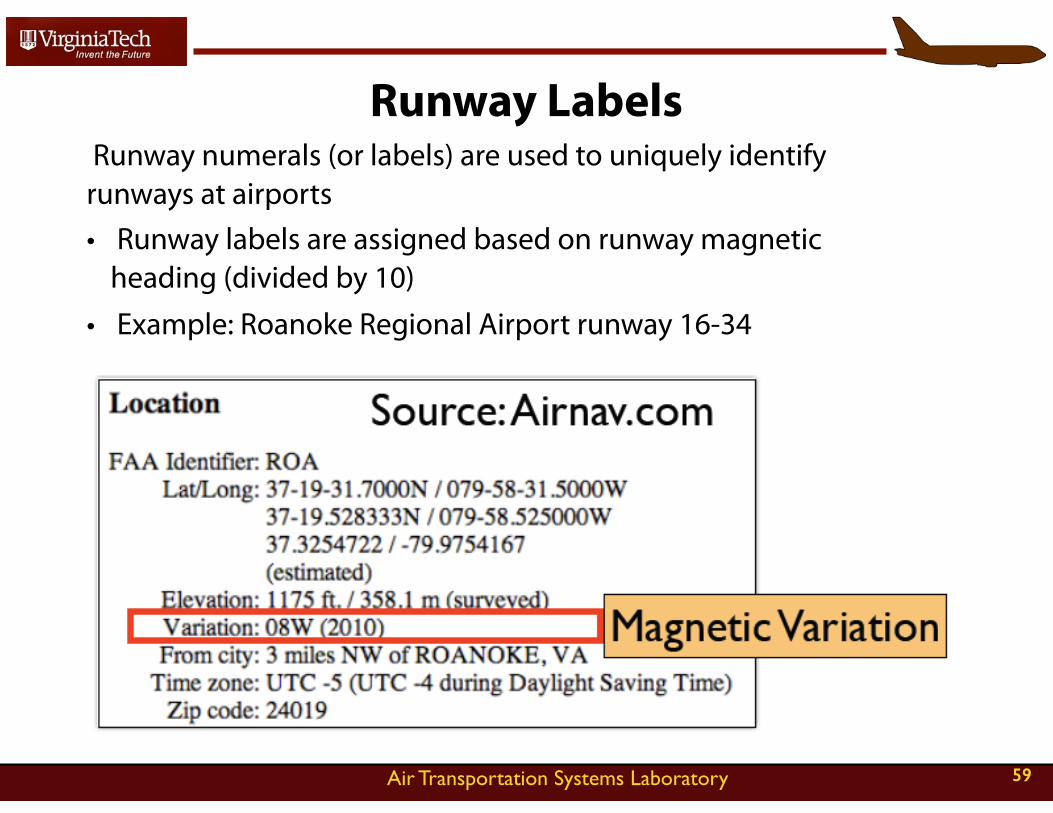
Runway Labels Runway numerals (or labels) are used to uniquely identify runways at airports • Runway labels are assigned based on runway magnetic
heading (divided by 10)
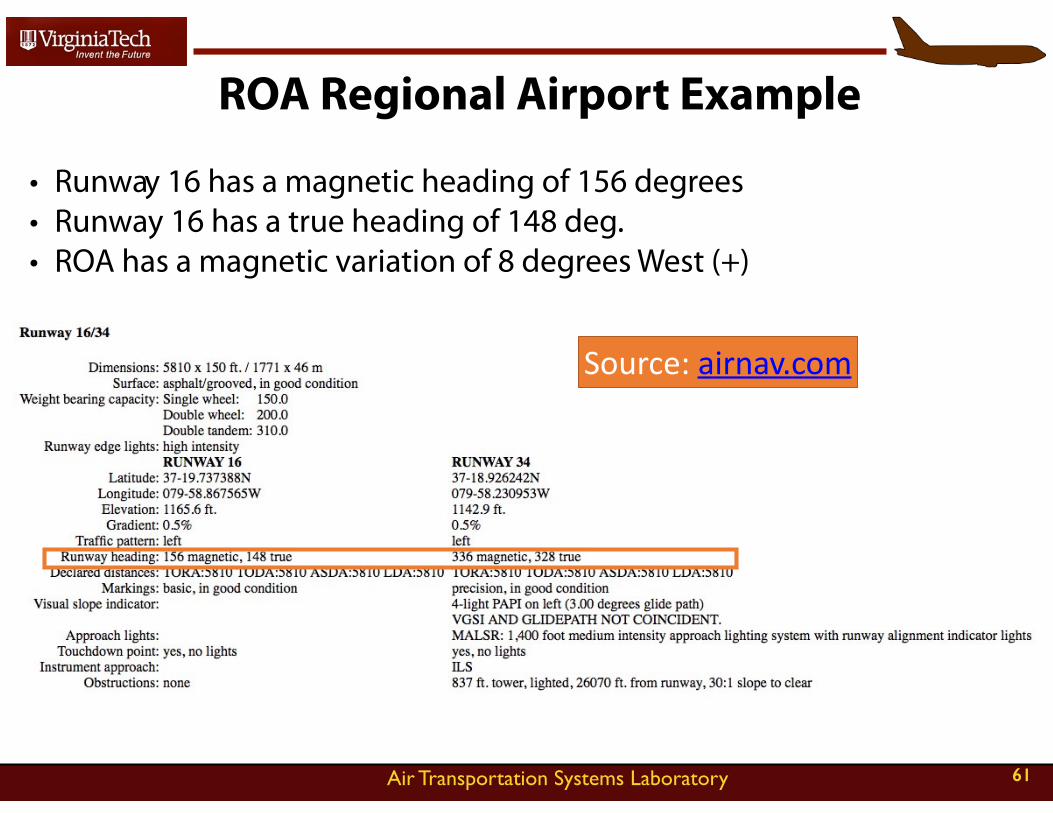
• Example: Roanoke Regional Airport runway 16-34
59
Air Transportation Systems Laboratory
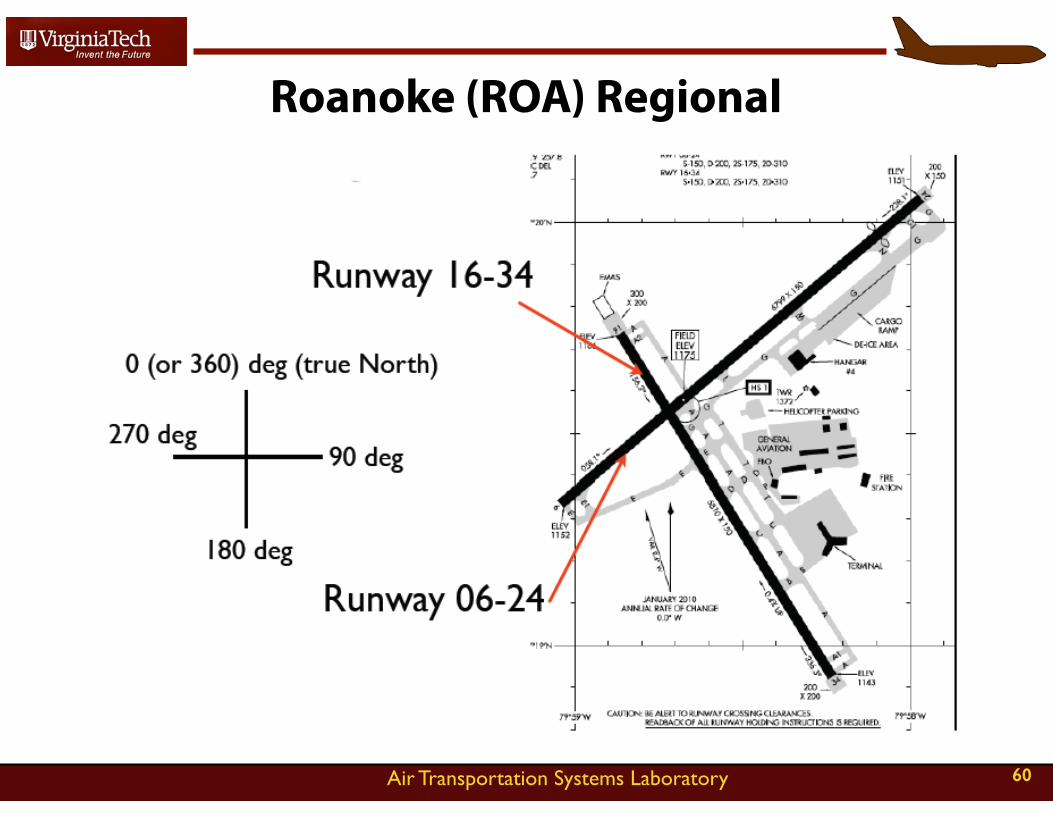
Roanoke (ROA) Regional
60
Air Transportation Systems Laboratory
ROA Regional Airport Example
• Runway 16 has a magnetic heading of 156 degrees • Runway 16 has a true heading of 148 deg. • ROA has a magnetic variation of 8 degrees West (+)
61
Source:airnav.com
Air Transportation Systems Laboratory
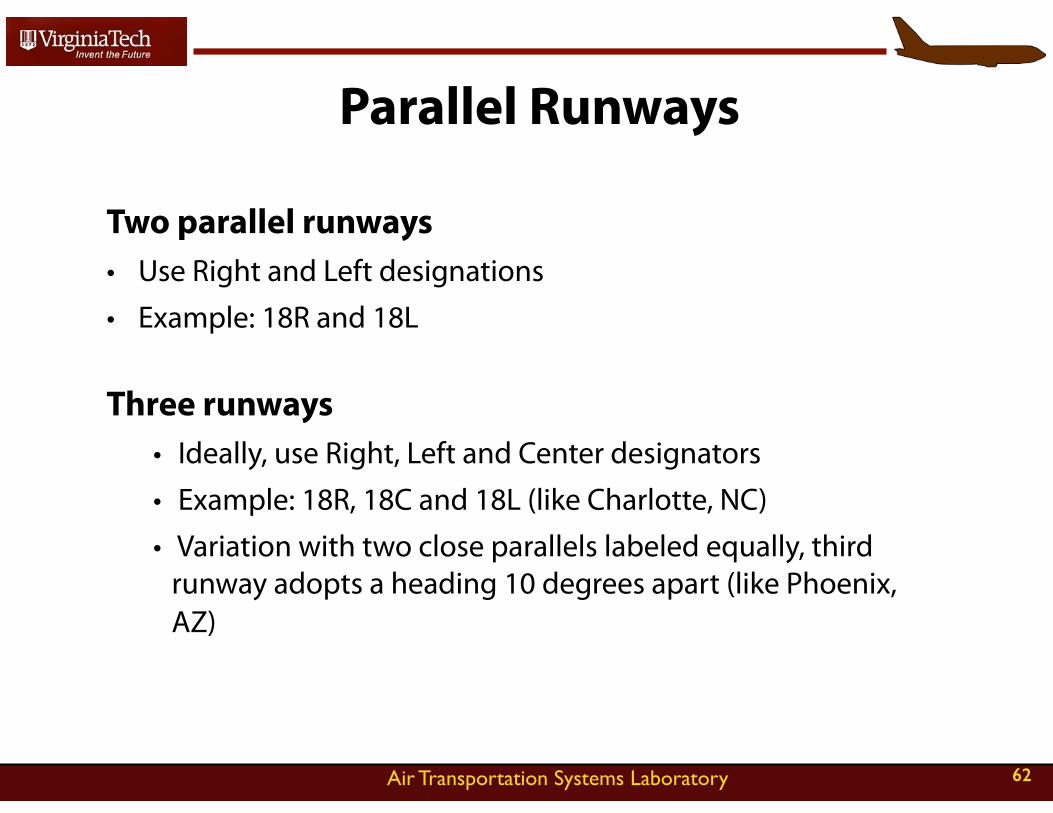
Parallel Runways
Two parallel runways • Use Right and Left designations
• Example: 18R and 18L
Three runways • Ideally, use Right, Left and Center designators
• Example: 18R, 18C and 18L (like Charlotte, NC)
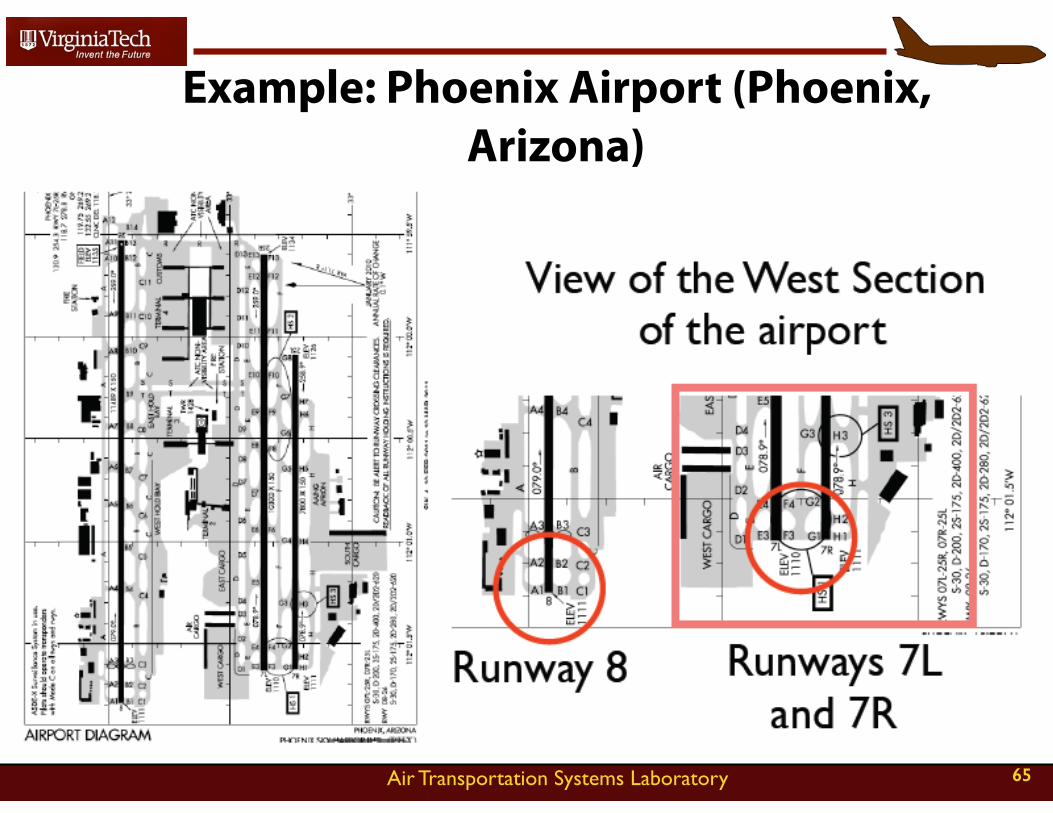
• Variation with two close parallels labeled equally, third runway adopts a heading 10 degrees apart (like Phoenix, AZ)
62
Air Transportation Systems Laboratory
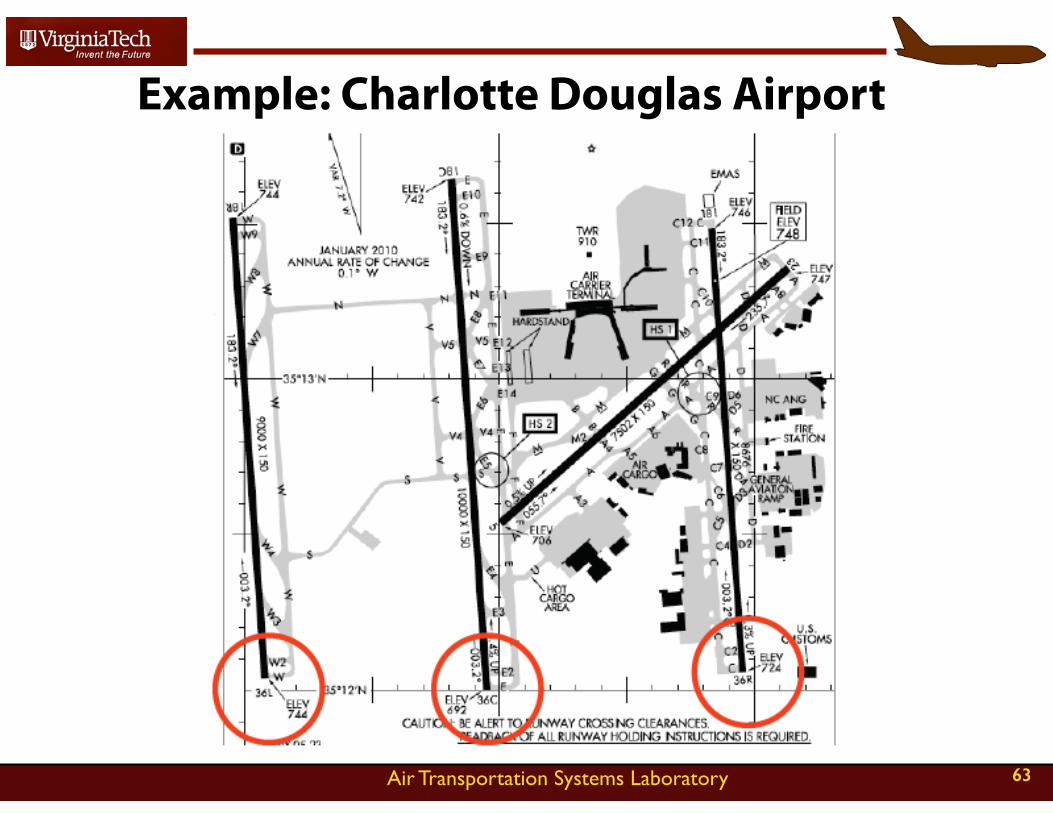
Example: Charlotte Douglas Airport
63
Air Transportation Systems Laboratory
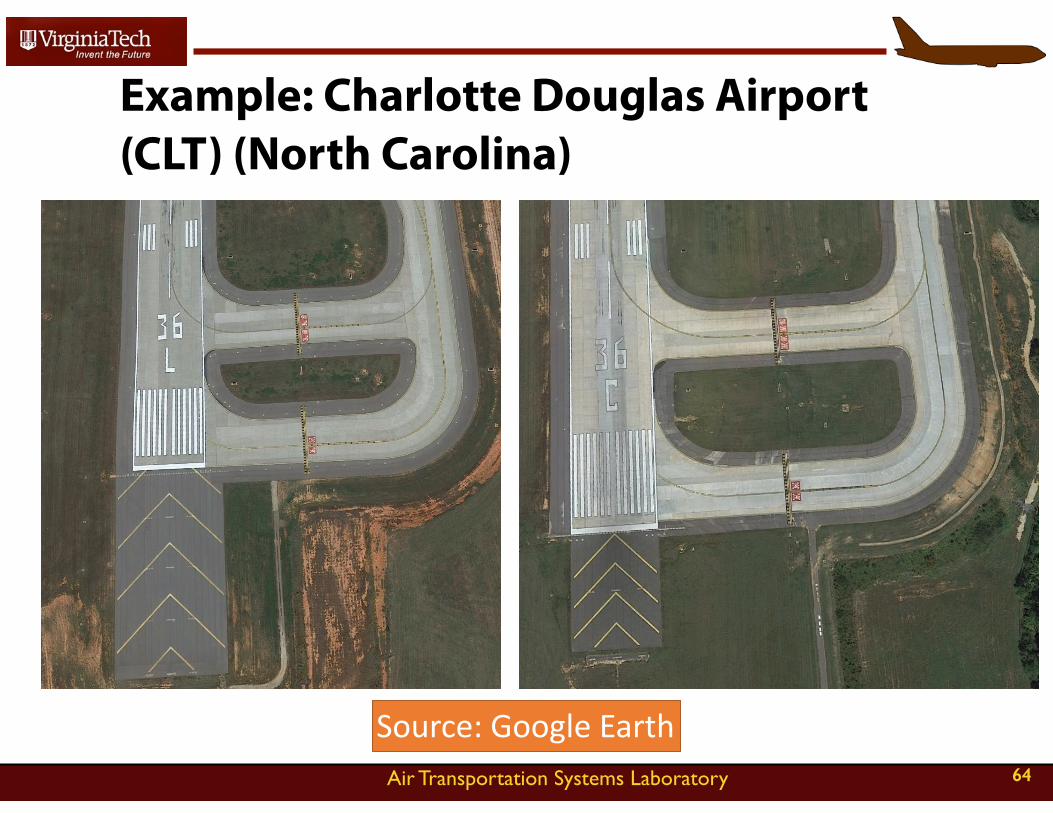
Example: Charlotte Douglas Airport (CLT) (North Carolina)
64
Source:GoogleEarth
Air Transportation Systems Laboratory
Example: Phoenix Airport (Phoenix, Arizona)
View of the West Section of the airport
Runway 8
Runways 7L and 7R
65
Air Transportation Systems Laboratory
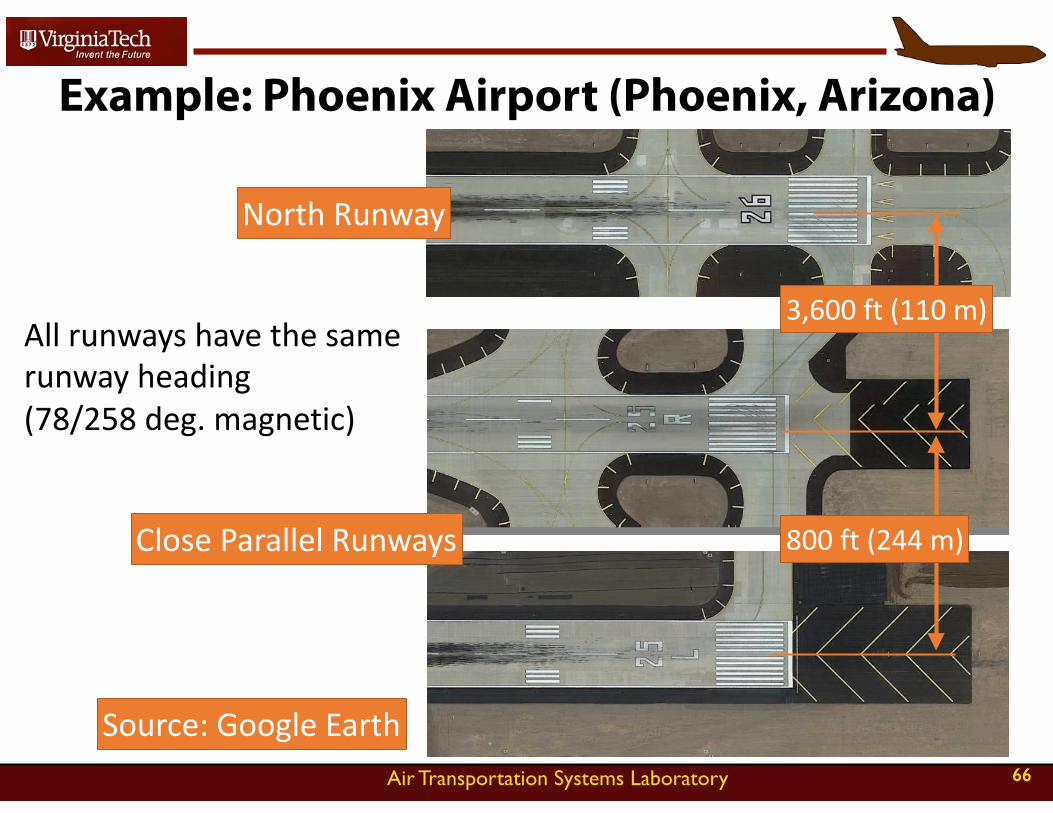
Example: Phoenix Airport (Phoenix, Arizona)
66
CloseParallelRunways
NorthRunway
Allrunwayshavethesamerunwayheading(78/258deg.magnetic)
3,600ft(110m)
800ft(244m)
Source:GoogleEarth
Air Transportation Systems Laboratory
Parallel Runways (4 or More)
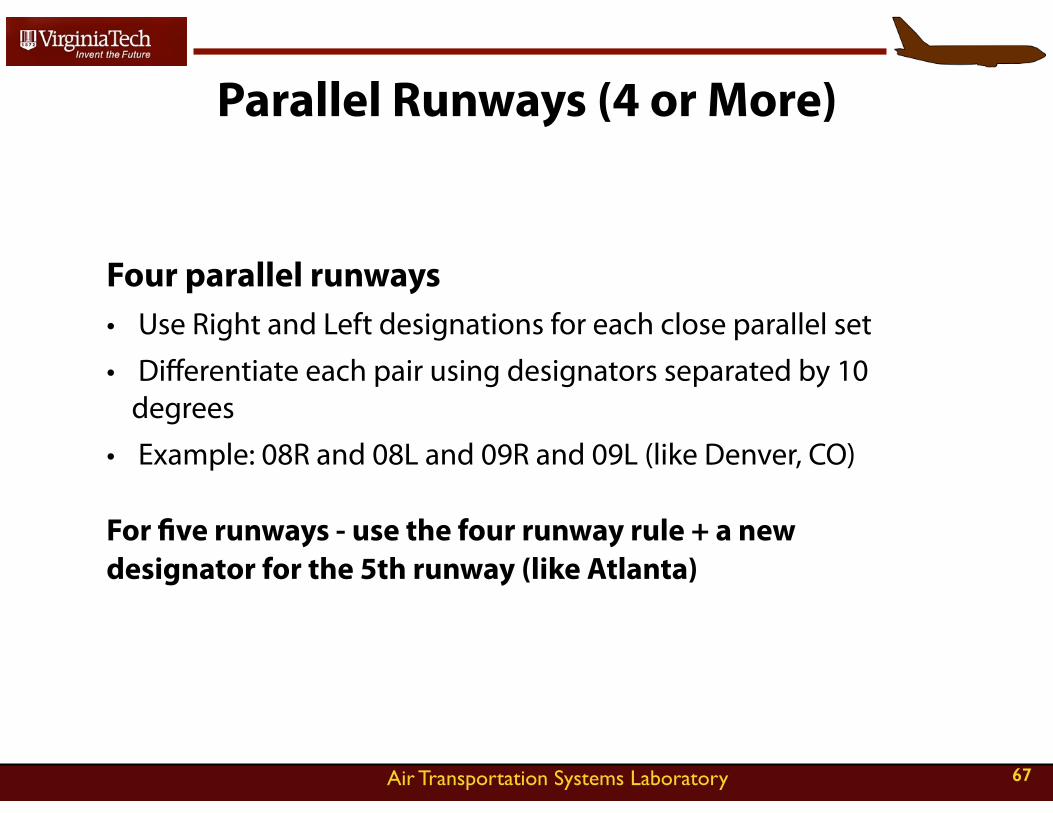
Four parallel runways • Use Right and Left designations for each close parallel set
• Differentiate each pair using designators separated by 10 degrees
• Example: 08R and 08L and 09R and 09L (like Denver, CO)
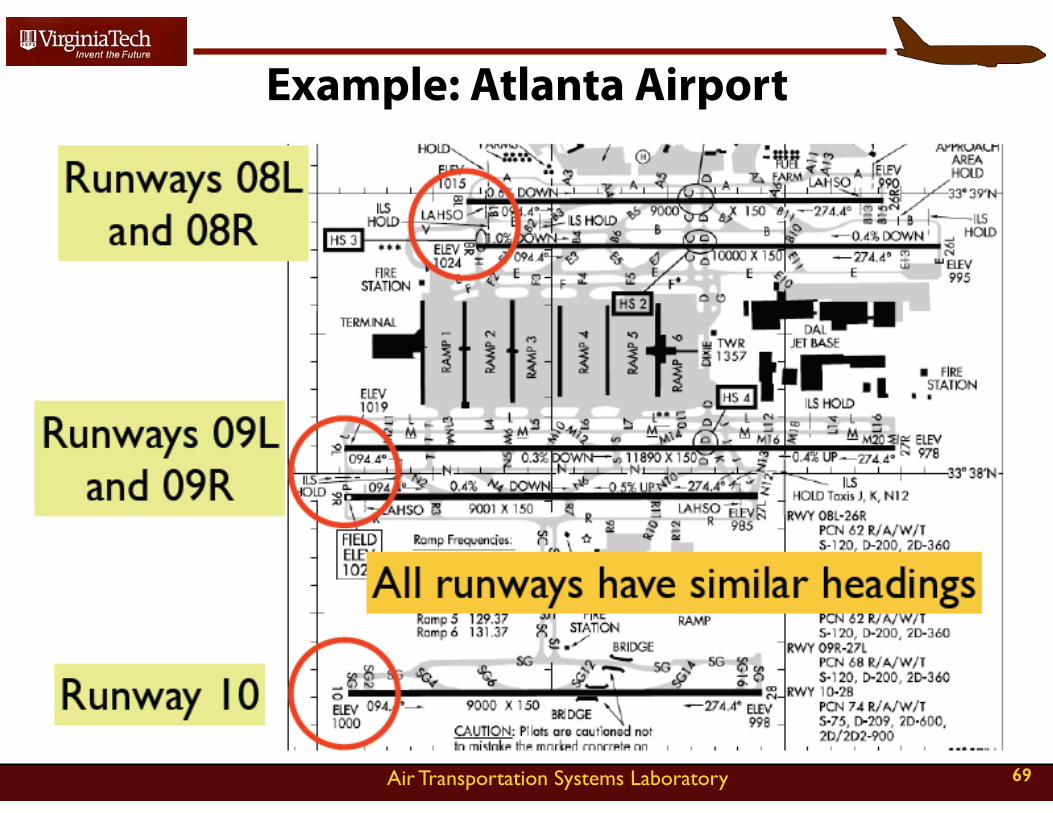
For five runways - use the four runway rule + a new designator for the 5th runway (like Atlanta)
67
Air Transportation Systems Laboratory
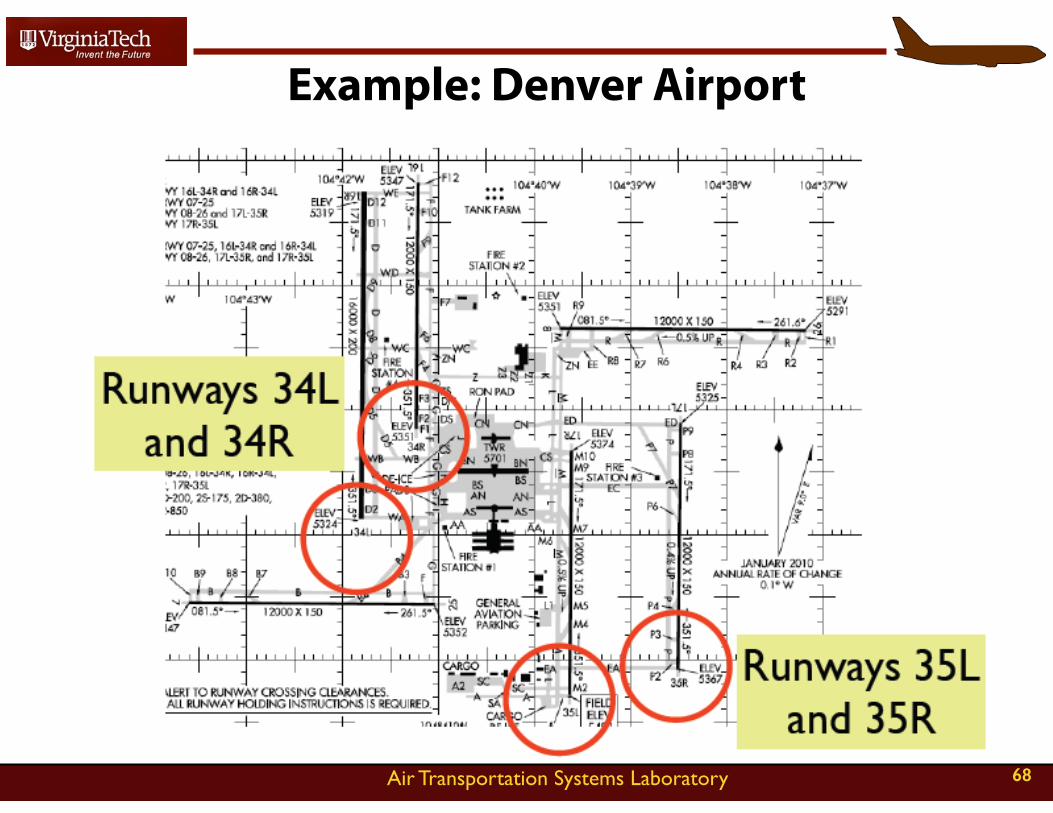
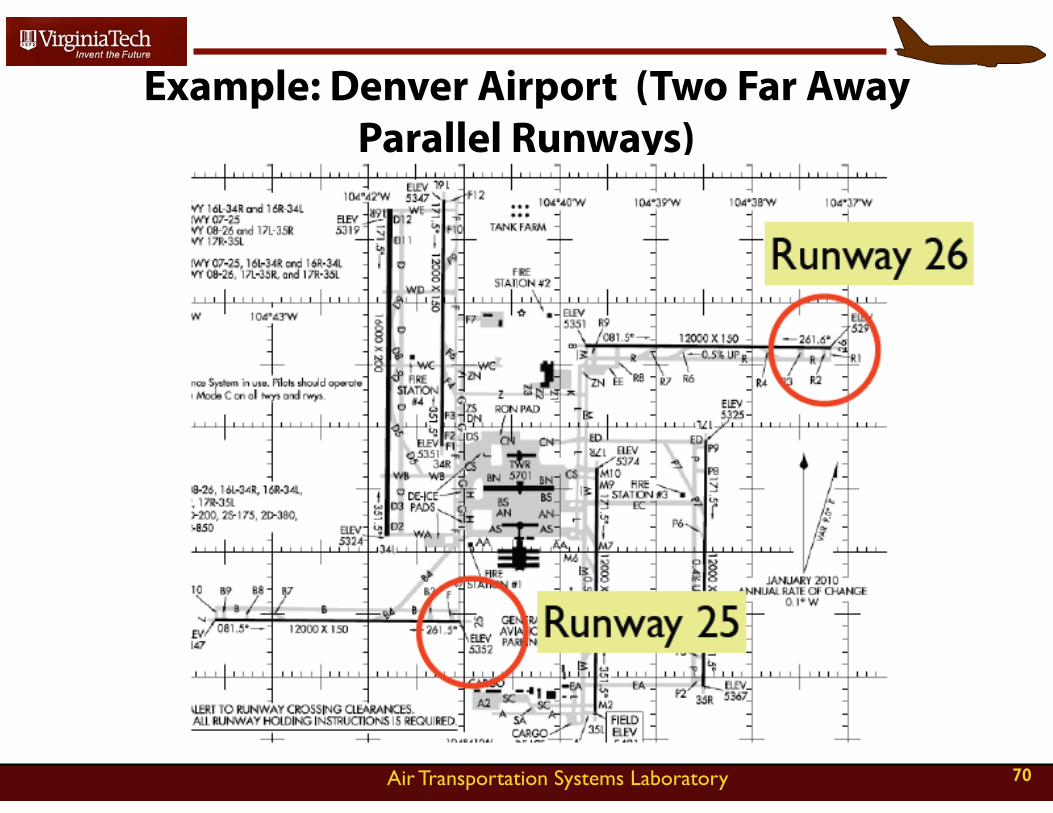
Example: Denver Airport
• Runways 34L and 34R
Runways 35L and 35R
68
Air Transportation Systems Laboratory
Example: Atlanta Airport
Runways 09L and 09R
Runways 08L and 08R Runway 10
All runways have similar headings
69
Air Transportation Systems Laboratory
Example: Denver Airport (Two Far Away Parallel Runways)
70