Our Residential criteria guide - TSB Mortgage Intermediaries
DI
SC
US
SI
ON
P
AP
ER
S
ER
IE
S
Forschungsinstitut zur Zukunft der ArbeitInstitute for the Study of Labor
Detecting Mortgage Delinquencies
IZA DP No. 5895
July 2011
Nikolaos AskitasKlaus F. Zimmermann
Detecting Mortgage Delinquencies
Nikolaos Askitas IZA
Klaus F. Zimmermann IZA and University of Bonn
Discussion Paper No. 5895 July 2011
IZA
P.O. Box 7240 53072 Bonn
Germany
Phone: +49-228-3894-0 Fax: +49-228-3894-180
E-mail: [email protected]
Any opinions expressed here are those of the author(s) and not those of IZA. Research published in this series may include views on policy, but the institute itself takes no institutional policy positions. The Institute for the Study of Labor (IZA) in Bonn is a local and virtual international research center and a place of communication between science, politics and business. IZA is an independent nonprofit organization supported by Deutsche Post Foundation. The center is associated with the University of Bonn and offers a stimulating research environment through its international network, workshops and conferences, data service, project support, research visits and doctoral program. IZA engages in (i) original and internationally competitive research in all fields of labor economics, (ii) development of policy concepts, and (iii) dissemination of research results and concepts to the interested public. IZA Discussion Papers often represent preliminary work and are circulated to encourage discussion. Citation of such a paper should account for its provisional character. A revised version may be available directly from the author.
IZA Discussion Paper No. 5895 July 2011
ABSTRACT
Detecting Mortgage Delinquencies Economic hardship is strongly reflected by the housing market. It is the concern of much research, but its analysis is often obstructed by insufficient lagged data. This paper evaluates search intensity for “hardship letter” from Google Insights to detect ensuing mortgage delinquencies. Such searches locate documents which assist to write a successful loan modification request. Other relevant searches for “short sale”, “REO” (as in Real Estate Owned) or “FHA” (as in Federal Housing Administration) are used to provide a comprehensive view of the housing market. Using data from the great recession and benchmarking them against data from the labor market, the paper demonstrates that internet activity captures socioeconomic phenomena in real time very well, with no interviewer effect at a high frequency. This suggests that the new data base should spur new housing research. JEL Classification: C81, E65, G21, R31 Keywords: housing, hardship letter, loan delinquency, mortgage, National Delinquency Survey (NDS), financial crisis, recession, bubble, Google Insights Corresponding author: Nikolaos Askitas IZA P.O. Box 7240 53072 Bonn Germany E-mail: [email protected]
1. Introduction
During its lifecycle (construction, sale, renovation, resale) a house causes demand for a wide
range of raw material and a diverse amount of labor. By the time it becomes a home it also
generates consumer demand for a diverse array of home equipment. This is part of the reason
that housing markets are important for national economies. The significance of a home and of
homeownership for the lives of people is quite likely the prime force underlying this importance,
but also the basis on which bad mortgaging, speculation, bubbles and other irrationalities occur.
Nonetheless, conventional economic wisdom, not entirely unfounded, maintains that as the housing
market goes so goes the rest of the economy for the US. This is easily seen to be the case in the
recent great depression: the “Great Surge in mortgage defaults” (Dennis R. Capozza and Robert
Van Order (2011)) was crowned by a financial and economic crisis which manifested themselves as
such in the Fall of 2008.
The housing crisis was at the heart of the great depression. For an extended period, rising house
prices had been the basis for a stable consumer demand. When the value of houses fell and the
housing market collapsed, this was detrimental for consumption and for the whole US economy.1
Therefore, economic research needs to measure and understand its’ nature at an early stage. Early
data availability is one crucial challenge.
One way to get a sense for the size of the US housing market is to consider that the sample
used by the Mortgage Bankers Association (mortgagebankers.org) to construct their National
Delinquency Survey (NDS) includes about 44 millions loans held by “mortgage companies, com-
mercial banks, thrifts, credit unions and others”. A market of that size is highly important both in
terms of its economic relevance and the amount of people it affects. According to the NDS, during
the recent economic crisis, the total percent of delinquent loans went from 4.41% at the beginning
of 2006 to 10.1% at the beginning of 2010 when within the NDS sample alone we had 4.5 million
delinquent loans. In the same time interval quarterly foreclosures went from .98% to 4.63%.
In May of 2008, Angelo Mozilo, then Chairman of the board and CEO of a mortgage company
called Countrywide Financial, made the news2 by accidentally hitting “reply” instead of “forward”
in response to an e-mail from a distressed homeowner in North Carolina. The homeowner, who
1However, as Molloy and Shan (2011) have shown, foreclosures on residential mortgages do not generate aneconomic burden strong enough to severely reduce housing consumption.
2http://articles.latimes.com/2008/may/21/business/fi-mozilo21
2
apparently was facing or anticipating an inability to make mortgage payments on time, had written
a letter to request a loan modification and emailed it directly to the Office of the President of
Countrywide. Angelo Mozilo who apparently thought he was forwarding the email to one of his
people commented it as follows:
“This is unbelievable. Most of these letters now have the same wording. Obviously
they are being counseled by some other person or by the internet. Disgusting.”
Apparently, the homeowner who received the inadvertent reply with the comment made the
email exchange public. Countrywide Financial, which in 2006 was the nation’s “largest mortgage
lender”,3 was by then failing and was purchased by Bank of America4. Mozilo who at that moment
must have been confronted with a prolonged rise in loan delinquencies saw it right. As more and
more homeowners were entering financial hardship they sought help by writing loan modification
requests to the banks holding their mortgages and the internet was their prime resource: a number
of sites offered advice on the subject matter, loansafe.org being among the most prominent.
Our paper investigates the importance of mortgages for the early detection of deteriorating
economic conditions. More specifically we want to detect the likelihood of mortgage delinquency
as early as the homeowners themselves sense upcoming difficulties. One way to do this would be
to simply count Mozilo’s letters. Since this is obviously impossible, we use Google Insights to find
a proxy indicator that approximates their number. Such a letter is called a hardship letter and
Mozilo had already seen that they are very much alike. This is of course because people search
on the internet using terms like“hardship letter template” or “how to write a hardship letter”.
By counting the volumes of searches which contain hardship letter we can indeed detect loan
delinquency in its early stages before any other indicator could possible pick it up. We look at
a number of other relevant searches such as short sale, REO (“Real Estate Owned” ) and FHA
(Federal Housing Administration).
The paper is organized as follows. In Section 2 we discuss the elements of an Internet Search
Theory for the Social Sciences, and present our data provisioning service: Google Insights. Section
3 contains the empirical results. We conclude with Section 4.
3http://www.nytimes.com/2007/08/26/business/yourmoney/26country.html4See http://www.marketwatch.com/story/bank-of-america-to-buy-countrywide-financial-for-4-billion
3
2. Internet Search: Concept and Practice
Online is a “place” where diverse socioeconomic activity takes place. From online banking,
entertainment and shopping to informal education, social networking and information discovery
the internet is a central resource for the lives of people in modern societies. The study of internet
activity is therefore of increasing importance for social sciences. Search is a vital component of this
activity in that it indexes the enormous stock of online “documents” and makes them tractable
for the user population. An individual’s interest in certain documents (and not in others) is a
function of the individual’s state and so are search queries which are used to locate them. These
queries are therefore utterances worth being investigated and their collection can be thought of
as an involuntary, high-frequency and variable-frequency panel survey. The panel nature has
tremendous potential, but is less likely to be usable in the near future on grounds of data privacy
and protection.
Individuals performing internet searches are protected by anonymity and the privacy of their
internet session. Such searches are therefore, involuntary and hence contain no interviewer effects.5
This is a very important property in some contexts such as health studies (Askitas and Zimmermann
(2011)). Protecting the privacy of individuals, in this context, is important and raises many
interesting legal and ethical issues. These utterances come in a high but variable frequency with a
panel nature generating advantages and challenges at the same time. Since the data inherits the
internet’s own geographic distribution it also has a huge cross-sectional potential.
Focusing on certain types of properly chosen queries, we may be able to successfully define prox-
ies of the documents they locate and hence measure proxies of the individual’s state. Reasonably
defined aggregate measures of intensity by which certain classes of searches are pursued may then
be thought of as a sort of indicator of the degree of proliferation of a certain condition. In societies
with high internet penetration, the reservoir of internet users is also a reasonably representative
sample of the general population. The type of socioeconomic phenomena we may be able to detect
range from emotional, psychological and physical health, epidemics, economic conditions, crime
etc.
5Internet activity data have been used before as a reliable data base for econometric investigations. See Askitasand Zimmermann (2009) for a seminal use of Google activity data for the analysis of unemployment data in the greatdepression. See also Kulkarni, Haynes, Stough and Paelinck (2009) for using Google activity data to predict houseprices as well as McLaren and Shanbhogue (2011 Q2) for more recent efforts.
4
Finally, search represents only the demand side in this context. The supply of documents
through internet platforms is equally important but it is not easy to get access to this type of data
at the moment. Future research would benefit from a merger of supply side data with internet
search data.
In this paper we use Google Insights data (see http://www.google.com/insights/search/).
Since the summer of 2008, Google Insights allows a limited view into relative search volumes. For
chosen regional, temporal, search term specific and Google category specific parameters, Google
Insights will return weekly or monthly time series starting as far back as 2004. One can query
Google Insights for searches which contain specific terms, disjunctions thereof as well as comple-
ments: Jobs -Steve will give you search intensity for the class of searches containing Jobs without
those which also contain Steve. Google divides all search in categories such as Health or Automo-
tive and volumes of search classes can be obtained relative to a category (restricting jobs searches
in the classifieds category helps take out the noise coming from “Steve”).
Comparative queries are possible: up to 5 search terms in a single geographic unit for any time
interval or a single search term in up to five geographic regions in any time interval. Volumes are
scaled and normalized as follows: All data points of the time series will be normalized by dividing
the search term volume with the total search volume in the reference time interval (day, week,
month). This means if the keyword K has Ki searches in the i-th reference time point and the
total Google search volume therein is Gi then the measurement is N(Ki) = Ki/Gi. The latter will
then be scaled by setting the maximum value equal to 100 and scaling the rest accordingly, i.e. the
series based on Google Insights is then I(Ki) = N(Ki)maxi{N(Ki)}100. This means that two search terms
queries in a comparative modus deliver relative volumes which are nonetheless comparable with
each other. Finally, sampling is involved in generating these numbers and the results are robust
for high enough values. For low values results may be unreliable and caution should be applied.
3. Results
In this section we will present our results by isolating some key internet searches that best
capture the housing market developments in the time interval 2006-2011. This interval contains
a time span“before” the current economic and financial crisis. The date we will use to split time
into one segment before and one after the crisis is October 3 2008 on which the Troubled Assets
Rescue Program (TARP) was signed into effect.
5
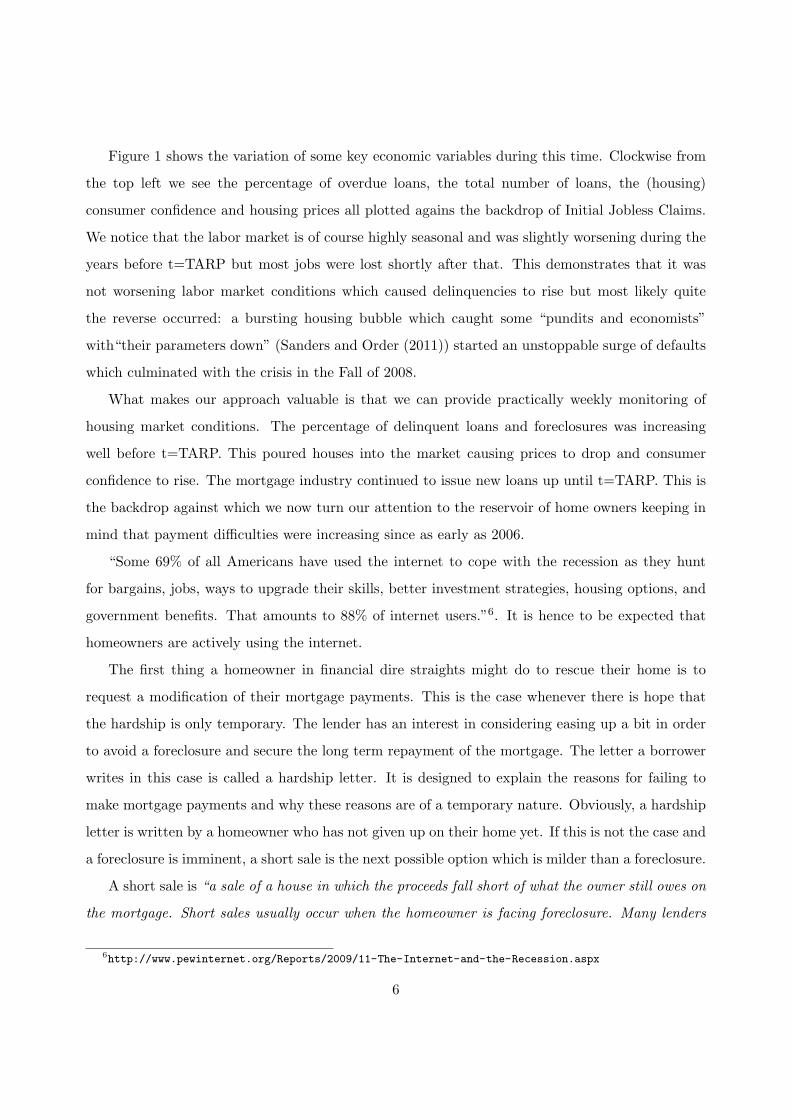
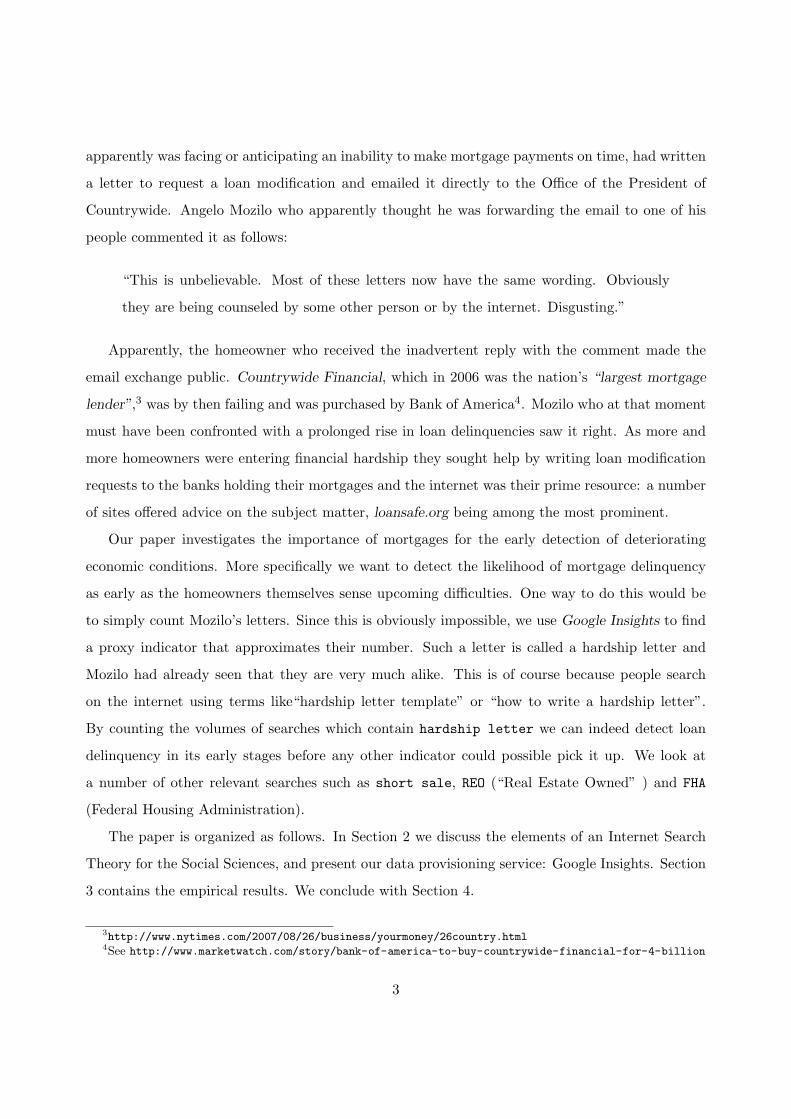
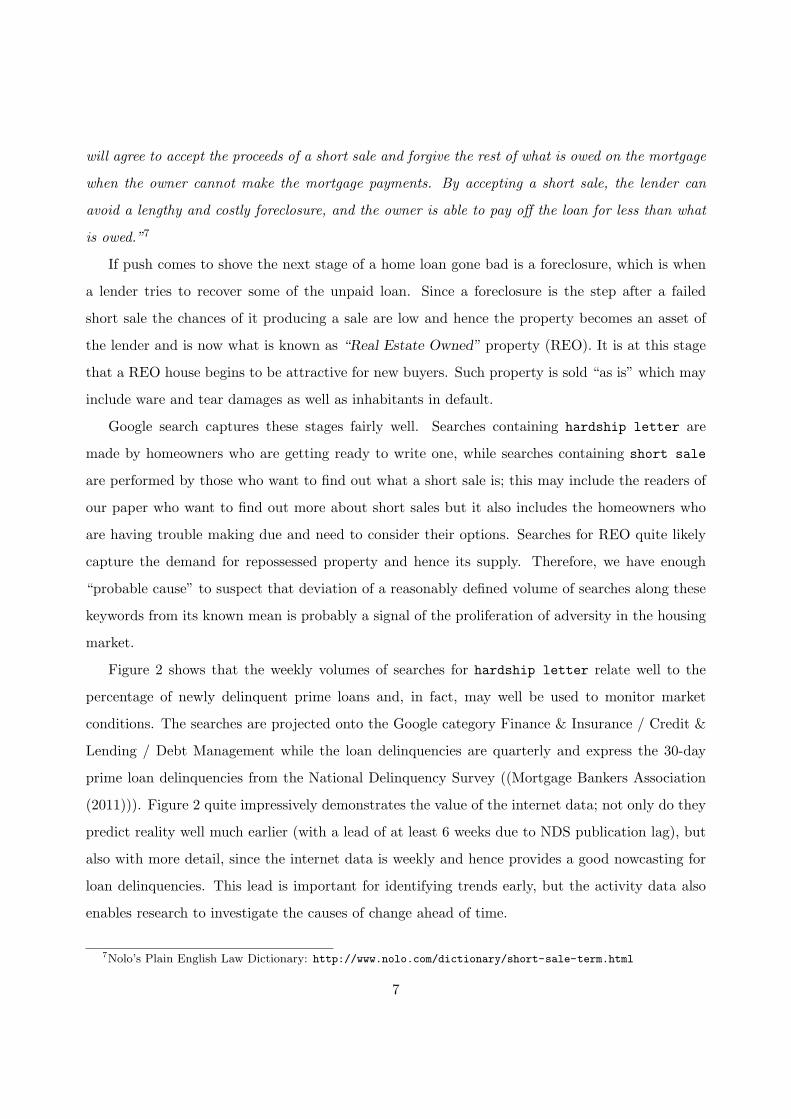
Figure 1 shows the variation of some key economic variables during this time. Clockwise from
the top left we see the percentage of overdue loans, the total number of loans, the (housing)
consumer confidence and housing prices all plotted agains the backdrop of Initial Jobless Claims.
We notice that the labor market is of course highly seasonal and was slightly worsening during the
years before t=TARP but most jobs were lost shortly after that. This demonstrates that it was
not worsening labor market conditions which caused delinquencies to rise but most likely quite
the reverse occurred: a bursting housing bubble which caught some “pundits and economists”
with“their parameters down” (Sanders and Order (2011)) started an unstoppable surge of defaults
which culminated with the crisis in the Fall of 2008.
What makes our approach valuable is that we can provide practically weekly monitoring of
housing market conditions. The percentage of delinquent loans and foreclosures was increasing
well before t=TARP. This poured houses into the market causing prices to drop and consumer
confidence to rise. The mortgage industry continued to issue new loans up until t=TARP. This is
the backdrop against which we now turn our attention to the reservoir of home owners keeping in
mind that payment difficulties were increasing since as early as 2006.
“Some 69% of all Americans have used the internet to cope with the recession as they hunt
for bargains, jobs, ways to upgrade their skills, better investment strategies, housing options, and
government benefits. That amounts to 88% of internet users.”6. It is hence to be expected that
homeowners are actively using the internet.
The first thing a homeowner in financial dire straights might do to rescue their home is to
request a modification of their mortgage payments. This is the case whenever there is hope that
the hardship is only temporary. The lender has an interest in considering easing up a bit in order
to avoid a foreclosure and secure the long term repayment of the mortgage. The letter a borrower
writes in this case is called a hardship letter. It is designed to explain the reasons for failing to
make mortgage payments and why these reasons are of a temporary nature. Obviously, a hardship
letter is written by a homeowner who has not given up on their home yet. If this is not the case and
a foreclosure is imminent, a short sale is the next possible option which is milder than a foreclosure.
A short sale is “a sale of a house in which the proceeds fall short of what the owner still owes on
the mortgage. Short sales usually occur when the homeowner is facing foreclosure. Many lenders
6http://www.pewinternet.org/Reports/2009/11-The-Internet-and-the-Recession.aspx
6
will agree to accept the proceeds of a short sale and forgive the rest of what is owed on the mortgage
when the owner cannot make the mortgage payments. By accepting a short sale, the lender can
avoid a lengthy and costly foreclosure, and the owner is able to pay off the loan for less than what
is owed.”7
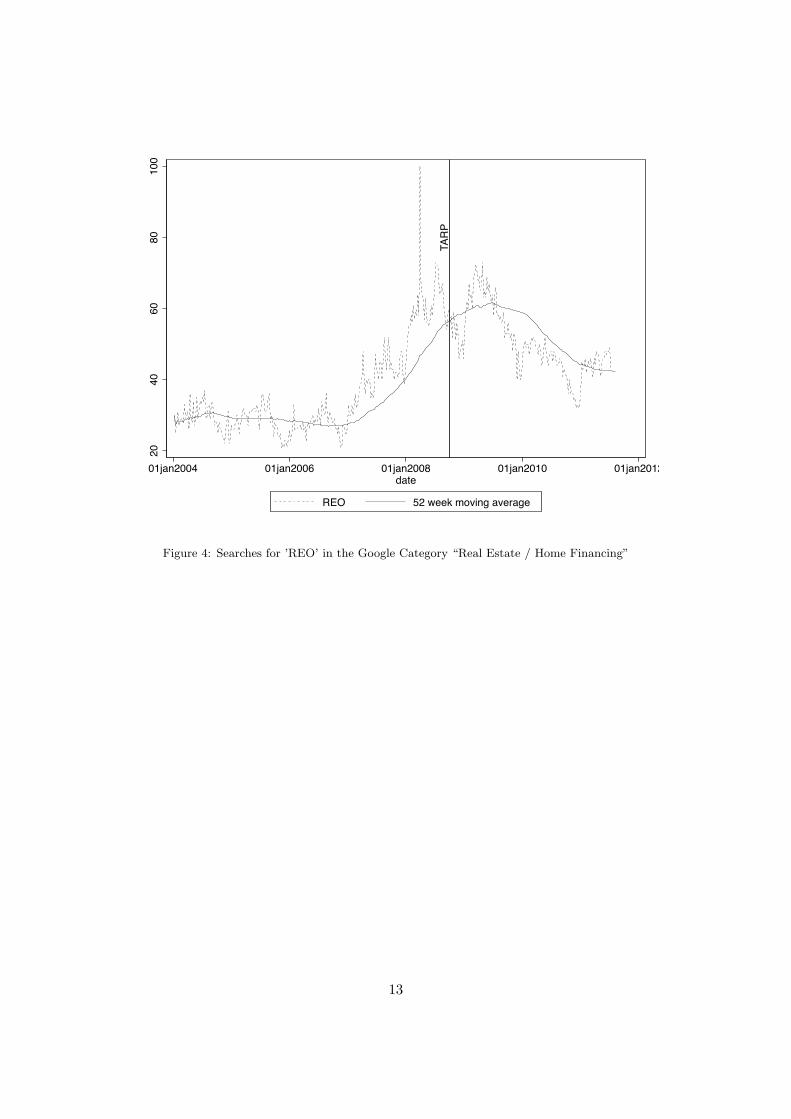
If push comes to shove the next stage of a home loan gone bad is a foreclosure, which is when
a lender tries to recover some of the unpaid loan. Since a foreclosure is the step after a failed
short sale the chances of it producing a sale are low and hence the property becomes an asset of
the lender and is now what is known as “Real Estate Owned” property (REO). It is at this stage
that a REO house begins to be attractive for new buyers. Such property is sold “as is” which may
include ware and tear damages as well as inhabitants in default.
Google search captures these stages fairly well. Searches containing hardship letter are
made by homeowners who are getting ready to write one, while searches containing short sale
are performed by those who want to find out what a short sale is; this may include the readers of
our paper who want to find out more about short sales but it also includes the homeowners who
are having trouble making due and need to consider their options. Searches for REO quite likely
capture the demand for repossessed property and hence its supply. Therefore, we have enough
“probable cause” to suspect that deviation of a reasonably defined volume of searches along these
keywords from its known mean is probably a signal of the proliferation of adversity in the housing
market.
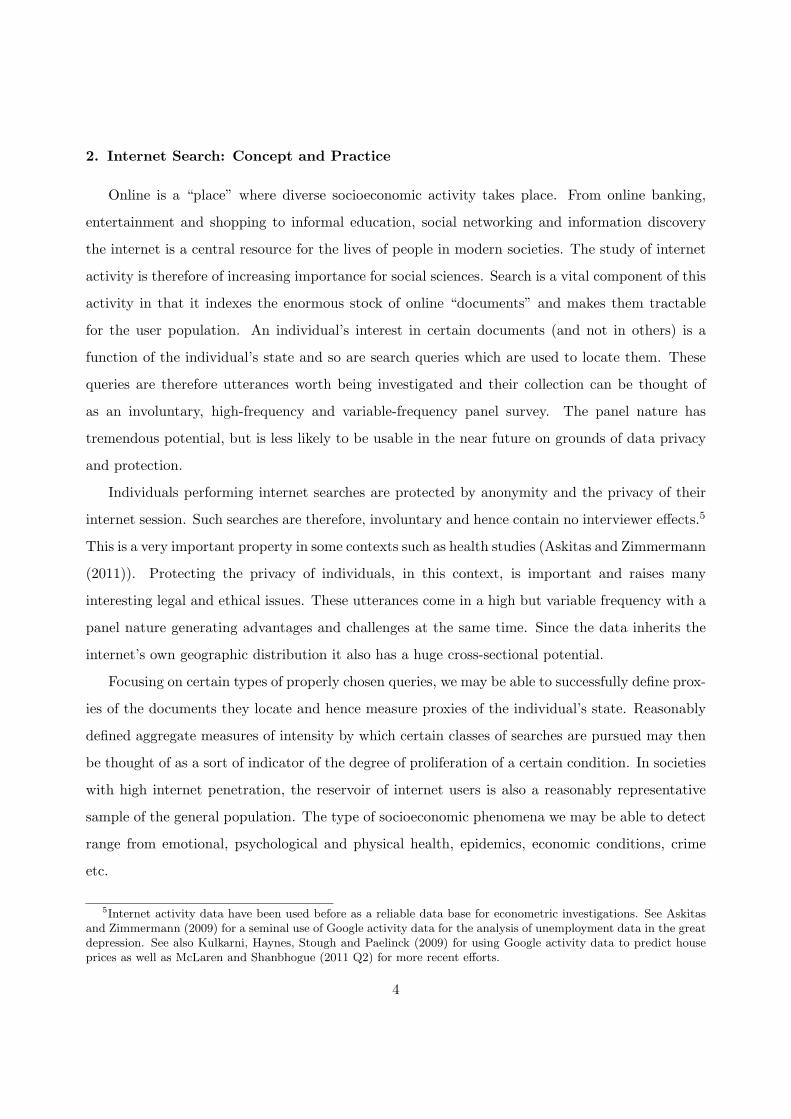
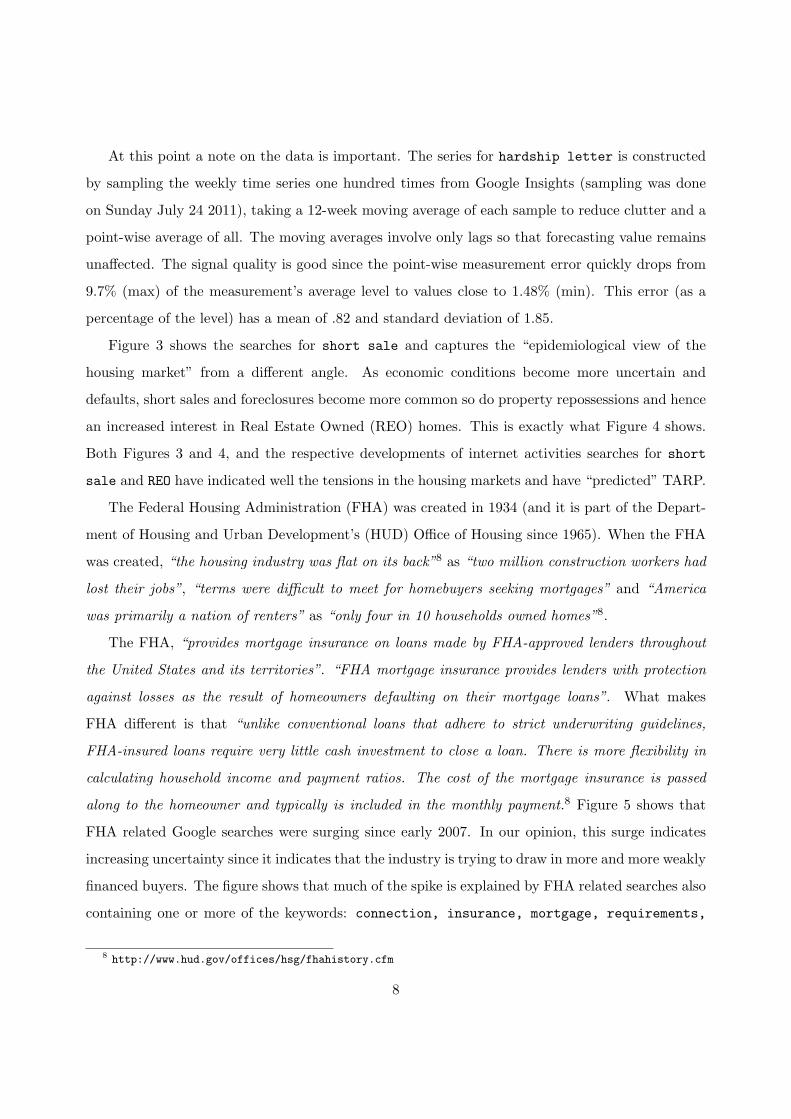
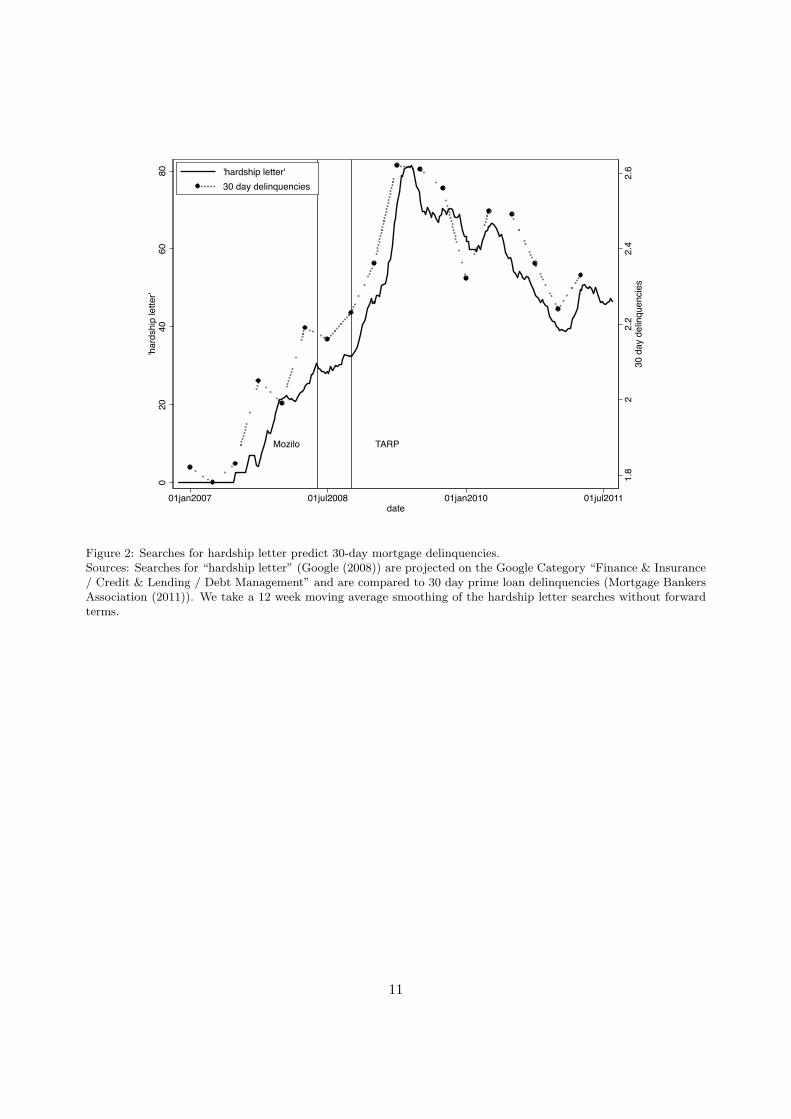
Figure 2 shows that the weekly volumes of searches for hardship letter relate well to the
percentage of newly delinquent prime loans and, in fact, may well be used to monitor market
conditions. The searches are projected onto the Google category Finance & Insurance / Credit &
Lending / Debt Management while the loan delinquencies are quarterly and express the 30-day
prime loan delinquencies from the National Delinquency Survey ((Mortgage Bankers Association
(2011))). Figure 2 quite impressively demonstrates the value of the internet data; not only do they
predict reality well much earlier (with a lead of at least 6 weeks due to NDS publication lag), but
also with more detail, since the internet data is weekly and hence provides a good nowcasting for
loan delinquencies. This lead is important for identifying trends early, but the activity data also
enables research to investigate the causes of change ahead of time.
7Nolo’s Plain English Law Dictionary: http://www.nolo.com/dictionary/short-sale-term.html
7
At this point a note on the data is important. The series for hardship letter is constructed
by sampling the weekly time series one hundred times from Google Insights (sampling was done
on Sunday July 24 2011), taking a 12-week moving average of each sample to reduce clutter and a
point-wise average of all. The moving averages involve only lags so that forecasting value remains
unaffected. The signal quality is good since the point-wise measurement error quickly drops from
9.7% (max) of the measurement’s average level to values close to 1.48% (min). This error (as a
percentage of the level) has a mean of .82 and standard deviation of 1.85.
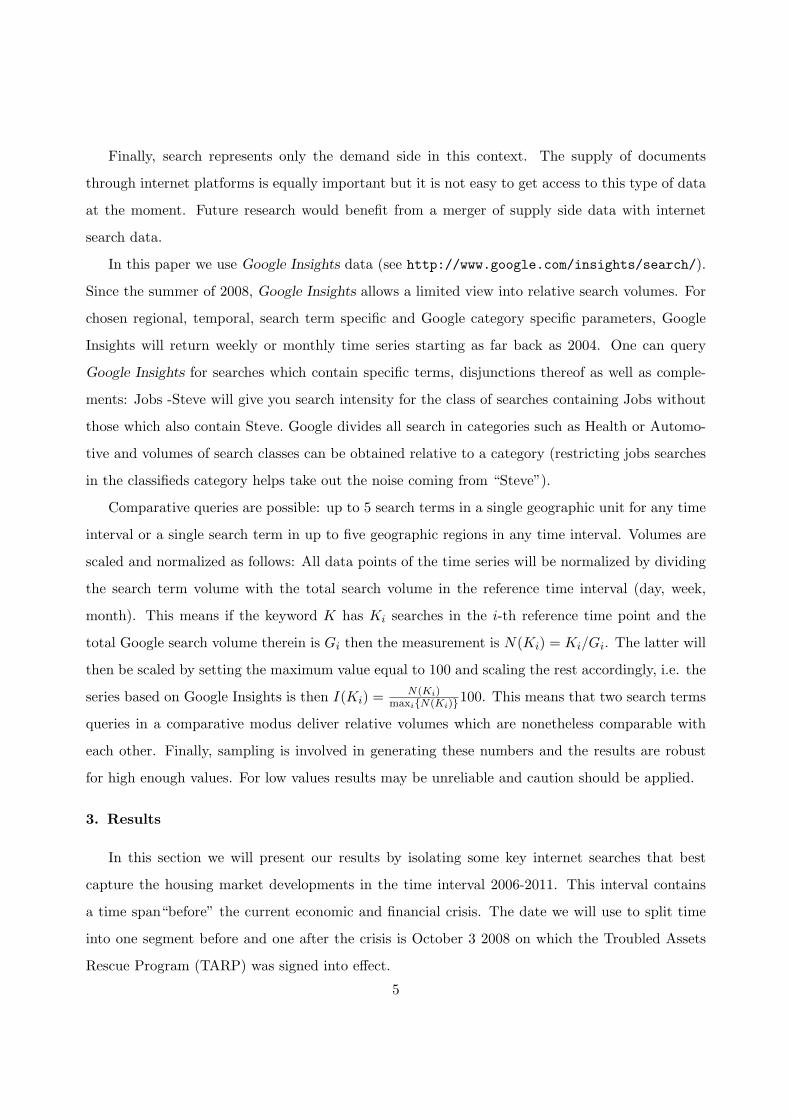
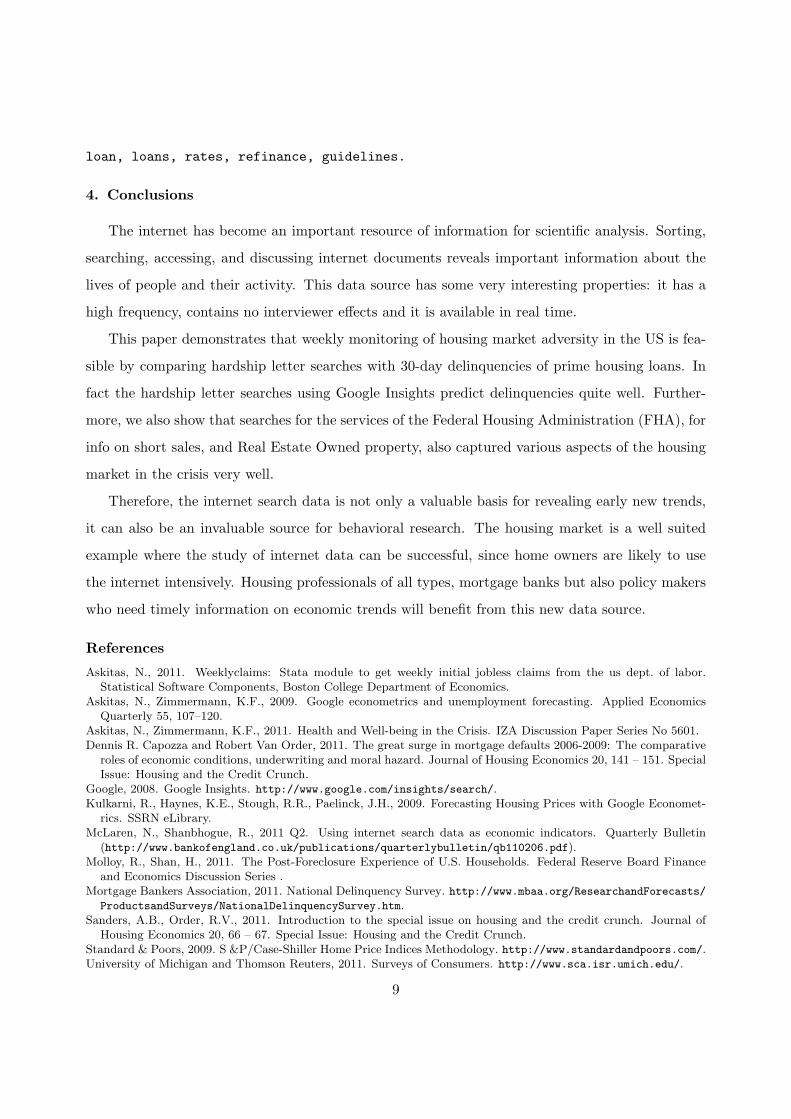
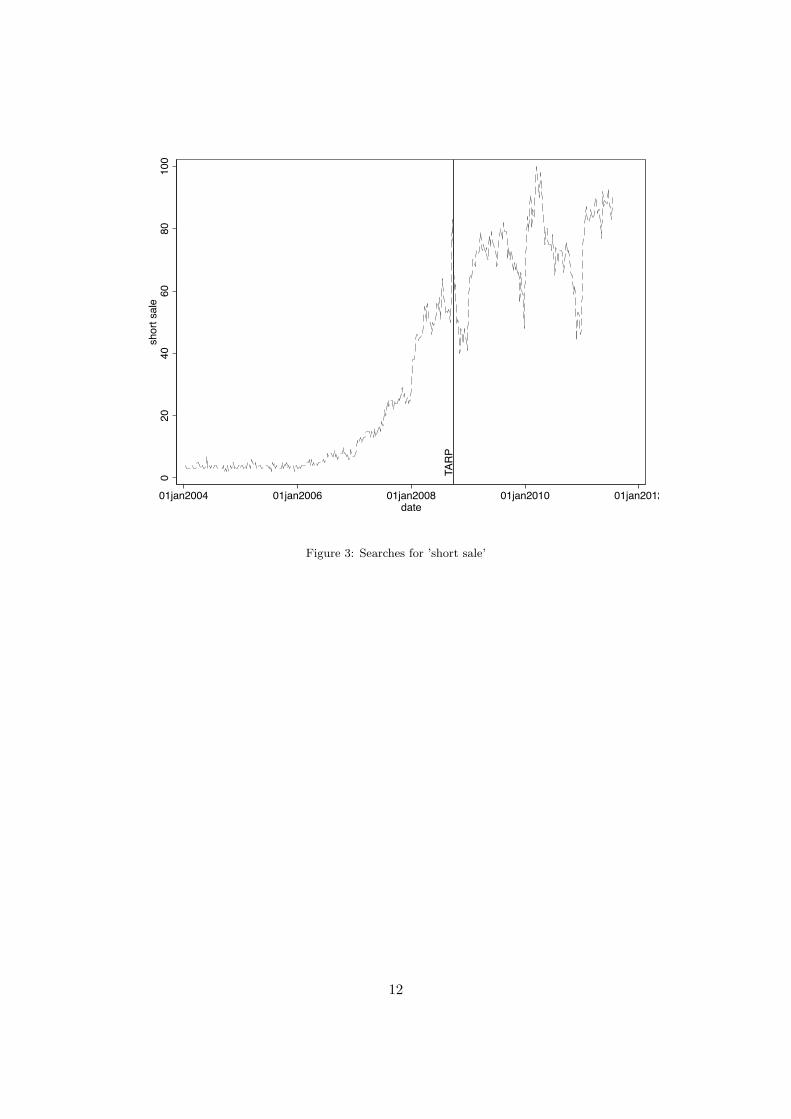
Figure 3 shows the searches for short sale and captures the “epidemiological view of the
housing market” from a different angle. As economic conditions become more uncertain and
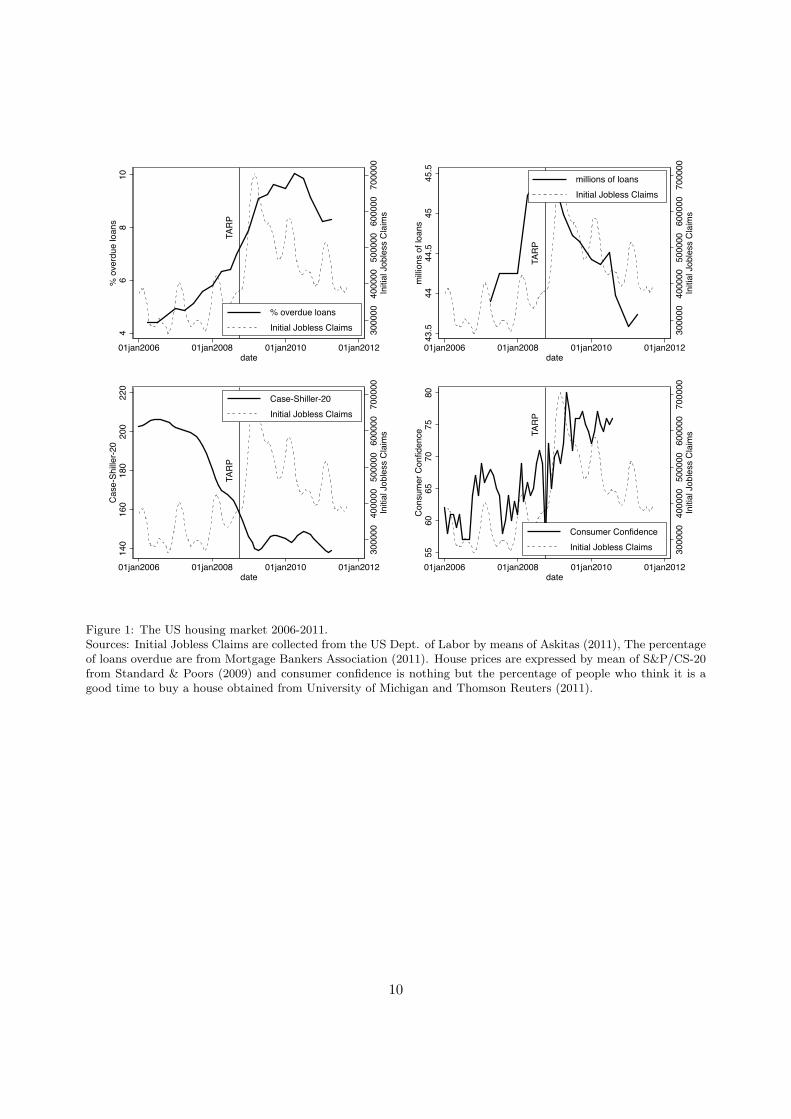
defaults, short sales and foreclosures become more common so do property repossessions and hence
an increased interest in Real Estate Owned (REO) homes. This is exactly what Figure 4 shows.
Both Figures 3 and 4, and the respective developments of internet activities searches for short
sale and REO have indicated well the tensions in the housing markets and have “predicted” TARP.
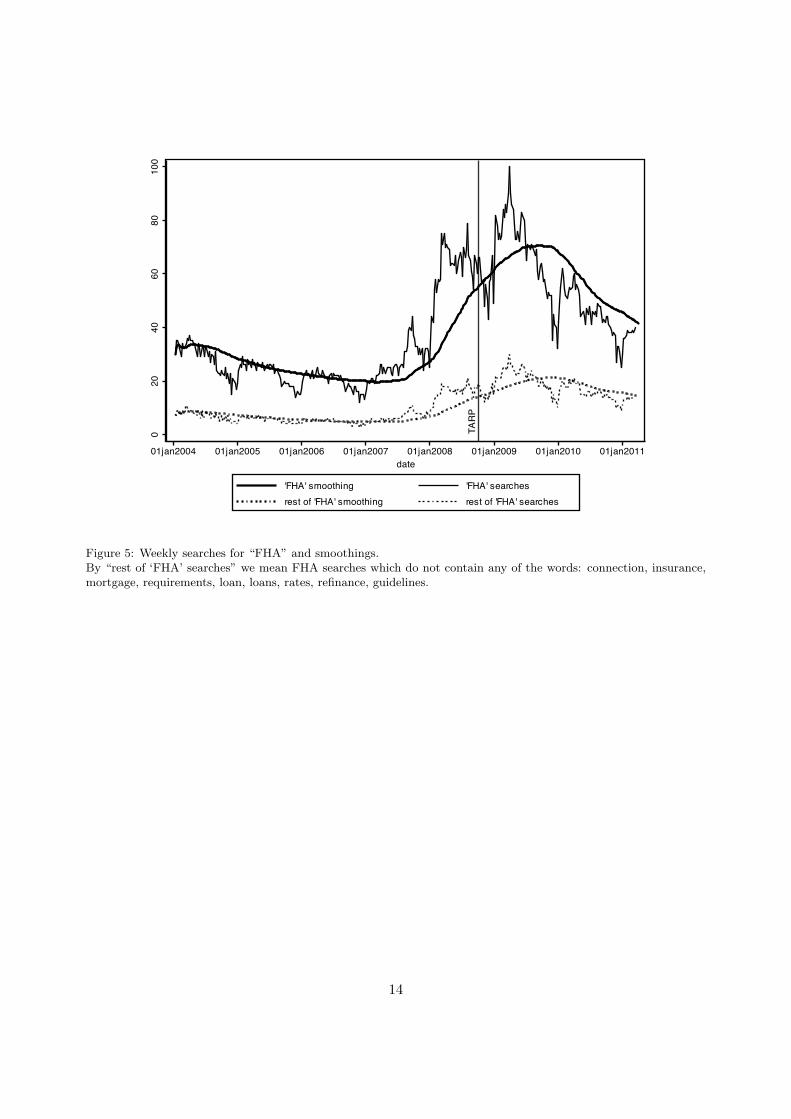
The Federal Housing Administration (FHA) was created in 1934 (and it is part of the Depart-
ment of Housing and Urban Development’s (HUD) Office of Housing since 1965). When the FHA
was created, “the housing industry was flat on its back”8 as “two million construction workers had
lost their jobs”, “terms were difficult to meet for homebuyers seeking mortgages” and “America
was primarily a nation of renters” as “only four in 10 households owned homes”8.
The FHA, “provides mortgage insurance on loans made by FHA-approved lenders throughout
the United States and its territories”. “FHA mortgage insurance provides lenders with protection
against losses as the result of homeowners defaulting on their mortgage loans”. What makes
FHA different is that “unlike conventional loans that adhere to strict underwriting guidelines,
FHA-insured loans require very little cash investment to close a loan. There is more flexibility in
calculating household income and payment ratios. The cost of the mortgage insurance is passed
along to the homeowner and typically is included in the monthly payment.8 Figure 5 shows that
FHA related Google searches were surging since early 2007. In our opinion, this surge indicates
increasing uncertainty since it indicates that the industry is trying to draw in more and more weakly
financed buyers. The figure shows that much of the spike is explained by FHA related searches also
containing one or more of the keywords: connection, insurance, mortgage, requirements,
8 http://www.hud.gov/offices/hsg/fhahistory.cfm
8
loan, loans, rates, refinance, guidelines.
4. Conclusions
The internet has become an important resource of information for scientific analysis. Sorting,
searching, accessing, and discussing internet documents reveals important information about the
lives of people and their activity. This data source has some very interesting properties: it has a
high frequency, contains no interviewer effects and it is available in real time.
This paper demonstrates that weekly monitoring of housing market adversity in the US is fea-
sible by comparing hardship letter searches with 30-day delinquencies of prime housing loans. In
fact the hardship letter searches using Google Insights predict delinquencies quite well. Further-
more, we also show that searches for the services of the Federal Housing Administration (FHA), for
info on short sales, and Real Estate Owned property, also captured various aspects of the housing
market in the crisis very well.
Therefore, the internet search data is not only a valuable basis for revealing early new trends,
it can also be an invaluable source for behavioral research. The housing market is a well suited
example where the study of internet data can be successful, since home owners are likely to use
the internet intensively. Housing professionals of all types, mortgage banks but also policy makers
who need timely information on economic trends will benefit from this new data source.
References
Askitas, N., 2011. Weeklyclaims: Stata module to get weekly initial jobless claims from the us dept. of labor.Statistical Software Components, Boston College Department of Economics.
Askitas, N., Zimmermann, K.F., 2009. Google econometrics and unemployment forecasting. Applied EconomicsQuarterly 55, 107–120.
Askitas, N., Zimmermann, K.F., 2011. Health and Well-being in the Crisis. IZA Discussion Paper Series No 5601.Dennis R. Capozza and Robert Van Order, 2011. The great surge in mortgage defaults 2006-2009: The comparative
roles of economic conditions, underwriting and moral hazard. Journal of Housing Economics 20, 141 – 151. SpecialIssue: Housing and the Credit Crunch.
Google, 2008. Google Insights. http://www.google.com/insights/search/.Kulkarni, R., Haynes, K.E., Stough, R.R., Paelinck, J.H., 2009. Forecasting Housing Prices with Google Economet-
rics. SSRN eLibrary.McLaren, N., Shanbhogue, R., 2011 Q2. Using internet search data as economic indicators. Quarterly Bulletin
(http://www.bankofengland.co.uk/publications/quarterlybulletin/qb110206.pdf).Molloy, R., Shan, H., 2011. The Post-Foreclosure Experience of U.S. Households. Federal Reserve Board Finance
and Economics Discussion Series .Mortgage Bankers Association, 2011. National Delinquency Survey. http://www.mbaa.org/ResearchandForecasts/
ProductsandSurveys/NationalDelinquencySurvey.htm.Sanders, A.B., Order, R.V., 2011. Introduction to the special issue on housing and the credit crunch. Journal of
Housing Economics 20, 66 – 67. Special Issue: Housing and the Credit Crunch.Standard & Poors, 2009. S &P/Case-Shiller Home Price Indices Methodology. http://www.standardandpoors.com/.University of Michigan and Thomson Reuters, 2011. Surveys of Consumers. http://www.sca.isr.umich.edu/.
9
TAR
P
3000
0040
0000
5000
0060
0000
7000
00In
itial
Job
less
Cla
ims
46
810
% o
verd
ue lo
ans
01jan2006 01jan2008 01jan2010 01jan2012date
% overdue loansInitial Jobless Claims
TAR
P
3000
0040
0000
5000
0060
0000
7000
00In
itial
Job
less
Cla
ims
43.5
4444
.545
45.5
milli
ons
of lo
ans
01jan2006 01jan2008 01jan2010 01jan2012date
millions of loansInitial Jobless Claims
TAR
P
3000
0040
0000
5000
0060
0000
7000
00In
itial
Job
less
Cla
ims
140
160
180
200
220
Cas
e-Sh
iller-2
0
01jan2006 01jan2008 01jan2010 01jan2012date
Case-Shiller-20Initial Jobless Claims
TAR
P
3000
0040
0000
5000
0060
0000
7000
00In
itial
Job
less
Cla
ims
5560
6570
7580
Con
sum
er C
onfid
ence
01jan2006 01jan2008 01jan2010 01jan2012date
Consumer ConfidenceInitial Jobless Claims
Figure 1: The US housing market 2006-2011.Sources: Initial Jobless Claims are collected from the US Dept. of Labor by means of Askitas (2011), The percentageof loans overdue are from Mortgage Bankers Association (2011). House prices are expressed by mean of S&P/CS-20from Standard & Poors (2009) and consumer confidence is nothing but the percentage of people who think it is agood time to buy a house obtained from University of Michigan and Thomson Reuters (2011).
10
TARPMozilo
1.8
22.
22.
42.
630
day
del
inqu
enci
es
020
4060
80'h
ards
hip
lette
r'
01jan2007 01jul2008 01jan2010 01jul2011date
'hardship letter'30 day delinquencies
Figure 2: Searches for hardship letter predict 30-day mortgage delinquencies.Sources: Searches for “hardship letter” (Google (2008)) are projected on the Google Category “Finance & Insurance/ Credit & Lending / Debt Management” and are compared to 30 day prime loan delinquencies (Mortgage BankersAssociation (2011)). We take a 12 week moving average smoothing of the hardship letter searches without forwardterms.
11
TAR
P
020
4060
8010
0sh
ort s
ale
01jan2004 01jan2006 01jan2008 01jan2010 01jan2012date
Figure 3: Searches for ’short sale’
12
TARP
2040
6080
100
01jan2004 01jan2006 01jan2008 01jan2010 01jan2012date
REO 52 week moving average
Figure 4: Searches for ’REO’ in the Google Category “Real Estate / Home Financing”
13
TARP
020
4060
8010
0
01jan2004 01jan2005 01jan2006 01jan2007 01jan2008 01jan2009 01jan2010 01jan2011date
'FHA' smoothing 'FHA' searchesrest of 'FHA' smoothing rest of 'FHA' searches
Figure 5: Weekly searches for “FHA” and smoothings.By “rest of ‘FHA’ searches” we mean FHA searches which do not contain any of the words: connection, insurance,mortgage, requirements, loan, loans, rates, refinance, guidelines.
14
Copyright © 2022 FDOKUMEN