
Mississippi Water Resources Conference Jackson Hilton
246
Mississippi Water Resources Conference Jackson Hilton Jackson, MS 2012
-
Upload
khangminh22 -
Category
Documents
-
view
0 -
download
0
Transcript of Mississippi Water Resources Conference Jackson Hilton

Miss
issip
pi W
ater
Res
ourc
es C
onfe
renc
eJa
ckso
n Hi
lton
Jack
son,
MS
2012

Mississippi Water Resources ConferenceHilton Jackson Jackson, MS
2012
EXHIBITORS:
CONFERENCE ORGANIZERS: Mississippi Water Resources Research Institute | Mississippi Department of Environmental Quality Mississippi Water Resources Association | U.S. Geological Survey
Florence & Hutcheson Inc.G.E.C. Inc.Mississippi Department of Environmental QualityPickering Firm Inc.U.S. Geological Survey
SPONSORS:Delta CouncilFlorence & Hutcheson Inc.G.E.C. Inc.Michael Hatcher & Associates Inc.Mississippi Department of Environmental QualityMSU Department of GeosciencesMSU Department of Landscape Architecture
Mississippi Water Resources AssociationMississippi Water Resources Research InstituteU.S. Geological SurveyWeyerhaeuser CompanyYazoo-Mississippi Delta Levee Board

iii
Mississippi Water Resources Conference2012
Poster SessionSoil Moisture and Watershed Assessment to Predict Wildfire Occurences in the Southeast of United States ............................................................................................................................................................... 2Eduardo Arias-Araujo, Diaz-Ramirez, J.; Cooke, W.
Efficacy of Manufactured Wood Shavings to Mitigate Marsh Land Impacts Associated With Deep Water Oil Spills ............................................................................................................................................................. 3Hamid Borazjani, Seale, R
Assessment of Improved Sensors to Monitor Water Used for Irrigation in the Mississippi Delta ........................ 10David E. Burt, Kröger, R.; Miranda, L.
Measuring Fallout Plutonium and Lead Isotopes in Sediment Using ICPMS for Dating Purposes .................... 11James Cizdziel, Chakravarty, P.
Identifying Fish Guilds Relative to Water Quality and Depth in Oxbow Lakes of the Mississippi Alluvial Valley ............................................................................................................................................................ 21Daniel Goetz, Kröger, R.; Miranda, L.
Comparison of Indigenous and Selected Pentachlorophenol (PCP) Degrading Bacterial Consortiums for Remediation of PCP Contaminated Groundwater ............................................................................................. 22Vaibhav V. Joshi, Prewitt, M.; Borazjani, H.; Willeford, K.
Formaldehyde Released in Leachate from Medium Density Fiberboard (MDF) Buried in a Simulated Landfill ...................................................................................................................................................... 30Min Lee, Prewitt, M.; Borazjani, H.; Mun, S.
Preliminary Results from a New Ground-Water Network in Northeastern Mississippi ........................................ 37Michael A. Manning, Rose, C.; Welch, H.; Coupe, R.
The Buttahatchie River Stabilization Project .......................................................................................................... 38Brad Maurer
Laymen, Experts, NGOs, and Institutions in Watershed Management............................................................... 52 Giusy Pappalardo
Assessment of the Ecological Value of Low-Grade Weirs in Agricultural Drainage Ditches ........................... 60 Beth Poganski, Kröger, R.
Assessing and Modeling Sediment Loads from Stream Corridor Erosion along the Town Creek in Mississippi .................................................................................................................................................................... 61John J. Ramirez-Avila, Langendoen, E.; McAnally, W.; Ortega-Achury, S.; Martin, J.; Bingner, R.
Contents
SPONSORS:

Mississippi Water Resources Conference2012
iv
Rainfall Simulation to Evaluate Nutrient Loss from Marietta Soil Amended with Poultry and Cattle Manure ........................................................................................................................................................... 62John J. Read, McLaughlin, M.; Adeli, A.
Effects of Immobilizing Agents on Surface Runoff Water Quality from Bermudagrass Sod Fertilized with Broiler Litter ............................................................................................................................................................................ 63Jing Sheng, Adeli, A.; Brooks, J.; McLaughlin, M.
Sedimentation Processes in Perdido Bay ............................................................................................................... 64Natalie Sigsby, McAnally, W.; Sigsby, N.
Hydrologic Regimes of Bottomland Hardwood Forests in the Mississippi Alluvial Valley and Gulf Coastal Plain and the Impact on Red Oak Acorn Production .......................................................................................... 65Johnathan Sloan, Hatten, J.
Sediment and Mercury Fate and Path Modeling in Weeks Bay, Alabama ...................................................... 66Jennifer Sloan-Ziegler, Camacho-Rincon, R.; Martin, J.; McAnally, W.
Monitoring Success of Mississippi’s Delta Nutrient Reduction Strategies—Steele Bayou ................................. 67Shane Stocks, Hicks, M.
Proposal of the Total Human Ecosystem on Blakeley Island, Mobile AL ............................................................ 68Long Zhou
Best Management PracticesField-Scale Monitoring of Agricultural Ditches as Conduits of Nitrogen, Phosphorus, and Suspended Sediment in Response to Storm Events and Low-Input Drainage Management: A Case-study of the Tchula Lake Farm ...................................................................................................................................................... 70Samuel C. Pierce, Kröger, R.; Prevost, D.; Pierce, T.
Nutrient and Suspended Sediment Mitigation Through the Use of a Vegetated Ditch System Fitted with Consecutive Low-Grade Weirs ............................................................................................................................... 84Corrin Flora, Kröger, R.
Runoff Quality Effects of Simulated Conservation Practice Scenarios in a Mississippi Delta’s Watershed ................................................................................................................................................................. 93J.J. Ramirez-Avila, Ortega-Achury, S.; McAnally, W.; Daiz, J.; Martin, J.
The Mississippi Nutrient Management Manual: Simplifying Availability of Maintenance-Based Fertilizer Recommendations and Nutrient Best Management Practices.......................................................................... 94Larry Oldham
Downstream Water Quality and Quantity Impacts Of Water Storage Systems in a Mississippi Delta Watershed ................................................................................................................................................................. 95Mary Love Tagert, Paz, P.; Pote, J.; Kirmeyer, R.
Contents

v
Mississippi Water Resources Conference2012
Low-Grade Weirs: An Innovative Best Management Practice for nitrate-N Mitigation ................................... 96Alex Littlejohn, Kröger, R.; Moore, M.; Farris, J.
Evaluation and Validation of a Decision Support System for Selection and Placement of BMPs in the Mississippi Delta ......................................................................................................................................................... 97Sandra Ortega-Achury, Kröger, R.; Ramirez-Avila, J.; Diaz, J.
Best Management Practices in the MS Delta: What Are We Learning? .......................................................... 108Robert Kröger, Prevost, J.; Cooke, T.
Delta Water AssessmentThe Great Flood of 2011 and its Influence on the Mississippi River Valley Alluvial Aquifer: Did the River Recharge the Aquifer or What?............................................................................................................................ 110Amanda Roberts
Snapshot Through Time of “The Hole” in the MRVA of the Central Delta (Sunflower and Leflore County) ..................................................................................................................................................................................111Paul Parrish
Develop Hydrological Relationships Using a Modeling Approach in Mississippi Delta .................................. 112Priyantha Jayakody, Parajuli, P., Sassenrath, G.
Nitrogen Dynamics within the Big Sunflower River Basin in Northwestern Mississippi ............................... 113Jeannie R.B. Barlow, Coupe, R., Kröger, R.
Flood Assessment and ManagementFlooding Concerns on the Lower Pearl River Near Walkiah Bluff ...................................................................... 115Amanda L. Roberts
Movement of Agricultural Chemicals and Sediment Through the Lower Mississippi River Basin During the 2011 Flood, April through July ................................................................................................................................ 127Heather Welch, Aulenbach, B., Coupe, R.
Water-quality of the Yazoo River During the 2011 Mississippi River Flood ........................................................ 128Marcia S. Woods, Rose, C., Coupe, R.
Flood Inundation Mapping for the Leaf River at the City of Hattiesburg, MS ................................................. 129John Storm
Contents

Mississippi Water Resources Conference2012
vi
WetlandsNutrient Characteristics of Moist-Soil Wetlands in Agriculture Landscapes ..................................................... 131Amy B. Alford, Kröger, R.; Kaminski, R.
Management of Coastal Ecosystem Restoration Sites under Increased Climatic Extremes: Effects of Hurricane Katrina on Wetlands Restoration Projects in Coastal Mississippi ................................................. 132Marc A. Foster, Battaglia, L.
Sea Level Rise Visualization and Measurements of Subsidence and Accretion Rates for the Alabama, Mississippi, and Florida Coastlines ......................................................................................................................... 133K. Van Wilson
Beneficial Use at Deer Island: A Decade of Design and Implementation ...................................................... 134William B. Roth, Mears, W.; Keith, D.; Ramseur, G.
Watershed ManagementLaymen, Experts, NGOs, and Institutions in Watershed Management............................................................. 136Giusy Pappalardo
Management Challenges for Deer Creek in the Mississippi Delta .................................................................... 137Ron Killebrew
Results of Regional SPARROW Models for Selected Watershed in Mississippi .................................................. 138Richard A. Rebich
The Arkansas Discovery Farms Program ............................................................................................................... 139Mike Daniels, Sharpley, A.
Rule Curves in Flood Control Reservoirs: A Historical and Procedural Analysis ............................................... 149Ethan Mower, Miranda, L.
Preliminary Sediment Accumulation and Phosphorus Retention Behind Low Grade Weirs in the Mississippi Delta ....................................................................................................................................................... 150Elizabeth Usborne, Kröger, R.
Monitoring Success of Mississippi’s Delta Nutrient Reduction Strategies .......................................................... 151Matthew B. Hicks
Contents

vii
Mississippi Water Resources Conference2012
ContentsNon-Point Source
The Buttahatchie River Stabilization Project ........................................................................................................ 153Brad Mauer,
Sources and Yield of Particulate Organic Carbon and Nitrogen In Managed Headwaters of Mississippi ............................................................................................................................................................. 154Jeff Hatten, Dewey, J.; Mangum, C.; Choi, B.
Predicting Nitrogen and Phosphorus Concentrations using Chlorophyll-a Fluorescence and Turbidity ............................................................................................................................................................ 155Caroline Andrews, Kröger, R.; Miranda, L.
Water Quality in Sardis Lake: A Multi-Variate Statistical Method for Analysis of Temporal and Spatial Trends .......................................................................................................................................................... 160Cristiane Q. Surbeck
ModelingAnalyzing the Hydraulics of a Biofiltration Swale Using HEC-RAS ...................................................................... 162David Bassi, Rivas, D.; Diaz-Ramirez, J.; Martin, J.
Sediment and Mercury Fate and Path Modeling in Weeks Bay, Alabama .................................................... 163Jennifer Sloan-Ziegler, Camacho-Rincon, R.; Martin, J.; McAnally, W.
Calculation of Water Surface Elevation Using HECRAS 4.1.0 for Fixing Tailwater Elevation for Powerhouse Site in Planned 37 MW Kabeli “A” Hydroelectric Project, Nepal ................................................ 164Surendra Raj Pathak
Assessing Water Balance Using a Hydrologic Model ......................................................................................... 183Sarah Duffy, Parajuli, P.
Water QualityThe Fate and Transport of Glyphosate and AMPA into Surface Waters of Agricultural Watersheds ........... 186R.H. Coupe, Rose, C.; Welch, H.; Manning, M.
A Holistic Assessment of the Occurrence of Metolachlor and 2 of its Degradates Across Various Environmental Compartments in 7 Environmental Settings ............................................................................... 187Claire Rose, Welch, H.; Coupe, R.; Capel, P.
Assessing a Novel Method for Verifying Automated Oxidation-Reduction Potential Data Loggers: Laboratory and Field Tests ..................................................................................................................................... 188Cory M. Shoemaker, Kröger, R.; Pierce, S.
Using Dissolved Oxygen Dynamics to Derive Nutrient Criteria: Tried, True, and Troublesome ...................... 196Matthew B. Hicks, Paul, M.; Caviness, K.

Mississippi Water Resources Conference2012
viii
Delta Water ConservationWater-Conserving Irrigation Systems for Furrow & Flood Irrigated Crops in the Mississippi Delta .................. 198Joseph H. Massey
Modeling the Potential for Replacing Groundwater with Surface Water for Irrigation by Using On-Farm Storage Reservoirs in the Mississippi Delta ........................................................................................... 199Robert G. Thornton, Pote, J.; Wax, C.
Technologies and Methods to Aid the Adoption of PHAUCET Irrigation in the Mississippi Delta................... 215Shane Powers
MIST: A Web-Based Irrigation Scheduling Tool for Mississippi Crop Production ............................................... 216Brandon Rice, Crumpton, J.; Schmidt, A.; Sassenrath, G.; Schneider, J.
SedimentationThe National Reservoir Sedimentation Data Base: Background and Purpose ................................................ 218Matt Römkens, Jones, M.; Gray, J.
Sedimentation Processes in Perdido Bay ............................................................................................................. 219Natalie Sigsby, McAnally, W.
Measuring Fallout Plutonium and Lead Isotopes in Sediment Using ICPMS for Dating Purposes .................. 220James Cizdziel, Chakravarty, P.
Using Acoustic Measurements as a Surrogate Technique for Measuring Sediment Transport ..................... 221James Chambers, Kleinert, D.; Carpenter, B.; Goodwiller, B.; Wren, D.; Kuhnle, R.
Storm WaterSources and Yield of Dissolved Inorganic and Organic Constituents in Headwater Streams of the Upper Gulf Coastal Plain, Mississippi .............................................................................................................. 223Clay Mangrum, Hatten, J.; Dewey, J.; Choi, B. Policy Approaches to Stormwater Facility Sizing and Sustainable Site Design ............................................... 224Emily Overby, Gallo, W.
Adapting Portland’s Stormwater Approach to Other U.S. Cities ...................................................................... 225Warren Corrado Gallo, Overbey, E.
Policy Approaches to Stormwater Facility Sizing and Sustainability Site Design ............................................. 226Jesse English
Contents

ix
Mississippi Water Resources Conference2012
Public Water SystemsFinancial Sustainability of Water Treatment and Distribution: Using a Public Private Partnership Toolkit to Evaluate Project Costs ........................................................................................................................... 228Rebecca A. Werner, Surbeck, C.
The Influence of the Mitchell Rate Structure on Community Drinking Water Consumption and Customer Fairness ................................................................................................................................................... 229Jason Barrett
An Analysis of Factors Influencing Capacity Development of Public Water Systems in Mississippi .............. 230Alan Barefield, Tack, J.
Surface Water Assessment & EvaluationAn Approach for Low Flow Selection in Water Resource Management ......................................................... 232Ying Ouyang
Sediment and Nutrients Loadings from the Upper Pearl River Watershed ...................................................... 233Prem B. Parajuli
Evaluating a Vegetated Filter Strip in an Agricultural Field ............................................................................... 234Alina Young
Soil Moisture and Watershed Assessment to Predict Wildfire Occurrences in the Southeast of United States ....................................................................................................................................................... 235Eduardo Arias-Araujo, E.; Diaz-Ramirez, J.; Cooke, W.
Contents

Mississippi Water Resources Conference2012
x

Poster Session
1
Post
er S
essio
nPOSTER SESSION
Eduardo Arias-AraujoMississippi State University
Soil Moisture and Watershed Assessment to Predict Wildfire Occurrences in the Southeast of United States
Hamid BorazjaniMississippi State University
Efficacy of Manufactured Wood Shavings to Mitigate Marsh Land Impacts Associated With Deep Water Oil Spills
David BurtU.S. Geological Survey
Assessment of Improved Sensors to Monitor Water Used for Irrigation in the Mississippi Delta
James CizdzielUniversity of Mississippi
Measuring Fallout Plutonium and Lead Isotopes in Sediment Using ICPMS for Dating Purposes
Daniel GoetzMississippi State University
Identifying Fish Guilds Relative to Water Quality and Depth in Oxbow Lakes of the Mississippi Alluvial Valley
Vaibhav V. JoshiMississippi State University
Comparison of Indigenous and Selected Pentachlorophenol (PCP) Degrading Bacterial Consortiums for Remediation of PCP Contaminated Groundwater
Min LeeMississippi State University
Formaldehyde Released in Leachate from Medium Density Fiberboard (MDF) Buried in a Simulated Landfill
Michael A. ManningU.S. Geological Survey
Preliminary Results from a New Ground-Water Network in Northeastern Mississippi
Brad Maurer The Nature Conservancy
The Buttahatchie River Stabilization Project
Giusy PappalardoUniversity of Catania
Laymen, Experts, NGOs, and Institutions in Watershed Management
Beth PoganskiMississippi State University
Assessment of the Ecological Value of Low-Grade Weirs in Agricultural Drainage Ditches
John J. Ramirez-AvilaMississippi State University
Assessing and Modeling Sediment Loads from Stream Corridor Erosion along the Town Creek in Mississippi
John J. ReadUSDA ARS
Rainfall Simulation to Evaluate Nutrient Loss from Marietta Soil Amended with Poultry and Cattle Manure
Jing ShengUSDA ARS
Effects of Immobilizing Agents on Surface Runoff Water Quality from Bermudagrass Sod Fertilized with Broiler Litter
Natalie SigsbyMississippi State University
Sedimentation Processes in Perdido Bay
Jonathan Sloan Mississippi State University
Hydrologic Regimes of Bottomland Hardwood Forests in the Mississippi Alluvial Valley and Gulf Coastal Plain and the Impact on Red Oak Acorn Production
Jennifer Sloan-ZieglerMississippi State University
Sediment and Mercury Fate and Path Modeling in Weeks Bay, Alabama
Shane StocksU.S. Geological Survey
Monitoring Success of Mississippi’s Delta Nutrient Reduction Strategies—Steele Bayou
Long ZhouAuburn University
Proposal of the Total Human Ecosystem on Blakeley Island, Mobile, AL

Mississippi Water Resources Conference2012
2
Soil Moisture and Watershed Assessment to Predict Wildfire Occurrences in the Southeast
of United States Arias-Araujo, E, Mississippi State University
Diaz-Ramirez, J.; Cooke, W. Mississippi State University
Wildfires occurrences are frequent in the Southeast of United States (US) and it has become a major concern in this region. The purpose of this study is to determine the effect that soil moisture (SW) level and basin water- balance values (BWB) have over summer-wildfires occurrences in the Southeast of US which encompasses Texas, Louisiana, Oklahoma, Mississippi, Alabama, Tennessee, Georgia, Florida, South Carolina and North Carolina. Quantifying, analyzing and processing the spatial and temporal distribution of SW and BWB could be an effective method for modeling, managing and preventing potential wildfire occurrences. Most of the studies related with this topic have been done to assess the causes and ecological conditions that aid the beginning of wildfires; however, there has not been found studies that integrate SW and BWB to evaluate and predict the wildfires occurrences. Hydrological models such Soil Water Assessment Tools (SWAT) and Hydrological Simulation Program--Fortran (HSPF) are being used as tools to evaluate, compare and simulate watershed water-flow and SW outputs at specific locations where the density of wildfires occurrences are elevated, medium and low; the purpose of this analysis is to contrast temporally and spatially the three scenarios. To evaluate the complete Southeast of US a simpler soil water-balance model is being utilized because of the large extension of study area. SWAT and/or HSPF require data intensive inputs and extensive parameterization thus these models have limited capabilities to process the complete Southeast region. ArcGIS and MATLAB software have being used to compile, prepare and analyze data. Wildfire data, Digital Elevation Models (DEMs), NASA -Land Information System (LIS) gridded binary (GRIB) data, National Land Cover Data (nlcd), STASTGO soil units (USDA-NRCS), USGS-stream-gauges and NOAA Doppler data (precipitation) is being used in the assessment. The final product will be Graphical user interface (GUI) that permits the modeling and prediction the wildfires occurrences in the southeast of US. This GUI will be distributed and shared with governmental agencies and private organizations associated with Forest and Land management. This project is being funded by National Aeronautics and Space Administration (NASA).

Poster Session
3
Efficacy of manufactured wood shavings to mitigate marsh land impacts associated with
deep water oil spills.H. Borazjani, Mississippi State University
R. Dan Seale, and S.K. Langroodi, Mississippi State University
Introduction Wood shavings have been proposed as a mechanism for preventing environmental damage to marsh grasses and for absorbing oil from the deep water drilling operations. Initial questions associated with the use of wood shavings in this application is the composition of the shavings that would be added to tidal estuaries and would the addition have negative impacts on the food chain in the marshland. If there is not a detrimental impact on the marsh from the addition of shavings to protect marsh grasses, what would be the best management practices associated with application of shavings to 1) protect the soil in an area where oil contamination in eminent, 2) soak up floating oil, and 3) could shavings remove oil from contaminated soil.
This study was designed to collect preliminary data associated with using manufactured shavings as a method of protecting marsh grass and adsorbing oil found in inland bays. The study was designed to formulate initial or best management practices for three scenarios based on small scale tests that may need modification for wide area testing.
The first condition studied, was oil that was adjacent to marsh grass (Figure 1) with enough separation to allow for application of shavings that would sink to the bottom to provide a protective soil barrier. Shavings placed in water that do not contact oil sink but no studies have been done to see if they have the ability to form a protective soil barrier. The probability of success was unknown.
The second condition was represented by floating oil that had appeared in marsh areas behind booms and is adjacent to marsh grass as shown in Figure 1. In pre-study laboratory tests, shavings soaked up multiples of their own weight in used motor oil and once oil was adsorbed, the shavings floated for extended periods (up to 3 months). Therefore, it was believed that the probability of success for this treatment was high.
The third condition was contaminated soil with oil visibly sitting on top (land based). An evaluation of effectiveness of shavings absorbing oil in this condition was made. Figure 2 illustrates condition three at the bottom where there is contaminated soil. Shavings have shown the ability to absorb floating oil so it was believed that some of the oil
Use of pine shaving to remove oil from seawater and sandy beaches during spill was evaluated. Two identi-cal microcosms capable of simulating tidal waves were constructed. Shavings were applied in three different spill scenarios; 1): over clean sand before tide, 2): over contaminated sands after tide, and 3): over oil covered sands. Saudi Arabian sweet crude was used for this study. Shavings adsorbed significant amounts of oil in all three cases from oil contaminated water and sands. Shavings spread over the contaminated seawater surface contained the highest amount of oil adsorption from seawater and the least amount of sand contamination. This method of application seems to provide the most efficient and practical approach for quick removal of oil and spent shaving from seawater with minimal contamination of beaches or marshes. The high number of petroleum acclimated bacteria in seawater are able to biodegrade the leftover residual hydrocarbons.

Mississippi Water Resources Conference2012
4
on contaminated soil would also be removed. The probability of success was rated as high.
A tidal simulator capable of analyzing the three scenarios was constructed and used to study the feasibility of using manufactured shavings to reduce environmental impacts associated with deep water oil spills.
Material and Methods Seawater was collected by pumping water into 50 gallon containers from Bay St.Louis in south Mississippi (Figure 3).
Southern yellow pine shavings were provided by Sunbelt Shavings in Shuqualak, Mississippi.
The shavings were cut on a Kimber 4488 Quad Head Log Shaver.
Twin identical microcosms to simulate tidal movement were built by cutting a 206 L drum into two identical 103 L test units connected to a seawater reservoir and drain systems (Figure 4). Twenty four Kg of clean sand was spread in the bottom of each unit. Twenty eight L of seawater and 106 g of shaving were used for each of the following tests. Nutrient agar (NA) was used to count for total bacterial population in seawater. The same media amended with 50mg/L of petroleum diesel estimated the petroleum acclimated bacteria (TNA). Dilution plate technique was used for bacterial counts. Fungal population was determined using potato dextrose agar amended with antibiotics (PDAA).
Test I: Shavings were spread over the clean sand in each unit. Seawater (30 L approximately) was allowed to enter into each unit slowly. Forty eight mL of Saudi Arabian crude oil was gently added on the surface of water while the remaining seawater was flowing over the sand covered with shavings. Samples were taken from contaminated water, sands, uncovered sands and wood shavings for total petroleum hydrocarbon (TPH) analysis after
seawater was drained from the unit.
Test II: The test units containing sand were filled with seawater and 48 mL of crude oil was put on the water surface as illustrated in Figure 5. One hundred and six grams of shavings were spread over the water surface to adsorb spilled oils. Shaving and water samples were collected after one hour. Sand samples were taken after seawater was drained from the unit.
Test III: This test was performed the same as test II. The only difference was spreading shavings over oily sands after all water was removed from the unit. Shavings, water and sand samples were taken for TPH analysis from this test.
Results Background seawater results tested by EPA methods for total petroleum hydrocarbons (TPH), salinity, total kjeldahl nitrogen (TKN), chemical oxygen demand (COD), total organic carbon (TOC), and pH are summarized in Table 1. These results showed normal concentration levels common to seawater with no higher than usual concentration of TOC and TPH common to oil spill. No background level of oil was also observed for clean sand and shavings in this study (Table 3). Microbial counts showed a good number of colonies per mL in which most of these colonies were tolerant/acclimated to oil (Table 2).
Total petroleum hydrocarbon (TPH) results for tests I, II, and III are summarized in Table 3. In test I shavings adsorbed most of oil from the surface water during tidal waves with little or no significant amount of oil left in water but some in uncovered, and covered sands,
In test II where shavings were spread over the water surface after spill, shavings adsorbed most of the oil with a much lower sand contamination than test I. However, more oil was recovered in water for this test than test I. Test III where shavings were spread over oil contaminated sands after drainage,
Efficacy of manufactured wood shavings to mitigate marsh land impacts associated with deep water oil spillsBorazjani, Hamid

Poster Session
5
shaving adsorbed significantly less oil than test II. Also, significant concentration of oil remained on the sand.
Conclusion Shavings seem to adsorb significant amount of oil from oil contaminated water and sands. Shavings spread over the contaminated water surface would provide the most efficient and practical approach for quickly removing oil and spent shaving from seawater with minimal contamination of beaches or marshes. The high number of TPH acclimated bacteria in seawater should be able to breakdown the residual oil in the water(Hazen et al.,2010,Horel et al.,2012). While not as technically efficient as collecting oil from water, the use of shavings to prevent or reduce soil contamination from floating crude washing ashore holds promise and should be explored further as a means of reducing the long term impacts associated with the loss of marsh grasses.
Acknowledgements: Authors would like to thank Gulf of Mexico Research Initiative Subtask for funding this project. This article is approved for publication as Journal article FP- 654 of Forest & Wildlife Research center, Mississippi State University, Mississippi State, MS.
ReferencesHazen TC,Dubinsky EA,DeSantis TZ,Anderson GL,Piceno YM,Singh M,Jansson JK,Probst A,Borglin SE,Fortney JL.2010.Deep-Sea Oil plume Enriches Indigenous Oil-DegradingBacteria.Science 330(6001):204-208.
Horel A, Mortazavi B, Sobecky PA. 2012. Resposes of microbial community from north Gulf of Mexico sandy sediments following exposure to deepwater horizon crude oil. Environmental Toxicology and Chemistry 31(5): 1004-11.
Efficacy of manufactured wood shavings to mitigate marsh land impacts associated with deep water oil spillsBorazjani, Hamid

Mississippi Water Resources Conference2012
6
Efficacy of manufactured wood shavings to mitigate marsh land impacts associated with deep water oil spillsBorazjani, Hamid
Table 1: Concentrations for Salinity, Total Organic Carbon (TOC), TPH (diesel), pH, Chemical Oxygen Demand (COD), and Total Kjeldahl Nitrogen (TKN) on duplicate seawater samples collected
Sample ID* Salinity TOC TPH COD TKN pH
SU ------------------------------------ mg/L ----------------------------------
33385 36 7.5 <100 603 0.14 7.3
33386 36 7.4 <100 350 <0.1 7.7
Method ** 2520B 415.1 8015M 8000 351.4 150.1
*Samples 33385 and 33386 are duplicates.
**The tests performed are in accordance with EPA methods for chemical analyses and/or standard methods 20th edition.
Table 2: Bacterial colonies recovered from seawater on selected media*
Microorganism Media used Colonies/mL
Total Fungi PDAA 0
Total bacteria NA 10,500
TPH acclimated bacteria TNA 9500
*Each figure represents an average of three replications
Table3: Total Petroleum Hydrocarbons diesel (TPH) concentrations (ppm) for test I, II, and III of oil spill experi-ment*
Treatments Matrices Concentration (ppm) Test I Uncovered sand 68Test I Covered sand 1,550Test I Oily water <100Test I Oily shaving 66,500
Test II Oily water 1,100Test II Oily shaving 50,000Test II Oily sand 373
Test III Oily water 1,500Test III Oily shaving 38,765Test III Oily sand 12784
Tests I, II& III Clean shaving <50Tests I, II& III Clean sand <50
*EPA method 8015M

Poster Session
7
Efficacy of manufactured wood shavings to mitigate marsh land impacts associated with deep water oil spillsBorazjani, Hamid
Figure 1. Crude oil from a deep water spill adjacent to marsh grass.
Source: http://www.louisianasportsman.com/lpca/index.php?section=reports&event=view&action=full_report&id=78635&sid=9a888d71d4cbd22eed314cbe112f6400
Figure 2. Intertidal zone with oil contaminated soil at the bottom of the picture and floating in water at the top of the picture.
Source: Dr. Dan Seale

Mississippi Water Resources Conference2012
8
Efficacy of manufactured wood shavings to mitigate marsh land impacts associated with deep water oil spillsBorazjani, Hamid
Source: Dr. Dan Seale
Figure 3. Collection of sea water from Bay of St. Louis in Mississippi.
Source: Dr. Dan Seale
Figure 4. Test 1, (top left) shavings applied over sand, (top right) shavings sink when contacted by water and the oil floats over the top, (bottom left) as the water is removed simulating tidal movement, the oil is deposited on the shavings, (bottom right) the sand is protected as a sample is collected for analysis.
Source: Dr. Dan Seale

Poster Session
9
Efficacy of manufactured wood shavings to mitigate marsh land impacts associated with deep water oil spillsBorazjani, Hamid
Figure 5. Test 2, (top left) oil added to water over sand, (top right) shavings applied over the top of float-ing oil, (bottom left) shavings sit on the oil for an hour, (bottom right) samples are collected for analysis.
Figure 6. Test 3, (left) oil contaminated sand, (right) shavings applied over the top contaminated sand.
Source: Dr. Dan Seale

Mississippi Water Resources Conference2012
10
Assessment of Improved Sensors to Monitor Water Used for Irrigation in the Mississippi Delta
David Burt, U.S. Geological Survey
The Mississippi River Valley alluvial (MRVA) aquifer spans seven states in the central part of the U.S. In northwestern Mississippi, the MRVA underlies a rich, agricultural region known locally as the Delta. Nearly all of the water used to irrigate crops in the Delta is withdrawn from the MRVA aquifer. As more and more wells are drilled to irrigate crops, the need to monitor the amount of water being pumped from the MRVA becomes more critical. Using technologies such as data loggers combined with improved sensors, the U.S. Geological Survey has partnered with the Yazoo-Mississippi Delta Joint Water Management District to monitor irrigation wells throughout the Delta.
Vibration and inductance sensors are being tested on a variety of pumping applications to obtain real-time data for the amount of time that pumps are applying water during the growing season. The sensors were evaluated on about 30 test wells during the 2011 growing season to determine their ability to accurately monitor pump usage based on powering up and down and overall run-time. Once pump usage is determined, and pump rates are measured using a non-intrusive flow meter, then a total water volume pumped at each well can be calculated.
Future plans are to calculate total water volume pumped from a network of wells throughout the Delta during the growing season. Selected permitted wells in every county in the Delta for each of the four main crop types—corn, cotton, rice, and soybean—will form the network. This network can then be used to estimate irrigation water use for all other permitted wells in the Delta, aggregated by crop type and county.

Poster Session
11
Dating Sediments from Oxbow Lakes in the Mississippi Delta using 239Pu, 240Pu and 210Pb determined by ICPMS: a feasibility study
James Cizdziel*, University of MississippiPragya Chakravarty, University of Mississippi
IntroductionDetermining the chronology of sediments is important for a number of reasons including: to manage reservoirs more effectively (e.g., calculate sediment rates), to study the spatial and temporal patterns of metal deposition in an area, and, more recently, to monitor the effectiveness of erosion control methods (Wren and Davidson 2011). Dating of sediments is done by using natural radionuclides like 210Pb and 14C and artificial radionuclides like 137Cs, 239Pu and 240Pu.
Plutonium 239Pu and 240Pu are anthropogenic radionuclides introduced into the environment from atmospheric testing of nuclear weapons and from accidental releases from nuclear power plants. Because
plutonium is particle-reactive, fallout from these events are accumulated and preserved in sediments along with other particles washed into lakes. Because the dates for these fallout events are known they can be used for determining sediment chronology. For example, the peak fallout for Pu in the northern hemisphere was in 1963; thus, if a sediment core is divided into intervals (typically 1 cm) the layer/horizon containing the highest activity or concentration of Pu will, in the absence of other major local or regional sources, likely correspond to 1963. Once a sediment layer has been dated, it can be used to estimate the average sedimentation rate (cm/yr) by (continuing with the Pu example) dividing that depth by the years since 1963. Moreover, the isotopic signature (240Pu/239Pu atom ratio) is indicative of the source of
Sediments are complex deposits of inorganic and organic matter that can serve as a natural storage system for metals and anthropogenic contaminants. Sediment cores can provide a window on the past because they can go back years, decades, even centuries and serve as environmental proxies. Dating of recent (<100 years) sediments is important in many studies and applications, including determining the source and timing of pollu-tion events, establishing sedimentation patterns, and in reservoir management. Linking sediment "dates" (typi-cally in years) with sediment characteristics or specific chemical constituents is also crucial for examining the effectiveness of both pollution and erosion control measures. Conventional dating techniques which use 210Pb and 137Cs are slow and costly, in part because extended times are needed to measure the radioactive decay emissions from low-activity samples.
In this study, we examined the feasibility of using inductively coupled plasma mass spectrometry (ICP-MS) to: measure global fallout plutonium (Pu) and 210Pb in sediment core samples from Mississippi for dating purposes. Recent advances in mass spectrometry have made it an alternative to radioactive decay spectrometry for de-termining Pu, and possibly 210Pb, in environmental samples. This study utilized core samples previously collected from strategic locations within the Mississippi Delta region. Select samples were be digested with mineral acids and the Pu and Pb isotopes were selectively removed from the matrix using chromatographic extraction resins, effectively pre-concentrating the elements prior to analysis. Plutonium was determined using isotope dilution mass spectrometry and 210Pb using external standardization. In this talk and associated poster we will discuss the methodology and present our findings.

Mississippi Water Resources Conference2012
12
the Pu and can be used for source apportionment. For example, the stratospheric fallout ratio is 240Pu/239Pu = 0.180 ± 0.014 and the Nevada Test Site fallout ratio is 240Pu/239Pu = 0.03 ± 0.07 [e.g., Ketterer et al. 2004]. Using these and other known ratios one can decipher the source of fallout in a region.
Conventionally, radiometric analyses of 239Pu and 240Pu have been performed by alpha spectrometry. Alpha spectrometry is destructive, requires the use of large sample volumes and involves a lot of sample preparation. Further, alpha spectrometry cannot categorize 239Pu and 240Pu separately due to small difference in their alpha particle energies [Donard et al. 2007].
210Pb 210Pb is a member of the 238U decay series. Uranium is ubiquitous in soils and sediments. “Supported” 210Pb in soils and sediments is generated in-situ, whereas “unsupported” or “excess” 210Pb results from deposition from the atmosphere. A precursor of 210Pb is 222Rn, an inert gas, which diffuses from surface soils, decays in the atmosphere, where it becomes charged and can attach to particles that deposit to the earth’s surface through wet and dry deposition. The 210Pb dating method is based on measuring and comparing the quantities of supported and unsupported 210Pb and applying the decay equation [Simms et al. 2008]. However, there are two major limitations in applying this method. First, mixing or displacement of sediment particles gives erroneous dates, and second, this method does not hold good for sediments more than ~100 years old as no excess 210Pb can be detected above the background (supported) level. Conventionally, 210Pb has been measured using radiochemical techniques. 210Pb decays by emitting beta particles of energy 17 kev and 63.5 kev and gamma rays of energy 46.5 kev [Amr et al. 2010]. The decay products are 210Bi and 210Po, respectively, Po being an alpha emitter. The count times are long and thus 210Pb analyses are generally time-consuming and costly.
Objectives An alternative to using radiochemistry is the use of mass spectrometry. Inductively coupled plasma mass spectrometry (ICPMS) has a number of advantages for long-lived radionuclides because it counts atoms instead of decays. It is particularly suitable for routine analysis of large number of samples (utilizing solutions) and can measure isotope ratios. Others have successfully used Pu for dating sediments [e.g., Ketterer et al. 2004]. In contrast, there are, to our knowledge, no reports of using sector field ICPMS to measure 210Pb in sediments.
In this study, our goals were to: 1) transfer and optimize protocols for Pu analyses for our lab using our instrumentation, and 2) examine the feasibility of using sector field ICPMS for dating sediments using both Pu and Pb isotopes. Specific objectives were to:
• Use ICPMS to measure Pu activity and atom ratios to age-date the Oxbow Lake sediments, and to compare the results with conventional 137Cs and 210Pb radioanalytical analysis.
• Determine the likely source(s) of Pu in the sediment using Pu isotopic signatures.
• Test the feasibility of using sector field ICPMS (instead of radiochemical means) to measure 210Pb extracted from sediment and isolated using column chromatography.
MethodsSediment Collection and Conventional Radiochemical ChronologySediment cores were collected as a part of a previous study [Wren and Davidson 2011]. Briefly, cores were sampled using a vibracorer from both open water and wetland areas within six different Oxbow Lakes (Roundaway, Washington, Beasley, Wolf, Sky and Hampton) in the Mississippi Delta. Plastic core pipes were inserted in the vibracorer before sampling. The cores were extruded and stored at 4˚C until they were processed. The cores were sliced into 1-cm thick intervals, dried
Dating Sediments from Oxbow Lakes in the Mississippi Delta using 239Pu, 240Pu and 210Pb determined by ICPMS: a feasibility studyCizdziel, James

Poster Session
13
at 60˚C in an oven, crushed with a mortar and pestle, and sieved through 1-mm screen. The cores were dated using both 210Pb and 137Cs analyses using conventional radioanalytical techniques as described elsewhere [Reimann et al. 2012]. Other sample and lake information, including watershed area, surface area, and GPS coordinates can be found elsewhere [Wren and Davidson 2007, 2011].
Plutonium Extraction, Isolation and ConcentrationThe main issues associated with the determination of Pu isotopes are: 1) formation of 238U1H, 238U1H1H that cause interferences with 239Pu and 240Pu, respectively, and 2) tailing effect of 238U on the 239Pu signal. Thus, uranium should be removed from the sample solutions by column chromatography before analysis because resolution of 238U1H and 239Pu is not possible using SF-ICPMS.
Here, sediment core samples from Beasley Lake (BL1A), Washington Lake (LW1A) and Roundaway Lake were analyzed for 239Pu, 240Pu and 242Pu (tracer) isotopes. The sample weights ranged from about 2 to 5 grams. The samples were weighed into a 20-ml glass vial and dry ashed at 600˚C for 6 hours to remove organic matter. 50 pg of 242Pu (NIST 4334g) was added as a spike for isotope dilution analysis. Five ml of 16M HNO3 was added and the mixture was leached at 80˚C for 16 hours. The samples were vacuum filtered through 0.45 micron glass fiber filters. The filters were rinsed with 15 ml of DI water and the rinsate was combined with the filtrate. Twenty mg of ascorbic acid were added to the solution for the conversion of all the Pu (III) to Pu (IV).
Columns of TEVA resin (Eichrom Technologies), used for the collection of actinides, were prepared using 5 ml pipette tips and TEVA resin powder. The narrow end of the pipette tips were clogged with glass wool and 0.1 – 0.2 gm TEVA resin powder was added. The columns were conditioned by passing 5 ml of 4M HNO3. 5 ml of the sample solution was allowed to pass through the column. During this step, Pu (IV) along with Np, Th and U is retained
within the column and other matrix elements are discarded. The columns were then rinsed with 3 ml of 4M HNO3 and 5 ml of 1M HNO3. The rinse step with 1M HNO3 allows wash out of the majority of the U from the column. A final rinse of the column with 20 ml of 9M HCl was performed to wash out Th. Pu was eluted using 10 ml of 0.02M HCl and analyzed by ICPMS.
Plutonium by ICPMS A desolvating sample introduction system (APEX) was utilized to minimize uranium hydride formation. SF-ICP-MS operating conditions are summarized in Table 1. The detection limit (3 times the standard deviation of the blank) was determined at femtogram levels.
210Pb AnalysesWetland and open water sediment core samples from Lake Washington (LW1A and LW2 respectively) and open water sediment samples from Hampton Lake (HL2A) were analyzed for total-Pb and Pb isotopes (206Pb, 207Pb, 208Pb and 210Pb). This report focuses on 210Pb; results for the other Pb isotopes will be reported elsewhere.
Dating Sediments from Oxbow Lakes in the Mississippi Delta using 239Pu, 240Pu and 210Pb determined by ICPMS: a feasibility studyCizdziel, James
Table 1. SF-ICPMS Conditions for Pu analysisParameter Units or mass Operating
ConditionForward Power W 1450Cool gas L/min 16Auxiliary gas L/min 1.0Sample gas L/min 1.2Mass Window % 20Magnet settling
s 0.001
Scan type E-scanIntegration window
% 80
Samples/peak 239, 240 150242 50
Sample time 239, 240 0.1s242 0.01s

Mississippi Water Resources Conference2012
14
Sample preparation for total-Pb analysisTwo grams of each sediment sample was weighed in a 20 ml glass vial and ashed in a muffle furnace at 600˚C for 6 hours. The ashed samples were transferred to clean 50 ml tubes and leached with 20 ml of concentrated HNO3 for 8 hours in a hot block. The leached samples were passed through 0.45 micron filters and the leachate volume was made to 50 ml with DI water. 0.5 ml liquid from the diluted leachate was transferred to 15 ml clean centrifuge tube and the volume was made up to 10 ml with 2% HNO3.
Sample preparation for 210Pb analysisSamples were prepared as described above for total-Pb analyses. As noted, 0.5 ml of the diluted leachate was used for total Pb analysis; here the remaining 49.5 ml liquid was used for Pb isotope analysis. The solution was heated to complete dryness in a hot block. The volumes of the samples were made up to 10 ml using 1M HNO3. Pb resin columns were prepared by clogging the narrow end of 5 mL pipette tips with glass wool and filling it up with 0.1 - 0.2 gm of Pb resin powder (100 – 150 µm). The columns were conditioned by passing 5vml of 1M HNO3. The sample solutions were then loaded on to the columns and the eluent was discarded. The columns were washed using 20 ml of 1M HNO3. This wash is performed to remove Bi and Fe. 10 ml of 0.1M HNO3 was added to the columns to remove any 210Po. Following the last wash, 40 ml of 0.1M citric acid monohydrate solution was added and the eluent was collected in 50 ml centrifuge tubes. The solutions were heated to complete dryness in a hot block and the volumes were raised to 10 ml with 1% HNO3. The procedure is summarized in Figure 1.
210Pb by ICPMSThe commonly occurring polyatomic interferences in the detection of 210Pb are: 1) the presence of large peak at mass 208 (the most abundant Pb isotope) which tails into the adjacent mass 209 and 210 (this is partly from the ions losing energy by collisions with residual gas molecules in the
analyzer); and 2) the formation of 208Pb1H1H (isobaric with 210Pb). Note that it is not possible to separate stable (208Pb) and radioactive isotopes (210Pb) of the same element using chromatographic resins. A possible solution to the later is the use of a desolvating nebulizer to remove hydrogen atoms, which stem mostly from water [Laiviere et al. 2005].
Here we used a desolvating sample introduction system (APEX-Q) for both total-Pb and Pb-isotopes to minimize hydride formation and boost sensitivity. SF-ICPMS operating conditions are summarized in Table 2.
Results & DiscussionPlutonium. Results for Pu (concentrations, 239+240Pu activities, and 240Pu/239Pu atom ratios) for the Beasley Lake open water (OW) core are given in table 3 and figure 2. The results for Washington and Roundaway Lake wetland core are presented in Figures 3 and 4. Of the cores analyzed the Beasley Lake OW core has the best defined chronology [Wren and Davidson 2011]. The authors of that report used conventional dating techniques to find a reduction in sediment accumulation rates and attributed it to recent erosion control and cropping practices. We analyzed Beasley Lake sediment samples using two methods: batch mode (mixing resin beads with the solution then collecting them by filtration) and column mode (slowly passing the sample through a column containing the resin).
Dating Sediments from Oxbow Lakes in the Mississippi Delta using 239Pu, 240Pu and 210Pb determined by ICPMS: a feasibility studyCizdziel, James
Table 2. SF-ICPMS Conditions for Pb analysesParameter Operating ConditionForward Power 1450 WCool gas flow rate 16 L/minAuxiliury gas flow rate 1.0 L/minSample gas flow rate 1.2 L/minMass Window 5%Magnet settling time 1 sScan type E-scanIntegration window 5%Samples/peak 100Sample time 0.05s

Poster Session
15
Whereas Pu levels were found to be lower in the batch method, the trend (profile) for concentration with depth was similar (figure 2). Nevertheless, the column method appears to yield better results, based on the low counts (recoveries) and unusually high isotope ratios for the batch method (discussed below). Thus, we used the column method for other analyses.
Importantly, the peak Pu depth (~47 cm) was in agreement with peak 137Cs depth (data not shown). This suggests that Pu can be used as an alternative to traditional 137Cs radioanalysis. It should be noted that the inventory of 137Cs (half-life 30 yrs) from global fallout is decreasing and at some point in the future it will be too low in concentration to be used for dating purposes; this will not be the case for Pu with its long half life. As noted, 137Cs and Pu peaks correspond to 1963, the peak year for fallout, but the 210Pb dating places them a few years later (~1970). It is possible that the recent changes in sedimentation rates slightly affected the 210Pb chronology due to different slopes for the “excess” 210Pb (natural log) versus depth for before and after the erosion control structures were put in place.
240Pu/ 239Pu atom ratios averaged 0.19 for the column method, consistent with a global fallout source. The batch method yielded a ratio of 0.21, which is outside the global fallout range. Because
there are no other expected sources of Pu at this location, this suggests that the batch method is less accurate, perhaps a result of the low signal (counts) that it yielded which would introduce analytical error. There was an anomalously high ratio (0.25) at the peak Pu concentration (corresponding to 1963) for both methods. Again, whereas this wouldn’t be unexpected near the Pacific Proving Grounds where high yield tests were conducted this is unusual at this location. The cause is unknown but it should be noted that this high reading was not replicated in other cores. Removing the anomalous point changes the mean ratio to 0.18 (column) and 0.20 (batch), more in-line with global fallout ratios. The Pu activity profile for Washington and Roundaway Lakes are shown in figures 3 and 4. The data suggests that these sediments were, to some extent, mixed since deposition. Importantly, this agrees with conventional dating results which showed data scatter indicative of mixing [Wren and Davidson 2011]. Interestingly, for Washington Lake the peak Pu level occurred at a depth of ~21 cm which is similar to the peak depth for 137Cs (18 cm, not shown). In retrospect, these wetland cores were not the best choice for testing. An additional core from Sky Lake, also an Oxbow Lake in the Delta, is being analyzed with more samples for greater resolution; results were unavailable at the time this report was prepared.
Dating Sediments from Oxbow Lakes in the Mississippi Delta using 239Pu, 240Pu and 210Pb determined by ICPMS: a feasibility studyCizdziel, James
Table 3. Pu levels, isotope ratios, and 239+240Pu activities for Beasley Lake open water (BL1A) sediment core determined by Column (C) or Batch (B) modes
YearDepth (cm)
239Pu (pg/g) 240Pu (pg/g) 240Pu/239Pu 239+240Pu (Bq/kg)C B C B C B C B
2003 6 0.94 0.10 0.18 0.02 0.19 0.21 3.65 0.391992 16 1.04 0.17 0.18 0.03 0.17 0.18 3.89 0.631982 23 1.51 0.13 0.24 0.03 0.16 0.20 5.49 0.501971 47 2.72 1.07 0.42 0.25 0.16 0.23 9.82 4.551966 60 2.41 0.31 0.46 0.06 0.19 0.21 9.43 1.251963 68 0.06 0.06 0.02 0.01 0.25 0.25 0.27 0.241953 90 1.69 0.43 0.30 0.09 0.18 0.21 6.43 1.74Mean 1.48 0.32 0.26 0.07 0.19 0.21 5.57 1.33SD 0.91 0.36 0.15 0.08 0.03 0.02 3.37 1.52

Mississippi Water Resources Conference2012
16
Total-Pb: The average lead concentrations for Washington Lake (WL1A and WL2) cores and Hampton Lake (HL2A) were 7.86, 4.03, and 8.48 ppm, respectively. The corresponding signal intensity (counts-per-second) at mass 210 was 294, 219 and 400, respectively. Total-Pb concentrations ranged from about 4-12 ppm in all the three sediment cores. The variation in total-Pb concentration with depth (time) for the Hampton Lake core is presented in figure 5. The Washington Lake cores are not shown because chronology suggests that they were mixed since deposition. The concentration rises from about 6 ppm during the early part of last century to ~12 ppm during the 1950’s and early 1960’s, a time when leaded gasoline use was relatively high, then diminishes to ~7 ppm in the most recent (surface) sediment. The 6 ppm concentration likely reflects the background levels from naturally-occurring lead in soils.
210Pb: Determination of 210Pb in the sediment samples by ICPMS proved to be difficult. The levels of 210Pb were expected to decrease with depth but instead we found a correlation with total-Pb (figure 6), showing data for the Hampton Lake open water core. This suggests that interference from stable Pb, perhaps a 208PbHH+ and /or the tail of the large 208Pb peak (referred to as abundance sensitivity), is present and masking the small 210Pb signal. Conclusion & Future WorkPlutonium. This study has demonstrated that ICPMS can serve a useful role in rapidly identifying sediments that have experienced a degree of mixing since deposition, and thus, a potential use is as a screening tool, eliminating time-consuming and costly 210Pb analyses on such cores. Analyses of an undisturbed core yielded a Pu peak at a depth which is in good agreement with conventional 137Cs dating. The column method yielded better recoveries compared to the batch method. Open water cores provided Pu profiles more conducive for dating compared to wetland cores which appeared to have been mixed since deposition. Future work will include additional samples to
obtain a higher resolution chronology.
210Pb. The ICPMS analytical procedure presented here allows total-Pb and Pb isotopes (206Pb, 207Pb, 208Pb) to be determined at ppm levels in sediment samples. Total-Pb was highest in sediment intervals corresponding to a period when leaded gasoline was used. The results for 210Pb by ICPMS were problematic. The counts at mass 210 were low and subject to interferences that were not resolvable by high resolution ICPMS. Two approaches are suggested to overcome these issues: increase sensitivity (a new jet-interface option has been shown to enhance signal >100x), and remove polyatomic interferences using a collision cell.
ReferencesAmr M.A.; Saad-Al K.A.; Helal A.L., Ultra –trace measurements of 210Pb in natural occurring radioactive materials by ICP-MS. Nuclear Instruments and Methods in Physics Research.615 (2010) 237-241.
Donard O.X.F.; Bruneau F.; Moldovan M. Garraud H.; Epov V.N.; Boust D. Multi – isotopic determination of plutonium (239Pu, 240Pu, 241Pu and 242Pu) in marine sediments using sector – field inductively coupled plasma mass spectrometry. Analytica Chimica Acta 587 (2007) 170- 179.
Ketterer M.E.; Hafer K.M.; Jones V.J.; Appleby P.G., Rapid dating of sediments in Loch Ness: Inductively coupled plasma mass spectrometric measurements of global fallout plutonium. Science of Total Environment 322 (2004) 221 – 229
Laiviere D., Reiber K.M.; Evans R.D.; Cornett R.J.’ Determination of 210Pb at ultra trace levels in water by ICP-MS. Analytica Chimica Acta. 549 (2005) 188-196.
Reimann C.; Flem B.; Fabian K.; Burke M.; Ladenbereger A.; Negrel P.; Demetraides A.; Hoogewerff J.; The GEMAS Project Team. Lead and lead isotopes in agricultural soils in Europe – The
Dating Sediments from Oxbow Lakes in the Mississippi Delta using 239Pu, 240Pu and 210Pb determined by ICPMS: a feasibility studyCizdziel, James

Poster Session
17
Dating Sediments from Oxbow Lakes in the Mississippi Delta using 239Pu, 240Pu and 210Pb determined by ICPMS: a feasibility studyCizdziel, James
Figure 1. Pb analytical scheme
continental perspective. Applied Geochemistry, 27 (2012) 532-542.
Simms A.D.; Woodroffe C.; Jones B.G.; Heijnis H.; Mann R. A.; Harrison J., Use of 210Pb and 137Cs to simultaneously constrain ages and sources of post-dam sediments in the Cordeaux reservoir, Sydney, Australia. Journal of environmental Radioactivity. 99 (2008) 1111 – 1120.
Wren D.G.; Davidson G.R.; Galicki S. J.; Walker W.G., The evolution of an Oxbow Lake in the Mississippi alluvial floodplain. Journal of soil and water conservation. (2007).
Wren, D. G and Davidson, G. R. Using Lake Sedimentation Rates to Quantify the Effectiveness of Erosion Control in Watersheds. Journal of Soil and Water Conservation. 66 (2011) 313-322.
2.0g sediment sample
ashed for 6 hours at 600'C
H Acid leached with 20ml
C(mc. H.N03 for 16 hours
at 80"C in a hot block.
H Sample solution was
filtered and r~sidue was washed with 20m I Dl
water.
l1 Filtrate and residue wash
~ solutions were combined. Total Pb Volume was made up to Pb Isotope Analysis
50ml. ( 40% acid).
~ ~
49.5ml of the solution 0.5ml of the 50ml -solution was was transferred to
transferred to 15ml 50ml digestion
centrifuge Lube. vessels.
il il The volume was Solution was raised to 10ml by evaporated to
2% J.lN O:i. complete dryness.
il il Quantified by SF- Volume made up to 10
ICP-MS. ml with lM rlNOi and analy✓,ed by lCPMS

Mississippi Water Resources Conference2012
18
Figure 2. Sample preparation scheme for Pb analysis.
Figure 3. Depth vs. 239+240Pu activity for Beasley Lake
Dating Sediments from Oxbow Lakes in the Mississippi Delta using 239Pu, 240Pu and 210Pb determined by ICPMS: a feasibility studyCizdziel, James
0.0 2.0
6
,...._
5 16 '-' = :=. 23 .., ~
47
60
68
8
11 ,...._
15 = " '-' 21 = =- 23 .., ~ 26
27
30
33
0.0 OJ
Beasley Lake(01•en Watel')
239+240Pt1 (Bq/l(g)
4.0 6.0 8.0
■ Column
■ Batch
Washington Lake
0.2 OJ 0.4 05 0.6 0.7
239+240Pt1 Activity (Bq/l(g)
10.0
0.8

Poster Session
19
Figure 4. Depth vs. 239+240Pu activity (Bq/Kg) for Roundaway Lake
Figure 5. Deposition Date vs. Pb conc. in Hampton Lake
Dating Sediments from Oxbow Lakes in the Mississippi Delta using 239Pu, 240Pu and 210Pb determined by ICPMS: a feasibility studyCizdziel, James
11
,....._ 16
= 0 21 '-' -'= 26 =-.., ~ 31
36
46
51
56
0.00
2010
2000
i 1990
~ 1980
11970 .... ~ 1960 =-~ 1950
1940
Rounda~vay Lake
0.05 0.10 0.15 0.20 239+240Pt1 Activity
Ha1npton Lake (HL2A)
1930 +---~-~~-~--~--~--~ 0.0 2.0 4.0 6.0 8.0 10.0 12.0
Pb Con e. (ppm)
0.25

Mississippi Water Resources Conference2012
20
Figure 6. 210Pb signal intensity and total-Pb concentration versus depth (x-axis)
Dating Sediments from Oxbow Lakes in the Mississippi Delta using 239Pu, 240Pu and 210Pb determined by ICPMS: a feasibility studyCizdziel, James
900
800 --Pb-210
700 - Total-Pb
600 -;;;-a. 500 ~ 0 ... 400 N l, Q.
300
200
100
0 0
Hampton lake (Open Water}
100 200 Depth (cm)
300
14
12
10
8 E a. ~ ,::,
6 ~ ;. -~ 4
2
0

Poster Session
21
Identifying Fish Guilds Relative to Water Quality and Depth in Oxbow Lakes of the
Mississippi Alluvial ValleyDaniel Goetz, Mississippi State University
Goetz, D.; Kröger, R.; Miranda, L.
The Mississippi River Valley alluvial (MRVA) aquifer spans seven states in the central part of the U.S. In northwestern Mississippi, the MRVA underlies a rich, agricultural region known locally as the Delta. Nearly all of the water used to irrigate crops in the Delta is withdrawn from the MRVA aquifer. As more and more wells are drilled to irrigate crops, the need to monitor the amount of water being pumped from the MRVA becomes more critical. Using technologies such as data loggers combined with improved sensors, the U.S. Geological Survey has partnered with the Yazoo-Mississippi Delta Joint Water Management District to monitor irrigation wells throughout the Delta.
Vibration and inductance sensors are being tested on a variety of pumping applications to obtain real-time data for the amount of time that pumps are applying water during the growing season. The sensors were evaluated on about 30 test wells during the 2011 growing season to determine their ability to accurately monitor pump usage based on powering up and down and overall run-time. Once pump usage is determined, and pump rates are measured using a non-intrusive flow meter, then a total water volume pumped at each well can be calculated.
Future plans are to calculate total water volume pumped from a network of wells throughout the Delta during the growing season. Selected permitted wells in every county in the Delta for each of the four main crop types—corn, cotton, rice, and soybean—will form the network. This network can then be used to estimate irrigation water use for all other permitted wells in the Delta, aggregated by crop type and county.

Mississippi Water Resources Conference2012
22
Comparison of Indigenous and Selected Pentachlorophenol (PCP) Degrading
Bacterial Consortiums for Remediation of PCP Contaminated Groundwater
Vaibhav V. Joshi, Mississippi State UniversityM. Lynn Prewitt, H. Borazjani, Din-Pow Ma, Mississippi State University
IntroductionChlorophenolic compounds like Pentachlorophenol (PCP) are commonly used in a wide range of industrial and agricultural applications such as pesticides, paints, pulp bleaching, leather tanning and wood preservatives. Improper disposal of PCP containing materials and leakage of stored PCP into the environment have resulted in groundwater contamination (9, 12) which is a very serious health issue.
Prolonged exposure to PCP may lead to increased incidences of non-Hodgkin’s lymphoma, multiple myeloma and cancer in humans (2). PCP has been listed as a priority pollutant by the U.S. Environmental Protection Agency (EPA) and its use is restricted (5). Currently EPA lists 173 PCP
contaminated sites in the active superfund database, 3 within the state of Mississippi. Thus it is very important to effectively remediate PCP and its impurities causing contamination in the environment. Moreover PCP is very resistant to degradation due to the presence of a stable aromatic ring with high chloride content, which makes it a recalcitrant contaminant when introduced into soil or water (3). Many bacterial species, such as various strains of Burkholderia cepacia, Sphingobium chlorophenolicum, Pseudomonas sp., Arthobacter sp. and Bacillus thuringensis (7, 8) have been reported to actively degrade PCP. Previous studies have focused on degradation of PCP by individual bacterial species; however at sites of PCP contamination it is more likely that microbial communities are involved in
Pentachlorophenol (PCP) is a toxic and recalcitrant wood preservative which has been classified as a priority pollutant by U. S. Environmental Protection Agency. Improper disposal and handling of PCP treating solutions has resulted in sites of soil and water contamination. Previous studies have reported on individual bacterial and fungal species that degrade PCP. However in the environment there are communities of microorganisms present at sites of PCP contamination and involved in degradation of PCP. Few studies have focused on the microbial community involved in PCP degradation. Therefore the objective of this work is to compare PCP degradation by the indigenous bacterial community from PCP contaminated groundwater and customized groups of known PCP degrading bacteria. The experimental setup included treatments of indigenous and known PCP degrading bacteria. Bacterial identification was performed by cloning and sequencing of 16S rRNA gene and expression analysis of the PCP degrading genes was done using real time RT-PCR. Many of the bacterial species identified from the PCP contaminated groundwater have been reported to degrade chlorinated phenols. Burkholderia sp, a PCP degrading bacterium, was the predominant species identified in this study. Statistical analysis of the data indicated significant differences between the average PCP concentrations of treatments between day 0 and 21, but there was no detectable expression of PCP degrading genes observed in the groundwater samples possibly indicating that the decrease in PCP may not be from the microbial community.

Poster Session
23
PCP degradation. The contribution of indigenous microbial communities in the degradation of PCP in groundwater is unknown and is therefore the objective of this study.
Methods and MaterialsBacterial strains and growth conditions:Sphingobium chlorophenolicum strain L1 was obtained from American Type Culture Collection (ATCC). ATCC medium 1687 which contained (per liter) 0.65g of K2HPO4, 0.19g of KH2PO4, 0.1g of MgSO4.7H2O, 0.5g of NaNO3, 4g of sodium glutamate (C5H8NNaO4) and 2 ml of 0.01M FeSO4 was used to grow the strain. Cells were grown in a 30°C shaker at 200 revolutions per minute.
Sample collection:Twenty-five liters of PCP contaminated groundwater sample was collected from a 20 foot deep monitoring well (number 19AO) at a site located near a former wood treatment facility in central Mississippi (Figure 1).
Experimental setup:The following treatments with three replications per treatment were used in this study:1) Groundwater (with no amendments)2) Groundwater amended with Miracle Gro3) Groundwater inoculated with a pure culture of S. chlorophenolicum and amended with Miracle Gro.Groundwater samples were collected on days 0 and 21.
Chemical analysis:PCP concentration in groundwater samples (200ml) on day 0 and 21 was determined by EPA standard method 3510C (EPA 1996, separatory funnel liquid-liquid extraction) followed by analysis with gas chromatography electron capture detection (GC-ECD).
Bacterial Identification:One milliliter of groundwater sample from each treatment was added to 100 ml of sterile nutrient broth containing 8 ppb of PCP. Genomic DNA
was extracted from these cultures using a Nucleospin nucleic acid purification kit from Macherey-Nagel. Gene encoding 16S rRNA was amplified from isolated genomic DNA samples by PCR using two gene specific primers, 16S F (5’-AGATCGATCCTGGCTCAG) and 16S R (5’-GGTTACCTTGTTACGACTT). These amplified products were cloned into pCR 2.1-TOPO vector using TOPO TA cloning kit (Invitrogen). Recombinant plasmids were extracted from E. coli cells using PureLink plasmid miniprep kit (Invitrogen) and sequenced using Beckman-Coulter CEQ8000 Genetic Sequencer. Sequence analysis was performed using BLAST database searches.
RNA quality and gene expression:RNA was extracted from bacterial cultures using the standard protocol of the RNAqueous kit (Ambion inc.) and treated with TURBO DNA-free kit (Ambion Inc.) to remove DNA contamination. RNA quality from extracted bacteria was determined using 1.5% agarose gel electrophoresis and Experion RNA StdSens chip (Bio-Rad) analysis (Figure 4). The presence of clear and distinct bands for 16s and 23s regions indicated good quality of RNA free from DNA contamination. Purified RNA samples with good quality were then converted into cDNA using two step iScript cDNA synthesis kit (Bio-Rad). The cDNAs were amplified using gene specific primers designed for PCP degrading enzymes (Table 1). SYBR green master mixture and 16s housekeeping gene was used for real time PCR of these cDNA samples. Real time PCR was performed using the following program: initial denaturation step of 5 minutes at 95°C, followed by 28 cycles of denaturation at 95°C for 50s, annealing at 63°C for 60s and extension at 72°C for 50s with a final extension at 72°C for 10 minutes (4). These amplified cDNA products were analyzed by electrophoresis on a 1.5% agarose gel.
Statistical analysis:Significant differences in PCP concentration among treatments at day 0 and 21 were determined using PROC ANOVA and Tukey’s Studentized Range
Comparison of Indigenous and Selected Pentachlorophenol (PCP) Degrading Bacterial Consortiums for Remediation of PCP Contaminated GroundwaterJoshi, Prewitt, Borazjani, Ma

Mississippi Water Resources Conference2012
24
(HSD) test in SAS V. 9.2. Statistical values were: α =0.05, F value + 10.64, P value = 0.0022, F critical = 3.89.
Results and discussionAnalysis of PCP concentration:PCP concentration was determined from treatments 1, 2 and 3 on day 0 and 21 (Figure 2). Average PCP concentration ranged from 0.8ppm to 1ppm, which was higher than EPA detectable limits of PCP in groundwater (1 ppb) (6). There were significant differences in average PCP concentrations between treatments (1 and 2; 1 and 3) with and without Miracle Gro at each of the two sampling times. Average PCP concentration (ppm) in treatment 1 (0.9972) on day 0 and 21 was different from that of treatment 2 (0.8015) and treatment 3 (0.7683), indicating decrease in PCP concentration. There were no significant differences between the average PCP concentrations of treatments 2 and 3 (without and with S. chlorophenolicum) on day 0 and 21. Also there were no significant differences between the average PCP concentrations on day 0 and 21 of each treatment. Therefore this may indicate that differences among treatments can be attributed to the addition of Miracle Gro, stimulating bacterial growth and degradation of PCP in the groundwater.
Bacterial identification:Sequences obtained from CEQ8000 sequencer were analyzed using BLAST database searches. Sequences with greater than 98% identity match and less than 2 sequence gaps were selected as positive matches. Figure 3 represents the identification and composition of PCP tolerant bacterial species at day 0 and day 21. Bacterial species identified were Burkholderia sp., S. chlorophenolicum, Pseudomonas sp., Bacillus cereus sp., Ralstonia eutropha sp., Cupriavidus sp. and they have the ability to degrade chlorinated phenols in the environment (7, 8, 10, 11, and 13). Among these S. chlorophenolicum and Burkholderia sp. are known PCP degrading bacteria, and a
proposed mechanism by which they degrade PCP has been reported (14). Our data indicates that Burkholderia sp. is a dominant bacteria present in this study.
Gene expression:Results indicated that there was no gene expression obtained in RT-PCR, as there was no cDNA amplification observed, except in the case of 16s housekeeping gene (Figure 5) which indicates the presence of bacterial species in the groundwater. Average cycle threshold (Ct) value for 16s housekeeping gene was 22.2, which indicated strong positive gene expression for that gene, but there were no Ct values obtained for PCP degrading genes (Figure 6). Thus quantification of the gene expression was not possible for PCP degrading genes used in this study. This may indicate that bacterial genes encoding PCP degrading enzymes are not expressed or at very low level at these growth conditions and PCP concentrations.
ConclusionsMany bacterial species identified were potent chlorophenol degraders and Burkholderia sp. was a predominant PCP degrading bacterium present in the study. There were significant differences between average PCP concentrations among treatments over time period on day 0 and 21, but there was no gene expression observed for bacterial genes encoding for the PCP degrading enzymes. Therefore this may indicate that the decrease observed in the PCP concentration in the groundwater samples was due to the volatilization of PCP rather than microbial degradation. This site is undergoing biosparging bioremediation of PCP contaminated groundwater.
Acknowledgements
Funding for this research was provided by the Mississippi Water Resources Research Institute and the Forest Products Department. Special thanks to Min Lee for his contribution
Comparison of Indigenous and Selected Pentachlorophenol (PCP) Degrading Bacterial Consortiums for Remediation of PCP Contaminated GroundwaterJoshi, Prewitt, Borazjani, Ma

Poster Session
25
ReferencesCai M., Xun L., 2002. Organization and Regulation of Pentachlorophenol-Degrading Genes in Sphingobium chlorophenolicum ATCC 39723. Journal of Bacteriology. 184 (17): 4672–4680.
Cooper G., Jones S. 2008. Pentachlorophenol and Cancer Risk: Focusing the Lens on Specific Chlorophenols and Contaminants. Environmental Health Perspectives. 116:1001–1008.
Copley S. D. 2000. Evolution of a metabolic pathway for degradation of a toxic xenobiotic: the patchwork approach. Trends In Biochemical Sciences.25: 261-265.
Dai M., Rogers J. B., Warner J. R., Copley S. D. 2003. A previously Unrecognized Step in pentachlorophenol Degradation in Sphingobium chlorophenolicum is catalyzed by Tetrachlorobenzoquinone Reductase (PcpD). Journal of Bacteriology. 185(1): 302-310.
EPA 1996 EPA Method 3510C, Revision 3. December 1996, Revision 3. December 1996 EPA. 1987. Final determination and indent to cancel and deny applications for registrations of pesticide products containing pentachlorophenol (including but not limited to its salts and esters) for non-wood uses. US Environmental Protection Agency. Federal Register. 52: 2282-2293.
Federal Register, National primary and secondary drinking water regulations. Federal. Register 54, 1999.
He L., Guangwei L., Xiufen L., Chen J. 2008. Molecular characterization of bacterial community in aerobic granular sludge stressed by pentachlorophenol. Journal of Environmental Sciences. 20: 1243–1249.
Karn S. K., Chakrabarty S. K., Reddy M. S. 2010. Characterization of pentachlorophenol degrading Bacillus strains from secondary pulp-and-paper-
industry sludge. International Biodeterioration and Biodegradation. 64: 609-613.
Langwaldt J. H., Mannisto M. K., Wichmann R., Puhakka J. A. 1998. Simulation of in situ subsurface biodegradation of polychlorophenols in air-lift percolators. Applied Microbiology and Biotechnology. 49: 663-668.
Louie T. M., Webster C. M. and Xun L. 2002. Genetic and Biochemical Characterization of a 2, 4, 6-Trichlorophenol Degradation Pathway in Ralstonia eutropha JMP134. Journal of Bacteriology. 184 (13): 3492-3500.
Sánchez M. A. and González B. 2007. Genetic Characterization of 2,4,6-Trichlorophenol Degradation in Cupriavidus necator JMP134. Applied and Environmental Microbiology. 73 (9):2769-2776.
Stokes, E., Prewitt, M.L., Borazjani, H. Identification of Pentachlorophenol. 2011. (PCP) Tolerant Bacterial Communities in Contaminated Groundwater During Air-Sparging Remediation. 41st Annual Proceedings of the Mississippi Water Resources Research Meeting. Pp. 115-121. Bay St. Louis, MS. Nov 2-4, 2010.
Vallecillo, A., Garcia-Encina, P.A., Pena M. 1999. Anaerobic biodegradability and toxicity of chlorophenols. Water Science and Technology. 40: 161-168.
Xun L., Gisi M. R. 2003. Characterization of Chlorophenol-4-monooxygenase (tftD) and NADH: Flavin Adenine Dinucleotide Oxidoreductase (tftC) of Burkholderia cepacia AC 1100. Journal of Bacteriology. 185(9):2786-2792.
Yang C. F., Lee C. M., Wang C. C. 2006. Isolation and physiological characterization of the pentachlorophenol degrading bacterium Sphingomonas chlorophenolica. Chemosphere. 62: 709–714.
Comparison of Indigenous and Selected Pentachlorophenol (PCP) Degrading Bacterial Consortiums for Remediation of PCP Contaminated GroundwaterJoshi, Prewitt, Borazjani, Ma

Mississippi Water Resources Conference2012
26
Comparison of Indigenous and Selected Pentachlorophenol (PCP) Degrading Bacterial Consortiums for Remediation of PCP Contaminated GroundwaterJoshi, Prewitt, Borazjani, Ma
Table 1. List of gene specific primers used for amplification of cDNA in this study (1, 13).# Name of gene Forward Primer Reverse Primer1 16s TAGGGTTGGCGATGGCTGAT TTCTTCACACACGCGGCATT2 PCP-B CGGGTTCACGTTCAACTTC-
GAGAAGATCGTCGAAGGAACTGAGA-TAGC
3 PCP-C CTATGACGACAAGCAGGTGGA-CAT
CATCCGCTGATAATAAGCGAG-CAG
4 PCP- A CGAACCATATCACCAGTCTG-CATC
CATGAAGAAGTCCATGTCCTC-CAG
5 PCP-E TCCATATCGGGTTATCTTCGGTCC ATCGGGATCGTAGACCAC-GATCTT
6 PCP-D GGAGACCCGTCATAT-GACAAACCCGT
GTCGATCTCGAGGATGTCCAG-CACCA
7 Chlorophenol-4- monooxy-genase
CGGAGGTGGTCGCACGGAAC CCAGACAACGCGGCCGTCAT
8 S. chlorophenolicum “pcp” suite of genes
TGGTGACGTCGGCATTCGCC CCCGGCGTCGCCTTCCATTT
Figure 1. Aerial photograph of study site, including locations of biosparging wells and monitoring wells. Water sample for this study was collected from MW44 circled in red. Study site is located in central Mississippi and had initial PCP groundwater concentrations of ~3ppm(Stokes 2011)
., • •
..

Poster Session
27
Comparison of Indigenous and Selected Pentachlorophenol (PCP) Degrading Bacterial Consortiums for Remediation of PCP Contaminated GroundwaterJoshi, Prewitt, Borazjani, Ma
Figure 2. Statistical analysis of Average PCP concentration in three treatments on sampling day 0 and 21, by Gas Chromotography ECD. Statistical Values:a- 0.05, F value= 10.64, P value= 0.0022, F critical= 3.89
Figure 3. Identification and composition of idigenous bacterial species in PCP contaminated groundwater sample.
1.4
e ! 1.2 C 0 1 :;::; Ill ~ ....
0.8 C QI u C 0 0.6 u
Cl. u Cl. 0.4 QI QO Ill
0.2 ~ QI > <I:
0
Comparison of average PCP concentration among treatments
A
I
t reat ment 1
Sphingobium chlorophenolirom sp
3%
Pseudomonas sp. bE19
2%
B B
treat ment 2 treatment 3
Treatments
■ day0
day 21

Mississippi Water Resources Conference2012
28
Comparison of Indigenous and Selected Pentachlorophenol (PCP) Degrading Bacterial Consortiums for Remediation of PCP Contaminated GroundwaterJoshi, Prewitt, Borazjani, Ma
Figure 4. Experion RNA StdSens chip analysis of RNA samples. Lane L=RNA ladder, lane 1= day0_TRT1.rep2, lane 2=day0_TRT2.rep1, lane 3=day0_TRT2.rep2, lane 4=day0_TRT2.rep3, lane 5=day1_TRT1.rep1, lane 6+day1_TRT1.rep3, lane 7=day1_TRT2.rep1andlane8=day1_TRT2.rep2
Figure 5. Amplification of cDNA of Day 21 TRT2.rep1 using gene specific primers. Lane 1-16s lane 2- chlorophenol 4 monooxygenase, lane 3- pentachlorophenol 4 monooxygenase, lane 4=pcpA, lane 5= pcpB, lane 6=pcpC, lane 7=pcpD, lane 8= pcpE and lane9-1Ko plus ladder
....
..... .... -·-·--~ .... ...
7 0

Poster Session
29
Comparison of Indigenous and Selected Pentachlorophenol (PCP) Degrading Bacterial Consortiums for Remediation of PCP Contaminated GroundwaterJoshi, Prewitt, Borazjani, Ma
Figure 6. RT-PCR analysis of gene expression using gene specific primers in samples day0_TRT1.rep1 and day1_TRT2.rep1. Blue arrow indicates peaks for housekeeping gene 16s with average Ct value=22.2, while red arrow indicattes that there are no peaks observed for target gene chlorophenol-4-monooxygenase indicating no gene expression.
500
0 s
Afl'Oif,calion Cl'l&1'1 : Oe!a 2012-04-20 ,,,9.opd
10 1S Cy<Jo
20 2S
~ RT-PCR aoal)[Sis of geoe eiw.i:essiQO usiog gene specifiU>.dmecs io sample,s_ dayO_TRT1 cep1 aod day1_TRT2,cep1. Blue arrow indicates peaks for housekeeping gene 16s with average Ct value= 22.2, while red arrow indicates that there are no peaks observed for target gene chlorophenol-4-monooxygenase indicating no gene expression .

Mississippi Water Resources Conference2012
30
Formaldehyde released in leachate from medium density fiberboard (MDF)
buried in a simulated landfill
Min Lee, Mississippi State UniversitySung Phil Mun, Chonbuk National University
Lynn Prewitt, Mississippi State UniversityHamid Borazjani, Mississippi State University
IntroductionThe forest products industry was developed to meet the building needs of humans and has grown worldwide (Youngquist et al. 1996). Many forests have been destroyed by reckless clear-cutting practices causing people to be concerned about the future of forest, wildlife diversity, wood production, and the aesthetics (McNutt et al. 1992). However, current supplies of forest products materials are not sufficient to meet ordinary building needs. Therefore, wood composites were developed mostly during the past 40 years to meet the needs of the forest products industry (Thomas et al. 2008). In 1996, millions of tons of wood composites were manufactured annually (Maloney 1996). In 2009, the United Nations estimated that
42,494 m3 of wood-based panels were used (Pepke 2010). Wood composites are defined as wood that has been bonded and compressed with an adhesive (Maloney 1996) and include products such as: medium density fiberboard (MDF), particleboard (PB), oriented strand board (OSB), plywood, and laminated beam. Many adhesives commonly used in wood composite production contain formaldehyde: melamine-formaldehyde (MF), phenol-formaldehyde (PF), melamine-urea-formaldehyde (MUF), and urea-formaldehyde (UF). Formaldehyde is not only widely used in the manufacture of wood products such as medium density fiberboard (MDF), oriented strand board
Formaldehyde, a flammable, colorless, highly reactive gas at standard temperature and pressure, is commonly found in the environment, however, it is toxic and causes health issues for humans. Approximately 14 million tons of wood waste containing formaldehyde based resins are generated yearly and disposed in landfills or burned. No regulations exist and no studies have been conducted to address formaldehyde emission from wood waste containing formaldehyde buried in landfills. Studies are therefore needed to address this potential environmental issue. The objective of this study was to determine the amount of formaldehyde released into the leachate from two sizes of medium density fiber board (MDF) buried in a simulated landfill. Simulated landfills were constructed in cylindrical plastic containers (15.24 cm diameter, 22.86 cm high) with alternating layers of silty clay soil and ground or cut pieces of MDF for a total of five layers. Leachate was collected and sampled for formaldehyde and pH on days 0, 7, 14, 21 and 28. Formaldehyde released in leachate was determined by derivatizing using 2,4-Dinitrophenylhydrazine and analyzing by liquid chromatography with UV-Vis detection. Preliminary results indicate that formaldehyde released in the leachate was reduced by 99% by the end of the study. The initial pH of the leachate from soil without MDF was 5.87 and increased to 6.18 at the first week’s sampling time and remained at approximately 6.22 through day 28. The leachate from soil with added MDF had an initial pH of 4.66 and increased weekly to 6.40 on week four. Results from this study should provide new information about the fate of wood waste containing formaldehyde disposed in landfills.

Poster Session
31
(OSB), plywood, laminated beam, and furniture but also in the chemical and paper industries as well as in textile processing (Marra 1992). All resins are thermosetting and once formed they become very stable and resistant to heat. Among the different types of adhesives, UF resins are widely used in industry because of their beneficial characteristics. UF resins cost less than other resins and penetrate wood cells very quickly. Urea-formaldehyde resins can be degraded by bacteria into urea, formaldehyde, ammonia and carbon dioxide (Jahns et al. 1998)
Formaldehyde, a flammable, colorless, highly reactive gas at standard temperature and pressure, is commonly found in the environment (IPCS 2002). In nature the formaldehyde concentration is less than 1 μg/m3 with an average value of 0.5 μg/m3 (IARC 1995). However, formaldehyde is toxic and causes health issues such as watery eyes, burning sensations in the eyes and throat, nausea, difficulty in breathing and cancer in humans (IARC 2006). In 1996, the World Health Organization established the drinking water quality guideline value of 0.9 mg/liter for formaldehyde and air quality guideline value of 0.1 mg/m3 (IPCS 1996). The U.S. Department of Labor’s Occupational Safety and Health Administration (OSHA) established a standard of 0.75 parts per million for 8 hours working time with appropriate labels and warnings to protect workers from exposures to formaldehyde (OSHA 2011). The U.S. Environmental Protection Agency (EPA), Consumer Product Safety Commission (CPSC), and the U.S. Department of Housing and Urban Development (HUD) have focused on indoor air formaldehyde exposure. On July 7, 2010, the Formaldehyde Standards for Composite Wood Products Act was signed into law which states that no higher than 0.05 parts per million of formaldehyde for hardwood plywood, or 0.06 parts per million of formaldehyde for particleboard and MDF are allowed for emission of formaldehyde and this law will become effective on January 1, 2013 (S. 1660-6).
Approximately 14 million tons of wood waste containing formaldehyde based resins are generated yearly and disposed in landfills or burned (EPA 2003). Formaldehyde bonded wood waste may be a source of formaldehyde emission by release of free formaldehyde through degradation of the urea-formaldehyde bond in wood waste. No regulations exist and to our knowledge no studies have been conducted to address formaldehyde emission from formaldehyde bonded wood waste buried in landfills. Therefore the objective of this study was to determine the amount of formaldehyde released in leachate by two sizes of MDF buried in a simulated landfill.
Materials and MethodsExperimental design Simulated landfills were constructed in cylindrical plastic containers (15.24 cm diameter, 22.86 cm high) with alternating layers of silty clay soil (870 g) and MDF (120 g, ground or cut pieces) for a total of five layers (Figure 1). Soil (silty clay) was collected in Starkville, Mississippi and was obtained from a depth of 152.4 cm and then sieved through a screen to remove debris and large rocks. Plastic screens (10 mm thick and 5 mm thick), and non-woven fabric were placed successively on the bottom of each container in order to prevent clogging of the collection tube. Non-woven fabric was also placed on the top soil layer in order to reduce loss of moisture. One circular hole (5 mm diameter) was drilled in the bottom of the containers for collection of leachate and two circular holes (5 mm diameter) were drilled in the top of each plastic cylindrical container for air sampling. Plastic tubing containing a cut-off valve was attached through each hole with glue for air sampling and leachate collection. All chambers were stored in an incubator at 34°C. Medium density fiberboardMedium density fiberboard (MDF, 100 cm x 100 cm x 1.27 cm), commercially manufactured was used in this study. Two different MDF sizes were tested: cut pieces (3 cm x 1.5 cm x 0.5 cm) and ground (milled though a 5 mm screen). There were four
Formaldehyde released in leachate from medium density fiberboard (MDF) buried in a simulated landfillLee, Mun, Prewitt, Borzjani

Mississippi Water Resources Conference2012
32
treatments with three replicates per treatment: 1) ground MDF covered in soil, 2) cut pieces of MDF covered in soil, 3) soil only, and 4) ground MDF only.
Leachate collection and samplingDeionized water (750 mL) was added to each constructed landfill initially to saturate the soil and MDF, then drained (by gravity) into a glass vial, filtered though a 0.22 µm Nylon filter and analyzed for formaldehyde (day 0 sample). A second portion of deionized water (200 mL) was added to the chambers and allowed to soak for 1 hour. After 1 hour, leachate was collected in a 50 mL glass vial and filtered through a 0.22 μm Nylon filter (day 1 sample). At day 7 and on subsequent sampling times, 200 ml of deionized water was added to each treatment and allowed to soak for 1 hour and then collected as described above. Leachate was sampled on days 0, 7, 14, 21 and 28.
Formaldehyde determinationFormaldehyde was analyzed according to the U. S. Environmental Protection Agency Method IP-6C and 8315A (US EPA 1996a, US EPA 1996b) using a Waters 2695 high-performance liquid chromatography system with UV-Vis detection at 370 nm (Waters 996, Waters Corporation, Milford, MA). The analytical column was a 3.9 x 150 mm HPLC column (Nova-Pac® C18 60Å 4 μm, Waters Corporation, Milford, MA). HPLC chromatographic conditions were as follows: 40/60 acetonitrile/water (v/v), hold for 1 min; 40/60 acetonitrile/water to 100% acetonitrile in 3 min; 100% acetonitrile for 10 min; Flow Rate: 1.0 mL/min; Injection Volume: 20 μL. Leachate (1 ml) was derivatized by adding 0.5 mL of 2, 4-dinitrophenylhydrazine (DNPH) solution (100 mg/ 100mL in 0.1 N HCl) and mixing for 20 minutes. Derivatized formaldehyde was extracted with 1 mL of toluene, evaporated to dryness under nitrogen, resuspended in 1 mL acetonitrile and injected into the HPLC-UV system. The volume of leachate collected and pH were also determined at each sampling time.
Formaldehyde concentration was determined from a calibration curve generated using 0, 0.25, 1, 10, 25 and 100 ppm derivatized formaldehyde standards in acetonitrile. The formaldehyde concentration in the leachate was converted to total micrograms formaldehyde by multiplying the concentration determined from the calibration curve by the volume of leachate collected.
ResultsFormaldehyde analysis The amount of formaldehyde (µg) in the leachate from the four treatments were determined weekly for 4 weeks. The highest amount of formaldehyde was observed on day 1 and occurred in all treatments after the collection of the saturation leachate (day 0, Figure 2). On day 1 the leachate from MDF only (treatment 4) was highest in formaldehyde (43 mg) compared to MDF plus soil (17 and 15 mg respectively, treatments 1 and 2) while the soil only treatment (# 3) contained the lowest amount of formaldehyde (0.5 mg) in the leachate. The amount of formaldehyde decreased by 50% in the ground MDF only treatment by day 7 compared to between 90-96% in the MDF plus soil treatments (1 and 2) and the soil only treatment. The amount of formaldehyde in each treatment continued to decrease on days 14 and 21. By the end of the study at day 28, the formaldehyde in the leachate had been reduced by 99% in treatments 1 and 2 and by 87% in the MDF only leachate (treatment 4).
pH and leachate volumeThe change in pH of the leachate from the 4 treatments over the four week test period is shown in Figure 3. The initial pH of the leachate from soil without MDF was 6.36, increased to a maximum of 6.87 at day 21 and was 6.70 at day 28. The leachate from ground MDF buried in soil (treatment 1) had a pH of 4.66 on day 0 and increased to 6.70 by day 28. At day 28 the pH of the leachate containing the small MDF was 6.56 which was slightly lower than the pH of the leachate from the ground MDF in soil. The pH of the ground MDF only
Formaldehyde released in leachate from medium density fiberboard (MDF) buried in a simulated landfillLee, Mun, Prewitt, Borzjani

Poster Session
33
treatment was 4.21 on day 0 and increased to 5.71 on day 28 which was lower than the leachate in the other treatments.
The highest change in leachate collection volume was a decrease in the MDF only treatment that occurred at the day 1 sampling. After day 1 the volume of collected leachate remained stable in this treatment. In contrast, the volume of leachate collected in the treatments containing soil and MDF increased at day 1, decreased at days 7, 14 and 21 then increased at day 28. The volume of leachate collected in the soil only treatments decreased from day 0 to day 1 and remained constant after day 1. Figure 4 shows the leachate amounts of the four treatments at each sampling time.
DiscussionThe pH of the leachate was lower on ground and small pieces MDF buried in soil and the ground MDF only treatments (1, 2, and 4 respectively) than in the soil only treatment (3) except at the end of the study. This is most likely due to the acidic catalysts used in making the UF resin and the acidic wood fibers. However, the pH of the leachate increased in treatments 1 and 2 to that of the soil’s pH by the end of study. The pH of the ground MDF only (treatment 4) remained below that of the other treatments, indicating that the soil helped to neutralize the acidity of the leachate overtime. This data indicates that most of the acidic material in the MDF plus soil treatments was removed during the 4 week test period.
The amount of leachate collected from soil only (treatment 3) was more constant over time compared to the other treatments containing MDF. At the last sampling time, the amount of leachate from the treatments containing MDF plus soil (1 and 2) increased 4-5x.
The formaldehyde in leachate (Figure 2) from ground MDF only (treatment 4) was reduced by 50% by the second sampling time and this reduction increased to 83% by the end of the
study. The formaldehyde reduction in MDF plus soil treatments increased to 90-96% at day 7 and increased again to 99% at the end of the study. This indicates that formaldehyde may be bound to the soil thereby reducing its concentration in the leachate over time.
At the end of the study, the amounts of formaldehyde in the leachate from ground MDF buried in soil and small pieces MDF buried in soil were less than the formaldehyde in leachate from soil only on Day 0. From this data, nearly all of the free formaldehyde was removed from the MDF plus soil treatments. However, formaldehyde was still detected in the leachate from ground MDF only. Reduction of formaldehyde in the leachate from soil amended treatments may have been due to transformation or degradation of formaldehyde by the soil or binding to the soil. Further studies are needed to determine the amount of formaldehyde in the soil and remaining in the MDF and to address the fate of the formaldehyde in soil. Acknowledgements
This work was funded through a United State Department of Agriculture Wood Utilization Research Grant and the Mississippi State University Department of Forest Products.
References CitedIARC (International Agency for Research on Cancer). 2006. Formaldehyde, 2-Butoxyethanol and 1-tert-Butoxypropan-2-ol. IARC Monographs on the Evaluation of the Carcinogenic Risk of Chemicals to Humans. 88.
IARC (International Agency for Research on Cancer). 1995. Formaldehyde. In: Wood dust and formaldehyde. IARC Monographs on the Evaluation of the Carcinogenic Risk of Chemicals to Humans. 62: 217–362.
IPCS 2002. Formaldehyde. World Health Organization, International Programme on
Formaldehyde released in leachate from medium density fiberboard (MDF) buried in a simulated landfillLee, Mun, Prewitt, Borzjani

Mississippi Water Resources Conference2012
34
Chemical Safety (Concise International Chemical Assessment Document 40). Geneva.
IPCS 1996. Guidelines for drinking-water quality. Health criteria and other supporting information. World Health Organization, International Programme on Chemical Safety. Geneva. 2: 973.
Jahns, T., R. Schepp, C. Siersdorfer, and H. Kaltwasser. 1998. Microbial urea-formaldehdye degradation involves a new enzyme, methylene diurease. Acta Biologica Hungarica. 49(2-4):449-54. Maloney T. M. 1996. The family of wood composite materials. Forest Products Journal. 46(2): 19-26.
Marra A. A. 1992. Technology of wood bonding: principles in practice. Van Nostrand Reinhold. ISBN 0-442-00797-3.
McNutt J.Α., Haegglom R., Raemoe K. 1992. The global fiber resource Picture. In: Wood Product Demand and the Environment. A Forest Products Research Society International Conference Proceedings. 39-53.
OSHA (Occupational Safety and Health Administration). 2011. Formaldehyde fact sheet. www.osha.gov. retrieved 06.20.2012
Pepke E.D. 2010. Forest Products Annual Market Review. United Nations.
S.1660-6. 2010. Formaldehyde Standards for Composite Wood Products Act. www.govtrack.us/congress/bills/111/s1660/text. retrieved 06.20.2012
Thomas N., David W.T., Timothy M., William C.P., Barry M. 2008. Medium Density Fibreboard. United States Patent Application 0032147 A1.
U. S. Environmental Protection Agency Method 8315A. 1996a. Agency Method IP-6C. 1996b. Compendium Determination of Air Pollutants in Indoor Air.
U.S. Environmental Protection Agency Method IP-6C. 1996b. Compendium of Methods for the Determination of Air Pollutants in Indoor Air.
Youngquist, J.A., Krzysik A.M.,English B.W., Spelter H.N. Chow P.1996. Agricultural Fibers for Use in Building Components. In: The use of recycled wood and paper in building applications. Forest Products Society. Proceeding 7286. Madison, WI 123-134.
Formaldehyde released in leachate from medium density fiberboard (MDF) buried in a simulated landfillLee, Mun, Prewitt, Borzjani

Poster Session
35
Formaldehyde released in leachate from medium density fiberboard (MDF) buried in a simulated landfillLee, Mun, Prewitt, Borzjani
Figure 1. Simulated landfill test design for determination of formaldehyde in leachate and air. A: Leachate port (5mm), B: Plastic screen (10mm), C: Plastic screen (5mm), D: Non-woven fabric, E: Soil (2.54 cm), F: MDF sample (2.54 cm).
Figure 2. Total formaldehyde (µg) released in leachate from 4 treatments involving MDF buried in a simulated landfill and sample weekly for 4 weeks. The concentration represents the average values of three replications.
45000 - Ground MDF/soil
40000 ~ Small MDF/soil ~ Soil
35000 ~ Ground MDF only
1 30000 C ,Q 25000 -f! -5i 20000 u C 8 15000
10000
5000
0 0 7 14 21 28
Time (day)

Mississippi Water Resources Conference2012
36
Formaldehyde released in leachate from medium density fiberboard (MDF) buried in a simulated landfillLee, Mun, Prewitt, Borzjani
Figure 3. pH of leachate from 4 treatments involving MDF buried in a simulated landfill and sampled weekly for 4 weeks. The pH represents the average of three replications.
Figure 4. Volume of leachate collected from 4 treatments involving MDF buried in a simulated landfill and sampled weekly for 4 weeks. The volume represents the average of three replications.
:r Q.
7.5
7.0
6.5
6.0
5.5
5.0
4.5
4.0
3.5
3.0 0
500
450
- 400 ...J
.5. 350
.! ~ 300 u "' j 250 ... 2 200 C ::,
~ 150
< 100
50
0
7
0 7
14
Time {day)
14
JChart Area I Time (day)
~ Ground MDF/soil
~ Small MDF/soil
Soil .,.Ground MDF only
21
~ Ground MDF/soil ~ Small MDF/soil ~ Soil ~ round MDF only
21
28
28
Poster Session
37
Preliminary Results from a New Ground-Water Network in Northeastern Mississippi
Michael A. Manning, U.S. Geological SurveyM.; Rose, C.; Welch, H.; Coupe, R., U.S. Geological Survey
In 2010, the U.S. Geological Survey established a new groundwater network to better understand the influence of agricultural land use on shallow groundwater quality. The areal extent of the study spans from southwestern Tennessee southward through the middle of northern Mississippi. A 30 well network overlays the basic recharge area that conforms along the eastern outcrop boundary of the Middle Claiborne Group, (Sparta Sand) within Tennessee and Mississippi. Well locations were randomly selected using a grid of 30 polygons generated by a geographical information system (GIS) model. Monitoring- well locations were then selected for each GIS-generated polygon that best fit both agricultural land use, and location to the outcrop area. These areas of outcrop for the Sparta Sand provide a hydrologic connection between the aquifer, and surface-water sources such as rivers, lakes, and rainfall runoff. This study will investigate the shallow groundwater quality of the Sparta waters on the eastern edge of the formation that could be altered by agricultural land use and will document any unfavorable compounds that may be carried into the aquifer.
During the fall of 2010, 15 of the new 30 well network were drilled and established on private properties located in northeastern Mississippi. These new monitoring wells were installed using a rotary drilling-type rig until the first water was identified. Using historical data, potentiometric surfaces were estimated to range from zero (land-surface) to about 30 feet below land surface. During the initial well drilling, the first water was encountered anywhere from 12 to 40 feet below land surface. All of the wells were screened at a 10 foot interval from the bottom of the well. Each well screen was set within mixed marine/deltaic facies consisting mostly of sand to sandy silty clays which are considered consistent with most Sparta Sands. Most of the wells were drilled within an area consisting of a least 60 percent or more local agricultural land-use. The locations were selected because the landowners were interested in the study, allowed accesses to their property, and they possessed land that had active agricultural activities that included corn, cotton, and /or soybeans.
The lower extent of the two-state study area was sampled for groundwater quality from March through April 2011. Water samples were analyzed for a wide range of constituents, including but not limited to trace elements, inorganics, nutrients, dissolved gases, tritium, and a full spectrum of pesticide compounds. The well network will be re-visited annually to monitor water levels, and a subset of five wells will be sampled every other year. Future plans are to re-sample the entire network for water-quality trends on a 10-year rotation. Land-use surveys were conducted within a 500-meter radius of each well to determine the current land use, and to provide a baseline for future land-use changes.

Mississippi Water Resources Conference2012
38
Buttahatchie RiverRiver Bank Stabilization Project
Brad Maurer, The Nature ConservancyAndrew Peck, The Nature Conservancy
Introduction The Buttahatchie River originates in northwestern Alabama and flows southwest into northeastern Mississippi where it joins the Tennessee-Tombigbee Waterway north of Columbus, Mississippi. The watershed encompasses approximately 556,750 acres. This total acreage is divided between Mississippi with approximately 128,459 acres and
Alabama with approximately 428,291 acres. Counties within the watershed include Itawamba, Lowndes and Monroe Counties in Mississippi and Franklin, Lamar, Marion and Winston Counties in Alabama. The Buttahatchie River was listed as an important site for conservation of freshwater biodiversity in North America by the World Wildlife Fund, United States in 2000. It has also been
The Buttahatchie River watershed is recognized by local and regional scientists, conservationists, and outdoors people for its ecological significance, especially the unique biological diversity found and documented in this system (Mississippi Museum of Natural Science, 2005). Mussel surveys, conducted by O'Neil et al (2004; 69 FR 40084), and the Mississippi Department of Wildlife Fisheries and Parks (2004) have documented viable communi-ties of rare mussel species along several reaches of the Buttahatchie River and some of its major tributaries. In addition, rare and unique fish communities and species have been reported from the Buttahatchie River system (Mississippi Museum of Natural Science, 2005). In an unpublished survey (Hicks 2004) of 23 biological experts in Mississippi, the Buttahatchie River ranked second behind the Pascagoula River out of 14 rivers in Mississippi in terms of priority for conservation and ecological significance (Mississippi Museum of Natural Science, 2005).
However, the lower reaches of the river have undergone wholesale channel adjustments in recent years, in-cluding widening, rapid erosion, quarry capture, and excess sediment. Erosion and excess sediment continue to be a problem in this area. The Stability Analysis of the Buttahatchie River by USDA National Sedimentation Laboratory (2005) cites disturbances including meander cutoffs, construction of the Tennessee-Tombigbee Wa-terway (including the impoundment of the Columbus pool), and gravel-mine capture.
The Buttahatchie River Stabilization Project was completed by The Nature Conservancy and partners in Oc-tober, 2010 , to demonstrate techniques to reduce non-point source (NPS) pollution within the Buttahatchie River Watershed, specifically NPS resulting from eroding river banks. The project was supported by a Section 319 Grant, and used several Best Management Practices (BMPs) designed to show habitat-oriented options to river-bank stabilization. Located in Lowndes County, Mississippi, the project met several important goals. Most imme-diately, it stabilized a rapidly eroding river bank and prevented thousands of cubic yards of soil from washing into the river. In the long term it is expected that the river bed in this area will also become more stable, and this will allow for improved habitat for fish, aquatic invertebrates, mussels, and other benthic organisms.
It also created an open-air educational site that demonstrates several useful stabilization BMPs and sets of tech-niques. This unique setting allows for the comparison of various techniques in one location.
The presentation will describe the individual BMPs, their installation process, and the resulting improvements to the river bank.

Poster Session
39
classified as a Freshwater Conservation Area by the Nature Conservancy (Smith, et al 2002). In an unpublished survey (Hicks 2004) of 23 biological experts in Mississippi, the Buttahatchie River ranked second behind the Pascagoula River out of 14 rivers in Mississippi in terms of priority for conservation and ecological significance (Mississippi Museum of Natural Science, 2005).
The Buttahatchie River watershed is a Conservation Priority Area for The Nature Conservancy (TNC). Local and regional scientists, conservationists, and outdoors people have long recognized the ecological significance of the Buttahatchie River, especially the unique biological diversity found and documented in this system (Mississippi Museum of Natural Science, 2005). Mussel surveys, conducted by O’Neil et al(2004; 69 FR 40084), and the Mississippi Department of Wildlife Fisheries and Parks (2004) have documented viable communities of rare mussel species along several reaches of the Buttahatchie River and some of its major tributaries. In addition, rare and unique fish communities and species have been reported from the Buttahatchie River system (Mississippi Museum of Natural Science, 2005). However, the lower reaches of the river have undergone wholesale channel adjustments in recent years, including widening, rapid erosion, quarry capture, and excess sediment. Erosion and excess sediment continue to be a problem in this area. The Stability Analysis of the Buttahatchie River by USDA National Sedimentation Laboratory (2005) cites disturbances including meander cutoffs, construction of the Tennessee-Tombigbee Waterway (including the impoundment of the Columbus pool), and gravel-mine capture.
SedimentErosion and sedimentation are natural and necessary processes in streams and rivers, and the movement of sediment in a stable system occurs at steady rates when averaged over fairly long time periods (such as years or decades). However, changes in conditions can cause perturbations to the amount of sediment in a river, and this can
lead to disequilibrium and further adjustments to the river morphology. The lower Buttahatchie River has been undergoing morphological adjustments for several years with mass wasting of river banks and rapid deposition of large gravel bars apparent along much of the river in this area (Pollen, et al. 2005). These adjustments are the result of land use practices, gravel mining adjacent to the channel, and changes resulting from the construction of the Tennessee-Tombigbee Waterway, completed in 1984.
PurposeThe purpose of this project is to demonstrate techniques to reduce non-point source (NPS) pollution within the Buttahatchie River Watershed, specifically NPS resulting from eroding river banks. This project used eight Best Management Practices (BMPs) designed to show habitat-oriented options to riverbank stabilization (Lowndes County Site, Fig. 1).
Site selection The initial site review was conducted through an examination of aerial photographs. Following the aerial photo review, several landowners were contacted, and windshield surveys and site visits were conducted.
The selected site is situated on the Buttahatchie River in Lowndes County met all of our selection criteria which included:
• Site must be within the Buttahatchie River watershed,
• The site must be typical of erosion problems in the watershed (rapidly eroding banks in sandy soil),
• The site must be accessible for construction equipment and personnel,
• The site must be in a convenient location for tours and educational visits,
• The landowner must be willing to allow the work and to leave the completed project in place without removing or altering it.
Buttahatchie River, River Bank Stabilization ProjectMaurer, Brad

Mississippi Water Resources Conference2012
40
Selected SiteThe Lowndes County project site is located along the Buttahatchie River approximately 10 miles north of Columbus, Mississippi, east of Highway 45 N on the west bank of the river in Lowndes County (Latitude 33.670495 N and Longitude -88.424005 W; West, Section 16, Township 16S, Range 18W; Fig. 1) and the watershed is located in the 8-digit Hydrologic Unit Code 03160103. The property is 16th Section land owned by the Lowndes County School District, and leased by the Lowndes County Wildlife Federation for hunting; both have been highly cooperative partners in the project.
PartnersPartners for the project included the Mississippi Department of Environmental Quality, Lowndes County School District, Ellis Construction, Mossy Oak Nativ Nurseries, Wallace Environmental, Mossy Oak Productions, Phillips Contracting, Lowndes County Wildlife Federation, the Tombigbee River Valley Watershed Management District, USDA-NRCS of Lowndes and Monroe Counties, private landowners, and anonymous contributors.
Project ImplementationLowndes County SiteExisting Conditions The Lowndes County project site is situated on the outside of a meander bend, and in its original condition the river was eroding in a westerly direction into the property (left descending bank). The site exhibited steep, rapidly eroding banks, mass wasting, and numerous trees that had recently washed into the river or were on the verge of being undercut. A review of aerial photographs showed that the river had moved laterally up to 250 feet over the last 30 to 40 years, with a large gravel bar developing on the opposite bank.
Similar fast-eroding river bends are found up and downstream of the project site. The river in this area exhibits characteristics of channels undergoing severe erosion; the bed material is not well consolidated, an excessive number of downed
trees are found in the channel, and the outside stream banks are steep and unstable (Fig. 4). These adjustments are the result of headcutting from the Tennessee-Tombigbee Waterway, meander cutoffs, and gravel mine capture (U.S. Department of Agriculture, 2005). Past incompatible agricultural practices have also cited as a cause of disturbance (Patrick, 1996).
The river banks at the project site were composed largely of unconsolidated sand and silt. However, a layer of cemented, or oxidized gravel was found at the toe of the bank along much of the reach. This cemented layer appeared to have greater resistance to erosion than the other materials. Due to the nature of the soils and the rate of erosion, there was little or no vegetation below the top of the banks except exposed tree roots.
Description of Lowndes County Site BMPsSeveral Best Management Practices (BMPs) were employed at the Lowndes County site to demonstrate various stabilization practices. These BMPs, as described below, were demonstrated in various combinations. It is not typical to construct several adjacent sets of different BMP techniques at one site; however, because this is demonstration project, this approach allows different BMPs and combinations of BMPs to be viewed on a single location.
The finished site consists of five separate sets of stabilization BMPs installed side by side along 600 feet of an eroding bend in the river. Existing unstable bank material (overburden) was excavated to prevent sedimentation caused by sloughing into the river. Though the cemented gravel layer apparently had some resistance to washing from the river, the material crumbled during excavation. The banks were regraded to a stable slope of approximately 3:1, and stabilized through the BMP techniques (see as-built drawings, Appendix I). Materials and practices consist of erosion control blankets, willow stakes, root wads, native ground cover vegetation and trees, and
Buttahatchie River, River Bank Stabilization ProjectMaurer, Brad

Poster Session
41
broken, debris-free concrete. An additional 600 feet, approximately 300 feet at each end of the BMP reach, was stabilized at the toe of the slope with broken concrete (Fig. 7).
The individual BMPs are listed below with a description of each. Table 1 shows how the BMPs were grouped in different areas of the site.
Regrading of unstable river bankSteep eroding river banks were excavated to a more stable slope of approximately 3:1. Without this project, virtually all of the soil that was removed would eventually have eroded into the river (Fig. 4).
Bank regrading is appropriate in areas of rapid erosion where the banks are too steep to stabilize in their existing configuration or unable to support vegetation that will create stability.
Erosion control blanketThe biodegradable erosion control blankets are made of coconut shell fibers and netting. The blanket holds the soil in place until vegetation becomes established, and will eventually degrade and disappear. It was installed in all areas where the bank overburden was removed (Fig.5) Erosion control blankets are used to stabilized soils or channels exposed by construction or other disturbances. The blankets hold soil or bed material in place until vegetation or other processes create natural stability.
Stacked soil cellsStacked soil cells consist of soil wrapped with erosion control blanket, and stacked in a staggered stair-step fashion. They are used in areas where a steeper bank slope is needed, and are included here for demonstration purposes (Fig. 6).
Appropriate locations for this technique include areas where structures or roadways are adjacent to the river or stream, and there is inadequate space to shape the bank to a shallower slope.
Rock ToeBroken concrete was placed at the toe of the slope to prevent erosion from undercutting the bank (Fig. 7). In addition to the rock at the toe of the slope, trenches were cut perpendicular to the bank to a length of 20 feet. These trenches were filled with rock to a depth of 4 to 5 feet, and backfilled. This technique, known as “tie-backs”, help to slow or prevent the movement of erosion up or down stream should a washout occur.
Though not part of the native landscape, rock is sometimes necessary in erodible soils to prevent the river from undercutting the bank, particularly in highly erodible or unconsolidated soils, such as those on the Buttahatchie River.
Root wadsOn-site hardwood trees were utilized for the root wads. Ten to twelve feet of the trunk was buried into the bank with the roots exposed at the toe of the slope. This prevents erosion and provides excellent habitat. Ten root wads were installed (Fig. 8).
Where the proper trees are available, root wads are an effective stabilization technique.
WillowsWillow cuttings placed into the ground will sprout roots and leaves with the expectation that the roots will spread laterally and grow into mature trees. As they grow and spread, the willows provide habitat and protection from erosion. Willow stakes have been planted along the length of the project on the lower bank, and through the rock placed on the slopes at the ends of the BMP section (Fig 9). At the upstream end of the project, willow cuttings were placed in trenches to form living, flexible “fences” to slow down the water at high flows and reduce erosion (Fig. 10).
Willow cuttings are generally appropriate anywhere within their habitat range when placed in moist soil. As they mature, willow cuttings effectively provide
Buttahatchie River, River Bank Stabilization ProjectMaurer, Brad

Mississippi Water Resources Conference2012
42
soil stabilization and habitat.
Rock on SlopeRock was placed on the slope of the bank at each end of the BMP area. This was done to stabilize the transition from the unexcavated slopes to the BMP area.
Native trees and plantsNative trees and other plants have been planted over the length of the project, Planting of native trees and other vegetation is compatible and necessary with all BMPs. As the trees mature, they will provide bank protection, and habitat and food for both terrestrial and aquatic animals. The native plants were planted in two “layers”, one of overstory trees and the other of understory shrubs and low trees. The overstory consists largely of oaks, while the understory species include American beautyberry, Chickasaw plums, Pawpaw and other low maintenance plants. Each layer was planted on a 10 x 10 foot grid, with the two grids offset to form an overall grid of 5 x 5 feet. This planting system will establish a high density of roots to better stabilize the soil from erosion. The understory species will reduce pressure on the oaks from animals such as deer and beaver, and will encourage the growth of beneficial soil microorganisms (Fig. 11).
Volume of Erosion and Sediment PreventionAs previously discussed, it is assumed that most or all of the soil excavated from the river bank would have eventually washed into the river without the stabilization. It is therefore worthwhile to estimate the amount of erodible soil that was excavated and removed from the site as quantifiable benefit from the project.
Three cross sections of the river were measured before the construction, and were resurveyed again following construction. The cross-sectional area of excavated material was measured for each cross section, and the values were averaged. The average value was then multiplied by the length of the project to produce the estimated volume of soil
removed. The volume of soil excavated from the stacked cells area was calculated separately due to the difference in the shape of the bank. Based on this approach, it is estimated that over 4,000 cubic yards of material were removed, and thereby prevented from washing into the river. This is equivalent to a football field covered with nearly 2 feet of soil. This value assumes a 0.4 increase in volume of the excavated soil in comparison with the in-situ soil, a typical expansion of excavated soils.
Summary The Buttahatchie River Stabilization Project has met several important goals. Most immediately, it has stabilized a rapidly eroding river bank and prevented thousands of cubic yards of soil from washing into the river. In the long term it is expected that the river bed in this area will also become more stable, and this will allow for improved habitat for fish, aquatic invertebrates, mussels, and other benthic organisms. It has also created an open-air educational site that demonstrates several useful stabilization BMPs and sets of techniques. This unique setting allows for the comparison of various techniques in one location (Figs. 12-13).
Strong and unique partnerships have been created during this undertaking, including the use of 16th Section land and the involvement of the local school district. Other partners include the local hunting club, local businesses and individuals, and businesses from other parts of the state. Though one of our partners was unable to participate in the construction of the project as expected, they have maintained a strong interest in learning from the completed techniques, and remain a partner in future Buttahatchie and Tombigbee River projects and planning. The project has and will continue to provide positive publicity for the Buttahatchie River, the Section 319 program, and the partners who have participated in the project. Additionally, the project has lead to the preliminary planning of future studies and actions that will continue to
Buttahatchie River, River Bank Stabilization ProjectMaurer, Brad

Poster Session
43
make improvements on the stability and quality of the Buttahatchie River.
BibliographyAlabama Natural Heritage Program 2004. Natural community Assessment and Rare Plant Survey of the Buttahatchee River bluffs, Lamar County, Alabama. Montgomery, Alabama.
Bankhead, N., Simon, A. and Klimetz, D. 2008. U.S. Department of Agriculture- Agricultural Research Service, National Sedimentation Laboratory. Analysis of Streambank Erosion Along the Lower Tombigbee River , Alabama. Oxford, Mississippi. FTN Associates, Ltd. 2004. Buttahatchee River Watershed Implementation Plan. Little rock, Arkansas.
McGregor, S.W. 2001. Geological Survey of Alabama. A survey of Freshwater Mussels in Selected Tributaries of the Upper Tombigbee River System, Alabama and Mississippi, 1994-2001. Tuscaloosa, Alabama.
McGregor, S.W. and Cook, M.R. 2005. Geological Survey of Alabama. A Preliminary Analysis of Sedimentation Loading Rates in the Upper Buttahatchee River, Alabama, 2004-2005. Tuscaloosa, Alabama.
Miller, M. and Freeman, P. 2007. The Nature Conservancy. Conservation Action Plan for the Buttahatchie River Watershed. Arlington, Virginia.Mississippi Department of Environmental Quality. 2002. Big Black-Tombigbee, Tennessee River Basins Prioritization and Implementation Process. Jackson, Mississippi.Mississippi Department of Environmental Quality. 1998. Tombigbee River Basin Status Report 1998. Jackson, Mississippi.
Mississippi Department of Wildlife, Fisheries and Parks. 2004. Freshwater Mussels of Mississippi. Jackson, Mississippi.
Mississippi Department of Wildlife, Fisheries and Parks, Mississippi Museum of Natural Science. 1998. Endangered Species of Mississippi. Jackson, Mississippi.
Mississippi Museum of Natural Science, 2005. Mississippi’s Comprehensive Wildlife Conservation Strategy. Mississippi Department of Wildlife, Fisheries and Parks, Mississippi Museum of natural Science, Jackson, Mississippi.
O’Neil, P.E., McGregor, S. W., and Wynn, E. A. 2004. Geological Survey of Alabama. Federal Register 69 FR 40084. Critical Habitat Units for Threatened and Endangered Mussels in the Mobile River Basin.
Patrick, D. M. and Dueitt, S. 1996. University of Southern Mississippi. Geomorphology of Erosion and Channel Instability, Upper Tombigbee Drainage Basin, Northeast Mississippi. Hattiesburg, Mississippi .
Pollen, N., Simon, A., Klimetz, L. and Klimetz, D. 2005. U.S. Department of Agriculture- Agricultural Research Service, National Sedimentation Laboratory. Stability Analysis of the Buttahatchee River, Mississippi and Alabama. Oxford, Mississippi.
The Nature Conservancy. 1998. Rivers of Life: Critical Watershed for Protecting Freshwater Biodiversity. Arlington, Virginia.
The Nature Conservancy. 2000. The Five-S Framework for Site conservation: A Practitioner’s Handbook for Site Conservation Planning and Measuring Conservation Success. Volume I. Arlington, Virginia.
U.S. Department of Agriculture. Channel and Watershed Processes, Research Unit, National Sedimentation Laboratory. 2005. Stability Analysis of the Buttahatchee River Basin, Mississippi and Alabama. Oxford, Mississippi.
U.S. Department of Agriculture. 1979. Soil Survey of Marion County, Alabama. Auburn, Alabama.
Buttahatchie River, River Bank Stabilization ProjectMaurer, Brad

Mississippi Water Resources Conference2012
44
U.S. Department of Agriculture. 1979. Soil Survey of Lowndes County, Mississippi. Jackson, Mississippi.
U.S. Department of Agriculture. 1979. Soil Survey of Monroe County, Mississippi. Jackson, Mississippi.
U.S. Department of Agriculture, Natural Resources Conservation Service. 2007. Stream Restoration Design, National Engineering Handbook, Part 654. Washington D.C.
Buttahatchie River, River Bank Stabilization ProjectMaurer, Brad
Table 1. BMP sets showing included individual BMPs.
BMP Set Regrade Bank
Rock Toe
Erosion Control Blanket
Willow Stakes
Root Wads Stacked Cells
Willow Trenches
Rock on Slope
Basic X X X X
Root Wads X X X X X
Stacked Cells
X X X X X
Willow Trenches
X X X X X
Rock on Slope
X X X X

Poster Session
45
Buttahatchie River, River Bank Stabilization ProjectMaurer, Brad
Figure 2. Pre-construction conditions at the Lowndes County site.
Figure 1. Site locations map.
Ptop,d luQl,on S.1

Mississippi Water Resources Conference2012
46
Buttahatchie River, River Bank Stabilization ProjectMaurer, Brad
Figure 4. Regrading of unstable river bank.
Figure 3. Layout of stabilization plan
~ P.oc:k$1~
1 8
11!1 11'1'1 WIIIOW~l<.ai
c:::::J ErO'..ion c«wot Blank.et snCI 8n Regrading - ~01wae1,
VVlll~T~e.s
1' '9' StackedC~s
ft • 1 't t N$1Ve Tre~
RO<k T<>e PfO(e(:0"°' -· 100Hu
Butlahatchie River
~

Poster Session
47
Buttahatchie River, River Bank Stabilization ProjectMaurer, Brad
Figure 5. Installation of erosion control blanket.
Figure 6. Stacked cells.

Mississippi Water Resources Conference2012
48
Buttahatchie River, River Bank Stabilization ProjectMaurer, Brad
Figure 7. Rock at toe of slope.
Figure 8. Installed root wads.

Poster Session
49
Buttahatchie River, River Bank Stabilization ProjectMaurer, Brad
Figure 9. Placement of willow stakes.
Figure 10. Installation of willow trenches.

Mississippi Water Resources Conference2012
50
Buttahatchie River, River Bank Stabilization ProjectMaurer, Brad
Figure 11. Photograph taken in June, 2011, showing trees and developing vegetation. Note debris deposited by winter floods.
Figure 12. Post-construction site looking upstream.
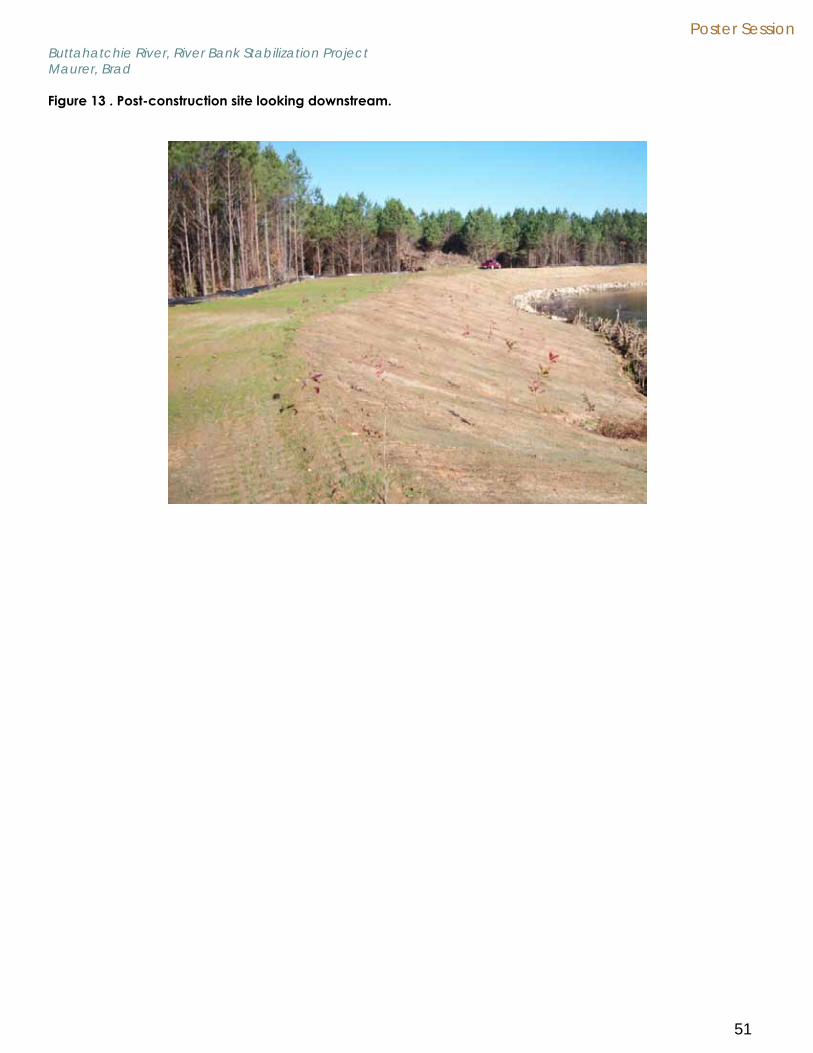
Poster Session
51
Figure 13 . Post-construction site looking downstream.
Buttahatchie River, River Bank Stabilization ProjectMaurer, Brad

Mississippi Water Resources Conference2012
52
Laymen, Experts, NGOs, and Institutions in Watershed Management
Giusy Pappalardo, University of CantaniaVia Santa Sofia, Città Universitaria
People’s activities and behaviors are deeply related with water and ecosystems: the relationship between human communities, their places of life, and nature has always been a challenging issue, like Ian McHarg explains in 1969, inspiring many scholars’ works. A question is open: who is part of human communities? It is possible to identify some groups of people: inhabitants, with their direct experiences of their native lands (laymen); researchers and practitioners, with scientific tools to understand and to design lands (experts); supporters of specific interests and hopes (NGOs); environmental authorities, with their responsibility in managing lands (institutions). They have different knowledge, roles, interests, and expectations. According to Fisher, Professor of Political Science at Rutgers University in Newark, everybody should be allowed to participate into the decision-making process about environmental matters. Elinor Ostrom, American political economist, 2009 Nobel Memorial Prize in Economic Sciences, also underlines the necessity of collaboration between different people and institutions to manage Common Goods, like rivers, rich soil, and hydraulic infrastructures.
Starting from this framework, this paper has an overall goal: to identify how do laymen, experts, NGOs, and institutions work together in managing their places of life. The main question is: how to establish collaborative practices among them, focused on watershed management, to experience a responsible use of resources and to improve water ecosystems? This question comes out from my PhD research at its current status: Rethinking Environmental Management through collaborative practices. The Simeto River Agreement: a crazy idea or a possible outcome? In Italy, these kinds of collaborative practices are experimental processes called River Agreements: they still are not so common, and in Sicily there is an ongoing one to define and to build a River Agreement for the Simeto Watershed. It is a Participatory Action Research (PAR) process, i.e. a deep collaboration among scholars and associations’ activists to improve local communities, and I am directly involved in the process as researcher. The process is led by a partnership between the University of Catania – Department of Architecture, and a network of Associations called ViviSimeto, to revitalize the Simeto River Valley, East Sicily, Italy, promoting ecological design and socio-economic improvement through a collective learning process. Furthermore, thanks to an European Scholarship on International Exchanges called Beyond Frontiers, I had the possibility to be a Short Term Visiting Scholar at Mississippi State University – Department of Landscape Architecture, from September to December 2011. Research’s activities at MSU let me find some Cases in Mississippi State about collaborative practices in watershed management, to study in order to give an input to the process. The Case Study Method is a useful tool for PAR processes, to help participants in visualizing possible alternatives.
This paper presents opportunities and some preliminary results related to a comparison between the PAR process in Sicily and a Case Study in Mississippi State. I am going to continue the Case Study and the comparison when I will be a Visiting Scholar at MSU again thanks to a Fulbright scholarship, from September 2012 to May 2013. Having returned to Italy again, the Case Study would support the ongoing process in Sicily, translated and shared with other participants through focus groups, public presentations and a website under construction, for collective learning and education.

Poster Session
53
IntroductionThe biosphere does not consist of a pyramid of organisms but of ecosystems in which many different creatures coexist in interdependence, each with its own process, apperception, roles, fitness, adaptations and symbioses. This system has an energy source as its currency, an inventory of matter, life forms and ecosystems, and reserves in the inventory – the cycles of matter, genetic and cultural potential. Energy is degraded but is replaced; some energy is arrested on its path to entropy and this increases the inventory and enhances the creative capacity of the biosphere. »(McHarg 1969:197)
Landscape architects and experts well know the importance of relationships among different elements of ecosystems. The relationship between human communities and the environment is a crucial issue underlined by Ian McHarg in his milestone Design with Nature (1969). In ecological design, it is also a matter of relevance to understand relationships inside human communities, as different people have different knowledge, interests, responsibilities in order to manage natural resources. The paper explores preconditions and characteristics of collaborative relationships among laymen, experts, NGOs’ activists, and institutional representatives, in managing water ecosystems. This work synthesizes some preliminary results of my PhD research developed in South Italy, Sicily, whose boundaries are mostly related to the Simeto River watershed. My research is part of a wider research project, the Simeto River Process, in partnership between the University of Catania, Department of Architecture, and a network of local grassroots associations called ViviSimeto. The partnership’s goal is to promote opportunities for self-sustainable development at the local scale; the context is characterized by complex ecological and socio-economic problems. The Process has already got a milestone, the Community Mapping project, i.e.
a strategy to explore the peculiar knowledge of inhabitants and their ability to organize landscape regeneration in a democratic perspective (Chambers 1992, Aberlay 1993, Fisher 2000). Next step of the process is the River Agreement, i.e. a strategy to support a network of different stakeholders working together in order to highlight common values and best practices in managing the river ecosystems. My PhD research has two interdependent overall goals: sustaining the process itself (action goal); enlightening possibilities and limits related to the Simeto River Agreement strategy, in order to reframe the concept of environmental management (scientific goal). The methodology is based on a deep collaboration between researchers and other stakeholders (Participatory Action Research, Whyte 1997), supported by a selection of Case Studies (Yin 1994) to improve the ongoing process (Francis 2001). Mississippi Water Resources Research Institute hosts an inventory of data in alignment with the research design; among them, the Mississippi Delta Nutrient Reduction Strategies and Watershed Implementation Plan for Harris Bayou have proper characteristics in order to focus how do laymen, experts, NGOs, and institutions collaborate in watershed management. Though the research is still a work in progress, the paper presents a first set of reflections and introduces the comparison of frameworks and practices in two different contexts, the Mississippi State - USA one, and the South Italy-European one.
Paradigm, research questions and literature review.It is widely accepted that human actions in environmental transformations are awkward choices. Considering landscape design as an act based on value system (Halprin 1989), choices depends on which visions for the future a community decides to embrace. Scholars agree that technologies and practices should be selected with strong awareness and responsibility about their consequences for the environment,
Laymen, Experts, NGOs, and Institutions in Watershed Management.Pappalardo, Giusy

Mississippi Water Resources Conference2012
54
as for present time, as for next generations (Jonas 1979); so opportunities and consequences related to transformations should be point out in public debate and discussed with all members of a community. Someone can argue that contemporary institutions are not able to take into account citizens’ direct involvement; but when communities have to organize and face practical problems, related to their resources and common goods (like water, forests, rural infrastructures), deep institutional changes can happen, through shared rules and projects (Ostrom 1990). It means that the decision-making process has to move to a collaborative process, taking into account different stakeholders’ knowledge and purposes through suitable tools (Fisher 2000). The main question is: who is part of a community, and which are these tools, practices, and furthermore, preconditions for different stakeholders’ collaboration? Simplifying, stakeholders can be defined in four categories. Laymen are inhabitants and users of a land, with their direct experience of the land due to their everyday life; according to André Gorz, their experience is called local knowledge (Gorz 2008). It also happens that groups of laymen, with distinguishing interests on their land, cluster in associations: laymen that take part to Non–Governmental Organizations (NGOs) represent a second specific kind of stakeholders. Then experts are inhabitants or users of a land, or external people, with a specific kind of scientific knowledge; among them, researchers are experts with scholar skills, and they have the responsibility of producing innovation in order to improve society. Lastly, institutional representatives are laymen or experts with high responsibilities for land management. As rivers and their ecosystems are a vital core of human communities, watershed is proposed as a critical scene to test forms of collaboration among stakeholders. So the main question moves to another question: is it possible to establish a collaborative strategy in managing water resources,
and which are its characteristics? In Italy there is a school of avant-garde scholars that is experiencing watershed management through participatory processes called River Agreements (Pizziolo and Micarelli 2011). The international debate highlights the necessity of watershed partnerships as a crucial issue in managing water resources, and Leach provides a framework of characteristics defined as inclusiveness, representativeness, impartiality (as equity and fairness), transparency, deliberativeness, lawfulness, empowerment (Leach 2006).
MethodologyResearch is connected to a practical experience. Researchers themselves are active participants, not just observers: according to the complexity theory (Morin, 1994), they influence data during the action. Results are evaluated during the action, too; they are analyzed through reports and focus groups that clarify consistency between goals and outcomes, reframing problems when it is due. Starting from the classification matrix of Deming&Swaffield (2011), research strategy is defined as subjectivist, i.e. knowledge itself is the product of a particular way to look at society where researchers are merged, and samples are not representative of general laws, but they are related to specific situations and context. Lessons from the fields contribute to theory building; theory and practice are deeply related; theory is tasted during the action though a reflective rationality (Schon, 1994; 1995). The main strategy is to be engaged in a Participatory Action Research project with a Service Learning perspective. Some scholars (Lewin, 1946; Whyte, 1991; 1997) have shown the validity of mixed research groups: these groups are composed by researchers and other participants; with their different skills and experiences, they contribute to build collective innovative processes. This is suitable for:
Laymen, Experts, NGOs, and Institutions in Watershed Management.Pappalardo, Giusy

Poster Session
55
• researchers to enter inside practical problems and evaluate their hypothesis during the action;
• participants to get capabilities in raising problems and building strategies.
Others (Reardon, 2003; Gravagno et alii, 2010) have concretely carried on Partnerships between University and Association to empower local communities. This is suitable for:
• University to apply its theoretical skills and contribute directly to local development;
• Associations to learn and improve their action;
• Institutions to innovate themselves.
Participants are invited to reflect during the action and to reframe their issues thanks to input received by concrete actions: this also helps researchers to perform their practical thinking and to face the complexity of reality (Saija, 2007). Since one of my goals is to improve the process itself, the methodology also requires a wide variety of multiple in-depth case-studies. The collected samples are analyzed with the purpose of defining what a River Agreement can be, and shared with other participants. Selection criteria are: partnerships among laymen, experts, NGOs, and institutions to improve water ecosystems; working together with different knowledge, abilities and responsibilities; learning by doing. The paper synthesizes the Participatory Action Research process in Sicily and presents some opportunities of comparison with a Case-Study in Mississippi State, detected using the aforementioned selection criteria.
The Simeto River Agreement. Some notes about the context, an overview of the process, and some preliminary results.The local context is a rural area where the most important river of Sicily flows, the Simeto River (113 km/70 mi long; 4182 Km2/1614 mi2 watershed).
This place is very rich of biodiversity, traditions and agricultural productions, but it is losing its original characters due to a lot of factors. The local community calls the middle course of the River as the Simeto River Valley.
With five municipalities in two different Provinces along its path, plus eight more close to it, it is a significant area due to some features: rare elements of wildlife still existing; historical and cultural heritage places; peculiar farming systems (with some high-quality products into a fascinating rural landscape with ancient buildings and infrastructures, from different époques starting from Neolithic, continuing with Greeks, Romans, Arabic, Normans, Bourbons); a lot of springs from Mount Etna (rich groundwater system). But there are also a lot of disturbing factors: water and ground pollution (cities’ depuration plants do not work; inefficient waste management system, illegal water pumping and chemical pollutants by some farmers and industries); derelict lands (young generations move from rural places into the cities and no one is taking care of fields anymore); inefficient and useless hydraulic infrastructures (artificial banks and dykes); so the context is badly changing and biodiversity is decreasing. For these reasons, it could be defined as an ecological challenging context. Furthermore, there is a long-lasting crisis for the local agricultural market and rural economies, with few institutional plans and no well-defined visions to empower local communities. Different local agencies do not share land management information and, in general, laymen, associations, and institutions are not used to work in a collaborative way, as it is even difficult to say who is the local community. Moreover, political patronage is quite common and young generations suffer unemployment problems (they do not believe in better changing so they often go away from Sicily).
Laymen, Experts, NGOs, and Institutions in Watershed Management.Pappalardo, Giusy

Mississippi Water Resources Conference2012
56
In the meanwhile, there is an active network of grassroots associations that wants to promote strategies and projects to revitalize derelict areas though responsible fruition and practices. They want to encourage public debate about these issues, with institutions playing their part in a responsible way. In 2008, the partnership among association and the Uinversity of Catania started from a specific need: defending a Special Area of Conservation (SAC Pietralunga) from the building of a big incinerator, that laymen perceived as very dangerous for them, for ecosystems and for the economy of their life place. This incinerator was part of the Regional Waste Plan of Governor Salvatore Cuffaro in 2002 (some years later he was convicted of mafia affair), so that regional institution was perceived as an enemy to fight. Laymen started organizing in grassroots associations that were able to affect decision-making process thanks to mass protests, for example mobilizing more than 5000 participants for a march, and also legal actions supported by some experts (Gravagno&Saija, 2008). Even if the fight against incinerator was successfully, it was not enough: partnership knew that NIMBY approach was not a proper way to face the question (Fisher, 2000), so researchers and activists started reflecting on a complex and more holistic level. It was immediately clear that the entire river system needs to be revitalized from deep changes, long-terms strategies, new and respectfully relationship human-environment. The partnership highlighted some goals: promoting an inclusive debate about the environment, starting from local knowledge and common experience, involving also laymen that are outside grassroots associations; affecting decision-making process, building a community strategic plan as a tool for a meaningful dialogue with institutions; trying to overcome advocacy toward a shared responsibility, i.e. a process in which different actors
play their part with their skills. The partnership was therefore starting to trace a collaborative strategy for watershed management improving renewed ecological relationship. It is reasonable to say that these goals are inspired by discourses about sustainability. More than theories, the debate focused on practices: which could be suitable paths toward sustainability? The first step was defined as the ‘Community Mapping Project’, built in a specific way suited to the local context, interests and needs. It explored the awareness to be part of an ecosystem where inhabitants share a ‘common home’ and its resources with other living being. Inspired from Bioregional practices, it focused the importance of mapping to create a community sense related also to natural environment, giving up a ‘city-centered’ vision to move toward a wider one, with the central role of rivers as symbols for respectful ways to live together (Aberlay, 1993); furthermore, it was a way to explore allocation and management of resources through an easy way of understanding land’s features, as experienced in Participatory Rural Appraisal (Chambers, 1992). But the ‘Community Mapping Project’ was also something more. It was a simple and direct action able to put different people together in front of a huge map (1:10000 scale with the all river path, in a 3 m height, 10 m weight wall) and reflect together about future of their land. A ‘serious play’ was invented, without rigid rules, but just some guidelines, to sharpen ‘mapper’s’ interest and action. In four months of work (carried on in four different cities), the partnership was able to involve 500 active participants (farmers, tourism operators, students, inhabitants, workers, users of the valley, and so on), plus some institutional representatives. This number is quite minor comparing with 5000 people involved into the protest against incinerator mentioned above, because it was more difficult moving ‘from NO! to YES!’, i.e. from the protest level to the proposal level. By the way, the Map collected a lot of interesting contributes about the past, the present and the future of the river valley in
Laymen, Experts, NGOs, and Institutions in Watershed Management.Pappalardo, Giusy

Poster Session
57
its complexity, with a particular attention on water resources. After a ‘Three Days Community Design Workshop’, called ‘ViviSimeto 2010’ and focused on some topics arisen from the ‘Community Mapping’, a document was realized, with a system of values, wish and, above all, with a system of actions: something like a participatory strategic plan. Participants evaluated this phase as successful through public appreciations and the willingness to continue working together.
When the partnership focused which pilot actions and projects could be the starting point of practical landscape transformation and regeneration, it was immediately clear the necessity to start from derelict areas, places that are not currently used, apart from being illegal dumps. Two of them were chosen, where the partnership experienced a community design approach to build collective knowledge (Raciti, 2012): one near the river, to revitalize through planting trees and natural open furniture, promoting a responsible use and care of a fragile ecosystem characterized by peculiar birds; the other one inside a city in a poor neighborhood, to revitalize through a creative school-community garden, promoting intergenerational exchange between old people and young students, with experiential forms of education. These two experiments showed two critical points: voluntary action was too weak; institutional support was not effective. Reflecting during the action, the partnership focused the importance of an Institutional Turning Point, i.e. a more organized structure made of a deep collaboration among associations and institutions.
Synthesizing, in order to build the River Agreement, the Community Mapping Project was the first milestone as a voluntary experiment carried on by the partnership among associations and institutions, with its good results and some failures related to the pilot actions. In the meanwhile, the partnership decided to enlarge itself, enclosing different institutional representatives, with the aim
of building a frame defined as a Community River Statement, the baseline for the River Agreement. This is still a work in progress, but it is possible to trace its characteristics. It is about to be realized by mixed work groups, with the institutional representatives as newcomers, and the purpose of clarifying the Simeto Community’s system of values, common rules, and landscape managing. The process of realizing the Statement is a way to let institutions and citizens collaborate around the common issue of revitalizing their place of life. It is going to be structured like a ‘puzzle’, where different actors do what they can (and want) to do, in order to contribute and to exchange with others. For examples, old people want to explore the topic of memories and transmission to young generation; some institutional representatives want to exchange data and expertise related to the river system; farmers and touristic operators want to realize networks and promotional strategies for a sustainable rural economy; some activists and researchers want to continue a ‘listening process’, like the one started with Community Mapping Project, going deeper inside stories of people who live the river. All different contributes are going to compose the puzzle, if every participant does not delegate, but takes own responsibility of a small action for the large collective project. After this phase, expected results are related to obtain a mature process to build the River Agreement, with the crucial challenge of defining the ‘stickiness factor’ (Gladwell, 2000), i.e. preconditions and characteristics of best practices in collaborative watershed management.
Comparing for learning: Watershed Implementation Plan for Harris Bayou – Mississippi State – USA. Research perspectives.In order to explore collaborative practices in watershed management, Mississippi State University and Mississippi Water Resource Research Institute host data about a Case where farmers, experts and institutional representatives started and implemented strategies to reduce water pollution and to improve ecosystems: the Harris Bayou Plan,
Laymen, Experts, NGOs, and Institutions in Watershed Management.Pappalardo, Giusy

Mississippi Water Resources Conference2012
58
part of a complex strategy called Mississippi Delta Nutrient Reduction Strategy. For this research, the first source of information used are some reports: Mississippi Delta Nutrient Reduction Strategies Implementation Draft December 2009; Watershed Implementation Plan for Harris Bayou Draft February 2011; Delta Nutrient Reduction Strategies and Implementation Plan Update September 2011. To go deep inside the Case, according to Yin (1994), a set of questions has been provided to key-actors, that represent different kinds of stakeholders involved: laymen and NGOs’ activists (Delta Farmers Advocating Resources Management and Delta Wildlife), experts and representatives of Mississippi Department of Environmental Quality. Questions are related to understand the “farmers’ forward-thinking mindset”, as reports say; they also try to explore the role of local knowledge, and tools used to link it to scientific knowledge; questions explore awareness and the educational process as an adaptive process of learning by doing, eventually.
Even if the study is still a work in progress, some preliminary aspects can be highlighted. Preconditions of this case are related to a voluntary, incentive-based, practical, cost-effective action; collaborative teams of stakeholders, governmental agencies, NGOs, academia, business, and agricultural producers, use existing programs in order to find proper strategies to support their action. It is necessary to continue with interviews in depth and field-work, to better understand the nature of the Case and to share “good news” with Simeto participants. For this reason, I am going to spend next nine months in Mississippi as a Fulbright scholar, and to study different cases in order to build a frame about collaborative practices in watershed management.
Acknowledgment I feel grateful to every person I met along the Simeto River. Besides, I want to acknowledge my advisor, Prof. Filippo Gravagno, University of Catania; my co-advisor, Laura Saija, Researcher
and Marie Curie Fellow, University of Catania – University of Memphis. Thanks to Antonio Raciti, Visiting Professor – University of Memphis, for the practical experiences and efforts in our common fieldwork for one year. I also want to acknowledge professors and students I met, as a short term visiting scholar, during my research exchange at Mississippi State University, Landscape Architecture Department, Mississippi Water Resource Research Institute, and College of Forest Resources – Wildlife, Fisheries & Aquaculture. Special thanks to Sadik C.Artunç, FASLA, Professor and Head Department of Landscape Architecture - College of Agriculture and Life Sciences, that invited me. Special thanks to Prof. Wayne Wilkerson, ASLA, Associate Professor at Department of Landscape Architecture, Director at Mississippi Water Resources Research Institute (my local mentor at MSU), that helped me in selecting Case Studies and gave me interesting eadvices. I also want to acknowledge: Prof. Chuo Li, PhD, Professor of Research Methods, DLA – MSU; Prof. Donald C. Jackson, PhD, Sharper Professor of Fisheries, Department of Wildlife, Fisheries & Aquaculture, MSU; Prof. Cory Gallo, ASLA, Assistant Professor, DLA – MSU.
Thanks to key actors I have already met and I am going to meet: far from my river, close to other rivers, I have the opportunity to refocus some points of my work, and to look at the international debate from another meaningful perspective.
References
Aberley D. 1993. Boundaries of home: mapping for local empowerment. Gabriola Island, Bc: New Society Pub.
Chambers R., 1992. Rural Appraisal: Rapid, Relaxed and Participatory, Discussion paper.
Deming and Swaffield, 2011. Landscape Architectural Research: Inquiry, Strategy, design. Hoboken, NJ: John Weley and Sons.
Laymen, Experts, NGOs, and Institutions in Watershed Management.Pappalardo, Giusy

Poster Session
59
Fisher F., 2000. Citizens, Experts and the Environment. The Politics of Local Knowledge. Durham and London: Duke University Press.
Gladwell M., 2001. The tipping point: how little things can make a big difference, Little Brown. Gorz, A. Écologie et politique (Galilée, 1975) (trad. it.: Ecologia e politica, Bologna 1978).
Gravagno F., Saija L., 2008. Is Mafia a Planning Issue, AESOP-ACSP 4th Joint conference. Chicago
Gravagno F., Saija L., Pappalardo G., 2010. Il fare alla prova del Mezzogiorno: partnership fra Università e comunità locale come soggetto attivo dello sviluppo locale,(tr: Participatory Action Research for a southern context. Partnerships between University and local community toward active sustainability),paper presented at XIII Conferenza Sociatà Italiana degli Urbanisti, Roma
Leach W., 2006. Collaborative Public Management and Democracy: Evidence from Western WatershedPartnerships, Public Administration Review 66 pp. 100-110. Blackwell PublishingLewin, K., 1946. “Action Research and Minority Problems” in Resolving Social Conflict. New York: Harper&Row.
Morin E., 1994. Mes demons. It. Tr. (1999): I Miei Demoni, Maltemi. Ostrom, E., 1990. Governing the Commons. The evolution of institutions for collective action. Cambridge University Press.Pizziolo G., Micarelli R., 2011. Il contratto di fiume/paesaggio del medio Panaro (Tr: The Panaro River/landscape agreement), in Bastiano M., Contratti di fiume (Tr: River Agreements). Palermo: Flaccovio Editore.
Raciti, A., 2012. Building Collective Knowledge through Design. Paper to be presented at the AESOP 26th Annual Congress, 11-15 July, METU, Ankara.
Reardon, K. M., 2003. Ceola’s Vision, Our Blessing:
The Story of an Evolving Community- University Partnership in East St. Louis, Illinois. In: B. Eckstein and J. A. Throgmorton (eds.). Story and Sustainability: Planning, Practice, and Possibility for American Cities. Cambridge, MA and London, UK: MIT Press, 113-142.
Saija L., ed. 2011. Comunità e Progetto nella Valle del Simeto (Tr: Community design in the Simeto River Valley). Catania: Edizioni Didasko.
Schon D., 1994. The reflective practiotionar. UK: Ashgate.
Schon D., Rein M., 1995. Frame reflection. New York: Basic Books.
Whyte W. F., 1989. Advancing Scientific Knowledge Through Participatory Action Research. Sociological Forum, 4(3), pp. 367-85.
Whyte W. F., 1997. Creative Problem Solving in the Field. Reflections on a Career. Walnut Creek, California: Alta Mira Press, Sage Publications.
Yin, R. 1994, Case study research : design and methods, Thousands Oak CA: Sage
Laymen, Experts, NGOs, and Institutions in Watershed Management.Pappalardo, Giusy

Mississippi Water Resources Conference2012
60
Assessment of the Ecological Value of Low-Grade Weirs in Agricultural Drainage Ditches
Beth Poganski, Mississippi State UniversityKröger, R. , Mississippi State University
Agricultural best management practices have been a common fixture in farm field landscapes for decades. Unfortunately, little scientific information documents ecological and economic benefits of implementing such practices. Recent literature has highlighted the ability of low-grade weirs placed in agricultural drainage ditches to decrease sediment and nutrient loads to downstream waters by altering ditch discharge rates and hydraulic residence time. Currently, knowledge of how these structures can affect agricultural landscape ecology, from the molecular to ecosystem level, is unknown. The aim of this research is to assess the ecological value of low-grade weirs as effective management practices in agricultural drainage ditches. Ecological value will be appraised based on the diversity and richness of organisms inhabiting such systems. Organismal communities were selected for evaluation because of their critical roles in nutrient cycling and exchange within aquatic food webs. Experimental organisms include aquatic vegetation, microbes, benthic macroinvertebrates, and fish. Sampling events will be conducted during the growing season (May-June) annually for 3 years in agricultural drainage ditches fitted with low-grade weirs in the upper Yazoo River Basin. Conducting the experiment during the specified time period increases the likelihood that water will be present in ephemeral ditches. Organism data will be compared to chemical sediment and water data collected at the study sites provided by an ongoing study that will continue on a parallel temporal scale. Investigating biologically diverse but systematically linked organisms, will not only supplement estimates of the total ecological value of low-grade weirs in drainage ditches, but analysis of individual groups of organisms will aid in predicting mechanistic effects of implementing such structures in heavily cultivated agricultural landscapes.

Poster Session
61
Assessing and Modeling Sediment Loads from Stream Corridor Erosion along the Town Creek
in MississippiJohn J. Ramirez-Avila, Mississippi State University
Langendoen, E.; McAnally, W.; Ortega-Achury, S.; Martin, J.; Bingner, R.
A research study was developed focused on the identification, assessment, evaluation and prediction of streambank erosion processes within the Town Creek watershed (TCW) in Mississippi. The hypothesis of the study was that streambank erosion is an important mechanism driving sediment supply into the streams and an important portion of the sediment budget for the TCW. A combination of in situ monitoring, geomorphic characterization methods and modeling was performed on different locations along the TCW to quantify the contribution of streambanks to stream sediment loads and better understand the processes of streambank erosion. From the results streambank instability was prevalent and highly erodible materials of streambanks are an important potential source of sediment through the entire watershed. Streambanks predominantly lost materials through gravitational failures and removal of failed sediments by hydraulic forces along the channel headwaters. These geomorphic processes could supply a considerable amount of the estimated 1,000,000 Mg of sediment annually exported from the entire watershed. Headwaters were commonly represented as incised channels near agricultural areas. Annual top streambank retreat occurred up to 2.7 m and contributed annual sediment loads ranged from 0.15 to 28.5 Mg per m-stream. Both assessments were based on repeated measured cross section surveys performed from February 2009 to March 2010. The USDA computational model CONCEPTS (Conservational Channel Evolution and Pollutant transport System) was evaluated on an incised reach of TCW to assess model performance and capability to simulate spatial and temporal changes along the study reach. CONCEPTS accurately predicted the time of occurrence and magnitude of top streambank retreat and failures of streambanks along the modeled reach. Results from field measurements and modeling offered important insights into the relative effects of streambank erosion on the sediment budget for TCW. Reduction of suspended sediment loads should focus on the attenuation of geomorphic processes and stabilization of reaches near agricultural lands at the headwaters within the watershed.

Mississippi Water Resources Conference2012
62
Rainfall Simulation to Evaluate Nutrient Loss from Marietta Soil Amended with Poultry and
Cattle ManureJohn J. Read, Mississippi State University
McLaughlin, M.; Adeli, A.
A research study was developed focused on the identification, assessment, evaluation and prediction of streambank erosion processes within the Town Creek watershed (TCW) in Mississippi. The hypothesis of the study was that streambank erosion is an important mechanism driving sediment supply into the streams and an important portion of the sediment budget for the TCW. A combination of in situ monitoring, geomorphic characterization methods and modeling was performed on different locations along the TCW to quantify the contribution of streambanks to stream sediment loads and better understand the processes of streambank erosion. From the results streambank instability was prevalent and highly erodible materials of streambanks are an important potential source of sediment through the entire watershed. Streambanks predominantly lost materials through gravitational failures and removal of failed sediments by hydraulic forces along the channel headwaters. These geomorphic processes could supply a considerable amount of the estimated 1,000,000 Mg of sediment annually exported from the entire watershed. Headwaters were commonly represented as incised channels near agricultural areas. Annual top streambank retreat occurred up to 2.7 m and contributed annual sediment loads ranged from 0.15 to 28.5 Mg per m-stream. Both assessments were based on repeated measured cross section surveys performed from February 2009 to March 2010. The USDA computational model CONCEPTS (Conservational Channel Evolution and Pollutant transport System) was evaluated on an incised reach of TCW to assess model performance and capability to simulate spatial and temporal changes along the study reach. CONCEPTS accurately predicted the time of occurrence and magnitude of top streambank retreat and failures of streambanks along the modeled reach. Results from field measurements and modeling offered important insights into the relative effects of streambank erosion on the sediment budget for TCW. Reduction of suspended sediment loads should focus on the attenuation of geomorphic processes and stabilization of reaches near agricultural lands at the headwaters within the watershed.

Poster Session
63
Effects of Immobilizing Agents on Surface Runoff Water Quality from Bermudagrass Sod
Fertilized with Broiler LitterJing Sheng, USDA ARS
Adeli, A.; Brooks, J.; McLaughlin, M.
Surface broadcasting is the common method for applying poultry litter on perennial forages, but this application method concentrates nutrients and pathogenic microorganisms at the soil surface where they are vulnerable to runoff water. The potential impairment of surface water from soluble nutrients, particularly N and P, metals such as copper (Cu) and Zinc (Zn), and pathogenic microorganism contained in broiler litter are of concern. Management practices that minimize contaminants in surface runoff water are environmentally desirable. A greenhouse study was conducted using rainfall simulation to determine the effects of immobilizing agents, such as FGD (flue gas desulfurization) gypsum (a residue from coal combustion) and biochar, on manure nutrients and fecal bacteria in runoff from bermudagrass sod. The experimental design was a randomized complete block with seven treatments and three replications. Treatments included a control (no litter), and broiler litter (either wood shavings or rice hulls) at the rate of 9 Mg ha-1, in all combinations with and without FGD or biochar. Rainfall was delivered at an average intensity of 75 mm h-1 with a total of four rain events. Runoff was collected in 250-ml sterile plastic bottles. Runoff samples were immediately transferred to the lab for microbial and nutrient analyses. Nitrate and ammonium were determined on a Lachat. Dissolved reactive P and metals were determined in filtered (0.45 µm filter) runoff samples. Unfiltered runoff samples were digested and analyzed for total nutrient concentrations using ICP). The results indicated that application of broiler litter in combination with FGD gypsum to bermudagrass significantly reduced runoff total dissolved organic C (DOC), total N, dissolved reactive P (DRP), Cu and Zn by 16, 30, 61, 73 and 13%, respectively, compared to broiler litter alone, regardless of litter type. Biochar had no effect on reducing soluble nutrients in surface runoff. Treatments did not affect culturable bacterial levels in runoff. Detailed information will be discussed.

Mississippi Water Resources Conference2012
64
Sedimentation Processes in Perdido BayNatalie Sigsby, Mississippi State University
McAnally, W.; Sigsby, N.
Perdido Bay is an estuarine system located along the Alabama-Florida border in the Gulf of Mexico with an estimated 2900 sq. km watershed and a narrow tidal inlet to the Gulf of Mexico. Water quality and hydrodynamics have been examined in some detail, but very little research has been done on the sedimentation processes of the bay. A systematic sedimentation study will contribute to an improved understanding of the processes of the bay.
An investigation into the sediment classifications, distributions, and discharges will be completed as a major part of this sedimentation study. As a first step, a data collection was performed in July 2011. This survey included water and bed sediment sampling, water quality readings, and velocity measurements. Water quality constituents tested included dissolved oxygen, pH, salinity, temperature, turbidity, and depth. Velocity and discharge calculations were recorded using an Acoustic Doppler Current Profiler. Bed sediment samples will be used for grain size analysis and sediment classification. The water samples collected will be used for total suspended solids analysis. Analysis of the tide levels, salinity and turbidity will be completed for the verification of the existence and location of the turbidity maxima in Perdido Bay.
A thorough literature review will be completed to better understand sedimentation processes, sediment budgets, numerical modeling, and historical data. Using this data, along with data collected on-site, a systematic sediment budget will be developed and a numerical model of sediment transport using EFDC will be developed.

Poster Session
65
Hydrologic Regimes of Bottomland Hardwood Forests in the Mississippi Alluvial Valley and
Gulf Coastal Plain and the Impact on Red Oak Acorn Production
Johnathon Sloan, Mississippi State UniversityHatten, J.
Red oak (Quercus spp.; Subgenus Erythrobalanus) acorns provide a major food source for many species of wildlife such as ducks, white-tailed deer (Odocoileus virginianus), and wild turkeys. Acorns are also important for the regeneration of these forests. The production of acorns is sporadic and the cause of this is not completely known or understood. Red oaks are prevalent in bottomland hardwood forests throughout the Mississippi Alluvial Valley (MAV) and Gulf Coastal Plain (GCP) and these forests undergo extreme hydrological events annually, from being completely inundated in the winter and spring to very dry in the summer. This study will examine the hydrology and soils of bottomland hardwood systems and the control they have on acorn production. Data has been collected at six sites, covering five states in the MAV and GCP. A well placed at each site was used to measure hydroperiod with an In-Situ Inc. LevelTROLL 300 and an In-Situ Inc. BaroTROLL. With these wells both ground water and surface water were measured. Organic matter input was measured using 10 porcelain sediment tiles at five of the sites and 20 porcelain sediment tiles at one site. Organic matter content of deposited sediment was determined by loss on ignition. Acorn production data was measured at 20 plots per site during the fall and winter of 2011/2012 and will be measured again in the fall and winter of 2012/2013. We will present preliminary hydrology, sedimentation, and organic matter accumulation data collected from September, 2011-February 2012.

Mississippi Water Resources Conference2012
66
Sediment and Mercury Fate and Path Modeling in Weeks Bay, Alabama
Jennifer Sloan-Ziegler, Mississippi State UniversityCamacho-Rincon, R.; Martin, J.; McAnally, W.
Mercury, a naturally occurring element, is found in water, soil, and air and is released into the environment through natural sources and human activities. Mercury is subject to several physical and chemical processes in aquatic systems that impact its fate, transport, and toxicity to humans and aquatic life. Mercury bioaccumulates though the food chain and can eventually be ingested by humans though fish consumption. Mercury exposure can lead to negative effects such as risks to the nervous system, brain, lungs, heart, kidneys, and immune system.
Knowing the processes that can affect the fate and transport of mercury in waterbodies is fundamental for developing ecological restoration and prevention plans as well as for mitigating the potential threats to humans.
In this study, a mechanistic model based in the Water Quality Analysis Simulation Program (WASP) was implemented to support the analysis and understanding of the fate and transport of mercury in Weeks Bay, Alabama. Preliminary results indicate that the model is capable of representing the transport characteristics of the estuary and is, thus, potentially able to reproduce the long-term transport of mercury in the system. Current observed mercury data is limited; therefore, the current model can be used to aid in the formulation and development of future data collection programs focused on refining, calibrating, and validating the model.

Poster Session
67
Monitoring Success of Mississippi’s Delta Nutrient Reduction Strategies—Steele Bayou
Shane Stocks, U.S. Geological SurveyHicks, M.
The Steele Bayou watershed (SBW) in the lower Mississippi Delta of northwestern Mississippi has been subjected to altered land and water resources for decades. Poor stream health in the SBW has been documented by several short-term studies, and the watershed is listed on the Mississippi Department of Environmental Qual-ity section 303(d) List of Impaired Waters with causes of impairment being pesticides, organic enrichment/low dissolved oxygen, nutrients, and siltation. In the SBW, like many other areas in the Delta, there have been and continue to be numerous large and small scale efforts by land owners and State and Federal entities to reduce sediment and nutrient loadings. It is estimated that more than $15 million has been spent in the SBW for various conservation practices, not factoring in unknown private dollars by landowners. It is also estimated that com-bined Federal, State and private efforts have resulted in up to 50 percent of the Steele Bayou watershed being treated with various conservation practices.
An intensive monitoring network was implemented in 2008 through a multi-agency partnership. This monitoring network was designed to evaluate conditions at three nested scales: edge-of-field, in-stream, and outlet of the watershed. Data collected from the network will help define characteristics of a wide range of physical and chemical properties of water quality and will quantify the changes over time that result from the implementa-tion of conservation measures. Preliminary evaluation of historical data compared to current data from the SBW suggests decreases in both sediment and nutrients. In addition to comparison of data between historical and current values, the current monitoring design will allow for a detailed analysis of loads and trends over time, at edge of field and at several locations along the main stem channel.

Mississippi Water Resources Conference2012
68
Proposal of the Total Human Ecosystem on Blakeley Island, Mobile AL
Long Zhou, Auburn University
The principle of industrial ecology and landscape ecology has been touched upon in the past decades by scientists, ecologists and landscape architects. The concepts of industrial ecology have passed beyond the idea of controlling pollution and are trying to foster “thinking like an ecosystem”. Landscape ecology focuses on the spatial pattern intertwined with processes and changes. Through applying the model of “Total Human Ecosystem” with the structure of patch-corridor-matrix, landscape ecology provides a model applied to the environment with human disturbance. Mobile, AL is a city built in wetlands and it was dominated by heavy industry. Blakeley Island is one of the largest industrial areas in Mobile, AL. The situation in Blakeley Island reflects the paradox at a global scale. On one hand, people are searching for more methods to take full advantage of the environment and create jobs. On the other hand, people complain about the degradation of their liv-ing habitats due to the overdevelopment. This paper focuses on how to create an ecological and sustainable living system that provides reconciliation between the industrial park and natural wetlands on Blakeley Island. My research explores the application of the Total Human Ecosystem model through landscape transition at urban scale in a way that, natural processes and industrial processes cooperate. Besides science, for example landscape ecology, has provided knowledge about the role of human in creating and affecting patterns and processes. But science has been less effective in transforming this knowledge to society and design is a com-mon ground for scientists and practitioners to bring scientific knowledge into decision-making. The novelty of my method is the integration of science and design from dysfunctional patch recovery and corridors creation, to the new cybernetic symbiosis cycle formulation.

Best Management Practices
69
Best Management Practices
Samuel C. PierceMississippi State University
Field-Scale Monitoring of Agricultural Ditches as Conduits or Nitrogen, Phoshorus, and Suspended Sediment in Response to Storm Events and Low-Input Drainage Management: A Case-study of the Tchula Lake Farm
Corrin FloraMississippi State University
Nutrient and Suspended Sediment Mitigation Through the Use of a Vegetated Ditch System Fitted with Consecutive Low-Grade Weirs
J. J. Ramirez-AvilaMississippi State University
Runoff Quality Effects of Simulated Conservative Practice Scenarios in a Mississippi Delta’s Watershed
Larry OldhamMississippi State University
The Mississippi Nutrient Management Manual: Simplifying Availability of Maintenance-Based Fertilizer Recommendations and Nutrient Best Management Practices
Mary Love TagertMississippi State University
Downstream Water Quality and Quantity Impacts of Water Storage Systems in a Mississippi Delta Watershed
Alex LittlejohnMississippi State University
Low-Grade Weirs: An Innovative Best Management Practice for nitrate-N Mitigation
Sandra Ortega-AchuryMississippi State University
Evaluation and Validation of a Decision Support System for Selection and Placement of BMPs in the Mississippi Delta
Robert KrögerMississippi State University
Best Management Practices in the MS Delta: What Are We Learning?
Bes
t Man
agem
ent P
ract
ices
Mississippi Water Resources Conference2012
70
Field-Scale Monitoring of Agricultural Ditches as Conduits of Nitrogen, Phosphorus, and
Suspended Sediment in Response to Storm Events and Low-Input Drainage Management:
A Case-study of the Tchula Lake FarmSamuel C. Pierce, Mississippi State University
Kröger, R.; Prevost, D.; Pierce, T.
IntroductionNonpoint Source Pollution and Agricultural DrainageThe USEPA lists agriculture as the primary source of stream impairment in the United States (USEPA, 2004). Agriculture is also considered by the USEPA to be the third greatest source of impairment to lakes (USEPA, 2004) and wetland systems (USEPA, n.d.). There is some degree of variation in the types of impairment caused by agriculture but impacts related to water quality are ubiquitous (Blann et al., 2009). Sedimentation is the most common cause of decreased water quality in streams and wetlands; whereas nutrient enrichment is the most common cause in lakes (USEPA, 2002).
Sediment and nutrient transport from agricultural landscapes to receiving waters is generally increased by improvements to drainage that decrease surface water storage capacity and increase peak velocities. These alterations not only decrease the potential for settling of sediment and biogeochemical reduction, but they also increase the potential for further erosion and sediment resuspension. This problem has been highlighted by the impact of modern agricultural practices in the Mississippi River watershed on the size of the Gulf of Mexico Hypoxic Zone, known colloquially as the “Dead Zone.”
Runoff from row-crop agriculture is a major source of non-point source aquatic pollution. High concentrations of inorganic N and sediment-bound P that are conveyed in agricultural drainage ditches can lead to eutrophi-cation of receiving waters at both local and regional scales. Concerns regarding accelerated eutrophication have led to a concerted effort toward understanding the movement of nutrients across the landscape and the management of agricultural drainages for water quality remediation. This study monitors field-scale move-ments of nitrate, ammonia, dissolved P, particulate P and total suspended solids through agricultural ditches over several months preceding and following the implementation of controlled drainage practices including slotted pipes and low-grade weirs. Water samples were collected during non-storm flow conditions and storm events via grab sampling and automated techniques. Nitrate concentrations showed a high degree of vari-ability both spatially and temporally, varying from approximately 0 to 15 ppm. Storm events generally had ni-trate concentrations 50% to 100% greater than non-storm flow concentrations. In contrast to oxidized nitrogen, ammonia concentrations generally ranged from 0.1 to 0.3 ppm regardless of time or location. Dissolved inor-ganic P concentrations ranged from approximately 0 to .5 ppm with mean values an order of magnitude lower than the upper maximums. Total inorganic P and turbidity approached an order of magnitude higher in storm water samples than non-storm flow samples, with mean total inorganic P of approximately 0.5 ppm in non-storm flow samples compared to mean values greater than 1 ppm in storm water samples. Total suspended sedi-ment concentrations were also significantly higher in storm water samples than non-storm flow samples, indicat-ing the likelihood that erosion or sediment resuspension is a major factor in P transport in agricultural drainage ditches.

Best Management Practices
71
Coastal hypoxia is a common phenomenon worldwide. Anthropogenic hypoxic zones, however, have been implicated in the collapse of productive fisheries in systems as varying from the Baltic Sea to the Black Sea. Though there is currently little evidence that a similar collapse will occur in the northwestern Gulf of Mexico, concern about changes in commercial fish harvest have prompted a concerted effort to decrease the delivery of agricultural nonpoint source pollution, primarily excess N. This effort is a multi-tiered approach that relies upon coordinating a vast monitoring network, using data in the most efficacious models, and developing and validating management practices that decrease sedimentation and nutrient delivery. Many of the practices being considered for row-crop agriculture utilize decreasing nutrient inputs and decreasing nutrient transport at their initial aquatic interface: the drainage ditch.
Drainage ditches have received little study with respect to their relative importance as conduits of sediment and nutrients. In the portion of the Lower Mississippi Alluvial Valley known as the Mississippi Delta, these ditches, whether completely artificial or highly modified streams, comprise a greater proportion of wadeable stream reach than unmodified systems. Historically, in order to ensure that water bodies are meeting designated uses, surface water quality monitoring has focused on large watersheds as a gauge of landscape-level trends, or examined smaller drainage basins that are either a known source of pollution or are considered especially ecologically valuable. The diffuse nature of nonpoint source pollutants, and often variable hydrology in agricultural ditches makes them a logistically challenging subject of study. Their position in the landscape between terrestrial inputs and “natural” receiving waters, as well as their role in sediment delivery via in-stream erosion and resuspension justifies a greater effort at surmounting these challenges. Additionally, given the likelihood of a lag-effect between management implementation and measured
improvements to the quality of receiving waters, intensive monitoring of these systems is necessary to establish appropriate baselines with which to judge management practices developed to decrease agricultural nonpoint source pollution. The objective of this study is to characterize nonpoint source pollution at the field scale by using different sampling methods in ditches draining row-crop agriculture and describe the implementation of water control structures for water quality improvement. Samples were collected from row-crop drainage ditches at a site in the Mississippi Delta and analyzed for total suspended solids (TSS), turbidity, total inorganic P (TIP), dissolved inorganic P (DIP), nitrate-N (NO3- -N) and ammonia-N (NH3+-N). The data presented herein are considered preliminary pending further quality assurance validation.
Watershed and Site InfoThe study site is located in the Upper Yazoo Watershed (HUC: 08030206) immediately southeast of Eagle Lake and empties into Tchula Lake, a narrow, sinuous oxbow lake of approximately 460 acres that, in turn, empties into the Yazoo River. In 2006 the state of Mississippi reported to the EPA impairments caused by nutrients, sedimentation, and organic enrichment/low dissolved oxygen (USEPA, 2006). Initial data collection began 1/26/11. Seven ditches on the site are being periodically monitored for nonpoint source pollutants. Only four of these ditches (numbered 1-4 in Figure 1) have data from the spring of 2011 and are currently being monitored using the complete sampling protocol described below. Only data from these four ditches is presented in this manuscript. The ditches varied in width from less than three meters at the inflows to nearly 15 meters at outflows (Figure 2). Other relevant information about the ditches is presented in Table 1. During the monitoring period, the site was planted in corn, cotton, and soybeans and much of the site was periodically irrigated with alluvial groundwater via center-pivot irrigation. Less than 40% of the
Field-Scale Monitoring of Agricultural Ditches as Conduits of Nitrogen, Phosphorus, and Suspended Sediment in Response to Storm Events and Low-Input Drainage Management: A Case-study of the Tchula Lake FarmPierce, Samuel C.

Mississippi Water Resources Conference2012
72
drainage area of Ditch 1 was planted in row-crops, while the drainage areas of the other three ditches were over 95% row crop agriculture. The non-agricultural portion of Ditch 1 is comprised primarily of bottomland hardwoods that were converted from farmland between 1996 and 2004. A small (<1 hectare) body of open water was established during the same period. The remainder of the drainage area of Ditch 1 consists of an estimated 4.5 hectares of emergent palustrine wetland and 7 hectares of forested palustrine wetland. Although it appears in aerial imagery from 1996 that these wetlands were already present, only a very small portion of the present area was listed in the USFWS Wetlands Survey of the area performed in 1974. During the summer of 2011 all ditches were dredged and re-graded. Low-grade weirs and slotted pipes were installed on Ditches 2-3 (Table 1; Figure 3). Water samples were not collected during construction, but as the summer of 2011 was unusually dry, few, if any storm events that would have resulted in significant surface flows were missed. Ditch 1 was straightened and a large volume of unconsolidated sediment was removed, but no weirs or slotted pipes were installed. In August the banks and upper slopes of Ditches 2-3 were seeded with Bermuda grass and the beds/slopes were hydro-seeded with a mixture composed primarily of millet, smartweed, and rice
MethodsSample CollectionDitches were monitored using three sampling methods: grab samples, electronic sample collectors (Automated Isco 6712), and fixed-height, passive storm water collectors (referred to hereafter as storm). Grab samples were collected at fixed sampling points prior to implementation of drainage management, and immediately upstream of weirs following implementation. Grab samples were scheduled to be collected at pre-determined sampling points along the length of the ditch (approximate locations in Figure 1) at least every three weeks from March-October and at least every six weeks from November-February. If
no flowing water was present in the ditches during the scheduled sampling time, however, no sample was collected. Following weir construction grab samples were collected either at the weir outflow or directly upstream of the weir, depending upon sampling conditions.
Isco samplers were located at the field outlets. The samplers were programmed to begin collecting storm water samples when the water level was 10cm above the intake hose. The hose itself was located in the thalweg approximately 5-10cm above the bed of the ditch. Following initiation of sampling, individual samples were collected in 1-liter polyethelene bottles at 10-minute intervals for one hour and one-hour intervals thereafter, for a potential total of 24 samples spanning a 19-hour period. Constructed storm samplers were deployed along the length of the ditch at the same locations as grab sampling points. Samplers were set at heights from 15-55 cm depending upon the expected water depth and microphotography. At sampling points where the water depth was regularly expected to exceed one meter during storm flows, an additional sampler was set 30-55 cm above the bottom sampler (Figure 3). The units were assembled in-house using PVC pipe and a self-sealing ball valve. They are constructed to passively collect a 650mL water sample at a fixed height on the rising limb of the storm hydrograph. Following construction of weirs, sampling points were shifted from between 0-3 m to sample weir outflow. Isco and storm samples were collected within 48 hours of the estimated collection time. All samples were placed on ice and transported to the water quality laboratory of the MSU Dept of Wildlife, Fisheries, and Aquaculture for analyses. Table 2 presents a summary of the number of samples analyzed for dissolved nonpoint source pollution by ditch and sampling method. A subset of these samples was analyzed for particulate pollution. With the exception of Ditch 1, each ditch had a minimum of 19 samples of each sampling method analyzed for Turbidity and 24 analyzed for TSS and TIP. For samples collected via Isco in Ditch 1 only six
Field-Scale Monitoring of Agricultural Ditches as Conduits of Nitrogen, Phosphorus, and Suspended Sediment in Response to Storm Events and Low-Input Drainage Management: A Case-study of the Tchula Lake FarmPierce, Samuel C.

Best Management Practices
73
samples were analyzed for TSS and four for turbidity.
Physicochemical AnalysesSamples were generally analyzed within 24 hours of arriving at the laboratory. Raw samples were shaken to resuspend sediment prior to analysis. Turbidity was analyzed following the Nephelometric Method 2130B (APHA, 1998) using a HACH 2100P portable turbidimeter. TSS was determined by filtration through glass filters (CG-B, <2 μm pore size) following method 2540 D (APHA, 1998). Depending upon the expected value, sample volume varied from 10-100 mL to prevent clogging. TIP was determined with a HACH DR 5000 spectrophotometer utilizing the HACH methods TNT 843, TNT 844, TNT 845 (depending upon concentration, total range: 0.05-20 mg/L PO4--P). Analyses using HACH methods followed protocols established in HACH (2008). Due to time constraints, turbidity and TIP were not measured on site as recommended.
Raw samples were filtered through 0.45 μm pore diameter nitrocellulose filters for analysis of DIP, NH3+-N, and oxidized N species (NOx-N). Prior to date 9/29/2011 a HACH DR 500 spectrophotometer was used to measure NH3+-N (HACH TNT 830, range 0.015 – 2 mg/L NH3-N); and DIP (HACH TNT 843). After 9/29/2011 all dissolved nutrient concentrations were determined with EPA equivalent methods using a Lachat QuickChem 8500 flow injection analyzer. Ammonia was determined using QuickChem method 10-107-06-1-J (range: 0.01 – 2 mg/L NH3+-N). DIP was estimated using QuickChem method 10-115-01-1-A (range: 0.01 – 2 mg/L PO4--P). NOx was determined using QuickChem method 10-107-04-1-0 (range: 0.05 – 10 mg/L NOx-N). Nitrite was determined using QuickChem method 10-107-05-1-B (range: 14-70 μg/L NO2--N). NO3- -N was calculated as the difference of [NOx] – [NO2-]. Only the calculated values for NO3- -N are presented in the results section.
Data AnalysisBecause data were non-normally distributed, non-parametric statistical analyses were used to discriminate among the various parameters. Due to the limited utility of non-parametric tests for determining interactions among multiple independent variables, a combination ordination, parametric statistics and visual examination of distributions were used to screen the data for potential interactions. In both grab samples and storm samples no differences were found based on sample station within a given ditch. Therefore, sample station was not considered as a factor in the subsequent analyses and all samples within a ditch were analyzed without respect to location. Likewise, although during some precipitation events the relative position of the storm sampler in the water column (top sampler versus bottom sampler) produced different values, the samples were not analyzed with respect to height, as there were no discernible trends in pollutant values in the samples.
NO3- -N, DIP and NH3+-N were initially analyzed using Kruskal-Wallace one-way analysis of variance to find differences among ditches and among different sampling methods (α = 0.1). Because particulate-related water quality parameters (turbidity, TSS, and TIP) were not necessarily all analyzed together on a given sample, it was necessary to analyze each individually, rather than as a set of dependent variables. Any significant effects were analyzed as pairwise comparisons using a two-sample Kolmogorov-Smirnov test (α = 0.1). This test was selected because it specifically compares the probability distribution between groups, rather than comparing central tendency and variance. Because of the large number of sampling dates relative to the overall number of samples collected and wide variability in the number of samples collected on a given date, sampling date was not analyzed. Both existing literature and visual examination of our data suggest, however, that date was among the most important factors influencing nonpoint source pollution. As the Kolmogorov-Smirnov
Field-Scale Monitoring of Agricultural Ditches as Conduits of Nitrogen, Phosphorus, and Suspended Sediment in Response to Storm Events and Low-Input Drainage Management: A Case-study of the Tchula Lake FarmPierce, Samuel C.

Mississippi Water Resources Conference2012
74
test differentiates between groups based on the shape and range of the probability distribution, it was chosen as the most parsimonious test to compare among all dates. Isco samples were divided into first-flush (the initial hour, samples 1-6), and extended flows (hours 2-19, samples 7-24) and compared to fixed-height, passive storm samplers located at the outflow of Ditches 2 and 3.
ResultsSummary data for all pollutants are listed in Table 3. These values are not weighted based on the number of samples collected or discharge. Both the sampling method and the ditch being sampled influenced the concentrations of pollutants in the water samples. There were an insufficient number of Isco samples in some ditches to compare all values among all sampling methods. Six sample dates included outflow concentrations determined from more than one sampling method within a given ditch. No differences were detected between methods in DIP or NH3+-N concentrations for the limited number of samples available for comparison, although NH3+-N was two times higher in grab samples than either method for collecting storm flows. NO3- -N, on the other hand, was significantly lower in samples collected by storm samplers when compared to either Isco or grab samples. When comparing grab samples among ditches, Ditch 1, with the least amount of area in crop production, was generally lower in nonpoint source point pollution than other ditches except in DIP (Figure 4), which was higher, and TIP which was no different between ditches. During storm events, however, median particulate-related values were about double that of other ditches (Figure 5), with median TIP values around 4 ppm (not shown). When comparing the outflows of Ditches 2 and 3, which had the most complete data set, sampling method had no overall effect on dissolved nutrients (Figure 6). In 2011, grab samples yielded higher values for NO3- -N than either storm sampling technique used; whereas in 2012 there were no differences. Particulate-related water quality values, in contrast, were strongly influenced by
sampling method (Figure 5). Grab samples had the lowest values, followed by Isco samples, with storm samplers having the highest values. There were also differences between the initial hour of Isco sample and subsequent samples, with higher concentrations in samples from the first hour of storm events compared to subsequent samples (Figure 7). NO3- -N tended to increase during a given storm event, but this trend was not pronounced enough to cause differences between the initial hour of Isco sampling and subsequent samples during the same storm event.
A large amount of variability was due to sampling date (Figures 8 & 9). NO3- -N was episodically elevated during late winter and spring, as would be expected from fertilizer application, but there were no clear seasonal patterns. As the ditches were usually dry in the summer and fall, an adequate number of samples were not available to make comparisons. DiscussionDitch 1 differed in overall water quality from the other ditches, but not simply due to lower overall concentrations. These differences were likely primarily a result of different land use and drainage area. Lower NO3- -N would be expected as the majority of the drainage area is not cropland. Additionally, the wetland area draining into the ditch would be expected to reduce NO3-, while releasing orthophosphate into the water column. Given the presence of flow constrictions due to sedimentation in 2011, it is not altogether surprising to find elevated particulate pollutants.
Although turbidity and TSS were very high, they are not unheard off. In the northern Delta Region, Rebich et al. (2001) found mean sediment concentrations of 1492 mg/L in ditches draining row crops under conventional tillage. A six-year study near Clarksdale, MS recorded mean annual sediment concentrations in ditches ranging from approximately 2000-4800 mg/L (McDowell et al., 1989). Both studies utilized an automated pump
Field-Scale Monitoring of Agricultural Ditches as Conduits of Nitrogen, Phosphorus, and Suspended Sediment in Response to Storm Events and Low-Input Drainage Management: A Case-study of the Tchula Lake FarmPierce, Samuel C.

Best Management Practices
75
system similar to the Isco samplers used in the present study. McDowell et al. (1989) utilized composites of ten-minute samples, rather than time-series samples. Given the sharp decline in sediment concentrations following the initial hour of runoff it is unclear whether the lower values in the present study are a result of site conditions or different sampling techniques. McDowell et al. (1989) also reported higher concentrations of P, which was mostly associated with sediment. In comparison, in data compiled by Shields et al. (2008, 2009) mean total P in watersheds of less than two square kilometers had values around 1 mg/L, comparable to the Isco samples in the present study.
In comparing dissolved nutrients, DIP at the Tchula Lake ditches was at the lower end of the range reported by McDowell et al. (1989) and slightly higher than reported by Schreiber (2001). Mean NH3+, on the other hand, was higher than either previous study. Shields et al. (2008, 2009), in analyzing metadata collected from the 1980s-2000, found mean (nitrate+nitrite)-N (approximately equivalent to NO3- -N in most row-crop drainages) concentrations of 1.7 mg/L at nineteen sites in the Delta Region of the Yazoo River. These data were comparable to concentrations measured in Delta ditches draining conventional tillage (Schreiber et al., 2001; McDowell, 1989), but lower than mean concentrations at the Tchula Lake site, regardless of sampling method. It is important to note that concentrations reported by Shields et al. (2008, 2009) were negatively correlated with drainage area, and in the smallest watersheds monitored had higher mean values. In a review of ditch monitoring studies in the Midwest Region of the United States, Blann et al. (2009) reported mean total N concentrations regularly exceeding 10 mg/L. As the previously cited studies in the Delta Region reported more than half of the total N as being particulate-bound, however, a large percentage of N in the water may be unaccounted for by only measuring dissolved species. Even compensating for this difference, the concentrations in the present study are still comparatively low in comparison to
the Midwest.
This study highlights the importance of storm-related flows versus non-storm flows in a small agricultural watershed. Our results indicate that between storm events approximately 85-90% of inorganic P in the water column is DIP, whereas during storm flows only 1-5% is DIP. This trend was paralleled in the increased turbidity and suspended sediment observed during storm flows, as well as increased NO3- -N concentrations. In contrast, NH3+-N was essentially unaffected. Another interesting observation was the first-flush effect in these ditches with regard to sediment. During storm flows, TSS and associated values peaked in the initial hour, dropping off sharply afterward, indicating that the first-flush should be targeted for remediation of particulate-bound pollutants. NO3- -N, on the other hand showed no such effect, with concentrations during some storm events still climbing after 19 hours of sampling. The differences observed between samples collected via storm samplers and those collected via Isco or grab sampling may be due to the specific timing of sample collection during the storm event, rather than any physical differences in sample collection. Given the importance of both N and P with regard to eutrophication, management efforts for decreasing nutrient transport from agriculture may need different strategies for monitoring particulate versus non-particulate pollutants in response to precipitation events.
Future DirectionsThe objective of this manuscript was to characterize water quality parameters of the Tchula Lake site and describe the implementation of drainage management practices on the site. A number of questions remain unanswered. Given the variability in concentrations among sampling dates and, likely precipitation, neither the effect of management practices nor seasonal effects were analyzed. These issues will be addressed in future publications and may require extended monitoring of the site. Information on farm management practices, such as fertilizer application, and hydrology data
Field-Scale Monitoring of Agricultural Ditches as Conduits of Nitrogen, Phosphorus, and Suspended Sediment in Response to Storm Events and Low-Input Drainage Management: A Case-study of the Tchula Lake FarmPierce, Samuel C.

Mississippi Water Resources Conference2012
76
collected concurrently with water sampling will be incorporated into future analyses. These data are especially important in gauging the effectiveness of the water control structures on site, a topic that was not addressed in the present study. Beginning in August 2012, an undetermined number of sampling points in Tchula Lake will be incorporated into the routine grab sampling schedule to document any changes in water quality resulting from the implementation of drainage conservation structures.
AcknowledgmentsThe authors would like to thank Walter Shelton and Coco Roland who hospitably offered their farms as our laboratory. Additionally, many late hours were spent in sample collection and analysis. For their efforts, we thank: Jason Brandt, Alex Littlejohn, Dan Goetz, Cory Shoemaker, Jessica Quintana, Alex Blake, Jonathan Stoll, and Justin Tucker. Funding for this study was provided through an EPA 319 Grant # EPA-GM-2009-1.
ReferencesAmerican Public Health Association. 1998. Standard Methods for the Examination of Water and Wastewater. 20th Ed. American Public Health Association, Inc., Washington, D.C.
Blann, K.L.; Anderson, J.L.; Sands, G.R.; Vondracek, B. 2009. Effects of agricultural drainage on aquatic ecosystems: a review. Critical Reviews in Environmental Science and Technology 39, 909–1001.
Hach. 2008. Water Analysis Handbook 5th ed. Loveland, Colorado. USA.
McDowell, L.L., G.H. Willis, and C.E. Murphee. 1989. Nitrogen and Phosphorus yields in run-off from silty soils in the Mississippi Delta, USA.
Rebich, R.A. 2004. Suspended sediment and agrochemicals in runoff from agricultural systems in the Mississippi Delta: 1996-2000. Water quality
assessments in the Mississippi Delta: Regional Solutions, National Scope, M.T. Nett, M.A. Locke, and D.A. Pennington, eds. American Chemical Society Symposium Series 977. Washington, D.C., 104-118.
Schreiber, J.D., R.A. Rebich and C.M. Cooper. 2001. Dynamics of diffuse pollution from US southern watersheds. Water Research 35, 2534-2542.
Shield, F.D., Jr., S. Testa, III, and C.M. Cooper. 2009. Nitrogen and Phosphorus levels in the Yazoo River Basin, Mississippi. Ecohydrology 2, doi: 10.1002/eco.49.
Shields, F. D., Jr., C. M. Cooper, S. Testa, III, and M. E. Ursic. 2008. Nutrient transport in the Yazoo River Basin, Mississippi. U.S. Department of Agriculture, Agricultural Research Service, Water Quality, Ecology Research Unit, National Sedimentation Laboratory Research Report 60, Oxford, Mississippi, USA: <http://afrsweb.usda.gov/SP2UserFiles/person/5120/NSLReport60.pdf> Accessed 20 June 2012.
USEPA. 2009. National Water Quality Inventory: Report to Congress, 2004 Reporting Cycle (EPA 841-R-08-001). [published online, accessed: 6/29/12] URL: http://water.epa.gov/lawsregs/guidance/cwa/305b/2004report_index.cfm.
USEPA, 2006. 2006 Waterbody Report to Tchula Lake. [published online, accessed 6/29/12] URL: http://iaspub.epa.gov/tmdl_waters10/attains_waterbody.control?p_list_id=MS358TLE&p_cycle=&p_report_type=#causes.
USEPA. n.d. National Assessment Database. [published online, accessed: 6/10/12] URL: http://iaspub.epa.gov/waters10/w305b_report_v2.nation.
Field-Scale Monitoring of Agricultural Ditches as Conduits of Nitrogen, Phosphorus, and Suspended Sediment in Response to Storm Events and Low-Input Drainage Management: A Case-study of the Tchula Lake FarmPierce, Samuel C.

Best Management Practices
77
Table 1. Ditch Descriptions
Ditch Length (m) Drainage Area (ha)
Predominant Soil types in drainage area
# weirs # slotted pipes
# Descriptive
1 Forest 2173 117 75% Alligator, Dowling, and Forestdale Soils
0 0
2 Main 1081 102 96% Alligator-Dowling Clays
4 7
3 Old Control 595 78.5 38% Dowling Clay, 25% Alligator Clay,
2 6
4 Laberto 1754 76 43% Alligator Clay, 9% Alligator Silty Clay Loam
4 12
Table 2. Number of samples analyzed for dissolved nutrients by sampling methods and ditch.
Ditch Lachat Total ISCO Total Grab Total StormTotal
1 Forest 102 49 24 292 Main 312 209 25 783 Old Control 298 230 27 414 Laberto 95 24 44 27
Table 3. Site Results Summary. All units are mg/L, except turbidity, which is NTU.Grab Isco Storm
Me-dian
Mean S.D. N Me-dian
Mean S.D. N Me-dian
Mean S.D. N
TSS 188 336 679 162 562 803 985 274 3108 5314 7134 169Turbidity 239 389 685 88 956 1550 1578 172 3490 5941 8764 115
TIP .36 .51 .74 166 .89 1.23 1.21 439 1.29 4.34 8.25 173DIP .31 .08 .16 118 .04 .10 .19 489 .04 .09 .11 175
NHз- .13 .23 .33 118 .13 .26 .85 489 .15 .32 .61 175NOз+ .77 2.53 4.30 118 2.48 4.02 4.32 489 1.53 3.71 6.25 175
Field-Scale Monitoring of Agricultural Ditches as Conduits of Nitrogen, Phosphorus, and Suspended Sediment in Response to Storm Events and Low-Input Drainage Management: A Case-study of the Tchula Lake FarmPierce, Samuel C.
------------

Mississippi Water Resources Conference2012
78
Field-Scale Monitoring of Agricultural Ditches as Conduits of Nitrogen, Phosphorus, and Suspended Sediment in Response to Storm Events and Low-Input Drainage Management: A Case-study of the Tchula Lake FarmPierce, Samuel C.
Figure 1. Aerial view of study site. Ditches are shown in blue, with the corresponding drainage areas outlined in red. Weirs are shown as red dots along the ditches. Tchula Lake is shown as a sinous white line at the southwest (bottom-left) and east (right).
Figure 2. Ditch 2 (Main ditch) following dredging and hydroseeding. A small in-channel floodplain is located ¾ of the way down the bank, characteristic of a 2-stage ditch.

Best Management Practices
79
Field-Scale Monitoring of Agricultural Ditches as Conduits of Nitrogen, Phosphorus, and Suspended Sediment in Response to Storm Events and Low-Input Drainage Management: A Case-study of the Tchula Lake FarmPierce, Samuel C.
Figure 3. Passive water control structures currently in place at the study site. A. Slotted weirs intercept swale inflows from adjacent fields, with a shallow basin to limit bed flow of sediment. B. Low-grade weirs slow storm water velocity, allowing sedimentation at discrete points along the ditch, and create intermittent pools between storm flows. A storm sampler array is visible immediately downstream of the weir.

Mississippi Water Resources Conference2012
80
Field-Scale Monitoring of Agricultural Ditches as Conduits of Nitrogen, Phosphorus, and Suspended Sediment in Response to Storm Events and Low-Input Drainage Management: A Case-study of the Tchula Lake FarmPierce, Samuel C.
Figure 4. Median concentations (mg/L) of dissolved nutrients in grab samples.
Figure 5. Summary of median TSS and turbidity across ditches using different sampling methods. A. Grab samples. B. Isco samples. C. Stormsamples. In Ditch 1 (Forest) only 6 samples were used to determine TSS and 4 for turbidity in Isco samples. All other bars represent a minimum of 19 samples.
' ,_...
A
""
...
.,.
-"'
I I . -
A
i ~ 'O :0
~ ., ~ , .§. (J)
[!!
••n - .. ,...
B
B
- , .... - .. .... - ••n
C
- Od( - 11 ,_
..., "'
... ~-,

Best Management Practices
81
Field-Scale Monitoring of Agricultural Ditches as Conduits of Nitrogen, Phosphorus, and Suspended Sediment in Response to Storm Events and Low-Input Drainage Management: A Case-study of the Tchula Lake FarmPierce, Samuel C.
Figure 6. Summary of Median NO3- -N concentrations at outflows of Ditch 2 and Ditch 3.
4
3.
Z 2 I.., 0 z
1.
00
Ditch

Mississippi Water Resources Conference2012
82
Figure 7. TIP and TSS concentrations (mg/L) in Ditch 2 and 3 by sample number. The first six samples (left of blue line) represent the first hour of storm flow at 10-minute intervals. Subsequent samples are at hourly intervals.
Field-Scale Monitoring of Agricultural Ditches as Conduits of Nitrogen, Phosphorus, and Suspended Sediment in Response to Storm Events and Low-Input Drainage Management: A Case-study of the Tchula Lake FarmPierce, Samuel C.
0 12.5
10 .00
:::J' 7.50 --0)
E ----0... 5.00
I-
2.5 0
.00
10000
8000
,,,....._ 6000 .....J --0)
E ----(J) 4000 (J) I-
2000
o·
I 0
0
0
0
0
8 0
0 0 0 0
0
0 0 § i 8
: o ~ ~ ~ I i I I i I I
5
0
0
0 0 0
o e 0
8 0
0
0 0 8 0
i;pP 0 0 @ ~
5
0 0
; I i I i i i I i i i I i I I I i I I I 20 I
10 15 25
j ! i i ! ! I I ! ff I ~ I § i 6 i g 10 15 20 25
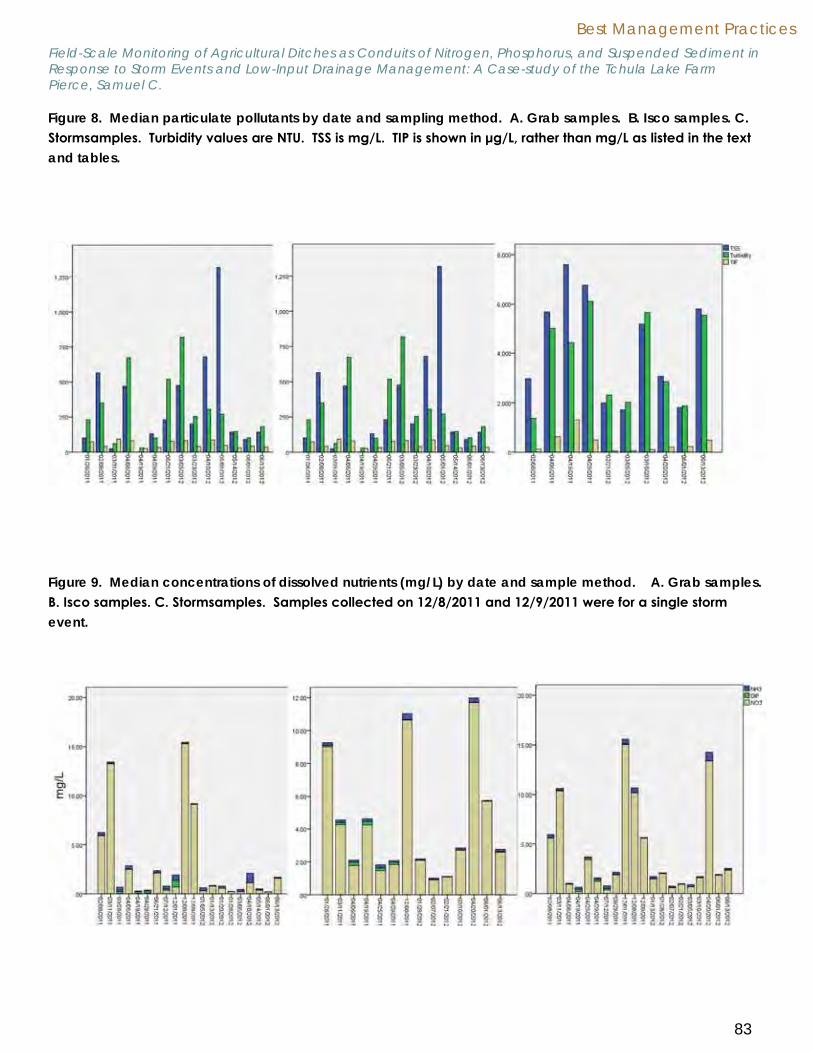
Best Management Practices
83
Figure 8. Median particulate pollutants by date and sampling method. A. Grab samples. B. Isco samples. C. Stormsamples. Turbidity values are NTU. TSS is mg/L. TIP is shown in μg/L, rather than mg/L as listed in the text and tables.
Field-Scale Monitoring of Agricultural Ditches as Conduits of Nitrogen, Phosphorus, and Suspended Sediment in Response to Storm Events and Low-Input Drainage Management: A Case-study of the Tchula Lake FarmPierce, Samuel C.
Figure 9. Median concentrations of dissolved nutrients (mg/L) by date and sample method. A. Grab samples. B. Isco samples. C. Stormsamples. Samples collected on 12/8/2011 and 12/9/2011 were for a single storm event.
"' ..... , ..
, .. ., ,.,,

Mississippi Water Resources Conference2012
84
Low-grade Weirs as a Suspended Solid Mitigation Strategy for Aquaculture Effluent
Corrin Flora , Mississippi State UniversityRobert Kröger, Mississippi State University
IntroductionThe introduction of sustainable production system certifications is giving more incentive for commer-cial aquaculture farmers to introduce new prac-tices to their production facility (Boyd, 2003; Bosma and Verdegem, 2011). Several organizations are developing standards for ecolabeled products as large-scale seafood buyers are seeking products produced using responsible methods to satisfy in-creasing demand (Seafood Choices Alliance, 2003; Boyd et al., 2007; Bosma and Verdegem, 2011). The adoption of easy to monitor indicators may stimu-late the adoption of sustainable practices (Bosma and Verdegem, 2011). Mitigation of suspended solids after discharge would be easy to monitor and is a critical component of sustainable practices that should be monitored.
Suspended solids is the largest category, by vol-ume, of pollutants in the United States (Fowler and Heady, 1981). Sediments degrade downstream water quality and carry nutrients that adversely influence aquatic life (Ritchie, 1972). Cooper et al. (1991) found as suspended sediment load de-creased, water quality improved rapidly. Therefore, the first principle of sediment reduction centers on sound policy and management (Cooper and Lipe, 1992). There are several best management prac-
tices that can be utilized to mitigate suspended solid concentrations and loads from effluent. Set-tling basins and constructed wetlands allow time for suspended solids to fall out of the water column; however, these practices are not always practical for farmers (Boyd, 2003). Ghate et al. (1997) showed 18 – 82% of suspended solids were removed over a 24 m distance using grass strips to filter catfish ef-fluent. Tucker and Hargreaves (2003) noted that a vegetated ditch has the potential to act as a long settling pond. A ditch with a low gradient and area comparable to that of a settling basin is sufficient for solids removal. Shireman and Cichra (1994) found a 93 m long ditch initially added suspended solids, but later acted as a sink and an potential management practice to reduce TSS.
Most commercial aquaculture ponds already drain into vegetated ditches. The introduction of low-grade weirs may serve as an innovative alternative to reduce suspended solids and organic material entering receiving waters. This controlled drainage structure increases residence time within the ditch system allowing time for natural processes to occur (Kröger et al., 2008; Kröger et al., 2012). This study analyzed the efficiency of a vegetated ditch sys-tem fitted with consecutive low-grade weirs in miti-gating aquaculture effluent by reducing suspended
Mitigating suspended solids after discharge is a critical component of sustainable aquaculture practices. Total suspended solids and their volatile component were determined from water samples collected during and after pond discharge in a vegetated ditch system fitted with consecutive low-grade weirs. Concentrations and reduction efficiency were analyzed using repeated measures ANOVA for each reach of the system. Suspended solids increased over the residence time and returned to baseline within the 48 hour sampling period for each discharge. The highest concentration of suspended solids was in the initial effluent, while the smallest concen-tration was at weir 4. On average, concentrations were reduced between 0.009 mg/L – 0.021 mg/L across the system. Volatile suspended solids made 16% - 30% of the total suspended solids. Reduction efficiency of total suspended solids ranged from 14% - 54% over the system as a whole. Overall, the vegetated ditch fitted with low-grade weirs functioned as a mitigation tool for aquaculture effluent.

Best Management Practices
85
material concentrations reaching receiving waters. Reduction efficiency of weirs was compared across and within the system.
Materials & MethodsIn fall 2011, three embankment ponds (0.05 ha) stocked with freshwater prawns were intentionally discharged at the Mississippi State University South Farm Aquaculture Facility (Mississippi State, MS) into a 292 m vegetated ditch fitted with four pre-cast concrete low-grade weirs. Weirs ranged from 0.3 m to 1.2 m in depth. Prior to each pond draining event; initial water samples (n=2) were taken from the pond and any ditch sampling sites (n=4) where water was present. Initial samples were used to es-tablish baseline parameters for the system for each event.
Ponds were drained using a hydraulic PTO tractor pump (custom fabrication, Starkville, MS) or a 15 cm stand pipe depending on proximity of the pond to the ditch. To monitor the flow of effluent and calcu-late residence time, a salt slug was delivered to the system. This solution was created in a mixing cham-ber using 99% pure NaCl as the tracer. Diamond Crystal® pool salt (Cargill, Inc., Wayzata, MN) was dissolved in pond water and delivered immediately into the ditch when pumping began.
Effluent samples were collected over two periods; while water was flowing over weirs and after water flow over weirs stopped. Water samples were col-lected in 275 mL polyethylene cups (Fisher Scientific, Pittsburgh, PA). Samples were collected between 0.1 – 0.3 m below the water surface. Initial effluent was sampled at 5 min intervals during the first hour. After the first hour, the initial effluent was sampled every 30 min until pumping stopped. When water began to flow over each weir, water samples were taken below each weir every 30 min. Once water stopped flowing over the weirs, samples were col-lected above each weir every 6 hr until the experi-ment ran for 48 hours. Samples were kept on ice and transported to the Mississippi State University Water Quality Lab for analysis.
Water samples were analyzed for TSS and vola-tile suspended solids (VSS). One hundred mL of each sample was filtered through pre-ashed, pre-weighed 0.45µm Whatman glass fiber filters (APHA, 1998). Filters were dried at 105°C for 24 hours and then weighed to the nearest mg using a Scientech SA210 scale (Scientech Inc., Boulder, CO). TSS was calculated as:
TSS = Dried filter weight (g)– Initial filter weight (g)Initial effluent and above weir samples were addi-tionally ignited in a muffle furnace ( ) at 550°C over 20 minute intervals. VSS was calculated as:
VSS = TSS (g)– Ignited filter weight (g)
An ANOVA using general linear model procedure (PROC GLM) with repeated measures of SAS (SAS Institute 1988) was used to determine any signifi-cance among drainage events related to TSS and VSS. Reduction efficiency was calculated as:
% efficiency=(peak concentration (mg⁄L)-concentration(mg⁄L))*100
Efficiency was calculated at each weir for each sampling period.
ResultsTotal suspended solid concentrations were re-duced, on average, between 0.0088 mg/L – 0.0212 mg/L across the system (Figure 1). The highest concentration (0.0908 mg/L) of TSS was in the initial effluent. A significantly (F= 31.91, P < 0.001) smaller concentration (0.0005 mg/L) was measured at weir 4. Individual weirs showed significant reductions, as did the system as a whole (F=5.05, P=0.025). Volatile suspended solids comprised 15% - 30% of TSS. The second discharge, through a standpipe, showed significantly (F=27.26, P < 0.001) higher concentra-tions of TSS than the tractor pump discharges. Over-all, higher concentrations of initial effluent signifi-cantly (F=68.78, P < 0.001) increased the reduction efficiency across the system.
Positive reduction efficiency of TSS was observed across the system. Efficiency of reduction ranged from 0.7% - 98%. Reduction efficiency of weir 1 increased with time in each drainage event (Figure 2). However, efficiency decreased from the first to
Low-grade Weirs as a Suspended Solid Mitigation Strategy for Aquaculture EffluentFlora, Corrin

Mississippi Water Resources Conference2012
86
the second drainage. Weir 2 functioned similarly to weir 1 in the first two drainage events and then weir 2 efficiency increased from the second to the third drainage event. Weir 3 efficiency decreased over consecutive drainage events. When effluent was analyzed at weir 4, for the first time a negative efficiency over time was observed during the final drainage event.
DiscussionThe goal of best management practices is to make aquaculture environmentally responsible, while also considering the economic sustainability (Bosma and Verdegem, 2011). The use of a vegetated ditch fitted with low-grade weirs shows the potential to fill these considerations. Over the course of this study, the vegetated ditch fitted with consecu-tive weirs was a tool for suspended solid reduction. Suspended solids initially increased over the resi-dence time, or dilution period, of the system, return-ing to baseline levels within 48 hours of each event. Suspended solid concentrations were highest when a standpipe was used. This is consistent with findings by Hargreaves et al. (2005a) which found the TSS to be high during the first 10 - 30 min of discharge when a standpipe was used. The increase in con-centration in our study, however, did not affect the efficiency of reducing TSS at each weir. Samocha et al. (2004) reported the major fraction in TSS was low density and likely composed of fine organic particles (uneaten feed and plankton). Results from our study found VSS comprised on average 16% - 30% of TSS in effluent. New et al. (2009) found that one of the areas of concern in freshwater prawn aquaculture is potential pollution released at discharge. It was suggested that effluent could be treated prior to discharge, but there is no men-tion of utilizing adjacent landscape features such as drainage ditches, nor were management strategies to treat effluent post-discharge suggested. Kröger et al. (2008) found the presence of both vegetation and weirs affected agricultural ditches. Drainage ditches are features of the aquaculture landscape that have not received much attention for nutrient reduction potential. It is known that in-
stream vegetation will increase friction and rough-ness in a stream channel, thus decreasing water velocity, increasing sedimentation and decreasing suspended sediments from the overlying water col-umn (Dieter, 1990; Abt et al., 1994; Braskerd, 2002; Schoonover et al., 2006). The study of Hargreaves et al. (2005b) represents the sole investigation that evaluated drainage ditch effectiveness in reduc-ing aquaculture effluent loads. Their study found a substantial decrease in TSS concentrations . Moore et al. (2010) found a significant difference in total solid loads between vegetated and non-vegetated ditches. Their study reported < 28% of total solids were comprised of suspended solids in vegetated ditch effluent as opposed to >95% in non-vege-tated ditch effluent. This highlights the potential of vegetated ditches to remove suspended solids from effluent. Furthermore the installation of low-grade weirs increases the hydraulic residence time and capacity of a ditch system (Kröger et al., 2008). Our study shows the ability of weirs to reduce suspend-ed solids from aquaculture effluent. Overall, weir ef-fectiveness was variable. Efficiency of reducing TSS ranged from 14% - 54%. This may be explained by ecosystem services being heterogeneous in space and evolving through time (Fisher et al., 2009). Previous research on constructed wetlands found suspended solids retention varied from 61% - 98%. Variability in the system may be due to interrelation-ships that are spatially explicit (Boyd and Banzhaf, 2007).Further research is required to calculate loads in and out of the ditch system and analyzing interre-lationships affecting the system. Temporal effective-ness based on effluent discharge at different times of the year also needs to be investigated.
AcknowledgementsThe authors thank the workers at the South Farm Aquaculture facility for their efforts in the pond management and husbandry. This project was funded through the Hill Country cooperative agree-ment # 6402-310004808 01S with USDA-ARS.
Low-grade Weirs as a Suspended Solid Mitigation Strategy for Aquaculture EffluentFlora, Corrin

Best Management Practices
87
ReferencesAbt, S.R., Clary, W.P., Thornton, C.I., 1994. Sediment deposition and entrapment in vegetated stream-beds. Journal of Irrigation and Drainage Engineer-ing 120, 1098-1113.
APHA, 1998. Standard methods for the examination of water and wastewater. American Public Health Association, Washington, DC. 19th ed.
Bosma, R.H., Verdegem, M.C.J., 2011. Sustainable aquaculture in ponds: Principles, practices and limits. Livestock Science 139, 58-68.
Boyd, C.E., 2003. Guidelines for aquaculture effluent management at the farm-level. Aquaculture 226, 101-112.
Boyd, C.E., Tucker, C., McNevin, A., Bostick, K., Clay, J., 2007. Indicators of Resource Use Efficiency and Environmental Performance in Fish and Crustacean Aquaculture. Reviews in Fisheries Science 15, 327-360.
Boyd, J., Banzhaf, S., 2007. What are ecosystem services? The need for standardized environmental accounting units. Ecological Economics 63, 616-626.Braskerd, B.C., 2002. Factors affecting the phospho-rus retention in small constructed wetlands treating agricultural non-point source pollution. Ecological Engineering 19, 41-61.
Cooper, C.M., Lipe, W.M., 1992. Water quality and agriculture: Mississippi experiences. Journal of Soil and Water Conservation 47, 220-223.
Cooper, C.M., Schiebe, F.R., Ritchie, J.C., 1991. Case study of a sediment-limited lake. In Proceed-ings, Fifth Federal Interagency Sediment Confer-ence U.S. Geological Survey, Denver, Colorado, 13/16-13/33.
Dieter, C.D., 1990. The importance of emergent vegetation in reducing sediment resuspension in wetlands. Journal of Freshwater Ecology 5, 467-474.
Fisher, B., Turner, R.K., Morling, P., 2009. Defining and classifying ecosystem services for decision making. Ecological Economics 68, 643-653.
Fowler, J.M., Heady, E.O., 1981. Suspended sedi-ment production potential on undistrubed forest land. Journal of Soil and Water Conservation 36, 47-50.
Ghate, S.R., Burtle, G.J., Vellidis, G., Newton, G.L., 1997. Effectiveness of grass strips to filter catfish (Ictalurus punctatus) pond effluent. Aquacultural Engineering 16, 149-159.
Hargreaves, J.A., Tucker, C.S., Kingsbury, S.K., 2005a. Pattern of Discharge and Mass Loading during Drainage of Excavated Ponds Used for Food Fish Production of Channel Catfish. North American Journal of Aquaculture 67, 79-85.
Hargreaves, J.A., Tucker, C.S., Thornton, E.R., Kings-bury, S.K., 2005b. Characteristics and sedimentation of initial effluent discharged from excavated levee ponds for channel catfish. Aquacultural Engineering 33, 96-109.
Kröger, R., Cooper, C.M., Moore, M.T., 2008. A pre-liminary study of an alternative controlled drainage strategy in surface drainage ditches: Low-grade weirs. Agricultural Water Management 95, 678-684.
Kröger, R., Pierce, S.C., Littlejohn, K.A., Moore, M.T., Farris, J.L., 2012. Decreasing nitrate-N loads to coastal ecosystems with innovative drainage man-agement strategies in agricultural landscapes: An experimental approach. Agricultural Water Man-agement 103, 162-166.
Moore, M.T., Kröger, R., Locke, M.A., Cullum, R.F., Steunriede, R.W.J., Testa, S.I., Lizotte, R.E.J., Bryant, C.T., Cooper, C.M., 2010. Nutrient mitigation capac-ity in Mississippi Delta, USA drainage ditches. Envi-ronmental Pollution 158, 175-184.
New, M.B., D’Abramo, L.R., Valenti, W.C., Singholka, S., 2009. Sustainability of Freshwater Prawn Culture.
Low-grade Weirs as a Suspended Solid Mitigation Strategy for Aquaculture EffluentFlora, Corrin

Mississippi Water Resources Conference2012
88
Freshwater Prawns. Wiley-Blackwell, pp. 524-530.Ritchie, J.C., 1972. Sediment, fish, and fish habitat. Journal of Soil and Water Conservation 27, 124-125.
Samocha, T.M., Lopez, I.M., Jones, E.R., Jackson, S., Lawrence, A.L., 2004. Characterization of intake and effluent waters from intensive and semi-inten-sive shrimp farms in Texas. Aquaculture Research 35, 321-339.
Schoonover, J.E., Williard, K.W.J., Zaczek, J.J., Man-gun, J.C., Carver, A.D., 2006. Agricultural sediment reduction by giant cane and forest riparian buffers. Water Air Soil Pollut 169, 303.
Seafood Choices Alliance, 2003. Growing appe-tites and shrinking seas. Washington DC.: Seafood Choices Alliance.
Shireman, J.V., Cichra, C.E., 1994. Evaluation of aquaculture effluents. Aquaculture 123, 55-68.
Tucker, C.S., Hargreaves, J.A., 2003. Management of effluents from channel catfish (Ictalurus puncta-tus) embankment ponds in the southeastern United States. Aquaculture 226, 5-21.
Low-grade Weirs as a Suspended Solid Mitigation Strategy for Aquaculture EffluentFlora, Corrin

Best Management Practices
89
Low-grade Weirs as a Suspended Solid Mitigation Strategy for Aquaculture EffluentFlora, Corrin
0.000
0.010
0.020
0.030
0.040
0.050
0.060
Conc
entr
atio
n ch
ange
(m
g/L)
Time (min)
Weir 1
discharge 1
discharge 2
A
0.000
0.010
0.020
0.030
0.040
0.050
0.060
Conc
entr
atio
n ch
ange
(m
g/L)
Time (min)
Weir 2
discharge 1
discharge 2
discharge 3
B
Figure 1. Change in total suspended solids concentrations (mg/L) with time (min) in three drainage events at individual weirs. A) Weir 1 B) Weir 2 C) Weir 3 D) Weir 4. Discharge 1 and 2 were discharged by tractor pump, while discharge 3 was discharged by standpipe. The standpipe was below weir 1, therefore weir 1 was not sampled for this event. Each discharge was sampled over a 48 hr period.

Mississippi Water Resources Conference2012
90
Low-grade Weirs as a Suspended Solid Mitigation Strategy for Aquaculture EffluentFlora, Corrin
0.000
0.010
0.020
0.030
0.040
0.050
0.060
Conc
entr
atio
n ch
ange
(m
g/L)
Time (min)
Weir 3
discharge 1
discharge 2
discharge 3
C
0.000
0.010
0.020
0.030
0.040
0.050
0.060
Conc
entr
atio
n ch
ange
(m
g/L)
Time (min)
Weir 4
discharge 1
discharge 2
discharge 3
D
Figure 1. Change in total suspended solids concentrations (mg/L) with time (min) in three drainage events at individual weirs. A) Weir 1 B) Weir 2 C) Weir 3 D) Weir 4. Discharge 1 and 2 were discharged by tractor pump, while discharge 3 was discharged by standpipe. The standpipe was below weir 1, therefore weir 1 was not sampled for this event. Each discharge was sampled over a 48 hr period.
....... --.......
....... --.......

Best Management Practices
91
Low-grade Weirs as a Suspended Solid Mitigation Strategy for Aquaculture EffluentFlora, Corrin
0
20
40
60
80
100
120
0 500 1000 1500 2000 2500
% re
duct
ion
effic
ienc
y
Time (min)
Weir 1
discharge 1
discharge 2
A
0
20
40
60
80
100
120
0 500 1000 1500 2000 2500
% re
duct
ion
effic
ienc
y
Time (min)
Weir 2
discharge 1
discharge 2
discharge 3
Figure 2. Changes in reduction efficiency of weirs in reducing total suspended solids concentrations with time (min) in three drainage events. A) Weir 1 B) Weir 2 C) Weir 3 D) Weir 4. Discharge 1 and 2 were discharged by tractor pump, while discharge 3 was discharged by standpipe. The standpipe was below weir 1, therefore weir 1 was not sampled for this event. Each discharge was sampled over a 48 hr period.
.,,.■.,,..,,.
• ■
• ■
•

Mississippi Water Resources Conference2012
92
Low-grade Weirs as a Suspended Solid Mitigation Strategy for Aquaculture EffluentFlora, Corrin
0
20
40
60
80
100
120
0 500 1000 1500 2000 2500
% re
duct
ion
effic
ienc
y
Time (min)
Weir 3
discharge 1
discharge 2
discharge 3
C
0
20
40
60
80
100
120
0 500 1000 1500 2000 2500
% re
duct
ion
effic
ienc
y
Time (min)
Weir 4
discharge 1
discharge 2
discharge 3
D
Figure 2. Changes in reduction efficiency of weirs in reducing total suspended solids concentrations with time (min) in three drainage events. A) Weir 1 B) Weir 2 C) Weir 3 D) Weir 4. Discharge 1 and 2 were discharged by tractor pump, while discharge 3 was discharged by standpipe. The standpipe was below weir 1, therefore weir 1 was not sampled for this event. Each discharge was sampled over a 48 hr period.
-,, _ .. -_ .. -·
♦
■
♦
■

Best Management Practices
93
Runoff Quality Effects of Simulated Conservation Practice Scenarios in a
Mississippi Delta’s Watershed
J.J. Ramirez-Avila , Mississippi State UniversityOrtega-Achury, S.; McAnally, W.; Daiz, J.; Martin, J.
The APEX (Agricultural Policy Environmental Extender) model was developed for use in whole farm and small watershed management with the capability of detailed field scale modeling and routing by connecting farm/field sized subareas. The ArcAPEX is an ArcGIS based user interface designed to automate the input param-eterization of the APEX hydrologic/water quality model. The objective of this study is to evaluate runoff quality effects of alternative conservation practices scenarios for agricultural production in a northeastern Mississippi’s watershed using the APEX model and the ArcAPEX interface. Model evaluation compares the observed runoff sediment and nutrient losses from a USGS gauging station draining an 11 ha watershed in the Mississippi Delta with the simulated results generated by APEX. Initial stage of the study demonstrated a satisfactory capability of the model in simulating runoff and sediment at annual and monthly scales (R2≈0.8), but not at daily scale. Using no calibrated parameters, the model underestimated observed phosphorus loading. This maybe due to the use of the initial phosphorus concentration in soils set as zero. Modeling of conservation practice scenarios are expected to evidence an improvement of runoff quality condition at the edge of the studied watershed. Final results are also expected to compare APEX performance with other developed model(s) for the same location and scenarios.

Mississippi Water Resources Conference2012
94
The Mississippi Nutrient Management Manual: Simplifying Availability of Maintenance-Based Fertilizer Recommendations and Nutrient Best
Management PracticesLarry Oldham , Mississippi State University
Plant nutrient dynamics at the agriculture and environment interface is a societal concern. Injudicious application rates or improper application may have deleterious effects on water or soil quality; however supplemental nutrient applications often maximize agronomic crop production and profitability. Prior to 2007, Mississippians spent about $155 million per year on fertilizers for all uses; dramatic price increases that year nearly doubled fertilizer expenditures. Fertilizer prices have been volatile due to both supply and demand issues since the adjustment. Broiler chicken production is the main animal feeding industry located in the state; the litter produced is valued as a plant nutrient source both in the poultry production region, and other areas in the state. Mississippi State University fertilizer recommendations are chiefly based on the maintenance philosophy of soil testing: providing sufficient phosphorus (P) and potassium (K) fertilizer for the current crop, and controlling soil acidity. The university does not recommend P and/or K if the soil test index is high or very high, except one research-verified exception for cotton. Nitrogen fertilizer recommendations are research-based crop and soil specific, but lack a valid soil test for Mississippi climatic conditions. For many years, specific crop recommendations resided in various outreach platforms, as did recommended Best Management Practices. With combined economic and environmental interests, there was a need to centralize the Mississippi State University Extension Service nutrient recommendation and associated Best Management Practice outreach efforts. The Nutrient Management Guidelines for Agronomic Crops Grown in Mississippi (Manual) was developed for ease of use by crop advisers, farmers, government advisers, and others. The Manual exists both as hard copy, and a dynamic, updatable presence on the Extension Service website. Chapters/subjects include introductions to Nutrient Management, soils of Mississippi, nutrients, soil testing, fertilizers, and lime. Other chapters focus on poultry litter as fertilizer and Best Management Practices for nutrients. Separate appendices include the soil testing based fertility recommendations for forages and annual agronomic crops. In addition, there is a Glossary of nutrient management terminology. The centralization of research-proven recommendations, information, and guidelines should facilitate better management of plant nutrients in the Mississippi environment for many years.

Best Management Practices
95
Downstream Water Quality and Quantity Impacts Of Water Storage Systems in a
Mississippi Delta Watershed
Mary Love Tagert , Mississippi State UniversityPaz, P.; Pote, J.; Kirmeyer, R.
The Mississippi River Basin contains over 60% of the United States’ harvested cropland, and the Mississippi and Atchafalaya Rivers contribute more than three-fourths of the total nutrient load to the Gulf. Since the 1970’s, groundwater levels in the Mississippi Alluvial Aquifer have decreased at a rate of approximately 100,000 acre-feet per year due to increased irrigated acres. There are roughly 13,000 permitted irrigation wells dependent on water from the Mississippi Alluvial Aquifer. Adequate supply of good quality water is vital to sustaining agriculture, the primary industry in the economically depressed Mississippi Delta. Due to concerns over groundwater declines and increasing fuel costs to run irrigation pumps, farmers have begun implementing irrigation conservation measures, such as creating on site storage areas to capture irrigation and surface water runoff from the field for later use. However, while decreases in groundwater levels have been of particular concern to agricultural producers withdrawing from the Mississippi Alluvial Aquifer in recent years, there has also been a push by federal agencies to reduce the Gulf of Mexico hypoxic zone. The Mississippi River/Gulf of Mexico Nutrient Management Task Force, formed in 1997, set a goal to reduce the size of the Gulf hypoxic zone to less than 5,000 km2 by the year 2015. In 2010, the Natural Resources Conservation Service launched the Mississippi River Basin Healthy Watersheds Initiative to support the implementation of conservation practices to reduce nutrient loading in the Basin and improve water quality in the Basin and Gulf of Mexico. This presentation will outline a USDA-funded project that will determine the watershed-scale impacts of water storage systems on water quality and quantity, using the example of Porter Bayou Watershed, Mississippi.

Mississippi Water Resources Conference2012
96
Low-Grade Weirs: An Innovative Best Management Practice for nitrate-N Mitigation
Alex Littlejohn , Mississippi State UniversityKröger, R.; Moore, M.; Farris, J.
Best management practices (BMPs) generally refer to measures that provide some level of environmental protection for downstream aquatic systems. In agricultural watersheds, BMPs aim to improve the water quality of runoff from the landscape by controlling or trapping pollutants that can potentially degrade downstream aquatic ecosystems. Installation of low-grade weirs in agricultural drainage ditches is being evaluated as an innovative, yet cost effective, management practice that decreases nutrient concentrations and loads by increasing the water volume and hydraulic residence time of the ditch. The objective of our study was to assess the nutrient mitigation capabilities of low-grade weirs in artificially constructed ditches (four ditches with weirs and four without weirs). A replicated nutrient runoff event was simulated using a calculated 11-15 mg/L nitrate (NO3-) concentration applied continuously to each ditch for eight hours. Inflow and outflow concentrations and loads were quantified to determine overall NO3- reduction. A significant difference in weir and non-weir ditch volumes (P= 0.006) was observed, as well as a significant difference in observed hydraulic residence times between weir and non-weir ditches (P= 0.029). Similarly, ditches with weirs demonstrated a statistically lower (P= < 0.001) median outflow load (47.9 mg/min) than ditches without weirs (63.2 mg/min). An enhancement of the biogeochemical environment within the ditch was also observed, with a significantly greater NO3- concentration reduction (P= 0.029) during the hypothesized biogeochemical reduction phase of the experiment for those ditches containing weirs. These results highlight the dynamics of low-grade weirs in reducing nutrient concentrations and loads from agricultural landscapes, potentially establishing low-grade weirs as an additional, innovative BMP for nutrient reduction.

Best Management Practices
97
Evaluation and Validation of a Decision Support System for Selection and Placement
of BMPs in the Mississippi DeltaSandra Ortega-Achury, Mississippi State University
Kröger, R.; Ramirez-Avila, J.; Diaz, J.
Prevention and reduction of surface water pollution has been a matter of concern for decades, which has promoted the implementation of best management practices (BMPs) to ensure the protection of water resources. A considerable number of structural and non-structural BMPs have been developed to control hydrological processes and enhance pollutant load reduction at field and watershed scales. However, the selection of a specific BMP or the best combination of these practices and BMP placement are major challenges faced by decision makers. Recently, modeling tools have been presented as an effective alternative to support those challenges and to achieve cost-effectiveness in addressing environmental quality restoration and protection needs in different scenarios. USEPA has presented The System for Urban Stormwater Treatment and Analysis Integration (SUSTAIN) model to be used by watershed and stormwater professionals to develop, evaluate and select optimal BMPs combinations, at multiple watershed scales, and to achieve targeted water quality objectives based on cost and effectiveness. This tool incorporates algorithms from the Storm Water Management Model (SWMM), the Hydrologic Simulation Program FORTRAN (HSPF) model and other BMP modeling techniques. In order to evaluate and validate the application of the SUSTAIN model in an agricultural scenario, a case study is developed for a midsize drainage area (307 ha) located in the Mississippi Delta. The agricultural watershed includes a surface drainage ditch in which three low grade weirs have been installed and monitored for water level and pollutants concentrations since July 2010. The objective of this study is to assess the performance and capability of the SUSTAIN model in the context of a real agricultural scenario where BMPs are implemented. The study also attempts to determine the cost-effectiveness curve for the implementation of BMPs in the study area (considering the number of weirs installed as a variable) using total suspended sediments and total phosphorus as control targets.
INTRODUCTIONThe Mississippi River/Gulf of Mexico Hypoxia task force released the Gulf Hypoxia Action Plan for Reducing, Mitigating, and Controlling Hypoxia in the Northern Gulf of Mexico and Improving Water Quality in the Mississippi River Basin in June 2008 (FTN Associates, 2009). A Planning Team co-led by Delta F.A.R.M and the Mississippi Department of Environ-mental Quality (MDEQ) and formed by about 30 representatives from agencies organizations and stakeholders groups identified 12 critical elements for a Delta nutrient reduction strategy. This docu-ment is a component of the activities orientated to the evaluation and selection of appropriate ana-lytical tools that can be used to develop the most
efficient and effective action plans for areas within the Mississippi Delta Region.
Different models involving Management Decision Support Frameworks have been developed in the past years including a new model released by the USEPA in 2009 called SUSTAIN (System for Urban Stormwater Treatment and Analysis Integration). The SUSTAIN model (version 1.0) has been presented as an efficient tool that facilitates the selection of stra-tegic placement of best management practices (BMPs) and Low Impact Development (LID) in wa-tersheds at multiple scales. The model is expected to help in the development and implementations of plans for flow and pollution control in water systems,

Mississippi Water Resources Conference2012
98
and to aid to identify the best cost effective solu-tion helping managers or decision makers to iden-tify the most efficient design of a BMP. The SUSTAIN model was developed and has being tested for urban stormwater treatment. This study evaluated the SUSTAIN model in an agricultural sub-watershed where BMPs were implemented for the reduction of sediment and nutrients. The objective of this study was to evaluate the performance and capability of the SUSTAIN model in the context of a real agricul-tural scenario in the Mississippi Delta, where BMPs were implemented.
What is the System for Urban Stormwater Treatment and Analysis Integration - SUSTAIN ?The SUSTAIN model (Version 1.0) is a decision sup-port system developed by the USEPA to facilitate the selection and strategic placement of best management practices (BMPs) and Low Impact Development (LID) techniques in watersheds at multiple scales (local and larger scale). The major purpose of this model is to aid in the development and implementation of plans for flow and pollution control in water systems. Specifically, the SUSTAIN model was designed to evaluate a BMP effective-ness.
The SUSTAIN Model has six components built on a base platform interface using ArcGIS (ArcView 9.3 and Spatial Analyst extension). The ArcGIS Frame-work Manager serves as the command center of SUSTAIN, facilitates the linkages between the system components (BMP sitting tool, watershed module, BMP module, conveyance module, post processor, and optimization tools) and coordinates external inputs as well as provides output information to the post-processor (Figure 1).
The application of the SUSTAIN model starts with the definition of a study objectives, followed by data collection, project/model setup, formulation of the optimization problem, and analysis of results (Figure 2). To setup the model, each component needs
to be considered and usually applied in a series of steps, as follows:
Step 1. The BMP sitting tool is applied using the ArcGIS platform and user-guided rules to deter-mine site suitability for a variety of BMP options.
Step 2. The watershed and conveyance module is used to generate runoff time series data to drive the BMP simulation and to provide routing capabilities between land segments, BMPs or both. The SUSTAIN model has the option to use externally generated land use-associated flow and water quality time series data, or internally generated data from BMP contributing areas, routing them through the BMPs to predict flow and water quality time series data at selected downstream locations.
Step 3. The BMP module is applied to provide simulation of management practices by using a combination of processes for storage retention, open-channel controls, filtration, biological pu-rification and mechanical structure facilitated separation.
Step 4. Assessment locations are defined in the watershed where results are analyzed or com-pared.
Step 5. The cost database is organized accord-ing to BMP construction components (e.g., grading, backfilling, filter fabric) and populated with unit costs for each component.
Step 6. Optimization module compiles results from other modules in the framework for evalu-ating and selecting a combination of BMP op-tions that achieve the defined pollutant targets at minimum cost.
Step 7. A post-processor tool is used to present the optimization results in a cost-effectiveness curve.
Evaluation and Validation of a Decision Support System for Selection and Placement of BMPs in the Mississippi DeltaOrtega-Achury, Kröger, Ramirez-Avila, McAnally, Diaz

Best Management Practices
99
Evaluation and Validation of a Decision Support System for Selection and Placement of BMPs in the Mississippi DeltaOrtega-Achury, Kröger, Ramirez-Avila, McAnally, Diaz
Model EvaluationThe main objective of this study was to evaluate the performance and capability of the SUSTAIN model in the context of a real agricultural scenario in the Mississippi Delta, where BMPs were implemented. The model evaluation used general and monitoring information from the Harris Bayou North Ditch Proj-ect, which was established and monitored by Dr. Robert Kröger, Assistant Professor at the Department of Wildlife, Fisheries and Aquaculture of Mississippi State University. The project was set up in August 2010 and samples have been collected since December 2010. The model evaluation considered monitoring information collected between January and July 2011.
MATERIALS AND METHODSStudy Area DescriptionThe Harris Bayou North Ditch project is located at the Mississippi Delta area within the Harris Bayou watershed (Figure 3), which was placed on the Mississippi 2006 Section 303(d) list of impaired water bodies due to sediments and nutrients. The project has a total area of 758.9 acres including a ditch of approximately 931.93 ft length. Agricultural crops production (corn/winter wheat and soybean/winter wheat) represents the 80% of the entire area com-plemented by an extension of forest land located at the upper part of the watershed. Overland flow was drained from the agricultural fields to the ditch by 11 pipes (Ø=20 in) established at the end of the fields along the channel length. The ditch has a two-stage trapezoidal shape, which first stage depth is always lower than 1 ft. Three low grade weirs, a BMP method used as an alternative water control structure in drainage ditches, were built at the upper, middle and lower part of the ditch. Each low grade weir (h=1.4 ft) was built using rip-rap (Ø≈8.0 in) following a trapezoidal design (Figure 4). The construction of the weirs included excavation, engineering fabric, and installation of the rip-rap, information that was taken in consideration when computing costs for the SUSTAIN model setup. Four
monitoring stations were located along the ditch length, one at the upper part of the ditch before the location of the first drainage pipe and other three near each weir. Each monitoring station in-cluded two water samplers each one at a different level, one water level logger and a sediment level ruler.
MethodologyTo determine the effectiveness of SUSTAIN to repre-sent the Harris Bayou North Ditch system the model was initially setup to run in internal simulation mode. A second instance in the application of the model referred to its evaluation by running it in external simulation mode. Suspended sediments and phos-phorus were defined as the pollutants of interest for this analysis.
The SUSTAIN model was setup using the monitoring dataset from the Harris Bayou North Ditch Project and additional information collected by field obser-vation and GIS application. The monitoring dataset included information of water level, water quality and channel geometry. Based on field recognition, aerial photography available at Google Earth® and personal communication with Dr. Kröger, a GIS dataset for land use, channel network, BMP loca-tion, monitoring points’ location, soil series/hydro-logical group and area delimitation was generated using ArcMap 9.3.1. Since the project was already established, the SUSTAIN’s BMPs sitting tool was not used to identify the BMP locations within the area. Instead, each BMP location was considered as established at the original project design. The three low grade weirs were represented in the model as dry ponds and the total cost of their construction was considered as $3,000 per unit. The entire area (watershed) was subdivided in nine major fields or drainage areas (subcathments) contributing their overland flow to each one of the three low grade weirs (Figure 4). A full description of sizing and weir configuration was included, as well as substrate properties (depth, porosity, field capacity, wilting point, and infiltration). A distribution of five com-

Mississippi Water Resources Conference2012
100
binations of hydrological unit responses (HRUs) that capture the land use and physical texture of the watershed were determined. The initial values for the parameters involved in the estimations of overland flow and infiltration were defined as the representative values for each soil texture present on each field.
A weather file including daily air temperature and evaporation data was prepared. The format for the climate file followed the input format required by the SWMM model. Temperature values were ob-tained from the NOAA National Climatic Data Cen-ter. The closest weather station from the study area was the Clarksdale Station (GHCND: USC00221707; 34.1864°N and -90.5573°E). A period of record from January 2010 to July 2011 was compiled in the SUSTAIN’s climate file. A separate file was compiled containing a 15-min precipitation time series data-set from a USGS station located near to the Harris Bayou North Ditch area (USGS 341550090391300 Overcup Slough Tributary No 2 near Farrell, MS). Daily evapotranspiration rates were estimated by using the ETo Calculator Version 3.1 (FAO, 2009). The records from April 2010 to July 2011 were included in the file to setup the SUSTAIN model application.
A routing network, which connected the estab-lished BMPs within the system, was built as a two stage level channel considering the conduit cross section as an irregular shape. A Manning’s rough-ness coefficient value of 0.03 was assigned to the entire length of the conduit. The values for the pol-lutants decay factors and sediment transport pa-rameters were initially considered as the default val-ues included in the model. Infiltration was estimated by using the Green-Ampt equation and its param-eters values were considered for each soil texture class as suggested by Rawls et al., (1983). SUSTAIN’s default values were initially assigned to the values of the pollutants properties and concentrations and the land use properties used to estimate sediment erosion from pervious lands.
After setting up all the modeling components and parameters, two land simulation input files were compiled by SUSTAIN before performing the land simulation running. The activity of a computational bug, which limited the compilation of the input files by SUSTAIN, was solved by including the “SC” text before the catchment ID in all the sections wherever a catchment ID was present. Assessment points for running current scenario conditions were defined at the location where each field monitoring station was established. SUSTAIN would generate flow, sediment and phosphorus concentration time series at these points, which would be compared with the monitoring dataset. The optimization com-ponent that makes SUSTAIN to search and identify the optimal solutions was setup by establishing a number of three optimal solutions for output.
The Harris Bayou North Ditch system was evaluated in SUSTAIN under the external land simulation op-tion. The combination of water level and flow time series, sediment and phosphorus concentration datasets from stormflow and grab sampling events were used to generate sediment rating curves and linear relationships between sediment loads and phosphorus loads (Figure 5). Continuous time series of flow, sediment loads and phosphorus loads were generated for the period between Decem-ber 16, 2010 and July 9, 2011. The entire area was subdivided in three major fields (subcatchments). Flow and pollutants time series were built for each contributing area to be routed through each one of the three low grade weirs. The routing network was built as a two stage level channel considering the conduit cross section as an irregular shape with a Manning’s roughness coefficient value of 0.03 for the entire length of the conduit. The values for the pollutants decay factors and sediment transport parameters were considered as the default values included in the model. Assessment points were setup at each BMP location to develop the BMP simulation under current scenario and optimized conditions. For each type of evaluation an input file was created and the results were observed
Evaluation and Validation of a Decision Support System for Selection and Placement of BMPs in the Mississippi DeltaOrtega-Achury, Kröger, Ramirez-Avila, McAnally, Diaz

Best Management Practices
101
and analyzed. The criteria selection to minimize the BMPs implementation costs at the Harris Bayou North Ditch system was based on the reduction of the annual average load of sediment and phos-phorus in a 50% of the value under existing condi-tions. Another criteria, searched for the opportunity to reduce the concentration of phosphorus in runoff to a daily level of 1 mg L-1.
RESULTS AND DATA ANALYSISThe manual calibration procedure, based on a trial and error process of adjusting selected param-eters, resulted on inaccurate and poor calibrated results for the internal land simulation option. Results showed that the SUSTAIN model underestimated the flow volumes, the peak flow and the duration of the receding time on each stormflow event (Figure 6).
Under the external simulation procedure, model-ing results from running SUSTAIN to compare the current conditions scenario (agricultural land with BMPs established along the ditch) with a pre-de-velopment scenario (agricultural land with no BMPs established) showed that the BMPs could reduce the sediment and phosphorus concentrations de-livered by the Harris Bayou North Ditch system in up to 55% and 53%, respectively (Figure 7). The figure 8 summarize the predicted values of average daily sediment and phosphorus concentrations in the water flow running trough the Harris Bayou North Ditch system. Under the pre-development scenario conditions, the SUSTAIN model predicted constant values for sediment and phosphorus concentrations along the entire segment of the ditch. Those con-centrations were higher than the concentrations estimated by the generation of the time series from the monitoring dataset (in at least 2 times), which represented the existing conditions in the study area. The phosphorus concentrations (TP) in the wa-ter flowing along the ditch, which can be consid-ered as agricultural runoff, were favorably reduced by the effect of the BMPs.
The use of SUSTAIN to determine the best probable scenario with minimized costs in the establishment of BMPs showed that the current scenario was the best probable arrangement to be established to reduce sediments and nutrients at the estimated percentage of control (50%). However, this ar-rangement was not capable to reduce phosphorus concentrations to the targeted level of 1 mg l-1. The procedure to develop the cost effectiveness curve for the conclusion of this study was limited due to a bug in the Microsoft Excel spreadsheet that accom-panied the SUSTAIN model, which did not identify some needed components that the estimation rou-tine required. By the end of this report, the authors were unable to obtain an updated or modified version of the spreadsheet from the group of the model developers.
Model Application Analysis Based on the application of the SUSTAIN model in the study area, the following considerations were found to be a limitation of this new tool and for be-ing evaluated in the context of a real agricultural scenario. The considerations were classified in two groups based on their incidence for the model ap-plication. For instance, issues related with the model setup were considered as operational subjects and issues related with the model performance were classified as technical subjects.
Operational Issues. The first limitation that the SUS-TAIN model (version 1.0) can present is the availabil-ity and incompatibility of the model’s GIS interface platform. The current version of the model runs only under a specific previous version of the ESRI Arc-GIS® software (ArcGIS 9.3 or 9.3.1) and the Spatial Analyst extension, which is not compatible with posterior releases of this GIS commercial software.
During the evaluation of the SUSTAIN Model, the modeling setup and running processes were de-layed due to a lack of knowledge and published information regarding the model operation and guidance. A tutorial guide prepared by the model
Evaluation and Validation of a Decision Support System for Selection and Placement of BMPs in the Mississippi DeltaOrtega-Achury, Kröger, Ramirez-Avila, McAnally, Diaz

Mississippi Water Resources Conference2012
102
developers is available; however, a significant number of steps that were not included in that document were needed during the model setup to properly apply some of the model tools and solve programming problems (bugs) the model engine and the postprocessor spreadsheet included. The programming problems or “bugs” that make the model crash when creating an input file was one of the conditions that more time consumed dur-ing the evaluation of SUSTAIN for this study. After a failed run in SUSTAIN, the entire project was gone and the model had to be setup from the beginning. SUSTAIN only generated an “error message” that did not explain the specific problem and the iden-tification of the specific error was not possible until getting in contact with the technical support team at TetraTech. The problem was identified to be a bug on SUSTAIN, which prevented the model for having a unique subcatchment ID when using the internal simulation mode. The solution to this prob-lem was to internally modify in the input file each subcathcment ID by adding the prefix “SC” before the ID number. Additionally, this programming error caused that any change on the value of a param-eter or property made during the calibration pro-cess required to properly modify and create a new input file before performing a new run.
Changes on a layer component of the model could be performed and included in the geo-database file of the project. However, that change was not reflected on the creation of a new input file.
Technical Issues. • SUSTAIN does not handle the possible inter-
action between the groundwater system and the channel system to properly repre-sent the occurrence of baseflow or water retention conditions along a channel.
• The SUSTAIN model does not represent con-ditions like “back water” caused by floods that increase the time of reduction in wa-ter level after a storm or rainfall event. The model does not have any hydraulic option
to add a structure that allows the user to represent it.
• The optimization tool spreadsheet recog-nizes all the configuration parameters and files containing the outlet information under the different scenarios of evaluation. How-ever, the macro routines were not able to generate time series results or to create the cost effectiveness curve for the evaluated system.
Some of the technical and operational issues previ-ously mentioned were discussed and solutions were given as reported through electronic (email) and telephonic communication (until March 2012) by the SUSTAIN technical support team at Tetra Tech. For some cases, the support team said they are working on a new version of the SUSTAIN model, which will include a solution to the identified pro-gramming errors and technical issues. CONCLUSIONS
• For different studies performed by the tech-nical support team at TetraTech in urban watersheds, the SUSTAIN model has been a very useful tool capable to help decision makers to select the best combination of practices to implement among the many options available that also result in the most cost-effective achievable. However, the evaluation of the SUSTAIN model in an agricultural environment by a user that was not part of the technical support team some limitations on its application were found. Important operational problems were an enormous time consuming condition that limited the opportunity to evaluate all the potential capabilities of the model.
• Non-accurate results were obtained in this study when trying to perform the prediction of water flow under the internal land simula-tion option included in the model. Addition-ally, the need to repetitively perform chang-es on the input files to avoid the model to
Evaluation and Validation of a Decision Support System for Selection and Placement of BMPs in the Mississippi DeltaOrtega-Achury, Kröger, Ramirez-Avila, McAnally, Diaz

Best Management Practices
103
crash, made the calibration process an expensive time consuming and ineffective process.
• The use of external datasets could have been a successful alternative to perform the evaluation of the SUSTAIN model at the Har-ris Bayou North Ditch project. However, the technical problems that the postprocessor spreadsheet presented were an additional factor that finally limited to achieve the study’s objective.
• Because of the technical and operational limitations previously described in the docu-ment, the current version of the SUSTAIN model can not be satisfactorily considered as an appropriate tool at field and water-shed scale to develop action plans to en-hance the nutrient reduction strategy within the Mississippi Delta Region. The model has an enormous potential to satisfactorily sup-port this enhancement if the reported op-erational and technical limitations are fixed and presented in a new version.
REFERENCESBicknell B.R., J.C. Imhoff, J.L. Kittle, T.H. Jobes, and A.S. Jr. Donigian. 2001. Hydrological Simulation Program - FORTRAN, Version 12, User’s Manual, U.S. Environmental Protection Agency, national expo-sure Research laboratory, Athens, G.A. in coopera-tion with U.S. Geological Survey, water Resource Division, Reston, VA.
FAO. The ETo Calculator. Reference Manual, Ver-sion 3.1. 2009. Food and Agriculture Organization of the United Nations, Land and Water Division. FAO, Via delle terme di Caracalla, 00153 Rome, Italy.
Lai F., T. Dai, J. Zhen, J. Riverson, K. Alvi, and L. Shoemaker. SUSTAIN - An EPA BMP process and placement tool for urban watersheds. 2007. Water Environment Federation. Available online at: http://www.epa.gov/nrmrl/wswrd/wq/models/sustain/sus-tain_paper2007.pdf.
Riverson J., Zhen J., Shoemaker L., and Lai F. 2004. Design of a Decision Support System for Selection and Placement of BMPs in Urban Watersheds. World Water and Environmental Resources Congress 2004, June 27 – July 1, 2004. Salt Lake City, Utah.
Rossman L.A. 2005. Stormwater Management Mod-el User’s Manual, Version 5.0.EPA/600/R-05/040. U.S. Environmental Protection Agency, Water Supply and Water Resources Division, National risk Man-agement Research laboratory, Cincinnati, OH.
Shoemaker L., Riverson J., Alvi K., Zhen J., Paul s., and Rafi Teresa. 2009. SUSTAIN – SUSTAIN - A Frame-work for Placement of Best Management Practices in Urban Watersheds to Protect Water Quality. National Risk Management Research Laboratory. United States Environmental Protection Agency. Report: EPA/600/R-09/095.
Tetra Tech. 2009. System for Urban Stormwater Treatment and Analysis Integration (SUSTAIN). Step-by-step application guide, Version 1.0. Prepared by: Tetra Tech, October 15, 2009.
Evaluation and Validation of a Decision Support System for Selection and Placement of BMPs in the Mississippi DeltaOrtega-Achury, Kröger, Ramirez-Avila, McAnally, Diaz

Mississippi Water Resources Conference2012
104
Evaluation and Validation of a Decision Support System for Selection and Placement of BMPs in the Mississippi DeltaOrtega-Achury, Kröger, Ramirez-Avila, McAnally, Diaz
Figure 1. SUSTAIN Model Components (Source: Shoemaker et al., 2009)
Figure 2. SUSTAIN Application Process (Source: Shoemaker et al., 2009)
II ,.. e
• • 0 .. 3 0 .. .? C: t; ..
iz 0 0
ji .. t .~ .. iS, C 0. 0 .. "' 8 .. .:: !! • <71 o-•
i
Interpretation (Post Processor)
Data Collection & Analysis • Study ore review • GIS data. - use. Slfeam DEM. BMP ..... !IC. • Walfflhed end BMP r,lofm&uonldllA • C0mplo rnonJIOtlng data (ailibtllClM'aidalla,,)
ProJ•ct Setup • 8MP ,epre...,talorr l)f...,11e11t, conf9Jlll!IOn. end OC>M • LonaNV•-Rep,-. Raoil!OQ-• ~poollt$1 • T.., S)'tem 81)1)11<:atlOO (e'1emoly cail>rll(eo model) • CalbnU,""llclale model (-mal modell
Put Optimization Processor to Wori< • Sele<! ded...,. v- (BMP -..on.1 • Sele<l e.....,,.,.,.. points (Bt.f'/Oulet toeat.oom) • Sel«i evalualon facl<lrs. coo•ol 121rgo1> (end potrts)
Results Analysis and Rtpr.wntadon (Post-Proct5'or) • Opt.....,, BMP dlnonol°"' • Alternate IOhJtions
J _J

Best Management Practices
105
Evaluation and Validation of a Decision Support System for Selection and Placement of BMPs in the Mississippi DeltaOrtega-Achury, Kröger, Ramirez-Avila, McAnally, Diaz
Figure 3 Harris Bayou Project Location
Figure 4. Low Grade Weir and Water Quality Monitoring Equipment
Mississippi East Ditch Study Area
~ih.-l-----<n,----l-1h4

Mississippi Water Resources Conference2012
106
Evaluation and Validation of a Decision Support System for Selection and Placement of BMPs in the Mississippi DeltaOrtega-Achury, Kröger, Ramirez-Avila, McAnally, Diaz
Figure 5. Runoff sediment rating curve (up) and relationship between suspended sediment load and phosphorus load in runoff (down) along the Harris Bayou North Ditch system
Figure 6. Estimated and simulated water flow along the Harris Bayou North Ditch system
.... .. • Slit 1 • Sllt2
,. ..... •
·-1 ., .-g" e
" • .. ,:
•--------------------------- • " .. "'
,.,, .,., , ... """' ,~,
Of~hj
,..., 11G
"" l'!JI) ,. 11,0
,.., -~ 'e ~ •oo l IC
"° .., ~
0 HON' 10 l&llt ll 11 kb l1 l \l.ly U 1i ,.,_.., II
Oate

Best Management Practices
107
Evaluation and Validation of a Decision Support System for Selection and Placement of BMPs in the Mississippi DeltaOrtega-Achury, Kröger, Ramirez-Avila, McAnally, Diaz
Figure 7. Time series of sediment (up) and phosphorus concentration (down) in water flow at the outlet of the Harris Bayou North Ditch system for two different.
Figure 8. Mean annual concentration of TSS and TP at the lower BMP established along the Harris Bayou North Ditch system
-..,. .,.,
_., ___ __ ---
• .... -. -. -.-.-.-.-.---.-.-. -. -.-.-.-.-.-.-.-. -. ---. -.-.-.-.-.-'-. • > • • • < < < > A A • . . . . . < < < < < C < • 0 0 > . . i~ - ss~~s~,~ 4 fit~~ii§~~sslis~!I
u C 0 2 u -;i 1 ..., :::;
c o Q.
--+--
PreOev
....
PostOev
Scenarios
-
Existing
•
.J. 800
"BlJ 700 E '-' 600
--CJ 500 C -0 400 ::.) - 300 --C
200 J J 100
--0 0 ~ PreOev PostDev
Scenarios
-----
---Ex,st,ng

Mississippi Water Resources Conference2012
108
Best Management Practices in the MS Delta: What Are We Learning?
Robert Kröger, Mississippi State UniversityPrevost, J.; Cooke, T.
Prevention and reduction of surface water pollution has been a matter of concern for decades, which has promoted the implementation of best management practices (BMPs) to ensure the protection of water resources. A considerable number of structural and non-structural BMPs have been developed to control hydrological processes and enhance pollutant load reduction at field and watershed scales. However, the selection of a specific BMP or the best combination of these practices and BMP placement are major challenges faced by decision makers. Recently, modeling tools have been presented as an effective alternative to support those challenges and to achieve cost-effectiveness in addressing environmental quality restoration and protection needs in different scenarios. USEPA has presented The System for Urban Stormwater Treatment and Analysis Integration (SUSTAIN) model to be used by watershed and stormwater professionals to develop, evaluate and select optimal BMPs combinations, at multiple watershed scales, and to achieve targeted water quality objectives based on cost and effectiveness. This tool incorporates algorithms from the Storm Water Management Model (SWMM), the Hydrologic Simulation Program FORTRAN (HSPF) model and other BMP modeling techniques. In order to evaluate and validate the application of the SUSTAIN model in an agricultural scenario, a case study is developed for a midsize drainage area (307 ha) located in the Mississippi Delta. The agricultural watershed includes a surface drainage ditch in which three low grade weirs have been installed and monitored for water level and pollutants concentrations since July 2010. The objective of this study is to assess the performance and capability of the SUSTAIN model in the context of a real agricultural scenario where BMPs are implemented. The study also attempts to determine the cost-effectiveness curve for the implementation of BMPs in the study area (considering the number of weirs installed as a variable) using total suspended sediments and total phosphorus as control targets.

Delta Water Assessment
Charlotte Bryant ByrdMississippi Department of Environmental Quality
The Great Flood of 2011 and its Influence on the Mississippi River Valley Alluvial Aquifer: Did the River Recharge the Aquifer or What?
Paul ParrishMississippi Department Environmental Quality
Snapshot Through Time of “The Hole” in the MRVA of the Central Delta (Sunflower and Leflore County)
Priyantha JayakodyMississippi State University
Develop Hydrological Relationships using a Modeling Approach in Mississippi Delta
Jeannie R.B. BarlowU.S. Geological Survey
Nitrogen dynamics within the Big Sunflower River Basin in northwestern Mississippi
Del
ta W
ater
Ass
essm
ent

Mississippi Water Resources Conference2012
110
The Great Flood of 2011 and its Influence on the Mississippi River Valley Alluvial Aquifer: Did
the River Recharge the Aquifer or What?Charlotte Bryant Byrd, Mississippi Department of Environmental Equality
The flooding along the Mississippi River during the months of April and May, 2011 was among the worst in the last 100 years. According to one source, this flooding event was comparable to the flooding that occurred in 1927 and 1993. Data from five gages that include stations at Memphis, Tennessee down to Vicksburg, Mississippi indicate that an all-time record was set at the gage at Vicksburg, Mississippi, and near-record stages were recorded at the other four stations. Seven states were impacted by the floodwaters, and for the first time in many years, the Morganza Spillway was opened to deliberately flood roughly 4,600 square miles of rural Louisiana so that New Orleans and Baton Rouge could be spared.
With all the record setting stages along the Mississippi River adjacent to Mississippi, one may ask, “What influence did the record-high river stages have on the Mississippi River valley alluvial aquifer (MRVA), which is the shallow aquifer in the alluvial plain (Delta) in the northwest portion of the state?” Unfortunately, the answer is not as straight forward as one may wish.
The Mississippi River is the western boundary for both the Delta and the alluvial aquifer. The depositional history of this river system is very complex, thus the geology of the alluvial aquifer is very complex. As the Mississippi River and its tributaries migrated throughout the alluvial plain, many stream channels were eventually cut off from the main river creating oxbow lakes. Through time, many of these oxbows were filled in with very fine-grained sediments, such as silt and clay. If the fine-grained sediments within an oxbow is of sufficient thickness, a “clay plug” is formed that serves to prevent any flow of water through it. Remnants of these old streams and oxbows are present all along length of the Mississippi River. However, if mostly fine- to coarse-grained sand and gravel was deposited, the river and the MRVA are most likely in very good hydrologic connection.
Water levels were collected during early May (the period of peak flooding) by the Office of Land and Water Resources staff. This data along with water level data collected by the Yazoo Mississippi Joint Water Management District staff during early April and early June were correlated with River stages. Then an analysis of geologic data was combined with the water levels and river stages to try to determine hydrogeologic connection.

Delta Water Assessment
111
Snapshot Through Time of “The Hole” in the MRVA of the Central Delta (Sunflower and
Leflore County)Paul Parrish, Mississippi Department of Environmental Equality
The data utilized in this presentation will provide snapshots of the decline in water levels in what we affectionately call “The Hole”. This will be done through the use of three dimensional maps, hydrographs, and geophysical logs. “The Hole” is an area of depression in the potentiometric surface of the MRVA (Mississippi River Valley Alluvial Aquifer). It is located in the central delta of northwest Mississippi. In large part it is centered in Sunflower and Leflore counties. The purpose of this research is to expand the examination of the growing trend of declining water levels in this area over time. This data collection involves drilling, historical research, and water level data collection. The water level measurements are mainly conducted in the Fall after irrigation season has ended and the Spring before irrigation season begins.
This examination leads us to the question, “Why?”. There are many answers to that question which will be discussed in more depth. The geology in and around the delta both creates the possibility of such an aquifer as the MRVA, as well as, hinders its recharge and flow. Deforestation and dewatering of the land in the delta have also caused problems. Incision and dredging of channels in surface water bodies may contribute to the problem. Local domination of certain crops may contribute the trend. All of these areas need to be addressed and examined further.

Mississippi Water Resources Conference2012
112
Develop Hydrological Relationships using a Modeling Approach in Mississippi Delta
Priyantha Jayakody, Mississippi State UniversityParajuli, P.; Sassenrath, G.
Agriculture management practices such as tillage and crop rotations alter the hydrological budget of watersheds. Changes happen to surface runoff can be easily identify with the help of intensive USGS stream gage network, available in Mississippi, but changes to ground water table is less understood as inherent difficulties of measurements. The main objective of this research is to develop relationships among evapotranspiration (ET), soil moisture content (SMC) and depth to the ground water table through modelling approach. The SWAT hydrologic and crop models were setup for the Big Sunflower River watershed (BSRW; 7,660 km2) within Yazoo Rive Basin of the Mississippi Delta. Hydrologic calibration and validation was carried out for the period from 1999-2009 using USGS flow data. Crop model was calibrated and validated for the same period by using Corn and Soybean yield data from the USDA experiment stations. Both crop and hydrologic model performances will be evaluated using coefficient of determination (R2), Nash-Sutcliff Efficiency Index (NSE) and Root Mean Square Error (RMSE). Empirical relationships will be developed to predict depth to the groundwater table using model predicted ET and SMC. The relationships developed will be validated with the field observed data and will be used to make groundwater thematic maps for the Mississippi Delta.

Delta Water Assessment
113
Nitrogen dynamics within the Big Sunflower River Basin in northwestern Mississippi
Jeannie R.B. Barlow, U.S. Geological SurveyCoupe, R.; Kröger, R.
Two important water issues in northwestern Mississippi are: (1) the export of nutrients to the Mississippi River and eventually to the Gulf of Mexico, and (2) the availability of water for irrigation and to sustain baseflow in streams. Recently, the Yazoo River Basin in Mississippi was identified as a significant contributor of total nitrogen and phosphorus to the Gulf of Mexico. The Big Sunflower River Basin, located within the Yazoo River Basin, receives large annual inputs of nitrogen from agriculture, atmospheric deposition, and point sources. Recent publications indicate that nitrate, once it enters the surface waters of the Big Sunflower River Basin, acts conservatively and does not undergo significant losses. Stream flow in the Big Sunflower River has been substantially altered by loss of base flow due to declining water levels in the underlying alluvial aquifer. Therefore, instead of being a predominantly gaining stream, the Big Sunflower River is now a predominantly losing stream allowing for surface-water to move through the streambed. Nitrate transported with surface water through the streambed, with its generally low oxygen environment, is susceptible to denitrification, thereby removing nitrate from the system. Over the past 2 years, the USGS, in cooperation with the USACE, has conducted a study to determine the relative roles of in-stream processing and groundwater/surface-water exchange on the transport and fate of nitrate in the Big Sunflower River. Preliminary results from this study indicate that the transport of nitrate in surface water moving through the streambed is removed by denitrification, whereas the in-stream transport of nitrate is relatively conservative.

Flood Assessment and Management
Amanda RobertsNational Weather Service
Flooding Concerns on the Lower Pearl River Near Walkiah Bluff, MS
Heather Welch U.S. Geological Survey
Movement of Agricultural Chemicals and Sediment Through the Lower Mississippi River Basin During the 2011 Flood, April through July
Marcia S. WoodsU.S. Geological Survey
Water-quality of the Yazoo River During the 2011 Mississippi River Flood
John StormU.S. Geological Survey
Flood inundation mapping for the Leaf River at the city of Hattiesburg, MS
Floo
d A
sses
smen
t and
Man
agem
ent

Flood Assessment and Management
115
Flooding Concerns on the Lower Pearl River Near Walkiah Bluff
Amanda L. Roberts, National Weather Service
IntroductionWalkiah Bluff is located in Mississippi on the East Pearl River near Wilson Slough and the divergence of the Pearl River into the East and West Pearl Rivers (Figure 1). Approximately 75 residents own raised homes along Parkside Drive, which parallels the East Pearl River near Walkiah Bluff. At least another 100 residents own homes in various nearby neighborhoods, such as the Oak Point Road area (Figure 2). Flooding often occurs in the Walkiah Bluff area whenever flooding occurs upstream on the Pearl River, thus heightening concerns of local citizens. The National Weather Service (NWS) Lower Mississippi River Forecast Center (LMRFC) has agreed to provide guidance on flooding in this area and has developed several tools to assist with such guidance.
Hydrology of the Pearl River near Walkiah BluffThe Pearl River forks into the East Pearl River and the West Pearl River approximately 9 miles northwest of Picayune, MS (Figure 3). The East Pearl River flows about 45 miles before emptying into Lake Borgne and also serves as the state boundary between Mississippi and Louisiana. The West Pearl River spans 44 miles before emptying into the Rigolets, which is the main outlet between Lake Ponchartrain and Lake Borgne (U.S. Army Corps of Engineers, New Orleans District 1998).
Wilson Slough and Holmes Bayou are the two main conduits that permit flow from the East Pearl River to empty into the West Pearl River (U.S. Army Corps of Engineers, New Orleans District 1998). Wilson Slough originates about 7 miles west of Picayune, MS and
Walkiah Bluff is located in south Mississippi on the East Pearl River near Wilson Slough and the divergence of the Pearl River into the East and West Pearl Rivers. Approximately 175 residents own homes on or near the East Pearl River near Walkiah Bluff, MS. Flooding often occurs in the Walkiah Bluff area whenever flooding occurs upstream on the Pearl River, thus heightening concerns of local citizens. The Lower Mississippi River Forecast Center (LMRFC) has flood forecasting responsibility in this area, however, Walkiah Bluff is not currently an official forecast point.
Historical data from the period of record was utilized to develop flood forecasting guidance tools for the Walkiah Bluff area. Flood events were analyzed to obtain a better understanding of how Walkiah Bluff reacts in relationship to upstream flooding on the Pearl River at Bogalusa, LA and the Bogue Chitto River at Bush, LA. As-sessments were also made regarding how the Pearl River at Pearl River, LA reacts in association with upstream flooding at Walkiah Bluff and Bush.
The effects of the Bogue Chitto River on the crest at Walkiah Bluff, MS are complicated due to numerous sloughs and bayous that interconnect the two channels. It is difficult to accurately interpolate any affects from the Bogue Chitto by utilizing a crest to crest curve for Bogalusa to Walkiah Bluff. However, because the crest at Pearl River, LA is based upon water routed from both Bogalusa and Bush, the LMRFC forecast for Pearl River, LA can be utilized along with the crest to crest curve for Walkiah Bluff to Pearl River, LA to essentially back-forecast the crest at Walkiah Bluff. The results of this study are expected to assist in increasing the accuracy and timeli-ness of LMRFC flood forecasts for Walkiah Bluff citizens.

Mississippi Water Resources Conference2012
116
Holmes Bayou begins about 3 miles southwest of Picayune, MS (Figure 3).
Since the late 19th century, approximately 75% of the low flow in the Pearl River passed through Wilson Slough to the West Pearl River (U.S. Army Corps of Engineers, Vicksburg District, 1989). By 1996, the problem had amplified to the point where almost no flow occurred along the East Pearl River past Wilson Slough during low flow conditions. With funding from the U.S. Army Corps of Engineers (USACOE) and the Mississippi Department of Environmental Quality (MSDEQ), the Walkiah Bluff diversion was constructed in 1999. The diversion, an earthen, trapezoidal weir, was designed to increase discharge and water levels in the East Pearl near Walkiah Bluff and decrease these factors in Wilson Slough and the West Pearl during flow conditions of 1,500 cfs or less. A 50/50 low flow distribution is maintained by this weir (Miller and Payne 1995). According to information received from Charlie McKinnie with the Vicksburg ACOE via email, the top of the weir is 36.1’ NGVD 29 and the top of the bank at the weir is 42.65’ NGVD 29.
MethodsThe United States Geological Survey (USGS) owns and maintains two gages near Walkiah Bluff. One gage is located in Mississippi directly above the weir on the Pearl River (NWS ID WSWM6), while the other gage is below the weir just across the state line in Louisiana on Wilson Slough (NWS ID WSWL1). For the purposes of this study, the gage in Mississippi at Walkiah Bluff above Wilson Slough (NWS ID WSWM6) was utilized. The period of record runs from the gage installation date in August of 2006 to present. Historical data from the period of record was utilized to develop flood guidance tools for the Walkiah Bluff area. Flood events were analyzed to obtain a better understanding of how Walkiah Bluff reacts in relationship to flooding on the Pearl River at Bogalusa, LA (NWS ID BXAL1) and the Bogue Chitto River at Bush (NWS ID BSHL1). Assessments were also made regarding how the Pearl River at Pearl River, LA (NWS ID PERL1) reacts in association with flooding at WSWM6 and BSHL1 (Figure 4 and
Table 1).
Contributions to the Pearl River at Walkiah Bluff, MS Above Wilson SloughThe main contributor of flow at WSWM6 is the water routed down from the mainstem of the Pearl River, however when the Bogue Chitto River provides a significant portion of the flow, it can have considerable effects. Stage data from the USGS gages at BXAL1 and BSHL1 were studied. The amount, timing, and distribution of routed water from these two locations control the shape of the WSWM6 hydrograph. In general, the crest at WSWM6 is directly related to the routed flow from BXAL1.
In addition to the flows from BXAL1, flows from the Bogue Chitto River have some effects on the Pearl. The Bogue Chitto River merges with the Pearl River Navigation Canal between Locks 2 and 3. Below the navigation canal, the Bogue Chitto River flows roughly southward, paralleling the Pearl River to the east and Pearl River canal to the west. There are small sloughs and bayous that connect the Pearl and Bogue Chitto Rivers above Wilson Slough that allow some water to be transferred between the two rivers. The majority of the flow from the Bogue Chitto eventually merges with the West Pearl River near Wilson Slough, downstream of the weir.
If the Bogue Chitto is high compared to the Pearl River, some water from the Bogue Chitto may flow eastward into Wilson Slough and have effects on the flows at WSWM6. During these events, the Bogue Chitto can cause a rise in the tailwater at the weir structure, which lessens the flow through the weir and allows more water down the Pearl River. If the weir structure and closure are overtopped, open river conditions exist on the Pearl and the water level differential between Wilson Slough and the Pearl River is reduced or absent.
Stage forecasts are provided at BXAL1 by LMRFC. To provide information on the expected river levels at Walkiah Bluff, the stages at BXAL1 were compared with stages at WSWM6. The crest to crest
Flooding Concerns on the Lower Pearl River Near Walkiah BluffRoberts, Amanda L.

Flood Assessment and Management
117
curve for BXAL1 to WSWM6 branches to the right during high water events when the Bogue Chitto raises the tailwater at the weir (Figure 5). This lessens the flow through the weir and forces more water down the East Pearl. The upper end of the curve branches to the left when there are no significant affects from the Bogue Chitto. Notice the yellow line in Figure 5, indicating the top of the bank at the weir. Regardless of the effects of the Bogue Chitto, once the bank is over-topped, the entire swamp conveys water and requires a larger volume of water to notice an increase in stage. This results in both branches of the curve turning upward once the bank is over-topped.
Contributions to the Pearl River at Pearl River, LAThe two primary contributors of flow for the West Pearl River at Pearl River are flows from BXAL1 and BSHL1. Generally, the crest height and timing at PERL1 is directly related to the flow routed down from BXAL1 and subsequently, WSWM6.
Generally, the flow contributed by the Bogue Chitto River is much less than that from the Pearl River. The most prevalent affect that water from BSHL1 has on PERL1 is that it causes the initial rise in the PERL1 hydrograph prior to the arrival of the routed water from WSWM6. Because of this, the secondary rise generated by water from WSWM6 drives the flood crest at PERL1 (Figure 6). The travel time from BSHL1 to PERL1 ranges from slightly less than a day and a half to two days, with longer travel times associated with large scale events (Figure 7).
ResultsThe effects of the Bogue Chitto on the crest at WSWM6 are complicated. It is difficult to accurately interpolate any affects from the Bogue Chitto by utilizing the crest to crest curve for BXAL1 to WSWM6. Because the crest at PERL1 is based upon water routed from both BXAL1 and BSHL1, the LMRFC forecast for PERL1 can be utilized along with the crest to crest curve for WSWM6 to PERL1 to essentially back-forecast the crest at WSWM6.
A list of corresponding historical crests for BSHL1, BXAL1, WSWM6 and WSWL1 has been developed in an effort to give citizens an idea of what to expect based on historical data (Table 2).
ConclusionsIn most cases, the crest at WSWM6 can be expected to occur slightly less than a day and a half prior to the PERL1 crest, however events with a long, broad crest may take as long as 2 days. The user is encouraged to take into consideration the magnitude of the flood event when determining the travel time, as this will also assist in establishing the general shape of the hydrograph. Historically, the Walkiah Bluff hydrograph strongly mimics that of BXAL1, but additional rises have also been noted when water from the Bogue Chitto causes a rise in the tailwater at the weir or when the weir is overtopped. As a reminder, a significant difference is noted in the response of the river when the top of the bank at the weir is overtopped (42.65’ NGVD 29). If a crest for WSWM6 is anticipated to be above this level, the user should keep in mind that the river will become more of an open river system, the water will spread beyond the channel, and a greater volume of water is needed in order to see a significant rise in stage.
ReferencesMiller, A. C., and Payne, B. S. (1997). “Effects of water diversions of freshwater mussels in the Pearl River near Walkiah bluff, Mississippi and Louisiana, 1995,” Technical Report EL-97-22, U.S. Army Engineer Waterways Experiment Station, Vicksburg, MS.
U.S. ARMY CORPS OF ENGINEERS. 1989. “Lower Pearl River Basin Flow Distribution, Mississippi and Louisiana,” United States. Army. Corps of Engineers. Vicksburg District.
U.S. ARMY CORPS OF ENGINEERS. 1998. Water resources development in Louisiana. U.S. Army Corps of Engineers, New Orleans District. 191 pp.
Flooding Concerns on the Lower Pearl River Near Walkiah BluffRoberts, Amanda L.

Mississippi Water Resources Conference2012
118
Flooding Concerns on the Lower Pearl River Near Walkiah BluffRoberts, Amanda L.
Table 1. Select gages in the Lower Pearl River basin.National Weather Service
Gage IDRiver Name Gage Location Gage Datum
(NGVD29)BXAL1 Pearl River Near Bogalusa, LA 55.0’FRNL1 Bogue Chitto River Near Franklinton, LA 123.81’PPBL1 Pearl River Pool’s Bluff (6 mi. south of
Bogalusa)0.0’
PRTL1 Pearl River Navigation Canal
Near Sun, LA (at Lock #3) 0.0’
BSHL1 Bogue Chitto River Bush, LA 44.25’PRDL1 Pearl River Navigation
CanalNear Sun, LA (at Lock #2) 0.0’
WSWM6 Pearl River Above Weir at Walkiah Bluff, MS
0.0’
WSWL1 Pearl River Below Weir at Walkiah Bluff, LA
0.0’
MNLM6 West Hobolochitto Creek McNeil, MS 55.64’CREM6 East Hobolochitto Creek Carrier, MS 62’PRUL1 Pearl River Navigation
CanalNear Pearl River, LA (at
Lock #1)0.0’
PERL1 Pearl River Pearl River, LA -0.05’SIVL1 Pearl River Indian Village near Slidell,
LAN/A
EPCM6 Pearl River East Pearl at CSX Rail Road
0.0’

Flood Assessment and Management
119
Table 2. Historical crests for the Bogue Chitto at Bush, LA, the Pearl River at Bogalusa, LA, the Pearl River at Walkiah Bluff, MS, and Wilson Slough at Walkiah Bluff, LA
Bogue Chitto at
Bush Crest Date
Bogue Chitto at
Bush Crest
Pearl River at Bogalusa Crest Date
Pearl River at Bogalusa
Crest
Pearl River at Walkiah Bluff Crest
Date
Pearl River at Walkiah Bluff Crest
Wilson Slough at Walkiah
Bluff Crest Date
Wilson Slough at Walkiah
Bluff Crest
10/30/2006 11.29 10/29/2006 18.8 10/31/2009 36.2 No Gage No Gage2/4/2007 7.15 2/5/2007 17.47 2/7/2009 37.5 No Gage No Gage
2/26/2008 9.05 2/29/2008 20.53 3/2/2009 40 No Gage No Gage3/8/2008 11.19 3/9/2008 20.23 3/11/2008 39.8 No Gage No Gage4/6/2008 4.46 4/10/2008 16.84 4/12/2008 36.2 No Gage No Gage
5/17/2008 8.29 5/22/2008 18.23 5/24/2008 38 No Gage No Gage9/7/2008 12.86 9/8/2008 18.42 9/8/2008 37.98 9/8/2008 34.0
12/15/2008 10.41 12/19/2008 20.75 12/21/2008 40.2 12/21/2008 36.41/10/2009 10.07 1/13/2009 20.65 1/15/2009 40.2 1/14/2009 36.42/15/2009 7.65 2/18/2009 18.88 2/20/2009 38.05 2/19/2009 33.23/18/2009 8.33 3/21/2009 20.28 3/23/2009 39.5 3/24/2009 35.03/31/2009 17.5 3/31/2009 21.99 4/1/2009 44.62 4/1/2009 44.44/17/2009 12.48 4/16/2009 20.35 4/18/2009 39.92 4/18/2009 37.2
10/19/2009 9.55 10/19/2009 20.23 10/21/2009 39.71 10/21/2009 34.911/3/2009 6.43 11/4/2009 17.36 11/6/2009 37.14 11/6/2009 31.2
12/18/2009 14.29 12/20/2009 21.13 12/21/2009 42.77 12/21/2009 41.6
Flooding Concerns on the Lower Pearl River Near Walkiah BluffRoberts, Amanda L.

Mississippi Water Resources Conference2012
120
Flooding Concerns on the Lower Pearl River Near Walkiah BluffRoberts, Amanda L.
Figure 1. Lower Pearl River basin.
C::: lnter,1a1e l!C;!! Sw,11111 - River c:::J State Boundary
• Sludy Loullont
I j
/ I
Lake Borgne

Flood Assessment and Management
121
Figure 2. Aerial photography of the Walkiah Bluff area (courtesy of ESRI). Red outlines indicate residential areas frequently affected by flooding
Figure 2. Aerial photography of the Walkiah Bluff area (courtesy of ESRI). Red outlines indicate residential areas frequently affected by flooding.
Flooding Concerns on the Lower Pearl River Near Walkiah BluffRoberts, Amanda L.

Mississippi Water Resources Conference2012
122
Flooding Concerns on the Lower Pearl River Near Walkiah BluffRoberts, Amanda L.
Figure 3. Pearl River divergence.
Bogue l,UStl Creek
Louisiana
Legend
c::::::I tnter$1<Ue
[:ii! SW.111> - Rive, CJ St•t• Boundary
• S1udy Locollons • Olv,nslon
Mississippi

Flood Assessment and Management
123
Figure 4. Gage locations in the lower Pearl River basin (NEW gage IDs).
Flooding Concerns on the Lower Pearl River Near Walkiah BluffRoberts, Amanda L.

Mississippi Water Resources Conference2012
124
Flooding Concerns on the Lower Pearl River Near Walkiah BluffRoberts, Amanda L.
Figure 5. Crest to crest curve for Bogalusa, LA to Walkiah Bluff, MS on the Pearl River. Purple markers indicate events with a heavy contribution from the Bogue Chitto River near Bush, LA.
23
21
19
17
15
Pearl River Bogalusa to '1Valkiah Bluff
Crest to Crest Time to Cr est (hours) be-~ide date of event. No flood stage has be-e-n establish eel for WSvVM 6. When the Bogue Chitto is high, it can cause a rise- in taihvater a t the- we-ir, whid1 in turn can cause- a higher ere-st at WSWM6.
f-- -
The curve branches to the right for events with h eavy Bogue Chitto contribution. Both branch es curve u1nvard afte-r the bank at the we-ir has bee-n over t.op1>e-d b ecause- the e-ntit"e
l!/1/200 ~ (19)
swami> conveyswate-r ,lt this p oint and a larger volume of water is ue-eded to see an in cr ease in stage. J/ ~ '9 (27)
12/20/2008
~ "/8(. 010 (42
1/ 5/2009 (36 31'/2008 (30)1
3/23/2 )09 (36) :4/18/2009 ( 3)
10/20/2( 09 (34 ""-3111 /2008 (301
10/3 12006 (36i ◄ r
~ in ~
BXALl FS=18'1 ►5/23/2008 N
30) '<:I'
!I ·5
7/2007 (35) ~ ;.,, \0
1/6 12009 (39) ~ ~
4/12/2008 (41 1 00
~ -~ .::.:: = ~ ~ .... 0 Q. 0
I-< ~
32 34 36 38 40 42 46 WSWM6 Cr est (ft)
Figure 5. Crest to crest curve for Bogalusa, LA to Walkiah Bluff, MS on the Pearl River. Purple markers indicate events with a heavy contribution from the Bogue Chitto River near Bush, LA

Flood Assessment and Management
125
Figure 6. Historical hydrographs indicating the hydrologic contributors at Pearl River, LA on the Pearl River (NWSID PERL1).
Flooding Concerns on the Lower Pearl River Near Walkiah BluffRoberts, Amanda L.
02,.01
•• ••
••
•• •• ,. • •
-• e t/01
: : :
0 .earUUv.el'-Gt..WOlk~I · , ....
-
Pearl River at Pearl River, .A
Bo_gue..Cbitto at B.us h,J. A
Otna
•••
= 0
$TAGC
164-CLl <rS - 11> --. U$UftG cts - ) --...O'Ll <rl - 14 ) --
(rt .. >--crs - ~--
-~
-r ::
- --,
--

Mississippi Water Resources Conference2012
126
Flooding Concerns on the Lower Pearl River Near Walkiah BluffRoberts, Amanda L.
Figure 7. Crest to crest curve for Walkiah Bluff, MS to Pearl River, LA on the Pearl River.
Pearl River ,valkiah Bluff to Pead River
Crest to Crest 48 -.-,=-.:.:.:.:.:.:::.:.:.:.:.:.:.:.:::.:.:.:.:.:.:.:.::r:.:.:.:.:.:.:.:::.:.:.:.::;---,------,------,
Time to Crest (hours) beside date of event. Polynomial best fit line. No Oood stage has been establish ed for WSWM6. Purl)lel)Oints indicate events with heavy
46 - contribu tion fromBSHLl. V
<11/200 • (28./ 44 +----+----+-----+----+----+-~,__-+--------1
)lVl ... ( .,, 42
~ /9/. 010 (17)
,....., 5 ~~~~& t; 3/2, ~008 (20.~ • .,,., 1/15/200 (32) ~40 +----+----+-:-:-c-::--:-::--:-:-:··cf:-:-::-=:----'
0
~"¥-/ "Pr;jtTttl""'""'""tt,---+------1 U 10/21/2009r v , i .1o, .. vv>' l C-J -c 3'11/2008 (14) ::g 9 (2 0) ::> ~
i:: _ .- ~--- -~J 0/2,~ 110) 38 +-----t---i.!'f-:!-lf. •. _~,-Hl_-!fffl_~-,to--V■_>-t-----+----+----+------t
21712007 (20 ~ '. _/llll/ 006(11.5)
11 6/2009 (16) 7
-~2/2008(11) 36 +----+----+---'---'-+----+----+----+-----I
~
~
34 +----+----+-----t-1 ... II
~ -..:I l:t:: ~ ll..
32
8 10 12 14 16 18 20 22 PERL! Ct·est (ft)

Flood Assessment and Management
127
Movement of Agricultural Chemicals and Sediment Through the Lower Mississippi River
Basin During the 2011 Flood, April through JulyHeather Welch, U.S. Geological Survey
Aulenbach, B.; Coupe, R.
Extreme hydrologic events, such as floods, can overwhelm a surface water system’s ability to process agricultural chemicals (nutrients and pesticides) and can move large amounts of sediment downstream to larger surface water bodies. The Mississippi-Atchafalaya River basin drains approximately 41% of the conterminous United States and is the largest contributor of nutrients to the hypoxic zone that develops along the inner continental shelf of the Gulf of Mexico each spring. From March through April 2011, the lower Mississippi River basin received more than five times more precipitation than normal, which combined with snow melt from the upper Mississippi River basin, created a historic flood event that lasted from April through July. The U.S. Geological Survey, as part of the National Stream Quality Accounting Network (NASQAN), collected samples from six sites located in the lower Mississippi-Atchafalaya River basin, as well as, samples from the three flow-diversion structures: the Birds Point-New Madrid in Missouri and the Morganza and Bonnet Carré in Louisiana, from April through July. Samples were analyzed for nutrients, pesticides, suspended sediments, and particle size; results were used to determine the water quality of the river during the 2011 flood. Monthly loads for nitrate, phosphorus, pesticides (atrazine, glyphosate, fluometuron, and metolachlor), and sediment were calculated to quantify the movement of agricultural chemicals and sediment into the Gulf of Mexico. Nutrient loads were compared to historic loads to assess the effect of the flood on the zone of hypoxia that formed in the Gulf of Mexico during the spring of 2011.

Mississippi Water Resources Conference2012
128
Water-quality of the Yazoo River During the 2011 Mississippi River Flood
Marcia S. Woods, U.S. Geological SurveyRose, C.; Coupe, R.
The Mississippi River was above flood stage at Vicksburg, Mississippi, for much of spring 2011. Water samples were collected during this period on a weekly basis from the Yazoo River near Vicksburg, Mississippi, and analyzed for nutrients, sediment, and pesticides as part of a U. S. Geological Survey study to assess water quality of the Mississippi River Basin. High water affected the water quality of the lower Yazoo River, as the Mississippi River stage rose and fell during the flood. Water-quality changes correspond not only to stagnant or reversed flows and accumulation and backwater effects, but also to different sources of water to the Yazoo River before, during, and after the flood. Before the spring 2011 flooding of the Mississippi River, the Yazoo River water came from two sources: the Delta and the Bluff Hills. Along the upper Yazoo River, flood-control structures at Steele Bayou and Little Sunflower Diversion Canal outlets were closed to prevent flooding in the Delta from the Mississippi River; during this time, the Yazoo River source is primarily from the Bluff Hills. During the flood, when the Mississippi River stage was higher than the Yazoo River stage, the Yazoo River flow was impeded and reversed, and mixing of the Mississippi River into the Yazoo River occurred. The Mississippi River was a major source of water to the Yazoo River near Vicksburg during flooding. For much of the 2011 growing season, the control structures along the Yazoo River were closed, thus causing sediment and nutrients to accumulate behind the flood control structures. As the Mississippi River receded following the flood, the flow control structures were reopened, flushing the stagnant and sediment-laden backwater into the Yazoo River, allowing the streams of the Delta to return to normal flow. Following the flood, the Yazoo River water source was primarily from the Delta. The changes in water-quality on the Yazoo River during the 2011 Mississippi River flood can be attributed to the different water sources caused by the flood.

Flood Assessment and Management
129
Flood Inundation Mapping for the Leaf River at the City of Hattiesburg, MS
John Storm, U.S. Geological Survey
Flood forecasting predicts the eventual elevation of a river at a single location during moderate to extreme hydrologic events. Although this provides an understanding of the expected extremity of the flood, it does not give the general public an understanding of which areas will be affected and to what extent. The U.S. Geological Survey (USGS) Mississippi Water Science Center, in cooperation with the City of Hattiesburg, the Forrest County Emergency Management District, the Mississippi Emergency Management Agency, and the National Weather Service (NWS), is preparing a series of static flood inundation maps for the Leaf River at Hattiesburg, MS, based on a one-dimensional steady flow model calibrated to historic and current hydrologic data. The maps will be accessible to the public on USGS and NWS web pages and will provide flood depths and inundated areas at 1-foot increments of forecasted stage at the real-time USGS stream-gaging station 02473000 Leaf River at Hattiesburg, MS. These maps will provide both the public and city officials the ability for better planning and management during extreme flooding events.

Wetlands
Amy B. AlfordMississippi State University
Nutrient Characteristics of Moist-Soil Wetlands in Agriculture Landscapes
Marc A. FosterCypress Environmental Services
Management of Coastal Ecosystem Restoration Sites under Increased Climatic Extremes: Effects of Hurricane Katrina on Wetlands Restoration Projects in Coastal Mississippi
K. Van WilsonU.S. Geological Survey
Sea Level Rise Visualization and Measurements of Subsidence and Accretion Rates for the Alabama, Mississippi, and Florida Coastlines
William B. RothAnchor QEA, LLC
Sea Level Rise Visualization and Measurements of Subsidence and Accretion Rates for the Alabama, Mississippi, and Florida Coastlines
Wet
land
s

Wetlands
131
Nutrient Characteristics of Moist-Soil Wetlands in Agriculture Landscapes
Amy B. Alford, Mississippi State UniversityKröger, R.; Kaminski, R.
In the Mississippi Alluvial Valley (MAV), significant improvements in wetland management strategies have increased the availability of food for wintering waterfowl. Through seasonal drawdown and flooding schedules, moist-soil wetland management encourages growth of annual seed-producing grasses and sedges. Whereas the ecological importance of this conservation strategy is widely known, other environmental benefits, including its effect on water quality, are little understood. To quantify the nutrient exports from these wetlands and therefore explore their potential to improve downstream water quality in the MAV, we implemented a study to compare effluent water quality from runoff events from 5 spatially paired moist-soil wetlands and agriculture fields in Mississippi MAV during October 2010-March 2012. We measured concentrations (mg L-1) of nitrate, NO3-; nitrite, NO2-; ammonium, NH4+; total phosphorus, TP; total dissolved phosphorus, TDP; particulate phosphorus, PP and; total suspended solids, TSS. Mean concentrations of NO3- , TP, PP, and TSS were 91%, 37%, 49%, and 83% lower (P<0.005) in effluent from wetlands than agricultural fields, respectively. Loads (kg) of nutrients discharged from wetlands will be calculated and used to evaluate how moist-soil wetlands in the LMAV aid in meeting Mississippi River and Gulf of Mexico nutrient reduction goals.Key words: Nonpoint Source Pollution, Sediments, Water Quality

Mississippi Water Resources Conference2012
132
Management of Coastal Ecosystem Restoration Sites under Increased Climatic Extremes: Effects of Hurricane Katrina on Wetlands Restoration Projects in Coastal
MississippiMarc A. Foster
Battaglia, L.
Coastal wetland mitigation banks are at the forefront of climate change and are under strict regulatory requirements regarding plant community composition. As effects from climate change intensify, sea level rise and tropical storms may alter the composition of these communities. We measured aspects of plant community structure and diversity at a 382-hectare wetland mitigation bank in southwest Mississippi in 2005-20011. Rapid monitoring assessment with supplemental recording of all species detected was conducted each year at seven pine savanna monitoring plots. The site was in the eye-path of Hurricane Katrina and received over 2.5m of storm surge in August 2005. Multivariate analyses of the understory composition indicated that the high diversity, pre-Katrina community diverged after the storm to a lower diversity subset assemblage. Some recovery through time was evident, although species composition had neither stabilized nor returned to pre-storm conditions by 2011. Richness of savanna forbs dramatically declined following Katrina and has not yet recovered. The assemblages have continued to shift in composition since Katrina, but the eventual state of these systems is not yet known. The reference species composition for a mitigation site is typically strictly defined by regulatory requirements. As a result of tropical storm activity, these coastal ecosystems may be shifting away from fixed reference standards. The likelihood of a major vegetation state change increases as the effects of sea level rise and intensified tropical storm activity become more pronounced along the northern Gulf of Mexico.
Wetlands
133
Sea Level Rise Visualization and Measurements of Subsidence and Accretion
Rates for the Alabama, Mississippi, and Florida Coastlines
K. Van Wilson, U.S. Geological Survey
Coastal communities throughout the U.S. are in the initial stages of planning and/or creating climate adaptation plans. Emergency managers, developers, and the general public have a need to understand the potential effect of a rising sea level, whether the land surface is subsiding or accreting, and how these phenomena may influence plans for developing future critical infrastructure and for habitat restoration and conservation.
The Alabama, Mississippi, and Florida Gulf of Mexico Coastal Internet Map Server (http://gom.usgs.gov/slr/index.html) was developed to provide an interactive online tool for the public to visualize the effects of sea level rise along coastal communities. This server was based an existing server which was built principally to display the maximum storm tide crest resulting from Hurricane Katrina (2005). This server quickly and easily projects 1-, 2-, 3-, 4-, 5-, and 6-ft sea level rises onto a 3-meter digital elevation model constructed from Light Detection and Ranging (LiDAR) data procured before Hurricane Katrina for Alabama and Mississippi and after Katrina for Florida from the Alabama line to the east side of the St. Marks National Wildlife Refuge, east of Apalachicola, Florida.
To determine rates of land surface subsidence or accretion due to sea level changes, surface Elevation Tables (SETs) were installed (and readings began) in late 2010 at six sites along the Mississippi and Alabama coasts. Each site has four SETs dispersed within the local area of the site. Three years of data will be collected to provide an estimate of the current rates of subsidence or accretion in the coastal marshes by comparing the leveling rates of vertical displacement to established National Geodetic Survey benchmarks.ls

Mississippi Water Resources Conference2012
134
Beneficial Use at Deer Island: A Decade of Design and Implementation
William B. Roth, Anchor QEA, LLCMears, W.; Keith, D.; Ramseur, G.
Deer Island, just offshore of Biloxi, Mississippi, provides habitat for native fish and bird species and wintering sites for migratory birds, and the nearshore area is utilized by recreational fishermen throughout the year.
In response to the continual shoreline land-loss at the island, a beneficial use (BU) site at Deer Island was completed in 2003 as a joint effort between the State of Mississippi Department of Marine Resources (MDMR) and the U.S. Army Corps of Engineers (USACE), Mobile District using dredged materials to restore some of the lost habitat. The BU site was designed to restore 52 acres of the island’s intertidal marsh and chenier using 400,000 cubic yards (CY) of dredged material. In 2005, Hurricane Katrina destroyed a significant portion of the restoration area; erosion of the interior marsh area has continued since that time.
Utilizing lessons learned from during and after the construction of the 2003 BU site at Deer Island, new design concepts were developed for the repair and expansion of the site. A containment berm will be constructed along the northern shoreline of the island. Approximately 350,000 CY of dredged material will initially be placed into the existing and new expansion BU areas. The material will be placed at numerous discharge locations within the containment areas to create variation in the finished elevation and to enhance habitat diversity. The western alignment of the containment and control berm will be left open to promote circulation and habitat formation as the dredged materials consolidate. The “open-ended” design will also allow for future expansion of the site.
With the implementation of Mississippi State Law § 49-27-6161, planners, engineers, and contractors participating in design efforts involving excavation of marine sediments in the State now have an obligation to integrate BU of dredged material as a placement option. Proposed BU locations, including Deer Island, along with the sediment testing guidance is presented in the Master Plan for the Beneficial Use of Dredged Material for Coastal Mississippi1 (the Master Plan). Developing and implementing the Master Plan provides a starting point for future maintenance and new work dredging projects in Mississippi, with a global goal to retain this valuable resource within the coastal estuarine environment.

Wetlands
Giusy PappalardoUniversity of Catania
Laymen, Experts, NGOs, and Institutions in Watershed Management
Ron KillebrewMississippi Department of Environmental Equality
Management Challenges for Deer Creek in the Mississippi Delta
Richard A. RebichU.S. Geological Survey
Results of Regional SPARROW Models for Selected Watershed in Mississippi
Mike DanielsUniversity of Mississippi
The Arkansas Discovery Farms Program
Ethan MowerMississippi State University
Rule Curves in Flood Control Reservoirs: A Historical and Procedural Analysis
Elizabeth UsborneMississippi State University
Preliminary Sediment Accumulation and Phosphorus Retention Behind Low Grade Weirs in the Mississippi Delta
Matthew B. HicksU.S. Geological Survey
Monitoring Success of Mississippi’s Delta Nutrient Reduction Strategies
Wat
ersh
ed M
anag
emen
t

Mississippi Water Resources Conference2012
136
Laymen, Experts, NGOs, and Institutions in Watershed Management
People's activities and behaviors are deeply related with water and ecosystems: the relationship between hu-man communities, their places of life, and nature has always been a challenging issue, like Ian McHarg explains in 1969, inspiring many scholars' works. A question is open: who is part of human communities?
It is possible to identify some groups of people: inhabitants, with their direct experiences of their native lands (laymen); researchers and practitioners, with scientific tools to understand and to design lands (experts); sup-porters of specific interests and hopes (NGOs); environmental authorities, with their responsibility in managing lands (institutions). They have different knowledge, roles, interests, and expectations and, according to Fisher, everybody should be allowed to participate into the decision-making process about environmental matters.
Elinor Ostrom also underlines the necessity of collaboration between different people and institutions to man-age Common Goods, like rivers, rich soil, and hydraulic infrastructures.
Starting from this framework, this paper has an overall goal: to identify how do laymen, experts, NGOs, and institutions work together in managing their places of life. The main question is: how to establish a sort of deal among them, focused on watershed management, to experience collaborative practices able to affect every-day life styles toward a responsible use of resources and better water quality? Even if every context has its own peculiarities, it is useful to learn from different experiences. In Italy, these kinds of deal are experimental practices called River Agreements: they still are not so common, and in Sicily there is an ongoing process to define and to build a River Agreement for the Simeto Watershed. It is a Participatory Action Research (PAR) pro-cess, i.e. a deep collaboration between scholars and associations' activists to help local communities (Whyte), and I am directly involved in the process as researcher. So I am studying some Cases in the United States, focus-ing on Mississippi State, to give an input to the process. The Case Study Method is a useful tool for PAR process-es, to help participants in visualizing possible alternatives (Francis).
Through some Case Studies in Mississippi, chosen to answer the main question, this paper also will support the ongoing process in Sicily: it will be translated and shared with other participants through focus groups, public presentations and a web site under construction, as an opportunity for collective learning and education.

137
Watershed Management
Management Challenges for Deer Creek in the Mississippi Delta
Ron Killebrew, Mississippi Department of Environmental Quality
Rivers and central are paramount to surface water ecosystems. Many characteristics differentiate lake ecosystems from running water. Areas with flowing freshwater are called lotic (lotus, from lavo, to wash) and water moves along a slope in response to gravity. Lotic ecosystems are contrasted to lentic (lenis, to make calm) or lake ecosystems. Most lakes are open and have distinct flows into, through, and out of their basins. Throughflows, called water renewal rates, are often variable and slow in lakes but are continuous.
The distinction between running waters and lakes focuses on the relative residence times of the water. The importance of variable but continuous and rapid throughput of water and materials contained within is evident in the biology of most organisms living in running waters. When the energy of flowing water is dissipated, like it does in the transitional zone of reservoirs, the change to lentic characteristics is rapid.
How does one manage a water body that, for most of the year, is neither stream nor lake? Deer Creek in the Mississippi Delta is more like the Dead Sea in many respects. For much of the year it has no outflow and very little inflow. Deer Creek has a very small basin area because it is a perched water body.
This presentation will provide a glimpse into the many challenges of balancing the needs of the water body inhabitants with the needs or desires of the people who live along the water body.

Mississippi Water Resources Conference2012
138
Results of Regional SPARROW Models for Selected Watershed in Mississippi
Richard A. Rebich, U.S. Geological Survey
SPARROW (SPAtially Referenced Regressions On Watershed attributes) models were developed by the U.S. Geological Survey to estimate nutrient inputs (total nitrogen and total phosphorus) to the northwestern part of the Gulf of Mexico from streams in the South-Central United States. These models included drainages in Mississippi: the Yazoo River Basin, the Big Black River Basin, and the South Independent Streams. The models were standardized to reflect nutrient sources and stream conditions during 2002.
Model results indicated that total nitrogen yields in the Yazoo River Basin generally were higher in the lower part of the Basin (an area locally referred to as the Delta) than in the upper part. Although total phosphorus yields generally were higher in the Delta than in the upper part of the Yazoo River Basin as well, yields also were high along the bluff hill area of the Basin prior to entry into the Delta area. The primary source of nitrogen and phosphorus in the Yazoo River Basin was fertilizer. Model results indicated that total nitrogen and total phosphorus yields in the Big Black River Basin were highest in the lower part of the Basin. Wet deposition of total inorganic nitrogen was the largest nitrogen source in the Big Black River Basin; for phosphorus, however, there were no dominant sources. Nitrogen yields generally were highest for areas adjacent to the Mississippi River levee and southern State boundary for the South Independent Streams Basin, whereas phosphorus yields generally were highest for areas adjacent to the Mississippi River levee. The primary source of nitrogen in the South Independent Streams Basin was wet deposition of total inorganic nitrogen; there were no dominant sources of phosphorus.
The SPARROW Decision Support System (DSS) is an online interactive tool created for these and other SPARROW models so that water managers, researchers, and the general public can have access to results for a variety of uses. Users can map loads, yields, concentrations, and sources by stream reach and catchment; track transport to downstream receiving waters, such as estuaries and reservoirs; evaluate management scenarios such as source reductions; and overlay other sources of information such as land use, states, counties, and hydrologic units. The SPARROW DSS is located at: http://cida.usgs.gov/sparrow/index.jsp .

139
Watershed Management
The Arkansas Discovery Farms ProgramMike Daniels, University of Arkansas
Andrew Sharpley, Chris Henry, Pearl Daniel and Sarah Hirsh
IntroductionThe Arkansas Discovery Farm (ADF) program uses a unique approach based on agriculture producers, scientists and natural resource managers working jointly to identify issues and potential solutions. The Arkansas Discovery Farm strives to collect economic and environmental data to better define sustainability issues and find solutions that promote agricultural profitability and natural resource protection. The program uses extensive and state-of-the-art water quality monitoring systems installed on real, working farms to document environmental and natural resource impact and to investigate solutions to reduce off-farm impacts. The overall goal of the program is to document sustainable and viable farming systems that remain cost-effective in an environmentally sound manner. The following objectives would be applied to each farm:
1. Conduct on-farm research and monitoring to assess the need for and effectiveness of best management practices (BMPs). This will also help determine individual and synergistic nutrient and sediment loss reduction efficiencies and water conservation.
2. Provide on-farm verification and documentation of nutrient and sediment loss reductions and water conservation in support of nutrient management planning and sound environmental farm stewardship.
3. Develop and deliver educational programs from on-farm data that will assist producers in achieving both production and environmental goals in support of sustainable farming in Arkansas.
The program is based on following four cornerstones; 1) sound science, 2) unbiased,
Discovery Farms are privately owned farms that have volunteered to help with on-farm research, verification, and demonstration of farming's impact on the environment and natural resource sustainability. We currently have six Discovery farms in five counties of Arkansas; including a poultry farm in Washington County, a beef cattle operation in Conway County, a rice-soybean and corn operation in Arkansas County, two adjacent rice-soybean operations in Cross County and a cotton farm in Desha County. We collect water use and water quality data from several fields on each of these farms, utilizing automated ISCO samplers equipped with rain gauges, sensor equipped edge-of-field H-flumes, pipes or weir flow structures. In Washington County, we are monitoring runoff originating immediately near poultry houses due to concerns with spillage of litter during bird removal and house clean out, as well as dust accumulation from tunnel ventilation. We are also quantifying the nutrient and sediment remedial efficiencies of capturing runoff in a farm pond and an un-grazed grass filter strip. In Conway County, we are assessing runoff from pastures and the ability of a wetland to capture and as-similate nutrients. In Arkansas County, we are examining whole farm water management three 80-acre rice and soybean fields with different irrigation scheduling and nutrient management practices, a corn field, and runoff from 1,200 acres that drains back to an irrigation reservoir. In Cross County, we are monitoring a 65-acre rice and soybean field under conventional production, and a 23-acre soybean field and 105-acre soybean field under conservation tillage. Finally, in Desha County, we are monitoring the effects of conservation tillage and cover crops on nutrient and sediment loss from four fields in cotton. However, the Arkansas Discovery Farms program is not just about monitoring but just as importantly, empowering farmers to proactively address envi-ronmental concerns. This paper discusses the development, guidance, principals and goals of the Arkansas Discovery Farm program.

Mississippi Water Resources Conference2012
140
research-based, 4) stakeholder driven transparency and 5) partnerships.
1. Sound science The case of relating runoff from agricultural operations to in-stream water quality data is not as clearly defined as very few studies have been designed to monitor runoff from real, working farms in Arkansas and track these losses through drainage networks to in-stream monitoring sites in Arkansas. Thus determining cause and effect relationships between agriculture and in-stream water quality is difficult due to this void in data. This knowledge gap has been the primary catalyst that makes water issues related to agriculture controversial and emotional. The Discovery Farm approach strives to collect data from real, working farms to help base decisions on sound science rather than emotion.
Runoff and water use studies on real, working farms typically do not conform to the traditional statistical approaches used in other aspects of agricultural research due to the nature of the issue and the cost of state-of-the-art automated water quality sampling. Edge of field monitoring of runoff from the entire field (management unit) is a more appropriate scale rather than traditional small plots to study the effects of management practices on water use and quality as well as other hydrologically related processes.
Thus replicated plot designs do fit the sampling protocol. We typically equip three to four sites (fields) with monitoring stations which allows us to conduct field by field comparisons or compare two to three scenarios with a control site. In this manner, we can look at a singular issue such as water management, tillage, or crop rotation. Because we conduct this research on real-working farms at a field-scale, we cannot predetermine what factors to investigate without first meeting with the host farmer and conducting a thorough farm reconnaissance and developing a research plan that both applies directly to the participating farm, but where results can also applicable to the peers and the region.
2. Unbiased, Research-basedThe concern over potential water quality impacts originating from agricultural operations has prompted much controversy and has created a sometimes emotional issue among agricultural producers who feel they have been unfairly targeted. Under the Clean Water Act, the Arkansas Department of Environmental Quality (ADEQ) as well as the United States Geological Survey (USGS) have collected considerable in-stream water quality data (ADEQ, 2012; USGS, 2012) and the Arkansas Natural Resources Commission (ANRC) and USGS have developed a network of groundwater wells in Eastern Arkansas to monitor declining groundwater levels (ANRC, 2012). In the case of groundwater, it is generally accepted by all stakeholders that irrigation is the primary user of groundwater in critical groundwater areas of Eastern Arkansas.
Each monitoring station is equipped with a flow outlet structure such as a flume or weir so that runoff volume can be measured either by a flow stage pressure transducer or a flow velocity profiler (Figure 1). At each station, an ISCO 6712® automated water sampler equipped with a weather station is housed in a storage unit and will automatically collect water samples at pre-programmed intervals once water flow is detected at the flume or weir so that a representative, composite sample can be collected over the course of a runoff event (Figure 2). For example, each sampler is programmed to collect one hundred, 100 milliliter (mL) samples integrated across various stages of the flow hydrograph, or up to a total of 10 liters during each runoff event. Each sample is collected and analyzed following protocol set forth by the USEPA for suspended solids, sediment, nitrogen and phosphorus. Runoff volume is calculated from pressure transducer measurements or velocity flow measurements using the appropriate equations that describe the type of flow structure (weir, flume, pipe, etc.). Flow-weighted concentrations are calculated to determine loads (mass) lost in runoff from fields.
The Arkansas Discovery Farms ProgramDaniels, Mike
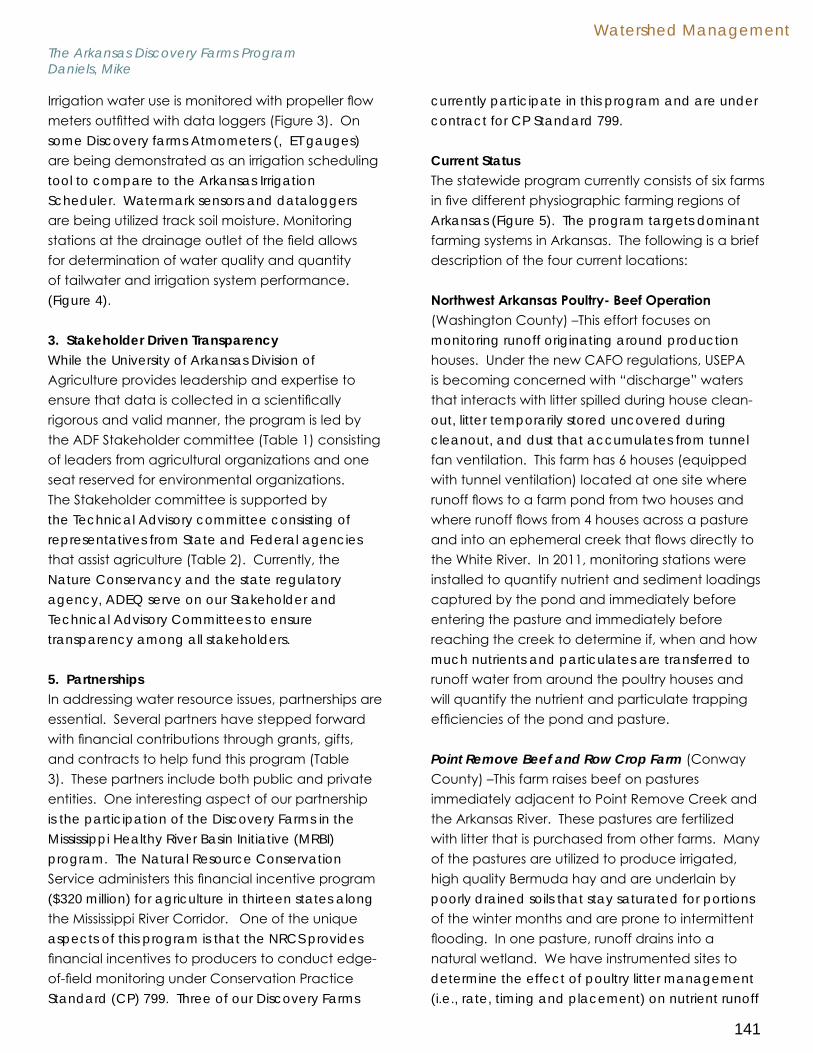
141
Watershed Management
Irrigation water use is monitored with propeller flow meters outfitted with data loggers (Figure 3). On some Discovery farms Atmometers (, ET gauges) are being demonstrated as an irrigation scheduling tool to compare to the Arkansas Irrigation Scheduler. Watermark sensors and dataloggers are being utilized track soil moisture. Monitoring stations at the drainage outlet of the field allows for determination of water quality and quantity of tailwater and irrigation system performance. (Figure 4).
3. Stakeholder Driven TransparencyWhile the University of Arkansas Division of Agriculture provides leadership and expertise to ensure that data is collected in a scientifically rigorous and valid manner, the program is led by the ADF Stakeholder committee (Table 1) consisting of leaders from agricultural organizations and one seat reserved for environmental organizations. The Stakeholder committee is supported by the Technical Advisory committee consisting of representatives from State and Federal agencies that assist agriculture (Table 2). Currently, the Nature Conservancy and the state regulatory agency, ADEQ serve on our Stakeholder and Technical Advisory Committees to ensure transparency among all stakeholders.
5. PartnershipsIn addressing water resource issues, partnerships are essential. Several partners have stepped forward with financial contributions through grants, gifts, and contracts to help fund this program (Table 3). These partners include both public and private entities. One interesting aspect of our partnership is the participation of the Discovery Farms in the Mississippi Healthy River Basin Initiative (MRBI) program. The Natural Resource Conservation Service administers this financial incentive program ($320 million) for agriculture in thirteen states along the Mississippi River Corridor. One of the unique aspects of this program is that the NRCS provides financial incentives to producers to conduct edge-of-field monitoring under Conservation Practice Standard (CP) 799. Three of our Discovery Farms
currently participate in this program and are under contract for CP Standard 799.
Current StatusThe statewide program currently consists of six farms in five different physiographic farming regions of Arkansas (Figure 5). The program targets dominant farming systems in Arkansas. The following is a brief description of the four current locations:
Northwest Arkansas Poultry- Beef Operation (Washington County) –This effort focuses on monitoring runoff originating around production houses. Under the new CAFO regulations, USEPA is becoming concerned with “discharge” waters that interacts with litter spilled during house clean-out, litter temporarily stored uncovered during cleanout, and dust that accumulates from tunnel fan ventilation. This farm has 6 houses (equipped with tunnel ventilation) located at one site where runoff flows to a farm pond from two houses and where runoff flows from 4 houses across a pasture and into an ephemeral creek that flows directly to the White River. In 2011, monitoring stations were installed to quantify nutrient and sediment loadings captured by the pond and immediately before entering the pasture and immediately before reaching the creek to determine if, when and how much nutrients and particulates are transferred to runoff water from around the poultry houses and will quantify the nutrient and particulate trapping efficiencies of the pond and pasture.
Point Remove Beef and Row Crop Farm (Conway County) –This farm raises beef on pastures immediately adjacent to Point Remove Creek and the Arkansas River. These pastures are fertilized with litter that is purchased from other farms. Many of the pastures are utilized to produce irrigated, high quality Bermuda hay and are underlain by poorly drained soils that stay saturated for portions of the winter months and are prone to intermittent flooding. In one pasture, runoff drains into a natural wetland. We have instrumented sites to determine the effect of poultry litter management (i.e., rate, timing and placement) on nutrient runoff
The Arkansas Discovery Farms ProgramDaniels, Mike

Mississippi Water Resources Conference2012
142
from pasture and to quantify the wetland’s ability to capture and store nutrients and sediment by monitoring runoff entering the wetland.
Cherry Valley Rice-Soybean Rotation (Cross County): Two farms adjacent to the L’Anguille River, one on the east side and one on the west side of the River, were selected as they offer a contrast in conservation practices. One uses conventional tillage and water management for the area, while the other uses conservation tillage and has implemented switch grass filters between the river and fields via Conservation Reserve Program (CRP). These farms are located in a recently declared as a Critical Groundwater area by the ANRC. Because fields in the study region are not candidates for leveling due to cost and the risk of exposing underlying soil horizons that are detrimental to crop production, flood irrigation is still the preferred irrigation method for soybeans. The conventional site uses ground water as an irrigation source, while the conservation site uses a combination of surface sources (re-lift from the L’Anguille) and wells. Through the MRBI, the conservation site has been approved for reservoir construction. Runoff from two fields on this farm will be monitored; for one field, traditional flood irrigation is used for both rice and soybean and drains through a switch grass border and on the other field furrow irrigation is used for soybeans and runoff will eventually be captured by a new tail-water recovery system and reservoir. By monitoring runoff, nutrients, and sediment from the two adjacent rice-soybean systems, we will be able to determine the effect of conservation management on nutrient and sediment losses.
Rice-Soybean Rotation (Arkansas County): This farm has been in a Critical Groundwater decline area for several years. The farm no longer has active irrigation wells in the shallow alluvial aquifer. It does have one well in the deeper (>600 ft) Sparta aquifer but pumping costs render it for emergency use only. The entire farm is irrigated using an on-site surface water reservoir, and all water draining from the farm is captured via tail-water recovery
systems and returned to the reservoir. This farm represents a unique opportunity to highlight reuse of water, an issue of national prominence across all sectors of society across the Nation. We have 5 stations to monitor water use and runoff water quality under: 1) rice-soybean rotation on a zero-grade field; 2) rice-soybean rotation on non-graded field (conventional); 3) corn production on precision-graded field; 4) rice-soybean rotation on a precision-graded field; and 5) at the central drain for the entire farm, where runoff drains back to the reservoir. With the this last station we can assess water reuse and nutrient and sediment loss at a farm scale.
Cotton, Corn and Soybean Production (Desha County): This farm grows cotton, corn and soybeans in southeastern Arkansas. We have installed automatic water samplers so that we can monitor the inflow and outflow in four fields where cotton and corn are in rotation. This farm is located in a current groundwater decline study area where intensive groundwater well monitoring is being conducted by the State to determine if the area needs to be declared as a “Critical Groundwater Area” where producers will have to report groundwater withdraw to the State.
Expected Results / ImpactDocumenting environmental impacts of Arkansas farming systems, as well as evaluating the efficacy and cost-effectiveness of alternative practices, will bridge a knowledge gap that now keeps farmers, natural resource managers and decision-makers alike from confidently taking effective actions that ensure both economic and environmental sustainability. This program, as well as the formation of strong partnerships, has the potential to affect millions of agricultural acres across the state. Program results will also give all of us the confidence that we are doing our part to maintain safe and affordable food supplies while protecting our natural resources for future generations of Arkansans.
The Arkansas Discovery Farms ProgramDaniels, Mike
143
Watershed ManagementThe Arkansas Discovery Farms ProgramDaniels, Mike
ReferencesThe Arkansas Department of Environmental Quality. 2012. The 2010 List of Impaired Waterbodies. Available on July 15, 2012 at http://www.adeq.state.ar.us/water/branch_planning/pdfs/303d_list_2010.pdf
The Arkansas Natural Resources Commission. 2012. The 2011 Arkansas Ground-Water Management and Protection Report. Available on July 15, 2012 at http://www.anrc.arkansas.gov/groundwater/2011_gw_report.pdf
The Natural Resources Conservation Service. 2009. Mississippi River Basin Healthy Watershed Initiative. Available on July 15, 2012 at http://www.nrcs.usda.gov/Internet/FSE_DOCUMENTS//nrcs143_008142.pdf
The United States Geological Survey Real-Time Water Data for Arkansas. 2012. Available on July 15, 2012 athttp://waterdata.usgs.gov/ar/nwis/current/?type=quality&group%20Key=basin%20cd
Table 1. Members of the Arkansas Discovery Farm Stakeholder Involvement Committee.Member AffiliationWoody Bryant (Chair) Arkansas Dairy ProducerAndrew Wargo (Liaison) Arkansas Association of Conservation DistrictsTerry Dabbs Arkansas Farm BureauJennifer James USA Rice FederationAdam McClung Arkansas Cattlemen’s AssociationScott Simon Arkansas Nature ConservancyGene Pharr Poultry ProducersDennis Sternberg Arkansas Rural Water AssociationSteve Stephan Arkansas Pork Producers AssociationBrad Doyle Arkansas Soybean AssociationMax Braswell Arkansas Forestry AssociationAndrew Grobmeyer Arkansas Ag. Council

Mississippi Water Resources Conference2012
144
The Arkansas Discovery Farms ProgramDaniels, Mike
Figure 1. Various flow structures used in the Arkansas Discovery Farm program to quantify runoff volume: a) 3.5 foot h-flume to collect runoff from around poultry houses, b) culvert under cattle crossing to collect runoff from pasture (Manning’s Equation), c) rectangular weir in fice field (also flood depth control and d) monitoring open channel pipe flow from soybean field; sampling strainer and pressure transducer are also shown for collecting water samples.

145
Watershed Management
Figure 2. ISCO 6712® automated water quality sampler and associated rain gauge.
The Arkansas Discovery Farms ProgramDaniels, Mike

Mississippi Water Resources Conference2012
146
The Arkansas Discovery Farms ProgramDaniels, Mike
Figure 3. Irrigation flow meter equipped with data logger to monitor irrigation quantity.

147
Watershed ManagementThe Arkansas Discovery Farms ProgramDaniels, Mike
Figure 4. Evapotranspiration (ET) gauge equipped with data logger to estimate daily ET values and to schedule irrigation.

Mississippi Water Resources Conference2012
148
The Arkansas Discovery Farms ProgramDaniels, Mike
Figure 5. Location of the Arkansas Discovery Farms.
Elkins
Poultry – beef
Cherry Valley
SSooyybbeeaann,, wwhheeaatt,, rriiccee
Morrilto
n
BBeeeeff
SSttuuttttggaarrtt
RRiiccee,, ssooyybbeeaann,, ccoorrnn
DDuummaass
CCoottttoonn && ccoorrnn

149
Watershed Management
Rule Curves in Flood Control Reservoirs: A Historical and Procedural Analysis
Ethan Mower, Mississippi State UniversityMiranda, L.
The U.S. Army Corps of Engineers (USACE) manages 11 million ha of federal land and water including hundreds of multi-purpose reservoirs. Managing the water regime in many of these reservoirs requires establishing seasonal targets in water levels (i.e. rule curves) that are dependent on regional precipitation patterns and water demands from user groups. Rule curves in Northern Mississippi reservoirs were established in 1967 as an answer to increased interest in multi-purpose water storage. Rule curves have been modified in past years attempting to balance various environmental concerns such as emphasis on fish and wildlife management mandated in USACE reservoirs by federal legislation, and water needs such as flood control and agriculture use. The processes and challenges associated with developing and amending rule curves are complicated and generally unknown to most fish and wildlife managers and user groups. Informing managers and user groups about the process required could lead to effective communication, management, research, and collaboration. Thus we sought to review the processes, policies and laws the USACE follows in developing and amending rule curves that govern water levels, focusing on the four large flood control reservoirs in the Upper Yazoo Basin. To this end we reviewed the history of the rule curves, as well federal policies and laws governing them. We obtained our information from a literature review and interviews with agency personnel having current or past involvement in managing these flood control reservoirs. Congressional authorization, feasibility studies and justification studies are some requirements that must be met before a rule curve can be established or modified. National Environmental Policy compliance must be shown, as well as flood risk impacts both upstream and downstream for flood control reservoirs. Magnitude of the rule curve change determines congressional involvement in amending rule curves. Although our results are preliminary, they provide a window into a little-understood but important component of fish and wildlife management in reservoirs.

Mississippi Water Resources Conference2012
150
Preliminary Sediment Accumulation and Phosphorus Retention Behind Low Grade Weirs
in the Mississippi DeltaElizabeth Usborne, Mississippi State University
Kröger, R. Agricultural phosphorus (P) loads, carried by surface runoff through ditches, contribute to eutrophication. Low grade rip rap weirs potentially reduce P from entering primary aquatic systems by slowing water flow through drainage ditches, allowing sediments to settle out and P to sorb to soil. Due to the relatively new application of weirs in Lower Mississippi Alluvial Valley drainage ditches, their effects over time are not understood. Weirs have the potential to alter the pH and hydraulic residence time within the ditch system, thereby affecting P retention by ditch soils. Three weirs and a control have been monitored monthly from the time of installation for one year in order to track changes in P bioavailability ratios and sediment deposition rates. Sediment depth was recorded using a permanent reference marker located behind the weir and P fractions were measured on collected sediment samples. Loosely bound P and iron phosphate were considered bioavailable while reductant-soluble P and aluminum phosphate were considered non-bioavailable. Locations that are losing sediment coincide with increasing bioavailability ratios and locations that are accumulating sediment have declining bioavailability ratios. Predicting time periods between soil P saturation and sediment accumulation limits will allow us to inform farm managers of optimal times to dredge ditches for greatest phosphorus retention efficiency.

151
Watershed Management
Preliminary Sediment Accumulation and Phosphorus Retention Behind Low Grade Weirs
in the Mississippi DeltaMatthew B. Hicks, U.S. Geological Survey
Stocks, S.; Wright, J. Nutrient reduction strategies are being implemented in northwestern Mississippi, an area locally referred to as the Mississippi Delta, in response to Action Plans of the Mississippi River/Gulf of Mexico Hypoxia Task Force and the Gulf of Mexico Alliance, which call for reduction of nutrients to the Gulf of Mexico. As part of the nutrient reduction efforts, it is important to understand and answer several key questions such as what level reductions are achievable and what reductions are required to protect the health of Delta waters. To gain a scientific understanding of these questions, a comprehensive monitoring and data collection plan was developed by a consortia of Federal, State, and local agencies and is being applied throughout the Delta. Monitoring will document changes in nutrient concentrations and loads that occur at each of three nested scales—edge-of-field, in-stream, and outlet of the watershed —following the implementation of a suite of BMPs.
As part of the implementation of the comprehensive plan, the U.S. Geological Survey began monitoring in the spring of 2010 in selected Delta watersheds and will continue for several years to detect changes over time. Two of the watersheds where monitoring is taking place include Harris Bayou and Porters Bayou in the upper part of the Big Sunflower River Bain. Implementation of best management practices (BMPs) is complete in Harris Bayou watershed, and post-implementation monitoring has begun. Pre-implementation monitoring is continuing in Porters Bayou as implementation of BMPs has yet to begin.
Monitoring in these watersheds includes collection of flow and water-quality samples throughout the entire year, during storms and on a regular fixed schedule. To evaluate changes, a before-and-after and a paired-watershed approach are being used. Ecosystem characteristics being monitored and evaluated include, but are not limited to, various physical, chemical and biological properties such as nutrient concentrations, sediment concentrations, dissolved oxygen dynamics, chlorophyll-a concentrations, streamflow, physical habitat, and biological community assemblages.

Mississippi Water Resources Conference2012
152
Education
Brad MaurerThe Nature Conservancy
The Buttahatchie River Stabilization Project
Jeff HattenMississippi State University
Sources and Yield of Particulate Organic Carbon and Nitrogen in Managed Headwaters of Mississippi
Caroline AndrewsMississippi State University
Predicting Nitogren and Phosporus Concentrations using Chlorophyll-a Fuorescence and Turbidity
Christine Q. SurbeckUniversity of Mississippi
Water Quality in Sardis Lake: A Multi-Variate Statistical Method for Analysis of Temporal and Spatial Trends
Non
-Poi
nt S
ourc
e A
sses
smen
t

Non-Point Source Assessment
153
The Buttahatchie River Stabilization ProjectBrad Maurer, The Nature Conservacy
The Buttahatchie River watershed is recognized by local and regional scientists, conservationists, and outdoors people for its ecological significance, especially the unique biological diversity found and documented in this system (Mississippi Museum of Natural Science, 2005). Mussel surveys, conducted by O'Neil et al (2004; 69 FR 40084), and the Mississippi Department of Wildlife Fisheries and Parks (2004) have documented viable communi-ties of rare mussel species along several reaches of the Buttahatchie River and some of its major tributaries. In addition, rare and unique fish communities and species have been reported from the Buttahatchie River system (Mississippi Museum of Natural Science, 2005). In an unpublished survey (Hicks 2004) of 23 biological experts in Mississippi, the Buttahatchie River ranked second behind the Pascagoula River out of 14 rivers in Mississippi in terms of priority for conservation and ecological significance (Mississippi Museum of Natural Science, 2005).
However, the lower reaches of the river have undergone wholesale channel adjustments in recent years, in-cluding widening, rapid erosion, quarry capture, and excess sediment. Erosion and excess sediment continue to be a problem in this area. The Stability Analysis of the Buttahatchie River by USDA National Sedimentation Laboratory (2005) cites disturbances including meander cutoffs, construction of the Tennessee-Tombigbee Wa-terway (including the impoundment of the Columbus pool), and gravel-mine capture.
The Buttahatchie River Stabilization Project was completed by The Nature Conservancy and partners in Oc-tober, 2010 , to demonstrate techniques to reduce non-point source (NPS) pollution within the Buttahatchie River Watershed, specifically NPS resulting from eroding river banks. The project was supported by a Section 319 Grant, and used several Best Management Practices (BMPs) designed to show habitat-oriented options to river-bank stabilization. Located in Lowndes County, Mississippi, the project met several important goals. Most imme-diately, it stabilized a rapidly eroding river bank and prevented thousands of cubic yards of soil from washing into the river. In the long term it is expected that the river bed in this area will also become more stable, and this will allow for improved habitat for fish, aquatic invertebrates, mussels, and other benthic organisms.
It also created an open-air educational site that demonstrates several useful stabilization BMPs and sets of tech-niques. This unique setting allows for the comparison of various techniques in one location.
The presentation will describe the individual BMPs, their installation process, and the resulting improvements to the river bank.

Mississippi Water Resources Conference2012
154
Sources and Yield of Particulate Organic Carbon and Nitrogen In Managed
Headwaters of MississippiJeff Hatten, Mississippi State University
Dewey, J.; Mangum, C.; Choi, B.
Managed, forested headwaters in Mississippi constitute a crucial part of watershed dynamics because they comprise more than 60-80% of stream networks and watershed land areas. Headwater streams contribute particulate forms of organic carbon (POC) and nutrients such as nitrogen (PON) to downstream fluvial environments. Flux of these materials from headwaters is difficult to quantify and few studies have examined their source. In particular, the relationships among origin and export of particulate organic carbon and nitrogen with stream discharge represent significant gaps in our understanding of headwater processes. POC and N serve vital function as a regulator of bacterial productivity, dissolved oxygen concentrations, nutrient cycling, and food web productivity however excess terrestrial input of POC and N can contribute to eutrophication and hypoxia in waters that are deficient in DO. This project augments current research efforts concerning hydrologic and hydrologically-mediated functions in managed, forested headwaters of Mississippi. This study quantifies the yield, source, and transport of POC and N within managed watersheds in order to better constrain the flux of OC, nutrients, and contaminants that bind to OM. Objectives are to (1) quantify exports of sediment, POC , and PON, (2) determine whether C and N are derived from a similar source using stable isotope ratios, and (3) determine whether additional process are occurring at a larger scale. Preliminary data linking suspended sediments to soils from 15 months of sampling across four management intensities will be presented. These data will be of value to forested-watershed managers in their efforts to weight the environmental cost vs. nutrient cycling benefit of organic inputs resulting from silvicultural activities.

Non-Point Source Assessment
155
Predicting Nitrogen and Phosphorus Concentrations using Chlorophyll-a
Fluorescence and TurbidityCaroline Andrews, Mississippi State University
Kröger, R.; Miranda, L.
IntroductionHigh sedimentation and nutrient loading is a major issue leading to undesirable water quality conditions, especially in extensive agricultural systems (Turner and Rabalais 2003). Eutrophication in both inland and coastal systems has shown to be deleterious to aquatic ecosystem functioning (Dodds and Whiles 2010). Controlling excess nutrients such as phosphorus and nitrogen can slow eutrophication, but is difficult due to their ubiquitous presence in the landscape. With the development of regional and state specific nutrient criteria to meet EPA regulations and promote well-functioning ecosystems and maintain waters for designated uses, monitoring efforts will be an essential need for water quality programs and will aid in better understandings of nutrient movement across the landscape over time. In the Mississippi Alluvial Valley (MAV), high ranges in observed
nutrient conditions can be even more challenging to understand as they may often produce desirable ecological communities (FTN Associates 2007). There are hundreds of small water bodies scattered across the MAV, and, because of this abundance, monitoring each individual body can be expensive and impractical. Predicting nutrient concentrations through monitoring of alternate parameters may provide a way to reduce such costs.
Measuring a response variable such as phytoplankton biomass, which could represent an elevated nutrient concentration, can make monitoring more efficient. Phytoplankton-nutrient relationships for both phosphorus and nitrogen are well established (Dillon and Rigler 1974; Jones and Bachmann 1976; Watson et al. 1992; Brown et al. 2000; Jones and Knowlton 2005; Phillips et al. 2008). In Mississippi, however, these relationships across
Agricultural practices and land modification introduce excess nutrient and sediment loads into inland watersheds. Modification of tributary streams and rivers within these watersheds decreases the ability of floodplains to respond to increased loads. Therefore, large amounts of nutrients and sediments are transferred to coastal aquatic systems. Aquatic systems are facing increased nuisance algal growth and premature senescence leading to hypoxic conditions, threatening recreational and commercial fish yields. Furthermore, sedimentation and turbidity create intolerant conditions for aquatic organisms, and can trap phosphorus in these systems. To address these issues, states are developing nutrient criteria for inland waters. As inland water bodies are numerous, the usefulness of such criteria is dependent on efficient monitoring. We investigated the potential use of a handheld chlorophyll-a (chl-a) fluorometer as an estimator of total phosphorus (TP) and total nitrogen (TN) in oxbow lakes of the Mississippi Alluvial Valley. Several adjustments were explored to improve the ability of the fluorometer to accurately represent chl-a. Past studies in Mississippi lakes have shown a poor relationship between TP and chl-a (r2 = 0.18), but a moderate relationship between TN and chl-a (r2 = 0.53). The poor TP-chl-a relationship is partially attributable to naturally high levels of phosphorus and turbidity in the region. We found the relationships between chl-a and nutrient concentrations were improved in oxbow lakes; adding covariates such as turbidity and suspended solids further improved predictability. Estimating TP and TN with in-situ handheld-meter measurements of chl-a supplemented with measures of suspended solids may, in many cases, be adequate for temporal or spatial monitoring of nutrients in oxbow lakes.

Mississippi Water Resources Conference2012
156
all types of lentic systems are poor (FTN Associates 2007). Turbidity is a major factor that may contribute to these poor relationships, especially in small and shallow oxbow lakes. Regional soil minerology and composition not only contributes to the naturally high phosphorus levels in the region, but also limits phytoplankton growth due to reduced light conditions (McDowell et al. 1989; Knowlton and Jones 1996; Sobolev et al. 2009). Estimates of both phytoplankton and suspended solids can be obtained instantaneously with handheld meters. Simultaneously collected parameters, including those that affect phytoplankton growth or nutrient cycling, may be used as covariates in predicting nutrient concentrations. The combination of a few select covariates can provide predictive models for nutrient concentrations that optimize lentic monitoring efforts.
To reduce costs associated with monitoring of numerous oxbow lakes in the MAV, we set out to achieve three objectives:
1. Assess the relationship between field estimates and lab measurements of suspended solids and primary productivity (via chlorophyll-a).
2. Assess the relationship between nutrients and easily obtained field measurements of chlorophyll-a fluorescence, turbidity, Secchi depth, water temperature, maximum depth, dissolved oxygen, pH, and alkalinity.
3. Determine if surrogate measures of chlorophyll-a and suspended solids are appropriate for predicting phosphorus and nitrogen concentrations in oxbow lakes.
MethodsThirty oxbow lakes were sampled during June and July of 2011. Ten 1-L surface (< 0.5 m) subsamples were collected from open-water areas in each lake and combined for a composite sample. Secchi depth was measured with a standard 0.2-m Secchi disk. Standard measurements of surface temperature, dissolved oxygen (DO), and pH were also measured using a YSI 556 multiprobe (YSI Inc.,
Yellow Springs, OH). Overall maximum depth of each lake was recorded.
Immediately upon return to shore, the turbidity (NTU) and relative fluorescence (RFU) of the composite sample were measured using portable handheld meters (2100p, HACH and Aquafluor 8000, respectively). Signal averaging mode was used on the turbidimeter; the first reading of the sample was used for the fluorometer. Alkalinity was estimated using LaMotte test kit number 9844-01 (LaMotte, Chestertown, MD). Approximately 150 ml of the sample was filtered through a 0.45-µm glass-fiber filter. The residual filter was folded and placed in aluminum foil within a sealed plastic bag. The bag and 4-L of sample was stored on ice for transport Mississippi State University. Upon arrival, 1-L of the sample was used for suspended solid analysis, using standard methods for total suspended solids (TSS) (APHA 1998). The remaining 3-L of the composite water sample and the residual filter for chlorophyll-a analysis was frozen at -20oC for future analyses. Chlorophyll-a was analyzed, after overnight extraction in 90% buffered acetone, using standard methods (Tri-colorometric; APHA 1998) with a HACH DR5000 spectrophotometer. Frozen composite water samples were transported on ice to USDA-ARS National Sedimentation Laboratory in Oxford, Mississippi for total phosphorus (TP) and total kjehldahl nitrogen (TKN) analysis. Simple linear regression was used to compare NTU and RFU to their analytical equivalent, TSS and chlorophyll-a. Once linear relationships were confirmed, meter estimates were used, along with a suite of other limnological variables (maximum depth, alkalinity, surface and mid epilimnetic temperature, DO and pH) to determine the best correlations with TKN and TP. The highest correlated variables were used in a multiple regression model to predict TKN and TP. Variables were transformed with natural logarithms when necessary to straighten curvilinear relationships.
Predicting Nitrogen and Phosphorus Concentrations using Chlorophyll-a Flourescence and TurbidityAndrews, Caroline

Non-Point Source Assessment
157
Results The relationship between NTU and TSS was linear and had a coefficient of determination (R2) of 0.77 (Table 1). The relationship between RFU and chlorophyll-a was log-linear and had a R2 of 0.81 (Table 1), after removal of one outlier lake that had a noticeable cyanobacteria algal bloom at the time of sampling. Therefore, NTU and RFU were used in place of TSS and chlorophyll-a concentration in further model development.
Correlations between TP, TKN, and various field limnological measurements ranged from 0.01 to 0.87 (Table 2). An outlier at an extremely clear, yet highly enriched, lake was removed from analysis. The highest correlations were found between nutrients, chlorophyll-a fluorescence, and turbidity; therefore, these variables were used to create predictive models for TP and TKN using multiple regression. A multiple regression model was established to predict TP from NTU and RFU measurements. We chose not to include Secchi depth as a predictor variable due to its subjectivity and user bias when an alternate measure of water clarity and suspended solids was available. As correlations between field measurements and TKN were lower than between field measurements and TP, we used our model for TP to further predict TKN, which indirectly incorporates NTU and RFU. The final models for TP and TKN are shown in Table 1.
DiscussionThe handheld meters used in this study provided estimates of surface suspended solids and chlorophyll-a that were satisfactory (p<0.05; r>0.85) for use. Correlations between nutrient concentrations and both NTU and RFU were higher than any other standard field measurements tested. High correlation (r=0.85) between chlorophyll-a (as estimated through RFU) and TP was contrasted from a previously low correlation (r=0.42) found in lakes and reservoirs in Mississippi (FTN Associates 2007). The chlorophyll-a and TKN relationship was not improved (r=0.68 in our study; r=0.73 previously). Based on these results, we suggest
that nutrient concentrations may be monitored in oxbow lakes through the use of both a turbidity and chlorophyll-a estimation made with field meters. While RFU is partially dependent on NTU, we included both to improve the predictability of TP across multiple combinations of these parameters represented in MAV lakes. Nitrogen concentrations are not as tightly correlated with these estimations, and therefore further work may be necessary to incorporate additional covariates. However, TKN was closely correlated with TP (r=0.83), which has been found to be true in other systems (Bachmann 1980; Jones and Knowlton 2005). We used this relationship to provide a limited prediction model for TKN.
Oxbow lakes in the MAV have become highly eutrophic, and as such, diminishing clarity and high algal content often leads to lower perceived value in the resource (Cooper et al. 2003). Ecological changes such as eutrophication warrant the need for more frequent monitoring, especially in systems where there are nutrient criteria to be met. Using biotic and abiotic parameters that can be quickly and inexpensively obtained can save expenses traditionally used for sparse nutrient concentration analysis. While use of these parameters directly in regulations would be ideal, our models may help predict whether nutrient levels are within compliance. Furthermore, these estimations of nutrients can help redirect efforts towards monitoring and understanding how a response variable changes as a result of other factors. However, these models should only be used in shallow oxbow lakes of the MAV, and should be used with caution especially with lakes known to contain unusual trophic characteristics. Sampling events should make note of extreme algal blooms, and estimations of chlorophyll-a may need to be confirmed with laboratory analysis or additional sampling.
AcknowledgementsWe thank the USDA-ARS National Sedimentation Laboratory in Oxford, MS for graciously running
Predicting Nitrogen and Phosphorus Concentrations using Chlorophyll-a Flourescence and TurbidityAndrews, Caroline

Mississippi Water Resources Conference2012
158
nutrient concentration analyses. Funding and support was provided by the U.S. Army Corps of Engineers Vicksburg District, the U.S. Geological Survey, and Mississippi State University.
ReferencesAPHA 1998. Standard methods for the examination of water and wastewater. Washington, DC.
Bachmann, R. W. 1980. Prediction of total nitrogen in lakes and reservoirs. Restoration of lakes and inlands waters. International Symposium on Inland Waters and Lake Restoration. Portland Maine, USEPA 440/5-81-010: 320-324.
Brown, C. D., M. V. Hoyer, R. W. Bachmann and D. E. Canfield, Jr. 2000. Nutrient-chlorophyll relationships: an evaluation of empirical nutrient-chlorophyll models using Florida and north-temperate lake data. Canadian Journal of Fisheries and Aquatic Sciences 57(8):1574-1583.
Cooper, C., M. Moore and S. Smith, Jr. 2003. Surface water, ground water and sediment quality in three oxbow lake watersheds in the Mississippi Delta agricultural region: pesticides. International Journal of Ecology & Environmental Sciences 29:171-184.
Dillon, P. J. and F. H. Rigler 1974. The phosphorus-chlorophyll relationship in lakes. Limnology and Oceanography 19(5):767-773.
Dodds, W. K. and M. R. Whiles 2010. Freshwater ecology: concepts and environmental applications of limnology, Academic Press.
FTN Associates 2007. Nutrient assessments supporting development of nutrient criteria for Mississippi lakes and reservoirs.
Jones, J. R. and R. W. Bachmann 1976. Prediction of phosphorus and chlorophyll levels in lakes. Water Pollution Control Federation 48(9):2176-2182.
Jones, J. R. and M. F. Knowlton 2005. Chlorophyll response to nutrients and non-algal seston in Missouri reservoirs and oxbow lakes. Lake and Reservoir Management 21(3):361-371.
Knowlton, M. F. and J. R. Jones 1996. Experimental evidence of light and nutrient limitation of algal growth in a turbid midwest reservoir. Archiv fuer Hydrobiologie 135(3):321-335.
McDowell, L. L., G. H. Willis and C. E. Murphree 1989. Nitrogen and phosphorus yield in run-off from silty soils in the Mississippi delta, U.S.A. Agriculture, Ecosystems & Environment 25(2/3):119.
Phillips, G., O. P. Pietilainen, L. Carvalho, A. Solimini, A. L. Solheim and A. C. Cardoso 2008. Chlorophyll-nutrient relationships of different lake types using a large European dataset. Aquatic Ecology 42(2):213-226.
Sobolev, D., K. Moore and A. L. Morris 2009. Nutrients and light limitation of phytoplankton biomass in a turbid Southeastern reservoir: implications for water quality. Southeastern Naturalist 8(2):255-266.
Turner, R. E. and N. N. Rabalais 2003. Linking landscape and water quality in the Mississippi River basin for 200 years. BioScience 53(6):563.
Watson, S., E. McCauley and J. A. Downing 1992. Sigmoid relationships between phosphorus, algal biomass, and algal community structure. Canadian Journal of Fisheries and Aquatic Sciences 49(12):2605-2610.
Predicting Nitrogen and Phosphorus Concentrations using Chlorophyll-a Flourescence and TurbidityAndrews, Caroline

Non-Point Source Assessment
159
Table 1: Regression models for handheld meters and laboratory analysis and for nutrient concentration prediction in oxbow lakes of the Mississippi Alluvial Valley. All models significant (p ≤ 0.05).Total phosphorus* = predicted mg/L from TP model.Regression models R²Total suspended solids (mg/L) = 8.31 + 0.68 × Turbidity (NTU) 0.77Chlorophyll-a (μg/L) = e-2.31 × Fluorescence (RFU)1.17 0.81Total phosphorus (μg/L) = 87.7 + 1.69 × Turbidity (NTU) + 0.22 0.89Total kjehldahl nitrogen (mg/L) = 3.97 + 1.41 × log (Total phosphorus*) 0.59
Table 2: Correlation coefficients (r) for nutrients and common limnological measurements in 29 oxbow lakes of the Mississippi Alluvial Valley. S=surface measurements; m=mid epilimneon measurements. * Denotes significance (p≤0.05). + Denotes relationship with loge(TP).Parameter TKN TPLoge(Total phosphorus) 0.83* -Turbidity (NTU) 0.71* 0.87*Log(Secchi depth) -0.76* -0.83*Fluorescence (RFU) 0.68* 0.85*+Alkalinity -0.57* -0.35Loge(Maximum depth) -0.53* -0.63*+
Loge(s Dissolved oxygen) -0.11 -0.29s pH 0.01 -0.18s Temperature -0.13 -0.25Loge(m Dissolved oxygen) -0.2 -0.2m pH 0.11 0.07m Temperature -0.22 -0.21
Predicting Nitrogen and Phosphorus Concentrations using Chlorophyll-a Flourescence and TurbidityAndrews, Caroline
Mississippi Water Resources Conference2012
160
Water Quality in Sardis Lake: A Multi-Variate Statistical Method for Analysis of Temporal and
Spatial TrendsCristiane Q. Surbeck, University of Mississippi
Water quality data from rivers, lakes, and other bodies of water are collected by environmental agencies. These monitoring activities occur because of requirements set by regulations, and data are collected in a systematic way for the intended purpose. Monitoring enables agencies to determine whether water bodies are polluted. Much effort is spent for each monitoring event, resulting in hundreds of data points typically used solely for comparison with regulatory standards and then stored for little further use. This presentation shows a data analysis methodology applied to Sardis Lake in north Mississippi that uses a pre-existing dataset to extract more useful information on water quality trends, without new sample collection and analysis. In this presentation, measured lake water quality data are subjected to statistical analyses including Principal Component Analysis (PCA) to deduce changes in water quality spatially and temporally over several years. It was found that the lake water quality as a whole changed temporally by season, rather than spatially. Storm events caused the greatest shifts in water quality, and the shifts were fairly consistent across sampling stations. This methodology can be applied to similar datasets, especially with the recent emphasis by the U.S. EPA on protection of lakes as water sources. Water quality managers using these techniques may be able to lower their monitoring costs by eliminating redundant water quality parameters found in this statistical analysis.

Modeling
David BassiMississippi State University
Analyzing the Hydraulics of a Biofiltration Swale Using HEC-RAS
Jennifer Sloan-ZieglerMississippi State University
Sediment and Mercury Fate and Path Modeling in Weeks Bay, Alabama
Surendra Raj PathakMississippi State University
Calculation of Water Surface Elevation Using HECRAS 4.1.0 for Fixing Tailwater Elevation for Powerhouse Site in Planned 37 MW Kabeli “A” Hydroelectric Project, Nepal
Sarah DuffyMississippi State University
Assessing Water Balance Using a Hydrologic Model
Mod
elin
g

Mississippi Water Resources Conference2012
162
Analyzing the Hydraulics of a Biofiltration Swale Using HEC-RAS
David Bassi, Mississippi State University
Hydraulic Engineering Center’s River Analysis System (HEC-RAS) is a hydraulic model that was developed by the U.S. Army Corps of Engineers to execute 1-D hydraulic calculations. The software is made up of four 1-D river analysis tools that all use the same geometric data that is imputed by the user. It calculates steady flow water surface profile computations, unsteady flow simulation, movable boundary sediment transport computations, and water quality analysis. It comprises of a graphical user interface, data storage and management, and reporting functions. The purpose of this research was to use HEC-RAS to assess a biofiltration swale by calculating the flows, roughness, and sediment loads, as well as evaluating a porous check dam located at the end of the swale. The vegetative swale is a Best Management Practice (BMP) that is located on the South Farm at Mississippi State University. The 50-m long swale contains a rip-rap check dam at the downstream end of the BMP followed by a fiberglass flume. The watershed for the BMP contained cattle pastures and is approximately 8.4 ha. Since summer 2011, flows from storm events were measured using a Son-Tec Flow Meter in the field and water levels were used to measure the gage heights during the events. Rating curves (stage vs. discharge) were developed for the upstream, middle, and downstream (flume) sections of the BMP. Thirteen cross sections of the channel were found using a total station and the geometric data was imputed into HEC-RAS. Water samples were also collected during storm events using an automatic water sampler located at the entrance, middle, and flume sections, and the samples were analyzed in the laboratory for total suspended solids as well as various nutrients. Currently, we’re setting up the model and planning to show model results at the conference.

Modeling
163
Sediment and Mercury Fate and Path Modeling in Weeks Bay, Alabama
Jennifer Sloan-Ziegler, Mississippi State UniversityCamacho-Rincon, R.; Martin, J.; McAnally, W.
Mercury, a naturally occurring element, is found in water, soil, and air and is released into the environment through natural sources and human activities. Mercury is subject to several physical and chemical processes in aquatic systems that impact its fate, transport, and toxicity to humans and aquatic life. Mercury bioaccumulates though the food chain and can eventually be ingested by humans though fish consumption. Mercury exposure can lead to negative effects such as risks to the nervous system, brain, lungs, heart, kidneys, and immune system.
Knowing the processes that can affect the fate and transport of mercury in waterbodies is fundamental for developing ecological restoration and prevention plans as well as for mitigating the potential threats to humans.
In this study, a mechanistic model based in the Water Quality Analysis Simulation Program (WASP) was implemented to support the analysis and understanding of the fate and transport of mercury in Weeks Bay, Alabama. Preliminary results indicate that the model is capable of representing the transport characteristics of the estuary and is, thus, potentially able to reproduce the long-term transport of mercury in the system. Current observed mercury data is limited; therefore, the current model can be used to aid in the formulation and development of future data collection programs focused on refining, calibrating, and validating the model.

Mississippi Water Resources Conference2012
164
Calculation of Water Surface Elevation Using HECRAS 4.1.0 for Fixing Tailwater Elevation for Powerhouse Site in Planned 37 MW Kabeli “A”
Hydroelectric Project, NepalPathak, S., Mississippi State University
IntroductionKabeli River is one of the tributaries of the Tamor River which itself is one of the major tributaries of Sapta Koshi River basin. The catchment area above the proposed intake site of the project is 864 km2 and elevation ranges from 550 m to 7200 m above mean sea level. Likewise powerhouse located on left bank of Tamor river has catchment area of 3930 km2 with elevation ranging from 452 m to 7200 m above mean sea level. In this geographical region,
monsoon climatic pattern commences from June till September. Rainfall intensity varies in catchment with elevation. Most of annual precipitation takes place during those months compared to other months of the year. In general, amount of precipitation is highest in the south at lower elevation and gradually decreases to the north with the increase in elevation. Average annual precipitation in Kabeli basin is 2135 mm. Average yearly flow at the intake site is 51.75 m3/s with the
Goal of this HECRAS 4.1.0 model analysis is to find out water surface elevations for safe and optimized layout of powerhouse located in left bank of Tamor river with other protective structures like floodwalls at different flood frequencies for planned 37 MW Kabeli “ A” Hydroelectric Project. Powerhouse is costly and vulnerable com-ponent of any hydropower facility. Safe location of powerhouse should be prioritized. Any increment in head is related with generation of extra revenue but powerhouse earthwork excavation volume incurs huge part of overall project cost initially. There is some sort of tradeoff between these two parameters to get an optimum design elevation. It is envisioned that 1-D US Army Corp’s HEC-RAS model can simulate flow conditions at differ-ent flood frequencies.This project is located in Panchthar and Taplejung districts in Eastern Development Region of Nepal. This project utilizes more than 15 km long loop of Kabeli River formed with Tamor River. Kabeli River, which is a tributary of Tamor river is diverted through a 4326.8 m long D-shaped headrace tunnel having internal finished diameter 5.65 m, discharging diverted water into Tamor River for power generation. The gross head of the project is 116.8 m and the design discharge based on 40 percentile flow set by government for power gen-eration from flow duration curve (FDC) in river is 37.73 m3/s.
Kabeli River is one of the tributaries of Tamor River which itself is a major tributary of Sapta Koshi River basin.The catchment area above the proposed intake site of project is 864 km2 and at powerhouse site is 3930 km2 with elevation ranging from 452 m to 7200 m above mean sea level. In this catchment, monsoon pattern of climate is prevalent. It commences from June to September with heavy rainfall intensity for those four months com-pared to other months of the year. Rainfall intensity varies in catchment with elevation and runoff is calculated from different methods as powerhouse site is ungaged.
Due to global warming, glacial lake outburst flood (GLOF), known as mountain tsunamies in high Himalayas ( Kanchanjunga range) is highly probable. This zone lies in area with high seismic activity with possibility of GLOF, flooding populated areas and infrastructure downstream. Since glacial/snow hydrology study and data collec-tion is still in nascent stage of development, analysis for design flood elevation has been done without taking into account those effects due to unavailability of data.

Modeling
165
minimum monthly flow of 8.11 m3/s in March and maximum monthly flow of 151.09 m3/s in August. The 100-year return period flood flow at intake site is 1921 m3/s and 5984 m3/s at the intake and powerhouse site respectively.
HydrologySince overall civil engineering design is based on hydrology, hydrological study is crucial component to study rainfall pattern, calculate discharging capacity of catchment and to predict design discharge, mean monthly flow, flow duration curve, flood flow and low flow of river. Overall aim of the hydrological and meteorological study of project is to estimate the design flow for required capacity of hydroelectric power plant and to estimate flood and low flows of river.
An accurate assessment of long-term hydrology is essential to any hydropower project. The longer the hydrological record, more reliable is the estimation of design parameters for the project. In case of ungaged (i.e. either limited or no stream flow records) river, direct measurements of hydrological parameters are not available. So, it is necessary to look at catchments that have similar catchment and meteorological characteristics and catchment area ratio (CAR) method is used.
The Kabeli River is one of tributaries of Tamor River and Tamor River is one of major rivers of the Sapta Koshi Basin system.The Kabeli basin is located in between latitudes 27° 16’ and 27° 17’ N and longitudes 87° 42’ and 87° 43’ E .The Sapta Gandaki Basin drains Eastern Development Region of Nepal.
The catchment of Kabeli River at proposed project site has characteristics of mountainous catchment. The catchment area of the Kabeli River is 864 km2 at the proposed intake site. The catchment area above the permanent snow line (El. 5000m) is about 0.5 km2 only. It has elevation ranging from El. 550 m to El. 7200 m.
Above mentioned drainage areas and elevations
are based on latest 1:25000 and 1:50000 scale topographical maps compiled from aerial photogrammetry of 1996 and produced by Survey Department in co-operation with the Government of Finland.
The monsoon commences from June till September.The mean annual precipitation over the project area estimated is 2135 mm.
Methodologies for ungaged catchmentAs Kabeli river is an ungaged type river, various methodologies, common for ungaged catchment, are used to determine the hydrology of Kabeli and Tamor River. Followings are widely adopted methods for most of the ungaged catchment in Nepal.
HYDEST The HYDEST method has been used to estimate mean flow series at the proposed intake and powerhouse site. This method was developed by Water and Energy Commmission Secretariat (WECS) and Department of Hydrology & Metereology (DHM) in 1990 for evaluating the hydrologic characteristics of ungaged catchments. For complete hydrological analysis by this approach, catchment area and its distribution in altitude are essential along with monsoon wetness index of catchments.Monsoon wetness index from isoheytal map for Kabeli catchment is 1500 mm. This approach is used to compute long-term hydrology and extreme hydrology.
MHSP (MEDIUM HYDROPOWER STUDY PROJECT)The Medium Hydropower Study Project (MHSP) under Nepal Electricity Authority (NEA) in 1997 developed a method to predict long-term flows, flood flows and flow duration curves at ungaged sites through regional regression technique.The MHSP method has been used to estimate mean monthly flow series at proposed intake site. This approach uses both monsoon wetness index and average precipitation of the area along with catchment area of the river.
Calculation of Water Surface Elevation Using HECRAS 4.1.0 for Fixing Tailwater Elevation for Powerhouse Site in Planned 37 MW Kabeli “A” Hydroelectric Project, NepalPathak, Surendra Raj

Mississippi Water Resources Conference2012
166
Catchment correlationSince there is no availability of hydrological data of project area, an attempt was made to correlate the flows of gaged catchment with the ungaged catchment by using cathment area ratio. During the study, it was found that Tamor River at Majhitar (station no 684) has recorded data of 11 years only. Therefore, catchment characteristics of only two stations: station 690 (Tamor River at Mulghat) and station 795 (Kankai Mai at Mainachuli) are compared. The catchment parameters are presented in Table 2.
CATCHMENT CORRELATION Mean monthly flows were also computed correlating ungaged Kabeli River with gaged catchment. The catchment area of Tamor at Mulghat (Station Number 690) is 5640 km2 while that of Kankai Mai at Mainachuli (Station Number 795) is 1178 km2.The station 795 has comparatively smaller catchment area than that of station 690.Tha catchment area ratio (CAR ) of Kabeli to station 795 is 0.73 while that of Kabeli to station 690 is 0.15. As presented in Table 2, station 795 has only 13.8% of total area lying between El 3000 m and 5000 m. But, Kabeli River at the intake site has 20.5% of total area lying between El 3000 m and El. 5000 m.Therefore, correlating the catchment area with station 795 underestimates the flow in Kabeli River during dry seasons. However, station 690 has comparatively bigger catchment area. In one hand, the flow during the dry seasons is is of more concern.On other hand, Tamor at Mulghat is mother catchment of Kabeli River, attempts have been made to correlate the flow of this station by applying CAR method to derive the mean monthly flow of Kabeli River at intake site and powerhouse site. In addition, direct catchment correlation with station 690 overestimates the flow during dry seasons in Kabeli River as station 690 has 23.9% of total area lying between elevation 3000 m and 5000 m. Precipitation ratio of 0.937 is also applied along with catchment area ratio (CAR). The mean monthly flow derived from three methods is presented in Table 3.
ADOPTED MEAN MONTHLY FLOWTo compare and check mean monthly flow computed based on station number 690 for Tamor river Mulghat, flow computed by other two methods HYDEST and MSHP are also presented. The above table shows that the mean annual flow derived by later two methods is less than the correlated flow based on station 690.The flow given by HYDEST and MSHP methods is less than the flow given by previous one in wet seasons but seems to be within the reasonable range in dry seasons. Since station 690 being the mother catchment of Kabeli and has long term data of 41 years, mean monthly flow based on catchment correlation and precipitation ratio is adopted. The adopted hydrograph is shown in Figure 2.
There are no water sharing issues of Kabeli River in its licensing area. Therefore whatever flow is available in river can be used for power generation except for downstream release of 10% of driest mean monthly flow as minimum release for environmental flow.
A flow duration curve is a probability discharge curve that shows percentage of time a particular flow is equaled or exceeded. A multiplying factor of 0.14 (CAR=0.15 and Precipitation ratio=0.937) was applied in the daily flow of station 690 to derive the long term daily flow of Kabeli River at the intake site. Based on average daily data from 365 days of each year, flow duration curve was derived. The numerical values of flow duration curve are presented in Table 4.
Since design discharge for project has been calculated based upon 40% exceedance rule from flow duration curve (FDC) for power generation laid by Government of Nepal. Annual 40% exceedance discharge of 37.73m3/s from Kabeli river is diverted through 4326.8 m long D shaped tunnel having internal finished diameter of 5.65m for power generation at powerhouse, which is later added at river section 100 in HECRAS analysis of powerhouse site at tailwater area.It eventually will be discharged
Calculation of Water Surface Elevation Using HECRAS 4.1.0 for Fixing Tailwater Elevation for Powerhouse Site in Planned 37 MW Kabeli “A” Hydroelectric Project, NepalPathak, Surendra Raj

Modeling
167
into Tamor river from powerhouse tailrace area.
Extreme hydrologyFlood flowIn order to estimate the flood flow at intake and powerhouse sites, different methods were used.
CAR methodThe maximum instantaneous flow data of Tamor River at Mulghat (station number 690) is available from the year 1965 to year 2006.Three distribution methods; Lognormal, Log Pearson III and Gumbel distribution methods were used to estimate the flow for different return periods. The Log pearson III method has given the best fit curve, therefore the result given by this method is taken. The flood flows for different return periods at the intake site and powerhouse site of Kabeli-A hydroelectric project were calculated using following formula:
Where,QT1= Flow at the intake/Powerhouse site at T-year return period, m3/s.QT2= Flow at the gaging station no 690 at T-year return period, m3/s.A1= Catchment area at the intake/powerhouse site, Km2
A2= Catchment area at the gaging station no 690 for Tamor river at Mulghat, Km2
Regression analysis methodIn this method, instantaneous maximum flow data from 15 gaging stations (Table 7) all lying within Koshi basin was collected and their individual frequency analysis was carried out. Then, regression equations were developed between the catchment area below elevation 3000 m and T-year return period.
Regional flood frequency analysis methodThis method is one of the most widely used methods
for estimating floods for different return periods in an ungaged catchment. The same 15 gaging stations as mentioned in above method were selected for analysis in this method as well. The frequency analysis of maximum instantaneous floods was carried out for each of the station and regression equation between the mean flood discharge (Q2.33) and the catchment area was developed. The equation is given as follows:Y=7.792X0.623 where the coefficient of correlation is 0.775.And Y= Mean flood discharge at intake/Powerhouse site, m3/s X= catchment area of intake/Powerhouse, Km2
The mean flood discharge given by above equation was multiplied by the median flood ratio (QT/Q2.33) to get the flood discharge for T-year return period. The median flood ratio for different return period is shown in Table 7.
The flood flow for different return periods at intake and powerhouse sites using above three methods are presented inTable 8 and Table 9 respectively.
The results given by these three methods are compared. The regression analysis method has overestimated flow for small size catchment like Kabeli since only 4 out of 15 gaging stations taken for this analysis have similar catchment size to Kabeli.
Similarly, regional flood frequency method has underestimated the flow as it has not given the good correlation between mean flood discharge and the catchment area. Therefore, the flood flow derived from CAR method is adopted in HECRAS analysis.
Glacial Lake Outburst Flood (GLOF) Impact AssessmentA glacial lake outburst flood (GLOF) is a type of outburst flood that occurs when the dam containing a glacial lake fails. The dam can
Calculation of Water Surface Elevation Using HECRAS 4.1.0 for Fixing Tailwater Elevation for Powerhouse Site in Planned 37 MW Kabeli “A” Hydroelectric Project, NepalPathak, Surendra Raj

Mississippi Water Resources Conference2012
168
consist of glacier ice or a terminal moraine. Failure can happen due to erosion, a buildup of water pressure, an avalanche of rock or heavy snow, an earthquake or cryoseism, volcanic eruptions under the ice, or if a large enough portion of a glacier breaks off and massively displaces the waters in a glacial lake at its base. There are few glacier lakes identified in Kabeli basin. All lakes are located below 4500 m altitude. The identified lakes are shown in Table 10.
None of these lakes are identified as potentially dangerous lakes in study conducted by International Center for Integrated Mountain Development (ICIMOD) and United Nations Environment Program (UNEP) in 2001. There is no evidence of glacial lake outburst flood (GLOF) in Kabeli basin in the past. However, possibility of GLOF in the future cannot be ignored. Powerhouse site is located on the left bank of Tamor River which has a number of glacier lakes in its upper catchment. An assessment of a possible GLOF that may impact on the powerhouse of Kabeli-A hydroelectric project is also required.
There is not enough data to make accurate assessment of a possible GLOF impact on the Kabeli-A powerhouse. There are more than eight major glaciers in upper catchment of Tamor river: Chhubuk Glacier, Lonak Glacier, Chhatang Glacier, Pyramid Glacier, Kanchanjangha Glacier, Ramdung glacier, Khumbha Karna Glacier and Yalari Glacier.
There was a GLOF in 1980 and it originated from Lake Nagma Pokhari. The examination of flow records downstream at gauging station 690 indicates that GLOF occurred on 24th June 1980 and the peak discharge was 3, 300 m3/s. The flood surge reached 20 m above the river bed of Yangma Khola. It is estimated that the peak flow at Yagma Khola was about 8500 m3/s decreasing to about 3300 m3/s at the gauging station 690. Considering the flood attenuation over this distance, it is estimated that the peak flow at the
tailrace site in Tamor River is about 4500 m3/s which is equivalent to the 1 in 20 year return period flood at the tail race site.
• The average annual flow of Kabeli River at the intake site is 51.75 m3/s.
• The design discharge is 37.73 m3/s corresponding to 40 percentile exceedance flow.
• The 100- year flood discharge is 1921 m3/s at the intake site and 5984 m3/s at the powerhouse site. Additional discharge of 37.73 m3/s has been added from tailrace water coming out near powerhouse mixed with Tamor river station 100 taken for HECRAS analysis.
Since Kabeli and Tamor rivers being ungaged and planned for potential hydropower generation, recordkeeping of daily staff gage readings of river at intake site and tailrace site is highly recommended.Proper hydrology will lead to efficient design of hydraulic structures which ultimately will affect related electrical and mechanical components later. River discharge measurements should also be taken at various gage height so as to develop reliable rating curves at both sites. As gage is already installed at the intake site, hydrology of Kabeli River at intake site should be updated based on recorded data. Staff gage should be installed at powerhouse area with automated hourly recordkeeping of hydrological data too.
The true risk to settlements and infrastructure downstream in the Hindu Kush Himalayan region is difficult to assess. But the Himalayan region is dotted with glacial lakes and is in a seismically active zone. Experts say that, on the basis of past records, a large earthquake in the region is overdue.Many glacial lakes are said to be growing. Some of them alarmingly fast – because of melting glaciers. Some are at risk of rupturing, which would flood areas downstream. There have been at least 35 glacial lake outburst events in Nepal, Pakistan, Bhutan and China during the last century, according to the
Calculation of Water Surface Elevation Using HECRAS 4.1.0 for Fixing Tailwater Elevation for Powerhouse Site in Planned 37 MW Kabeli “A” Hydroelectric Project, NepalPathak, Surendra Raj

Modeling
169
United Nations Environment Program (UNEP). But the increased risk from the quake-induced rupture of glacial lakes has been rarely discussed (Khadka, 2011).
Tail Race Level Optimization Using HECRAS Analysis The powerhouse area is located near left bank of Tamor river. It has been found that central part of powerhouse is located about 100 m from the bank of the Tamor river. For protection purpose of the powerhouse area from flood, HEC-RAS analysis has been done to know the flow characteristics of the Tamor river so that the river protection structure can be made to withstand worst condition of flood. With the help of HEC-RAS Analysis, 13 cross sections, various water level profiles, rating curves for different years return period at various chainage of river are calculated.Mannings n values for main channel and side channels are chosen as 0.035 and 0.037 taken from document entitled “Guide for Selecting Manning’s Roughness Coefficients for Natural Channels and Flood Plains, United States Geological Survey Water-supply Paper 2339”.Values are bit higher owing to fact that large cobbles and boulders present along Tamor river. Tailrace outlet is taken at point 120m from extreme downstream cross section or 480m from extreme upstream cross section in Tamor river chosen for analysis. For tail race waterlevel optimization, rating curve at area near to the outlet of the tailrace canal is found as shown in Figure 8.
Optimization table and plot The optimization chart is plotted to show the effect of change in tail water level in cost for earthwork excavation and protection of powerhouse and extra revenue obtained from generated energy while changing the tail water level elevation. The chart is plotted by taking TWL elevation along X-axis and cost / revenue along the Y-axis. Two curves a) curve between TWL and cost, b) curve between TWL and revenue has been plotted. The intersection point of these two curves is taken as the optimized point for the tail water level. From chart optimized level is found equal to 458.5 m. The optimization chart is as shown below in Table 13.
Conclusion and basis for finalization of optimizationThe main basis for finalization of tailwater elevation (TWL) is the net difference between cumulative incremental revenue and the cost.
The cost is found for earthwork excavation to which TWL is fixed. The total cost is found by adding a) excavation cost b) cost for pumping of seepage water during excavation for powerhouse layout as powerhouse area is very near to the large Tamor river c) cost for diversion work of the river during excavation work plus foundation preparation work of the powerhouse, d)cost for the disposal of the excavated earth.
The incremental change in revenue is found by fluctuating TWL from 457m to 462 m elevation. It is found that revenue increases as the tail water level elevation goes downwards. The earthwork excavation cost also goes on increasing as we go deeper. The optimum point is then chosen where the two curves intersect each other. It comes out as 458.5 m.
Referenceshttp://www.chinadialogue.net/article/show/single/en/4310
http://www.swisseduc.ch/glaciers/glossary/glof-2-en.html
http://en.wikipedia.org/wiki/Glacial_lake_outburst_flood
Guide for Selecting Manning’s Roughness Coefficientsfor Natural Channels and Flood Plains, United States Geological Survey Water-supply Paper 2339”
HEC-RAS 4.1_Users_Manual
HEC-RAS 4.1 Hydraulic Reference Manual
HEC-RAS 4.1 Applications Guide
Calculation of Water Surface Elevation Using HECRAS 4.1.0 for Fixing Tailwater Elevation for Powerhouse Site in Planned 37 MW Kabeli “A” Hydroelectric Project, NepalPathak, Surendra Raj

Mississippi Water Resources Conference2012
170
Calculation of Water Surface Elevation Using HECRAS 4.1.0 for Fixing Tailwater Elevation for Powerhouse Site in Planned 37 MW Kabeli “A” Hydroelectric Project, NepalPathak, Surendra Raj
Table 1: Catchment characteristicsElevation, masl Intake Area Powerhouse Area
Area in km² % of total area
Area in km² %
Above 5000 0.5 0.1% 717.0 18.2%Between 5000 m and 3000 m 177.5 20.5% 1325.0 33.7%Below 3000 m 686.0 79.4% 1888.0 48.1%Total Catchment Area 864.0 100.0% 3930.0 100.0%
Table 2: Catchement parameters
Elevation, maslTamor at Mulghat Kankai Mai and Mainachuli
Area in km²% of total
areaArea in km²
% or total area
Above 5000 717.0 12.7% 0.0 0%Between 5000 m and 3000 m 1350.0 23.9% 162.0 13.8%Below 3000 m 3573.0 63.4% 1016.0 86.2%Total Catchment Area 5640 100.0% 1178.0 100.0%
Table 3: Mean monthly flows for Kabeli River from various mentods, m3/s
Month Correlation with Tamor at Mulghat
HYDEST MSHP
Jan 9.93 10.58 10.77Feb 8.25 9.00 8.98Mar 8.11 8.34 8.44Apr 11.83 9.25 11.43May 25.92 13.38 13.22Jun 72.42 39.6 40.70Jul 142.08 123.70 115.21Aug 151.09 145.96 134.98Sep 106.31 110.73 103.14Oct 49.49 48.52 46.98Nov 21.95 20.32 22.77Dec 13.61 13.11 14.92Average 51.75 46.04 44.29

Modeling
171
Calculation of Water Surface Elevation Using HECRAS 4.1.0 for Fixing Tailwater Elevation for Powerhouse Site in Planned 37 MW Kabeli “A” Hydroelectric Project, NepalPathak, Surendra Raj
Table 4: Values of flow duration curve.% Exceedance Discharge, m3/s
5 154.510 143.215 131.420 111.325 90.130 72.035 48.840 37.745 27.250 23.555 19.7
Table 5. Flow Duration Curve based on average daily data (1965-2006)
Perc
enta
ge o
f ex
ceed
ance
, %
Month
Ann
ual
Jan Feb Mar Apr May Jun Jul Aug Sep Oct Nov Dec
5 11.39 8.81 9.06 17.38 40.73 105.58 173.28 169.18 135.82 78.34 27.10 17.72 154.4710 11.01 8.73 8.79 15.31 38.01 101.15 158.80 162.71 129.96 71.08 26.81 16.44 143.2415 10.97 8.63 8.66 15.02 37.10 96.81 156.76 158.26 154.58 70.93 26.27 16.18 131.4520 10.84 8.61 8.61 14.26 32.44 92.95 155.44 157.60 123.50 69.00 25.70 15.87 111.2525 10.60 8.50 8.53 14.01 29.11 90.75 148.93 156.35 116.92 60.04 25.13 15.34 90.1230 10.47 8.49 8.32 13.31 28.17 86.43 145.42 156.00 112.97 56.33 24.58 14.98 72.0035 10.24 8.45 8.16 12.54 27.12 83.35 143.18 154.50 111.61 56.04 24.04 14.66 48.7740 10.06 8.38 8.12 12.18 26.22 80.52 142.24 153.54 109.73 53.68 23.54 14.26 37.7345 9.97 8.35 8.09 11.90 25.85 76.83 141.65 151.91 108.85 48.39 22.83 13.94 27.1750 9.88 8.24 8.04 10.91 24.30 73.20 138.14 149.61 108.26 47.09 21.66 13.71 23.4855 9.82 8.20 7.95 10.77 22.77 68.26 136.86 146.56 105.54 45.63 20.99 13.38 19.6660 9.71 8.15 7.88 10.44 21.94 64.06 135.89 146.27 100.86 44.65 20.36 13.09 16.3365 9.53 8.10 7.78 10.20 21.59 59.56 132.39 145.55 96.07 40.38 19.72 12.81 13.7270 9.44 8.01 7.73 9.98 21.38 52.86 130.39 144.69 90.93 36.15 19.11 12.62 11.9075 9.32 7.94 7.72 9.85 21.03 44.31 128.85 144.04 88.90 35.13 18.49 12.41 10.3080 9.29 7.87 7.71 9.39 20.16 44.07 127.12 143.41 85.89 33.14 18.04 12.14 9.3685 9.16 7.82 7.63 9.30 19.92 42.76 124.02 143.17 84.25 31.84 17.59 11.99 8.7890 9.11 7.81 7.63 9.18 19.18 41.32 118.59 140.78 82.61 29.96 17.17 11.81 8.2895 8.95 7.76 7.60 9.00 18.06 39.33 115.36 134.90 77.20 28.72 16.99 11.62 7.89

Mississippi Water Resources Conference2012
172
Calculation of Water Surface Elevation Using HECRAS 4.1.0 for Fixing Tailwater Elevation for Powerhouse Site in Planned 37 MW Kabeli “A” Hydroelectric Project, NepalPathak, Surendra Raj
Table 6: DHM gauging stations within Khosi River basin
S.n Station No. River Name LocationDrainage Area, Km2
Total Area A<5000 m A<3000 m A> 3000 m1 640 Rosi Khola Panauti 87 87 87 02 650 Khimti Khola Rasnalu 313 303 213 1003 620 Balephi
KholaJalbire 629 543 292 337
4 660 Likhu Khola Sangutar 823 775 537 2865 610 Bhote Koshi Barabise 2410 980 255 21556 647 Tamakoshi Busti 2753 1375 531 22227 670 Dudh Koshi Rabuwa
Ghat4100 2690 1560 2540
8 630 Sun Koshi Pachuwar Ghat
4920 3348 2093 2827
9 690 Tamor Mulghat 5640 4923 3573 206710 652 Sunkoshi Khurkot 10000 7040 4851 514911 600.1 Arun River Uwa Gaun 26750 13474 43 2670712 680 Sunkoshi Kampughat 17600 13502 9828 777213 604.5 Arun River Turkeghat 28200 14924 1493 2670714 606 Arun River Simle 30380 17104 3673 26707
15 695 Sapt KoshiChautara-
kothu54100 36009 17512 36588
Table 7: Median Flood ratio for different return period with respect to mean flood (QT/Q2.33)Station Q2 Q5 Q10 Q20 Q50 Q100 Q200 Q500 Q1000
640 0.86 1.55 2.01 2.45 3.02 3.44 3.87 4.42 4.85650 0.82 1.78 2.42 3.03 3.82 4.42 5.01 5.79 6.38620 0.90 1.43 1.78 2.11 2.55 2.87 3.19 3.62 3.94660 0.95 1.21 1.39 1.56 1.78 1.94 2.10 2.32 2.48610 0.87 1.58 2.05 2.50 3.09 3.53 3.96 4.54 4.98647 0.95 1.20 1.36 1.52 1.72 1.87 2.02 2.22 2.37670 0.88 1.51 1.93 2.33 2.85 3.23 3.62 4.13 4.52630 0.94 1.28 1.51 1.72 2.00 2.22 2.43 2.70 2.91690 0.93 1.30 1.54 1.78 2.08 2.31 2.53 2.83 3.06652 0.93 1.29 1.53 1.76 2.05 2.27 2.49 2.79 3.00
600.1 0.97 1.13 1.23 1.33 1.45 1.55 1.64 1.77 1.86680 0.96 1.19 1.35 1.50 1.70 1.85 2.00 2.19 2.34
604.5 0.94 1.25 1.45 1.64 1.89 2.08 2.26 2.51 2.69606 0.94 1.25 1.45 1.64 1.89 2.08 2.26 2.51 2.69695 0.93 1.30 1.54 1.77 2.07 2.30 2.53 2.82 3.05
Median flood ratio
0.93 1.29 1.53 1.76 2.05 2.27 2.49 2.79 3.00

Modeling
173
Calculation of Water Surface Elevation Using HECRAS 4.1.0 for Fixing Tailwater Elevation for Powerhouse Site in Planned 37 MW Kabeli “A” Hydroelectric Project, NepalPathak, Surendra Raj
Table 8:Flood flow at intake site (m3/s)
Return PeriodFlood Flow, m3/s
CAR method Regression analysis Regional flood frequency2 710 1238 4915 1004 1742 68010 1210 2081 80520 1417 2403 92550 1699 2820 1080100 1921 3133 1196200 2153 3444 1312500 2477 3855 1465
1000 2736 4165 1581
Table 9: Flood flow at Powerhouse site (m3/s)
Return PeriodFlood Flow, m3/s
CAR method Regression analysis Regional flood frequency2 2212 1770 12615 3126 2451 174610 3770 2914 206820 4414 3352 237650 5292 3918 2775100 5984 4342 3074200 6706 4765 3372500 7715 5322 3765
1000 8523 5745 4062
I I
I I I
I I
I I
I I
I I

Mississippi Water Resources Conference2012
174
Calculation of Water Surface Elevation Using HECRAS 4.1.0 for Fixing Tailwater Elevation for Powerhouse Site in Planned 37 MW Kabeli “A” Hydroelectric Project, NepalPathak, Surendra Raj
Table 10: Hydrological Data Used for HECRAS AnalysisAt Normal Flow
River Kabeli and TamorKabeli and Tamor adding Q from Power-
houseReach 1 1
RS 600 100Jan 48.75 86.48Feb 40.25 77.98Mar 39.55 77.28Apr 57.90 95.63May 127.52 165.25June 345.29 383.02July 682.56 720.29Aug 734.02 771.75Sept 512.06 549.79Oct 241.09 278.82Nov 106.79 144.52Dec 68.10 105.83
2 Years 2212.00 2250.0020 Years 4414.00 4452.0050 Years 5292.00 5329.00100 Years 5984.00 6022.001000 Years 8523.00 8561.00

Modeling
175
Calculation of Water Surface Elevation Using HECRAS 4.1.0 for Fixing Tailwater Elevation for Powerhouse Site in Planned 37 MW Kabeli “A” Hydroelectric Project, NepalPathak, Surendra Raj
Table 11: Profile Output table of Tamor-Kabeli for 20 and 100 years return period flood frequency
Reac
h River Sta
ProfileQ total
Min Ch El
W.S. Elev
Crit W.S
E.G. Elev
E.G. Slap
Vol Chnl
Flow Area
Tap Width
Frou-do & Chl(m3/s) (m) (m) (m) (m) (m/m) (m/s) (m2) (m)
1 600 20 Years 4414 458.5 467.58 467.58 470.25 0.00475 7.87 669.2 121.92 0.891 600 100 Years 5984 458.5 468.83 468.83 472.02 0.00479 8.7 824.44 125.9 0.91
1 550 20 Years 4414 458.18 466.47 466.47 468.96 0.0051 7.44 688.56 144.28 0.91 550 100 Years 5984 458.18 468.22 467.77 470.6 0.00377 7.42 957.28 158.28 0.8
1 502.7 20 Years 4414 457.88 466.8 468.45 0.00287 6.01 844.31 159.56 0.691 502.7 100 Years 5984 457.88 468.59 470.25 0.0023 6.17 1161.18 187.39 0.64
1 450 20 Years 4414 457.55 467.03 468.18 0.00191 5.06 997.62 172.75 0.561 450 100 Years 5984 457.55 468.8 470.02 0.00161 5.3 1343.31 204.57 0.54
1 400 20 Years 4414 457.23 467.14 468.02 0.00139 4.44 1133.23 188.78 0.481 400 100 Years 5984 457.23 468.92 469.87 0.0012 4.69 1498.58 211.99 0.47
1 350 20 Years 4414 456.91 467.13 467.93 0.00123 4.31 1181.85 178.99 0.461 350 100 Years 5984 456.91 468.9 469.8 0.00111 4.61 1543.93 214.16 0.45
1 300 20 Years 4414 456.59 467.01 467.86 0.00139 4.81 1132.49 157.11 0.51 300 100 Years 5984 456.59 468.67 469.72 0.00149 5.52 1458.69 215.81 0.53
1 250 20 Years 4414 456.27 466.71 476.76 0.00182 5.51 1051.84 165.91 0.571 250 100 Years 5984 456.27 468.46 469.62 0.00169 5.94 1384.48 204.29 0.56
1 200 20 Years 4414 455.95 466.4 467.64 0.00206 5.8 958.44 145.35 0.61 200 100 Years 5984 455.95 468.04 469.5 0.00201 6.37 1225.61 154.52 0.61
1 150 20 years 4414 455.63 465.12 467.39 0.00396 7.67 711.92 113.8 0.821 150 100 Years 5984 455.63 465.93 465.78 469.17 0.00507 9.19 804.44 116.4 0.94
1 100 20 Years 4451.73 455.31 464.48 464.45 467.13 0.00495 8.33 678.68 121.94 0.911 100 100 Years 6021.73 455.31 465.72 465.72 468.87 0.00502 9.18 832.14 127.18 0.94
1 50 20 Years 4451.73 454.99 464.29 464.29 466.85 0.00477 8.1 697.66 131.33 0.891 50 100 Years 6021.73 454.99 465.49 465.49 468.52 0.00483 8.92 858.54 137.35 0.92
1 0 20 Years 4451.73 454.67 463.44 463.44 466.31 0.00545 8.2 635.5 126.63 0.941 0 100 Years 6021.73 454.67 465.02 465.02 468.01 0.00461 8.55 869 142.38 0.9

Mississippi Water Resources Conference2012
176
Calculation of Water Surface Elevation Using HECRAS 4.1.0 for Fixing Tailwater Elevation for Powerhouse Site in Planned 37 MW Kabeli “A” Hydroelectric Project, NepalPathak, Surendra Raj
Figure 1. Photograph taken in June, 2011, showing trees and developing vegetation. Note debris deposited by winter floods.
Table 12: Tailwater Level (TWL) Optimization
Tailwater Level masl
Incremental Energy
Energy Tariff (NRs)
Incremental Revenue
discounted for 30 years
Earthwork Excavation Volume in
m^3
Total Incremental Excavation Amount NRs
Present value of Energy
revenue, NRs
Difference between
Incremental Revenue and
Cost462 0.00 4.70 0.00 67717.35 0.00461 1.69 4.70 79570271.14 75175.71 6541914.02 79,570,271.14 42,656,491.45460 1.69 4.70 79570271.14 83219.89 7303407.03 79,570,271.14 38,268,958.70459 1.40 4.70 65840360.87 92788.50 8982057.96 65,840,360.87 14,993,587.65458 0.84 4.70 39587412.98 102908.50 9811214.47 39,587,412.98 (16,111,056.91)457 0.44 4.70 20816784.31 113793.12 10887613.27 20,816,784.31 (41,168,239.39)-

Modeling
177
Calculation of Water Surface Elevation Using HECRAS 4.1.0 for Fixing Tailwater Elevation for Powerhouse Site in Planned 37 MW Kabeli “A” Hydroelectric Project, NepalPathak, Surendra Raj
Figure 2: Monthly hydrograph
Figure 3: Flow duration curve
Mean monthly hydrograph 180
160
140 ~ I \.
" 120
I ~ t() .. 100 " I \ ~ ..,
80 ·"' ~ \ 0 60
/ ' 40 / ..........
20 -0 ' ' ' . ' ' '
Jan Feb Mar Apr May llun Jul Aug Sep Oct Nov Dec Month
Flow Duration Curve 120 - - - - - - - -.- - - - - - - - 1 - - - - - - - - .- - - - - - - - -.- - - - - - - - -.- - - - - - - - 1 - - - - - - - - .- - - - - - - - -.- - - - - - - - , - - - - - - - -
110 - - - - - - - _,_ - - - - - - - - - - - - - - ... - - - - - - - _,_ - - - - - - - -'- - - - - - - - .I - - - - - - - - ... - - - - - - - _,_ - - - - - - - ., - - - - - - - -
100 I I I I I I I
- - - - - .- - - - - - - - -,- - - - - - - - -.- - - - - - - - 1 - - - - - - - - .- - - - - - - - -,- - - - - - - - , - - - - - - - -
90 - - - - - - - _,_ - - - - - - - .. - - - - - -.. - - - - - - - _,_ - - -- - - - ... _ - - - - - - - .. - - - - - - - -.. - - - - - - - _,_ - - - - - - - .. - - - - - - - -., - 80 M
E 70 qj N 60 :.. I'S
50 ~
I I I I I I I I I - - - - - - - -,- - - - - - - - i - - - - - - - i - - - - - - - -,- - - - - - - - -,- - - - - - - - i - - - - - - - - i - - - - - - - -,- - - - - - - - ;- - - - - - - - i
I I I I I I I I I I - - - - - - - -,- - - - - - - - i - - - - - - - - i - - - - - - -,- - - - - - - - -,- - - - - - - - i - - - - - - - - i - - - - - - - -,- - - - - - - - ;- - - - - - - - i
u ., 40 i5 30
' ' ' - - - - - - - -,- - - - - - - - I - - - - - - - - I - - - - - -I I I I I I ------- ,-------- ,--------, --------,-------- ,--------,
I I I I I I I I I
20 - - - - - - - -'- - - - - - - - J - - - - - - - - L - - - - - - - -'- - - - - - - - Y-~~•-- - J - - - - - - - - L - - - - - - - -'- - - - - - - - .J - - - - - - - - I I I I I I I I I
10
0 0 10 20 30 40 50 60 70 80 90 100
% Exceedance

Mississippi Water Resources Conference2012
178
Calculation of Water Surface Elevation Using HECRAS 4.1.0 for Fixing Tailwater Elevation for Powerhouse Site in Planned 37 MW Kabeli “A” Hydroelectric Project, NepalPathak, Surendra Raj
Figure 4: Glacial Lake Outburst Flood (GLOF), know as mountain tsunamis
Figure 5: Cross Sections of Tamor river taken for HECRAS analysis

Modeling
179
Calculation of Water Surface Elevation Using HECRAS 4.1.0 for Fixing Tailwater Elevation for Powerhouse Site in Planned 37 MW Kabeli “A” Hydroelectric Project, NepalPathak, Surendra Raj
Figure 6: Contour Map along Tamor river with cross sections for input to HECRAS geometry data

Mississippi Water Resources Conference2012
180
Calculation of Water Surface Elevation Using HECRAS 4.1.0 for Fixing Tailwater Elevation for Powerhouse Site in Planned 37 MW Kabeli “A” Hydroelectric Project, NepalPathak, Surendra Raj
Rating Curve:
Figure 7: 480 m upstream of Tailrace
Figure 8: Rating Curve 30 m upstream of Tailrace
Figure 9: 20 m downstream of Tailrace
Kabeli AH EC RAS l'llalysis 11142011 Plan: Plan New Gean: K1beli andTarmrStraigtt Reach Row: Kabeli Tanor 1-ECRAS 11142011
R'Wr = Kabe Ii ald T arm r Rea ch = 1 Olai nag e at 0..000
472 leQ!nd
470 W.S.Bev
g 488
> 486 ;11 ~
484
$ 482
480
468 0 lO00 4)00 eooo sooo 10000
OTot~ (mJ/s)
Kabeli AH EC RAS l'llalysis 11142011 Plan: Plan New Gean: K1beli andTarmrStraigtt Reach Row: Kabeli Tanor 1-ECRAS 11142011
R'Wr = Kabe Ii ald T arm r Rea ch = 1 Olai nag e at 0+460
470
488 W.S.Bev
486
g 484 >
;11 482
~ 480 $ 468
466
464 0 lO00 4)00 eooo sooo 10000
QT ot~ (mJ/s)
Kabeli A HE C RAS Analysis 11142011 Plan: P Ian New Gean: K1beli andTarmr Sniglt Reach Flow: Kabeli Tamor HECRAS 11142011
Rher= Kabel andTarmr Reach= 1 Olainage at0-1-600
4l8 Legend
4l6 W.S.Bev
g 4l4
> 4l2
"' w .; 4l0 $
458
456
454 0 2000 4000 eooo 8000 10000
QT oal (mJ/s)

Modeling
181
Figure 10: Water Surface Profile for 20 and 100 years flood frequency
Calculation of Water Surface Elevation Using HECRAS 4.1.0 for Fixing Tailwater Elevation for Powerhouse Site in Planned 37 MW Kabeli “A” Hydroelectric Project, NepalPathak, Surendra Raj
Figure 11: Cross Section Output Table for 100 years flood at extreme upstream river station 600
Kabeli A HECRAS Analysis1114 2011 P Ian: Plan New Geom:Kibel ard TarmrStraightReach Flow J.<abeli T armr HECR.AS 11142011
I Kabeli 61d T arm r 1
I 475 lege'ld
----EG 1l0Years ,. ----- EG ZlYears ------470
___ ..,_ __ ,.____,.__ ___ -- -, WS 100Years --- ----- _. ______ ,. ______ --.....,.- ------- . , --.:,:__ Crit 100Years ---1-- ---- WS 20Yeas - ------·------
5 465 Crit 20Years
C - Ground ,g • > • w
4'J
465
4'J 0 -oo 3'.JO :DJ 4)0 50J 50J 100
Main C hannel D istance ( rril
iii Cross Section Output
File Type O ption5 H elp
R ivor: J Koboli .o,nd T 6fflOf
Rcooh i 1
Plolilo. I 1 00 Y -· ...=J RS; - -----...=J _!_I ..!J Pion; i P1on Now
,,m
P l.,n P1"1nN.-w t ' ,,h~ltnndl..,mo, IR~ ,;nn Prn filr- 100Yro_.,,,..
472.02 Ea..Me<>t Lefl OB Chbn~ R OB 31B WL n-Val. 0.037 0.035 0.037
468.83 2D.20 50.00 69.60 468.83 2 42.50 511 .62 70.32
0.004785 242.50 511 .62 7D.32 sg94 QO 1193.34 4453 49 337.17
125.90 55.B1 55.10 14.99 7 .26 4,92 8 .70 4, 79
10.33 4 .35 9 .29 4 .69 86505.3 17251.0 64380. 1 4 874.2
46.29 56.79 55.35 17 .12 458.50 200.39 433.73 192.74
1.19 7877.36 000 000 0.20 156.16 352.26 1 97.87 0. 24 39.80 35.09 29.91
Tho ene,·gy oQubtion could not bo bolonced w lUW, tho S:Pecif'.ed nurnbot of tte1.ot.ons. Tho p 1og,a.m u:s-od criticfll depth fo, the w.e.ter a:urf&ee &nd continued on with the celcufotions.. The velooit,y head has changed by rnofe than O.S It (0. 15 m). Thd' may indicate the need fo, additional Ot'OS-e section1. Tho cnOfgy '°" woo g 1oote1 lhon 1 .0 fl (0 .3 m) bot""""" tho cv1tonl ond pr.,_• coott ooetoon T ._ may inocoto tho need fo, -&ddtt,on-0, c,oa-a- aoctiona~ nurin n flvl itfNV1Arrt Jtff"ITT it"1!1Afinn.11t ~ Jlvl A.ou,~,t WAfN JtlJff.N"":ft WAJI U'lf f'Y'MW fn ruilir.Al ~ t h th .... n.Mf"':1JWM

Mississippi Water Resources Conference2012
182
Calculation of Water Surface Elevation Using HECRAS 4.1.0 for Fixing Tailwater Elevation for Powerhouse Site in Planned 37 MW Kabeli “A” Hydroelectric Project, NepalPathak, Surendra Raj
Figure 12: Cross Section Output Table for 100 years flood at extreme upstream river station 600
Figure 13: Tailwater level optimization plot
Kabeli A HECRAS Analyss 11142011 Plan: Plan New Geom: Kabeli and T amor Straight Rea ch Flow. Kabel i T amo r H EC RAS 1114:a::111
o::: 90000
isoooo 270000 4 t60000
!50000 .. d4oooo
Tailwater Level Optimization
,,,.. -_,.
L / 'f"
~
., ...... ...... ~
_,. V /
-~100
/
1 i
Le<JerHI
VIB :a:J Years
VIB 1CD Yea rs
Ground •
Bank Sta
'c;30000
~20000
110000
_,; -+-Incremental Revenue ,_
... ; 0 ; 456 I.
Q. 457
' ' ' ' ' ' '
458 459 460 T ailwater Level Elevation, masl
,_
' '
461 462

Modeling
183
Assessing Water Balance Using a Hydrologic Model
Sarah Duffy, Mississippi State UniversityParajuli, P.
The availability of water within soil is fundamental to the success of agricultural, ranching, and forestry practices. The amount of water than is present within the soil column depends on climate, land use, land management practices, and soil characteristics. The objective of this study is to assess water balance parameters such as surface flow, soil moisture content, and water quality parameters using field studies and the Soil and Water Assessment Tool (SWAT) model simulations.
Two watersheds located in northeast (Town Creek, 1775.2 km2) and central (Upper Pearl River, 7,588 km2) Mississippi were chosen as the focus of this study. Soil samples from four fields of varying land use were collected monthly and analyzed to determine actual soil water content. Theoretical soil water content was predicted by developing two independent computational models using SWAT. The models were calibrated and validated using monthly stream flow data obtained from USGS gauging stations. Field-observed soil water content and model-predicted soil water content was analyzed statistically. Further model-simulated uncalibrated water balance and water quality outputs will be presented.

Mississippi Water Resources Conference2012
184

Water Quality
R.H. CoupeU.S. Geological Survey
The Fate and Transport of Glyphosate and AMPA into Surface Waters of Agricultural Watersheds
Claire RoseU.S. Geological Survey
A Holistic Assessment of the Occurrence of Metolachlor and 2 of its Degradates Across Various Environmental Compartments in 7 Environmental Settings
Cory M. ShoemakerMississippi State University
Assessing a Novel Method for Verifying Automated Oxidation-Reduction Potential Data Loggers: Laboratory and Field Tests
Matthew B. HicksU.S. Geological Survey
Using Dissolved Oxygen Dynamics to Derive Nutrient Criteria: Tried, True, and Troublesome
Wat
er Q
ualit
y

Mississippi Water Resources Conference2012
186
The Fate and Transport of Glyphosate and AMPA into Surface Waters of Agricultural
WatershedsR.H. Coupe, U.S. Geological Survey
Rose, C.; Welch, H.; Manning, M.
Glyphosate [N-(phosphonomethyl)glycine] is a herbicide used widely throughout the world in the production of many crops and is predominately used on soybeans, corn, potatoes, and cotton that have been genetically modified to be tolerant to glyphosate. Glyphosate is used extensively in almost all agricultural areas of the United States. The agricultural use of glyphosate has increased from less than 10,000 Mg in 1992 to more than 80,000 Mg in 2007. The greatest areal use is in the Midwest where glyphosate is applied on transgenic corn and soybeans. Yet the characterization of the transport of glyphosate on a watershed scale is lacking. Glyphosate and its degradate AMPA were frequently detected in the surface waters of 4 agricultural watersheds. The load as a percent of use ranged from 0.009 to 0.86 percent and could be related to 3 factors: source strength, hydrology, and flowpath. Glyphosate use in a watershed results in some occurrence in surface water at the part per billion level, however, those watersheds most at risk for the offsite transport of glyphosate are those with high application rates, rainfall that results in overland runoff, and a flowpath that does not include transport through the soil.

Water Quality
187
A Holistic Assessment of the Occurrence of Metolachlor and 2 of its Degradates Across Various Environmental Compartments in 7
Environmental SettingsClaire Rose, Mississippi State University
Welch, H.; Coupe, R.; Capel, P.
The widely used herbicide, metolachlor, is one of the most frequently detected pesticides in surface water and groundwater throughout the United States in both agricultural and urban settings. Metolachlor has also been detected in rain and in the unsaturated zone. The U.S. Geological Survey conducted a study to assess the controlling factors in the transport and fate of metolachlor and its degradates across seven watersheds in California, Indiana, Iowa, Maryland, Mississippi, Nebraska, and Washington during 1997-2007. The occurrence of metolachlor and two degradates (metolachlor ethane-sulfonic acid and metolachlor oxanilic acid) was examined in several environmental compartments within these environmental settings; groundwater, surface water, overland flow, subsurface drains, the unsaturated zone, and the atmosphere. Within these environmental compartments, the occurrence of metolachlor and its degradates primarily is affected by a number of factors including use, management, environmental setting, and physical and chemical properties of metolachlor and its degradates. The fate of metolachlor can be generalized by the environmental compartments. The majority (90%) of metolachlor is taken up by plants, degraded in the soil, or is trapped in/adsorbed to soil. About 10% of the applied metolachlor is volatilized into the atmosphere, and about 0.3% returns by rainfall. Some (0.4%) metolachlor is transported to surface water, while an equal amount (0.4%) is infiltrated into the unsaturated zone and may move downward into groundwater. Generally, groundwater stores less than 0.02% and does not serve as a metolachlor source to receiving surface waters.

Mississippi Water Resources Conference2012
188
Assessing a Novel Method for Verifying Automated Oxidation-Reduction Potential Data Loggers: Laboratory and Field Tests
Cory M. Shoemaker, Mississippi State UniversityKröger, R.; Pierce, S.
IntroductionOxidation-reduction (redox) reactions are reactions involving the exchange of electrons between chemical species. Oxidation or the loss of electrons occurs simultaneously with reduction or the gain of electrons and these redox reactions comprise virtually all biological and many inorganic reactions in the soil (Bohn et al., 2001). The exchange of electrons from oxidized species to reduced ones creates an electrical potential in the soil (Mitsch and Gosselink, 2000), known as redox potential (Eh). Redox potential regulates many biogeochemical reactions in the soil (Reddy and DeLaune, 2008) and low Eh values are a distinguishing characteristic of wetland soils. When oxygen and subsequent compounds are removed from the soil, a Eh gradient is established as facultative anaerobes reduce energetically less favorable chemical species during the final stage of respiration. These gradients can be measured to better predict biogeochemical processes occurring in the soil. The standard method to record Eh of soils involves measuring the voltage difference between a Pt
tipped soil electrode and a reference electrode (e.g. single-junction reference electrode - AgCl, calomel, salt bridge) inserted directly into the soil (Rabenhorst et al., 2009). The values are then read by a handheld meter and the voltages corrected to account for the specific reference electrode employed and the resulting voltages recorded as Eh. Although this method is often employed, it has several distinct limitations. Redox potential varies both temporally at scales ranging from hours to days to seasons and spatially. In measuring soil Eh, Pt tipped electrodes have been found to only characterize the conditions occurring in the 1 mm3 surrounding the tip of the probe (Fielder et al., 2007). Thus, single Eh measurements potentially overlook dynamic spatial and temporal fluxes in soil Eh. Additionally, the manual collection of data may not always be practical or possible due to site location, weather or events such as flooding. The automated nature of the new units mitigates problems associated with data collection by minimizing visits to sites and units can securely store data indefinitely if conditions do not allow for unit
Redox potential describes the electrical pressure of systems. In waterlogged soils, Eh is an important parameter for regulating the products of biogeochemical cycling. Until recently, Eh was measured at individual points us-ing an electrode attached to a voltmeter. This method can overlook dynamic diel and short term fluxes in the environment. Automated data loggers enable long-term continuous monitoring of Eh in soils; however, no pro-tocol has been developed for testing the accuracy and precision of these loggers. Automated data loggers were tested under a laboratory with known voltages to assess the ability of these units to record Eh precisely and accurately. Voltages of +450 and -450 mV were applied to four loggers with four Eh sensors five times at and voltages of +400 and -400 mV across units plus probes. The average measured voltages had an error of less than 10% and with a maximum range of ± 16 mV. The voltage averages of all units and probes were ac-curate within 2.5% and had a maximum range of ± 3.66 mV. Field data obtained from the automated data loggers in vegetated and non-vegetated control plots were able to record diel Eh fluxes in vegetated plots over a period of 72 hours. The loggers thus have the potential to be used to characterize in situ soil Eh condi-tions across larger areas and time frames than previously possible.

Water Quality
189
extraction at the specified time. Finally, since Eh is sensitive to water pressure, the mere presence of an observer near the measuring location may induce errors in the subsequent Eh measurements by increasing the pressure of water in the soil (Vorenhout et al., 2004). Although automated data loggers had been previously developed (Vorenhout et al., 2004; Rabenhorst et al., 2009; Vorenhout et al., 2011), the accuracy and precision of these units has not yet been tested. In this paper we seek to outline testing procedures for accuracy and precision, determine if the units both accurate and precise, and to field test the units to document their ability to record in situ Eh values.
MethodsIn order to address these shortcomings, an automated data logger design was developed in the electrical engineering department at Mississippi State University. Data loggers were specified to support input from five temperature probes, four analog soil probes, and one reference probe and were capable of taking Eh measurements over short intervals of either one or twenty minutes. The unit was powered by three AAA batteries and recorded data on removable USB drives. After closing a circuit to measure and sending a current through the unit to take a data point, the unit would enter a “sleep mode” where the circuit would be opened, stopping current flow and data recording. This feature allowed for long-term deployment field (<10 days) by saving battery life. These units addressed the main shortcoming of standard Eh measurements by allowing Eh to be taken simultaneously at four sites in the soil column at short intervals over an extended period of time without the presence of an operator. Data could then be recovered when convenient, and, if desired, batteries replaced and the unit left to continue monitoring the site.
Standard Pt tipped soil probes were developed following the methods outlined by Wafer et al. (2004). Upon completion, the probes were connected to an Ethernet cable and temperature
probe, allowing for transmission of data to the automated data logger. Single junction reference probes of either AgCl (Thermo Scientific, Waltham MA) or LD-15 construction grade reference (Castle Electronics, UK) model were also attached to Ethernet cables and a temperature probe.
In order to assess the units’ accuracy and precision, four constructed units, sets of soil probes and single junction and LD-15 reference probes were tested in both laboratory and field settings. Before testing began, accepted accuracy was defined as less than 10% error from known values. Precision was determined a priori to be ± 20 mV of all other recorded points. An Ethernet test cord was attached to input channel on each unit and connected to a DC power supply (1710A 30V/1A DC Power Supply, BK Precision). Five voltages each of positive and negative 450 mV were applied to each of soil probe channel and readings were recorded. Constructed probes were then connected to the unit and five voltages each of positive and negative 400 mV were administered to each probe and results recorded. To test the ability of the continuous automated data loggers to measure voltages in an aqueous solution, two automated data loggers were set into a +225 mV ORP solution (Sensorex) as suggested by Nordstrom and Wilde (1998), with one logger using a single junction reference electrode (AgCl) and the other using a LD-15 construction grade reference electrode.
Field testing occurred in a vegetated agricultural drainage ditch located at the South Farm Aquaculture facility on the campus of Mississippi State University and in constructed mesocosms at the USDA National Sedimentation Laboratory in Oxford, Mississippi. In the agricultural drainage ditch, four test plots were set up; with above and below ground vegetation being removed in two of the four plots two weeks before testing began. Automated data logging units were deployed on November 9th, 2011 with all probes placed to a depth of 7 cm. Units were set to take
Assessing a Novel Method for Verifying Automated Oxidation-Reduction Potential Data Loggers: Laboratory and Field TestsShoemaker, Corey M.

Mississippi Water Resources Conference2012
190
measurements every 20 minutes for the 72 hour duration of the run. Mesocosms were planted with either Myriophyllum aquaticum (Vell.) Verdc. or Leersia oryzoides L. Sw. six months prior to testing and inundated one week before to probe deployment. In the mesocosms, two of the logger’s four probes were placed to a depth of 5 cm and the remaining two to a depth of 10 cm in the soil. All units were set to 20 minute data recording intervals and allowed to run for 72 hours.
ResultsAll four units tested were found to be accurate within 10% of the accepted value and precise to within 16 mV for average measurements. Similarly, when probes were attached to the logging units, the combination of the probe and unit were accurate to 2.5% and precise (within 3.66 mV) for all probe combinations and voltage charges. In the +225 mV ORP solution, the unit equipped with the AgCl probe exceeded the accepted 10% error by up to 3 mV. In the contrast, all values recorded by the unit equipped with the LD-15 construction grade reference electrode were within ±13 mV of the expected value. Precision was within the accepted range for each unit. From these data, the continuous short interval automated data loggers were shown to be both accurate and precise under laboratory conditions.
In the agricultural drainage ditch the units took approximately 24 hours to equilibrate. In comparing the vegetated and non-vegetated plot, the vegetated plot (Figure 1) shows strong diel fluctuations in soil redox at multiple channels not present in the non-vegetated plot (Figure 2). Three of the four soil probes of the vegetated plot unit showed simultaneous increases in Eh starting between 9:00 and 11:00 AM. Interestingly, each of the three soil probes mirror the Eh changes of the others almost exactly, with only the magnitude of the change being different between the probes. In contrast, the measurements from the non-vegetated plot did not contain any pronounced diel fluxes or any trends across all soil probes.
In further testing, units deployed in the vegetated mesocosms displayed similar trends in fluctuations in soil redox were observed as the agricultural ditch’s vegetated plot. Both units in the M. aquaticum (Figure 3) and L. oryzoides (Figure 4) plots showed a 24 equilibration period and strong diel fluxes. Both species showed similar fluxes in Eh, with the rise of Eh commencing at approximately 10:00 in both mesocosms. This pattern was observed occurring over two days. However, the rise in Eh was of 40 minutes longer in M. aquaticum than L. oryzoides. In both M. aquaticum and L. oryzoides mesocosms, an increase in temperature occurred nearly simultaneously with the rise in Eh. In M. aquaticum, Eh decreased as temperature decreased, while L. oryzoides had Eh increases of shorter duration and began to return to base levels before temperature began to decrease.
DiscussionAutomated data loggers have been shown to be accurate, precise, and able to elucidate cycles in soils. Our observations of strong diel Eh cycles in vegetated plots may be the probes picking up the presence of oxidized rhizospheres or the leaking of oxygen from the roots (Jaynes and Carpenter, 1986; Flessa, 1994; Sorrell and Armstrong, 1994; Eriksson and Weisner, 1999; Sima et al., 2009; Pierce and Pezeshki, 2010; Dong et al., 2011). The physiological adaptation of aerenchyma of macrophytes transports oxygen from the atmosphere to soils in order to mitigate the toxic effects associated with heavily reduced soils (DeLaune and Pezeshki, 2001) creating oxic zones in anoxic environments (Nikolausz et al., 2008). In soils colonized by macrophytes, Eh cycles may be caused by daily changes in light intensity, resulting in an increase in photosynthetic activity in plants (Flessa, 1994) and the corresponding transport of oxygen to the soil by those plants thus creating oxidized rhizospheres. If standard Eh measurements were employed, this trend in Eh may not have been observed. The versatility of continuous automated data loggers allow them to be used in a wide variety of study environments, from mesocosms (Vorenhout et al.,
Assessing a Novel Method for Verifying Automated Oxidation-Reduction Potential Data Loggers: Laboratory and Field TestsShoemaker, Corey M.

Water Quality
191
2004; Rabenhorst et al., 2009), laboratory studies (van Bochove et al., 2002), sewage reclamation basins (Eshel and Banin, 2002) and tidal wetlands (Catallo, 1999). The use of these loggers allows for convenient collection of accurate and precise soil Eh data. These loggers can be used to describe bulk soil electrical properties in order to better characterize chemical transformations occurring in different spatial and temporal environments.
Acknowledgements Funding for this project was gratefully provided by the Mississippi Alabama Sea Grant Consortium Award # NA10OAR4170078 and the Environmental Protection Agency – Gulf of Mexico Program Office, agreement number MX-95460110. We thank the Mississippi State Forest and Wildlife Research Center for personnel and administrative support as well as the electrical engineering students for their help in constructing the data loggers.
ReferencesBohn, H.L., McNeal, B.L., O’Conner, G.A., 2001. Soil chemistry. John Wiley and Sons, New York.
Catallo, W.J., 1999. Hourly and daily variation of sediment redox potential in tidal wetlands. In: Survey, U.S.G. (Ed.). Biological Resources Division Biological Sciences Report, Lafayette, LA.
DeLaune, R.D., Pezeshki, S.R., 2001. Plant functions in wetland and aquatic systems: influence of intensity and capacity of soil reduction. The Scientific World 1, 636-649.
Dong, C., Zhu, W., Zhao, Y.Q., Gao, M., 2011. Diurnal fluctuations in root oxygen release rate and dissolved oxygen budget in wetland mesocosm. Desalination 272, 254-258.
Eriksson, P.G., Weisner, S.E.B., 1999. An experimental study on effects of submersed macrophytes on nitrification and denitrification in ammonium-rich systems. Journal of Limnology and Oceanography 44, 1993-1999.
Eshel, G., Banin, A., 2002. Feasibility study of long-term continuous field measurement of soil redox potential Communications in Soil Science and Plant Analysis 33, 695-709.
Fielder, S., Vepraskas, M.J., Richardson, J.L., 2007. Soil redox potential: importance, field measurements, and observations. Advances in Agronomy 94, 1-54.
Flessa, H., 1994. Plant-induced changes in the redox potential of the rhizospheres of the submerged vascular macrophytes Myriophyllum verticillatum L. and Ranunculus circinatus L. Aquatic Botany 47, 119-129.
Jaynes, M.L., Carpenter, S.R., 1986. Effects of vascular and nonvascular macrophytes on sediment redox and solute dynamics Ecology 67, 875-882.
Mitsch, W.J., Gosselink, J.G., 2000. Wetlands. Wiley & Sons, New York.
Nikolausz, M., Kappelmeyer, U., Szekely, A., Rusznyak, A., Marialigeti, K., Kastner, M., 2008. Diurnal redox fluctuation and microbial activity in the rhizosphere of wetland plants. European Journal of Soil Biology 44, 324-333.
Nordstrom, D.K., Wilde, F.D., 1998. Reduction-oxidation potential (electrode Method). In: Wilde, F.D., Radtke, D.B., Gibs, J., Iwatsubo, R.T. (Eds.), National Field Manual for the Collection of Water-Quality Data.
Pierce, S.C., Pezeshki, S.R., 2010. Vegetation in agricultural ditches: limitations to establishment, productivity and ecosystem functioning. In: Moore, M.T., Kroger, R. (Eds.), Agricultural Drainage Ditches: Mitigation Wetlands for the 21st Century. Research Signpost, Kerala, India, pp. 75-106.
Rabenhorst, M.C., Hivley, W.C., James, B.R., 2009. Measurements of soil redox potential. Soil Science
Assessing a Novel Method for Verifying Automated Oxidation-Reduction Potential Data Loggers: Laboratory and Field TestsShoemaker, Corey M.

Mississippi Water Resources Conference2012
192
Society of America Journal 73, 668-674.
Reddy, K.R., DeLaune, R.D., 2008. Biogeochemistry of wetlands: science and applications CRC Press, Boca Raton, FL.
Sima, J., Diakova, K., Pavelcova, L., Havelka, M., 2009. Redox properties of a constructed wetland: theoretical and practical aspects. Chemistry and Biodiversity 6, 341-355.
Sorrell, B.K., Armstrong, W., 1994. On the difficulties of measuring oxygen release by root systems of wetland plants Journal of Ecology 82, 177-183.
van Bochove, E., Beauchemin, S., Theriauly, G., 2002. Continuous multiple measurements of soil redox potential using platinum microelectrodes Soil Science Society of America Journal 66, 1813-1820.
Vorenhout, M., van der Geest, H.G., Ellard, R.H., 2011. An improved datalogger and novel probes for continuous redox measurements in wetlands. International Journal of Environmental Analytical Chemistry 91, 801-810.
Vorenhout, M., van der Geest, H.G., van Marum, D., Wattel, K., Eijsackers, H.J.P., 2004. Automated and continous redox potential measurements in soil. Journal of Environmental Quality 33, 1562-1567.
Wafer, C.C., Richards, J.B., Osmond, D.L., 2004. Construction of platinum-tipped redox probes for determining soil redox potential. Journal of Environmental Quality 33, 2375-2379.
Assessing a Novel Method for Verifying Automated Oxidation-Reduction Potential Data Loggers: Laboratory and Field TestsShoemaker, Corey M.

Water Quality
193
Assessing a Novel Method for Verifying Automated Oxidation-Reduction Potential Data Loggers: Laboratory and Field TestsShoemaker, Corey M.
-250
-200
-150
-100
-50
0
50
100
15017
:01:
42
20:0
1:42
23:0
1:42
2:01
:42
5:01
:42
8:01
:42
11:0
1:42
14:0
1:42
17:0
1:42
20:0
1:42
23:0
1:42
2:01
:42
5:01
:42
8:01
:42
11:0
1:42
14:2
1:42
Time
Eh (m
V)
SP1 7cm
SP3 7cm
SP4 7cm
Figure 1: Eh recorded by soil probes in a vegetated plot in an agricultural drainage ditch at Mississippi State University. All probes were placed to a depth of 7 cm for a period of 72 hours.
-400
-300
-200
-100
0
100
200
300
15:04
:44
20:04
:44
1:04:4
4
6:04:4
4
11:04
:44
16:04
:44
21:04
:44
2:04:4
4
7:04:4
4
12:04
:44
Time
Eh (m
V)
SP1 7cmSP2 7cmSP3 7cmSP4 7cm
Figure 2: Eh recorded by soil probes in a non-vegetated plot in an agricultural drainage ditch at Mississippi State University. All probes were placed to a depth of 7 cm and measurements occurred over a period of approx. 72 hours.
-250
-200
-150
-100
-50
0
50
100
150
17:0
1:42
20:0
1:42
23:0
1:42
2:01
:42
5:01
:42
8:01
:42
11:0
1:42
14:0
1:42
17:0
1:42
20:0
1:42
23:0
1:42
2:01
:42
5:01
:42
8:01
:42
11:0
1:42
14:2
1:42
Time
Eh (m
V)
SP1 7cm
SP3 7cm
SP4 7cm
Figure 1: Eh recorded by soil probes in a vegetated plot in an agricultural drainage ditch at Mississippi State University. All probes were placed to a depth of 7 cm for a period of 72 hours.
-400
-300
-200
-100
0
100
200
300
15:04
:44
20:04
:44
1:04:4
4
6:04:4
4
11:04
:44
16:04
:44
21:04
:44
2:04:4
4
7:04:4
4
12:04
:44
Time
Eh (m
V)
SP1 7cmSP2 7cmSP3 7cmSP4 7cm
Figure 1: Eh recorded by soil probes in a vegetated plot in an agricultural drainage ditch at Mississippi State University. All probes were placed to a depth of 7 cm for a period of 72 hours.
-
-I
.......___ ______ __ -
..... ...... . . _,_ -.. --- --.. - . - . - - - - - - -;-~ . ' \. /\., - --- -
I . --___ ....,,,,..,,
- ,- .. - .
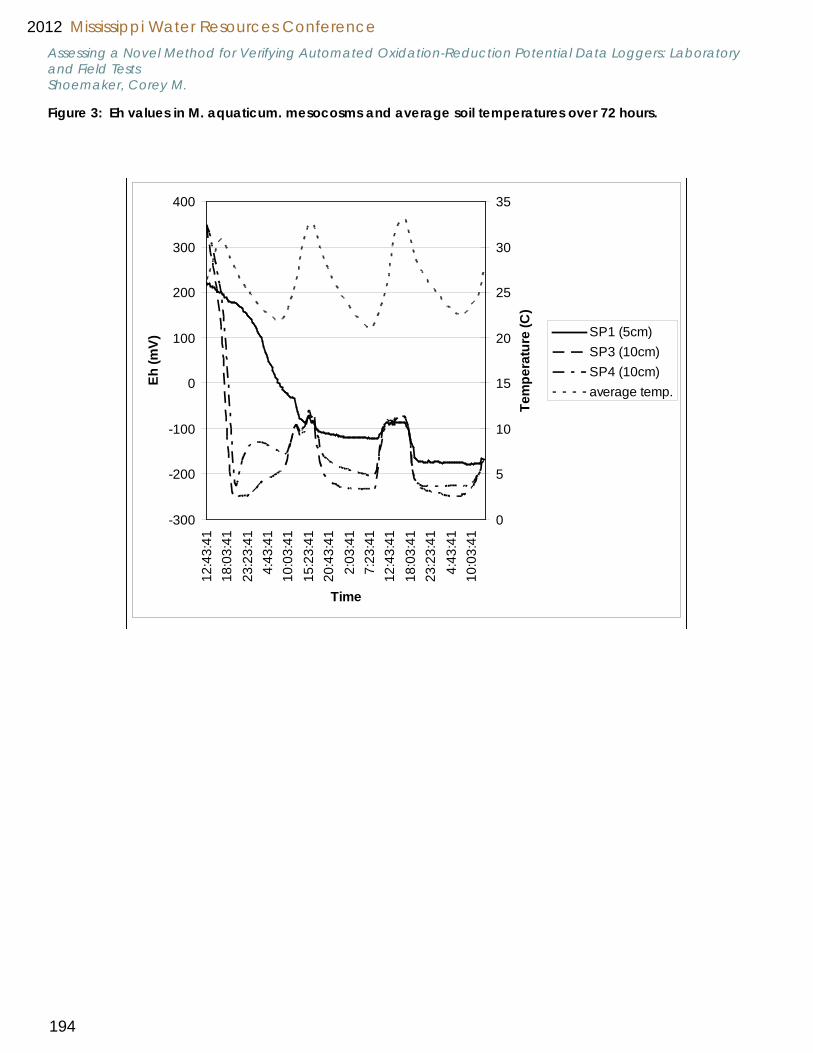
Mississippi Water Resources Conference2012
194
Assessing a Novel Method for Verifying Automated Oxidation-Reduction Potential Data Loggers: Laboratory and Field TestsShoemaker, Corey M.
Figure 2: Eh recorded by soil probes in a non-vegetated plot in an agricultural drainage ditch at Mississippi State University. All probes were placed to a depth of 7 cm and measurements occurred over a period of approx. 72 hours.
-300
-200
-100
0
100
200
300
40012
:43:
4118
:03:
4123
:23:
414:
43:4
110
:03:
4115
:23:
4120
:43:
412:
03:4
17:
23:4
112
:43:
4118
:03:
4123
:23:
414:
43:4
110
:03:
41
Time
Eh (m
V)
0
5
10
15
20
25
30
35
Tem
pera
ture
(C)
SP1 (5cm)SP3 (10cm)SP4 (10cm)average temp.
Figure 3: Eh values in M. aquaticum. mesocosms and average soil temperatures over 72 hours.
Figure 3: Eh values in M. aquaticum. mesocosms and average soil temperatures over 72 hours.
' . I •
; . ,
., \" / - ,.,, _,
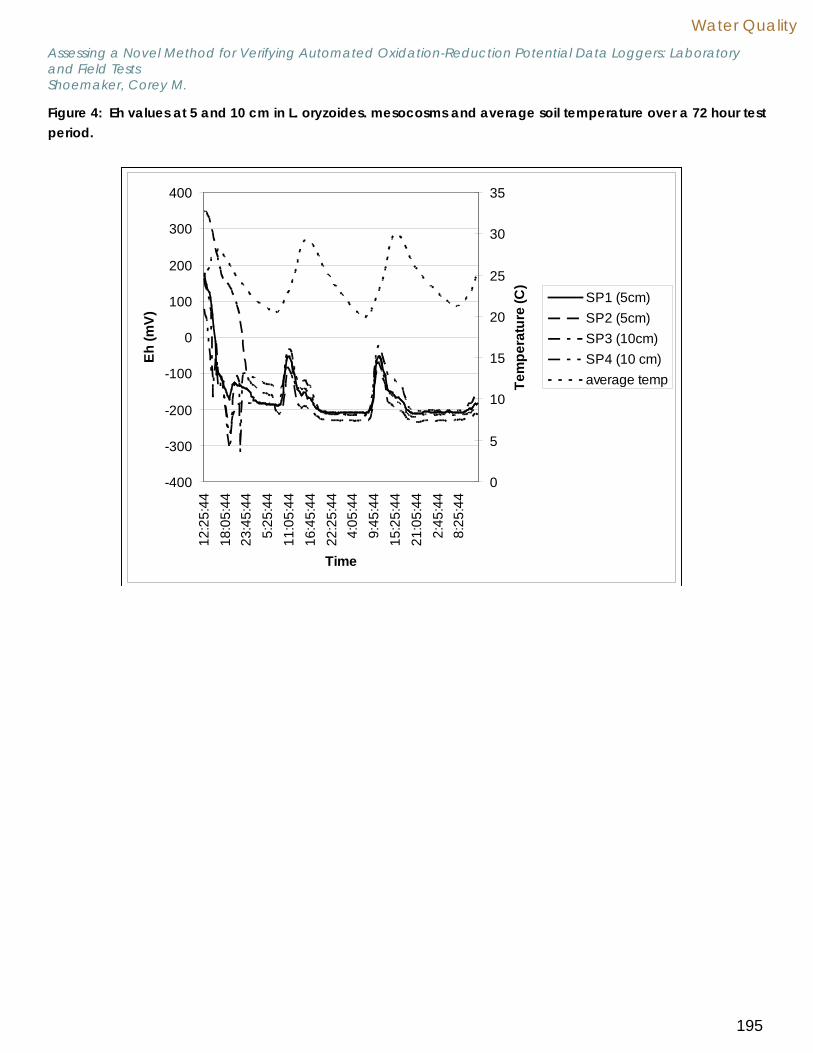
Water Quality
195
-400
-300
-200
-100
0
100
200
300
40012
:25:
4418
:05:
4423
:45:
445:
25:4
411
:05:
4416
:45:
4422
:25:
444:
05:4
49:
45:4
415
:25:
4421
:05:
442:
45:4
48:
25:4
4
Time
Eh (m
V)
0
5
10
15
20
25
30
35
Tem
pera
ture
(C)
SP1 (5cm) SP2 (5cm)SP3 (10cm)SP4 (10 cm)average temp
Figure 4: Eh values at 5 and 10 cm in L. oryzoides. mesocosms and average soil temperature over a 72 hour test period.
Assessing a Novel Method for Verifying Automated Oxidation-Reduction Potential Data Loggers: Laboratory and Field TestsShoemaker, Corey M.
Figure 4: Eh values at 5 and 10 cm in L. oryzoides. mesocosms and average soil temperature over a 72 hour test period.
\ I~'
# \ •
\ ·.
I •
'
• '
' ·~ ,------,c---L_ ____ _'_'~-_JLJ

Mississippi Water Resources Conference2012
196
Using Dissolved Oxygen Dynamics to Derive Nutrient Criteria: Tried, True, and Troublesome
Matthew B. Hicks, Mississippi State UniversityPaul, M.; Caviness, K.
Linking nutrient enrichment to adverse ecological effects involves a series of potential causal pathways and proximal stressors. A common proximal stressor is alteration of dissolved oxygen dynamics due to enriched organic matter loading and decomposition. Predictions associated with nutrient enrichment include both the potential for reduced minimum oxygen concentrations, as well as, increased maximum dissolved oxygen and diel fluctuation. Several states have expressed interest in and used oxygen range as a potential response metric. The U.S. Geological Survey sampled more than 50 low gradient Mississippi streams for the period 2009 to present and analyzed samples for dissolved oxygen and nutrients. Several oxygen characteristics were calculated (min, max, range, mean, sd) and related to concurrent nutrient, chlorophyll, and invertebrate assemblage data. All measures of oxygen showed some relation to nutrient concentrations; however, minimum and central tendency measures were most strongly related. At the same time, invertebrate metrics showed a stronger response to minimum concentration among all other measures.

Delta Water Conservation
Joseph H. MasseyMississippi State University
Water-Conserving Irrigation Systems for Furrow & Flood Irrigated Crops in the Mississippi Delta
Robert G. ThortonMississippi State University
Modeling the Potential for Replacing Groundwater with Surface Water for Irrigation by Using On-Farm Storage Reservoirs in the Mississippi Delta
Shane PowersU.S. Geological Survey
Technologies and Methods to Aid the Adoption of PHAUCET Irrigation in the Mississippi Delta
Brandon RiceUniversity of Mississippi
MIST: A Web-Based Irrigation Scheduling Tool for Mississippi Crop Production
Del
ta W
ater
Con
serv
atio
n

Mississippi Water Resources Conference2012
198
Water-Conserving Irrigation Systems for Furrow & Flood Irrigated Crops in the Mississippi Delta
Joseph H. Massey, Mississippi State University
The goal of this project was to determine the feasibility of using multiple inlet plus intermittent irrigation to reduce water and energy use in Mid-south rice irrigation. Intermittent rice flooding improves rainfall capture and reduces over-pumping by maintaining rice flood heights at less-than-full levels. Depending on soil conditions, weather, and crop stage, the targeted intermittent pumping pattern allows the flood to naturally subside over a period of five to ten days before re-initiating irrigation, resulting in a fully saturated (not dry) soil surface. Field studies are being conducted at four Mississippi producer locations location in Boliver, Coahoma, and Sunflower counties in the Mississippi River Valley delta. Seasonal water use was measured using flow meters in commercial rice fields ranging in size from ~30 to 70 acres. Rainfall inputs were determined using rain gauges at each field location. Rough rice yield and grain quality determined for the upper and lower portions of each paddy of each field were not different, indicating that intermittent flooding does not result in agronomic losses relative to continuous flood. The studies show that when coupled with multiple inlet irrigation, intermittent rice irrigation uses ~20% less water than multiple inlet irrigation alone and only ~5% more than zero-grade irrigation. Having no slope, zero-grade fields are the ‘gold standard’ for Mid-south rice production in terms of water use. The advantage of the intermittent flood over zero-grade is that water-logging of rotational crops often associated with zero-grade fields is avoided. Rice is typically grown with soybean in a 1-yr rice, 2-yr soybean rotation. The presentation will also summarize results from using the USDA’s Phaucet irrigation optimization program designed to improve soybean irrigation efficiency.

Delta Water Conservation
199
Modeling the Potential for Replacing Groundwater with Surface Water for Irrigation by Using On-Farm Storage Reservoirs in the
Mississippi DeltaRobert G. Thorton, Mississippi State University
Pote, J.; Wax, C.
A groundwater conservation strategy is proposed in this research, the use of surface water in lieu of groundwa-ter for irrigation. Previous research shows the effectiveness of using stream water in lieu of groundwater on fields located within one-quarter mile of a stream, and the effectiveness of capturing rainfall in catfish ponds. This research proposes another form of surface water capture -- that of on-farm storage reservoirs, which may be as simple as large ditches which will serve to capture precipitation and tailwater.
A model was developed for optimizing the size of on-site water retention structures (ditches) to capture rainfall on agricultural fields in the Mississippi Delta. The climatological driver for the model is precipitation minus 0.8 pan evaporation, which is then adjusted by a crop coefficient to produce an irrigation demand value based on the age of the crop. The model uses long-term weather records (50 years of daily data) to estimate daily values of these climatological inputs, which are then summed to weeks through the year. Total field irrigation demand, ditch demand, ditch volume, overflow, and ground water used are outputs of the model, calculated accord-ing to specified field size and ditch volume. The percentage of required irrigation demand that is met by rain stored in the ditch is calculated weekly for the entire growing season.
Field acreage, runoff coefficient, ditch acreage, and ditch depth are interactive inputs in the model. Outputs of the model recalculate as inputs are changed. Optimization is achieved when groundwater use is minimized, annual overflow is minimized, and the smallest possible amount of the field is used for the ditch. Previous re-search assessed the impact of crop type and irrigation system on aquifer volume and showed that the aquifer could be reduced in volume by as much as 1,500,000 A-F over the next 50 years under current practices. This study shows that if only 10% of Delta producers adopted the 95:5 ratio on-farm surface water storage scheme for irrigation, that decline in volume in the aquifer could be reduced to 100,000 A-F over the same time period. If 15% of producers adopted the scheme, the aquifer could become stable in about seven years, and totally sustainable in about 25 years.
Introduction Agricultural producers in Mississippi are increasingly relying on irrigation to insure that crops receive the right amount of water at the right time to enhance yields. The Mississippi River Valley Shallow Alluvial Aquifer (MRVA) is the most heavily developed source of groundwater in the Mississippi Delta region and the entire state (Figure 1). The aquifer is heavily used for irrigation of corn, soybeans, and cotton, as well as for rice flooding and filling aqua-
culture ponds in the prominent catfish industry. Demand for the groundwater resource continues to grow at a rapid rate (Figure 2).
Water volume in the aquifer is subject to seasonal declines and annual fluctuations caused by both climatological and crop water use variations from year-to-year. These declines can be dramatic and are most notable during the period April-October of each year, particularly in years when normal

Mississippi Water Resources Conference2012
200
crop water demands are accentuated by concur-rent abnormally dry climatic conditions. Recharge during the remainder of the year has recently been insufficient to restore water volume, and the aqui-fer is now being mined at the approximate rate of 300,000 acre-feet per year (Figure 3). To under-score the urgent nature of this water problem, it is estimated that about 35,000 new acres are cur-rently being brought into irrigated production each year (Pennington, 2011).
It is of critical importance to understand how clima-tological variability and cultural uses of the water cause the groundwater volume in the aquifer to vary. It is also critical to discover and implement management strategies such as changing irrigation methods and using precipitation and other surface water sources as substitutes for aquifer withdrawals, thereby reducing the use of groundwater in the re-gion. Stopping the consistent drop in water volume in the aquifer will require a curtailment averaging about 300,000 acre-feet of groundwater use each year, and the highest priority of this research project is to find and recommend solutions to this problem. This information is essential to agricultural producers in the region and to planners in the Yazoo Mississippi Delta Joint Water Management District who must design sustainable water use scenarios which will al-low continuation of the productivity of the region.
The objective of this research is to augment an ex-isting climatological model to assess the effective-ness of capturing precipitation in on-farm storage structures to use in place of groundwater for irriga-tion, and thereby conserve groundwater. This is the fourth phase of an on-going project to identify and recommend management strategies to curtail the drawdown in the MRVA and make the resource more sustainable. In phase one of the project, the growing season precipitation was used to develop a relationship that estimated irrigation use, and this was the driving mechanism of the model that simulated water use to the year 2056. Phase two added the use of surface water when growing sea-
son precipitation was 30% or more above normal and a field was within a quarter-mile buffer around a stream. In the third phase, a new climatologi-cal input was introduced into the model—irrigation demand. Irrigation demand was calculated using daily precipitation, evaporation, and a crop coef-ficient to estimate daily water needs by crop type (Wax, et al, 2010). Daily values were summed to one week segments which were added to derive the total growing season irrigation demand. Weekly summations increased temporal resolution, improv-ing model efficiency in accounting for excess daily rainfall, allowing the model to apply excess rainfall in subsequent days. As stated above, phase four introduces the potential of using on-farm structures (ditches, reservoirs) built specifically to capture rain-fall and irrigation tailwater for use in lieu of ground-water for irrigation.
Background InformationAgriculture is the major water consumer in the southeast region, and aquaculture specifically has the potential to become disproportionately consumptive. For example, most row crops in the region require 30-40 cm/yr, whereas catfish farming requires up to 100 cm/yr under current practices. In the Delta region of Mississippi where nearly 60% of U.S. farm raised catfish are produced, catfish pro-duction accounts for about 28% of all water used (Pennington, 2005).
Research to reduce reliance on groundwater in aquaculture has shown remarkable potential reductions in groundwater through use of man-agement strategies to create storage capacity which can capture rainfall to keep ponds filled. For example, studies show the potential to reduce con-sumption of groundwater in delta catfish ponds by nearly 70% annually through precipitation capture (Pote and Wax, 1993; Pote, et al, 1988; Cathcart et al, 2007). Extension Services in Alabama and Louisiana include variations of those strategies as industry best management practices for reducing groundwater use in those states (Auburn University,
Modeling the Potential for Replacing Groundwater with Surface Water for Irrigation by Using On-Farm Storage Reservoirs in the Mississippi DeltaThornton, Wax, Pote

Delta Water Conservation
201
Modeling the Potential for Replacing Groundwater with Surface Water for Irrigation by Using On-Farm Storage Reservoirs in the Mississippi DeltaThornton, Wax, Pote
2002; LCES, 2003). In rice production, straight levee systems and use of multiple inlets have been shown to be specific irrigation methods that significantly reduce water use (Smith et al, 2006). Intermittent (wet-dry) irrigation has been shown to reduce water use and non-point source runoff by up to 50% with no yield losses in Mississippi field trials (Massey et al, 2006). Massey (Personal Communication, 2010) states that conserving one inch of pumped ground-water saves producers 0.7 gallons of diesel per acre or 34 kilowatt hours of electricity per acre.
MethodsFor phases one, two, and three of the research, climatological data, crop coefficient formulas, crop data, and water use data for the growing season were collected. Growing season was defined as May through August. In this study, all but the evaporation data were collected and analyzed for Sunflower County, MS. It was assumed that climate and cultural land uses (crops, acreages, irrigation methods) in Sunflower County were representative of the entire Delta region. These data were used in a model that was developed to identify and account for relationships between climatological variability and cultural water use. The model is in-teractive, allowing the user to change input values and alter the final output, thus allowing for specific scenarios to be simulated. Successive alternative combinations of variables were simulated with the model to determine possible methods and strate-gies to aid in groundwater conservation and man-agement (Wax, et al, 2010).
Climatological Data-The precipitation record from Moorhead, MS (lo-cated centrally in Sunflower County) and the evaporation record from Stoneville, MS were used in the analysis. The data were arrayed in an Excel spreadsheet, and missing data were identified. Gaps in the data were filled with data from the next-nearest climate station location. The result was a serially complete and homogeneous daily record of precipitation and evaporation from 1961-
2010. The evaporation data were used to represent potential evaporation (PE), or the demand of the atmosphere for water. To include consideration for the physiological demand of different crops at dif-ferent phenological stages, the PE was modified by crop coefficients. Crop coefficient formulas-The SCS (1970) established consumptive crop use coefficient curves for a variety of crops. Ranjha and Ferguson (1982) matched these values with curves of best fit and derived the following equa-tions to calculate a crop coefficient for three crops, using crop age in days from emergence as input:
CC (Soybeans) = 0.21-(2.97)(DAY)10-3+(4.74)(DAY)210-4-(4.03)(DAY)310-6
CC (Corn) = 0.12+(0.01)(DAY)+(0.18)(DAY)210-3-(2.05)(DAY)310-6
CC (Cotton) = 0.11-(0.011)(DAY)+(0.55)(DAY)210-3-(3.49)(DAY)310-6
Crop DataCrop data for cotton, rice, soybeans, corn, and catfish were collected from the U.S. Department of Agriculture’s National Agricultural Statistics Service (NASS). For the five crops, total acres and total irrigated acres were retrieved for the years 2002-2009 (the only years for which water use data were available).
Water Use DataField crop water use data were supplied by Yazoo-Mississippi Delta Joint Water Management District (YMD) in acre-feet/acre (A-F/A). For 2002 through 2009, these data were divided into the amount of water used by each specific irrigation method for cotton, corn, soybeans, and rice as well as the total average water use for each of the crops. Locations of the survey wells are shown in Figure 4. Catfish water use is dependent upon whether the producer uses the maintain-full (MF) or the drop-
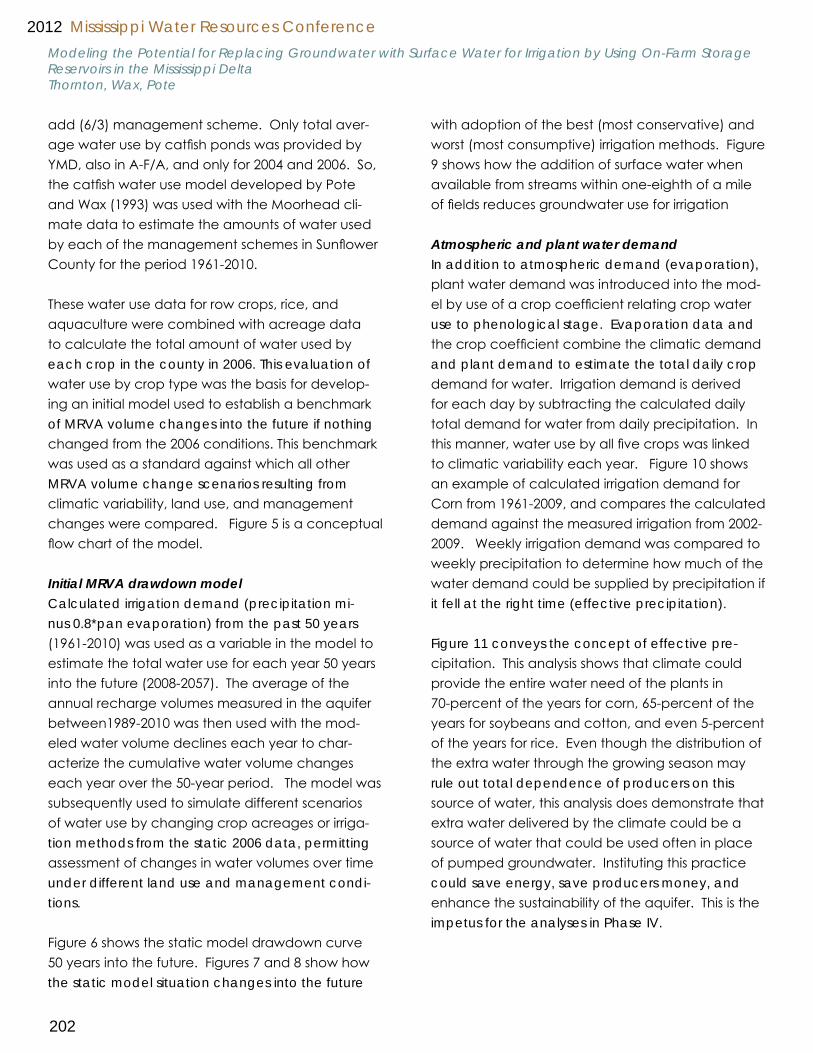
Mississippi Water Resources Conference2012
202
add (6/3) management scheme. Only total aver-age water use by catfish ponds was provided by YMD, also in A-F/A, and only for 2004 and 2006. So, the catfish water use model developed by Pote and Wax (1993) was used with the Moorhead cli-mate data to estimate the amounts of water used by each of the management schemes in Sunflower County for the period 1961-2010.
These water use data for row crops, rice, and aquaculture were combined with acreage data to calculate the total amount of water used by each crop in the county in 2006. This evaluation of water use by crop type was the basis for develop-ing an initial model used to establish a benchmark of MRVA volume changes into the future if nothing changed from the 2006 conditions. This benchmark was used as a standard against which all other MRVA volume change scenarios resulting from climatic variability, land use, and management changes were compared. Figure 5 is a conceptual flow chart of the model.
Initial MRVA drawdown modelCalculated irrigation demand (precipitation mi-nus 0.8*pan evaporation) from the past 50 years (1961-2010) was used as a variable in the model to estimate the total water use for each year 50 years into the future (2008-2057). The average of the annual recharge volumes measured in the aquifer between1989-2010 was then used with the mod-eled water volume declines each year to char-acterize the cumulative water volume changes each year over the 50-year period. The model was subsequently used to simulate different scenarios of water use by changing crop acreages or irriga-tion methods from the static 2006 data, permitting assessment of changes in water volumes over time under different land use and management condi-tions.
Figure 6 shows the static model drawdown curve 50 years into the future. Figures 7 and 8 show how the static model situation changes into the future
with adoption of the best (most conservative) and worst (most consumptive) irrigation methods. Figure 9 shows how the addition of surface water when available from streams within one-eighth of a mile of fields reduces groundwater use for irrigation
Atmospheric and plant water demandIn addition to atmospheric demand (evaporation), plant water demand was introduced into the mod-el by use of a crop coefficient relating crop water use to phenological stage. Evaporation data and the crop coefficient combine the climatic demand and plant demand to estimate the total daily crop demand for water. Irrigation demand is derived for each day by subtracting the calculated daily total demand for water from daily precipitation. In this manner, water use by all five crops was linked to climatic variability each year. Figure 10 shows an example of calculated irrigation demand for Corn from 1961-2009, and compares the calculated demand against the measured irrigation from 2002-2009. Weekly irrigation demand was compared to weekly precipitation to determine how much of the water demand could be supplied by precipitation if it fell at the right time (effective precipitation). Figure 11 conveys the concept of effective pre-cipitation. This analysis shows that climate could provide the entire water need of the plants in 70-percent of the years for corn, 65-percent of the years for soybeans and cotton, and even 5-percent of the years for rice. Even though the distribution of the extra water through the growing season may rule out total dependence of producers on this source of water, this analysis does demonstrate that extra water delivered by the climate could be a source of water that could be used often in place of pumped groundwater. Instituting this practice could save energy, save producers money, and enhance the sustainability of the aquifer. This is the impetus for the analyses in Phase IV.
Modeling the Potential for Replacing Groundwater with Surface Water for Irrigation by Using On-Farm Storage Reservoirs in the Mississippi DeltaThornton, Wax, Pote

Delta Water Conservation
203
On-farm storage analysis (phase IV) Storing precipitation in on-farm structures can be an effective way to reduce reliance of Delta produc-ers on groundwater. As pointed out above, the climate delivers a surplus of water to the region in many years. An on-farm water storage manage-ment scheme could also capture over-pumped ir-rigation water (tailwater) for re-use, further maximiz-ing efficiency of irrigation by curtailing waste from runoff of that water. An added benefit of this management practice would also be the reduction of nutrient runoff from fields. Combined annual mean streamflow for the Mississippi and Atchafalaya Rivers represents about 80-percent of the estimated freshwater discharge to the Gulf, and the Mississippi River combined with the Atchafalaya River contributes over 85% of the total nutrient load to the Gulf of Mexico (Dunn, 1996). The hypoxic zone in the Gulf covered about 8,000 square miles in 2010 (USGS, 2010). That same year the Natural Resources Conservation Service launched the Mississippi River Basin Healthy Water-sheds Initiative, and this research fits directly into the mission of that program to reduce nutrient runoff into the Gulf. Therefore, developing a method to optimize on-farm storage of surface water could be beneficial to conservation of both water quantity and water quality.
A farm storage reservoir model was developed to quantify the effectiveness and usefulness of this management strategy and addresses two large obstructions to sustainability of agricultural produc-tion in the Delta – declining groundwater volume in the MRVA and nutrient loads added to the Missis-sippi river and the Gulf of Mexico. Optimization of the management scheme requires quantification of the best ratio between field size and water contain-ment structure size. Containment structures in this research are considered to be man-made features as simple as a ditch at the lowest point in a field or as sophisticated as a reservoir in a totally land-leveled area with underground drainage structures
and pumps to collect precipitation and distribute it to the storage structure. The Natural Resources Conservation Service (NRCS) of the USDA is already supporting the idea of on-farm storage for irrigation use. Several prototype facilities are already constructed in the Delta, but their effectiveness has not yet been proven be-cause they have not been used through a growing season. Figure 12 shows a ditch near the border of Bolivar and Sunflower Counties designed to hold 12 acre-feet of water when full. The water is then in turn pumped into an adjacent reservoir designed to hold 93 acre-feet of water. The ditch is 12 feet wide, six-feet deep and 3,720 feet long. Construc-tion of the ditch alone required excavation of 21,700 yard3 of earth. The reservoir is 10 acres in area and nine-feet deep. It required excavation of 43,000 yard3.
Farm storage reservoir model The farm storage model is interactive and is set up in an Excel spreadsheet (Figures 13 and 14). The initial data set for the model includes Precipitation minus 0.8*Evaporation. This is adjusted by a crop coefficient to produce an Irrigation Demand value based on the age of the crop. Precipitation - Evap-oration and Irrigation Demand are both summed by weeks and used as inputs. The values are in acre-feet. Analyses are conducted for each of the row crops and rice.
Model SpecificsThe model begins on day one of week one of the growing season. The six elements accounted for in the model include 1) mass water balance (precipi-tation and evapotranspiration), 2) field demand (includes crop irrigation demand during growing season and evaporation in other parts of year), 3) ditch demand (includes evaporation the whole year), 4) ditch volume (precipitation-evaporation, runoff and pumping out) 5) overflow from the ditch, and 6) groundwater used.Model Output
Modeling the Potential for Replacing Groundwater with Surface Water for Irrigation by Using On-Farm Storage Reservoirs in the Mississippi DeltaThornton, Wax, Pote

Mississippi Water Resources Conference2012
204
Ground water use, total field irrigation demand, annual overflow, and growing season overflow are summed seasonally in the model. The seasonal val-ues are used to optimize the model to find the most efficient scenario -- one in which the ratio between the size of the ditch and the field provides the best combination of maximum surface water supply and minimal crop acreage reduction. The interactive part of the model has four inputs: 1) field acreage, 2) runoff coefficient, 3) ditch acre-age, and 4) ditch depth. The inputs are referenced to cells within the model calculation sheet which recalculates as inputs are changed (see Figures 13 and 14). This allows the model output to be easily optimized while instantly viewing the results in the form of charts. The model identifies optimal param-eters of field and ditch size in which groundwater use is minimized, annual overflow is minimized, and the smallest amount of the field is used for the ditch.
Irrigation RatiosThe model is a tool that can be used to evaluate field to reservoir/ditch ratios in order to optimize production in various crops. Two ratios were exam-ined in this study for corn, cotton, and soybeans. They include the 95:5 and the 97.5:2.5. The first ratio is 95 acres of production to 5 acres of reservoir/ditch. The second is 97.5 acres of production and 2.5 acres of reservoir/ditch.
Results Analyses show that if 100-percent of producers adopted the 95:5 ratio, the aquifer would rebound by 8,794,259 A-F at the end of the 50-year period as compared to the static model (Table 1). Under the 97.5:2.5 ratio, if 100-percent of the producers used the plan, the aquifer would increase by 7,070,346 A-F at the end of the 50-year period compared to the static model (Table2).
Realizing that 100-percent producer participation is unlikely, various adoption rates were examined to see how the aquifer would respond through time.
Figures 15 and 16 show the 95:5 and 97.5 ratios with various adoption rates. In Figure 15, for the 95:5 ratio, it can be seen that if just 15-percent of pro-ducers adopted the practice, the aquifer would stabilize and begin showing artesian flow in about 30 years. After experiencing some dry years the water table drops below the top of the aquifer and artesian flow ceases in about 2047 before returning again thereafter. In Figure 16, for the 97.5:2.5 ratio, it is seen that if just 15-percent of producers adopt the management strategy, the aquifer at least sta-bilizes in a few years. However, if 25-percent of pro-ducers adopt the 97.5:2.5 ratio, the aquifer would show artesian flow in about 14 years and continue to stay full thereafter.
ConclusionsThe analyses show that climate could provide the entire water need of the plants in 70-percent of the years for corn, 65-percent of the years for soybeans and cotton, and even 5-percent of the years for rice. This shows that precipitation capture could be a viable solution to reducing groundwater use for irrigation. An on-farm water storage management scheme can also capture over-pumped irrigation water (tailwater) for re-use, further maximizing ef-ficiency of irrigation by curtailing waste from runoff of that water.
If producers adopted, at a minimum, the 97.5:2.5 ratio management practice, this minimal manage-ment strategy could potentially conserve 48-per-cent, 35-percent and 42-percent of groundwater for cotton, corn and soybeans, respectively. Even in extreme drought years such as 2007, cotton corn and soybeans produced under the 97.5:2.5 management strategy could conserve 32-percent, 46-percent and 38-percent of groundwater, re-spectively.
Modeling the Potential for Replacing Groundwater with Surface Water for Irrigation by Using On-Farm Storage Reservoirs in the Mississippi DeltaThornton, Wax, Pote

Delta Water Conservation
205
ReferencesAuburn University, 2002. Auburn University and USDA/Natural Resources Conservation Service, Managing Ponds to reduce Effluent Volume, BMP No. 21.(http://efotg.nrcs.usda.gov.references/public/AL/G02ReduceEffluent.pdf)
Cathcart, T.P., C.L. Wax, J.W. Pote and Sugeng Tri-yono, 2007. “A Climatological Basis for Conserving Groundwater and Reducing Overflow in Aquacul-ture Ponds in the Southeast United States.” Aqua-cultural Engineering, 36(2007)225-232.
Dunn, D.D., 1996. “Trends in nutrient inflows to the Gulf of Mexico from streams draining the contermi-nous U.S, 1972-1993.” US GeolSurv Water-Res Inves Report 96-4113, 1996:60
LCES, 2003. “Aquacultural Production Best Man-agement Practices (BMPs)”, Pub. 2894 4/03 (Online only). Louisiana Cooperative Extension Service, Baton Rouge, LA.(http://www.agctr.lsu.edu/NR/rdonlyres/4005CC33-BF01-4FAB-8EA3-E2D9AB-CE038C/2616/pub2894aquaBMP6.pdf).
Massey, Joseph H., 2010. Associate Professor, Plant and Soil Sciences, Mississippi State University. Per-sonal communication, November, 2010.
Massey, J.H., M.C. Smith, A. Johnson, J.Thomas, P.L.Tacker, E.D.Vories, S. Lancaster, A.A.Andrews, and P.Ampim, 2006. Multiple-Inlet plus Intermittent Rice Irrigation Increases Rainfall Capture and Re-duces Non-Point Source Runoff. Proceedings, 31st Rice Technical Working Group Meeting. The Wood-lands, TX.
Pennington, Dean, 2005. 2005 Annual Report, Yazoo Mississippi Delta Joint Water Management District, Stoneville, MS 38766.
Pennington, Dean, 2011. Executive Director, Yazoo Mississippi Delta Joint Water Management District.
Personal communication, May, 2011.
Pote, J.W., C.L. Wax and C.S. Tucker, 1988. Water in Catfish Production: Sources, Uses, and Conserva-tions. Special Bulletin 88-3, November 1988, Missis-sippi Agricultural and Forestry Experiment Station, Mississippi State, MS.
Pote, J.W. and C.L. Wax, 1993. “Modeling the Climatological Potential for Water Conservation in Aquaculture.” Transactions of the American Soci-ety of Agricultural Engineers, Volume 36 (5), 1343-1348.
Soil Conservation Service, 1970. Irrigation water re-quirements, Technical Release No. 21, U.S. Depart-ment of Agriculture, Washington, DC.
Smith, M.C., J. H. Massey, P. Tacker, E. Vories, D. Pennington, J. Epting, and C.Wilson, 2006. Water use estimates for various rice production systems in Mississippi and Arkansas. Irrigation Science (DOI 10.1007/s00271-006-0041-0; pgs. 1-7).
USGS, 2010.”The Gulf of Mexico Hypoxic Zone.”United States Geological Survey. Online at: http://toxics.usgs.gov/hypoxia/hypoxic_zone.html
Wax, C.L., J. Pote, and Robert Thornton, 2010. “Re-fining Effective Precipitation Estimates for a Model Simulating Conservation of Groundwater in the Mis-sissippi Delta Shallow Alluvial Aquifer,” Proceedings, Water Resources Conference, Bay St. Louis, MS.
Modeling the Potential for Replacing Groundwater with Surface Water for Irrigation by Using On-Farm Storage Reservoirs in the Mississippi DeltaThornton, Wax, Pote

Mississippi Water Resources Conference2012
206
Modeling the Potential for Replacing Groundwater with Surface Water for Irrigation by Using On-Farm Storage Reservoirs in the Mississippi DeltaThornton, Wax, Pote
Table 1. Aquifer volume change over 50 years with various adoption percentages, 95:5 plan (A-F)Static 100% 25% 15% 10%
-1,150,385 +8,794,259 +1,335,775 +341,311 -155,920
Table 2. Aquifer volume change over 50 years with various adoption percentages, 97.5:2.5 plan (A-F)Static 100% 25% 15% 10%
-1,150,385 +7,070,346 +904,797 +82,724 -328,311
Figure 1. Distribution of permitted wells in Mississippi, 2005
1·-.4 . ~ : p,• ... , •
. .. . .
'Ii:~ , • .. · .,1. .. 'lo i ,i t '·
. .. .. •
. ,
• J • • 1.,,
.. ·, . ..

Delta Water Conservation
207
Modeling the Potential for Replacing Groundwater with Surface Water for Irrigation by Using On-Farm Storage Reservoirs in the Mississippi DeltaThornton, Wax, Pote
Figure 2: New Permit Requests, 2006
• j
.: (}. ·= /~~
c.: "J. • • r-• ,· -. . '· '\
•' i-, . ·- .- .......
• -• • • j
• • .. '\ r-a. , .. ..._ • • • • u-:...,, .,. .... -~-: .. • \ •· · / -·.. . . : ' • • ••• , .r.
• • • • • -! . . . . . , .. -' ... .. . ( ~ ~- :,,,\, .. ~ . . .. , ........... . r •• • ' • -~ • i •
•• f • #a • A~...,_ l
lk4••··· •. • -... t i "--• ...._.:!!• _. l ' • -\, \ • •• • •' • 1;~ .•'J: :;:' )t -···:-,.-
• • • \· ~ • 1·
•• • :• ~·~ • 'I \ • · •. ·· - •• ~,· • • 1
'· ~ •·' •• . • • r.) .,;.., . .,-., .. ·- · -•.. . • ' -.E• ...... ""'""---~ ~ • ..-:-"' . • 1. • ..
'-:""". •.- :, • • • • •• • 1 I • .. -~ . ,.,. •• :- ' .. •i
••• • • ~ I Iii ,, • • •• • I I • -:r~ ~ .... _, .r . ' .. .. 'T'•.-~ • I f
. . ~-l-j . ~._ .. ~~· . . /; - . ., .. ~. . . .. / .__. -. -- " .. / ~ "":""' ., • ,.. ~ . r ... 1-• : ) ( • ::! •.' ••·~l
-1 ~ • :-;;- J,I - ' r .... . ... ,,
,...., .•.:.-. .,. .,_ --r,:. ,.._ . ·/-·
• ' • '\..... efl ;:, .(/.: ... -.; -~ ._.,.,,,,.,...... 1' ,,>.I . -~~ ,., .-~-..,, ..
!/ r· I• . ~ ;:
.;:/~
"'""'
•
I 0 JO 20
Scale

Mississippi Water Resources Conference2012
208
Modeling the Potential for Replacing Groundwater with Surface Water for Irrigation by Using On-Farm Storage Reservoirs in the Mississippi DeltaThornton, Wax, Pote
Figure 3: Seasonal Cumulative Aquifer Volume Decline, 1990-2006
Delta A<1uifer Cumulative Seasonal Change 2,000,000 ~----------------------~
1,500,000 +----1t:-----tr--r----------------------1 1,000,000 t-:;P'tf..~-\---------------------1
500,000 ~ - ..:_---=~~~l\------:--:----------------l i of-r,rrr,-,---.,..,:~~~:?QArw,-,---m-.--rm-.--rTT7rrT7 l -500,000 +---------_:_____:~{..\;:::-----------I -<1,000,000 +---------------\-,t--=--,.------fr-------1
-1,500,000 +------------___.:~r,.J-~~A/J.1;1'~-~ -2,000,000 +--------------Jl-_.:_ ____ _..::,,~~f-1 -2,500,000 +-----------------------¥--1 -3,000,000 -'------------------------'
Year

Delta Water Conservation
209
Modeling the Potential for Replacing Groundwater with Surface Water for Irrigation by Using On-Farm Storage Reservoirs in the Mississippi DeltaThornton, Wax, Pote
Figure 4: Locations of Water Use Survey Wells, 2006
Locations of the 2006 Water Use Survey Wells
Wate.rUs.s SH:ea
e cotton
o Com
4)Se••·

Mississippi Water Resources Conference2012
210
Modeling the Potential for Replacing Groundwater with Surface Water for Irrigation by Using On-Farm Storage Reservoirs in the Mississippi DeltaThornton, Wax, Pote
Figure 5: Conceptual flow chart of the original model
Figure 6: Static model with cultural and climatic variability the same
I Climatic Delivery of Moisture (P) 8lld Energy Demand (ET)
l Crop Water Demand
Six Field Inigation Methods
Two aquaculture Management Schemes
Precipitation-0.8Pan Evaporation*Crop Coeff,cient
l I Inigation I
I \ I Groundwater I Surl'ace Water When Available
l I MRVADrawdown I
Phase 1: Static Management Practices
,i; ,! -1500000 +-----------------------'-==="-",! ~
~ -2500000 +-----------------------------1
I- static 20061

Delta Water Conservation
211
Modeling the Potential for Replacing Groundwater with Surface Water for Irrigation by Using On-Farm Storage Reservoirs in the Mississippi DeltaThornton, Wax, Pote
Figure 7: Static model versus most conservative methods
Figure 8: Static model versus most consumptive methods
Pha~e, 1: Static v~ B., ~, Manage,m.,nt
-500000
! -1500000 -1---------------------=-~ yY~¼..! ~
~ -2500000 +--------------------------1
I- Static 2006 - Most Conseivai'Je I
Phase 1: Static vs Worst Management Prac1ices
500000 +--------------------------1
,i; of. -1500000 +------'-"-'-""==------------_;_-'-"-"-"'-IA"'! ~
~ -2500000 +--------------'--"'=~----------!
-4500000 -'--------------------------'
,,,_-.:,"o 0 . ., ~
I- Static 2006 - Worst Conservation °ractices I

Mississippi Water Resources Conference2012
212
Modeling the Potential for Replacing Groundwater with Surface Water for Irrigation by Using On-Farm Storage Reservoirs in the Mississippi DeltaThornton, Wax, Pote
Figure 9: Static versus use of surface water when available from streams
Figure 10: Calculated (1961-2009) vs. Measured (2002-2009) Corn Irrigation(Y=1.180774(x) + 0.001839; R2=0.77)
<(
3.S
3
2.S
~ 2 <(
1.S
O.S
0
500000 +---------------------------1
-3500000 +---------------------------!
-4500000 "' "' "' "' "' "' "' "' "' "' "' "' "' "' "' "' c:, c:, S! S! S! c:,
"' c:,
"' c:,
"' c:,
"' c:, w
c:, w
c:, w
c:, .... c:, .... c:, .... c:, a,
c:, a,
0) .... " c:, w cr, <D "' a, 0) .... " c:, w
Year
I - STATIC - SFCWAlER I
I - I - I I - -I I I I I I I I II . . . . . . .
■Cl'lcul:lled ■uemured
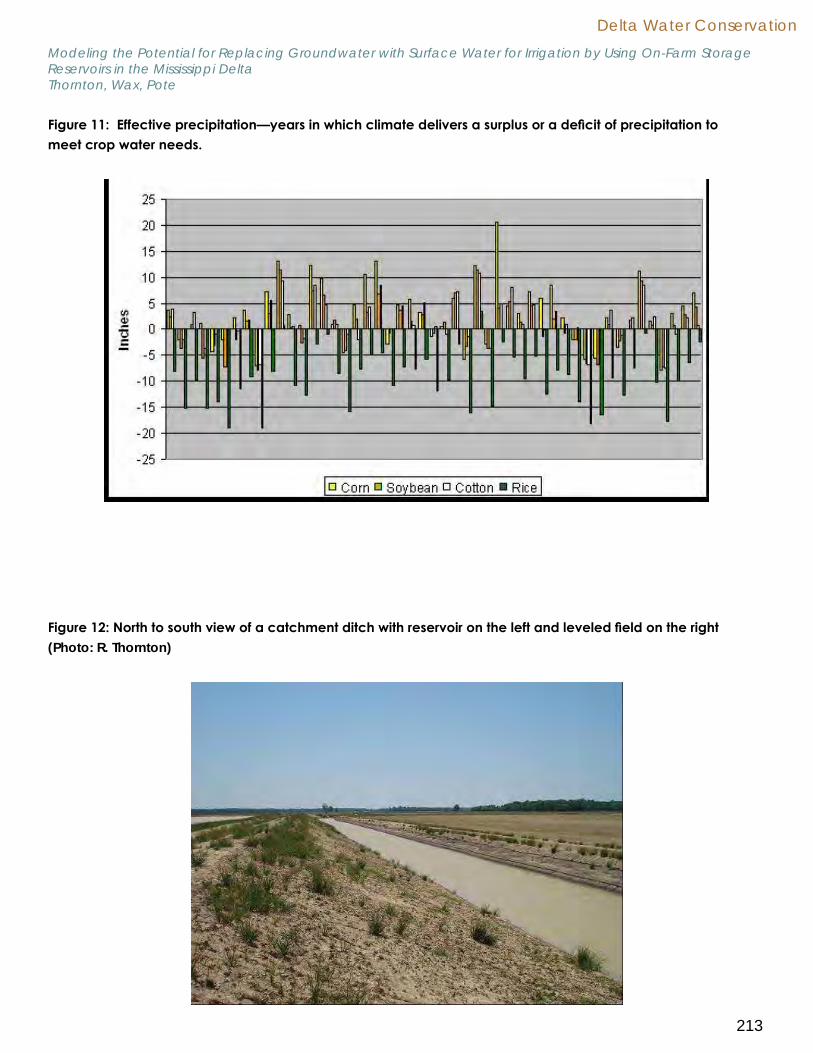
Delta Water Conservation
213
Modeling the Potential for Replacing Groundwater with Surface Water for Irrigation by Using On-Farm Storage Reservoirs in the Mississippi DeltaThornton, Wax, Pote
Figure 11: Effective precipitation—years in which climate delivers a surplus or a deficit of precipitation to meet crop water needs.
Figure 12: North to south view of a catchment ditch with reservoir on the left and leveled field on the right (Photo: R. Thornton)
25
20
15
10
5 n. n .Ill n n n 1/1 ~ n n ,1~ In II . 1111 111 rLlm I I 11 ~ I t 41 ... 0
IU I~ ~ I . I I ~ "O 1nu11 1~ I = -5
I I -10
-15
-20
-25
I □ Corn □ Sotbean □ Cotton ■ Rice I

Mississippi Water Resources Conference2012
214
Modeling the Potential for Replacing Groundwater with Surface Water for Irrigation by Using On-Farm Storage Reservoirs in the Mississippi DeltaThornton, Wax, Pote
Figure 13: Partial view of farm storage reservoir model
Figure 14: Partial view of farm storage reservoir model, continued
A B C 0 E F G I All Velues In Atrt S:ee1 2 Yo, Ctound W11t, UM (f.lt fd) Flt ld lnlg1tlon 011nat1d: Oi1ch Con11lbullon: " Su Dltoh 3 1961 000 ooo' -3946 39,a 3946
' 1962 -2698 26.98 .
.7155 71.55 44 57 5 1963 ·•59 459 • -5051 !iOSI 4592 6 1964 -698 698' -5092 !1)92 4394 7 1965 -691 6.97' -50.46 !l)C8 OSI 8 lliE6 ~25 3025' .1,n 1, n US2 9 1961 000 000' '31363 38,63 38$3 10 1968 000 ODO ' .4013 40 13 40 13 II 1969 ·2561 2561 ,, .SS89 6989 44 28 12 1970 000 oDO' ·21 42 21 '2 2142 13 1911 000 ODO' .3374 ll.14 3374 1• 19n 000 ooo' -45S4 455' 4554 IS 1973 • 17.44 17.u" ~67 6267 4523 16 1974 ODO ODO' 4)74 43 74 4)74 17 1975 000 o.oor ,4696 '696 4696 18 1976 -17.28 t7.28" ~Ill 6500 ,ns 19 19n -840 8 AO"' '51'7 5147 4307 20 1978 •l8.98 18.98 " -o' 17 64 17 , s.19 21 1979 000 ODO ' ·'380 •380 4380 22 1980 .3977 YJ.77" -119 46 8946 4970 23 1981 •II 42 11 . .42" '5724 57.24 4581 2, 19112 000 ODO' ·3605 3605 3605 2S 1983 -1743 17 43" -63 44 63.44 46.DI :l6 198A 000 0.00" .39 72 38n 38.72 11 1985 • I 14 1 14" •4661 '661 4547 28 1986 •35.79 35,79" .SHO 8240 46.61
Ground W3ter Ung• (Fil Id)
90.00
80.00
, ... JO•;-.; , ...
'50.00
•o.oo
30.00
2000
10..00

Delta Water Conservation
215
Technologies and Methods to Aid the Adoption of PHAUCET Irrigation in the
Mississippi DeltaShane Powers, U.S. Geological Survey
Conservation is one of the keys to balancing the water budget of the Mississippi Delta’s Alluvial Aquifer. As more and more farmed acres in the Delta are being irrigated every year, the use of new and existing conservation practices in the application of that water is imperative. While high value, expensive projects such as the installation of surface water reservoirs and tail water recovery systems demonstrate great groundwater savings potential, there are many other sensible and more economic ways to conserve the Delta’s water resources. Among those options is the use of the PHAUCET Irrigation Program. PHAUCET is a computer program originally written by the USDA-NRCS for use with furrow irrigation of row crops using poly pipe. Its primary function is to generate a range of hole sizes for each irrigating set that will increase the uniformity of each round of irrigation. This increased uniformity allows irrigators to more accurately time irrigations, leading to a more easily managed irrigation cycle. With the PHAUCET Program, however, there are a number of variables users must input in order for the program to generate its suggested hole sizes. These variables include the flow rate of the well, hole spacing along the poly pipe, the elevation changes of the poly pipe, poly pipe size, the number of holes for each watered furrow, set lengths, and row lengths. While most of these variables are known to growers, three of them can be more difficult to obtain. Flow rates, elevation changes, and row lengths can all three present problems to growers when they are working to implement the program. This paper will look at different technologies and methods that have the potential to aid users in the collection and use of the lesser known variables.

Mississippi Water Resources Conference2012
216
MIST: A Web-Based Irrigation Scheduling Tool for Mississippi Crop Production
Brandon Rice, University of MississippiCrumpton, J.; Schmidt, A.; Sassenrath, G.; Schneider, J.
Increased reliance on supplemental irrigation has begun to deplete the alluvial aquifer in the Mississippi Delta region. To alleviate nonproductive overuse of groundwater resources, we are developing a web-based irrigation scheduling tool. The Mississippi Irrigation Scheduling Tool (MIST) uses a water balance approach, calculating evapotranspiration from weather data using standard ET equations. User input is streamlined by relying on automatic integration of soils data and weather information from national databases. MIST is currently being tested in various production management scenarios for corn and soybeans and for different alluvial soils common to the Mississippi Delta. The web interface allows users to input the necessary data that is required to compute the aforementioned formulas. Users then will be able to access the irrigation scheduling information remotely. Using java, jsps, and a SQL database, the web interface attempts to be easy to use for all users. The data that must be entered by a user should be data that is common or easily accessible knowledge to a farmer. Google Maps provides a framework to display and select the features (maps, fields, and wells) via the Internet, minimizing computation resources needed by users. Following completion of testing and validation, the research team is planning a tentative general release for the 2013 growing season.

Sedimentation
Matt RömkensUSDA Agricultural Research Service
The National Reservoir Sedimentation Data Base: Background and Purpose
Natalie SigsbyMississippi State University
Sedimentation Processes in Perdido Bay
James CizdzielUniversity of Mississippi
Measuring Fallout Plutonium and Lead Isotopes in Sediment Using ICPMS for Dating Purposes
James ChambersUniversity of Mississippi
Using Acoustic Measurements as a Surrogate Technique for Measuring Sediment Transport
Sed
imen
tatio
n

Mississippi Water Resources Conference2012
218
The National Reservoir Sedimentation Data Base: Background and Purpose
Matt Römkens, USDA Agricultural Research ServiceJones, M.; Gray, J.
For many years, the Federal Interagency Subcommittee on Sedimentation (SOS), one of the nine Subcommittees of the USGS Advisory Committee on Water Information (ACWI), has been spearheading the development of a National Data Base concerning the sedimentation status of the Nation’s Reservoirs. This data base is of critical importance for a number of issues such as water storage for flood control, sediment storage to reduce sediment movement in watersheds, water supply for irrigation and consumptive use, to maintain recreation functions, etc. Changes in the storage capacity may affect all these functions including the potential of the destabilization of the structures containing the reservoirs. The nation has more than 85000 dams and more than 110000 miles of levees. A large number of these dams are principally earthen dams that were built within the last 60 years, usually with an economic life time of 50 years. Many of them have lost a significant part of their storage capacity due to sedimentation. Decisions need to be made to decommission or rehabilitate these reservoirs and associated dam structures. The presentation will discuss the development of this data base, including the status of the reservoirs, dam failures and their disastrous consequences.
Sedimentation
219
Sedimentation Processes in Perdido BayNatalie Sigsby, Mississippi State University
McAnally, W.; Sigsby, N.
Perdido Bay is an estuarine system located along the Alabama-Florida border in the Gulf of Mexico with an estimated 2900 sq. km watershed and a narrow tidal inlet to the Gulf of Mexico. Water quality and hydrodynamics have been examined in some detail, but very little research has been done on the sedimentation processes of the bay. A systematic sedimentation study will contribute to an improved understanding of the processes of the bay.
An investigation into the sediment classifications, distributions, and discharges will be completed as a major part of this sedimentation study. As a first step, a data collection was performed in July 2011. This survey included water and bed sediment sampling, water quality readings, and velocity measurements. Water quality constituents tested included dissolved oxygen, pH, salinity, temperature, turbidity, and depth. Velocity and discharge calculations were recorded using an Acoustic Doppler Current Profiler. Bed sediment samples will be used for grain size analysis and sediment classification. The water samples collected will be used for total suspended solids analysis. Analysis of the tide levels, salinity and turbidity will be completed for the verification of the existence and location of the turbidity maxima in Perdido Bay.
A thorough literature review will be completed to better understand sedimentation processes, sediment budgets, numerical modeling, and historical data. Using this data, along with data collected on-site, a systematic sediment budget will be developed and a numerical model of sediment transport using EFDC will be developed.
Mississippi Water Resources Conference2012
220
Measuring Fallout Plutonium and Lead Isotopes in Sediment Using ICPMS for Dating
Purposes James Cizdziel, University of Mississippi
Chakravarty, P.
Sediments are complex deposits of inorganic and organic matter that can serve as a natural storage system for metals and anthropogenic contaminants. Sediment cores can provide a window on the past because they can go back years, decades, even centuries and serve as environmental proxies. Dating of recent (<100 years) sediments is important in many studies and applications, including determining the source and timing of pollution events, establishing sedimentation patterns, and in reservoir management. Linking sediment “dates” (typically in years) with sediment characteristics or specific chemical constituents is also crucial for examining the effectiveness of both pollution and erosion control measures. Conventional dating techniques which use 210Pb and 137Cs are slow and costly, in part because extended times are needed to measure the radioactive decay emissions from low-activity samples.
In this study, we examined the feasibility of using inductively coupled plasma mass spectrometry (ICP-MS) to: measure global fallout plutonium (Pu) and 210Pb in sediment core samples from Mississippi for dating purposes. Recent advances in mass spectrometry have made it an alternative to radioactive decay spectrometry for determining Pu, and possibly 210Pb, in environmental samples. This study utilized core samples previously collected from strategic locations within the Mississippi Delta region. Select samples were be digested with mineral acids and the Pu and Pb isotopes were selectively removed from the matrix using chromatographic extraction resins, effectively pre-concentrating the elements prior to analysis. Plutonium was determined using isotope dilution mass spectrometry and 210Pb using external standardization. In this talk and associated poster we will discuss the methodology and present our findings.

Sedimentation
221
Using Acoustic Measurements as a Surrogate Technique for Measuring Sediment Transport
James Chambers, University of Mississippi
The diversity in climate, topography, soil types, and cropping practices within the United States lends itself to numerous soil erosion and water contamination mechanisms. The measurement of sediments transported in waterways using acoustic techniques can provide valuable information which can support both systems for planning and assessment and the development of better erosion control technologies. The collaboration between the NCPA and USDA-ARS-NSL has focused on the development and evaluation of innovative acoustic hardware and measurement techniques to monitor sediment transport. Most current techniques are often prohibitively expensive and not easily adaptable for in-situ measurements. Furthermore, manual techniques are often spatially and temporally coarse, cannot easily monitor particle movement over time and could modify the evaluated particle size distribution since aggregates are often broken up in sample collection and handling. In contrast, acoustic techniques tend to be amenable to in-situ measurement, are less costly, less invasive, and allow for long-term monitoring. The presentation will provide a survey of our work on using acoustics for monitoring sediment transport. This includes near bed, suspended, sand sized particles (100-1000 micron), clays and silts (0.1 – 64 micron diameter particles) which tend to be mixed uniformly throughout the water column along with future plans to investigate kinetic energy impact plates to monitor gravel bedload movement.

Storm Water
Clay MangumMississippi State University
Sources and Yield of Dissolved Inorganic and Organic Constituents in Headwater Streams of the Upper Gulf Coastal Plain, Mississippi
Emily OverbeyMississippi State University
Policy Approaches to Stormwater Facility Sizing and Sustainable Site Design
Warren Corrado GalloMississippi State University
Adapting Portland’s Stormwater Approach to Other U.S. Cities
Jesse EnglishMississippi State University
Holitoblichi: A Celebration of the North Mississippi Hills
Stor
m W
ater

Storm Water
223
Sources and Yield of Dissolved Inorganic and Organic Constituents in Headwater Streams of
the Upper Gulf Coastal Plain, MississippiClay Mangum, Mississippi State University
Hatten, J.; Dewey, J.; Choi, B.
Mississippi has more than 8 million hectares of land in active forest management, much of which is in headwater watersheds. Headwater systems contribute water and initiate dissolved material export to downstream fluvial environments. Nutrients, such as nitrogen and dissolved organic carbon (DOC), are constituents that frequently lead to impaired rivers in Mississippi. This study analyzes event data from 4 ephemeral (1.8-3.8 ha) and 1 perennial (32 ha) forested headwater system in Upper Gulf Coastal Plain, Mississippi over a 15 month period. We measured dissolved inorganic and organic constituents in samples collected during storm and baseflow conditions. We calculated the flux of nitrate, dissolved organic nitrogen (DON) and phosphorus with average kilograms per hectares per year yields of 0.48, 7.83 and 0.25 respectively. We also used an end member mixing model to determine the source of water and compared those results with nutrient fluxes during both storm and baseflow conditions. The data show that dissolved constituents are primarily mobilized during the rising limb of storm events. The source of these materials appears to be shallow mineral soil horizons (A horizons). In our presentation we will discuss how the source of water interacts with flux of nitrogen and implications for forest management and downstream environments.

Mississippi Water Resources Conference2012
224
Policy Approaches to Stormwater Facility Sizing and Sustainable Site Design
Emily Overbey, Mississippi State UniversityGallo, W.
A difficult challenge in implementing sustainable stormwater facilities is navigating stormwater policies designed to use complex stormwater models to size large detention basins. The presentation explores unique stormwater facility sizing approaches that have been used and modified for over ten years by landscape architects, architects and civil engineers in Portland, Oregon. Through a survey of design professionals, the research highlights the opportunities for policy to influence where and how stormwater facilities are incorporated into the design process.
The Portland Stormwater Management Manual (SWMM) primarily utilizes two approaches to meet the city’s stormwater requirements. The Simplified Approach uses simple sizing factors accompanied by standard design details and specifications to streamline the process. Alternatively, the Presumptive Approach utilizes a unique sizing calculator that allows for maximum design flexibility and control of an array of best management practices. Both of these approaches promote multiple, small-scaled facilities that infiltrate and manage stormwater as close to where it falls as possible.
Results of the survey indicate that design professionals differ on how they utilize sizing tools in the design process. Art based disciplines lean toward the Simplified Approach that allows exploration of multiple solutions early in the design process, while engineers tend to lean toward the more robust Presumptive Approach, allowing refinement of the facility design.
The new and evolving paradigm of sustainable stormwater management can be shaped by policies that are designed specifically for implementation of small-scaled infiltration facilities. By simplifying the sizing process, these tools allow designers to use facilities as an integral part of overall site design. However, simplifying the sizing methodology is not a shortcut for simplifying design of the individual facility which requires careful consideration and refinement to meet specific needs of the site.

Storm Water
225
Adapting Portland’s Stormwater Approach to Other U.S. Cities
Warren Corrado Gallo, Mississippi State UniversityOverbey, E.
The Pacific Northwest, specifically Portland, OR, has become a recognized leader in progressive and creative stormwater management practices in the United States. Its projects have received numerous design awards and recognition based on their innovative approach to manage stormwater for both quality and quantity using primarily small-scale vegetated facilities. Designers throughout the country use Portland as a model of what could be done elsewhere, however there are numerous differences that have to be accounted for.
The presentation will explore the inherent differences between stormwater management in the Pacific Northwest and the rest of the United States, and also the opportunities that can be shared with the rest of the country. The research focuses on Portland’s practice of providing a simplified sizing factor for small scale best management practices. The researchers re-created Portland’s sizing factors and then modified the variables to reflect a range of locations elsewhere in the United States.
Through this approach, the study highlights just how different, and more complicated, it is to apply small scale best management practices to other parts of the country. However, the differences, while in some instances are quite significant, point to opportunities to design future facilities around the specific needs of each location. This will be demonstrated by illustrating how a built work in Portland could be modified to meet other regions’ climatic differences.
Armed with a better understanding of what it means to take the Pacific Northwest’s triumphs and apply them to the rest of the country, the study hopes to allow designers to more meaningfully engage clients and engineers in a dialogue about specific issues and opportunities related to adapting Portland approaches to their own watershed.

Mississippi Water Resources Conference2012
226
Policy Approaches to Stormwater Facility Sizing and Sustainable Site Design
Jesse English, Mississippi State University
Utilizing the Choctaw Indian word for “celebrate” as its name, Holitoblichi intends to celebrate the heritage and inspire the future of the north Mississippi Hills through the stewardship of its unique cultural and natural environment. This project transforms nearly 350 acres adjacent to the new Toyota manufacturing plant in Blue Springs, Mississippi into a regional amenity with a rich array of uses. From stormwater management and bioremediation to stream channel restoration and native habitat revitalization, from experiential learning and community-building facilities to sustainable agriculture and recreation, the project combines many threads into one comprehensive story. Guiding the design are three principles: 1) to express the three components of sustainable development (environment, economy, society) in every aspect of the design; 2) to weave together agricultural, environmental, and industrial and showcase the symbiotic relationships between them; and 3) to evoke a sense of “the new old,” pulling culture from the past and the present into an innovative and resilient future. Conceptually, two poles anchor the design: environment and culture. Throughout the space between, the interconnections between the two poles are explored. From practicing agriculture in collaboration with nature to experiencing the blues in the environment that set its tone, Holitoblichi is an example of how a mutually beneficial relationship between man and nature can be cultivated.

Public Water Systems
Rebecca A. WernerUniversity of Mississipii
Sources and Yield of Dissolved Inorganic and Organic Constituents in Headwater Streams of the Upper Gulf Coastal Plain, Mississippi
Jason BarrettMississippi State University
The Influence of the Mitchell Rate Structure on Community Drinking Water Consumption and Customer Fairness
Alan BarefieldMississippi State University
An Analysis of Factors Influencing Capacity Development of Public Water Systems in Mississippi
Publ
ic W
ater
Sys
tem
s

Mississippi Water Resources Conference2012
228
Financial Sustainability of Water Treatment and Distribution: Using a Public Private Partnership
Toolkit to Evaluate Project CostsRebecca A. Werner, University of Mississippi
With population growth and an increasing need for water supply and distribution, innovative ways to sustainably finance capital, operation, and maintenance costs of water projects must be found. A Public Private Partnership (PPP) between government and one or more private companies is an underused means of financing such projects. PPPs in the United States are common in the energy and solid waste industries. However, in the water sector, governments have been the entities solely responsible for funding water services. PPPs in water projects would enable a larger variety of capital investments and a balanced share of risk between government and private companies. Further, PPPs enable public services to be provided when there are public budget constraints.
The principal objective of this presentation is to show scenarios in which PPPs are beneficial for funding water projects. The analysis will include data from municipalities in the state of Mississippi, and results from a case study will be reported. The method used will be a toolkit software developed by The World Bank for use in road and highway projects. This existing toolkit, which has been applied to PPP projects worldwide, will be adapted for the water sector. For example, existing input parameters, such as average daily traffic and toll rate per vehicle, will be changed to water-related parameters, such as average daily water use and water use fees per household.
Overall, the goal of a PPP project in the water sector is a sustainable investment for both the government and private entities in terms of balance of risk and financial return on investment.

Public Water Systems
229
The Influence of the Mitchell Rate Structure on Community Drinking Water Consumption and
Customer FairnessJason Barrett, Mississippi State University
Public water systems have come to accept standards in relation to rate structures to support their respective drinking water systems without comparing the cost to customer conservation or equity. The current rate structures have been adopted without substantive support for why this is the rate structure to utilize. The Mitchell (single) rate structure is a rate structure that highly promotes fairness among the customer base in relation to the cost of drinking water in comparison to the amount of revenue produced by the customer base. The Mitchell (single) rate structure also triggers conservative drinking water consumption practices amongst different socioeconomic strata. A new rate structure can be an alternative answer to the rising infrastructure cost and drinking water supply concerns. In this presentation, I will look to explain the impacts of the Mitchell (single) rate structure on public drinking water systems and the possible ramifications a new rates structure may bring.

Mississippi Water Resources Conference2012
230
An Analysis of Factors Influencing Capacity Development of Public Water Systems in
MississippiAlan Barefield, Mississippi State University
The Safe Drinking Water Act Amendments of 1996 (SDWA) mandated the implementation of capacity development strategies to avoid the withholding of Drinking Water State Revolving Fund monies. In particular, section 1420 defined the two capacity enhancement foci as (1) ensuring that new community and non-transient water systems demonstrate sufficient financial, managerial and technical capacity to achieve authorization and (2) developing an implementation strategy to assist currently operating water systems with acquiring and maintaining these same capacity components.
As the state’s primacy agency, the Mississippi State Department of Health-Bureau of Public Water Supply (MSDH-BPWS) has developed a mandatory survey instrument that contains three sections corresponding to the enumerated capacity development mandates. MSDH-BPWS regional engineers administer this survey to all community and non-transient water systems in the state. MSDH-BPWS also utilizes a portion of Drinking Water State Revolving Fund monies to fund capacity development programs, such as the Peer Review program. The Mississippi State University Extension Service implements this program that utilizes a team of certified waterworks operators from high performing systems to make site visits to poorer performing systems and providing advice and technical assistance in improving capacity development scores.
The purpose of this paper is to assess the effectiveness of the Peer Review program in increasing capacity development scores and to assess a number of other factors that may have significant influence on a particular system’s capacity development. An intertemporal binomial dependent variable regression model is constructed to determine the marginal effects of several firm-level managerial and regional socioeconomic factors in influencing the success of public water systems in increasing capacity assessment scores to acceptable levels.

Surface Water Assessment and Evaluation
Ying OuyangUSDA Forest Service
An Approach for Low Flow Selection in Water Resource Management
Prem B. ParajuliMississippi State University
Sediment and Nutrients Loadings from the Upper Pearl River Watershed
Alina YoungMississippi State University
Evaluating a Vegetated Filter Strip in an Agricultural Field
Eduardo Arias-AraujoMississippi State University
Soil Moisture and Watershed Assessment to Predict Wildfire Occurrences in the Southeast of United States
Surfa
ce W
ater
Ass
essm
ent a
nd E
valu
atio
n

Mississippi Water Resources Conference2012
232
An Approach for Low Flow Selection in Water Resource Management
Ying Ouyang, USDA Forest Service
Low flow selections are essential to water resource management, water supply planning, and watershed ecosystem restoration. In this study, a new approach, namely the frequent-low (FL) approach, was developed based on the frequent low category used in minimum flows and/or levels programs. This approach was then compared to the conventional 7Q10 approach for low flow selections prior to its applications, using the USGS flow data from the freshwater environment (Big Sunflower River, Mississippi) as well as from the estuarine environment (St. Johns River, Florida). Unlike the FL approach that is associated with the biological and ecological impacts, the 7Q10 approach could lead to the selections of extremely low flows (e.g., near-zero flows) that may hinder its use for establishing criteria to prevent streams from significant harm to biological and ecological communities. Additionally, the 7Q10 approach could not be used when the period of data records is less than 10 years while this is not the case for the FL approach. Results from both approaches showed that the low flows from the Big Sunflower River and the St. Johns River decreased as time elapsed, demonstrating that these two rivers have become drier during the last several decades with a potential of salted water intrusion to the St. Johns River. Results from the FL approach further revealed that the recurrence probability of low flow increased while the recurrence interval of low flow decreased as time elapsed in both rivers, indicating that low flows occurred more frequent in these rivers as time elapsed. This report suggests that the FL approach, developed in this study, is a useful alternative for low flow selections in addition to the 7Q10 approach.

Surface Water Assessment and Evaluation
233
Sediment and Nutrients Loadings from the Upper Pearl River Watershed
Prem B. Parajuli, Mississippi State University
Sediment and nutrients loading from the non-point sources of agricultural and non-agricultural activities contribute to water quality degradation. Developing Total Maximum Daily Loads (TMDLs) for the sediment and nutrients require quantifying pollutant load contribution from each potential source. Quantifying pollutant loads from each source will help in developing pollutants reduction strategies to meet applicable water quality standards. The objective of this research was to monitor sediment and nutrients concentrations and quantify daily, monthly and annual pollutant loadings from the Upper Pearl River watershed (UPRW-7,885 km2) in east-central Mississippi. Analysis of average NCDC rainfall, USGS stream flows, observed sediment, and nutrient data from the watershed will be presented. Preliminary results from the model simulations will also be presented using appropriate statistics.

Mississippi Water Resources Conference2012
234
Evaluating a Vegetated Filter Strip in an Agricultural Field
Alina Young, Mississippi State University
The use of best management practices and low impact development strategies have become common in recent years, leading to the need for the creation of hydrologic models to predict their behavior and effectiveness. A vegetated filter strip at the South Farm Research Park at Mississippi State University was used to test two of these models: the Hydrologic Simulation Program-FORTRAN Best Management Practices Editor (HSPF BMPrac) and the System for Urban Stormwater Treatment and Analysis Integration (SUSTAIN). Water samples were taken during the Spring of 2011 and tested for sediments and nutrients; HSPF was used for computing flows, sediments, and nutrients. The filter strip was not effective at pollutant removal with removal efficiency rates of 68.1, 91.7, 86.3, and 115.4 percent for total suspended solids (TSS), total nitrogen (TN), total phosphorus (TP), and dissolved phosphorus (DP) respectively. Calibration of HSPF was successful for TSS with a R2 value of 0.52; nutrients were not as successful with R2 values of 0.11 and 0.43 for TN and TP. HSPF’s BMP Practice Editor demonstrated an drastic over prediction of pollutant removal. Modeling of the VFS in SUSTAIN was not a success due to technical failures preventing the model from running.

Surface Water Assessment and Evaluation
235
Soil Moisture and Watershed Assessment to Predict Wildfire Occurrences in the Southeast
of United StatesEduardo Arias-Araujo, Mississippi State University
Wildfires occurrences are frequent in the Southeast of United States (US) and it has become a major concern in this region. The purpose of this study is to determine the effect that soil moisture (SW) level and basin water- balance values (BWB) have over summer-wildfires occurrences in the Southeast of US which encompasses Texas, Louisiana, Oklahoma, Mississippi, Alabama, Tennessee, Georgia, Florida, South Carolina and North Carolina. Quantifying, analyzing and processing the spatial and temporal distribution of SW and BWB could be an effective method for modeling, managing and preventing potential wildfire occurrences. Most of the studies related with this topic have been done to assess the causes and ecological conditions that aid the beginning of wildfires; however, there has not been found studies that integrate SW and BWB to evaluate and predict the wildfires occurrences. Hydrological models such Soil Water Assessment Tools (SWAT) and Hydrological Simulation Program--Fortran (HSPF) are being used as tools to evaluate, compare and simulate watershed water-flow and SW outputs at specific locations where the density of wildfires occurrences are elevated, medium and low; the purpose of this analysis is to contrast temporally and spatially the three scenarios. To evaluate the complete Southeast of US a simpler soil water-balance model is being utilized because of the large extension of study area. SWAT and/or HSPF require data intensive inputs and extensive parameterization thus these models have limited capabilities to process the complete Southeast region. ArcGIS and MATLAB software have being used to compile, prepare and analyze data. Wildfire data, Digital Elevation Models (DEMs), NASA -Land Information System (LIS) gridded binary (GRIB) data, National Land Cover Data (nlcd), STASTGO soil units (USDA-NRCS), USGS-stream-gauges and NOAA Doppler data (precipitation) is being used in the assessment. The final product will be Graphical user interface (GUI) that permits the modeling and prediction the wildfires occurrences in the southeast of US. This GUI will be distributed and shared with governmental agencies and private organizations associated with Forest and Land management. This project is being funded by National Aeronautics and Space Administration (NASA).