First Quarter Report 2014 Australasian Joint Agencies Scanning Network
Upload
khangminh22Category
view
0download
0


FIRST QUARTER ECONOMIC REPORT 2006
ECONOMIC ANALYSIS DIVISION ECONOMIC ANALYSIS AND BUSINESS FACILITATION UNIT
FINANCIAL SECRETARY’S OFFICE GOVERNMENT OF THE
HONG KONG SPECIAL ADMINISTRATIVE REGION
MAY 2006


CONTENTS Paragraphs CHAPTER 1: OVERVIEW OF ECONOMIC PERFORMANCE
Overall situation 1.1 - 1.5 Net output or value added by major economic sector 1.6 Some highlights of economic policy 1.7 - 1.9 Box 1.1 Have the demographic and education factors affected the unemployment rate?
CHAPTER 2: THE EXTERNAL SECTOR
Visible trade Total exports of goods 2.1 - 2.4 Imports of goods 2.5 Invisible trade Exports of services 2.6 Imports of services 2.7 Visible and invisible trade balance 2.8 Trade policy and other developments 2.9 Co-operation with the Mainland under CEPA 2.10 - 2.11 Pan-PRD co-operation 2.12 CHAPTER 3: DEVELOPMENTS IN SELECTED SECTORS
Property 3.1 - 3.4 Land 3.5 - 3.6 Public transport 3.7 - 3.8 Tourism 3.9 - 3.11 Logistics 3.12 - 3.13 Creativity and innovation 3.14 - 3.16 Box 3.1 Spending pattern of the Mainland visitors under the Individual Visit Scheme
CHAPTER 4: THE FINANCIAL SECTOR
Overall situation 4.1 - 4.2 Interest rates, aggregate balance and exchange rates 4.3 - 4.6 Money supply and deposits 4.7 - 4.8
Loans and advances 4.9 Banking 4.10 - 4.13 The debt market 4.14 - 4.15 The stock and futures markets 4.16 - 4.19 Fund management and investment funds 4.20 - 4.21 Insurance 4.22 Box 4.1 Key features of Basel II and its benefits to the economy
CHAPTER 5: THE LABOUR SECTOR
Overall labour market situation 5.1 Total employment and labour supply 5.2 - 5.3 Profile of unemployment 5.4 Profile of underemployment 5.5 Profile of employment in establishments 5.6 - 5.7 Vacancies 5.8 - 5.10 Earnings and wages 5.11 - 5.14 Box 5.1 Recent movement in the labour force participation rate CHAPTER 6: PRICES
Consumer prices 6.1 - 6.2 Costs of factor inputs 6.3 - 6.4 Output prices 6.5 GDP deflator 6.6 Box 6.1 Rebasing of the Consumer Price Index STATISTICAL APPENDIX
1
CHAPTER 1 : OVERVIEW OF ECONOMIC PERFORMANCE Summary The strong upturn of the Hong Kong economy continued into the first
quarter of 2006 on a broad front, with GDP leaping by 8.2% in real terms, following an already robust 7.3% growth in 2005. Trading and logistics as well as financial services have been the star performers among the various industries.
Externally, merchandise exports attained an even more marked growth in
the first quarter, thanks to surging intra-regional trade, with the Mainland again as the key growth spot. Exports to the European Union also fared well, while exports to the US grew further. Exports of services were likewise robust, with both offshore trade and inbound tourism growing distinctly further.
As for domestic demand, consumption spending showed a solid increase,
benefited from rising employment income and a buoyant stock market. Consumer sentiment remained largely upbeat, although interest rates rose further during the quarter. Overall investment spending sustained distinct growth, having already surged markedly in the fourth quarter of 2005, supported by strengthening corporate profits and increasing confidence in business outlook.
The labour market improved further, with the seasonally adjusted
unemployment rate down to a 4 1/2- year low of 5.2% in the first quarter. Reflecting the sustained demand for labour, wages and earnings rose steadily further and job openings continued to surge across the board at end-2005.
The property market warmed up in the first quarter in thicker trading,
having gone through some consolidation in the second half of 2005. Sentiment about the market outlook remained generally positive, particularly with market expectation that interest rate hikes would possibly come to a pause soon.
Consumer price inflation remained benign in the first quarter, though
edging up slightly alongside the brisk economic expansion. The effects of increasing private housing rentals and higher oil prices have increasingly fed through to the Consumer Price Indices. Yet sustained expansion in production capacity brought about by rising productivity and business investments, coupled with easing import prices, have helped to mitigate the pressures on local prices.
2
Overall situation
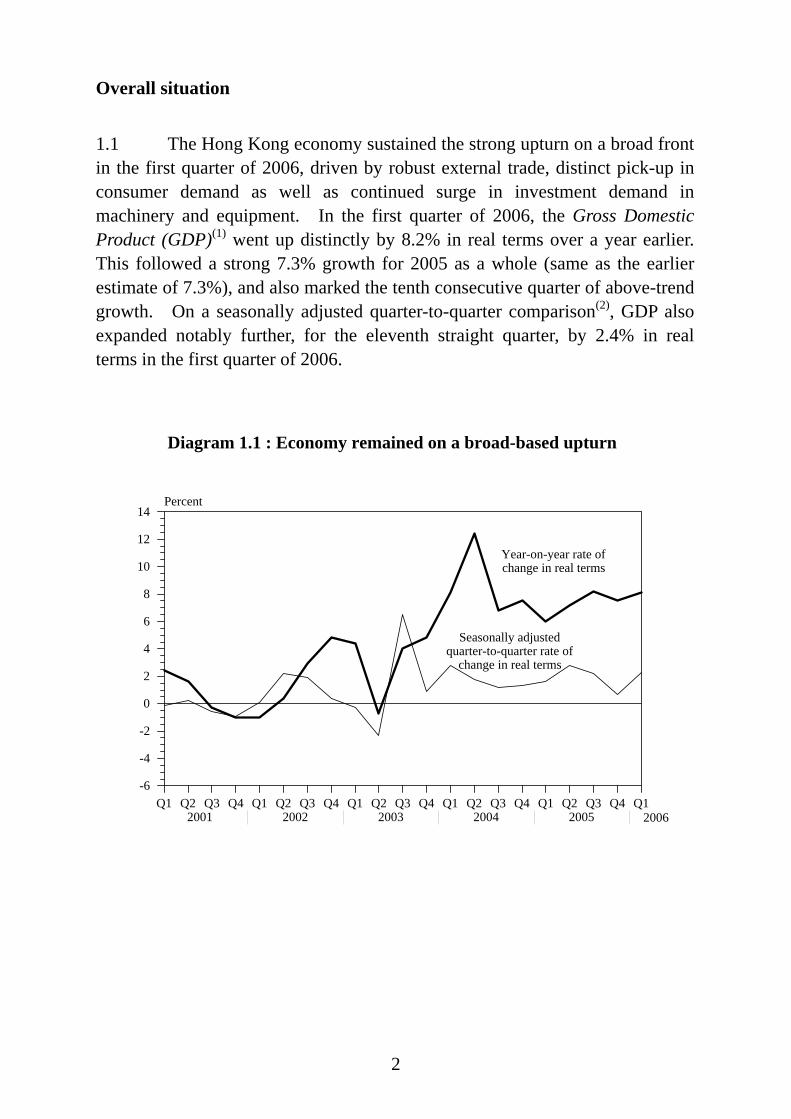
1.1 The Hong Kong economy sustained the strong upturn on a broad front in the first quarter of 2006, driven by robust external trade, distinct pick-up in consumer demand as well as continued surge in investment demand in machinery and equipment. In the first quarter of 2006, the Gross Domestic Product (GDP)(1) went up distinctly by 8.2% in real terms over a year earlier. This followed a strong 7.3% growth for 2005 as a whole (same as the earlier estimate of 7.3%), and also marked the tenth consecutive quarter of above-trend growth. On a seasonally adjusted quarter-to-quarter comparison(2), GDP also expanded notably further, for the eleventh straight quarter, by 2.4% in real terms in the first quarter of 2006.
Q1 Q2 Q3 Q4 Q1 Q2 Q3 Q4 Q1 Q2 Q3 Q4 Q1 Q2 Q3 Q4 Q1 Q2 Q3 Q4 Q12001 2002 2003 2004 2005 2006
0
2
4
6
8
10
12
14
-2
-4
-6
Percent
Year-on-year rate of change in real terms
Seasonally adjusted quarter-to-quarter rate of
change in real terms
Diagram 1.1 : Economy remained on a broad-based upturn
2006
3
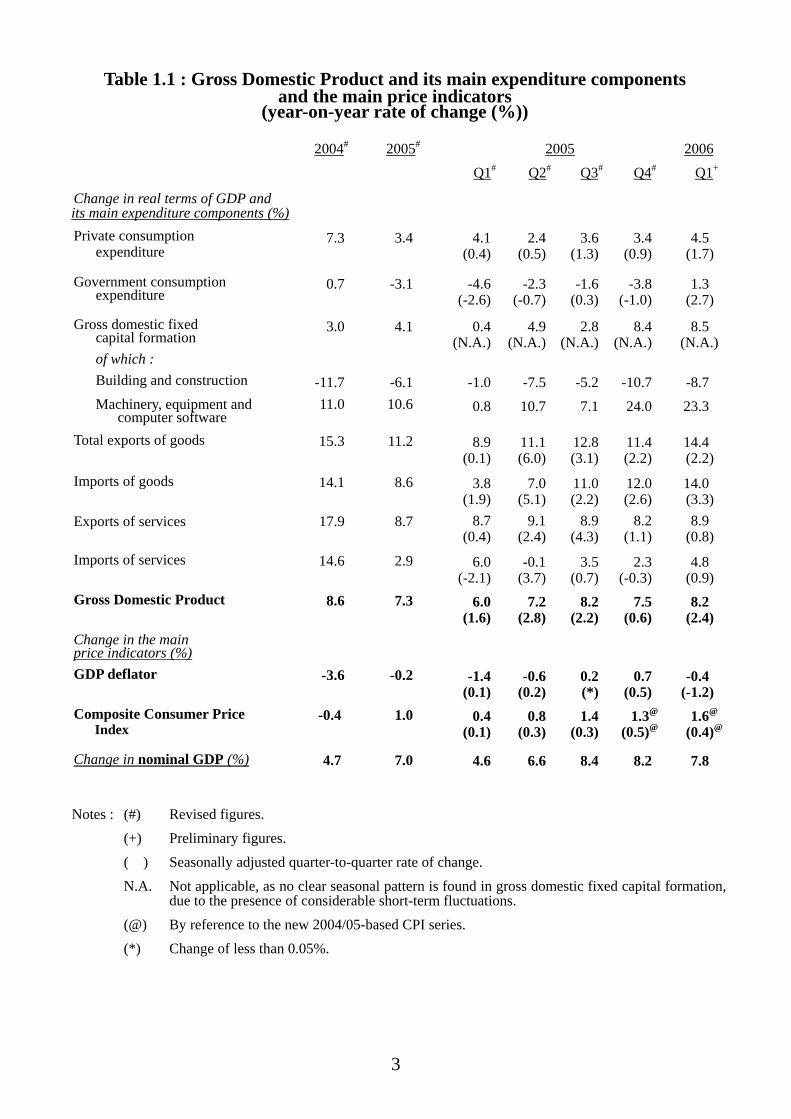
Table 1.1 : Gross Domestic Product and its main expenditure components and the main price indicators
(year-on-year rate of change (%))
2004# 2005# 2005 2006 Q1# Q2# Q3# Q4# Q1+
Change in real terms of GDP and its main expenditure components (%)
Private consumption expenditure
7.3 3.4 4.1(0.4)
2.4(0.5)
3.6 (1.3)
3.4 (0.9)
4.5 (1.7)
Government consumption expenditure
0.7 -3.1 -4.6(-2.6)
-2.3 (-0.7)
-1.6 (0.3)
-3.8 (-1.0)
1.3 (2.7)
Gross domestic fixed capital formation
3.0 4.1 0.4(N.A.)
4.9(N.A.)
2.8 (N.A.)
8.4 (N.A.)
8.5 (N.A.)
of which : Building and construction -11.7 -6.1 -1.0 -7.5 -5.2 -10.7 -8.7 Machinery, equipment and computer software
11.0 10.6 0.8 10.7 7.1 24.0 23.3 Total exports of goods 15.3 11.2 8.9
(0.1)11.1(6.0)
12.8 (3.1)
11.4 (2.2)
14.4 (2.2)
Imports of goods 14.1 8.6 3.8(1.9)
7.0(5.1)
11.0 (2.2)
12.0 (2.6)
14.0 (3.3)
Exports of services 17.9 8.7 8.7(0.4)
9.1(2.4)
8.9 (4.3)
8.2 (1.1)
8.9 (0.8)
Imports of services 14.6 2.9 6.0(-2.1)
-0.1(3.7)
3.5 (0.7)
2.3 (-0.3)
4.8 (0.9)
Gross Domestic Product 8.6 7.3 6.0(1.6)
7.2(2.8)
8.2 (2.2)
7.5 (0.6)
8.2 (2.4)
Change in the main price indicators (%)
GDP deflator -3.6 -0.2 -1.4(0.1)
-0.6(0.2)
0.2 (*)
0.7 (0.5)
-0.4 (-1.2)
Composite Consumer Price Index
-0.4 1.0 0.4(0.1)
0.8(0.3)
1.4 (0.3)
1.3@
(0.5)@1.6@
(0.4)@
Change in nominal GDP (%) 4.7 7.0 4.6 6.6 8.4 8.2 7.8
Notes : (#) Revised figures. (+) Preliminary figures. ( ) Seasonally adjusted quarter-to-quarter rate of change. N.A. Not applicable, as no clear seasonal pattern is found in gross domestic fixed capital formation,
due to the presence of considerable short-term fluctuations. (@) By reference to the new 2004/05-based CPI series. (*) Change of less than 0.05%.
4
1.2 The global economy continued to show a fairly strong performance in the first quarter of 2006, notwithstanding the increase in oil prices and higher interest rates. The Mainland economy in particular remained vibrant. The trade boom throughout the region had led to a surge in intra-regional trade. Against this background, the external sector sustained robust performance and provided an important driving force for Hong Kong’s overall economic growth. Total exports of goods grew markedly, by 14.4% year-on-year in real terms in first quarter, driven mainly by rapid growth in exports to the Mainland and some other Asian markets. On invisible trade, offshore trade and exports of transportation services surged further, on the back of the Mainland’s buoyant trade flows. The thriving inbound tourism also rendered additional support. As a result, exports of services held up well, rising by 8.9% in real terms in the first quarter. 1.3 Domestic demand is playing an increasing role in the current economic upturn, a sign that the economic recovery has become more entrenched. Local consumer spending picked up again in the first quarter, supported by rising labour income and the better performance of the property and stock markets. Private consumption expenditure (PCE) grew by 4.5% in real terms in the first quarter over a year earlier, up from the 3.4% growth attained in 2005. Government consumption expenditure reverted to a slight increase in the first quarter, after declining for six consecutive quarters.
Table 1.2 : Consumer spending by major component(a) (year-on-year rate of change in real terms (%))
Total
consumer spending in the domestic
market(a)
Of
Food
which :
Durables
Non- durables
Services
Residents’ expenditure
abroad
Visitor
spending
Private consumptionexpenditure(b)
2005 Annual 4.3 3.8 6.7 6.3 3.2 -0.6 9.5 3.4
Q1 4.4 2.8 9.5 9.1 2.2 7.7 11.6 4.1 Q2 3.9 4.0 8.2 6.3 2.3 -9.1 8.2 2.4 Q3 4.6 3.2 7.2 5.0 4.2 -1.5 8.7 3.6 Q4 4.1 4.8 2.6 5.1 4.0 0.9 9.6 3.4
2006 Q1 5.1 5.5 4.1 3.4 5.8 1.0 7.5 4.5
Notes : (a) Consumer spending in the domestic market comprises both local consumer and visitor spending, which are not separable from the survey data.
(b) Private consumption expenditure is obtained by deducting visitor spending from the total consumer spending in the domestic market, and adding back residents’ expenditure abroad.
5
Q1 Q3 Q1 Q3 Q1 Q3 Q1 Q3 Q1 Q3 Q12001 2002 2003 2004 2005 2006
0
2
4
6
8
10
12
-2
-4
-6
Percent
Q1 Q3 Q1 Q3 Q1 Q3 Q1 Q3 Q1 Q3 Q12001 2002 2003 2004 2005 2006
0
10
20
30
-10
-20
-30
Year-on-year rate of change in real terms (%)
Overall investment expenditure
Expenditure on building and construction
Expenditure on machinery,
equipment and computer software
Diagram 1.2 : Consumer spending grew solidly despite higher interest rates
Diagram 1.3 : Investment spending still mainly driven by the surge in
expenditure on machinery and equipment
Year-on-year rate of change in real terms
Seasonally adjusted quarter-to-quarter
rate of changein real terms
20062006
1.4 Overall investment spending in terms of gross domestic fixed capital formation sustained a distinct growth at 8.5% in real terms in the first quarter over a year earlier, after the 8.4% growth in the fourth quarter of last year. Expenditure on machinery and equipment remained the key driver of overall investment growth, reflecting the strong investor confidence on business outlook as well as the need to expand capacity to capture the sustained increase in business opportunities. Building and construction activity was however still sluggish, dragged mainly by the fall-off in public sector construction along with the winding-down of such major projects as the Shenzhen-Hong Kong Western Corridor and Deep Bay Link. 1.5 Consumer price inflation remained benign, running at 1.6% in the first quarter of 2006, by reference to the new 2004/05-based series (or 2.0% by reference to the old 1999/2000-based series). The successive rises in rentals over the past two years have begun to creep into consumer prices to a greater extent. Yet inflationary pressure was mitigated by the concurrent easing in import prices of food and consumer goods, thanks to a continued fall in the prices of food imported from the Mainland as well as the earlier appreciation of the Hong Kong dollar along with the US dollar. As to the GDP deflator, it fell back again in the first quarter, by 0.4%. But this was entirely due to the renewed slackening in the terms of trade resulting from a fall-off in export
6
prices. Excluding the relative price movements of exports and imports, the domestic demand deflator went up by 1.1% in the first quarter, broadly in line with the trend of consumer price inflation.
Q1 Q2 Q3 Q4 Q1 Q2 Q3 Q4 Q1 Q2 Q3 Q4 Q1 Q2 Q3 Q4 Q1 Q2 Q3 Q4 Q12001 2002 2003 2004 2005 2006
0
2
4
-2
-4
-6
-8
Year-on-year rate of change (%)
Diagram 1.4 : Inflation remained benign amidst brisk economic expansion
GDP deflator
Domestic demand deflator
Composite Consumer Price Index
2006
Note : From the fourth quarter of 2005 onwards, the year-on-year rates of change in the Consumer Price Indices are computed from the new 2004/05-based CPI series. Before then, the year-on-year rates of change are computed from the old 1999/2000-based CPI series. Splicing has been applied to the indices to maintain continuity.
7
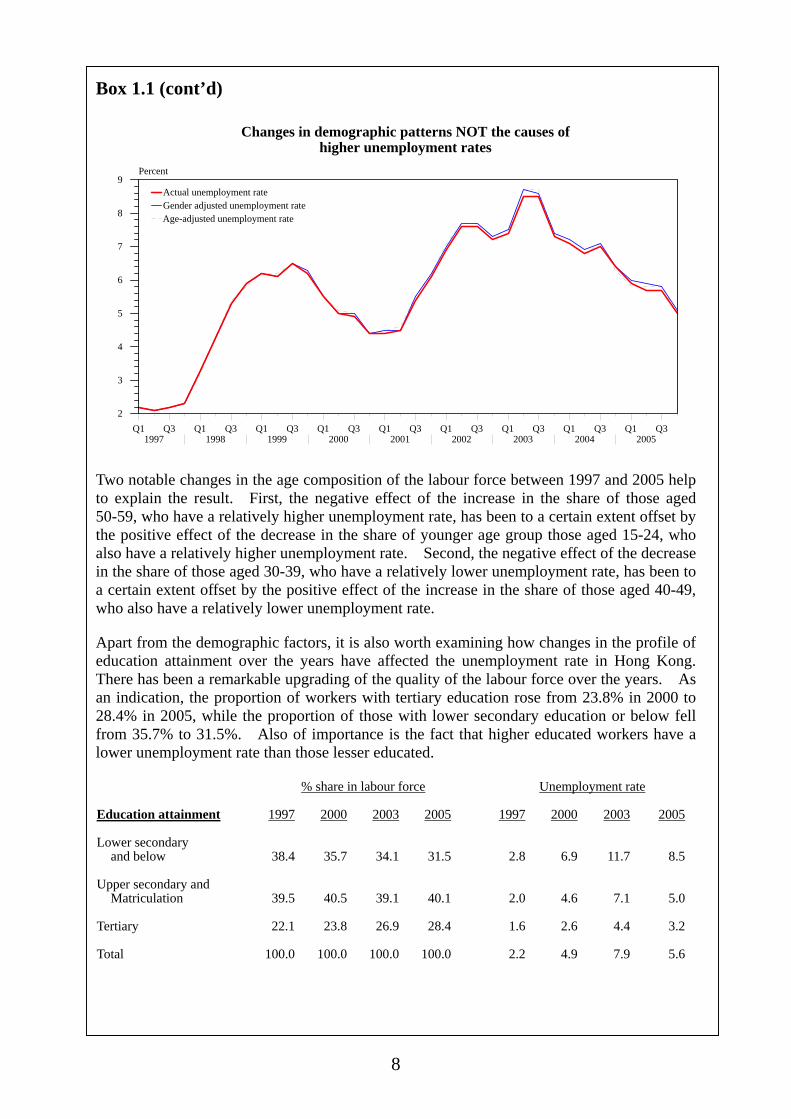
Box 1.1
Have the demographic and education factors affected the unemployment rate?
The Hong Kong economy returned to above trend growth in the past two years, yet the unemployment rate still stood at a relatively high level compared with the historical experience. Some people are concerned that an ageing population might have led to a higher unemployment rate amid the shift of the economy towards knowledge-based activity. Thus it is worth examining whether changes in the demographic structure over time can indeed help explain the “high unemployment rate” phenomenon. Similar to the ageing phenomenon on-going in many developed economies, Hong Kong has also experienced gradual ageing of its population. The proportion of workers aged at 50 or above in total labour force increased steadily from 15.8% in 2000 to 19.4% in 2005. The proportion of the middle-age group, i.e. those aged 40-49, also rose, from 26.4% in 2000 to 29.9% in 2005. By contrast, the proportions of the younger age groups, namely those aged 15-24, 25-29 and 30-39, all fell. As to the gender composition of the labour-force, there has been a moderate increase in the proportion of female workers, from 41.8% in 2000 to 44.8% in 2005. The changes in the age and gender composition of the labour force largely follow the corresponding changes in Hong Kong’s overall population,
% share in labour force Unemployment rate
Age group 1997 2000 2003 2005 1997 2000 2003 2005 15-24 13.9 12.7 11.2 11.0 5.0 10.7 15.0 10.8 25-29 14.7 14.3 12.7 12.0 2.0 4.3 6.7 4.4 30-39 32.7 30.8 29.2 27.8 1.6 3.2 6.0 3.8 40-49 24.3 26.4 29.2 29.9 1.7 4.3 7.3 5.2 50-59 10.5 12.4 14.6 16.2 2.2 6.0 9.4 7.0 60 and above 3.9 3.8 3.2 3.2 1.0 2.9 4.5 3.8 Total 100.0 100.0 100.0 100.0 2.2 4.9 7.9 5.6 Gender group Male 60.4 58.2 56.1 55.2 2.3 5.6 9.3 6.5 Female 39.6 41.8 43.9 44.8 2.0 4.1 6.2 4.4
The impact of demographic factors on the unemployment rate can be analysed by re-constructing the unemployment rate series based on a fixed age or gender structure in a base year, and then comparing them with the actual unemployment rate series to delineate the changes in unemployment rate arising from changes in demographic factors. The first series, “gender-adjusted unemployment rate”, is constructed by standardising the unemployment rate to the gender profile in a fixed base year (1997 used as the base year in the present exercise). The second series, “age-adjusted unemployment rate”, is constructed by standardising the unemployment rate to the age profile in 1997. The movements of the gender-adjusted and age-adjusted unemployment rates, together with the actual unemployment rate, are shown in following chart. The changing composition of the population by sex and age over the past decade or so had only a modest effect on the unemployment rate. For example, the gender-adjusted unemployment rate and the age-adjusted unemployment rate were 5.1% and 5.0% respectively in the fourth quarter of 2005, little different from the actual unemployment rate of 5.0%. In other words, changes in the gender and age composition of the labour force since 1997 were not the cause of the high unemployment rate in Hong Kong in recent years. This runs contrary to the common perception that the unemployment rate will tend to rise as the population ages.
8
Box 1.1 (cont’d)
Q1 Q3 Q1 Q3 Q1 Q3 Q1 Q3 Q1 Q3 Q1 Q3 Q1 Q3 Q1 Q3 Q1 Q31997 1998 1999 2000 2001 2002 2003 2004 2005
2
3
4
5
6
7
8
9Percent
Actual unemployment rate Gender adjusted unemployment rate
Age-adjusted unemployment rate
Changes in demographic patterns NOT the causes ofhigher unemployment rates
Two notable changes in the age composition of the labour force between 1997 and 2005 help to explain the result. First, the negative effect of the increase in the share of those aged 50-59, who have a relatively higher unemployment rate, has been to a certain extent offset by the positive effect of the decrease in the share of younger age group those aged 15-24, who also have a relatively higher unemployment rate. Second, the negative effect of the decrease in the share of those aged 30-39, who have a relatively lower unemployment rate, has been to a certain extent offset by the positive effect of the increase in the share of those aged 40-49, who also have a relatively lower unemployment rate. Apart from the demographic factors, it is also worth examining how changes in the profile of education attainment over the years have affected the unemployment rate in Hong Kong. There has been a remarkable upgrading of the quality of the labour force over the years. As an indication, the proportion of workers with tertiary education rose from 23.8% in 2000 to 28.4% in 2005, while the proportion of those with lower secondary education or below fell from 35.7% to 31.5%. Also of importance is the fact that higher educated workers have a lower unemployment rate than those lesser educated. % share in labour force Unemployment rate Education attainment 1997 2000 2003 2005 1997 2000 2003 2005 Lower secondary
and below 38.4 35.7 34.1 31.5 2.8 6.9 11.7 8.5 Upper secondary and
Matriculation 39.5 40.5 39.1 40.1 2.0 4.6 7.1 5.0 Tertiary 22.1 23.8 26.9 28.4 1.6 2.6 4.4 3.2 Total 100.0 100.0 100.0 100.0 2.2 4.9 7.9 5.6

9
Box 1.1 (cont’d) An education-adjusted unemployment rate is again constructed to delineate the effect of education on the unemployment rate. As an illustration, if the education profile of the labour force in the fourth quarter of 2005 had remained unchanged from that in 1997, i.e. without the substantial upgrading in education attainment of our workforce, the unemployment rate would have been 5.4% instead of 5.0%. That the effect of changes in the education profile of the labour force since 1997 has helped to lower the unemployment rate is easy to understand. This is because the increase in the share of workers with tertiary education, who have a relatively lower unemployment rate, coupled with the decrease in the share of workers with lower secondary education and below, who have a relatively higher unemployment rate, has resulted in a lower overall unemployment rate than otherwise. This also points to the importance of continuous investment in human capital as a means to improve the flexibility and vitality of the labour market. Indeed, if not with the substantial investment in education, Hong Kong’s labour market would have faced even more difficulties in weathering the severe shocks from the 1998 Asian Financial Turmoil and the 911 incident.
Q1 Q3 Q1 Q3 Q1 Q3 Q1 Q3 Q1 Q3 Q1 Q3 Q1 Q3 Q1 Q3 Q1 Q31997 1998 1999 2000 2001 2002 2003 2004 2005
2
4
6
8
10Percent
Actual unemployment rate Education adjusted Gender-age-education adjusted
Significant improvement in education attaintment over the yearsactually helped to lower Hong Kong's unemployment rate
Also worthy to note is the joint effect of the gender, age and education factors on the unemployment rate, which is found to be much more pronounced than the summation of the three individually assessed effects. For instance, the gender-age-education adjusted unemployment rate in the fourth quarter of 2005 was 6.0%, one percentage point higher than the actual unemployment rate of 5.0%. Although the age-gender compositional changes are not found to be the main cause of high unemployment in recent years, the impact of ageing as the economy continues to gear towards knowledge-based and service activities cannot be taken lightly over the longer run. Workers of older age and lesser educated usually experience greater difficulties in upgrading their skills and knowledge to meet the challenges from the changing economic environment. This makes it all the more important for the Government to continue to invest in higher education and in job training and retraining, so as to tackle the skill mismatch and also to raise productivity for a smoother transition to knowledge-based economy.
Significant improvement in education attainment over the years actually helped to lower Hong Kong’s unemployment rate
10
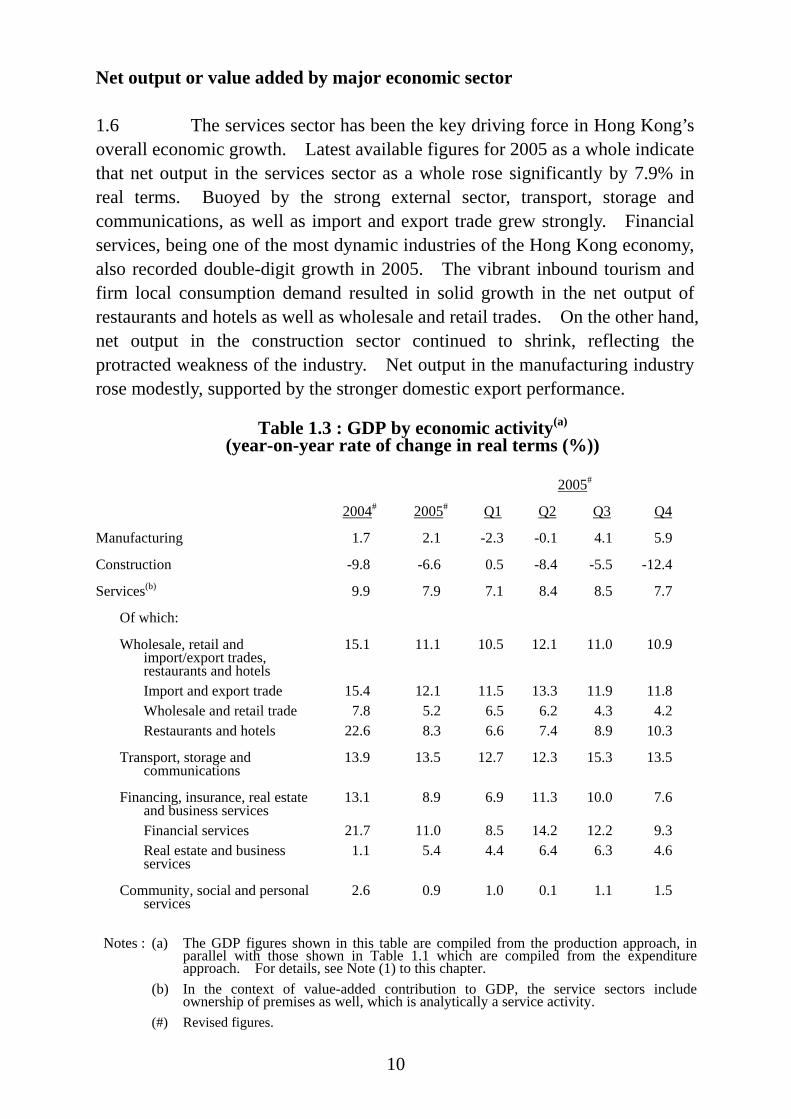
Net output or value added by major economic sector 1.6 The services sector has been the key driving force in Hong Kong’s overall economic growth. Latest available figures for 2005 as a whole indicate that net output in the services sector as a whole rose significantly by 7.9% in real terms. Buoyed by the strong external sector, transport, storage and communications, as well as import and export trade grew strongly. Financial services, being one of the most dynamic industries of the Hong Kong economy, also recorded double-digit growth in 2005. The vibrant inbound tourism and firm local consumption demand resulted in solid growth in the net output of restaurants and hotels as well as wholesale and retail trades. On the other hand, net output in the construction sector continued to shrink, reflecting the protracted weakness of the industry. Net output in the manufacturing industry rose modestly, supported by the stronger domestic export performance.
Table 1.3 : GDP by economic activity(a) (year-on-year rate of change in real terms (%))
2005# 2004# 2005# Q1 Q2 Q3 Q4
Manufacturing 1.7 2.1 -2.3 -0.1 4.1 5.9
Construction -9.8 -6.6 0.5 -8.4 -5.5 -12.4 Services(b) 9.9 7.9 7.1 8.4 8.5 7.7 Of which:
Wholesale, retail and
import/export trades, restaurants and hotels
15.1 11.1 10.5 12.1 11.0 10.9
Import and export trade 15.4 12.1 11.5 13.3 11.9 11.8 Wholesale and retail trade 7.8 5.2 6.5 6.2 4.3 4.2 Restaurants and hotels 22.6 8.3 6.6 7.4 8.9 10.3 Transport, storage and
communications 13.9 13.5 12.7 12.3 15.3 13.5
Financing, insurance, real estate
and business services 13.1 8.9 6.9 11.3 10.0 7.6
Financial services 21.7 11.0 8.5 14.2 12.2 9.3 Real estate and business
services 1.1 5.4 4.4 6.4 6.3 4.6
Community, social and personal
services 2.6 0.9 1.0 0.1 1.1 1.5
Notes : (a) The GDP figures shown in this table are compiled from the production approach, in parallel with those shown in Table 1.1 which are compiled from the expenditure approach. For details, see Note (1) to this chapter.
(b) In the context of value-added contribution to GDP, the service sectors include ownership of premises as well, which is analytically a service activity.
(#) Revised figures.
11
Some highlights of economic policy 1.7 The main thrust of the Government’s economic policy is the principle of “Big Market, Small Government”. The future directions for development are to enhance innovative and value-adding capabilities, and continue to enhance Hong Kong’s competitive advantages in the following areas:
• continuing economic co-operation with the Mainland;
• improving business environment. The Business Facilitation Advisory Committee will, inter alia, conduct in-depth regulatory/licensing control reviews of the construction, entertainment, retail and catering industries;
• continuing to strengthen financial services. Hong Kong is best-placed to become the launchpad for Mainland enterprises to develop a global presence. Measures to be implemented include continuing to expand the scope of Renminbi business; setting up a Financial Reporting Council to enhance the quality of Hong Kong’s financial markets; exempting offshore funds from profits tax; and reducing the levy on trading in securities, futures and options contracts by 20 per cent within this year;
• promoting tourism through redeveloping existing and opening new facilities;
• developing logistics, including considering provision for a concession in trade declaration charges for gold to support a proposed gold depository at the Hong Kong International Airport; and
• pooling of talent. Apart from the provision of 1 800 additional hostel places to local tertiary institutions, the Government will also introduce in the first half of 2006 year of the “Quality Migrant Scheme” (QMS) to attract talent from outside Hong Kong. Applicants will be required to meet certain eligibility criteria in respect of, inter alia, academic attainment and professional qualifications, but without having the need to secure prior employment. QMS will have a quota of 1 000 entrants a year.
1.8 On the fiscal front, the Government will continue to manage its finances prudently. The Government provides the community with a basic safety net and aims to build a just and caring society. But Hong Kong cannot be compared with welfare states given the commitment to low tax regime. Following the principle of “Big Market, Small Government” helps to maintain
12
our low-tax regime and requires the government to spend within its means. This is the approach that best serves the long-term interests of Hong Kong. Meanwhile, recognising that a Goods and Services Tax (GST) can help broaden the tax base and provide more stable sources of revenue, the Government will follow the principle of maintaining a low and simple tax regime in working out the details of GST and launch a public consultation in the middle of this year. 1.9 Increasing investment in infrastructure will not only promote economic development and bring more job opportunities, but also make Hong Kong’s living environment more pleasant and enhance its overall competitiveness. A number of large infrastructure projects are under planning. An average of $29 billion a year over the next five years will be earmarked for infrastructure projects, which hopefully will add more new construction jobs to the industry in the coming year. Notes : (1) The Gross Domestic Product (GDP) is an overall measure of net output produced
within an economy in a specified period, such as a calendar year or a quarter, before deducting the consumption of fixed capital. In accordance with the expenditure approach to its estimation, GDP is compiled as total final expenditures on goods and services (including private consumption expenditure, government consumption expenditure, gross domestic fixed capital formation, changes in inventories, and exports of goods and services), less imports of goods and services.
(2) The seasonally adjusted quarter-to-quarter GDP series, by removing the variations that
occur at about the same time and in about the same magnitude each year, provides another perspective for discerning the trend, particularly in regard to turning points. A detailed examination reveals the presence of seasonality in the overall GDP and in some of its main components, including private consumption expenditure, government consumption expenditure, exports of goods, imports of goods, exports of services, and imports of services. However, due to the presence of considerable short-term fluctuations, no clear seasonal pattern is found in gross domestic fixed capital formation. Therefore, the seasonally adjusted series of GDP is compiled separately at the overall level, rather than summing up from its main components.

13
CHAPTER 2 : THE EXTERNAL SECTOR Summary External trade continued to thrive on entering 2006, supported by the
generally favourable external environment and the Mainland’s surging trade flows, which offset mostly the negative impacts of high oil prices, rising global interest rates and the earlier strengthening of the US dollar.
Total exports of goods accelerated even further to a 14.6% growth in real
terms in the first quarter of 2006, up from an already robust increase in the preceding quarter. The strong export performance was marked by surging intra-regional trade, with the Mainland again as the key growth driver. Re-exports continued to grow strongly, a manifestation of the key role of Hong Kong in facilitating trade flows between the Mainland and the rest of the world.
Domestic exports also surged further, continuing the trend that started in mid-2005. Apart from clothing items, domestic exports of office machines and equipment, and telecommunications and sound equipment also grew distinctly. This suggests that certain Hong Kong products are highly competitive in the international markets.
Exports of services also held up well in the first quarter, underpinned by
vibrant offshore trade and further strong growth in inbound tourism. Exports of finance, business and other services also grew in tandem with the upturn in business activities and a buoyant financial market.
Along with the increased openness and further liberalisation of the Mainland
economy, the significance of the Mainland dimension in Hong Kong’s external sector has been gaining even more prominence over the years. To capitalise on the tremendous opportunities arising from the booming Mainland economy, the Government has taken various initiatives to strengthen economic relations with the Mainland, including further liberalisation measures under CEPA, and strengthened co-operation under the Pan-PRD framework.
14
Visible trade Total exports of goods 2.1 Supported by the generally favourable external environment and the Mainland’s buoyant trade flows, merchandise exports continued to thrive on entering 2006. Total exports of goods (comprising re-exports and domestic exports) accelerated even further, to growth at 14.6% in real terms(1) in the first quarter of 2006, up from an already strong growth of 11.4% in the fourth quarter of 2005. 2.2 Re-exports(2) remained the key growth driver within overall exports, rising by 13.2% in real terms in the first quarter. The Mainland continued to feature prominently in Hong Kong’s re-export trade, with over 90% of re-exports either sourced from or destined to the Mainland. Indeed, the Mainland is not only the important production hinterland for Hong Kong manufacturers. It is also an increasingly important export market for Hong Kong. Excluding those trade flows related to outward processing, that part of re-exports to the Mainland for meeting their own demand accounted for 29% of Hong Kong’s total re-exports in 2005, up from 19% ten years ago. Thus the Mainland market is now even more important than the United States (which accounts for 15% of total re-exports) and also the European Union (14%). As the Mainland is striving to rebalance its growth pattern towards more domestic demand-led in the coming years, it can be envisaged that Hong Kong’s re-exports to the Mainland for meeting its domestic demand will gain more prominence over time. 2.3 Domestic exports also surged further, by 42.3% in real terms in the first quarter of 2006, continuing the strong uptrend that started in mid-2005. Exports of clothing items soared, after the shift-back in clothing production to Hong Kong last year(3). Also noteworthy was the concurrent surge in domestic exports of office machines and equipment, and telecommunications and sound equipment. This suggested that certain Hong Kong products are actually highly competitive in the international markets, despite the relatively high local labour cost.
15
Table 2.1 : Total exports of goods, re-exports and domestic exports (year-on-year rate of change (%))
Total exports of goods Re-exports Domestic exports
In value
terms In real terms
Changein prices
In valueterms
In real terms
Changein prices
In value terms
In real terms
Changein prices
2005 Annual 11.4 11.4 1.3 11.7 11.6 1.2 8.0 7.6 2.2 Q1 10.6 9.2 (0.2) 2.1 11.7 10.4 (0.9) 2.0 -6.9 -9.5 (-11.3) 4.8 Q2 12.5 11.7 (6.0) 1.8 13.8 13.0 (6.1) 1.6 -6.4 -8.3 (4.0) 4.7 Q3 12.5 12.8 (3.0) 1.0 12.4 12.7 (2.0) 1.0 14.0 14.3 (21.7) 1.1 Q4 10.0 11.4 (2.2) 0.4 9.0 10.3 (1.3) 0.5 25.2 28.1 (15.3) -0.5 2006 Q1 12.1 14.6 (2.5) -0.3 10.7 13.2 (2.9) -0.2 38.7 42.3 (-2.7) -2.9 Note : Figures in brackets are the seasonally adjusted quarter-to-quarter rates of change.
Diagram 2.1 : Merchandise exports continued to thrive on entering 2006, despite the negative impact from the earlier strengthening of the US dollar
(year-on-year rate of change)
Hong Kong's total exports of goods
(left scale)
Q1 Q2 Q3 Q4 Q1 Q2 Q3 Q4 Q1 Q2 Q3 Q4 Q1 Q2 Q3 Q4 Q1 Q2 Q3 Q4 Q12001 2002 2003 2004 2005 2006
0
5
10
15
20
25
30
35
-5
-10
-15
Percent
0
2
4
6
8
10
12
14
-2
-4
-6
Percent
Trade-weighted Real EERI*(right scale)
-12
-10
-8
-6
-4
-2
0
2
4
6
-14
Total import demand in Hong Kong's major markets
(left scale)
Notes : Total exports of goods as depicted refer to the year-on-year rate of
change in real terms, while total import demand in Hong Kong’s major markets as depicted refers to the year-on-year rate of change in US dollar terms in the aggregate import demand in East Asia, the United States and the European Union taken together.
(*) For ease of comparison with the rate of change in Hong
Kong’s total exports of goods, the scale for the Real EERI is presented here upside down, so that positive changes denoting real appreciation of the Hong Kong dollar appear at the lower part and negative changes denoting real depreciation at the upper part of the diagram.
16
Q1 Q3 Q1 Q3 Q1 Q3 Q1 Q3 Q1 Q3 Q12001 2002 2003 2004 2005 2006
05
101520253035404550
-5-10-15-20
Percent
Q1 Q3 Q1 Q3 Q1 Q3 Q1 Q3 Q1 Q3 Q12001 2002 2003 2004 2005 2006
05
101520253035404550
-5-10-15-20
Percent
(a) Year-on-year rate of change in real terms
(b) Seasonally adjusted quarter-to-quarterrate of change in real terms
Re-exports
Re-exports
Domestic exports
Domestic exports
Total exports
of goodsTotal
exports of goods
Diagram 2.2 : Re-exports remained the growth driver,while domestic exports sustained strong growth momentum
2006 2006
Total exports of goods in the first quarter of 2006 : $537.0 billion
Mainland of China$248.3 billion (46%)
United States$77.0 billion (14%)
Japan$29.3 billion (5%)
Germany$18.0 billion (3%)
United Kingdom$14.8 billion (3%)
Others$113.5 billion (21%)
Taiwan$12.0 billion (2%)
Singapore$11.1 billion (2%)
Republic of Korea$13.0 billion (2%)
Diagram 2.3 : The Mainland featured prominently in Hong Kong's exports
17
Table 2.2 : Total exports of goods by major market (year-on-year rate of change in real terms (%))
Mainland
of China UnitedStates
Japan
United Kingdom
Germany
Taiwan
Singapore
Republicof Korea
2005 Annual 14.2 5.5 9.6 5.4 14.8 4.1 9.0 10.8 Q1 9.9 5.1 11.5 11.9 18.2 -5.4 15.7 5.4 Q2 13.3 7.6 10.8 9.4 15.1 4.8 14.5 5.4 Q3 14.9 8.4 11.1 2.0 12.9 8.4 0.8 12.7 Q4 17.9 0.9 5.6 1.1 13.6 8.2 6.6 19.0 2006 Q1 23.1 3.5 8.2 2.3 10.8 10.4 2.3 20.9 2.4 Notwithstanding the strong overall growth, performance in individual markets was diverse. Exports to the Mainland accelerated further, bolstered by the Mainland’s persistently strong industrial activity and robust domestic demand. Exports to Japan also re-accelerated, supported by Japan’s strengthening economy, which helped offset the restraining effect of the weakening of the yen over the past quarters. Exports to most other East Asian markets likewise grew strongly, in tandem with the surge in intra-regional trade, thanks to the export boom throughout Asia but also partly helped by the recovery in global demand for IT products. Exports to the EU market as a whole still fared quite well, albeit moderating from the strong growth last year. The deceleration was partly due to the feed-through of weaker euro and pound sterling, but there was also some distortion to the base effect caused by an exceptional surge in T&C exports a year ago. Likewise, for the US market, the deceleration in exports was more apparent than real, again being largely distorted by a distinctly high base caused by T&C items in early 2005. Exports other than T&C items to the United States actually held up well, in line with the pick-up in US import demand in the first quarter.
18
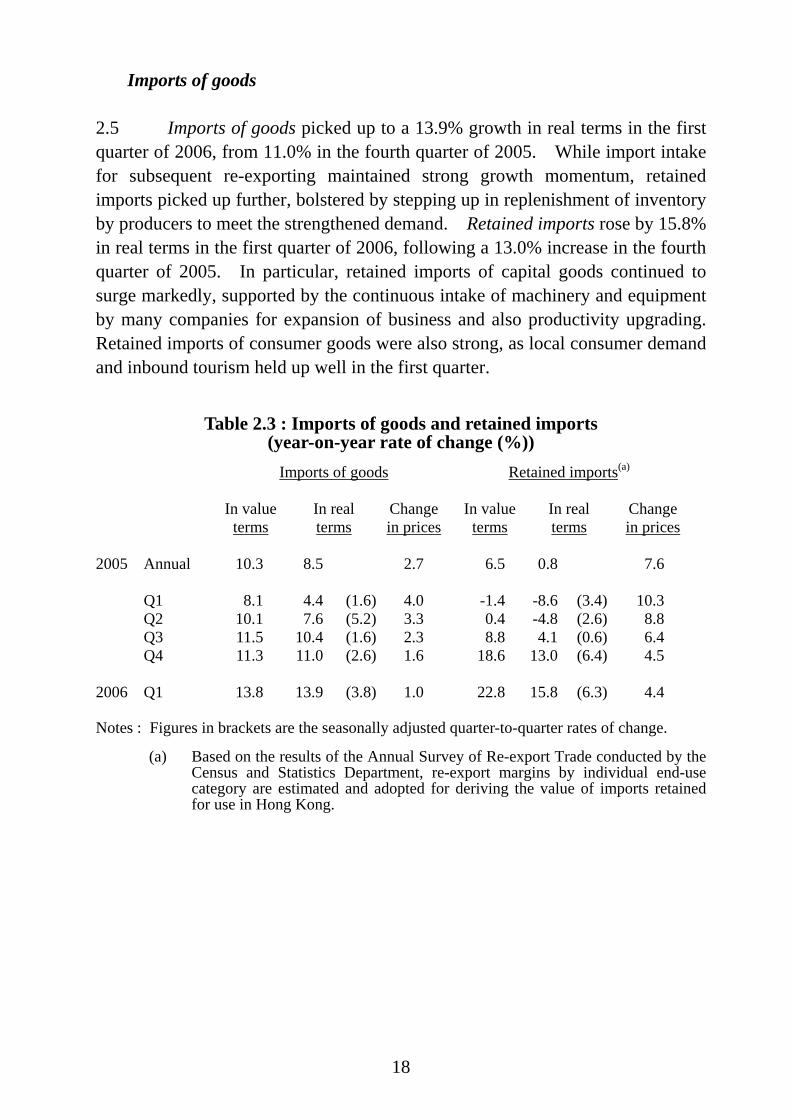
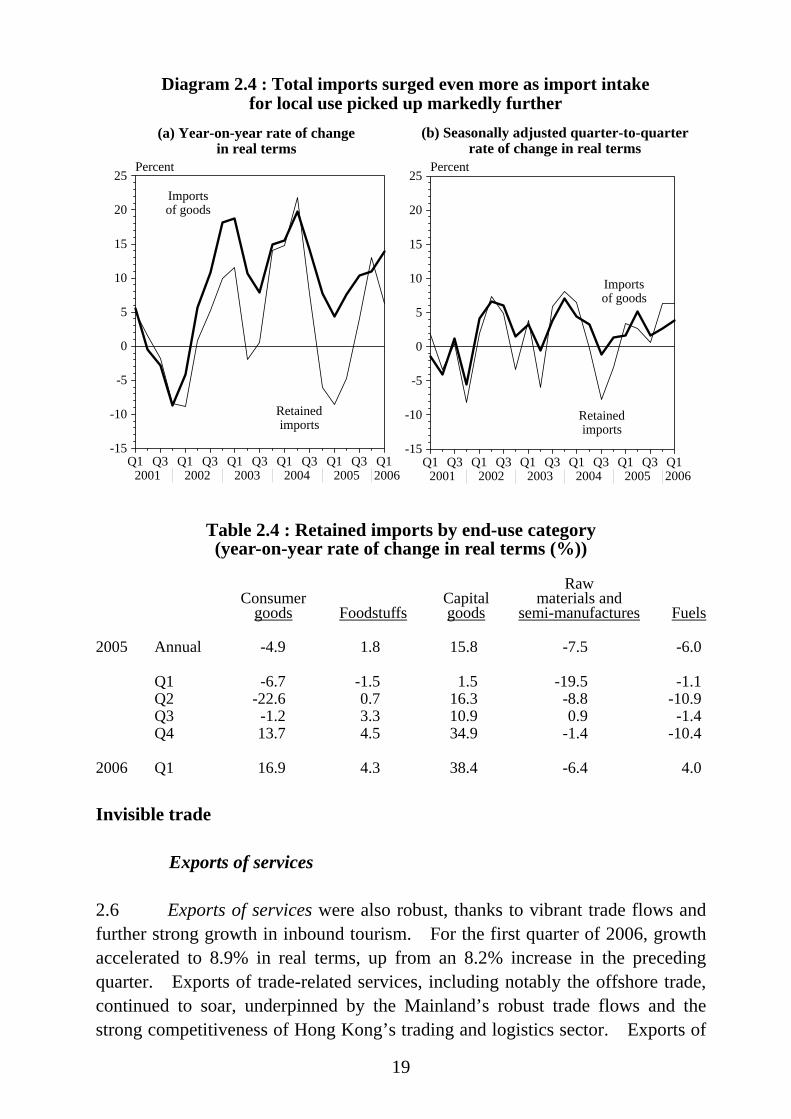
Imports of goods 2.5 Imports of goods picked up to a 13.9% growth in real terms in the first quarter of 2006, from 11.0% in the fourth quarter of 2005. While import intake for subsequent re-exporting maintained strong growth momentum, retained imports picked up further, bolstered by stepping up in replenishment of inventory by producers to meet the strengthened demand. Retained imports rose by 15.8% in real terms in the first quarter of 2006, following a 13.0% increase in the fourth quarter of 2005. In particular, retained imports of capital goods continued to surge markedly, supported by the continuous intake of machinery and equipment by many companies for expansion of business and also productivity upgrading. Retained imports of consumer goods were also strong, as local consumer demand and inbound tourism held up well in the first quarter.
Table 2.3 : Imports of goods and retained imports (year-on-year rate of change (%))
Imports of goods Retained imports(a)
In value terms
In real terms
Change in prices
In valueterms
In real terms
Changein prices
2005 Annual 10.3 8.5 2.7 6.5 0.8 7.6 Q1 8.1 4.4 (1.6) 4.0 -1.4 -8.6 (3.4) 10.3 Q2 10.1 7.6 (5.2) 3.3 0.4 -4.8 (2.6) 8.8 Q3 11.5 10.4 (1.6) 2.3 8.8 4.1 (0.6) 6.4 Q4 11.3 11.0 (2.6) 1.6 18.6 13.0 (6.4) 4.5 2006 Q1 13.8 13.9 (3.8) 1.0 22.8 15.8 (6.3) 4.4 Notes : Figures in brackets are the seasonally adjusted quarter-to-quarter rates of change. (a) Based on the results of the Annual Survey of Re-export Trade conducted by the
Census and Statistics Department, re-export margins by individual end-use category are estimated and adopted for deriving the value of imports retained for use in Hong Kong.
19
(a) Year-on-year rate of change in real terms
(b) Seasonally adjusted quarter-to-quarterrate of change in real terms
Re-exports
Domestic exports
Total exports of goods
Q1 Q3 Q1 Q3 Q1 Q3 Q1 Q3 Q1 Q3 Q12001 2002 2003 2004 2005 2006
0
5
10
15
20
25
-5
-10
-15
Percent
Q1 Q3 Q1 Q3 Q1 Q3 Q1 Q3 Q1 Q3 Q12001 2002 2003 2004 2005 2006
0
5
10
15
20
25
-5
-10
-15
Percent
Imports of goods
Retained imports
Imports of goods
Retained imports
Diagram 2.4 : Total imports surged even more as import intake for local use picked up markedly further
2006 2006
Table 2.4 : Retained imports by end-use category (year-on-year rate of change in real terms (%))
Consumer goods
Foodstuffs
Capital goods
Raw materials and
semi-manufactures
Fuels 2005 Annual -4.9 1.8 15.8 -7.5 -6.0 Q1 -6.7 -1.5 1.5 -19.5 -1.1 Q2 -22.6 0.7 16.3 -8.8 -10.9 Q3 -1.2 3.3 10.9 0.9 -1.4 Q4 13.7 4.5 34.9 -1.4 -10.4 2006 Q1 16.9 4.3 38.4 -6.4 4.0
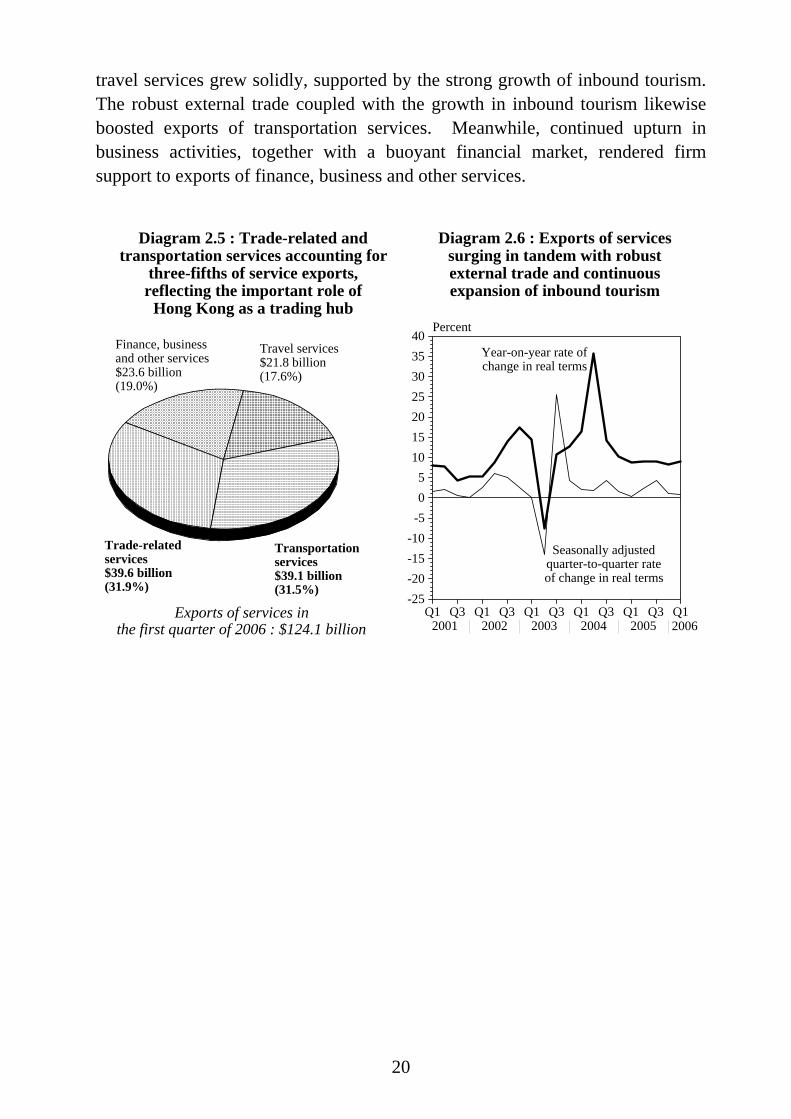
Invisible trade Exports of services 2.6 Exports of services were also robust, thanks to vibrant trade flows and further strong growth in inbound tourism. For the first quarter of 2006, growth accelerated to 8.9% in real terms, up from an 8.2% increase in the preceding quarter. Exports of trade-related services, including notably the offshore trade, continued to soar, underpinned by the Mainland’s robust trade flows and the strong competitiveness of Hong Kong’s trading and logistics sector. Exports of
20
travel services grew solidly, supported by the strong growth of inbound tourism. The robust external trade coupled with the growth in inbound tourism likewise boosted exports of transportation services. Meanwhile, continued upturn in business activities, together with a buoyant financial market, rendered firm support to exports of finance, business and other services.
Exports of services inthe first quarter of 2006 : $124.1 billion
Transportation services$39.1 billion(31.5%)
Finance, businessand other services$23.6 billion(19.0%)
Trade-relatedservices$39.6 billion(31.9%)
Travel services$21.8 billion(17.6%)
Diagram 2.5 : Trade-related and transportation services accounting for
three-fifths of service exports, reflecting the important role of
Hong Kong as a trading hub
Q1 Q3 Q1 Q3 Q1 Q3 Q1 Q3 Q1 Q3 Q12001 2002 2003 2004 2005 2006
05
10152025303540
-5-10-15-20-25
Percent
Diagram 2.6 : Exports of services surging in tandem with robust external trade and continuous expansion of inbound tourism
Year-on-year rate of change in real terms
Seasonally adjusted quarter-to-quarter rate of change in real terms
2006
21
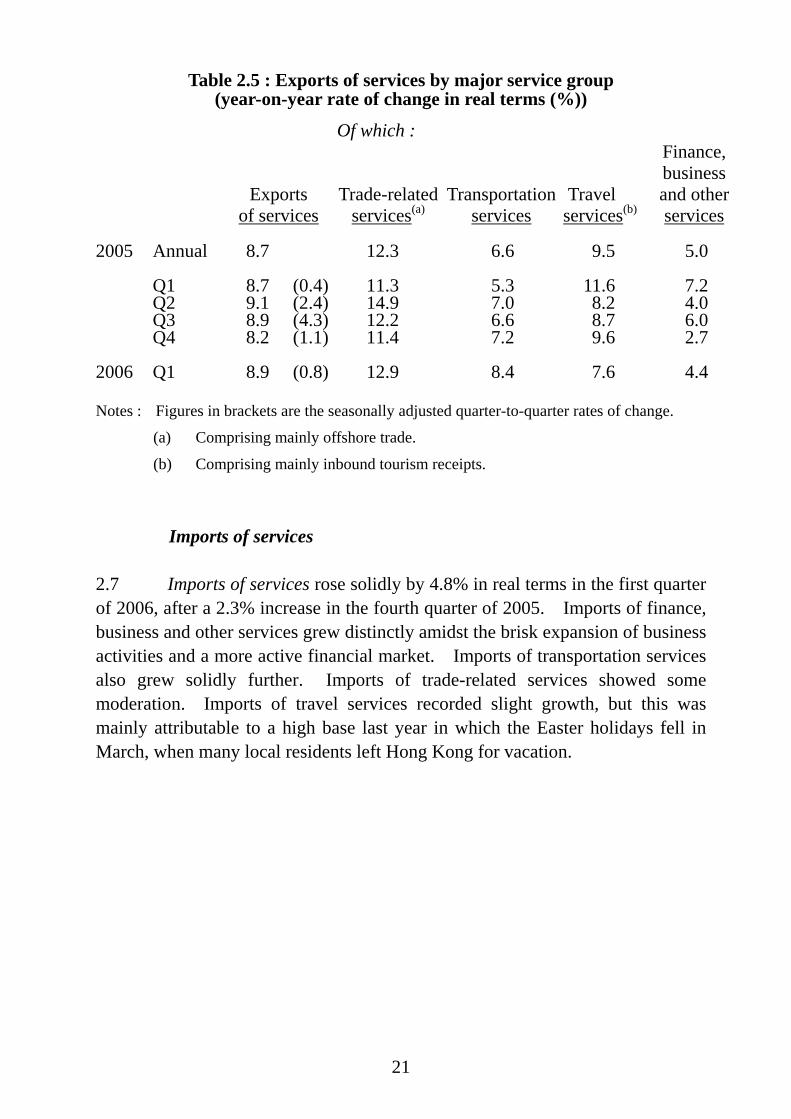
Table 2.5 : Exports of services by major service group (year-on-year rate of change in real terms (%))
Exports of services
Of which :
Trade-related services(a)
Transportation
services
Travel services(b)
Finance, business and otherservices
2005 Annual 8.7 12.3 6.6 9.5 5.0 Q1 8.7 (0.4) 11.3 5.3 11.6 7.2 Q2 9.1 (2.4) 14.9 7.0 8.2 4.0 Q3 8.9 (4.3) 12.2 6.6 8.7 6.0 Q4 8.2 (1.1) 11.4 7.2 9.6 2.7 2006 Q1 8.9 (0.8) 12.9 8.4 7.6 4.4 Notes : Figures in brackets are the seasonally adjusted quarter-to-quarter rates of change. (a) Comprising mainly offshore trade. (b) Comprising mainly inbound tourism receipts. Imports of services 2.7 Imports of services rose solidly by 4.8% in real terms in the first quarter of 2006, after a 2.3% increase in the fourth quarter of 2005. Imports of finance, business and other services grew distinctly amidst the brisk expansion of business activities and a more active financial market. Imports of transportation services also grew solidly further. Imports of trade-related services showed some moderation. Imports of travel services recorded slight growth, but this was mainly attributable to a high base last year in which the Easter holidays fell in March, when many local residents left Hong Kong for vacation.
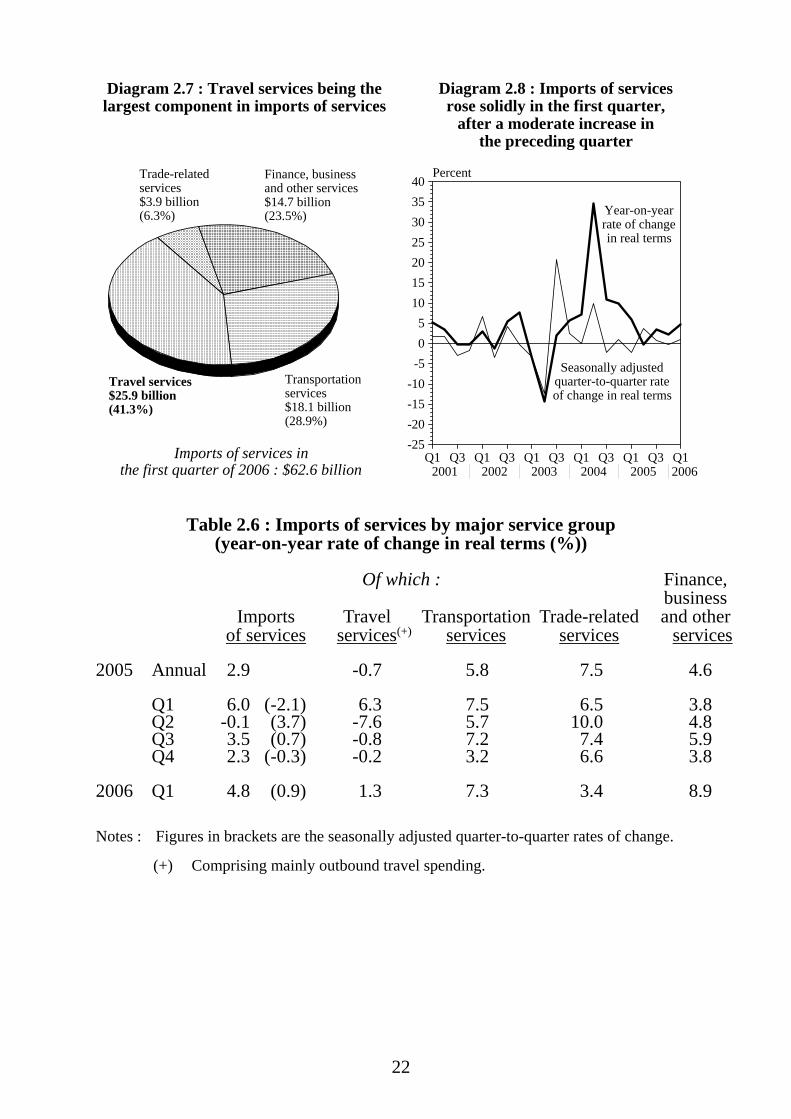
22
Imports of services inthe first quarter of 2006 : $62.6 billion
Diagram 2.7 : Travel services being the largest component in imports of services
Q1 Q3 Q1 Q3 Q1 Q3 Q1 Q3 Q1 Q3 Q12001 2002 2003 2004 2005 2006
05
10152025303540
-5-10-15-20-25
Percent
Diagram 2.8 : Imports of services rose solidly in the first quarter,
after a moderate increase in the preceding quarter
Year-on-year rate of change in real terms
Seasonally adjusted quarter-to-quarter rate of change in real terms
Transportation services$18.1 billion(28.9%)
Travel services$25.9 billion(41.3%)
Finance, business and other services$14.7 billion (23.5%)
Trade-relatedservices$3.9 billion(6.3%)
2006
Table 2.6 : Imports of services by major service group
(year-on-year rate of change in real terms (%))
Of which : Finance,
Imports of services
Travel
services(+)
Transportation
services
Trade-related
services
business and other
services 2005 Annual 2.9 -0.7 5.8 7.5 4.6 Q1 6.0 (-2.1) 6.3 7.5 6.5 3.8 Q2 -0.1 (3.7) -7.6 5.7 10.0 4.8 Q3 3.5 (0.7) -0.8 7.2 7.4 5.9 Q4 2.3 (-0.3) -0.2 3.2 6.6 3.8 2006 Q1 4.8 (0.9) 1.3 7.3 3.4 8.9 Notes : Figures in brackets are the seasonally adjusted quarter-to-quarter rates of change. (+) Comprising mainly outbound travel spending.
23
Visible and invisible trade balance 2.8 The combined visible and invisible trade balance stood at $31.7 billion in the first quarter of 2006, equivalent to 5.0% of the total value of imports of goods and services. This was larger than the corresponding figures of $30.2 billion (5.4%) in the same period in 2005. The sustained large surplus in the visible and invisible trade account was an indication of the overall strong external competitiveness of the Hong Kong economy.
Table 2.7 : Visible and invisible trade balance
($ billion at current market prices)
Total exports Imports Trade balance Goods Services Goods Services Goods Services Combined
2005 Annual 2,251.7 483.5 2,311.1 251.8 -59.3 231.6 172.3 Q1 479.1 109.7 498.8 59.8 -19.7 49.9 30.2 Q2 555.4 109.8 575.0 59.0 -19.6 50.8 31.2 Q3 614.6 128.7 621.6 68.0 -6.9 60.7 53.7 Q4 602.7 135.3 615.8 65.1 -13.1 70.2 57.1 2006 Q1 538.5 124.1 568.3 62.6 -29.8 61.5 31.7 Note : Figures may not add up exactly to the total due to rounding. Trade policy and other developments 2.9 As a small open economy, the external sector has played an important and substantive role in Hong Kong’s economic development. In particular, along with the increased openness and further liberalisation of the Mainland economy, the significance of the Mainland dimension in Hong Kong’s external sector has increased markedly over the years. To capitalise on the tremendous opportunities arising from the booming Mainland economy, the Government has taken various initiatives to strengthen economic relations with the Mainland. Co-operation with the Mainland under CEPA 2.10 The third phase of the Mainland and Hong Kong Closer Economic Partnership Arrangement (CEPA III) was implemented on 1 January 2006. Under CEPA III, the Mainland gives tariff free treatment to all products of Hong Kong origin upon application by local manufacturers and upon the CEPA origin rules being agreed and met. On trade in services, 23 new liberalisation measures spreading across ten sectors are introduced. These additional

24
measures, on top of the substantial measures provided under CEPA I and II, offer new business opportunities on the Mainland for Hong Kong enterprises and professionals and enhance Hong Kong’s attractiveness to overseas investors. 2.11 As at end-April 2006, the Trade and Industry Department (TID) and five Government Approved Certificate Organisations issued 12 485 certificates of Hong Kong origin (CEPA) to goods produced in Hong Kong, involving a total of $4.42 billion worth of goods. TID also approved 955 applications for certificates of Hong Kong service supplier. The Government will continue to work closely with the Mainland authorities to ensure the smooth and effective implementation of CEPA, and make use of the standing consultation mechanism of CEPA to discuss with the Mainland authorities on further trade liberalisation and additional market access opportunities for Hong Kong goods and services. Pan-PRD co-operation 2.12 The Government will also continue to push ahead co-operation under the Pan-PRD framework. With effect from 1 May 2006, the Individual Visit Scheme is expanded further to six more cities within the Pan-PRD region, bringing the total number of cities covered under the scheme to 44(4). On cross-boundary infrastructure, the Hong Kong-Shenzhen Western Corridor is scheduled for commissioning in the first half of 2007 to tie in with the completion of the boundary-crossing facility in Shekou, while the Sheung Shui - Lok Ma Chau Spur Line is expected to be commissioned in 2007. Meanwhile, construction work on the Mainland section of the Guangzhou-Shenzhen-Hong Kong Express Rail Link is in progress, and further planning work for the Hong Kong section has already commenced. The Government is also working jointly with the Mainland authorities on advance planning of the Hong Kong-Zhuhai-Macau Bridge. The Government will also strengthen its representation in the Mainland. With effect from 1 April 2006, the geographical boundary of the Economic and Trade Office in Guangdong has been extended to cover Guangdong, Guangxi, Fujian, Jiangxi and Hainan provinces. There are also plans to set up new offices in Shanghai and Chengdu in the latter half of this year.
25
Notes : (1) Estimates of price changes for the trade aggregates are based on changes in unit values,
which do not take into account changes in the composition or quality of the goods traded, except for some selected commodities for which specific price indices are available. Changes in real terms are derived by discounting the effect of price changes from changes in the value of the trade aggregates.
(2) Re-exports are those goods which have previously been imported into Hong Kong and
are subsequently exported without having undergone in Hong Kong any manufacturing processes which change permanently the shape, nature, form or utility of the goods.
(3) Following the removal of textile and clothing (T&C) quota among WTO members on 1
January 2005, the surge in T&C exports from the Mainland to the EU and the US had triggered the imposition of anti-surge safeguards on the Mainland’s exports by both the EU and the US. Subsequently, the Mainland has reached agreements over its T&C exports with both the EU and the US on 11 June 2005 and 8 November 2005 respectively. The agreements set the growth rates for selected T&C products exported by the Mainland to the EU till 2007 and to the US till 2008.
(4) The six cities newly covered are: Nanchang in Jiangxi Province, Changsha in Hunan Province, Guiyang in Guizhou Province, Kunming in Yunnan Province, Haikou in Hainan Province, and Nanning in Guangxi Province.
26
CHAPTER 3 : DEVELOPMENTS IN SELECTED SECTORS
Summary After some moderation in the second half of 2005, overall property sales
rebounded visibly in early 2006 with property prices firming up in general. Increased market expectation that the interest rate hike would come to a pause soon, coupled with continued buoyancy in leasing activities, largely contributed. Sentiment turned more positive towards the market outlook recently, though acquisition interest stayed cautious in general.
The proposed merger of mass transit railway (MTR) and Kowloon-Canton
Railway (KCR) systems announced by the Government in April 2006 is expected to benefit the economy substantially by enhancing efficiency, enabling fare reduction, and strengthening the potential for connectivity with the Mainland.
Inbound tourism recorded accelerated growth in the first quarter of 2006
with broad-based increase in visitor arrivals. Latest indications showed that the tourism expenditure associated to inbound tourism surged to a new record high in 2005, underpinned by concurrent increases in visitor arrivals and their per capita spending.
The logistics sector made a solid start in early 2006, with air freight
showing further growth and waterborne freight holding stable. The objective to strengthen independent innovation capacity in China’s 11th
Five-Year Plan is expected to provide further opportunities for collaboration between the Mainland and Hong Kong in developing research and creative activities to mutual benefits.
Property 3.1 After some moderation in the second half of 2005, overall property sales rebounded visibly in early 2006 with property prices firming up in general. This was mainly due to increased market expectation that the interest rate hike would soon come to a pause, together with sustained vibrancy in leasing activities that supported investment demand. Sentiment turned more positive towards market outlook recently, though acquisition interest stayed cautious in general.
27
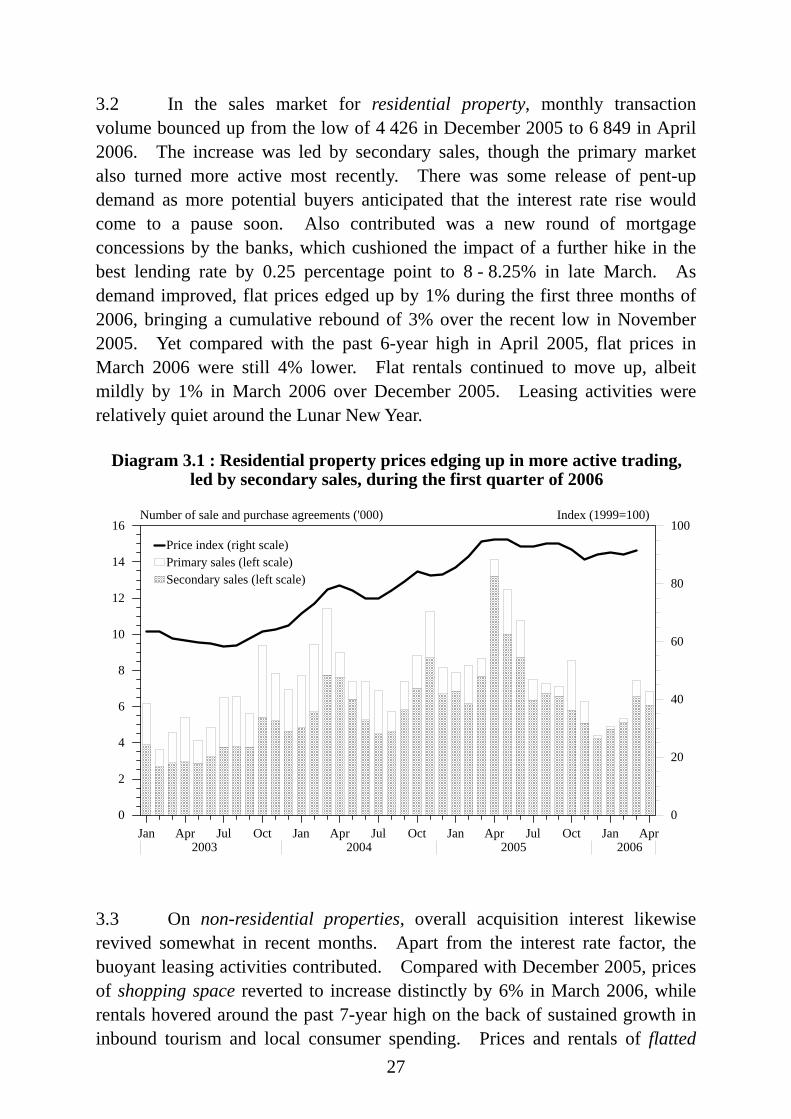
3.2 In the sales market for residential property, monthly transaction volume bounced up from the low of 4 426 in December 2005 to 6 849 in April 2006. The increase was led by secondary sales, though the primary market also turned more active most recently. There was some release of pent-up demand as more potential buyers anticipated that the interest rate rise would come to a pause soon. Also contributed was a new round of mortgage concessions by the banks, which cushioned the impact of a further hike in the best lending rate by 0.25 percentage point to 8 - 8.25% in late March. As demand improved, flat prices edged up by 1% during the first three months of 2006, bringing a cumulative rebound of 3% over the recent low in November 2005. Yet compared with the past 6-year high in April 2005, flat prices in March 2006 were still 4% lower. Flat rentals continued to move up, albeit mildly by 1% in March 2006 over December 2005. Leasing activities were relatively quiet around the Lunar New Year.
Diagram 3.1 : Residential property prices edging up in more active trading, led by secondary sales, during the first quarter of 2006
Jan Apr Jul Oct Jan Apr Jul Oct Jan Apr Jul Oct Jan Apr2003 2004 2005 2006
0
2
4
6
8
10
12
14
16Number of sale and purchase agreements ('000)
0
20
40
60
80
100Index (1999=100)
Secondary sales (left scale)Primary sales (left scale)Price index (right scale)
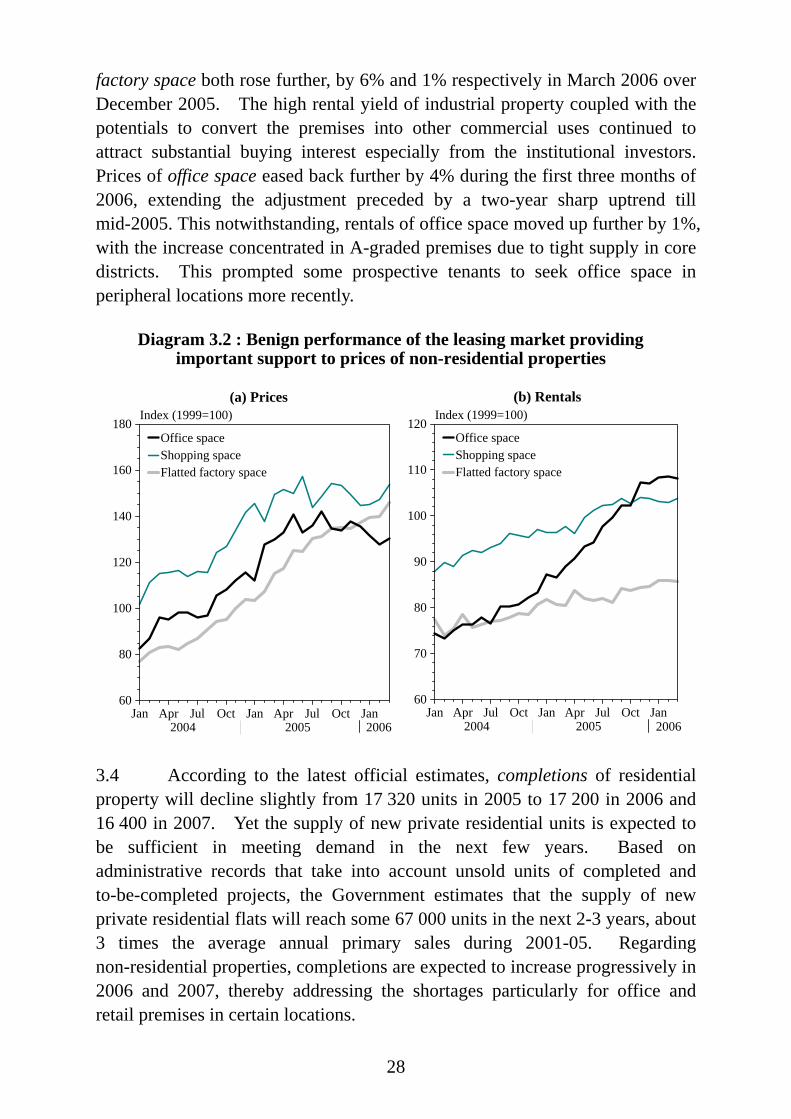
3.3 On non-residential properties, overall acquisition interest likewise revived somewhat in recent months. Apart from the interest rate factor, the buoyant leasing activities contributed. Compared with December 2005, prices of shopping space reverted to increase distinctly by 6% in March 2006, while rentals hovered around the past 7-year high on the back of sustained growth in inbound tourism and local consumer spending. Prices and rentals of flatted
28
factory space both rose further, by 6% and 1% respectively in March 2006 over December 2005. The high rental yield of industrial property coupled with the potentials to convert the premises into other commercial uses continued to attract substantial buying interest especially from the institutional investors. Prices of office space eased back further by 4% during the first three months of 2006, extending the adjustment preceded by a two-year sharp uptrend till mid-2005. This notwithstanding, rentals of office space moved up further by 1%, with the increase concentrated in A-graded premises due to tight supply in core districts. This prompted some prospective tenants to seek office space in peripheral locations more recently.
(a) Prices
Jan Apr Jul Oct Jan Apr Jul Oct Jan2004 2005 2006
60
80
100
120
140
160
180Index (1999=100)
Office spaceShopping spaceFlatted factory space
(b) Rentals
Jan Apr Jul Oct Jan Apr Jul Oct Jan2004 2005 2006
60
70
80
90
100
110
120Index (1999=100)
Office spaceShopping spaceFlatted factory space
Diagram 3.2 : Benign performance of the leasing market providing important support to prices of non-residential properties
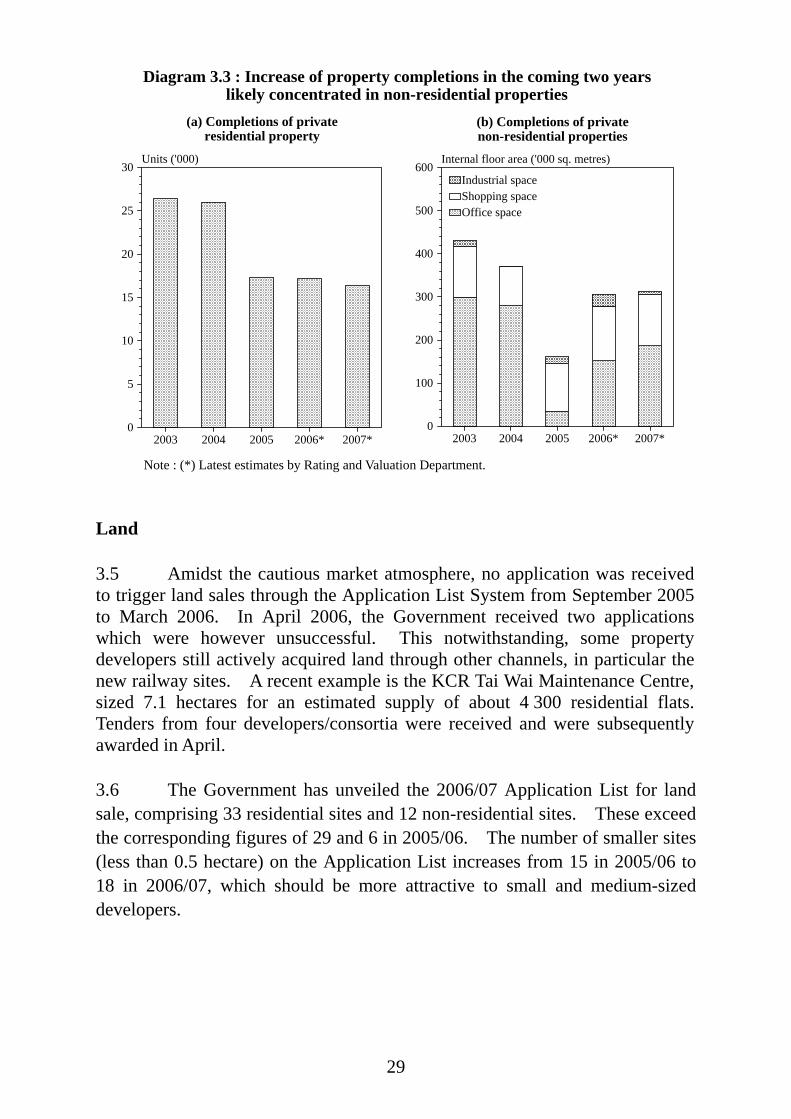
20062006 3.4 According to the latest official estimates, completions of residential property will decline slightly from 17 320 units in 2005 to 17 200 in 2006 and 16 400 in 2007. Yet the supply of new private residential units is expected to be sufficient in meeting demand in the next few years. Based on administrative records that take into account unsold units of completed and to-be-completed projects, the Government estimates that the supply of new private residential flats will reach some 67 000 units in the next 2-3 years, about 3 times the average annual primary sales during 2001-05. Regarding non-residential properties, completions are expected to increase progressively in 2006 and 2007, thereby addressing the shortages particularly for office and retail premises in certain locations.
29
Diagram 3.3 : Increase of property completions in the coming two years likely concentrated in non-residential properties
2003 2004 2005 2006* 2007*0
5
10
15
20
25
30Units ('000)
2003 2004 2005 2006* 2007*0
100
200
300
400
500
600Internal floor area ('000 sq. metres)
Office spaceShopping spaceIndustrial space
(a) Completions of privateresidential property
(b) Completions of privatenon-residential properties
Note : (*) Latest estimates by Rating and Valuation Department.
Land 3.5 Amidst the cautious market atmosphere, no application was received to trigger land sales through the Application List System from September 2005 to March 2006. In April 2006, the Government received two applications which were however unsuccessful. This notwithstanding, some property developers still actively acquired land through other channels, in particular the new railway sites. A recent example is the KCR Tai Wai Maintenance Centre, sized 7.1 hectares for an estimated supply of about 4 300 residential flats. Tenders from four developers/consortia were received and were subsequently awarded in April.
3.6 The Government has unveiled the 2006/07 Application List for land sale, comprising 33 residential sites and 12 non-residential sites. These exceed the corresponding figures of 29 and 6 in 2005/06. The number of smaller sites (less than 0.5 hectare) on the Application List increases from 15 in 2005/06 to 18 in 2006/07, which should be more attractive to small and medium-sized developers.
30
Public transport 3.7 On 11 April 2006, the Government announced that it had reached an understanding with the MTR Corporation Limited (MTRCL) on the structure and terms for merging the MTR and the KCR systems. According to the proposed merger package, the Kowloon-Canton Railway Corporation (KCRC) will grant a service concession to MTRCL for use of the KCRC assets to operate KCR services. The concession will last for an initial period of 50 years which is extendable, co-terminous with the franchise of the post-merger corporation. The MTRCL would be the legal entity of the post-merger corporation and would retain its listing status. After the proposed rail merger, KCRC would cease to have any railway operation but would retain certain admistrative, accounting and treasury functions. 3.8 The proposed merger package meets all the five parameters set by the Government for the merger discussions commenced in February 2004(1). It is expected that the rail merger will bring about substantial economic benefits to the community. These include, inter alia, efficiency enhancement of the rail network through achieving economies of scale, attaining synergy through better interface and streamlining of the management and operation of the two railways systems, higher labour mobility across different areas of Hong Kong fostered by fare reduction which will in turn stimulate a series of economic and employment activities, better potential for connectivity between the railway networks in Hong Kong and the Mainland, and strengthening the competitiveness of the post-merger corporation both in the Mainland market and in the international arena. Tourism 3.9 Inbound tourism showed accelerated and broad-based growth in the first quarter of 2006, with the number of incoming visitors resuming double-digit increase of 14% over a year earlier to 6.2 million. There was a surge of 18% in arrivals from the Mainland, on the back of continued growth in its outbound tourism especially in relation to the Individual Visit Scheme (IVS). Arrivals from Europe and Southeast Asia also fared strongly with respective increases of 14% and 9%.
31
Q1 Q3 Q1 Q3 Q1 Q3 Q1 Q3 Q1 Q3 Q12001 2002 2003 2004 2005 2006
0
1
2
3
4
5
6
7Number of visitors arrivals by source (Mn)
Mainland Rest of Asia Long-haul markets
Diagram 3.4 : Mainland visitors leadingthe way to sustain the growth momentum
of inbound tourism into early 2006
Total number of incoming visitors for the 12 months
ending March 2006 : 24.12 million
Diagram 3.5 : The prominent Mainland market apart, Hong Kong's inbound tourism is built on a balanced market
portfolio worldwide
Mainland of China13.09 mn (54%)
Japan1.21 mn(5%)
Taiwan2.16 mn(9%)
SouthandSoutheastAsia2.46 mn(10%) Americas
1.58 mn(7%)
SouthKorea0.67 mn(3%)
Others1.50 mn(6%)
Europe1.44 mn(6%)
2006
3.10 Tourism expenditure associated to inbound tourism(2) surged by 14% to a new record high of $106 billion in 2005. Buoyant visitor arrivals apart, increase in per capita visitor spending contributed. In 2005, per capita spending(3) of overnight visitors reverted to increase by 4% over 2004 to $4,663, though their average length of stay was maintained at 3.7 nights. The corresponding figure for same-day in-town visitors even surged by 18% to $810. While per capita spending of the overnight Mainland visitors was close to the average, that of same-day in-town Mainland visitors was much higher at $1,247.

32
Diagram 3.6 : Growth of per capita spending in 2005 virtually across-the-board
Allsources
Mainland NorthAsia (incl.
Taiwanand Macau)
Southand
SoutheastAsia
Americas Europe,Africa& the
Middle East
3000
3500
4000
4500
5000
5500
6000Per capita spending by selected source ($)
2004 2005
(b) Overnight visitors(a) Same-day in-town visitors
Allsources
Mainland NorthAsia (incl.
Taiwanand Macau)
Southand
SoutheastAsia
Americas Europe,Africa& the
Middle East
0
500
1000
1500
2000
2500Per capita spending by selected source ($)
2004 2005
3.11 Following its implementation and progressive expansion since July 2003(4), the contribution of IVS to Hong Kong’s inbound tourism has risen significantly. In the first quarter of 2006, the share of IVS visitors in total incoming Mainland visitors rose to 50%. Moreover, the year-on-year growth pace stayed hectic at 31%. As more than 90% of the IVS visitors were from nearby cities in the Guangdong Province, they usually came more frequently but spent less than the non-IVS Mainland visitors per trip. Nevertheless, same-day in-town IVS visitors on average spent more than same-day in-town non-IVS Mainland visitors as the latter comprised a larger proportion stopping over the city for a short while (see Box 3.1 for details).
33
Box 3.1
Spending pattern of the Mainland visitors under the Individual Visit Scheme
By end-March 2006, Mainland residents had made 12.3 million visits to Hong Kong under the Individual Visit Scheme (IVS). In 2005, the IVS visitors accounted for 24% of total visitor arrivals in Hong Kong. An understanding of their spending behaviour is important in maintaining Hong Kong’s attractiveness to IVS visitors. In 2005, about two-thirds of IVS visitors stayed overnight in Hong Kong and spent $3,829 on average, considerably less than that of $5,267 by other overnight Mainland visitors. Yet this difference has to be viewed against the much shorter stay by the former than the latter, at 2.4 nights versus 5.7 nights. Since more than 90% of the IVS visitors are from nearby cities in the Guangdong Province, they tend to make shorter yet more frequent trips to Hong Kong. After taking this factor into account, per-diem spending of the overnight IVS visitors was $1,595, much higher than that of $924 for overnight non-IVS Mainland visitors. Similar to other overnight Mainland visitors, shopping is the largest expenditure category of overnight IVS visitors, with even higher share at 68% in 2005. This is conceivably due to the fact that many of the IVS visitors, especially those from the Guangdong Province, has been to Hong Kong before. Very often they come to Hong Kong again mainly for purchasing goods with better quality assurance, such as watches, jewellery, pharmaceutical and beauty products. On the other hand, overnight IVS visitors spent relatively less on hotel accommodation and miscellaneous services (including domestic transport, local tours, etc.), with respective shares of 10% and 8% in their per capita spending in 2005. Familiar with the local condition, many overnight IVS visitors are able to save budget by using public transport and seeking larger discount off hotel tariffs. Besides, shopping-orientation of the short trips allows less time to spend on sightseeing and leisure.
Spending pattern of overnight IVS and non-IVS Mainland visitors
Per capita spending in 2005 : $5,267
Hotel bills$373 (9.7%)
IVS visitors Non-IVS Mainland visitors
Per capita spending in 2005 : $3,829
Meals outside hotel$519 (13.6%)
Shopping$2,612 (68.2%)
Misc. (e.g. local tour, domestic transport)$325 (8.5%)
Shopping$3,340 (63.4%)
Meals outside hotel$699 (13.3%)
Hotel bills$658 (12.5%)
Misc. (e.g. local tour, domestic transport)$570 (10.8%)
34
Box 3.1 (cont’d) Contrary to the situation for overnight visits, the per capita spending of IVS visitors making same-day in-town visits to Hong Kong was much higher than the same-day in-town non-IVS Mainland visitors, at $1,663 as against $928 in 2005. This is largely due to the fact that many same-day in-town non-IVS Mainland visitors are group tourists and business travellers stopping over Hong Kong for transport linkages, or else Hong Kong is just one of the destinations in their travel itineraries. Same-day in-town IVS visitors focused even more on shopping which accounted for $1,459 or 88% of their per capita spending in 2005. This exceeded by a wide margin the corresponding figures of $759 and 82% by same-day in-town non-IVS Mainland visitors. The amount of per capita spending on miscellaneous services and meals outside hotel were also higher for same-day in-town IVS visitors, albeit to a milder extent. Yet in relative terms, the shares of these two categories were lower at 7% and 5% due to the overwhelming size of shopping expenditure. Regarding hotel bills, the amount involved and proportions to the total were likewise insignificant for both same-day in-town IVS visitors and same-day in-town non-IVS Mainland visitors who basically do not need accommodation services.
Spending pattern of same-day in-town IVS and non-IVS Mainland visitors
Per capita spending in 2005 : $928
Hotel bills$11 (0.7%)
Per capita spending in 2005 : $1,663
Meals outside hotel$82 (5.0%)
Shopping$1,459 (87.7%)
Misc. (e.g. local tour, domestic transport)$110 (6.6%)
Shopping$759 (81.8%)
Meals outside hotel$75 (8.0%)Hotel bills
$16 (1.7%)
Misc. (e.g. local tour, domestic transport)$79 (8.5%)
IVS visitors Non-IVS Mainland visitors
Logistics 3.12 The logistics sector made a solid start in early 2006, with activities related to air freight continuing to outperform. Benefiting from the robust external trade and its on-going structural shift towards higher value-added goods, air cargo movements expanded markedly further by 10% year-on-year in the first quarter of 2006. In value terms, the share of Hong Kong’s external trade (excluding transhipment) handled by air rose to 35% in the quarter, compared with 33% by sea and river, and 31% by land.
35
Diagram 3.7 : Booming air freight in tandem with robust external trade and its growing composition of high-valued and time-sensitive items
Q1 Q2 Q3 Q4 Q1 Q2 Q3 Q4 Q1 Q2 Q3 Q4 Q1 Q2 Q3 Q4 Q1 Q2 Q3 Q4 Q12001 2002 2003 2004 2005 2006
0
100
200
300
400
500
600
700
800
900
1000Air cargo movements ('000 tonnes)
0
10
20
30
40
50
60
70
80
-10
-20
Percent
Total volume (left scale) Year-on-year rate of change (right scale)
2006 3.13 On port cargo movement, container traffic held stable in the first two months of 2006 as compared to a year earlier, following three consecutive quarters of modest growth. There was a further pick-up in transhipment cargo so far this year, reflecting Hong Kong’s strength in respect of international connectivity and logistics-related services. This provided an offset to the easing in direct shipment cargo under the on-going impact of structural shift from re-export trade to offshore trade.
Q1 Q2 Q3 Q4 Q1 Q2 Q3 Q4 Q1 Q2 Q3 Q4 Q1 Q2 Q3 Q4 Q1 Q2 Q3 Q42001 2002 2003 2004 2005
0000
1000
2000
3000
4000
5000
6000
7000
8000
9000
10000Port container throughput ('000 TEUs)
0
5
10
15
20
25
30
35
40
-5
-10
Percent
Total number (left scale) Year-on-year rate of change (right scale)
J F M A M J J A S O N D J F2005 2006
0
500
1000
1500
2000
2500TEUs ('000)
0
10
20
30
40
-10
Percent
Diagram 3.8 : Port container throughput holding stable in early 2006 after three consecutive quarters of modest growth
36
Creativity and innovation 3.14 In the 11th Five-Year Plan endorsed by China’s National People’s Congress in March 2006, one of the main objectives is to strengthen the independent innovation capacity as the strategic base point for development and the linchpin for industrial restructuring and transformation of the growth mode. Increased importance attached to innovation in the Mainland economy can be expected to provide further opportunities for collaboration between the Mainland and Hong Kong to leverage on their comparative advantages in fostering research and creative activities to mutual benefits. 3.15 On 20 April 2006, five new government-funded R&D centres in selected technology focus areas commenced operation(5). Establishment of the R&D centres is aimed to harness Hong Kong’s advantages in applied research, intellectual property protection, business-friendly environment and proximity to the manufacturing base in the Pearl River Delta region. Through conducting industry-oriented R&D and promoting technology transfer, the R&D centres aim to assist the industries in enhancing their productivity and competitiveness. 3.16 The Quality Migrant Admission Scheme is scheduled for implementation in the first half of 2006. With a quota of 1 000 entrants a year, the Scheme is aimed to attract talented people from the Mainland and the rest of the world to come and settle in Hong Kong. Without the prerequisite of securing local employment beforehand, the Scheme can better enable the talents who are interested in developing their business and careers in Hong Kong but do not have the latest information on the local conditions to stay here and seek business and career opportunities(6). Apart from enhancing our overall competitiveness, a critical mass of quality personnel from diverse backgrounds can foster a more vibrant cultural and creative environment that facilitates the development of creative activities in Hong Kong. Notes : (1) The five parameters include (a) adoption of a more objective and transparent fare
adjustment mechanism; (b) abolition of the second boarding charge and review of the fare structure with the objective of reducing fares; (c) early resolution of interchange arrangements for new rail projects under planning, notably the Shatin to Central Link; (d) ensuring job security for frontline staff at the time of merger; (e) provision of seamless interchange arrangements in the long run. For the detailed outcome of
37
discussions of these parameters and other details of the proposed merger package, see the paper entitled “Merger of MTR and Kowloon-Canton Railway Systems – Proposed Way Forward” discussed at the meeting of the Legislative Council Panels on Transport and Financial Affairs on 12 April 2006.
(2) In 2005, 75% of the tourism expenditure associated to inbound tourism was destination
consumption expenditure by all inbound visitors and travellers for goods and services that they consumed in Hong Kong. The remaining 25% was expenditure by these visitors and travellers on cross-boundary transportation services provided by Hong Kong-based carriers.
(3) Per capita visitor spending is derived from the total destination consumption
expenditure viz. expenditure on goods and services consumed in Hong Kong and visitor arrivals (except servicemen, aircrew members and transit/transfer passengers). Expenditure by visitors on cross-boundary transportation services is not covered.
(4) As from 1 May 2006, the Individual Visit Scheme has been further extended to six
provincial cities in the Pan Pearl River Delta region, including Changsha, Nanning, Kunming, Nanchang, Guiyang and Haikou. The Scheme now covers 44 cities in the Mainland with a population exceeding 220 million.
(5) The selected technology focus areas include automotive parts and accessory systems;
information and communications technologies; logistics and supply chain management enabling technologies; nanotechnology and advanced materials; and textiles and clothing.
(6) For other details of the Quality Migrant Admission Scheme, including the several
“must-meet” requirements and assessment factors for the “points test”, see the Legislative Council Brief on “Quality Migrant Admission Scheme” prepared by the Security Bureau in February 2006.
38
CHAPTER 4 : THE FINANCIAL SECTOR#
Summary
The financial sector was vibrant in the first quarter of 2006, contributing to
the dynamism of the Hong Kong economy. The Mainland dimension has become increasingly important to the
developments in Hong Kong’s financial markets. This in turn is a manifestation of Mainland enterprises increasingly making use of Hong Kong’s world-class financial infrastructure as a launch-pad to go global.
The Hong Kong dollar exchange and money markets held stable in the first
quarter of 2006. Liquidity in the banking sector remained abundant, and money supply continued to grow steadily.
The Hong Kong dollar interest rates moved up further in the first quarter of
2006, along with the uptrend in the US dollar interest rates. The faster concurrent rise in long-term rates gave a slightly steepened yield curve. Credit demand in overall terms edged up further despite higher interest rates. Benefited from strengthening economic conditions, asset quality of the banking sector continued to improve.
The stock market was buoyant in the first quarter of 2006, boosted not only
by abundant liquidity but also the buoyant overseas stock markets, enthusiastic response to the IPO of new listings, strong corporate earnings as well as the favourable economic prospects for both the Hong Kong and Mainland economies.
• The relaxation measures announced in April by the Mainland authorities on
foreign exchange management under the current account would encourage more outflow of capital from the Mainland for overseas investment. Hong Kong, by virtue of its entrenched advantages as a conduit of fund flows between the Mainland and the outside world, could stand to benefit.
_________
(#) This chapter is jointly prepared by the Hong Kong Monetary Authority (HKMA)
and the Economic Analysis Division.
39
Overall situation 4.1 The financial market was vibrant in the first quarter of 2006, contributing to the dynamism of the Hong Kong economy. The Hong Kong dollar exchange and money markets held stable, notwithstanding the further rise in interest rates during the period. Money supply expanded steadily. Bank loans in overall terms edged up further despite higher interest rates. Amidst the sanguine sentiment, the stock market was buoyant in the first quarter. Fund raising activities in the stock market were hectic and generally received enthusiastic response. Funds raised in the debt market also expanded further, providing further impetus for developing Hong Kong into a regional bond centre. In addition, Hong Kong’s niches as an asset management centre are also manifested in the continuous growth in fund management business in Hong Kong. 4.2 In mid-April, the Mainland authorities put on board several measures to relax policies on foreign exchange management under the current account. This would encourage more outflow of capital from Mainland residents and institutions for overseas investment. Depending on the magnitude, pace and destinations of such outward investment, by virtue of its entrenched advantages as a conduit of fund flows between the Mainland and the outside world, Hong Kong’s financial services industry could stand to benefit(1). Interest rates, aggregate balance and exchange rates 4.3 Hong Kong dollar interest rates moved up further in the first quarter of 2006, along with the uptrend in the US dollar interest rates. The Base Rate under the Discount Window operated by the HKMA was adjusted upward twice during the first quarter by a cumulative total of 50 basis points to 6.25% at end-March 2006, in line with the increases in the US Fed Funds Target Rate(2). Hong Kong dollar interbank interest rates generally moved up accordingly. Yet owing to abundant liquidity in the local banking sector, overnight HIBOR edged up only slightly to an average of 3.65%, while its 3-month counterpart eased back to 4.10% in the first quarter. The discount of three-month HIBOR over the corresponding Euro-dollar deposit rate widened slightly from 37 basis points at end-December 2005 to 58 basis points at end-March 2006. Meanwhile, the Hong Kong dollar yield curve moved upwards during the first quarter of 2006 and steepened slightly, reflecting a slightly faster rise in long-term interest rates.

40
4.4 The deposit rates and the best lending rates both rose, though the magnitude of increases varied among different banks, reflecting the different cost structure and funding costs of the banks. At end-March 2006, there were two best lending rates, at 8.0% and 8.25%. Reflecting an increase in the average cost of funds of banks, the composite interest rate rose from 2.88% at end-2005 to 3.00% at end-March 2006(3). Meanwhile, the Aggregate Balance was little changed during the first quarter, closing at around $1.3 billion at end-March 2006. Since the introduction of the three refinements to the Linked Exchange Rate System by the HKMA in May 2005, liquidity in the banking sector has been generally stable.
5 Jun 31 Jul 25 Sep 20 Nov 15 Jan 12 Mar 7 May 2 Jul 27 Aug 22 Oct 17 Dec 11 Feb2004 2005 2006
0
1
2
3
4
5
6
7
8
9Percent per annum
0
5
10
15
20
25
30
35
40HK$Bn
Diagram 4.1 : Aggregate balance in the banking system held steady notwithstanding rising interest rates as liquidity remained abundant
Best lending rate
Aggregate balance(right scale)
OvernightHIBOR
Three-monthHIBOR
Base rate under the Discount Window
(end for the week)
31 Mar2006
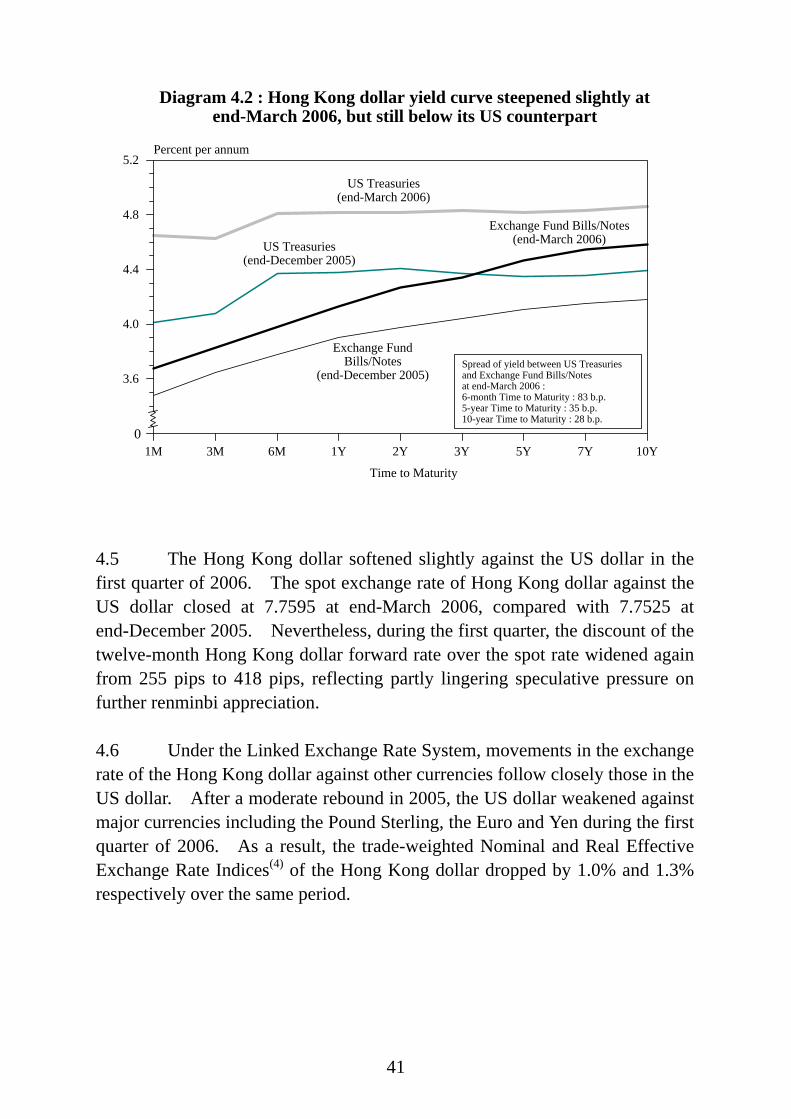
41
Diagram 4.2 : Hong Kong dollar yield curve steepened slightly at end-March 2006, but still below its US counterpart
Time to Maturity
1M 3M 6M 1Y 2Y 3Y 5Y 7Y 10Y3.2
3.6
4.0
4.4
4.8
5.2Percent per annum
US Treasuries(end-December 2005)
Exchange FundBills/Notes
(end-December 2005)
0
Exchange Fund Bills/Notes(end-March 2006)
US Treasuries(end-March 2006)
Spread of yield between US Treasuriesand Exchange Fund Bills/Notesat end-March 2006 :6-month Time to Maturity : 83 b.p.5-year Time to Maturity : 35 b.p.10-year Time to Maturity : 28 b.p.
4.5 The Hong Kong dollar softened slightly against the US dollar in the first quarter of 2006. The spot exchange rate of Hong Kong dollar against the US dollar closed at 7.7595 at end-March 2006, compared with 7.7525 at end-December 2005. Nevertheless, during the first quarter, the discount of the twelve-month Hong Kong dollar forward rate over the spot rate widened again from 255 pips to 418 pips, reflecting partly lingering speculative pressure on further renminbi appreciation. 4.6 Under the Linked Exchange Rate System, movements in the exchange rate of the Hong Kong dollar against other currencies follow closely those in the US dollar. After a moderate rebound in 2005, the US dollar weakened against major currencies including the Pound Sterling, the Euro and Yen during the first quarter of 2006. As a result, the trade-weighted Nominal and Real Effective Exchange Rate Indices(4) of the Hong Kong dollar dropped by 1.0% and 1.3% respectively over the same period.

42
5 Jun 28 Aug 20 Nov 12 Feb 7 May 30 Jul 22 Oct 14 Jan2004 2005 2006
7.55
7.60
7.65
7.70
7.75
7.80
7.85
7.90HK$/US$
HK$/US$three-month forward rateLinked Rate
HK$/US$twelve-month forward rate
HK$/US$spot rate
0
Diagram 4.4 : Trade-weighted Effective Exchange Rate Index of the Hong Kong
dollar dropped in the first quarter of 2006(average for the month)
Real EERI
M J S D M J S D M J S D M J S D M J S D M 75
80
85
90
95
100
105
110Index (Jan 2000 = 100)
Nominal EERI
Real EERI
20022001 2003 2004
0
Diagram 4.3 : The Hong Kong dollarsoftened slightly against the US dollar,
but forward spread widenedin the first quarter of 2006
(end for the week)
20055 Jun
200631 Mar
2006
Money supply and deposits 4.7 The monetary conditions continue to hold stable in the first quarter of 2006. Both the narrow and broad money supply registered increases in the quarter. The seasonally adjusted Hong Kong dollar narrow money supply (HK$M1)(5) grew by 5.1% at end-March 2006 over end-December 2005, mainly due to increases in demand deposits along with high stock market turnover in the first quarter. Hong Kong dollar broad money supply (HK$M3) continued to rise, by 5.3% during the same period, in line with the growth in time deposits but slower than that of the nominal GDP.
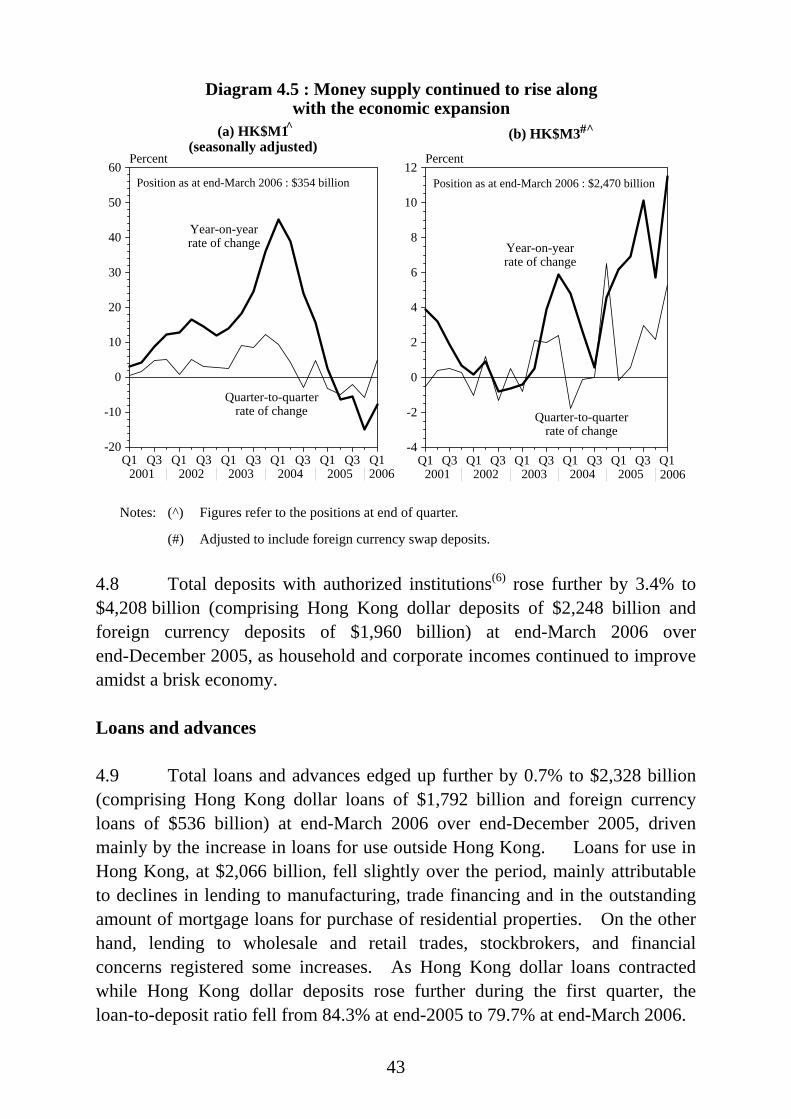
43
Foreign currency deposits *(left scale)
Q1 Q3 Q1 Q3 Q1 Q3 Q1 Q3 Q1 Q3 Q12001 2002 2003 2004 2005 2006
0
10
20
30
40
50
60
-10
-20
Percent
Quarter-to-quarterrate of change
Year-on-yearrate of change
Q1 Q3 Q1 Q3 Q1 Q3 Q1 Q3 Q1 Q3 Q12001 2002 2003 2004 2005 2006
0
2
4
6
8
10
12
-2
-4
Percent
(a) HK$M1(seasonally adjusted)
Diagram 4.5 : Money supply continued to rise alongwith the economic expansion
(b) HK$M3#^
Year-on-yearrate of change
Quarter-to-quarterrate of change
Position as at end-March 2006 : $354 billion Position as at end-March 2006 : $2,470 billion
^
2006 2006 Notes: (^) Figures refer to the positions at end of quarter. (#) Adjusted to include foreign currency swap deposits.
4.8 Total deposits with authorized institutions(6) rose further by 3.4% to $4,208 billion (comprising Hong Kong dollar deposits of $2,248 billion and foreign currency deposits of $1,960 billion) at end-March 2006 over end-December 2005, as household and corporate incomes continued to improve amidst a brisk economy. Loans and advances 4.9 Total loans and advances edged up further by 0.7% to $2,328 billion (comprising Hong Kong dollar loans of $1,792 billion and foreign currency loans of $536 billion) at end-March 2006 over end-December 2005, driven mainly by the increase in loans for use outside Hong Kong. Loans for use in Hong Kong, at $2,066 billion, fell slightly over the period, mainly attributable to declines in lending to manufacturing, trade financing and in the outstanding amount of mortgage loans for purchase of residential properties. On the other hand, lending to wholesale and retail trades, stockbrokers, and financial concerns registered some increases. As Hong Kong dollar loans contracted while Hong Kong dollar deposits rose further during the first quarter, the loan-to-deposit ratio fell from 84.3% at end-2005 to 79.7% at end-March 2006.
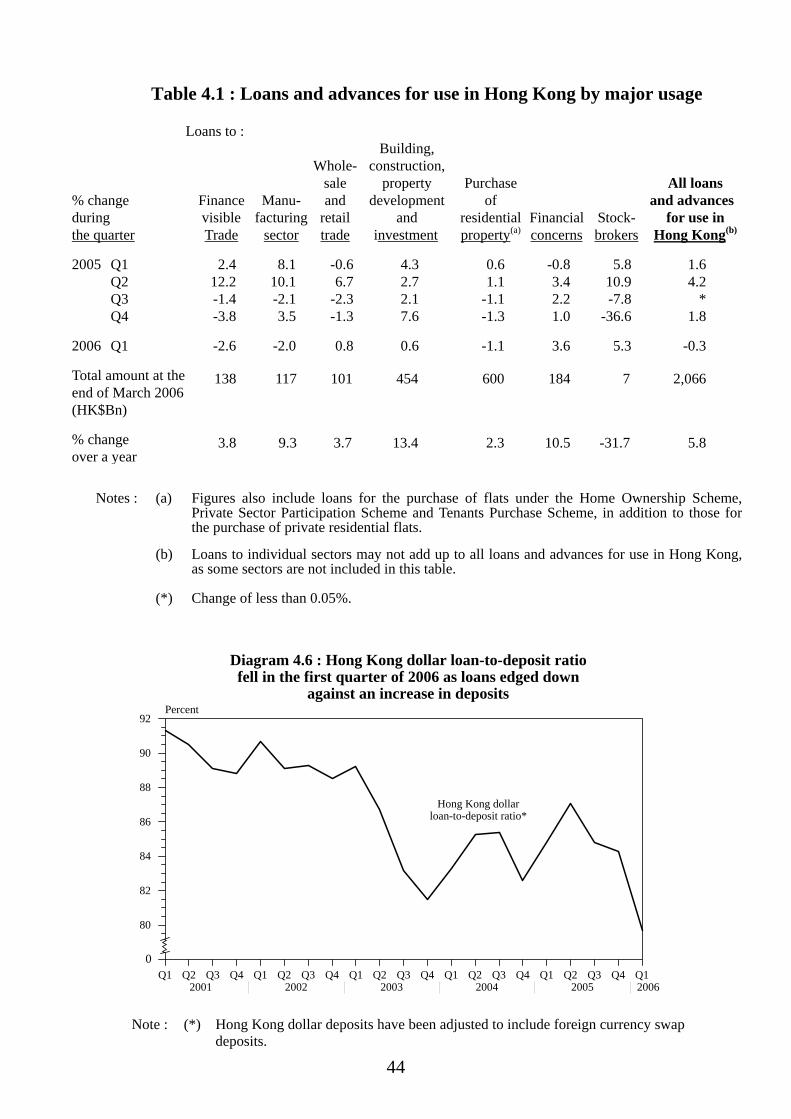
44
Table 4.1 : Loans and advances for use in Hong Kong by major usage
Loans to :
Building, Whole- construction, sale property Purchase All loans
% change Finance Manu- and development of and advancesduring visible facturing retail and residential Financial Stock- for use in the quarter Trade sector trade investment property(a) concerns brokers Hong Kong(b)
2005 Q1 2.4 8.1 -0.6 4.3 0.6 -0.8 5.8 1.6 Q2 12.2 10.1 6.7 2.7 1.1 3.4 10.9 4.2 Q3 -1.4 -2.1 -2.3 2.1 -1.1 2.2 -7.8 * Q4 -3.8 3.5 -1.3 7.6 -1.3 1.0 -36.6 1.8 2006 Q1 -2.6 -2.0 0.8 0.6 -1.1 3.6 5.3 -0.3 Total amount at the end of March 2006 (HK$Bn)
138 117 101 454 600 184 7 2,066
% change over a year
3.8 9.3 3.7 13.4 2.3 10.5 -31.7 5.8
Notes : (a) Figures also include loans for the purchase of flats under the Home Ownership Scheme,
Private Sector Participation Scheme and Tenants Purchase Scheme, in addition to those for the purchase of private residential flats.
(b) Loans to individual sectors may not add up to all loans and advances for use in Hong Kong,
as some sectors are not included in this table. (*) Change of less than 0.05%.
Q1 Q2 Q3 Q4 Q1 Q2 Q3 Q4 Q1 Q2 Q3 Q4 Q1 Q2 Q3 Q4 Q1 Q2 Q3 Q4 Q12001 2002 2003 2004 2005 2006
78
80
82
84
86
88
90
92Percent
0
Diagram 4.6 : Hong Kong dollar loan-to-deposit ratiofell in the first quarter of 2006 as loans edged down
against an increase in deposits
Hong Kong dollar loan-to-deposit ratio*
2006
Note : (*) Hong Kong dollar deposits have been adjusted to include foreign currency swap deposits.

45
Banking 4.10 Benefited from strengthening economic conditions, asset quality of the local banking sector on the whole improved further in the fourth quarter of 2005. The ratio of classified loans to total loans of retail banks edged down further from 1.49% at end-September 2005 to 1.38% at end-December 2005. Over the same period, the arrears for over three months in credit card repayment fell further to 0.37% from 0.39%. Notwithstanding further rise in mortgage rates, the delinquency ratio for residential mortgage loans stabilised at 0.19% at end-March 2006, same as that at end-December 2005. The consolidated capital adequacy ratio for local banks averaged at 14.9% at end-December 2005, well above the minimum international standard of 8% set by the Bank for International Settlements. 4.11 Hong Kong will follow the Basel Committee on Banking Supervision's timetable for implementing the new capital adequacy standards for banks ("Basel II") from January 2007. Since August 2004, the HKMA has issued for public consultation detailed proposals of its policies and standards relating to the implementation approach and the core requirements of the new framework. The banking industry endorses the proposals as pragmatic and the policy setting stage is now largely complete. To provide a legal framework for implementing Basel II in Hong Kong, the Banking (Amendment) Ordinance 2005 was enacted on 6 July 2005 under which the HKMA will issue capital and disclosure rules in consultation with the Financial Secretary, the statutory advisory committees and the industry associations. Drafting of the rules is in progress. The new framework aligns regulatory capital requirement more closely with the inherent risks of banks, encouraging banks to improve risk management. Adopting the latest international banking standards in this respect will contribute to the safety and soundness of the banking system in Hong Kong and help strengthen the position of Hong Kong as a leading international financial centre.
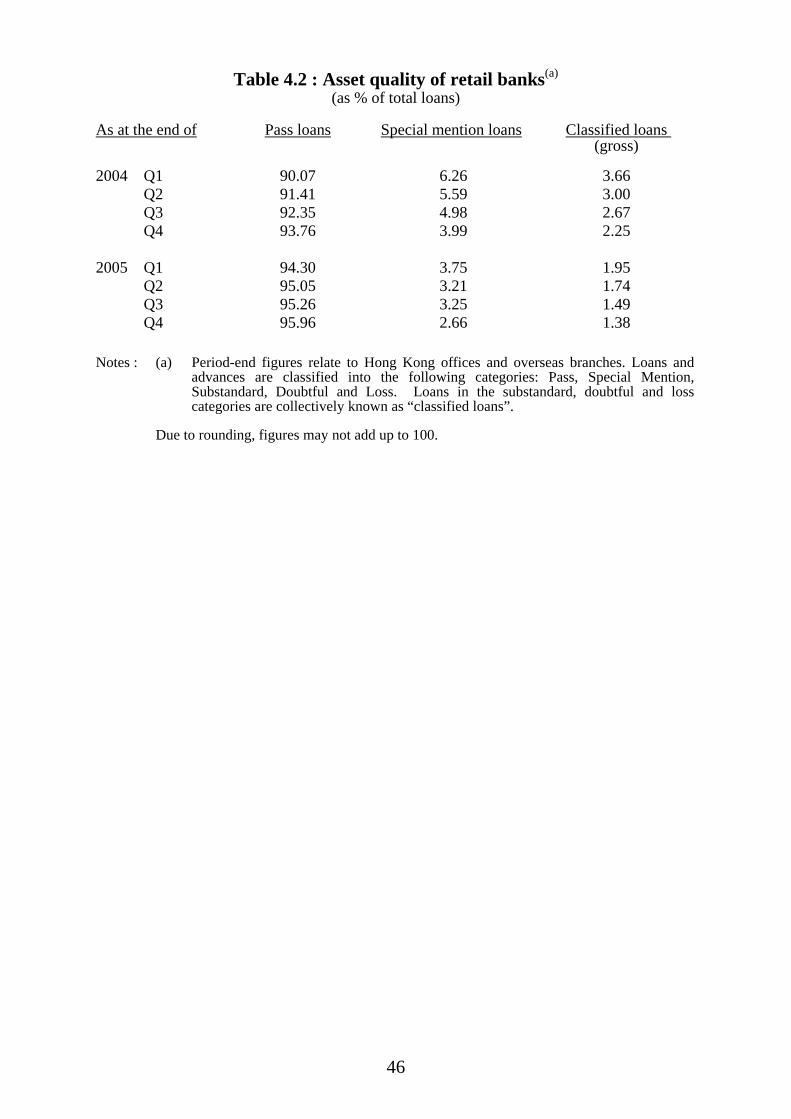
46
Table 4.2 : Asset quality of retail banks(a)
(as % of total loans)
As at the end of Pass loans Special mention loans Classified loans (gross)
2004 Q1 90.07 6.26 3.66
Q2 91.41 5.59 3.00 Q3 92.35 4.98 2.67 Q4 93.76 3.99 2.25 2005 Q1 94.30 3.75 1.95
Q2 95.05 3.21 1.74 Q3 95.26 3.25 1.49 Q4 95.96 2.66 1.38
Notes : (a) Period-end figures relate to Hong Kong offices and overseas branches. Loans and
advances are classified into the following categories: Pass, Special Mention, Substandard, Doubtful and Loss. Loans in the substandard, doubtful and loss categories are collectively known as “classified loans”.
Due to rounding, figures may not add up to 100.

47
Box 4.1
Key features of Basel II and its benefits to the economy The Basel Committee on Banking Supervision, established by the central bank governors of the Group of Ten countries, released the revised capital adequacy framework (commonly referred to as “Basel II”) in June 2004. The objective of Basel II is to better align minimum capital requirement of banks more closely to the risks they face. The revised framework replaces the old “one size fits all” approach on banks in regard to risk management. Given the significant benefits of Basel II to the Hong Kong economy, Hong Kong has been at the forefront of jurisdictions globally taking active steps to incorporate the requirements of the revised framework into their regulatory regimes. The revised framework under Basel II adopts a three-pillar structure which represents a major step forward in terms of the identification, quantification and management of risk and public disclosure. Pillar 1 requires banks to maintain a minimum amount of capital for credit, market and operational risks. The new framework provides a spectrum of approaches for banks of different levels of sophistication, depending on their internal risk management capabilities and complexity of operations, to calculate their minimum capital requirement. Pillar 2 requires banks to assess the full range of risks they run and to determine how much capital to hold against them. The banks’ capital adequacy and internal assessment process will also be reviewed for ensuring that capital above the minimum level is held where appropriate. Pillar 3 aims to bolster market discipline by setting out the disclosure requirements applicable to banks in areas such as their risk profiles, capital adequacy and internal risk management. As a general rule, different banks with different levels of sophistication and risk exposures will be subject to different disclosure requirements. Hong Kong has implemented Basel I and its subsequent amendments. As an international financial centre that prides itself on adopting best practices that commands wide international acceptance, Hong Kong has committed to adopting Basel II. Implementation of Basel II in Hong Kong will commence in phases starting on 1 January 2007. This is in accordance with the timetable recommended by the Basel Committee for its own members, and will be at about the same time as other major international financial centres, such as London, Frankfurt and Tokyo, and also broadly similar to that of Australia and Singapore. Recognizing that banks in Hong Kong vary widely in terms of their business focus, size and complexity, as well as the nature and combination of risks they face, the HKMA will adopt a menu-based approach in implementing Basel II. Banks are expected to choose options based on their risk profile and complexity of operations, and the results of their own detailed feasibility studies and cost-and-benefit analyses. Basel II will provide incentives to banks to adopt the latest advances in the field of risk management. Banks which adopt best practices in the management of risk will be awarded with lower capital requirements. Enhanced risk management will improve banks’ ability to offer more sophisticated products to customers, thereby helping bolster development of the banking industry. It will also enhance banks’ ability to assess lending to sectors such as the small and medium-sized enterprises, and allow for better risk-adjusted pricing. From a macro perspective, the greater risk sensitivity of Basel II and the inclusion of a wider range of risks will further enhance the safety and stability of the banking sector, strengthening the position of Hong Kong as an international centre.
48
4.12 Since February 2004, banks in Hong Kong have been offering renminbi deposit-taking, exchange and remittance services to customers. At end-March 2006, a total of 39 licensed banks were engaged in renminbi banking business in Hong Kong. At end-March 2006, renminbi deposits with authorized institutions stood at RMB 22.5 billion, similar to the level of RMB 22.6 billion at end-December 2005. Meanwhile, the share of renminbi deposits in total foreign currency deposits with all authorized institutions eased back slightly from 1.12% to 1.11% during the period. 4.13 To cater for the expanding renminbi business, the Hong Kong Interbank Clearing Limited launched a new Renminbi Settlement System in March 2006. Hong Kong residents can now open renminbi current accounts in a Hong Kong bank and use renminbi cheques for consumer spending in the Guangdong Province. Designated merchants are also allowed to open renminbi deposit accounts and conduct one-way exchange of their renminbi deposits into Hong Kong dollar. In addition, in the 2006/07 Budget Speech, the Financial Secretary indicated that the HKSAR Government is discussing with the Central Government on the proposals to allow cross-boundary trade to settle in renminbi and to establish a renminbi debt issuance mechanism in Hong Kong. The increase in participation in renminbi business by banks in Hong Kong would reinforce Hong Kong’s position as an international financial centre.
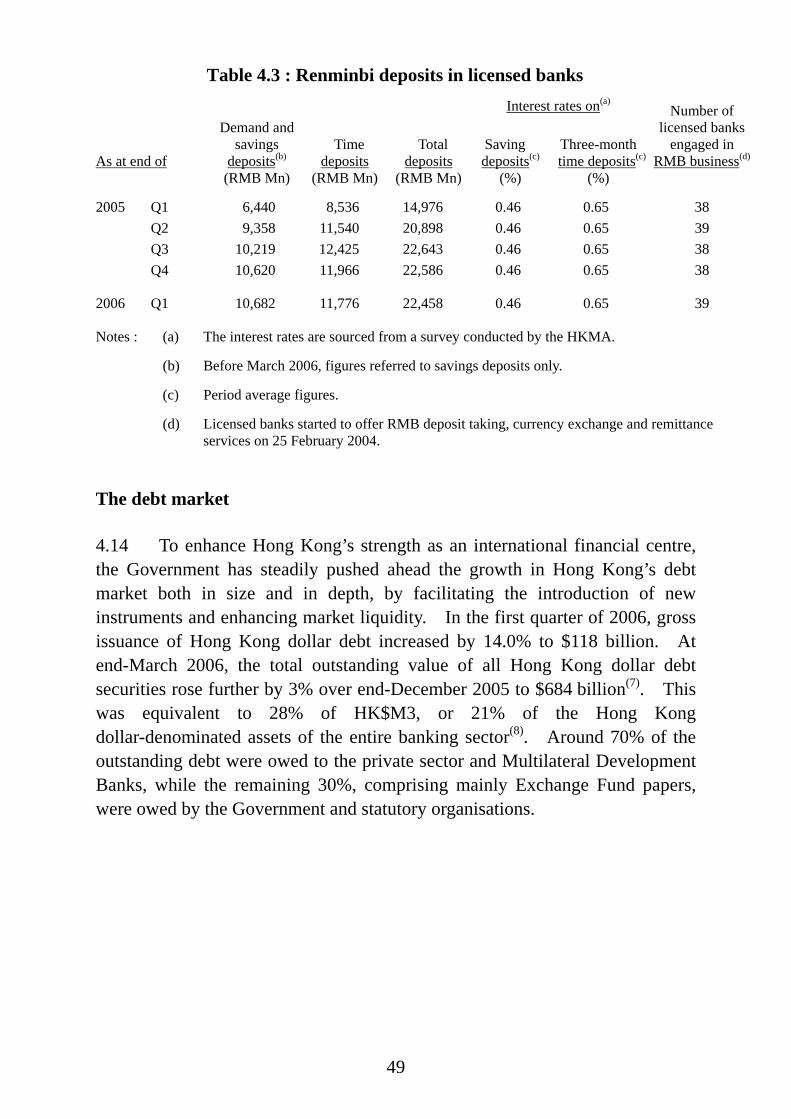
49
Table 4.3 : Renminbi deposits in licensed banks
Interest rates on(a)
As at end of
Demand and savings
deposits(b) Time
deposits Total
deposits Saving deposits(c)
Three-month time deposits(c)
Number of licensed banks
engaged in RMB business(d)
(RMB Mn) (RMB Mn) (RMB Mn) (%) (%) 2005 Q1 6,440 8,536 14,976 0.46 0.65 38 Q2 9,358 11,540 20,898 0.46 0.65 39 Q3 10,219 12,425 22,643 0.46 0.65 38 Q4 10,620 11,966 22,586 0.46 0.65 38 2006 Q1 10,682 11,776 22,458 0.46 0.65 39 Notes : (a) The interest rates are sourced from a survey conducted by the HKMA.
(b) Before March 2006, figures referred to savings deposits only. (c) Period average figures. (d) Licensed banks started to offer RMB deposit taking, currency exchange and remittance
services on 25 February 2004.
The debt market 4.14 To enhance Hong Kong’s strength as an international financial centre, the Government has steadily pushed ahead the growth in Hong Kong’s debt market both in size and in depth, by facilitating the introduction of new instruments and enhancing market liquidity. In the first quarter of 2006, gross issuance of Hong Kong dollar debt increased by 14.0% to $118 billion. At end-March 2006, the total outstanding value of all Hong Kong dollar debt securities rose further by 3% over end-December 2005 to $684 billion(7). This was equivalent to 28% of HK$M3, or 21% of the Hong Kong dollar-denominated assets of the entire banking sector(8). Around 70% of the outstanding debt were owed to the private sector and Multilateral Development Banks, while the remaining 30%, comprising mainly Exchange Fund papers, were owed by the Government and statutory organisations.
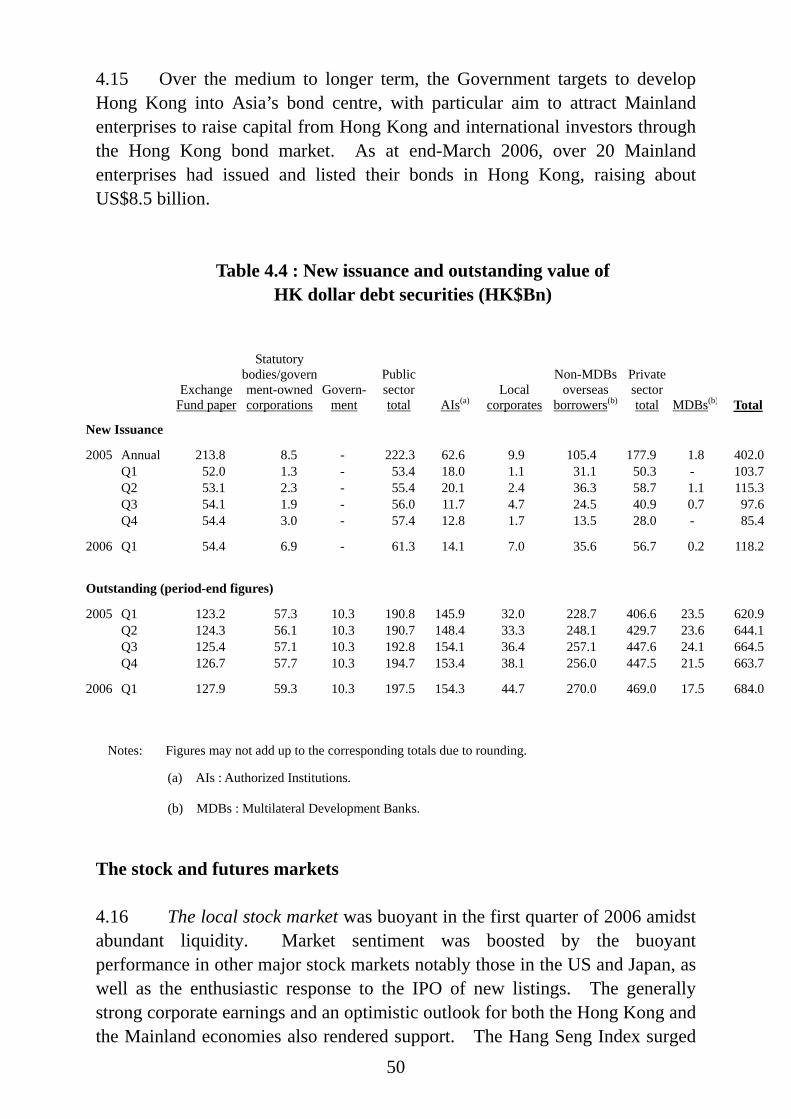
50
4.15 Over the medium to longer term, the Government targets to develop Hong Kong into Asia’s bond centre, with particular aim to attract Mainland enterprises to raise capital from Hong Kong and international investors through the Hong Kong bond market. As at end-March 2006, over 20 Mainland enterprises had issued and listed their bonds in Hong Kong, raising about US$8.5 billion.
Table 4.4 : New issuance and outstanding value of
HK dollar debt securities (HK$Bn)
Exchange
Fund paper
Statutory bodies/government-owned corporations
Govern-ment
Public sector total AIs(a)
Local corporates
Non-MDBs overseas
borrowers(b)
Private sector total MDBs(b) Total
New Issuance
2005 Annual 213.8 8.5 - 222.3 62.6 9.9 105.4 177.9 1.8 402.0 Q1 52.0 1.3 - 53.4 18.0 1.1 31.1 50.3 - 103.7 Q2 53.1 2.3 - 55.4 20.1 2.4 36.3 58.7 1.1 115.3 Q3 54.1 1.9 - 56.0 11.7 4.7 24.5 40.9 0.7 97.6 Q4 54.4 3.0 - 57.4 12.8 1.7 13.5 28.0 - 85.4
2006 Q1 54.4 6.9 - 61.3 14.1 7.0 35.6 56.7 0.2 118.2
Outstanding (period-end figures)
2005 Q1 123.2 57.3 10.3 190.8 145.9 32.0 228.7 406.6 23.5 620.9 Q2 124.3 56.1 10.3 190.7 148.4 33.3 248.1 429.7 23.6 644.1 Q3 125.4 57.1 10.3 192.8 154.1 36.4 257.1 447.6 24.1 664.5 Q4 126.7 57.7 10.3 194.7 153.4 38.1 256.0 447.5 21.5 663.7
2006 Q1 127.9 59.3 10.3 197.5 154.3 44.7 270.0 469.0 17.5 684.0
Notes: Figures may not add up to the corresponding totals due to rounding.
(a) AIs : Authorized Institutions. (b) MDBs : Multilateral Development Banks.
The stock and futures markets 4.16 The local stock market was buoyant in the first quarter of 2006 amidst abundant liquidity. Market sentiment was boosted by the buoyant performance in other major stock markets notably those in the US and Japan, as well as the enthusiastic response to the IPO of new listings. The generally strong corporate earnings and an optimistic outlook for both the Hong Kong and the Mainland economies also rendered support. The Hang Seng Index surged
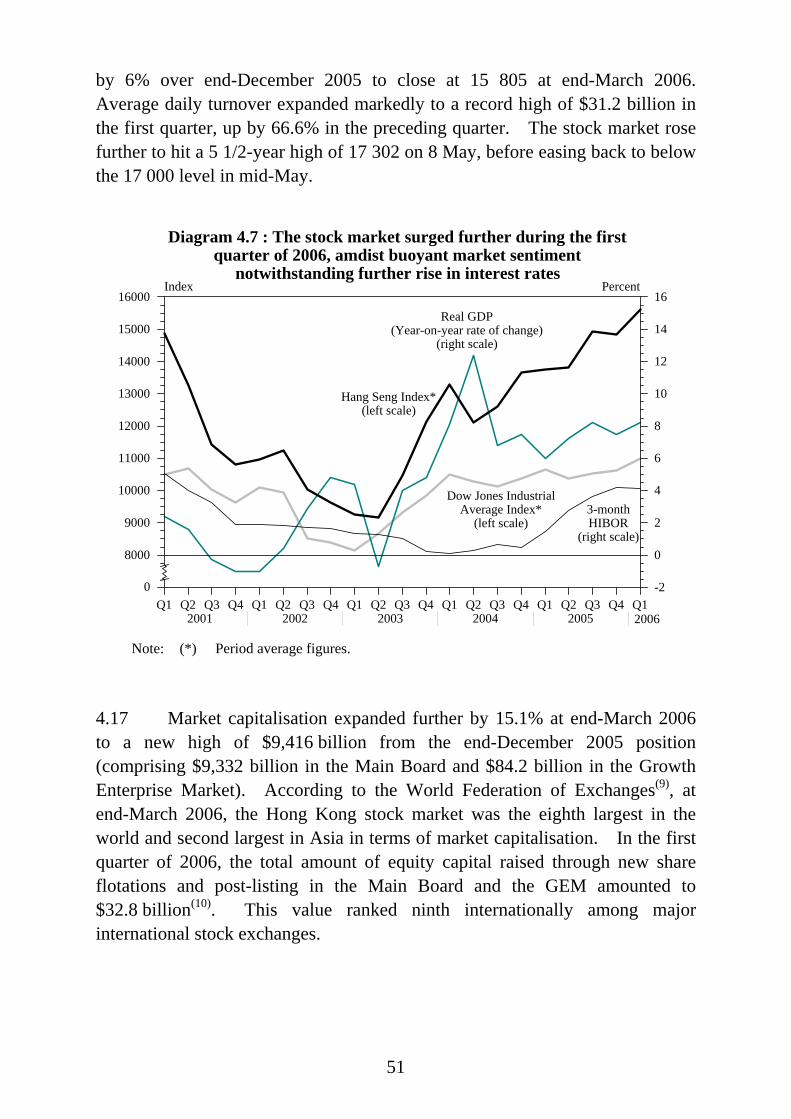
51
by 6% over end-December 2005 to close at 15 805 at end-March 2006. Average daily turnover expanded markedly to a record high of $31.2 billion in the first quarter, up by 66.6% in the preceding quarter. The stock market rose further to hit a 5 1/2-year high of 17 302 on 8 May, before easing back to below the 17 000 level in mid-May.
Diagram 4.7 : The stock market surged further during the first quarter of 2006, amdist buoyant market sentiment
notwithstanding further rise in interest rates
Q1 Q2 Q3 Q4 Q1 Q2 Q3 Q4 Q1 Q2 Q3 Q4 Q1 Q2 Q3 Q4 Q1 Q2 Q3 Q4 Q12001 2002 2003 2004 2005 2006
7000
8000
9000
10000
11000
12000
13000
14000
15000
16000Index
0
2
4
6
8
10
12
14
16
-2
Percent
Hang Seng Index*(left scale)
0
3-month HIBOR
(right scale)
Real GDP(Year-on-year rate of change)
(right scale)
Dow Jones IndustrialAverage Index*
(left scale)
2006 Note: (*) Period average figures.
4.17 Market capitalisation expanded further by 15.1% at end-March 2006 to a new high of $9,416 billion from the end-December 2005 position (comprising $9,332 billion in the Main Board and $84.2 billion in the Growth Enterprise Market). According to the World Federation of Exchanges(9), at end-March 2006, the Hong Kong stock market was the eighth largest in the world and second largest in Asia in terms of market capitalisation. In the first quarter of 2006, the total amount of equity capital raised through new share flotations and post-listing in the Main Board and the GEM amounted to $32.8 billion(10). This value ranked ninth internationally among major international stock exchanges.
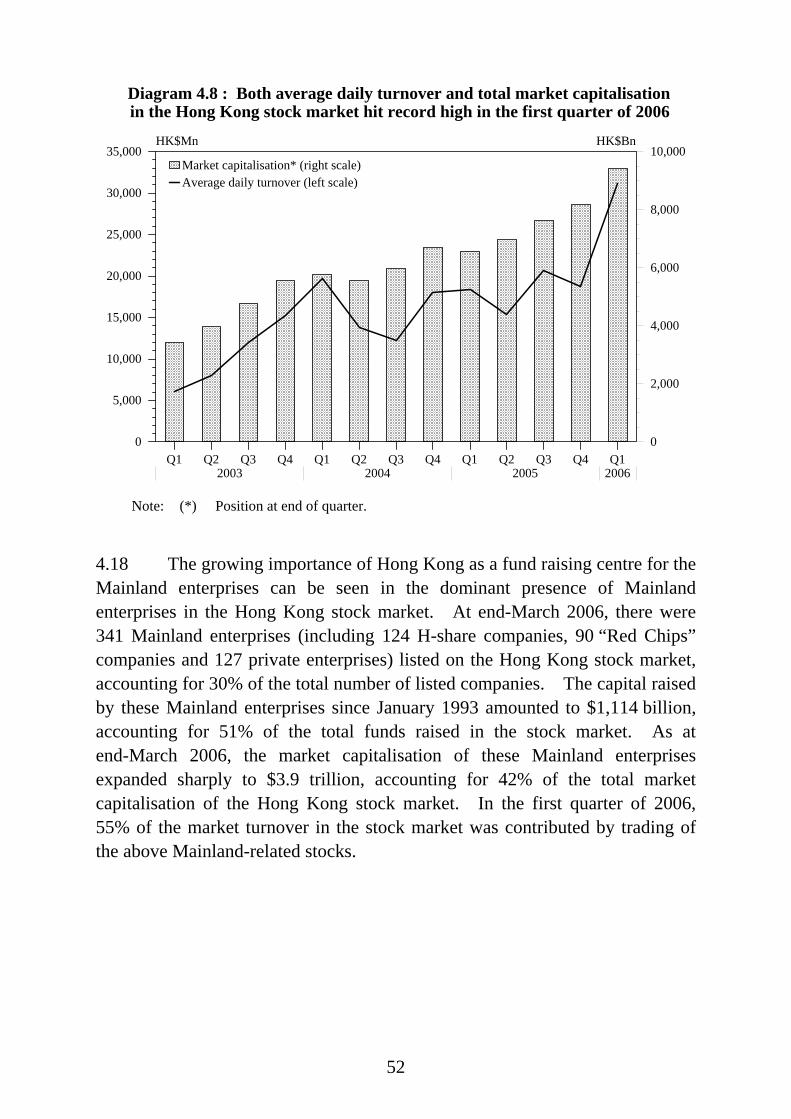
52
Diagram 4.8 : Both average daily turnover and total market capitalisation in the Hong Kong stock market hit record high in the first quarter of 2006
Q1 Q2 Q3 Q4 Q1 Q2 Q3 Q4 Q1 Q2 Q3 Q4 Q12003 2004 2005 2006
0
5,000
10,000
15,000
20,000
25,000
30,000
35,000HK$Mn
0
2,000
4,000
6,000
8,000
10,000HK$Bn
Average daily turnover (left scale) Market capitalisation* (right scale)
Note: (*) Position at end of quarter.
4.18 The growing importance of Hong Kong as a fund raising centre for the Mainland enterprises can be seen in the dominant presence of Mainland enterprises in the Hong Kong stock market. At end-March 2006, there were 341 Mainland enterprises (including 124 H-share companies, 90 “Red Chips” companies and 127 private enterprises) listed on the Hong Kong stock market, accounting for 30% of the total number of listed companies. The capital raised by these Mainland enterprises since January 1993 amounted to $1,114 billion, accounting for 51% of the total funds raised in the stock market. As at end-March 2006, the market capitalisation of these Mainland enterprises expanded sharply to $3.9 trillion, accounting for 42% of the total market capitalisation of the Hong Kong stock market. In the first quarter of 2006, 55% of the market turnover in the stock market was contributed by trading of the above Mainland-related stocks.
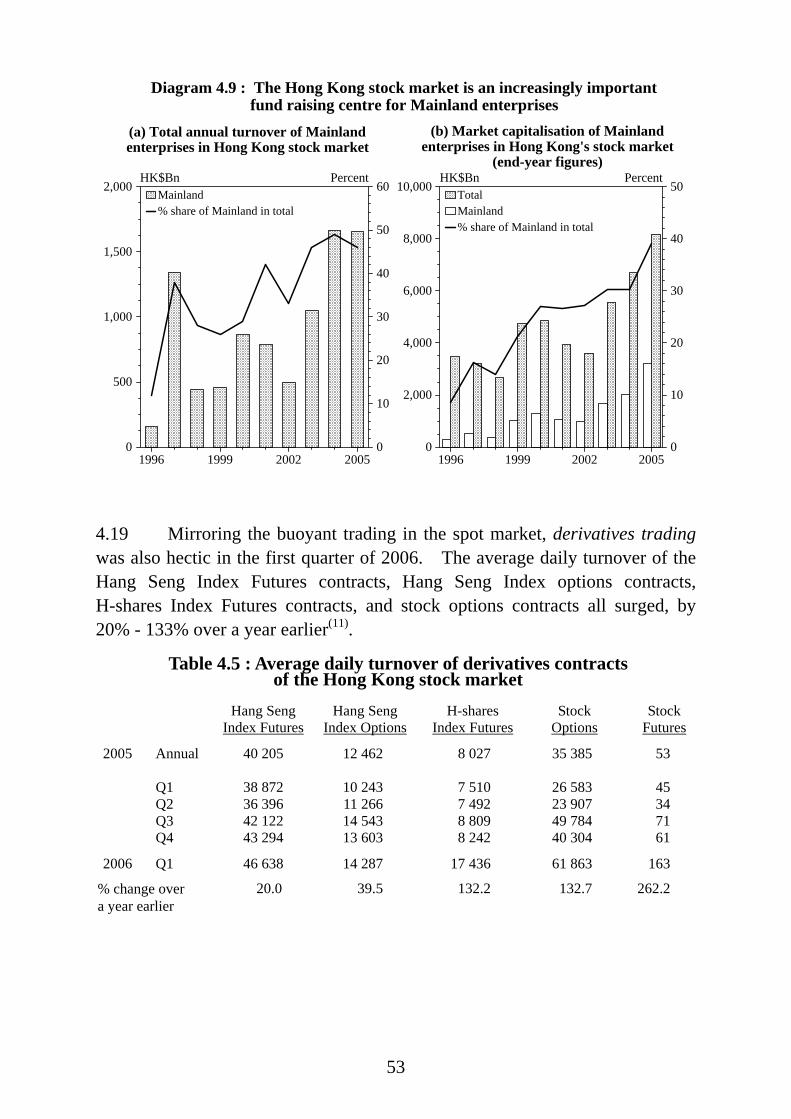
53
Diagram 4.9 : The Hong Kong stock market is an increasingly importantfund raising centre for Mainland enterprises
(a) Total annual turnover of Mainlandenterprises in Hong Kong stock market
1996 1999 2002 20050
2,000
4,000
6,000
8,000
10,000HK$Bn
0
10
20
30
40
50Percent
% share of Mainland in total Mainland Total
(b) Market capitalisation of Mainland enterprises in Hong Kong's stock market
(end-year figures)
1996 1999 2002 20050
500
1,000
1,500
2,000HK$Bn
0
10
20
30
40
50
60Percent
% share of Mainland in total Mainland
4.19 Mirroring the buoyant trading in the spot market, derivatives trading was also hectic in the first quarter of 2006. The average daily turnover of the Hang Seng Index Futures contracts, Hang Seng Index options contracts, H-shares Index Futures contracts, and stock options contracts all surged, by 20% - 133% over a year earlier(11).
Table 4.5 : Average daily turnover of derivatives contracts
of the Hong Kong stock market
Hang Seng Index Futures
Hang Seng Index Options
H-shares Index Futures
Stock Options
Stock Futures
2005 Annual 40 205 12 462 8 027 35 385 53 Q1 38 872 10 243 7 510 26 583 45 Q2 36 396 11 266 7 492 23 907 34 Q3 42 122 14 543 8 809 49 784 71 Q4 43 294 13 603 8 242 40 304 61
2006 Q1 46 638 14 287 17 436 61 863 163
% change over a year earlier
20.0 39.5 132.2 132.7 262.2
54
Fund management and investment funds 4.20 Reflecting the prominent role of Hong Kong as an international financial centre, both the depth and breadth of investment funds managed in Hong Kong increased notably in the more recent years. This paves the way for Hong Kong to evolve as Asia’s leading asset management centre. In the first quarter of 2006, gross sales of mutual funds(12) amounted to US$7,701 million, representing a substantial increase from US$3,337 million in the fourth quarter of 2005. After deducting redemptions, net sales amounted to US$2,364 million in the first quarter of 2006, compared with the net outflows of US$743 million registered in the fourth quarter of 2005. Analysed by asset size, equity funds continued to take up a predominant portion, accounting for 68% of the total value of funds at end-March 2006. Funds managed under the MPF schemes continued to grow. The aggregate net asset value of the approved constituent funds surged to $164.6 billion at end-March 2006, from $151.4 billion at end-December 2005(13). 4.21 More recently, the number of hedge funds launched for sale to the public in Hong Kong also increased in line with the growing popularity of this type of funds among the investors. There were 13 retail hedge funds authorised by the Securities and Futures Commission (SFC) with net asset size of US$1.15 billion as at end-March 2006, an increase of 10.5% from end-December 2005. The net asset size at end-March 2006 was more than six times larger than that as at end-2002, the year when the hedge funds guidelines were first issued. Apart from authorised hedge funds, based on the information available as at March 2006, about 148 hedge funds were operating in Hong Kong with total assets under management (AUM) amounted to US$17.4 billion. As the presence of hedge funds can contribute to or may adversely impact financial stability, the SFC is building partnership with both other regulators, whether local or overseas, and the industry itself to build a fair and transparent regulatory framework with the primary objective to safeguard investor interests. Besides, the co-operation can also facilitate market and product development, maintain market confidence and promote high standards. Insurance 4.22 The insurance sector continued to flourish amidst the pick-up in economic activities. Gross premium income surged further by 15.6% in 2005 over a year earlier(14). Growth in individual life and annuity business outpaced notably that in non-life business. The greater demand for the former type of products reflected partly the increase in employment income along with the
55
economic recovery, and also the increasing awareness of the needs for individual risk coverage and retirement planning.
Table 4.6 : Insurance business in Hong Kong (HK$Mn)
General business : Premium for long-term business* :
Gross
premium Net
premium Underwriting
profit
Individual life and annuity
(non-linked)
Individual life and annuity (linked)
Other individual business
Non-retirement scheme group
business
All long-term
business
2004 Annual
23,478 16,578 1,957 19,722 18,515 195 163 38,595
2005 Q1 6,944 4,909 63 4,814 4,209 45 41 9,109
Q2 6,171 4,422 141 6,099 5,376 41 48 11,564
Q3 5,704 4,177 433 5,749 5,281 43 39 11,112
Q4 5,069 3,525 1,210 7,628 6,385 49 32 14,094
Annual 23,888 17,033 1,847 24,290 21,251 178 160 45,879
% change from 2004 to 2005
1.7 2.7 -5.6 23.2 14.8 -8.7 -1.8 18.9
Note : (*) Figures refer to new businesses only. Retirement scheme businesses are excluded. Notes : (1) The measures were jointly promulgated by the People’s Bank of China, State
Administration of Foreign Exchange and the China Banking Regulatory Commission. The measures provide that commercial banks are allowed to invest in stipulated financial products in foreign financial markets on behalf of domestic institutions and households. Meanwhile, with effect from 1 May 2006, the requirement of prior approval for opening up of foreign exchange account related to the current account items by domestic institutions is abolished. Individuals are allowed to buy up to US$20,000 of foreign currency a year, up from the previous quota of US$8,000.
(2) At present, the Base Rate is set at either 150 basis points above the prevailing US Fed
Funds Target Rate or the average of the five-day moving averages of the overnight and one-month HIBORs, whichever is higher.
(3) In December 2005, the HKMA published a new data series on composite interest rate,
reflecting movement in various deposit rates, interbank and other interest rates to closely track the average costs of funds of banks. The published data enable the banks to keep track of changes in funding cost and thus help improve interest rate risk management in the banking sector.
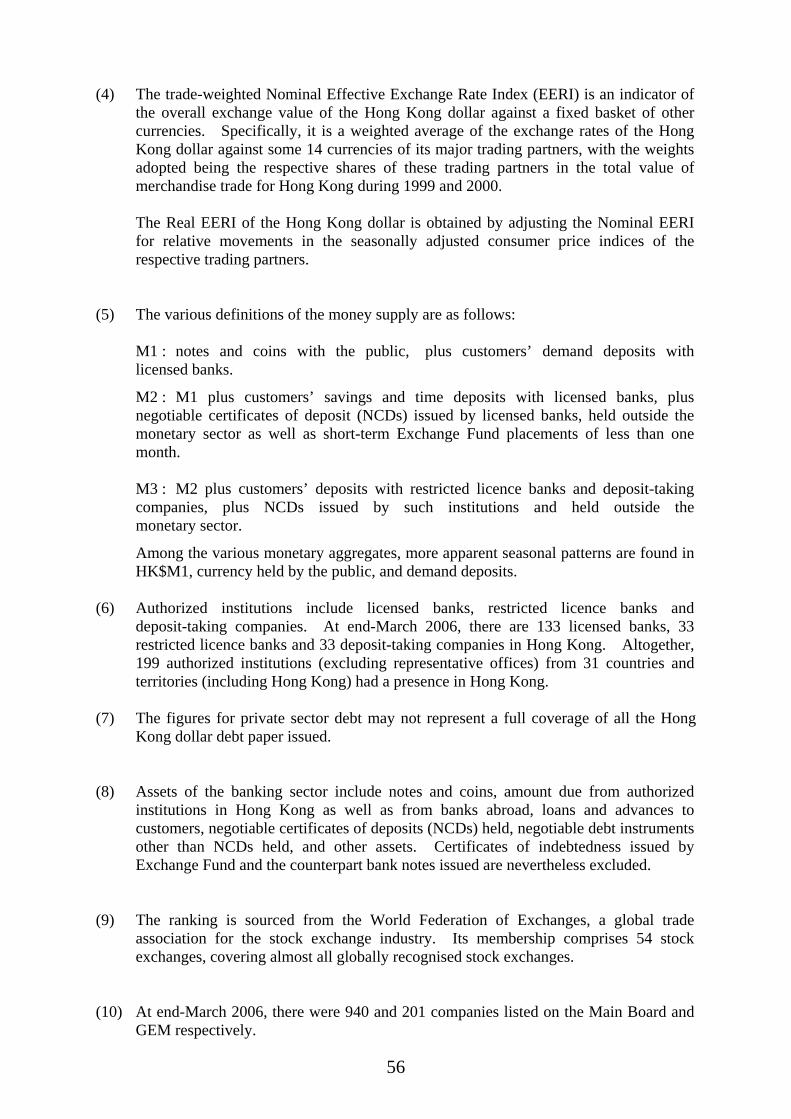
56
(4) The trade-weighted Nominal Effective Exchange Rate Index (EERI) is an indicator of
the overall exchange value of the Hong Kong dollar against a fixed basket of other currencies. Specifically, it is a weighted average of the exchange rates of the Hong Kong dollar against some 14 currencies of its major trading partners, with the weights adopted being the respective shares of these trading partners in the total value of merchandise trade for Hong Kong during 1999 and 2000.
The Real EERI of the Hong Kong dollar is obtained by adjusting the Nominal EERI
for relative movements in the seasonally adjusted consumer price indices of the respective trading partners.
(5) The various definitions of the money supply are as follows: M1 : notes and coins with the public, plus customers’ demand deposits with
licensed banks.
M2 : M1 plus customers’ savings and time deposits with licensed banks, plus negotiable certificates of deposit (NCDs) issued by licensed banks, held outside the monetary sector as well as short-term Exchange Fund placements of less than one month.
M3 : M2 plus customers’ deposits with restricted licence banks and deposit-taking
companies, plus NCDs issued by such institutions and held outside the monetary sector.
Among the various monetary aggregates, more apparent seasonal patterns are found in HK$M1, currency held by the public, and demand deposits.
(6) Authorized institutions include licensed banks, restricted licence banks and
deposit-taking companies. At end-March 2006, there are 133 licensed banks, 33 restricted licence banks and 33 deposit-taking companies in Hong Kong. Altogether, 199 authorized institutions (excluding representative offices) from 31 countries and territories (including Hong Kong) had a presence in Hong Kong.
(7) The figures for private sector debt may not represent a full coverage of all the Hong
Kong dollar debt paper issued. (8) Assets of the banking sector include notes and coins, amount due from authorized
institutions in Hong Kong as well as from banks abroad, loans and advances to customers, negotiable certificates of deposits (NCDs) held, negotiable debt instruments other than NCDs held, and other assets. Certificates of indebtedness issued by Exchange Fund and the counterpart bank notes issued are nevertheless excluded.
(9) The ranking is sourced from the World Federation of Exchanges, a global trade
association for the stock exchange industry. Its membership comprises 54 stock exchanges, covering almost all globally recognised stock exchanges.
(10) At end-March 2006, there were 940 and 201 companies listed on the Main Board and
GEM respectively.
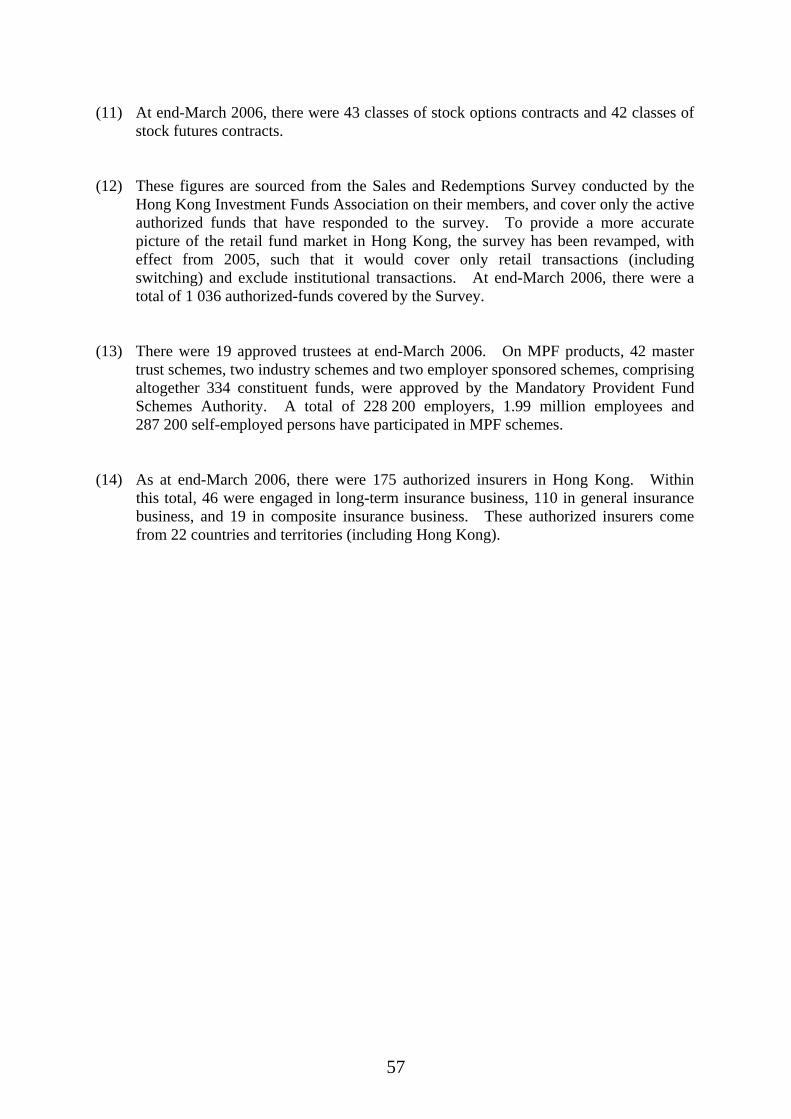
57
(11) At end-March 2006, there were 43 classes of stock options contracts and 42 classes of
stock futures contracts. (12) These figures are sourced from the Sales and Redemptions Survey conducted by the
Hong Kong Investment Funds Association on their members, and cover only the active authorized funds that have responded to the survey. To provide a more accurate picture of the retail fund market in Hong Kong, the survey has been revamped, with effect from 2005, such that it would cover only retail transactions (including switching) and exclude institutional transactions. At end-March 2006, there were a total of 1 036 authorized-funds covered by the Survey.
(13) There were 19 approved trustees at end-March 2006. On MPF products, 42 master
trust schemes, two industry schemes and two employer sponsored schemes, comprising altogether 334 constituent funds, were approved by the Mandatory Provident Fund Schemes Authority. A total of 228 200 employers, 1.99 million employees and 287 200 self-employed persons have participated in MPF schemes.
(14) As at end-March 2006, there were 175 authorized insurers in Hong Kong. Within
this total, 46 were engaged in long-term insurance business, 110 in general insurance business, and 19 in composite insurance business. These authorized insurers come from 22 countries and territories (including Hong Kong).
58
CHAPTER 5 : THE LABOUR SECTOR Summary • The labour market showed signs of consolidation in the first quarter of 2006,
as business activity in some economic sectors turned quieter after the Lunar New Year holidays.
• With total employment and labour force both decreasing mildly, the numbers
unemployed held broadly stable. Concurrently, the unemployment and underemployment rates both exhibited minor changes.
• Labour wages and earnings had an accelerated, yet still modest, increase
more recently. Overall labour market situation 5.1 The labour market, having staged a visible turnaround in the past couple of years, became more settled in the first quarter of 2006. Most of the major labour-related indicators hovered within a narrow range. Total employment fell modestly to 3 426 200, consequential to slackened business activity and labour demand in some economic sectors, such as construction and transport, in the wake of the Lunar New Year holidays. Nevertheless, owing to the offsetting effect of a somewhat larger reduction in the labour supply to 3 606 700, the number of unemployed persons edged down further to 180 500. The seasonally adjusted unemployment rate(1) also moved slightly lower to 5.2%. So did the underemployment rate(2), to 2.3%.
0.0
1.0
2.0
3.0
4.0
5.0
6.0
7.0
8.0
9.0
10.0
Seasonally adjustedunemployment rate
4.5 4.5 5.2 6.2 7.0 7.7 7.4 7.2 7.5 8.6 8.3 7.4 7.3 6.8 6.8 6.6 6.1 5.7 5.5 5.3 5.2
Underemploymentrate
2.3 2.2 2.5 3.0 3.2 2.9 2.9 3.1 2.9 4.3 3.6 3.3 3.4 3.5 3.2 3.1 3.1 2.8 2.6 2.5 2.3
Q1 Q2 Q3 Q4 Q1 Q2 Q3 Q4 Q1 Q2 Q3 Q4 Q1 Q2 Q3 Q4 Q1 Q2 Q3 Q4 Q1
2001 2002 2003 2004 2005 2006
Percent
Seasonally adjustedunemployment rate
Underemployment rate
Diagram 5.1 : Labour market conditions, whilst more settled,remained on an improving trend in the first quarter of 2006

59
Total employment and labour supply 5.2 At 3 426 200, total employment(3) in the first quarter of 2006 was just 0.2% below the peak of 3 431 500 in the fourth quarter of 2005. Thus labour demand, though moderating, remained robust in the early part of the year. This recent reduction in employment was in fact partly seasonal, caused by the slowdown in business activities shortly after the Lunar New Year holidays. Manufacturing, construction and transport were the major sectors where job losses were mostly found. Within the total workforce, those persons with lower educational attainment and/or lesser skills like craft and related workers, and clerks were among the hardest hit. Nevertheless, past experience suggests that as the seasonal influence recedes and as more jobs are created along with sustained economic growth, total employment is likely to pick up again later in the year. 5.3 On the labour supply(4), there was likewise a mild decrease of 0.2% quarter-to-quarter to 3 606 700, mainly attributable to a decline in the population of working age. This more than offset the increase in the labour force participation rate for persons aged 25-34, as some of the people in this age group who had previously quit their jobs were found to have re-entered the labour market more recently.
Table 5.1 : The labour force, and persons employed, unemployed and underemployed
Labour force
Persons employed Persons
unemployed(a) Persons
underemployed 2005 Annual 3 586 300 (1.0) 3 385 500 (2.3) 200 700 98 700 Q1 3 565 100 (1.0) 3 354 500 (2.3) 210 600 109 800 Q2 3 569 200 (0.7) 3 364 700 (1.9) 204 500 100 400 Q3 3 597 300 (1.2) 3 391 600 (2.6) 205 700 95 000 Q4 3 613 400 (1.1) 3 431 500 (2.5) 182 000 89 500 2006 Q1 3 606 700 (1.2) 3 426 200 (2.1) 180 500 82 600 <-0.2> <-0.2> Notes : (a) These include first-time job-seekers and re-entrants into the labour force. ( ) % change over a year earlier. < > % change over the preceding quarter. Source : General Household Survey, Census and Statistics Department.
60
Q1 Q2 Q3 Q4 Q1 Q2 Q3 Q4 Q1 Q2 Q3 Q4 Q1 Q2 Q3 Q4 Q1 Q2 Q3 Q4 Q12001 2002 2003 2004 2005 2006
3100
3200
3300
3400
3500
3600
3700Number ('000)
Totallabour force
Diagram 5.2 : Total employment stayed close to its all-time high amid the still robust labour demand
Totalemployment
2006
Profile of unemployment 5.4 While the unemployment situation held steady in overall terms, performance varied considerably among different economic sectors, occupation categories and educational attainment levels. More specifically, whereas a surge in unemployment was observed in the construction sector (particularly decoration and maintenance), notable decreases were observed in the import/export trade amid continued buoyancy in the external trade, as well as in restaurants owing to a contraction in the labour supply. Furthermore, workers at the lower segment of the occupational hierarchy generally were affected more by the recent job losses, relative to those at the upper segment. The unemployment rate for the former group, at 6.1%, remained distinctly above that for the latter group, at 2.0%. By the same token, workers with higher educational attainment continued to face lower unemployment rates than the less educated ones.
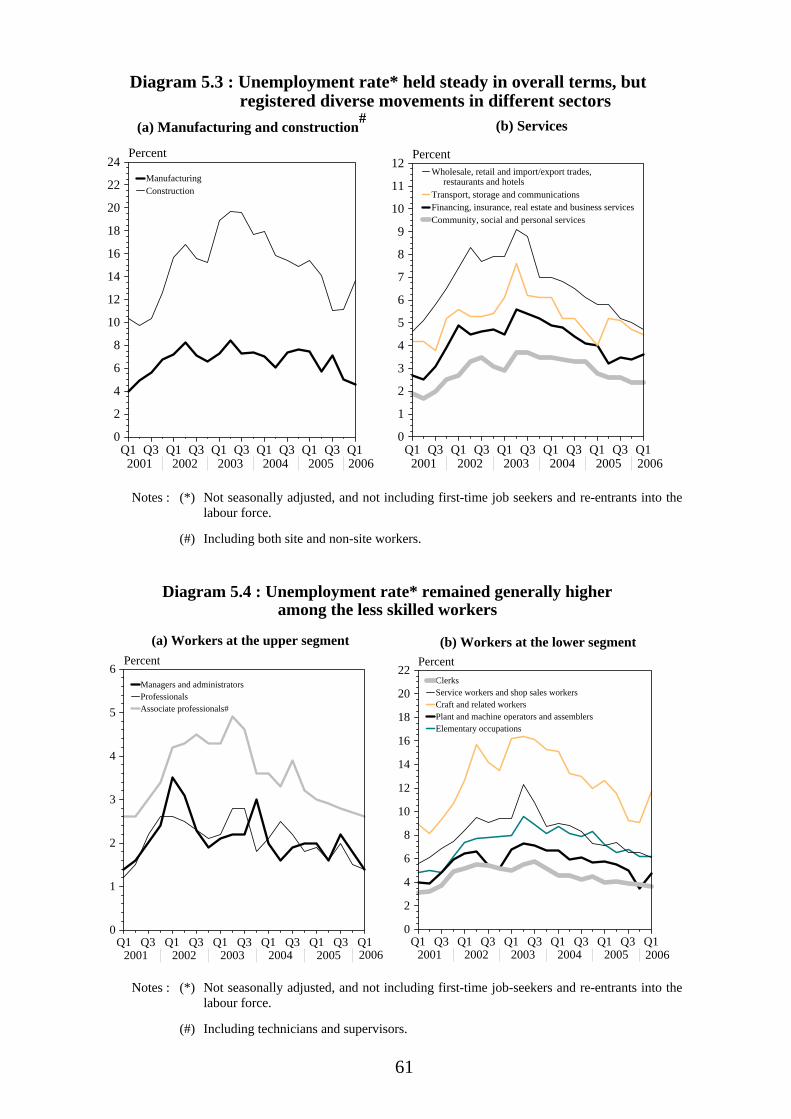
61
Diagram 5.3 : Unemployment rate* held steady in overall terms, but registered diverse movements in different sectors
Q1 Q3 Q1 Q3 Q1 Q3 Q1 Q3 Q1 Q3 Q12001 2002 2003 2004 2005 2006
0
2
4
6
8
10
12
14
16
18
20
22
24Percent
Manufacturing Construction
(a) Manufacturing and construction# (b) Services
Q1 Q3 Q1 Q3 Q1 Q3 Q1 Q3 Q1 Q3 Q12001 2002 2003 2004 2005 2006
0
1
2
3
4
5
6
7
8
9
10
11
12Percent
Wholesale, retail and import/export trades, restaurants and hotels Transport, storage and communications Financing, insurance, real estate and business services Community, social and personal services
2006 2006 Notes : (*) Not seasonally adjusted, and not including first-time job seekers and re-entrants into the
labour force. (#) Including both site and non-site workers.
Q1 Q3 Q1 Q3 Q1 Q3 Q1 Q3 Q1 Q3 Q12001 2002 2003 2004 2005 2006
0
1
2
3
4
5
6Percent
Managers and administrators Professionals Associate professionals#
Diagram 5.4 : Unemployment rate* remained generally higheramong the less skilled workers
(a) Workers at the upper segment
Q1 Q3 Q1 Q3 Q1 Q3 Q1 Q3 Q1 Q3 Q12001 2002 2003 2004 2005 2006
0
2
4
6
8
10
12
14
16
18
20
22Percent
Clerks Service workers and shop sales workers Craft and related workers Plant and machine operators and assemblers Elementary occupations
(b) Workers at the lower segment
2006 2006 Notes : (*) Not seasonally adjusted, and not including first-time job-seekers and re-entrants into the
labour force. (#) Including technicians and supervisors.
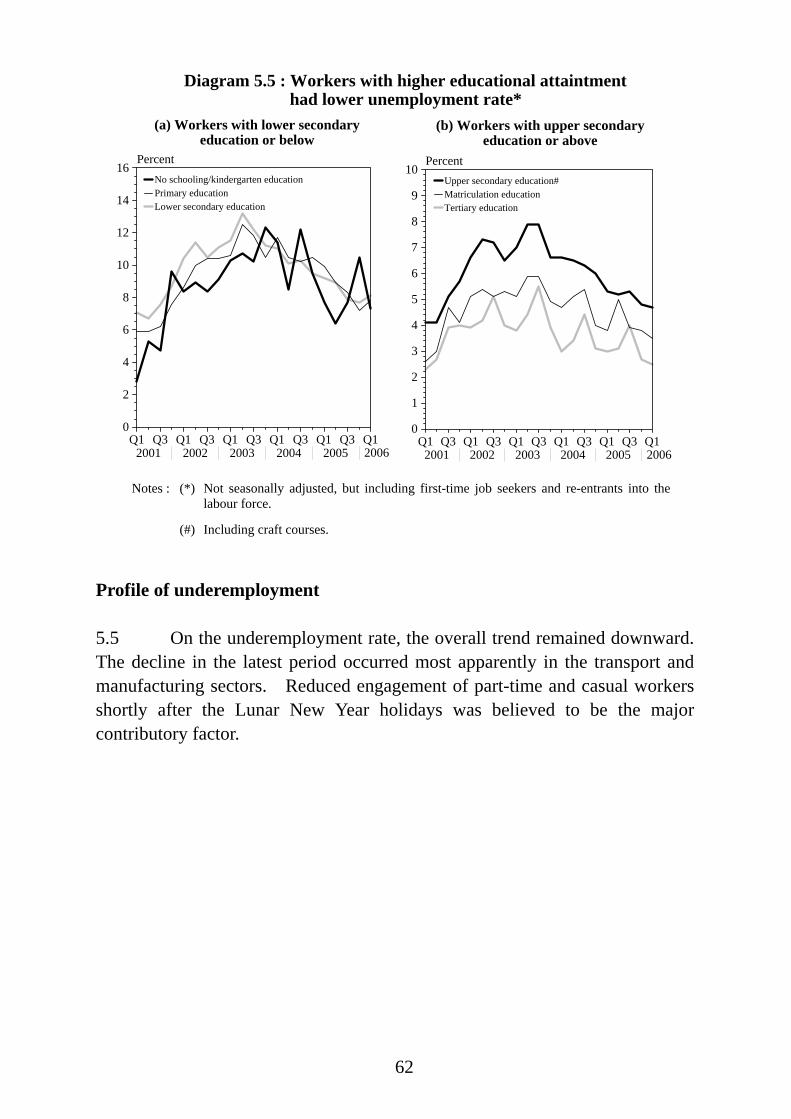
62
Q1 Q3 Q1 Q3 Q1 Q3 Q1 Q3 Q1 Q3 Q12001 2002 2003 2004 2005 2006
0
2
4
6
8
10
12
14
16Percent
No schooling/kindergarten education Primary education Lower secondary education
Diagram 5.5 : Workers with higher educational attaintmenthad lower unemployment rate*
(a) Workers with lower secondaryeducation or below
Q1 Q3 Q1 Q3 Q1 Q3 Q1 Q3 Q1 Q3 Q12001 2002 2003 2004 2005 2006
0
1
2
3
4
5
6
7
8
9
10Percent
Upper secondary education# Matriculation education Tertiary education
(b) Workers with upper secondaryeducation or above
2006 2006
Notes : (*) Not seasonally adjusted, but including first-time job seekers and re-entrants into the labour force.
(#) Including craft courses.
Profile of underemployment 5.5 On the underemployment rate, the overall trend remained downward. The decline in the latest period occurred most apparently in the transport and manufacturing sectors. Reduced engagement of part-time and casual workers shortly after the Lunar New Year holidays was believed to be the major contributory factor.
63
Box 5.1
Recent movement in the labour force participation rate
The labour force participation rate (LFPR) fell over the past decade, from 62.0% in 1995 to 60.9% in 2005. This decline was attributable entirely to the secular downtrend in the LFPR 60.9 for males, more than offsetting the progressive rise in the LFPR for females. Analysed by age group, younger persons aged 15-24 faced a significant drop in the LFPR, by 6.7 percentage points from 50.3% in 1995 to 43.6% in 2005 (Table 1). Even after standardisation of age profile to that in 1995 so as to remove the effect of population ageing over time, the LFPR for this particular age group was still down visibly, by 6.3 percentage points to 44.0%. Conceivably, such a large decrease was due to an upsurge in the proportion of youngsters pursuing further studies at schools for better qualifications. According to the statistics supplied by the Education and Manpower Bureau, the number of full-time student enrolments for tertiary education leaped by 57% between 1995/96 and 2005/06 (provisional figure).
Table 1 : Labour Force Participation Rate (%) by Age Group
Age group 1995 2005 Difference in % points (a) (b) (b) – (a) 15 – 24 50.3 43.6 -6.7 (44.0) (-6.3) 25 – 54 79.2 80.8 +1.6 (83.8) (+4.6) 55+ 24.8 23.3 -1.6 (23.1) (-1.7) Overall 62.0 60.9 -1.0 (63.3) (+1.3)
Note: ( ) Figures in brackets refer to the labour force participation rates after
standardisation of the age profile in 2005 to that in 1995. Meanwhile, the LFPR for elderly people aged 55 or above also went down, albeit by a smaller magnitude of 1.6 percentage points, from 24.8% to 23.3%. After age standardisation, the LFPR for these people likewise dropped, by 1.7 percentage points. This decline might be caused by early retirement of some elderly workers in the age cohort. In face of the on-going economic restructuring and several business downturns within this period, a considerable proportion of the elderly persons with lower educational level might have encountered increasing difficulty in finding or securing a job in the knowledge-based society and thus quit the workforce. Persons aged 25-54 were the only group registering a rise in the LFPR. The increase occurred solely among females with their LFPR up by 7.6 percentage points, outweighing the decrease of 2.4 percentage points in the LFPR for males (Table 2). After allowing for age standardisation, the LFPR for females showed an even larger increase, by 11.0 percentage points between 1995 and 2005.
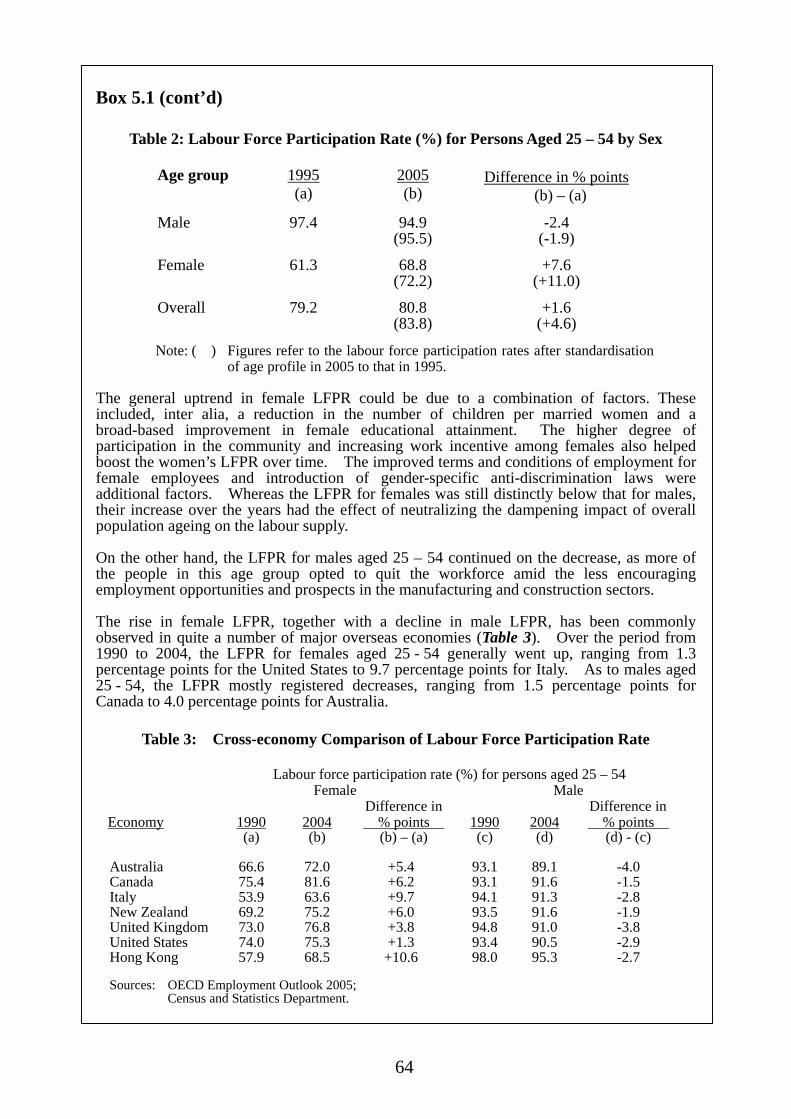
64
Box 5.1 (cont’d)
Table 2: Labour Force Participation Rate (%) for Persons Aged 25 – 54 by Sex
Age group 1995 2005 Difference in % points (a) (b) (b) – (a) Male 97.4 94.9 -2.4 (95.5) (-1.9) Female 61.3 68.8 +7.6 (72.2) (+11.0) Overall 79.2 80.8 +1.6 (83.8) (+4.6)
Note: ( ) Figures refer to the labour force participation rates after standardisation
of age profile in 2005 to that in 1995. The general uptrend in female LFPR could be due to a combination of factors. These included, inter alia, a reduction in the number of children per married women and a broad-based improvement in female educational attainment. The higher degree of participation in the community and increasing work incentive among females also helped boost the women’s LFPR over time. The improved terms and conditions of employment for female employees and introduction of gender-specific anti-discrimination laws were additional factors. Whereas the LFPR for females was still distinctly below that for males, their increase over the years had the effect of neutralizing the dampening impact of overall population ageing on the labour supply. On the other hand, the LFPR for males aged 25 – 54 continued on the decrease, as more of the people in this age group opted to quit the workforce amid the less encouraging employment opportunities and prospects in the manufacturing and construction sectors. The rise in female LFPR, together with a decline in male LFPR, has been commonly observed in quite a number of major overseas economies (Table 3). Over the period from 1990 to 2004, the LFPR for females aged 25 - 54 generally went up, ranging from 1.3 percentage points for the United States to 9.7 percentage points for Italy. As to males aged 25 - 54, the LFPR mostly registered decreases, ranging from 1.5 percentage points for Canada to 4.0 percentage points for Australia.
Table 3: Cross-economy Comparison of Labour Force Participation Rate
Labour force participation rate (%) for persons aged 25 – 54 Female Male
Economy
1990
2004
Difference in % points
1990
2004
Difference in % points
(a) (b) (b) – (a) (c) (d) (d) - (c) Australia 66.6 72.0 +5.4 93.1 89.1 -4.0 Canada 75.4 81.6 +6.2 93.1 91.6 -1.5 Italy 53.9 63.6 +9.7 94.1 91.3 -2.8 New Zealand 69.2 75.2 +6.0 93.5 91.6 -1.9 United Kingdom 73.0 76.8 +3.8 94.8 91.0 -3.8 United States 74.0 75.3 +1.3 93.4 90.5 -2.9 Hong Kong 57.9 68.5 +10.6 98.0 95.3 -2.7
Sources: OECD Employment Outlook 2005; Census and Statistics Department.
65
Profile of employment in establishments 5.6 The statistics on employment, vacancy, labour earnings and wages in the corporate sector are available up to the end of 2005 only. Comparing December 2005 with a year earlier, the number of people employed in private sector establishments went up by 2.0%. For 2005 as a whole, the growth was 2.5%. This reflected primarily the combined influence of an expansion in staffing in the existing establishments and an increase in the number of business operators over the past year, in tandem with the sustained upturn in economic activity. Among all the establishments surveyed, the small and medium-sized enterprises (5) were more important as a source of employment growth than the large ones, with the respective contributions being 1.7% and 0.8% in 2005. Analysed by economic sector, whereas job reductions were still recorded in the manufacturing sector and at the building and construction sites(6), this was more than offset by employment gains seen in the service sectors, including in particular financing, insurance, real estate and business services, community, social and personal services, and the import/export trade. Another development worth noting was that manufacturing employment reverted to increase in December 2005, partly boosted by the shift-back in clothing production to Hong Kong in view of the threat of imposing safeguard measures on Mainland’s textiles and clothing exports by the US and the EU in the latter part of the year. 5.7 As for the civil service, employment continued to decline, by 1.8% in December 2005 over a year earlier and by 2.7% for 2005 on a whole. On current indications, the size of civil service establishment is expected to be trimmed further to about 161 900 by end-March 2007.

66
Table 5.2 : Employment by major economic sector
2004 2005 Annual Annual average Mar Jun Sep Dec average Mar Jun Sep Dec Wholesale and
import/export trades 567 700
(1.7)556 600
(-1.3) 563 100
(0.9)577 000
(3.8)574 100
(3.4)581 800
(2.5)583 100
(4.8) 579 100
(2.8) 585 300
(1.4)579 500
(0.9) Retail trade 217 300
(3.1)214 600
(2.3) 216 500
(3.6)219 400
(6.0)218 400
(0.6)221 100
(1.8)216 000
(0.7) 224 600
(3.7) 221 700
(1.0)221 900
(1.6) Restaurants and hotels 207 900
(6.0)204 600
(3.2) 209 500
(9.7)206 600
(6.6)210 900
(4.7)215 400
(3.6)210 700
(2.9) 214 500
(2.3) 214 300
(3.7)222 300
(5.4) Water transport, air
transport and services allied to transport
104 500(6.6)
101 600 (1.4)
104 500(8.7)
104 800(8.5)
107 000(8.1)
110 100(5.4)
107 900 (6.2)
110 900 (6.1)
110 100(5.1)
111 400(4.2)
Storage and
communications 35 900
(2.2)35 900
(8.0) 36 100
(2.2)35 300
(0.1)36 100
(-1.0)35 400(-1.1)
35 300 (-1.7)
36 400 (0.8)
35 300(0.1)
34 800(-3.7)
Financing, insurance,
real estate and business services
437 000(3.6)
428 600 (1.4)
434 200(3.6)
437 800(3.7)
447 400(5.6)
456 100(4.4)
447 600 (4.4)
457 200 (5.3)
455 400(4.0)
464 400(3.8)
Community, social and
personal services 420 200
(3.2)412 000
(3.5) 418 100
(4.4)415 700
(0.4)435 200
(4.5)439 000
(4.5)434 400
(5.4) 437 000
(4.5) 437 700
(5.3)446 800
(2.7) Manufacturing 168 000
(-3.0)168 900
(-5.6) 169 600
(-1.7)168 000
(-2.8)165 300
(-1.8)164 700
(-2.0)163 100
(-3.5) 161 900
(-4.5) 166 300
(-1.0)167 400
(1.3) Building and
construction sites 66 300(-5.7)
69 100 (-4.5)
69 900(-0.1)
64 900(-8.1)
61 200(-10.3)
59 300(-10.6)
65 800 (-4.8)
60 000 (-14.2)
56 800(-12.4)
54 500(-11.1)
All establishments
surveyed in the private sector(a)
2 271 400(2.4)
2 239 000 (0.6)
<0.5>
2 268 400(3.1)
<1.0>
2 276 000(2.7)
<0.3>
2 302 100(3.1)
<1.1>
2 328 700(2.5)
2 310 000 (3.2)
<0.7>
2 327 300 (2.6)
<0.5>
2 328 900(2.3)
<0.1>
2 348 700(2.0)
<0.7> Civil service(b) 160 800
(-3.8)163 000
(-3.6) 161 700
(-3.9)160 100
(-3.8)158 400
(-3.8)156 500
(-2.7)157 300
(-3.5) 156 800
(-3.0) 156 200
(-2.4)155 500
(-1.8)
Notes : Employment figures enumerated from business establishments, as obtained from the Quarterly Survey of Employment and Vacancies, are somewhat different from those enumerated from households, as obtained from the General Household Survey. This is mainly due to difference in sectoral coverage: while the former survey covers selected major sectors, the latter survey covers all sectors in the economy.
(a) The total figures on private sector employment cover also employment in mining and quarrying and in
electricity and gas supply, besides employment in the major sectors indicated above. (b) These figures cover only those employed on civil service terms of appointment. Judicial officers,
ICAC officers, locally engaged staff working in overseas Hong Kong Economic and Trade Offices, and other Government employees such as non-civil service contract staff are not included.
( ) % change over a year earlier. < > Seasonally adjusted quarter-to-quarter % change.
Source : Quarterly Survey of Employment and Vacancies, Census and Statistics Department.
67
Vacancies 5.8 The job vacancy statistics reaffirmed the sustained strong demand for labour during 2005. Comparing December 2005 with a year earlier, the number of job vacancies in private sector establishments surged by 24.9% to 36 500. Almost all of the new vacancies generated were from the service sectors, in particular restaurants, and the retail and import/export trades. Moreover, vacancies were concentrated at the lower end of the occupational hierarchy like service workers and shop sales workers, and clerks. Taken together, the lower-end job vacancies showed a much faster growth than job vacancies at the upper end, by 37.0% as against 10.2%. For 2005 as a whole, the increase in vacancies in private sector establishments averaged at 26.4 %. As to the civil service, while there were renewed openings for certain posts after several years of general recruitment freeze, the number of vacancies remained small, amounting to a mere 500 in December 2005. 5.9 When a comparison is made between the job vacancy and unemployment figures, this will provide some indication of the degree of job mismatch in the labour market. In case of the financing sector, the vacancy rate was higher than the unemployment rate at end-2005, indicating a relative shortage in labour supply for meeting the employment opportunities available predominantly among banks and investment companies. On the other hand, in the retail trade and in restaurants and hotels, the vacancy rates were still markedly below the unemployment rates, suggesting a relative surplus in labour supply despite the existence of considerable vacancies. For the latter two sectors, the gap between the vacancy and unemployment rates had nevertheless narrowed appreciably over the past couple of years, amid the distinct revival in tourism and related activities. Analysed by occupation category, there continued to be a comparatively large surplus in labour supply at the lower segment of the occupational hierarchy, despite the creation of many new vacancies over the past couple of years. Concurrently, workers at the upper end faced with a much smaller surplus in supply, as a larger proportion of them had been absorbed into employment. Whilst the gaps existing in various sectors and occupations could be partly explained by the cyclical ups and downs of the economy, to no small degree this was also due to the mismatch prevailing in the labour market, in terms of job requirements and labour skills, demographic structure and regional distribution pattern of workers, etc. This notwithstanding, recent experience suggests that such mismatch can be expected to lessen in the future if the economy continues to grow and the knowledge and skills of the local workforce are suitably enhanced.
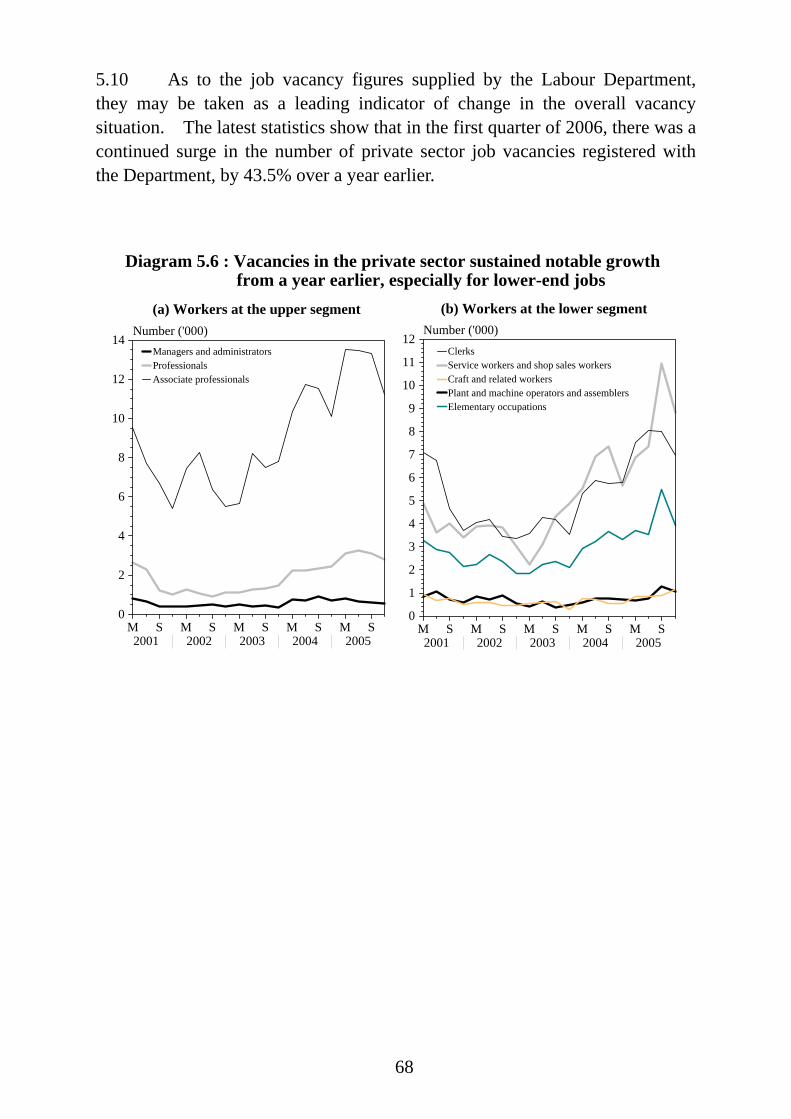
68
5.10 As to the job vacancy figures supplied by the Labour Department, they may be taken as a leading indicator of change in the overall vacancy situation. The latest statistics show that in the first quarter of 2006, there was a continued surge in the number of private sector job vacancies registered with the Department, by 43.5% over a year earlier.
M S M S M S M S M S2001 2002 2003 2004 2005
0
2
4
6
8
10
12
14Number ('000)
Managers and administrators Professionals Associate professionals
Diagram 5.6 : Vacancies in the private sector sustained notable growth from a year earlier, especially for lower-end jobs
(a) Workers at the upper segment
M S M S M S M S M S2001 2002 2003 2004 2005
0
1
2
3
4
5
6
7
8
9
10
11
12Number ('000)
Clerks Service workers and shop sales workers Craft and related workers Plant and machine operators and assemblers Elementary occupations
(b) Workers at the lower segment
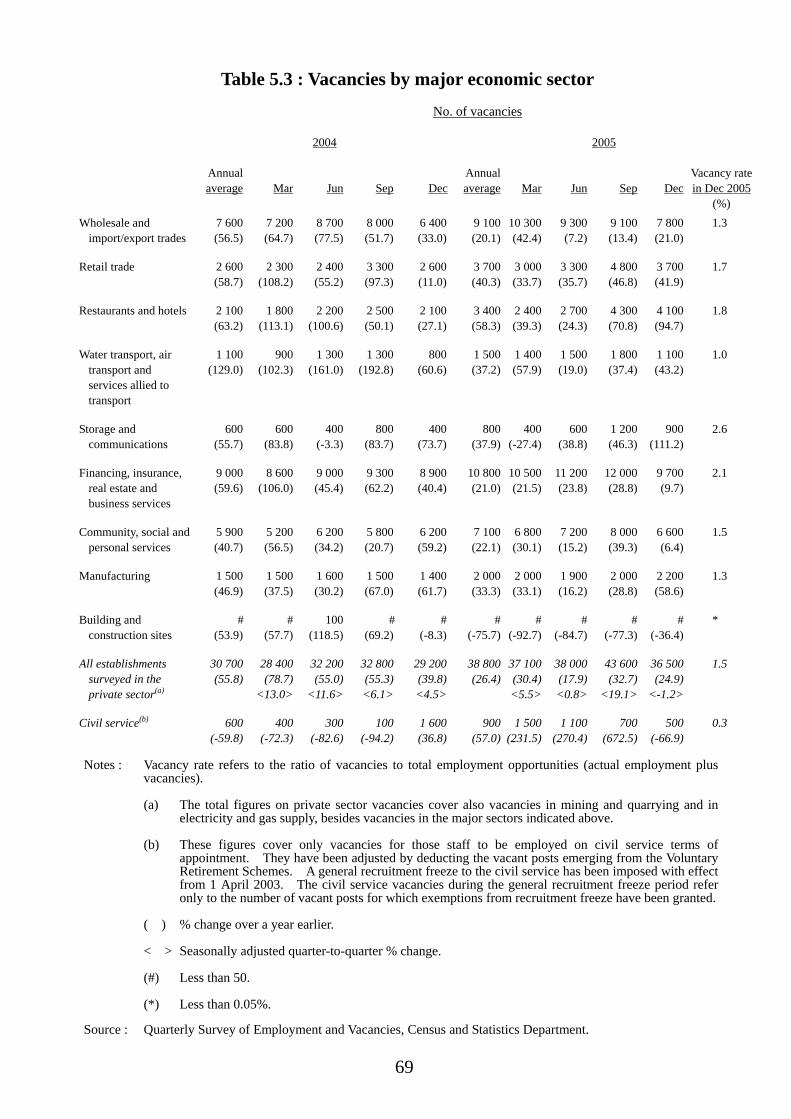
69
Table 5.3 : Vacancies by major economic sector
No. of vacancies 2004 2005
Annualaverage Mar Jun Sep Dec
Annualaverage Mar Jun Sep Dec
Vacancy ratein Dec 2005
(%) Wholesale and
import/export trades 7 600(56.5)
7 200 (64.7)
8 700(77.5)
8 000(51.7)
6 400(33.0)
9 100(20.1)
10 300(42.4)
9 300 (7.2)
9 100 (13.4)
7 800(21.0)
1.3
Retail trade 2 600
(58.7)2 300
(108.2) 2 400(55.2)
3 300(97.3)
2 600(11.0)
3 700(40.3)
3 000(33.7)
3 300 (35.7)
4 800 (46.8)
3 700(41.9)
1.7
Restaurants and hotels 2 100
(63.2)1 800
(113.1) 2 200
(100.6)2 500(50.1)
2 100(27.1)
3 400(58.3)
2 400(39.3)
2 700 (24.3)
4 300 (70.8)
4 100(94.7)
1.8
Water transport, air
transport and services allied to transport
1 100(129.0)
900 (102.3)
1 300(161.0)
1 300(192.8)
800(60.6)
1 500(37.2)
1 400(57.9)
1 500 (19.0)
1 800 (37.4)
1 100(43.2)
1.0
Storage and
communications 600
(55.7)600
(83.8) 400
(-3.3)800
(83.7)400
(73.7)800
(37.9)400
(-27.4)600
(38.8) 1 200 (46.3)
900(111.2)
2.6
Financing, insurance,
real estate and business services
9 000(59.6)
8 600 (106.0)
9 000(45.4)
9 300(62.2)
8 900(40.4)
10 800(21.0)
10 500(21.5)
11 200 (23.8)
12 000 (28.8)
9 700(9.7)
2.1
Community, social and
personal services 5 900(40.7)
5 200 (56.5)
6 200(34.2)
5 800(20.7)
6 200(59.2)
7 100(22.1)
6 800(30.1)
7 200 (15.2)
8 000 (39.3)
6 600(6.4)
1.5
Manufacturing 1 500
(46.9)1 500 (37.5)
1 600(30.2)
1 500(67.0)
1 400(61.7)
2 000(33.3)
2 000(33.1)
1 900 (16.2)
2 000 (28.8)
2 200(58.6)
1.3
Building and
construction sites #
(53.9) # (57.7)
100(118.5)
#(69.2)
#(-8.3)
#(-75.7)
#(-92.7)
# (-84.7)
# (-77.3)
#(-36.4)
*
All establishments
surveyed in the private sector(a)
30 700(55.8)
28 400 (78.7)
<13.0>
32 200(55.0)
<11.6>
32 800(55.3)<6.1>
29 200(39.8)<4.5>
38 800(26.4)
37 100(30.4)<5.5>
38 000 (17.9) <0.8>
43 600 (32.7)
<19.1>
36 500(24.9)
<-1.2>
1.5
Civil service(b) 600
(-59.8)400
(-72.3) 300
(-82.6)100
(-94.2)1 600(36.8)
900(57.0)
1 500(231.5)
1 100 (270.4)
700 (672.5)
500(-66.9)
0.3
Notes : Vacancy rate refers to the ratio of vacancies to total employment opportunities (actual employment plus
vacancies).
(a) The total figures on private sector vacancies cover also vacancies in mining and quarrying and in electricity and gas supply, besides vacancies in the major sectors indicated above.
(b) These figures cover only vacancies for those staff to be employed on civil service terms of
appointment. They have been adjusted by deducting the vacant posts emerging from the Voluntary Retirement Schemes. A general recruitment freeze to the civil service has been imposed with effect from 1 April 2003. The civil service vacancies during the general recruitment freeze period refer only to the number of vacant posts for which exemptions from recruitment freeze have been granted.
( ) % change over a year earlier. < > Seasonally adjusted quarter-to-quarter % change. (#) Less than 50. (*) Less than 0.05%.
Source : Quarterly Survey of Employment and Vacancies, Census and Statistics Department.
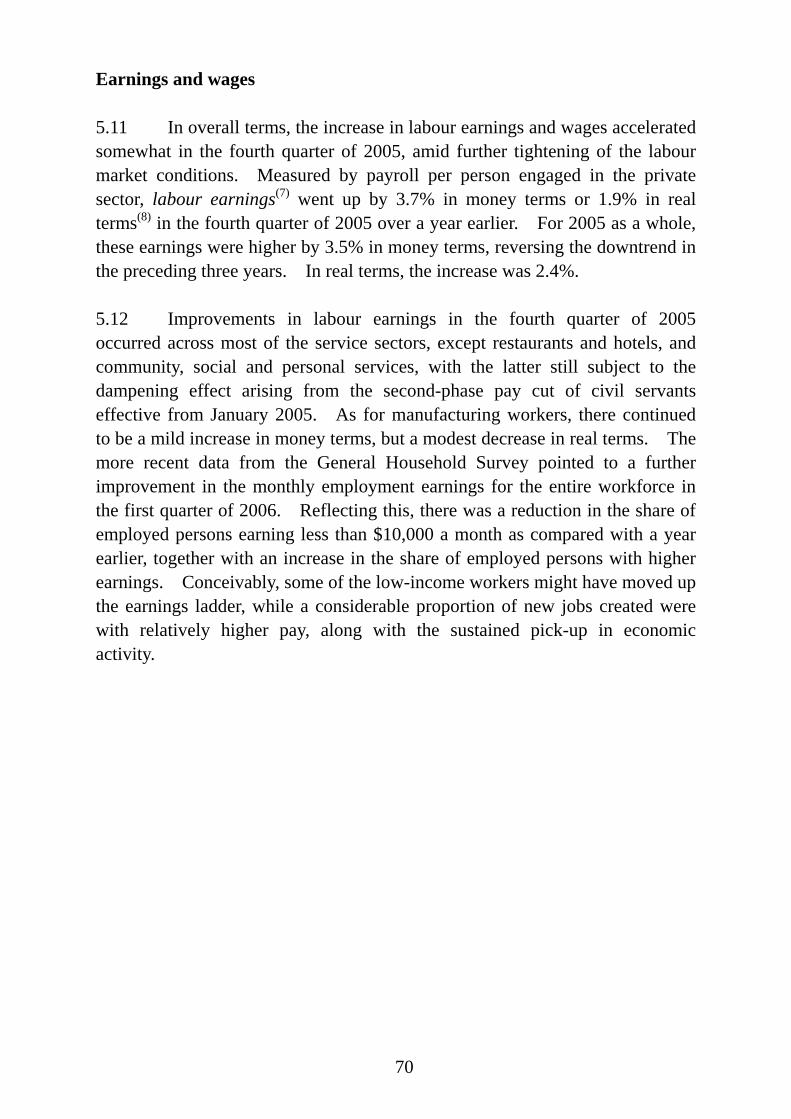
70
Earnings and wages 5.11 In overall terms, the increase in labour earnings and wages accelerated somewhat in the fourth quarter of 2005, amid further tightening of the labour market conditions. Measured by payroll per person engaged in the private sector, labour earnings(7) went up by 3.7% in money terms or 1.9% in real terms(8) in the fourth quarter of 2005 over a year earlier. For 2005 as a whole, these earnings were higher by 3.5% in money terms, reversing the downtrend in the preceding three years. In real terms, the increase was 2.4%. 5.12 Improvements in labour earnings in the fourth quarter of 2005 occurred across most of the service sectors, except restaurants and hotels, and community, social and personal services, with the latter still subject to the dampening effect arising from the second-phase pay cut of civil servants effective from January 2005. As for manufacturing workers, there continued to be a mild increase in money terms, but a modest decrease in real terms. The more recent data from the General Household Survey pointed to a further improvement in the monthly employment earnings for the entire workforce in the first quarter of 2006. Reflecting this, there was a reduction in the share of employed persons earning less than $10,000 a month as compared with a year earlier, together with an increase in the share of employed persons with higher earnings. Conceivably, some of the low-income workers might have moved up the earnings ladder, while a considerable proportion of new jobs created were with relatively higher pay, along with the sustained pick-up in economic activity.
71
Q1 Q3 Q1 Q3 Q1 Q3 Q1 Q3 Q1 Q32001 2002 2003 2004 2005
01234567
-1-2-3-4-5-6
Percent
Q1 Q3 Q1 Q3 Q1 Q3 Q1 Q3 Q1 Q32001 2002 2003 2004 2005
01234567
-1-2-3-4-5-6
Percent
(b) Year-on-year rate of changein real terms
Diagram 5.7 : Labour earnings reverted to increase in 2005 after falling for three years in a row
(a) Year-on-year rate of changein money terms
Manufacturingsector
Service sectorsas a whole
Manufacturingsector
Service sectorsas a whole
5.13 As to labour wages, whilst the trend remained generally upward, the increase was still modest, by 1.4% in money terms in December 2005 over a year earlier. In real terms, there was however a slight decrease of 0.3%. This reflected mainly the difference in coverage of the two sets of labour income data, with wages covering only the regular payments of workers up to the supervisory level. Also contributed was the prevailing tendency among business establishments to reward employees through variable or discretionary pay so as to encourage work incentive and maintain flexibility in managing labour cost. For 2005 as a whole, labour wages went up by 0.8% in money terms, yet down by 0.6% in real terms. 5.14 Analysed by economic sector, nominal wage increases were seen across almost all the major economic sectors, except personal services, in December 2005 over a year earlier. Wages in the manufacturing sector went up notably towards the end of 2005, in tandem with a bounce-back in employment in that sector. But elsewhere, wage increases remained generally modest, conceivably reflecting the still loose manpower resource balance observed for workers engaged in lower-end occupations.

72
Notes : (1) For a person aged 15 or above to be classified as unemployed, he or she should: (a) not
have a job and not be performing any work for pay or profit during the reference period (i.e. seven days before enumeration); and (b) be available for work during the reference period; and (c) be seeking work during the 30 days before enumeration.
Notwithstanding the above, the following types of persons are also considered
unemployed: (a) persons without a job, having sought work but not available for work because of temporary sickness; (b) persons without a job, available for work but not having sought work because they will take up new jobs or start business at a subsequent date, or expect to return to their original jobs; and (c) discouraged workers not having sought work because they believe work is not available to them.
Even at full employment, some frictional unemployment is bound to exist as workers
move between jobs in order to obtain better terms of employment. The precise level of unemployment which can be described as purely frictional varies amongst economies, depending on the structure and characteristics of their labour markets.
In April 2001, the Census and Statistics Department put out a revised series of
seasonally adjusted unemployment rate compiled by reference to the X-11 ARIMA method, which adjusts for all seasonal variations in employment and unemployment (i.e. the changes due to holiday effects, seasonally ups and downs in economic activity, seasonal variations in first-time job-seekers, etc). This replaces the former series which adjusts only for seasonal variations in the proportion of first-time job-seekers in the labour force. For more details, see Note (3) at the end of Chapter 5 of the Half-yearly Economic Report 2001.
(2) The main criteria for an employed person aged 15 or above to be classified as
underemployed are: involuntarily working less than 35 hours during the reference period (i.e. seven days before enumeration), and either available for additional work during the reference period or seeking additional work during the 30 days before enumeration.
Following these criteria, employed persons taking no-pay leave due to slack work
during the reference period are also classified as underemployed if they had worked less than 35 hours or were on leave for the entire reference period.
(3) The employed population refers to those persons aged 15 or above who performed
work for pay or profit or had a formal job attachment during the reference period (i.e. seven days before enumeration).
(4) The labour force, or the economically active population, is defined to include all
persons aged 15 or above who either were engaged in productive work during the reference period (i.e. seven days before enumeration) or would otherwise have been engaged in productive work but were unemployed.
(5) Small and medium-sized enterprises (SMEs) generally refer to those establishments
with the number of persons engaged less than 50. Yet in so far as the manufacturing sector is concerned, establishments with staff strength of 50-99 are also classified as SMEs.
73
(6) Taking into account off-site workers and related professional and support staff, employment in the entire building and construction sector increased, by 0.5% in the first quarter of 2006 over a year earlier.
Employment for the construction sector as a whole is enumerated from the General
Household Survey carried out by the Census and Statistics Department. Apart from site workers, it also includes non-site workers engaged in minor alteration and addition, repair, maintenance and interior decoration work on existing buildings. In addition, it includes professional, administrative and other support personnel engaged in that sector, such as engineers, architects, surveyors and contract managers, as well as general clerical staff.
(7) In addition to wages, which include all regular payments like basic pay and stipulated
bonuses and allowances, earnings also cover overtime pay and other non-guaranteed or irregular bonuses and allowances, except severance pay and long service payment. Because of this difference, as well as the difference in sectoral and occupational coverage, the movements in average earnings, as measured by payroll per person engaged, do not necessarily match closely with those in wage rates.
(8) Different consumer price indices are used for compiling the real indices of labour
earnings and wages, taking into account their relevance to the respective occupation coverage. Specifically, the Composite CPI, being an indicator of overall consumer prices, is taken as the price deflator for earnings received by employees at all levels of the occupational hierarchy. The CPI(A), being an indicator of consumer prices for the middle to lower income groups, is taken as the price deflator for wages in respect of workers on occupations up to the supervisory level, and also in respect of manual workers engaged in the construction sector.
74
CHAPTER 6 : PRICES
Summary • Consumer price inflation remained benign, running at 1.6% in the first
quarter of 2006 by reference to the new 2004/05-based series (or 2.0% by reference to the old 1999/2000-based series). The successive rises in rentals over the past two years have begun to creep into consumer prices to a greater extent. Yet inflationary pressure was mitigated by the concurrent easing in import prices in such key items as food and consumer goods, thanks to a continued fall in the prices of foodstuffs imported from the Mainland as well as the earlier appreciation of the Hong Kong dollar along with the US dollar.
• Despite rising rentals and wages, the cost pressure from these two cost
elements was actually not that significant when viewed against the concurrent surge in business turnover and also the rapid labour productivity growth stemming from machinery and equipment investment. Thus on a unit cost basis, labour cost was still rather flat, although unit rental cost went up further in the first quarter of 2006.
• The GDP deflator, a general indicator of prices of the aggregate economy,
fell back again in the first quarter. But this was entirely due to the renewed slackening in the terms of trade resulting from the fall-off in export prices. Excluding the terms of trade effect, the domestic demand deflator picked up slightly further in tandem with the rise in consumer price inflation.
Consumer prices 6.1 Continuing the rising trend in 2005, consumer price inflation climbed up slightly further in the first quarter of 2006, alongside brisk economic growth. Inflation in terms of the rate of increase in the new 2004/05-based Composite Consumer Price Index (CCPI) was 1.6% in the first quarter of 2006 (or 2.0% by reference to the old 1999/2000-based series. For details of the rebasing, see Box 6.1). The successive rises in rentals over the past two years have begun to creep into consumer prices to a greater extent. Yet inflationary pressure was checked by the concurrent easing in import prices of food and consumer goods, thanks to a continued fall in the food import prices from the Mainland and the earlier appreciation of the Hong Kong dollar, in particular against the Japanese Yen, Pound Sterling and Euro. Cost pressures from rising rentals and wages,
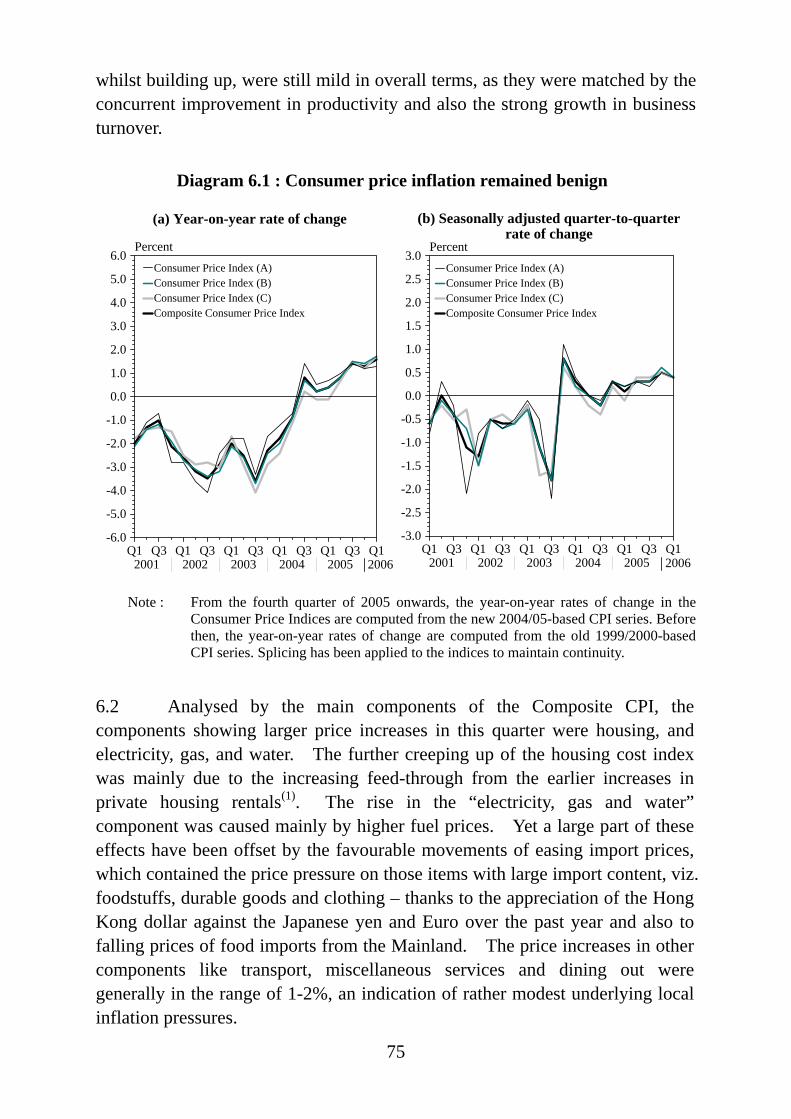
75
whilst building up, were still mild in overall terms, as they were matched by the concurrent improvement in productivity and also the strong growth in business turnover.
Q1 Q3 Q1 Q3 Q1 Q3 Q1 Q3 Q1 Q3 Q12001 2002 2003 2004 2005 2006
0.0
1.0
2.0
3.0
4.0
5.0
6.0
-1.0
-2.0
-3.0
-4.0
-5.0
-6.0
Percent Consumer Price Index (A)Consumer Price Index (B)Consumer Price Index (C)Composite Consumer Price Index
(a) Year-on-year rate of change
Q1 Q3 Q1 Q3 Q1 Q3 Q1 Q3 Q1 Q3 Q12001 2002 2003 2004 2005 2006
0.0
0.5
1.0
1.5
2.0
2.5
3.0
-0.5
-1.0
-1.5
-2.0
-2.5
-3.0
Percent Consumer Price Index (A)Consumer Price Index (B)Consumer Price Index (C)Composite Consumer Price Index
(b) Seasonally adjusted quarter-to-quarter rate of change
Diagram 6.1 : Consumer price inflation remained benign
2006 2006
Note : From the fourth quarter of 2005 onwards, the year-on-year rates of change in the
Consumer Price Indices are computed from the new 2004/05-based CPI series. Before then, the year-on-year rates of change are computed from the old 1999/2000-based CPI series. Splicing has been applied to the indices to maintain continuity.
6.2 Analysed by the main components of the Composite CPI, the components showing larger price increases in this quarter were housing, and electricity, gas, and water. The further creeping up of the housing cost index was mainly due to the increasing feed-through from the earlier increases in private housing rentals(1). The rise in the “electricity, gas and water” component was caused mainly by higher fuel prices. Yet a large part of these effects have been offset by the favourable movements of easing import prices, which contained the price pressure on those items with large import content, viz. foodstuffs, durable goods and clothing – thanks to the appreciation of the Hong Kong dollar against the Japanese yen and Euro over the past year and also to falling prices of food imports from the Mainland. The price increases in other components like transport, miscellaneous services and dining out were generally in the range of 1-2%, an indication of rather modest underlying local inflation pressures.
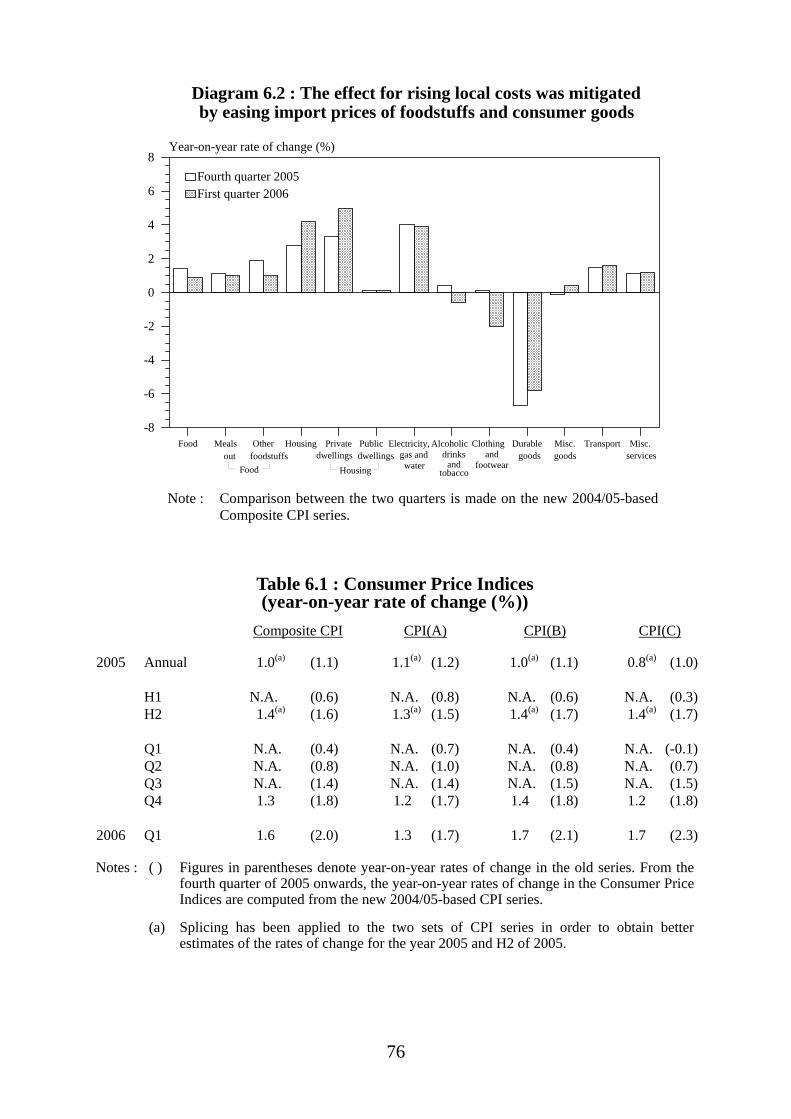
76
Food Meals Other Housing Private Public Electricity, Alcoholic Clothing Durable Misc. Transport Misc.
0
2
4
6
8
-2
-4
-6
-8
Year-on-year rate of change (%)
Fourth quarter 2005First quarter 2006
gas anddwellingsdwellingsout foodstuffs drinks and
tobacco
goodsgoods servicesandfootwearwaterFood Housing
Diagram 6.2 : The effect for rising local costs was mitigated by easing import prices of foodstuffs and consumer goods
Note : Comparison between the two quarters is made on the new 2004/05-based
Composite CPI series.
Table 6.1 : Consumer Price Indices (year-on-year rate of change (%))
Composite CPI CPI(A) CPI(B) CPI(C) 2005 Annual 1.0(a) (1.1) 1.1(a) (1.2) 1.0(a) (1.1) 0.8(a) (1.0) H1 N.A. (0.6) N.A. (0.8) N.A. (0.6) N.A. (0.3) H2 1.4(a) (1.6) 1.3(a) (1.5) 1.4(a) (1.7) 1.4(a) (1.7) Q1 N.A. (0.4) N.A. (0.7) N.A. (0.4) N.A. (-0.1) Q2 N.A. (0.8) N.A. (1.0) N.A. (0.8) N.A. (0.7) Q3 N.A. (1.4) N.A. (1.4) N.A. (1.5) N.A. (1.5) Q4 1.3 (1.8) 1.2 (1.7) 1.4 (1.8) 1.2 (1.8) 2006 Q1 1.6 (2.0) 1.3 (1.7) 1.7 (2.1) 1.7 (2.3) Notes : ( ) Figures in parentheses denote year-on-year rates of change in the old series. From the
fourth quarter of 2005 onwards, the year-on-year rates of change in the Consumer Price Indices are computed from the new 2004/05-based CPI series.
(a) Splicing has been applied to the two sets of CPI series in order to obtain better
estimates of the rates of change for the year 2005 and H2 of 2005.
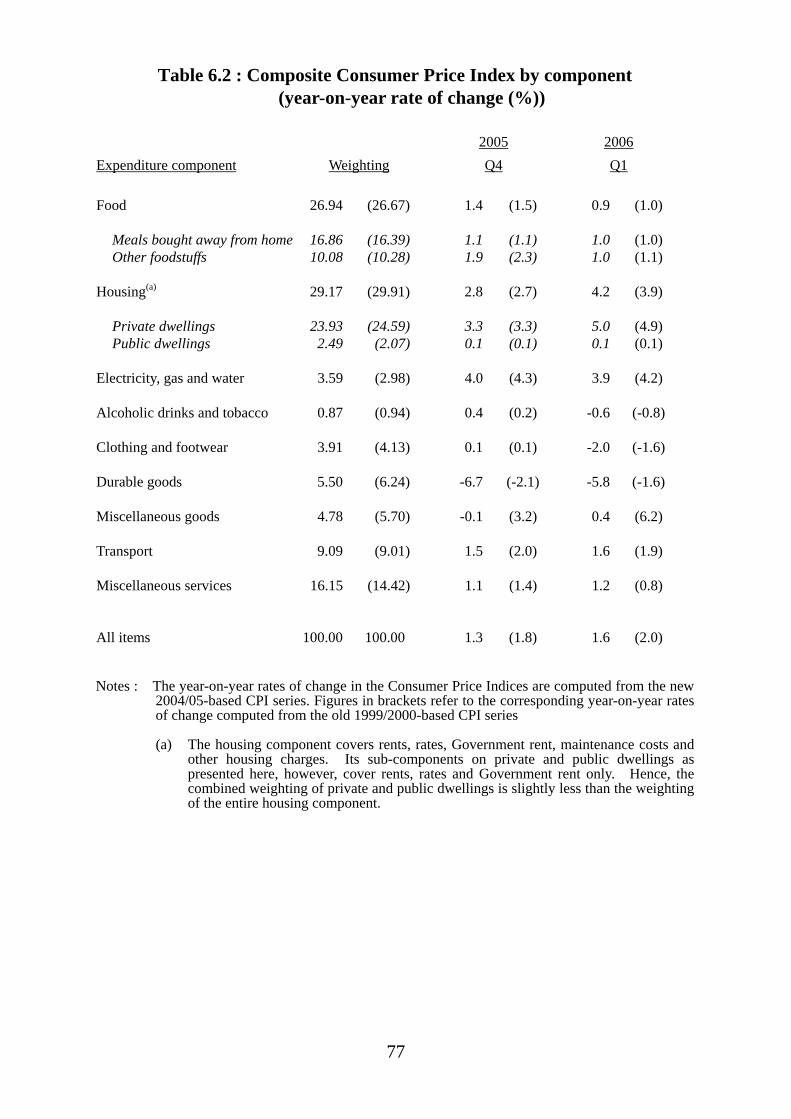
77
Table 6.2 : Composite Consumer Price Index by component (year-on-year rate of change (%))
2005 2006 Expenditure component Weighting Q4 Q1 Food 26.94 (26.67) 1.4 (1.5) 0.9 (1.0) Meals bought away from home 16.86 (16.39) 1.1 (1.1) 1.0 (1.0) Other foodstuffs 10.08 (10.28) 1.9 (2.3) 1.0 (1.1) Housing(a) 29.17 (29.91) 2.8 (2.7) 4.2 (3.9) Private dwellings 23.93 (24.59) 3.3 (3.3) 5.0 (4.9) Public dwellings 2.49 (2.07) 0.1 (0.1) 0.1 (0.1) Electricity, gas and water 3.59 (2.98) 4.0 (4.3) 3.9 (4.2) Alcoholic drinks and tobacco 0.87 (0.94) 0.4 (0.2) -0.6 (-0.8) Clothing and footwear 3.91 (4.13) 0.1 (0.1) -2.0 (-1.6) Durable goods 5.50 (6.24) -6.7 (-2.1) -5.8 (-1.6) Miscellaneous goods 4.78 (5.70) -0.1 (3.2) 0.4 (6.2) Transport 9.09 (9.01) 1.5 (2.0) 1.6 (1.9) Miscellaneous services 16.15 (14.42) 1.1 (1.4) 1.2 (0.8) All items 100.00 100.00 1.3 (1.8) 1.6 (2.0)
Notes : The year-on-year rates of change in the Consumer Price Indices are computed from the new 2004/05-based CPI series. Figures in brackets refer to the corresponding year-on-year rates of change computed from the old 1999/2000-based CPI series
(a) The housing component covers rents, rates, Government rent, maintenance costs and
other housing charges. Its sub-components on private and public dwellings as presented here, however, cover rents, rates and Government rent only. Hence, the combined weighting of private and public dwellings is slightly less than the weighting of the entire housing component.
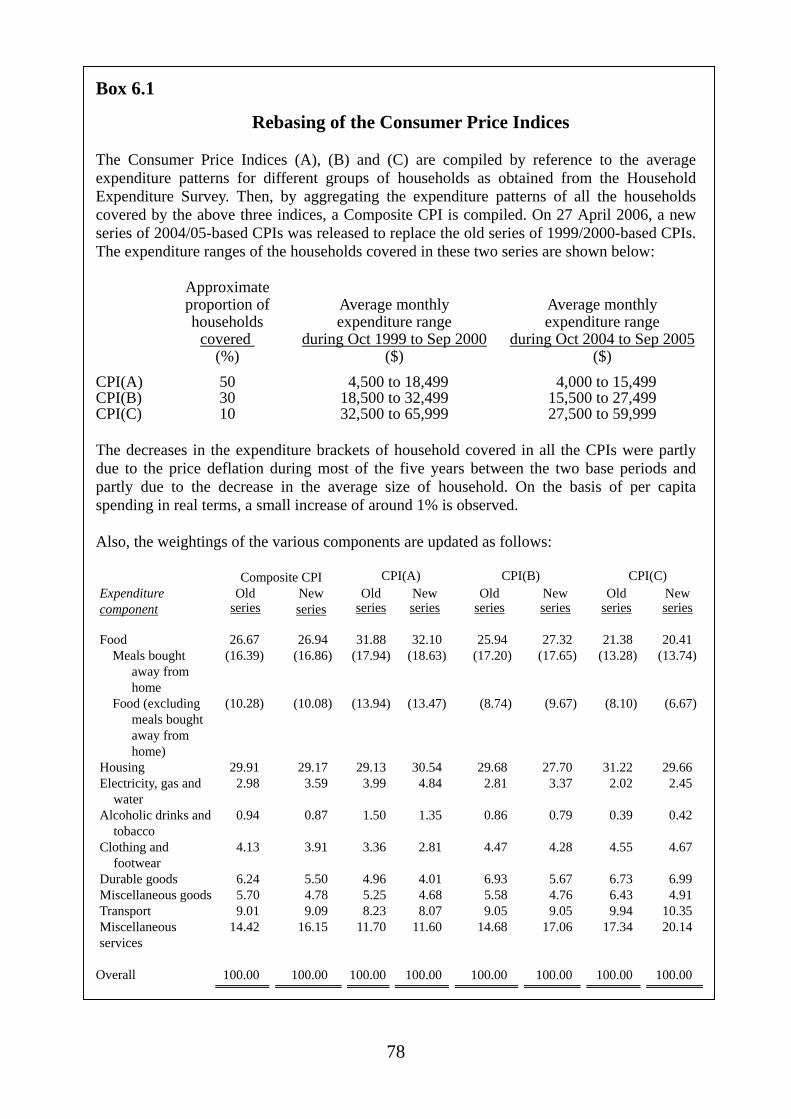
78
Box 6.1
Rebasing of the Consumer Price Indices The Consumer Price Indices (A), (B) and (C) are compiled by reference to the average expenditure patterns for different groups of households as obtained from the Household Expenditure Survey. Then, by aggregating the expenditure patterns of all the households covered by the above three indices, a Composite CPI is compiled. On 27 April 2006, a new series of 2004/05-based CPIs was released to replace the old series of 1999/2000-based CPIs. The expenditure ranges of the households covered in these two series are shown below:
Approximate proportion of households
covered
Average monthly expenditure range
during Oct 1999 to Sep 2000
Average monthly expenditure range
during Oct 2004 to Sep 2005 (%) ($) ($) CPI(A) 50 4,500 to 18,499 4,000 to 15,499 CPI(B) 30 18,500 to 32,499 15,500 to 27,499 CPI(C) 10 32,500 to 65,999 27,500 to 59,999 The decreases in the expenditure brackets of household covered in all the CPIs were partly due to the price deflation during most of the five years between the two base periods and partly due to the decrease in the average size of household. On the basis of per capita spending in real terms, a small increase of around 1% is observed. Also, the weightings of the various components are updated as follows: Composite CPI CPI(A) CPI(B) CPI(C) Expenditure component
Old series
New series
Old series
New series
Old series
New series
Old series
New series
Food 26.67 26.94 31.88 32.10 25.94 27.32 21.38 20.41 Meals bought
away from home
(16.39) (16.86) (17.94) (18.63) (17.20) (17.65) (13.28) (13.74)
Food (excluding meals bought away from home)
(10.28) (10.08) (13.94) (13.47) (8.74) (9.67) (8.10) (6.67)
Housing 29.91 29.17 29.13 30.54 29.68 27.70 31.22 29.66 Electricity, gas and
water 2.98 3.59 3.99 4.84 2.81 3.37 2.02 2.45
Alcoholic drinks and tobacco
0.94 0.87 1.50 1.35 0.86 0.79 0.39 0.42
Clothing and footwear
4.13 3.91 3.36 2.81 4.47 4.28 4.55 4.67
Durable goods 6.24 5.50 4.96 4.01 6.93 5.67 6.73 6.99 Miscellaneous goods 5.70 4.78 5.25 4.68 5.58 4.76 6.43 4.91 Transport 9.01 9.09 8.23 8.07 9.05 9.05 9.94 10.35 Miscellaneous services
14.42 16.15 11.70 11.60 14.68 17.06 17.34 20.14
Overall 100.00 100.00 100.00 100.00 100.00 100.00 100.00 100.00

79
Box 6.1 (cont’d) The weightings are updated every five years so that the substitution effects of changes in prices over that five-year period can be taken into account in the new CPI series. Due to such substitution effect, CPIs based on consumption patterns fixed with reference to a base year tend to over-estimate price increases or under-estimate price decreases over time, a well-known characteristic of the Laspeyres’ type of consumer price index (i.e. fixed weight index). This explains the fact that the year-on-year rates of increase in monthly CPIs from the 2004/05-based CPI series are in general smaller than those from the 1999/2000-based series (Table 6.1), as households tend to buy more of the goods or services with relatively smaller price increases and less of those with larger price increases. Compared with five years ago, households spent a greater share of their expenditure on gadgets such as mobile phone, digital MP3 player/recorder, digital camera and electrical massage equipment, the prices of which have been falling. The effect of this change in spending pattern was to lower the rate of change in the overall CPI. While the magnitudes of the year-on-year changes in the 2004/05-based and 1999/2000-based CPIs are somewhat different, the general trend of a gradual pick-up in the inflation rate from the fourth quarter of 2005 to the first quarter of 2006 is observed in all the four new CPI series, as in the old ones. Costs of factor inputs 6.3 In tandem with the brisk expansion of economic activity, the cost pressure from the local front was naturally building up, as evidenced from the rise-back in both unit labour and unit rental cost over the past few quarters. Yet the build-up of such cost pressure has been far more modest than can be expected by reference to the experience in the previous cycles, especially when viewed against the current rapid pace of activity expansion. Conceivably, price pressures have been kept in check by the concurrent improvement in factor productivity, as well as by capacity expansion on the back of surging machinery and equipment investment. Also relevant were the forces of globalisation which have led to a global-wide dis-inflation process over the past few years, and also the availability of ample production capacity in the Mainland, both conducive to lower inflation in the Hong Kong economy. 6.4 The cost pressures from the external front were likewise modest, save for the further pick-up in imported fuel price. In overall terms, the external cost element actually played a role in keeping CCPI inflation at bay in the first quarter. This can be seen from the continued fall-off in the prices of imports of foodstuffs and the slower increase in the prices of imports of consumer goods,
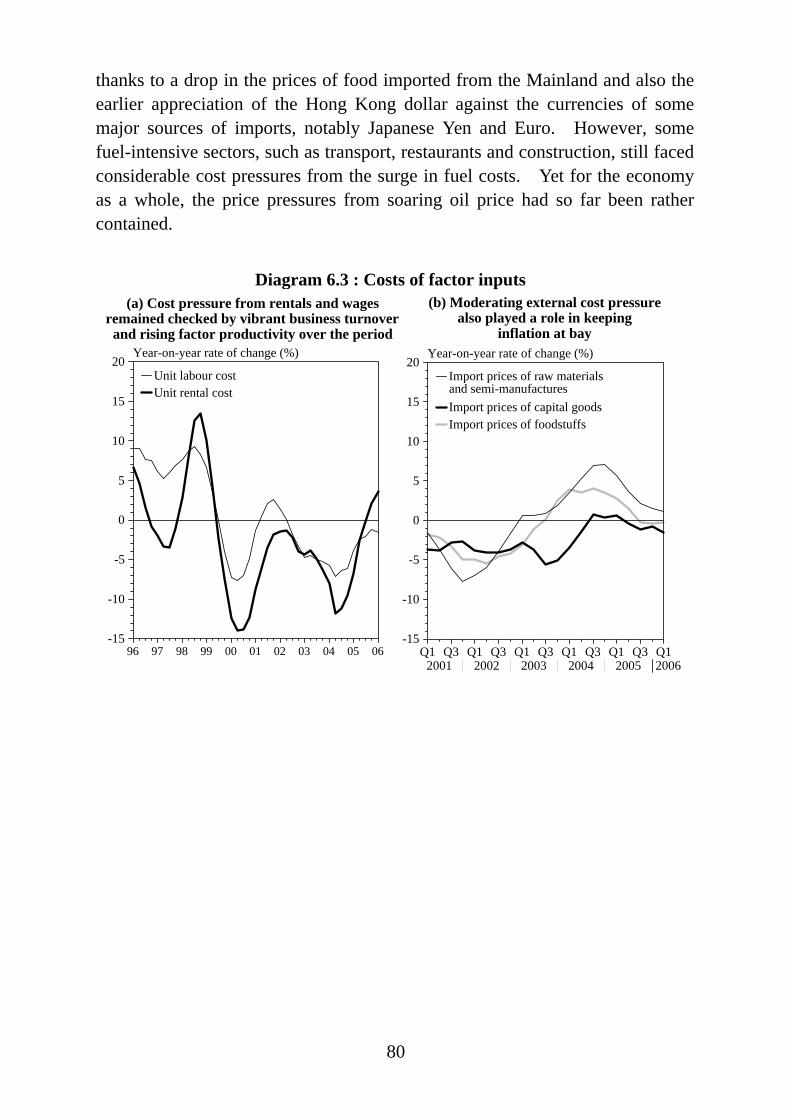
80
thanks to a drop in the prices of food imported from the Mainland and also the earlier appreciation of the Hong Kong dollar against the currencies of some major sources of imports, notably Japanese Yen and Euro. However, some fuel-intensive sectors, such as transport, restaurants and construction, still faced considerable cost pressures from the surge in fuel costs. Yet for the economy as a whole, the price pressures from soaring oil price had so far been rather contained.
(a) Cost pressure from rentals and wages remained checked by vibrant business turnover and rising factor productivity over the period
(b) Moderating external cost pressure also played a role in keeping
inflation at bay
Q1 Q3 Q1 Q3 Q1 Q3 Q1 Q3 Q1 Q3 Q12001 2002 2003 2004 2005 2006
0
5
10
15
20
-5
-10
-15
Year-on-year rate of change (%)
Import prices of raw materials Import prices of capital goods Import prices of foodstuffs
Diagram 6.3 : Costs of factor inputs
and semi-manufactures
96 97 98 99 00 01 02 03 04 05 06
0
5
10
15
20
-5
-10
-15
Year-on-year rate of change (%)
Unit labour cost Unit rental cost
2006
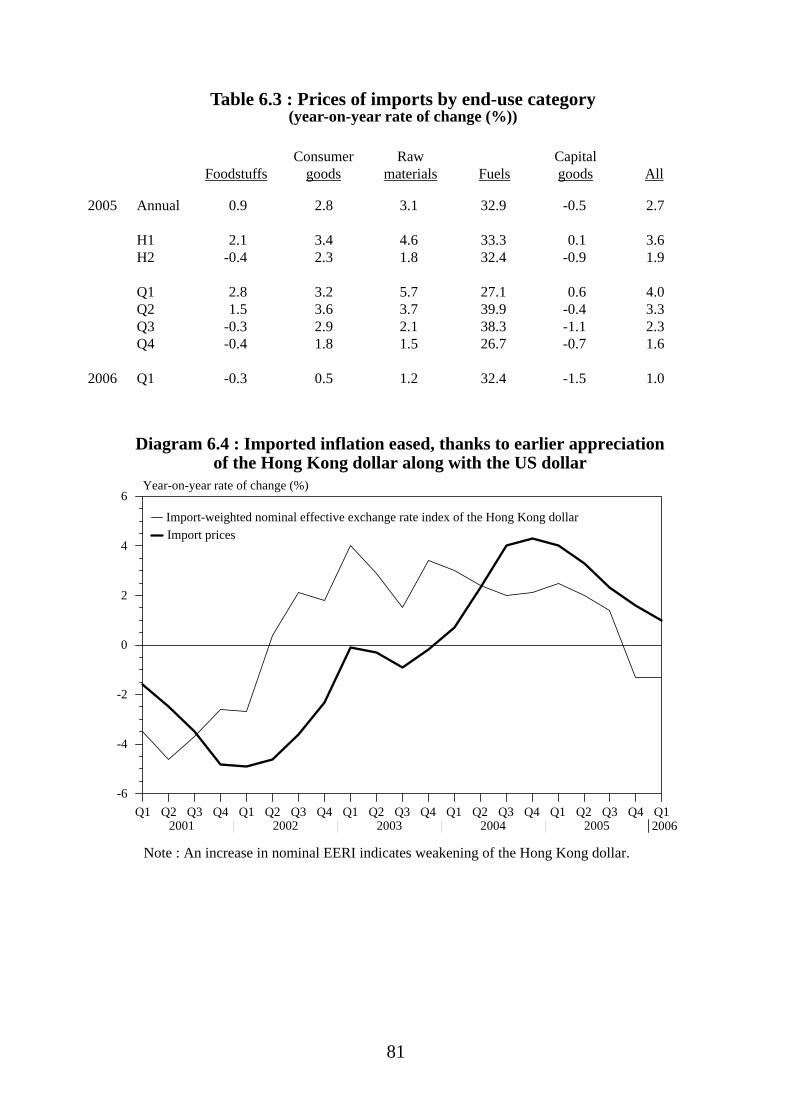
81
Table 6.3 : Prices of imports by end-use category
(year-on-year rate of change (%))
Foodstuffs
Consumer goods
Raw materials
Fuels
Capital goods
All
2005 Annual 0.9 2.8 3.1 32.9 -0.5 2.7
H1 2.1 3.4 4.6 33.3 0.1 3.6 H2 -0.4 2.3 1.8 32.4 -0.9 1.9
Q1 2.8 3.2 5.7 27.1 0.6 4.0 Q2 1.5 3.6 3.7 39.9 -0.4 3.3 Q3 -0.3 2.9 2.1 38.3 -1.1 2.3 Q4 -0.4 1.8 1.5 26.7 -0.7 1.6
2006 Q1 -0.3 0.5 1.2 32.4 -1.5 1.0
Q1 Q2 Q3 Q4 Q1 Q2 Q3 Q4 Q1 Q2 Q3 Q4 Q1 Q2 Q3 Q4 Q1 Q2 Q3 Q4 Q12001 2002 2003 2004 2005 2006
0
2
4
6
-2
-4
-6
Year-on-year rate of change (%)
Import prices
Import-weighted nominal effective exchange rate index of the Hong Kong dollar
Diagram 6.4 : Imported inflation eased, thanks to earlier appreciation of the Hong Kong dollar along with the US dollar
Import prices
2006
Note : An increase in nominal EERI indicates weakening of the Hong Kong dollar.
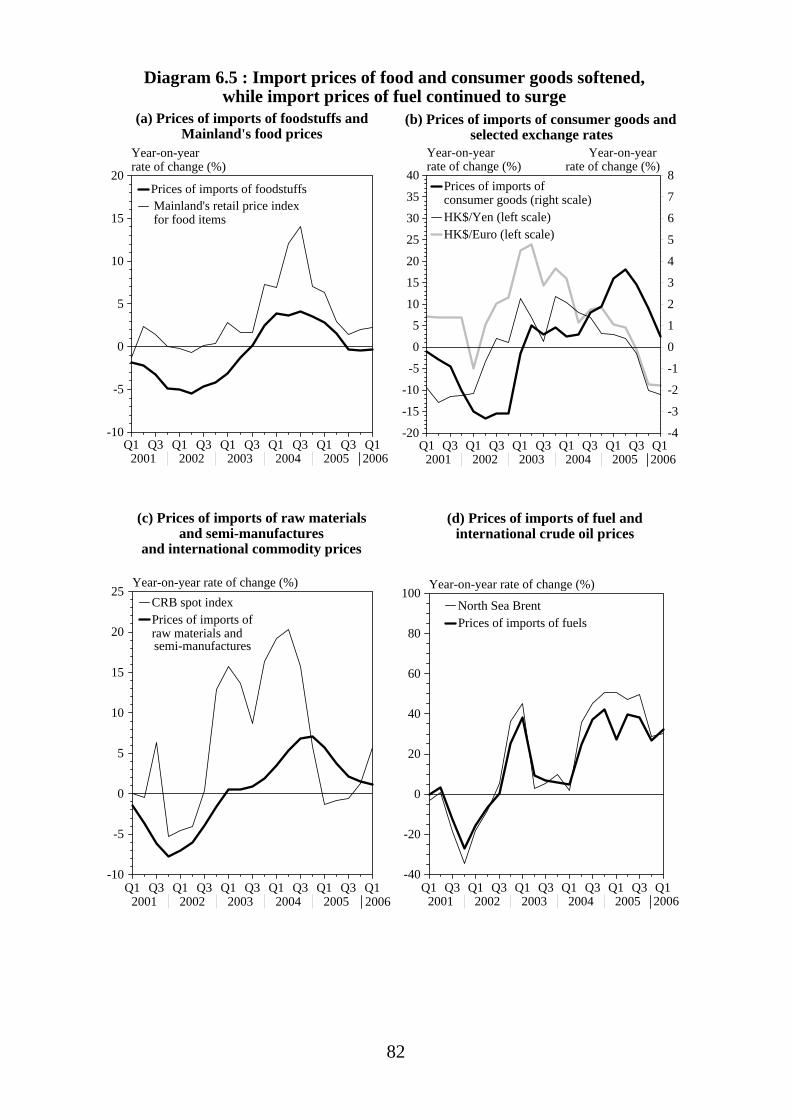
82
(a) Prices of imports of foodstuffs andMainland's food prices
Q1 Q3 Q1 Q3 Q1 Q3 Q1 Q3 Q1 Q3 Q12001 2002 2003 2004 2005 2006
0
5
10
15
20
-5
-10
Year-on-yearrate of change (%)
Prices of imports of foodstuffs
(b) Prices of imports of consumer goods and selected exchange rates
Q1 Q3 Q1 Q3 Q1 Q3 Q1 Q3 Q1 Q3 Q12001 2002 2003 2004 2005 2006
0
5
10
15
20
25
30
35
40
-5
-10
-15
-20
Year-on-year rate of change (%)
0
1
2
3
4
5
6
7
8
-1
-2
-3
-4
Year-on-year rate of change (%)
Prices of imports of consumer goods (right scale) HK$/Yen (left scale) HK$/Euro (left scale)
Diagram 6.5 : Import prices of food and consumer goods softened, while import prices of fuel continued to surge
Mainland's retail price index for food items
2006 2006
(c) Prices of imports of raw materialsand semi-manufactures
and international commodity prices
Q1 Q3 Q1 Q3 Q1 Q3 Q1 Q3 Q1 Q3 Q12001 2002 2003 2004 2005 2006
0
5
10
15
20
25
-5
-10
Year-on-year rate of change (%) CRB spot index Prices of imports of raw materials and
(d) Prices of imports of fuel and international crude oil prices
Q1 Q3 Q1 Q3 Q1 Q3 Q1 Q3 Q1 Q3 Q12001 2002 2003 2004 2005 2006
0
20
40
60
80
100
-20
-40
Year-on-year rate of change (%)
North Sea Brent Prices of imports of fuels
semi-manufactures
2006 2006
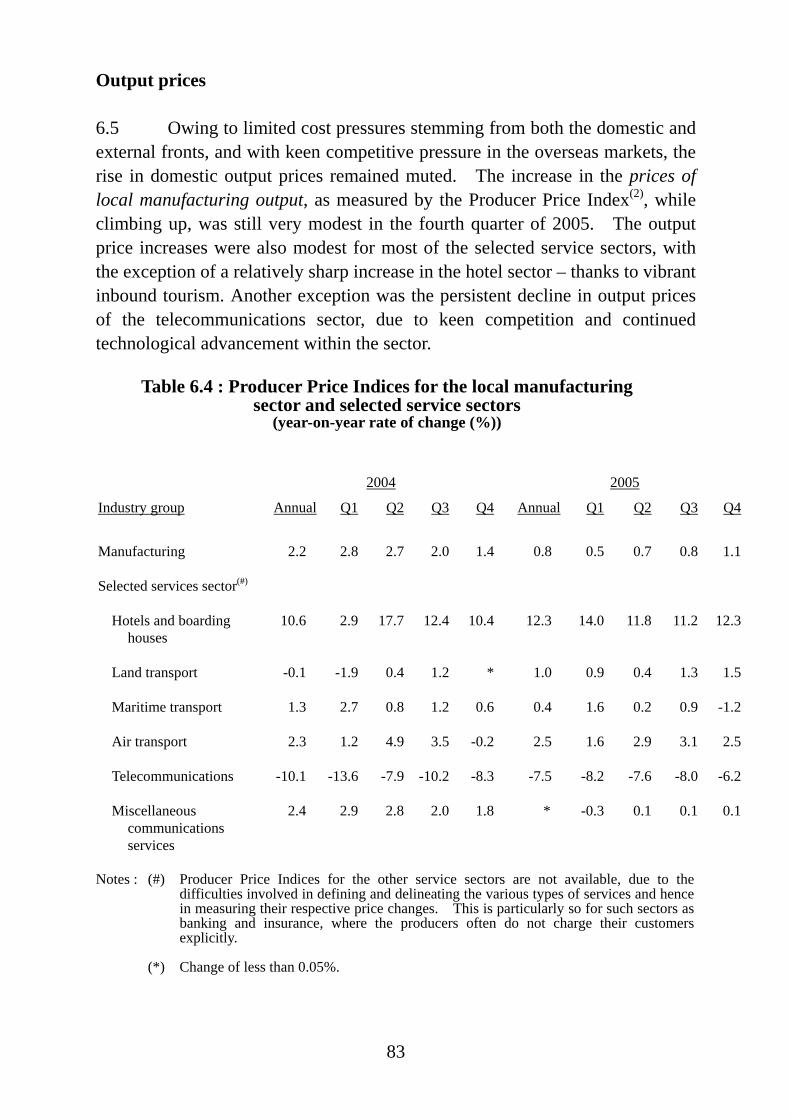
83
Output prices 6.5 Owing to limited cost pressures stemming from both the domestic and external fronts, and with keen competitive pressure in the overseas markets, the rise in domestic output prices remained muted. The increase in the prices of local manufacturing output, as measured by the Producer Price Index(2), while climbing up, was still very modest in the fourth quarter of 2005. The output price increases were also modest for most of the selected service sectors, with the exception of a relatively sharp increase in the hotel sector – thanks to vibrant inbound tourism. Another exception was the persistent decline in output prices of the telecommunications sector, due to keen competition and continued technological advancement within the sector.
Table 6.4 : Producer Price Indices for the local manufacturing sector and selected service sectors
(year-on-year rate of change (%))
2004 2005
Industry group Annual Q1 Q2 Q3 Q4 Annual Q1 Q2 Q3 Q4
Manufacturing 2.2 2.8 2.7 2.0 1.4 0.8 0.5 0.7 0.8 1.1 Selected services sector(#)
Hotels and boarding houses
10.6 2.9 17.7 12.4 10.4 12.3 14.0 11.8 11.2 12.3
Land transport -0.1 -1.9 0.4 1.2 * 1.0 0.9 0.4 1.3 1.5 Maritime transport 1.3 2.7 0.8 1.2 0.6 0.4 1.6 0.2 0.9 -1.2 Air transport 2.3 1.2 4.9 3.5 -0.2 2.5 1.6 2.9 3.1 2.5 Telecommunications -10.1 -13.6 -7.9 -10.2 -8.3 -7.5 -8.2 -7.6 -8.0 -6.2 Miscellaneous
communications services
2.4 2.9 2.8 2.0 1.8 * -0.3 0.1 0.1 0.1
Notes : (#) Producer Price Indices for the other service sectors are not available, due to the
difficulties involved in defining and delineating the various types of services and hence in measuring their respective price changes. This is particularly so for such sectors as banking and insurance, where the producers often do not charge their customers explicitly.
(*) Change of less than 0.05%.
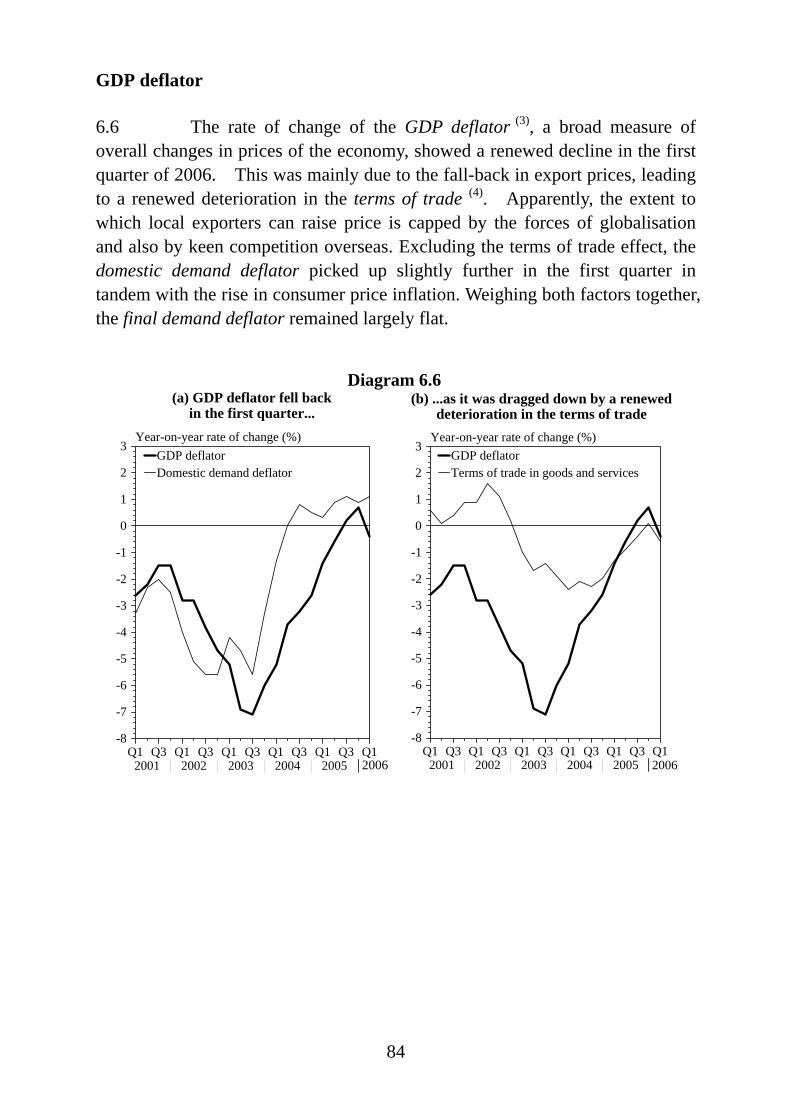
84
GDP deflator 6.6 The rate of change of the GDP deflator (3), a broad measure of overall changes in prices of the economy, showed a renewed decline in the first quarter of 2006. This was mainly due to the fall-back in export prices, leading to a renewed deterioration in the terms of trade (4). Apparently, the extent to which local exporters can raise price is capped by the forces of globalisation and also by keen competition overseas. Excluding the terms of trade effect, the domestic demand deflator picked up slightly further in the first quarter in tandem with the rise in consumer price inflation. Weighing both factors together, the final demand deflator remained largely flat.
Q1 Q3 Q1 Q3 Q1 Q3 Q1 Q3 Q1 Q3 Q12001 2002 2003 2004 2005 2006
0
1
2
3
-1
-2
-3
-4
-5
-6
-7
-8
Year-on-year rate of change (%)GDP deflatorDomestic demand deflator
Q1 Q3 Q1 Q3 Q1 Q3 Q1 Q3 Q1 Q3 Q12001 2002 2003 2004 2005 2006
0
1
2
3
-1
-2
-3
-4
-5
-6
-7
-8
Year-on-year rate of change (%)GDP deflatorTerms of trade in goods and services
(a) GDP deflator fell back in the first quarter...
(b) ...as it was dragged down by a renewed deterioration in the terms of trade
Diagram 6.6
2006 2006

85
Table 6.5 : GDP deflator and the main expenditure component deflators
(year-on-year rate of change (%)) 2005 2006 Annual# Q1# Q2# Q3# Q4# Q1+
Private consumption expenditure 1.4 0.4 1.4 1.5 2.2 1.8 Government consumption expenditure -1.6 -1.8 -1.6 -1.7 -1.4 1.1 Gross domestic fixed capital formation
0.9 2.3 1.8 1.3 -1.7 -1.2
Total exports of goods -0.1 1.3 0.4 -0.2 -1.3 -1.8 Imports of goods 1.3 2.9 1.8 0.8 * * Exports of services 3.5 2.6 2.9 3.2 5.2 3.9 Imports of services 0.9 2.0 1.7 0.9 -0.7 * Gross Domestic Product -0.2 -1.4 -0.6 0.2 0.7 -0.4 <0.1> <0.2> <*> <0.5> <-1.2> Total final demand 0.8 1.2 0.9 0.5 0.2 * Domestic demand 0.8 0.3 0.9 1.1 0.9 1.1 Notes : (#) Revised figures. (+) Preliminary figures. < > Seasonally adjusted quarter-to-quarter % change. (*) Change of less than 0.05%.

86
Notes : (1) It should be noted that, in any particular period, only a small proportion of the
tenancies of private dwellings are new lettings for which rentals are freshly determined, and lease renewals upon which rentals are revised. The majority of the tenancies are existing leases with rentals fixed until their expiry. Upon aggregation, the movements in private housing cost thus tend to be less responsive than the corresponding movements in market rentals, as reflected in the rental index for private residential flats compiled by the Rating and Valuation Department (RVD). According to RVD, rentals for new lettings rose further by an average of 8.8% year-on-year in the first quarter of 2006, after an average of 11.3% increase in 2005.
(2) The Producer Price Index is designed to reflect changes in the prices of goods and
services received by local producers. Producer prices refer to the transacted prices, net of any discounts or rebates allowed to the buyers. Transportation and other incidental charges are not included.
(3) The implicit price deflators of GDP and its main expenditure components are derived
by dividing GDP at current prices by the corresponding constant price figures. The rate of change in the GDP deflator may differ substantially from that in the Composite CPI over the same time span. The Composite CPI covers consumer price inflation in particular. Yet the GDP deflator is a much broader measure of inflation for the entire economy, and takes into account all the price changes related to consumption, investment, exports and imports. Also, the rate of change in the GDP deflator may differ appreciably from that in the total final demand deflator, depending on the movement in the prices of final demand and imports. Likewise, the rate of change in the GDP deflator may differ appreciably from that in the domestic demand deflator, depending on the movement in the prices of imports and exports.
(4) The terms of trade is defined as the ratio of the prices of total exports to the prices of
total imports.
Table Page
1. Gross Domestic Product by expenditure component (at current market prices) 88-89
2. Rates of change in Gross Domestic Product by expenditure component (in real terms) 90-91
3. Gross Domestic Product by economic activity (at current prices) 92
4. Rates of change in Gross Domestic Product by economic activity (in real terms) 93
5. Balance of payments account by major component (at current prices) 94
6. 95
7. Total exports of goods by market (in value terms) 96
8. Imports of goods by source (in value terms) 97
9. Retained imports of goods by end-use category (in value terms) 97
10. Exports and imports of services by component (at current market prices) 98
11. Incoming visitors by source 99
12. Property market 100-101
13. 102-103
14. Monetary aggregates 104-105
15. Rates of change in business receipts indices for service industries/domains 106
16. Labour force characteristics 107
17. Employment in selected major economic sectors 108
18. Number of workers engaged at building and construction sites 109
19. Average labour earnings by major economic sector 110
20. Rates of change in wage indices by selected major economic sector 111
21. Rates of change in prices 112-113
22. Rates of change in Composite Consumer Price Index 114-115
23 116-117
Visible and invisible trade (at current market prices)
Rates of change in implicit price deflators of GDP andits main expenditure components
Statistical Appendix
Property prices and rentals
87

($Mn)
1996 1997 1998 1999 2000
755,508 833,825 795,948 765,282 774,280expenditure
103,541 112,751 116,550 119,993 120,172expenditure
378,486 451,891 388,731 325,328 347,375
185,648 223,264 208,235 171,930 155,441170,652 190,760 165,177 141,349 180,204
computer software
Changes in inventories 9,762 12,313 -15,651 -10,612 14,399
Total exports of goods 1,397,917 1,455,949 1,347,649 1,349,000 1,572,689
Domestic exports 212,160 211,410 188,454 170,600 180,967Re-exports 1,185,758 1,244,539 1,159,195 1,178,400 1,391,722
Imports of goods 1,511,365 1,589,876 1,408,317 1,373,500 1,636,711
Exports of services 285,385 286,595 262,099 276,385 315,012
Imports of services 189,753 198,424 194,245 185,174 192,427
GDP 1,229,481 1,365,024 1,292,764 1,266,702 1,314,789
Per capita GDP ($) 191,047 210,350 197,559 191,736 197,268
GNP 1,218,405 1,363,409 1,317,362 1,291,470 1,323,543
Per capita GNP ($) 189,326 210,101 201,318 195,485 198,581
Total final demand 2,930,599 3,153,324 2,895,326 2,825,376 3,143,927
Total final demand 1,949,977 2,130,313 1,952,900 1,886,191 2,045,858excluding re-exports(a)
Domestic demand 1,247,297 1,410,780 1,285,578 1,199,991 1,256,226Private 1,078,661 1,233,803 1,107,816 1,014,347 1,075,654Public 168,636 176,977 177,762 185,644 180,572
External demand 1,683,302 1,742,544 1,609,748 1,625,385 1,887,701
Definitions of Terms :
=
=
=
Domestic demand =
External demand =
Table 1 : Gross Domestic Product by expenditure component(at current market prices)
Private consumption
Building and construction
of which:
Government consumption
Gross domestic fixedcapital formation
Machinery, equipment and
total exports of goods + exports of services
Total final demand
Private sector domestic demand
Public sector domestic demand
private consumption expenditure + government consumption expenditure + grossdomestic fixed capital formation + changes in inventories + total exports of goods +exports of services
private consumption expenditure + gross domestic fixed capital formation by theprivate sector + changes in inventories
government consumption expenditure + gross domestic fixed capital formation by thepublic sector
private sector domestic demand + public sector domestic demand
88
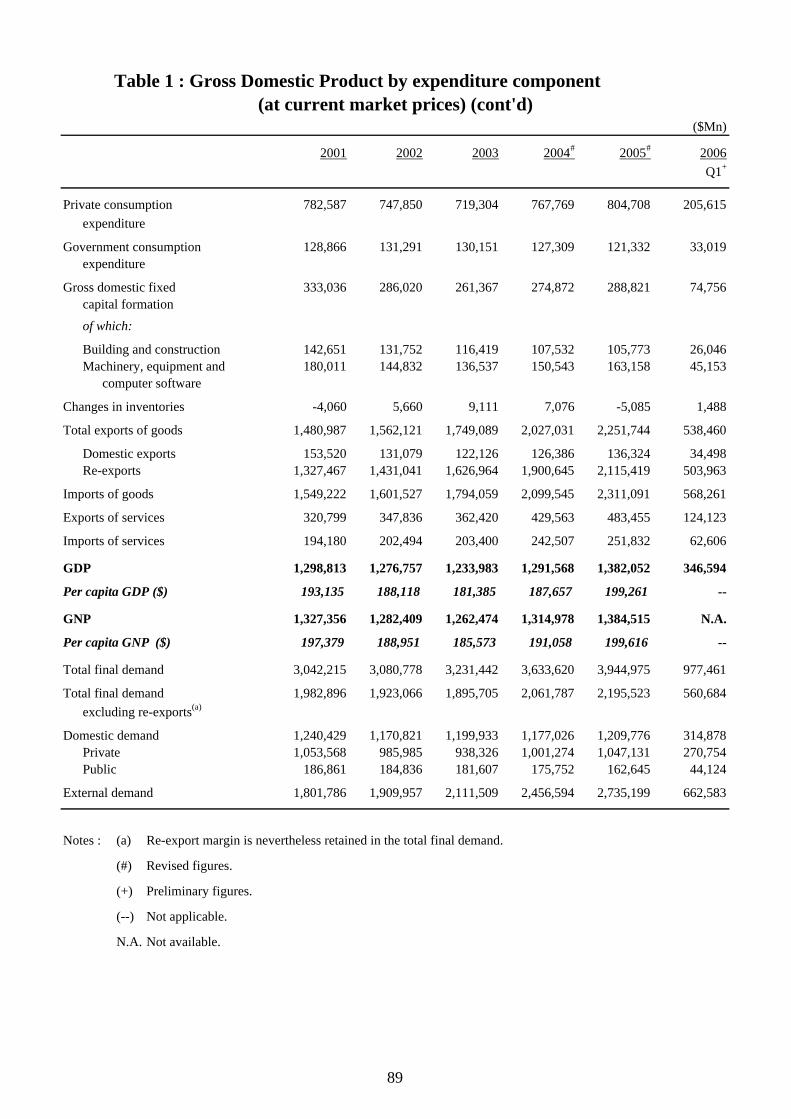
($Mn)
2001 2002 2003 2004# 2005# 2006Q1+
782,587 747,850 719,304 767,769 804,708 205,615expenditure
128,866 131,291 130,151 127,309 121,332 33,019expenditure
333,036 286,020 261,367 274,872 288,821 74,756
142,651 131,752 116,419 107,532 105,773 26,046180,011 144,832 136,537 150,543 163,158 45,153
computer software
Changes in inventories -4,060 5,660 9,111 7,076 -5,085 1,488
Total exports of goods 1,480,987 1,562,121 1,749,089 2,027,031 2,251,744 538,460
Domestic exports 153,520 131,079 122,126 126,386 136,324 34,498Re-exports 1,327,467 1,431,041 1,626,964 1,900,645 2,115,419 503,963
Imports of goods 1,549,222 1,601,527 1,794,059 2,099,545 2,311,091 568,261
Exports of services 320,799 347,836 362,420 429,563 483,455 124,123
Imports of services 194,180 202,494 203,400 242,507 251,832 62,606
GDP 1,298,813 1,276,757 1,233,983 1,291,568 1,382,052 346,594
Per capita GDP ($) 193,135 188,118 181,385 187,657 199,261 --
GNP 1,327,356 1,282,409 1,262,474 1,314,978 1,384,515 N.A.
Per capita GNP ($) 197,379 188,951 185,573 191,058 199,616 --
Total final demand 3,042,215 3,080,778 3,231,442 3,633,620 3,944,975 977,461
Total final demand 1,982,896 1,923,066 1,895,705 2,061,787 2,195,523 560,684excluding re-exports(a)
Domestic demand 1,240,429 1,170,821 1,199,933 1,177,026 1,209,776 314,878Private 1,053,568 985,985 938,326 1,001,274 1,047,131 270,754Public 186,861 184,836 181,607 175,752 162,645 44,124
External demand 1,801,786 1,909,957 2,111,509 2,456,594 2,735,199 662,583
(a) Re-export margin is nevertheless retained in the total final demand.
(#)
(+)
(--) Not applicable.
N.A. Not available.
of which:
Gross domestic fixedcapital formation
Preliminary figures.
Building and constructionMachinery, equipment and
Notes :
Revised figures.
Private consumption
Government consumption
Table 1 : Gross Domestic Product by expenditure component(at current market prices) (cont'd)
89
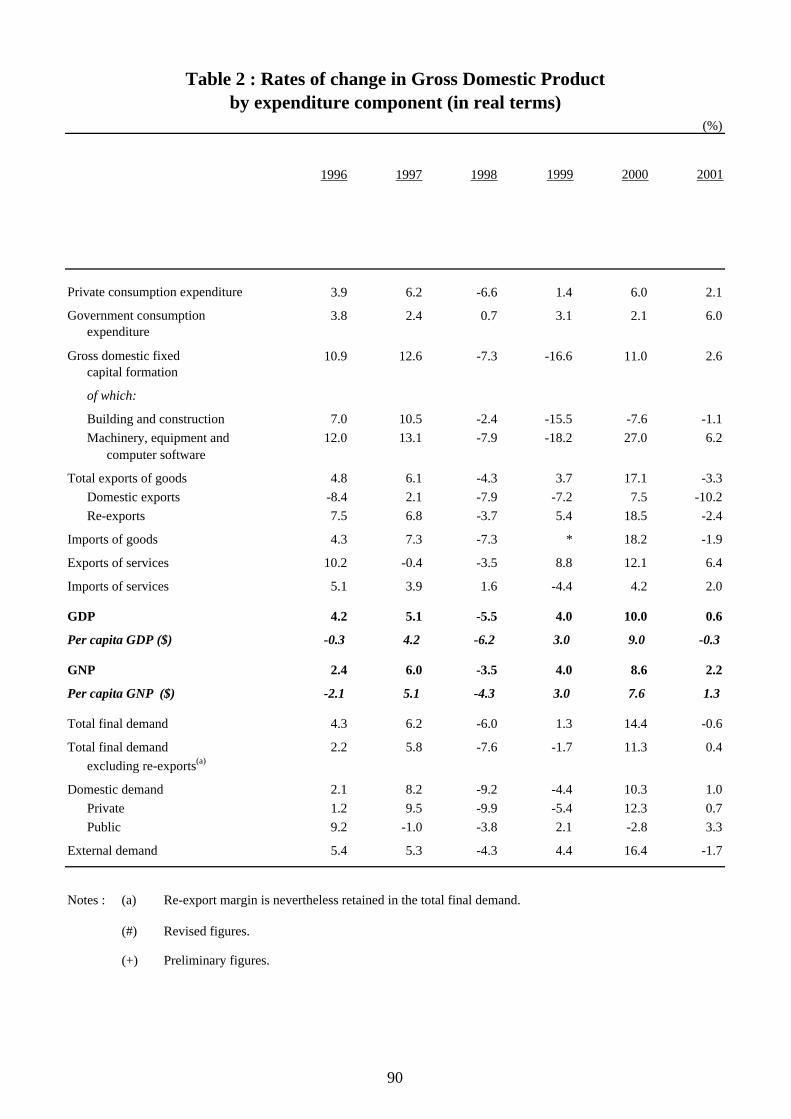
(%)
1996 1997 1998 1999 2000 2001
3.9 6.2 -6.6 1.4 6.0 2.1
3.8 2.4 0.7 3.1 2.1 6.0expenditure
10.9 12.6 -7.3 -16.6 11.0 2.6
7.0 10.5 -2.4 -15.5 -7.6 -1.112.0 13.1 -7.9 -18.2 27.0 6.2
computer software
Total exports of goods 4.8 6.1 -4.3 3.7 17.1 -3.3Domestic exports -8.4 2.1 -7.9 -7.2 7.5 -10.2Re-exports 7.5 6.8 -3.7 5.4 18.5 -2.4
Imports of goods 4.3 7.3 -7.3 * 18.2 -1.9
Exports of services 10.2 -0.4 -3.5 8.8 12.1 6.4
Imports of services 5.1 3.9 1.6 -4.4 4.2 2.0
GDP 4.2 5.1 -5.5 4.0 10.0 0.6
Per capita GDP ($) -0.3 4.2 -6.2 3.0 9.0 -0.3
GNP 2.4 6.0 -3.5 4.0 8.6 2.2
Per capita GNP ($) -2.1 5.1 -4.3 3.0 7.6 1.3
Total final demand 4.3 6.2 -6.0 1.3 14.4 -0.6
Total final demand 2.2 5.8 -7.6 -1.7 11.3 0.4excluding re-exports(a)
Domestic demand 2.1 8.2 -9.2 -4.4 10.3 1.0Private 1.2 9.5 -9.9 -5.4 12.3 0.7Public 9.2 -1.0 -3.8 2.1 -2.8 3.3
External demand 5.4 5.3 -4.3 4.4 16.4 -1.7
(a)
(#)
(+) Preliminary figures.
Revised figures.
Re-export margin is nevertheless retained in the total final demand.
Private consumption expenditure
Notes :
Government consumption
Machinery, equipment and
Table 2 : Rates of change in Gross Domestic Productby expenditure component (in real terms)
capital formation
Building and construction
of which:
Gross domestic fixed
90
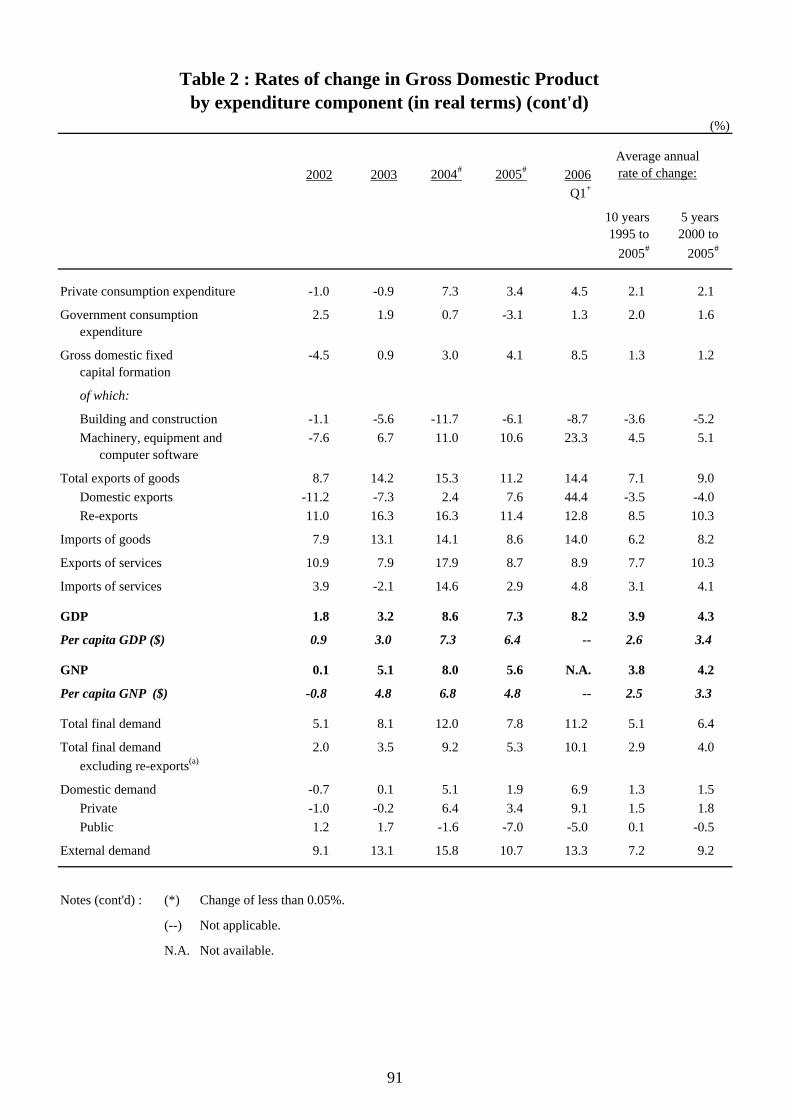
(%)
2002 2003 2004# 2005# 2006Q1+
10 years1995 to
2005#
5 years2000 to
2005#
-1.0 -0.9 7.3 3.4 4.5 2.1 2.1
2.5 1.9 0.7 -3.1 1.3 2.0 1.6 expenditure
-4.5 0.9 3.0 4.1 8.5 1.3 1.2
-1.1 -5.6 -11.7 -6.1 -8.7 -3.6 -5.2 -7.6 6.7 11.0 10.6 23.3 4.5 5.1
computer software
Total exports of goods 8.7 14.2 15.3 11.2 14.4 7.1 9.0 Domestic exports -11.2 -7.3 2.4 7.6 44.4 -3.5 -4.0 Re-exports 11.0 16.3 16.3 11.4 12.8 8.5 10.3
Imports of goods 7.9 13.1 14.1 8.6 14.0 6.2 8.2
Exports of services 10.9 7.9 17.9 8.7 8.9 7.7 10.3
Imports of services 3.9 -2.1 14.6 2.9 4.8 3.1 4.1
GDP 1.8 3.2 8.6 7.3 8.2 3.9 4.3
Per capita GDP ($) 0.9 3.0 7.3 6.4 -- 2.6 3.4
GNP 0.1 5.1 8.0 5.6 N.A. 3.8 4.2
Per capita GNP ($) -0.8 4.8 6.8 4.8 -- 2.5 3.3
Total final demand 5.1 8.1 12.0 7.8 11.2 5.1 6.4
Total final demand 2.0 3.5 9.2 5.3 10.1 2.9 4.0 excluding re-exports(a)
Domestic demand -0.7 0.1 5.1 1.9 6.9 1.3 1.5 Private -1.0 -0.2 6.4 3.4 9.1 1.5 1.8 Public 1.2 1.7 -1.6 -7.0 -5.0 0.1 -0.5
External demand 9.1 13.1 15.8 10.7 13.3 7.2 9.2
(*) Change of less than 0.05%.
(--) Not applicable.
N.A. Not available.
Government consumption
capital formation
Notes (cont'd) :
Table 2 : Rates of change in Gross Domestic Product
Building and constructionMachinery, equipment and
of which:
Gross domestic fixed
by expenditure component (in real terms) (cont'd)
Average annualrate of change:
Private consumption expenditure
91
$Mn%
share $Mn%
share $Mn%
share $Mn%
share $Mn%
share
920 0.1 1,003 0.1 1,002 0.1 824 0.1 886 0.1
241 * 174 * 136 * 116 * 72 *
67,646 5.4 59,760 4.8 51,396 4.2 44,403 3.7 44,455 3.5
36,917 2.9 37,957 3.1 39,609 3.2 38,839 3.2 39,726 3.2
62,054 4.9 57,167 4.6 51,534 4.2 44,910 3.7 40,376 3.2
1,087,570 86.6 1,088,211 87.5 1,091,272 88.4 1,073,941 89.3 1,130,301 90.0
308,600 24.6 309,926 24.9 310,500 25.1 308,872 25.7 345,092 27.5
118,974 9.5 117,526 9.4 121,766 9.9 117,420 9.8 126,820 10.1
268,399 21.4 251,495 20.2 247,045 20.0 251,085 20.9 266,834 21.2
249,997 19.9 262,960 21.1 265,746 21.5 261,917 21.8 263,756 21.0
141,600 11.3 146,304 11.8 146,214 11.8 134,648 11.2 127,799 10.2
1,255,348 100.0 1,244,271 100.0 1,234,949 100.0 1,203,034 100.0 1,255,816 100.0
57,908 53,917 43,325 48,057 58,729
0.1 * -0.1 -1.4 -1.8
1,314,789 1,298,813 1,276,757 1,233,983 1,291,568
Notes : Figures may not add up exactly to the total due to rounding.
(#)
(*) Less than 0.05%.
Revised figures.
Wholesale, retail and
Financing, insurance,real estate andbusiness services
GDP at factor cost
storage andcommunications
Community,social and personalservices
Transport,
Ownership of premises
market prices
imports
GDP at current
Statistical discrepancy (%)
Taxes on production and
import/export trades,restaurants and hotels
2004#
Services
Construction
Agriculture and fishing
Mining and quarrying
Manufacturing
Electricity, gas and water
Table 3 : Gross Domestic Product by economic activity(at current prices)
20032000 2001 2002
92
2001 2002 2003 2004# 2005#
Q1 Q2 Q3 Q4
4.1 -0.7 -5.6 2.8 2.1 -3.0 7.4 5.4 -0.8
-14.1 -11.1 2.2 -17.0 10.3 * 12.8 18.9 7.0
-9.1 -10.0 -10.3 1.7 2.1 -2.3 -0.1 4.1 5.9
1.7 3.8 1.8 2.0 3.4 5.0 4.8 0.5 4.3
-2.2 -1.5 -4.9 -9.8 -6.6 0.5 -8.4 -5.5 -12.4
1.8 2.8 4.5 9.9 7.9 7.1 8.4 8.5 7.7
0.3 4.5 9.1 15.1 11.1 10.5 12.1 11.0 10.9
1.9 6.5 0.7 13.9 13.5 12.7 12.3 15.3 13.5
0.5 2.7 5.7 13.1 8.9 6.9 11.3 10.0 7.6
4.0 -0.6 0.6 2.6 0.9 1.0 0.1 1.1 1.5
3.4 2.0 2.7 0.9 4.2 4.3 4.0 4.3 4.1
-1.1 -0.1 3.4 13.0 1.0 -1.3 2.0 10.1 -5.0
0.6 1.8 3.2 8.6 7.3 6.0 7.2 8.2 7.5
(#)
(*) Change of less than 0.05%.
real estate and businessservices
Financing, insurance,
communicationsTransport, storage and
Taxes on production and
Ownership of premises
Community, social andpersonal services
import/export trades,restaurants and hotels
Agriculture and fishing
Mining and quarrying
Manufacturing
Wholesale, retail and
Electricity, gas and water
Construction
Services
Notes :
market pricesGDP at constant (2000)
imports
Revised figures.
2005#
(%)
Table 4 : Rates of change in Gross Domestic Product by economic activity(in real terms)
93
($Mn)
2001 2002 2003 2004# 2005#
Q1 Q2 Q3 Q4
76,315 96,800 128,240 122,491 157,692 32,750 32,029 43,367 49,547
-64,970 -39,406 -44,970 -72,514 -59,347 -19,677 -19,646 -6,941 -13,083
126,620 145,341 159,020 187,056 231,623 49,908 50,833 60,661 70,221
28,543 5,652 28,491 23,410 2,463 6,999 4,763 -6,085 -3,214
-13,878 -14,787 -14,301 -15,461 -17,046 -4,481 -3,921 -4,268 -4,377
-97,359 -151,179 -179,086 -184,640 -160,882 -54,444 -7,427 -48,610 -50,400
-60,829 -169,720 -171,497 -159,155 -150,202 -51,890 -12,926 -45,639 -39,746
(net change)
-9,155 -15,686 -8,292 -2,561 -5,237 -2,653 -1,511 -683 -390
-51,674 -154,033 -163,205 -156,594 -144,966 -49,238 -11,415 -44,956 -39,356
96,948 -60,685 63,372 -91,038 25,845 970 3,928 -30,607 51,554
-322,045 -302,484 -264,619 -306,368 -168,100 -70,770 -91,131 -19,263 13,063
39,640 51,563 78,288 44,319 13,754 4,206 5,749 952 2,847
133,783 157,573 -40,247 196,492 -16,464 16,357 70,038 3,961 -106,821
-36,530 18,541 -7,589 -25,486 -10,679 -2,554 5,500 -2,971 -10,654
21,044 54,379 50,846 62,149 3,190 21,695 -24,602 5,244 853
36,530 -18,541 7,589 25,486 10,679 2,554 -5,500 2,971 10,654
Notes : Figures may not add up exactly to the total due to rounding.
(a)
(#)
non-reserve assets
Direct investment
Portfolio investment
Overall balance of payments
Financial derivatives
Other investment
Reserve assets (net change)(a)
Net errors and omissions
Current account
Table 5 : Balance of payments account by major component(at current prices)
Services
2005#
Revised figures.
A negative value for net change in reserve assets represents a net increase, and a positive value represents anet decrease.
Goods
Income
Financial non-reserveassets (net change)
Capital transfers
Capital and financial account
Current transfers
Capital and financial
94
($Mn)
2001 2002 2003 2004# 2005# 2005 2006
Q2# Q3# Q4# Q1+
Total exports of goods 1,480,987 1,562,121 1,749,089 2,027,031 2,251,744 555,352 614,625 602,671 538,460
Imports of goods 1,549,222 1,601,527 1,794,059 2,099,545 2,311,091 574,998 621,566 615,754 568,261
Visible trade balance -68,235 -39,406 -44,970 -72,514 -59,347 -19,646 -6,941 -13,083 -29,801(-4.4) (-2.5) (-2.5) (-3.5) (-2.6) (-3.4) (-1.1) (-2.1) (-5.2)
Exports of services 320,799 347,836 362,420 429,563 483,455 109,835 128,678 135,275 124,123
Imports of services 194,180 202,494 203,400 242,507 251,832 59,002 68,017 65,054 62,606
Invisible trade balance 126,619 145,342 159,020 187,056 231,623 50,833 60,661 70,221 61,517(65.2) (71.8) (78.2) (77.1) (92.0) (86.2) (89.2) (107.9) (98.3)
1,801,786 1,909,957 2,111,509 2,456,594 2,735,199 665,187 743,303 737,946 662,583
1,743,402 1,804,021 1,997,459 2,342,052 2,562,923 634,000 689,583 680,808 630,867
Visible and invisible 58,384 105,936 114,050 114,542 172,276 31,187 53,720 57,138 31,716 trade balance <3.3> <5.9> <5.7> <4.9> <6.7> <4.9> <7.8> <8.4> <5.0>
Notes : Figures in this table are reckoned on a GDP basis.
(#)
(+) Preliminary figures.
( ) As a percentage of the total value of imports of goods/services.
< > As a percentage of the total value of imports of goods and services.
Revised figures.
Imports of goods andservices
Table 6 : Visible and invisible trade(at current market prices)
Exports of goods andservices
95
2001 2002 2003 2004 2005 2006
Q2 Q3 Q4 Q1
$Mn
All markets -5.8 5.4 11.7 15.9 11.4 2,250,174 12.5 12.5 10.0 12.1
Mainland of China 0.6 12.3 21.1 19.7 14.0 1,012,565 14.7 14.2 14.5 18.4
United States -9.8 1.0 -2.6 5.4 5.6 360,639 7.3 7.9 1.7 3.8
Japan 0.5 -4.5 12.3 14.4 10.3 118,578 11.6 12.5 5.7 6.9
Germany -13.9 -5.3 15.1 11.9 15.6 72,720 15.7 14.5 14.7 10.5
United Kingdom -12.2 -2.0 5.8 14.8 5.2 69,247 9.8 2.8 0.1 2.1
Taiwan -11.1 -2.2 22.2 16.2 2.7 50,427 4.3 6.5 3.0 4.1
Republic of Korea -9.4 17.2 16.9 24.0 9.5 48,241 4.9 11.0 16.4 16.3
Singapore -19.5 6.8 13.0 22.0 6.8 46,541 12.9 -2.0 3.4 -1.0
Rest of the world -8.4 3.5 7.1 17.3 13.3 471,215 13.9 16.7 10.4 10.3
Note : Figures may not add up exactly to the total due to rounding.
Table 7 : Total exports of goods by market
2005
(% change over a year earlier) (% change)
(in value terms)
96
2001 2002 2003 2004 2005 2006
Q2 Q3 Q4 Q1
$Mn
All sources -5.4 3.3 11.5 16.9 10.3 2,329,469 10.1 11.5 11.3 13.8
Mainland of China -4.6 5.1 9.6 16.9 14.3 1,049,335 14.2 15.3 13.5 16.9
Japan -11.2 3.4 17.2 19.7 0.1 256,501 0.2 -0.4 1.5 4.4
Taiwan -13.1 7.4 8.0 22.8 9.4 168,227 3.8 8.5 21.2 19.4
Singapore -2.8 3.9 19.6 22.5 21.8 135,190 14.2 26.9 32.6 34.3
United States -7.0 -12.8 7.9 13.4 6.5 119,252 13.8 9.6 -2.4 0.1
Republic of Korea -12.2 7.3 15.0 15.0 2.6 103,035 -1.0 4.5 15.4 19.8
Rest of the world 0.5 2.2 12.1 13.6 8.4 497,928 10.4 9.4 6.2 8.0
Note : Figures may not add up exactly to the total due to rounding.
2001 2002 2003 2004 2005 2006
Q2 Q3 Q4 Q1
$Mn
Overall -9.1 -9.0 2.6 14.8 6.5 581,072 0.4 8.8 18.6 22.8
Foodstuffs -2.6 0.2 1.5 8.6 3.3 50,834 1.1 2.9 5.2 4.1
Consumer goods 3.9 -5.2 -1.8 7.4 3.7 125,616 -11.9 6.3 17.5 13.1
Fuels -10.2 3.9 12.9 37.5 23.7 57,034 21.4 33.4 15.0 40.0
-22.3 -1.6 10.7 17.6 4.9 217,297 2.2 10.5 14.7 14.3 semi-manufactures
Capital goods -2.8 -24.9 -6.6 13.3 6.6 129,521 4.0 -0.1 31.2 40.0
Note : Figures may not add up exactly to the total due to rounding.
(in value terms)
(in value terms)
Table 8 : Imports of goods by source
Table 9 : Retained imports of goods by end-use category
2005
(% change over a year earlier) (% change)
Raw materials and
(% change over a year earlier)
2005
(% change)
97
2001 2002 2003 2004# 2005 2006
Q2# Q3# Q4# Q1+
$Mn
Exports of services 1.8 8.4 4.2 18.5 12.5 483,455 12.2 12.3 13.9 13.2
Transportation -5.9 10.8 3.8 25.5 12.5 152,147 13.3 12.0 11.9 12.1
Travel 0.7 25.4 -4.4 26.1 14.1 79,994 12.3 12.0 15.3 13.0
Trade-related 9.0 9.0 12.2 12.6 11.6 163,498 12.8 10.8 11.1 12.9
Other services 3.4 -5.9 -1.4 12.7 12.9 87,816 9.3 16.4 22.0 15.6
Imports of services 0.9 4.3 0.4 19.2 3.8 251,832 1.7 4.4 1.6 4.8
Transportation 4.7 -4.7 7.8 29.4 8.0 73,067 8.9 9.5 3.8 7.7
Travel -1.4 0.8 -8.0 15.9 0.1 103,492 -6.0 0.1 -1.2 1.6
Trade-related 5.7 24.2 9.2 3.2 10.3 18,211 13.6 9.7 8.2 4.5
Other services 0.5 20.0 8.2 19.7 3.8 57,062 4.7 4.7 1.5 7.1
Net exports of services 3.3 14.8 9.4 17.6 23.8 231,623 27.7 22.8 28.3 23.3
Notes : Figures may not add up exactly to the total due to rounding.
(#)
(+) Preliminary figures.
(% change) (% change over a year earlier)
Revised figures.
Table 10 : Exports and imports of services by component
2005#
(at current market prices)
98
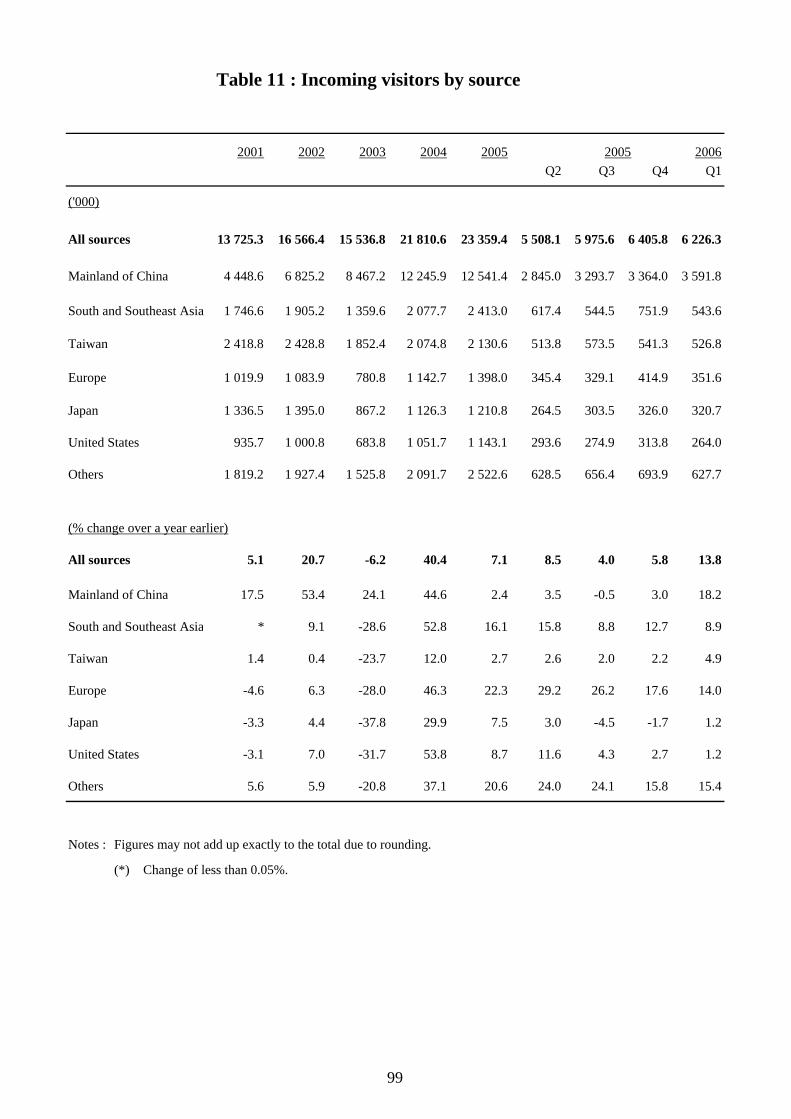
2001 2002 2003 2004 2005 2005 2006Q2 Q3 Q4 Q1
('000)
All sources 13 725.3 16 566.4 15 536.8 21 810.6 23 359.4 5 508.1 5 975.6 6 405.8 6 226.3
Mainland of China 4 448.6 6 825.2 8 467.2 12 245.9 12 541.4 2 845.0 3 293.7 3 364.0 3 591.8
South and Southeast Asia 1 746.6 1 905.2 1 359.6 2 077.7 2 413.0 617.4 544.5 751.9 543.6
Taiwan 2 418.8 2 428.8 1 852.4 2 074.8 2 130.6 513.8 573.5 541.3 526.8
Europe 1 019.9 1 083.9 780.8 1 142.7 1 398.0 345.4 329.1 414.9 351.6
Japan 1 336.5 1 395.0 867.2 1 126.3 1 210.8 264.5 303.5 326.0 320.7
United States 935.7 1 000.8 683.8 1 051.7 1 143.1 293.6 274.9 313.8 264.0
Others 1 819.2 1 927.4 1 525.8 2 091.7 2 522.6 628.5 656.4 693.9 627.7
(% change over a year earlier)
All sources 5.1 20.7 -6.2 40.4 7.1 8.5 4.0 5.8 13.8
Mainland of China 17.5 53.4 24.1 44.6 2.4 3.5 -0.5 3.0 18.2
South and Southeast Asia * 9.1 -28.6 52.8 16.1 15.8 8.8 12.7 8.9
Taiwan 1.4 0.4 -23.7 12.0 2.7 2.6 2.0 2.2 4.9
Europe -4.6 6.3 -28.0 46.3 22.3 29.2 26.2 17.6 14.0
Japan -3.3 4.4 -37.8 29.9 7.5 3.0 -4.5 -1.7 1.2
United States -3.1 7.0 -31.7 53.8 8.7 11.6 4.3 2.7 1.2
Others 5.6 5.9 -20.8 37.1 20.6 24.0 24.1 15.8 15.4
Notes : Figures may not add up exactly to the total due to rounding.
(*) Change of less than 0.05%.
Table 11 : Incoming visitors by source
99
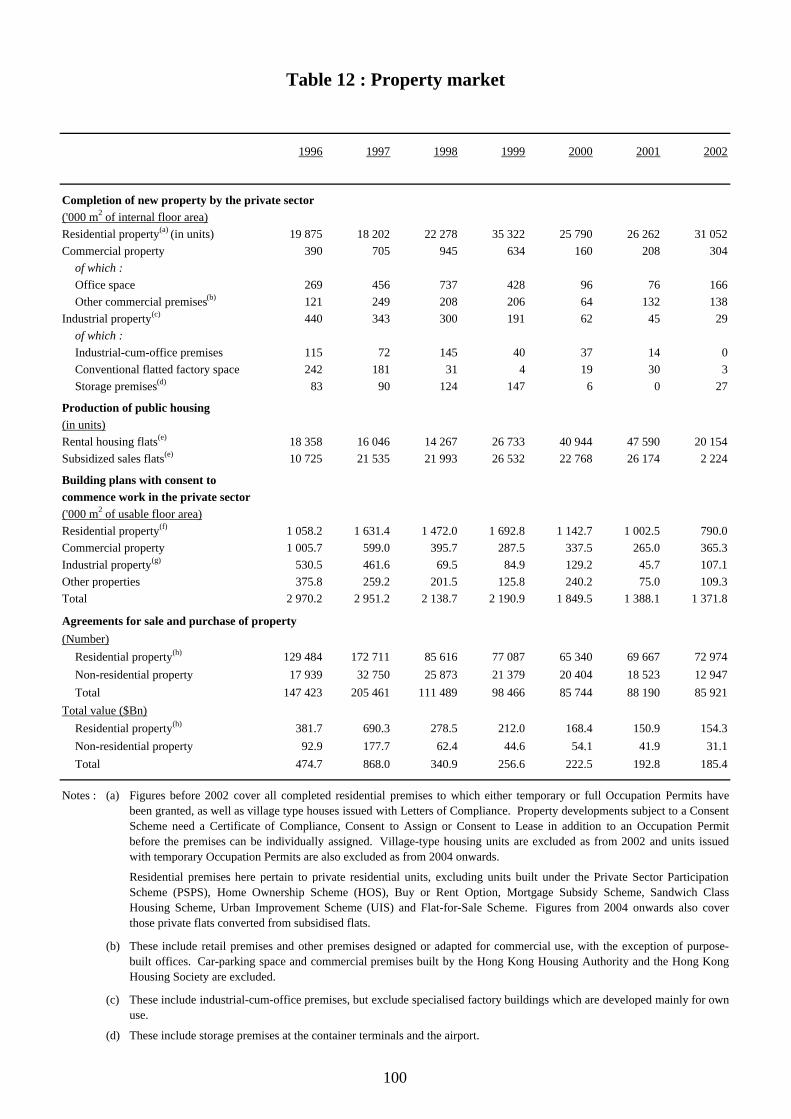
1996 1997 1998 1999 2000 2001 2002
Completion of new property by the private sector('000 m2 of internal floor area)Residential property(a) (in units) 19 875 18 202 22 278 35 322 25 790 26 262 31 052Commercial property 390 705 945 634 160 208 304
of which :Office space 269 456 737 428 96 76 166Other commercial premises(b) 121 249 208 206 64 132 138
Industrial property(c) 440 343 300 191 62 45 29of which :Industrial-cum-office premises 115 72 145 40 37 14 0Conventional flatted factory space 242 181 31 4 19 30 3Storage premises(d) 83 90 124 147 6 0 27
Production of public housing(in units)Rental housing flats(e) 18 358 16 046 14 267 26 733 40 944 47 590 20 154Subsidized sales flats(e) 10 725 21 535 21 993 26 532 22 768 26 174 2 224
Building plans with consent tocommence work in the private sector('000 m2 of usable floor area)Residential property(f) 1 058.2 1 631.4 1 472.0 1 692.8 1 142.7 1 002.5 790.0Commercial property 1 005.7 599.0 395.7 287.5 337.5 265.0 365.3Industrial property(g) 530.5 461.6 69.5 84.9 129.2 45.7 107.1Other properties 375.8 259.2 201.5 125.8 240.2 75.0 109.3Total 2 970.2 2 951.2 2 138.7 2 190.9 1 849.5 1 388.1 1 371.8
Agreements for sale and purchase of property(Number)
Residential property(h) 129 484 172 711 85 616 77 087 65 340 69 667 72 974Non-residential property 17 939 32 750 25 873 21 379 20 404 18 523 12 947Total 147 423 205 461 111 489 98 466 85 744 88 190 85 921
Total value ($Bn)Residential property(h) 381.7 690.3 278.5 212.0 168.4 150.9 154.3Non-residential property 92.9 177.7 62.4 44.6 54.1 41.9 31.1Total 474.7 868.0 340.9 256.6 222.5 192.8 185.4
Notes : (a)
(b)
(c)
(d) These include storage premises at the container terminals and the airport.
These include retail premises and other premises designed or adapted for commercial use, with the exception of purpose-built offices. Car-parking space and commercial premises built by the Hong Kong Housing Authority and the Hong KongHousing Society are excluded.
These include industrial-cum-office premises, but exclude specialised factory buildings which are developed mainly for ownuse.
Table 12 : Property market
Figures before 2002 cover all completed residential premises to which either temporary or full Occupation Permits havebeen granted, as well as village type houses issued with Letters of Compliance. Property developments subject to a ConsentScheme need a Certificate of Compliance, Consent to Assign or Consent to Lease in addition to an Occupation Permitbefore the premises can be individually assigned. Village-type housing units are excluded as from 2002 and units issuedwith temporary Occupation Permits are also excluded as from 2004 onwards.
Residential premises here pertain to private residential units, excluding units built under the Private Sector ParticipationScheme (PSPS), Home Ownership Scheme (HOS), Buy or Rent Option, Mortgage Subsidy Scheme, Sandwich ClassHousing Scheme, Urban Improvement Scheme (UIS) and Flat-for-Sale Scheme. Figures from 2004 onwards also coverthose private flats converted from subsidised flats.
100
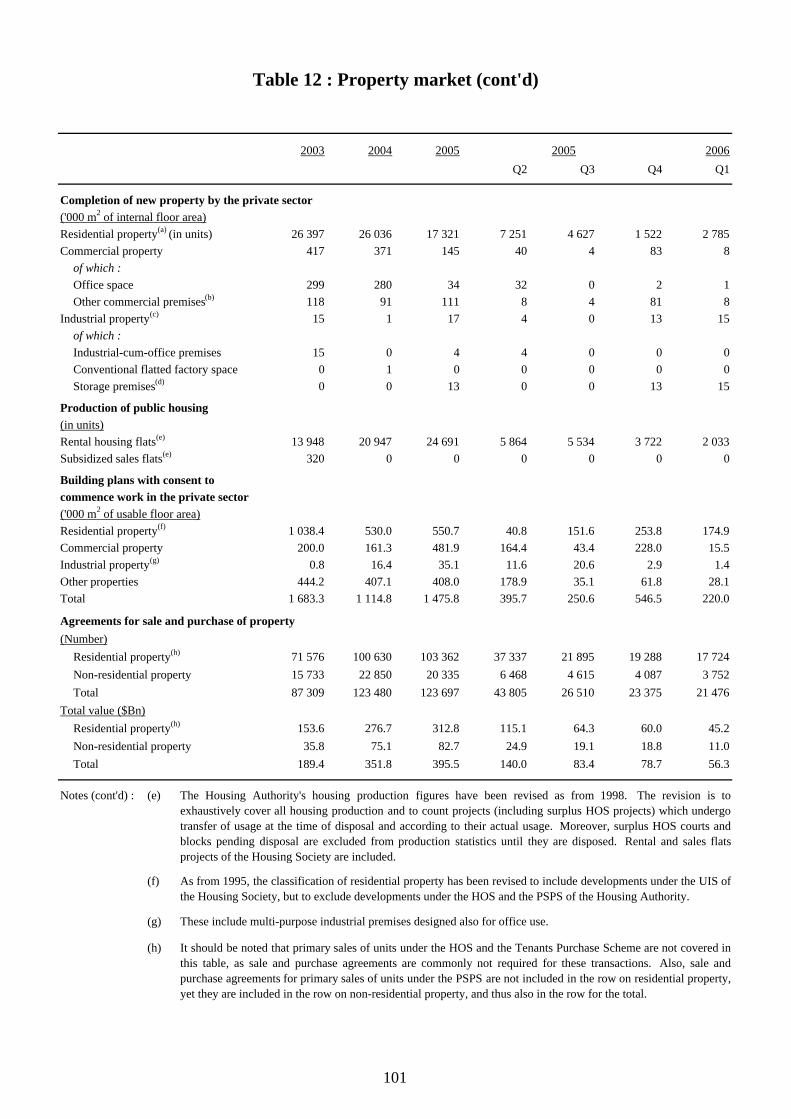
2003 2004 2005 2005 2006Q2 Q3 Q4 Q1
Completion of new property by the private sector('000 m2 of internal floor area)Residential property(a) (in units) 26 397 26 036 17 321 7 251 4 627 1 522 2 785Commercial property 417 371 145 40 4 83 8
of which :Office space 299 280 34 32 0 2 1Other commercial premises(b) 118 91 111 8 4 81 8
Industrial property(c) 15 1 17 4 0 13 15of which :Industrial-cum-office premises 15 0 4 4 0 0 0Conventional flatted factory space 0 1 0 0 0 0 0Storage premises(d) 0 0 13 0 0 13 15
Production of public housing(in units)Rental housing flats(e) 13 948 20 947 24 691 5 864 5 534 3 722 2 033Subsidized sales flats(e) 320 0 0 0 0 0 0
Building plans with consent tocommence work in the private sector('000 m2 of usable floor area)Residential property(f) 1 038.4 530.0 550.7 40.8 151.6 253.8 174.9Commercial property 200.0 161.3 481.9 164.4 43.4 228.0 15.5Industrial property(g) 0.8 16.4 35.1 11.6 20.6 2.9 1.4Other properties 444.2 407.1 408.0 178.9 35.1 61.8 28.1Total 1 683.3 1 114.8 1 475.8 395.7 250.6 546.5 220.0
Agreements for sale and purchase of property(Number)
Residential property(h) 71 576 100 630 103 362 37 337 21 895 19 288 17 724Non-residential property 15 733 22 850 20 335 6 468 4 615 4 087 3 752Total 87 309 123 480 123 697 43 805 26 510 23 375 21 476
Total value ($Bn)Residential property(h) 153.6 276.7 312.8 115.1 64.3 60.0 45.2Non-residential property 35.8 75.1 82.7 24.9 19.1 18.8 11.0Total 189.4 351.8 395.5 140.0 83.4 78.7 56.3
(e)
(f)
(g)
(h)
Table 12 : Property market (cont'd)
The Housing Authority's housing production figures have been revised as from 1998. The revision is toexhaustively cover all housing production and to count projects (including surplus HOS projects) which undergotransfer of usage at the time of disposal and according to their actual usage. Moreover, surplus HOS courts andblocks pending disposal are excluded from production statistics until they are disposed. Rental and sales flatsprojects of the Housing Society are included.
These include multi-purpose industrial premises designed also for office use.
It should be noted that primary sales of units under the HOS and the Tenants Purchase Scheme are not covered inthis table, as sale and purchase agreements are commonly not required for these transactions. Also, sale andpurchase agreements for primary sales of units under the PSPS are not included in the row on residential property,yet they are included in the row on non-residential property, and thus also in the row for the total.
As from 1995, the classification of residential property has been revised to include developments under the UIS ofthe Housing Society, but to exclude developments under the HOS and the PSPS of the Housing Authority.
Notes (cont'd) :
101
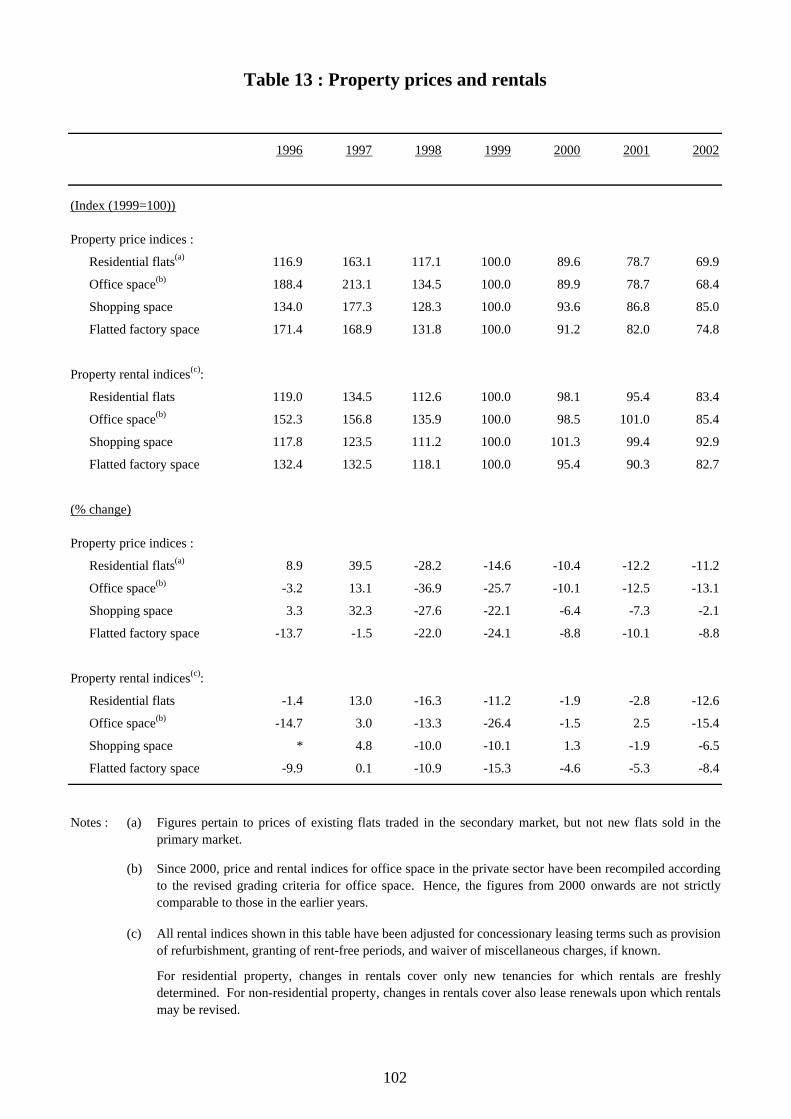
1996 1997 1998 1999 2000 2001 2002
(Index (1999=100))
Property price indices :
Residential flats(a) 116.9 163.1 117.1 100.0 89.6 78.7 69.9
Office space(b) 188.4 213.1 134.5 100.0 89.9 78.7 68.4
Shopping space 134.0 177.3 128.3 100.0 93.6 86.8 85.0
Flatted factory space 171.4 168.9 131.8 100.0 91.2 82.0 74.8
Property rental indices(c):
Residential flats 119.0 134.5 112.6 100.0 98.1 95.4 83.4
Office space(b) 152.3 156.8 135.9 100.0 98.5 101.0 85.4
Shopping space 117.8 123.5 111.2 100.0 101.3 99.4 92.9
Flatted factory space 132.4 132.5 118.1 100.0 95.4 90.3 82.7
(% change)
Property price indices :
Residential flats(a) 8.9 39.5 -28.2 -14.6 -10.4 -12.2 -11.2
Office space(b) -3.2 13.1 -36.9 -25.7 -10.1 -12.5 -13.1
Shopping space 3.3 32.3 -27.6 -22.1 -6.4 -7.3 -2.1
Flatted factory space -13.7 -1.5 -22.0 -24.1 -8.8 -10.1 -8.8
Property rental indices(c):
Residential flats -1.4 13.0 -16.3 -11.2 -1.9 -2.8 -12.6
Office space(b) -14.7 3.0 -13.3 -26.4 -1.5 2.5 -15.4
Shopping space * 4.8 -10.0 -10.1 1.3 -1.9 -6.5
Flatted factory space -9.9 0.1 -10.9 -15.3 -4.6 -5.3 -8.4
(a)
(b)
(c)
For residential property, changes in rentals cover only new tenancies for which rentals are freshlydetermined. For non-residential property, changes in rentals cover also lease renewals upon which rentalsmay be revised.
All rental indices shown in this table have been adjusted for concessionary leasing terms such as provisionof refurbishment, granting of rent-free periods, and waiver of miscellaneous charges, if known.
Since 2000, price and rental indices for office space in the private sector have been recompiled accordingto the revised grading criteria for office space. Hence, the figures from 2000 onwards are not strictlycomparable to those in the earlier years.
Table 13 : Property prices and rentals
Notes : Figures pertain to prices of existing flats traded in the secondary market, but not new flats sold in theprimary market.
102

2003 2004 2005# 2005 2006Q2 Q3 Q4# Q1+
(Index (1999=100))
Property price indices :Residential flats(a) 61.6 78.0 92.0 94.5 93.6 90.1 90.8Office space(b) 62.5 99.3 133.0 135.6 137.6 135.7 130.0Shopping space 85.5 119.3 148.8 153.0 148.9 149.1 148.7Flatted factory space 71.7 88.6 124.7 122.5 132.1 135.7 141.7
Property rental indices(c):Residential flats 73.6 77.7 86.5 85.5 88.3 89.9 89.8Office space(b) 74.6 78.1 96.5 92.8 99.8 105.5 108.3Shopping space 86.4 92.8 100.6 99.0 102.9 103.5 103.3Flatted factory space 74.9 77.3 82.5 82.4 82.5 84.3 85.9
(% change over a year earlier)
Property price indices :Residential flats(a) -11.9 26.6 17.9 22.4 20.3 8.0 1.0
<53.1>{-46.4}
Office space(b) -8.6 58.9 33.9 39.5 38.4 21.2 5.5<120.3>{-42.2}
Shopping space 0.6 39.5 24.7 32.8 25.5 11.1 3.0<83.6>{-23.1}
Flatted factory space -4.1 23.6 40.7 46.7 45.6 36.1 30.5<102.4>{-18.3}
Property rental indices(c):Residential flats -11.8 5.6 11.3 10.5 12.3 12.1 8.8
<24.9>{-35.3}
Office space(b) -12.6 4.7 23.6 20.8 26.3 28.5 23.5<51.0>{-31.9}
Shopping space -7.0 7.4 8.4 7.6 9.0 7.8 6.7<22.8>{-17.1}
Flatted factory space -9.4 3.2 6.7 7.3 6.5 6.3 6.0<19.0>{-35.1}
(#) Figures for non-residential property are provisional.(+) Provisional figures.(*) Change of less than 0.05%.< > % change from the trough in 2003.{ } % change from the peak in 1997.
Notes (cont'd) :
Table 13 : Property prices and rentals (cont'd)
103
1996 1997 1998 1999 2000 2001 2002
(as at end of period)Hong Kong dollar money supply ($Mn) :
M1 198,311 188,135 178,260 205,339 203,966 229,841 259,411M2(a) 1,503,603 1,666,419 1,828,691 1,923,481 1,987,963 1,998,774 1,984,049M3(a) 1,520,461 1,684,325 1,840,824 1,935,471 2,002,358 2,016,635 2,004,225
Total money supply ($Mn)M1 217,460 208,093 197,666 225,156 243,847 258,056 295,650M2 2,532,236 2,788,808 3,111,942 3,386,196 3,649,492 3,550,060 3,518,326M3 2,611,636 2,871,425 3,168,199 3,434,467 3,692,753 3,594,130 3,561,852
Deposit(b) ($Mn)HK$ 1,400,077 1,551,555 1,699,726 1,773,169 1,851,177 1,854,651 1,824,911Foreign currency 1,058,180 1,158,728 1,300,302 1,477,448 1,676,670 1,551,852 1,492,631Total 2,458,256 2,710,282 3,000,027 3,250,617 3,527,847 3,406,502 3,317,542
Loans and advances ($Mn)HK$ 1,447,844 1,742,481 1,695,027 1,607,126 1,652,191 1,647,684 1,615,667Foreign currency 2,467,045 2,379,189 1,609,400 1,205,784 809,259 537,301 460,659Total 3,914,890 4,121,670 3,304,427 2,812,910 2,461,450 2,184,986 2,076,325
Nominal Effective Exchange Rate Indices(Jan 2000 =100)(c)(d)
Trade-weighted 94.0 98.0 103.4 100.9 101.7 104.7 104.0Import-weighted 93.0 97.9 105.5 101.4 101.5 105.1 104.7Export-weighted 95.1 98.1 101.3 100.4 101.9 104.3 103.3
(% change)Hong Kong dollar money supply :
M1 15.5 -5.1 -5.2 15.2 -0.7 12.7 12.9M2(a) 19.3 -- 9.7 5.2 3.4 0.5 -0.7M3(a) 18.9 -- 9.3 5.1 3.5 0.7 -0.6
Total money supply :M1 14.2 -4.3 -5.0 13.9 8.3 5.8 14.6M2 10.9 -- 11.6 8.8 7.8 -2.7 -0.9M3 10.5 -- 10.3 8.4 7.5 -2.7 -0.9
Deposit(b)
HK$ 19.5 -- 9.5 4.3 4.4 0.2 -1.6Foreign currency 0.3 -- 12.2 13.6 13.5 -7.4 -3.8Total 10.4 -- 10.7 8.4 8.5 -3.4 -2.6
Loans and advancesHK$ 17.0 20.4 -2.7 -5.2 2.8 -0.3 -1.9Foreign currency -1.4 -3.6 -32.4 -25.1 -32.9 -33.6 -14.3Total 4.7 5.3 -19.8 -14.9 -12.5 -11.2 -5.0
Nominal Effective Exchange Rate Indices(c)(d)
Trade-weighted 2.6 4.3 5.5 -2.4 0.8 2.9 -0.7Import-weighted 3.8 5.3 7.8 -3.9 0.1 3.5 -0.4Export-weighted 1.5 3.2 3.3 -0.9 1.5 2.4 -1.0
Definition of Terms :
Total Money Supply:M1: Legal tender notes and coins with the public, plus customers’ demand deposits with licensed banks.M2:
M3: M2 plus customers’ deposits with restricted licence banks and deposit-taking companies, plus negotiable certificates of depositissued by such institutions and held outside the monetary sector.
Table 14 : Monetary aggregates
The Hong Kong Dollar Money Supply is the Hong Kong dollar component of the respective monetary aggregate. Starting from April 1997,money supply definition has been revised to include short-term Exchange Fund placements of less than one month in the monetary aggregates.As such, figures after 1997 cannot be compared with those in the previous period.
M1 plus customers’ savings and time deposits with licensed banks, plus negotiable certificates of deposit issued by licensed banksand held outside the monetary sector.
104
2003 2004 2005 2005 2006Q2 Q3 Q4 Q1
(as at end of period)Hong Kong dollar money supply ($Mn) :
M1 354,752 412,629 348,246 360,889 350,711 348,246 356,869M2(a) 2,107,269 2,208,591 2,329,697 2,214,261 2,278,988 2,329,697 2,453,240M3(a) 2,122,861 2,219,557 2,345,866 2,227,479 2,294,680 2,345,866 2,469,679
Total money supply ($Mn)M1 413,423 484,494 434,684 438,286 431,190 434,684 438,946M2 3,813,442 4,166,706 4,379,087 4,166,961 4,243,288 4,379,087 4,522,812M3 3,858,044 4,189,544 4,407,218 4,192,238 4,270,883 4,407,218 4,551,810
Deposit(b) ($Mn)HK$ 1,930,790 2,017,911 2,131,607 2,017,544 2,080,347 2,131,607 2,248,321Foreign currency 1,636,227 1,848,145 1,936,323 1,837,973 1,845,628 1,936,323 1,959,835Total 3,567,018 3,866,056 4,067,931 3,855,517 3,925,974 4,067,931 4,208,156
Loans and advances ($Mn)HK$ 1,573,079 1,666,740 1,797,268 1,757,390 1,763,803 1,797,268 1,792,148Foreign currency 462,000 488,964 514,667 499,281 505,312 514,667 535,656Total 2,035,079 2,155,704 2,311,935 2,256,671 2,269,115 2,311,935 2,327,803
Nominal Effective Exchange Rate Indices(Jan 2000 =100)(c)(d)
Trade-weighted 100.7 98.3 97.4 97.1 97.6 98.6 97.6Import-weighted 101.6 99.2 98.1 97.7 98.3 99.5 98.2Export-weighted 99.8 97.3 96.7 96.4 96.9 97.7 97.0
(% change over a year earlier)Hong Kong dollar money supply :
M1 36.8 16.3 -15.6 -6.3 -5.5 -15.6 -7.8M2(a) 6.2 4.8 5.5 7.1 10.1 5.5 11.4M3(a) 5.9 4.6 5.7 6.9 10.1 5.7 11.5
Total money supply :M1 39.8 17.2 -10.3 -2.1 -3.1 -10.3 -5.5M2 8.4 9.3 5.1 8.9 8.6 5.1 8.6M3 8.3 8.6 5.2 8.2 8.2 5.2 8.6
Deposit(b)
HK$ 5.8 4.5 5.6 7.1 10.6 5.6 12.2Foreign currency 9.6 13.0 4.8 9.0 5.4 4.8 6.0Total 7.5 8.4 5.2 8.0 8.1 5.2 9.2
Loans and advancesHK$ -2.6 6.0 7.8 9.4 9.8 7.8 5.5Foreign currency 0.3 5.8 5.3 6.5 6.9 5.3 11.0Total -2.0 5.9 7.2 8.7 9.2 7.2 6.7
Nominal Effective Exchange Rate Indices(c)(d)
Trade-weighted -3.2 -2.4 -0.9 -1.7 -1.1 1.3 1.5Import-weighted -3.0 -2.4 -1.1 -2.0 -1.4 1.3 1.3Export-weighted -3.4 -2.5 -0.6 -1.5 -0.8 1.3 1.6
Notes : (a) Adjusted to include foreign currency swap deposits.(b)
(c) Period average.(d)
(--) Not applicable.
The Effective Exchange Rate Indices (EERIs) from January 2000 onwards are compiled on the basis of the average merchandisetrade pattern from 1999 to 2000. The EERIs for the earlier periods are compiled on the basis of the average merchandise tradepattern in a much earlier period from 1991 to 1993, and have been re-scaled to the new base period for linking up with the newindex series.
Table 14 : Monetary aggregates (cont'd)
Starting from April 1997, deposits include short-term Exchange Fund placements of less than one month. As such, figures after1997 cannot be compared with those in the previous period.
105
Table 15 : Rates of change in business receipts indices forservice industries/domains
(%)
2001 2002 2003 2004 2005
Q1 Q2 Q3 Q4
Wholesale trade -12.0 -10.7 -5.0 4.7 5.6 3.9 7.9 4.8 5.7
Retail trade -1.2 -4.1 -2.3 10.8 6.8 8.5 7.3 6.1 5.3
Import/export trade -14.1 -2.8 6.5 12.4 10.6 13.5 10.0 8.7 10.7
Restaurants -2.5 -5.4 -9.7 10.1 6.0 6.1 4.5 6.3 7.0
Hotels -7.6 -2.3 -19.7 39.4 22.1 22.8 22.3 19.2 23.4
Transport(a) -2.4 2.3 0.5 22.8 17.8 19.1 15.5 21.2 15.4
Storage -14.9 -19.6 -4.5 17.0 10.4 5.2 10.5 12.9 12.5
Communications -13.2 -2.6 -2.4 1.0 5.1 3.8 4.9 7.9 3.6
Banking 2.7 -0.8 * 4.4 10.9 5.9 11.6 17.5 9.2
Financing (other than banking) -12.6 -14.3 17.3 33.2 14.3 -1.9 11.8 30.0 18.7
Insurance 14.2 10.3 19.1 22.3 16.0 9.4 14.7 17.9 21.2
Real estate -16.9 -2.5 6.2 13.5 16.0 17.8 42.2 12.1 -1.0
Business services -9.6 -5.8 0.5 8.3 4.9 1.7 6.2 6.2 5.5
Film entertainment 15.2 -9.1 2.3 3.7 5.0 9.1 5.2 -1.3 7.6
-3.8 10.7 -7.3 26.5 13.6 13.9 13.0 11.2 15.9
-11.6 5.7 5.7 20.5 23.4 14.5 27.0 25.2 25.8
Notes : (a) Including business receipts from the Airport Authority Hong Kong.
(+) Figures for 2004 and 2005 are provisional figures.
(*) Change of less than 0.05%.
Computer and informationservices
Tourism, convention and exhibitionservices+
2005
106
2001 2002 2003 2004 2005 2005 2006
Q2 Q3 Q4 Q1
(%)
61.4 61.8 61.4 61.3 60.9 60.8 61.0 60.9 61.1
5.1 7.3 7.9 6.8 5.6 5.7 5.5 5.3 5.2
Underemployment rate 2.5 3.0 3.5 3.3 2.8 2.8 2.6 2.5 2.3
('000)
Population of working age 5 579.2 5 642.8 5 694.0 5 796.0 5 884.4 5 866.5 5 899.5 5 933.7 5 905.3
Labour force 3 427.1 3 487.1 3 496.2 3 551.0 3 586.3 3 569.2 3 597.3 3 613.4 3 606.7
Persons employed 3 252.3 3 231.6 3 219.1 3 308.6 3 385.5 3 364.7 3 391.6 3 431.5 3 426.2
Persons unemployed 174.8 255.5 277.2 242.5 200.7 204.5 205.7 182.0 180.5
Persons underemployed 85.5 105.2 123.3 116.7 98.7 100.4 95.0 89.5 82.6
(% change over a year earlier)
Population of working age 1.5 1.1 0.9 1.8 1.5 1.4 1.6 1.7 1.2
Labour force 1.6 1.8 0.3 1.6 1.0 0.7 1.2 1.1 1.2
Persons employed 1.4 -0.6 -0.4 2.8 2.3 1.9 2.6 2.5 2.1
Persons unemployed 4.7 46.2 8.5 -12.5 -17.2 -15.1 -17.9 -20.1 -14.3
Persons underemployed -8.6 23.0 17.3 -5.4 -15.4 -18.3 -16.3 -19.6 -24.7
Table 16 : Labour force characteristics
Seasonally adjustedunemployment rate
Labour forceparticipation rate
107
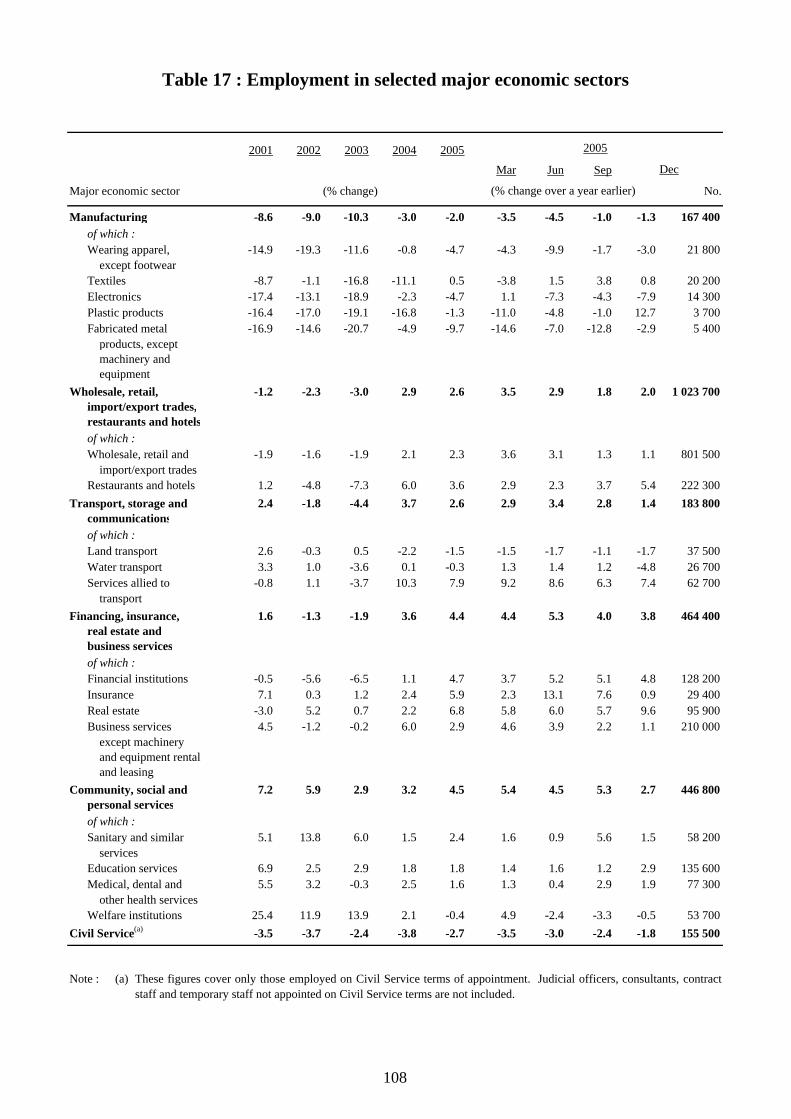
2001 2002 2003 2004 2005 2005
Mar Jun Sep
Major economic sector (% change) No.
Manufacturing -8.6 -9.0 -10.3 -3.0 -2.0 -3.5 -4.5 -1.0 -1.3 167 400of which :Wearing apparel, -14.9 -19.3 -11.6 -0.8 -4.7 -4.3 -9.9 -1.7 -3.0 21 800
except footwearTextiles -8.7 -1.1 -16.8 -11.1 0.5 -3.8 1.5 3.8 0.8 20 200Electronics -17.4 -13.1 -18.9 -2.3 -4.7 1.1 -7.3 -4.3 -7.9 14 300Plastic products -16.4 -17.0 -19.1 -16.8 -1.3 -11.0 -4.8 -1.0 12.7 3 700Fabricated metal -16.9 -14.6 -20.7 -4.9 -9.7 -14.6 -7.0 -12.8 -2.9 5 400
products, exceptmachinery and equipment
Wholesale, retail, -1.2 -2.3 -3.0 2.9 2.6 3.5 2.9 1.8 2.0 1 023 700import/export trades,restaurants and hotelsof which :Wholesale, retail and -1.9 -1.6 -1.9 2.1 2.3 3.6 3.1 1.3 1.1 801 500
import/export tradesRestaurants and hotels 1.2 -4.8 -7.3 6.0 3.6 2.9 2.3 3.7 5.4 222 300
Transport, storage and 2.4 -1.8 -4.4 3.7 2.6 2.9 3.4 2.8 1.4 183 800communicationsof which :Land transport 2.6 -0.3 0.5 -2.2 -1.5 -1.5 -1.7 -1.1 -1.7 37 500Water transport 3.3 1.0 -3.6 0.1 -0.3 1.3 1.4 1.2 -4.8 26 700Services allied to -0.8 1.1 -3.7 10.3 7.9 9.2 8.6 6.3 7.4 62 700
transportFinancing, insurance, 1.6 -1.3 -1.9 3.6 4.4 4.4 5.3 4.0 3.8 464 400
real estate andbusiness servicesof which :Financial institutions -0.5 -5.6 -6.5 1.1 4.7 3.7 5.2 5.1 4.8 128 200Insurance 7.1 0.3 1.2 2.4 5.9 2.3 13.1 7.6 0.9 29 400Real estate -3.0 5.2 0.7 2.2 6.8 5.8 6.0 5.7 9.6 95 900Business services 4.5 -1.2 -0.2 6.0 2.9 4.6 3.9 2.2 1.1 210 000
except machinery and equipment rental and leasing
Community, social and 7.2 5.9 2.9 3.2 4.5 5.4 4.5 5.3 2.7 446 800personal servicesof which :Sanitary and similar 5.1 13.8 6.0 1.5 2.4 1.6 0.9 5.6 1.5 58 200
servicesEducation services 6.9 2.5 2.9 1.8 1.8 1.4 1.6 1.2 2.9 135 600Medical, dental and 5.5 3.2 -0.3 2.5 1.6 1.3 0.4 2.9 1.9 77 300
other health servicesWelfare institutions 25.4 11.9 13.9 2.1 -0.4 4.9 -2.4 -3.3 -0.5 53 700
Civil Service(a) -3.5 -3.7 -2.4 -3.8 -2.7 -3.5 -3.0 -2.4 -1.8 155 500
Note : (a) These figures cover only those employed on Civil Service terms of appointment. Judicial officers, consultants, contractstaff and temporary staff not appointed on Civil Service terms are not included.
Table 17 : Employment in selected major economic sectors
(% change over a year earlier)
Dec
108
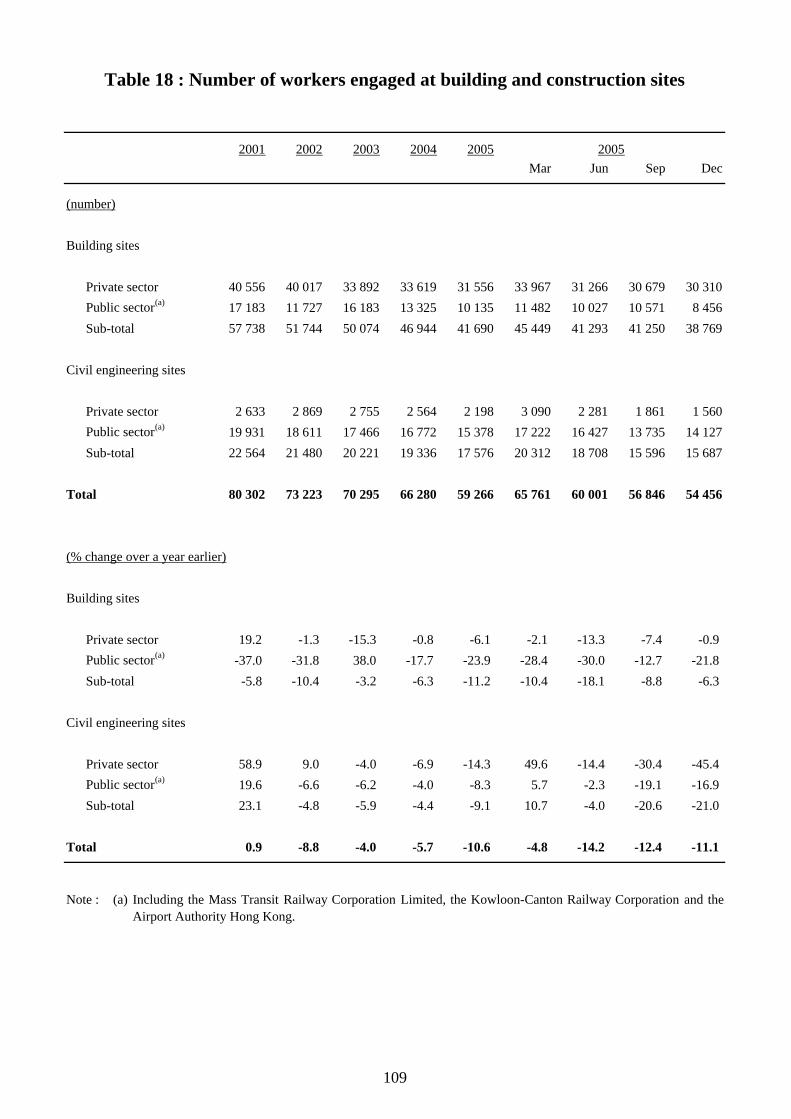
2001 2002 2003 2004 2005Mar Jun Sep Dec
(number)
Building sites
Private sector 40 556 40 017 33 892 33 619 31 556 33 967 31 266 30 679 30 310Public sector(a) 17 183 11 727 16 183 13 325 10 135 11 482 10 027 10 571 8 456Sub-total 57 738 51 744 50 074 46 944 41 690 45 449 41 293 41 250 38 769
Civil engineering sites
Private sector 2 633 2 869 2 755 2 564 2 198 3 090 2 281 1 861 1 560Public sector(a) 19 931 18 611 17 466 16 772 15 378 17 222 16 427 13 735 14 127Sub-total 22 564 21 480 20 221 19 336 17 576 20 312 18 708 15 596 15 687
Total 80 302 73 223 70 295 66 280 59 266 65 761 60 001 56 846 54 456
(% change over a year earlier)
Building sites
Private sector 19.2 -1.3 -15.3 -0.8 -6.1 -2.1 -13.3 -7.4 -0.9Public sector(a) -37.0 -31.8 38.0 -17.7 -23.9 -28.4 -30.0 -12.7 -21.8Sub-total -5.8 -10.4 -3.2 -6.3 -11.2 -10.4 -18.1 -8.8 -6.3
Civil engineering sites
Private sector 58.9 9.0 -4.0 -6.9 -14.3 49.6 -14.4 -30.4 -45.4Public sector(a) 19.6 -6.6 -6.2 -4.0 -8.3 5.7 -2.3 -19.1 -16.9Sub-total 23.1 -4.8 -5.9 -4.4 -9.1 10.7 -4.0 -20.6 -21.0
Total 0.9 -8.8 -4.0 -5.7 -10.6 -4.8 -14.2 -12.4 -11.1
Note : (a) Including the Mass Transit Railway Corporation Limited, the Kowloon-Canton Railway Corporation and theAirport Authority Hong Kong.
Table 18 : Number of workers engaged at building and construction sites
2005
109
Table 19 : Average labour earnings by major economic sector
($)
2001 2002 2003 2004 2005 2005
Major economic sector Q1 Q2 Q3 Q4
Wholesale, retail and 12,700 12,500 12,300 12,400 13,300 15,100 12,100 12,400 13,400 import/export trades (2.0) (-1.6) (-1.5) (0.4) (7.3) (5.6) (5.2) (9.6) (9.0)
<3.7> <1.4> <1.1> <0.9> <6.1> <5.2> <4.4> <8.1> <7.0>
Restaurants and hotels 9,000 8,700 8,100 8,100 8,300 9,100 7,900 8,000 8,000(0.1) (-4.2) (-6.2) (-0.1) (1.9) (6.4) (2.7) (-0.4) (-1.4)
<1.7> <-1.1> <-3.7> <0.4> <0.8> <6.0> <1.9> <-1.8> <-3.2>
Transport, storage and 18,900 18,900 18,500 18,300 19,200 20,500 18,000 18,100 20,200 communications (1.3) (-0.2) (-1.7) (-1.3) (5.0) (5.5) (4.3) (7.4) (3.1)
<3.0> <2.9> <0.9> <-0.9> <3.9> <5.2> <3.5> <5.9> <1.3>
Financing, insurance, 19,200 18,800 18,600 18,500 19,100 21,000 18,100 17,200 19,900 real estate and (0.4) (-2.2) (-1.4) (-0.1) (2.8) (3.1) (1.2) (1.5) (5.1) business services <2.0> <0.8> <1.2> <0.4> <1.7> <2.8> <0.4> <0.1> <3.2>
Community, social and 20,000 19,800 18,900 18,400 18,000 17,800 17,800 18,100 18,100 personal services (0.7) (-1.3) (-4.7) (-2.6) (-2.2) (-2.7) (-0.3) (-4.5) (-1.1)
<2.3> <1.9> <-2.2> <-2.2> <-3.3> <-3.1> <-1.1> <-5.8> <-2.9>
Manufacturing 11,900 11,800 11,400 11,300 11,600 12,700 11,200 10,600 11,600(2.1) (-1.2) (-3.0) (-0.6) (1.8) (2.6) (2.6) (0.8) (1.2)
<3.8> <1.9> <-0.4> <-0.2> <0.8> <2.3> <1.8> <-0.6> <-0.6>
All sectors surveyed 15,400 15,300 15,000 14,900 15,400 16,800 14,600 14,600 15,700(1.8) (-1.1) (-1.8) (-0.7) (3.5) (4.4) (2.7) (3.2) (3.7)
<3.5> <2.0> <0.8> <-0.2> <2.4> <4.0> <1.8> <1.8> <1.9>
Notes : ( ) % change over a year earlier in money terms.
< > % change over a year earlier in real terms.
110

Table 20 : Rates of change in wage indices byselected major economic sector
(%)
2001 2002 2003 2004 2005 2005
Mar Jun Sep Dec
(in money terms)
Wholesale, retail and 1.4 -0.6 -1.7 -1.6 1.6 1.9 0.9 1.9 1.8 import/export trades
0.7 -2.6 -4.1 -2.2 * -0.1 -1.0 0.2 0.7
Transport services 0.7 0.6 -1.9 -1.0 1.0 0.7 1.5 0.5 1.4
Financing, insurance, -0.9 -0.8 -0.1 -0.5 * -1.9 -0.3 0.5 1.8 real estate and business services
Personal services 0.7 -1.5 -3.1 1.3 -1.5 2.1 -0.9 -4.5 -2.7
Manufacturing 2.2 -1.4 -2.7 -1.3 1.2 1.2 0.5 0.5 2.5
All sectors surveyed 0.8 -1.0 -1.9 -1.1 0.8 0.7 0.4 0.8 1.4
(in real terms)
Wholesale, retail and 4.1 1.7 0.4 -1.7 0.2 0.7 -0.4 0.4 0.1 import/export trades
3.3 -0.3 -2.1 -2.2 -1.4 -1.2 -2.3 -1.3 -0.9
Transport services 3.4 2.9 0.1 -1.0 -0.4 -0.4 0.2 -1.0 -0.3
Financing, insurance, 1.7 1.5 2.0 -0.5 -1.3 -3.0 -1.5 -1.0 0.2 real estate and business services
Personal services 3.3 0.8 -1.1 1.3 -2.9 0.9 -2.2 -5.9 -4.3
Manufacturing 4.8 0.8 -0.7 -1.3 -0.2 0.1 -0.8 -1.0 0.8
All sectors surveyed 3.4 1.3 0.2 -1.2 -0.6 -0.5 -0.9 -0.7 -0.3
Note : (*) Change of less than 0.05%.
Restaurants and hotels
Selected majoreconomic sector
Restaurants and hotels
111

(%)
1996 1997 1998 1999 2000 2001 2002
GDP deflator 5.8 5.6 0.2 -5.8 -5.6 -1.8 -3.5
Domestic demand deflator 4.9 4.5 0.4 -2.3 -5.0 -2.3 -4.9
Consumer Price Indices(a) :Composite CPI 6.3 5.8 2.8 -4.0 -3.8 -1.6 -3.0CPI(A) 6.0 5.7 2.6 -3.3 -3.0 -1.7 -3.2CPI(B) 6.4 5.8 2.8 -4.7 -3.9 -1.6 -3.1CPI(C) 6.6 6.1 3.2 -3.7 -4.5 -1.5 -2.8
Unit Value Indices :Domestic exports 0.3 -2.4 -2.8 -2.4 -1.0 -4.7 -3.3Re-exports -0.5 -1.5 -3.9 -2.8 -0.1 -2.0 -2.7Total exports of goods -0.3 -1.6 -3.8 -2.7 -0.2 -2.3 -2.7Imports of goods -1.3 -2.3 -4.9 -2.0 0.8 -3.1 -3.9
Terms of Trade Index 1.0 0.7 1.2 -0.7 -1.0 0.9 1.2
Producer Price Index -0.1 -0.3 -1.8 -1.6 0.2 -1.6 -2.7for all manufacturing industries
Construction Labour and 6.8 9.3 7.5 1.4 1.8 0.3 -0.3Material Cost Index
Tender Price Indices :Public sector 14.4 17.6 9.1 -4.4 -13.1 -8.5 -11.7
building projectsPublic housing projects 11.4 18.9 9.0 -3.3 -11.9 -15.1 -9.6
(a)
(#)
(+) Preliminary figures.
(*) Change of less than 0.05%.
N.A. Not available.
Table 21 : Rates of change in prices
Notes : From October 2005 onwards, the year-on-year rates of change in the Consumer Price Indices are derivedfrom the 2004/05-based CPI series. For the earlier periods, the year-on-year rates of change are derived fromthe CPIs with old base period.
Revised figures.
112
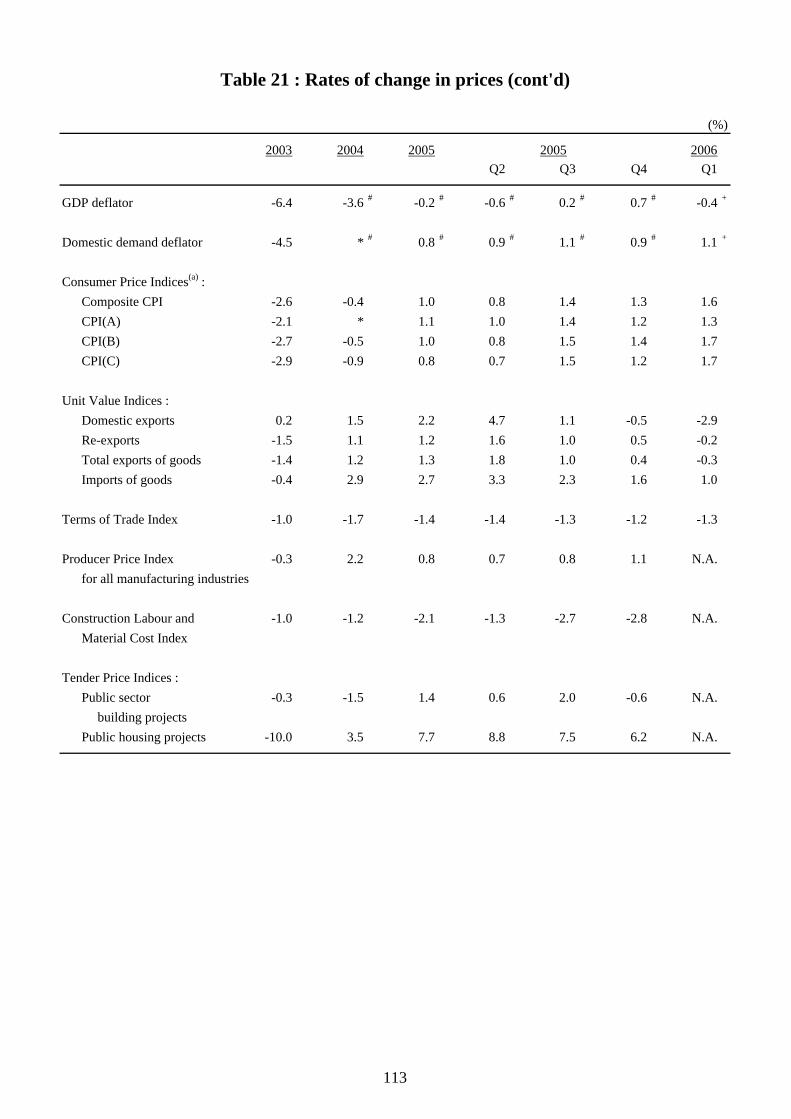
(%)
2003 2004 2005 2005 2006Q2 Q3 Q4 Q1
GDP deflator -6.4 -3.6 # -0.2 # -0.6 # 0.2 # 0.7 # -0.4 +
Domestic demand deflator -4.5 * # 0.8 # 0.9 # 1.1 # 0.9 # 1.1 +
Consumer Price Indices(a) :Composite CPI -2.6 -0.4 1.0 0.8 1.4 1.3 1.6CPI(A) -2.1 * 1.1 1.0 1.4 1.2 1.3CPI(B) -2.7 -0.5 1.0 0.8 1.5 1.4 1.7CPI(C) -2.9 -0.9 0.8 0.7 1.5 1.2 1.7
Unit Value Indices :Domestic exports 0.2 1.5 2.2 4.7 1.1 -0.5 -2.9Re-exports -1.5 1.1 1.2 1.6 1.0 0.5 -0.2Total exports of goods -1.4 1.2 1.3 1.8 1.0 0.4 -0.3Imports of goods -0.4 2.9 2.7 3.3 2.3 1.6 1.0
Terms of Trade Index -1.0 -1.7 -1.4 -1.4 -1.3 -1.2 -1.3
Producer Price Index -0.3 2.2 0.8 0.7 0.8 1.1 N.A.for all manufacturing industries
Construction Labour and -1.0 -1.2 -2.1 -1.3 -2.7 -2.8 N.A.Material Cost Index
Tender Price Indices :Public sector -0.3 -1.5 1.4 0.6 2.0 -0.6 N.A.
building projectsPublic housing projects -10.0 3.5 7.7 8.8 7.5 6.2 N.A.
Table 21 : Rates of change in prices (cont'd)
113
(%)
Weight 1996 1997 1998 1999 2000 2001 2002
All items 100.0 6.3 5.8 2.8 -4.0 -3.8 -1.6 -3.0
Food 26.94 3.9 3.6 1.9 -1.8 -2.2 -0.8 -2.1
(16.86) 3.9 4.0 2.2 -1.2 -0.9 -0.3 -1.5
(10.08) 3.9 3.0 1.5 -2.8 -4.2 -1.7 -3.1away from home
Housing(a) 29.17 10.2 9.2 4.7 -5.1 -8.2 -3.1 -5.7
Private housing rent (23.93) 10.7 9.1 5.5 -6.1 -9.8 -2.9 -6.5
Public housing rent (2.49) 8.3 13.5 -3.4 1.4 1.1 -8.3 -2.7
Electricity, gas and water 3.59 5.0 5.0 1.4 -0.4 3.6 -1.9 -7.0
Alcoholic drinks and tobacco 0.87 5.7 5.6 6.6 1.2 -0.9 3.3 2.4
Clothing and footwear 3.91 8.3 8.4 -0.8 -20.6 -10.1 -4.6 0.7
Durable goods 5.50 1.9 2.2 0.2 -6.3 -4.6 -7.1 -6.3
Miscellaneous goods 4.78 2.7 5.4 2.6 -0.7 0.9 1.3 1.7
Transport 9.09 6.2 4.0 3.9 0.5 1.0 0.4 -0.6
Miscellaneous services 16.15 6.1 4.5 2.7 -1.3 -0.2 0.5 -2.3
Notes :
(a)
(*) Change of less than 0.05%.
Table 22 : Rates of change in Composite Consumer Price Index
Meals bought away from home
Food, excluding meals bought
From October 2005 onwards, the year-on-year rates of change in the Composite Consumer Price Index arederived from the 2004/05-based CPI series. For the earlier periods, the year-on-year rates of change are derivedfrom the CPIs with old base period. The weights quoted in this table correspond to that in the new series.
Apart from "Private housing rent" and "Public housing rent", the "Housing" section also includes"Management fees and other housing charges" and "Materials for house maintenance".
114
(%)
Weight 2003 2004 2005 2005 2006Q2 Q3 Q4 Q1
All items 100.0 -2.6 -0.4 1.0 0.8 1.4 1.3 1.6
Food 26.94 -1.5 1.0 1.8 1.9 1.9 1.4 0.9
(16.86) -1.5 0.2 0.9 0.8 1.1 1.1 1.0
(10.08) -1.7 2.5 3.2 3.6 3.3 1.9 1.0away from home
Housing(a) 29.17 -4.8 -5.2 0.1 -0.9 1.0 2.8 4.2
Private housing rent (23.93) -6.3 -6.6 -0.1 -1.3 1.3 3.3 5.0
Public housing rent (2.49) 9.1 2.5 0.2 0.2 0.2 0.1 0.1
Electricity, gas and water 3.59 1.4 11.4 4.1 5.1 3.2 4.0 3.9
Alcoholic drinks and tobacco 0.87 0.1 * 0.4 0.4 0.6 0.4 -0.6
Clothing and footwear 3.91 -2.7 6.4 2.0 2.2 2.2 0.1 -2.0
Durable goods 5.50 -6.4 -2.2 -3.2 -1.9 -1.7 -6.7 -5.8
Miscellaneous goods 4.78 2.3 3.6 1.5 2.1 2.7 -0.1 0.4
Transport 9.09 -0.4 0.4 1.4 1.2 2.1 1.5 1.6
Miscellaneous services 16.15 -3.2 -0.2 1.0 0.7 0.8 1.1 1.2
Table 22 : Rates of change in Composite Consumer Price Index (cont'd)
Meals bought away from home
Food, excluding meals bought
115
(%)
1996 1997 1998 1999 2000 2001 2002
Private consumption 5.2 3.9 2.1 -5.2 -4.5 -1.0 -3.4 expenditure
Government consumption 6.5 6.4 2.6 -0.1 -1.9 1.1 -0.6 expenditure
Gross domestic fixed 2.0 6.0 -7.2 0.4 -3.8 -6.6 -10.1 capital formation
Total exports of goods -0.7 -1.9 -3.3 -3.4 -0.5 -2.6 -2.9
Imports of goods -1.2 -1.9 -4.4 -2.6 0.8 -3.5 -4.2
Exports of services 2.1 0.8 -5.1 -3.1 1.6 -4.3 -2.2
Imports of services -0.1 0.7 -3.6 -0.3 -0.3 -1.1 0.4
Gross Domestic Product 5.8 5.6 0.2 -5.8 -5.6 -1.8 -3.5
Total final demand 1.7 1.3 -2.3 -3.7 -2.7 -2.6 -3.7
Domestic demand 4.9 4.5 0.4 -2.3 -5.0 -2.3 -4.9
Notes : (#)
(+) Preliminary figures.
(*) Change of less than 0.05%.
and its main expenditure componentsTable 23 : Rates of change in implicit price deflators of GDP
Revised figures.
116
(%)
2003 2004# 2005# 2005 2006Q2# Q3# Q4# Q1+
Private consumption -2.9 -0.5 1.4 1.4 1.5 2.2 1.8 expenditure
Government consumption -2.7 -2.9 -1.6 -1.6 -1.7 -1.4 1.1 expenditure
Gross domestic fixed -9.4 2.1 0.9 1.8 1.3 -1.7 -1.2 capital formation
Total exports of goods -2.0 0.5 -0.1 0.4 -0.2 -1.3 -1.8
Imports of goods -0.9 2.5 1.3 1.8 0.8 * *
Exports of services -3.4 0.4 3.5 2.9 3.2 5.2 3.9
Imports of services 2.6 4.0 0.9 1.7 0.9 -0.7 *
Gross Domestic Product -6.4 -3.6 -0.2 -0.6 0.2 0.7 -0.4
Total final demand -3.0 0.4 0.8 0.9 0.5 0.2 *
Domestic demand -4.5 * 0.8 0.9 1.1 0.9 1.1
Table 23 : Rates of change in implicit price deflators of GDPand its main expenditure components (cont'd)
117

Copyright © 2022 FDOKUMEN