Fourth Quarter 2020 results - Archer
18
1 Fourth Quarter 2020 results Dag Skindlo Chief Executive Officer Espen Joranger Chief Financial Officer 25 February 2021
-
Upload
khangminh22 -
Category
Documents
-
view
2 -
download
0
Transcript of Fourth Quarter 2020 results - Archer
1
Fourth Quarter 2020 results
Dag Skindlo
Chief Executive Officer
Espen Joranger
Chief Financial Officer
25 February 2021
Disclaimer – forward looking statements
Cautionary Statement Regarding Forward-Looking Statements
In addition to historical information, this presentation contains statements relating to our future business and/or results. These statements include certain projections and business trends that are “forward-looking.” All statements, other than statements of historical fact, are statements that could be deemed forward-looking statements, including statements preceded by, followed by or that include the words “estimate,” pro forma numbers, “plan,” project,” “forecast,” “intend,” “expect,” “predict,” “anticipate,” “believe,” “think,” “view,” “seek,” “target,” “goal” or similar expressions; any projections of earnings, revenues, expenses, synergies, margins or other financial items; any statements of the plans, strategies and objectives of management for future operations, including integration and any potential restructuring plans; any statements concerning proposed new products, services, developments or industry rankings; any statements regarding future economic conditions or performance; any statements of belief; and any statements of assumptions underlying any of the foregoing.
Forward-looking statements do not guarantee future performance and involve risks and uncertainties. Actual results may differ materially from projected results/pro forma results as a result of certain risks and uncertainties. Further information about these risks and uncertainties are set forth in our most recent annual report for the Year ending December 31, 2019. These forward-looking statements are made only as of the date of this press release. We do not undertake any obligation to update or revise the forward-looking statements, whether as a result of new information, future events or otherwise.
The forward-looking statements in this report are based upon various assumptions, many of which are based, in turn, upon further assumptions, including without limitation, management’s examination of historical operating trends, data contained in our records and other data available from Fourth parties. Although we believe that these assumptions were reasonable when made, because these assumptions are inherently subject to significant uncertainties and contingencies, which are impossible to predict and are beyond our control, we cannot assure you that we will achieve or accomplish these expectations, beliefs or projections.
2
Q 4 2 0 2 0
3
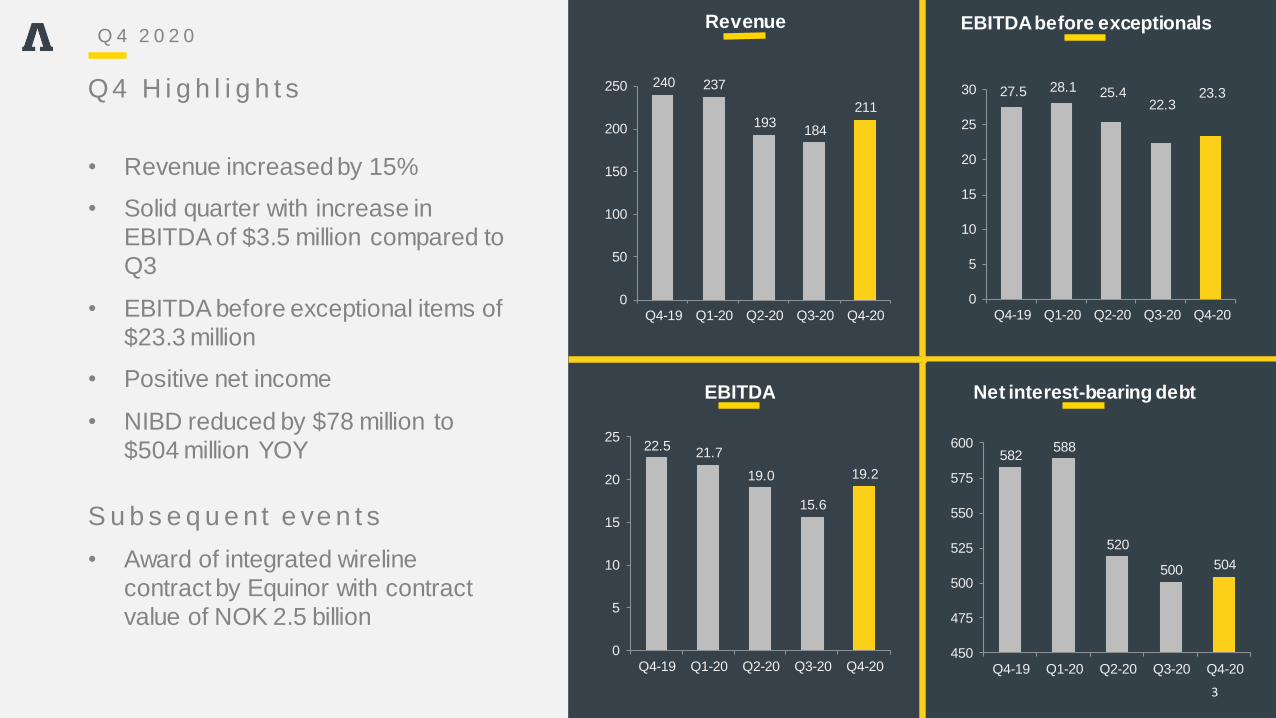
• Revenue increased by 15%
• Solid quarter with increase in
EBITDA of $3.5 million compared to
Q3
• EBITDA before exceptional items of
$23.3 million
• Positive net income
• NIBD reduced by $78 million to
$504 million YOY
Q 4 H i g h l i g h t s
3
Q 4 2 0 2 0
240 237
193184
211
0
50
100
150
200
250
Q4-19 Q1-20 Q2-20 Q3-20 Q4-20
EBITDA before exceptionalsRevenue
27.5 28.1 25.422.3
23.3
0
5
10
15
20
25
30
Q4-19 Q1-20 Q2-20 Q3-20 Q4-20
22.521.7
19.0
15.6
19.2
0
5
10
15
20
25
Q4-19 Q1-20 Q2-20 Q3-20 Q4-20
EBITDA
582588
520
500 504
450
475
500
525
550
575
600
Q4-19 Q1-20 Q2-20 Q3-20 Q4-20
Net interest-bearing debt
S u b s e q u e nt e ve n t s
• Award of integrated wireline
contract by Equinor with contract
value of NOK 2.5 billion
Operations
4
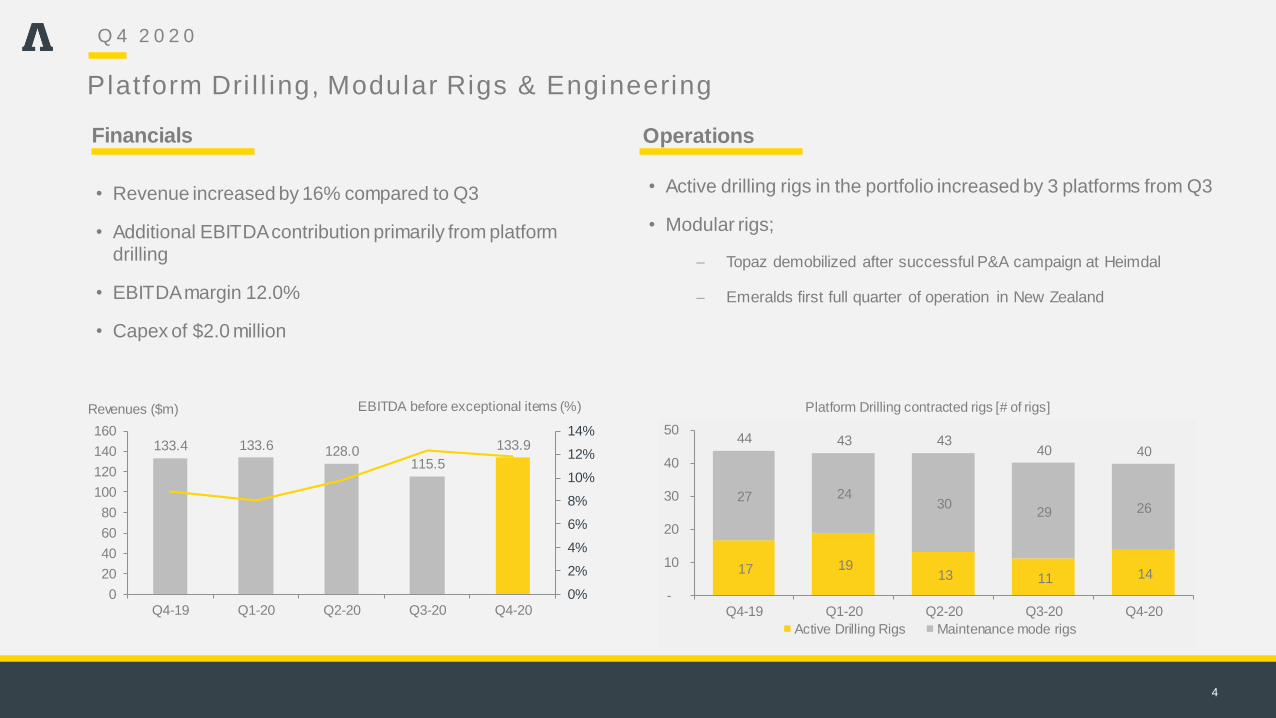
• Active drilling rigs in the portfolio increased by 3 platforms from Q3
• Modular rigs;
− Topaz demobilized after successful P&A campaign at Heimdal
− Emeralds first full quarter of operation in New Zealand
• Revenue increased by 16% compared to Q3
• Additional EBITDA contribution primarily from platform drilling
• EBITDA margin 12.0%
• Capex of $2.0 million
Q 4 2 0 2 0
Platform Dri l l ing, Modular Rigs & Engineering
Revenues ($m) EBITDA before exceptional items (%)
133.4 133.6 128.0115.5
133.9
0%
2%
4%
6%
8%
10%
12%
14%
0
20
40
60
80
100
120
140
160
Q4-19 Q1-20 Q2-20 Q3-20 Q4-20
17 19 13 11 14
27 2430
29 26
44 43 4340 40
-
10
20
30
40
50
Q4-19 Q1-20 Q2-20 Q3-20 Q4-20
Active Drilling Rigs Maintenance mode rigs
Platform Drilling contracted rigs [# of rigs]
Financials
5
Financials
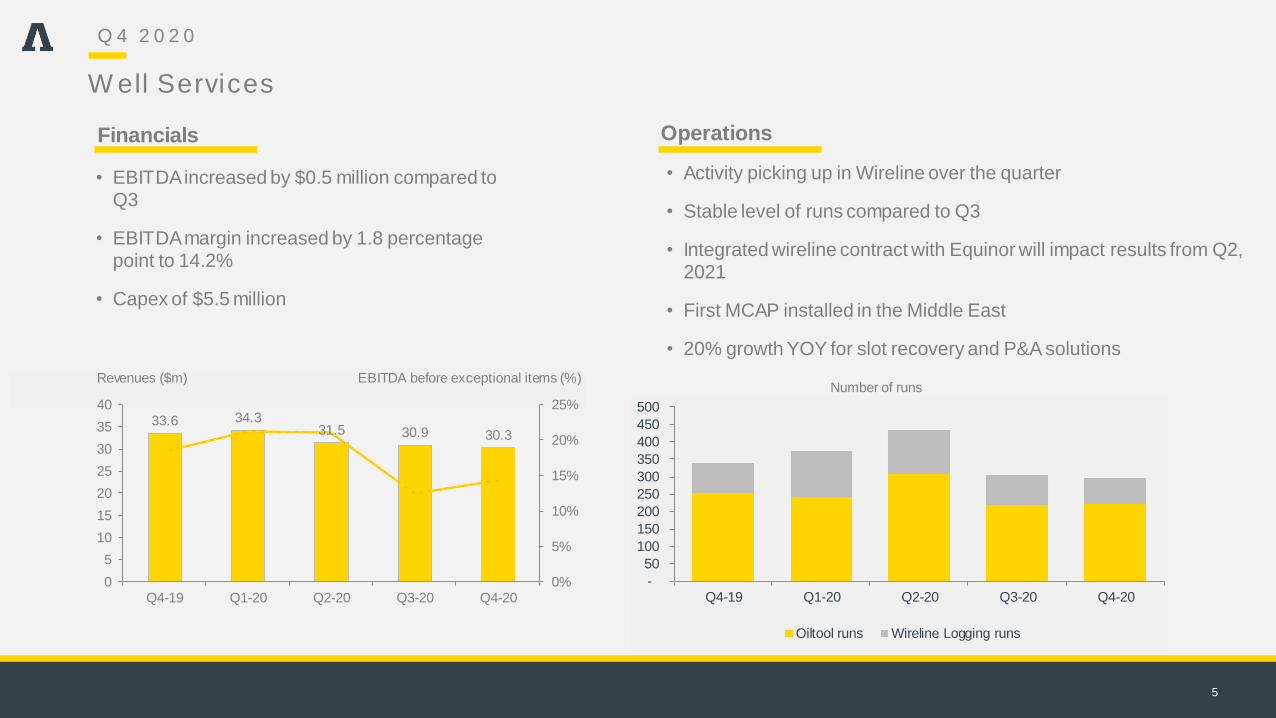
• Activity picking up in Wireline over the quarter
• Stable level of runs compared to Q3
• Integrated wireline contract with Equinor will impact results from Q2, 2021
• First MCAP installed in the Middle East
• 20% growth YOY for slot recovery and P&A solutions
• EBITDA increased by $0.5 million compared to Q3
• EBITDA margin increased by 1.8 percentage point to 14.2%
• Capex of $5.5 million
33.6 34.331.5 30.9 30.3
0%
5%
10%
15%
20%
25%
0
5
10
15
20
25
30
35
40
Q4-19 Q1-20 Q2-20 Q3-20 Q4-20
Revenues ($m) EBITDA before exceptional items (%)Number of runs
W ell Services
Operations
Q 4 2 0 2 0
-
50
100
150
200
250
300
350
400
450
500
Q4-19 Q1-20 Q2-20 Q3-20 Q4-20
Oiltool runs Wireline Logging runs
6
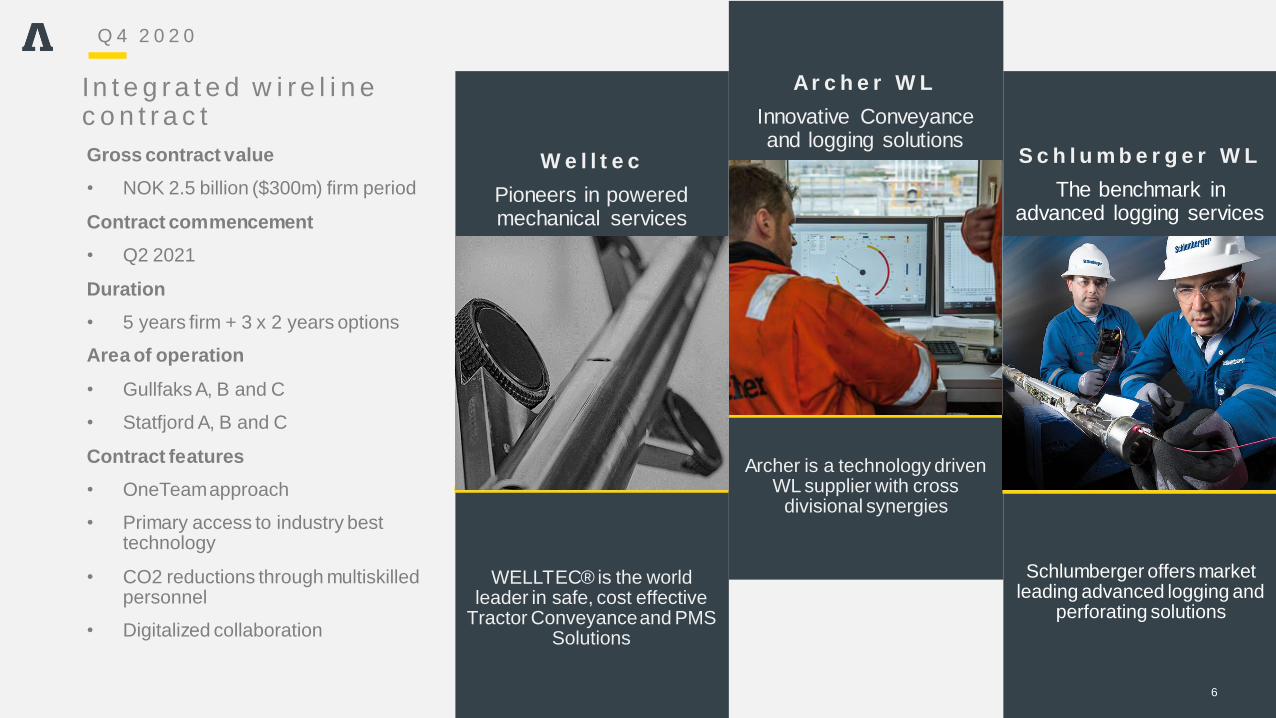
In t e g r a t e d w i r e l i n e c o n t r a c t
Gross contract value
• NOK 2.5 billion ($300m) firm period
Contract commencement
• Q2 2021
Duration
• 5 years firm + 3 x 2 years options
Area of operation
• Gullfaks A, B and C
• Statfjord A, B and C
Contract features
• OneTeamapproach
• Primary access to industry best technology
• CO2 reductions through multiskilled personnel
• Digitalized collaboration
S c h l u m b e r g e r W L
The benchmark in advanced logging services
W e l l t e c
Pioneers in powered mechanical services
Ar c h e r W L
Innovative Conveyance and logging solutions
WELLTEC® is the world leader in safe, cost effective
Tractor Conveyance and PMS Solutions
Schlumberger offers market leading advanced logging and
perforating solutions
Archer is a technology driven WL supplier with cross
divisional synergies
Q 4 2 0 2 0
72.7 70.0
32.537.1
46.3
0%
5%
10%
15%
20%
25%
0
10
20
30
40
50
60
70
80
Q4-19 Q1-20 Q2-20 Q3-20 Q4-20
7
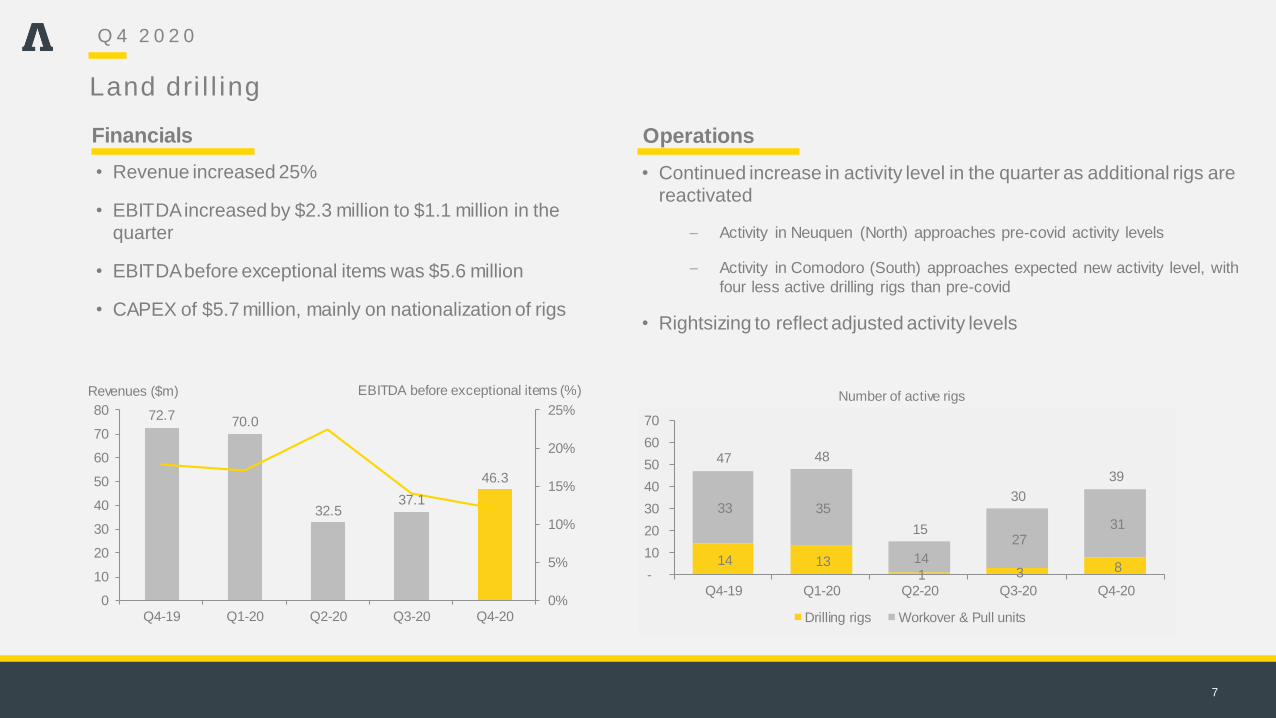
• Continued increase in activity level in the quarter as additional rigs are reactivated
− Activity in Neuquen (North) approaches pre-covid activity levels
− Activity in Comodoro (South) approaches expected new activity level, with
four less active drilling rigs than pre-covid
• Rightsizing to reflect adjusted activity levels
• Revenue increased 25%
• EBITDA increased by $2.3 million to $1.1 million in the quarter
• EBITDA before exceptional items was $5.6 million
• CAPEX of $5.7 million, mainly on nationalization of rigs
Q 4 2 0 2 0
Land dri l l ing
Revenues ($m) EBITDA before exceptional items (%) Number of active rigs
14 13 1 3 8
33 35
14
27 31
47 48
15
30
39
-
10
20
30
40
50
60
70
Q4-19 Q1-20 Q2-20 Q3-20 Q4-20
Drilling rigs Workover & Pull units
Financials Operations
8
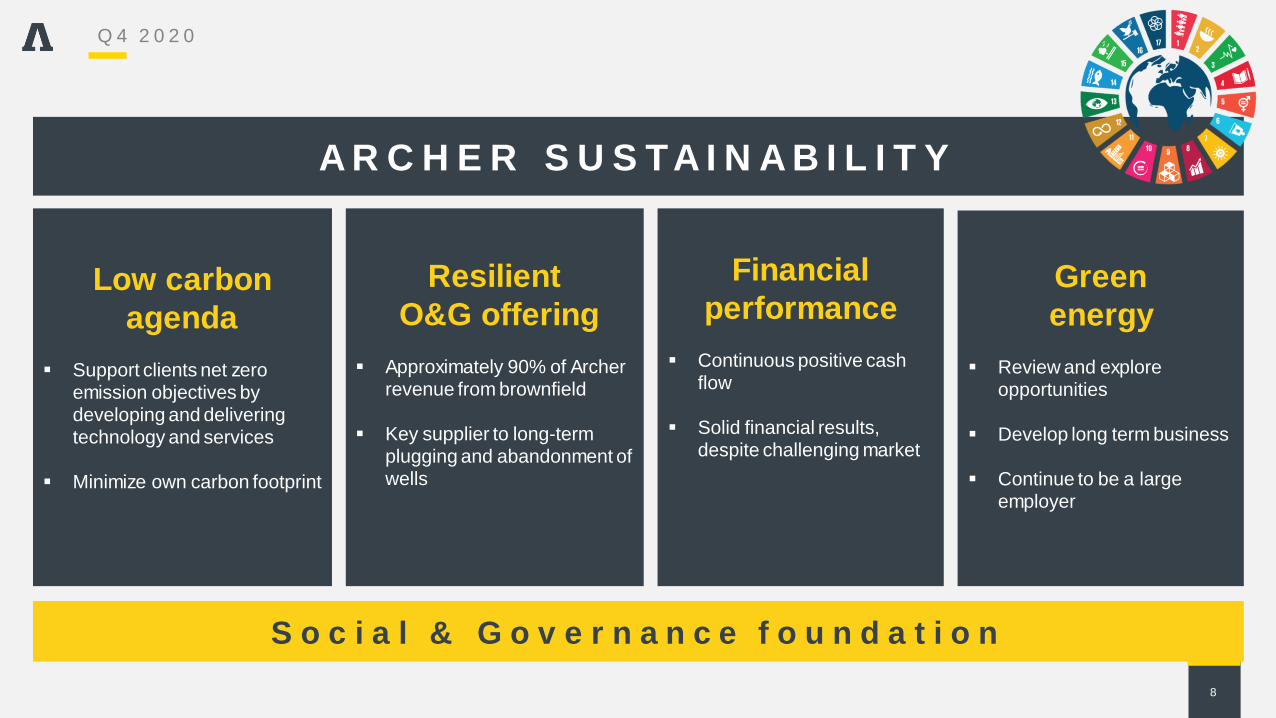
Low carbon
agenda
▪ Support clients net zero emission objectives by developing and delivering technology and services
▪ Minimize own carbon footprint
Resilient
O&G offering
▪ Approximately 90% of Archer revenue from brownfield
▪ Key supplier to long-term plugging and abandonment of wells
Financial
performance
▪ Continuous positive cash flow
▪ Solid financial results, despite challenging market
Green
energy
▪ Review and explore opportunities
▪ Develop long term business
▪ Continue to be a large employer
A R C H E R S U S TA I N A B I L I T Y
S o c i a l & G o v e r n a n c e f o u n d a t i o n
Q 4 2 0 2 0
9
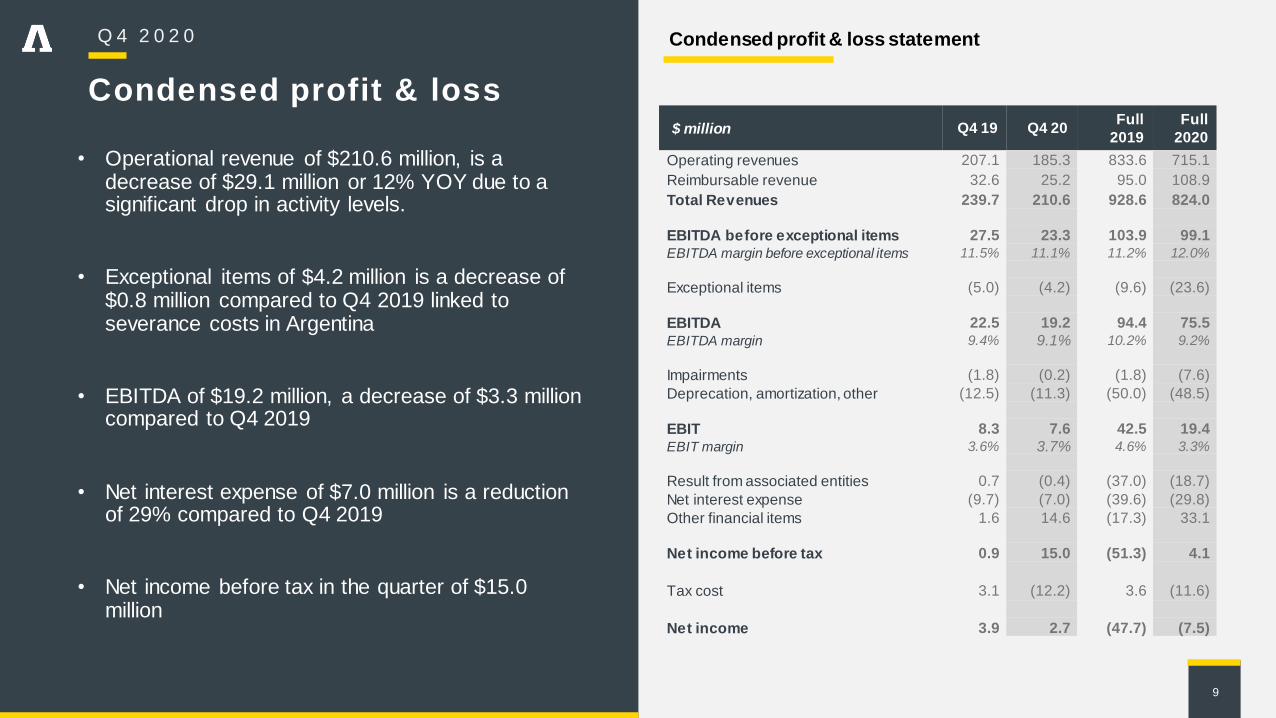
• Operational revenue of $210.6 million, is a decrease of $29.1 million or 12% YOY due to a significant drop in activity levels.
• Exceptional items of $4.2 million is a decrease of $0.8 million compared to Q4 2019 linked to severance costs in Argentina
• EBITDA of $19.2 million, a decrease of $3.3 million compared to Q4 2019
• Net interest expense of $7.0 million is a reduction of 29% compared to Q4 2019
• Net income before tax in the quarter of $15.0 million
Condensed profit & loss statement
($ million Q4 19 Q4 20Full
2019
Full
2020
Operating revenues 207.1 185.3 833.6 715.1
Reimbursable revenue 32.6 25.2 95.0 108.9
Total Revenues 239.7 210.6 928.6 824.0
EBITDA before exceptional items 27.5 23.3 103.9 99.1
EBITDA margin before exceptional items 11.5% 11.1% 11.2% 12.0%
Exceptional items (5.0) (4.2) (9.6) (23.6)
EBITDA 22.5 19.2 94.4 75.5
EBITDA margin 9.4% 9.1% 10.2% 9.2%
Impairments (1.8) (0.2) (1.8) (7.6)
Deprecation, amortization, other (12.5) (11.3) (50.0) (48.5)
EBIT 8.3 7.6 42.5 19.4
EBIT margin 3.6% 3.7% 4.6% 3.3%
Result from associated entities 0.7 (0.4) (37.0) (18.7)
Net interest expense (9.7) (7.0) (39.6) (29.8)
Other financial items 1.6 14.6 (17.3) 33.1
Net income before tax 0.9 15.0 (51.3) 4.1
Tax cost 3.1 (12.2) 3.6 (11.6)
Net income 3.9 2.7 (47.7) (7.5)
Q 4 2 0 2 0
Condensed profit & loss
10
1)
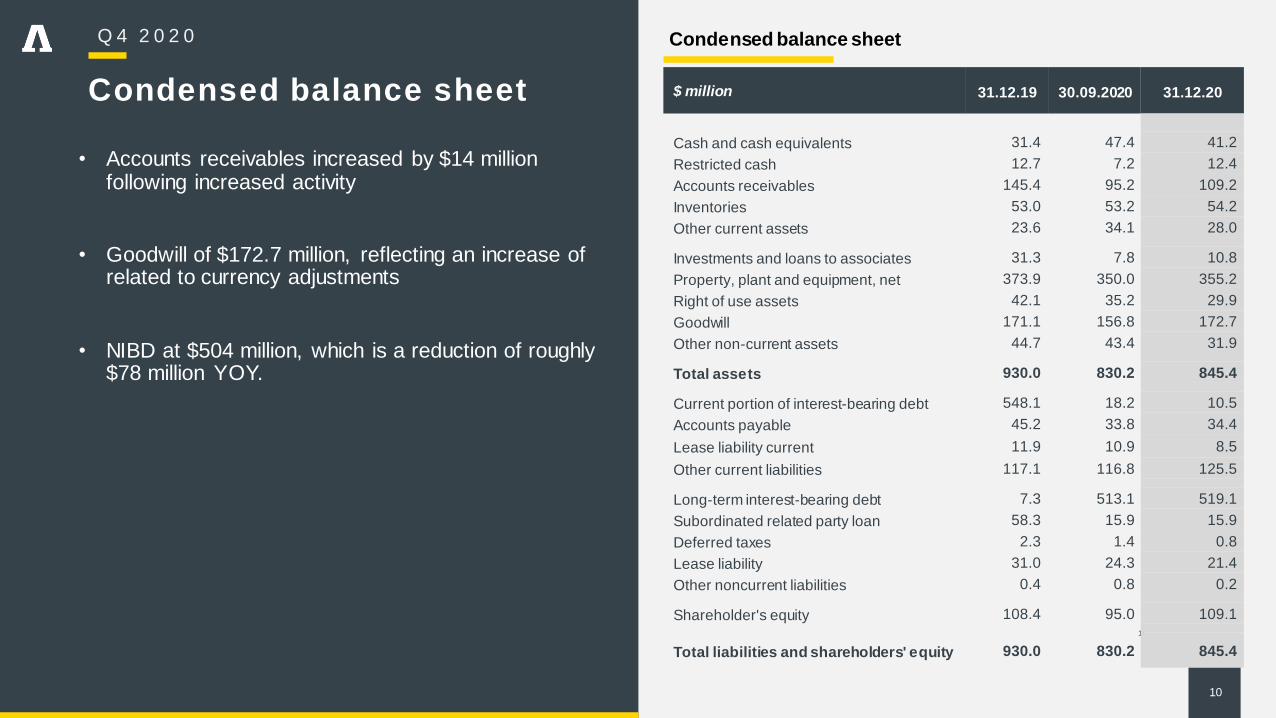
Condensed balance sheet
$ million 31.12.19 30.09.2020 31.12.20
Cash and cash equivalents 31.4 47.4 41.2
Restricted cash 12.7 7.2 12.4
Accounts receivables 145.4 95.2 109.2
Inventories 53.0 53.2 54.2
Other current assets 23.6 34.1 28.0
Investments and loans to associates 31.3 7.8 10.8
Property, plant and equipment, net 373.9 350.0 355.2
Right of use assets 42.1 35.2 29.9
Goodwill 171.1 156.8 172.7
Other non-current assets 44.7 43.4 31.9
Total assets 930.0 830.2 845.4
Current portion of interest-bearing debt 548.1 18.2 10.5
Accounts payable 45.2 33.8 34.4
Lease liability current 11.9 10.9 8.5
Other current liabilities 117.1 116.8 125.5
Long-term interest-bearing debt 7.3 513.1 519.1
Subordinated related party loan 58.3 15.9 15.9
Deferred taxes 2.3 1.4 0.8
Lease liability 31.0 24.3 21.4
Other noncurrent liabilities 0.4 0.8 0.2
Shareholder's equity 108.4 95.0 109.1
Total liabilities and shareholders' equity 930.0 830.2 845.4
Q 4 2 0 2 0
• Accounts receivables increased by $14 million following increased activity
• Goodwill of $172.7 million, reflecting an increase of related to currency adjustments
• NIBD at $504 million, which is a reduction of roughly $78 million YOY.
Condensed balance sheet
11
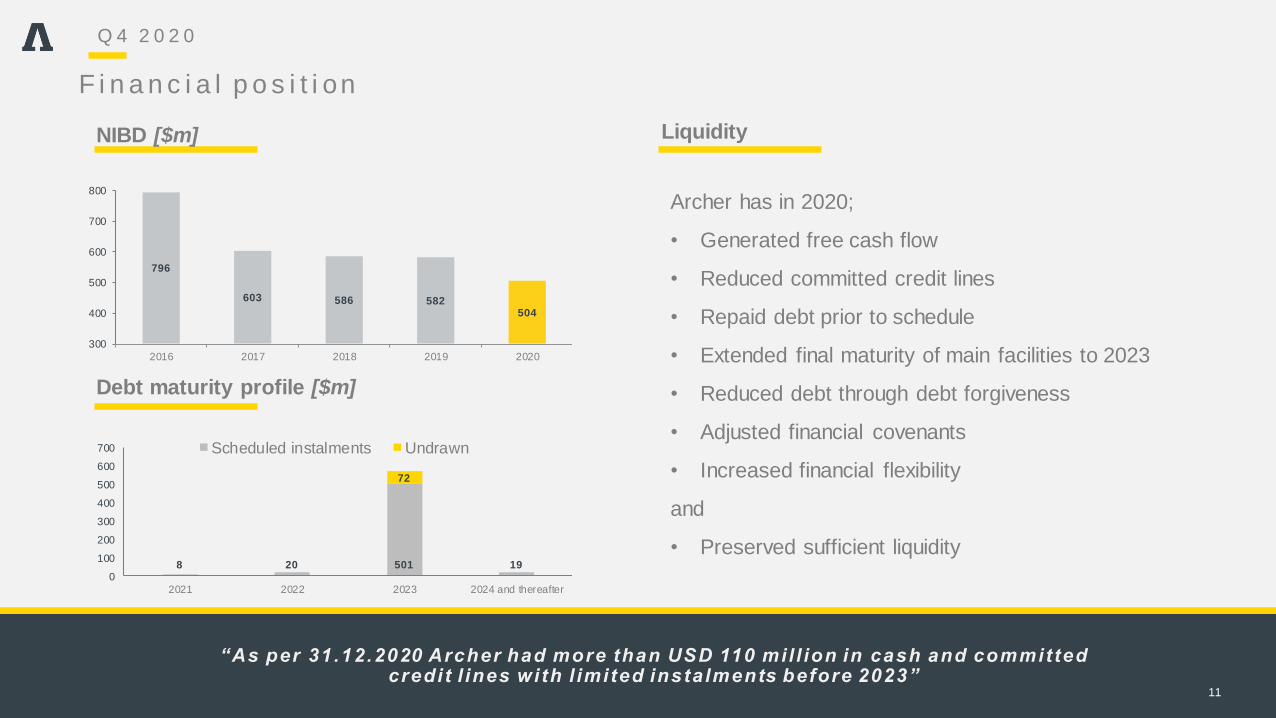
NIBD [$m]
Debt maturity profile [$m]
F i n a n c i a l p o s i t i on
796
603 586 582504
300
400
500
600
700
800
2016 2017 2018 2019 2020
Liquidity
8 20 501 19
72
0
100
200
300
400
500
600
700
2021 2022 2023 2024 and thereafter
Scheduled instalments Undrawn
Archer has in 2020;
• Generated free cash flow
• Reduced committed credit lines
• Repaid debt prior to schedule
• Extended final maturity of main facilities to 2023
• Reduced debt through debt forgiveness
• Adjusted financial covenants
• Increased financial flexibility
and
• Preserved sufficient liquidity
“As per 31.12.2020 Archer had more than USD 110 mil l ion in cash and committed credit l ines with l imited instalments before 2023”
Q 4 2 0 2 0
12
1)
Q 4 2 0 2 0
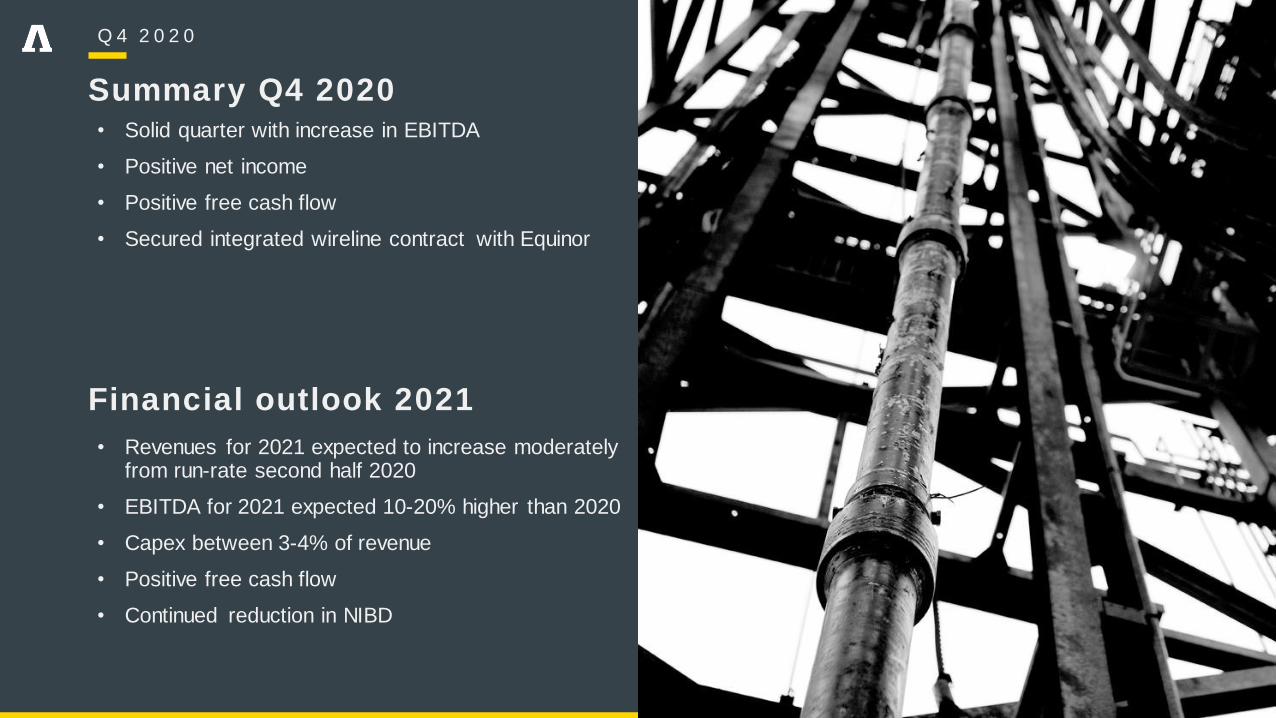
• Solid quarter with increase in EBITDA
• Positive net income
• Positive free cash flow
• Secured integrated wireline contract with Equinor
Summary Q4 2020
Financial outlook 2021
• Revenues for 2021 expected to increase moderately from run-rate second half 2020
• EBITDA for 2021 expected 10-20% higher than 2020
• Capex between 3-4% of revenue
• Positive free cash flow
• Continued reduction in NIBD

Q&A
13
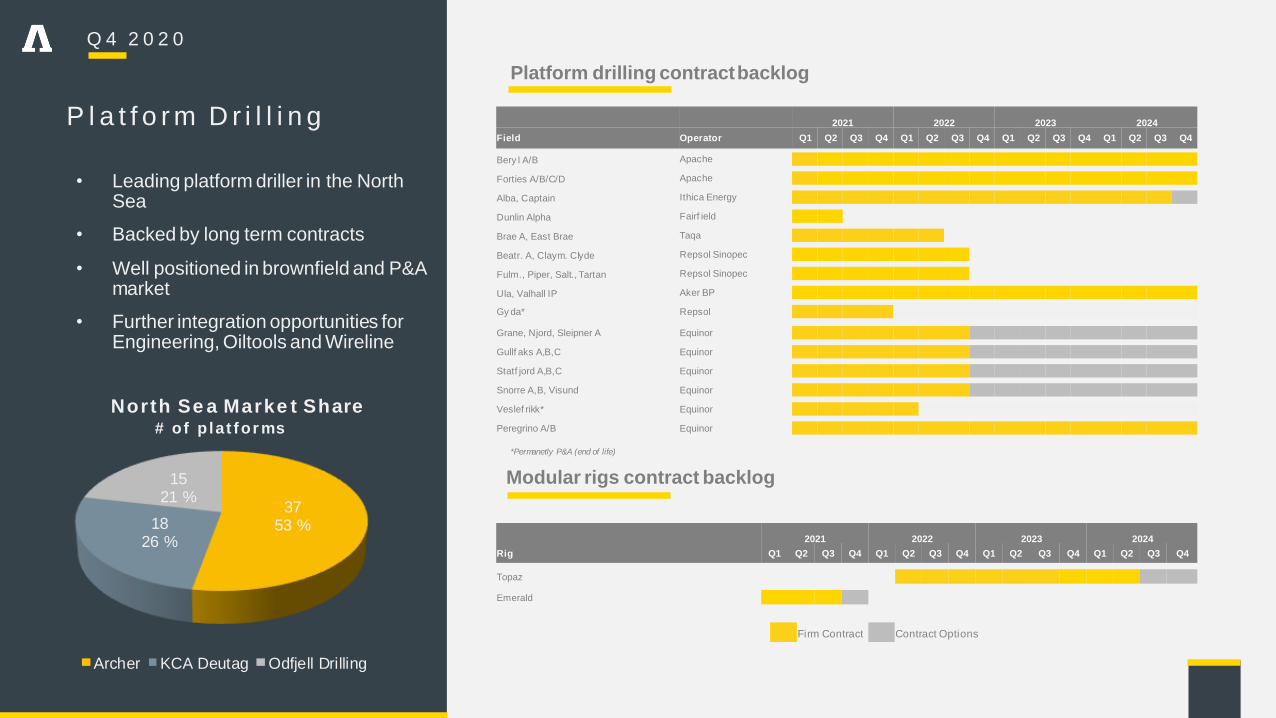
3753 %18
26 %
1521 %
Archer KCA Deutag Odfjell Drilling
Q 4 2 0 2 0
• Leading platform driller in the North Sea
• Backed by long term contracts
• Well positioned in brownfield and P&A market
• Further integration opportunities for Engineering, Oiltools and Wireline
Platform drilling contract backlog
Modular rigs contract backlog
2021 2022 2023 2024
Field Operator Q1 Q2 Q3 Q4 Q1 Q2 Q3 Q4 Q1 Q2 Q3 Q4 Q1 Q2 Q3 Q4
Bery l A/B Apache
Forties A/B/C/D Apache
Alba, Captain Ithica Energy
Dunlin Alpha Fairf ield
Brae A, East Brae Taqa
Beatr. A, Claym. Clyde Repsol Sinopec
Fulm., Piper, Salt., Tartan Repsol Sinopec
Ula, Valhall IP Aker BP
Gy da* Repsol
Grane, Njord, Sleipner A Equinor
Gullf aks A,B,C Equinor
Statf jord A,B,C Equinor
Snorre A,B, Visund Equinor
Veslef rikk* Equinor
Peregrino A/B Equinor
2021 2022 2023 2024
Rig Q1 Q2 Q3 Q4 Q1 Q2 Q3 Q4 Q1 Q2 Q3 Q4 Q1 Q2 Q3 Q4
Topaz
Emerald
Firm Contract Contract Options
P l a t f o r m D r i l l i n g
North Se a Marke t Share # of p lat for ms
*Permanetly P&A (end of life)
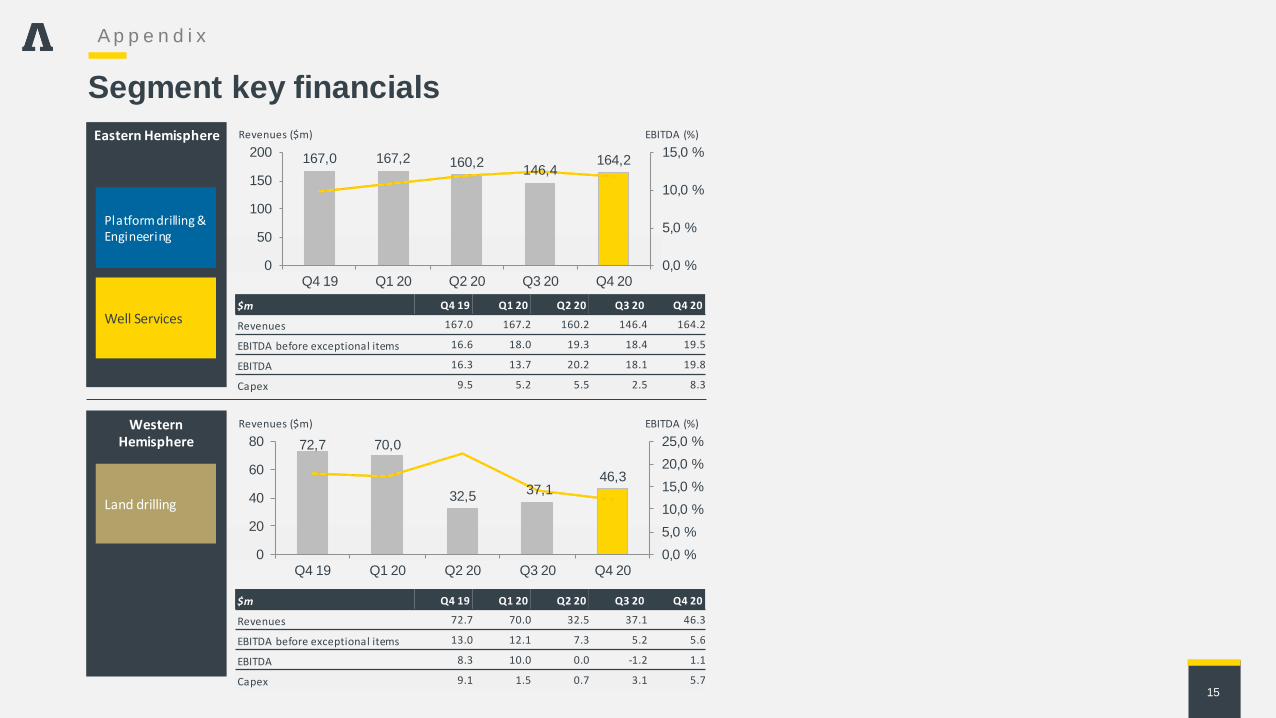
Eastern Hemisphere
Segment key financials
Revenues ($m) EBITDA (%)
15
167,0 167,2 160,2146,4
164,2
0,0 %
5,0 %
10,0 %
15,0 %
0
50
100
150
200
Q4 19 Q1 20 Q2 20 Q3 20 Q4 20
$m Q4 19 Q1 20 Q2 20 Q3 20 Q4 20
Revenues 167.0 167.2 160.2 146.4 164.2
EBITDA before exceptional items 16.6 18.0 19.3 18.4 19.5
EBITDA 16.3 13.7 20.2 18.1 19.8
Capex 9.5 5.2 5.5 2.5 8.3
Western Hemisphere
Revenues ($m) EBITDA (%)
72,7 70,0
32,537,1
46,3
0,0 %
5,0 %
10,0 %
15,0 %
20,0 %
25,0 %
0
20
40
60
80
Q4 19 Q1 20 Q2 20 Q3 20 Q4 20
$m Q4 19 Q1 20 Q2 20 Q3 20 Q4 20
Revenues 72.7 70.0 32.5 37.1 46.3
EBITDA before exceptional items 13.0 12.1 7.3 5.2 5.6
EBITDA 8.3 10.0 0.0 -1.2 1.1
Capex 9.1 1.5 0.7 3.1 5.7
Platform drilling & Engineering
Well Services
Land drilling
15
A p p e n d i x
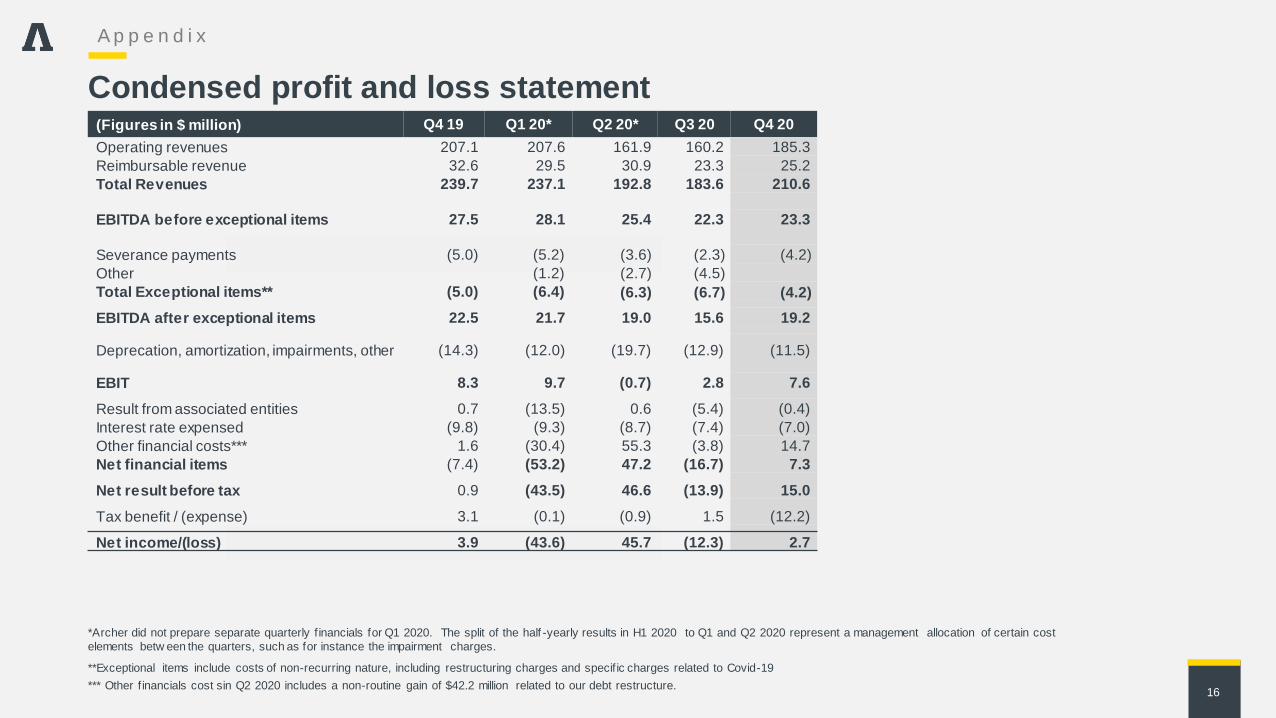
Condensed profit and loss statement
1616
(Figures in $ million) Q4 19 Q1 20* Q2 20* Q3 20 Q4 20
Operating revenues 207.1 207.6 161.9 160.2 185.3
Reimbursable revenue 32.6 29.5 30.9 23.3 25.2
Total Revenues 239.7 237.1 192.8 183.6 210.6
EBITDA before exceptional items 27.5 28.1 25.4 22.3 23.3
Severance payments (5.0) (5.2) (3.6) (2.3) (4.2)
Other (1.2) (2.7) (4.5)
Total Exceptional items** (5.0) (6.4) (6.3) (6.7) (4.2)
EBITDA after exceptional items 22.5 21.7 19.0 15.6 19.2
Deprecation, amortization, impairments, other (14.3) (12.0) (19.7) (12.9) (11.5)
EBIT 8.3 9.7 (0.7) 2.8 7.6
Result from associated entities 0.7 (13.5) 0.6 (5.4) (0.4)
Interest rate expensed (9.8) (9.3) (8.7) (7.4) (7.0)
Other financial costs*** 1.6 (30.4) 55.3 (3.8) 14.7
Net financial items (7.4) (53.2) 47.2 (16.7) 7.3
Net result before tax 0.9 (43.5) 46.6 (13.9) 15.0
Tax benefit / (expense) 3.1 (0.1) (0.9) 1.5 (12.2)
Net income/(loss) 3.9 (43.6) 45.7 (12.3) 2.7
A p p e n d i x
*Archer did not prepare separate quarterly f inancials for Q1 2020. The split of the half -yearly results in H1 2020 to Q1 and Q2 2020 represent a management allocation of certain cost
elements betw een the quarters, such as for instance the impairment charges.
**Exceptional items include costs of non-recurring nature, including restructuring charges and specif ic charges related to Covid-19
*** Other f inancials cost sin Q2 2020 includes a non-routine gain of $42.2 million related to our debt restructure.
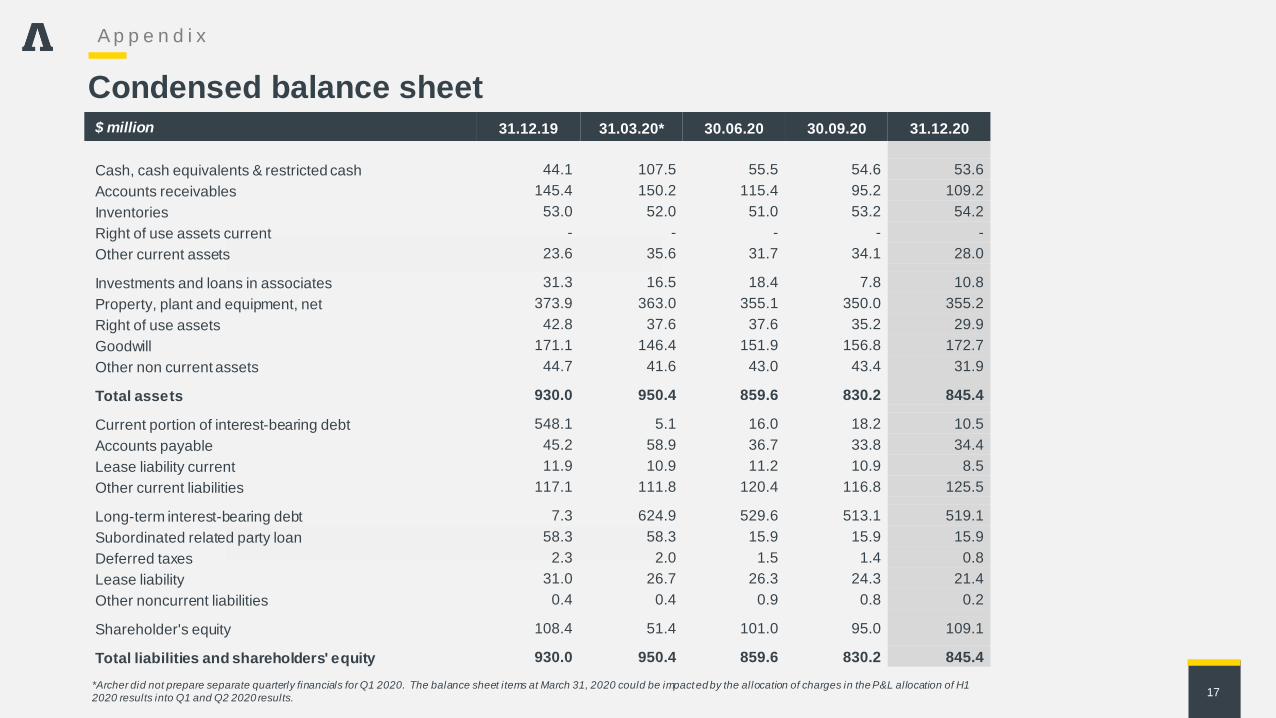
Condensed balance sheet
1717
$ million 31.12.19 31.03.20* 30.06.20 30.09.20 31.12.20
Cash, cash equivalents & restricted cash 44.1 107.5 55.5 54.6 53.6
Accounts receivables 145.4 150.2 115.4 95.2 109.2
Inventories 53.0 52.0 51.0 53.2 54.2
Right of use assets current - - - - -
Other current assets 23.6 35.6 31.7 34.1 28.0
Investments and loans in associates 31.3 16.5 18.4 7.8 10.8
Property, plant and equipment, net 373.9 363.0 355.1 350.0 355.2
Right of use assets 42.8 37.6 37.6 35.2 29.9
Goodwill 171.1 146.4 151.9 156.8 172.7
Other non current assets 44.7 41.6 43.0 43.4 31.9
Total assets 930.0 950.4 859.6 830.2 845.4
Current portion of interest-bearing debt 548.1 5.1 16.0 18.2 10.5
Accounts payable 45.2 58.9 36.7 33.8 34.4
Lease liability current 11.9 10.9 11.2 10.9 8.5
Other current liabilities 117.1 111.8 120.4 116.8 125.5
Long-term interest-bearing debt 7.3 624.9 529.6 513.1 519.1
Subordinated related party loan 58.3 58.3 15.9 15.9 15.9
Deferred taxes 2.3 2.0 1.5 1.4 0.8
Lease liability 31.0 26.7 26.3 24.3 21.4
Other noncurrent liabilities 0.4 0.4 0.9 0.8 0.2
Shareholder's equity 108.4 51.4 101.0 95.0 109.1
Total liabilities and shareholders' equity 930.0 950.4 859.6 830.2 845.4
A p p e n d i x
*Archer did not prepare separate quarterly financials for Q1 2020. The balance sheet items at March 31, 2020 could be impacted by the allocation of charges in the P&L allocation of H1
2020 results into Q1 and Q2 2020 results.
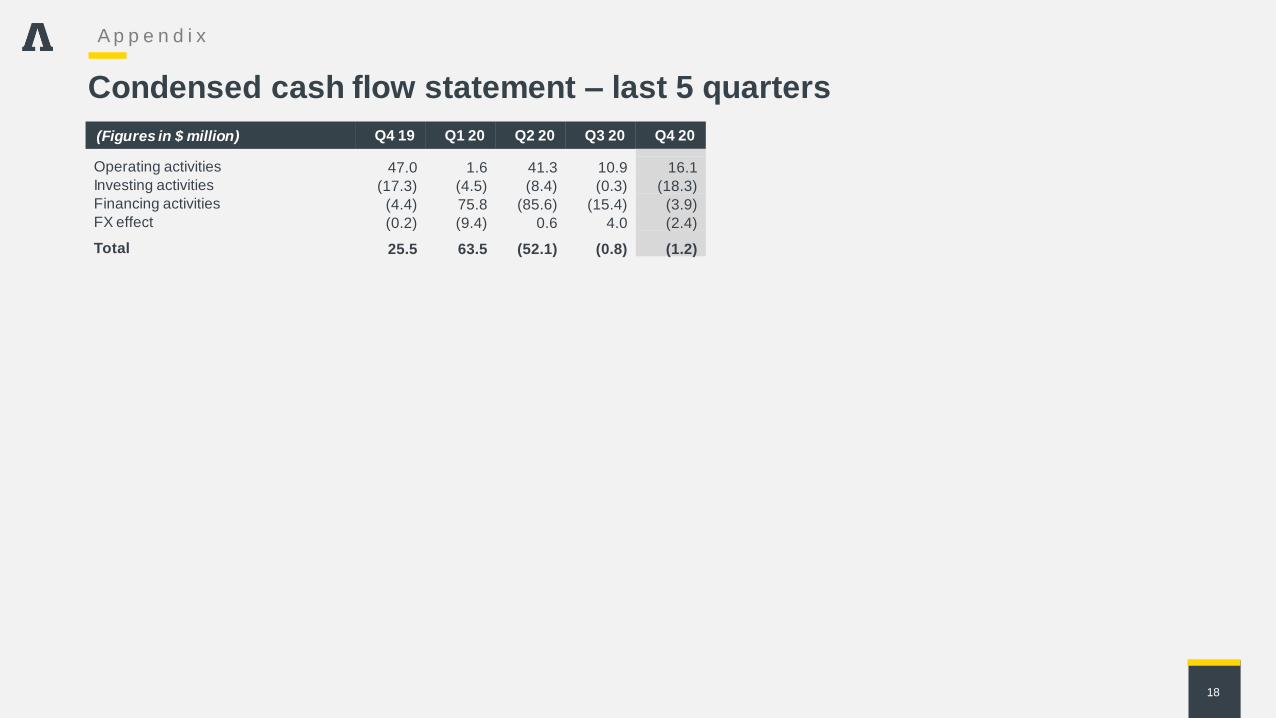
Condensed cash flow statement – last 5 quarters
(Figures in $ million) Q4 19 Q1 20 Q2 20 Q3 20 Q4 20
Operating activities 47.0 1.6 41.3 10.9 16.1
Investing activities (17.3) (4.5) (8.4) (0.3) (18.3)
Financing activities (4.4) 75.8 (85.6) (15.4) (3.9)
FX effect (0.2) (9.4) 0.6 4.0 (2.4)
Total 25.5 63.5 (52.1) (0.8) (1.2)
18
A p p e n d i x