
bp full year & fourth quarter 2021 financial results & update on ...
86
8 February 2022 bp full year & fourth quarter 2021 financial results & update on strategic progress
-
Upload
khangminh22 -
Category
Documents
-
view
0 -
download
0
Transcript of bp full year & fourth quarter 2021 financial results & update on ...

8 February 2022
bp full year & fourth quarter 2021 financial results &
update on strategic progress

svp investor relations
Good morning, everyone, and thank you for joining Bernard, Murray and Itoday.
2

Full year and fourth quarter 2021 results
Strategic progress
Financial frame
Investor proposition
Q&A
3
We have a slightly extended presentation today.
In a moment I’ll hand over to Bernard to introduce and cover the full yearhighlights, and Murray will take you through our fourth quarter results.
Then we will turn to strategy, and Bernard and Murray will update you on ourprogress and financial frame. Following that we’ll make sure we leave plentyof time for your questions.
3

FY & 4Q 2021 financial results & update on strategic progress
Cautionary statementIn order to utilize the ‘safe harbor’ provisions of the United States Private Securities Litigation Reform Act of 1995 (the ‘PSLRA’) and the general doctrine of cautionary statements, bp is providing the following cautionary statement: The discussion in this results announcement contains certain forecasts, projectionsand forward-looking statements - that is, statements related to future, not past events and circumstances - with respect to the financial condition, results of operations and businesses of bp and certain of the plans and objectives of bp with respect to these items. These statements may generally, but not always, beidentified by the use of words such as ‘will’, ‘expects’, ‘is expected to’, ‘aims’, ‘should’, ‘may’, ‘objective’, ‘is likely to’, ‘intends’, ‘believes’, ‘anticipates’, ‘plans’, ‘we see’, ‘focus on’ or similar expressions.
In particular, the following, among other statements, are all forward looking in nature:
expectations regarding the impact of LNG contracts on adjusting items and underlying replacement cost profit; expectations regarding the COVID-19 pandemic, including its consequences, the impact on bp’s financial performance, the potential reversal of such impacts, and the impact on the trading environment andmargins; expectations regarding the pace of transition to a lower-carbon economy and energy system; plans, expectations and assumptions regarding oil and gas demand, supply or prices, storage, the timing of production of reserves, or decision making by OPEC+; plans, expectations and assumptions related toelectricity demand; plans and expectations regarding bp’s performance, earnings, returns, capital expenditure and market position through 2025 and/or 2030 at the group, segment and business level, including with respect to bp’s resilient hydrocarbons, convenience and mobility and low carbon energy businesses;plans and expectations related to earnings growth, including that resilient hydrocarbons will sustain EBITDA at around $33 billion through 2025 and maintain $30-35 billion of EBITDA until 2030 at broadly consistent price assumptions with returns of 12-15%, that EBITDA from convenience and mobility will reacharound $7 billion by 2025 and $9-10 billion by 2030 while generating returns of at least 15-20%, that EBITDA for bp’s low carbon businesses will grow between 2025 and 2030 with potential to reach $2-3 billion of EBITDA by 2030, that EBITDA from transition growth businesses will reach $9-10 billion by 2030, andthat underlying EBITDA growth in refining (excluding biofuels) will reach $2 billion by 2030; plans and expectations that bp can deliver a 7-9% EBIDA per share CAGR between 2H19/1H20 and 2025, and ROACE of 12-14% at oil prices of $50-60 per barrel in 2020 real terms, and that bp will be able to continue to growEBITDA while continuing to achieve returns of 12-14% during the energy transition; plans and expectations regarding capital expenditure into transition at over 40% by 2025, rising to around 50% by 2030, and capital employed in transition rising from over 20% in 2025 to around 40% by 2030; plans and expectationsregarding cash cost savings; plans and expectations to maintain a capital frame of $14-16 billion per annum through 2025 and to sustain this level through 2030, as well as plans and expectations related to bp’s planned investment hurdles, returns expectations and payback periods; plans and expectations regardingbp’s five growth engines of biofuels, convenience, EV charging, renewable power and hydrogen, including plans and expectations related to allocation of capital expenditure, levered returns and EBITDA growth, including the expectation that low-carbon businesses can deliver $9-10 billion of EBITDA by 2030; plansand expectations regarding bp’s next-gen mobility business, including EV charging earnings growth, growth of bp’s network of EV charge points, energy sales, utilisation rates and footfall at convenience stores, plans to scale up strategic convenience sites by 2030 and expand in growth retail markets with a focus onIndia, plans, expectations and assumptions related to bp’s margin share from convenience and electrification, and the expectation that the EV charging business will deliver more than a third of bp’s overall EBITDA growth from convenience and mobility to 2030; plans and expectations regarding resilient hydrocarbons,including expectations related to earnings through 2030, plans to high grade bp’s oil and gas portfolio and plans related to growth of bio-diesel and bp’s bio-refineries, co-processing and sustainable aviation fuel and plans, and expectations regarding bp’s oil and gas capital frame and investment plan; expectationsregarding Solomon availability, turnaround improvement plans, business improvement plans, and related costs; expectations regarding refining margins, refinery utilization rates and product demand; expectations regarding bp’s future financial performance and cash flows; expectations regarding future hydrocarbonproduction, managed base decline, unit production costs and project ramp-up; plans and expectations regarding integrated energy value chains; expectations regarding supply shortages; expectations with respect to completion of transactions and the timing and amount of proceeds of agreed disposals, including bp’saim to divest around 700k/boed by 2030; expectations with regards to bp’s transformation to an IEC, including growth in sectors made possible by the transition, such as electrification and biofuels; plans and expectations regarding bp’s financial framework and distribution model; expectations regarding priceassumptions used in accounting estimates; bp’s plans and expectations regarding the allocation of surplus cash flow and cash balance point; plans regarding future quarterly dividends and the amount and timing of share buybacks; plans and expectations regarding a resilient dividend; plans and expectations regardingbp’s credit rating, including in respect of maintaining a strong investment grade credit rating; plans and expectations regarding capital discipline; expectations regarding bp’s development of hydrogen projects, CCUS projects, low carbon energy hubs and offshore wind projects, including that bp’s first green hydrogenproject will start-up from 2024, and well as plans and expectations for bp’s hoppers of hydrogen and wind projects and future bids; plans and expectation’s regarding bp’s ability in hydrogen to grow scale in key regionally integrated markets and create a portfolio of globally advantaged supply hubs, and expectationsregarding a target 2024 start-up for certain hydrogen projects; plans and expectations regarding start-ups during 2022; plans and expectations regarding the implications of the energy transition for bp; plans and expectations in renewables to develop a target of 20 gigawatts net to FID by 2025 and a target of 50gigawatts net to FID by 2030; plans and expectations regarding average expected returns in bp’s renewables project and hydrogen portfolios, anticipated investment in renewables and hydrogen, and anticipated earnings from renewables and hydrogen, each through 2030; expectations of disposal proceeds of $25billion by 2025; plans and expectations of around $14-15 billion capital expenditure in 2022; plans and expectations regarding’s bp Scope 1, Scope 2 and Scope 3 emissions, net zero aims and methane intensity; plans and expectations regarding bp’s sustainability frames, including expectations related to third partyratings of bp’s ESG performance and ambitions, and plans and expectations regarding Rosneft’s environmental performance and aims; plans and expectations of further improvement in bp’s reliability and availability; plans and expectations regarding bp’s Castrol, aviation and B2B and midstream businesses; and plansand expectations regarding joint ventures, partnerships and other collaborations with Empire Wind and Beacon offshore wind projects, EnBW for the ScotWind licensing round and Lightsource bp.
By their nature, forward-looking statements involve risk and uncertainty because they relate to events and depend on circumstances that will or may occur in the future and are outside the control of bp.
Actual results may differ materially from those expressed in such statements, depending on a variety of factors, including: the extent and duration of the impact of current market conditions including the volatility of oil prices, the impact of COVID-19, overall global economic and business conditions impacting ourbusiness and demand for our products as well as the specific factors identified in the discussions accompanying such forward-looking statements; changes in consumer preferences and societal expectations; the pace of development and adoption of alternative energy solutions; developments in policy, law,regulation, technology and markets, including societal and investor sentiment, related to the issue of climate change; the receipt of relevant third party and/or regulatory approvals; the timing and level of maintenance and/or turnaround activity; the timing and volume of refinery additions and outages; the timing ofbringing new fields onstream; the timing, quantum and nature of certain acquisitions and divestments; future levels of industry product supply, demand and pricing, including supply growth in North America and continued base oil and additive supply shortages; OPEC+ quota restrictions; PSA and TSC effects;operational and safety problems; potential lapses in product quality; economic and financial market conditions generally or in various countries and regions; political stability and economic growth in relevant areas of the world; changes in laws and governmental regulations; regulatory or legal actions including thetypes of enforcement action pursued and the nature of remedies sought or imposed; the actions of prosecutors, regulatory authorities and courts; delays in the processes for resolving claims; amounts ultimately payable and timing of payments relating to the Gulf of Mexico oil spill; exchange rate fluctuations;development and use of new technology; recruitment and retention of a skilled workforce; the success or otherwise of partnering; the actions of competitors, trading partners, contractors, subcontractors, creditors, rating agencies and others; our access to future credit resources; business disruption and crisismanagement; the impact on our reputation of ethical misconduct and non-compliance with regulatory obligations; trading losses; major uninsured losses; decisions by Rosneft’s management and board of directors; the actions of contractors; natural disasters and adverse weather conditions; changes in publicexpectations and other changes to business conditions; wars and acts of terrorism; cyber-attacks or sabotage; and other factors discussed elsewhere in this report, as well those factors discussed under “Risk factors” in bp Annual Report and Form 20-F 2020 as filed with the US Securities and Exchange Commissionand those factors discussed under “Principal risks and uncertainties” in bp’s Report on Form 6-K regarding results for the six-month period ended 30 June 2021.
Reconciliations to GAAP - This presentation also contains financial information which is not presented in accordance with generally accepted accounting principles (GAAP). A quantitative reconciliation of this information to the most directly comparable financial measure calculated and presented in accordance withGAAP can be found on our website at www.bp.com.
This presentation contains references to non-proved resources and production outlooks based on non-proved resources that the SEC's rules prohibit us from including in our filings with the SEC. U.S. investors are urged to consider closely the disclosures in our Form 20-F, SEC File No. 1-06262.
Tables and projections in this presentation are bp projections unless otherwise stated.
February 2022
* For items marked with an asterisk throughout this document, definitions are provided in the glossary
4
Before we begin, I’d like to draw your attention to the cautionary statementincluded in our presentation slide deck. During today’s presentation, we willmake forward-looking statements, including those that refer to our estimates,plans, targets, aims and expectations. Actual results and outcomes coulddiffer materially due to factors noted in our cautionary statement and in our UKand SEC filings. Please refer to these filings, which are available on ourwebsite, for more details.
Over to you Bernard.
4

Chief executive officer
Thanks Craig, and good morning to everyone joining us on the phone and web.
I’m also delighted that we are able to host a small audience here in-person.
5

FY & 4Q 2021 financial results & update on strategic progress 6
The leadership team
Emma DelaneyEVP, customers
and products
Eric NitcherEVP, legal
Carol HowleEVP, trading and
shipping
Gordon BirrellEVP, production and operations
Kerry DryburghEVP, people and
culture
Giulia ChierchiaEVP, strategy
and sustainability
William LinEVP, regions,
cities and solutions
Emeka Emembolu1
Chief of staff
Murray AuchinclossChief financial
officer
Anja-Isabel Dotzenrath1
EVP, gas & low carbon energy
Leigh-Ann Russell1
EVP, innovation and engineering
Bernard LooneyChief executive
officer
(1) Effective 1 March 2022 6FY & 4Q 2021 financial results & update on strategic progress
This includes my leadership team – with the exception of Anja who joins uson March 1st – which we’re all very excited about. I also want to introduce youto two new members of the team - Leigh-Ann who takes over from DavidEyton – and Emeka who takes over from Dominic Emery. All on March 1st.
And for those of you on the web, you can see them up on this slide.
The last time we held an in-person event was two years ago – and so it isfantastic to welcome those of you joining us here today. Hopefully a little signof progress and confidence in the future.
6

Chief executive officer
In the two years since laying out our new ambition – we have been through aperiod of significant change.
At the same time - the world around us has changed; COVID, volatility inenergy markets and the accelerating energy transition.
With this backdrop, it feels like a good time to pause for a moment - andreflect on our journey so far.
The bp we see today is a company that has successfully completed a periodof significant change, one that sees clear and compelling growth opportunitiespresented by the energy transition, and one that is 100% focused ondelivering the plan we laid out. What - by now you know - we call “performingwhile transforming”.
Before we get started, we’ve got a short video to share with you…
7

FY & 4Q 2021 financial results & update on strategic progress
underlying replacementcost profit*
operating cash flow* including $5.3bn working capital* build1
per ordinary share dividend for 4Q21
buybacks announced from 2021 surplus cash flow*
Performing – building a strong track record in 2021
cash cost savings2 target delivered ahead of schedule
net debt* reduction
ROACE*
Full year and fourth quarter 2021 results
8
Continued focus on reducing emissions and driving continuous safety improvementFY & 4Q 2021 financial results & update on strategic progress(1) Adjusted for inventory holding gains and fair value accounting effects (2) Relative to 2019
I personally think it’s amazing to see what the team has delivered – especiallyconsidering how much was done virtually in the midst of a pandemic. I hope itgives you some confidence in our ability to get things done.
So, let’s get into that in a bit more detail, starting with the full year results for2021. We delivered:
− underlying replacement cost profit of $12.8 billion
− operating cash flow of $23.6 billion, including a working capital build of$5.3 billion, and
− return on average capital employed of 13.3% - the highest level for adecade.
In addition:
− we delivered our target of $2.5 billion of cash cost savings on a run-ratebasis relative to 2019, ahead of schedule
− we reduced our net debt by over $8 billion
− we raised our dividend per ordinary share in the second quarter by 4%;and
− including the $1.5 billion share buyback announced today, we will havedelivered share buybacks from 2021 surplus cash flow totalling $4.15billion.
8

FY & 4Q 2021 financial results & update on strategic progress
Transforming – strategic progress
2021201920212019
Renewables pipeline* UK and US offshore wind pipeline
1.45GW ScotWind lease option award
Low carbon hydrogen* hopper*
20212019
Full year and fourth quarter 2021 results
FY & 4Q 2021 financial results & update on strategic progress 9Renewables pipeline* and hydrogen* hopper* are net to bp
Next, to our progress in transforming bp.
Since we announced our strategy to become an integrated energy company,we have been building momentum across each of our three strategic focusareas:
In Resilient hydrocarbons, we have:
− started up 11 major projects since the start of 2020, thereby deliveringour 2016 target of bringing 900 thousand barrels of new high-marginproduction online.
In convenience and mobility, we have:
− grown margin share from convenience and electrification by 4% since2019 – demonstrating the strength of our customer offers; and
− increased the number of EV charge points to over 13,000 across the UK,Europe, India and China.
And, in Low carbon energy, we have:
− entered offshore wind – with a pipeline of 5.2 gigawatts net to bp today,following the recent ScotWind lease option award of 1.5 gigawatts net
− built a renewables pipeline which at the end of 2021 stood at 23gigawatts, a four-fold increase since the end of 2019; and
− made exciting progress in hydrogen – having grown a hopper of between
9

0.7 and 1.3 mtpa.
Progress like this – as well as the pace at which the world is moving– leads us to believe we can accelerate our plans in some areas andreinforces our confidence in delivering our 2025 targets.
Before we get into the detail around that – let me first bring inMurray to discuss our 4Q results.
Murray…
9

Chief financial officer
Thanks Bernard and good morning everyone.
10

FY & 4Q 2021 financial results & update on strategic progress
An improving but volatile macro environment
Natural gas price1 $/mmbtu Refining marker margin* 1 $/bblOil price1 $/bbl
JKMHenry HubBrent RMM*NBP
Source: Platts - all data 1 January 2021 to 2 February 2022
(1) Spot price 11
Full year and fourth quarter 2021 results
I’ll start as usual with the macro environment.
During the fourth quarter Brent rose by 8% to average $80 per barrel, itshighest level in seven years. To date in 2022, Brent has moved above $90,with supply disruptions, easing concerns around Omicron and the expectationof continued declines in inventories. Looking ahead, we expect supply anddemand to move back towards balance through 2022. However, with lowerlevels of spare capacity, price volatility is likely.
Turning to gas. During the quarter, seasonal demand saw Henry Hub rise by10% to an average $4.70. International prices rose sharply with NBP and JKMaround 90% higher than in the third quarter. This was caused by low inventorylevels and concerns about the availability of supply during the winter months.With ongoing geopolitical uncertainty, and low storage levels we see thepotential for continued price volatility.
Turning to refining. Industry margins remained broadly flat compared to thethird quarter and we expect them to remain at similar levels during the firstquarter. Local margins may be impacted by lockdowns.
11

FY & 4Q 2021 financial results & update on strategic progress
Underlying results$bn 4Q20 3Q21 4Q21
Underlying RCPBIT* 1.0 5.9 7.0
Gas & low carbon energy 0.2 1.8 2.2
Oil production & operations 0.6 2.5 4.0
Customers & products 0.1 1.2 0.6
Rosneft* 0.3 0.9 0.7
Other businesses and corporate (0.1) (0.4) (0.5)
Consolidation adjustment - UPII* (0.1) (0.0) (0.0)
Underlying replacement cost profit* 0.1 3.3 4.1
Operating cash flow* 2.3 6.0 6.1
Capital expenditure* (3.5) (2.9) (3.6)
Divestment and other proceeds 4.2 0.3 2.3
Net issue (repurchase) of shares 0.0 (0.9) (1.7)
Net debt* 38.9 32.0 30.6
Announced dividend per ordinary share (cents per share) 5.25 5.46 5.46
4Q 2021 vs 3Q 2021
▪ Higher oil and gas realisations*
▪ Higher upstream production
▪ Stronger refining commercial
optimisation
▪ Significantly lower oil trading result
and an average contribution from
gas marketing and trading
▪ Higher energy costs
Full year and fourth quarter 2021 results
12FY & 4Q 2021 financial results & update on strategic progress
Moving to our results.
In the fourth quarter we reported an underlying replacement cost profit of $4.1billion compared to $3.3 billion last quarter.
Compared to the third quarter:
In gas and low carbon energy the result benefitted from higher gas realisationsand higher production due to major project ramp-up. After an exceptional firstnine months it was an average quarter for gas marketing and trading;
In oil production and operations the result reflects higher liquids and gasrealisations - this includes the benefit of very strong NBP prices. The resultalso reflects higher production including a recovery in the Gulf of Mexico fromthe impact of Hurricane Ida; and
In customers and products, the products result was impacted by a significantlylower oil trading result and higher energy costs. The customers result reflectsresilient retail and convenience performance despite seasonality and COVID-19 impacts. In Castrol volumes were higher, although results continue to beimpacted by high base oil prices and additive shortages.
For the fourth quarter, bp has announced a dividend of 5.46 cents per ordinaryshare, payable in the first quarter.
12

FY & 4Q 2021 financial results & update on strategic progress
Cash flow and balance sheet
FY21 and 4Q highlights
▪ $6.1bn 4Q21 operating cash flow* including
▪ $2.2bn working capital*1 build
▪ $7.6bn FY21 disposal proceeds* with $2.3bn in 4Q21
▪ $6.3bn FY21 surplus cash flow* with $3.0bn in 4Q21
▪ $1.725bn buyback executed in 4Q21
▪ Further $1.5bn buyback prior to 1Q22 results
▪ Net debt* reduced to $30.6bn
2021 cash inflows/outflows $bn
(1) Adjusted for inventory holding gains and fair value accounting effects 13
Full year and fourth quarter 2021 results
Turning to cash flow.
Operating cash flow was $6.1 billion in the fourth quarter. This included aworking capital build of $2.2 billion.
Capital expenditure was $3.6 billion for the fourth quarter.
And disposal proceeds were $2.3 billion. This includes $1.5 billion related tothe sale of our Alaska business to Hilcorp in 2020. With proceeds of $7.6billion received during 2021, we have received $12.8 billion of proceedsagainst a target of $25 billion by 2025.
Strong cash flow generation enabled us to deliver surplus cash flow of $3.0billion for the quarter and $6.3 billion for the full year. This underpinned afurther reduction in net debt and supports our continued share buybacks.
During the quarter:
− Net debt fell for the seventh consecutive quarter to reach $30.6 billion atyear-end;
− A share buyback of $1.725 billion was executed. This included the $1.25billion announced with third quarter results and $475 million to completethe programme announced with second quarter results; and
− We intend to execute a further $1.5 billion share buyback prior toannouncing first quarter 2022 results.
13

FY & 4Q 2021 financial results & update on strategic progress
Delivered against the 2021 financial frame
(1) Includes OB&C*
(2) In addition, $500m share buyback completed during 2Q21 to offset dilution from vesting of awards under employee share schemes 14
Full year and fourth quarter 2021 results
Let me then summarise the progress made during 2021 against our financialframe.
We have a clear set of priorities.
First, a resilient dividend. We announced a 4% increase in the dividend pershare with second quarter 2021 results.
Second, a strong investment grade credit rating. During 2021 we achieved our$35 billion net debt target around a year earlier than expected and reducednet debt by over $8 billion.
Third, disciplined investment allocation. 2021 capital expenditure was $12.8billion including inorganics – in-line with guidance of around $13 billion.
And fourth, share buybacks. For the year we announced $4.15 billion ofbuybacks from surplus cash flow. That takes us to total announcedshareholder distributions of $8.4 billion for the year – around the level ofannual dividend distributions in 2019.
I will update you on our 2022 plans shortly, but for now let me hand back toBernard.
14

Chief executive officer
Thanks Murray.
I am going to speak for just over half an hour before handing back to Murrayto cover the financial frame. Then I will close and we’ll move to Q&A.
15

FY & 4Q 2021 financial results & update on strategic progress
Our strategy to transform into an IEC remains unchangedStrategic progress
16
Let me turn now to our strategic progress.
We now have two years under our belt. We have made progress on our 2025targets. And we are increasingly confident - not just in those targets - but inthe opportunities presented by the energy transition.
Before we get into the detail, let me remind you of that strategy – which Iwould add, remains unchanged.
It is a three-part strategy:
Part 1. Resilient hydrocarbons
Part 2. Convenience and mobility; and
Part 3. Low carbon energy.
Embedded across these is our sustainability frame, which sets out our aimsfor getting to net zero, improving people’s lives and caring for our planet.
And binding it all together is integration. Harnessing our collective capabilitiesas the energy system transitions, to help more and more customers get theclean, reliable and affordable energy they want - and in doing so – creatingvalue for our shareholders.
We sum up all of this as bp transforming from an International Oil Company toan Integrated Energy Company.
16

FY & 4Q 2021 financial results & update on strategic progress
Our progress so far
▪ New purpose
▪ New ambition
▪ New strategy
▪ New financial frame
▪ New sustainability frame
▪ New leadership team
▪ Restructuring completed
▪ Disclosures enhanced
▪ Capability expanded
▪ Shareholder distributions increased
▪ Balance sheet strengthened
Strategic progress
17FY & 4Q 2021 financial results & update on strategic progress
And I would say we have already made significant progress in thistransformation.
In year 1 – 2020 – we set out a new direction - a new purpose, a newambition, a new strategy, a new financial frame, a new sustainability frame;and a new leadership team. That is now done.
Year 2 – 2021 – was about change and the largest restructuring in our history– so that we are organised to deliver. That is also now done.
With all of this now behind us – the decks are clear. Year 3 – 2022 – and,indeed, beyond – is about one thing and one thing only – delivery. The safe,efficient and disciplined delivery of the plans we have laid out.
And maybe our biggest takeaway from our experience thus far: that as wetransform – we must perform. Our shareholders expect and deserve nothingless – and I hope our results show you that we are doing just that.
17

FY & 4Q 2021 financial results & update on strategic progress
From IOC to IEC
Confidence in 2025 delivery, EBITDA*
growth to 20301
EBITDA from resilient hydrocarbons sustained through 20301
Greening accelerated –net zero operations, production and sales2
Capital discipline, balance sheet deleverage, focus on shareholder returns
Strategic progress
18
$9-10bn EBITDA* from transition growth businesses by 20301
(1) 2030 represent aims, at $60/bbl (2020 real) and bp planning assumptions(2) By 2050 or sooner, see glossary for definition of net zero, net zero operations, net zero production & net zero sales
I will be emphasising six points today and that was Point 1: direction is set,change is done, we are now focused on delivery.
We will cover these points through the presentation, but let me brieflysummarise.
18

FY & 4Q 2021 financial results & update on strategic progress
Confidence in 2025 deliveryTwo year track record of strategic delivery
Growing EBITDA* to ~$40bn in 2025
▪ Sustaining from resilient hydrocarbons at ~$33bn
▪ Rateable growth from convenience and mobility to ~$7bn
Disciplined application of our financial frame
▪ $14-16bn capital expenditure* p.a.
▪ Transition spend rising to >40% by 2025
▪ Commitment to allocate ≥60% surplus cash flow*
to share buybacks5
▪ Resilient and growing dividend within a 2021-2025 average cash balance point* of ~$40/bbl
(1) 2H19/1H20 to 2025 at $50-60/bbl (2020 real), at bp planning assumptions (2) 2025 at $50-60/bbl (2020 real), at bp planning assumptions(3) Excludes goodwill and cash and cash equivalent(4) By 2025 (5) Subject to maintaining a strong investment grade credit rating 19FY & 4Q 2021 financial results & update on strategic progress
Strategic progress
Point 2.
We have confidence in delivering our key 2025 financial targets.
This is underpinned by:
− Resilient hydrocarbons, where we expect to sustain EBITDA at around$33 billion
− Convenience and mobility, where we expect rateable EBITDA growth toaround $7 billion; and
− our disciplined financial frame, including:
− annual capital expenditure unchanged at $14-16 billion, of which atleast 40% is expected to be invested in the transition by 2025;
− a commitment to return at least 60% surplus cash flow throughshare buybacks, subject to maintaining a strong investment gradecredit rating; and
− a resilient and growing dividend.
As a result, we remain on track to deliver:
− a 7-9% EBIDA per share CAGR
− 12-14% ROACE; and
− at least 20% of capital employed in the transition.
19

FY & 4Q 2021 financial results & update on strategic progress
Aiming for EBITDA growth to 2030
All numbers represent 2030 aims, at $60/bbl Brent (2020, real) and bp planning assumptions
Strategic progress
20
And we aim to continue to grow EBITDA to 2030. We plan to do this by:
sustaining EBITDA from resilient hydrocarbons
continuing rateable growth in convenience and mobility, and
aiming to deliver a $2 to 3 billion contribution from low carbon energy.
Point 3.
We aim to sustain EBITDA from our hydrocarbons business by:
− high-grading our oil and gas portfolio
− growing the underlying contribution from refining, and
− deepening our investment in bioenergy.
Point 4
We aim to deliver between $9 and 10 billion of EBITDA from transition growthbusinesses by 2030, up from $1bn today, driven by five transition growthengines:
− Bioenergy
− Convenience
− EV charging
20

− Renewables; and
− Hydrogen.
You can think of them as non-fossil and in high growth sectors.
20

FY & 4Q 2021 financial results & update on strategic progress
Transition growth businesses
21
(1) Expected returns (IRR)(2) Excludes goodwill and cash and cash equivalent(3) 2030 EBITDA* aim, at $60/bbl Brent (2020, real) and bp planning assumptions
Strategic progress
In each of these areas – our experience, our skills, our networks, our brand,our assets – gives us real competitive advantage.
Capital expenditure invested into transition is expected to be over 40% of totalspend by 2025, rising to around 50% by 2030. This leads to capital employedin transition rising from over 20% at 2025 to around 40% by 2030. On thechart – you can see the returns we expect.
And all of this within our existing $14-16 billion capital frame.
21

FY & 4Q 2021 financial results & update on strategic progress
From IOC to IEC
Confidence in 2025 delivery, EBITDA*
growth to 20301
EBITDA* from resilient hydrocarbons sustained through 20301
Greening accelerated –net zero operations, production and sales2
Capital discipline, balance sheet deleverage, focus on shareholder returns
Strategic progress
22
$9-10bn EBITDA* from transition growth businesses by 20301
(1) 2030 represent aims, at $60/bbl (2020 real) and bp planning assumptions(2) By 2050 or sooner, see glossary for definition of net zero, net zero operations, net zero production & net zero sales
Point 5.
We are now aiming for net zero emissions across operations, production andsales by 2050 or sooner.
Finally, point 6.
We will remain focused on the disciplined application of our financial frame -providing compelling shareholder distributions, while continuing to strengthenthe balance sheet and remaining disciplined in our capital expenditure.
This framework is unchanged and Murray will come back to this later.
22

FY & 4Q 2021 financial results & update on strategic progress 23
Strategic progress ‒ resilient hydrocarbons
Turning then to progress across our strategic themes – and starting with # 1 –resilient hydrocarbons.
23

FY & 4Q 2021 financial results & update on strategic progress
Resilient hydrocarbonsStrategic progress ‒ resilient hydrocarbons
24
High-grading our portfolio, lowering our emissions and driving returns”
▪ Continue to improve availability
▪ Move portfolio to first quartile Solomon net cash margin
▪ High-grade portfolio
“
▪ Maximise returns and cash flow
▪ Maintain production base decline at 3-5%
▪ Focus on highest quality infill and tie-backs
▪ Drive efficiency in operating costs
▪ Continued focus on digital and agile
▪ High-grade portfolio
▪ Transition refineries to produce biofuels; maximise co-processing and production from 5 projects
▪ Grow biogas production and marketing
Decarbonisation, safety and operational excellence
Here we plan to high-grade our portfolio, lower our emissions and drive higherreturns.
We will do this through three focus areas – oil and gas, refining and bioenergy.
Before I turn to each, let me let me take you through some of our strategichighlights to date.
24

FY & 4Q 2021 financial results & update on strategic progress
Progressing our strategy
new major projects*
production since 2016
2021 plant reliability*
2021 refining availability*
Under budget on average for the 35 major projects*
delivered since 2016
Driving portfolio competitiveness
▪ Angola and Iraq JVs
▪ Aker bp and Lundin Energy oil and gas business transaction
,
bpx energy Permian methane flaring intensity reduced by 95% since
acquisition
people working in Agile structures
Single operating model
Significant gas discovery in Russia,
among largest in 2021
Strategic progress ‒ resilient hydrocarbons
25
reduction in drilling & completions non-productive
time vs 2020
Since the start of 2020 we have delivered 11 major projects, bringing the totalto 35 since 2016, executed on average, on schedule and around 15% belowbudget.
And there is more to come, with four start-ups expected during 2022.
Through 2021 we have:
− driven competitiveness through portfolio decisions
− maintained reliability and availability in the face of a challenging operatingenvironment
− reduced the non-productive time in our drilling and completion operationsby 20%; and
− we have embedded our single operating model, with around 7,500people now deployed in ‘Agile’ structures, fundamentally changing howthey work.
For example, this single operating model helped with our approach to plannedturnarounds. In 2021 – the first year these were managed globally across oil,gas and refining – we delivered 26 planned turnarounds, on average underbudget and with a lower production impact than planned.
And we are in action on emissions, for example further reducing our Permianmethane flaring intensity to a record low of around 0.6% in December, down95% since acquiring the assets in 2018.
25

FY & 4Q 2021 financial results & update on strategic progress
2019 2021 2025 2030 aims
EBITDA*1 ($bn) 32.0 33.5 ~33 30-35
Capital expenditure*2
($bn) 17.3 9.3 9-10 ~8
Oil and gas production3
(mmboed)2.6 2.2 ~2 ~1.5
Unit production costs* ($/boe) ~7 ~7 ~6 ~6
Refining throughput (mmbd) 1.7 1.6 <1.5 ~1.2
Bioenergy(mbd) 23 26 50 >100
LNG portfolio (mtpa) 15 18 25 30
Aim to sustain EBITDA to 2030
(1) At $60/bbl Brent (2020, real) and $3/mmbtu Henry Hub (2020, real), RMM* $12/bbl (2020, real). Includes Rosneft and trading
(2) Includes inorganic spend(3) Excludes Rosneft
Strategic progress ‒ resilient hydrocarbons
26
We expect to sustain EBITDA from resilient hydrocarbons at around $33 billionthrough 2025, and thereafter we now aim to maintain EBITDA in a range of$30-35 billion until 2030.
With our 2030 nominal oil price assumption broadly flat versus 2021 actual,this is driven by three factors:
− we aim to grow unit EBITDA from oil and gas.
− we aim to grow the underlying contribution from refining, and
− we aim to deepen our investment in bioenergy.
− Let me take each of these in turn.
26

FY & 4Q 2021 financial results & update on strategic progress
Deep oil and gas resource base driving quality through choice
~19bn boe of resource selected for development3
~$7.5bn capital frame through 2025
$9/boe average point-forward development cost4
~$15/boe DD&A in 2021
80% of 2022-2030 capital expenditure* in 6 regions
(1) Proved and probable reserves plus other resources not categorised as either barriered or non-viable, before future divestments, excludes Rosneft(2) 2022 point forward, excluding bp’s share of equity-accounted entities (3) Proved developed balance at end-2021 plus future proved developed reserve additions excluding Rosneft(4) Point forward development capital divided by total proved developed reserve additions, excluding bp’s share of equity-accounted entities
Strategic progress ‒ resilient hydrocarbons
27
In oil and gas, we have a deep and high-quality resource base of 30 billion boethat allows us to choose the best investments.
We have a disciplined capital frame for oil and gas of around $7.5 billion perannum through 2025.
In allocating this capital we look for paybacks of less than ten years for oil andless than 15 years for gas, to select the highest quality options as we focuson cycle time.
We are confident in the value and resilience of this investment plan:
− it leverages existing assets, with around 70% to be spent on existinghubs – typically lower risk and higher quality
− it holds managed base decline in a 3 to 5% range through 2025 andbeyond
− it is capital efficient – with an average point-forward development cost ofaround $9 per barrel compared to a 2021 unit DD&A of $15 per boe
− We aim to manage our R to P ratio down to around eight years by 2030,and;
− it is focused, with 80% of capex spent in just six regions.
27

FY & 4Q 2021 financial results & update on strategic progress
Higher quality more focused oil and gas portfolio
(1) Excludes Rosneft(2) At $60/bbl Brent (2020, real) and $3.00/mmbtu Henry Hub (2020, real)(3) 2025 and 2030 reflect planned divestments
Broadly flat underlying production*
▪ Base decline held at 3-5% through 2025 and beyond
▪ Invest in best barrels
High-grade ~700mboed by 2030
▪ EBITDA* margin <$20/boe
▪ Realise value through proceeds
Drive cost efficiencies
▪ ~$6/bbl unit production costs
High-quality focused portfolio
▪ >20% margin expansion to 2030
▪ 90% of 2030 EBITDA* from 6 regions
Strategic progress ‒ resilient hydrocarbons
28
This investment plan holds underlying production broadly flat through 2030.
The depth of our resource base provides flexibility:
− By 2030 we aim to high-grade around 700 thousand barrels of oilequivalent per day relative to 2021.
− The margin on these barrels is lower - at an average less than $20 perbarrel.
− This is expected to allow us to realise value through the divestment ofassets.
And we plan to continue to drive cost efficiency while maintaining safety andoperational integrity – realising synergies through our single operating model,our relentless focus on digital, and our adoption of agile work structures. Weplan to drive unit production costs to around $6 per barrel by 2025 and aim tohold at this level through 2030.
This is expected to result in a high-quality, focused portfolio, with:
− 90% of 2030 EBITDA generated from six regions; and
− an improvement in unit margins relative to 2021 of more than 20% by2030.
28

FY & 4Q 2021 financial results & update on strategic progress
Growing contribution from our advantaged refining portfolio
29
Improving market conditions
▪ Recovery in product demand
Availability improvement
▪ >96% Solomon availability*
Cost efficiencies
▪ Solomon 2nd quartile non-energy cash costs
Enhance flexibility and yield improvements
▪ Solomon 1st quartile net cash margin*
High-grade portfolio
▪ Conversion, consolidation or divestment
EBITDA* $bn
2021 2030 aims
Refining throughput (mmbd) 1.6 ~1.2
Strategic progress ‒ resilient hydrocarbons
In refining, we aim to deliver around $2 billion of underlying EBITDA growth by2030 relative to 2021, excluding biofuels.
Of this, around half is expected to come as demand recovers, with COVIDimpacts easing, supporting an increase in realised refining margins. Theremainder is expected to be delivered by our business improvement plans,focused on three areas:
First, availability. We are on-track to deliver over 96% Solomon availability. Ourturnaround improvement plans have already delivered improvements and weexpect the impact of the higher maintenance activity in 2021 to reduce overtime.
Second, cost efficiencies. We plan to deliver Solomon second quartile orbetter, non-energy cash costs, a competitive position given our refineryconfigurations, while keeping a rigorous focus on safety and operationalintegrity.
Third, flexibility and yield improvements. For example, through investments inthe US Midwest and the Cherry Point Hydrocracker Improvement Project.
In addition, we remain focused on high-grading the portfolio – throughconversion, consolidation of less advantaged units or divesting where it makessense.
Together these points underpin our target of achieving top quartile Solomonnet cash margin by 2025.
29

FY & 4Q 2021 financial results & update on strategic progress
Growing bioenergy production
Bioenergy production1 mbd
(1) Net bp volumes include bp bunge bioethanol equivalent and biopower, refinery co-processing volumes, HEFA biodiesel and SAF, and biogas(2) Largest biogas supplier to the US road transportation sector
Strategic progress ‒ resilient hydrocarbons growth engine
30
Biofuels
Maximise co-processing
▪ Biofuels production to triple
Biodiesel/SAF production from 5 projects
▪ Investment in 3 standalone bio-plants
▪ Conversion of up to 2 refineries to bio-refineries*
Biogas
▪ Increase production ~20x, through leveraging position as largest US biogas supplier2 and expansion into Europe
▪ 35 offtakes today, aiming for >225 by 2030
Turning to bioenergy, the first of our transition growth engines.
The market backdrop is strong. bp's energy outlook ‘Rapid Transition’ scenarioshows biofuels growing by an average of 6% per annum to 2030, withsustainable aviation fuels – SAF – and biogas, growing significantly faster.
We aim to deliver around $2 billion EBITDA by 2030 – around half driven bythe production of biofuels from feedstocks meeting applicable sustainabilitystandards, and around half by biogas and other trading opportunities.
Let me start with biofuels.
Our refineries operate in regions where we expect to see strong growth indemand, and our manufacturing processes are well positioned to adapt to this.
We already produce more than 5,000 barrels per day of biofuels at three of ourrefineries through bio co-processing. We aim to triple production by 2030across these sites.
We plan to invest in five major biofuels projects including three adjacent toexisting refineries and the conversion of up to two to bio-refineries.
This focus on leveraging existing infrastructure, logistics, scale and customerrelationships is expected to create capital-efficient growth.
30

Turning to biogas.
This is a sector we are increasingly excited about. It:
− is capital light
− is highly modular and capable of rapid growth
− can achieve very low carbon intensities
− creates value for bp through strong integration with trading; and
− it delivers high returns and fast paybacks.
Through our co-marketing agreement with Clean Energy Fuels, we arealready the largest supplier of biogas in the US to heavy duty fleetcustomers. And we recently acquired a 29% stake in Gasrec, a majorUK provider of biogas to heavy goods vehicles.
We plan to retain our leadership position in the US and expand in thefast-growing European market. We aim to scale equity productionaround 20-fold, to over 10,000 barrels a day by 2030, and throughadditional offtake, we expect further margin capture.
30

FY & 4Q 2021 financial results & update on strategic progress 31
Strategic progress ‒ convenience and mobility
Strategic theme #2 is convenience and mobility.
31

FY & 4Q 2021 financial results & update on strategic progress
Convenience and mobility
Castrol
▪ Focus on growing revenue and growth markets expansion
▪ Cost optimisation
Aviation & B2B/midstream
▪ Decarbonisation partner for airports and airlines
▪ Optimise across the value chainand grow bio ground fuels
Enhance the customer experience through loyalty and digital
“
▪ Acceleration of EV charging –‘on-the-go’ fast-charging¹ and fleets
▪ Strategic partnerships
▪ Integrated digital solutions
▪ Advantaged network
(1) “Fast charging” includes rapid charging 50kW and ultra-fast charging 150kW
▪ Market leading convenience offers
▪ Differentiated fuels and strong brands
▪ Advantaged network
▪ Growth market expansion
Strategic progress ‒ convenience and mobility
32
Doubling EBITDA*, sustaining returns, focused on
customers”
Here - our aim is to double EBITDA by 2030, while sustaining returns of 15 to20%, all through a focus on customers.
We see this growth being driven by:
− our differentiated convenience and fuels offers and selective growthmarkets expansion
− the acceleration of our EV charging ambition across key markets, and
− the contribution from Castrol, aviation including SAF, B2B and midstream.
Since we outlined our strategy, our capital allocation plans have changed intwo areas:
First, we are accelerating our EV charging ambition, and;
Second, we are tightening our expansion in growth markets.
32

FY & 4Q 2021 financial results & update on strategic progress 33
convenience partnership extended to at least 2030
Strategic investments and partnerships with leading fleet and OEM
providers
Growing biofuels marketing
including SAF
All comparisons referenced are versus 2019; absolute figures are 2021
Castrol earnings from growth markets
Progressing our strategy Strategic progress ‒ convenience and mobility
record convenience gross margin*
vs $1.2bn in 2019
growth in mix of premium fuels
in bpme customers supported by leading
digital offers
This slide shows just some examples of the progress we made, which I willhighlight when I cover these businesses. This strong strategic delivery givesus confidence in future delivery.
33

FY & 4Q 2021 financial results & update on strategic progress
Aim to double EBITDA to $9-10bn by 2030
Convenience and mobility EBITDA* $bn
2019 2021 2025 2030 aims
EBITDA* ($bn) 4.9 4.4 ~7 9-10
Capital expenditure*¹ ($bn) 1.5 1.6 2-3
Customertouchpoints per day (million)
>10 >12 >15 >20
bp retail sites in growth markets*2 1,250 2,700 ~5,000 >6,000
Strategic convenience sites*2 1,650 2,150 ~3,000 ~3,500
Castrol revenues ($bn) 6.7 6.8 ~7.5 >8.0
EV charge points* >7,500 13,100 >40,000 >100,000
Margin share from convenience and electrification (%)
~25 29 ~35 ~50
(1) Includes inorganic spend(2) Reported to the nearest 50
Strategic progress ‒ convenience and mobility
34
As a reminder, we expect to deliver around $7 billion EBITDA by 2025 and aimfor between $9-10 billion by 2030, with returns of 15 to 20%.
Our businesses have remained resilient during the pandemic. We expectCOVID impacts of more than $600 million in 2021 to reverse over the comingyears, and EBITDA growth to 2030 to be split across the three businessesshown on the chart.
Our convenience and fuels businesses, along with Castrol, are rateable, anddrive most of the growth to 2025; with EV driving more of the growth in thesecond half of the decade.
Let me outline our plans in each of our business areas, starting withconvenience and fuels retail.
34

FY & 4Q 2021 financial results & update on strategic progress
Convenience and fuels retail – global presence and proven track record of growth
Convenience gross margin* $bn Record convenience gross margin* and increase in basket size in key markets
▪ $1.5bn, growth of >20%
Increased strategic convenience sites* by ~500 to 2,1501
Took full ownership of Thorntons
2,7001 retail sites in growth markets*, an increase of >1,400 (Jio-bp expansion)
Strong premium fuels mix growth
▪ +2 percentage points
Digital solutions and loyalty
▪ ~16m active loyalty customers
▪ 3x increase in bpme customers
Strategic progress ‒ convenience and mobility
35All comparisons referenced are versus 2019; absolute figures are 2021(1) Reported to the nearest 50
Convenience is the second of our transition growth engines. It is a materialbusiness and in 2021 delivered a record $1.5 billion gross margin – more than20% growth in two years. And we aim to continue to grow, at around 7% perannum.
We are confident in this growth as:
− we aim to expand our strategic convenience network to around 3,500sites by 2030; having already added around 500 since 2019
− we continue to increase basket sizes
− we have taken full ownership of Thorntons in the US; and
− we have extended our partnership with Marks & Spencer in the UK.
Our convenience offer builds on a strong and material retail fuels business.We have:
− a great network of sites in established markets which generally sell morefuel than the industry average
− strong, trusted brands
− premium fuels that generate around double the margin of our regularfuels in many markets; and
− differentiated digital offers and loyalty schemes. For example, our bpmeapp customers have grown three-fold since 2019, and these customerstypically spend twice as much as other customers.
We now aim to expand our presence in growth markets to over 6,000 sites by
35

2030, which will be primarily driven by our successful Jio-bp JV inIndia.
35

FY & 4Q 2021 financial results & update on strategic progress
EV charging – accelerating our ambition through a focus on ‘on-the-go’ charging and fleets in material markets
Established a leading presence in UK and Germany, entered fleet segment in the US
~50% of network are rapid or ultra-fast charge points*1
More than 10x increase in energy sales (GWh) 2019-2021
Digitally connected charging, strategic investments and partnerships
Operated ‘on-the-go’ EV charge points*
and energy sales
(1) Rapid charging 50kW and ultra-fast charging 150kW
Strategic progress ‒ convenience and mobility growth engine
36
So, turning to EV charging – the third of our transition growth engines.
We aim for this business to deliver more than a third of our overall EBITDAgrowth from convenience and mobility to 2030.
We are accelerating our EV charging ambition across key growth markets,through a focus on ‘on-the-go’ charging and fleets.
For ‘on-the-go’ charging – customers want fast, convenient, reliable andseamless charging, integrated with leading convenience offers and services.
We are confident we can succeed for three reasons:
− first, we have an advantaged retail and convenience network in our keyfocus markets. In the UK and Germany for example, we have establisheda leading presence – where more than 90% of the population live withina twenty-minute drive of our stores
− second, we are focused on rapid and ultra-fast charging, driving higherutilisation and margins
− third, we expect our investment in digital technology and strategicpartnerships to drive-up utilisation and increase footfall at ourconvenience stores.
Overall, we aim to grow our network to more than 100,000 EV charge pointsand increase our energy sales from those by more than 100-fold by 2030.
Our second focus area is fleets. We think this has enormous growth potentialfor bp:
36

− we have a material fleet business with customers who we aim tosupport in their transition to EV charging
− we already provide dedicated fleet solutions, which includehardware, software and other services; and
− our acquisition of AMPLY Power has accelerated our entry intothe US – one of the fastest growing fleet charging markets in theworld
Taken together, these plans give us confidence in aiming to deliver~50% margin share from convenience and electrification by 2030.
36

FY & 4Q 2021 financial results & update on strategic progress
Castrol, aviation, B2B/midstream – growth in volume and margin
Castrol revenues $bn 2030 aims underpinned by
▪ Top line increase from Castrol, aviation, B2B/midstream
▪ Bottom line improvement through efficiency, optimisation and footprint
▪ ~55% of Castrol earnings from growth markets
Growth in premium lubricants, market leading in EV fluids
▪ +2 percentage points premium lubricants
▪ >2/3 of major OEMs approved Castrol ON as part of their factory fill1
SAF supply network expanded
▪ ~3x increase to >20 airports
All comparisons referenced are versus 2019; absolute figures are 2021(1) Based on LMCA data for top 20 selling OEMs (total new car sales)
Strategic progress ‒ convenience and mobility
37
Turning finally to Castrol, aviation, B2B and midstream. Here the three keydrivers of growth are:
First, aiming to grow Castrol revenues to more than $8 billion by 2030,through:
− expansion in growth markets, including in India where Castrol is thenumber one brand
− extending our Castrol branded service and maintenance offers globally;and
− providing market leading offers in EV fluids. More than two-thirds ofmajor OEMs have approved Castrol ON as part of their factory fill.
Second, improving Castrol profitability through a focus on cost efficiency,simplification, digitisation and optimisation of its manufacturing footprint.
Third, growing aviation, B2B & midstream, by leveraging our:
− strategic relationships with major airlines and airports
− established position in SAF – where we aim in place to be a sector leader,with 20% share of supply, and
− continued growth in our bio ground fuels businesses.
Summing up, these steps give us the confidence in our aim of delivering $9-10 billion EBITDA from convenience and mobility by 2030.
37

FY & 4Q 2021 financial results & update on strategic progress 38
Strategic progress ‒ low carbon energy
Strategic theme #3 is low carbon energy.
38

FY & 4Q 2021 financial results & update on strategic progress
Low carbon energy
Building scale with capital discipline and returns focus”
“
▪ Build a leadership position in offshore wind
▪ Focus on integrated core markets and early stage project development
▪ Acceleration of solar growth through Lightsource bp and bp US solar
▪ Confidence in 8–10% levered returns
▪ Aim for 50GW developed renewables to FID* by 2030
▪ Leverage bp’s existing refinery demand to build regional supply positions
▪ Develop advantaged global production hubs
▪ Integrate CCS projects to support blue hydrogen* and industrial emissions reduction
▪ Aim to capture 10% share of core markets by 2030
Create integrated low carbon energy hubs
Strategic progress ‒ low carbon energy
39
Our focus on returns and building scale with capital discipline is unchanged.
We are aiming to create integrated low carbon energy hubs, enabled by ourlast two transition growth engines:
− First, renewables. We aim to build a leadership position in offshore windand accelerate our solar growth through Lightsource bp and bp’s US solarpipeline. We remain confident in achieving 8 to 10% levered returns;
− Second, hydrogen. Here we aim to leverage bp’s existing refinerydemand to build regional supply positions. And as hydrogen marketsdevelop, we aim to create a portfolio of globally advantaged supply hubs.We aim to capture a 10% share of core markets, by 2030.
39

FY & 4Q 2021 financial results & update on strategic progress
Progressing our strategy
Creating integrated hydrogen* and
renewables hubs
▪ Oman, Abu Dhabi, UK and Europe
renewables pipeline*1
increased 4x since 2019
US offshore wind JVs progress
▪ East Coast Cluster selected for government support
▪ NZT and NEP FEED contracts awarded
▪ HyGreen project announced
▪ 3.3GW (gross) 25-year NYSERDA offtake contracts
▪ 2GW (gross) turbine contract awarded
UK offshore wind
bp net offshore wind pipeline to date
Lightsource bp projects1
achieved FID since 2019
UK hydrogen* and CCS
▪ 1.45GW bp net ScotWind lease option awarded in 2022
(1) Year-end 2021
Strategic progress ‒ low carbon energy
40
building hydrogen* hopper*
in UK, Australia, Europe, Middle East
Over the past two years we have made significant progress.
In offshore wind, we grew our pipeline to over 5 gigawatts net in two coremarkets, through our partnership with Equinor in the US and with EnBW inthe UK.
In solar, Lightsource bp has increased its pipeline from 1.6 gigawatts to 20.6gigawatts since bp’s investment in late 2017, progressing 53 projects to FIDat weighted average expected returns of 8-10% - prior to farm-down.
And we are achieving significant milestones in building our hydrogen and CCSbusinesses.
40

FY & 4Q 2021 financial results & update on strategic progress
Aim to grow EBITDA to $2-3bn by 2030
In addition we have
▪ 17GW renewables hopper*
▪ 0.7-1.3mtpa low carbon hydrogen* hopper*
2019 2021 2025 2030 aims
EBITDA* ($bn) Growth phase 2-3
Capital expenditure*
($bn) 0 1.6 3-5 4-6
Developed renewables to FID*
(GW)2.6 4.4 20 50
Low carbon hydrogen* in core markets (%)
Growth phase 10
Strategic progress ‒ low carbon energy
41
We have successfully increased the size of our renewables project pipeline to23 gigawatts net bp at end 2021 and have a material hopper of early-stagerenewables and hydrogen projects.
Our capital investment in these businesses is growing. We spent $1.6 billionin 2021 and expect to invest between $3 to 5 billion per annum by 2025,rising to $4 to 6 billion per annum by 2030.
We are rigorous in evaluating opportunities, selecting only what we see as thebest projects.
This momentum and discipline, gives us confidence in the quality of thebusiness we are building. By 2030 we aim to deliver between $2 and $3billion of EBITDA.
41

FY & 4Q 2021 financial results & update on strategic progress
Establishing our new wave of projects in low carbon energy
(1) 7X Energy pipeline acquisition
Strategic progress ‒ low carbon energy growth engine
42
Germany
USA
Oman
Abu Dhabi
Portugal
Ireland
Greece
PolandNetherlands
Hydrogen* / CCS
Solar
Offshore wind
Italy
UK
Brazil
Trinidad & Tobago
Australia
Norway
Spain
UK
NZT Morgan
NEP Mona
HyGreen Morven
H2Teesside Lightsource bp
Aberdeen Hydrogen Hub
Germany
Lingen Green Hydrogen Get-H2 Nukleus
Netherlands
H2-Fifty H-Vision
Lightsource bp
Norway
Sørlige Nordsjø II
Spain
Castellon Lightsource bp
Lightsource bp projects
Italy Portugal
Greece Poland
Ireland
USA
Lightsource bp Empire Wind 2
bp US solar1 Beacon Wind 1
Empire Wind 1 Beacon Wind 2
Abu Dhabi - strategic partnership with
Abu Dhabi National Oil Company (ADNOC) and Masdar
Australia
Project Geraldton Export-Scale Renewable Investment (GERI)
Lightsource bp
Brazil
Lightsource bp
Egypt
Lightsource bp
India
Lightsource bp
Oman
Ministry of Energy and Minerals Strategic Framework Agreement
Trinidad & Tobago
Lightsource bp
UK and Europe USA and rest of the world
India
Egypt
As this slide shows, we now have a global portfolio of projects in solar,offshore wind and hydrogen, giving us the platform to develop future lowcarbon energy hubs.
Turning to hydrogen, where we have conviction in our ability to createdifferentiation and build a material business.
42

FY & 4Q 2021 financial results & update on strategic progress 43
Low carbon hydrogen – ambition to reach 10% share in core markets
Leveraging ~450ktpa existing refining hydrogen*
demand
First projects on schedule for production from 2024 onwards
▪ E.g. Lingen gH2, H2-Fifty, Castellon gH2 and GET H2 Nukleus
Project hopper* with depth and optionality
Driving value with CCS & renewables integration
▪ E.g. NZT, NEP, H2 Teesside and HyGreen in the UK
Advancing high quality supply hubs and strong partnerships
▪ E.g. Oman, ADNOC & Masdar, NYK, Daimler
Strategic progress ‒ low carbon energy growth engine
Hydrogen* hopper* bp net, mtpa
Announced projects
Not yet announced projects
Hydrogen* hopper* includes high graded projects in development, with scale-up potential
across blue and green hydrogen* supply
Scale up potential from existing hopper*
We now have a hopper of 0.7 mtpa, of which half has been announcedincluding H2 Teesside, Lingen and Oman. This hopper has the potential togrow to up to 1.3 mtpa, as we continue to activate demand and scale upproduction.
We are focused on growing scale in key, regionally integrated markets, suchas the UK, Europe, and the US.
And we are playing to our strengths:
− leveraging our technical capabilities and existing demand at our refineriesto underpin first projects
− building on our experience of delivering and operating complex globalprojects;
− creating value through integration of marketing, trading and shipping; forexample, with power customers in Asia through LNG; and
− deepening partnerships; creating integrated low carbon energy hubopportunities, through long-standing relationships built through our oil andgas businesses such as in Abu Dhabi and Oman, and with companiessuch as Daimler and NYK Group.
We are confident and energised by the potential of this new business andAnja will discuss this – and the broader low carbon business – with you later inthe year.
43

FY & 4Q 2021 financial results & update on strategic progress 44
Strategic progress ‒ integration
Turning to Integration.
Let me explain why we see a role, and need, for an IEC such as bp – one of afew companies we believe who have the scale and expertise to navigatecomplex markets and who can help manage increasingly inter-connectedenergy systems – the importance of which has been highlighted in only thepast few months.
For over one hundred years, we have been in the business of integratedenergy value chains, based on hydrocarbons as the energy source.
We get oil and gas out of the ground – the upstream business.
We transform hydrocarbons into marketable products – the refining business.
We sell hydrocarbon-based products – the marketing business.
We have created a portfolio which gives us a global presence across thehydrocarbon value chain. And we have our trading organisation to optimisethe flow, providing an uplift to group returns of at least 2%, in addition towhat each standalone business can deliver.
As we move from an IOC to an IEC, and decarbonise our portfolio, we plan toreplicate this model of integrated energy value chains, combininghydrocarbons with electrons and hydrogen.
We are moving into renewables, solar and wind, generating electrons – a newupstream business.
We can transform these electrons into hydrogen – a new downstream
44

business.
And we will sell the products – electrons and hydrogen – to customers– a new marketing business.
This creates an electron and hydrogen energy value chain withupstream, downstream and marketing businesses, that complementour existing hydrocarbon value chain.
44

FY & 4Q 2021 financial results & update on strategic progress
Leading energy trader present in 140 countries with >2,000 employees”
Business integration – our trading organisation is at the heart of our IEC model
Established positions
Trade in >15 European gas and power hubs
Largest natural gas and biogas marketer in North America
Top 10 position in US wholesale and retail power
Low carbon trading
Provide carbon solutions as a service
Present in 8 carbon trading systems
NCS origination e.g. Finite Carbon
“
Strategic progress ‒ integration
45
At the heart of our integrated value chains is our world-class trading business.It has been decades in the making with a presence in 140 countries and over2,000 employees. Through it:
− we can leverage our global asset portfolio to provide a consistentlyreliable supply
− we have expertise in managing risk in volatile markets with highcommercial and regulatory complexity
− we have deep analytics and technology expertise;
− and we can create integrated bespoke energy solutions for customers.
All of these are transferable – allowing us to grow in new products andmarkets, including for example biogas and low carbon products.
Together we believe this capability can allow bp to offer customers a one stopshop for their energy needs.
45

FY & 4Q 2021 financial results & update on strategic progress
Country integration – creating multi-energy customer solutions along and across value chain
(1) 2021(2) Shared with partner
Strategic progress ‒ integration
46
The UK is an example of how these integrated hydrocarbon, electron andhydrogen value chains can come together in one region.
We have been present across the hydrocarbon value chain in the UK for over50 years:
− we produce oil and gas from the North Sea
− we sell oil and gas to customers and gasoline and coffee to consumers;and
− we are also bringing gas into the UK from overseas to the Isle of Grainterminal as well as shipping products from European refineries.
We are now in action to create electron and hydrogen energy value chains:
− we intend to produce electrons through offshore wind farms in Scotlandand in the Irish Sea and through solar in our Lightsource bp joint venture
− we plan to construct hydrogen, CCS and biogas plants
− we plan to scale up our EV charging and customer offers using ourextensive physical retail network, brand and convenience offer
− we will be able to link gas and electrons to help create reliable power;and, as mentioned earlier
− the returns from each of these hydrocarbon, electron and hydrogenbusinesses can be further enhanced by integration through our trading
46

organisation.
This ability to leverage existing infrastructure, capabilities andrelationships, and integrate across offshore wind, hydrogen and EVcharging, supported our recent successful bid in the ScotWind leasinground.
And we are already working to replicate this model in other countries.
46

FY & 4Q 2021 financial results & update on strategic progress 47(1) Identify as racial and ethnic minorities
Our capability Strategic progress ‒ integration
…and are attracting high-calibre specialised talentWe have great incumbent capability…
Marleece Estella,SVP Health & Wellbeing Previously Lockheed Martin
Carlos de la Pena,SVP Strategy Previously McKinsey
Erin Eisenberg,VP Finance Low Carbon Energy Solution. Previously Macquarie
Anja-Isabel Dotzenrath,EVP G&LCE From RWE, 1 March 2022
Matthias Bausenwein,SVP Offshore wind From Orsted in 2H22
Tracey Clements,SVP Mobility & Convenience, ESA Previously Boots
Andrea GalietiVP Sustainability policy and partnershipsPreviously Engie
Greg Franks,SVP Mobility & Convenience Americas Previously 7-Eleven
Ivanka Mamic,SVP Sustainability Previously Target
Niamh Staunton,SVP Treasury Previously Morgan Stanley
Louise Kingham,SVP Europe & UK Head of Country. Previously Energy Institute
Stefan Von Dobschuetz General Manager Europe, Future Mobility Previously Innogy SE
Equally crucial to our transformation to an IEC is having the right capability toenable our success.
And here we are in a good position.
We have great incumbent capability. Skills that we can leverage right acrossour three strategic themes. Our 120 strong extended leadership team isrepresentative of our broader workforce, bringing together a broad anddiverse set of expertise, views and perspectives, and is made up of around40% females and around 25% global minority. And from next month, I lookforward to having a gender balanced leadership team reporting to me.
And on the right of the slide, you will see that where we feel we needdifferent skills – we are hiring. Bringing in high-calibre, specialised talent, oftenfrom other industries. Over the past 18 months – we have hired 38 seniorexecutives from outside the company – a marked change with our history. Itis hugely encouraging to see the interest in our strategy and our direction.
47

FY & 4Q 2021 financial results & update on strategic progress 48
Strategic progress ‒ sustainability
Turning then to sustainability.
In 2020, we announced our ambition to be a net zero company by 2050 orsooner, and to help the world get to net zero.
Two years on, we continue to believe our ambition is good business andsupports society’s drive towards the Paris climate goals.
48

FY & 4Q 2021 financial results & update on strategic progress
Sustainability – we are accelerating our net zero ambition in line with the progression of our strategy
(1) 2025 targets and 2030 aims for Aims 1-3 are against our 2019 baseline. 100% means to net zero* by 2050 or sooner.
Strategic progress ‒ sustainability
49
We are in action and on track for our 2025 targets.
As we progress, we continue to learn. We have growing confidence in theopportunities – especially over the longer term – in building, participating inand integrating along and across net zero value chains.
This enables us to make some changes.
For Aim 1, which encompasses our scope 1 and 2 emissions from ouroperations, we’re accelerating our 2030 aim from 30-35% to 50%.
For Aim 3, which includes the lifecycle emissions from the products we sell,we are:
− increasing our 2050 or sooner aim from a 50% reduction in carbonintensity to net zero
− updating our 2030 aim to 15-20%; and
− expanding Aim 3’s scope to include physically traded energy products.
Delivery of our 2030 aims will be driven by execution of our strategy.
For aim 1, this includes improvements from reduced flaring, energy efficiency,electrification and use of low carbon electricity, as well as the contributionfrom base decline and divestments.
For aim 3, this is driven by our evolving portfolio, including investment in EVcharging, bioenergy, renewables and hydrogen, as well as an energy producttrading mix that reflects decarbonisation of global energy and bp’s activitiesover time.
49

Our other aims remain as is, including those on methane and net zeroproduction.
In aiming for net zero across our operations, production and sales by2050 or sooner, we believe our ambition supports the global push tomeet the Paris goals, including helping the world pursue efforts to limittemperature rise to 1.5°C above pre-industrial levels.
We intend to provide shareholders with the opportunity of an advisoryvote on our net zero ambition at our 2022 AGM. We are grateful forthe continued engagement, challenge and support from our investors,including CA100+.
49

FY & 4Q 2021 financial results & update on strategic progress
New net zero 2050 targets
▪ Scope 1 and 2 operational emissions targets leading in Russia
Rosneft – committed to sustainably developing resources and driving down emissions
▪ “Rosneft-2030” strategy sets interim targets, including:
▪ 25% reduction in absolute emissions2
▪ Zero routine flaring in line with the World Bank’s 2030 initiative
▪ Methane intensity to <0.2%
(1) Scope 1(2) Scopes 1 and 2 vs. 2020
In action onemissions
▪ Upstream GHG intensity competitive with global peers1
▪ Co-leading Methane Guiding Principles project on flaring reductions
▪ Performance reflected in international ESG ratings, e.g. FTSE4Good Index, CDP, Bloomberg
Strategic progress ‒ sustainability
50
Turning finally to Rosneft, who also continue to make significant progress ontheir sustainability agenda.
We welcome their board’s approval of a new 2030 strategy, whichincorporates a target to be net zero by 2050 for scope 1 and 2 operationalemissions.
Rosneft’s ambitions are leading among large Russian energy companies. Theyare supported by interim targets on absolute emissions, methane and flaring.
This builds upon Rosneft’s commitment to improving environmentalperformance, with a strong focus on energy efficiency and carbon andmethane intensity.
We are, almost to the day, one year into bp and Rosneft’s strategiccollaboration agreement on carbon management and sustainability. Throughsharing perspectives and exploring emissions reduction opportunities, theagreement supports both companies’ decarbonisation journeys.
Let me now hand back to Murray to update you on our financial frame.
50

Chief financial officer
No script
51

FY & 4Q 2021 financial results & update on strategic progress
Growing cash flow as the business transitions
2H19/1H20 2021 2025 2030 aims
$51/bbl $71/bbl $66/bbl¹ $73/bbl¹
Resilient hydrocarbons 25.0 33.5 ~33 30-35
Convenience and mobility 4.0 4.4 ~7 9-10
Low carbon energy 2-3
Group EBITDA*2 ($bn) 28.5 37.2 ~40 41-48
Group capital employed2,3 ($bn) 112 109 ~120 ~150
EBIDA per share CAGR4,5 ROACE*6
(1) Brent $60/bbl 2020 real, at bp planning assumptions (2) Includes OB&C* (3) Excludes goodwill and cash and cash equivalent(4) 2H19/1H20 to 2025 at $50-60/bbl (2020 real), at bp planning assumptions (5) EBIDA per share - 2H19/1H20 128¢; 2021 157¢(6) 2025 and 2030 at $50-60/bbl (2020 real), at bp planning assumptions
Strategic progress ‒ financial frame
52
Growth phase
Thanks Bernard.
The detail we’ve provided today links the delivery of our strategy to our 2025financial targets. It also shows how we aim to transition the cash flows of thecompany to 2030 based on our plans.
Let me briefly recap.
First, we have a high-quality, resilient hydrocarbons business that we expectto sustain EBITDA around 2021 levels through 2025. And we aim to holdaround this level through 2030 at broadly constant price assumptions, withreturns of 12 to 15%.
Second, from 2021 we aim to more than double EBITDA from convenienceand mobility to around $9 to 10 billion by 2030, while generating returns of atleast 15 to 20%. Our customer businesses are rateable, and drive growth to2025; with EV charging driving growth in the second half of the decade.
And third, in low carbon, we aim to grow EBITDA in the second half of thedecade, reaching $2 to 3 billion by 2030 as our renewables and hydrogenbusinesses come on-line.
This is all underpinned by a continuing focus on cost and efficiency,investment in digital, and agile ways of working. We continue to expect todeliver cash cost savings from reinvent bp of $3 to 4 billion in 2023 relative to
52

2019.
Taken together, this underpins our confidence in the guidance that wegave you in August 2020. We expect to deliver a 7 to 9% EBIDA pershare CAGR between 2H19/1H20 and 2025, and ROACE of 12 to 14%.This assumes oil prices of $50 to 60 per barrel in 2020 real terms.
And looking further ahead, as the business transitions we aim tocontinue to grow EBITDA to 2030 while sustaining returns of 12 to14%.
52

FY & 4Q 2021 financial results & update on strategic progress
Increasing exposure to transition growth businesses
Capital expenditure* % Capital employed1 %
Strategic progress ‒ financial frame
53
aims
EBITDA* $bn
▪ Bioenergy ▪ Convenience ▪ EV charging ▪ Renewables ▪ Hydrogen*
(1) Excludes goodwill and cash and cash equivalent
Within this we are increasing our exposure to businesses which are expectedto see rapid growth through the energy transition.
As Bernard mentioned, this is driven by five transition growth engines –bioenergy, convenience, EV charging, renewables and hydrogen.
These businesses contribute around $1.5 billion of our EBITDA today.
But we are deepening our investment here. In 2021 they represented morethan 15% of our capex. By 2025 we expect this to be greater than 40% andby 2030 around 50%.
Capital employed will follow. While modest today, it is expected to reach over20% by 2025 and close to 40% by 2030.
And in the second half of the decade, we aim to deliver double digit EBITDAgrowth from these businesses as the capital we are investing matures.
Together these transition businesses, underpinned by these five growthengines, aim to deliver around $9 to 10 billion of EBITDA by 2030.
53

FY & 4Q 2021 financial results & update on strategic progress
Transition growth engines – operational milestones
Bioenergy production
Standalone bio-plants 3
Strategic convenience sites*
Margin share from convenience & electrification
2,150 ~3,000 ~3,500
~35% ~50%
EV charge points* 13,100 >70,000 >100,000>40,000
Developed renewables to FID*
Offshore wind
20GW4.4GW 50GW
Hydrogen*
CCS
SolarLSbp delivers 25GW to FID
First COD of bp US solar pipeline
First green hydrogen*
from Lingen gH2, H2-Fifty, Castellon gH2, GET H2 Nukleus
H Vision, HyGreen, NZT power, and H2 Teesside operational
NEP CCS operational
54
Global biogas offtakes >225
>50mbd >100mbd
29%
35
>26mbd
5.2GW1
pipeline
5.2GWNet offshore wind to FID
First offshore wind projects operational
19.4GWpipeline
0.7-1.3mtpa
3
Operational bio-refineries* 22
>125
(1) Includes ScotWind lease option award in January 2022
First offshore wind projects to FID
Strategic progress ‒ financial frame
Our confidence in this potential reflects the progress made in building strongfoundations in each of these businesses and, as a result, a clear set ofoperational milestones from which you can start tracking our progress.
As Bernard has highlighted:
− In bioenergy, our plans are underpinned by 5 major projects includingthree adjacent to existing refineries;
− Additionally, we will continue to rapidly expand our arrangements withbiogas companies – with further offtake and equity positions;
− In convenience we have grown our network of strategic conveniencesites by around 30% in the last two years with clear line of sight to ourupgraded targets in 2025;
− We are rapidly building a network of EV charge points to underpin ourfocus on fleet and ‘on-the-go’ fast charging in core markets;
− We have established a 5.2GW pipeline in offshore wind. This includesEmpire Wind and Beacon Wind in the US, Mona and Morgan in the IrishSea and our new ScotWind venture, Morven. We expect the first projectsdue online before the end of the decade; and
− Our first green hydrogen projects are scheduled to start-up from 2024.
54

FY & 4Q 2021 financial results & update on strategic progress
Disciplined investment allocation
Capital expenditure* (including inorganics) $bn
2021 2022 2023-25 2026-30
Resilient hydrocarbons 9.3 ~9 9-10 ~8
Convenience and mobility 1.6 2-3 2-3 2-3
Low carbon energy 1.6 ~2.5 3-5 4-6
Group capital expenditure*1 12.8 14-15 14-16 14-16
(1) Includes OB&C*
Strategic progress ‒ financial frame
55
As we invest to drive this growth we are committed to the disciplinedallocation of capital.
We expect to maintain a disciplined capital frame of $14 to 16 billion perannum through 2025. And we aim to sustain this level through 2030.
− In resilient hydrocarbons we expect to invest $9 to 10 billion per annumbetween 2023 and 2025. With our plan to invest around $7.5 billion perannum in oil and gas through 2025 unchanged, the range reflects ourplans to deepen in bioenergy;
− In convenience and mobility we expect to invest between $2 to 3 billionper annum. This underpins our convenience strategy and our plans toaccelerate in EV charging; and
− In Low carbon energy we expect to invest $3 to 5 billion per annumbetween 2023 and 2025, rising to $4 to 6 billion per annum in the secondhalf of the decade as we build our position in renewables and hydrogen.
We also have a standardised approach to investment allocation balancing:investment economics; volatility and rateability; optionality and integration;strategic alignment; safety and risks; and sustainability.
And we have stringent investment hurdles. These include payback periods ofless than 10 years for oil and refining and less than 15 years for gas. And wealso have returns expectations for low carbon energy as well as the transitiongrowth engines Bernard mentioned earlier.
55

FY & 4Q 2021 financial results & update on strategic progress
Continued strengthening of the balance sheet
Continued net debt* reduction $bn Doubling duration of debt book to >9 years % Gross debt
2021-5 average cash balance point*
~$40/bbl
Intend to allocate 40% of 2022 surplus cash to further strengthen balance sheet
Strategic progress ‒ financial frame
56
This capital frame is also underpinned by a strong balance sheet.
We remain focused on maintaining a strong investment grade credit ratingand have made strong progress.
I have already outlined the strong progress we made in reducing net debt byover $8 billion in 2021.
In addition, we remain focused on maintaining an efficient balance sheet.Since the end of 2019 we have:
− repurchased around $15 billion of short-dated bonds and issued over $11billion of bonds with a duration of 20 years or longer;
− more than doubled the duration of our debt book to over 9 years; and
− Increased our exposure to fixed rates at attractive coupons.
Looking ahead, and subject to maintaining an investment grade credit rating in2022, we plan to allocate 40% of surplus cash flow to further strengthen thebalance sheet. And to manage the business with a conservative cash balancepoint of around $40 per barrel on average through 2025.
56

FY & 4Q 2021 financial results & update on strategic progress
Resilient dividend with clear priorities for surplus cash flow
2022-25 average annual dividend and uses of surplus cash flow*¹ $bn
(1) Assumes 60% surplus cash flow* allocated to share buyback and 40% to further debt reduction(2) Through 2025(3) Subject to maintaining a strong investment grade credit rating
Resilient dividend is our first priority
Capacity for ~4% annual dividend per share increase at ~$60/bbl²
Committed to return ≥60% surplus cash flow*
through share buyback3
Expect to deliver average buyback of ~$4bn per annum at ~$60/bbl²
Strategic progress ‒ financial frame
57
Our financial frame enables us to reward shareholders today throughcommitted distributions.
Subject to the board’s discretion, and at around $60 per barrel, we expect tohave capacity for an annual increase in the dividend per ordinary share ofaround 4% through 2025.
And we remain committed to returning at least 60% of surplus cash flowthrough share buybacks – guiding to 60% in 2022 – subject to maintaining astrong investment grade credit rating.
On average, at around $60 per barrel, we expect to be able to deliverbuybacks of around $4.0 billion per annum through 2025, with upside at higherprices.
57
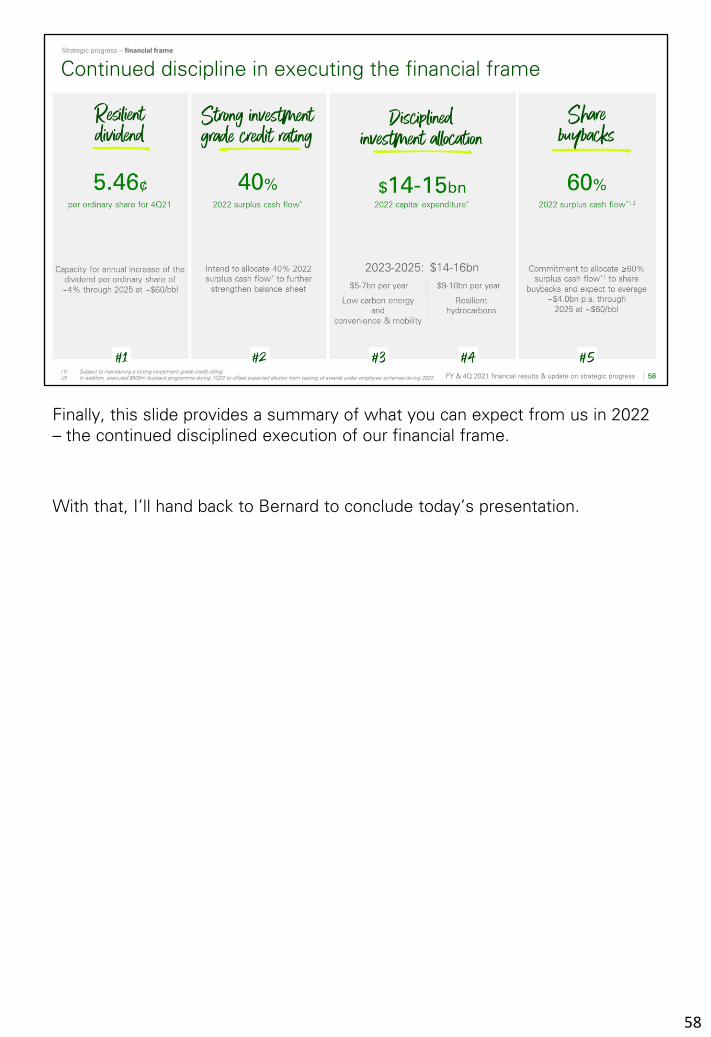
FY & 4Q 2021 financial results & update on strategic progress
Continued discipline in executing the financial frame
(1) Subject to maintaining a strong investment grade credit rating. (2) In addition, executed $500m buyback programme during 1Q22 to offset expected dilution from vesting of awards under employee schemes during 2022
Strategic progress ‒ financial frame
58
Finally, this slide provides a summary of what you can expect from us in 2022 – the continued disciplined execution of our financial frame.
With that, I’ll hand back to Bernard to conclude today’s presentation.
58

Chief executive officer
Thanks Murray
59

FY & 4Q 2021 financial results & update on strategic progress
Our investor propositionGrowing value and returns
Investing in transition; driving down emissions
Compelling cash distributions
(1) 2H19/1H20 to 2025 at $50-60/bbl (2020 real), at bp planning assumptions(2) By 2025, $50-60/bbl (2020 real), at bp planning assumptions (3) On average, based on bp’s current forecasts, at around $60 per barrel Brent and subject to the board’s discretion each quarter, bp expects to be able to
deliver buybacks of around $4bn per annum and have capacity for an annual increase in the dividend per ordinary share of around 4% through 2025(4) Excludes goodwill and cash and cash equivalent(5) By 2025
▪ 7-9% adjusted EBIDA*1 per share CAGR*
▪ Growing ROACE* to 12-14%2
▪ >20% capital employed4 in transition5
▪ Net zero* by 2050 or sooner for Scopes 1, 2 and 3
▪ Resilient dividend3, ~4% p.a. growth
▪ ≥60% surplus cash as share buybacks3
60FY & 4Q 2021 financial results & update on strategic progress
Investor proposition
In summary, you have heard a lot today on our strategic progress towardstransitioning into an IEC.
And it all comes together in our investor proposition as can be seen on thisslide. It is a simple, but we believe compelling, proposition that combines:
− committed distributions - generating competitive cash returns now as wetransform
− profitable growth – growing EBIDA per share and growing returns; and
− sustainable value - as we invest with discipline in the five transitiongrowth engines - and lower our emissions.
All in service of delivering long-term shareholder value.
Thank you again for listening this morning – now, it’s over to you. Murray and Iwill be delighted to take your questions, from the room and online.
May we ask you keep them to two points at most – and to frame them as
60

briefly as you can – so that we can get through as many as we can.
60

FY & 4Q 2021 financial results & update on strategic progressSecret

FY & 4Q 2021 financial results & update on strategic progress
1Q22 vs 4Q21
▪ Expect first-quarter 2022 reported upstream* production to be lower than
fourth-quarter 2021 reflecting base decline and higher maintenance. Within this,
we expect production from both oil production & operations and gas & low
carbon to be lower.
▪ Expect product demand to remain impacted by ongoing uncertainty around
COVID-19 restrictions and continued additive supply shortages in Castrol. In
products we expect energy costs to remain under pressure.
Guidance
(1) Underlying effective tax rate* is sensitive to the impact that volatility in the current price environment may have on the geographical mix of the group’s profits and losses
Full year 2022
Capital expenditure* $14-15bn
DD&A Similar level to 2021
Divestment and other proceeds $2-3bn
Gulf of Mexico oil spill payments ~$1.4bn pre-tax
OB&C* underlying annual charge $1.2-1.4bn full year, quarterly charges may vary
Underlying effective tax rate*1
Expected to be around 35% but is sensitive to theimpact that volatility in the current price environmentmay have on the geographical mix of the group’sprofits and losses.
Reported and underlying upstream production*
(ex. Rosneft)
Expect both reported and underlying upstream*
production to be broadly flat compared with 2021.Within this, we expect production from oil production& operations to be slightly higher and production fromgas & low carbon to be slightly lower. We expect thestart-up of Mad Dog Phase 2 in the second half of theyear and first gas from the Tangguh expansion projectin 2023.

FY & 4Q 2021 financial results & update on strategic progress
Gas and low carbon energyUnderlying RCPBIT* $bn
0.2
2.3
1.2
1.8
2.2
0
1
2
3
4Q20 1Q21 2Q21 3Q21 4Q21
▪ Higher realisations* and increased volumes driven by major project* ramp-up
▪ Return to an average contribution from gas marketing and trading
4Q 2021 vs 3Q 2021
4Q20 3Q21 4Q21
Production volume
Liquids (mbd) 98 109 122
Natural gas (mmcfd) 4,049 4,520 4,941
Total hydrocarbons (mboed) 796 889 974
Average realisations*
Liquids ($/bbl) 36.51 66.39 71.63
Natural gas ($/mcf) 3.37 5.26 6.94
Total hydrocarbons ($/boe) 21.27 34.91 43.68
Selected financial metrics ($bn)
Adjusted EBITDA* 0.9 3.1 3.5
Capital expenditure* – gas 0.9 0.7 0.9
Capital expenditure* – low carbon 0.5 0.3 0.1
Operational metrics (GW, bp net)
Installed renewables capacity* 1.5 1.7 1.9
Developed renewables to FID* 3.3 3.6 4.4
Renewables pipeline* 10.9 23.3 23.1

FY & 4Q 2021 financial results & update on strategic progressSecret
Gas and low carbon energy
4.4
27.516.2
1.4
5.3
0.2
Developedto FID*4Q 2021
Americas AsiaPacific
Europe Other Developed+ pipeline
Pipeline
84%
16%
Solar Offshore wind
Developed renewables to FID* and renewables pipeline* bp net, GW
Renewables pipeline*
by technology bp net
▪ Developed and pipeline 0.6GW higher than 3Q21, driven byincrease in Lightsource bp developed assets
▪ 53 projects developed to FID* by Lightsource bp withweighted average expected IRR of 8 – 10%
active projects
Renewables hopper*
bp net

FY & 4Q 2021 financial results & update on strategic progress
Oil production and operations4Q20 3Q21 4Q21
Production volume1
Liquids (mbd) 1,021 975 1,004
Natural gas (mmcfd) 1,962 1,961 2,053
Total hydrocarbons (mboed) 1,359 1,313 1,358
Average realisations*
Liquids ($/bbl) 38.58 65.53 71.07
Natural gas ($/mcf) 2.38 5.61 9.27
Total hydrocarbons ($/boe) 33.18 57.72 66.94
Selected financial metrics ($bn)
Exploration write-offs 0.1 0.0 0.0
Adjusted EBITDA* 2.5 4.2 5.7
Capital expenditure* 1.1 1.1 1.3
Combined upstream
Oil and gas production1 (mboed) 2,155 2,202 2,332
bp average realisation* ($/boe) 28.48 47.57 56.46
Unit production costs* 1,2 ($/boe) 6.39 6.96 6.82
bp-operated plant reliability* 2 (%) 94.0 94.3 94.0
(1) Excluding Rosneft(2) On a year-to-date basis
Underlying RCPBIT* $bn
0.6
1.6
2.22.5
4.0
0.0
1.0
2.0
3.0
4.0
5.0
4Q20 1Q21 2Q21 3Q21 4Q21
4Q 2021 vs 3Q 2021
▪ Higher liquids and gas realisations* including the benefit of very strong NBP prices
▪ Higher volumes

FY & 4Q 2021 financial results & update on strategic progress
Customers and products4Q20 3Q21 4Q21
Customers – convenience & mobility
Customers – convenience & mobility adjusted EBITDA*
1.0 1.1 1.0
Castrol1 adjusted EBITDA* 0.3 0.3 0.2
Capital expenditure* 0.4 0.3 0.7
bp retail sites* – total2 20,300 20,350 20,500
bp retail sites in growth markets* 2 2,700 2,650 2,700
Strategic convenience sites* 2 1,900 2,050 2,150
Marketing sales of refined products (mb/d)3 2,683 2,993 2,978
Products – refining & trading
Adjusted EBITDA* (0.2) 0.8 0.4
Capital expenditure* 0.4 0.3 0.5
Refining environment
RMM* ($/bbl) 5.9 15.2 15.1
Refining throughput (mmbd) 1,628 1,622 1,644
Refining availability* (%) 96.1 95.6 95.4
Underlying RCPBIT* $bn
4Q 2021 vs 3Q 2021
Customers
▪ Resilient retail and convenience performance despite seasonality and COVID-19 impacts
▪ Castrol performance benefitted from higher volumes which was more thanoffset by high base oil prices and continuing additive shortages
▪ Increased digital and wage expenditure
Products
▪ In refining, higher commercial optimisation offset by increased energy costs
▪ Significantly lower contribution from oil trading
0.1
0.70.8
1.2
0.6
(1.0)
0.0
1.0
2.0
4Q20 1Q21 2Q21 3Q21 4Q21
Customers - convenience & mobility Products - refining & trading Petrochemicals Total
(1) Castrol is included in customers – convenience & mobility(2) Reported to the nearest 50(3) Comparative information for 2020 has been restated for the changes to net presentation of revenues and
purchases relating to physically settled derivative contracts effective 1 January 2021. For more information see SEA - note 1 basis of preparation - voluntary change in accounting policy

FY & 4Q 2021 financial results & update on strategic progress
Rosneft
bp share of underlying net income* $bn
4Q20 3Q21 4Q21
bp share of production volume
Liquids (mbd) 876 876 879
Natural gas (mmcfd) 1,360 1,418 1,432
Total hydrocarbons (mboed) 1,111 1,120 1,126
bp share of Rosneft dividend* $bn
0.0
0.2
0.4
0.6
0.8
2020 20210.3
0.4
0.7
0.9
0.7
0.0
0.2
0.4
0.6
0.8
1.0
4Q20 1Q21 2Q21 3Q21 4Q21

FY & 4Q 2021 financial results & update on strategic progressSecret
Oil investment optionsUS Gulf of Mexico
Atlantis
Major facility expansion
Drill center 1,2 and 3 expansions
Mad Dog
North West water injection
South West expansion
North Graben
Na Kika
Herschel expansion
Thunder Horse
Shallow development
Infill and Exploration Drilling
Operated hubs Non-operated hubs
Exploration drilling
bpx energy
Permian stacked horizons
Austin chalk
Eagle Ford infill and expansion drilling
Canada
Exploration drilling
Brazil
Exploration drilling
UK and Norway
Murlach Johan Sverdrup Phase 2
Alligin Phase 2 NOAKA
Clair Phase 3 and follow-on
NCP
UK infill drilling Norway infill drilling
Exploration drilling
Azerbaijan
Infill drilling Exploration drilling
Russia
Infill drilling Exploration drilling
Middle East
Iraq infill drilling/waterflood
UAE infill drilling/EOR
Angola
B18 infill drilling B15/17 infill drilling
B31 PAJ Exploration drilling
Asia Pacific
Exploration drilling
Angola
UK and Norway
Russia
Azerbaijan
bpx energy
US Gulf of Mexico
Middle East
Canada
Brazil
New hubExisting hub
Note: Summarised selection of opportunities. Excludes major projects* under development or online
Asia Pacific

FY & 4Q 2021 financial results & update on strategic progressSecret
Gas investment options
UK and Norway
Infill drilling Exploration drilling
bpx energy
Haynesville infill drillingEagle Ford infill and expansion drilling
Trinidad & Tobago
Cypre Cassia TP61
Coconut Mento
Ginger Deepwater
Infill drilling Exploration drilling
Mauritania and Senegal
GTA Phases 2 and 3Southern Mauritania Gas Hub
Yakaar Teranga
North Africa
Harmattan Bashrush
Satis Raven M40/M62
Algeria infill drilling Egypt infill drilling
Exploration drilling
Angola
New Gas Consortium
Azerbaijan
Shah Deniz compression
Infill drilling
Exploration drilling
Russia
Kharampur Turonian Zinichev
Middle East
Oman infill drilling Oman compression
Exploration drilling
India
R-series Phase 2 Exploration drilling
Asia Pacific
Tangguh infill drillingTangguh Expansion Phase 2
North West Shelf infill drilling
Browse
Exploration drilling
Angola
Russia
Azerbaijan
bpx energy
Trinidad & Tobago
North Africa
Mauritania and Senegal
New hubExisting hub
Note: Summarised selection of opportunities. Excludes major projects* under development or online
India
MiddleEast
UK and Norway
Asia Pacific

FY & 4Q 2021 financial results & update on strategic progressSecret
Reconciling strategic themes and reporting segments
Oil production & operations
Customers & products
Gas & low carbon energy1
Rosneft Other businesses & corporate
Resilient hydrocarbons
▪ Oil production ▪ Refining and products
▪ Bioenergy
▪ Gas production
▪ Gas marketing and trading
▪ Rosneft
Convenience and mobility
▪ Convenience
▪ Fuels
▪ EV charging
▪ Castrol, aviation, B2B/midstream
Low carbon energy1
▪ Renewables
▪ Hydrogen*
Other businesses & corporate
▪ OB&C
Reporting segment
Str
ate
gic
th
em
e
Denotes growth engine
This is not a exhaustive list of businesses
(1) Includes bp bunge

FY & 4Q 2021 financial results & update on strategic progressSecret

FY & 4Q 2021 financial results & update on strategic progressSecret
GlossaryAdjusting items Include gains and losses on the sale of businesses and fixed assets,
impairments, environmental and other provisions, restructuring, integrationand rationalisation costs, fair value accounting effects, costs relating to theGulf of Mexico oil spill and other items. Adjusting items within equity-accounted earnings are reported net of incremental income tax reported bythe equity-accounted entity. Adjusting items are used as a reconcilingadjustment to derive underlying RC profit or loss and related underlyingmeasures which are non-GAAP measures.
Bio-refineries A facility that is dedicated to processing biological materials (including wasteoil and crop waste) to produce biofuels such as bio-diesel and sustainableaviation fuel, which may be blended to customer specifications with othercomponents such as hydrocarbons at co-located or adjacent terminals andtanks.
bp-operated plant reliability
Calculated taking 100% less the ratio of total unplanned plant deferralsdivided by installed production capacity. Unplanned plant deferrals areassociated with the topside plant and where applicable the subsea equipment(excluding wells and reservoir). Unplanned plant deferrals includebreakdowns, which does not include Gulf of Mexico weather relateddowntime.
bp share of Rosneft dividend
From 2018, represents bp’s share of 50% of Rosneft’s IFRS net profit.
bp share of underlying net income
On a replacement cost basis and adjusted for adjusting items*; 4Q21represents bp estimate.
Capital expenditure
Total cash capital expenditure as stated in the condensed group cash flowstatement. Capital expenditure for the operating segments and customers &products businesses is presented on the same basis.
Cash balance point
Implied Brent oil price for the quarter that would cause the sum of operatingcash flow excluding Gulf of Mexico oil spill payments (assuming actualrefining marker margins and Henry Hub gas prices for the quarter) andproceeds from loan repayments to equate to the sum of total cash capitalexpenditure, lease liability payments, dividend paid, and payments onperpetual hybrid bonds.
Consolidation adjustment – UPII
Unrealised profit in inventory arising on inter-segment transactions.
Convenience gross margin
Calculated as RC profit before interest and tax for the customers & productssegment, excluding RC profit before interest and tax for the refining &trading and petrochemicals businesses, and adjusting items* (as definedabove) for the convenience & mobility business to derive underlying RCprofit before interest and tax for the convenience & mobility business;subtracting underlying RC profit before interest and tax for the Castrolbusiness; adding back depreciation, depletion and amortisation, productionand manufacturing, distribution and administration expenses forconvenience & mobility (excluding Castrol); subtracting earnings from equity-accounted entities in the convenience & mobility business (excludingCastrol) and gross margin for the retail fuels, next-gen, aviation, B2B andmidstream businesses.
Developed renewables to FID
Total generating capacity for assets developed to FID by all entities wherebp has an equity share (proportionate to equity share). If asset issubsequently sold bp will continue to record capacity as developed to FID. Ifbp equity share increases developed capacity to FID will increaseproportionately to share increase for any assets where bp held equity at thepoint of FID.
Disposal proceeds
Divestments and other proceeds.

FY & 4Q 2021 financial results & update on strategic progressSecret
EBIDA / adjusted EBIDA
Underlying replacement cost profit before interest and tax*, add backdepreciation, depletion and amortisation and exploration expenditure written-off (net of adjusting items*), less taxation on an underlying RC basis.
EBITDA / adjusted EBITDA
Replacement cost (RC) profit before interest and tax, excluding net adjustingitems*, adding back depreciation, depletion and amortisation and explorationwrite offs (net of adjusting items).
Electric vehicle charge points / EV charge points
Defined as charge points operated by either bp or a bp joint venture.
Energy product An energy product is a product that is used by an ultimate end-user to satisfyan energy demand. In the case of fuels, to burn them to release their calorificcontent, and in the case of electricity to provide work or heat. A refinedproduct such as a lubricant base stock does not count as an energy productas it is not used to provide energy in its use phase.
Hopper Renewables hopper comprises of project opportunities from the point ofinitial evaluation until they are either stopped or become part of therenewable pipeline.
Hydrogen / low carbon hydrogen
Hydrogen fuel with reduced carbon attributes, including renewable (green)hydrogen made from solar, wind and hydro-electricity, and (blue) made fromnatural gas in combination with carbon capture and storage.
Installed renewables capacity
bp's share of capacity for operating assets owned by entities where bp hasan equity share.
Lease payments Lease liability payments.
Major projects Have a bp net investment of at least $250 million, or are considered to be ofstrategic importance to bp or of a high degree of complexity.
Net debt Calculated as finance debt, as shown in the balance sheet, plus the fair valueof associated derivative financial instruments that are used to hedge foreigncurrency exchange and interest rate risks relating to finance debt, for whichhedge accounting is applied, less cash and cash equivalents. Net debt doesnot include accrued interest, which is reported within other receivables andother payables on the balance sheet and for which the associated cash flowsare presented as operating cash flows in the group cash flow statement.
Net zero References to net zero for bp in the context of our ambition and Aims 1, 2and 3 mean achieving a balance between (a) the relevant Scope 1 and 2emissions (for Aim 1), Scope 3 emissions (for Aim 2) or product lifecycleemissions (for Aim 3), and (b) the aggregate of applicable deductions fromqualifying activities such as sinks under our methodology at the applicabletime.
Net zero operations
bp’s aim to reach net zero* operational greenhouse gas (CO2 and methane)emissions by 2050 or sooner, on a gross operational control basis, inaccordance with bp’s Aim 1, which relates to our reported Scope 1 and 2emissions. Any interim target or aim in respect of bp’s Aim 1 is defined interms of absolute reductions relative to the baseline year of 2019.
Net zero production
bp’s aim to reach net zero* CO2 emissions, in accordance with bp’s Aim 2,from the carbon in our upstream oil and gas production, in respect of theestimated CO2 emissions from the combustion of upstream production ofcrude oil, natural gas and natural gas liquids (NGLs) on a bp equity sharebasis based on bp’s net share of production, excluding bp’s share of Rosneftproduction and assuming that all produced volumes undergo fullstoichiometric combustion to CO2. Aim 2 is bp’s Scope 3 aim and relates toScope 3, category 11 emissions. Any interim target or aim in respect of bp’sAim 2 is defined in terms of absolute reductions relative to the baseline yearof 2019.
Glossary

FY & 4Q 2021 financial results & update on strategic progressSecret
Net zero sales bp’s aim to reach net zero* for the greenhouse gas emissions associatedwith the lifecycle (including end use) of its marketed and physically traded*energy products, in accordance with bp’s Aim 3. Any interim target or aim inrespect of bp’s Aim 3 is defined in terms of reductions in the weightedaverage greenhouse gas emissions per unit of energy delivered (in gramsCO2e/MJ) relative to the baseline year of 2019. (Work is ongoing to confirman assured baseline for this Aim to incorporate the inclusion of physicallytraded sales.) Greenhouse gas emissions (CO2, methane, N2O) are estimatedon a lifecycle basis covering production / extraction, transportation,processing, distribution and use of the relevant products (assuming fullstoichiometric combustion of the product to CO2).
OB&C Other businesses and corporate.
Operating cash flow
Net cash provided by (used in) operating activities as stated in the condensedgroup cash flow statement.
Physically traded energy product
For the purposes of Aim 3, this includes trades in energy products which arephysically settled in circumstances where bp considers their inclusion to beconsistent with the intent of the Aim. It therefore excludes, for example,financial trades, and physical trades where the purpose or effect is that thevolumes traded net off against each other.
Realisations Result of dividing revenue generated from hydrocarbon sales, excludingrevenue generated from purchases made for resale and royalty volumes, byrevenue generating hydrocarbon production volumes. Revenue generatinghydrocarbon production reflects the bp share of production as adjusted forany production which does not generate revenue. Adjustments may includelosses due to shrinkage, amounts consumed during processing, andcontractual or regulatory host committed volumes such as royalties.
Refining availability
Represents Solomon Associates’ operational availability for bp-operatedrefineries, which is defined as the percentage of the year that a unit isavailable for processing after subtracting the annualised time lost due toturnaround activity and all planned mechanical, process and regulatorydowntime.
Refining marker margin (RMM)
Average of regional indicator margins weighted for bp’s crude refiningcapacity in each region. Each regional marker margin is based on productyields and a marker crude oil deemed appropriate for the region. The regionalindicator margins may not be representative of the margins achieved by bpin any period because of bp’s particular refinery configurations and crude andproduct slate.
Renewables pipeline
Renewable projects satisfying the following criteria until the point they canbe considered developed to final investment decision (FID): Site basedprojects have obtained land exclusivity rights, or for PPA based projects anoffer has been made to the counterparty, or for auction projects pre-qualification criteria has been met, or for acquisition projects post a bindingoffer being accepted.
Retail sites Include sites operated by dealers, jobbers, franchisees or brand licensees orjoint venture (JV) partners, under the bp brand. These may move to and fromthe bp brand as their fuel supply agreement or brand licence agreementexpires and are renegotiated in the normal course of business. Retail sitesare primarily branded bp, ARCO, Amoco, Aral and Thorntons, and alsoincludes sites in India through our Jio-bp JV.
Retail sites in growth markets
Retail sites that are either bp branded or co-branded with our partners inChina, Mexico and Indonesia and also include sites in India through our Jio-bp JV.
Glossary

FY & 4Q 2021 financial results & update on strategic progressSecret
ROACE Defined as underlying replacement cost profit, which is defined as profit orloss attributable to bp shareholders adjusted for inventory holding gains andlosses, adjusting items and related taxation on inventory holding gains andlosses and total taxation on adjusting items, after adding back non-controllinginterest and interest expense net of tax, divided by the average of thebeginning and ending balances of total equity plus finance debt, excludingcash and cash equivalents and goodwill as presented on the group balancesheet over the periods presented. Interest expense is finance costs aspresented on the group income statement, excluding lease interest and theunwinding of the discount on provisions and other payables before tax.
Rosneft underlying RCPBIT
bp’s adjusted share of Rosneft’s earnings after Rosneft's own finance costs,taxation and non-controlling interests is included in the bp group incomestatement within profit before interest and taxation. For each year-to-dateperiod it is calculated by translating the amounts reported in Russian roublesinto US dollars using the average exchange rate for the year to date.
Solomon availability
See Refining availability definition
Solomon net cash margin
Net cash margin is defined by Solomon Associates as the net marginachieved after subtracting cash operating expenses and adding any refineryrevenue from other sources. Net cash margin is expressed in US dollars perbarrel of net refinery input.
Strategic convenience sites
Retail sites, within the bp portfolio, which both sell bp branded fuel and carryone of the strategic convenience brands (e.g. M&S, Rewe to Go). To beconsidered a strategic convenience brand the convenience offer should be astrategic differentiator in the market in which it operates. Strategicconvenience site count includes sites under a pilot phase.
Surplus cash flow Refers to the net surplus of sources of cash over uses of cash, afterreaching the $35 billion net debt target. Sources of cash include net cashprovided by operating activities, cash provided from investing activities andcash receipts relating to transactions involving non-controlling interests.Uses of cash include lease liability payments, payments on perpetual hybridbond, dividends paid, cash capital expenditure, the cash cost of sharebuybacks to offset the dilution from vesting of awards under employeeshare schemes, cash payments relating to transactions involving non-controlling interests and currency translation differences relating to cash andcash equivalents as presented on the condensed group cash flowstatement.
Underlying effectivetax rate (ETR)
Calculated by dividing taxation on an underlying replacement cost (RC) basisby underlying RC profit or loss before tax. Taxation on an underlying RCbasis for the group is calculated as taxation as stated on the group incomestatement adjusted for taxation on inventory holding gains and losses andtotal taxation on adjusting items*.
Underlying production
2021 underlying production, when compared with 2020, is production afteradjusting for acquisitions and divestments, curtailments, and entitlementimpacts in our production-sharing agreements/contracts and technicalservice contract.
Underlying replacement cost profit
Replacement cost profit or loss* after excluding net adjusting items* andrelated taxation.
Underlying replacement cost profit or loss before interest and tax (RCPBIT)
Underlying RC profit or loss before interest and tax for the operatingsegments or customers & products businesses is calculated as RC profit orloss including profit or loss attributable to non-controlling interests beforeinterest and tax for the operating segments and excluding net adjustingitems* for the respective operating segment or business.
Glossary

FY & 4Q 2021 financial results & update on strategic progressSecret
Unit production costs
Calculated as production cost divided by units of production. Production costdoes not include ad valorem and severance taxes. Units of production arebarrels for liquids and thousands of cubic feet for gas. Amounts disclosedare for bp subsidiaries only and do not include bp’s share of equity-accounted entities.
Underlying replacement cost profit or loss before interest and tax (RCPBIT)
Underlying RC profit or loss before interest and tax for the operatingsegments or customers & products businesses is calculated as RC profit orloss including profit or loss attributable to non-controlling interests beforeinterest and tax for the operating segments and excluding net adjustingitems* for the respective operating segment or business.
Unit production costs
Calculated as production cost divided by units of production. Production costdoes not include ad valorem and severance taxes. Units of production arebarrels for liquids and thousands of cubic feet for gas. Amounts disclosedare for bp subsidiaries only and do not include bp’s share of equity-accounted entities.
Glossary
Working capital Movements in inventories and other current and non-current assets andliabilities as reported in the condensed group cash flow statement.
Change in working capital adjusted for inventory holding gains/losses and fairvalue accounting effects is a non-GAAP measure. It is calculated by adjustingfor inventory holding gains/losses reported in the period and from thesecond quarter onwards, it is also adjusted for fair value accounting effectsreported within adjusting items* for the period. This represents what wouldhave been reported as movements in inventories and other current and non-current assets and liabilities, if the starting point in determining net cashprovided by operating activities had been underlying replacement cost profitrather than profit for the period. The nearest equivalent measure on an IFRSbasis for this is movements in inventories and other current and non-currentassets and liabilities.
bp utilises various arrangements in order to manage its working capitalincluding discounting of receivables and, in the supply and trading business,the active management of supplier payment terms, inventory and collateral.