cop_esia.pdf - BP
948
-
Upload
khangminh22 -
Category
Documents
-
view
4 -
download
0
Transcript of cop_esia.pdf - BP


ACKNOWLEDGEMENTS
URS acknowledges with thanks the following:
Companies
Academic and Scientific Experts
Individual Expertise
Academic and Scientific Institutions
Non Governmental Organisations

AIOC Chirag Oil Project Environmental & Socio-Economic Impact Assessment
Executive Summary
February 2010 E/1Final
Executive Summary
This Executive Summary presents a concise non technical overview of the Chirag Oil Project (COP) Environmental and Social Impact Assessment (ESIA). It is intended to provide a summary of the project design and activities, of the issues considered in the ESIA and of the main conclusions with respect to environmental and socio-economic impact. Detailed technical descriptions of discharge modelling, mitigation and monitoring are presented in the main sections of the ESIA.
E.1 Introduction
The Azeri Chirag Gunashli (ACG) Contract Area covers approximately 432km2 and lies approximately 120km east of Baku, the Azerbaijan capital. Development of the Contract Area, which is operated by BP on behalf of the Azerbaijan International Operating Company (AIOC),is being pursued in phases and to date has included:
Early Oil Project (EOP); ACG Phase 1; ACG Phase 2; and ACG Phase 3.
Operations at the ACG field started in November 1997 with the start-up of production from the Chirag-1 platform (Early Oil Project). The Central, West and East Azeri facilities (including the EA, WA, CA-C&WP and CA-PDQ platforms) were developed under Phases 1 and 2 and Deepwater Gunashli (DWG) portion was developed under Phase 3. The Chirag Oil Project (COP) represents the next stage of development in the ACG Contract Area. Figure E.1 shows the location of the existing ACG and proposed COP offshore facilities within the ACG Contract Area in addition to the subsea pipeline network, connecting the facilities to the onshore processing facilities at Sangachal Terminal.
Figure E.1 Location of Azeri Chirag Gunashli Contract Area

AIOC Chirag Oil Project Environmental & Socio-Economic Impact Assessment
Executive Summary
February 2010 E/2Final
E.2 Project Overview and Need for an ESIA
The COP includes the construction and the installation of a new Production, Drilling and Quarters platform (designated West Chirag (WC)-PDQ), to be located between the existing Chirag-1 and DWG platforms, and the installation of infield pipelines connecting the platform to the existing ACG subsea oil and gas pipelines. Infield pipelines will also be installed for the transfer of produced water and injection water between the WC-PDQ platform to the nearby DWG facilities. Figure E.2 shows the proposed platform and infield pipelines in the context of the existing operational ACG offshore facilities.
Figure E.2 ACG Contract Area Offshore Facilities (Including COP)
COP activities will occur primarily at the WC-PDQ platform location and, during the construction period, at existing onshore fabrication sites used for previous ACG projects. No new onshore facilities are planned as the existing facilities have sufficient capacity for handling production received from the WC-PDQ platform.
Given the location, scale and planned activities associated with the COP, AIOC and the Ministry of Ecology and Natural Resources (MENR) concluded that the project should be subject to an ESIA, and the ESIA should take account of applicable national and international legislation, the AIOC PSA and relevant BP standards.
The COP ESIA has been developed to make the most effective use of lessons learned during previous ACG projects and of the large amount of environmental and social information that has been acquired during the design, construction and subsequent operation of these projects.
The COP impact assessment methodology has been refined to take advantage of the fact that, unlike for previous ACG project ESIAs, it has been possible to:
Directly observe and document interactions with environmental receptors during all phases of development, including routine platform operations;
Utilise a large amount of regional environmental data to enable local operational impacts to be assessed more quantitatively and in context; and
Define receptor sensitivity more directly and quantitatively.
The COP ESIA has also addressed aspects such as predrilling activities and non-routine events in more detail than possible in previous ACG project ESIA.
Key:Pipelines
Oil
Water Gas

AIOC Chirag Oil Project Environmental & Socio-Economic Impact Assessment
Executive Summary
February 2010 E/3Final
E.3 Options Assessed and COP Design
Options assessed during the evolution of the COP design focused on the following:
The identification of a suitable location within the ACG Contract Area for the offshore facilities to exploit the selected reservoirs;
Platform design and the extent of integration with existing ACG offshore facilities; Efficiency and performance improvements offered by technology alternatives; and Maximising in-country fabrication of offshore facilities.
Those design options previously considered throughout the development of the ACG Phase 1, 2 and 3 Projects were also assessed.
The option of not developing the COP offshore facilities was also recognised and considered. A decision not to proceed would, however, result in a reduction of potential oil revenues to the Azerbaijan government with a resultant inability to deliver the associated benefits to the Azerbaijan economy. Pursuing the COP will result in employment creation for national citizens during both the construction phase and operational phase of the development as well as increased use of local facilities, infrastructure and suppliers. The option of not proceeding was therefore disregarded when considered against these socio-economic benefits.
The assessment of project design options led to the selection of a single-platform design, which will utilise available water injection capacity at the nearby DWG Production, Drilling, Water injection and Utilities (DWG-PCWU) platform. Produced water separated from crude oil on the WC-PDQ platform will be transferred to DWG-PCWU, mixed with both treated seawater and DWG-PCWU produced water and returned to the WC-PDQ platform under pressure for injection to the reservoir.
The selected design of the WC-PDQ platform is based largely on established ACG single-platform design with improvements based on experience in constructing and operating existing ACG platforms. These improvements include:
A more effective and reliable design for the platform sewage treatment plant; Improved offshore sand separation and management; and An alternative concept to a standard design option whereby the gas turbine direct
drives for gas export compression are replaced with electric motor drives and the onboard main power generation capacity is increased, the benefits of which are expected to include: More efficient use of the power provided by the main platform generators; Increased availability of the gas export compressors; Increased reliability and associated reduction in safety risk and potential for
accidental events; Reduced frequency of non-routine flaring by up to 40%; and Significantly reduced emissions, specifically greenhouse gas emissions, from the
platform.

AIOC Chirag Oil Project Environmental & Socio-Economic Impact Assessment
Executive Summary
February 2010 E/4Final
E.4 Assessment Methodology
The ESIA process adopted for the COP, as illustrated in Figure E.3, constitutes a systematic approach to the evaluation of the project and its associated activities throughout the project lifecycle from pre-construction, to construction and through to operation.
Figure E.3 The ESIA Process
Screening and ScopingType/level of assessment to be conducted
Initial appraisal of likely key issuesTargeted stakeholder engagement
Project AlternativesAnalysis of viable
alternatives to base case design
Existing ConditionsBaseline environmental
and socio-economic conditions
Base Case DesignGather and review design information
Impact Assessment Determine activity event
magnitudesDetermine receptor sensitivities
Identify existing controls and base case mitigation
Determine impact significance
Transboundary and Cumulative Impacts
Assessment of transboundary and cumulative Impacts
Residual Impacts Undertake residual impact assessment and determine any additional mitigation
measures required
Disclosure and ConsultationCommunicate draft findings and recommendations to stakeholders for comment
Finalise ESIA and submit for approval to authorities
Monitoring and MitigationDevelopment of management plans and procedures as part of AzSPU HSSE
Management System
Environmental and Socio-Economic InteractionsDetermine project activities – receptor interactions
Assessment of COP environmental impacts has been undertaken based on identified COP activities and events for each project phase that have the potential to interact with the environment. The expected significance of the impact has been assessed taking into account:
Event Magnitude: Determined based on the following parameters; Extent – the size of the area that is affected by the activity being undertaken; Duration – the length of time that the activity occurs; Frequency – how often the activity occurs; and Intensity of the impact - concentration of an emission or discharge with respect to standards of acceptability that include applicable legislation and international guidance, its toxicity or potential for bioaccumulation, and its likely persistence in the environment.

AIOC Chirag Oil Project Environmental & Socio-Economic Impact Assessment
Executive Summary
February 2010 E/5Final
Receptor Sensitivity: Determined based on: Presence – whether species/people are regularly present/transient, and whether species present are unique, threatened or protected; and Resilience – how vulnerable people/species are to the change or disturbance associated with the environmental interaction with reference to existing baseline conditions and trends (e.g. trends in ecological abundance/diversity/status, ambient air quality etc).
The COP impact assessment process has benefited from the fact that offshore ACG discharges and emissions have been comprehensively studied and characterised during the five years over which the existing ACG platforms have become operational. As a result, impacts have been evaluated and understood to a far greater extent than was previously possible.
The evaluation of impacts has been based on three principal sources of information:
Previous environmental risk assessments, including results of toxicity tests and modelling studies which are applicable to the COP;
Modelling studies, including onshore and offshore noise assessments and air dispersion modelling, undertaken specifically for the COP; and
Results from the Azerbaijan Strategic Performance Unit (AzSPU) Integrated Environmental Monitoring Programme (IEMP), which has included systematic and regular offshore monitoring at all new and operational platforms and which has regularly carried out ‘regional’ monitoring to identify and quantify natural environmental trends, and with onshore surveys including ecological and air quality monitoring in and around Sangachal Terminal.
The IEMP has been instrumental in providing a clearer picture of the composition and sensitivity of benthic biological communities in the ACG Contract Area and of the effect of platform and pipeline installation, drilling activities and platform operations on these receptors. With ACG Phases 1, 2 and 3 now in operation, the IEMP demonstrates that the control measures (design and operation) included in previous ESIAs have adequately mitigated impacts on the marine environment.
E.5 Consultation
The first stages of the Public Consultation and Disclosure process were initiated and completed before the drafting of the main ESIA document began. Scoping meetings were held in September 2008 to inform and receive comment from representatives of civil society, the scientific community, the key regulatory authorities and government and allow key issues to be incorporated into the ESIA scope.
The Draft ESIA document was subsequently publically disclosed and Non Governmental Organisations (NGO), the scientific community, the public and state organisations (including the Ministry of Ecology and Natural Resources (MENR)) were invited to provide written comment and to attend public meetings to discuss issues of concern. Comments received on the Draft Final ESIA report were collated, analysed and detailed responses issued to the consultees. The ESIA report was then revised and finalised for approval.
During the development of the COP detailed design, the MENR will be provided with regular updates to communicate materially significant technical changes.
E.6 Socio-Economic Impact
The majority of COP related Activities (with the exception of the construction phase) occur offshore and use existing operational onshore infrastructure capacities (e.g. Sangachal Terminal, the Baku Deep Water Jacket Factory (BDJF)). With reference to the experience gained on from the previous ACG Phases, the following key socio-economic issues were assessed:

AIOC Chirag Oil Project Environmental & Socio-Economic Impact Assessment
Executive Summary
February 2010 E/6Final
Employment creation; End of construction phase workforce reduction; Training and skills development; Economic activity; and Community disturbance.
The assessment concluded that the national workforce to be employed during the COP construction phase is likely to peak at approximately 2,000 and will likely exceed 1,000 for a period of approximately 18 months. Additional and new employment during the operations phase will be less in terms of new positions. Employment impacts are likely to be distributed within the local area with the majority of employees expected to be recruited from the local Garadagh area. It is anticipated therefore that employment will not require establishment of workforce accommodation or significant migration of populations to the construction areas.
Although the jobs created during the construction phase will not be required once the COP construction phases are complete, training and skills development, similar to that undertaken during the previous ACG projects, will provide a positive impact in developing the construction workforce skills and qualifications.
As the construction phase will only deliver temporary employment, planning for the conclusion of contracts will begin at the outset of the construction phase and related activities. Staff communications will ensure the workforce is aware of project progress and completion dates and staff will be provided with financial planning advice to encourage them to make provision for after the construction period.
The overall socio-economic impacts of the COP, particularly from employment creation throughout the construction, installation and hook-up and commissioning phases were assessed as positive.
Increased road traffic during the COP construction and operation phases has the potential to disrupt communities and businesses along the routes used through increased noise and traffic flows. BP and its main construction contractors implemented a successful driving and vehicle management plan during earlier ACG projects and this will be adopted for the COP to ensure that this impact is adequately mitigated. Overall the residual impact to communities and businesses from the increased traffic is considered to be minimal and significantly outweighed by the employment and business opportunities gained.
Economic developments in the Garadagh area since the completion of previous ACG projects include the relocation of the airport market to Lokhbatan, the proposed expansion of existing cement production facilities and the construction of new cement production facilities. These developments will have an impact on both local employment and traffic and will tend to reduce the relative magnitude of the impact of the COP development.
E.7 Environmental Impact Assessment
Environmental impact was assessed for each of the three main phases of the project.
Predrill: The project has adopted the established ACG practice of using a mobile drilling rig to predrill a number of producer, water injection and a cuttings injection well prior to WC-PDQ platform installation to facilitate early production once the platform is in place; Construction, installation, hook-up and commissioning: Includes all onshore construction and commissioning activities, offshore pipelay and pipeline commissioning and connection to the platform and existing ACG export pipeline network; and Operations: Platform production drilling and onshore hydrocarbon processing using the existing Sangachal Terminal facilities.

AIOC Chirag Oil Project Environmental & Socio-Economic Impact Assessment
Executive Summary
February 2010 E/7Final
Evaluation of impacts took into account the existence and effectiveness of existing controls and mitigation measures implemented by previous construction phases or in place on operational ACG platforms, which are also relevant for the COP.
For each phase:
Activities and events leading to interactions with the environment were identified; Scoping was undertaken to identify those COP activities that could be excluded from
the full assessment process based on their limited potential to result in discernable impacts; and
The impact of the remaining COP activities and the associated events were assessed based on event magnitude and the receptor sensitivity parameters.
The receptors and interaction categories considered are presented in Table E.1.
Table E.1 Receptors
Receptors Impact Type/Interaction
Atmospheric emissions Onshore communities (people)
NoiseSeals and fish Zooplankton Phytoplankton
Benthic invertebrates
Marine Environment: Discharges; Underwater noise; Seabed disturbance; and
Physical presence.
E.7.1 Predrill
Table E.2 summarises the outcome of impact assessment for the predrill phase of the project.
Emissions associated with mobile drilling rig power generation, well test flaring and the activity of support vessels will all occur offshore and disperse into the atmosphere. Modelling was undertaken to determine the concentration of key pollutants associated with these activities at receptor locations (i.e. onshore) and hence event magnitude. Based on existing good air quality relative to recognised standards for the protection of health, receptor sensitivity was considered to be low and the impact of atmospheric emissions was considered to be minor.

AIOC Chirag Oil Project Environmental & Socio-Economic Impact Assessment
Executive Summary
February 2010 E/8Final
Table E.2 Summary of Predrill Residual Environmental Impacts
During predrilling, the largest discharges to the marine environment by volume are drilling discharges, specifically the discharge of drill cuttings and water based drilling mud, and the discharge of cooling water from the mobile drilling rig generators. Modelling of the drilling discharges was undertaken to confirm the extent and scale of mud and cuttings predicted to be deposited on the seabed during COP predrilling. This was compared to trends observed during pre- and post- drilling surveys at existing platforms undertaken as part of the IEMP. These surveys have shown that such discharges, which are required to meet applicable standards prior to discharge, have a very limited ecological impact to marine receptors. Based on the predicted event magnitude, receptor characteristics and observed sensitivities the impact was assessed as minor.
Small quantities of cement may be discharged to the seabed whilst cementing well casings into place. These will remain close to the well-head in the same area as drill cuttings are deposited. The impact to benthic invertebrates, which were evaluated as having a low sensitivity to cement discharges, was therefore assessed as minor.
Cooling water discharges are estimated to have a zone of influence (i.e., where temperature and trace biocide concentrations might have a minor effect) of only a few metres and are also considered to have a minor impact upon biological receptors in the water column (i.e. zooplankton, phytoplankton, seals and fish).
The remaining discharges to sea (ballast water, black water, grey water and deck drainage) are all small in volume (relative to drilling and cooling water discharges and do not contain components of high environmental concern. These discharges, which are monitored in accordance with existing procedures to ensure applicable project standards are met, will be rapidly diluted and are all assessed as having a minor impact upon biological receptors in the water column.
Seabed disturbance associated with anchor handling during positioning of the mobile drilling rig will cause temporary disturbance to the surface layers of the sediment. The assessment concluded that benthic communities in the area are not, however, sensitive to this form of disturbance and the impact was therefore assessed as negligible.
Event Receptor Event Magnitude
Receptor Sensitivity
Impact Significance
Emissions from mobile drilling rig power generation
Medium Low Minor
Negative
Emissions from well test flaring Medium Low Minor
Negative Emissions from support vessel engines
Onshorecommunities
(people)Birds
Seals and fish Medium Low Minor
Negative
Underwater noise from drilling and vessel movements
Seals and fish Medium Low Minor
Negative
Drilling discharges
Seals and fish Zooplankton
Phytoplankton Benthic
Invertebrates
Medium Low Minor
Negative
Vessel and drilling rig cooling water intake and discharge
Medium Low Minor
Negative Vessel and drilling rig ballast water discharge
Medium Low Minor
Negative Vessel and drilling rig treated black water discharge
Medium Low Minor
Negative Vessel and drilling rig grey water discharge
Medium Low Minor
Negative Vessel and drilling rig drainage discharges
Seals and fish Zooplankton
Phytoplankton
Medium Low Minor
Negative
Cement discharges Medium Low Minor
Negative Seabed disturbance from anchor handling
BenthicInvertebrates
Low Low Negligible

AIOC Chirag Oil Project Environmental & Socio-Economic Impact Assessment
Executive Summary
February 2010 E/9Final
For all predrill phase environmental impacts assessed it has been concluded that impacts are minimised as far as practicable and necessary through the implementation of the existing control measures and no additional mitigation is required.
E.7.2 Construction, Installation, Hook-Up and Commissioning
Table E.3 summarises the interactions assessed for the construction, hook-up and commissioning phase, and the results of the impact assessment for each interaction.
Table E.3 Summary of Construction, Installation, Hook-Up and Commissioning Residual Environmental Impacts
Event Receptor Event Magnitude
Receptor Sensitivity
Impact Significance
Emissions from yard generators and engines
Medium MediumModerate Negative
Emissions from onshore platform generator commissioning
Medium MediumModerate Negative
Emissions from support vessel engines
Onshorecommunities
(people)Birds
Medium Low Minor Negative
Noise from construction yard plant
Medium MediumModerate Negative
Noise from onshore platform generator commissioning
Onshorecommunities
(people)Birds Medium Medium
Moderate Negative
Underwater noise from jacket foundation piling and vessel movements
Seals and fish Medium Low Minor Negative
Cooling water discharge from onshore commissioning of topside
Medium Low Minor Negative
Pipeline hydrotest discharge Medium Low Minor Negative Discharge of oil line wye spool water
Low Low Negligible
Support vessel ballast water discharge
Medium Low Minor Negative
Support vessel treated black water discharge
Medium Low Minor Negative
Support vessel grey water discharge Medium Low Minor Negative
Support vessel drainage discharge
Seals and fish Zooplankton
Phytoplankton
Medium Low Minor Negative
Jacket foundation pile cement discharge
Low Low Negligible
Seabed disturbance from anchor handling and pipe-lay
BenthicInvertebrates
Low Low Negligible
During the construction phase, impacts to onshore communities and birds from atmospheric emissions and noise arising from construction yard plant operation and onshore generator commissioning were modelled based on planned activities and were assessed as having moderate impact.
Underwater noise sources include jacket piling activities and movement of vessels used during platform and pipeline installation. Piling activities will generate the greatest sound volume but the sound will occur intermittently and over a short period. Vessel noise will be more persistent but will be at a much lower level than piling noise. Underwater noise modelling, undertaken to determine the extent of the noise impacts, coupled with an assessment of the associated avoidance behaviour reactions recorded in fish and seal populations, demonstrated that the activities would result in a minor impact.
During onshore commissioning of the platform generators, it will be necessary to operate a temporary cooling water system that will abstract water from and discharge to the construction yard harbour. This water will be at a higher temperature than the receiving waters and will contain neutralised disinfectant at trace concentrations. Similar discharges have been modelled and subject to environmental assessment during previous ACG projects

AIOC Chirag Oil Project Environmental & Socio-Economic Impact Assessment
Executive Summary
February 2010 E/10Final
and on the basis of those assessments and the existing controls and monitoring in place, the discharge was assessed as having a minor impact to biological receptors.
During offshore installation, hook-up and commissioning, the largest total volume of discharge to the marine environment will be associated with hydrotesting the oil and gas infield pipelines which connect the platform to the main ACG pipeline network pipelines and the produced and injection water infield pipelines. These discharges (comprising seawater dosed with dye and chemicals to prevent corrosion and biological growth) will take place intermittently over approximately one year and at different depths. Individual events have been evaluated to have a minor impact and, given the spatial and temporal distribution of the discharges, the overall impact was also assessed as minor to biological receptors. Additional measures to monitor and control hydrotest discharges will comprise:
Preparation and maintenance of a hydrotest management plan, which will include a regularly updated schedule of hydrotest events together with a detailed set of commissioning procedures;
Recording of chemical dosage rates and water flow rates during all pipeline hydrotest activities;
Recording of the volume of treated water released during each hydrotest discharge event; and
Preparation of laboratory samples, which will be stored onshore under simulated pipeline conditions and periodically subject to chemical analysis and toxicity testing in order to measure the rate of chemical degradation and associated toxicity reduction
Based on previous ACG experience, these measures are considered to provide effective and practicable monitoring and assurance during hydrotesting and are designed to ensure that the impact to the marine environment is of no more than minor significance.
The impacts of jacket foundation cementing discharges and physical disturbance associated with anchor handling upon benthic invertebrates will be similar to those evaluated for the predrill programme and were assessed as minor.
Aqueous discharges (ballast water, grey water, black water and drainage) will also be similar in magnitude and impact to those for the predrill programme and were assessed as having a minor impact upon biological receptors.
A small volume of water (approximately 65m3) with a low level of residual hydrocarbon (less than 100ppm) may be released to sea during hydrotesting of the wye section that will connect the COP oil export pipeline to the DWG oil export pipeline. This volume will be released at the seabed and will dilute and disperse rapidly. The impact upon biological receptors was assessed to be negligible.
Overall, the majority of residual impacts were assessed as minor or negligible. The only moderate impacts were those arising from air emissions and noise associated with construction yard activity and onshore platform commissioning. These activities will not however, result in the exceedence of ambient air quality or noise standards for the protection of human health. Community liaison and engagement, similar to that undertaken for the previous ACG projects, will be a key element throughout the construction phase to ensure these impacts are minimised. Construction activities will be managed in accordance with previously established practice and AzSPU procedures and impacts are considered to be controlled and mitigated to an acceptable level.

AIOC Chirag Oil Project Environmental & Socio-Economic Impact Assessment
Executive Summary
February 2010 E/11Final
E.7.3 Operations
Table E.4 summarises the interactions assessed for the operations phase, and the results of the impact assessment for each interaction.
Table E.4 Summary of Operations Residual Environmental Impacts Table 15.3 Summary of Operations Residual Environmental Impacts
Event Receptor Event Magnitude
Receptor Sensitivity
Impact Significance
Emissions from offshore platform power generation and non-routine flaring
Medium Low Minor Negative
Emissions from support vessel engines
Medium Low Minor Negative
(Humans)Medium
Moderate Negative
Emissions from onshore combustion plant and flaring
Onshorecommunities
(people)Birds
Medium (Biological /Ecological)
Low Minor Negative
Underwater noise from drilling, hammering and vessel movements
Seals and fish Medium Low Minor Negative
Platform drilling discharges Medium Low Minor Negative
Platform pigging discharges (produced water and injection water infield pipelines)
Seals and fish Zooplankton
Phytoplankton Benthic
InvertebratesMedium Low Minor Negative
Platform cement discharge Benthic
InvertebratesMedium Low Minor Negative
Platform non routine produced water discharge
Medium Low Minor Negative
Platform water intake and cooling water discharge
Medium Low Minor Negative
Support vessel ballast water discharge
Medium Low Minor Negative
Platform and support vessel treated black water discharge
Medium Low Minor Negative
Platform and support vessel grey water discharge
Medium Low Minor Negative
Platform and support vessel galley waste discharge
Medium Low Minor Negative
Platform and support vessel drainage discharge
Seals and fish ZooplanktonPhytoplankton
Medium Low Minor Negative
The majority of operational interactions are similar to those already considered for predrill and construction activities. Each interaction was assessed based on event magnitude and receptor sensitivity and the impact significance found to be the same as for the previous phases. Events include offshore emissions, underwater noise, drilling discharges (water based mud and cuttings discharge), cement discharge, cooling water discharge and aqueous discharges (i.e. ballast water, black water, grey water, galley waste, drainage). Only air emissions (onshore plant and flaring) were assessed as having a moderate impact. Emissions from onshore plant and flaring associated with the COP will not however, result in exceedences of internationally recognised ambient air quality standards for the protection of health at onshore receptors.
During routine operations, produced water will be reinjected into the reservoir. Discharge of produced water which meets applicable project standards will only occur due to failure of the reinjection system or if produced water is incompatible with seawater that is injected into the reservoir for pressure maintenance purposes. Pigging (i.e. cleaning of the produced water and injection water pipelines) is planned to occur once a week and discharge of pigging fluids will be of short duration (i.e. hours).
Produced water and pigging fluids have been the subject of chemical analysis, toxicity testing and dispersion modelling. The results of these studies have been used to estimate the degree of dilution required to reach a “no effect” level and the size of the dispersion plume within which such dilution would occur. Both types of discharge will be intermittent and of

AIOC Chirag Oil Project Environmental & Socio-Economic Impact Assessment
Executive Summary
February 2010 E/12Final
short duration (i.e. hours) and the plumes will dissipate within a few hours of the end of each discharge event. Based on the modelling conducted the volume of seawater potentially affected by these discharges is limited to a narrow plume of less than 600m in length. Based on the sensitivity of the receptors in the water column to the event and its limited magnitude, produced water and pigging fluid discharges were assessed as having a minor impact upon biological receptors.
Overall, the majority of residual impacts from operations are assessed as minor or negligible (with the exception of onshore air emissions). The expected moderate negative impact associated with onshore operations at the Sangachal Terminal will also be mitigated through existing community liaison and engagement supported by the IEMP ambient monitoring undertaken in and around the Terminal. All activities will be managed in accordance with previously established practice and AzSPU procedures and impacts are considered to be controlled and mitigated to an acceptable level.
E.8 Cumulative, Transboundary and Accidental Events
Cumulative impacts, potential transboundary impacts and the impacts of accidental events associated with the COP were also assessed. The routine and non-routine discharges to sea from the COP will be, as with other ACG projects, of limited impact. It was concluded that each discharge will make a small incremental contribution to the ACG total but the platform discharges will be isolated from each other and the total itself represents a very small fraction of the assimilative capacity of the Contract Area. Consequently, it is considered that these discharges represent a sustainable situation and it is predicted that there will be no measurable deterioration of the marine environment attributable to ACG operations.
For both onshore and offshore activities, the volumes of atmospheric emissions released (including visible particulates) due to the COP are expected to result in very small increases in pollutant concentrations in the atmosphere and in any washout from rainfall, which will not be discernable to biological/ecological receptors. SO2 emissions are minimised through the planned use of low sulphur diesel and preferential use of gas as a fuel for the operation of the WC-PDQ platform and are expected to disperse rapidly due to appropriate equipment design and fuel use. Contribution of COP SO2 emissions to acid rain generation is therefore expected to be insignificant.
It was estimated that 97% (5,995,000 tonnes) of the COP GHG emissions (comprising carbon dioxide and methane) will be generated from the operational phase activities onshore and offshore. The annual contribution of COP in the year 2020 to the predicted national Azerbaijan forecast1 was estimated to be approximately 0.5%.
Energy efficiency and GHG reduction was a key aspect taken into account during the development of the COP design, contributing to the selection of the electric drive concept with all power to the platform, including the gas export compressors, being provided by the main power generation turbines. Analysis demonstrated that this technology selection resulted in a saving of approximately 300,000 tonnes of CO2 emissions across the project’s lifetime, when compared to direct drive gas turbine technology. This is a more than 40% reduction.
A review and assessment of accidental events was carried out as part of the COP ESIA. This considered a number of accidental events scenarios that included well blowout and pipeline failure as well as lower magnitude events (e.g. spills). Modelling was undertaken to illustrate the expected behaviour of an oil spill for the blowout and pipeline rupture scenarios for COP. The results were similar to those obtained within previous ACG ESIAs as the COP crude oil is expected to be more persistent than Azeri oil but less persistent than the Chirag oil.
A platform blowout or major pipeline rupture are the only events with the potential to become regional transboundary events. The precise nature of the impact would depend on the
1 First National Communication of Azerbaijan on Climate Change, May 23 2000.

AIOC Chirag Oil Project Environmental & Socio-Economic Impact Assessment
Executive Summary
February 2010 E/13Final
prevailing weather conditions at the time of the spill, the time required for deploying spill response measures and their effectiveness.
BP, as operator of AIOC, has developed and maintains a range of Oil Spill Response Plans (OSRP) in place for its offshore and onshore operations in Azerbaijan. These plans encompass all phases of ACG development and establish the notification, response and followup actions that must be implemented should an accidental event occur. In addition BP has developed a system to manage pipeline integrity across the ACG pipeline network including monitoring and auditing procedures.
Analysis of onshore construction and offshore operation spill data focused on classifying the root causes, types, and quantities of spills. The principal outcome of this analysis was to identify the areas for improvement in equipment specification, training, operating procedures and maintenance procedures to be implemented for the COP. The established procedures for spill recording, investigation and corrective action will also be maintained.
The ESIA predicts that accidental events will be low in frequency, given the preventative measures in place, and if they do occur will be discrete (i.e. have a very low likelihood of overlapping in time and space). With the exception of a major loss of oil containment (i.e., blowout or pipeline rupture) they are also not persistent and such events will, therefore, have no cumulative impact.
E.9 Environmental and Social Management
Each phase of the COP will be subject to formal environmental and social (E&S) management planning under the framework of the integrated AzSPU HSSE Management System.
During the predrill and construction, installation and HUC phases the key contractor companies will be required, under the terms of their contracts, to develop and implement E&S Management Systems that align with the BP expectations and are bridged to the AzSPU HSSE Management System.
Once the WC-PDQ platform is “hydrocarbon live” it will become an operational facility, managed directly by AzSPU. External certification of the platform to ISO 14001 (the leading international standard on environmental management) within 12 months of becoming operational is a BP requirement.
The environmental and social management process during all phases of the COP will benefit from accumulated experience and ‘lessons learned’ from executing the three previous ACG projects. Major benefits of previous project experience include the development of:
Effective and reliable procedures for on-site segregation and management of waste; A non-hazardous landfill site designed and constructed to EU standards; and An effective process for identifying and utilising opportunities for waste recovery and
recycling.

AIOC Chirag Oil Project Environmental & Socio-Economic Impact Assessment
Executive Summary
February 2010 E/14Final
E.10 Conclusions
The COP has benefited, to a considerable extent, from the experience gained by AIOC in designing, constructing, installing and operating the ACG Phase 1, 2 and 3 facilities. The basic design concept has been well-tested and proven and over five years of environmental monitoring have demonstrated that the basic design concept is environmentally sound. Nevertheless, the COP has identified opportunities for improvement, most notably the selection of an electric drive concept that substantially reduces emissions and a more reliable sewage treatment plant. COP is committed to implementing these during project execution.
The COP will also benefit from the fact that the predrilling, construction and installation teams now have extensive practical experience in offshore ACG activities and that these teams can execute the planned activities reliably.
The environmental management process is underpinned by the IEMP. Since 2004, this programme has focused on establishing and executing a regular and structured programme of ambient environmental monitoring around planned, new and operating installations (onshore and offshore). By 2008, all the ACG Phase 1, 2 and 3 installations were operational and the focus of the IEMP is now shifting towards integration of operational monitoring. Increasingly, the IEMP will concentrate on the results of discharge/emission sampling and analysis from operational installations with the aim of confirming design performance and of identifying deviations in over time to minimise adverse effects.
In conclusion, the COP is based on proven design concepts and engineering standards and has benefited from lessons learned during previous ACG projects. These previous projects have been the subject of extensive environmental monitoring and the results of this monitoring provide confidence that the environmental impact of the COP design will be acceptable and effectively controlled.

AIOC Chirag Oil Project Environmental & Socio-Economic Impact Assessment
February 2010 i Final
Contents
Executive Summary
Units and Abbreviations Glossary
1. Introduction
1.1 Introduction 1/2 1.2 AIOC Oil and Gas Caspian Developments 1/3
1.2.1 ACG Production Sharing Agreement 1/3 1.2.2 ACG Contract Area and Field Development 1/3 1.2.3 Shah Deniz Gas Export Project 1/5 1.2.4 Export Pipelines 1/5
1.3 COP Overview 1/6 1.4 COP Environment and Socio-economic Impact Assessment 1/6
1.4.1 Objectives 1/6 1.4.2 Structure and ESIA Team 1/6
2. Policy, Regulatory and Administrative Framework
2.1 Introduction 2/2 2.2 Regulatory Agencies 2/2 2.3 The Constitution 2/3 2.4 Production Sharing Agreement 2/3 2.5 International and Regional Environmental Conventions 2/4 2.6 National Environmental Legislation 2/7
2.6.1 National EIA Guidance 2/11 2.7 Regional Processes 2/12
2.7.1 European Union 2/12 2.7.2 Environment for Europe 2/12
2.8 International Petroleum Industry Standards and Practices 2/12 2.9 BP Requirements 2/12
2.9.1 EIMP 2/13 2.9.2 PR 2/13
2.10 COP Project Standards 2/13
3. Impact Assessment Methodology
3.1 Introduction 3/2 3.2 ESIA Process 3/2
3.2.1 Screening 3/3 3.2.2 Scoping 3/3 3.2.3. Project Alternatives and Base Case Design 3/5 3.2.4 Existing Conditions 3/5 3.2.5 Impact Significance Assessment 3/6
3.3 Transboundary and Cumulative Impacts 3/8 3.4 Mitigation and Monitoring 3/9
4. Options Assessed
4.1 Introduction 4/2 4.2 Appraise Stage 4/3
4.2.1 Reservoir Resource 4/4 4.2.2 Bathymetry and Hazard Mapping 4/4 4.2.3 Extended Reach Wells 4/5 4.2.4 Location Selection and Environmental Issues 4/6 4.2.5 Well Drilling Options 4/6

AIOC Chirag Oil Project Environmental & Socio-Economic Impact Assessment
February 2010 ii Final
4.2.6 Platform Design Options 4/7 4.3 Select Stage 4/7
4.3.1 Select Stage Platform Design Options 4/7 4.3.2 Lessons Learnt and Previous ACG Options Appraisal 4/10
4.4 Define Stage 4/15
5. Project Description
5.1 Introduction 5/4 5.2 COP Schedule 5/6 5.3 Predrilling 5/7
5.3.1 MODU (Predrilled) Well Design 5/7 5.3.2 MODU Drilling Activities 5/8 5.3.3 MODU Logistics and Utilities 5/15 5.3.4 Predrilling – Emissions, Discharges and Waste 5/16
5.4 Onshore Construction and Commissioning of Offshore Facilities 5/18 5.4.1 Introduction 5/18 5.4.2 Upgrade Works and Yard Reactivation 5/18 5.4.3 Materials Transportation 5/19 5.4.4 Jacket and Piles 5/19 5.4.5 Drilling Modules 5/20 5.4.6 Topside 5/21 5.4.7 Testing and Pre-Commissioning 5/22 5.4.8 Topside Commissioning 5/22 5.4.9 Load Out and Sail-away 5/23 5.4.10 Onshore Construction and Commissioning – Emissions, Discharges and Waste 5/25
5.5 Infield Pipeline Installation, Tie-in and Commissioning 5/27 5.5.1 COP Pipeline Integrity and Design 5/28 5.5.2 Pipeline Installation 5/28 5.5.3 Pipeline Cleaning and Hydrotesting 5/29 5.5.4 Oil Pipeline Wye Installation 5/30 5.5.5 Pipeline Tie-in, Testing and Dewatering 5/31 5.5.6 Summary of Pipeline Installation Discharges 5/32 5.5.7 Pipeline Installation, Tie-in and Commissioning
– Emissions, Discharges and Waste 5/34 5.6 Platform Installation, Hook Up and Commissioning 5/35
5.6.1 Pre Installation Survey 5/35 5.6.2 Jacket 5/35 5.6.3 Topside 5/35 5.6.4 Topside Hook Up and Commissioning 5/36 5.6.5 DWG-PCWU Brownfield Works 5/37 5.6.6 Installation, Hook Up and Commissioning Vessels 5/37 5.6.7 Platform Installation, Hook Up and Commissioning
– Emissions, Discharges and Waste 5/38 5.7 Platform Drilling 5/40
5.7.1 Introduction 5/40 5.7.2 Platform Drilling Facilities 5/40 5.7.3 Predrill Well Tie-in and Re-entry 5/41 5.7.4 Platform Well Design 5/41 5.7.5 Cuttings Treatment and Disposal 5/43 5.7.6 Conductor Suspension 5/45 5.7.7 Well Completion Activities 5/45 5.7.8 Sand Control 5/46 5.7.9 Contingency Chemicals 5/46 5.7.10 Platform Drilling – Emissions, Discharges and Waste 5/46
5.8 Offshore Operations and Production 5/47 5.8.1 Overview 5/47 5.8.2 Separation System 5/47 5.8.3 Gas Processing and Export 5/48
AIOC Chirag Oil Project Environmental & Socio-Economic Impact Assessment
February 2010 iii Final
5.8.4 Produced Water 5/48 5.8.5 Water Injection 5/49 5.8.6 Platform Utilities 5/51 5.8.7 Pipeline Operations and Maintenance 5/58 5.8.8 Supply and Logistics 5/60 5.8.9 Offshore Operations and Production
– Emissions, Discharges and Waste 5/60 5.9 Terminal 5/63
5.9.1 Oil Processing 5/63 5.9.2 Gas Processing 5/63 5.9.3 Produced Water 5/63 5.9.4 Terminal Operations
– Emissions, Discharges and Waste 5/64 5.10 Decommissioning 5/65 5.11 Management of Change Process 5/65 5.12 Summary of Emissions and Waste 5/66
5.12.1 COP Emissions 5/66 5.12.2 COP Hazardous and Non Hazardous Waste 5/66
5.13 COP Employment 5/70
6. Environmental Description
6.1 Introduction 6/3 6.2 Data Sources 6/3 6.3 Physical Environment 6/7
6.3.1 Seismicity 6/7 6.3.2 Climate 6/7 6.3.3 Temperature 6/7 6.3.4 Precipitation 6/7 6.3.5 Wind 6/8
6.4 Terrestrial and Coastal Environment 6/10 6.4.1 Setting 6/10 6.4.2 Air Quality 6/12 6.4.3 Noise 6/16 6.4.4 Terrestrial Ecology 6/16 6.4.5 Coastal Ecology 6/18 6.4.6 Birds 6/18
6.5 Offshore Environment 6/23 6.5.1 Introduction 6/23 6.5.2 General Characteristics of ACG Contract Area 6/24 6.5.3 WC-PDQ Platform Location Characteristics 6/47 6.5.4 Observed Effect of West Azeri Platform Installation and
Operations 6/54 6.6 Benthic and Sedimentary Surveys 6/57
6.6.1 Biological Data 6/57 6.6.2 Sediment Composition and Chemistry 6/59 6.6.3 Conclusion 6/60
7. Socio-Economic Description
7.1 Introduction 7/2 7.2 Demographic Profile 7/2
7.2.1 Population 7/2 7.3 Education 7/3 7.4 Human Resource Development 7/5 7.5 Income 7/6 7.6 Community Programmes 7/6
7.6.1 Socio-Economic and Environmental Programmes 7/6 7.6.2 Local Content Development 7/7
7.7 Economic Development 7/7

AIOC Chirag Oil Project Environmental & Socio-Economic Impact Assessment
February 2010 iv Final
7.7.1 Overview 7/7 7.8 Employment 7/9
7.8.1 BP Projects Employment 7/10 7.8.2 Local Trading Centres 7/11
7.9 Construction Yards 7/12
8. Consultation and Disclosure
8.1 Introduction 8/2 8.2. COP Consultations and Disclosure Process 8/2
8.2.1 Overview 8/2 8.2.2 Scoping, Consultation and Disclosure 8/2
8.3. Draft Final ESIA Report Consultation 8/6 8.4 Post-ESIA Project Consultations 8/6 8.5 Consultation Under the Espoo Convention 8/6
9. Predrill Environmental Impact Assessment, Mitigation and Monitoring
9.1 Introduction 9/3 9.2 Scoping Assessment 9/3 9.3 Existing Controls, Monitoring and Reporting 9/5 9.4 Impacts to the Atmosphere 9/9
9.4.1 MODU Power Generation 9/9 9.4.2 MODU Well Test Flaring 9/11 9.4.3 Support Vessels 9/13
9.5 Impacts to the Marine Environment 9/14 9.5.1 Underwater Noise & Vibration 9/14 9.5.2 Drilling Discharges 9/17 9.5.3 Cement Discharges 9/23 9.5.4 Cooling Water Intake and Discharge 9/25 9.5.5 Other Discharges 9/27 9.5.6 Seabed Disturbance 9/29
9.6 Summary of COP Predrill Phase Residual Environmental Impacts 9/31
10. Construction, Installation, Hook-Up & Commissioning Impact Assessment
10.1 Introduction 10/3 10.2 Scoping Assessment 10/3 10.3 Existing Controls, Monitoring and Reporting 10/7 10.4 Impacts to the Atmosphere 10/12
10.4.1 Construction Yard Emission Sources 10/12 10.4.2 Onshore Platform Generator Commissioning 10/15 10.4.3 Jacket and Pipeline Installation Vessels 10/17
10.5 Impacts to the Terrestrial Environment Associated with Onshore Noise 10/19 10.5.1 Construction Yard Plant 10/19 10.5.2 Onshore Platform Generator Commissioning 10/22
10.6 Impacts to the Marine Environment 10/24 10.6.1 Construction Yard Cooling Water Discharge 10/24 10.6.2 Pipeline Cleaning and Hydrotest Discharge 10/26 10.6.3 Cement Discharges 10/31 10.6.4 Underwater Noise and Vibration 10/32 10.6.5 Seabed Disturbance 10/35 10.6.6 Other Discharges 10/37
10.7 Summary of COP Construction, Installation and HUC Residual Environmental Impacts 10/40

AIOC Chirag Oil Project Environmental & Socio-Economic Impact Assessment
February 2010 v Final
11. Operations Impact Assessment, Mitigation and Monitoring
11.1 Introduction 11/3 11.2 Scoping Assessment 11/3 11.3 Existing Controls, Monitoring and Reporting 11/6 11.4 Impacts to the Atmosphere 11/13
11.4.1 Offshore Operations 11/13 11.4.2 Support Vessels 11/18 11.4.3 Onshore Operations 11/20
11.5 Impacts to the Marine Environment 11/23 11.5.1 Underwater Noise and Vibration 11/23 11.5.2 Drilling Discharges 11/26 11.5.3 Cement Discharges 11/31 11.5.4 Produced Water Discharge 11/33 11.5.5 Water Intake/Entrainment and Cooling Water Discharge 11/38 11.5.6 Pigging Discharge 11/41 11.5.7 Other Discharges 11/43
11.6 Summary of COP Operations Phase Residual Environmental Impacts 11/46
12. Socio-Economic Impact Assessment, Mitigation and Monitoring
12.1 Introduction 12/2 12.2 Impact Assessment 12/2
12.2.1 Employment 12/2 12.2.2 End of Construction Phase Workforce Reduction 12/5 12.2.3 Training and Skills Development 12/5 12.2.4 Economic Activity 12/5 12.2.5 Community Disturbance 12/6
13. Cumulative and Transboundary Impacts and Accidental Events
13.1 Introduction 13/3 13.2 Cumulative and Transboundary Impacts 13/3 13.3 Marine Environment: Cumulative Impacts 13/5
13.3.1 Physical Presence 13/5 13.3.2 Drilling Discharges 13/6 13.3.3 Grey and Black Water Discharges 13/6 13.3.4 Cooling Water Discharges 13/6 13.3.5 Produced Water Discharges 13/7 13.3.6 Conclusion 13/7
13.4 Non-Greenhouse Gas Atmospheric Emissions: Cumulative Impacts 13/10 13.4.1 Onshore Non-Greenhouse Gas Atmospheric Emissions 13/11 13.4.2 Offshore Non Greenhouse Gas Atmospheric Emissions 13/12 13.4.3 Conclusion 13/14
13.5 Non-Greenhouse Gas Atmospheric Emissions: Transboundary Impacts 13/15 13.6 Greenhouse Gas Atmospheric Emissions: Cumulative and Transboundary
Impacts 13/15 13.6.1 Conclusion 13/17
13.7 Accidental Events 13/18 13.7.1 Overview 13/18 13.7.2 Previous Crude and Diesel Spill Modelling Revelant to COP 13/18 13.7.3 Impact of Oil Spills 13/34 13.7.4 Oil Spill Prevention and Response Planning 13/35 13.7.5 Reporting 13/39

AIOC Chirag Oil Project Environmental & Socio-Economic Impact Assessment
February 2010 vi Final
14. Environmental and Social Management
14.1 Introduction 14/2 14.2 Overview of AzSPU HSSE Management System 14/2
14.2.1 Documentation 14/3 14.3 Emphasis of AzSPU HSSE Management System during COP Phases 14/4
14.3.1 Design & Procurement 14/5 14.3.2 Pre-Drilling and Construction, Installation and HUC 14/6 14.3.3 Operations 14/8
14.4 Common Elements 14/9 14.4.1 Commitments Register 14/9 14.4.2 Integrated Environmental Monitoring Programme (IEMP) 14/10 14.4.3 Waste Management 14/11
15. Residual Impacts and Conclusion
15.1 Introduction 15/2 15.2 Design, Construction and Operation 15/2 15.3 Socio-Economic Impact 15/2 15.4 Environmental Impacts 15/3
15.4.1 Predrill 15/3 15.4.2 Construction, Hook-Up and Commissioning 15/4 15.4.3 Operations 15/6
15.5 Cumulative, Transboundary and Accidental Events 15/8 15.6 Environmental Management Plan 15/9 15.7 Conclusions 15/9
List of Figures
Figure 1.1 Location of Azeri Chirag Gunashli Contract Areas 1/2 Figure 1.2 ACG Offshore Developments (Including COP) 1/3 Figure 2.1 Azerbaijan Legal Hierarchy 2/2 Figure 3.1 The ESIA Process 3/2 Figure 4.1 BP Capital Value Process 4/3 Figure 4.2 Installation Risk Mapping Across the ACG Contract Area 4/5 Figure 4.3 Platform Option Locations and Drilling Radii from Each Location Option 4/6 Figure 4.4 Cumulative Reduction in CO2 Emissions for the All-Electric Drive Single Platform Concept versus GT Direct Drives for Export Gas
Compression 4/9 Figure 5.1 Overview of Chirag Oil Project 5/5 Figure 5.2 Estimated COP Production Profiles Across the PSA Period 5/6 Figure 5.3 Estimated COP Schedule to First Oil 5/6 Figure 5.4 Dada Gorgud Semi-Submersible Rig 5/7 Figure 5.5 Generic Predrill Well Design 5/8 Figure 5.6 Import Routes to Azerbaijan 5/19 Figure 5.7 Jacket Fabrication Process 5/20 Figure 5.8 Topside Construction Process 5/21 Figure 5.9 DWG-DUQ Jacket During Loadout 5/23 Figure 5.10 EA Platform Topside Onboard STB-01 Barge 5/24 Figure 5.11 Proposed COP Infield Pipelines 5/27 Figure 5.12 Oil Pipeline Wye Installation Methodology 5/31 Figure 5.13 Jacket Installation 5/35 Figure 5.14 Topsides “Float-Over” Installation Method 5/36 Figure 5.15 Cuttings Re-injection Process 5/43 Figure 5.16 WC-PDQ Process Schematic 5/47 Figure 5.17 Simplified Produced Water and Injection Water Flows 5/50 Figure 5.18 Open Drains System 5/55 Figure 5.19 Pigging Operations – Infield Produced Water Pipeline 5/58 Figure 5.20 Pigging Operations – Injection Water Pipeline 5/59

AIOC Chirag Oil Project Environmental & Socio-Economic Impact Assessment
February 2010 vii Final
Figure 5.21 Predicted GHG Emissions Associated with COP Offshore Operations and ACG FFD 5/61 Figure 5.22 Forecast EOP and ACG Phases 1-3 GHG Emissions Associated with Terminal Operations and COP Contribution 5/64 Figure 5.23 Estimated Number of jobs for Azerbaijani Citizens Over the COP 5/70 Figure 6.1 Key Onshore and Offshore Locations Associated with the COP 6/5 Figure 6.2 Annual Wind Rose for the Sangachal Area, 1999-2001 6/8 Figure 6.3 Wind Rose for Offshore Central Caspian, 2005 6/9 Figure 6.4 Wind Speeds for Offshore Central Caspian, 2005 6/9 Figure 6.5 Sangachal Terminal and Key Features in the Surrounding Area 6/11 Figure 6.6 Ambient Air Quality Monitoring Locations 2006 and 2007 6/13 Figure 6.7 Approximate Distribution of Plant Community Types (Habitats) Around Sangachal Terminal 6/16 Figure.6.8 Important Ornithological Sites 6/19 Figure 6.9 Bird Migration Routes 6/20 Figure 6.10 The ACG Contract Area in the Context of the Caspian 6/23 Figure 6.11 Seabed Bathymetry 6/24 Figure 6.12 Thirteen Year (1982-1994) Average Wind Fields for January and July 6/26 Figure 6.13 Sketch of Winter Seasonal Flows Across the Absheron Based Largely on Near Bottom Current Measurements Collected Between November 2007 and May 2008 6/28 Figure 6.14 Sea Surface Temperature 09:40 (GMT) 3rd February 1996 During a Strong Deep Water Current Event in the ACG Contract Area 6/29 Figure 6.15 NCEP Winds and Atmospheric Pressure During the Largest Storm in the CASMOS 2 Dataset 6/30 Figure 6.16 NCEP Wind and Pressure During a High Pressure Intrusion from the North West 6/31 Figure 6.17 Location of ACG 2006 Regional Seabed Sampling Stations 6/32 Figure 6.18 Water and Plankton Sampling Locations 6/37 Figure 6.19 Location of ACG Contract Area Plankton Sampling Transects 6/38 Figure 6.20 CTD Profiles from ACG, Pipeline and Inam Water Sampling Stations 6/39 Figure 6.21 Platform, Pipeline Corridor and Sangachal Bay Survey Locations 6/48 Figure 6.22 Sediment Silt-Clay Content (%) - Median and Range 6/49 Figure 6.23 Sediment Particle Diameter - Median and Range µm 6/50 Figure 6.24 Carbonate (%) – Median and Range 6/51 Figure 6.25 Median Depth, and Range, at Survey Locations Across ACG Contract Area 6/55 Figure 6.26 Layout of the West Azeri 2008 Survey Stations 6/57 Figure 6.27 2009 COP Benthic Survey Stations 6/57 Figure 7.1 BP Projects Construction Workforce, 2002 to 2007 7/10 Figure 8.1 COP ESIA Consultation and Disclosure Process 8/3 Figure 9.1 MODU Power Generation Predicted Long Term NO2 Concentrations 9/9 Figure 9.2 MODU Well Test Flaring Predicted Short Term NO2 Concentrations 9/12 Figure 9.3 Predicted Distances Within Which Fish and Seals React to Underwater Drilling and Vessel Noise 9/15 Figure 9.4 Barite Deposition Thickness Contour Plots (Discharge from 28”/26” Sections at 11m Depth - 20 Wells) 9/19 Figure 10.1 Maximum Short Term Ground Level Increase in NO2 Concentration (µg/m3) At Distance from Centre of Yard (High Wind Speed Conditions) 10/13 Figure 10.2 Maximum Short Term Ground Level NO2 Concentration (µg/m3) at Distance from Source (High Wind Speed Conditions) 10/16 Figure 10.3 Predicted Noise Levels from Plant/Machinery at the Construction Yard 10/20 Figure 10.4 Predicted Noise Level Associated with Onshore Platform Generator Commissioning 10/22 Figure 10.5 Predicted Cooling Water Plume Temperature Above Ambient at Distance from Discharge 10/24

AIOC Chirag Oil Project Environmental & Socio-Economic Impact Assessment
February 2010 viii Final
Figure 10.6 Plume Dimensions for Discharge of 1,200 m3 ‘Fresh’ Hydrotest Water Under Stagnant and Predominant Current Conditions 10/27 Figure 10.7 Plume Dimensions for Discharge of 7,000m3 Degraded Hydrotest Water 10/27 Figure 10.8 Relationship Between Produced Water Toxicity (LC50 expressed as % Dilution in Caspian Seawater) and Total Hydrocarbon Concentration 10/28 Figure 10.9 Predicted Distances Within Which Fish and Seals React to Underwater Piling and Vessel Noise 10/33 Figure 11.1 WC-PDQ Platform Predicted Long Term NO2 Concentrations Under Routine Conditions 11/14 Figure 11.2 WC-PDQ Platform Predicted Short Term NO2 Concentrations From Flaring - Restricted Gas Export at a) Regional Scale b) Local Scale 11/15 Figure 11.3 WC-PDQ Platform Predicted Short Term NO2 Concentrations From Flaring Due to Emergency Shutdown Flaring at a) Regional Scale b) Local Scale 11/16 Figure 11.4 Predicted Maximum 1 Hour Peak NO2 Concentrations Moving South West from the Terminal (Emergency Shutdown Flaring of All ACG Facilities) 11/21 Figure 11.5 Predicted Distances Within Which Seals and Fish React to Underwater Hammering, Drilling and Vessel Noise 11/24 Figure 11.6 Barite Deposition Thickness Contour Plots (Discharge from Caisson at 136m depth - 28 wells) 11/28 Figure 11.7 Produced Water Dispersion Plumes Under Stagnant and Dominant Current Conditions 11/35 Figure 11.8 Temperature Contour Plots for Summer and Winter (Stagnant and Predominant Current Conditions) 11/39 Figure 12.1 Estimates for the Number of Azerbaijani Citizens Likely to be Employed Over the Duration of the COP 12/3 Figure 12.2 Total Workforce Employed on Jacket and Topsides Construction for ACG Project Phases 1 (CA-PDQ & C&WP), 2 (EA &WA) and 3 (DWG-DUQ &PCWU) 12/4 Figure 13.1 Location of ACG and SD Offshore Facilities 13/4 Figure 13.2 WC-PDQ Discharge Locations 13/9 Figure 13.3 Horizontal Displacement of Produced Water Plume by Cooling Water in the Absence of a Thermocline Under Stagnant (Upper Graph) and Predominant Current (Lower Graph) Conditions 13/9 Figure 13.4 COP Non-GHG Emissions Per Project Phase 13/11 Figure 13.5 NO2 Long Term Concentrations (Normal Operations at All Platforms) 13/12 Figure 13.6 NO2 Short Term Concentrations (Normal Operations at All Platforms) 13/13 Figure 13.7 NO2 Short Term Concentrations (West Chirag Emergency Depressurisation, Other Platform Normal Operations) 13/14 Figure 13.8 COP Greenhouse Gas Emissions Per Phase 13/16 Figure 13.9 COP Operational GHG Emissions Relative to Forecast GHG Emissions from EOP, ACG 1, 2 & 3 and SD Projects (2012 –2024) 13/16 Figure 13.10 Volume of Spilled Chirag and DWG Crude Oils in 5m/s Wind at 6oC 13/21 Figure 13.11 Volume of Spilled Chirag and DWG Crude Oils in 10m/s Wind at 6oC 13/21 Figure 13.12 Volume of Spilled Chirag, DWG and COP Crude Oils in 5m/s Wind at 6oC 13/22 Figure 13.13 Volume of Spilled Chirag, DWG and COP Crude Oils in 10m/s Wind at 6oC 13/23 Figure 13.14 Drift of Spilled COP Oil from Blowout in 5m/s Wind from 100o 13/26 Figure 13.15 Drift of Spilled COP Oil from Blowout in 5m/s Wind from 105o 13/26 Figure 13.16 Drift of Spilled COP Oil from Blowout in 5m/s Wind from 115o 13/27 Figure 13.17 Drift of Spilled COP Oil from Blowout in Wind from 45o 13/28 Figure 13.18 Drift of Spilled COP Oil from Blowout in 5m/s Wind from 270o. 13/29

AIOC Chirag Oil Project Environmental & Socio-Economic Impact Assessment
February 2010 ix Final
Figure 13.19 Pipeline Rupture: Directions and Distance of Spilled Oil Drift and the Volume of Spilled Oil Coming Onshore (m3) 13/32 Figure 13.20 Drift of Spilled COP Oil from Separator Failure in 10m/s Wind from 110o 13/33 Figure 13.21 OSRP – Responsibility 13/39 Figure 14.1 AzSPU Integrated HSSE Management System Framework 14/2 Figure 14.2 Continuous Improvement Philosophy 14/3 Figure 14.3 Key Management Processes During COP Phases 14/5
List of Tables
Table 1.1 Structures and Content of the ESIA 1/7 Table 1.2 COP ESIA Team 1/7 Table 2.1 Summary of International Conventions 2/5 Table 2.2 Summary of Regional Conventions 2/6 Table 2.3 Key National Environmental and Social Laws 2/8 Table 2.4 Summary of Guidance on the EIA Process in Azerbaijan 2/11 Table 3.1 Summary of Lessons Learnt in Relation to Previous ACG
Project Phases and Related ESIA 3/4 Table 3.2 Event Magnitude Rankings 3/6 Table 3.3 Biological/Ecological and Human Receptor Sensitivity Rankings 3/7 Table 3.4 Impact Significance 3/8 Table 4.1 Oil Recovery for West Chirag and North/South Azeri Options 4/4 Table 4.2 Options Considered to Reduce Chemical Use During Pipeline Commissioning 4/14 Table 5.1 Generic COP Predrill Well Design 5/7 Table 5.2 Estimated Use of Drilling Chemicals Per Hole – 36” Conductor
Section 5/10 Table 5.3 Estimated Use of WBM (Ultradril) Per Hole – 28” and 26” Hole Sections 5/10 Table 5.4 Estimated Use of SBM/LTMOBM Per Hole – 16” and 12 ¼” Holes 5/11 Table 5.5 Estimated MODU Well Cuttings and Mud Volumes per Hole Section 5/12 Table 5.6 Estimated Usage of Well Cement Chemicals 5/12 Table 5.7 Estimated Usage of Drilling Contingency Chemicals 5/13 Table 5.8 Estimated Well Clean Up Chemicals 5/14 Table 5.9 Summary of the MODU Utilities and Support Activities 5/15 Table 5.10 Estimated GHG and non GHG Emissions Associated with Routine and Non Routine COP Predrill Activities 5/16 Table 5.11 Estimated Drilling Fluids and Cement Discharges to Sea Associated with COP Predrill Activities 5/16 Table 5.12 Estimated Hazardous and Non Hazardous Waste Associated with Predrilling Activities 5/17 Table 5.13 Estimated GHG and Non GHG Emissions Associated with Routine and Non Routine COP Onshore Construction and Commissioning
Activities 5/25 Table 5.14 Estimated Hazardous and Non Hazardous Waste Associated with Onshore Construction and Commissioning Activities 5/26 Table 5.15 COP Infield Pipelines 5/27 Table 5.16 Pipelay Support Vessels 5/29 Table 5.17 Pipelay Barge and Support Vessel Utilities 5/29 Table 5.18 Estimated Pipeline Gauging, Hydrotesting, Tie-in, Leak Tests and Dewatering Treated Seawater Discharges 5/33 Table 5.19 Estimated GHG and non GHG Emissions Associated with Routine and Non Routine Pipeline Installation, Tie-in and Commissioning Activities 5/34 Table 5.20 Installation, Hook Up and Commissioning Vessels (Including DWG-PCWU Platform Brownfield Works) 5/37 Table 5.21 Installation, Hook Up and Commissioning Vessel Utilities 5/38 Table 5.22 Predicted GHG and Non GHG Emissions Associated with Routine Installation, Hook Up and Commissioning Activities 5/38

AIOC Chirag Oil Project Environmental & Socio-Economic Impact Assessment
February 2010 x Final
Table 5.23 Estimated Hazardous and Non Hazardous Waste Associated with Pipeline and Platform Installation, Hook Up and Commissioning Activities 5/39 Table 5.24 Estimated Suspension Fluid Chemicals and Viscous Sweeps 5/41 Table 5.25 Generic COP Well Design 5/42 Table 5.26 Estimated Platform Well Cuttings and Mud Volumes per Hole Section 5/42 Table 5.27 Anticipated Production Chemicals and Requirements 5/57 Table 5.28 DWG-PCWU Injection Water Chemicals 5/59 Table 5.29 Summary of Produced Water and Injection Water Pipeline Pigging Volumes and Locations of Discharge 5/60 Table 5.30 Predicted GHG and non GHG Emissions Associated with Routine and Non Routine COP Offshore Operations and Production Activities 5/60 Table 5.31 Estimated Planned Discharges to Sea Associated with Routine and Non Routine Platform Drilling Activities 5/61 Table 5.32 Estimated Hazardous and Non Hazardous Waste Associated with Offshore Drilling and Processing Activities 5/62 Table 5.33 Predicted GHG and non GHG Emissions Associated with Terminal Operations (COP Contribution) 5/64 Table 5.34 Estimated GHG and non GHG Emissions Associated with the COP 5/66 Table 5.35 Estimated Hazardous and Non Hazardous Waste Associated with the COP 5/66 Table 5.36 Waste Subcategories 5/67 Table 5.37 Planned Destination of COP Waste Streams 5/69 Table 6.1 Onshore, Nearshore and Offshore Surveys, 1992-2007 6/6 Table 6.2 Absheron Peninsula 2000 Rainfall Data (mm) 6/8 Table 6.3 Average NOX and SO2 Air Quality Concentrations (µg/m3) (2006) 6/14 Table 6.4 Average Benzene and VOC Concentrations (µg/m3) (2006) 6/14 Table 6.5 Average PM10 Concentrations (µg/m3) (2006) 6/15 Table 6.6 Average NOx and SO2 Air Quality Concentration (µg/m3) (2007) 6/15 Table 6.7 Noise Survey results for Residential Communities in the Vicinity of Sangachal Terminal (2007 and 2008) 6/16 Table.6.8 Overwintering Birds of Importance Recorded in 2002-2206 Surveys 6/20 Table 6.9 Percentage of Birds Utilising Spring and Autumn Migration Routes 6/21 Table 6.10 Migration Birds of Importance Recorded in 2002-2006 Surveys 6/21 Table 6.11 Azeri Redbook/IUCN Red List Bird Species Observed in the Vicinity of theTerminal 6/22
Table 6.12 Summary of 2006 Survey Sediment Metals Concentrations Across 12 Monitoring Stations (µg/g) 6/33 Table 6.13 Summary of 2004 Survey Sediment Metals Concentrations Across 6 Monitoring Stations (µg/g) 6/33 Table 6.14 Comparison of Sediment Chemistry Concentrations Across Monitoring Stations Surveyed (µg/g),1996-2006 6/33 Table 6.15 Number of Taxa in Each Major Taxonomic Group, 1996-2006 6/34 Table 6.16 Comparison of Species Number and Abundance, 1995-2006 6/34 Table 6.17 Number of Phytoplankton Taxa per Major Taxonomic Group 6/40 Table 6.18 Seasonal Fish Presence in the Contract Area 6/43 Table 6.19 Fish Species recorded in the Contract Area, 2008 6/43 Table 6.20 Seabird Species Found in the ACG Contract Area 6/46 Table 6.21 Sediment Hydrocarbons (Median values for Each location are Given) 6/51 Table 6.22 Median Trace Metal Concentrations in Sediments (µg/g) at each Survey Location 6/52 Table 6.23 Number of Species Representing Each Major Taxonomic Group 6/54 Table 6.24 Comparison of Sediment Properties, West Azeri, 2002-2007 6/55 Table 6.25 Comparison of Overall Taxonomic Richness for Major Groups Between 2003 and 2009 in the Vicinity of the COP Location 6/58

AIOC Chirag Oil Project Environmental & Socio-Economic Impact Assessment
February 2010 xi Final
Table 6.26 Station-by-Station and Overall Comparison of Species Richness and Abundance between 2003 and 2009 6/59 Table 6.27 Comparison of Sediment Structure between 2003 and 2009 6/60 Table 6.28 Comparison of Sediment Heavy Metal Concentrations between 2003 and 2009Surveys 6/60 Table 6.29 Comparison of Sediment Heavy Metal and Hydrocarbon Concentrations between 2003 and 2009 Surveys 6/60 Table 7.1 National Population, 1995 - 2008 7/2 Table 7.2 Age Profile, Urban and Rural, 2008 7/3 Table 7.3 Key Education Indicators, 1995 to 2008 7/4 Table 7.4 Income By Urban and Rural Areas, 2005 to 2006 (AZN / Month) 7/6 Table 7.5 Wealth Quintiles, Urban and Rural, 2006 7/6 Table 7.6 BP / AIOC Social Spend, 2002 to 2008 (US$M) 7/7 Table 7.7 Local Content Spend, 2006 to 2008 (US$M) 7/7 Table 7.8 Macroeconomic Data 7/8 Table 7.9 Employment and unemployment in Baku and Garadagh District 7/9 Table 7.10 Employment by Sector, 2008 7/10 Table 8.1 Key Issues Raised During the COP ESIA Consultation Process 8/5 Table 9.1 Structure of COP Impact Assessment 9/3 Table 9.2 “Scoped Out” COP Predrill Routine and Non-routine Activities 9/4 Table 9.3 “Assessed” COP Predrill Routine and Non-routine Activities 9/5 Table 9.4 COP Predrill Existing Controls, Monitoring and Reporting 9/6 Table 9.5 Event Magnitude 9/10 Table 9.6 Human Receptor Sensitivity 9/10 Table 9.7 Biological / Ecological Receptor Sensitivity 9/11 Table 9.8 Impact Significance 9/11 Table 9.9 Event Magnitude 9/12 Table 9.10 Impact Significance 9/13 Table 9.11 Event Magnitude 9/13 Table 9.12 Impact Significance 9/14 Table 9.13 Event Magnitude 9/15 Table 9.14 Receptor Sensitivity (Seals and Fish) 9/16 Table 9.15 Impact Significance 9/16 Table 9.16 Summary of Maximum Extent From the Point of Discharge and Area Covered by Sediment Greater than 1mm Thick for the 36” Section
(Seabed Discharge) and the 28”/26” Sections (11 m Depth Discharge) 9/18 Table 9.17 Seawater Sweeps and Water Based Mud Toxicity Tests (2007) 9/20 Table 9.18 Event Magnitude 9/20 Table 9.19 Receptor Sensitivity (Seals and Fish) 9/21 Table 9.20 Receptor Sensitivity (Zooplankton) 9/22 Table 9.21 Receptor Sensitivity (Phytoplankton) 9/22 Table 9.22 Receptor Sensitivity (Benthic Invertebrates) 9/23 Table 9.23 Impact Significance 9/23 Table 9.24 Event Magnitude 9/24 Table 9.25 Receptor Sensitivity 9/24 Table 9.26 Impact Significance 9/24 Table 9.27 Event Magnitude 9/25 Table 9.28 Receptor Sensitivity (All Receptors) 9/26 Table 9.29 Impact Significance 9/26 Table 9.30 Event Magnitude 9/28 Table 9.31 Receptor Sensitivity (All Receptors) 9/28 Table 9.32 Impact Significance 9/29 Table 9.33 Event Magnitude 9/29 Table 9.34 Receptor Sensitivity (Benthic Invertebrates) 9/30 Table 9.35 Impact Significance 9/30 Table 9.36 Summary of Predrill Residual Environmental Impacts 9/31 Table 10.1 “Scoped Out” COP Construction, Hook Up and Commissioning Routine and Non-routine Activities 10/4

AIOC Chirag Oil Project Environmental & Socio-Economic Impact Assessment
February 2010 xii Final
Table 10.2 “Assessed” COP Construction, Installation, Hook Up and Commissioning Routine and Non-routine Activities & Interactions 10/7 Table 10.3 COP Construction, Installation and HUC Existing Controls, Monitoring and Reporting 10/8 Table 10.4 Event Magnitude 10/13 Table 10.5 Human Receptor Sensitivity 10/14 Table 10.6 Biological/Ecological Receptor Sensitivity 10/14 Table 10.7 Impact Significance 10/15 Table 10.8 Maximum Short Term NO2 Concentrations Under High, Low and Typical Wind Conditions (Platform Generator Emissions) 10/15 Table 10.9 Event Magnitude 10/16 Table 10.10 Impact Significance 10/17 Table 10.11 Event Magnitude 10/18 Table 10.12 Human Receptor Sensitivity 10/18 Table 10.13 Biological/Ecological Receptor Sensitivity 10/18 Table 10.14 Impact Significance 10/19 Table 10.15 Event Magnitude 10/20 Table 10.16 Human Receptor Sensitivity 10/21 Table 10.17 Biological/Ecological Receptor Sensitivity 10/21 Table 10.18 Impact Significance 10/21 Table 10.19 Event Magnitude 10/23 Table 10.20 Impact Significance 10/23 Table 10.21 Event Magnitude 10/25 Table 10.22 Receptor Sensitivity 10/25 Table 10.23 Impact Significance 10/26 Table 10.24 Event Magnitude 10/29 Table 10.25 Receptor Sensitivity 10/29 Table 10.26 Impact Significance 10/30 Table 10.27 Event Magnitude 10/31 Table 10.28 Receptor Sensitivity 10/31 Table 10.29 Impact Significance 10/32 Table 10.30 Event Magnitude (Piling) 10/33 Table 10.31 Event Magnitude (Vessels) 10/34 Table 10.32 Receptor Sensitivity 10/34 Table 10.33 Impact Significance 10/35 Table 10.34 Event Magnitude 10/35 Table 10.35 Receptor Sensitivity 10/36 Table 10.36 Impact Significance 10/36 Table 10.37 Event Magnitude 10/38 Table 10.38 Receptor Sensitivity (All Receptors) 10/39 Table 10.39 Impact Significance 10/39 Table 10.40 Summary of Construction, Installation and HUC Residual Environmental Impacts 10/40 Table 11.1 “Scoped Out” COP Operations Routine and Non-routine Activities 11/4 Table 11.2 “Assessed” COP Routine and Non-routine Operations Activities 11/6 Table 11.3 COP Operations Existing Controls, Monitoring and Reporting 11/7 Table 11.4 Event Magnitude (Routine Operations) 11/17 Table 11.5 Event Magnitude (Non-Routine Operations: Flaring) 11/17 Table 11.6 Human Receptor Sensitivity 11/18 Table 11.7 Biological/Ecological Receptor Sensitivity 11/18 Table 11.8 Impact Significance 11/18 Table 11.9 Event Magnitude 11/19 Table 11.10 Impact Significance 11/19 Table 11.11 Event Magnitude (Routine Operations) 11/21 Table 11.12 Event Magnitude (Non-Routine Operations: Flaring) 11/22 Table 11.13 Human Receptor Sensitivity 11/22 Table 11.14 Biological/Ecological Receptor Sensitivity 11/22 Table 11.15 Impact Significance 11/23 Table 11.16 Event Magnitude (Hammering) 11/25 Table 11.17 Event Magnitude (Drilling) 11/25

AIOC Chirag Oil Project Environmental & Socio-Economic Impact Assessment
February 2010 xiii Final
Table 11.18 Event Magnitude (Vessels) 11/25 Table 11.19 Receptor Sensitivity 11/26 Table 11.20 Impact Significance 11/26 Table 11.21 Predicted Distribution of Discharged Drill Cuttings from MODU Drilling (136m Depth Discharge) 11/27 Table 11.22 Event Magnitude 11/29 Table 11.23 Receptor Sensitivity 11/30 Table 11.24 Receptor Sensitivity 11/30 Table 11.25 Receptor Sensitivity 11/31 Table 11.26 Impact Significance 11/31 Table 11.27 Event Magnitude 11/32 Table 11.28 Receptor Sensitivity 11/32 Table 11.29 Impact Significance 11/32 Table 11.30 Event Magnitude 11/34 Table 11.31 Results of Terminal Produced water and Seawater Analysis 11/35 Table 11.32 Receptor Sensitivity 11/37 Table 11.33 Impact Significance 11/37 Table 11.34 Event Magnitude 11/40 Table 11.35 Receptor Sensitivity 11/40 Table 11.36 Impact Significance 11/41 Table 11.37 Event Magnitude 11/42 Table 11.38 Receptor Sensitivity 11/42 Table 11.39 Impact Significance 11/42 Table 11.40 Event Magnitude 11/44 Table 11.41 Receptor Sensitivity (All Receptors) 11/45 Table 11.42 Impact Significance 11/45 Table 11.43 Summary of Operations Residual Environmental Impacts 11/46 Table 12.1 Socio-Economic Events Leading to Impacts 12/2 Table 13.1 Areas Occupied by ACG Offshore Facilities (Platforms and Pipelines) 13/5 Table 13.2 Estimated Pour Points of Crude Oil Residues 13/20 Table 13.3 Summary of Oil Spill Scenarios Modelled for Previous ACG Projects 13/24 Table 13.4 Estimated Blow-Out Frequencies for a Range of Drilling Activities 13/24 Table 13.5 Inputs for COP Blow Out Scenario 13/25 Table 13.6 COP Blow Out: Locations and Amounts of Spilled Oil Coming Ashore Azerbaijan 13/27 Table 13.7 Blowout: Locations and Amounts of Oil Coming Ashore in Iran 13/28 Table 13.8 Blowout: Locations and Amounts of Oil Coming Ashore in Turkmenistan 13/29 Table 13.9 Pipeline Rupture Scenario Inputs 13/31 Table 13.10 Volumes of Oil Remaining on the Sea Surface after a 1,000 m3 Oil Spill 13/31 Table 13.11 Pipeline Rupture: Locations and Amounts of Spilled Oil Coming Ashore 13/31 Table 13.12 Inputs for the COP Separator Failure Scenario 13/32 Table 13.13 Separator Failure: Locations and Amounts of Spilled Oil Coming Ashore 13/33 Table 14.1 AzSPU HSSE Management System Tier Structure 14/4 Table 15.1 Summary of Predrill Residual Environmental Impacts 15/3 Table 15.2 Summary of Construction, Installation Hook-Up and Commissioning
Residual Environmental Impacts 15/5 Table 15.3 Summary of Operations Residual Environmental Impacts 15/7

AIOC Chirag Oil Project Environmental & Socio-Economic Impact Assessment
February 2010 xiv Final
Appendices
Appendix 2A: Appendix IX of PSA Appendix 5A: Emissions Estimate Assumptions Appendix 5B: Approved CRI Waste Streams Appendix 5C: Composition and Function of COP Chemicals with potential For Discharge Appendix 5D: Determination of Chemical Hazard Categories Appendix 5E: Seismic Design of the WC-PDQ Platform Appendix 5F: Estimate of Sludge Generated from the WC-PDQ Platform Appendix 6A: Fauna and Flora Surveys Appendix 6B: Seal and Fish Reviews Appendix 8A: MENR Scoping Consultation Meeting Minutes Appendix 8B: Public Consultation Presentations, Meetings and Minutes Appendix 8C: Draft COP ESIA Public Consultation December 2009 Appendix 9A: Predrill Activities and Events Appendix 10A: Construction, Installation and HUC Activities and Events Appendix 10B: Onshore Noise Screening Assessment Appendix 10C: Onshore Air Quality Screening Assessment Appendix 10D: Pipeline Hydrotest Discharge Modelling Appendix 11A: Operations Activities and Events Appendix 11B: Offshore Air Dispersion Modelling Appendix 11C: Underwater Noise Modelling Appendix 11D: Drilling Discharge Modelling Appendix 11E: Produced Water Modelling Appendix 11F: Cooling Water Dispersion Modelling Appendix 13A: Routine and Non Routine Discharge Parameters Appendix 13B: OSIS Study for COP

AIOC Chirag Oil Project Environmental & Socio-Economic Impact Assessment Units and Abbreviations
February 2010 i Final
Units and Abbreviations
Units
B Billion barg 1 bar (gauge) = 14.5 psi bbl Barrel (6.2898 barrels = 1 m3)bpd Barrels per day Bq/kg Bequerels per kilogram (measure of radioactivity) Bstb Billion standard barrels cm Centimetre cm3 Cubic centimetre cm/year Centimetres per year dB Decibel dB (A) A weighted unit of sound intensity weighted in favour of frequencies audible
to the human ear dBht(species) A metric for estimating the behavioural effects of noise on marine species dB LAEQ Sound pressure level dB re. 1 µPa Decibels relative to one micropascal g Grams ha Hectare hr Hour Hs Significant wave height Hz Hertz (Measure of frequency) K One thousand (e.g. 500K = 500,000) keV Kiloelectron volt (one thousand electron volts) kg Kilograms km Kilometre km² Square kilometre kNm3 Thousand cubic metre at normal conditions kW Kilowatts LC50 Lethal Concentration 50. The concentration of a chemical which kills 50% of
a sample population. l Litres l/hr Litres per hour m Metres M Million m TVD BRT Depth in Metres (True Vertical Depth) (Below the Rotary Table) m/hour Metres per hour m/s Metres per second m² Square metres m³ Cubic metres m3/day Cubic metres per day m3/hour Cubic metres per hour mbbl Thousand barrels mbgl Meters below ground level mbpd Thousand barrels per day mbwd Thousand barrels of water per day mbwpd Thousand barrels of water per day Mbopd Thousand barrels of oil per day µ Microns µm Micrometers
g Micrograms µg/g Micrograms per gram
g/m3 Micrograms per cubic meter µg/l Micrograms per litre µPa Micro Pascal mg Milligrams mg/l Milligrams per litre mg/m3 Milligrams per cubic metre

AIOC Chirag Oil Project Environmental & Socio-Economic Impact Assessment Units and Abbreviations
February 2010 ii Final
mg/Nm3 Milligrams per cubic meter (at normal conditions) ml Millilitres mm Millimetres mm/day Millimetres per day mm/hr Millimetres per hour mm/month Millimetres per month MMscf Million standard cubic feet MMscfd Million standard cubic feet per day MMBtu Million British thermal units MMscf Million standard cubic feet MMscfd Million standard cubic feet per day MMstb Million standard barrels m/s Metres per second Mstb/day Thousand barrels per day Mstbd Thousand barrels per day MW Megawatt pH -log 10 [H
+] (Measure of acidity or alkalinity) PM10 Particulate matter measuring 10µm in diameter ppb Parts per billion ppbv Parts per billion by volume ppm Parts per million ppmv Parts per million by volume PSI Pounds per square inch lb/MMscf Pounds of water per million standard cubic feet 1Q Quarter one (of year) s Second scf Standard cubic feet scf/bbl Standard Cubic Feet per Barrel Sm³ Standard cubic metres Sm3/hr Standard cubic metres per hour ktonne Thousand tonnes t Tonnes t/day Metric tonnes per day US$ US dollars US$M US dollars (Millions) yr Year “ Inches % Percent %v Percentage by volume %w Percentage by weight %ile Percentile ˚C Degrees centigrade ~ Approximately > Greater than +/- Plus/minus < Less than

AIOC Chirag Oil Project Environmental & Socio-Economic Impact Assessment Units and Abbreviations
February 2010 iii Final
Chemicals Elements and Compounds
241Am Americium As Arsenic Ba Barium BCM Bromochloromethane BTEX Benzene, toluene, ethylbenzene, xylene Cd Cadmium CFC Chlorofluorocarbon CH4 Methane CO Carbon Monoxide CO2 Carbon Dioxide CO2 Eq Carbon dioxide equivalent Cr Chromium 137Cs Caesium Cu Copper Fe Iron H2S Hydrogen Sulphide HCFC Hydrochloroflurocarbon HFCs Hydrofluorocarbons Hg Mercury HNO3 Nitric Acid KCl Potassium Chloride KOH Potassium Hydroxide MEG Mono Ethylene Glycol N2 Nitrogen N2O Nitrous Oxide NO Nitrogen Oxide NO2 Nitrogen Dioxide NOx Nitrogen Oxides NPD Naphthalenes, phenanthrenes and dibenzothiophenes PAH Polycyclic aromatic hydrocarbons Pb Lead 210Pb Radioactive form of lead PCB Polychlorinated biphenyls PFCs Perfluorocarbons PHB Pre Hydrated Bentonite Ra Radium SOx Sulphur Oxides SO2 Sulphur Dioxide TEG Tri-ethylene Glycol THPS Tetrakyshydroxymethyl phosphonium sulphate Zn Zinc
Abbreviations
ACG Azeri - Chirag - Gunashli ADMS3 Atmospheric Dispersion Modelling System Version 3 ADR European Agreement concerning International Carriage of Dangerous Goods
by RoadAERMOD A Computer programme that models air dispersion AFFF Aqueous Film Forming Foam AFS Anti Fouling Systems AIOC Azerbaijan International Operating Company AMEA Academy of Sciences of Azerbaijan ANAS Azerbaijan National Academy of Sciences API American Petroleum Institute AQS Air Quality Standard ARB Azerbaijan Red Data Book ASA Applied Science Associates

AIOC Chirag Oil Project Environmental & Socio-Economic Impact Assessment Units and Abbreviations
February 2010 iv Final
ASY Azerbaijan Statistical Yearbook ATA Amec-Tekfen-Azfen AZN Azerbaijan Manat AzSPU Azeri Strategic Performance Unit BAT Best Available Technology BDJF Baku Deep Water Jacket Factory BOD Biological Oxygen Demand BOP Blow Out Preventer BP British Petroleum BPEO Best Practicable Environmental Option BS British Standard BTC Baku-Tbilisi-Ceyhan BU Business Unit C&WP / CWP
Compression and Water Injection Platform
c. Approximately ca. Circa (English word used with dates meaning about or approximately) CA Central Azeri CAPEX Capital expenditure CBD Convention of Biological Diversity CCGT Combined Cycle Gas Turbine CD Compact Disk CDWG Chirag/Deep Water Gunashli CERC Cambridge Environmental Research Consultants CHARM Chemical Hazard Assessment and Risk Management CHP Combined Heat and Power CIA Central Intelligence Agency CISS Caspian International Seal Survey CITES Convention on the International Trade of Endangered Species CMC Contracts Management Committee COD Chemical Oxygen Demand COE Council of Europe COP Chirag Oil Project CRI Cuttings Reinjection CSC Caspian Shipyard Company CTD Conductivity - Temperature - Depth CVP Capital Value Process CWAA Central Waste Accumulation Area DBA Derrick Barge Azerbaijan DC/ AC Direct Current/ Alternating Current DES Drilling Equipment Set DHFC Down Hole Flow Control DLE Dry Low Emission DLN Dry Low NOx DPCU Dew Point Control Unit DPS Diverse Path Shutdown System DQ Drilling and Quarters Platform DRA Drag Reducing Agent DSM Drilling Support Module DST Drill Stem Test DSV Dive Support Vessel DTM Digital Terrain Model DUQ Drilling, Utilities and Quarters DWG Deep Water Gunashli DWG-PCWU Deep Water Gunashli Production, Compression, Water Injection & Utilities DWG-PDQ Deep Water Gunashli Production, Drilling & Quarters E East E&P Forum Exploration and Production Forum EA East Azeri EC Effective Concentration

AIOC Chirag Oil Project Environmental & Socio-Economic Impact Assessment Units and Abbreviations
February 2010 v Final
EC50 The statistical estimate of the toxicant concentration that has an adverse effect on 50% of the test organisms after a specific exposure time.
EGC Export Gas Compressors EIA Environmental Impact Assessment EIMP Environmental Impact Management Process EMS Environmental Management System EMTAG Environmental Monitoring Technical Advisory Group ENP European Neighbourhood Policy ENVIID Environmental Issues Identification EOP Early Oil Project EPR Environmental Performance Requirements EQS Environmental Quality Standard ERD Extended Reach ES Environmental Statement ESC Environmental Sub-Committee ESIA Environmental and Socio-Economic Impact Assessment ESD Emergency Shut Down ESMS Environmental and Social Management System ESS Expandable Sand Screen EU European Union FAO Food and Agriculture Organisation of the United Nations FDI Foreign Direct Investment FEED Front End Engineering Design FFD Full Field Development FGC Flash Gas Compressors FOC Foreign Oil Company GDP Gross Domestic Product GDP Group Defined Practice GHG Greenhouse Gases GMT Greenwich Mean Time GWP Global Warming Potential HOCNS Harmonised Offshore Chemical Notification HP High Pressure HPU Hydraulic pumping unit HRSG Heat Recovery Stream Generators HSE Health, Safety & Environment HSSE Health, Safety, Security and Environment HVAC Heating, Ventilation and Air-Conditioning HUC Hook-Up and Commissioning IADC International Association of Drilling Contractors IAGC International Association of Geophysical Contractors IBC Intermediate Bulk Container (container for hazardous materials) IC Internal Combustion IDP Internally Displaced Persons IEEM Institute for Ecology and Environmental Management IEMP Integrated Environmental Monitoring Programme IFC International Finance Corporation IMO International Maritime Organisation ISO International Organisation for Standardisation ISPM International Standards of Phytosanitary Measures ITD Indirect Thermal Desorption ITT Invitation to Tender IUCN International Union for the Conservation of Nature KO Knock-out KPI Key Performance Indicator KWelec Kilowatts of Electricity Laeq Equivalent average sound level LAO Linear alpha olefin LC50 Lethal Concentration 50% LCM Lost Circulation Mud

AIOC Chirag Oil Project Environmental & Socio-Economic Impact Assessment Units and Abbreviations
February 2010 vi Final
LCV Level Control Valve Leq (LAeq) equivalent continuous noise level LMO Living Modified Organisms LP Low Pressure LQ Living Quarters LTMOBM Low Toxicity Mineral Oil Based Mud MARPOL International Convention for the Pollution of Prevention by Ships, 1973, as
modified by the Protocol of 1978 MED Ministry of Economic Development MEL Maximum Exposure Level MENR Ministry of Ecology and Natural Resources MEPC Marine Environmental Protection Committee MES Ministry of Emergency Situations MODU Mobile Offshore Drilling Unit MOL Main Oil Line MPC Maximum Permissible Concentration MPE Maximum Permissible Emissions MPN Most Probable Number MRS Mud Recovery System MSD Marine Sanitation Device MSDS Material Safety Data Sheet MSL Mean Sea Level MTAG Manufacturing Advisory Group MW Megawatt MWelec. Megawatts of electrical energy MWheating Megawatts of heating energy MWmech Megawatts of mechanical energy NA Not Applicable N North NBSAP National Biodiversity Strategy and Action Plan NDT Non Destructive Testing NE North East NER Northern Export Route NETCEN National Environmental Technology Centre NGO Non Governmental Organisation NMVOC Non-methane Volatile Organic Compounds Non-GHG Non Greenhouse Gases NORM Naturally Occurring Radioactive Material NR Non Routine NRC National Research Council NREP Northern Route of Export Pipeline NNE North northeast NW Northwest NWBM Non Water Based Mud OBM Oil Based Mud OCNS Offshore Chemical Notification Scheme ODS Oxygen Depleting Substances OECD Organisation for Economic Co-operation and Development OGP International Association of Oil and Gas Producers OHGP Open Hole Gravel Packs OOIP Original Oil in Place OPEX Operating expenditure OSCE Organisation for Security and Co-operation in Europe OSCP Oil Spill Contingency Plan OSIS Oil Spill Information System OSPAR Oslo and Paris Convention for the Protection of the Marine Environment of
the North East Atlantic PCA Partnership and Cooperation Agreement PCDP Public Consultation and Disclosure Plan PCWU Production, Compression, Water Injection and Utilities

AIOC Chirag Oil Project Environmental & Socio-Economic Impact Assessment Units and Abbreviations
February 2010 vii Final
PDQ Production, Drilling and Quarters PDUQ Production, Drilling, Utilities and Quarters platform PGP Power Generation Package PGU Power Generation Unit PIMS Pipeline Integrity Management System PLONOR Presenting Little Or No Risk to the Environment PM Particulate Matter POB Persons on Board PPAH Pollution Prevention and Abatement Handbook PPE Personal Protective Equipment PR Performance Requirements PSA Production Sharing Agreement PSS Process Shutdown System PW Produced Water PWD Produced Water Disposal PWT Produced Water Treatment QA Quality Assurance R Routine RAM Reliability, Availability and Maintainability RMG Research and Monitoring Group RO Reverse Osmosis ROP Rate of penetration ROV Remotely operated vehicle ROW Right of Way RTL Reservoir Technical Limit S South SBM Synthetic Based Mud SCP South Caucasus Pipeline SCS Solids Circulation System SD Shah Deniz SDII Shah Deniz Phase 2 SE Southeast SEE State Ecological Expertise SOCAR State Oil Company of the Azerbaijan Republic SOFAZ State Oil Fund of Azerbaijan SPS Shelfprojectsroi SSC State Statistical Committee SSI Subsea Injection SST Sea Surface Temperature STB-01 Name of a transportation and installation barge SW Southwest THC Total Hydrocarbon Content TOC Total Organic Carbon TPAO Turkish Petroleum Corporation TSS Total Suspended Solids TVD BRT True Vertical Depth Below Rotary Table UCM Unresolved complex mixture UK United Kingdom UKOOA United Kingdom Offshore Operators Association UN United Nations UNOCAL Union Oil Company of California UNDP United Nations Development Programme UNECE United Nations Economic Commission for Europe UNEP United Nations Environmental Programme UNESCO United Nations Educational Scientific and Cultural Organisation UNFCCC United Nations Framework Convention on Climate Change UNFPA United Nations Food Programme UNIDO United Nations Industrial Development Organization URS URS Corporation Ltd USCG United States Coast Guard

AIOC Chirag Oil Project Environmental & Socio-Economic Impact Assessment Units and Abbreviations
February 2010 viii Final
US EPA United States Environmental Protection Agency VET Vocal, Educational and Training VIEC Vessel Internal Electrostatic Coalescers VOC Volatile Organic Compound W West WA West Azeri WB World Bank WBM Water Based Mud WC West Chirag WC-PDQ West Chirag Production, Drilling and Quarters WER Western Export Route WHO World Health Organisation WI Water Injection WIO Water In Oil WREP Western Route Export Pipeline

AIOC Chirag Oil Project Environmental & Socio-Economic Impact Assessment
Glossary
February 2010 ix Final
Glossary
Aarhus Convention An international legal agreement which promotes access to information, public participation in decision making and access to justice in environmental matters.
Abandonment Final plugging of wells and/or permanent dismantling of a production platform or other installation.
Alien Species / Introduced Species A species not native to the environment it inhabits.
Ambient Levels Sharing the same physical and/or chemical properties as the immediate surroundings.
Amine Sweetening Group of processes that use aqueous solutions of various alkanolamines (commonly referred to simply as amines) to remove hydrogen sulphide (H2S) and carbon dioxide (CO2) from gases.
AmphipodA small crustacean of the order Amphipoda having a laterally compressed body with no carapace.
Anode A positively charged electrode (associated with a battery, electronic device or electrical equipment).
AnnelidAny of various worms or wormlike animals of the phylum Annelida, characterised by an elongated, cylindrical and segmented body.
AnnulusThe space between the drill string and the well wall, or casing strings or between casing and the production tubing.
Anti-foulant Chemicals that are added to fluids, which inhibit fouling of plant or vessels by organisms.
Anthropogenic Relating to humans.
AquiferAn underground formation of rock saturated with water.
Aromatic Hydrocarbons Hydrocarbons which include cyclic conjugated carbon atoms such as benzene, toluene, xylene etc.
Arthropod Invertebrates with an exoskeleton, jointed legs and a segmented body. Usually in marine biology terms comprising crustacea and insect larva.
Associated Gas Natural gas found as part of or in conjunction with other constituents of crude oil as opposed to such gas found on its own.
Audiogram A noise graph showing absolute threshold for pure tones as a function of frequency.
Azerbaijan Manat (AZN) Currency of Azerbaijan.
Azeris or AzerbaijanisPeople of the Republic of Azerbaijan.
Azores High A permanent high atmospheric pressure area above the subtropical and tropic regions in the Atlantic Ocean in the Northern hemisphere.
Bacillarhiophytes Also known as diatoms, a phylum of Algae. Single celled marine or freshwater organisms that have cell walls and consist of two overlapping halves. Past deposition of these has resulted in diatomaceous earth and oil deposits.
BallastWater taken aboard a vessel to maintain stability and to distribute load stresses.
Barite A very heavy substance used as a main component of drilling mud to increase its density (mud weight). Main constituent of barite is the chemical element barium.
Barrels The traditional unit of measure of oil volume, equivalent to 159 litres (0.159 m3)or approximately 35 imperial gallons (42 US gallons).

AIOC Chirag Oil Project Environmental & Socio-Economic Impact Assessment
Glossary
February 2010 x Final
Base Case Design Project design as described and assessed within the ESIA.
Basel Convention An international legal agreement that primarily deals with transboundary hazardous waste movement and other hazardous waste management.
Bathymetry The measurement of the depth of water bodies, particularly of oceans and seas.
Beached Oil The portion of an oil spill that reaches the shore.
Benthos The collection of organisms attached to or resting on the bottom (benthic) sediments and those which bore or burrow into the sediments.
Best Available Technology (BAT) or Best Available Control Technology (BACT) A ‘top-down’ approach to the selection and evaluation of technology, starting with the best technology possible for the application, followed by the next best and so on. Each technology is considered on a cost benefit basis, taking into account technical and operational limitations.
Best Practicable Environmental Option (BPEO) A set of procedures to evaluate the environmental implications of a project’s options to determine the most benefits or least damage to the environment, at an acceptable cost.
BiocidesA chemical agent that can be added to fluids for the purpose of selectively preventing or limiting the growth of bacteria and other organisms.
Biodegradable Susceptible to breakdown into simpler compounds by microorganisms in the soil, water and atmosphere. Biodegradation often converts toxic organic compounds into non- or less toxic substances.
Biodiversity The number of plant and animal species in a given area.
Biological Oxygen Demand (BOD) The amount of oxygen required by aerobic microorganisms to decompose the organic matter in a sample of water, such as that polluted by sewage. It is used as a measure of the degree of water pollution.
BiomassThe total mass of living matter within a given quantity.
BiotaThe plant and animal life of a particular region.
Biotope An area that is uniform in environmental conditions and in its distribution of animal and plant life.
Bioremediation The use of biological methods to remediate/restore contaminated land.
Birth Rate Childbirth per 1,000 people per year.
Bivalve A marine or freshwater mollusc having a laterally compressed body and a shell consisting of two hinged valves.
Black Water Wastewater containing fecal matter and urine.
Blowout Uncontrolled or uncontrollable release of downhole pressure upward through the wellbore or casing.
Blowout Preventor (BOP) Hydraulically operated device used to prevent uncontrolled releases of oil or gas from a well.
Borehole A hole in the ground made by drilling; the uncased drill hole from the surface to the bottom of the well.
BundContainment around a storage tank to contain the contents in case of rupture or spillage.
Buy Back A system to allow the separation of fuel from a gas export line, when fuel gas is unavailable on the platform.

AIOC Chirag Oil Project Environmental & Socio-Economic Impact Assessment
Glossary
February 2010 xi Final
Caisson A steel cylindrical chamber extending from the drilling rig or platform that is completely submerged and may be used for the uptake of sea water or the discharge of effluent.
CasingThe steel piping used to line a well for protection against collapse of the well borehole and unwanted leakage into or from the surrounding formation.
Cathodic Protection A method of neutralising the corrosive static electric charges in a submerged steel structure.
Cement A powdery, viscous substance, capable of forming elastic mass when mixing with water, which consequently hardens..
Chemical Oxygen Demand (COD) The amount of oxygen consumed within a solution. It is used to indirectly measure the amount of organic compounds in water.
Chemiluminescence The emission of light with limited emission of heat (luminescence), as the result of a chemical reaction.
Circulation The passage of fluids, primarily drilling mud, down the interior of the drill stem and back to the surface via the annulus.
Coalescer A device used to change material from a liquid to a thickened curdlike state by chemical reaction.
ColiformOf or relating to the bacteria that commonly inhabit the intestines/colons of humans and other vertebrates.
Commissioning Preparatory work comprising system testing of the platform process systems, prior to full production.
Communities An ecological unit composed of the various populations of micro-organisms, plants, animals that inhabit a particular area.
CompletionSee well completion.
Completion Fluid Chemical mixture present in the well during the placement of production tubing and perforation of the well.
Compression The raising of pressure within a substance.
Condensate (Gas Condensate) Light hydrocarbon fractions produced with natural gas which condense into liquid at normal temperatures and pressures associated with surface production equipment.
Conductor Pipe/Sections A relatively short string of large diameter pipe which is set to keep the top of the wellbore open and to provide means of conveying the upflowing drilling fluid from the wellbore to the surface drilling fluid system until surface casing string is set in the well. Conductor pipe may also be used in well control. Conductor pipe is usually cemented.
Conductor Section Hammering Driving of the conductor section into the subsurface by repeated blows, usually using hydraulic hammering equipment
Consequence The resultant effect (positive or negative) of an activity’s interaction with the legal, natural and/or socio-economic environments.
Consultation A process of obtaining views and input from stakeholders.
Continental Plate A tectonic plate that forms part of one of the Earth’s continents.
Continental Slope Connects the continental shelf and the oceanic crust and is part of the continental margin.
Contract Area Area of the sea that has been sub-divided and licensed/leased to a company or group of companies for exploration and production of hydrocarbons.

AIOC Chirag Oil Project Environmental & Socio-Economic Impact Assessment
Glossary
February 2010 xii Final
Convergent Plate Boundary An actively deforming region where two (or more) tectonic plates or fragments of lithosphere move toward one another and collide.
Copepod Any member of a large family of the phylum Arthropoda, including many crustaceans, living in freshwater and marine water. Some copepods are parasitic and others are free living.
Corrosion The eating away of metal by chemical or electrochemical action. The rusting and pitting of pipelines, steel tanks, and other metal structures is caused by a complex electrochemical action.
Corrosion inhibitors Chemicals which reduce the rate of corrosion on metal.
Crude Oil An unrefined mixture of naturally-occurring hydrocarbons with varying densities and properties.
Crustacea Class of invertebrate animals of arthropoda type, includes various familiar animals, such as crabs, lobsters, crayfish, shrimp, krill and barnacles.
Ctenophore Any of various marine animals of the phylum Ctenophora, having transparent, gelatinous bodies bearing eight rows of comblike cilia used for swimming. Also known as comb jelly.
Cumulative Impact Environmental and/or socio-economic aspects that may not on their own constitute a significant impact but when combined with impacts from past, present or reasonably foreseeable future activities, result in a larger /more significance impact(s).
CuttingsThe fragments of rock dislodged by the drill bit and brought to the surface in the mud. Can be re-injected into substratum via a well.
Dada Gorgud The semi-submersible mobile drilling rig used to drill predrill wells.
DaphniaSmall planktonic invertebrate, cladoceran, varying in length from 0.2 to 5 mm.
Decibel (dB) A unit used (one tenth of a bel) used in the comparison of two power levels relating to sound intensities.
Decommissioning Shutdown and dismantling of any facilities.
De-gasser A separator which removes entrained gas from the returned mud flow. Also any process which removes gases of various kinds from an oil flow.
Dehydration Removal of water .
DemulsifierA chemical used to break down water oil emulsions. The chemical reduces the surface tension of the film of oil surrounding the droplets of water. The water then settles to the bottom of the tank.
Derrick A pylon-like steel tower which provides the vertical lifting capacity needed for drilling the well.
Descalers Substances added to remove solids such as calcium carbonates and sulphates deposited on the drill pipe and casing.
Desertification The transformation of arable or habitable land to desert, due to a change in climate or destructive land use.
Dew point The temperature to which a given parcel of air must be cooled, at constant pressure, for water vapour to condense into water.
Disclosure Release of ESIA information into the public domain.
AIOC Chirag Oil Project Environmental & Socio-Economic Impact Assessment
Glossary
February 2010 xiii Final
Dispersant Specially designed oil spill products that are composed of detergent-like surfactants in low toxicity solvents. Dispersants do not remove oil from the water but break the oil slick into small particles, which then disperse into the water where they are further broken down by natural processes.
Domestic waste Solid waste, composed of garbage and rubbish, which normally originates from a residence/living quarters.
Down Hole Area within the drilled bore of an oil well.
Downtime A period when any equipment is unserviceable or out of operation for maintenance.
Drill bit A drilling tool used to cut through rock.
Drilled Cuttings Small fragments of rock produced as the result of drilling that are brought to the surface by the flow of the drilling mud as it is circulated.
Drill Stem Test The assembled drill pipe in the well which serves to rotate the bit, to convey drilling mud or cement down the well and to flow fluids to the surface.
Drilling Mud A special clay mixed with water or oil and chemical additives, pumped downhole through the drill pipe (string) and drill bit. The mud cools the rapidly rotating bit, lubricates the drillpipe as it turns in the well bore, carries rock cuttings to the surface and serves as a plaster to prevent the wall of the borehole from collapsing. Also known as drilling fluid.
Drill string Lengths of steel tubing screwed together to form a pipe connecting the drill bit to the drilling rig. It is rotated to drill the hole and delivers the drilling fluids to the cutting edge of the bit.
Early Oil Project The first large-scale oil project in the Caspian Sea. It commenced in 1994 and involved a consortium of companies who
invested to extract oil from the Azeri, Chirag and Guneshli wells.
Ecosystem The interrelationships between all living organisms in a given area, and their relationships to non-living materials.
Effluent Waste products emitted as a liquid by an operation or process.
Emergency / Abnormal Activity An unplanned activity e.g. due to equipment failure, loss of containment, operator error, unexpected well conditions or design error.
EmulsionA mixture of two or more immiscible liquids, with one being dispersed in another.
EndemicPresent within a localised area or peculiar to organisms in such an area.
Entrained Oil Small amounts of oil which may be trapped and form part of a gas stream due to the difficulties of separation at source.
Environment for Europe A partnership of member states, including Azerbaijan, and other organisations within the UNECE region.
Environmental and Socio-economic Impact Assessment (ESIA) Systematic review of the environmental or socio-economic effects a proposed project may have on its surrounding environment.
Environmental Aspect An element of an organisation’s activities, products or services that can interact with the environment.
Environmental Impact Any change to the environment, whether adverse or beneficial, wholly or partially resulting from an organisation’s activities, products or services.
Environmental Impact Management ProcessA full life-cycle process that seeks to identify and understand a project’s environmental impacts, to avoid, minimise, mitigate and remediate the impacts.
AIOC Chirag Oil Project Environmental & Socio-Economic Impact Assessment
Glossary
February 2010 xiv Final
Environmental Management System A system established to plan, manage and document an organisation’s activities and processes and resultant environmental impacts.
Environmental Quality Standard (EQS) A value, generally defined by regulation, which specifies the maximum permissible concentration of a potentially hazardous chemical in an environmental sample, generally of gas or liquid.
Environmental Receptors Any of various organisms that are directly or indirectly affected by environmental impact.
Environmental Statement Formal document required to present the findings of an ESIA process for a proposed project.
EphemeralSomething living or lasting for a brief time.
Espoo Convention A regional legal agreement to promote environmentally sound and sustainable economic development through the application of ESIA.
Exploration WellA well drilled in search of an undiscovered reservoir or to greatly extend the limits of a known reservoir.
Fertility Rate The average number of children that would be born to a woman in a certain area over her lifetime.
Filter Feeder A variety of organisms living mostly on detritus or on plankton, whose feeding mechanism comprises a filter and a means of creating a current carrying particles through the filter.
Fixed Exchange Rate A type of exchange rate regime wherein a currency's value is matched to the value of another single currency or to a basket of other currencies, or to another measure of value, such as gold.
FlaringControlled disposal of surplus combustible hydrocarbons by igniting their vapours.
FlashThe sudden release of gases and/or vapours due to an instantaneous reduction in temperature and/or pressure.
Float Over The launch or loading out of jackets or other structures for installation offshore on a flotation barge or other vessel.
Flowline The pipe through which oil/gas travels from the well to the processing equipment or to storage.
Fluvial Of or relating to rivers or streams or produced by the action of a river or stream.
Footprint The spatial impact/impression on the seabed or land from a facility or building.
Foreign Direct Investment The establishment of an enterprise by a foreigner. Also used as a measure of foreign ownership of productive assets.
FormationA rock deposit or structure of homogenous origin and appearance.
Fugitive Emissions Unintended escape/leakage of gas and liquids from equipment and pipework.
Galley Waste Organic food waste originating from the platform galley or kitchen.
Gas Lift Increasing the production flow of oil by injecting gas into the annulus of a well to mingle with the oil, thus increasing pressure and flow rate.
Gas-oil Ratio The proportional amount of gas to oil liquid occurring in production from a reservoir, usually expressed as cubic feet per barrel.
Gas Reinjection Re-injection of gas into a reservoir, in order to increase pressure and thus increase/induce further oil/gas flow.
GastropodAny of the various molluscs of the class Gastropoda such as the snail.

AIOC Chirag Oil Project Environmental & Socio-Economic Impact Assessment
Glossary
February 2010 xv Final
Geohazard Geological state that represents or has the potential to develop further into a situation leading to damage or uncontrolled risk.
Glutaraldehyde A colourless liquid with a pungent odour used for industrial water treatment and as a chemical preservative.
Gravel Pack A fill of fine gravel used to support the formation and keep the interior of the well clean when the producing formation of a well is crumbling or caving into the well bore and is plugging the perforations.
Greenhouse Gases (GHG) Atmospheric gases considered to contribute to the greenhouse effect by absorbing and emitting radiation, including carbon dioxide, water vapour and methane.
Grey Water Wastewater (from wash basins, showers etc) that does not contain sewage or oil.
GroutA material that is used for filling voids and sealing joints.
Habitat An area where particular animal or plant species and assemblages are found, defined by environmental parameters.
Harmful Substances Those substances that are identified as marine pollutants in the IMDG Code.
Hazard The potential to cause harm, including ill health or injury; damage to property, plant, products or the environment; production losses or increased liabilities.
Heavy Metals A subset of elements that exhibit metallic properties, and which include the transition metals and a number of metalloids, lanthanoids, and actinides.
HelideckA helicopter landing surface on a drilling platform.
Holoplankton Permanent members of the plankton species, excluding temporary larval forms of fish and benthos.
Hook Up The activity following offshore development installation during which all connections and services are made operable for commissioning and ‘start-up’.
Hydrocarbon Organic chemical compounds of hydrogen and carbon atoms. There are a vast number of these compounds and they form the basis of all petroleum products. They may exist as gases, liquids or solids, examples being methane, hexane and paraffin.
Hydrotesting The checking of the integrity of a container (e.g. tank or pipe) by filling it with water under pressure and testing for any loss of pressure.
Inhibited Seawater Seawater which is chemically treated to reduce potential corrosion and biofouling.
Inert Gas Chemically unreactive gases used to flood compartments in a vessel or platform when there is fire or imminent danger of fire.
Injection Well A well used to introduce fluids into a reservoir, usually leading to enhanced recovery.
International Finance Corporation Organisation that is a member of the World Bank, and promotes sustainable private sector investment in developing countries.
Internationally Displaced Persons People who are forced to flee their homes, but unlike refugees, remain within their country’s borders.
Invertebrates Any animal lacking a backbone, including all species not classified as vertebrates.

AIOC Chirag Oil Project Environmental & Socio-Economic Impact Assessment
Glossary
February 2010 xvi Final
ISO 14001 An evolving series of generic environmental management system standards developed by the International Standards Organisation that provides business management with a structure for managing environmental impacts.
IsopodA type of peracarid crustacean.
Jacket The structure of an offshore steel, piled platform, which supports the topside facilities.
Kiloelectron volt Common unit of energy used in physics. It is the amount of kinetic energy an unbound electron gains when it accelerates through and electrostatic potential difference of one thousand volts.
Larvae An immature free-living form of animal that develops into a different form through metamorphosis.
Law on Normative-Legal Acts Azerbaijani legislation that stipulates that acts in force prior to independence, not subsequently cancelled or contradictory to the Constitution, remain in force.
Law on the Protection of the Environment Azerbaijani legislation that addresses use of natural resources, the rights and responsibilities of the State and its citizens, ecological requirements for economic activities, ecological emergencies and disaster zones, etc.
Lift Gas Gas sourced from the export stream to be delivered to the wellhead to maximise well productivity.
LikelihoodThe possibility that an activity or effect will occur.
Linear Alpha Olefins Chemical compounds found within some drilling mud. Olefins or alkenes have a chemical formula CxH2x and are industrially important.
Littoral zone The part of the shore that is under water at high tide and exposed when the tide is low. Also known as the intertidal zone.
Long Chain Diamine A type of polymer (molecule with repeating structural units) with a ‘long’ chemical structure.
Macrobenthos or Macrofauna Organisms that live on/in sediment at the bottom of a water column. Relatively larger than other benthos with a size range of approximately 20 cm to 0.5 mm.
Macroeconomic The overall aspects and workings of a national economy, (e.g. gross domestic product, inflation, unemployment statistics etc.).
ManifoldAssembly of pipes, valves and fittings which allows fluids from more than one source to be collected together and directed to various alternative routes.
Maximum Permissible Level An amount, usually a combination of time and concentration, beyond which any exposure of humans to a chemical or physical agent in their immediate environment is unsafe.
MammalA class of warm-blooded vertebrates, Mammalia, having mammary glands in the female.
Material Safety Data Sheet (MSDS) An information sheet used by chemical suppliers to summarise properties of products, including health, safety and environmental aspects.
MicroplateAny small lithospheric (Earth’s crust and upper mantle) plate.
MigrationAny regular animal journeys along well-defined routes, particularly those involving a return to breeding grounds.
Milli Mejlis Azerbaijan Parliament.

AIOC Chirag Oil Project Environmental & Socio-Economic Impact Assessment
Glossary
February 2010 xvii Final
MitigationThe measures put forward to prevent, reduce and where possible, offset any adverse environmental or socio-economic effects.
ModuleA separate section or box-like compartment of the topside of a platform, as far as possible self-contained, designed to be connected to other modules offshore.
Monitoring Activities All inspection, test and monitoring work related to health, safety and environmental management.
Nagorno-Karabakh A landlocked region in the South Caucasus which is mostly mountainous and afforested. It is within the national boundary of Azerbaijan, but governed by the internationally unrecognised Nagorno-Karabakh Republic.
Naturally Occurring Radioactive Material (NORM) A substance containing barium sulphate arising through the production process, which originates in subsurface formations. May be hazardous through inhalation and ingestion.
Neutralised Seawater A process to chemically alter seawater to make its pH level nearer neutral, to enhance its effectiveness for drilling mud.
Non-destructive Testing (NDT) Methods of inspecting and testing the quality or integrity of vessels or equipment which do not involve the removal or testing to destruction of representative sections.
Non Routine Activity An activity that occurs when plant / vessels or equipment is operated not as specified within the Base Case but in a previously planned manner, e.g. flaring when platform equipment is undergoing planned maintenance in line with known maintenance strategy, discharge of produced water when the produced water reinjection system is unavailable.
Non-Water Based Muds Drilling fluids such as Oil Based Muds and Synthetic Based Muds, which are not based on suspension of solids using water.
Oceanography The study of the ocean, including marine ecosystems, ocean currents, waves, and physical and chemical changes.
Oligochaete Any of various annelid worms of the class Oligochaeta, including the earthworms and a few small freshwater forms.
Operator The company responsible for conducting operations on a concession on behalf of itself and any other concession-holders.
Overpressure Subsurface pressure that is abnormally high, exceeding hydrostatic pressure at a given depth.
Oxygenated Water Water with high amounts of dissolved oxygen.
ParticulatesTiny particles of solid or liquid suspended in a gas or liquid.
Per Capita Income Means how much each individual receives, in monetary terms, of the yearly income generated in the country.
Performance Requirements The criteria BP shall meet to achieve a constant delivery of environmental performance.
Pipelay Barge A vessel designed for welding together pipelines and laying them on the seabed.
pHA scale of alkalinity or acidity, running from 0 to 14 with 7 representing neutrality, 0 maximum acidity and 14 maximum alkalinity.
Producer Well A drilled hole through which oil and gas is extracted.

AIOC Chirag Oil Project Environmental & Socio-Economic Impact Assessment
Glossary
February 2010 xviii Final
Productive Zone Most populated zone of the ocean (usually the top layer).
Phytoplankton Microscopic photosynthetic organisms which float or drift in the surface waters of seas and lakes, e.g. diatoms, dinoflagellates.
Pig (train) A bullet shaped, cylindrical or spherical capsule which is inserted into a pipeline flow and travels along with the fluid in the pipeline. Its primary purpose is to scrape the pipeline clean from rust, wax or other deposits. More sophisticated pigs, called intelligent pigs, carry instrumentation used in pipeline inspection.
Piling or Pile Driving Tubular steel shafts driven into the seabed to secure a structure to the seabed. Piles are usually driven through external sleeves or skirts attached to legs.
Pilot Hole A smaller hole drilled into a material prior to a larger hole being drilled, widening the hole to the desired width.
Pipe Dope Lubricating grease which seals pipe joints to prevent damage to threads.
Pipeline Tie-in The connection of two or more pipelines, usually by a wye piece.
Pipe Rack Where stands of drill pipe are stacked vertically in a derrick ready for use.
Photovolatic Application of solar cells for energy by converting solar energy (sunlight, including ultra violet radiation) directly into electricity.
Phytosanitary Measures Measures to protect the health of plants.
PlanktonTiny plants (phytoplankton) and animals (zooplankton) that drift in the surface waters of seas and lakes. They are of high ecological importance as they provide a source of food to larger marine organisms such as fish.
Platform One of the various types of offshore structures.
PlugTo seal a well or part of a well with cement.
PollutionThe introduction by man, directly or indirectly, of substances or energy to the environment resulting in deleterious effects such as harm to living resources; hazards to human health; hindrance of marine activities including fishing and impairment of the quality for use of seawater and reduction of amenities.
PolychaeteAny of various annelid worms of the class Polychaeta, including mostly marine worms such as the lugworm, and characterised by fleshy paired appendages tipped with bristles on each body segment.
Polycyclic Aromatic Hydrocarbons (PAH) Hydrocarbons whose carbon atoms form a ring or rings.
Polymer Two or more molecules of the same kind, combined to form a compound with different physical properties.
Pour Point The lowest temperature at which a liquid will pour or flow under prescribed conditions. It is a rough indication of the lowest temperature at which oil is readily pumpable.
PredrillDrilling activities taking place to accelerate early production once offshore facilities are in place.
Pressure Maintenance The process of keeping reservoir pressure at the optimum level during production, usually by water or gas injection to replace the extracted fluids.
Produced Water Water that naturally accompanies produced oil. Also known as produced formation water.

AIOC Chirag Oil Project Environmental & Socio-Economic Impact Assessment
Glossary
February 2010 xix Final
ProductionThe full-scale extraction of hydrocarbon reserves.
Production Sharing Agreement (PSA) Type of contract signed between a government and a resource extraction company (or group of companies).
Public Participation Process where the affected public are informed about the planned activities.
PuppingThe period when seals are giving birth to their young.
RAMSAR Convention An international legal agreement that provides designations to sites that are considered internationally important in terms of birds.
Reactive formations A group of subterranean formations which are sensitive to water, and may cause instability during drilling.
Receptor The aspect of the environment (air, water, ecosystem, human, fauna, etc.) that is affected by/interacts with an environmental or socio-economic impact.
Recycling/Recovery The conversion of wastes into usable materials and/or extraction of energy or materials from wastes.
Red List / Red Book A list comprised of rare or threatened species of plants and animals. The book containing Red List species.
Reservoir A porous, fractured or cavitied rock formation with a geological seal forming a trap for producible hydrocarbons.
Reservoir Pressure The pressure at reservoir depth in a shut-in well.
Residual Impacts Residual impacts are impacts that remain after mitigation measures, including those incorporated into the project’s Base Case design and those developed in addition to the base design, have been applied.
Residual Oil The dense, viscous “Heavy Ends” of the barrel, remaining after extraction of higher-value fractions.
ResilienceA measure of how a biological, ecological or human receptor is affected by an identified stressor.
Reuse The use of materials or products that are reusable in their original form.
Richter Scale The scale for expressing the magnitude of an earthquake, ranging from 0 to 8.
RigA collective term to describe the equipment needed for drilling a well.
RiserA pipe through which fluids flow upwards.
RiskThe product of the chance that a specified undesired event will occur and the severity of the consequences of the event.
Routine Activity An activity that occurs during routine operations when plant / vessels or equipment is operating as specified within the design base case e.g. operation of the flare in pilot mode, operation of the platform sewage treatment plant or drains as designed.
Sail-away The process of transporting equipment from onshore to its offshore location by vessel.
Salinity Total amount of solid material dissolved in aqueous solution. Salinity is measured in parts per thousand.
Scale Inhibitor Substances added to minimise deposition of solids such as calcium carbonates and sulphates in equipment, pipework or casings.
ScopingEarly stage in the EIA process which appraises the likely key issues requiring detailed assessment.

AIOC Chirag Oil Project Environmental & Socio-Economic Impact Assessment
Glossary
February 2010 xx Final
ScreeningThe process by which it is decided if an EIA is required to be carried out for a project.
ScreenA tubular “sieve” inserted in a well bore to hold back loose sand and rock while letting oil and gas enter the well.
SedimentAny particular matter that transported by fluid flow and subsequently deposited.
Semi-submersible Rig A type of floating offshore drilling rig which has pontoons or buoyancy chambers located on short legs below the drilling platform.
Sensitivity The recovery rate of flora or fauna from significant disturbance or degradation.
Separator A process vessel used to separate gases and liquids in a hydrocarbon stream.
Shale shaker Screen for extracting rock cuttings from circulating drilling mud.
Siberian High A collection of cold or very cold air that collects on the Eurasian terrain for much of the year, and causes a high pressure atmospheric system affecting weather patterns.
Significant Wave Height The average wave height (trough to crest) of the 1/3 largest waves.
Slurry A mix of cement and water used in cementing.
Solids Circulation System A device that separates SBM/LTMOBM from cuttings via a series of shale shakers, a vacuum degasser and centrifuges.
South Asian Low A semi-permanent area of low pressure which influences the weather patterns in South Asia.
Stakeholder A person, group and/or organisation with an interest in a project.
Static Equilibrium Flotation When all the forces on a floating body are at rest and the total force is permanently zero.
StingerA support boom that extends outwards from the stern of a lay-barge and used to lay pipes.
Stochastic Oil Spill Modelling A simulation of the distance and speed with which oil travels following a spill, based on a range of possible input conditions, the product of which is an array of probable results.
Stockholm Convention An international legal agreement requiring Governments to reduce the release of persistent organic pollutants.
Storm Surge An offshore rise in water level associated with a low pressure weather system. Usually caused by strong winds pushing the surface of the water body.
StrataDistinct, usually parallel beds of rock.
StratosphereA layer of the atmosphere beginning approximately 7 miles (11 km) above the surface of the earth.
SublittoralThe sublittoral or infralittoral zone extends from the intertidal zone into deeper waters.
SurfactantAn additive that reduces surface tension e.g. a detergent or emulsifier.
Swaging A technique for joining mechanical fittings (by squeezing) onto tubes.
Swim Bladder Buoyancy organ possessed by most bony fish.
TaxonPlural -Taxa. A taxonomic category or group, used to classify organisms.

AIOC Chirag Oil Project Environmental & Socio-Economic Impact Assessment
Glossary
February 2010 xxi Final
TemplateThe structural framework within which subsea wellheads are grouped.
Thermal desorption A non-oxidising process using heat to desorp oil from oily wastes.
Thermocline Temperature differential in the water.
TopsidePart of a rig which includes the upper deck, mezzanine deck, cellar deck and underdeck.
Total Depth The target depth for a well or the achieved (drilled) depth in a well at any one time.
Total original oil in place The estimated amount of oil in an oil reservoir, including both producible and non-producible oil.
Toxicity Inherent potential or capacity of a substance to cause adverse effects on living organisms.
Toxicity test Procedure that measures the toxicity produced by exposure to a series of concentrations of a test substance. In an aquatic toxicity test, the effect is usually measured as either the proportion of organisms affected or the degree of effect shown by the organism.
Trajectory oil spill modelling Estimated distance and speed with which oil travels following a spill, based on a single release scenario.
Transboundary impact An impact which crosses any boundaries between two geopolitical boundaries (i.e. a border).
Turbidity The cloudiness or haziness of a fluid caused by individual particles. It is used as a test of water quality.
UllageCapacity within a system or container.
UmbilicalTube or line that connects the subsurface to the surface of the sea.
Unresolved Complex Mixture (UCM) A mixture of hydrocarbons which produce a baseline rise in gas chromatograms of petroleum-derived hydrocarbons.
VentingThe release of gases to the atmosphere without burning.
Vienna Convention An international legal agreement regarding the protection of the Ozone Layer.
Viscosity The resistance of a fluid to flow due to the mutual adherence to its molecules.
WadiAn Arabic term, traditionally referring to a valley or dry riverbed.
Wastewater Water contaminated with domestic and production wastes.
Water Based Muds (WBM) Drilling fluid based on suspension of solids in water.
Water Injection/Water Reinjection The injection of water into a reservoir or well.
WaxWax is a constituent of crude oil that often requires special treatment to allow the oil to flow freely at surface conditions.
Weathering Processes related to the chemical action of air, water and organisms. Weathering results in evaporative loss of light hydrocarbons and it is commonly accompanied by biodegradation and water washing.
Well Clean Up Ridding the borehole of spent fluid. This returns the well to an original state and drains back into the borehole where it is pumped or circulated out, leaving the hole clean.
Well Completion The work of preparing a newly drilled well for production.

AIOC Chirag Oil Project Environmental & Socio-Economic Impact Assessment
Glossary
February 2010 xxii Final
WellheadTop of a casing and the attached control and flow valves. The well head is where the control valves, testing equipment and take-off piping are located.
Well Testing Testing of a well to estimate expected well productivity. Testing in a production well also monitors the effects of cumulative production on the formation.
Wet Gas Natural hydrocarbon gas containing significant amounts of naturally liquid hydrocarbons.
Wind Rose A diagram with radiating lines showing the frequency and strength of winds from each direction affecting a specific place.
World Heritage Site A site (such as a forest, mountain, lake, desert, monument, building, complex, or city) that is on the list that is maintained by the international World Heritage Programme administered by the UNESCO World Heritage Committee, composed of 21 state parties[1] which are elected by their General Assembly for a four-year term.[2] A World Heritage Site is a place of either cultural or physical significance.
Zonal Isolation Separation of oil arising from different sub-surface formations.
Zooplankton Plankton that consists of animals such as corals and jellyfish, usually small and often microscopic.

1. Introduction
Contents
List of Figures
List of Tables

1.1 Introduction
Figure 1.1 Location of Azeri Chirag Gunashli Contract Area

1.2 AIOC Oil and Gas Caspian Developments
1.2.1 ACG Production Sharing Agreement
1.2.2 ACG Contract Area and Field Development
Figure 1.2 ACG Offshore Developments (Including COP)
Key:

1.2.2.1 Early Oil Project
1.2.2.2 ACG Phase 1
1.2.2.3 ACG Phase 2
1.2.2.4 ACG Phase 3

1.2.2.5 Produced Water Disposal
1.2.3 Shah Deniz Gas Export Project
1.2.4 Export Pipelines

1.3 COP Overview
1.4 COP Environment and Socio-economic Impact Assessment
1.4.1 Objectives
1.4.2 Structure and ESIA Team

Table 1.1 Structures and Content of the ESIA
Section Content Executive Summary Units and Abbreviations Glossary
Appendices
Table 1.2 COP ESIA Team
Team Member Role
AIOC Chirag Oil Project Environmental & Socio-Economic Impact Assessment
Chapter 2: Policy, Regulatory and Administrative
Framework
February 2010 Final
2/1
2 Policy, Regulatory and Administrative Framework
Contents
2.1 Introduction........................................................................................................................22.2 Regulatory Agencies .........................................................................................................22.3 The Constitution ................................................................................................................32.4 Production Sharing Agreement .........................................................................................32.5 International and Regional Environmental Conventions...................................................42.6 National Environmental Legislation...................................................................................7
2.6.1 National EIA Guidance .......................................................................................112.7 Regional Processes ........................................................................................................12
2.7.1 European Union..................................................................................................122.7.2 Environment for Europe......................................................................................12
2.8 International Petroleum Industry Standards and Practices.............................................122.9 BP Requirements ............................................................................................................12
2.9.1 EIMP...................................................................................................................132.9.2 PR.......................................................................................................................13
2.10 COP Project Standards ...................................................................................................13
List of Figures
Figure 2.1 Azerbaijan Legal Hierarchy 2
List of Tables
Table 2.1 Summary of International Conventions 5 Table 2.2 Summary of Regional Conventions 6 Table 2.3 Key National Environmental and Social Laws 8 Table 2.4 Summary of Guidance on the EIA Process in Azerbaijan 11

AIOC Chirag Oil Project Environmental & Socio-Economic Impact Assessment
Chapter 2: Policy, Regulatory and Administrative
Framework
February 2010 Final
2/2
2.1 Introduction
The Chirag Oil Project (COP) will be undertaken in accordance with the Production Sharing Agreement (PSA), applicable requirements of international conventions ratified by the Azerbaijan government, International Petroleum Industry Standards and Practices, applicable national legislation and BP’s Health Safety Security and Environment (HSSE) Policy. The legislative framework governing the COP is illustrated in Figure 2.1.
Figure 2.1 Azerbaijan Legal Hierarchy
2.2 Regulatory Agencies
The Ministry of Ecology and Natural Resources (MENR) has primary responsibility for environmental regulation. The MENR’s statutes were adopted by presidential decree in 2001, making this body responsible for:
Development of draft environmental legislation for submission to the Azerbaijan Parliament (Milli Mejlis);
Implementation of environmental policy; Enforcement of standards and requirements for environmental protection; Suspension or termination of activities not meeting set standards; Advising on environmental issues; Expert review and approval of environmental documentation, including ESIA; and
Tier 1
Constitution of the Azerbaijan Republic
The highest law within the Azerbaijan Republic
Tier 4
The PSA grants exclusive right to conduct operations (Article II 2.1, ACG) that must be in accordance with international petroleum industry standards.
Production Sharing
Agreement
International Petroleum Industry Standards or
Environmental Standards
Tier 5 National Legislation
ESIAs
Laws passed by Parliament Orders of the President Decrees of CoM Normative Acts of Central Ex. Powers
Approved ESIAs act as legal permits for BP to operate within Azerbaijan.
Tier 3
International Conventions and
Agreements
Where conflict exists between national legislation and international agreements the provision of the international agreement shall apply (Constitution, Article 151).
Tier 2
Legal acts adopted by referendum
AIOC Chirag Oil Project Environmental & Socio-Economic Impact Assessment
Chapter 2: Policy, Regulatory and Administrative
Framework
February 2010 Final
2/3
Implementation of the requirements set out in international conventions ratified by the Azerbaijan Republic (within its competence).
Other ministries and committees have functions that relate to environmental regulation including:
Ministry of Emergency Situations (MES) - responsible for the management of natural disasters and industrial accidents and the implementation of safety rules in construction, mining and industry. MES (along with the State Oil Company of the Azerbaijan Republic (SOCAR), MENR and other appropriate Ministries) require prompt notification in the event of an emergency, or accident; Ministry of Health - state institution controlling the sanitary-epidemiological situation in the country and regulation of health protection in the work place; Ministry of Fuel and Energy - responsible for oil and gas activities, the sale of oil and gas products, and the efficient utilisation of Azerbaijan's energy resources; Melioration Water and Utilities Open Joint Stock Company - monitors water use, issues water abstraction permits for surface waters and imposes payments for water use; and State Committee for Construction and Architecture - regulates engineering surveys, and the implementation of design and construction rules and standards.
SOCAR is obligated under Article III, Clause 3.2 of the Azeri Chirag Gunashli (ACG) PSA to provide assistance to the Contractor in obtaining, “any necessary Government approvals and any other approvals from relevant Azerbaijan authorities, agencies and/or organisations”.
2.3 The Constitution
The Constitution is the highest law in the country. The following Articles help determine the applicability of national and international requirements to the COP:
Article 148.II - International agreements acceded to by the Azerbaijan Republic become an integral part of the legislative system of Azerbaijan; and Article 151 - If any conflicts arise between the normative-legal acts which constitute the legislative system of Azerbaijan (except for the Constitution and the acts adopted via referendum) and the international agreements acceded to by the Azerbaijan Republic, the provisions of the international agreements shall apply.
The Constitution (Article 39) also provides the right to all to live in a healthy environment; to have access to information on the state of the environment, and to obtain compensation for damage to person or property arising from a violation of environmental legislation.
2.4 Production Sharing Agreement
The ACG PSA is the legally binding agreement for the joint development and production sharing of the Azeri and Chirag fields and the deep-water portion of the Gunashli field in the Azerbaijan sector of the Caspian Sea. This agreement, between SOCAR and Azerbaijan International Operating Company (AIOC) shareholder parties (Contractor Parties) was enacted into Azerbaijan law in 1994 and applies to all phases of the COP Project. Under the terms of the PSA, AIOC, acting on behalf of Contractor Parties, has the right, for the entire term of the PSA, to develop and produce hydrocarbons from the ACG offshore fields. The PSA states that the conduct of operations should be undertaken with respect to the general environment, other natural resources and property, with the order of priority being the protection of life, environment and property.
Article 26.1 of the PSA states:
“Contractor shall conduct the Petroleum Operations in a diligent, safe and efficient manner in accordance with generally accepted international Petroleum industry standards.”

AIOC Chirag Oil Project Environmental & Socio-Economic Impact Assessment
Chapter 2: Policy, Regulatory and Administrative
Framework
February 2010 Final
2/4
Article 26.3 of the PSA requires AIOC to:
“comply with the present and future Azerbaijani laws or regulations of general applicability with respect to public health, safety and protection and restoration of the environment to the extent that such laws and regulations are no more stringent than the then current international petroleum standards and practices”.
The requirement to prepare environmental documentation, including an Environmental Impact Assessment of any new facilities is also a condition of Appendix IX Section II B of the PSA.
The specific environmental standards that must be met throughout the life of the PSA are stipulated in Appendix IX of the PSA (Appendix 2A).
2.5 International and Regional Environmental Conventions
Since its independence, Azerbaijan has sought to reform the policy, legal and institutional framework that it inherited from the former Soviet Union in order to move towards a modern market oriented economy. Accordingly, in recent years, the Azerbaijan Government has engaged in international and regional processes to support this objective. International and regional conventions currently in force in Azerbaijan relevant to the scope of this ESIA are described below in Tables 2.1 and 2.2.


AIOC Chirag Oil Project Environmental & Socio-Economic Impact Assessment
Chapter 2: Policy, Regulatory and Administrative
Framework
February 2010 Final
2/7
2.6 National Environmental Legislation
The Law on Normative-Legal Acts stipulates that acts in force prior to independence, that were not subsequently cancelled and that do not contradict the Constitution, remain in force. This results in a transitional legislative structure that combines soviet era and post soviet era regulations. The on-going transition process is being supported through a Partnership and Cooperation Agreement (PCA) between Azerbaijan and the European Union (which has been in force since 1999), (See Section 8.1).
The Government has committed to a process to align national environmental legislation with the principles of internationally recognised legislation, based on EU environmental legislation. As this process is on-going, the COP Project will comply with the intent of current national legal requirements where those requirements are consistent with the provisions of the PSA and do not contradict or are otherwise incompatible with international petroleum industry standards and practice.
The framework for national environmental legislation in Azerbaijan is provided by the Law on the Protection of the Environment (1999), which addresses the following issues:
The rights and responsibilities of the State, the citizens, public associations and local authorities;
The use of natural resources; Monitoring, standardisation and certification; Economic regulation of environmental protection; State Ecological Expertise (SEE); Ecological requirements for economic activities; Education, scientific research, statistics and information; Ecological emergencies and ecological disaster zones; Control of environmental protection; Ecological auditing; Responsibility for the violation of environmental legislation; and International cooperation.
According to Article 54.2 of the Law on Protection of the Environment, EIAs are subject to SEE, which means that the environmental authority (MENR) is responsible for the review and approval of EIA reports submitted by developers. The Law establishes the basis for the SEE procedure, which can be seen as a “stand-alone” check of compliance of the proposed project with the relevant environmental standards (e.g. for pollution levels, discharges and noise). In addition the law determines that projects cannot be implemented without a positive SEE resolution.
The SEE approach is based on Soviet approval and planning processes requiring state authorities to formally verify all submitted developments for their potential environmental impacts. Current internationally recognised practice emphasises a proportionate, consultative and publicly accountable approach to assessing impacts.


AIOC Chirag Oil Project Environmental & Socio-Economic Impact Assessment
Chapter 2: Policy, Regulatory and Administrative
Framework
February 2010 Final
2/11
2.6.1 National EIA Guidance
Guidance on the EIA process in Azerbaijan is provided in the Handbook for the Environmental Impact Assessment Process in Azerbaijan. The handbook introduces the main principles of the ‘western’-type EIA process and details:
The EIA process, i.e. the sequence of events and the roles and responsibilities of applicants and Government institutions;
The purpose and scope of the EIA document; Public participation in the process; Environmental review decision (following its submission to the MENR, the ESIA
document is reviewed for up to three months by an expert panel); and The appeal process.
A summary of the guidance provided in the handbook is given in Table 2.4 below.
The approval of an EIA by the MENR establishes the compliance framework, including the environmental and social standards that an organisation should adhere to.
Table 2.4 Summary of Guidance on the EIA Process in Azerbaijan2
Screening The developer is required to submit an Application (containing basic information on the proposal) to MENR to determine whether an EIA is required.
Scoping Requirement for a Scoping Meeting to be attended by the developer, experts and concerned members of the public, and aimed at reaching a consensus on the scope of the EIA.
Project Description
Full description of technological process and analysis of what is being proposed in terms of planning, pre-feasibility, construction and operation.
Environmental Studies
Requirement to describe fully the baseline environment at the site and elsewhere, if likely to be affected by the proposal. The environment must be described in terms of its various components – physical, ecological and social.
Consideration of Alternatives
No requirement to discuss project alternatives and their potential impacts (including the so-called “do-nothing” alternative), except for the description of alternative technologies.
Impact Assessment and Mitigation
Requirement to identify all impacts (direct and indirect, onsite and offsite, acute and chronic, one-off and cumulative, transient and irreversible). Each impact must be evaluated according to its significance and severity and mitigation measures provided to avoid, reduce, or compensate for these impacts.
PublicParticipation
Requirement to inform the affected public about the planned activities twice: when the application is submitted to the MENR for the preliminary assessment and during the EIA process. The developer is expected to involve the affected public in discussions on the proposal.
Monitoring The developer is responsible for continuous compliance with the conditions of the EIA approval through a monitoring programme. The MENR undertakes inspections of the implementation of activities in order to verify the accuracy and reliability of the developer’s monitoring data. The developer is responsible for notifying the MENR and taking necessary measures in case the monitoring reveals inconsistencies with the conditions of the EIA approval.
2 Source: based on a review of the EIA Handbook and “EIA in the New Oil and Gas Projects in Azerbaijan”, Parviz, 2005.

AIOC Chirag Oil Project Environmental & Socio-Economic Impact Assessment
Chapter 2: Policy, Regulatory and Administrative
Framework
February 2010 Final
2/12
2.7 Regional Processes
2.7.1 European Union
EU relations with Azerbaijan are governed primarily by the EU-Azerbaijan Partnership and Cooperation Agreement (PCA) and the European Neighbourhood Policy (ENP).
The PCA entered into force in 1999, under Article 43:
“The Republic of Azerbaijan should endeavour to ensure that its legislation will be gradually made compatible with that of the Community”.
As part of the PCA an EU assessment of Azerbaijan’s environmental legislation against EU Directives identified a number of recommendations for the approximation of national legislation with EU Directives3. Based on this, a draft national programme was developed that emphasises a flexible approach to amending national legislation to take account of institutional capacity and cost4.
Following the enlargement of the European Union, the EU launched the ENP and Azerbaijan became part of this policy in 2004. The current National Indicative Programme for implementing the ENP5 includes a commitment to support legislative reform in the environmental sector, including:
Approximation of Azerbaijan’s environmental legislation and standards with the EU’s; Strengthening of management capacity through integrated environmental authorisation; Improved procedures and structures for environmental impact assessment; and Development of sectoral environmental plans (waste and water management, air
pollution, etc.)
2.7.2 Environment for Europe
Environment for Europe6 is a partnership of member states, including Azerbaijan, and other organisations within the UNECE region. Under the auspices of the Environment for Europe a series of ministerial conferences on the environment have been held that have resulted in the establishment of the UNECE conventions described in Section 2.5.
2.8 International Petroleum Industry Standards and Practices
ACG related activities are required to comply with national legislation where it is no more stringent than “the then current international petroleum industry standards and practice (ACG PSA, Art. 26.3). Consideration of relevant international industry standards is therefore an important element in determining the applicability or otherwise of national legislation. Industry standards including those of the International Association of Oil and Gas Producers (OGP), the International Association of Geophysical Contractors (IAGC) and the International Association of Drilling Contractors (IADC) were specifically mentioned in the ACG PSA.
2.9 BP Requirements
The BP Environmental Group Defined Practice (GDP) includes minimum requirements that are applicable to the COP Project. There are two components of environmental practice applicable to the COP Project; the Environmental Impact Management Process (EIMP) and the Performance Requirements (PR). The latter are a comprehensive set of environmental
3 Mammadov, A. & Apruzzi, F. (2004) Support for the Implementation of the Partnership Cooperation Agreement between EU-Azerbaijan. Scoreboard Report on Environment and Utilisation of Natural Resources. Report prepared for TACIS. 4 SOFRECO (undated) Support for the Implementation of the PCA between EU-Azerbaijan, Draft Programme of legal Approximation.5 NIP (2007) European Neighbourhood and Partnership Instrument, Azerbaijan National Indicative Programme. 6 UNECE (2008) Environment for Europe (http://www.unece.org/env/efe/welcome.html)

AIOC Chirag Oil Project Environmental & Socio-Economic Impact Assessment
Chapter 2: Policy, Regulatory and Administrative
Framework
February 2010 Final
2/13
standards and the minimum requirements therein are in accordance with international petroleum industry standards as required by the ACG PSA.
2.9.1 EIMP
EIMP seeks to identify and understand the project’s environmental impacts. The project uses this information to avoid, minimise, mitigate and remediate the impacts. EIMP is a full life-cycle process and comprises:
1. Screening and categorisation 2. Environmental assessment 3. Consultation and disclosure 4. Compliance 5. Resourcing and contracting 6. Residual impacts 7. Environmental management system 8. Assurance and lessons learnt 9. Reporting
2.9.2 PR
The PR define the criteria BP shall meet to achieve a consistent delivery of environmental performance and are to be considered at all stages in the Environmental Impact Management Process.
PR-1 Air quality PR-2 Community disturbance PR-3 Cultural property PR-4 Drilling, completions and workover wastes and discharges PR-5 Energy efficiency PR-6 Environmental liability prevention PR-7 Flaring and venting PR-8 Marine mammals PR-9 Ozone Depleting Substances PR-10 Physical and ecological impacts PR-11 Waste management PR-12 Water management
2.10 COP Project Standards
Throughout the previous ACG Phases project standards have been agreed with the MENR on a project specific basis. The standards have taken into account Azerbaijan’s environmental legislation and regulation, which is currently in a transitional stage, as well as international standards, such as those mandated by the EU. This process has enabled MENR to assess, approve or modify the mitigation, controls and standards proposed by the project in liaison with BP.
This approach has also been adopted for the COP ESIA. Existing controls associated with COP events are summarised within the impact assessments chapters of this ESIA (Chapters 9-11). These controls comprise mitigation and monitoring inherent in the project design including the relevant environmental performance standards (refer to Chapter 9, Table 9.4, Chapter 10, Table 10.3 and Chapter11, Table 11.3).

AIOC Chirag Oil Project Environmental & Socio-Economic Impact Assessment
Chapter 3: Impact Assessment Methodology
February 2010 3/1Final
3 Impact Assessment Methodology
Contents
3.1 Introduction........................................................................................................................23.2 ESIA Process ....................................................................................................................2
3.2.1 Screening..............................................................................................................33.2.2 Scoping.................................................................................................................33.2.3 Project Alternatives and Base Case Design.........................................................53.2.4 Existing Conditions ...............................................................................................53.2.5 Impact Significance Assessment..........................................................................6
3.3 Transboundary and Cumulative Impacts ..........................................................................83.4 Mitigation and Monitoring ..................................................................................................9
List of Figures
Figure 3.1 The ESIA Process 2
List of Tables
Table 3.1 Summary of Lessons Learnt in Relation to Previous ACG Project Phases 4 and Related ESIA
Table 3.2 Event Magnitude Rankings 6 Table 3.3 Biological/Ecological and Human Receptor Sensitivity Rankings 7 Table 3.4 Impact Significance 8

AIOC Chirag Oil Project Environmental & Socio-Economic Impact Assessment
Chapter 3: Impact Assessment Methodology
February 2010 3/2Final
3.1 Introduction
This Chapter presents a description of the Environmental and Socio-Economic Impact Assessment (ESIA) process adopted for the Chirag Oil Project (COP) and the methodology used to assess impact significance.
3.2 ESIA Process
The ESIA process constitutes a systematic approach to the evaluation of a project and its associated activities throughout the project lifecycle from pre-construction, to construction and through to operation. The process includes:
Screening and Scoping; Project Alternatives and Base Case Design; Existing Environmental and Socio-Economic Conditions; Impact Significance Assessment; Mitigation and Monitoring; Residual Impacts; and Disclosure.
The ESIA also includes stakeholder consultation that identifies the views and opinions of potentially affected people and other interested parties. Stakeholder feedback is used to focus the impact assessment and, where appropriate, influence project design and execution. The ESIA process is integrated with the BP Capital Value Process (CVP) as illustrated in Figure 3.11.
Figure 3.1 The ESIA Process
1 Refer to Chapter 4 Section 4.1 for further details regarding the BP CVP
Screening and ScopingType/level of assessment to be conducted
Initial appraisal of likely key issuesTargeted stakeholder engagement
Project AlternativesAnalysis of viable
alternatives to base case design
Existing ConditionsBaseline environmental
and socio-economic conditions
Appraise and
Select
Base Case DesignGather and review design information
Impact Assessment Determine activity event
magnitudesDetermine receptor sensitivities
Identify existing controls and base case mitigation
Determine impact significance
Transboundary and Cumulative Impacts
Assessment of transboundary and cumulative Impacts
Residual Impacts Undertake residual impact assessment and determine any additional mitigation
measures required
Disclosure and ConsultationCommunicate draft findings and recommendations to stakeholders for comment
Finalise ESIA and submit for approval to authorities
Monitoring and MitigationDevelopment of management plans and procedures as part of AzSPU HSSE
Management System
Define
Execute
Construct and
Operate
BP CVP Process
Environmental and Socio-Economic InteractionsDetermine project activities – receptor interactions

AIOC Chirag Oil Project Environmental & Socio-Economic Impact Assessment
Chapter 3: Impact Assessment Methodology
February 2010 3/3Final
3.2.1 Screening
Screening is the first step in the ESIA process. It confirms the need (or otherwise) for an ESIA by appraising the type of project and its associated activities throughout its lifecycle in the context of its biophysical, socio-economic, policy and regulatory environments.
Given the location, scale and planned activities associated with the COP, AIOC and the Ministry of Ecology and Natural Resources (MENR) concluded that the project should be subject to an ESIA, and the ESIA should take account of applicable national and international legislation, AIOC PSA and BP standards as detailed in Chapter 2: Policy, Regulatory and Administrative Framework.
3.2.2 Scoping
Scoping is a high level assessment of anticipated “interactions” between project activities and environment ‘receptors’. Its purpose is to focus the ESIA on key issues and eliminate certain activities from the full impact assessment process based on their limited potential to result in discernable impacts. To arrive at a conclusion to “scope out” an activity/event, a mixture of expert scientific judgement based on prior experience of similar activities and events and, in some instances, scoping level quantification/numerical analysis (e.g. emission and discharge inventories and generic modelling) is used.
The scope of the COP ESIA has been determined, in part, from the experience gained during construction and operation of previous ACG phases (i.e. Phases 1, 2, and 3), in relation to both routine and non-routine activities (e.g. discharges during start up, maintenance and process upset conditions). Non-routine activities were not fully captured in the ESIA for these earlier developments (see Section 3.2.2.1). In addition, stakeholders’ concerns that were raised during the construction and operation of these prior ACG projects have been highlighted for consideration in the COP ESIA. COP ESIA Scoping consultation has included:
Liaison with the Onshore and Offshore Azerbaijan Strategic Performance Unit (AzSPU) Operations Teams and contractors associated with the construction phase of the ACG Phase 1, 2 and 3 projects;
Review of existing environmental and socio-economic data and reports relevant to the COP;
Liaison with the COP Design Team to gather design data and to formulate an understanding of the COP and its integration with existing operational ACG assets; and
Consultation with external stakeholders including the local community, academics, the MENR and Non Governmental Organisations (NGO).
Based on the findings and results of these reviews, investigations and consultations, the COP ESIA Team identified:
Potential project related environmental and socio-economic impacts based on likely interactions between COP project activities (as known during the BP CVP Select design stage) and environmental receptors; and
Gaps where the extent, depth and/or quality of environmental, socio-economic and/or technical data is insufficient for the COP ESIA process, thus identifying additional work to complete the ESIA.
3.2.2.1 Lessons Learnt From Previous ACG Project ESIA
As part of the COP ESIA scoping phase, key issues and lessons learned during the production and following the approval of previous ACG Project ESIAs as well as during the subsequent construction, installation, commissioning and operation of ACG Project facilities were identified. Table 3.1 provides a summary and details how the lessons have been implemented for the COP.

AIOC Chirag Oil Project Environmental & Socio-Economic Impact Assessment
Chapter 3: Impact Assessment Methodology
February 2010 3/4Final
Table 3.1 Summary of Lessons Learnt in Relation to Previous ACG Project Phases and Related ESIA
Aspect Issue Lesson Implementation Not all emissions and discharges were fully captured in previous project phase ESIAs – in particular those relating to onshore and offshore commissioning
A comprehensive review of all discharges, based on previous project experience, has been carried out for the COP ESIA to ensure that they are properly identified, quantified, assessed and mitigated. Regular reviews with the design team has been undertaken to ensure that there are no gaps.
Design changes during late ESIA phase and construction phase not all fully registered and tracked
A tracking system to capture all design changes with environmental aspects has been established for the COP, to ensure that the approval status of the final design is unambiguous
ProjectDescription
Ongoing options assessment post ESIA not fully registered and tracked
The COP tracking system will also ensure that any changes to the perceived viability of selected options are captured and that alternatives undergo a timely assessment and consultation process as detailed in the COP ESIA Management of Change Process2.
Optionsassessed
During previous projects, it was not always possible to implement the intended commissioning options, with the consequence that additional discharges had to be negotiated at short notice with the regulators
Whether selected commissioning options do or do not involve discharge, the alternatives should the selected option become unavailable have been thoroughly considered by the COP ESIA, and the potential impacts of the alternatives have been assessed.
Impactassessmentmethodology
Previous ESIAs used a generic, qualitative approach to impact assessment, which did not generate easily-tested predictions of impact
The COP ESIA impact assessment methodology takes a more quantitative approach, based largely on the data accumulated from previous projects, existing operations, and the AzSPU Integrated Environmental Monitoring Programme. In particular, impacts have been assessed with specific reference to the information available on actual receptors (Refer to Sections 3.2.4 and 3.2.5).
Interpretation of ambient environmental monitoring data has in the past been constrained by a lack of detailed information on the composition chemistry of discharges to sea.
In order to enhance understanding and interpretation of impacts, a process of systematic operational discharge monitoring will be initiated for the COP which will be incorporated within the Integrated Environmental Monitoring Programme (IEMP) for existing operations in future years. The IEMP is designed to provide a consistent set of environmental data, including monitoring at platforms (to directly identify impacts) and at a regional level (to quantify natural variability and trends)3.
In respect of COP commissioning discharges, a sampling and analysis assurance programme based on that developed during commissioning of pipelines and injection facilities for the Deep Water Guneshli (ACG Phase 3) platforms will be agreed with the MENR.
Mitigation and Monitoring
Impact assessment and associated mitigation for previous project phases were often based on estimates, in the absence of available verified data (e.g. with respect to water production rates). Experience has shown that these estimates are not always accurate.
During the execution phase, COP will continue to monitor available data from existing operations, to test the ESIA estimates in instances where a change in predicted values could occur, and will revise impact assessment and mitigation measures where necessary as detailed in the COP ESIA Management of Change Process2.
2 Refer to Chapter 5 Section 5.11 3 Refer to Chapter 6 for IEMP details

AIOC Chirag Oil Project Environmental & Socio-Economic Impact Assessment
Chapter 3: Impact Assessment Methodology
February 2010 3/5Final
3.2.3 Project Alternatives and Base Case Design
3.2.3.1 Project Alternatives
The initial step in defining a project is to identify, at a conceptual level, viable alternatives to the project so that a Base Case Design may be realised. Consideration of project alternatives occurs at two levels:
To the development as a whole, including the “no development” option, and Engineering alternatives within the selected project’s concept design definition.
Project alternatives were defined during the early conceptual design (CVP Appraise stage) of the COP and were compared on financial, logistical, technical design, safety, environmental and socio-economic criteria. The alternative that represented the best balance in regards all criteria was taken forward into the front end engineering design stage and subsequent detailed design stage (CVP Select and Define stages).
Chapter 4: Options Assessed presents a summary of the alternative designs considered and engineering options evaluated for the COP.
3.2.3.2 COP Design
The COP ESIA Team worked with the COP Engineering, Construction and Operations Teams to gather and interpret relevant information for the ESIA. This dialogue between the teams identified where additional project design definition, in terms of existing controls and additional mitigation measures, was required in the COP Base Case Design to minimise impacts. Opportunities identified for environmental and socio-economic enhancements were considered by the teams and incorporated into the Base Case Design where appropriate and practicable.
The COP Base Case Design, on which the COP impact assessment is based, is presented in Chapter 5: Project Description.
3.2.4 Existing Conditions
In order to identify potential impact to receptors, an understanding of the existing conditions was established prior to execution of project activities. The COP ESIA Scoping exercise determined that the project will likely result in impacts on the following receptor groups:
Biological/Ecological; and Socio-Economic/Human.
A review of existing onshore and offshore baseline data, covering a period from 1995 to 2007, and including results of ACG monitoring programmes, was undertaken to identify the existing conditions within the COP area. A benthic survey had been conducted at the proposed COP location in 2003, and discussion with MENR led to the agreement to carry out a limited supplementary survey in 20094, with the primary aim of identifying and quantifying any significant changes in the characteristics of the benthic habitat. As the COP scope does not include any Sangachal Terminal construction work and BP has completed numerous environmental surveys and continues to undertake routine monitoring work around the Terminal, additional surveys specific to the COP at Sangachal were not considered necessary.
Chapter 6: Environmental Description and Chapter 7: Socio-Economic Description describe the existing environments based on a review of existing data.
4 Subsequent to the submission of this ESIA

AIOC Chirag Oil Project Environmental & Socio-Economic Impact Assessment
Chapter 3: Impact Assessment Methodology
February 2010 3/6Final
3.2.5 Impact Significance Assessment
An impact, as defined by ISO14001:2004 is:
“Any change to the environment, whether adverse or beneficial, wholly or partially resulting from an organisation’s environmental aspects (activities, products or services)”.
Where project activity – environmental receptor interactions occur, an impact is defined. The ESIA process ranks impacts according to their “significance” determined by considering project activity “event magnitude” and “receptor sensitivity”. Determining event magnitude requires the identification and quantification (as far as practical) of the sources of potential environmental and social effects from routine and non-routine project activities. Determining receptor sensitivity requires an understanding of the biophysical environment.
3.2.5.1 Method for Determining Event Magnitude
Event magnitude is determined based on the following parameters, which are equally weighted and are each assigned a rating of ”1”, ”2”, or ”3”:
Extent / Scale: Events range from those affecting an area of up to 500m from the source (1); to those affecting an area greater than 500m and up to 1km from the source (2); to those affecting an area of greater than 1km from the source (3). Frequency: Events range from those occurring once (1); to those occurring up to 50 times (2); to those occurring more than 50 times or continuously (3). Duration: Events range from those occurring for less than 24 hours (1); to those occurring for more than 24 hours and up to one week (2); to those occurring for periods longer than one week (3). Intensity: Concentration of an emission or discharge with respect to standards of acceptability that include applicable legislation and international guidance, its toxicity or potential for bioaccumulation, and its likely persistence in the environment. Ranges from a low intensity event (1), to a moderate intensity event (2) to a high intensity event (3).
Overall event magnitude is then scored on a spectrum from low (1) to high (12) by adding the individual parameter scores:
Resulting individual ratings are summed to give the overall event magnitude ranking. Table 3.2 presents the score ranges for magnitude rankings of ”Low”, ”Medium” and ”High”.
Table 3.2 Event Magnitude Rankings
Event Magnitude Score (Summed Parameter Rankings) Low 4
Medium 5-8High 9-12

AIOC Chirag Oil Project Environmental & Socio-Economic Impact Assessment
Chapter 3: Impact Assessment Methodology
February 2010 3/7Final
3.2.5.2 Method for Determining Receptor Sensitivity
Receptor sensitivity is determined based on the following parameters, which are equally weighted and are each assigned a rating of ”1”, ”2”, or ”3”:
Biological/Ecological Receptors:
Resilience (to the identified stressor): Ranges from species or community unaffected or marginally affected (1); to probability of species undergoing moderate but sustainable change which stabilises under constant presence of impact source, with ecological functionality maintained (2); to probability for substantial loss of ecological functionality (e.g. loss of species in key groups, substantially lower abundance and diversity) (3). Presence: Routine, regular or reliably predictable presence of any species which is, in reverse order, a unique, threatened or protected species (3), to regionally rare or largely confined to COP area or sensitive to industry emissions /disturbances (2); to a species which is none of the above and is therefore assessed at the community level only (1).
Human Receptor:
Presence: Ranges from people being uncommon in the geographical area of anticipated impact (1); to people being present some of the time (e.g. commercial property) (2); to people being permanently present (e.g. residential property) in the geographical area of anticipated impact (3). Resilience (to the identified stressor): Ranges from people being least vulnerable to change or disturbance (i.e. ambient conditions (air quality, noise) are well below applicable legislation and international guidance) (1); to quite vulnerable to change or disturbance (i.e. ambient conditions (air quality, noise) are below adopted standards) (2); to the most vulnerable groups (i.e. ambient conditions (air quality, noise) are at or above adopted standards) (3).
Overall receptor sensitivity is then scored on a spectrum from low (1) to high (6) by adding the individual parameter scores:
Table 3.3 presents the score ranges for sensitivity rankings of ”Low”, ”Medium” and ”High”’.
Table 3.3 Biological/Ecological and Human Receptor Sensitivity Rankings
Receptor Sensitivity Score (Summed Parameter Rankings) Low 2
Medium 3-4High 5-6
3.2.5.3 Method for Determining Impact Significance
Impact significance, as a function of event magnitude and receptor sensitivity is subsequently ranked as “Negligible”, “Minor”, “Moderate” or “Major” as presented in Table 3.4 below.

AIOC Chirag Oil Project Environmental & Socio-Economic Impact Assessment
Chapter 3: Impact Assessment Methodology
February 2010 3/8Final
Table 3.4 Impact Significance
Receptor Sensitivity Low Medium High
Negligible Minor Moderate
Minor Moderate Major
Moderate Major Major
Any impact classified as “major” is considered to be significant and where the impact is negative, requires additional mitigation. Impacts of negligible, minor or moderate significance are considered as being mitigated as far as practicable and necessary, and therefore, do not warrant further mitigation5.
3.3 Transboundary and Cumulative Impacts
Transboundary impacts are impacts that occur outside the jurisdictional borders of a project’s host country. Potential COP transboundary impacts are considered to include:
Social and economic issues surrounding the sourcing of labour, goods and services from the international market;
GHG emissions to air; and Discharges to the marine environment.
Cumulative impacts arise from:
Interactions between separate project-related residual impacts; and Interactions between project-related residual impacts in combination with impacts from
other projects and their associated activities.
These can be either additive or synergistic effects, which result in a larger (in terms of extent or duration) or different (dependant on impact interaction) impacts when compared to project-related residual impacts alone.
At the time of writing there were no reasonably foreseeable new projects proposed in the ACG Contract Area and no new projects at or in the vicinity of the Sangachal Terminal which are sufficiently defined and for which there is sufficient data available for a quantitative impact assessment to be undertaken.
For the COP ESIA, potential cumulative impacts are therefore considered to include:
Physical presence of multiple ACG offshore installations; Cumulative discharges from the COP and other ACG offshore installations; and Cumulative emissions from COP activities and from other ACG facilities.
5 The methodology described in this chapter is focused on the evaluation of potentially significant negative impacts. Assessment of positive impacts resulting from the COP, primarily associated with employment and economic benefits, along with relevant enhancement measures is presented in Chapter 12 of this ESIA.

AIOC Chirag Oil Project Environmental & Socio-Economic Impact Assessment
Chapter 3: Impact Assessment Methodology
February 2010 3/9Final
3.4 Mitigation and Monitoring
The iterative and integrated nature of the ESIA and project design processes means that the majority of proposed additional mitigation measures and strategies have been incorporated into the Base Case Design. These measures / strategies have included mitigation measures and ongoing commitments as previously adopted by other ACG projects and which are of relevance to the COP. These include monitoring and reporting commitments, for, for example, emissions and discharges, as well as policies and procedures that form part of the AzSPU Environmental Management System.

AIOC Chirag Oil Project Environmental & Socio-Economic Impact Assessment
Chapter 4: Options Assessed
February 2010 4/1 Final
4 Options Assessed
Contents
4.1 Introduction ...................................................................................................................... 24.2 Appraise Stage ................................................................................................................ 3
4.2.1 Reservoir Resource ............................................................................................... 44.2.2 Bathymetry and Hazard Mapping .......................................................................... 44.2.3 Extended Reach Wells........................................................................................... 54.2.4 Location Selection and Environmental Issues ....................................................... 64.2.5 Well Drilling Options............................................................................................... 64.2.6 Platform Design Options ........................................................................................ 7
4.3 Select Stage..................................................................................................................... 74.3.1 Select Stage Platform Design Options................................................................... 74.3.2 Lessons Learnt and Previous ACG Options Appraisal ........................................ 10
4.4 Define Stage .................................................................................................................. 15
List of Figures
Figure 4.1 BP Capital Value Process 3 Figure 4.2 Installation Risk Mapping Across the ACG Contract Area 5 Figure 4.3 Platform Option Locations and Drilling Radii from Each Location Option 6 Figure 4.4 Cumulative Reduction in CO2 Emissions for the All-Electric Drive Single Platform Concept versus GT Direct Drives for Export Gas Compression 9
List of Tables
Table 4.1 Oil Recovery for West Chirag and North/South Azeri Options 4 Table 4.2 Options Considered to Reduce Chemical Use During Pipeline Commissioning 14

AIOC Chirag Oil Project Environmental & Socio-Economic Impact Assessment
Chapter 4: Options Assessed
February 2010 4/2 Final
4.1 Introduction
The objective of the Chirag Oil Project (COP) is to increase the oil production and recovery from the Azeri-Chirag-Gunashli (ACG) Contract Area. It is expected that approximately 5.4 billion standard barrels of oil (Bstb) can be recovered during the life of the Production Sharing Agreement (PSA) (up to the year 2024) from the Pereriv and Balakhany reservoirs within the ACG Contract Area.
The scope of the COP includes:
Fabrication, assembly and installation of offshore facilities; Drilling wells to target the Pereriv and Balakhany reservoirs; Tie-ins to the existing offshore marine pipeline infrastructure; and Transport of hydrocarbon products to the existing onshore Sangachal Terminal.
Offshore export pipelines and receiving/processing systems at Sangachal Terminal are expected to have sufficient levels of unutilised oil, gas and produced water handling capacity in 2013 when the COP offshore facilities are commissioned. There has, therefore, not been a requirement to consider additional subsea export pipelines or expansion at Sangachal Terminal at any stage of the COP option selection process.
ACG Phases 1, 2 and 3 were built using a successful standardised design principle, incorporating environmental improvements to reduce emissions and discharges to the environment and utilising in-country construction facilities wherever possible. The starting point for the COP offshore facilities was, therefore, to follow this approach where feasible but incorporating key learnings from the existing platforms to improve design, where appropriate.
Options assessed for the COP have focused on:
The selection of a suitable location within the ACG Contract Area for the offshore facilities to exploit the Pereriv and Balakhany reservoirs;
Platform design and the extent of integration with existing ACG offshore facilities; Efficiency and performance improvements offered by technology alternatives; and Maximising in-country fabrication of offshore facilities.
Those design options previously considered throughout the development of the ACG Phase 1, 2 and 3 Projects have also been assessed.
The option of not developing the COP offshore facilities has also been recognised and considered. A decision not to proceed would, however, result in a reduction of potential oil revenues to the Azerbaijan government with a resultant inability to deliver the associated benefits to the Azerbaijan economy. Pursuing the COP will result in employment creation for national citizens during both the construction phase and operational phase of the development as well as increased use of local facilities, infrastructure and suppliers. The option of not proceeding was therefore disregarded when considered against these socio-economic benefits1.
The development of the COP design has been undertaken within BP’s Capital Value Process (CVP). The CVP consists of a number of decision stage gates that all major project development decisions must pass through. The CVP approach ensures consistency across all major projects within BP’s portfolio. Figure 4.1 illustrates the CVP.
1 Chapter 12: Socio Economic Impact Assessment presents the expected socio-economic impacts of the project in full.

AIOC Chirag Oil Project Environmental & Socio-Economic Impact Assessment
Chapter 4: Options Assessed
February 2010 4/3 Final
Figure 4.1 BP Capital Value Process
As Figure 4.1 demonstrates, conceptual design options are analysed in terms of their feasibility during the Appraise stage of the CVP. Recommended design options then pass onto the Select stage during which the preferred option for development is further studied and selected. During the Define stage, the scope of the preferred option is more fully defined and final design decisions are made.
Throughout the CVP to date, environmental evaluation of the project options has been undertaken alongside technical and economic evaluation and consultation with stakeholders including SOCAR and AIOC partners2. Initial environmental evaluation undertaken during Appraise involves project screening to determine likely potential impacts and the requirement for / scope of an ESIA based on early project concepts. Chapter 3: Impact Assessment Methodology describes the process and the outcome of the COP screening process in full3.
The following sub-sections present a summary of the main decisions made during the Appraise and Select stages of the CVP. The End of Select COP Base Case Design is described in detail in Chapter 5: Project Description of this ESIA.
4.2 Appraise Stage
Aside from commercial and business strategy issues, identification of a suitable location for the COP offshore development was the key issue considered during Appraise. The following were taken into account:
Available reservoir resources across the ACG Contract Area; Bathymetry, seabed and subsea geotechnical characteristics including location of geo-
hazards (e.g. mud volcanoes and shallow gas); and Drilling radii and the potential to reduce the requirement for Extended Reach (ERD)
Wells.
2 Chapter 8: Consultation and Disclosure provides details of the consultation undertaken and proposed specifically with regard to the COP ESIA 3 Chapter 3 Figure 3.1 illustrates how COP ESIA process was integrated into the CVP
Appraise: Determine project feasibility & alignment with business strategy;
Understand project drivers; and
Identify viable opportunities to pursue.
COP: Jan 07 to Sept 07
Select:Perform technical definition and evaluation of prioritised project options;
Develop initial cost and schedule estimates for the options;
Compare options by focusing on uncertainties, risks, flexibility and associated economic criteria;
Recommendpreferred option and further develop technical definition, cost schedule and production estimates.
COP: Oct 07 to Oct 08
Define:Develop the selected option to an appropriate level of detailed technical definition and planning required to freeze the scope of the project; and
Confirm cost, schedule and production estimates.
Execute:Produce an operating asset consistent with scope, cost and schedule, including;
Detailed engineering;
Procurement;
Follow-on engineering;
Site support; and
Projectmanagementservices.
Operate:Evaluate asset to ensure performance is to specification including;
Feedback of facilities availability; and
Production performance.
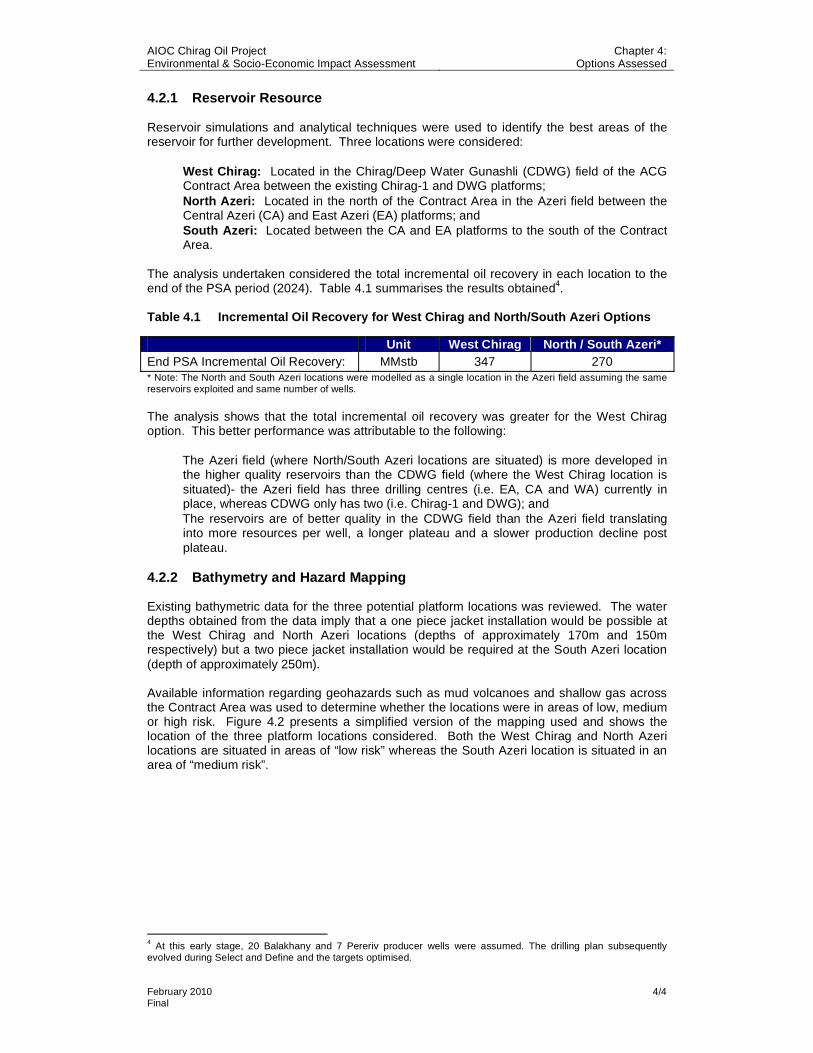
AIOC Chirag Oil Project Environmental & Socio-Economic Impact Assessment
Chapter 4: Options Assessed
February 2010 4/4 Final
4.2.1 Reservoir Resource
Reservoir simulations and analytical techniques were used to identify the best areas of the reservoir for further development. Three locations were considered:
West Chirag: Located in the Chirag/Deep Water Gunashli (CDWG) field of the ACG Contract Area between the existing Chirag-1 and DWG platforms; North Azeri: Located in the north of the Contract Area in the Azeri field between the Central Azeri (CA) and East Azeri (EA) platforms; and South Azeri: Located between the CA and EA platforms to the south of the Contract Area.
The analysis undertaken considered the total incremental oil recovery in each location to the end of the PSA period (2024). Table 4.1 summarises the results obtained4.
Table 4.1 Incremental Oil Recovery for West Chirag and North/South Azeri Options
Unit West Chirag North / South Azeri* End PSA Incremental Oil Recovery: MMstb 347 270 * Note: The North and South Azeri locations were modelled as a single location in the Azeri field assuming the same reservoirs exploited and same number of wells.
The analysis shows that the total incremental oil recovery was greater for the West Chirag option. This better performance was attributable to the following:
The Azeri field (where North/South Azeri locations are situated) is more developed in the higher quality reservoirs than the CDWG field (where the West Chirag location is situated)- the Azeri field has three drilling centres (i.e. EA, CA and WA) currently in place, whereas CDWG only has two (i.e. Chirag-1 and DWG); and
The reservoirs are of better quality in the CDWG field than the Azeri field translating into more resources per well, a longer plateau and a slower production decline post plateau.
4.2.2 Bathymetry and Hazard Mapping
Existing bathymetric data for the three potential platform locations was reviewed. The water depths obtained from the data imply that a one piece jacket installation would be possible at the West Chirag and North Azeri locations (depths of approximately 170m and 150m respectively) but a two piece jacket installation would be required at the South Azeri location (depth of approximately 250m).
Available information regarding geohazards such as mud volcanoes and shallow gas across the Contract Area was used to determine whether the locations were in areas of low, medium or high risk. Figure 4.2 presents a simplified version of the mapping used and shows the location of the three platform locations considered. Both the West Chirag and North Azeri locations are situated in areas of “low risk” whereas the South Azeri location is situated in an area of “medium risk”.
4 At this early stage, 20 Balakhany and 7 Pereriv producer wells were assumed. The drilling plan subsequently evolved during Select and Define and the targets optimised.
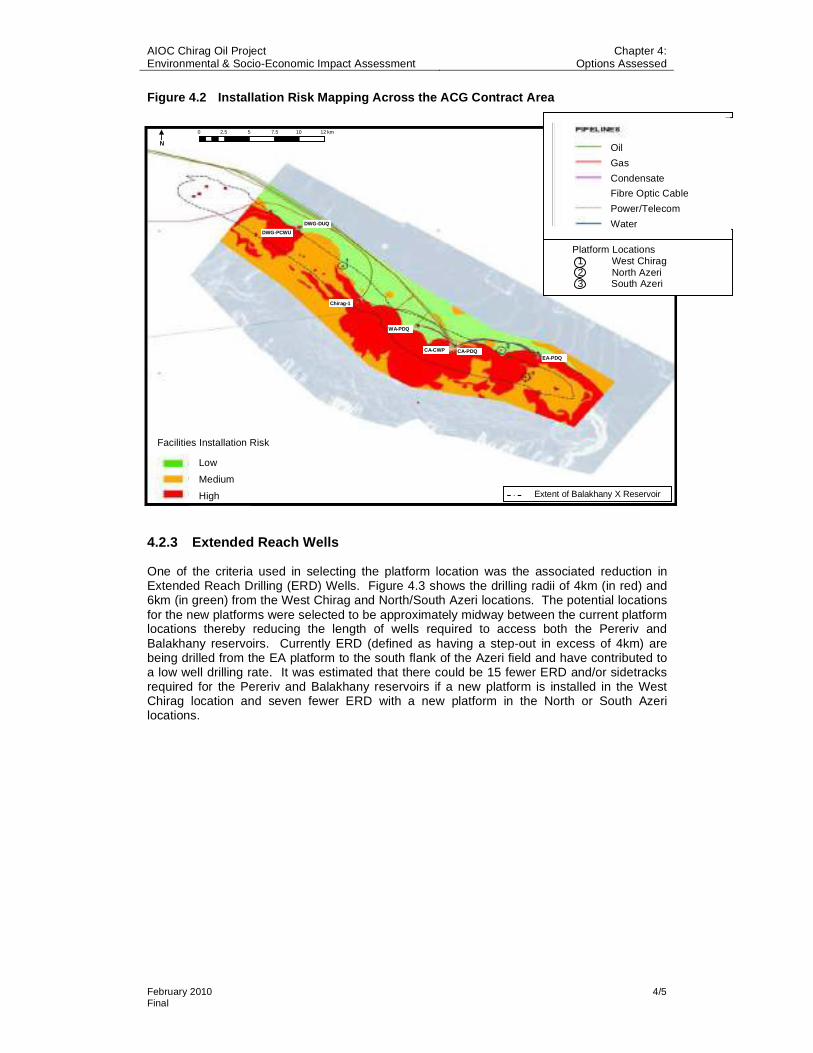
AIOC Chirag Oil Project Environmental & Socio-Economic Impact Assessment
Chapter 4: Options Assessed
February 2010 4/5 Final
Low
Medium
High
Facilities Installation Risk
Platform Locations 1 West Chirag 2 North Azeri 3 South Azeri
Oil
Gas
Condensate
Fibre Optic Cable
Power/Telecom
WaterDWG-PCWU
DWG-DUQ
Chirag-1
WA-PDQ
CA-CWP CA-PDQEA-PDQ
Extent of Balakhany X Reservoir
0 2.5 5 7.5 10 12 km
N
Figure 4.2 Installation Risk Mapping Across the ACG Contract Area
4.2.3 Extended Reach Wells
One of the criteria used in selecting the platform location was the associated reduction in Extended Reach Drilling (ERD) Wells. Figure 4.3 shows the drilling radii of 4km (in red) and 6km (in green) from the West Chirag and North/South Azeri locations. The potential locations for the new platforms were selected to be approximately midway between the current platform locations thereby reducing the length of wells required to access both the Pereriv and Balakhany reservoirs. Currently ERD (defined as having a step-out in excess of 4km) are being drilled from the EA platform to the south flank of the Azeri field and have contributed to a low well drilling rate. It was estimated that there could be 15 fewer ERD and/or sidetracks required for the Pereriv and Balakhany reservoirs if a new platform is installed in the West Chirag location and seven fewer ERD with a new platform in the North or South Azeri locations.

AIOC Chirag Oil Project Environmental & Socio-Economic Impact Assessment
Chapter 4: Options Assessed
February 2010 4/6 Final
Figure 4.3 Platform Option Locations and Drilling Radii from Each Location Option
4.2.4 Location Selection and Environmental Issues
Based on the reservoir resources, water depth and hazard mapping and the potential reduction available in ERD wells, West Chirag was identified as the optimal COP location5.The potential environmental benefits of this location include:
Reduction in materials required for jacket construction (as compared to South Azeri location where a two stage jacket would be required) and associated reduction in potential construction waste, emissions and discharges;
Reduction in the quantity of cuttings generated due to a reduction in ERD wells that generate more cuttings; and
Lower risk of accidental events, spills and discharges associated with geohazards as compared to South Azeri location.
4.2.5 Well Drilling Options
The number of wells drilled per year is a critical project driver from a schedule and economic feasibility perspective. The principle of predrilling a number of wells, as adopted for the previous ACG Phases, was incorporated in the COP Base Case during the Appraise stage. If predrilling were not to be performed the duration required for production ramp-up would be dramatically increased, resulting in a large reduction in the economic reasons for executing the project. If this were the case it is likely that the project would not proceed and the benefits associated with the project for all of the stakeholders would be lost. The number of predrill wells to ensure economic feasibility was determined with reference to the optimal project drilling and completion rate6.
5 Further analysis was undertaken during Select based on existing bathymetric and shallow seismic data from earlier studies and a completed seabed survey conducted during June / July 2008 to confirm the precise location for the offshore facilities. 6 Refer to Section 4.3.2.3 for predrill/platform drilling discharge options assessed.

AIOC Chirag Oil Project Environmental & Socio-Economic Impact Assessment
Chapter 4: Options Assessed
February 2010 4/7 Final
4.2.6 Platform Design Options
During Appraise, it was determined that the new offshore production facilities would comprise either a single platform or twin, bridge linked platforms to provide:
Living quarters; Drilling rig; 48 well slots for production, water injection and cuttings reinjection wells; Oil production and separation systems; Oil pumping facilities for exporting oil to Sangachal Terminal via tie-ins to the existing
30” marine pipelines; Gas dehydration unit; Produced water treatment system suitable for treating produced water for downhole
disposal / reservoir waterflood; and Utility and ancillary systems necessary to support the safe operation of the production
facility.
In addition, the following would either need to be accommodated on the new platform(s) or provided through integration with another ACG facility or facilities:
Gas compression system exporting associated gas to Sangachal Terminal via a tie-in to the existing 28” marine pipeline;
Water injection system utilising treated produced water and treated seawater; and Power generation to provide electrical power for the total platform(s) demand.
In keeping with the ACG standardisation principle, design case types were identified based on single and twin platform configurations analogous to the existing EA and DWG platforms respectively, centred at the West Chirag location. The case types considered were:
Case 1: Single platform integrated with existing ACG offshore facilities (e.g. for provision of injection water, export gas compression); and Case 2: Twin platforms with ACG integration limited to subsea export pipeline tie-ins.
These case types were carried forward to the Select stage for more detailed analysis.
4.3 Select Stage
During Select, options assessment focused on the following:
The number of COP platforms, extent of integration with existing ACG facilities and efficiency and performance improvements associated with alternatives to ACG standardised technology; and
The extent of fabrication and assembly works that could be undertaken at the existing in-country construction yards.
4.3.1 Select Stage Platform Design Options
4.3.1.1 Stand Alone and Fully Integrated Platform Concepts
At the end of the Appraise stage, the principle platform design concepts taken into Select were:
Stand alone twin platform concept (analogous to DWG facilities): Based on two bridge-linked platforms, identical to the Drilling, Utilities and
Quarters (DUQ) and Production, Compression, Water injection and Utilities (PCWU) platforms. This concept would provide all of its own processing capacity, including injection water, produced water handling, gas export utilities

AIOC Chirag Oil Project Environmental & Socio-Economic Impact Assessment
Chapter 4: Options Assessed
February 2010 4/8 Final
and power generation. Oil and gas would be exported via tie-ins to the existing marine export oil and gas pipelines to Sangachal Terminal.
Fully integrated single platform concept (analogous to EA facility): Based on a single Production, Drilling and Quarters (PDQ) platform, with
produced gas sent for processing on DWG-PCWU. This concept would require an additional export gas compressor to be installed on DWG-PCWU platform. The new platform would also be integrated with DWG-PCWU for handling of produced water and provision of water injection services. The option of integrating the power generation and distribution facilities with those on DWG-PCWU was also considered.
A Preliminary Environmental Impact Identification (ENVIID) was conducted during the Select stage to determine whether these design concepts could be differentiated in terms of their potential environmental benefits. Issues considered included:
Power Generation: Potential for efficiencies with an integrated single platform; Energy Efficiency: Considering life of field energy requirements; Construction: Significant reduction in material use, construction waste and construction emissions for a single platform; Energy Usage: Reduction in energy used for transportation, installation, hook up and commissioning of a single platform; Produced Water: Potential reduction in produced water discharged (particularly during start up) with a single integrated platform assuming existing ullage on DWG-PCWU is used; and Pigging Discharges: Increased pigging discharges associated with a single platform as produced water / injection water pipelines required for integration with DWG-PCWU, would need to be pigged periodically.
4.3.1.2 Partially Integrated Single Platform Concept
A variation to the fully integrated single platform concept was also considered, which consisted of a single platform with its own gas turbine driven gas export compression facility but with water injection support from DWG-PCWU. The advantages of this partially integrated design were:
Gas could be directly exported to Sangachal Terminal via the existing 28” marine gas export pipeline thereby avoiding the need for gas tie-ins to DWG-PCWU;
Independent power generator and hence no dependency on another installation for power, improving reliability and reducing down time;
A water injection system will not be required on the platform, saving weight, space and additional power generation capacity as well as making use of available capacity in the water injection system on DWG-PCWU; and
Construction and installation of the single platform will use significantly less raw materials, generate less waste, emissions and discharges than a twin platform concept.
An energy efficiency study was undertaken during Select, considering total energy use as a percentage of the total energy associated with the exported products. This study assessed the fully and partially integrated single platform options. The results demonstrated very little difference between the two options; cumulative energy efficiencies of 1.52%7 (fully integrated concept) and 1.60% (partially integrated concept) were calculated.
The main disadvantage of the partially integrated single platform option was the weight of the topside. Assuming power generation and gas compression systems analogous to those across the existing ACG facilities, the topsides would be heavier than any other ACG design to date and too heavy to be installed in one operation with the existing transportation barge. Up to two modules would be required to be lifted and installed onto the topside offshore, increasing the project hook up and commissioning duration and the risks associated with
7 Energy Efficiency was calculated as the proportion of energy consumed expressed as a percentage of the total energy exported by the platform.

AIOC Chirag Oil Project Environmental & Socio-Economic Impact Assessment
Chapter 4: Options Assessed
February 2010 4/9 Final
transportation and installation. The additional weight of the topside would also require a larger jacket, increasing material use, construction emissions discharges and waste and increasing the construction schedule.
The energy efficiency study considered an alternative to the partially integrated platform concept whereby the gas turbine direct drives for gas export compression were replaced with electric motor drives and the onboard main power generation capacity was increased. The benefits of this all-electric concept are:
Improved topsides weight distribution (centre of gravity) such that, following upgrade, the existing transportation barge can be used to install the topside in one operation eliminating the need for offshore modular lifts;
The electric motors, which are proven technology, are easier and quicker to start than gas turbine direct drives and require less maintenance - the increased availability has the effect of significantly reducing expected non-routine flaring due to process upsets and maintenance. Calculations demonstrated that the all-electric drive partially integrated single platform concept has the potential to reduce flaring across the PSA period by up to 40% compared to the gas turbine direct drive equivalent;
Better matching of compressor load requirements over the life of the PSA resulting in improved energy efficiency); and
Increased reliability also implies reduction in safety risk and potential for accidental events.
The reduction in annual CO2 emissions achieved by the all-electric drive concept compared to stand alone gas turbine direct drives for the export gas compressors is shown in Figure 4.4. The difference in CO2 savings between the two options in 2023 and 2024 is due to the reduced gas export in this period, resulting in one less compressor required for gas export for both options. This results in a more significant drop in emissions for the standard design (gas turbine drivers) configuration as one less gas turbine is running. Although the relative CO2
savings between the standard design and the alternative concept (electric deck) reduce in 2023 and 2024 the alternative concept option still results in lower overall emissions during these two years of reduced production.
Figure 4.4 Cumulative Reduction in CO2 Emissions for the All-Electric Drive Single Platform Concept versus GT Direct Drives for Export Gas Compression
Year 0
50,000
100,000
150,000
200,000
250,000
2013 2014 2015 2016 2017 2018 2019 2020 2021 2022 2023 2024
Year

AIOC Chirag Oil Project Environmental & Socio-Economic Impact Assessment
Chapter 4: Options Assessed
February 2010 4/10 Final
At the end of Select the all-electric partially integrated single platform option, denoted the West Chirag Production, Drilling and Quarters (WC-PDQ) platform, was adopted as the COP Base Case for subsequent development in Define.
4.3.2 Lessons Learnt and Previous ACG Options Appraisal
During previous phases of ACG a significant amount of work was undertaken to assess the viability of options that would reduce emissions to air/water and improve the energy efficiency or overall environmental performance of the facilities.
Some options were discounted based on space, weight, technological challenges or adverse economics. Similarly, some options were shown to improve environmental performance whilst fulfilling the weight and space restrictions of the offshore environment. A summary of the lessons learnt from previous phases is provided within the sections below.
4.3.2.1 Discounted Options
The COP was able to use research from earlier phases to ensure options that were previously discounted for technological, economic or practicality reasons were not considered in the design. A review of previously considered options was undertaken during the early stages of the project to reassess viability and to confirm that such options were still not viable.
The reader is referred to the Phase II ESIA for a full description of options and the advantages/disadvantages of each, however, a summary is provided below detailing previous considerations and why they were found to not be viable.
Discounted Options for Reducing or Eliminating Emissions from Combustion
CO2 Recovery & Sequestration. The principle would be to capture the CO2 emissions from combustion sources (gas turbines primarily) and dispose to sub-surface. This was not adopted due to weight of the equipment required to capture and dispose of the CO2,safety aspects, technological novelty and adverse economics.
Solar Thermal and Solar Photovoltaic Power Generation. The use of solar thermal or solar photovoltaic technology could help to reduce combustion emissions by supplementing the energy requirements of the topsides. This option is technically impractical and would not be able to make a significant contribution to the energy requirement of the topsides without the presence of impractically large solar collection areas. Additionally, this option was not found to be economically viable.
Wind Power Generation. Wind power could help to reduce the combustion emissions by supplementing energy requirements for the topsides. This option was found to have limited application offshore, represent a safety risk (due to rotating blades) and exhibit adverse economics.
Wave Power. Wave driven power generators could help to reduce combustion emissions on the topsides. However, the Caspian Sea is a low wave energy environment and therefore this option was not considered practical.
Centralised Onshore Power Generation. This option would consist of a centralised power generation scheme onshore (Sangachal) and subsequent transmission via sub-sea cable network to the offshore platforms. This option would not eliminate the production of combustion emissions but would help to reduce such emissions through increased efficiency of power generation. However, calculations for previous phases demonstrated the CO2 saving to be only marginal. This option was not adopted in previous phases due to size and weight concerns as high voltage DC/AC converter modules would be required on the offshore platforms. Additionally, this option suffered from unfavourable economics.
Combined Heat & Power Offshore and Combined Cycled Power Generation Offshore. There is no significant requirement for heating on the offshore platforms, as

AIOC Chirag Oil Project Environmental & Socio-Economic Impact Assessment
Chapter 4: Options Assessed
February 2010 4/11 Final
such, this option was not considered further in previous phases. The same limitation applies to the WC-PDQ topside and therefore was not considered a viable option.
Low NOx Gas Turbine Offshore. In previous phases, dry low NOx turbine technology was considered for the offshore platforms. Such technology can achieve around a 90% reduction of NOX emissions. The technology was rejected previously due to the requirement of dual fuel machines offshore (dual fuel turbines are required to enable power generation using diesel fuel when fuel gas is not available) for which low NOX was not available, and general operating problems that can occur such as ‘flame-out’ and the general robustness of the technology. The issue was re-visited for COP to identify whether such technology had improved, particularly in terms of reliability, and to identify whether there could be advantages in employing such technology. To this end, a review of current low NOX technology and operational feedback and predictive modelling undertaken to identify whether normal combustion emissions from gas turbines on the WC-PDQ platform could have an adverse environmental impact. The decision was made that low NOX technology should not be employed for the WC-PDQ topside for the following reasons:
There is a need for a dual fuel (gas and diesel) capability for the WC-PDQ turbines and there are currently no low NOX burners available on the market for dual fuel turbines (Rolls Royce have recently withdrawn this option).
Low NOX burners respond poorly to changes in fuel gas composition (trip) which can occur more frequently offshore.
Low NOX burners respond poorly to sudden changes in load (trip) which also occurs more frequently offshore.
Low NOX burner turbines produce more emissions than normal turbines when under low loads which will occur offshore during early years.
The main reason for low NOX burners being installed on turbines is to protect the health of local populations who are living nearby. High NOX levels can cause breathing difficulties and long term health effects. The WC-PDQ platform is not positioned in the vicinity of any local populations and the air dispersion modelling study undertaken demonstrated that even without low NOX burners there are no concerns regarding harmful NOX levels, or concentrations above regulatory limits either offshore or onshore.
Offshore fuel gas H2S removal using either zinc oxide absorption or by amine sweetening and sulphur recovery. Air dispersion modelling studies demonstrated that the concentration of SO2 in emissions had little impact on air quality around the greater Baku area and therefore there is no requirement for the removal of H2S in fuel gas. In addition H2S or SO2 removal has been shown in previous phases to be either expensive or consist of large heavy plant (depending on the technology used for removal) meaning that it was not practicable for application in the offshore environment.
Flaring
Offshore Flare Gas Recovery. Flare gas recovery systems enable the recovery of hydrocarbon vapours from the flare system and their return to the upstream process during normal purging and low flow conditions. In the absence of fuel gas, purge gas would need to be inert gas. This would increase the size and weight of equipment on the topsides, both for generating inert gas and for compressing recovered hydrocarbon vapours back into the process. The size and weight issues have resulted in flare gas recovery options offshore being discounted in previous phases. The same reasons for discounting this technology are applicable to the WC-PDQ topside.
Non-Continuously Lit Pilot Ignition Systems. A non-continuously lit pilot would eliminate the requirement for continuously lit flare tips, thereby reducing emissions. The systems evaluated previously were not considered viable due to reliability issues associated with electronic ignition of the flare, or due to adverse economics.

AIOC Chirag Oil Project Environmental & Socio-Economic Impact Assessment
Chapter 4: Options Assessed
February 2010 4/12 Final
Discharges to Sea
Air Cooling. Previous projects had considered the possibility of cooling the platform using air in order to eliminate or reduce the need to abstract (and discharge) seawater. However this was deemed to be impossible to implement due to the combination of cooling demand, limited availability and restrictions on weight allowance. As such, the most efficient method of cooling was concluded to be the seawater lift system currently employed on all the offshore platforms.
4.3.2.2 Adopted Options
The environmental options assessment undertaken during previous phases identified a number of features that improved environmental performance of the platforms whilst fulfilling the weight and space restrictions of the offshore environment. Such features were incorporated into previous designs and were included as part of the WC-PDQ platform base case design from early stages of development. A summary of these environmental performance features are as follows.
Emissions to Air
Electric Flash Gas Compression. Two flash gas compression trains (2 x 50% configuration) have been selected as the system configuration for the WC-PDQ topside. This continues the same configuration as used in previous phases. This configuration provides higher availability than a single train to process the full gas inventory and consequently provides a reduction in gas flaring should a compressor suffer downtime.
Flare Gas Metering. Although the rate of gas purge in the flare systems is calculated during design, the valve and metering system allows the volume of purge gas to be proactively controlled, thereby allowing the volume flared to be optimised i.e. the minimum flared while still maintaining safe conditions. A needle valve is in place to throttle flare gas into the flare header. Metering is also provided to measure the amount of gas flared during upset conditions.
Gas Dehydration Off-Gas Disposal via Flaring. This achieves a reduction of greenhouse gas emissions by combusting the methane in off-gas (into carbon dioxide and water), rather than emit non-combusted product into the atmosphere (which has higher greenhouse gas properties than CO2). This design feature was adopted in previous phases and continued in the COP design.
Fugitive Emissions. The project shall achieve a reduction in fugitive emissions by incorporating the following aspects into the design.
o Reduced number of valves, flanges, connections and intrusive instrumentation;
o Use of high efficiency dry gas seals on flash gas and export gas compressors;
o Closed drains for drainage of the hydrocarbon system; and o All process vents piped to flare.
Emissions to Water
Produced Water Disposal – Re-Injection. This is a long term solution for disposal of produced water and minimises discharges into the Caspian Sea. Treated produced water will only be discharged overboard due to a downtime event such as an emergency, accident or mechanical failure (Refer to Chapter 5 Section 5.84)Copper-Chlorine Seawater Anti-fouling System. Typical seawater anti-fouling systems utilise a hypochlorite generator to dose incoming seawater for anti-fouling control. The copper-chlorine system employed during previous phases, and included on the WC-PDQ topside, uses the application of direct current electrolysis to produce copper and chlorine at low concentrations. This results in significantly lower concentrations of chlorine discharged into the Caspian over the lifetime of the project from the seawater system.

AIOC Chirag Oil Project Environmental & Socio-Economic Impact Assessment
Chapter 4: Options Assessed
February 2010 4/13 Final
Ozone Depleting Chemicals
Fire Fighting Systems. No halon fire suppressants will be used in fire fighting systems. As used in previous projects, deluge/water mist and Niagara 3-3 Foam will be the primary methods of fire fighting. Niagara foam is based on natural protein foaming agent and contains no harmful synthetic detergents, glycol ethers, alkyl phenol ethoxylates (APE), totyltriazoles or complexing agents. It is biodegradable and virtually non-toxic to aquatic organisms.
Refrigerants. Refrigeration or HVAC systems on the WC-PDQ will not utilise HCFC and CFC gases.
4.3.2.3 Mud and Cuttings
During the ACG Phase 1 project a Best Practicable Environmental Option (BPEO) assessment was undertaken considering the handling and disposal of water based and non-water based mud and cuttings from drilling operations. The options evaluated for non-water based mud (NWBM) included:
The collection of mud and cuttings and ship to shore for disposal; and Re-injection offshore.
The assessment concluded that the BPEO was that NWBM and cuttings should be re-injected offshore. Cuttings generated prior to the installation of a cuttings re-injection well (e.g. during predrilling programme with a mobile drilling unit) or when the cutting re-injection system is not available should be contained and shipped to shore for treatment and disposal. This approach has been adopted across ACG Phases 1, 2 and 3. No routine discharge of NWBM and cuttings is a requirement of the PSA. It was determined that the cuttings reinjection (CRI) well would be partially drilled during predrilling and completed later by the WC-PDQ platform rig once the latter has commenced operations. The CRI well could be completed by the MODU, however, the MODU vessels available are not equipped with any of the major process and pumping equipment required to allow it to prepare cuttings for re-injection or systems to reinject the cuttings into the CRI well. Therefore NWBM and cuttings will be recovered and shipped to shore during predrilling.
The BPEO assessment of water based mud (WBM) and cuttings considered the following options:
Discharge to sea; Collection of cuttings and ship to shore for treatment and disposal; and Re-injection off shore.
Based on the expected low levels of environmental toxicity of the chemicals in the WBM and the localised impact of solids deposition, which will occur near to the discharge point, it was concluded that WBM and cuttings, which meet the relevant project standards, would be discharged to the marine environment. This approach has been adopted across ACG Phases 1, 2 and 3.
Monitoring of the benthic environment and water column in the vicinity of the existing ACG platforms and across the ACG Contract Area is reported in Chapter 6 of this ESIA. The monitoring demonstrates no appreciable impact to the marine environment associated with discharge of WBM and cuttings. Discharge of WBM and cuttings (in accordance with relevant project standards) to the marine environment has therefore, been incorporated into the COP Base Case Design.

AIOC Chirag Oil Project Environmental & Socio-Economic Impact Assessment
Chapter 4: Options Assessed
February 2010 4/14 Final
4.3.2.4 Pipeline Commissioning Discharges
The process of constructing subsea pipelines involves flooding them with water to facilitate construction and pressure testing. To prevent corrosion, the seawater used to flood the pipelines must be chemically treated to remove oxygen and inhibit the activity of bacteria; a dye is added to the water to provide a method of identifying leakage during pressure testing. On completion of construction and before a pipeline is used for its intended purpose, the treated water must be removed from the pipeline system.
Options to eliminate or reduce the use of chemicals during pipeline commissioning were considered and are summarised in Table 4.2.
Table 4.2 Options Considered to Reduce Chemical Use During Pipeline Commissioning
No. Option Applicability Yes / No Reason for Unsuitability
1 Reduce biocide dosage
No There is uncertainty in the duration that water will be present in the pipelines. The biocide dosage must ensure concentrations are sufficient to control biological growth for between 6 and 24 months.
2 Use no chemical additives and use Intrinsically Clean Water
No This option does not treat the biological systems that will be present in the pipeline prior to flooding and the level of confidence that the pipeline will be protected from corrosion is uncertain.
3 Use air or inert gas for pressure testing
No The risks to personnel and equipment are significantly higher when pressure testing with gas as the amount of energy stored in a pressurised gas, and released, in the event of a failure are far higher.
4 Recycling No Due to the planning constraints, the requirement to minimise disturbance to existing operational facilities and the lack of interconnectivity between the pipelines there are no opportunities to reuse the water from one pipeline and another.
5 Subsurface reinjection No The injection water quality, required to maintain well functionality, excludes this option.
6 Contain and ship to shore
No Due to the space and weight constraints on the existing DWG-PCWU and WC-PDQ platform there is no opportunity to contain these large volumes of treated seawater on production facilities. The storage of the volumes of treated water required for this operation would require an additional vessel. The additional vessel would have to be a `tanker type` vessel as construction and pipelay vessels do not have the levels of tankerage that would be required. Having `tanker type` vessel to collect water from a subsea pipeline would present significant risk and technical challenges, for example tankers do not normally have systems or ROV equipment required to support this type of operation where a hose may be connected to a subsea pipeline.
7 Send to terminal Partially used Sangachal Terminal have indicated that the maximum water slug size received and processed is 1,000m3.Where practical returning commission fluids to the Terminal forms part of the methodologies
The selected option is therefore to use chemically-treated seawater to flood and hydrotest the pipelines and to discharge this water to sea in cases where it cannot be sent to the Terminal (for instance, because of the volume or location of the event)8.
The chemicals added to the hydrotest seawater will comprise a tracer dye, an oxygen scavenger and a biocide. All three chemicals have been extensively used in previous ACG hydrotesting activities and have been:
The subject of extensive field and laboratory studies; and Extensively reviewed and approved by the MENR.
8 Refer to Chapter 5 Section 5.5

AIOC Chirag Oil Project Environmental & Socio-Economic Impact Assessment
Chapter 4: Options Assessed
February 2010 4/15 Final
The tracer dye and oxygen scavenger are of very low toxicity and the previous ACG-MENR evaluation process concluded that they would have no environmental impact. The biocide was selected because it rapidly hydrolyses (both in the pipeline and following discharge) to harmless components. Laboratory and field studies have shown that the toxicity of the biocide is reduced by more than 90% during the expected period it is in a pipeline; this reduction in toxicity, combined with low persistence following discharge, ensures that the environmental effects of discharging hydrotest water to sea are minimised.
4.4 Define Stage
During the Define stage of the CVP, the project scope, cost and schedule will be finalised. The main aspects being considered during Define are:
Power Generation: Review and update of the COP Base Case power demand requirements; Flaring: Review of potential COP flaring expected based on updated reservoir information and flaring across the ACG field to date; Sewage Treatment System: Selection of the preferred sewage treatment system for the WC-PDQ platform. As part of the COP engineering design process a team was established to complete a comprehensive review of sewage treatment technology. The team included an external consultant who specialises in sewage treatment systems and technology. The review considered the problems with the existing ACG platform treatment plants to ensure that any technology selected for the West Chirag PDQ will not have the same compliance, operability and reliability issues. The review included an assessment of the ability to comply with applicable discharge standards, the operability and reliability of the plant, sludge generation and handling, space and weight restrictions and maintenance requirements. From this review a decision was taken to include membrane filtration technology for the treatment of black water on the WC-PDQ platform. The vendor selection process and compliance assurance process is ongoing; Waste Minimisation and reduction: Review of waste minimisation and reduction opportunities will be pursued at three levels:
Design Stage: Reviewing the specification for all material acquisition that generates waste, and assessing the opportunity to reduce waste at source. To date a key focus area has been assessment of options to reduce waste from painting activities. The COP will benefit from work undertaken during the ACG Project, that resulted in the acceptance of low VOC paints, as well reductions in the quantities of paint required for the jacket following a review of the corrosion protection requirements.
A review of COP paint usage included challenging the need to paint the jacket and exposed topside surfaces as well as consideration of alternative corrosion protection coatings. Alternative corrosion protection options that would preclude the use of paint, such as increasing the wall thickness of the steel or installing sufficient sacrificial anodes on the jacket were rejected due to the weight limitations of the installation barge STB1 and safety issues associated with using divers to install sufficient sacrificial anodes once the jacket is installed. Alternative corrosion painting systems were considered, such as thermal aluminium systems, however the application systems are not flexible enough for jacket fabrication.
Opportunities do exist to reduce paint waste during construction by developing good paint shop work practices and reviewing procurement options, these opportunities will be pursued with the construction contractors.
Construction Stage: Use construction contracts to encourage contractors to minimise the generation of waste. The main fabrication and installation contractors will be required to develop waste minimisation plans and key performance indicators that will focus on promoting efficient resource usage and

AIOC Chirag Oil Project Environmental & Socio-Economic Impact Assessment
Chapter 4: Options Assessed
February 2010 4/16 Final
reporting performance against waste minimisation targets. Site based initiatives, to increase the segregation of waste to maximise recycling will be developed including workforce training and awareness schemes, as well as measures to reduce vehicle movements will be developed once the construction contractors have been selected. Service procurement: Local recycling services will be actively sought to maximise the potential for recycling material as close as possible to the point of generation.
Sand Treatment: Consideration of sand treatment packages that will improve performance compared to the existing packages on the operating ACG offshore facilities. Due to sand being wetted with oil and solidifying at low temperatures, current packages perform below expectations, resulting in potential damage to platform process equipment and the increased likelihood of equipment/platform shutdown. To improve performance the project is working with vendors to determine alternative designs using data and samples collected across the ACG field and test rig trials.
Should any of these studies result in a change to the COP Base Case design as assessed within this ESIA, the COP Management of Change Process will be followed as detailed within Chapter 5 Section 5.11.

AIOC Chirag Oil Project Environmental & Socio-Economic Impact Assessment
Chapter 5: Project Description
February 2010 5/1 Final
5. Project Description
Contents
5.1 Introduction........................................................................................................................45.2 COP Schedule...................................................................................................................65.3 Predrilling...........................................................................................................................7
5.3.1 MODU (Predrilled) Well Design............................................................................75.3.2 MODU Drilling Activities .......................................................................................85.3.3 MODU Logistics and Utilities ..............................................................................155.3.4 Predrilling – Emissions, Discharges and Waste.................................................16
5.4 Onshore Construction and Commissioning of Offshore Facilities...................................185.4.1 Introduction.........................................................................................................185.4.2 Upgrade Works and Yard Reactivation ..............................................................185.4.3 Materials Transportation.....................................................................................195.4.4 Jacket and Piles .................................................................................................195.4.5 Drilling Modules ..................................................................................................205.4.6 Topside...............................................................................................................215.4.7 Testing and Pre-Commissioning ........................................................................225.4.8 Topside Commissioning .....................................................................................225.4.9 Load Out and Sail-away .....................................................................................235.4.10 Onshore Construction and Commissioning – Emissions, Discharges and Waste
............................................................................................................................255.5 Infield Pipeline Installation, Tie-in and Commissioning...................................................27
5.5.1 COP Pipeline Integrity and Design.....................................................................285.5.2 Pipeline Installation.............................................................................................285.5.3 Pipeline Cleaning and Hydrotesting ...................................................................295.5.4 Oil Pipeline Wye Installation...............................................................................305.5.5 Pipeline Tie-in, Testing and Dewatering.............................................................315.5.6 Summary of Pipeline Installation Discharges.....................................................325.5.7 Pipeline Installation, Tie-in and Commissioning – Emissions, Discharges and
Waste..................................................................................................................345.6 Platform Installation, Hook Up and Commissioning........................................................35
5.6.1 Pre Installation Survey........................................................................................355.6.2 Jacket .................................................................................................................355.6.3 Topside...............................................................................................................355.6.4 Topside Hook Up and Commissioning...............................................................365.6.5 DWG-PCWU Brownfield Works .........................................................................375.6.6 Installation, Hook Up and Commissioning Vessels............................................375.6.7 Platform Installation, Hook Up and Commissioning – Emissions, Discharges
and Waste ..........................................................................................................385.7 Platform Drilling ...............................................................................................................40
5.7.1 Introduction.........................................................................................................405.7.2 Platform Drilling Facilities ...................................................................................405.7.3 Predrill Well Tie-in and Re-entry ........................................................................415.7.4 Platform Well Design ..........................................................................................415.7.5 Cuttings Treatment and Disposal .......................................................................435.7.6 Conductor Suspension .......................................................................................455.7.7 Well Completion Activities ..................................................................................455.7.8 Sand Control.......................................................................................................465.7.9 Contingency Chemicals......................................................................................465.7.10 Platform Drilling – Emissions, Discharges and Waste .......................................46
5.8 Offshore Operations and Production...............................................................................475.8.1 Overview.............................................................................................................475.8.2 Separation System .............................................................................................475.8.3 Gas Processing and Export................................................................................485.8.4 Produced Water..................................................................................................485.8.5 Water Injection....................................................................................................495.8.6 Platform Utilities..................................................................................................515.8.7 Pipeline Operations and Maintenance ...............................................................58

AIOC Chirag Oil Project Environmental & Socio-Economic Impact Assessment
Chapter 5: Project Description
February 2010 5/2 Final
5.8.8 Supply and Logistics...........................................................................................605.8.9 Offshore Operations and Production – Emissions, Discharges and Waste.......60
5.9 Terminal...........................................................................................................................635.9.1 Oil Processing ....................................................................................................635.9.2 Gas Processing ..................................................................................................635.9.3 Produced Water..................................................................................................635.9.4 Terminal Operations – Emissions, Discharges and Waste................................64
5.10 Decommissioning ............................................................................................................655.11 Management of Change Process....................................................................................655.12 Summary of Emissions and Waste .................................................................................66
5.12.1 COP Emissions ..................................................................................................665.12.2 COP Hazardous and Non Hazardous Waste.....................................................66
5.13 COP Employment............................................................................................................70
List of Figures
Figure 5.1 Overview of Chirag Oil Project 5 Figure 5.2 Estimated COP Production Profiles Across the PSA Period 6 Figure 5.3 Estimated COP Schedule to First Oil 6 Figure 5.4 Dada Gorgud Semi-Submersible Rig 7 Figure 5.5 Generic Predrill Well Design 8 Figure 5.6 Import Routes to Azerbaijan 19 Figure 5.7 Jacket Fabrication Process 20 Figure 5.8 Topside Construction Process 21 Figure 5.9 DWG-DUQ Jacket During Loadout 23 Figure 5.10 EA Platform Topside Onboard STB-01 Barge 24 Figure 5.11 Proposed COP Infield Pipelines 27 Figure 5.12 Oil Pipeline Wye Installation Methodology 31Figure 5.13 Jacket Installation 35 Figure 5.14 Topsides “Float-Over” Installation Method 36 Figure 5.15 Cuttings Re-injection Process 43 Figure 5.16 WC-PDQ Process Schematic 47 Figure 5.17 Simplified Produced Water and Injection Water Flows 50 Figure 5.18 Open Drains System 55 Figure 5.19 Pigging Operations – Infield Produced Water Pipeline 58 Figure 5.20 Pigging Operations – Injection Water Pipeline 59 Figure 5.21 Predicted GHG Emissions Associated with COP Offshore Operations and ACG FFD 61Figure 5.22 Forecast EOP and ACG Phases 1-3 GHG Emissions Associated with Terminal Operations and COP Contribution 64 Figure 5.23 Estimated Number of Jobs for Azerbaijani Citizens Over the COP 70
List of Tables
Table 5.1 Generic COP Predrill Well Design 7 Table 5.2 Estimated Use of Drilling Chemicals Per Hole – 36” Conductor Section 10 Table 5.3 Estimated Use of WBM (Ultradril) Per Hole – 28” and 26” Hole Sections 10 Table 5.4 Estimated Use of SBM/LTMOBM Per Hole – 16” and 12 ¼” Holes 11 Table 5.5 Estimated MODU Well Cuttings and Mud Volumes per Hole Section 12 Table 5.6 Estimated Usage of Well Cement Per Constituent 12 Table 5.7 Estimated Usage of Drilling Contingency Chemicals 13 Table 5.8 Estimated Well Clean Up Chemicals 14 Table 5.9 Summary of the MODU Utilities and Support Activities 15 Table 5.10 Estimated GHG and non GHG Emissions Associated with Routine and Non Routine COP Predrill Activities 16 Table 5.11 Estimated Drilling Fluids and Cement Discharges to Sea Associated with COP Predrill Activities 16

AIOC Chirag Oil Project Environmental & Socio-Economic Impact Assessment
Chapter 5: Project Description
February 2010 5/3 Final
Table 5.12 Estimated Hazardous and Non Hazardous Waste Associated with Predrilling Activities 17 Table 5.13 Estimated GHG and Non GHG Emissions Associated with Routine and Non Routine COP Onshore Construction and Commissioning Activities 25 Table 5.14 Estimated Hazardous and Non Hazardous Waste Associated with Onshore Construction and Commissioning Activities 26 Table 5.15 COP Infield Pipelines 27 Table 5.16 Pipelay Support Vessels 29 Table 5.17 Pipelay Barge and Support Vessel Utilities 29 Table 5.18 Estimated Pipeline Gauging, Hydrotesting, Tie-in, Leak Tests and Dewatering Treated Seawater Discharges 33 Table 5.19 Estimated GHG and non GHG Emissions Associated with Routine and Non Routine Pipeline Installation, Tie-in and Commissioning Activities 34 Table 5.20 Installation, Hook Up and Commissioning Vessels (Including DWG-PCWU Platform Brownfield Works) 37 Table 5.21 Installation, Hook Up and Commissioning Vessel Utilities 38 Table 5.22 Predicted GHG and Non GHG Emissions Associated with Routine Installation, Hook Up and Commissioning Activities 38 Table 5.23 Estimated Hazardous and Non Hazardous Waste Associated with Pipeline and Platform Installation, Hook Up and Commissioning Activities 39 Table 5.24 Estimated Suspension Fluid Chemicals and Viscous Sweeps 41 Table 5.25 Generic COP Well Design 42 Table 5.26 Estimated Platform Well Cuttings and Mud Volumes per Hole Section 42 Table 5.27 Anticipated Production Chemicals and Requirements 57 Table 5.28 DWG-PCWU Injection Water Chemicals 59 Table 5.29 Summary of Produced Water and Injection Water Pipeline Pigging Volumes and Locations of Discharge 60 Table 5.30 Predicted GHG and non GHG Emissions Associated with Routine and Non Routine COP Offshore Operations and Production Activities 60 Table 5.31 Estimated Planned Discharges to Sea Associated with Routine and Non Routine Platform Drilling Activities 61 Table 5.32 Estimated Hazardous and Non Hazardous Waste Associated with Offshore Drilling and Processing Activities 62 Table 5.33 Predicted GHG and non GHG Emissions Associated with Terminal Operations (COP Contribution) 64 Table 5.34 Estimated GHG and non GHG Emissions Associated with the COP 66 Table 5.35 Estimated Hazardous and Non Hazardous Waste Associated with the COP 67 Table 5.36 Waste Subcategories 68 Table 5.37 Planned Destination of COP Waste Streams 69
AIOC Chirag Oil Project Environmental & Socio-Economic Impact Assessment
Chapter 5: Project Description
February 2010 5/4 Final
5.1 Introduction
This Chapter of the Environmental and Socio-economic Impact Assessment (ESIA) describes the construction and operational activities associated with the Chirag Oil Project (COP). The description presents the technical design basis for the project facilities and associated planned activities for the following project phases:
Offshore predrilling; Onshore construction and commissioning of offshore facilities; Infield pipeline installation, tie-in and commissioning; Platform installation, hook up and commissioning; Platform drilling; Offshore operations and production; and Decommissioning of offshore facilities.
Estimated emissions, discharges and wastes from the COP are presented for each project phase; emission estimate assumptions are provided in full within Appendix 5A.
This Chapter provides the basis for the ESIA as presented in Chapters 9-13 and was prepared during the ‘Define’ stage of the project. During subsequent stages of the COP, there may be a need to change a design element. The COP Management of Change Process that will be followed should this be necessary is presented in Section 5.11 of this Chapter.
The Base Case design of the COP includes:
West Chirag Production, Drilling and Quarters (WC-PDQ) platform; Infield subsea pipelines to tie the WC-PDQ platform into the existing Azeri Chirag
Gunashli (ACG) pipeline infrastructure to transport hydrocarbon products to the Sangachal Terminal for processing to export specification; and
Infield pipelines for: - Produced water transfer from the WC-PDQ platform to Deep Water Gunashli
Production, Compression, Water Injection and Utilities (DWG-PCWU) platform; and
- Provision of injection water to the WC-PDQ platform from the DWG-PCWU platform.
Up to 28 producer wells, 17 water injection wells and 1 cutting reinjection (CRI) well are planned for the COP. While no subsea water injection wells will be drilled, space will be provided on the WC-PDQ platform to allow tie-in to a future subsea water injection system at a later date, if required.1
The COP will make use of existing capacity/ullage within the Sangachal Terminal processing facilities and no new infrastructure or Terminal expansion will be required.
Figure 5.1 presents an overview of the COP and the associated tie-ins to the existing ACG facilities and infrastructure.
1 Subsea water injection wells would allow more producer wells to be drilled. These are not part of the COP Base Case.

AIOC Chirag Oil Project Environmental & Socio-Economic Impact Assessment
Chapter 5: Project Description
February 2010 5/5 Final
Figure 5.1 Overview of Chirag Oil Project
Planned first oil for the COP is late 2013 with peak production anticipated in 2015. The ACG field, comprising 5 Pereriv (A, B, C, D, E) and 4 Balakhany (VII/VIII/IX/X) reservoirs, contains “total-original-oil-in-place” of 16.2 billion standard barrels (Bstb). The COP aims to develop the Balakhany reserves and accelerate recovery of the Pereriv resources in the Chirag-Deep Water Guneshli (CDWG) area of the ACG field. The COP offshore facilities have been designed to process up to:
185 thousand barrels per day (Mbpd)) oil; 290 million standard cubic feet per day (MMscfd) gas2; and 120 thousand barrels per day (Mbwd) of produced water.
Figure 5.2 illustrates the estimated COP oil, produced water and total gas production profile over the Production Sharing Agreement (PSA) period.
2 Including 80MMscfd lift gas and fuel gas

AIOC Chirag Oil Project Environmental & Socio-Economic Impact Assessment
Chapter 5: Project Description
February 2010 5/6 Final
Figure 5.2 Estimated COP Production Profiles Across the PSA Period
5.2 COP Schedule
Key COP milestones are shown in Figure 5.3. The milestones are based on the best available knowledge at the time of writing. The timing for each will be finalised prior to the end of the Define stage of the BP Capital Value Process (CVP).
Figure 5.3 Estimated COP Schedule to First Oil
The following sections discuss key activities associated with each phase of the project.
0
50
100
150
200
250
2013 2014 2015 2016 2017 2018 2019 2020 2021 2022 2023 2024
Oil
Total Gas
Produced Water

AIOC Chirag Oil Project Environmental & Socio-Economic Impact Assessment
Chapter 5: Project Description
February 2010 5/7 Final
5.3 Predrilling
The purpose of predrilling is to accelerate early production once the platform is in place. It is planned that up to 20 wells (16 producer wells, 3 water injection wells and 1 cuttings reinjection well) will be predrilled, using a Mobile Offshore Drilling Unit (MODU), prior to the installation of the WC-PDQ platform. It is anticipated that the wells will be drilled using the “Dada Gorgud” semi-submersible rig. This rig has been used for all of AIOC’s predrilling activities in the ACG Contract Area (Figure 5.4).
Figure 5.4 Dada Gorgud Semi-Submersible Rig
5.3.1 MODU (Predrilled) Well Design
The generic predrill well design is presented in Table 5.1 and illustrated in Figure 5.5. The casing design for the COP wells will be similar to the current designs used on the Pereriv wells in the ACG field. As was required for the Central and West Azeri wells, the drilling studies undertaken as part of the COP design evolution have demonstrated that a 24” casing liner may be required to minimise risk associated with shallow seabed instability.
Table 5.1 Generic COP Predrill Well Design
Hole Size (Drill Bit
Diameter)
Casing Outer
Dimension Description
Setting Depth (m TVD BRT1)
Drilling Mud System Disposal Route of Drilling Muds
36" 30” Conductor +/- 350 Seawater & gel sweeps Discharge to sea
28” 24” Drilling Liner +/- 500 WBM2 Discharge to sea
26” 20“ Surface +/- 750 WBM Discharge to sea
16” 133/8” Intermediate +/- 1,300 SBM3 or LTMOBM4 Ship to Shore
12¼” 95/8” Production Top Reservoir (2,600 - 3,000)
SBM or LTMOBM Ship to Shore
1 m TVD BRT: True Vertical Depth Below Rotary Table in metres. 2 WBM: Water Based Mud. 3 SBM: Synthetic Based Mud. 4 LTMOBM: Low Toxicity Mineral Oil Based Mud.

AIOC Chirag Oil Project Environmental & Socio-Economic Impact Assessment
Chapter 5: Project Description
February 2010 5/8 Final
Figure 5.5 Generic Predrill Well Design
Note: Target formation for CRI well will be the Sabunchi formation.
5.3.2 MODU Drilling Activities
5.3.2.1 Drilling Template and Foundation Pin Piles
To control the horizontal positioning of the predrill wells, a drilling template comprising 20 “slots” (i.e. wellhead receptacles) will be lifted into position by the Derrick Barge Azerbaijan (DBA), lowered onto the seabed and levelled using a hydraulic system. Following installation of the drilling template, four 96” diameter 110m length pin piles will be driven into the seabed using an underwater hydraulic hammer. These pin piles will form the temporary foundation support for the WC-PDQ jacket when it is installed (see Section 5.6.2). The construction and installation activities associated with the template and pin piles are described in full within the COP Fabrication and Installation of the Drilling Template Environmental Technical Note submitted in April 2009.

AIOC Chirag Oil Project Environmental & Socio-Economic Impact Assessment
Chapter 5: Project Description
February 2010 5/9 Final
5.3.2.2 MODU Positioning
The MODU will be moved into place above the drilling template by up to 3 vessels (each with up to 15 Persons on Board (POB). Anchoring of the MODU is expected to result in the following seabed disturbances:
Anchor setting: 8 anchors, 5m wide and 200m long seabed disturbance; and Anchor chains: 8 chains, 2m wide and up to 300m long seabed disturbance.
The total area of seabed likely to be affected is therefore approximately 12,800m2.
The positioning and set up of the MODU is expected to take up to 3 days and a further 3 days to demobilise the rig at the end of the drilling programme. A mandatory 500m exclusion zone will be established around the rig for the duration of the predrilling programme.
5.3.2.3 Pilot Hole
Before commencing predrilling, it is planned that 1 pilot hole will be drilled to determine whether any high-pressure shallow gas zones are present in the area. The pilot hole will be drilled to a depth of approximately 1,000m using a seawater system and gel sweeps3 of equivalent specification and environmental performance as used for previous ACG pilot holes4. It is predicted that approximately 60m3 of cuttings will be forced out of the hole and these will be directly discharged to the seabed over approximately 8 hours. The hole will subsequently be drilled and cased section by section as part of the predrilling programme as described in Section 5.3.2.4 below.
5.3.2.4 MODU Drilling of Predrill Wells
Prior to any drilling activities, the rig crew will apply pipe dope to the drilling equipment joints to prevent thread damage. Pipe dope is a lubricating grease which seals the joints to stop them rubbing and wearing. It is anticipated that BESTOLIFE 3010 Ultra (OCNS Category E) or a similar heavy metal free dope will be used for this purpose.
All well-bore sections will be drilled using drilling fluids/drilling muds, the primary role of which is to:
Maintain down-hole pressure to prevent formation fluids entering the well bore; Remove drill cuttings generated by the drill bit as it bores through the rock strata and
transport these to the surface; Lubricate and provide cooling to the drill bit and the drill string; and Seal the wall of the well-bore in order to provide stabilisation.
Drilling mud for the predrill programme will be routinely prepared on shore and supplied to the MODU via hose connections from supply vessels. The mud pumping system and connections between the MODU and supply vessels are designed to avoid discharges to the marine environment during mud transfer.
Conductor Sections
Drilling fluids for the 36” conductor sections will comprise a seawater and gel sweeps system of equivalent specification and environmental performance as used for previous ACG conductor section drilling fluid systems, which will be pumped down the drill string, forcing the
3 Worst case chemical use for pilot hole drilling is expected to be similar to estimated use for the 36” hole sections. Refer to Tables 5.2 and 5.5 for chemical composition and estimated volumes. 4 The COP Management of Change Process (Section 5.11) will be followed should alternative project chemicals be required

AIOC Chirag Oil Project Environmental & Socio-Economic Impact Assessment
Chapter 5: Project Description
February 2010 5/10 Final
cuttings up the hole and onto the seabed5. Table 5.2 presents the expected composition of the conductor section drilling chemicals and the estimated use per hole.
Table 5.2 Estimated Use of Drilling Chemicals Per Hole – 36” Conductor Section
Chemical1 Composition Function Estimated Use per Hole (tonnes)2
HazardCategory3
Bentonite Clay Ore Viscosifier and removal of cuttings
20 E
SodiumBicarbonate
Sodium Bicarbonate pH treatment and calcium ion separation
1 E
Fluorescent Dye Fluorescein Cement tracer 0.1 GOLD 1 Refer to Appendix 5C for further details of regarding composition and function of COP chemicals with potential for discharge 2 Volumes will depend on the actual subsurface conditions encountered as such these volumes are best estimates based on
previous experience. 3 Two methods of hazard assessment are used in accordance with internationally recognised practice - CHARM and Non CHARM.
The CHARM Model is used to calculate the ratio of predicted exposure concentration against no effect concentration (PEC:NEC) and is expressed as a Hazard Quotient. Hazard Quotients are assigned to 1 of 6 categories and "GOLD" is the least hazardous category. Those chemicals that cannot be modelled by CHARM are assigned to a category (A to E) based on toxicity assessment, biodegradation and bioaccumulation potential. Category E is the least harmful category. Source: CEFAS, Offshore Chemical Notification Scheme - Ranked Lists of Notified Chemicals, Updated February 2009. Refer to Appendix 5D for further details regarding determination of chemical hazard categories.
Drilling Liner and Surface Holes
The 28” and 26” drilling liner and surface hole sections will be drilled using a water based mud (WBM). It is proposed to use an Ultradril mud of the same specification and environmental performance as used for previous ACG wells (refer to Chapter 9 for environmental performance/toxicity details). If there is a requirement to change the drilling mud composition or to select a different drilling mud for commercial or technical reasons, the COP Management of Change Process (see Section 5.11) will be followed.
Table 5.3 presents the expected composition of the drilling liner and surface hole drilling mud (assuming use of an Ultradril mud) and the estimated volume per hole.
Table 5.3 Estimated Use of WBM (Ultradril) Per Hole - 28” and 26” Hole Sections
Chemical1 Composition Function Estimated
Use per Hole (tonnes)2
HazardCategory3
Barite Barium sulphate ore Weighting agent 200 E Bentonite Clay ore Viscosifier and removal of cuttings 20 E KCL Potassium chloride Borehole stabiliser 15 E Ultrahib Polyether amine Stabiliser / Shale Inhibitor 3 GOLD Polypac Polyanionic cellulose Encapsulater 0.3 E
Flo-Trol Cellulose polymer/ Modified starch
Fluid loss control and reduces the risk of drill string sticking
0.3 E
Duovis Bio-polymer Viscosifier 0.5 GOLD
UltraFree Synthetic Alyphatic Hydrocarbon
Lubricant, prevents bit balling 2 GOLD
Ultracap Polymer Encapsulator 1 GOLD SodiumBicarbonate
Sodium bicarbonate pH treatment and calcium ion separation 1 E
Citric acid Citric acid pH treatment and calcium ion separation 3 E Notes as per Table 5.2
The WBM and cuttings from the 28” and 26” hole sections will be returned to the MODU using a submerged Mud Recovery pumping System (MRS) located at the subsea wellhead. The mud and cuttings will then be treated in a solids control unit, separating mud from the cuttings onboard the MODU. Recovered WBM will be reused whenever possible. It is planned to discharge the cuttings to the sea via the MODU cuttings caisson at 11m below the sea surface, in accordance with applicable PSA standards6. If cuttings accumulate on the seabed 5 The COP Management of Change Process (Section 5.11) will be followed should alternative project chemicals be required6 There shall be no discharge of drill cuttings or drilling fluids if the maximum chloride concentration of the drilling fluid system is greater than 4 times the ambient concentration of the receiving water.

AIOC Chirag Oil Project Environmental & Socio-Economic Impact Assessment
Chapter 5: Project Description
February 2010 5/11 Final
to a degree where they could interfere with jacket installation, a hose will be used to discharge cuttings away from the template and jacket location.
Where practicable, residual WBM from the surface hole casing or left in the MODU mud system at the end of the drilling section will be recovered and shipped to shore for re-use or disposal. Where this is not practicable, residual WBM (up to approximately 160 tonnes per hole) will be discharged to sea in accordance with the applicable PSA requirements4.
Intermediate and Production Hole Sections
To improve well bore stability, ensure appropriate lubrication, optimise compatibility with deeper well formations and minimise the risk of stuck pipe, it will be necessary to change to a SBM or LTMOBM for the lower 16” and 121/4” well sections. The use of a SBM or LTMOBM will be dependent on the actual well conditions encountered during drilling operations. Table 5.4 presents the typical composition and estimated volumes expected to be used per hole.
Table 5.4 Estimated Use of SBM/LTMOBM Per Hole - 16” and 12 ¼” Holes
Chemical1 Composition Function Estimated Use
per Hole (tonnes)2
HazardCategory3
Chemicals Common to both SBM and LTMOBM
BariteBarium sulphate ore
Weighting agent 200 E
Bentone/truvis Organoclay Viscosifier and removal of cuttings 4 E
CalciumChloride
Calcium chloride Borehole stabiliser 12 E
Ecotrol Polymer Fluid loss control and reduces the risk of drill string sticking
1 E
Lime Calcium hydroxide Alkalinity, calcium ion treatment 10 E
Chemicals within SBM Only
Novamull Emulsifier Emulsifier 10 C Novawet Surfactant Wetting agent 2 C
Chemicals within LTMOBM Only
Versamul Emulsifier Emulsifier 10 B Versawet Surfactant Wetting agent 2 E
Notes as per Table 5.2
It is proposed to use LTMOBM and/or SBM of the same specification as used for previous ACG wells7.
Following installation of the surface casing (see Section 5.3.2.5), the blow-out preventer (BOP) and marine riser will be deployed for drilling the intermediate and production hole sections. The riser allows mud and cuttings to be returned to the MODU. Onboard the MODU, mud and cuttings will pass through the MODU Solids Circulation System (SCS) that separates SBM/LTMOBM from cuttings via a series of shale shakers, a vacuum degasser and centrifuges, which, in turn, separate increasingly smaller cutting particles from the SBM/LTMOBM Separated SBM/LTMOBM will be reused either on the MODU or transported to an operating platform for use where practicable. Unused separated SBM/LTMOBM will be returned to shore for disposal or recycling. SBM/LTMOBM associated drill cuttings will be contained in dedicated cuttings skips on the rig deck for subsequent transfer either:
To an operating platform for reinjection (where practicable); or To shore for treatment and final disposal.
It is not planned to release any SBM or LTMOBM or associated cuttings into the marine environment.
7 The COP Management of Change Process (Section 5.11) will be followed should alternative project chemicals be required

AIOC Chirag Oil Project Environmental & Socio-Economic Impact Assessment
Chapter 5: Project Description
February 2010 5/12 Final
Summary of Mud and Cuttings
Table 5.5 presents the estimated quantities of waste drilling fluids and cuttings for each hole section and the planned disposal route.
Table 5.5 Estimated MODU Well Cuttings and Mud Volumes per Hole Section
Hole Size (Drill Bit
Diameter) Description
Estimated Quantity of
Cuttings per Well (tonnes)
Estimated Quantity of
DrillingFluids per
Well (tonnes)1
Drilling Fluid/ Mud System
Cuttings and Mud Disposal
Duration of
Discharge per Well (hours)
36” Conductor 230 250 Seawater and
gel sweeps At seabed 8
Drilling Liner and Surface
Holes155 340
To sea via caisson or hose.
Mud recovery system utilised to recover
muds from cuttings
30
28” & 26”
ResidualMud - 160
WBMTo sea via caisson or
hose. Worst case discharged when WBM cannot be
recovered or recycled
4
16” & 12¼”
Intermediateand
ProductionHoles
600 450 SBM/
LTMOBM
Reinjection at operational platform
(where practicable) or shipped to shore
Dischargenot
planned
1 Total estimated fluid volume including chemicals and seawater/drill water.
5.3.2.5 Casing and Cementing
Once each hole section is drilled, a steel casing string will be installed and cemented into place. The casing provides structural strength for the well, protecting it from weak or unstable formations and is cemented into place by pumping cement slurry into the well bore. The cement passes around the open lower end of the casing and into the annulus between the casing outer wall and the host rock formation in the case of the top-hole conductor. For subsequent casings, the cement passes between the casing outer wall and inner wall of the previous casing. For each casing string, some loss of cement to the seafloor usually occurs due to the need to slightly overfill the annulus to complete the casing cementing8. Table 5.6 below presents the expected chemical constituents of the cement, the expected usage per hole and estimates of the worst case volume discharged to the seafloor9.
Table 5.6 Estimated Usage of Well Cement Per Constituent
36” Hole Casing 28” & 26” Hole Casing 16” & 12¼” Hole Casing
Additive1 HazardCategory3 Estimated Use
per Hole (tonnes)2
Worst Case Discharged (tonnes) 2
Estimated Use per Hole (tonnes)2
Worst Case Discharged (tonnes) 2
Estimated Use per Hole
(tonnes) 2
Worst Case Discharged (tonnes) 2
Class G cement E 63 6.3 105 4.4 57 0.7 Barite Gold 1.9 1.9 6.3 6.3 9.4 trace Cement chemicals D175 Antifoam Gold 0.1 0.1 0.2 <0.1 0.1 trace D185 Dispersant Gold 0.3 <0.1 0 0 0 trace D500 Gasblok LT Gold 3.6 0.3 8.3 0.6 0 trace D077 Liquid Acc. (CaCl2)
E 1.1 0.1 0 0 0.1 trace
D075 Extender E 0.2 0.1 0.3 <0.1 1.3 trace D182 Mudpush II Gold 0.1 0.1 0.1 0.1 0.2 trace F103 Ezeflo Gold 0 0 0 0 0.6 trace
Notes as per Table 5.2
8 Cement losses are estimated to occur over approximately 1 hour per hole. 9 The COP Management of Change Process (Section 5.11) will be followed should alternative chemicals be required.

AIOC Chirag Oil Project Environmental & Socio-Economic Impact Assessment
Chapter 5: Project Description
February 2010 5/13 Final
It is expected that, as a worst case, approximately 22 tonnes of cement per well will be discharged, comprising approximately 12 tonnes Class G cement, eight tonnes barite and the remainder cement chemicals of low toxicity (Hazard Category E and Gold).
At the end of cementing each casing string, up to 0.7 tonnes of cement (comprising Class G cement, barite and cement chemicals) could remain in the MODU cement system. Where it is not technically practicable or safe to recover excess cement remaining in the cement system, it will be mixed with seawater and discharged to the seabed over approximately one hour via the cement system hoses. It is not planned to discharge any dry cement to the marine environment.
The volume of cement used to cement each casing is calculated prior to the start of the activity. Sufficient cement is used to ensure that the casing is cemented securely and necessary formations isolated so that this safety and production critical activity is completed effectively while minimising excess cement discharges to the sea.
5.3.2.6 Drilling Hazards
Based on prior experience and current reservoir knowledge, there are a number of potential hazards that may be encountered during predrilling operations including:
Shallow Gas: Potentially between the surface and 16” hole sections (this is generally identified during pilot hole drilling); Reactive Formations: Below the 16” hole section; and Overpressure: At the 12¼” hole section, causing differential sticking and fluid losses to the subsurface formations.
A number of contingency chemicals will be retained for use in the event that hazards are encountered during drilling. Table 5.7 lists the chemicals intended to be stored on the rig and used during lower hole drilling in the event of contingencies10. By definition the use of contingency chemicals cannot be predicted with accuracy, although their use will be minimised to the extent practicable in accordance with operational needs. Contingency chemicals used will be recovered with the OBM/LTMOBM and shipped to shore for disposal. It is not planned to discharge contingency chemicals to the marine environment.
Table 5.7 Estimated Usage of Drilling Contingency Chemicals
Chemical1 Function Estimated use per Hole (tonnes)2 Hazard Category3
G-Seal Stress cage application 13 E Durcal 130 Stress cage application 13 ESafecarb Z3 Stress cage application 7 E
Safecarb Z4 Stress cage application 7 E
Starcarb Calcium carbonate – LCM 5 ENutplug LCM /Cement scouring pill 1 EFrom-A-Squeeze LCM 3 E
M-I-X II LCM 4 EGuar Gum Gel sweeps 4 ENotes as per Table 5.2
5.3.2.7 Well Clean Up
Clean up of the predrill wells will be achieved by circulating a number of fluid slugs or “pills” to the well. Their function is to remove any remaining mud and cuttings and, where the reservoir is already drilled, ready the sand face for production once the platform is in position and the well completed.
10 The COP Management of Change Process (Section 5.11) will be followed should alternative project chemicals be required.

AIOC Chirag Oil Project Environmental & Socio-Economic Impact Assessment
Chapter 5: Project Description
February 2010 5/14 Final
Table 5.8 details the chemicals and fluids planned to be stored on the rig and used for well clean up11.
Table 5.8 Estimated Well Clean Up Chemicals
Chemical/Fluid1 Function Estimated Use
per Well (tonnes)2
Hazard Category3
Transition Pill 1.46 SG Brine Weighted circulation fluid 12.5 N/A
SAFE-VIS LE (@7ppb) Viscosifier 0.2 E SAFE-SOLV E Surfactant 0.9 GOLD SAFE-SURF E Viscosifier 0.6 GOLD
Sodium Bromide Brine additive 0.75 E Hydroxyethylcellulose (HEC) Pill
1.46 SG Brine Weighted circulation fluid 35.0 N/A
Drill water Circulation fluid 6.0 N/A SAFE-VIS LE (@7ppb) Viscosifier 0.8 E
CCT®3000D Hi-Vis Pill 1.46 SG Brine Weighted circulation fluid 13.0 N/A
Drill water Circulation fluid 3.5 N/A CCT®3000D Detergent 2.5 D
FLOVIS PLUS Viscosifier 0.1 GOLD CCT®3000D Wash Pill
1.46 SG Brine Weighted circulation fluid 22.0 N/A Drill water Circulation fluid 8.0 N/A
CCT®3000D Detergent 4.0 D Casing Tail Spacer
1.46 SG Brine Weighted circulation fluid 7.0 N/A Drill water Circulation fluid 4.0 N/A
FLOVIS PLUS Viscosifier 0.05 GOLD Notes as per Table 5.2
It is planned that clean up chemicals will be circulated back to MODU, reused and recycled where practicable, and shipped to shore for disposal. It is not planned to discharge clean up chemicals or fluids to the marine environment.
5.3.2.8 Well Testing
Drill stem testing of predrill wells will be undertaken by exception only with well test proposals reviewed and challenged through existing BP internal processes. Well tests comprise flowing of formation fluids to the surface where pressure, temperature and flow rate measurements are made to evaluate well performance characteristics. The hydrocarbons are sampled and analysed with the remaining fluids sent to flare. The COP Base Case assumes well testing of two wells as a worst case, with up to 4,000 barrels of oil and 360 tonnes of gas flared per well12. A burner, designed to achieve high burning efficiencies and fallout free and smokeless combustion of the liquid hydrocarbons produced, will be used during well testing.
5.3.2.9 Template Well Suspension
Once predrilling, casing, cementing, clean up and any well tests are complete, the wells will be temporarily suspended by filling them with inhibited seawater, which will protect the well from any pressurised formations. Table 5.24 (see Section 5.7.3 below) presents the expected chemical constituents of the suspension fluid.
The wells will then be closed with a mechanical plug and a corrosion cap installed on the subsea well-head following retrieval of the riser system. The purpose of the cap is to seal the well until the WC-PDQ platform is in place and the wells can be re-entered for completion. It is
11 The COP Management of Change Process (Section 5.11) will be followed should alternative chemicals be required.12 Assumes gas-to-oil ratio of 1250 scf/bbl
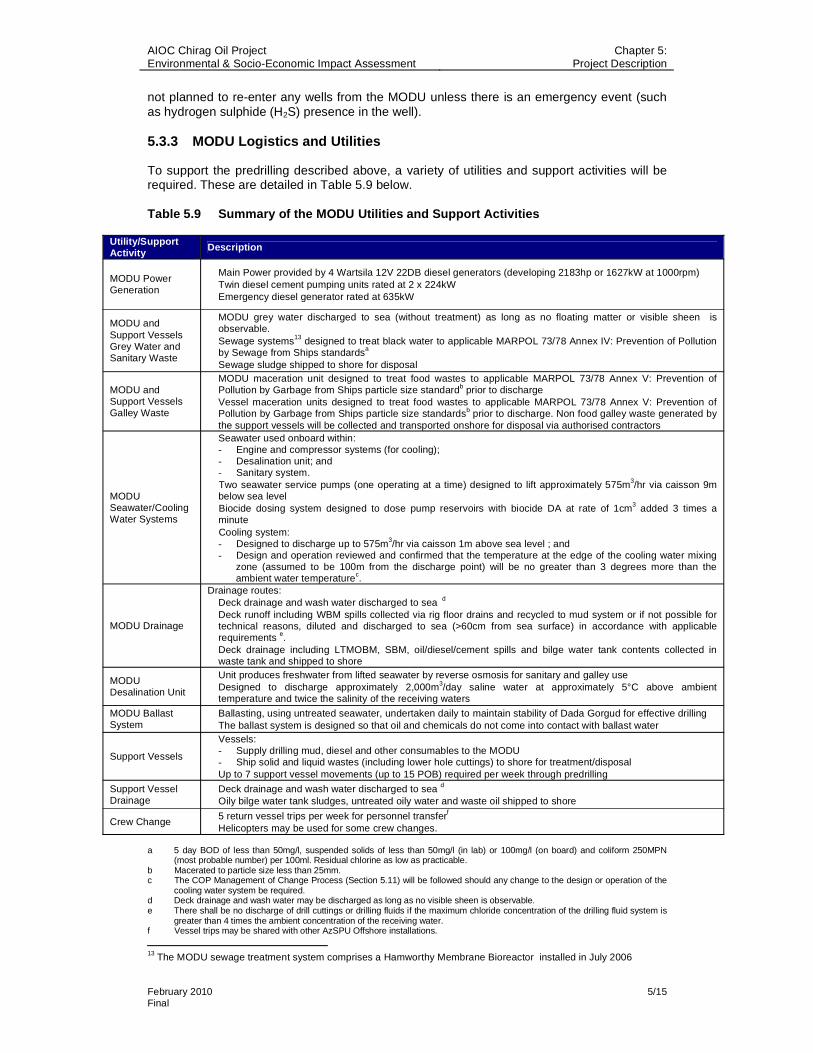
AIOC Chirag Oil Project Environmental & Socio-Economic Impact Assessment
Chapter 5: Project Description
February 2010 5/15 Final
not planned to re-enter any wells from the MODU unless there is an emergency event (such as hydrogen sulphide (H2S) presence in the well).
5.3.3 MODU Logistics and Utilities
To support the predrilling described above, a variety of utilities and support activities will be required. These are detailed in Table 5.9 below.
Table 5.9 Summary of the MODU Utilities and Support Activities
Utility/Support Activity Description
MODU Power Generation
Main Power provided by 4 Wartsila 12V 22DB diesel generators (developing 2183hp or 1627kW at 1000rpm) Twin diesel cement pumping units rated at 2 x 224kW Emergency diesel generator rated at 635kW
MODU and Support Vessels Grey Water and Sanitary Waste
MODU grey water discharged to sea (without treatment) as long as no floating matter or visible sheen is observable.
Sewage systems13 designed to treat black water to applicable MARPOL 73/78 Annex IV: Prevention of Pollution by Sewage from Ships standardsa
Sewage sludge shipped to shore for disposal
MODU and Support Vessels Galley Waste
MODU maceration unit designed to treat food wastes to applicable MARPOL 73/78 Annex V: Prevention of Pollution by Garbage from Ships particle size standardb prior to discharge
Vessel maceration units designed to treat food wastes to applicable MARPOL 73/78 Annex V: Prevention of Pollution by Garbage from Ships particle size standardsb prior to discharge. Non food galley waste generated by the support vessels will be collected and transported onshore for disposal via authorised contractors
MODUSeawater/Cooling Water Systems
Seawater used onboard within: - Engine and compressor systems (for cooling); - Desalination unit; and - Sanitary system.
Two seawater service pumps (one operating at a time) designed to lift approximately 575m3/hr via caisson 9m below sea level
Biocide dosing system designed to dose pump reservoirs with biocide DA at rate of 1cm3 added 3 times a minute
Cooling system: - Designed to discharge up to 575m3/hr via caisson 1m above sea level ; and - Design and operation reviewed and confirmed that the temperature at the edge of the cooling water mixing
zone (assumed to be 100m from the discharge point) will be no greater than 3 degrees more than the ambient water temperaturec.
MODU Drainage
Drainage routes: Deck drainage and wash water discharged to sea d
Deck runoff including WBM spills collected via rig floor drains and recycled to mud system or if not possible for technical reasons, diluted and discharged to sea (>60cm from sea surface) in accordance with applicable requirements e.
Deck drainage including LTMOBM, SBM, oil/diesel/cement spills and bilge water tank contents collected in waste tank and shipped to shore
MODUDesalination Unit
Unit produces freshwater from lifted seawater by reverse osmosis for sanitary and galley use Designed to discharge approximately 2,000m3/day saline water at approximately 5°C above ambient
temperature and twice the salinity of the receiving waters
MODU Ballast System
Ballasting, using untreated seawater, undertaken daily to maintain stability of Dada Gorgud for effective drilling The ballast system is designed so that oil and chemicals do not come into contact with ballast water
Support Vessels
Vessels: - Supply drilling mud, diesel and other consumables to the MODU - Ship solid and liquid wastes (including lower hole cuttings) to shore for treatment/disposal
Up to 7 support vessel movements (up to 15 POB) required per week through predrilling
Support Vessel Drainage
Deck drainage and wash water discharged to sea d
Oily bilge water tank sludges, untreated oily water and waste oil shipped to shore
Crew Change 5 return vessel trips per week for personnel transferf
Helicopters may be used for some crew changes.
a 5 day BOD of less than 50mg/l, suspended solids of less than 50mg/l (in lab) or 100mg/l (on board) and coliform 250MPN (most probable number) per 100ml. Residual chlorine as low as practicable.
b Macerated to particle size less than 25mm. c The COP Management of Change Process (Section 5.11) will be followed should any change to the design or operation of the
cooling water system be required. d Deck drainage and wash water may be discharged as long as no visible sheen is observable. e There shall be no discharge of drill cuttings or drilling fluids if the maximum chloride concentration of the drilling fluid system is
greater than 4 times the ambient concentration of the receiving water. f Vessel trips may be shared with other AzSPU Offshore installations.
13 The MODU sewage treatment system comprises a Hamworthy Membrane Bioreactor installed in July 2006

AIOC Chirag Oil Project Environmental & Socio-Economic Impact Assessment
Chapter 5: Project Description
February 2010 5/16 Final
It is anticipated that 120 workers will be onboard the Dada Gorgud during the 22 month predrill programme.
5.3.4 Predrilling – Emissions, Discharges and Waste
5.3.4.1 Summary of Emissions to Atmosphere
Table 5.10 summarises the greenhouse gas (GHG) (i.e. CO2 and CH414) and non GHG
emissions predicted for predrilling. Key sources include:
MODU engines and generators; Crew change helicopters/vessels; MODU support/supply vessel engines; and Non routine flaring associated with possible well testing.
Table 5.10 Estimated GHG and Non GHG Emissions Associated with Routine and Non Routine COP Predrill Activities
MODU Rig Transfer
Power Generation Crew Change Support
VesselsWell Test Flaring TOTAL
CO2
(k tonnes) 0.3 19.0 0.5 12.7 8.5 41.1
CO(tonnes) 1 93 1 32 41 168
NOx
(tonnes) 6 353 2 234 8 603
SOx
(tonnes) 1 24 1 32 0 58
CH4
(tonnes) 0 1 0 1 83 85
NMVOC(tonnes) 0 0 0 10 54 64
GHG (k tonnes)
0.3 19.0 0.5 12.7 10.3 42.9
See Appendix 5A for detailed emission estimate assumptions.
5.3.4.2 Summary of Discharges to Sea
Table 5.11 provides a summary of estimated routine and non routine drilling fluid, cuttings and cement discharges to sea across the predrilling programme associated with planned activities. A maximum of 20 predrilled wells is assumed.
Table 5.11 Estimated Drilling Fluids and Cement Discharges to Sea Associated with COP Predrill Activities
Discharge R/NR* Frequency Location Estimated Volume
(tonnes) Discharge
Composition
Seawater, gel sweeps and cuttings
RDuring pilot and top hole drilling
Seabed4,830 (cuttings) 5,250 (seawater and gel sweeps)
Refer to Tables 5.2 and 5.5
WBM and cuttings R During surface hole drilling
To sea (via cuttings caisson)
3,100 (cuttings) 6,800 (WBM)
Refer to Tables 5.3 and 5.5
Cement and cement chemicals
RDuring each casing cementing
Seabed 440 Refer to Table 5.6
Residual WBM NRAt end of surface hole drilling (if WBM cannot be recovered / recycled)
To sea (via cuttings caisson)
3,200Refer to Tables 5.3 and 5.5
Excess cement and cement chemicals
NR
At the end of each casing section (if excess cement cannot be recovered)
Seabed 45 Refer to Section 5.3.2.5
* R – Routine, NR – Non Routine
14 To convert to CO2 equivalent the predicted volume of CH4 is multiplied by a global warming potential of 21.

AIOC Chirag Oil Project Environmental & Socio-Economic Impact Assessment
Chapter 5: Project Description
February 2010 5/17 Final
Planned discharges associated with cooling water, desalination unit returns, treated black water and grey water, drainage, ballasting and galley waste from the MODU and support vessels are described in Table 5.9 above.
5.3.4.3 Summary of Hazardous and Non Hazardous Waste
The estimated quantities of non hazardous and hazardous waste generated during the predrill programme are provided in Table 5.12. Waste quantities have been estimated based on operational data from the drilling programmes of the previous ACG Phases, assuming that a maximum of 20 wells will be predrilled over a 22 month period.
Solid and liquid waste generated will be shipped to shore and managed in accordance with the Waste Management principles detailed in Chapter 14.
Table 5.12 Estimated Hazardous and Non Hazardous Waste Associated with Predrilling Activities1
Type Waste Category2 Sub Category Estimated Volume (tonnes) General waste Non hazardous non recyclable
waste Food/galley waste 285
Cooking oil Electrical cable Paper and card
Plastics Recyclable waste
Scrap metal and wood
95
Nonhazardous waste
Total (Non hazardous) 380 Batteries
Drum/cansCement
Clinical waste Oil filter parts
Oily rags
Solid hazardous waste
Paint cans contaminated with uncured paint
210
Non-water based drill cuttings3 - 21,000Used drilling fluids - 1,020
Acids and alkalis AntifreezeChemicals
Fuel oil Grease
Oil Paint
Paint sludge Solvents and thinners
Photographic developing fluids
Hazardous liquid waste
Oily and contaminated water
430
Hazardous waste
Total (Hazardous) 22,6601 Treatment and disposal routes are detailed in Section 5.12.2. 2 Estimates include key waste types. Minor non hazardous wastes including used tyres, toner cartridges and intermediate bulk
containers are excluded. 3 Includes associated mud, which is not separated on board the MODU.
AIOC Chirag Oil Project Environmental & Socio-Economic Impact Assessment
Chapter 5: Project Description
February 2010 5/18 Final
5.4 Onshore Construction and Commissioning of Offshore Facilities
5.4.1 Introduction
Fabrication of the jacket, topside and drilling facilities will be performed in Azerbaijan. The tender process for the selection of the construction contractors is planned for completion by the first quarter of 2010. It has been assumed for the purposes of this ESIA, that a combination of the following construction yards may be used:
Baku Deep Water Jacket Factory (BDJF) yard15: Used extensively during the ACG Projects. It is planned that the jacket will be constructed at the BDJF yard; Zykh yard: Used during the Shah Deniz Project; and Construction yards located on the western fringe of the Bibi Heybet oil field:Either in the South Dock16 or the yard previously used to construct the ACG DWG-PCWU and Central Azeri Compression and Water Injection (CA-CWP) offshore facilities17.
The location of these yards is described in Chapter 6: Environmental Description.
5.4.2 Upgrade Works and Yard Reactivation
COP construction activities will require a number of minor upgrade works to be undertaken at the selected construction yards. The scope of the upgrades is dependant on which elements of jacket, topside and drilling facilities construction are undertaken at each yard. Potential upgrade scopes include:
New steel rolling equipment for jacket fabrication; Extensions of the yard real estate to allow for equipment storage and fabrication; Ground improvement work to increase the weight bearing capacity – e.g. piling work,
backfilling and ground compaction; Electrical system upgrades; and New or refurbishments of the existing site support facilities, electrical systems, material
storage areas and waste handling facilities.
In addition to yard upgrades, the STB-01 topside transport and jacket launch barge will be strengthened to increase its topside transport capacity during 2011. Work to upgrade the STB-01 will take place at the quayside of the selected construction yard and is expected to include:
Addition of external sponsons in the stern area to increase the vessel’s stability; and Strengthening the internal and external structure with steel.
The DBA crane vessel will be reactivated ahead of drilling template activities. Potential modifications may be undertaken prior to mobilisation for jacket and topside installation activities.
The pipelay barge will undergo a condition survey prior to mobilisation to determine the requirement for any upgrade works. No major upgrade works to the barge are expected.
15 Referred to in previous ACG Project ESIAs as Shelfprojectsroi (SPS). 16 Operated by the Caspian Shipyard Company (CSC). 17 Operated by Amec-Tekfen-Azfen (ATA).

AIOC Chirag Oil Project Environmental & Socio-Economic Impact Assessment
Chapter 5: Project Description
February 2010 5/19 Final
5.4.3 Materials Transportation
Materials and prefabricated components/modules will arrive at the construction sites by road, rail, sea and air using the transportation routes established for the previous ACG Project construction programmes.
Goods arriving via sea can travel by two main routes. From the Mediterranean and Black Sea, vessels must pass through the Don-Volga canal system. Cargoes following the Baltic Sea route, would be transhipped at St. Petersburg and travel along the Baltic-Volga system. These routes are not available during the ice season (November - April).
Rail links are available from Poti in Georgia and Riga in Latvia. Deliveries by road from Europe would be through Turkey and Georgia and via Iran. Figure 5.6 illustrates potential transport routes.
Figure 5.6 Import Routes to Azerbaijan
While available transport routes can be identified, the likely use of each and what will be transported cannot be determined with any certainty until the procurement strategy and award of construction contracts has been made.
5.4.4 Jacket and Piles
The COP jacket, an 8 legged, braced, steel structure, will support the topside and will be designed for installation over the drilling template. The jacket structure will be approximately 185m tall, extending approximately 15m above the sea surface. The top of the jacket will be a “twin tower” configuration to enable “float over” installation of the topside deck. The design of the base will incorporate 3 pile sleeves at each of the 4 corners into which the 12 foundation piles will be driven.18
18 Refer to Appendix 5E for the WC-PDQ platform seismic design details.

AIOC Chirag Oil Project Environmental & Socio-Economic Impact Assessment
Chapter 5: Project Description
February 2010 5/20 Final
To construct the jacket, steel plate received at the fabrication yard, will be cut and shaped as required and then welded together with any prefabricated elements that are not constructed in country, to form the various sectional pieces. Section and weld joints will be integrity tested using Non Destructive Testing (NDT) prior to grit blasting in preparation for painting.
The majority of grit blasting and anti corrosion painting of jacket and pile components will be undertaken in a paint shop with a fume extraction and grit recovery system in place. Grit blasting and anti corrosion painting of sections which are too large are to be accommodated within a paint shop will be undertaken within a temporary enclosure. Waste grit and paint will be collected and disposed of in accordance with the Waste Management Process (see Chapter 14). Cathodic protection will be provided by zinc-aluminium sacrificial anodes. The jacket sections will then be transferred to the assembly skidway, where they will be crane lifted into position and welded to other jacket sections to form the complete structure.
Two buoyancy tanks will be placed on either side of the jacket (see Section 5.6.2 below). The current plan is to reuse the ACG Phase 2 tanks, which will be cleaned and integrity checked using an inert gas and potentially a helium tracer prior to use. Figure 5.7 shows the various stages of jacket fabrication.
The 12 foundation piles (each 96” diameter and approximately 130m in length) will be assembled, inspected and tested at the construction yard in a similar manner to the jacket.
Figure 5.7 Jacket Fabrication Process
5.4.5 Drilling Modules
Unlike previous ACG projects, the COP drilling module elements will be constructed in country. The Drilling Support Module (DSM), Drilling Derrick and Drilling Equipment Set (DES), will be constructed up to mechanical completion over approximately 16 months at the selected drilling module construction yard. Activities will predominantly include cutting, shaping, erecting and welding of steel, pipefitting, grit blasting and painting of steel and pipework in dedicated paint shops. Once mechanical completion has been achieved, the DSM and DES will be transported for installation on the topside. Depending on the construction yard selected, the drilling module elements may be moved to the topside yard by crane or loaded onto a barge and transported by sea over approximately 3 days. Onshore
1. Build and roll up left frames 2. Build and roll up right frames. Weld the frames together
3. Move structure onto skid way and weld other jacket section to the frame
4. Attach one buoyancy tank and weld other jacket sections to the frame
5. Attach second buoyancy tank and load out onto STB-01 transportation barge

AIOC Chirag Oil Project Environmental & Socio-Economic Impact Assessment
Chapter 5: Project Description
February 2010 5/21 Final
testing (including onshore test drilling), pre-commissioning and operator training of the drilling module is expected to take approximately 8 months.
5.4.6 Topside
The COP topside will be a steel structure erected from steel girders, steel stanchions, trusses and cross beams, which form and enclose decks and modules. Equipment, both electrical and mechanical will be installed into the topside modules. The topside will comprise a number of decks including an upper deck, weather deck, mezzanine deck, cellar deck and under deck. These will support the following:
Living Quarters; Power Generation Skids; Drilling Support Module; DES; Separation System; Gas Compressor Systems; Pig Launchers; Manifold; Flare Boom; Main Oil Line Pump; Wellbay Module; Equipment Room; Switchroom Module; and Utility Systems.
The main topside structure and decks will be fabricated at the selected topside construction yard. Prefabricated and imported components and modules will either be transported from international fabrication yards or fabricated in other Baku construction yards.
Steel plate will be cut, shaped and welded to form the topside structural elements. The sections will then be grit blasted and painted with anti-corrosion paint. Prefabricated utility and process equipment will be lifted into place using cranes, installed into the structural frame, secured and then fitted with power and piping connections as required. A single flare boom structure for the offshore platform, comprising a steel lattice frame structure, will be attached to the integrated deck in the construction yard. All deck frame and component weld joints will be tested using NDT methods. Figure 5.8 shows the general topside construction approach.
Figure 5.8 Topside Construction Process
1. Fabricate truss lines and position on skidway.
2. Infill cellar deck and commence equipment installation.
3. Install mezzanine and weather decks and start pipe erection.
4. Install drilling modules, derrick, living quarters and power generation.
5. Install separation module, complete equipment, piping and cable installation.
6. Jack up and install loadout and installation frame ready for loadout onto barge.

AIOC Chirag Oil Project Environmental & Socio-Economic Impact Assessment
Chapter 5: Project Description
February 2010 5/22 Final
5.4.7 Testing and Pre-Commissioning
The topside module elements including processing equipment and utilities will be tested onshore and where practicable, pre-commissioned. Testing will include hydrotesting of pipework and/or pressurised gas tests (using nitrogen with a 1% helium trace for detection). Onshore hydrotesting of the topside will be performed using potable water (where practicable) or seawater dosed with sodium hypochlorite (a sterilising agent) at a concentration of 2 mg/l. On completion of the pressure test, the water will be reused where possible. If the water cannot be reused on site, it will be neutralised and discharged to the site sewer network or used for dust suppression on site (if required).
5.4.8 Topside Commissioning
All topside utilities will be fully commissioned at the construction yard over an approximate 10 month period.
Partial commissioning (comprising system testing) of the platform process systems will also be undertaken where possible, including:
The fuel gas system; The Main Oil Line (MOL) pumps; The flare system; The flash gas compression system; The export gas compression system; Chemical systems; The produced water system; and Sand separation units.
These systems will be fully commissioned once in place offshore.
5.4.8.1 Seawater System
During onshore commissioning, seawater will be supplied to the topside via a temporary seawater lift system from the quayside. The seawater system will be designed to operate at a flow rate of approximately 575m3/hr for a period of up to 6 months and will be of a similar design to that approved for previous ACG projects. Seawater will be abstracted from the construction yard quayside and discharged back to the sea after use. The design and operation of the seawater/cooling water system has been reviewed and confirmed that the temperature at the edge of the cooling water mixing zone (assumed to be 100m from the discharge point) will be no greater than 3 degrees more than the ambient water temperature19.
As mentioned above, the seawater system will be designed to incorporate continuous dosing of sodium hypochlorite at a concentration of 2mg/l. The dose rate will be controlled and checked. Prior to discharging the cooling water, a neutralising agent will be added to reduce the chlorine concentration to a safe level (i.e. to <1mg/l residual chlorine).
5.4.8.2 Freshwater System
The freshwater supply system, with a total volume of approximately 120m3, is planned to be filled with freshwater dosed with sodium hypochlorite. To ensure that the entire system is adequately sterilised, approximately 2 - 3m3 will be expelled via taps and drains, collected and analysed. The system will be sealed once it is confirmed that the target concentration of hypochlorite has been achieved throughout the system.
After sterilisation, the contents of the system will be neutralised and discharged with the cooling water to the Caspian Sea.
19 The COP Management of Change Process (Section 5.11) will be followed should any change to the design or operation of the cooling water system be required.

AIOC Chirag Oil Project Environmental & Socio-Economic Impact Assessment
Chapter 5: Project Description
February 2010 5/23 Final
5.4.8.3 Diesel Users
The main platform power generation system comprises 3 RB211 generators. Onshore commissioning of the generators using diesel is planned to include:
Each generator run separately and intermittently for a week, for up to 8 hours a day at a maximum load of approximately 26%; and
3 synchronisation tests of 8 hour duration, running 2 of the 3 generators together at a maximum load of approximately 26%.
During commissioning of the compression system and topside utilities, the intention is to run the platform generators separately and intermittently for approximately 6 months. The emergency generator and platform pedestal cranes are also planned to be commissioned onshore.
5.4.9 Load Out and Sail-away
When completed, the jacket and topside will be loaded onto the upgraded STB-01 barge for transportation to the WC-PDQ platform location.
The jacket will be manoeuvred onto the STB-01 barge and sea fastened by welding members from the jacket to the barge deck. The barge will be ballasted and trimmed to sea-tow condition. The transportation barge will be assisted by 3 attendant support vessels during sail-away. Figure 5.9 shows the DWG-DUQ jacket on the transportation barge ready for sail-away.
Figure 5.9 DWG-DUQ Jacket During Loadout
The topside will be installed with a loadout and installation frame, which can then be moved onto the STB-01 barge. As for the jacket, the barge will be assisted by 3 support vessels during sail-away. Figure 5.10 shows the East Azeri (EA) platform topside on the transportation barge.

AIOC Chirag Oil Project Environmental & Socio-Economic Impact Assessment
Chapter 5: Project Description
February 2010 5/24 Final
Figure 5.10 EA Platform Topside Onboard STB-01 Barge
The jacket piles will be transported to site by “wet float”, that is, towed in the water behind a support or supply vessel.

AIOC Chirag Oil Project Environmental & Socio-Economic Impact Assessment
Chapter 5: Project Description
February 2010 5/25 Final
5.4.10 Onshore Construction and Commissioning – Emissions, Discharges and Waste
5.4.10.1 Summary of Emissions to Atmosphere
Table 5.13 summarises the GHG (i.e. CO2 and CH4) and non GHG emissions predicted to be generated during onshore construction and commissioning from key sources which include:
Construction yard engines and generators (including plant, cranes and on site vehicles);
Volatile materials used during construction (e.g. paint and solvents); Temporary generators (during commissioning); Platform crane and emergency generators (during commissioning); and Platform main generators (during commissioning).
Table 5.13 Estimated GHG and Non GHG Emissions Associated with Routine and Non Routine COP Onshore Construction and Commissioning Activities
Jacket Construction Topside Construction and Commissioning
Drilling Module Construction TOTAL
CO2
(k tonnes) 15 30 14 59
CO(tonnes) 55 68 48 171
NOx
(tonnes) 220 310 191 721
SO2
(tonnes) 19 48 16 83
CH4
(Tonnes) 1 1 1 3
NMVOC(tonnes) 18 25 14 57
GHG (k tonnes) 15 30 14 59
See Appendix 5A for detailed emission estimate assumptions.
5.4.10.2 Summary of Discharges to Sea
Planned routine discharges to the sea during COP onshore construction and commissioning will be associated with the cooling water system. In total, approximately 575m3/hr of neutralised seawater is estimated to be discharged to sea during the 6 month commissioning period (See Section 5.4.8.2).
At the construction yards there will be 3 categories of drainage water:
Black and grey water – black and grey water generated at the construction yard(s) will be collected in on site sewer pipes and sumps and then either transferred by road tanker or by sewer pipes to a municipal sewage treatment plant for treatment and disposal. If the construction yard has an operational sewage treatment plant that discharges treated effluent to the environment, the yard operator will be responsible for agreeing the discharge standard with the MENR and maintaining the discharge permit conditions stipulated by the MENR;
Hazardous area drainage – drainage water from areas in the construction yard(s) in which hazardous materials are stored, routinely used and drainage water is generated (e.g. mechanical workshops and bunded chemical storage areas), will be contained and collected from site via vacuum tanker and delivered to an appropriate licensed waste management contractor, in accordance with the site waste management procedure20; and
20 For discussion regarding spills refer to Chapter 13.

AIOC Chirag Oil Project Environmental & Socio-Economic Impact Assessment
Chapter 5: Project Description
February 2010 5/26 Final
Storm/rain water drainage - uncontaminated rainwater will be discharged directly to the onshore or marine environment to prevent flooding and ponding of water on site.
5.4.10.3 Summary of Hazardous and Non Hazardous Waste
The estimated quantities of non hazardous and hazardous waste that will be generated during onshore construction and commissioning are provided in Table 5.14. These have been estimated based on the waste records for construction of the previous ACG Phase platforms, taking into account the increased scope of onshore construction associated with the COP.
Solid and liquid waste generated will be shipped to shore and managed in accordance with the Waste Management principles detailed in Chapter 14.
Table 5.14 Estimated Hazardous and Non Hazardous Waste Associated with Onshore Construction and Commissioning Activities1
Type Waste Category2 Sub Category Estimated Volume (tonnes) General waste Non hazardous non recyclable
waste Food/galley waste 20,470
Cooking oil Electrical cable
Uncontaminated blasting grit Paper and card
Plastics
Recyclable waste
Scrap metal and wood
16,555
Nonhazardous waste
Total (Non hazardous) 37,025 Batteries
Drum/cansCement
Sand and soil Contaminated grit
Clinical waste Oil filter parts
Oily soil Sand and sludges
Oily rags
Solid hazardous waste
Paint cans contaminated with uncured paint
515
Acids and alkalis AntifreezeChemicals
Fuel oil Grease
Oil Paint
Paint sludge Solvents and thinners
Photographic developing fluids
Hazardous liquid waste
Oily and contaminated water
8,255
Hazardous waste
Total (Hazardous) 8,7701 Treatment and disposal routes are detailed in Section 5.12.2. 2 Estimates include key waste types. Minor non hazardous wastes including used tyres, toner cartridges and intermediate bulk
containers are excluded.
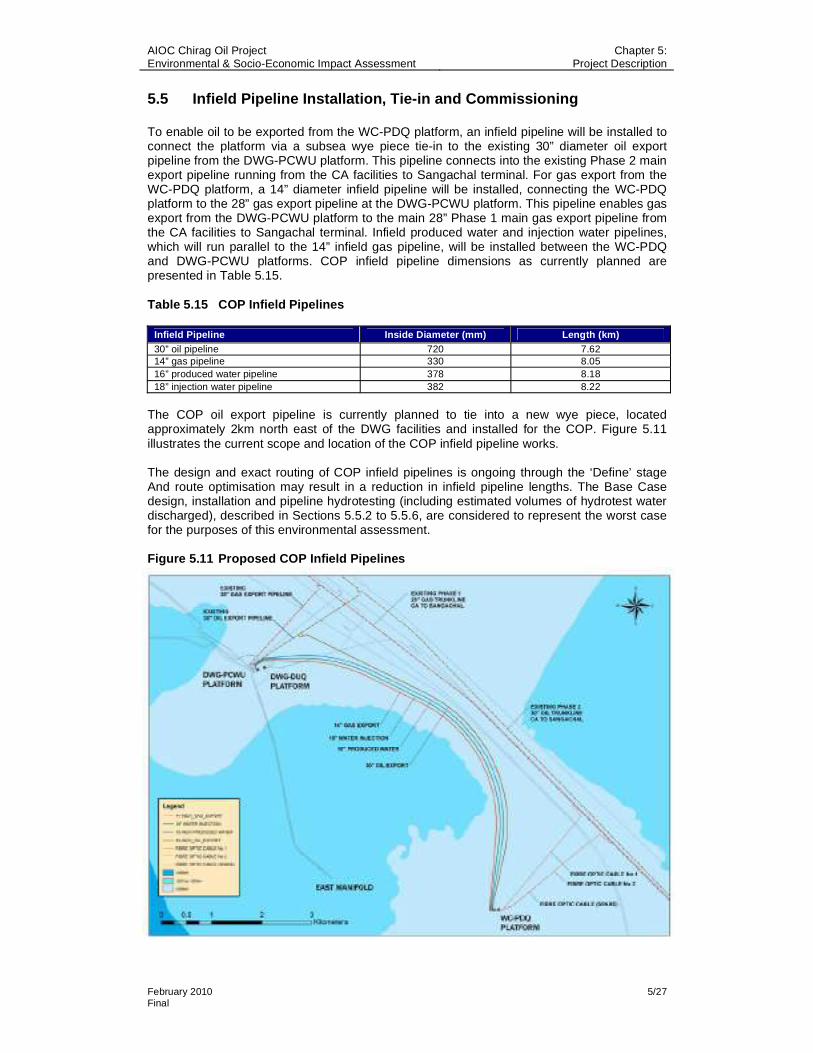
AIOC Chirag Oil Project Environmental & Socio-Economic Impact Assessment
Chapter 5: Project Description
February 2010 5/27 Final
5.5 Infield Pipeline Installation, Tie-in and Commissioning
To enable oil to be exported from the WC-PDQ platform, an infield pipeline will be installed to connect the platform via a subsea wye piece tie-in to the existing 30” diameter oil export pipeline from the DWG-PCWU platform. This pipeline connects into the existing Phase 2 main export pipeline running from the CA facilities to Sangachal terminal. For gas export from the WC-PDQ platform, a 14” diameter infield pipeline will be installed, connecting the WC-PDQ platform to the 28” gas export pipeline at the DWG-PCWU platform. This pipeline enables gas export from the DWG-PCWU platform to the main 28” Phase 1 main gas export pipeline from the CA facilities to Sangachal terminal. Infield produced water and injection water pipelines, which will run parallel to the 14” infield gas pipeline, will be installed between the WC-PDQ and DWG-PCWU platforms. COP infield pipeline dimensions as currently planned are presented in Table 5.15.
Table 5.15 COP Infield Pipelines
Infield Pipeline Inside Diameter (mm) Length (km) 30” oil pipeline 720 7.62 14” gas pipeline 330 8.05 16” produced water pipeline 378 8.18 18” injection water pipeline 382 8.22
The COP oil export pipeline is currently planned to tie into a new wye piece, located approximately 2km north east of the DWG facilities and installed for the COP. Figure 5.11 illustrates the current scope and location of the COP infield pipeline works.
The design and exact routing of COP infield pipelines is ongoing through the ‘Define’ stage And route optimisation may result in a reduction in infield pipeline lengths. The Base Case design, installation and pipeline hydrotesting (including estimated volumes of hydrotest water discharged), described in Sections 5.5.2 to 5.5.6, are considered to represent the worst case for the purposes of this environmental assessment.
Figure 5.11 Proposed COP Infield Pipelines

AIOC Chirag Oil Project Environmental & Socio-Economic Impact Assessment
Chapter 5: Project Description
February 2010 5/28 Final
5.5.1 COP Pipeline Integrity and Design
The COP infield pipeline design and materials will be consistent with that used for the previous ACG Projects. The pipelines will be constructed of carbon steel and will be designed to ensure that they are suitable for the environmental conditions including seawater properties and geo-hazards.
All the pipelines will be protected by a high integrity 3-layer polyolefin anti-corrosion coating, together with a sacrificial anode cathodic protection system. In addition, corrosion-inhibiting chemicals will be added to the hydrocarbon product before it passes through the pipeline to minimise internal corrosion.
The pipelines will be designed to be stable under 100 year extreme environmental conditions. The oil, gas and produced water pipelines will be provided with a reinforced concrete weight coating with a minimum thickness of 40mm to provide the required level of negative buoyancy. The concrete weight coating also affords protection from the mechanical impact of a dropped object or hooking anchor. The 18” water injection pipeline will be stable on the seabed without concrete coating due to the high pipeline wall thickness.
The infield gas, produced water and injection water pipelines between the WC-PDQ and DWG-PCWU platforms are planned to be routed along a common corridor, which minimises possible interference from anchoring vessels and the risk of damage due to dropped objects. The oil pipeline also follows the same route corridor for the majority of its length. Where an infield pipeline is planned to cross an existing pipeline(s), the intention is to construct crossing structures to ensure permanent separation between the pipelines.
In addition to the passive protection measures integrated into the COP pipelines design described above, pipeline integrity systems will also include the following measures
Monitoring (pressure, flow and fluid contaminant concentrations); Corrosion protection; Inspection; Emergency response; Management of change (e.g. pipeline system modifications); and Assurance.
These form part of the existing Offshore Operations Pipeline Integrity Management System (PIMS) (refer to Chapter 13).
5.5.2 Pipeline Installation
It is planned to use the pipelay barge “Israfil Guseinov” for the infield pipeline installation works. The installation methodology will be consistent with the previous ACG Projects.
On the lay-barge, each pipe section will be welded to the preceding one and the welded joints will be visually inspected and integrity tested using NDT techniques. The weld area will then be field-coated for protection with anti-corrosion material. The pipeline will be progressively deployed from the stern of the lay-barge via the “stinger”, a support boom that extends outwards from the stern of the barge.
The pipe-laying operation will be continuous with the barge moving progressively forward as sections of the pipe are welded, inspected, coated on board and then deployed to the seabed. The barge will be held in position by anchors. As pipe-laying proceeds, the anchors will be periodically moved by 2 anchor handling support vessels to pull the barge forward (with 1 more on standby). The distance of this will vary, but will typically be every 500m to 600m of pipeline length. The lateral anchor spread of the pipe-lay barge will typically be between 600m to 700m either side of the pipeline.

AIOC Chirag Oil Project Environmental & Socio-Economic Impact Assessment
Chapter 5: Project Description
February 2010 5/29 Final
In areas of soft sediment, concrete mats may be laid from a Diving Support Vessel (DSV) to provide support for the infield pipelines.
Those pipelines susceptible to temperature related lateral buckling during operation will be laid in a “lazy-S” configuration to allow their compression forces to be safely dissipated. In this case, concrete sleepers will be laid on the seabed under the pipeline so that it can move laterally in a controlled manner.
Table 5.16 summarises the estimated number and function of the vessels that will support the COP pipeline installation activities.
Table 5.16 Pipelay Support Vessels
Vessel Number Function POB
Pipelay barge 1 Pipelay 280 Anchor handling vessels 3 Positioning of pipelay barge and standby duty 15
Pipe supply vessels 4 Supplies pipe to the pipe-lay barge from the onshore pipe store
10
Pipelay barge support vessels
2 Tow pipeline barge and support functions 14
Survey vessel 1 Inspects laid pipeline DSV 1 Diver support to survey vessel
26
Table 5.17 summarises the pipelay barge and support vessel utilities.
Table 5.17 Pipelay Barge and Support Vessel Utilities
Utility DescriptionPower Generation (Israfil Guseinov) The main power provided by 5 diesel generators rated at 1,150 kW each.
Sanitary Waste Sewage systems designed to treat black water to applicable MARPOL
73/78 Annex IV: Prevention of Pollution by Sewage from Ships standards a
Sewage sludge shipped to shore for disposal
Galley Waste Vessel maceration units designed to treat food wastes to applicable MARPOL 73/78 Annex V: Prevention of Pollution by Garbage from Ships particle size standardsb prior to discharge. Non food galley waste generated by the support vessels will be collected and transported onshore for disposal via authorised contractors
Drainage/Cooling Water Deck drainage and wash water discharged to sea d
Oily bilge water tank sludges, untreated oily water and waste oil shipped to shore
Notes as per Table 5.9
Offshore pipelay activities are scheduled to last approximately 3 months.
5.5.3 Pipeline Cleaning and Hydrotesting
Following installation and prior to tie-in, each pipeline will be cleaned, gauged and hydro-tested. Treated seawater, pumped from a support vessel, will push a pig train to a temporary subsea pig trap to clean and gauge the pipeline and remove construction debris. The pig train will be removed and test flanges installed at either end of the pipeline. Hydrotesting will then be undertaken by pumping treated seawater from a support vessel to raise the pressure in the pipeline and confirm that there are no leaks. Treated seawater from cleaning, gauging and hydrotesting each infield pipeline will be discharged to the sea. Following hydrotesting of the infield oil pipeline, a new wye section will be laid, cleaned, gauged and hydrotested using treated seawater, which will be discharged to sea. (refer to Section 5.5.5 for discharge volume estimates).
To prevent corrosion and inhibit bacteria growth, seawater used for cleaning and hydrotesting will be chemically treated. A dye will also be added to the water to provide a method of

AIOC Chirag Oil Project Environmental & Socio-Economic Impact Assessment
Chapter 5: Project Description
February 2010 5/30 Final
identifying leakage during hydrotesting. The following Base Case chemicals, at the indicated dosage rates, are currently planned to be used:
300ppm Troskil 88 (biocide)21; 100ppm Tros TC 1000 (oxygen scavenger); and 100ppm Tros Seadye (dye).
In the event that different chemicals are required for commercial or technical reasons, the COP Management of Change Process (see Section 5.11) will be followed. The intent is to use chemicals no more toxic or persistent than the Base Case chemicals.
5.5.4 Oil Pipeline Wye Installation
To tie in the COP infield oil pipeline, it is planned to remove a section of the DWG oil export pipeline and connect the new wye section (refer to Figure 5.12 illustrating the installation methodology). Cleaning fluids (including wax solvents and diesel) will be used to displace the oil and minimise the amount of oil remaining on the internal surfaces of the pipeline. The cleaning fluids, together with the cleaning pig train, will be propelled through the pipeline using treated seawater (see Section 5.5.3 above for proposed chemicals and dosage rates). On completion of cleaning operations, secure isolation will be established between the target section and the oil on the main oil export pipeline side of the target section; the isolation will be provided either via the subsea valves at the trunk line wye valves, or alternatively via a high integrity piggable pipeline isolation tool (such as a smart plug). Once isolation has been verified, a section of cleaned pipeline will be removed to allow the wye to be installed and connected using 2 short spool pieces (curved connecting sections of pipeline).
Once the wye has been connected, the spools and tie ins will be hydrotested with treated seawater to confirm the integrity of the connections. During hydrotesting of the tie ins, a small volume of treated seawater (approximately 65m3) contaminated with residual hydrocarbons (approximately 100ppm) may be discharged to the marine environment. When pressure testing has been completed, the valves or isolation tool will be released and oil production from the DWG facilities will resume. Should a smart plug be used, this will be pushed along the main oil export pipeline to Sangachal Terminal by the oil export flow.
It is planned that the hydrotest and cleaning fluids from the target section cleaning activities will be displaced by the export oil flow and sent to Sangachal where they will be recovered and treated prior to disposal in accordance with Terminal procedures and permitting. If it is not practicable to recover the treated seawater (approximately 1,110m3 contaminated with approximately 100ppm residual hydrocarbon), for technical or safety reasons, it will be discharged to sea.
21 See Section 5.5.4 for dosing proposed during final produced water pipeline hydrotesting.

AIOC Chirag Oil Project Environmental & Socio-Economic Impact Assessment
Chapter 5: Project Description
February 2010 5/31 Final
Figure 5.12 Oil Pipeline Wye Installation Methodology
OR
DWG-PCWU WC-PDQ
Existing Phase II subsea 30” oil pipeline to Sangachal
2. Push cleaning fluids and cleaning pig train through target section for removal using treated seawater from DWG-PCWU.
Cleaning pig trainTo SangachalOil from CA, WA & EA
Existing Phase II subsea 30” oil pipeline to Sangachal
Oil from CA, WA & EA
Wye
To Sangachal
DWG-PCWU WC-PDQ
1. Install COP infield oil pipeline and wye. Clean, gauge and hydrotest. Cease oil export from DWG-PCWU.
5A. Resume oil export from DWG-PCWU. Launch pig with oil to push treated seawater and cleaning pig train to Sangachal.
WC-PDQDWG-PCWU
Oil from CA, WA & EA
Existing Phase II subsea 30” oil pipeline to Sangachal
To Sangachal
BASE CASE
5B. Resume oil export from DWG-PCWU. Launch pigs to push cleaning train to Sangachal and treated seawater to subsea valve for discharge (if recovery at Sangachal is not practicable)
Barrier PigTrain
DWG-PCWU
Oil from CA, WA & EA To Sangachal
Pig
Existing Phase II subsea 30” oil pipeline to Sangachal
WC-PDQ
OPTION
WC-PDQDWG-PCWU
Existing Phase II subsea 30” oil pipeline to Sangachal
3. Establish secure isolation either side of target section and remove.
To SangachalOil from CA, WA & EA
DWG-PCWU WC-PDQ
4. Connect wye using 2 short spools and hydrotest connections. Connect COP infield oil pipeline to WC-PDQ.
Existing Phase II subsea 30” oil pipeline to Sangachal
Oil from CA, WA & EA
Spools
To Sangachal
Pig
OR
DWG-PCWU WC-PDQ
Existing Phase II subsea 30” oil pipeline to Sangachal
2. Push cleaning fluids and cleaning pig train through target section for removal using treated seawater from DWG-PCWU.
Cleaning pig trainTo SangachalOil from CA, WA & EA
Existing Phase II subsea 30” oil pipeline to Sangachal
Oil from CA, WA & EA
Wye
To Sangachal
DWG-PCWU WC-PDQ
1. Install COP infield oil pipeline and wye. Clean, gauge and hydrotest. Cease oil export from DWG-PCWU.
5A. Resume oil export from DWG-PCWU. Launch pig with oil to push treated seawater and cleaning pig train to Sangachal.
WC-PDQDWG-PCWU
Oil from CA, WA & EA
Existing Phase II subsea 30” oil pipeline to Sangachal
To Sangachal
BASE CASE
5B. Resume oil export from DWG-PCWU. Launch pigs to push cleaning train to Sangachal and treated seawater to subsea valve for discharge (if recovery at Sangachal is not practicable)
Barrier PigTrain
DWG-PCWU
Oil from CA, WA & EA To Sangachal
Pig
Existing Phase II subsea 30” oil pipeline to Sangachal
WC-PDQ
OPTION
WC-PDQDWG-PCWU
Existing Phase II subsea 30” oil pipeline to Sangachal
3. Establish secure isolation either side of target section and remove.
To SangachalOil from CA, WA & EA
DWG-PCWU WC-PDQ
4. Connect wye using 2 short spools and hydrotest connections. Connect COP infield oil pipeline to WC-PDQ.
Existing Phase II subsea 30” oil pipeline to Sangachal
Oil from CA, WA & EA
Spools
To Sangachal
OR
DWG-PCWU WC-PDQ
Existing Phase II subsea 30” oil pipeline to Sangachal
2. Push cleaning fluids and cleaning pig train through target section for removal using treated seawater from DWG-PCWU.
Cleaning pig trainTo SangachalOil from CA, WA & EA
DWG-PCWU WC-PDQ
Existing Phase II subsea 30” oil pipeline to Sangachal
2. Push cleaning fluids and cleaning pig train through target section for removal using treated seawater from DWG-PCWU.
Cleaning pig trainTo SangachalOil from CA, WA & EA
Existing Phase II subsea 30” oil pipeline to Sangachal
Oil from CA, WA & EA
Wye
To Sangachal
DWG-PCWU WC-PDQ
1. Install COP infield oil pipeline and wye. Clean, gauge and hydrotest. Cease oil export from DWG-PCWU.
Existing Phase II subsea 30” oil pipeline to Sangachal
Oil from CA, WA & EA
Wye
To Sangachal
DWG-PCWU WC-PDQ
1. Install COP infield oil pipeline and wye. Clean, gauge and hydrotest. Cease oil export from DWG-PCWU.
5A. Resume oil export from DWG-PCWU. Launch pig with oil to push treated seawater and cleaning pig train to Sangachal.
WC-PDQDWG-PCWU
Oil from CA, WA & EA
Existing Phase II subsea 30” oil pipeline to Sangachal
To Sangachal
BASE CASE
5A. Resume oil export from DWG-PCWU. Launch pig with oil to push treated seawater and cleaning pig train to Sangachal.
WC-PDQDWG-PCWU
Oil from CA, WA & EA
Existing Phase II subsea 30” oil pipeline to Sangachal
To Sangachal
BASE CASE
5B. Resume oil export from DWG-PCWU. Launch pigs to push cleaning train to Sangachal and treated seawater to subsea valve for discharge (if recovery at Sangachal is not practicable)
Barrier PigTrain
DWG-PCWU
Oil from CA, WA & EA To Sangachal
Pig
Existing Phase II subsea 30” oil pipeline to Sangachal
WC-PDQ
OPTION
WC-PDQDWG-PCWU
Existing Phase II subsea 30” oil pipeline to Sangachal
3. Establish secure isolation either side of target section and remove.
To SangachalOil from CA, WA & EA
WC-PDQDWG-PCWU
Existing Phase II subsea 30” oil pipeline to Sangachal
3. Establish secure isolation either side of target section and remove.
To SangachalOil from CA, WA & EA
DWG-PCWU WC-PDQ
4. Connect wye using 2 short spools and hydrotest connections. Connect COP infield oil pipeline to WC-PDQ.
Existing Phase II subsea 30” oil pipeline to Sangachal
Oil from CA, WA & EA
Spools
To Sangachal
DWG-PCWU WC-PDQ
4. Connect wye using 2 short spools and hydrotest connections. Connect COP infield oil pipeline to WC-PDQ.
Existing Phase II subsea 30” oil pipeline to Sangachal
Oil from CA, WA & EA
Spools
To Sangachal
Pig
Direction of flow
Treated seawater
Oil
Cleaning pig train (as proposed)
Treated seawater
Treated seawater at network pressure
Treated seawaterDiesel
Diesel
SolventsSolvents
Export oil at network pressure
Key
Optional dischargeof treated seawater
Direction of flow
Treated seawater
Oil
Cleaning pig train (as proposed)
Treated seawater
Treated seawater at network pressure
Treated seawaterDiesel
Diesel
SolventsSolvents
Export oil at network pressure
Treated seawater
Treated seawater at network pressure
Treated seawaterDiesel
Diesel
SolventsSolvents
Export oil at network pressure
Key
Optional dischargeof treated seawater
BASE CASE
WC-PDQDWG-PCWU
6A. Commence oil export from WC-PDQ. Launch pig with oil to push treated seawater and cleaning pig train to Sangachal.
Oil from CA, WA & EA
Existing Phase II subsea 30” oil pipeline to Sangachal
To Sangachal
Pig
OR
OPTION
Barrier PigTrain
WC-PDQDWG-PCWU
6B. Commence oil export from WC-PDQ. Launch pigs to push treated seawater to subsea valve for discharge (if recovery at Sangachal is not practicable).
Oil from CA, WA & EA
Existing Phase II subsea 30” oil pipeline to Sangachal
To Sangachal
Pig
BASE CASE
WC-PDQDWG-PCWU
6A. Commence oil export from WC-PDQ. Launch pig with oil to push treated seawater and cleaning pig train to Sangachal.
Oil from CA, WA & EA
Existing Phase II subsea 30” oil pipeline to Sangachal
To Sangachal
Pig
BASE CASE
WC-PDQDWG-PCWU
6A. Commence oil export from WC-PDQ. Launch pig with oil to push treated seawater and cleaning pig train to Sangachal.
Oil from CA, WA & EA
Existing Phase II subsea 30” oil pipeline to Sangachal
To Sangachal
Pig
OR
OPTION
Barrier PigTrain
WC-PDQDWG-PCWU
6B. Commence oil export from WC-PDQ. Launch pigs to push treated seawater to subsea valve for discharge (if recovery at Sangachal is not practicable).
Oil from CA, WA & EA
Existing Phase II subsea 30” oil pipeline to Sangachal
To Sangachal
Pig
OPTION
Barrier PigTrain
WC-PDQDWG-PCWU
6B. Commence oil export from WC-PDQ. Launch pigs to push treated seawater to subsea valve for discharge (if recovery at Sangachal is not practicable).
Oil from CA, WA & EA
Existing Phase II subsea 30” oil pipeline to Sangachal
To Sangachal
Pig

AIOC Chirag Oil Project Environmental & Socio-Economic Impact Assessment
Chapter 5: Project Description
February 2010 5/32 Final
5.5.5 Pipeline Tie-in, Testing and Dewatering
Tie-in spool pieces will be used to connect each newly constructed pipeline to further components of the overall pipeline system. The spool pieces will be filled with treated seawater (Section 5.5.3 above provides chemical dosing details), prior to being deployed for subsea installation.
COP Produced Water and Injection Water Infield Pipelines - will connect the WC-PDQ and DWG-PCWU platforms. The completed pipelines will be cleaned, gauged (using a pig train as described above) and leak tested using treated seawater. The injection water pipeline will then be dewatered and the treated seawater discharged to the marine environment. It is planned that the produced water pipeline hydrotest water will be discharged at a later date, prior to commencement of the produced water system on the WC-PDQ platform (see Section 5.8.7). As the biocide in the pipeline will degrade over time, to minimise potential biological growth, it is planned to increase biocide dosing to 1,000 ppm in the produced water pipeline during final hydrotesting. Should there be a requirement for technical reasons to retain treated water in the COP produced water and injection water infield pipelines beyond the period when the biocide and oxygen scavenger chemicals remain at their effective concentrations, the pipelines will be dewatered and refilled with treated water at the chemical dose levels provided in Section 5.5.3. It is planned that pigging using “intelligent pigs” which incorporate instrumentation to confirm pipeline integrity, of the completed pipelines will be undertaken following the commencement of their operation (refer to Section 5.8.7). If a requirement is identified to undertake intelligent pigging during pipeline commissioning activities, approximately 1,285m3 and 1,185m3 of treated seawater may be discharged to sea from the produced water and injection water pipelines respectively.
COP Infield Oil Pipeline - will connect the WC-PDQ platform to the existing DWG-PCWU infield pipeline via the newly installed wye (see Section 5.5.4 above). Once the pipeline between the new wye and WC-PDQ platform has been installed, the pipeline will be cleaned, gauged and leak tested using treated seawater. The treated seawater will be sent to the Terminal to be recovered and treated as produced water or, if this is not practicable for technical or safety reasons, discharged to sea. Should a requirement be identified to undertake intelligent pigging during pipeline commissioning activities, approximately 3.740m3
of treated seawater may be discharged to sea.
COP Infield Gas Pipeline - will connect the WC-PDQ platform to the DWG-PCWU infield gas export pipeline. The completed pipeline will be cleaned, gauged (using a pig train as described above), leak tested using treated seawater and subsequently dewatered. Approximately 15m3 of MEG dosed with 300ppm Troskil 88 (biocide) and 100ppm Tros TC 1000 (oxygen scavenger) may be used to condition the infield gas pipeline; the Base Case is to recover the conditioning fluids and ship to shore. If this is not practicable for technical or safety reasons they will be discharged to sea. Should a requirement be identified to undertake intelligent pigging during pipeline commissioning activities, approximately 865m3 of treated seawater may be discharged to sea.
5.5.6 Summary of Pipeline Installation Discharges
Table 5.18 presents the expected volume and location of discharges associated with gauging, hydrotesting, tie-in, testing and dewatering of the infield COP pipelines, including potential discharges when recovery is not practicable for technical or safety reasons. The table includes estimated volumes should additional tests of the full length of the pipelines be required for safety reasons.

AIOC Chirag Oil Project Environmental & Socio-Economic Impact Assessment
Chapter 5: Project Description
February 2010 5/33 Final
Table 5.18 Estimated Pipeline Gauging, Hydrotesting, Tie-in, Leak Tests and Dewatering Discharges
Pipeline Activity Discharge Location
Estimated Discharge Volume (m3)
Total Estimated Discharge
Volume (m3)3
Clean and gauge Seabed 165 Hydrotest Surface 20 Tie-ins at WC-PDQ SSIV (Pipeline) Tie-ins at WC-PDQ SSIV (Spool) Tie-ins at WC-PDQ (Riser) Tie-ins at PCWU
Seabed 25
Final gauging connected system Leak test Valve leak test Dewater pipeline following full length test1
2,670
Option: If recovery is not practicable: Condition pipeline using MEG
15
OptionIntelligent pigging
45-50m below surface
865
3,760
(includes optional discharges)
Clean and gauge pipeline and wye Seabed 725 Hydrotest pipeline and wye Surface 65 Option: If recovery is not practicable:Treated seawater from DWG-PCWU target section (discharge includes 100ppm hydrocarbons).
Seabed 1,110
Tie-ins at wye (pipeline) Tie-ins at wye (spool) Tie-ins at WC-PDQ (pipeline & riser) Tie-ins at check valve (spool) Final gauging connected system
Seabed 3,760
Leak test 45-50m below
surface65
Valve leak test Surface 1 Tie-ins at wye (spool) 5 Tie-ins at wye (spool - DWG-PCWU) (discharge includes 100ppm hydrocarbons).
Seabed65
Leak test Leak test topsides pipework
45-50m below surface
85
Option: If recovery is not practicable: Dewater pipeline following full length test1 8,365
OptionIntelligent pigging
Seabed3,740
17,986
(includes optional discharges)
Clean and gauge Seabed 230 Hydrotest Surface 25 Tie-ins at WC-PDQ Tie-ins at DWG-PCWU
Seabed 5
Final gauging connected system Leak test Leak test topsides pipework Dewater pipeline following full length test 1
3,690
OptionIntelligent pigging
45-50m below surface
1,185
5,135
(includes optional discharges)
Clean and gauge Seabed 245 Hydrotest Surface 25 Tie-ins at WC-PDQ Tie-ins at DWG-PCWU
Seabed 5
Final gauging connected system Leak test Leak test topsides pipework Dewater pipeline following full length test 1,2
3,995
OptionIntelligent pigging
45-50m below surface
1,285
5,555
(includes optional discharges)
1 Includes estimated volume should additional testing be necessary. 2 The produced water pipeline will be dewatered prior to commencement of the produced water system on the WC-PDQ platform
(refer to Section 5.8.7.1)
Tie-in, testing and dewatering activities (except for the produced water pipeline) are expected to be undertaken over a 12 month period, assisted by up to 5 support vessels.

AIOC Chirag Oil Project Environmental & Socio-Economic Impact Assessment
Chapter 5: Project Description
February 2010 5/34 Final
5.5.7 Pipeline Installation, Tie-in and Commissioning – Emissions, Discharges and Waste
5.5.7.1 Summary of Emissions to Atmosphere
Table 5.19 summarises the GHG (i.e. CO2 and CH4) and non GHG emissions predicted to be generated during pipeline installation, tie-in and commissioning from key sources which include:
Pipelay barge and support vessel engines and generators; and Commissioning vessel engines.
Table 5.19 Estimated GHG and non GHG Emissions Associated with Routine and Non Routine Pipeline Installation, Tie-in and Commissioning Activities
Installation Commissioning TOTAL
CO2
(k tonne) 40.5 31.5 72
CO(tonnes) 181 79 260
NOx
(tonnes) 1,333 584 1,917
SOx
(tonnes) 181 79 260
CH4
(tonnes) 6 3 9
NMVOC(tonnes) 54 24 78
GHG (k tonnes) 41 32 73
See Appendix 5A for detailed emission estimate assumptions.
5.5.7.2 Summary of Discharges to Sea
Routine and non routine discharges to the sea during pipeline installation, tie-in and commissioning comprise:
Pipeline cleaning and hydrotest fluids (refer to Section 5.5.6 above); and Pipelay and support vessel discharges as described within Table 5.17.
5.5.7.3 Summary of Hazardous and Non Hazardous Waste
The estimated quantities of non hazardous and hazardous waste that will be generated during the pipeline and platform installation, tie-in and commissioning programme are provided in Section 5.6.7.3 Table 5.23.
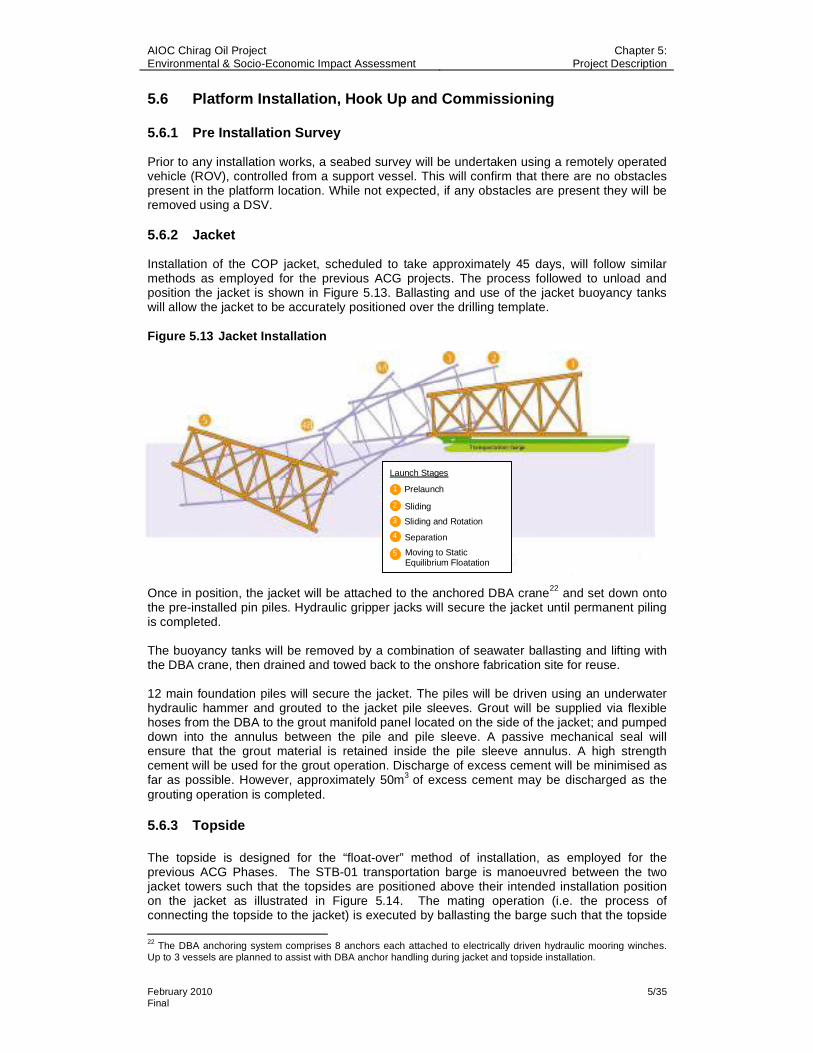
AIOC Chirag Oil Project Environmental & Socio-Economic Impact Assessment
Chapter 5: Project Description
February 2010 5/35 Final
5.6 Platform Installation, Hook Up and Commissioning
5.6.1 Pre Installation Survey
Prior to any installation works, a seabed survey will be undertaken using a remotely operated vehicle (ROV), controlled from a support vessel. This will confirm that there are no obstacles present in the platform location. While not expected, if any obstacles are present they will be removed using a DSV.
5.6.2 Jacket
Installation of the COP jacket, scheduled to take approximately 45 days, will follow similar methods as employed for the previous ACG projects. The process followed to unload and position the jacket is shown in Figure 5.13. Ballasting and use of the jacket buoyancy tanks will allow the jacket to be accurately positioned over the drilling template.
Figure 5.13 Jacket Installation
Once in position, the jacket will be attached to the anchored DBA crane22 and set down onto the pre-installed pin piles. Hydraulic gripper jacks will secure the jacket until permanent piling is completed.
The buoyancy tanks will be removed by a combination of seawater ballasting and lifting with the DBA crane, then drained and towed back to the onshore fabrication site for reuse.
12 main foundation piles will secure the jacket. The piles will be driven using an underwater hydraulic hammer and grouted to the jacket pile sleeves. Grout will be supplied via flexible hoses from the DBA to the grout manifold panel located on the side of the jacket; and pumped down into the annulus between the pile and pile sleeve. A passive mechanical seal will ensure that the grout material is retained inside the pile sleeve annulus. A high strength cement will be used for the grout operation. Discharge of excess cement will be minimised as far as possible. However, approximately 50m3 of excess cement may be discharged as the grouting operation is completed.
5.6.3 Topside
The topside is designed for the “float-over” method of installation, as employed for the previous ACG Phases. The STB-01 transportation barge is manoeuvred between the two jacket towers such that the topsides are positioned above their intended installation position on the jacket as illustrated in Figure 5.14. The mating operation (i.e. the process of connecting the topside to the jacket) is executed by ballasting the barge such that the topside 22 The DBA anchoring system comprises 8 anchors each attached to electrically driven hydraulic mooring winches. Up to 3 vessels are planned to assist with DBA anchor handling during jacket and topside installation.
Launch Stages
2
3
4
5
1
Separation
Sliding and Rotation
Sliding
Prelaunch
Moving to Static Equilibrium Floatation

AIOC Chirag Oil Project Environmental & Socio-Economic Impact Assessment
Chapter 5: Project Description
February 2010 5/36 Final
engages with shock absorbers in the jacket legs and the load is transferred. Sand jacks are then used to lower the topside until steel faces mate and are ready for welding. It is estimated that approximately 35m3 of sand will be released from the 8 sand jacks during this process and discharged to the sea. Topside installation is scheduled to take approximately 2 days.
Figure 5.14 Topsides “Float-Over” Installation Method
5.6.4 Topside Hook Up and Commissioning
Once the topside is installed, a number of offshore hook up activities will need to be completed on the topside prior to start up. These will include:
Installation of the WC-PDQ firewater and seawater lift pumps and caissons; Installation of the hazardous open drains caisson pump; Installation of the buy back valve control system23; Tie-ins to all risers; and Connection of all umbilicals (including subsea cabling).
During installation of the buy back valve control system, it is not planned to discharge any hydraulic fluids, however approximately 0.1 litres of water/glycol based fluids of the same specification and environmental performance as used for previous ACG hydraulic control systems may be discharged to the marine environment.
Commissioning will commence with living quarters and utility systems including the main power generators. The systems will then be started up, allowing workers to inhabit the platform during commissioning and start up of the process facilities.
The current Base Case assumes that power during commissioning (until first oil) will be provided by the main platform generators, using fuel gas received from the “buy back system”24 from the 28” marine export gas pipeline (through a connection near to CA). 23
Refer to Section 5.8.6.3 for further details24 See Section 5.8.6.1

AIOC Chirag Oil Project Environmental & Socio-Economic Impact Assessment
Chapter 5: Project Description
February 2010 5/37 Final
Alternatively, if not feasible for technical or safety reasons, four 1MW temporary diesel generators may be used for approximately 5 months through the commissioning period.
Commissioning of the deluge and foam systems is predicted to result in approximately 200 litres of seawater and approximately 20 litres of aqueous film forming foam (AFFF) (mixed with 140m3 of seawater) discharged via the WC-PDQ open drains caisson to the sea at 49.5m below sea level .
5.6.5 DWG-PCWU Brownfield Works
Brownfield works on the DWG-PCWU platform will comprise the following:
Installation of a riser ladder (which will be floated out) that includes risers for the produced water coming to the DWG-PCWU platform from the WC-PDQ platform and the injection water transported from DWG-PCWU to the COP water injection wells;
Installation of a produced water pig receiver/launcher and injection water pig launcher/receiver;
Tie-in to the injection water and produced water systems on the DWG-PCWU platform; All piping and control systems for the required piping runs; and Installation of a hazardous open drains line to cover the areas where the additional
equipment is installed.
Up to 50 days of diving works using a DSV will be required to install and secure the risers and frames to the DWG-PCWU jacket. Some of this work can take place when the PCWU platform is operational. However, it is expected that a shutdown of the DWG-PCWU platform of approximately 28 days will be required to complete the critical installation works. Once the shutdown procedure and programme are finalised for the DWG-PCWU platform to enable tie in to the COP platform, the potential implications of shutdown on the environmental impacts predicted for the original DWG-PCWU platform design will be considered. The results of this review will be communicated to the MENR.
Once installed and tied into the risers, the infield produced water and injection water pipelines will be hydrotested as described in Section 5.5.5 above.
Testing and commissioning of the pigging equipment and water systems’ controls will be undertaken. This equipment will be commissioned using the power generation and utility systems in place on the DWG-PCWU platform and will not require any temporary equipment.
5.6.6 Installation, Hook Up and Commissioning Vessels
Table 5.20 summarises the estimated numbers and period of use of the vessels that will support the COP platform installation, hook up and commissioning (HUC) activities and the DWG-PCWU platform brownfield works. The actual duration of the offshore installation work will be dependant on weather and other factors.
Table 5.20 Installation, Hook Up and Commissioning Vessels (Including DWG-PCWU Platform Brownfield Works)
Jacket Installation Topside Installation WC-PDQ Commissioning
and DWG-PCWU Brownfield Works Vessel
No. Duration (Days) POB No. Duration
(Days) POB No. Duration (Days) POB
DBA 1 45 160 1 2 70 1 21 160 Support vessel 3 45 4 4 2 15 2 180 15 STB-01 1 45 9 1 2 9 DSV 1 1 26 1 50 1
Note: The DBA will be used to accommodate personnel for up to 3 weeks during platform HUC.
Table 5.21 summarises the vessel utilities.

AIOC Chirag Oil Project Environmental & Socio-Economic Impact Assessment
Chapter 5: Project Description
February 2010 5/38 Final
Table 5.21 Installation, Hook Up and Commissioning Vessel Utilities
Utility DescriptionSanitary Waste
Sewage systems designed to treat black water to applicable MARPOL 73/78 Annex IV: Prevention of Pollution by Sewage from Ships standardsa
Sewage sludge shipped to shore for disposal
Galley Waste Vessel maceration units designed to treat food wastes to applicable MARPOL 73/78 Annex V: Prevention of Pollution by Garbage from Ships particle size standardsb prior to discharge. Non food galley waste generated by the support vessels will be collected and transported onshore for disposal via authorised contractors
Drainage/Cooling Water Deck drainage and wash water discharged to sead
Oily bilge water tank sludges, untreated oily water and waste oil shipped to shore
Notes as per Table 5.9
It is planned that crew changes will be by helicopter or by vessel through the installation, hook up and commissioning COP phase.
5.6.7 Platform Installation, Hook Up and Commissioning – Emissions, Discharges and Waste
5.6.7.1 Summary of Emissions to Atmosphere
Table 5.22 summarises the GHG (i.e. CO2 and CH4) and non GHG routine emissions predicted to be generated during platform installation, hook up and commissioning from key sources25 which include:
Jacket installation vessel engines and generators; Topside installation vessel engines and generators; and Support vessels engines (Hook up and transport of DWG-PCWU equipment).
Table 5.22 Predicted GHG and Non GHG Emissions Associated with Routine Installation, Hook Up and Commissioning Activities
JacketInstallation
Topside Installation Hook Up Vessels DWG Vessels TOTAL
CO2
(k tonnes) 4.8 0.3 2.9 0.02 8.0
CO(tonnes) 12 1 7 0 20
NOx
(tonnes) 88 5 54 0 147
SOx
(tonnes) 12 1 7 0 20
CH4
(tonnes) 0 0 0 0 0
NMVOC(tonnes) 4 0 2 0 6
GHG (k tonnes) 4.8 0.3 2.9 0.02 8.0
See Appendix 5A for detailed emission estimate assumptions.
25 Emissions and discharges associated with commissioning and start up activities on the platform (including crew transfer) are included within Sections 5.8.9.1 and 5.8.9.2 respectively.

AIOC Chirag Oil Project Environmental & Socio-Economic Impact Assessment
Chapter 5: Project Description
February 2010 5/39 Final
5.6.7.2 Summary of Discharges to Sea
Routine discharges to the sea during platform installation, hook up and commissioning comprise:
Ballast water during jacket installation (refer to Section 5.6.2); Minor cement losses during jacket grouting (refer to Section 5.6.2); Sand from topside jacking activities (refer to Section 5.6.3); Seawater and AFFF from deluge and foam system testing (refer to Section 5.6.4); and Installation and support vessel discharges as described within Table 5.2125.
5.6.7.3 Summary of Hazardous and Non Hazardous Waste
The estimated quantities of non hazardous and hazardous waste that will be generated during the pipeline and platform installation, hook up and commissioning programmes are provided in Table 5.23. These have been calculated using operational data gained during the previous ACG Phases.
Solid and liquid waste generated will be shipped to shore and managed in accordance with the Waste Management principles detailed in Chapter 14.
Table 5.23 Estimated Hazardous and Non Hazardous Waste Associated with Pipeline and Platform Installation, Hook Up and Commissioning Activities1
Type Waste Category2 Sub Category Estimated Volume (tonnes) General waste Non hazardous non recyclable
waste Food/galley waste 3,000
Cooking oil Electrical cable Paper and card
Plastics Recyclable waste
Scrap metal and wood
765
Nonhazardous waste
Total (Non hazardous) 3,765 Batteries
Drum/cansCement
Clinical waste Oil filter parts
Sand and sludges Oily rags
Solid hazardous waste
Paint cans contaminated with uncured paint
90
Acids and alkalis AntifreezeChemicals
Fuel oil Grease
Oil Paint
Paint sludge Solvents and thinners
Photographic developing fluids
Hazardous liquid waste
Oily and contaminated water
4,335
Hazardous waste
Total (Hazardous) 4,4251 Treatment and disposal routes are detailed in Section 5.12.2. 2 Estimates include key waste types. Minor non hazardous wastes including used tyres, toner cartridges and intermediate bulk
containers are excluded.
AIOC Chirag Oil Project Environmental & Socio-Economic Impact Assessment
Chapter 5: Project Description
February 2010 5/40 Final
5.7 Platform Drilling
5.7.1 Introduction
The COP Base Case assumes the following well requirements:
28 production wells (targeting the Pereriv and Balakhany reservoirs); 17 water injection wells; and 1 cuttings reinjection (CRI) well.
Up to 20 of these wells (16 producer wells, 3 water injection wells and the CRI well) are planned to be predrilled using a MODU as described in Section 5.3 above. Platform drilling operations will commence with re-entry and tie-back of the predrill wells to the production facilities. The Base Case incorporates two spare well slots in the platform design, future use of these is not currently defined.
The platform well designs will be the same as the predrill wells, with additional reservoir penetration achieved in the future through sidetracking. The objective of the COP is to target the Balakhany and Pereriv reservoirs, which underlay the ACG Contract Area26.
Following the tie-back of the predrilled wells, it is anticipated that platform drilling will commence in 2015 and will continue through to 2023. It is estimated that an average annual drill rate of 3.6 wells/year can be achieved, with each well taking approximately 40 days to drill and approximately 40 days to complete. Sidetrack drilling operations and well workover (i.e. well maintenance/remedial works) will be undertaken as per drilling requirements once the drilling programme is finalised.
5.7.2 Platform Drilling Facilities
Drilling facilities will comprise the DES and DSM. The DES will be a moveable rig, which can be positioned, by means of hydraulic rams, over each of the drilling slots. It will comprise the following principal equipment items:
Drilling equipment and pipe handling systems; Power swivel; Mast/Derrick; Draw works; Well control system; Solids control system; Drilling waste management system, including the CRI system; Ship-to-shore system; Drilled cuttings containment system; and Rig skidding system.
The DSM is a fixed unit, which is used for the storage and mixing of mud, cement and other chemicals necessary to support drilling. The module comprises the following principal equipment items:
Pipe rack and lay-down area; Low and high pressure mud systems; Mud chemical stores; Fluid and dry bulk stores; Mud mixing; Cementer Unit; 3 x cement powder storage tanks; Hazardous stores; and Forklift.
26 The depth of water at the drilling location is 169m.

AIOC Chirag Oil Project Environmental & Socio-Economic Impact Assessment
Chapter 5: Project Description
February 2010 5/41 Final
Power will be supplied to the drilling facilities by the main platform generators (see Section 5.8.6.4) and, when required, by the platform emergency power generators.
5.7.3 Predrill Well Tie-in and Re-entry
Conductors on the platform will be installed into each predrilled well, which will then be connected to the production manifolds. Following the removal of the mechanical plug and suspension fluids, viscous sweeps will be circulated within the well.
Table 5.24 presents the expected suspension fluids that will be displaced per well re-entry and the volume of viscous sweeps chemicals used per well.27. The suspension fluid and sweeps associated with predrill well re-entry will be sent to the CRI well, when available. Prior to the CRI well being tied-back and when it is not available, suspension fluids and sweeps will be recovered and shipped to shore. It is not planned to discharge suspension fluids and associated viscous sweeps.
Table 5.24 Estimated Suspension Fluid Chemicals and Viscous Sweeps
Chemical/Fluid1 Function Estimated Use per Well (tonnes)2
HazardCategory3
Suspension Fluids
M-I Cide / Glutaraldehyde
Biocide 0.6 E/GOLD
OS1-L Oxygen Scavenger 0.4 E
Safe-Cor Corrosion Inhibitor 2.5 E
Viscous Sweeps
Freshwater Circulation fluid 120 N/A
Bentonite Viscosifier 11 E
Guar Gum Viscosifier 2 E
Gluteraldehyde Biocide 0.1 GOLD Notes as per Table 5.2
Completion of the predrill wells to achieve first oil will comprise drilling of the 8½” reservoir hole, the installation of downhole sand control systems, described in Section 5.7.8, and installation of the upper completion system.
5.7.4 Platform Well Design
Table 5.25 below summarises the platform well design, the drilling mud system for each hole section and the respective disposal or discharge route.
27 The COP Management of Change Process (Section 5.11) will be followed should alternative chemicals be required.
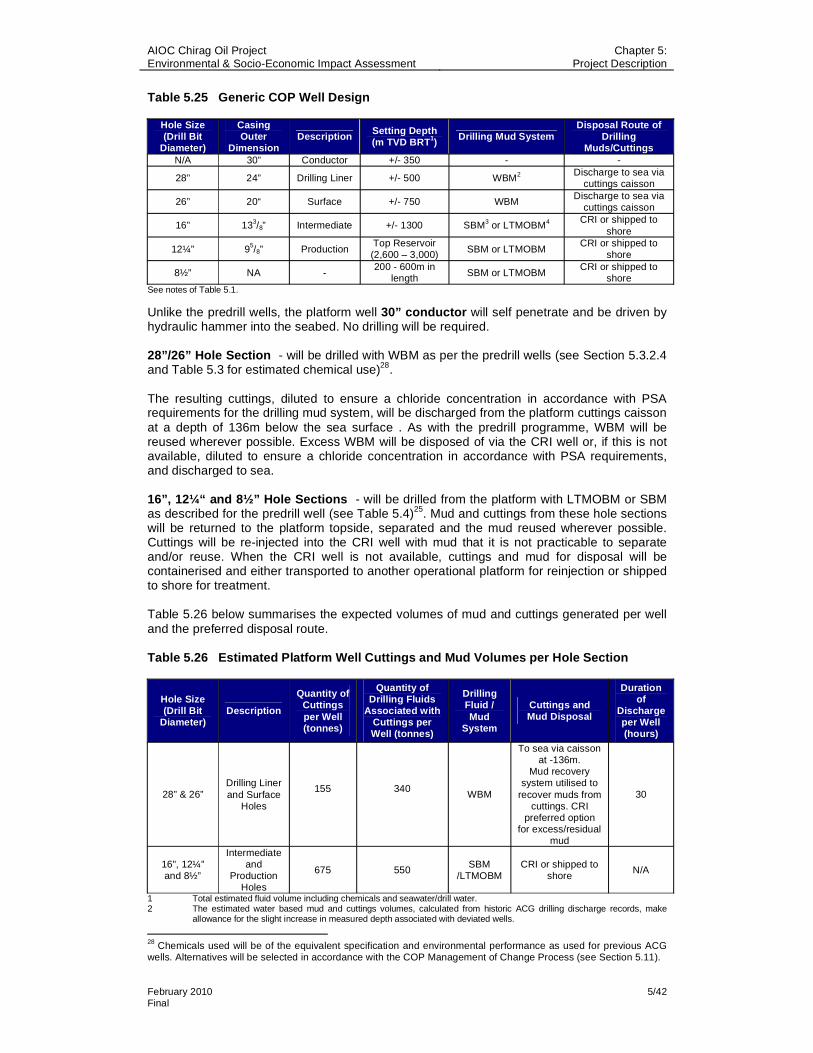
AIOC Chirag Oil Project Environmental & Socio-Economic Impact Assessment
Chapter 5: Project Description
February 2010 5/42 Final
Table 5.25 Generic COP Well Design
Hole Size (Drill Bit
Diameter)
Casing Outer
Dimension Description Setting Depth
(m TVD BRT1) Drilling Mud System Disposal Route of
DrillingMuds/Cuttings
N/A 30” Conductor +/- 350 - -
28” 24” Drilling Liner +/- 500 WBM2 Discharge to sea via cuttings caisson
26” 20“ Surface +/- 750 WBM Discharge to sea via
cuttings caisson
16” 133/8” Intermediate +/- 1300 SBM3 or LTMOBM4 CRI or shipped to shore
12¼” 95/8” Production Top Reservoir (2,600 – 3,000) SBM or LTMOBM
CRI or shipped to shore
8½” NA - 200 - 600m in
length SBM or LTMOBM CRI or shipped to
shoreSee notes of Table 5.1.
Unlike the predrill wells, the platform well 30” conductor will self penetrate and be driven by hydraulic hammer into the seabed. No drilling will be required.
28”/26” Hole Section - will be drilled with WBM as per the predrill wells (see Section 5.3.2.4 and Table 5.3 for estimated chemical use)28.
The resulting cuttings, diluted to ensure a chloride concentration in accordance with PSA requirements for the drilling mud system, will be discharged from the platform cuttings caisson at a depth of 136m below the sea surface . As with the predrill programme, WBM will be reused wherever possible. Excess WBM will be disposed of via the CRI well or, if this is not available, diluted to ensure a chloride concentration in accordance with PSA requirements, and discharged to sea.
16”, 12¼“ and 8½” Hole Sections - will be drilled from the platform with LTMOBM or SBM as described for the predrill well (see Table 5.4)25. Mud and cuttings from these hole sections will be returned to the platform topside, separated and the mud reused wherever possible. Cuttings will be re-injected into the CRI well with mud that it is not practicable to separate and/or reuse. When the CRI well is not available, cuttings and mud for disposal will be containerised and either transported to another operational platform for reinjection or shipped to shore for treatment.
Table 5.26 below summarises the expected volumes of mud and cuttings generated per well and the preferred disposal route.
Table 5.26 Estimated Platform Well Cuttings and Mud Volumes per Hole Section
Hole Size (Drill Bit
Diameter) Description
Quantity of Cuttings per Well (tonnes)
Quantity of Drilling Fluids
Associated with Cuttings per Well (tonnes)
DrillingFluid / Mud
System
Cuttings and Mud Disposal
Duration of
Discharge per Well (hours)
28” & 26” Drilling Liner and Surface
Holes
155 340WBM
To sea via caisson at -136m.
Mud recovery system utilised to
recover muds from cuttings. CRI
preferred option for excess/residual
mud
30
16”, 12¼” and 8½”
Intermediateand
ProductionHoles
675 550 SBM
/LTMOBMCRI or shipped to
shoreN/A
1 Total estimated fluid volume including chemicals and seawater/drill water. 2 The estimated water based mud and cuttings volumes, calculated from historic ACG drilling discharge records, make
allowance for the slight increase in measured depth associated with deviated wells.
28 Chemicals used will be of the equivalent specification and environmental performance as used for previous ACG wells. Alternatives will be selected in accordance with the COP Management of Change Process (see Section 5.11).

AIOC Chirag Oil Project Environmental & Socio-Economic Impact Assessment
Chapter 5: Project Description
February 2010 5/43 Final
A total of approximately 18 tonnes of residual WBM per well, diluted to achieve the PSA chloride standard, may be discharged should recovery/reuse or reinjection not be possible.
5.7.5 Cuttings Treatment and Disposal
Mud and cuttings from both the surface and lower holes will be returned to the platform. Each will pass through a shale shaker screen system to separate and recover the muds from the cuttings. The WBM cuttings will be discharged to the platform cuttings caisson and the mud stored for reuse. The SBM/LTMOBM cuttings will be routinely treated for reinjection as described below.
5.7.5.1 Cuttings Reinjection
In addition to used SBM and/or LTMOBM mud and cuttings, contaminated WBMs, used contingency and well clean up chemicals, predrill and batch suspension fluids, produced sand from the processing facilities, sewage sludge and waste streams previously approved by the MENR for offshore reinjection, may also be sent to the CRI well for disposal29.
Figure 5.15 below illustrates the cuttings reinjection process.
After separation by the shale shaker screens, the cuttings will be mixed with seawater and the resulting slurry milled. The slurry, injected with a viscosifier, oxygen scavenger and biocide, will then be pumped downhole into the CRI well either continuously or in batches. The slurry enters sub surface fractures created by injecting high pressure water into the well. The fracture characteristics are controlled by the flowrate, pressure and properties of the slurry. Injection rates and batch sizes will vary across the PSA period30.
Figure 5.15 Cuttings Reinjection Process
5.7.5.2 Cuttings Reinjection Well Design
The COP CRI well location, design and operation has been based on the findings of two major studies,31,32 which include detailed analysis and consideration of the following:
Estimating the total volume of drilling and completion wastes expected from the proposed development;
Assessing the technical and environmental suitability of overburden formations for burial of waste. This includes an understanding of stress and permeability barriers in the target formation that provide containment to ensure the waste domain does not
29 Refer to Appendix 5B for previously approved waste streams. 30 See ACG Phase 1 and 3 ESIAs for a full description of the cuttings reinjection process. 31 Subsurface Burial of Well Construction Wastes from the DWG field Development, Gidatec Ltd., March 2005 32 Disposal of Drill Cuttings from the Azeri Field Development: A Re-Injection Feasibility Study, BP Sunbury report UTG/245/01, May 2001
AIOC Chirag Oil Project Environmental & Socio-Economic Impact Assessment
Chapter 5: Project Description
February 2010 5/44 Final
grow upward to surface, into shallow faulted zones or over-pressured zones. Similarly, this assessment ensures that the waste domain does not grow downwards into reservoirs or deeper over-pressured zones;
Numerical simulation of the injection process to define the geometry of the waste domain and the limit for the volume of waste that can be buried safely in the targeted formation. This includes numerical simulation of fracture development and containment over time which requires understanding of the overall subsurface stress state;
Estimation of surface injection pressures and slurry re-injection rates required to sustain the burial operation, plus possible constraints in achieving these parameters;
Examination of any constraints on subsurface re-injection posed by nearby wells and stratigraphic features, such as faults, abnormally pressured formations, mud volcanoes or offset wells, which have potential to cause communication paths to surface;
Identification of any operational and environmental issues affecting the overall success of the re-injection operation; and
Departure of the CRI well design required from normal ACG well design to prevent pressure-up of drill-through intervals.
Compliance with these findings and BP’s internal CRI well policy33, has formed the basis of design for the COP CRI well. In addition to initial well design, the two studies consider well-life through operations, surveillance, well workover and well abandonment.
The preferred location for the COP CRI well is away from the crest and on the north-eastern flank of the anticline structure in the base of the Surakhany formation. This is because there is little risk of the disposal fractures intersecting any of the COP production and water injection wells and also prevents pressurisation of drill-through zones for the COP wells. Additionally, there are some overlying sand/silts that provide redundant capacity in the event that fracture containment is breached.
The top of the Surakhany formation, marked by a 3m-thick cap-rock of gypsum, is composed predominately of yellowish-brown and gray-green claystone with thin beds of gypsum and anhydrite and fine-grained argillaceous sandstone. In addition, subordinate halite has been noted from traces found in claystone cuttings in association with the evaporite-sandstone beds. The claystone is moderately calcareous and dolomitic, with occasional thin dolostone stringers found in conjunction with gypsum beds. The lower part of the section consists of olive-gray to yellowish-brown claystone with thin interbedded gray-white siltstones and sandstones that increase in frequency to the base of the formation, making the lower Surakhany suitable as the disposal target.
Cuttings/slurry capacity determination is based on specific well conditions as drilled, which is a function of formation porosity and thickness characteristics. Should the COP CRI well fail to provide the required performance or capacity or otherwise fails during service there is sufficient appropriately located volume within the Surakhany formation within the drilling radius of the COP platform for an additional CRI well to be located. This is not part of the current Base Case design.
All ACG CRI wells are designed with the casing shoes located to provide redundant isolation between the injection interval and the overlying formations. Cement bond logs are run in CRI wells to ensure annular integrity.
During well operation, injection pressure trends are monitored to detect any significant deviation from the fracture growth behaviour predicted by the fracture modelling work. This would provide early indication of any fracture containment barrier being breached. Annulus pressures are continuously monitored to ensure that the mechanical integrity of the wellbore is being maintained. All CRI wells are fitted with downhole pressure and temperature gauges which provide data from just above the depth of formation injection. These gauges are used for Pressure Fall-Off testing which provide additional information regarding fracture growth and containment which can be used to calibrate the fracture models.
33 BP DCRI Manual, BP Intranet: http://ut.bp.web.bp.com/drillcuttingreinjection/.
AIOC Chirag Oil Project Environmental & Socio-Economic Impact Assessment
Chapter 5: Project Description
February 2010 5/45 Final
5.7.6 Conductor Suspension
During drilling operations, it is expected that a number of the platform wells will be suspended with brine suspension fluids (as used for existing ACG projects) after the 30” conductor has been installed; and then re-entered at a later date in the drilling programme.
The preferred option for disposing of conductor suspension fluids when the wells are re-entered will be to recover and inject via the CRI well or, if this is unavailable, to ship to shore. It is not planned to discharge conductor suspension fluids to sea.
5.7.7 Well Completion Activities
5.7.7.1 Casing and Cementing
As for the predrill wells, different hole sections will be cased and the casing cemented into place. Cement slurry from the WC-PDQ platform will be pumped between the casing outer wall and the host rock formation via hosing. It is expected that the cement formulation used for predrilling will also be used for platform well casing.
Where it is not technically practicable or safe to recover excess cement remaining in the cement system following casing, it will be mixed with seawater and discharged to the seabed over approximately one hour via the cement system hoses. It is not planned to discharge any dry cement to the marine environment.
The volume of cement used to cement each casing is calculated prior to the start of the activity. Sufficient cement is used to ensure that the casing is cemented securely and necessary formations isolated so that this safety and production critical activity is completed effectively while minimising excess cement discharges to the sea. Releases of cement during platform drilling are anticipated to be slightly less than during predrill (refer to Section 5.3.2.5) as the conductor section will be driven and will not be cemented into place. It is expected that, as a worst case, approximately 13 tonnes of cement per well will be discharged, comprising approximately 5 tonnes Class G cement, 6.5 tonnes barite and the remainder cement chemicals of low toxicity (Hazard Category E and Gold) (Refer to Table 5.6) Releases of excess cement at the end of casing cementing, when it is not technically practicable or safe to recover excess cement remaining in the cement system, will be comparable to predrill releases (refer to Section 5.3.2.5).
To minimise potential gas leakage from wells due to inadequate cementing of the casing annuli (as occurred historically at the CA facilities), the following measures have been adopted:
The cement units have been designed to improve the reliability and accuracy of the system that controls the supply of the cement additives;
Solids control capability has been improved to ensure that the drilling fluid is maintained within specification; and
It is planned to spend additional time executing the cement programme and ensuring quality control. New cement techniques may be considered (e.g. two-stage cementation) and cement bond logs will be run after all critical cement jobs so that the quality of the cement can be verified.

AIOC Chirag Oil Project Environmental & Socio-Economic Impact Assessment
Chapter 5: Project Description
February 2010 5/46 Final
5.7.7.2 Well Clean Up
Following cementing, as for the predrill wells, a number of clean up chemicals will be circulated to the wells. Estimated chemicals and usage is provided in Table 5.8.34. Clean up fluids will be recovered and injected via the CRI well or, if this is unavailable, shipped to shore.
5.7.8 Sand Control
Without a form of sand control, the wells would accumulate considerable quantities of sand thereby adversely affecting production. It is expected that both Open Hole Gravel Pack (OHGP) and Expandable Sand Screen (ESS) sand control will be used depending on the well characteristics. In both cases, a well screen is installed in the open-hole-producing zone of the well. OHGP involves gravel packing the annular space between the screens and wellbore. This has the disadvantage of reducing the wellbore inside diameter due to the packing. The expandable sand screen option maintains the wellbore diameter and allows zonal isolation between oil arising from different formations.
5.7.9 Contingency Chemicals
Potential hazards during platform drilling include shallow gas, reactive formation and overpressure as discussed in Section 5.3.2.6. By definition, the use of contingency chemicals cannot be predicted with accuracy. Indicative information on the use of contingency chemicals for predrilling, provided previously in Table 5.7, is also applicable for platform drilling26.Contingency chemicals, if required, will be recovered and disposed of with the SBM/LTMOBM and cuttings, either to the CRI well (preferred option) or, if this is unavailable, shipped to shore.
5.7.10 Platform Drilling – Emissions, Discharges and Waste
Emissions, discharges and waste associated with all platform operations including drilling are provided in Section 5.8.9.
34 The COP Management of Change Process (Section 5.11) will be followed should alternative chemicals be required.

AIOC Chirag Oil Project Environmental & Socio-Economic Impact Assessment
Chapter 5: Project Description
February 2010 5/47 Final
5.8 Offshore Operations and Production
5.8.1 Overview
Key production activities that will be undertaken on the WC-PDQ platform will include:
Produced hydrocarbon separation; Gas processing; Oil and gas export; Well testing; Produced water treatment; Water injection; and Utilities to support these processes.
Figure 5.16 shows a simplified flow diagram of the platform processes.
Figure 5.16 WC-PDQ Process Schematic
The principal processes and support utilities for the COP are described below.
5.8.2 Separation System
Well fluids will be transferred from producing wells to the platform via flow-lines, which tie into either the high pressure (HP) or low pressure (LP) production manifold of the platform. From the manifolds, the fluids will be sent to the separation trains where gas, oil and produced water separation will be carried out.
Each separation train will comprise an HP separator, which will receive well fluids from the HP production manifold and a downstream LP separator, which will receive fluids from the HP separator and from the LP production manifold. The HP separator is designed to permit 2 phase separation of gas from liquids at a pressure of 38 bar gauge (barg). The LP separator is designed to permit further separation of the gas, at a pressure of 20 barg and separation of the oil from the produced water. The LP separator is designed to achieve a partially stabilised oil product, exported to the Sangachal Terminal from the platform via the Main Oil Line (MOL) pumps, with a maximum oil-in-water content of less than 8% by volume.
Test Separator
(1 train)
LP Separator(2 trains)
Flash Gas Compression
(2 x 50%)
Oil to Sangachal
Produced Water To DWG
Gas to Sangachal
38 barg
20 barg
110 barg
134 barg
1 bara
Fuel Gas
Transfer Pumps(2 x 100% )
Booster Pumps(3 x 50%)
Sand RemovalCyclones
Export Pumps(3 x 50%)
FlashDrum
Hydrocyclones
Gas Dehydration(1 Train)
Reservoir FluidsOilGasProduced WaterTEG
Rich TEG
30”
28”
ProductionWells (28 off)
HP Separator(2 trains)
Lean TEG
LEGEND
Export GasCompression
(2 x 50%)
Lift Gas
Returned to separation
system
Returned to separation
system
Returned to
separation system
To flare system
Returned to separation system
To CRI

AIOC Chirag Oil Project Environmental & Socio-Economic Impact Assessment
Chapter 5: Project Description
February 2010 5/48 Final
When testing wells, reservoir fluids will be sent to an additional test manifold and separator. The test separator will be sized to accommodate the maximum expected operational flows from any one well and will be capable of operating as a production separator in the event that the HP separator is unavailable (e.g. due to maintenance).
5.8.3 Gas Processing and Export
Flash gas from the LP separator will be compressed by 2 electric motor driven flash gas compressors to 38 barg, cooled and combined with the gas from the HP separator. The combined gas stream will then be cooled and passed to the gas dehydration package.
The gas dehydration package will comprise an inlet scrubber, glycol contactor and glycol regeneration package. The system is designed to reduce the water content of the combined separator flash gas stream to 4 lb/MMscf. The purpose of the dehydration process is to prevent hydrate formation and corrosion within the export gas pipeline.
The combined gas stream passes through the glycol contactor, where it is scrubbed by a recirculating solution of lean tri-ethylene glycol (TEG). The TEG absorbs the water within the gas stream and some heavy gaseous hydrocarbons. The rich (i.e. water and hydrocarbon saturated) TEG is then sent to the glycol regeneration package where it is heated to release the absorbed compounds. The regenerator off gas (i.e. gas released during heating) is cooled to condense the water present. The residual gaseous hydrocarbon and the condensed water streams are sent to the LP flare header. The regenerated glycol is recirculated back to the contactor.
The dehydrated gas stream will be compressed to export pressure of 112 barg using 2 centrifugal electrically driven Export Gas Compressors (EGC). Prior to export, a portion of the gas will be taken for use on the platform as lift and fuel gas (refer to Sections 5.8.6.1 and 5.8.6.2 below).
5.8.4 Produced Water
During early field life the produced water portion of the reservoir fluids will be small and will be transported onshore with the oil. Once the water portion in the COP LP separators exceeds 5% it will be separated from the reservoir fluids on the platform, treated and, under normal conditions, pumped to the DWG re-injection system. Recovered produced water from the LP separators will be desanded and sent to the produced water treatment package. This will include sand cyclones, oil hydrocyclones and a produced water degassing drum. The treatment package will be designed to:
De-oil the produced water to an oil-in-water concentration of 42 mg/l as a daily maximum and 29 mg/l as a monthly average (as defined by EPA method 1664A); and
De-gas the cleaned water.
Hydrocarbons from the degassing drum will be sent to the flare system and flared. Separated oil will be returned to the LP separators via the reject oil pumps. The cleaned and degassed produced water will be pumped by the produced water transfer pumps to the injection water system on the DWG-PCWU platform, via the produced water pipeline. Figure 5.2 presents the estimated produced water profile across the PSA period.
Discharge of produced water, treated to the applicable oil-in-water standards (42 mg/l as a daily maximum and 29 mg/l as a monthly average), will only occur:
If the volume of produced water exceeds that required for reservoir pressure maintenance; or
Due to a downtime event such as an emergency, accident or mechanical failure; or

AIOC Chirag Oil Project Environmental & Socio-Economic Impact Assessment
Chapter 5: Project Description
February 2010 5/49 Final
If standard compatibility testing demonstrates that produced water and Caspian seawater are not compatible35.
Experience to date from the ACG Contract Area has shown the most likely scenario for discharge is due to plant upsets. For the COP this would be due primarily to failure of:
the WC-PDQ platform produced water transfer pumps; or the DWG platform injection water pumps.
To reduce these potential failures redundancy has been designed into the WC-PDQ and DWG platforms as follows:
WC-PDQ produced water transfer pumps - the platform design incorporates two transfer pumps (1 spare), each of the two transfer pumps is capable of handling 100% of the forecasted maximum produced water flow rates, as if one pump fails the other pump can continue pumping water to DWG; and
The DWG-PCWU injection water pumps - the three water injection pumps on the DWG-PCWU platform are individually capable of handling all the produced water from WC-PDQ even at maximum predicted produced water flows.
5.8.5 Water Injection
Produced water from the WC-PDQ platform will be co-mingled with DWG produced water and treated seawater (when there is insufficient produced water at DWG) and treated to meet the specifications established for the operation of the DWG-PCWU water injection system.
A portion of the injection water will be pumped back to the WC-PDQ platform and the remainder will routinely be sent to the DWG water injection wells and via the DWG subsea water injection system. Injection water received at the WC-PDQ platform will be supplied to the WC-PDQ injection water manifold and routed to the COP water injection wells. Under routine conditions, it is not planned that injection water will be discharged to sea from the WC-PDQ platform.
Figure 5.17 provides a simplified flow diagram showing produced water and injection water flows associated with the COP and DWG facilities during routine operation and during downtime events such as mechanical failure of the WC-PDQ platform produced water transfer pumps or mechanical failure associated with the DWG water injection pumps.
35 The PSA requires that produced water is used for reservoir pressure maintenance as long as standard compatibility testing with Caspian Sea water demonstrates that no damage to the reservoir, resulting in a reduction in overall hydrocarbon recovery, would occur by mixing the two water streams.

AIOC Chirag Oil Project Environmental & Socio-Economic Impact Assessment
Chapter 5: Project Description
February 2010 5/50 Final
Figure 5.17 Simplified Produced Water and Injection Water Flows
Key:
Reservoir fluids Injection Water Oil Gaseous hydrocarbons Seawater Produced Water Sand
Manifold LP/TestSeparators
Desanding and Hydrocyclones
Produced WaterDegassing Drum
Produced Water Transfer Pumps
Wellhead
To oil booster
To dehydration/ compression
systems
To sand treatment package
To flare system
Injection Water Manifold
COP Water Injection Well
Water Injection System/Pumps
DWG Water Injection Well
Deaeration
DWG Desanding and Hydrocyclones and Produced
Water Degassing Drum
COP Facilities DWG Facilities
Reservoir
From DWG separators
To DWG Subsea Water Injection System
COP Produced Water Pipeline
COP Injection Water Pipeline
ROUTINE OPERATION
COP TRANSFER PUMP FAILURE
DWG WATER INJECTION PUMPS UNAVAILABLE
Manifold LP/TestSeparators
Desanding and Hydrocyclones
Produced WaterDegassing Drum
Produced Water Transfer Pumps
Wellhead
To oil booster
To dehydration/ compression
systems
To sand treatment package
To flare system
Injection Water Manifold
COP Water Injection Well
Water Injection System/Pumps
DWG Water Injection Well
Deaeration
DWG Desanding and Hydrocyclones and Produced
Water Degassing Drum
WC-PDQ Produced Water Caisson
COP Facilities DWG Facilities
Reservoir
From DWG separators
Seawater
To DWG Subsea Water Injection System
COP Injection Water Pipeline
Manifold LP/TestSeparators
Desanding and Hydrocyclones
Produced WaterDegassing Drum
Produced Water Transfer Pumps
Wellhead
To oil booster
To dehydration/ compression
systems
To sand treatment package
To flare system
Injection Water Manifold
Water Injection System/Pumps Deaeration
DWG Desanding and Hydrocyclones and Produced
Water Degassing Drum
WC-PDQ Produced Water Caisson
DWG-DUQ Produced Water
Caisson
COP Facilities DWG Facilities
Reservoir
From DWG separators
AIOC Chirag Oil Project Environmental & Socio-Economic Impact Assessment
Chapter 5: Project Description
February 2010 5/51 Final
5.8.6 Platform Utilities
5.8.6.1 Fuel Gas
A portion of the gas abstracted from the reservoir will be used as fuel gas for the following:
RB211 main gas turbine generators; and Purge and pilot within the HP and LP flare systems.
The gas, taken from the export gas stream, will be first passed through a knockout drum to remove any entrained liquids, through a heater and then filtered before being distributed to the platform users. The entrained liquids will be routed to the separators prior to export in the crude oil. In the event the separators are not available the system will be equipped with fuel gas condensate pumps, which will inject condensed liquid hydrocarbons to the MOL.
In the event that the export gas system is unavailable (e.g. due to maintenance, platform start up and plant and equipment upsets), a fuel gas “buy back” system will be provided to allow the import of fuel gas to the platform from the 28” marine gas export line, via a connection near to DWG-PCWU platform.
5.8.6.2 Lift Gas
The purpose of lift gas is to maximise well productivity. Lift gas will be sourced from the gas export stream, from where it will pass to the lift gas manifold before being delivered to the wellhead. The lift gas system will be sized to provide 80 MMscfd of gas, with a maximum lift gas flowrate per well of 6 MMscfd.
5.8.6.3 Hydraulic Valve Control System
The subsea gas “buy-back” valve on the 14” infield gas pipeline at the WC-PDQ platform will be controlled from the platform by a direct hydraulic closed loop control system. The control system will provide low pressure hydraulics from a dedicated hydraulic pumping unit (HPU) to the subsea valve via an umbilical. The umbilical contains hydraulic control lines and electrical cabling for instrumentation providing valve position status. During normal valve operations, the hydraulic fluid will be returned to the HPU via this closed loop system. It is not planned to discharge hydraulic fluid to the marine environment.
5.8.6.4 Power Generation
Power for the WC-PDQ platform will be provided by 3 identical Rolls Royce dual fuelled (fuel gas with diesel back up supply) RB211 gas turbine driven power generators. 2 of these turbines, each capable of providing 28.5MW of electrical power (based on ISO rating) will normally be operated simultaneously with the third turbine spared (e.g. used during maintenance work on the main turbines).
Emergency power will be provided for essential service by a 1.2 MW diesel generator.
5.8.6.5 Diesel System
The main platform diesel users comprise:
Cranes; Emergency power generators; Main power generators (only when both the export fuel gas and “buy back” system is
unavailable); Standby air compressor; Firewater pumps; and Lifeboats.

AIOC Chirag Oil Project Environmental & Socio-Economic Impact Assessment
Chapter 5: Project Description
February 2010 5/52 Final
Diesel will be transferred from supply boats and offloaded onto the platform by hose, where it will be filtered and stored in the crane pedestals. When required, it will be pumped to the diesel users, via the diesel treatment package, which will remove small amounts of water and particulates that have contaminated the diesel during vessel transfer from the onshore diesel treatment facilities. All by-products generated from the diesel treatment system will be transferred to the non-hazardous open drains system (see Section 5.8.6.11 below).
5.8.6.6 Flare System
The platform will be fitted with an LP and HP flare system. Each of the systems is designed to collect gaseous releases from various sources around the platforms and convey them, via a header and flare drum, to a flare tip where the gas is burned and the products of combustion discharged to atmosphere.
Under routine operational conditions, flaring emissions will only be associated with the following:
The glycol regeneration package, which will vent continuously into the LP flare header; The flare system, which will be continuously purged with fuel gas to prevent ingress of
oxygen and the build-up of an explosive atmosphere; and The flare tip, which will be provided with a fuel gas-fired pilot light to ensure ignition of
any gaseous releases.
During non routine conditions including start up, shutdown and equipment failure/maintenance, gaseous release from process equipment and utilities are directed to the flare for combustion as a safety measure. The COP Base Case assumes that up to 3% of total gas will be flared per annum, 2% of this total will be flared at the platform and the remainder at the Terminal.
Both the LP system and the HP system will share the same flare boom. The HP flare tip will be of a ‘smokeless design’.
5.8.6.7 Seawater System
Seawater will be required onboard the platform for a number of purposes including:
Heating, Ventilation and Air Conditioning (HVAC); Living quarters ablutions; Drilling facilities; Freshwater maker; Fire water ring main pressurisation facility; Bio-fouling control unit; Sewage treatment system; Sand jetting system; Course filter backwash; Cooling for the cooling medium system; and Washdown facilities.
The seawater will be abstracted from 1 of the 3 vertical seawater lift pump caissons36 at a depth of 105m beneath sea level. The maximum seawater abstraction design flow rate per pump will be approximately 1,500 m3/hr. The design of the seawater intake caissons on the platform will incorporate a mesh of 200mm diameter.
Lifted seawater will be electrochlorinated in an antifouling package and dosed with 50 ppbv of chlorine and 5 ppbv copper; and then filtered to remove any particles that are above 150 microns in diameter. After use, part of the seawater (up to 3,000 m3/hr) will be returned to the Caspian, via the seawater discharge caisson (at a depth of 45m below sea level). The design
36 Internal diameter 1,060mm.

AIOC Chirag Oil Project Environmental & Socio-Economic Impact Assessment
Chapter 5: Project Description
February 2010 5/53 Final
and operation of the seawater/cooling water system has been reviewed and confirmed that the temperature at the edge of the cooling water mixing zone (assumed to be 100m from the discharge point) will be no greater than 3 degrees more than the ambient water temperature37. Seawater forwarded to the drilling system will be mixed with the WBM and cuttings (see Section 5.7).
5.8.6.8 Cooling Medium System
The platform will be equipped with an indirect cooling medium system. The cooling medium (20% by weight MEG) will be cooled against seawater and will be circulated within a closed loop.
The main processes which require cooling include:
Flash gas compressor; Export gas compressors; Flash gas compressor discharge coolers; HP gas cooler; Power generation turbine utilities; MOL booster pumps; MOL pumps; Glycol regeneration package; Air compressor package; and Export gas compressor after-cooler.
In the event that the cooling medium becomes degraded and requires replacement, the used cooling medium will be pumped from the system, containerised and shipped to shore for disposal. The system will then be recharged with fresh cooling medium. The same process will be adopted for any make-up required.
5.8.6.9 Fire Systems
The platform will be equipped with a firewater distribution system, which will be supplied by two diesel powered firewater pumps. The firewater pumps will be tested on a weekly basis for an hour with seawater circulated through the firewater system and discharged via the seawater discharge caisson.
A foam concentrate system will be provided in the separator module (where there is potential for hydrocarbon pool fires), which will enhance the effectiveness of the fire system’s deluge water spray. A foam system will also be provided for the helideck. Following commissioning (see Section 5.6.4), foam may be discharged during emergency exercise drills (approximately every 4 months). Foam system chemicals of the same specification and environmental performance as those used in existing ACG platform foam systems will be stored on the platform for emergency use.38
5.8.6.10 Sand Separation System
The well completions will be designed to minimise sand production. Nevertheless, sand will be transported into the topside production facilities. As such, online sand removal will be required and will comprise sand jetting equipment. This will be internally fitted to process equipment such as the separators, produced water degassing drum and the closed drains drum to remove accumulated sand. Water will be injected into the equipment to generate a sand-water slurry. This slurry will then exit the vessel via dedicated nozzles and be routed to the sand treatment package.
37 The COP Management of Change Process (Section 5.11) will be followed should any change to the design or operation of the cooling water system be required. 38 The COP Management of Change Process (Section 5.11) will be followed should alternative chemicals be required.
AIOC Chirag Oil Project Environmental & Socio-Economic Impact Assessment
Chapter 5: Project Description
February 2010 5/54 Final
The following equipment will incorporate online sand removal capabilities:
HP separators; LP separators; Test separator; Produced water degassing drum and sand cyclones; and LP flare/closed drains drum.
Under routine conditions, treated produced water will be used for jetting. However, in the event that there is an insufficient volume of produced water available to fulfil this role, it is planned that deoxygenated seawater prepared and stored in the produced water degassing drum will be used instead39.
Design of the sand treatment package is ongoing through the ‘Define’ stage (refer to Chapter 4 Section 4.4).
The COP Base Case assumes the package will be designed to remove oil to a nominal level of 1% by weight oil on sand. Cleaned produced sand will be turned into a slurry and transported to the CRI system, where it will be injected into the CRI well. The oily water mixture from the sand treatment package will be routed to the closed drains drum (see Section 5.8.6.11 below). In the event that the CRI system is unavailable, the sand slurry will be diverted to the sand bagging filter. The filtered slurry water from the bagging system will be sent to the hazardous area open drains system (see Section 5.8.6.11); and the sand, to the bagging area where it will be containerised for transportation to shore for disposal. There will be no planned overboard discharge of sand from the platform.
Sand removal systems for the LP flare/closed drains drum and the produced water degassing drum will incorporate a transport system for returning the sand to the sand treatment package. This is because their operating pressures are too low to enable free flow of removed sand to the sand treatment package.
5.8.6.11 Drainage System
Open Drains
The open drains system on the WC-PDQ platform will comprise two separate gathering systems: a hazardous area drains system and a non-hazardous area drains system (see Figure 5.18). These will be segregated.
The purpose of the non-hazardous open drains system is to provide drainage for rainwater, wash down water, spillages and equipment drains/leakages from all the deck levels in the non-hazardous area of the platform. The non-hazardous area open drains will be routed to the non-hazardous open drains tank and then to the drilling oily drains tank. Liquids from the oily drains tank will then be pumped to the CRI system. Non-hazardous area liquids will be discharged to sea via the open drains caisson, provided that no visible sheen is observable40
if:
The oily drains tank is unavailable; The oily drains tank overflows; or The CRI well is unavailable.
The purpose of the hazardous open drains system is to provide drainage for rainwater, wash down water, firewater deluge, spillages and equipment drains/leakages from all the deck levels in the hazardous area of the platform. The hazardous area open drains will be routed to the open drains caisson, which is designed to ensure that there is no visible sheen on the
39 See Table 5.29 for chemical dosing rates of biocide and oxygen scavenger. 40 The non hazardous area and hazardous area drains design is based on previous ACG platform designs and is determined by space and weight requirements as well as safety considerations.

AIOC Chirag Oil Project Environmental & Socio-Economic Impact Assessment
Chapter 5: Project Description
February 2010 5/55 Final
sea surface, and discharged at a depth of 49.5m below sea level. Any oil in the open drains caisson will be routed to the LP flare/closed drains drum.
Helideck drains and deluge from deck drain boxes shall be routed directly overboard.
Figure 5.18 Open Drains System
Closed Drains
The function of the closed drains system is to collect hydrocarbon liquids/hazardous fluids from process equipment and instruments during maintenance operations. The contents of closed drain system on the WC-PDQ platform shall be collected, the gaseous phase routed to the LP flare drum and the liquid phase routed to the LP separators.
5.8.6.12 Instrument Air and Inert Gas System
The instrument air system will provide plant and instrument air for use in drilling, process and maintenance.
Inert gas (nitrogen) will be generated on demand by a membrane package using dry compressed air and a backup supply facility will be provided. Inert gas users include compressor seals, cooling medium expansion drum, methanol storage vessel blanketing and utility systems.
5.8.6.13 Freshwater
Freshwater will be produced on the WC-PDQ platform from seawater (taken from the seawater system) in the freshwater maker. There will also be a backup system whereby freshwater from supply boats is transferred to the freshwater tanks (via a filtration unit). The
NonHazardous
Open Drains Tank
Oily Drains Tank
Hazardous area drains collection
header
Tank Overflow
Non-hazardous area deck drains
Non-hazardous area equipment drains
Cuttings re-injection well
Skimmedhydrocarbon to LP flare/closed drains drum
- 49.5m discharge depth
* Discharge to open drains caisson when CRI/oily drains tank not available
To Open Drains Caisson*
Open Drains Caisson
Base oil & diesel tank overflow
Drilling area open drains
Hazardousarea diesel tank overflow

AIOC Chirag Oil Project Environmental & Socio-Economic Impact Assessment
Chapter 5: Project Description
February 2010 5/56 Final
freshwater maker system will utilise a reverse osmosis (RO) process to desalinate seawater. Saline effluent from the freshwater maker will either:
Be returned to the Caspian via the seawater or sewage discharge caissons; or Routed to the sewage treatment system and any unused saline effluent sent to the
sewage caisson41 .
The main uses of freshwater are expected to be:
The living quarters; Drilling support module; Mechanical workshop/laboratory; Utility station/HP wash-down; Safety showers; and Initial fill and make-up of cooling medium system (along with MEG).
5.8.6.14 Black and Grey Water
Black water will be collected via the sewer system and treated in a sewage treatment package, sized to accommodate up to 265 POB and an average of 175 POB. The selection of the sewage treatment package is ongoing through the ‘Define’ stage (refer to Chapter 4 Section 4.4). It will be designed in accordance with PSA requirements such that effluent is treated to applicable standards prior to discharge via the platform sewage caisson (17m below sea level)42 . The presence of surfactants in the sewage effluent has been considered during the selection process. The types of plant being considered ensure that a high proportion of the biodegradable surfactants present (greater than 90%) degrade prior to discharge of the treated effluent.
Grey water from the platform will be discharged to sea (without treatment) in accordance with applicable PSA requirements43 via the sewage caisson, 17m below sea level.
5.8.6.15 Galley Waste
Organic food waste originating from the platform galley will be macerated to less than 25mm in accordance with MARPOL 73/78 Annex V: Prevention of Pollution by Garbage from Ships requirements and discharged to the sewage caisson.
5.8.6.16 Chemical Injection System
The production process requires the addition of certain chemicals to facilitate production, aid the separation process and protect process equipment from corrosion.
Table 5.27 presents a list of anticipated production chemical requirements to be stored on the platform along with the dosage range and injection points. The chemical systems will be continually evaluated and modified as necessary depending on specific operating conditions.
41 Dependant on the selection of the sewage treatment system – refer to Section 5.8.6.1442 Sanitary waste may be discharged from a U.S. Coast Guard certified or equivalent Marine Sanitation Device (MSD) to meet USCG Type II standards of total suspended solids of 150mg/l and fecal coliforms of 200MPN (most probable number) per 100ml 43 Domestic wastes and grey water may be discharged as long as no floating solids are observable. Monitoring of floating solids shall be accomplished during daylight by visual observation of the surface of the receiving water in the vicinity of the sanitary and domestic waste outfalls. Observations shall be made following either the morning or the midday meals and at a time during daylight and maximum estimated discharge.

AIOC Chirag Oil Project Environmental & Socio-Economic Impact Assessment
Chapter 5: Project Description
February 2010 5/57 Final
Table 5.27 Anticipated Production Chemicals and Requirements
Chemical Unit Typical Dosage
Design Maximum Dosage
Dosage Basis1
Injection Mode2 Injection Points3
Chemical Present in Produced Water When Discharged
Antifoam ppmv 13 25 Total
productionliquids
Continuous- Inlet to each HP separator - Inlet to each LP separator - Inlet test separator
No8
Demulsifier4 ppmv 20 30 Total
productionliquids
Continuous- Inlet to each HP separator - Inlet to each LP separator - Inlet test separator
No8
Scale inhibitor ppmv 20 20 ProducedWater rate
Continuous- Individual wellheads - Inlet of produced water infield pipeline
Yes
ReverseDemulsifier
ppmv 10 20 ProducedWater rate
Continuous
- Water outlet from each LP separator- Water outlet of test separator
Yes
Corrosion Inhibitor (Oil)
ppmv 30 30 Oil rate ContinuousSuction of each oil export pump
No
Corrosion Inhibitor(ProducedWater)
ppmv 30 30 Producedwater rate
ContinuousSuction of each produced water transfer pump
No
Biocide ppmv 500 500 Producedwater rate
Batch5 Inlet of produced water degassing drum
No
Methanol(Gas Export)
l/MMscf 60 60 Export gas
rateTemporary
Gas export line6
No
Methanol(Well Equalisation)
l/hr 100 100 Absolute
rateTemporary Wellheads
Possible (during start up)7
Methanol(Fuel Gas Import)
l/MMscf 48 48 Fuel gas rate Temporary Fuel gas import line No
Oxygen Scavenger
ppmv 150 150 Equipment
volumeBatch
- Produced water degassing drum- Cooling medium system
No
Corrosion Inhibitor(Export Gas)
l/MMscf 1 1 Export gas
rate Temporary Gas export line No
1 The rate or volume on which the dosage is base 2 Temporary = continuous injection for a short period, batch = single finite dos 3 Where more than one location is specified, operational experience will determine if single or multiple simultaneous injection is
required. 4 Alternative demulsifier may be water based, whereas the “Base Case” conventional demulsifier will be hydrocarbon based.
Injection of both demulsifiers may be required simultaneously. 5 Shock dosing for 6 hours per week. System designed such that dosing can be discontinued during discharge/pigging 6 Temporary injection only (during wet gas export operation). Dosing facility to be available for start up. 7 During production start up, methanol may be injected into a well with a high produced water content to inhibit the formation of
hydrates and prevent blockages of process equipment and pipe work that could create emergency situations associated with over pressure events. Methanol would only be discharged in the event that produced water is discharged during this period, which is considered very unlikely.
8 Hydrocarbon based chemicals, which are expected to remain in the oil phase in the separators.
Water soluble production chemicals will normally be reinjected into the reservoir with the produced water. Table 5.27 indicates those production chemicals present in the event that produced water is discharged from the WC-PDQ platform or during planned produced water pipeline pigging (refer to Section 5.8.7.1 below). It is planned to use chemicals with comparable environmental performance to those previously approved for use on existing ACG Platforms44.
44 The COP Management of Change Process (Section 5.11) will be followed should alternative chemicals be required.

AIOC Chirag Oil Project Environmental & Socio-Economic Impact Assessment
Chapter 5: Project Description
February 2010 5/58 Final
5.8.7 Pipeline Operations and Maintenance
Maintenance of the produced water and injection water pipelines between the WC-PDQ and DWG-PCWU platforms will include periodic pigging to remove any scale and biological growth thereby controlling internal corrosion.
5.8.7.1 Produced Water Pipeline
During early field life, the produced water pipeline will be filled with treated seawater45 and will be dewatered as the produced water volume in oil approaches approximately 5%. Section 5.5.4 above describes the dewatering, which will be counter to the normal direction of flow. It is planned that pigging and flushing will continue in this direction using produced water and/or treated seawater from the DWG facilities, until there is sufficient produced water flow from the WC-PDQ platform to drive a pig. Once there is sufficient produced water flow to drive a pig in the normal direction of flow, pigging will be undertaken from the WC-PDQ platform to the DWG-PCWU platform with pigging water discharged at the DWG-PCWU seawater discharge caisson. Solids from pigging collected in the DWG-PCWU pig receiver will be containerised and shipped to shore for disposal.
Figure 5.19 shows the pigging scheme for the produced water pipeline.
Figure 5.19 Pigging Operations – Infield Produced Water Pipeline
45 Refer to Sections 5.5.2 and 5.5.4 for chemical dosing details.
Later Life
Early Life (following dewatering)
Pig Launcher
DWG-PCWU WC-PDQ
Pig Receiver
Produced Water Caisson
Produced Water Transfer LineSolids collected in pig receiver and shipped to shore
Pig Receiver
WC-PDQ
Pig Launcher
Seawater Discharge Caisson
Produced Water Transfer Line
Solids collected in pig receiver and shipped to shore
DWG-PCWU
Key
Normal Direction of Flow
Pigging Flow
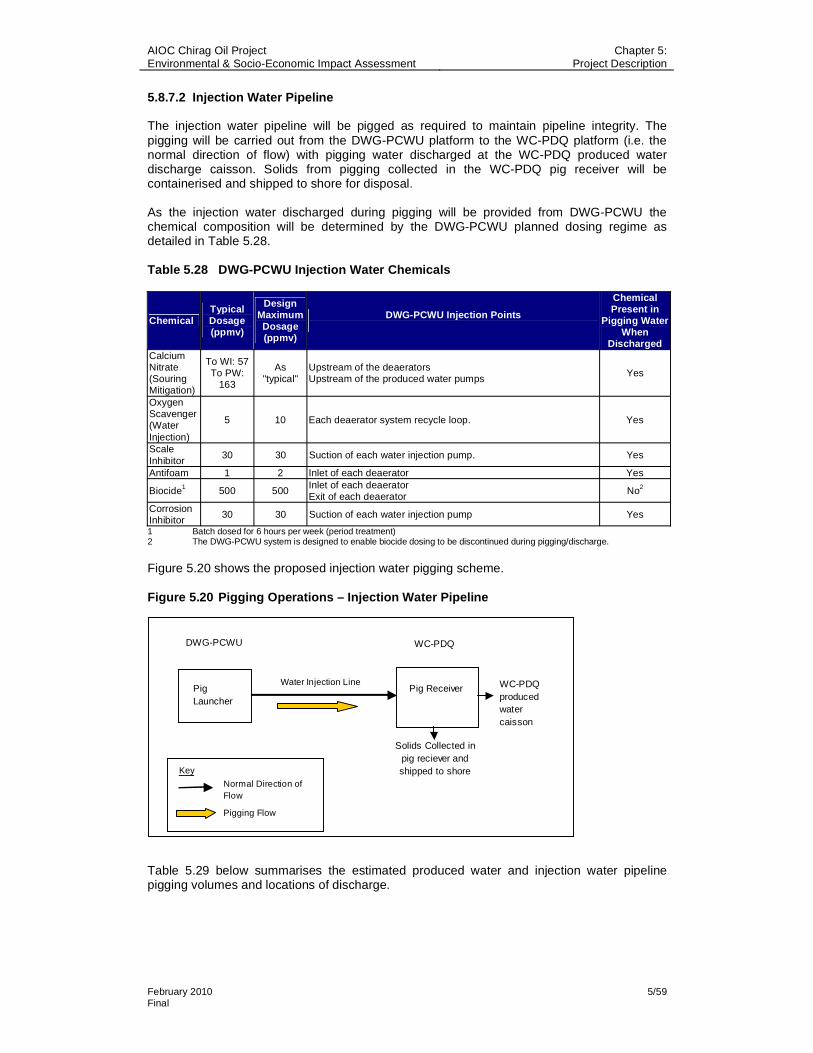
AIOC Chirag Oil Project Environmental & Socio-Economic Impact Assessment
Chapter 5: Project Description
February 2010 5/59 Final
5.8.7.2 Injection Water Pipeline
The injection water pipeline will be pigged as required to maintain pipeline integrity. The pigging will be carried out from the DWG-PCWU platform to the WC-PDQ platform (i.e. the normal direction of flow) with pigging water discharged at the WC-PDQ produced water discharge caisson. Solids from pigging collected in the WC-PDQ pig receiver will be containerised and shipped to shore for disposal.
As the injection water discharged during pigging will be provided from DWG-PCWU the chemical composition will be determined by the DWG-PCWU planned dosing regime as detailed in Table 5.28.
Table 5.28 DWG-PCWU Injection Water Chemicals
Chemical Typical Dosage (ppmv)
Design Maximum Dosage (ppmv)
DWG-PCWU Injection Points
Chemical Present in
Pigging Water When
Discharged CalciumNitrate(SouringMitigation)
To WI: 57 To PW:
163
As"typical"
Upstream of the deaerators Upstream of the produced water pumps
Yes
Oxygen Scavenger(WaterInjection)
5 10 Each deaerator system recycle loop. Yes
ScaleInhibitor
30 30 Suction of each water injection pump. Yes
Antifoam 1 2 Inlet of each deaerator Yes
Biocide1 500 500 Inlet of each deaerator Exit of each deaerator
No2
Corrosion Inhibitor
30 30 Suction of each water injection pump Yes
1 Batch dosed for 6 hours per week (period treatment) 2 The DWG-PCWU system is designed to enable biocide dosing to be discontinued during pigging/discharge.
Figure 5.20 shows the proposed injection water pigging scheme.
Figure 5.20 Pigging Operations – Injection Water Pipeline
Table 5.29 below summarises the estimated produced water and injection water pipeline pigging volumes and locations of discharge.
Pig Launcher
DWG-PCWU WC-PDQ
Pig ReceiverWater Injection Line WC-PDQ
produced water caisson
Solids Collected in pig reciever and shipped to shoreKey
Normal Direction of Flow
Pigging Flow

AIOC Chirag Oil Project Environmental & Socio-Economic Impact Assessment
Chapter 5: Project Description
February 2010 5/60 Final
Table 5.29 Summary of Produced Water and Injection Water Pipeline Pigging Volumes and Locations of Discharge
Discharge Location
PipelineVolumes of
Pigging Fluid per Pigging Event Fluids Solids
Frequency46
Chemicals Present in
Discharged Pigging
Fluid
Produced water (Early Life) 920m3
WC-PDQ produced water
caisson
Collected in WC-PDQ pig
receiver and shipped to shore
Once a week for approximately 6
months
Refer to Table 5.28
Produced water (Later Life)
920m3DWG-PCWU
produced water caisson
Collected in DWG-PCWU pig
receiver and shipped to shore
Once a week for approximately 9
years
Refer to Table 5.27
Injection water 950m3WC-PDQ
produced water caisson
Collected in WC-PDQ pig
receiver and shipped to shore
Once a week for approximately
11 years
Refer to Table 5.28
The contribution due to pigging of the COP produced water pipeline to the total volume of produced water discharge at DWG–PCWU will not result in the Phase III ESIA produced water discharge forecast being exceeded.
5.8.8 Supply and Logistics
Consumables such as mud, diesel, chemicals, water and supplies will be transported to the platform by vessels. During drilling operations, supplies will normally be delivered every 4 - 7 days. When there is no drilling, supply vessels will visit less frequently, normally every 10 - 14 days. Personnel will be transferred to the platform by vessels with up to 5 trips per week. Helicopters may be used for some crew changes. There will be no helicopter or vessel re-fuelling facilities on the platform.
5.8.9 Offshore Operations and Production – Emissions, Discharges and Waste
5.8.9.1 Summary of Emissions to Atmosphere
Table 5.30 shows the GHG (i.e. CO2 and CH4) and non GHG emissions predicted to be generated during COP start up and offshore production from key sources across the PSA period. These sources include:
Main power generators; Emergency diesel generators; Firewater pump; Platform cranes; and Crew change helicopters/vessels and supply vessels;
In addition, predicted emissions associated with the following are included:
Offshore flaring; and Commissioning and start up operations on the platform (2012 – 2013).
Table 5.30 Predicted GHG and non GHG Emissions Associated with Routine and Non Routine COP Offshore Operations and Production Activities
CO2 CO NOx SO2 CH4 NMVOC GHG (ktonne) (tonne) (tonne) (tonne) (tonne) (tonne) (ktonne)
TOTAL 4,320 7,275 9,990 2,475 7,105 4,610 4,470 See Appendix 5A for detailed emission estimate assumptions.
46 It is expected that the frequency of pigging required may reduce over the PSA period. A worst case is presented for assessment.

AIOC Chirag Oil Project Environmental & Socio-Economic Impact Assessment
Chapter 5: Project Description
February 2010 5/61 Final
Figure 5.21 presents the predicted GHG emissions associated with the COP over the PSA period in the context of ACG FFD.
Figure 5.21 Predicted GHG Emissions Associated with COP Offshore Operations and ACG FFD
0
500
1000
1500
2000
2500
3000
3500
2010 2011 2012 2013 2014 2015 2016 2017 2018 2019 2020 2021 2022 2023 2024
ACG FFD (Including EOP)
COP
COP offshore GHG emissions represent approximately 14% of all GHG emissions from ACG offshore facilities between 2013 and the end of the PSA period.
5.8.9.2 Summary of Discharges to Sea
Table 5.31 provides a summary of planned discharges to sea associated with COP platform drilling.
Table 5.31 Estimated Planned Discharges to Sea Associated with Routine and Non Routine Platform Drilling Activities
Discharge R/NR* Frequency Location Estimated Volume Discharge
Composition
WBM and cuttings R During surface hole drilling 4,340 tonnes cuttings9,520 tonnes WBM
Refer to Tables 5.3 and 5.26
Residual WBM NR At end of surface hole drilling (if WBM cannot be recovered/ recycled)
To sea (via WC-PDQ cuttings caisson)
4,480 tonnes WBM Refer to Section 5.7.4
Cement and cement chemicals
RDuring each casing cementing
320 tonnes Refer to Section 5.3.2.5
Excess cement and cement chemicals
NRAt the end of each casing section (if excess cement cannot be recovered)
Seabed
37 tonnes Refer to Section 5.3.2.5
Predrill well suspension fluids and cement plugs
NRDuring re-entry of predrill wells (if suspension fluids cannot be recovered)
Seabed 70 tonnes Refer to Section 5.7.3
* R – Routine, NR – Non Routine

AIOC Chirag Oil Project Environmental & Socio-Economic Impact Assessment
Chapter 5: Project Description
February 2010 5/62 Final
Other planned discharges to sea from COP offshore operations comprise:
Platform cooling water (refer to Section 5.8.6.7); Platform drainage (refer to Section 5.8.6.11); Platform freshwater maker returns (refer to Section 5.8.6.13); Platform black and grey water (refer to Section 5.8.6.14); Platform galley waste (refer to Section 5.8.6.15); and Infield produced water and injection water pipeline pigging fluids (refer to Section
5.8.7).
It is estimated, based on 2% unavailability of the equipment used to inject produced water and assuming that under these conditions produced water will be discharged, the resultant discharge of produced water will be approximately 730M m3 of produced water between 2014 and 2024 (refer to Section 5.8.4).
5.8.9.3 Summary of Hazardous and Non Hazardous Waste
The estimated quantities of non hazardous and hazardous waste that will be generated by the WC-PDQ operations during the PSA period are provided in Table 5.32. These have been estimated based on the waste records for the operational ACG platforms.
Solid and liquid waste generated will be shipped to shore and managed in accordance with the Waste Management principles detailed in Chapter 14.
Table 5.32 Estimated Hazardous and Non Hazardous Waste Associated with Offshore Drilling and Processing Activities1
Type Waste Category2 Sub Category Estimated Volume (tonnes) General waste Non hazardous non recyclable
waste Food/galley waste 3,000
Cooking oil Electrical cable Paper and card
Plastics Recyclable waste
Scrap metal and wood
975
Nonhazardous waste
Total (Non hazardous) 3,975 Batteries
Drum/cansCement
Clinical waste Oil filter parts
Sand and sludges Oily rags
Solid hazardous waste
Paint cans contaminated with uncured paint
1,765
Non-water based drill cuttings3 - 6,125Used drilling fluids - 17,350
Acids and alkalis AntifreezeChemicals
Fuel oil Grease
Oil Paint
Paint sludge Solvents and thinners
Photographic developing fluids
Hazardous liquid waste
Oily and contaminated water
56,820
Hazardous waste
Total (Hazardous) 82,0601 Treatment and disposal routes are detailed in Section 5.12.2. 2 Estimates include key waste types. Minor non hazardous wastes including used tyres, toner cartridges and intermediate bulk
containers are excluded. 3 Includes associated mud, which is not separated on board the platform. 4 Refer to Appendix 5F for details of sewage sludge estimate

AIOC Chirag Oil Project Environmental & Socio-Economic Impact Assessment
Chapter 5: Project Description
February 2010 5/63 Final
5.9 Terminal
The partially stabilised oil and gas from the COP will be transported via the existing 30” oil and 28” gas subsea export pipelines to Sangachal Terminal for processing. Final processing to export specifications will be carried out in the existing ACG facilities onshore at Sangachal Terminal. There is sufficient capacity at Sangachal Terminal such that no upgrades or improvements are required for onshore processing of the COP produced fluids.
The existing ACG facilities at the Terminal comprise:
Oil and gas reception facilities; 6 separation and stabilisation trains; 3 crude oil storage tanks; 2 dew point control units; 3 off spec crude oil tanks; Produced water storage tanks and treatment facilities; Open drains water tank; PSA1 Pump Head Station operated by BTC under the Export Business Unit (BU); and Standalone and back-up support and utility systems.
5.9.1 Oil Processing
Partially stabilised oil from the two 30” marine oil pipelines is fed to the 6 onshore processing trains. The oil is fed to the fired heater of each train where it is heated, before being degassed in a separator. The oil then flows into a low pressure separator where the pressure is reduced further to achieve the vapour pressure specification. Stabilised oil flows to an electrostatic coalescer where the water content is reduced to export specifications. Flash gas is compressed and co-mingled with the gas stream arriving from the 28” marine pipeline.
5.9.2 Gas Processing
Gas from the 28" marine pipeline (with water removed but containing residual hydrocarbons) will be co-mingled with flash gas from the oil stabilisation train and fed to the Dew Point Control Units (DPCUs). Here the gas is chilled using a propane refrigerant circuit to recover condensate and water from the gas. MEG is injected to prevent the formation of hydrates in the DPCU process. The residual gas is exported to the SOCAR pipeline. Recovered liquids are fed back into the process.
5.9.3 Produced Water
The produced water separated from the oil is pumped to produced water storage tanks. The treatment facilities enable the produced water from the storage tanks to be filtered and treated to remove oil and solids, cooled and chemically treated prior to export along the ACG produced water disposal pipeline for reinjection offshore at CA.

AIOC Chirag Oil Project Environmental & Socio-Economic Impact Assessment
Chapter 5: Project Description
February 2010 5/64 Final
5.9.4 Terminal Operations – Emissions, Discharges and Waste
Additional emissions, discharges and waste arising at the Terminal due to COP Activities will be associated with incremental changes in the following:
Load on fired heaters, dew point control units and turbines; Oil storage tank throughput; Non routine flaring; and Waste generated from routine operations (produced water treatment, pigging handling,
canteen/camp activities).
Table 5.33 presents the predicted COP contribution to the GHG and non GHG emissions associated with Terminal operations (including fugitive emissions).
Table 5.33 Predicted GHG and non GHG Emissions Associated with Terminal Operations (COP Contribution)
CO2 CO NOx SOx CH4 NMVOC GHG (ktonne) (tonne) (tonne) (tonne) (tonne) (tonne) (ktonne)
TOTAL 1,455 1,505 1,725 5 1,465 1,335 1,485 See Appendix 5A for detailed emission estimate assumptions.
Figure 5.22 shows the forecast GHG emissions for the Terminal associated with the EOP and ACG Phases 1-3 including the COP contribution.
Figure 5.22 Forecast EOP and ACG Phases 1 - 3 GHG Emissions Associated with Terminal Operations and COP Contribution
The figure indicates that emissions at the Terminal from the COP and existing ACG operations will not exceed the peak annual emissions volume forecast for EOP and ACG Phases 1 - 3. From first oil to the end of the PSA, COP is estimated to contribute to approximately 19% of emissions associated with the Terminal.
0
100
200
300
400
500
600
700
800
900
1000
2010 2011 2012 2013 2014 2015 2016 2017 2018 2019 2020 2021 2022 2023 2024
COP
EOP and ACG Phases 1 - 3

AIOC Chirag Oil Project Environmental & Socio-Economic Impact Assessment
Chapter 5: Project Description
February 2010 5/65 Final
5.10 Decommissioning
In view of the operational lifetime of the COP development, it is not possible to provide a detailed methodology for the potential decommissioning of the offshore facility. In accordance with the PSA, AIOC will produce a field abandonment plan one year before 70% of the identified reserves have been produced.
5.11 Management of Change Process
During the ‘Define’, ‘Execute’ and ‘Operate’ stages of the COP, there may occasionally be a need to change a design element or a process. The COP intends to implement a formal process to manage and track any such changes, and to:
Assess their potential consequences with respect to environmental and social impact; and
In cases where a new or significantly increased impact is anticipated, to inform and consult with the MENR to ensure that any essential changes are implemented with the minimum practicable impact.
All proposed changes, whether to design or process, will be notified to the Project HSE team, who will review the proposals and assess their potential for creating environmental or social interactions.
Changes which do not alter existing interactions or impacts, or which give rise to no interactions or impacts, will be summarised and periodically notified to the MENR, but will not be considered to require additional approval. This category will include items such as minor modification of chemical and drilling fluid systems, where the modification involves substitution of a chemical with equal or less environmental impact than the original.
If internal review and assessment indicates that a new or significantly increased impact may occur, the following process will be applied:
Categorisation of the impact using ESIA methodology; Assessment of the practicable mitigation measures; Selection and incorporation of mitigation measures; and Re-assessment of the impact with mitigation measures in place.
In practical terms, the changes that will require prior engagement and approval by the MENR are those that:
Result in a discharge to the Caspian that is not described in the COP ESIA; Increase the quantity discharged as detailed in the COP ESIA by more than 20%47,48; Result in the discharge of a chemical not referenced in the ESIA and not currently
approved by the MENR for use in the same application by existing AzSPU operations; or
Create or increase noise, light or other disturbance above applicable thresholds to human populations living in the vicinity of the COP activities.
Once the changes (and any appropriate mitigation) have been assessed as described above, a technical note will be submitted to the MENR describing the proposal and reporting the results of the revised impact evaluation. Where appropriate, this may include the results of environmental testing and modelling (e.g. chemical toxicity testing and dispersion modelling). Following submission of the technical note, the Project team will engage in meetings and 47
For the discharges detailed in the ESIA, an increase of 20% in volume would result in a 3-4% increase in the linear dimension of the mixing zone. For instance, a mixing plume 100m by 20m by 20m would increase by less than 2m in each dimension. Taking into account the actual size of the predicted mixing zones, this magnitude of increase is considered to make no material difference to the physical extent of the impacts. In practical terms, this would apply to increases of more than 20% (the value was selected to be conservative). 48 Unless increase is deemed to have no material effect on the associated impact(s).

AIOC Chirag Oil Project Environmental & Socio-Economic Impact Assessment
Chapter 5: Project Description
February 2010 5/66 Final
communication with the MENR in order to secure formal approval. Once approved, each item will be added to a register of change. The register will include all changes, including those non-significant changes notified in periodic summaries, and will note any specific commitments or regulatory requirements associated with those changes.
5.12 Summary of Emissions and Waste
5.12.1 COP Emissions
Table 5.34 presents an estimate of the total GHG and non GHG emissions associated with COP, assuming operations continue until 2024.
Table 5.34 Estimated GHG and non GHG Emissions Associated with the COP
Emissions to Atmosphere
Predrill
Onshore Construction
andCommissioning
PipelineInstallation and Commissioning
Platform Installation and Commissioning
Offshore Operations
Onshore Operations Total
CO2 ktonnes 41 59 72 8 4,320 1,455 5,955CO tonnes 168 171 260 20 7,275 1,505 9,400NOx tonnes 603 721 1,917 147 9,990 1,725 15,103SOx tonnes 58 83 260 20 2,475 5 2,901CH4 tonnes 85 3 9 0 7,105 1,465 8,667
NMVOC tonnes 64 57 78 6 4,610 1,335 6,150GHG ktonnes 43 59 73 8 4,470 1,485 6,138
See Appendix 5A for detailed emission estimate assumptions.
5.12.2 COP Hazardous and Non Hazardous Waste
Table 5.35 presents a summary of the expected hazardous and non hazardous waste generated by the COP, while Table 5.36 provides the subcategories of the waste listed in Table 5.35

AIOC Chirag Oil Project Environmental & Socio-Economic Impact Assessment
Chapter 5: Project Description
February 2010 5/67 Final
Table 5.35 Estimated Hazardous and Non Hazardous Waste Associated with the COP1
Estimated Volume (tonnes)
Type WasteCategory2
Sub Category PredrillOnshore
Construction & Commissioning
Installation and HUC
Offshore Operations Total
General Waste Nonhazardousnonrecyclable waste
Food/galley waste
285 20,470 3,000 3,000 26,755
Cooking oil Electrical cable Uncontaminated
blasting grit Paper and card
Plastics Scrap metal
Recyclable waste
Wood
95 16,555 765 975 18,390
Nonhazardous waste
Total (Non hazardous) 380 37,025 3,765 3,975 45,145 Batteries
Drum/cansCement
Sand and soil Contaminated grit
Clinical waste Oil filter parts
Oily soil Sand and sludges
Oily rags
Solidhazardouswaste
Paint cans contaminated with
uncured paint
210 515 90 1,765 2,580
Non-water basedassociateddrill cuttings3
-
21,000 - - 6,125 27,125
Used drilling fluids
-1,020 - - 17,350 18,370
Acids and alkalis AntifreezeChemicals
Fuel oil Grease
Oil Paint
Paint sludge Solvents and
thinnersPhotographic
developing fluids
Hazardous waste
Hazardousliquid waste
Oily and contaminated water
430 8,255 4,335 56,820 69,840
Total (Hazardous) 22,660 8,770 4,425 82,060 117,915 1 Treatment and disposal routes are detailed in Table 5.36 2 Estimates include key waste types. Minor non hazardous wastes including used tyres, toner cartridges and intermediate bulk
containers are excluded. 3 Includes associated mud, which is not separated on board the MODU/platform.

AIOC Chirag Oil Project Environmental & Socio-Economic Impact Assessment
Chapter 5: Project Description
February 2010 5/68 Final
Table 5.36 Waste Subcategories
Waste Container Type Waste type
Ground sweepings (non-hazardous) Food and drink packaging Office kitchen waste Uncontaminated used PPE Welding flux slag Uncontaminated cotton rags Used welding rods / electrodes Grinding / abrasive discs Non-recyclable office paper Rubber (hoses, gloves, etc) Air filters (no oil contamination) Empty plastic bottles Green waste (cuttings, dead plant matter) Electrode packaging Shoe covers Glass (sheet and uncontaminated bottles) – to be packaged Composite electrical equipment (switches etc) Scrap electrical panels Uncontaminated soils (unsuitable for re-use) Aggregates (stones, concrete, asphalt etc) Textile sacks and ropes Insulation eg Rockwool (must be in sealed bags) Used ropes Empty plastic packaging
GENERAL WASTE
Waste Blasting Grit/ Garnet (must be in sealed bags) General Metal Scrap Metal slag/ grindings Empty drums (uncontaminated) Chain cuts Empty clean metal buckets NailsCable trays (stainless steel) Electrical cable cuts (aluminum & copper)
METAL
Scrap metal lifting gear (no longer fit for use) Pallets, boxes, packing material and timberPlywood cuts Broken wooden handles from tools & supports
WOOD
Cable drums and cables Cardboard PAPER PaperPlastic scaffolding sheets Broken safety glasses and helmets Plastic packaging material Plastic kitchen wastes – not contaminated with food Plastic pipe cuts and shavings – no hazardous residues
PLASTIC
Waste plastic stationery Post consumer food waste FOOD Food processing and preparation waste Oily rags Oil filters Oily wood / wood shavings PPE contaminated with oil Oil Spill absorbents Any materials contaminated with oil
SOLID OILY WASTE
Soil contaminated with oil (sealed in plastic bags) Empty oil drums Empty plastic oil drums / cans Empty grease drums / tins
OILY WASTE CONTAINERS
Empty cooking oil drums / tins (metal & plastic) Paint cans (100% dry / cured) Paint cans containing unused paint (solid) PAINT WASTE Discarded paint brushes (100% dry /cured) Waste paint sludge Batteries & Accumulators Printer Cartridges Fluorescent tubes
HAZARDOUS WASTE
Tires (to be kept separately on pallets)

AIOC Chirag Oil Project Environmental & Socio-Economic Impact Assessment
Chapter 5: Project Description
February 2010 5/69 Final
Waste Container Type Waste type
Contaminated blasting grit (in plastic bags or dedicated skips) Glue tins / tubes – fully cured no wet glue Chemical contaminated rags, pads and sorbents Spray cans – punctured and depressurised Empty gas cylinders – fully emptied and depressurised Empty thinners tins Glass sharps, needles and syringes (double bagged) Contaminated materials (binds, tissues, etc) Plastic and glass vials (dbl bagged)
MEDICAL WASTE
Other medical disposables Dead birds and animals(dedicated wheelie bins) Oily liquids – waste drums to be used Cooking oil – filtered Waste thinners – waste drums to be used, no solids
DEAD BIRD / ANIMALS LIQUID WASTE – TANKS
PROVIDED BY EXECPETION Paint sludge – waste drums to be used
The planned destination of each COP waste stream is provided within Table 5.37. Waste management plans and procedures are detailed within Chapter 14.
Table 5.37 Planned Destination of COP Waste Streams
Category Sub Category Destination
General Waste Non hazardous non recyclable waste
Food/galley waste
Non-hazardous landfill – current facility has been designed and constructed to EU standards
Cooking oil Electrical cable Uncontaminated blasting grit Paper and card Plastics Scrap metal
Recyclable waste
Wood
Recycling contractors – SOFAZ to receive revenue from waste with inherent remaining value e.g. steel
BatteriesDrum/cansCementSand and soil Contaminated grit Clinical waste Oil filter parts Oily soil Sand and sludges Oily rags
Solid hazardous waste
Paint cans contaminated with uncured paint
Treatment/disposal by licensed AzSPU approved contractor or storage pending availability of appropriate contractor
Non-water based drill cuttings
Drilling cuttings
Cuttings will be treated by the indirect thermal desorption unit at Serenga.
Recovered mud will be reused and the process residuals stored until an AzSPU strategy of the long term reuse or disposal is agreed with the MENR
Acids and alkalis AntifreezeChemicalsFuel oil GreaseOil PaintPaint sludge Solvents and thinners Photographic developing fluids
Hazardous liquid waste
Oily and contaminated water
Treatment/disposal by licensed AzSPU approved contractor or storage pending availability of appropriate contractor

AIOC Chirag Oil Project Environmental & Socio-Economic Impact Assessment
Chapter 5: Project Description
February 2010 5/70 Final
5.13 COP Employment
It is estimated that the COP employment will peak at approximately 2,200 in 2011, and that the workforce will exceed 1,000 for a period of approximately 18 months during predrill, construction, installation and HUC activities (see Figure 5.23)49.
Figure 5.23 Estimated Number of Jobs for Azerbaijani Citizens Over the COP
Predrill, construction, installation and HUC
49 Refer to Chapter 12 for further details
0
500
1,000
1,500
2,000
2,500
0 10 20 30 40 50 602009 2010 2011 2012 2013 2014 2015 2016 2017 2018 2019 2020 2021 2022 2023 2024
Year
Predrill, construction, installation and HUC
Offshore Production

AIOC Chirag Oil Project Environmental & Socio-Economic Impact Assessment
Chapter 6: Environmental Description
February 2010 6/1 Final
6 Environmental Description
Contents
6.1 Introduction........................................................................................................................36.2 Data Sources.....................................................................................................................36.3 Physical Environment........................................................................................................7
6.3.1 Seismicity .............................................................................................................76.3.2 Climate..................................................................................................................76.3.3 Temperature .........................................................................................................76.3.4 Precipitation..........................................................................................................76.3.5 Wind......................................................................................................................8
6.4 Terrestrial and Coastal Environment...............................................................................106.4.1 Setting.................................................................................................................106.4.2 Air Quality ...........................................................................................................126.4.3 Noise...................................................................................................................166.4.4 Terrestrial Ecology..............................................................................................166.4.5 Coastal Ecology..................................................................................................186.4.6 Birds....................................................................................................................18
6.5 Offshore Environment .....................................................................................................236.5.1 Introduction.........................................................................................................236.5.2 General Characteristics of ACG Contract Area..................................................246.5.3 WC-PDQ Platform Location Characteristics.......................................................476.5.4 Observed Effect of West Azeri Platform Installation and Operations.................54
6.6 Benthic and Sedimentary Surveys Undertaken in 2009 .................................................576.6.1 Biological data ....................................................................................................576.6.2 Sediment Composition and Chemistry ...............................................................596.6.3 Conclusion..........................................................................................................60
List of Figures
Figure 6.1 Key Onshore and Offshore Locations Associated with the COP 5 Figure 6.2 Annual Wind Rose for the Sangachal Area, 1999-2001 8 Figure 6.3 Wind Rose for Offshore Central Caspian, 2005 9 Figure 6.4 Wind Speeds for Offshore Central Caspian, 2005 9 Figure 6.5 Sangachal Terminal and Key Features in the Surrounding Area 11 Figure 6.6 Ambient Air Quality Monitoring Locations 2006 and 2007 13 Figure 6.7 Approximate Distribution of Plant Community Types (Habitats) Around Sangachal Terminal 17 Figure 6.8 Important Ornithological Sites 19 Figure 6.9 Bird Migration Routes 20 Figure 6.10 The ACG Contract Area in the Context of the Caspian 23 Figure 6.11 Seabed Bathymetry 24 Figure 6.12 Thirteen Year (1982-1994) Average Wind Fields for January and July 26 Figure 6.13 Sketch of Winter Seasonal Flows Across the Absheron Based Largely on Near Bottom Current Measurements Collected Between November 2007 and May 2008 28 Figure 6.14 Sea Surface Temperature 09:40 (GMT) 3rd February 1996 During a Strong Deep Water Current Event in the ACG Contract Area 29 Figure 6.15 NCEP Winds and Atmospheric Pressure During the Largest Storm in the CASMOS 2 Dataset 30 Figure 6.16 NCEP Wind and Pressure During a High Pressure Intrusion from the North West 31 Figure 6.17 Location of ACG 2006 Regional Seabed Sampling Stations 32 Figure 6.18 Water and Plankton Sampling Locations 37 Figure 6.19 Location of ACG Contract Area Plankton Sampling Transects 38 Figure 6.20 CTD Profiles from ACG, Pipeline and Inam Water Sampling Stations 39 Figure 6.21 Platform, Pipeline Corridor and Sangachal Bay Survey Locations 48 Figure 6.22 Sediment Silt-Clay Content (%) - Median and Range 49

AIOC Chirag Oil Project Environmental & Socio-Economic Impact Assessment
Chapter 6: Environmental Description
February 2010 6/2 Final
Figure 6.23 Sediment Particle Diameter - Median and Range µm 50 Figure 6.24 Carbonate (%) – Median and Range 50 Figure 6.25 Median Depth, and Range, at Survey Locations Across ACG Contract Area 51 Figure 6.26 Layout of the West Azeri 2008 Survey Stations 55 Figure 6.27 2009 COP Benthic Survey Stations 57
List of Tables
Table 6.1 Onshore, Nearshore and Offshore Surveys, 1992-2007 6 Table 6.2 Absheron Peninsula 2000 Rainfall Data (mm) 8 Table 6.3 Average NOX and SO2 Air Quality Concentrations (µg/m3) (2006) 14 Table 6.4 Average Benzene and VOC Concentrations (µg/m3) (2006) 14 Table 6.5 Average PM10 Concentrations (µg/m3) (2006) 15 Table 6.6 Average NOX and SO2 Air Quality Concentrations (µg/m3) (2007) 15 Table 6.7 Noise Survey Results for Residential Communities in the Vicinity of Sangachal Terminal (2007 and 2008) 16 Table 6.8 Overwintering Birds of Importance Recorded in 2002-2206 Surveys 20 Table 6.9 Percentage of Birds Utilising Spring and Autumn Migration Routes 21 Table 6.10 Migration Birds of Importance Recorded in 2002-2006 Surveys 21 Table 6.11 Azeri Redbook/IUCN Red List Bird Species Observed in the Vicinity of the Terminal 22 Table 6.12 Summary of 2006 Survey Sediment Metals Concentrations Across 12 Monitoring Stations (µg/g) 33 Table 6.13 Summary of 2004 Survey Sediment Metals Concentrations Across 6 Monitoring Stations (µg/g) 33 Table 6.14 Comparison of Sediment Chemistry Concentrations Across Monitoring Stations Surveyed (µg/g),1996-2006 33 Table 6.15 Number of Taxa in Each Major Taxonomic Group, 1996-2006 34 Table 6.16 Comparison of Species Number and Abundance, 1995-2006 34 Table 6.17 Number of Phytoplankton Taxa per Major Taxonomic Group 40 Table 6.18 Seasonal Fish Presence in the Contract Area 43 Table 6.19 Fish Species recorded in the Contract Area, 2008 43 Table 6.20 Seabird Species Found in the ACG Contract Area 46 Table 6.21 Sediment Hydrocarbons (Median Values for Each Location are Given) 51 Table 6.22 Median Trace Metal Concentrations in Sediments (µg/g) at each Survey Location 52 Table 6.23 Number of Species Representing Each Major Taxonomic Group 54 Table 6.24 Comparison of Sediment Properties, West Azeri, 2002-2007 55 Table 6.25 Comparison of Overall Taxonomic Richness for Major Groups Between 2003
and 2009 in the Vicinity of the COP Location 58 Table 6.26 Station-by-Station and Overall Comparison of Species Richness and Abundance
between 2003 and 2009 59 Table 6.27 Comparison of Sediment Structure between 2003 and 2009 60 Table 6.28 Comparison of Sediment Heavy Metal Concentrations between 2003 and 2009
Surveys 60 Table 6.29 Comparison of Sediment Heavy Metal and Hydrocarbon Concentrations
between 2003 and 2009 Surveys 60

AIOC Chirag Oil Project Environmental & Socio-Economic Impact Assessment
Chapter 6: Environmental Description
February 2010 6/3 Final
6.1 Introduction
This Chapter describes the terrestrial and marine environments associated with the Chirag Oil Project (COP). Three geographic zones are defined:
Onshore: Vicinity of the Sangachal Terminal and potential construction yards; and Offshore: ACG Contract Area and the vicinity of the West Chirag Production, Drilling and Quarters (WC-PDQ) platform location.
It is the preference of the COP to use existing, developed, brown-field sites for onshore construction activities. Candidate locations include the following established yards:
Baku Deep Water Jacket Factory (BDJF) yard (formerly Shelfprojectsroi (SPS) yard); Zykh yard; and Construction yards adjacent to Bibi Heybet Oilfield including:
o South Dock yard; and o the former Amec-Tekfen-Azfen (ATA) yard hereafter referred to as the Bibi
Heybet construction yard.
Selection of the COP construction contractors and yards will be completed in 1Q 2010.
Figure 6.1 presents the key onshore and offshore locations associated with the COP.
6.2 Data Sources
AIOC has conducted a large number of surveys and investigations in relation to the ACG Contract Area and Sangachal Terminal environments. Table 6.1 lists the onshore, nearshore and offshore surveys and studies undertaken by AIOC since 1992 in the following areas:
ACG Contract Area and the associated marine export pipeline Right of Way (ROW); Sangachal Bay; and Vicinity of the Sangachal Terminal and other ACG onshore facilities including the
Logistics Supply Base (adjacent to the BDJF yard) and established construction yards.
Between 1994 and 2004 onshore surveys have focused on investigating baseline conditions for flora and fauna, air quality, noise and contamination in various project locations. As part of the Integrated Environmental Monitoring Programme (IEMP), data reporting since 2004 includes:
Ambient air quality at selected receptors in the vicinity of the Terminal; Soil, groundwater and surface water conditions from boreholes and sampling points in
the vicinity of the Terminal; and Ongoing overwintering birds survey in and around Sangachal Bay.
In 2003, a baseline benthic survey was conducted at the West Chirag location. The proposed position of the COP WC-PDQ platform lies within the boundaries of the 2003 West Chirag survey area. In July 2009 a limited benthic and sediment survey was carried out to extend the 2003 West Chirag survey area to the north east (NE).
Since 2004, offshore monitoring has been managed within the context of the IEMP, which has covered baseline surveys (for new ACG developments), operational platform surveys (as new installations start production), subsea pipeline surveys and regional “background” surveys to identify natural or large-scale trends for comparison against baseline and operational surveys.
A primary aim of the IEMP is to develop reliable and consistent time series data for each location or station array within a survey area. This approach enables long-term trends to be identified and minimises the risk of misinterpretation which can arise from simple “before and after” comparisons of data. In particular, it permits ecological changes, observed at a regional

AIOC Chirag Oil Project Environmental & Socio-Economic Impact Assessment
Chapter 6: Environmental Description
February 2010 6/4 Final
level, to be taken into account when interpreting the results of monitoring around ACG production platforms or other operational installations.
Under the AIOC Production Sharing Agreement (PSA), responsibility for the preparation and approval of the overall environmental monitoring programme rests with the Environmental Sub-Committee (ESC), which carries out an annual review of planned activities. The ESC comprises representatives of key stakeholders such as the State Oil Company of Azerbaijan (SOCAR), the Council of Ministers, the Ministry of Ecology and Natural Resources (MENR) and the Azerbaijan National Academy of Sciences (ANAS). Practical supervision and review of ongoing activities is delegated to the ACG & SD Environmental Monitoring Technical Advisory Group (EMTAG), which comprises environmental specialists representing these organisations.
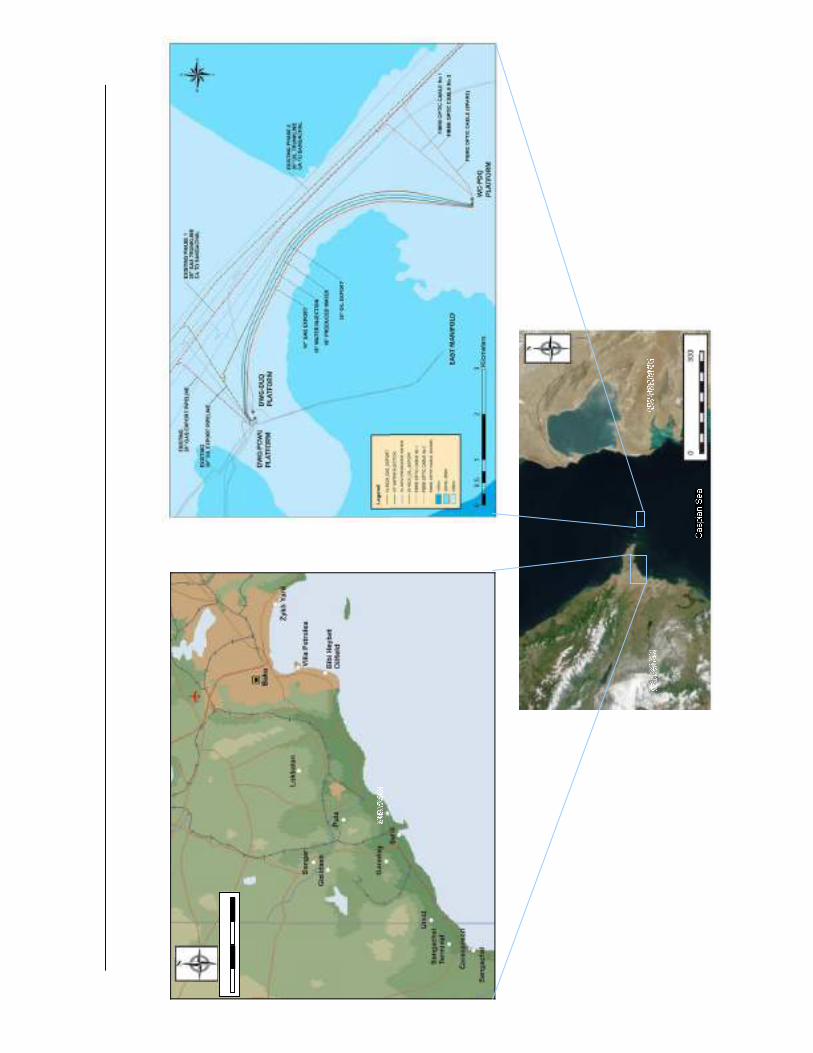

AIOC Chirag Oil Project Environmental & Socio-Economic Impact Assessment
Chapter 6: Environmental Description
February 2010 6/6Final
Table 6.1 Onshore, Nearshore and Offshore Surveys, 1992-2009
Date Title of Survey Marine Surveys 1992 Pilot Environmental Survey, Chirag oilfield 1995 Environmental baseline study: Review of the existing scientific literature 1995 AIOC Offshore Environmental Baseline Survey 1995, September and December1996 Pipeline Landfall Survey: Sediments and Macrobenthos 1996 AIOC Contract Area Long Term Monitoring Stations, 1996 1996 AIOC Appraisal Well 1 Pre and Post Appraisal Drilling Seabed Environmental Survey1996 Sangachal Coastal Environmental Survey, 1996 1997 AIOC Appraisal Well 1 Pre and Post Appraisal Drilling Seabed Environmental Survey1997 AIOC Appraisal Well GCA No. 3 GCA No. 4, Post Appraisal Drilling Surveys 1998 AIOC Chirag 1 Mid Drilling Environmental Survey, 1998 1998 AIOC Phase 1 Environmental Description, 1998 (draft) 1998 Phase 1 Platform 1a and 1b Environmental Baseline Surveys 1999 Review of AIOC Environmental Monitoring, 1999 1999–2001 Gunashli Field Fisheries Surveys 2000 Chirag 1 Post Saraline Survey, 2000 2000 GCA 5 and 6 Post Well Survey, 2000 2000 Chirag - Sangachal Sub-sea Pipeline Survey, 2000 2000 Sangachal Coastal Environmental Survey, 2000 2001 ACG Phase 1 ESIA Baseline Survey (Central Azeri) 2001 GCA7 Environmental Survey (ACG Phase 3 Offshore Area) 2000-2005 Sangachal Fisheries Monitoring Programme 2002 ACG Phase 2 Environmental Baseline Survey (East Azeri and West Azeri) 2003 West Chirag Environmental Baseline Survey 2004 ACG Contract Area Regional Benthic and Plankton Survey2004 Chirag 1 Benthic Survey 2004 Central Azeri Benthic Survey 2005 ACG Regional Plankton Survey 2005 West Azeri Post-installation Benthic Survey 2006 East Azeri Post-installation Benthic Survey 2006 Chirag 1 Platform Benthic Survey 2006 ACG Regional Benthic Survey 2006 Sangachal Bay Benthic Survey 2006 ACG Pipeline Corridor Benthic and Plankton Survey2007 West Azeri Platform Benthic Survey 2007 Deep Water Guneshli DUQ Post-installation Benthic Survey 2009 West Chirag Benthic and Sediment Composition Survey Terrestrial Surveys 1996 EOP Sangachal Terminal Survey 2001 Phase 1 Terrestrial Survey 2002 Phase 2 Terrestrial Survey 2002/2003 Overwintering Bird Survey, Absheron to Kura 2003 Sangachal Terminal Watershed Analysis 2003 Sangachal Wetlands Survey Summer/Autumn 2002
2004 BP Logistics Supply Base Development Project, Environmental and Socio-economic Impact Assessment, Draft Report
2004 Overwintering Bird Survey, Absheron to Kura 2004 Breeding Bird Monitoring Survey Sangachal 2004 Integrated Terrestrial Ecosystem Monitoring Survey - Spring 2004 Integrated Terrestrial Ecosystem Monitoring Survey - Autumn 2004 Winter Waterfowl Monitoring Study. Absheron to Kura 2005 Integrated Terrestrial Ecosystem Monitoring Survey - Spring 2005 Integrated Terrestrial Ecosystem Monitoring Survey - Autumn 2006 Sangachal Terminal Ambient Air Quality Monitoring 2006 Winter Waterfowl Monitoring Study. Absheron to Kura 2006 Sangachal Terminal Terrestrial Monitoring Survey - Spring 2006 Sangachal Terminal Terrestrial Monitoring Survey - Autumn 2006 Onshore Ambient Monitoring (Sangachal): Hydrology & Hydrogeology – Phase 1 2007 Sangachal Terminal Ambient Air Quality Monitoring 2007 Sangachal Terminal Terrestrial Monitoring Survey - Spring 2007 Sangachal Terminal Terrestrial Monitoring Survey - Autumn
AIOC Chirag Oil Project Environmental & Socio-Economic Impact Assessment
Chapter 6: Environmental Description
February 2010 6/7Final
6.3 Physical Environment
6.3.1 Seismicity
The Caspian region, which is part of the Eurasian continental plate, has a convergent plate boundary with the Arabian and Indian continental plates. This has occurred for hundreds of millions of years leading to the destruction of an ocean (Tethys), which lay, between Eurasia to the north with Africa and India forming its southern shores. The mountain chains of the Alps, Caucasus and the Karakorum/Himalayas are composed of upthrusted rocks formed in and around this ancient ocean.
The Southern Caspian area is defined by the Scythian microplate, as part of the Russian plate, the Turanian, Iranian and small Caucasian plates, as well as, the South Caspian microplate. Current neotectonic (more recent) processes are leading to convergent movements of these plates of 1.8cm/year in the Caspian1. Convergent plate movements are generally associated with relatively high levels of seismic activity and accompanied by earthquakes and volcanism.
Azerbaijan is known for its seismic activity, particularly in the Greater and Lesser Caucasus Mountains. Five earthquakes with a magnitude greater than 6.0 on the Richter scale have occurred since 1842 with the most recent, measuring 6.5, on 25th November 2000 with an epicentre 30km east-north east of Baku. More detailed information on the seismicity and tectonics of the area can be found in the ACG Phase 1 ESIA2.
6.3.2 Climate
Climatic data, with the exception of wind data, for the period 1977 to 2000, has been collected from the meteorological station at Alyat located approximately 25km south of Sangachal. Wind data, for the period 1999 and 2001, has been recorded onshore at Baku Airport located approximately 45km northeast of Sangachal. Offshore wind data, for the year 2005, has been recorded at the Central Azeri (CA) and Chirag-1 platforms.
6.3.3 Temperature
The onshore Sangachal area is classified as being warm, semi-arid steppe, with an annual mean air temperature of 14.4 degrees Celsius (°C). July is the warmest month of the year with a 23-year mean average air temperature between 1977-2000 of 26.4°C. January is the coldest month with an average of 0°C. Temperature extremes of –16°C and 41°C have been recorded historically in January and July, respectively.
Offshore air temperatures show considerable seasonal variation in the Caspian area. In the summer, the southern Caspian Sea is influenced by the South Asian Low. Air temperatures peak in July and August with average temperatures of 27°C. During the winter pressures over the southern area of the Caspian Sea tend to be raised by local highs that form over the Armenian and Iranian highlands. Temperatures within the ACG Contract Area average around 5°C, but are known to occasionally fall below freezing3.
6.3.4 Precipitation
The onshore Sangachal area is one of the driest in Azerbaijan. Based on data from Alyat meteorological station, mean annual rainfall over the period from 1977 to 2000 was 217mm. The highest monthly rainfalls are recorded in November, receiving an average of around 32mm/month with the drier periods occurring during July, receiving an average of 3mm/month. October to March is the period of greatest rainfall with intensities often exceeding 25 mm/day.
1 Karabanov, Institute of Geology, pers comm.2 URS (2002) 3 Ocean MetriX Ltd (2009)

AIOC Chirag Oil Project Environmental & Socio-Economic Impact Assessment
Chapter 6: Environmental Description
February 2010 6/8Final
Table 6.2 presents average monthly rainfall data from the Absheron Peninsula for 2000. The Absheron Peninsula experiences relatively dry summers with higher rainfall in the winter, spring and autumn months. Average annual rainfall varies between 200mm and 400mm. Rainfall in the ACG Contract Area is similar to that on the Absheron Peninsula.
Table 6.2 Absheron Peninsula 2000 Rainfall Data (mm)4
J F M A M J J A S O N D Total 46 20 34 18 45 20 2 15 45 64 44 33 386
6.3.5 Wind
Onshore
The wind regime in Sangachal Bay is on the whole consistent with that for the Absheron Peninsula although it is recognised that there is a local thermally driven wind system. The effects of the local system are most noticeable offshore within the bay, resulting in a slight (1m/s to 2m/s) offshore wind during the early hours of the morning, which then drops and becomes a stronger onshore wind as the land heats up. This thermal influence coupled with the meteorological dynamics of the region can result in strong winds occurring with little forewarning.
Figure 6.2 shows a wind rose compiled from data collected over the period between January 1999 and October 2001 at Baku Airport5. The predominant wind direction is north-northwesterly (i.e. blowing from land to sea) occurring approximately 20% of the year. Northwesterly, northerly and southerly winds account for approximately 30% to 40% of other winds. Wind speeds typically range from 0.5m/s to 14m/s with approximately 10% of winds being greater than 11m/s.
Figure 6.2 Annual Wind Rose for the Sangachal Area, 1999-2001
4 Food and Agricultural Organisation of the United Nations (2001) 5 The anemometer is located 10m above ground level

AIOC Chirag Oil Project Environmental & Socio-Economic Impact Assessment
Chapter 6: Environmental Description
February 2010 6/9Final
Offshore
Figure 6.3 presents a wind rose for offshore in the central Caspian Sea based on data recorded at the Chirag-1 and CA platforms for the year 20056. The predominant wind direction is southerly (blowing from south to north), occurring for approximately 20% of the year with secondary winds from the north, northwest and northeast occurring 30% of the year.
Figure 6.3 Wind Rose for Offshore Central Caspian, 2005
Figure 6.4 shows that the mean wind speed offshore was 12m/s in 2005. A maximum of 42.8m/s was reached in January. Wind speeds greater than 20m/s were experienced for approximately 10% of the time.
Figure 6.4 Wind Speeds for Offshore Central Caspian, 2005
6 There are two anemometers on both the Chirag-1 and CA platforms – one on the drilling rig approximately 80m above sea level and one on the helideck approximately 50m above sea level.

AIOC Chirag Oil Project Environmental & Socio-Economic Impact Assessment
Chapter 6: Environmental Description
February 2010 6/10Final
6.4 Terrestrial and Coastal Environment
6.4.1 Setting
6.4.1.1 Sangachal Terminal
Sangachal Terminal, occupying an area of approximately 5.5km2, is sited on a plain sloping gently towards the south east and to the Caspian Sea. The elevation of the Terminal site is around 15m to 20m below Mean Sea Level (MSL) (the mean level of the Caspian Sea is about 27 to 28m below MSL). There are a number of steeper hills to the north and north east of the Terminal rising to over 300m to the north and 400m around Mt Qaraqush, a large mud volcano, which last erupted in 2000. The nearest hills lie to the northwest with a mean height of 70m to 85m above MSL.
There are three main settlements in the vicinity of the Terminal (Figure 6.5) the largest being Sangachal Town located approximately 2.5km south. The Umid Settlement lies less than 1km to the east of the Terminal and Azim Kend is located approximately 2.7km to the southwest.
Umid and Sangachal are adjacent to the Baku-Alyat Highway, a four lane hard-surfaced road that runs parallel to the Caspian Sea coastline. A raised railway line (2m to 4m above ground level) runs parallel to the Highway, between the highway and the Terminal. Multiple underground and aboveground pipelines (oil, water and gas pipelines) also run parallel to the highway between the railway and Terminal.
Figure 6.5 also shows the main drainage catchment areas surrounding the Terminal. Drainage from:
Catchment areas 1-3 (the Shachkaiya Wadi and its western tributaries) flows to a culvert, which drains to the Caspian under a bridge beneath the railway and through a box culvert under the coastal highway.
Catchment areas 4-7 flows from the slopes around Mt Qaraqush to the flood protection channel around the Terminal and from there drains to the Caspian via the Central Drainage outlet; a culvert under the highway and railway.
Catchment area 8 flows directly to the Central Drainage outlet. Catchment area 9 (Wadi Umid) flows to the Caspian via a separate culvert under the
highway and railway.
During periods of high flow there can be significant ponding of water in flood storage area 10 prior to discharge to the Caspian via the Central Drain outlet.
The Sangachal Wadi flows between the terminal and Sangachal settlement, and enters the Caspian Sea through the railway bridge and a box culvert beneath the coastal highway. This wadi, and the other smaller catchments, are ephemeral and only flow after heavy or prolonged rainfall.
The lower reaches of the Shachkaiya Wadi are usually wet and appear to have a small permanent water flow which sustains a significant area of reed and scrub vegetation. It is likely that this flow is a combination of ephemeral surface drainage from the Sangachal terminal and waste water streams from the Azim Kend and Sangachal settlements, possibly with some contribution from leaking water pipes.
The Central Drain also seems to carry a small but steady stream of water which seems to originate largely from treated sewage water discharges from the Sangachal terminal.

AIOC Chirag Oil Project Environmental & Socio-Economic Impact Assessment
Chapter 6: Environmental Description
February 2010 6/11Final
Figure 6.5 Sangachal Terminal and Key Features in the Surrounding Area
6.4.1.2 Construction Yards
The BDJF Yard lies approximately 20km southwest of Baku on the western coastline of the Caspian Sea. The site is approximately 1.5km2 in size and bound to the north by vacant land, to the southeast by the Caspian Sea and to the west by the Salyan Highway. The site is located on a coastal plain that features undulations up to 2m in height in areas around the Yard. The coastal plain is backed by steep hills that form a ridgeline running approximately parallel to the coast. The coastal area in the vicinity of the yard also hosts shallow lagoons.
The BDJF Yard includes two areas: the area to the north that was previously used for construction of the ACG Phases 1, 2 and 3 jackets and the area to the south where the corresponding topsides were constructed (except for the Phase 1 Compression and Water Injection Platform (C&WP) and Phase 3 Production, Compression, Water Injection and Utilities (PCWU) topsides).
C A S P I A N S E A
228
302308
220
251
323
389
0
80
293
172.5
215.4
110
59.5
4031
2
3
4
5
6
7
8 9
10
ShachkaiyaWadi
ShachkaiyaHills
Mt Qaraqush
SANGACHAL
Dzhumathaz
Shachkaiya WadiTerminal central drainage outlet
Wadi Umid
Djeyramkechmez River
Main watercourses
Maximum elevations
Principal gulleys
Main Flood storage area
Catchment outlets forhydrological simulation
293
Mt Qaraqush mudflows
Shachkaiya catchments
Catchments 4 - 6
Mt Qaraqush catchments
0 1000 2000 3000 4000
AZIM KEND
UMID
0 4 kilometres
Railway
Highway
TERMINAL

AIOC Chirag Oil Project Environmental & Socio-Economic Impact Assessment
Chapter 6: Environmental Description
February 2010 6/12Final
Several derelict structures including buildings, storage tanks and wellheads are present in the surrounding area.
The Bibi Heybet Yard is located approximately 8km south of Baku. The Caspian Sea bounds the yard to the east and south. Land to the west of the yard is mostly undeveloped but some buildings, approximately 1km away, do exist. To the north is the Bibi Heybet oil field. The yard is approximately 0.84km2 and is essentially level with the regional topography, sloping gently (<1 degree) towards the Caspian Sea. The Phase 1 C&WP and Phase 3 PCWU topsides were fabricated at this yard.
The South Dock Yard is located approximately 8km to the south of Baku, adjacent to the Bibi Heybet Oilfield and in close proximity to the Bibi Heybet Yard. The facilities within the South Dock Yard include jetties and berths, cranes, offices, warehouse, mechanical and electrical repair shops, lay down areas, an enclosed painting facility and a steel fabrication and construction area. South Dock Yard has been used for various construction and upgrade projects, including barge and vessel upgrades, associated with ACG operations.
Areas surrounding the South Dock Yard include:
North: A narrow strip of land joining the southern site to the main South Dock Yard and the Bibi Heybet Oilfield further beyond; Northeast: A small area of land where vessels are serviced; South: A concrete jetty and the Caspian Sea; and Southwest: South Bay Road and a steep escarpment with a residential development and mosque overlooking the South Dock Yard.
The Zykh yard is located on a narrow coastal fringe at the foot of a steep escarpment, approximately 15km to the east of Baku. Land in the immediate site vicinity is occupied by light and heavy industrial uses and the nearest residential properties are approximately 1km from the site perimeter. The yard has previously been used for the construction of the Shah Deniz project offshore facilities.
6.4.2 Air Quality
Ambient air quality monitoring has been undertaken around Sangachal Terminal since 1997, prior to the EOP activities commencing at the Terminal. Currently ACG Phases 1-3 and SD1 as well as EOP are operating at the Terminal. The methodology, monitoring locations and species monitored have varied across the monitoring surveys. The most recent and relevant completed were undertaken in 2006 and 2007. Figure 6.6 presents the monitoring locations in and around the Sangachal Terminal for the 2006 and 2007 surveys.

AIOC Chirag Oil Project Environmental & Socio-Economic Impact Assessment
Chapter 6: Environmental Description
February 2010 6/13Final
Figure 6.6 Ambient Air Quality Monitoring Locations 2006 and 2007
Ambient air quality measurements were assessed against IFC7 and World Health Organisation Guidelines8 (WHO) and in the case of benzene, the European Union (EU) Guidelines.9,10,11
The 2006 average values and standard deviations for NOX12 and SO2 based on long-term
measurements are shown in Table 6.3. Annual average guideline criteria for NOX and SO2
were not exceeded at any station. The criteria were exceeded during individual measurement cycles at three stations (though this does not infer a breech of the limits as a one off measurement is not sufficient to give an annual average). Of these, two stations were within the Terminal boundary (ST12) or within the contractor area (ST03) and the cause for exceeding the guidelines are likely to have been a localised source such as exhaust emissions from a vehicle or from equipment. ST06, where one exceedence was recorded, is an unpopulated area between the Terminal and Sangachal Town, adjacent to a sewage treatment plant. Guidelines were not exceeded at stations located within the Sangachal Town or Umid Settlement. Short-term monitoring for NOX using chemiluminescence, SO2 using ultraviolet fluorescence and particulates using partisol analysers did not detect substantial quantities of pollutants and the short term guideline values were not exceeded at any of the monitoring sites.
7 IFC Environmental, Health and Safety Guidelines. General EHS Guidelines: Environmental, Air Emissions and Ambient Air Quality (2007) 8 World Health Organisation Guidelines (1999) 9 European Union Guidelines (2005) 10 No guidelines were available for total volatile organic carbon. 11 Historically in Azerbaijan ambient concentrations of NO2, SO2, CO and PM10 have also been assessed against 24 hour and 1 hour standards. These standards were not derived using the same health based criteria as the IFC, WHO and EU guideline values and the standards derived are not widely recognised.12 NOx was assessed on a worst case basis assuming all nitrous oxides are NO2.
Sangachal terminal
AAQ13 AAQ14
AAQ15
AAQ16
AAQ17
AAQ18
0 1 kilometres
Key
2006 Monitoring Locations
2006 and 2007 Monitoring Locations
2007 Monitoring Locations
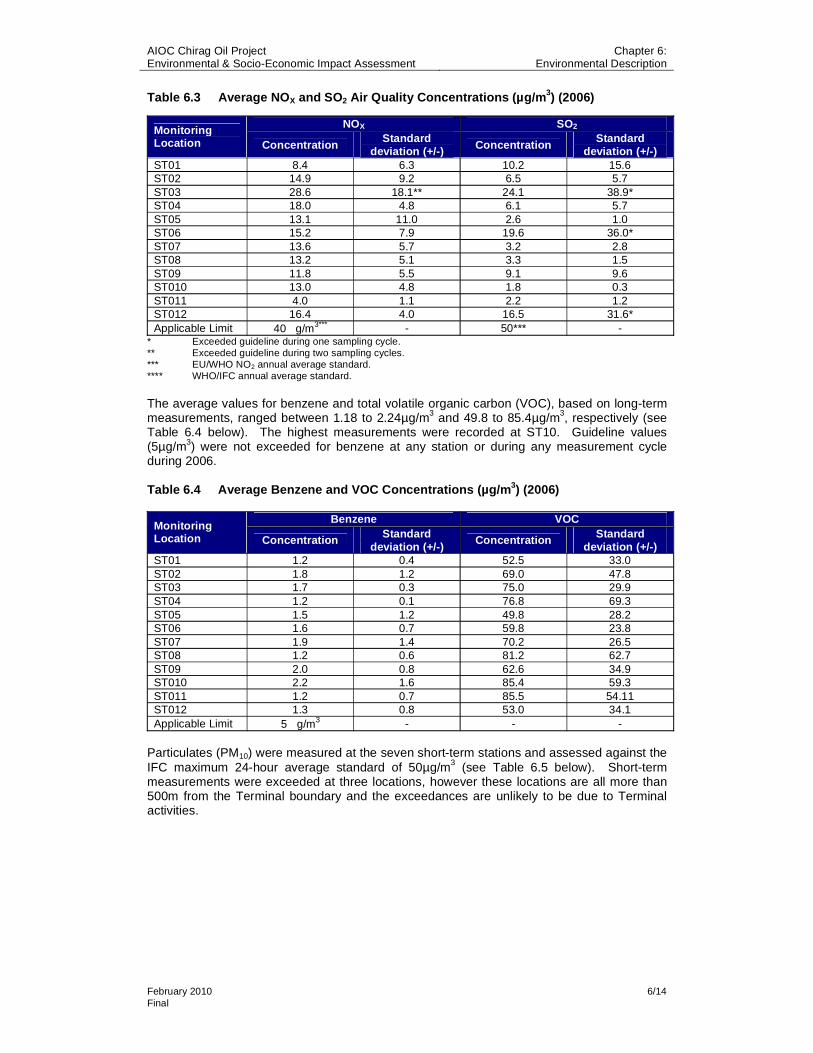
AIOC Chirag Oil Project Environmental & Socio-Economic Impact Assessment
Chapter 6: Environmental Description
February 2010 6/14Final
Table 6.3 Average NOX and SO2 Air Quality Concentrations (µg/m3) (2006)
NOX SO2Monitoring Location Concentration
Standard deviation (+/-) Concentration
Standard deviation (+/-)
ST01 8.4 6.3 10.2 15.6 ST02 14.9 9.2 6.5 5.7 ST03 28.6 18.1** 24.1 38.9* ST04 18.0 4.8 6.1 5.7 ST05 13.1 11.0 2.6 1.0 ST06 15.2 7.9 19.6 36.0* ST07 13.6 5.7 3.2 2.8 ST08 13.2 5.1 3.3 1.5 ST09 11.8 5.5 9.1 9.6 ST010 13.0 4.8 1.8 0.3 ST011 4.0 1.1 2.2 1.2 ST012 16.4 4.0 16.5 31.6* Applicable Limit 40 g/m3*** - 50*** -
* Exceeded guideline during one sampling cycle. ** Exceeded guideline during two sampling cycles. *** EU/WHO NO2 annual average standard. **** WHO/IFC annual average standard.
The average values for benzene and total volatile organic carbon (VOC), based on long-term measurements, ranged between 1.18 to 2.24µg/m3 and 49.8 to 85.4µg/m3, respectively (see Table 6.4 below). The highest measurements were recorded at ST10. Guideline values (5µg/m3) were not exceeded for benzene at any station or during any measurement cycle during 2006.
Table 6.4 Average Benzene and VOC Concentrations (µg/m3) (2006)
Benzene VOCMonitoring Location Concentration Standard
deviation (+/-) Concentration Standard
deviation (+/-) ST01 1.2 0.4 52.5 33.0 ST02 1.8 1.2 69.0 47.8 ST03 1.7 0.3 75.0 29.9 ST04 1.2 0.1 76.8 69.3 ST05 1.5 1.2 49.8 28.2 ST06 1.6 0.7 59.8 23.8 ST07 1.9 1.4 70.2 26.5 ST08 1.2 0.6 81.2 62.7 ST09 2.0 0.8 62.6 34.9 ST010 2.2 1.6 85.4 59.3 ST011 1.2 0.7 85.5 54.11 ST012 1.3 0.8 53.0 34.1 Applicable Limit 5 g/m3 - - -
Particulates (PM10) were measured at the seven short-term stations and assessed against the IFC maximum 24-hour average standard of 50µg/m3 (see Table 6.5 below). Short-term measurements were exceeded at three locations, however these locations are all more than 500m from the Terminal boundary and the exceedances are unlikely to be due to Terminal activities.

AIOC Chirag Oil Project Environmental & Socio-Economic Impact Assessment
Chapter 6: Environmental Description
February 2010 6/15Final
Table 6.5 Average PM10 Concentrations (µg/m3) (2006)
PM10Monitoring Location Concentration Standard deviation (+/-)
ST05 52.5 19.0** ST06 41.5 31.8 ST07 44.0 22.6 ST08 102.0 1.4* ST09 28.5 3.5 ST010 52.0 18.4** ST012 32.5 23.3 Applicable Limit 50 g/m3 -* Exceeded guideline during two measurement cycles ** exceeded guideline
Results are presented in full within the BP AzSPU Integrated Environmental Monitoring Programme: Annual Summary Report for 2006.
During 2007, the ambient air quality monitoring programme was redesigned to better reflect the operating plant as it is now, with some monitoring locations discontinued and several new monitoring locations initiated (Figure 6.6). Two rounds of monitoring were carried out using diffusion tubes, corresponding to a period when the Terminal oil-handling operations were shut-down and a second period when the Terminal was in full operational mode (Table 6.6).
Table 6.6 Average NOX and SO2 Air Quality Concentrations (µg/m3) (2007)
Terminal shut-down period Terminal operational Monitoring Location NOx SO2 NOx SO2
ST06 __* __* 18.0 5.7 ST07 160.0 2.0 12.0 1.6 ST08 12.0 18.0 13.0 4.3 ST09 9.6 22.0 12.0 1.3 ST10 6.4 2.0 9.3 1.5 ST11 5.3 3.7 3.9 23.0 ST12 13.0 4.4 5.1 1.6 AAQ13 25.0 5.9 10.0 1.6 AAQ14 2.7 2.0 16.0 1.6 AAQ15 4.4 2.3 __* __* AAQ16 6.2 13.0 0.05 1.6 AAQ17 __* __* __* __* AAQ18 5.8 5.2 4.2 200.0 Applicable Limit 40 g/m3*** 50*** 40 g/m3*** 50***
* Diffusion tubes were lost or stolen during the two monitoring cycles ** Exceeded guideline during one sampling cycle *** EU/WHO NO2 annual average standard **** WHO/IFC annual average standard
The data shows one guideline exceedence for NOX at ST07 (inside Sangachal Town). This occurred during the period when Terminal operations were shut down and would therefore be likely to have originated from a local source rather than from the Terminal.
A high SO2 value also occurred at one location, AAQ18, an unpopulated area east of the Terminal – between the Terminal and the Caspian Sea. The value was recorded when the Terminal was operational. However, nearby monitoring locations (ST09, AAQ13 and ST12) did not indicate similarly elevated levels suggesting the source would have been localised in nature.
Short-term monitoring (24-hour) was carried out on different days at each of the locations during the same periods. No exceedences of the short-term guideline values were observed.

AIOC Chirag Oil Project Environmental & Socio-Economic Impact Assessment
Chapter 6: Environmental Description
February 2010 6/16Final
6.4.3 Noise
Noise surveys were undertaken in 2007 and 2008 in the vicinity of the terminal and at surrounding residential communities. Table 6.7 presents the daytime noise levels recorded.
Table 6.7 Noise Survey Results for Residential Communities in the Vicinity of Sangachal Terminal (2007 and 2008)
20071 20082
Location (laeq) (laeq)
Azim Kend 44.3 38.7Umid 50.9 49.4Sangachal 50.9 51.21Averaged data from surveys conducted from January - April. 2Averaged data from surveys conducted from July - December.
While the terminal is the largest and most visible potential source of noise the area, other noise sources of relevance for the surrounding communities include wind generated noise (wind speeds and greater than 5 knots more than 80% of the time), major roads and local domestic noise sources. Taking into consideration of these noise sources Table 6.5 demonstrates that IFC noise guidelines (55dB during daytime) are met at all residential community locations. Night time noise monitoring surveys are included within the future IEMP activities as insufficient night time survey results have been undertaken to date to provide typical night time noise levels at residential communities in the terminal vicinity.
6.4.4 Terrestrial Ecology
6.4.4.1 Habitats and Flora
Sangachal Terminal is located in a semi-arid region interspersed with areas of semi-arid vegetation (Refer to Figure 6.7). The area is dominated by a high percentage of bare soil, often in large patches, and a vegetation component dominated by low perennial shrubs such as Salsola nodulosa and Salsola dendroides interspersed with the perennial grass Poabulbosa. The area particularly to the south/southeast of the Terminal also hosts chal-meadows – depressions that retain moisture and host a greater variety and structural diversity of plant species including Tamarix ramosissima and Lycium ruthenicum. Appendix 6A presents the habitats and predominant plant species identified in surveys undertaken in the vicinity of the Terminal between 2006 and 2008.

AIOC Chirag Oil Project Environmental & Socio-Economic Impact Assessment
Chapter 6: Environmental Description
February 2010 6/17Final
Figure 6.7 Approximate Distribution of Plant Community Types (Habitats) Around Sangachal Terminal.
Key: A = landscape changed due to anthropogenic activities; C = coastal vegetation; CM = Chal Meadow; D = Desert plain; DM = Desert mountain; R = Reed beds.
The central plains are heavily grazed by livestock (e.g. sheep) although the areas immediately surrounding the Terminal may have seen some recent reduction in grazing following the erection of a partial fence (not complete in the west). As such, moderate soil erosion occurs in vegetated areas and high rates of erosion can be seen in unvegetated areas. Since these unvegetated/low vegetation densities appear to be most common adjacent to the Terminal, they are also the least stable in terms of maintaining their ecosystem characteristics.
Sensitivity
The recovery rate of vegetation from significant disturbance or degradation is dependant on the type of vegetation and the soil conditions. For all terrestrial habitats it is expected that it will take between 9 and 12 years for the vegetation to recover.
Other than the initial land take for the Terminal, no significant additional adverse impacts (leading to degradation of habitat and / or loss of flora density / biodiversity) associated with Terminal operations have been observed in the vicinity of the Terminal.
6.4.4.2 Fauna
A recent survey of the area adjacent to the southern boundary of the Terminal, undertaken in 2008, revealed the presence of a variety of small vertebrate animals including six mammalian species, and four reptile species (See Appendix 6A). Of these only one species is listed in the Azerbaijan Red Book (i.e. is of national significance) and included in the IUCN Red List (i.e. international importance) namely Testudo graeca, the Spur-thighed tortoise. Of the remaining species Mus musculus, the common mouse, was detected at survey locations nearest Sangachal Settlement, and is considered an invasive species associated with human habitation. The other mammalian species (Microtus socialis (Social Vole), Lepus europaeus (European Hare), Meriones libycus (Libyan Jird), Vulpes vulpes (Red Fox), and Erinaceus

AIOC Chirag Oil Project Environmental & Socio-Economic Impact Assessment
Chapter 6: Environmental Description
February 2010 6/18Final
concolor (Southern white-breasted Hedgehog) are native to the habitats occurring in the areas adjacent to Sangachal Terminal. Their continued presence in the area, together with the reptile species, suggests that, as yet, exotic species such as Mus musculus have not displaced native species in the areas around the terminal.
Sensitivity
Faunal species are most sensitive to disturbance during mating, pregnancy and juvenile stages (see ACG Phase 1 Appendix 11 for seasonal faunal sensitivities). Anthropogenic disturbances can lead to stress that can result in a possible decrease in reproductive success. Comparing 2008 results with earlier surveys in the vicinity of the Terminal (Table 6.1) there appears to have been little change in faunal diversity during the period of ACG activities. In particular, the continued presence of Testudo graeca, which is known to be sensitive to habitat fragmentation and degradation, suggests that areas around Sangachal Terminal have not been heavily impacted by terminal-generated environmental stressors.
6.4.5 Coastal Ecology
The coastal zone adjacent to the Terminal comprises several sub habitats including a rocky coastline with sparse vegetation cover (dominant species Convolvulus persicus and Argusia siberica), littoral reedbeds (Juncusetum acutus and Phragmites australis), shallow lagoons, and a salt marsh dominated by Salicornia europea. The semi-arid areas consist of two components Artemisia fragans and saltwort species (Salsola denroides and Salsola nodulosa). A number of species listed in the Azerbaijan Red Book occur in this area including Ferula persica, Cladochaeta candidissima (IUCN, Indeterminate), Glycyrrisa glabra and Nitraria schoberii.
15 faunal species have been recorded in the coastal zone. An area of phragmites (Phragmites australis) located southeast of the Terminal was the most diverse, including the following species, Wolf (Canis lupus), Fox (Vulpes vulpes), Marsh frog (Rana ridibunda) and European grass snake (Natrix natri). Caucasian agama (Agama caucasia) and Dahl’s whipsnake (Coluber najadum) were also recorded.
6.4.6 Birds
6.4.6.1 Regional Environment
The coastal zone of the Caspian Sea has been identified as an area of ornithological importance, as it supports both internationally and nationally significant numbers of migrating and overwintering birds. Bird species afforded local and international importance are also known to frequent the coastline.
Important ornithological sites, located on the Caspian Sea’s southwest coast include (Figure 6.8)13:
Kura Delta - supports large populations of waders during the spring migration (approximately 92km south of Sangachal Terminal); Kyzyl-Agach State Nature Reserve - established in 1929 for the protection of wintering and migratory waterfowl, waders and steppe birds. It is estimated that there are 248 bird species within the reserve, a number of which are protected species (approximately 105km south of Baku); Pirsaget Islands – supports important bird colonies (approximately 37km south of Sangachal Terminal); Shahdili spit and Pirilahi Island14 – the Shahdili spit is designated as a sanctuary, and together with Pirilahi Island has been identified as a candidate Ramsar site (approximately 77km and 98km respectively north east of Sangachal Terminal); and
13 Phase 3 ESIA Section 6.3.2.8 (2004) 14 Now declared the Absheron National Park

AIOC Chirag Oil Project Environmental & Socio-Economic Impact Assessment
Chapter 6: Environmental Description
February 2010 6/19Final
Bandar Kaisher Lagoon and mouth of Sefid Rud – this area is an important staging and wintering area for a wide variety of migratory wildfowl (approximately 317km south of Sangachal Terminal).
Figure 6.8 Important Ornithological Sites Located on the Southwest Caspian Coast
A literature review was undertaken in January 2010, focussing on the number and species of birds observed in surveys between 2002 and 2006 along the coastlines of the Shahdili spit and Pirilahi Island and in the ACG Contract Area (refer to Appendix 6B).
The review highlighted that the breeding season of birds on the Shahdili and Pirilahi coastline commences at the end of April / beginning May and continues until mid-July. At the end of July and beginning of August the birds leave their nesting places and disperse. During the breeding season 18 species were recorded along the Pirilahi coastline and 16 species along the Shahdili coastline.
During the overwintering surveys between 2002 and 2006 an average of 24,873 waterfowl and 181 coastal birds and 20,004 waterfowl and 198 coastal birds were recorded along the Pirilahi coastline and Shahdili coastline, respectively (for a complete list of species recorded refer to Appendix 6B). Four species recorded along both coastlines exceeded the 1% limit for the provision of Ramsar status and four rare and endangered bird species listed in the Red Book of Azerbaijan and the IUCN Red List of Threatened Species were also recorded (refer to Table 6.8).

AIOC Chirag Oil Project Environmental & Socio-Economic Impact Assessment
Chapter 6: Environmental Description
February 2010 6/20Final
Table 6.8 Overwintering Birds of Importance Recorded in 2002 – 2006 Surveys
Bird Species PirilahiCoastline
Shahdili coastline
Exceeds limit for the
provision of Ramsar Status
Red Book of Azerbaijan
IUCN Red List of
Threatened Species
Aythya ferinaA. fuligulaCygnus olorFalica atraNumenius arquata
Pelecanus crispusPodiceps cristatusPorphyrio porphyrio
The Shahdili and Pirilahi coastlines are located within a major flyway for migrating waterfowl and coastal birds, who nest in the European parts of Russia, western Siberia, and north-western Kazakstan and migrate to the southern coast of the Caspian Sea, the Kur-Araz lowland, Turkmenistan, southwest Asia and Africa for the winter. The migration routes are indicated in Figure 6.9.
The autumn migration commences in the second half of August and continues until mid- December, with the most active period during November, while the spring migration starts in the second half of February and ends in April, with the most active period during March. Table 6.9 show the routes undertaken by the birds and the percentage of birds that use these routes.
Figure 6.9 Bird Migration Routes

AIOC Chirag Oil Project Environmental & Socio-Economic Impact Assessment
Chapter 6: Environmental Description
February 2010 6/21Final
Table 6.9 Percentage of Birds Utilising Spring and Autumn Migration Routes
Migration Period Routes Autumn Spring
South 51.2% Southeast 11.93% Southwest 36.64% North 39.76% Northeast 25.50% Northwest 26.32%
During the spring migration 19 and 29 bird species were recorded in the coastal waters of Pirilahi Island and the Shahdili coastline, respectively. In total 9 species recorded between 2002 and 2006 exceeded the 1% limit established for the provision of Ramsar status During the same period five endangered species were also recorded (refer to Table 6.10).
Table 6.10 Migrating Birds of Importance Recorded in 2002 – 2006 Surveys
Bird Species PirilahiCoastline
Shahdili coastline
Exceeds 1% Limit for the provision of
Ramsar Status
Red Book of Azerbaijan
IUCN Red List of
Threatened Species
Aythya ferinaA. fuligulaA. nyrocaCygnus cygnus C. bewickiiC. olorNetta rufinaPelecanus crispusPodiceps cristatusPhoenicopterus roseus
Birds have been observed flying through or near to the ACG Contract Area and in some cases have been observed resting on the existing platforms. However, staff have not observed birds using the platforms for roosting or nesting purposes.
The predominant direction of the current in the middle/south Caspian Sea is to the south. Therefore the areas most likely to be affected by a potential oil spill is the south Caspian coastline.
6.4.6.2 Sangachal Environment
The Azerbaijan coast lies on a major flyway15 for waterfowl, raptors and other birds migrating between breeding grounds which extend to the Arctic and wintering areas in south Asia and Africa.
Several bird surveys have been undertaken between 2000 and 2006 (Table 6.1) in the Sangachal area. Concerns were raised, however, that the survey methodology did not allow the impacts of the Terminal operations on bird species and populations to be fully addressed. The monitoring system was therefore redesigned to address these shortcomings and implemented in 2008. The 2008 survey (in preparation) indicated that bird species diversity, richness and numbers were highest in the (unpopulated) areas to the south and southeast of the Terminal, particularly in the more mesic areas with chal-meadows and near reed beds.
15 A flyway is the migration routes and areas used by water bird populations in moving between their breeding and wintering grounds.

AIOC Chirag Oil Project Environmental & Socio-Economic Impact Assessment
Chapter 6: Environmental Description
February 2010 6/22Final
The 2008 survey shows 111 species occurring in the immediate vicinity of the Sangachal Terminal, including both resident and migratory (including over-wintering, breeding and feeding) species (Appendix 6A). 80% of the species were identified as migratory birds.
During the 2008 survey, four Azerbaijan Red Book listed species where observed (Table 6.11). The Long-legged buzzard (Buteo rufinus) has been identified for inclusion in the Azerbaijan Red Data Book (ARB), while the Mute swan (Cygnus olor) is listed on the Azerbaijan Red Data Book and the Black bellied sandgrouse (Pterocles orientalis) is of regional and international importance. The Lesser kestrel (Falco naumanni) and Dalmatian pelican (Pelecanus crispus) where observed during the Phase 1 and 2 surveys and are listed on the IUCN Red Data List.
Table 6.11 Azeri Redbook/IUCN Red List bird species observed in the vicinity of the Terminal
Species Common Name Designation Buteo rufinus* Long-legged buzzard Proposed for inclusion in ARB Cygnus olor** Mute swan ARB Falco naumanni*** Lesser kestrel 2000 IUCN Red list.
Proposed for inclusion in ARB Pelecanus crispus**** Dalmatian Pelican ARB, 2000 IUCN Red list Pterocles orientalis***** Black-bellied sandgrouse ARB, 2000 IUCN Red list Neophron percenopterus** Egyptian Vulture IUCN Red List Pelecanus onocrotalus** White Pelican ARB Falco cherrug** Saker Falcon INCN Red List Coracius garrulous** European Roller IUCN Red List
* Observed during the Phase1, 2, and 2008 surveys ** Observed during the 2008 survey *** Observed during the Phase 1 and 2 surveys **** Observed during the Phase 2 survey ***** Observed during the Phase 1 and 2008 surveys.
The results of previous ornithological surveys in the Sangachal area are presented in the ACG Phase 3 ESIA, Section 6.3.2.8.
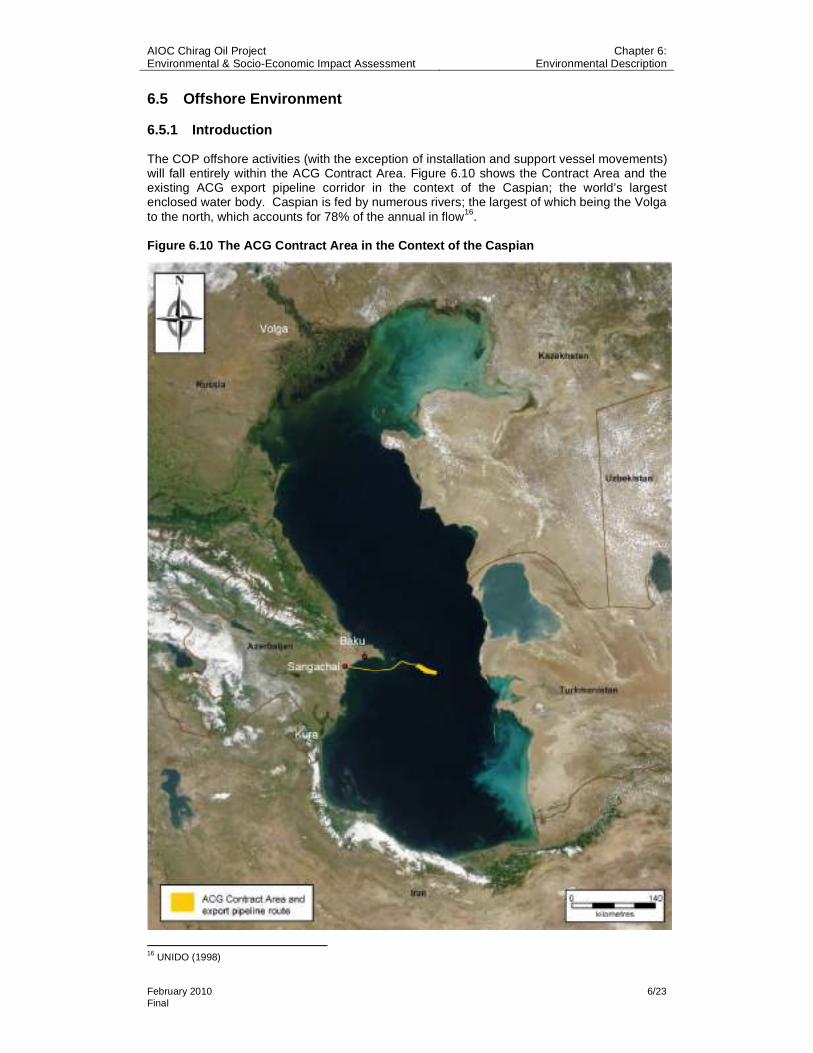
AIOC Chirag Oil Project Environmental & Socio-Economic Impact Assessment
Chapter 6: Environmental Description
February 2010 6/23Final
6.5 Offshore Environment
6.5.1 Introduction
The COP offshore activities (with the exception of installation and support vessel movements) will fall entirely within the ACG Contract Area. Figure 6.10 shows the Contract Area and the existing ACG export pipeline corridor in the context of the Caspian; the world’s largest enclosed water body. Caspian is fed by numerous rivers; the largest of which being the Volga to the north, which accounts for 78% of the annual in flow16.
Figure 6.10 The ACG Contract Area in the Context of the Caspian
16 UNIDO (1998)

AIOC Chirag Oil Project Environmental & Socio-Economic Impact Assessment
Chapter 6: Environmental Description
February 2010 6/24Final
6.5.2 General Characteristics of ACG Contract Area
6.5.2.1 Sources of Information
The AIOC has conducted environmental monitoring in the ACG Contract Area since the EOP baseline surveys in 1995 and 1996. During the period between 1996 and 2003, a number of operational surveys were carried out around the Chirag-1 platform and several baseline surveys were carried out at locations selected for the ACG Phase 1 (Central Azeri), Phase 2 (East and West Azeri) and Phase 3 (Deep Water Guneshli) developments.
In 2003, an overview of environmental monitoring outputs resulted in the design of the IEMP which was formally implemented in 2004 (see Section 6.2). Since the inception of the IEMP, regional surveys around the ACG Contract Area have been conducted in 2004, 2006 and 2008. Data from the 2008 surveys are not available at the time of writing, so the following description of the general characteristics of the ACG Contract Area is based on the results of the 2004 and 2006 regional surveys, with reference to previous surveys as reported in the ACG Phase 1, 2 and 3 ESIA where appropriate.
6.5.2.2 Bathymetry and Physical Oceanography
The WC-PDQ platform will be situated in the northern part of the Contract Area, approximately 5km to the north-east of the Chirag-1 platform. Water depth at the WC-PDQ location is approximately 160-175m. Seabed bathymetry throughout the area is irregular (Figure 6.11).
Figure 6.11 Seabed Bathymetry
The Caspian Sea is the largest landlocked water body on Earth. From north to south it is just over 1,000km long spanning 36.5°N to just over 47°N. Its width varies from between 200km and about 450km (from 46.75°E to 54°E). It is made up of three basins: the Northern, Central and Southern Basins. The Northern Basin is the smallest (about 25% of the total surface area), but is very shallow and contains just 0.5% of the water volume. The Central and Southern Basins have similar surface areas, but the Southern is deeper and contains almost twice the volume of water as the Central Basin. Both large Basins have extensive continental shelves (water depths < 150m). The deepest recorded depth is in the Southern Caspian Basin and is just over 1000m.
Key:
Existing platform locations
Current measurement sites
Monitoring locations
CASMOS model grid points
Winter sea temperature front (02/96)
Transect
Existing pipelines
10 kilometres 0

AIOC Chirag Oil Project Environmental & Socio-Economic Impact Assessment
Chapter 6: Environmental Description
February 2010 6/25Final
The bathymetry of the ACG Contract Area is particularly complex. The ACG Contract Area lies on the southern flank of the Absheron sill: the sill that separates the Central and Southern Caspian Basins. Depths vary little longitudinally, but change rapidly transversely. The deepest waters – about 600m - are along the southern border of the Contract Area. The continental slope is very steep (up to 1:8) and the shallowest waters are found at the crest of the slope, where a few isolated regions are less than 100m. Further north the bathymetry plateaus at about 150m depth.
Winters: During winters the northern Caspian Sea is affected by airflow from Western Europe drawn in by the Siberian Anticyclone, while pressures over the southern part of the sea tend to be raised by local highs which form over the Armenian and Iranian highlands (see top image of Figure 6.12). A low pressure trough is formed between the two systems, lying across the Caspian from northwest to southeast. The trough forms in October and persists until March. The trough is closely associated with winter storm systems: either drawing in passing storms or developing storms locally. Winter air temperatures in the ACG Contract Area normally fall to about 5°C (about 8°C warmer than the northern Caspian), but may occasionally fall to below freezing.
A combination of the formation of very cold waters in the northern Caspian and regional cyclonic wind fields, leads to the development of a cold water current along the western shelf of the Central Caspian Basin. In most winters a component of the cold water current flows over the western Absheron sill (through the western part of the Contract Area) and along and down the continental slope. The currents can be strong. By February water temperatures will have fallen to about 11°C in the east, and as low as 7 °C in the west of the Contract Area. A water temperature front bisects the region – it is mobile but at the height of winter often lies in the vicinity of West Chirag.

AIOC Chirag Oil Project Environmental & Socio-Economic Impact Assessment
Chapter 6: Environmental Description
February 2010 6/26Final
Figure 6.12 Thirteen Year (1982-1994) Average Wind Fields for January and July17
The severity of Caspian winters is highly variable. This is most apparent in the extent of sea ice cover: in mild winters winter ice is limited to the Northern Basin, while in very severe winters it may form around the coast of the Central Basin and occasionally extends around
17 Kalnay et al (1996) NCEP/NCAR Reanalysis Programme
January
July

AIOC Chirag Oil Project Environmental & Socio-Economic Impact Assessment
Chapter 6: Environmental Description
February 2010 6/27Final
the Absheron Peninsular. The variability may be associated, at least in part, with the major northern hemisphere weather index: the North Atlantic Oscillation Index18.
Summers: The northern region of the Caspian is affected by a wedge of the Azores High, while the southern region is influenced by South Asian Low (see bottom image of Figure 6.12). A stratified water column develops in the Contract Area from late spring through summer. A thermocline occurs at water depths between 20 and 60m13. Across this thermocline the water temperature may drop sharply from above 20°C to 10-12°C. The depth of the thermocline increases during the summer and autumn months as surface water temperatures and wind-driven turbulence increase. During winter the thermocline breaks down, reforming again the following spring. During summer months the water of the Southern Basin becomes stratified and a strong thermocline forms between 30 and 60m. The average temperature of surface waters during August is about 27°C.
6.5.2.3 Currents
Currents in the region are complex and may be strong, especially during winter. Attempts to simulate the currents using computer models have been disappointing and present knowledge is based largely on local measurements. The main component of strong currents is a winter wind driven circulation modulated, and sometimes reversed, by the action of passing storms. Tidal currents in the Caspian are negligible.
Seasonal Flow: The largest current occurs during winter months. The mechanism that drives the current can be traced back to the Northern Caspian basin. Here very cold winter air temperatures, shallow waters, and large fluvial inputs, lead to rapid ice development and the formation of a reservoir of cold, dense water on the boundary with the Central Caspian basin. The cold water is transported along the western Central basin under the influence of cyclonic winds associated with the winter low pressure trough. A component sinks and flushes the bottom waters of the Central Caspian basin, but in normal years a large volume finds its way over the western section of the Absheron sill and into the Southern Basin where it appears to mix and sink. A counter flow of relatively warm Southern Caspian water along the eastern section of the Absheron sill balances the cold water inflow. Figure 6.13 is a sketch of the seasonal flow across the longitudinal axis of the ACG Contract Area. The front between the two water bodies is clear in sea surface temperature (SST) satellite images: surface waters temperatures may differ by more than 3ºC over one km.
The irregular depth of the Absheron sill complicates further the winter seasonal flow. The sill is deeper on the western side, near Deepwater Gunashli (maximum depth over 200m), than on the eastern side (depths usually less than 150m). Therefore the cold water inflow penetrates beneath the level of the warm water outflow. This is thought to cause currents along the continental slope of the eastern sill to flow towards the west.
18 OceanMetriX (2002) Internal Report

AIOC Chirag Oil Project Environmental & Socio-Economic Impact Assessment
Chapter 6: Environmental Description
February 2010 6/28Final
Figure 6.13 Sketch of Winter Seasonal Flows Across the Absheron Sill Based Largely on Near Bottom Current Measurements Collected Between November 2007 and May 2008
The variability of winter severity is reflected in the strength of the seasonal currents. For example, the measured mean flow in the Shah Deniz shelf edge region during the relatively benign winter of 2000 - 2001 was just 0.03 m/s, while during the relatively severe winter of 2005 - 2006 it was 0.13m/s. Long term measurements of water oxygen content at several transects across the Caspian also pick up the variability19. In mild winters oxygenated surface waters (composed at least in part by the cold North Caspian water), are only found in the Southern Caspian basin in depths less than 50m (eg 1968), while in very cold winters the waters penetrate to more than 600m depth in the Shah Deniz region (eg 1969).
Storm Driven Flows: The passage of storms with strong winds from the northwest may cause large current surges. As the storms build the southerly flow into the Southern Basin is enhanced. Later, however, as the storms decay, the currents in the western region of the ACG Contract Area reverse and flow strongly back into the Central Caspian. Figure 6.14 is a sea surface temperature satellite image from a period of backflow following a northwesterly storm in February 1996. The temperature front is clearly defined, as is a large eddy to the north of the ACG Contract Area. The red arrows shown on the plot are near bottom currents predicted from the CASMOS1 3D model at this time.
The reverse flow is centred at depth (probably around 100m) and maybe weak on the surface. These currents are the largest documented current phenomena in the ACG Contract Area, and 1-year values in the Deepwater Gunashli region are expected to exceed 0.7m/s 1m above the seabed, and more than 1m/s at mid depths. The mechanism linking the storms and the current surges is not understood. The CASMOS current models have been able to replicate the occurrence of some of the strong current flow events, but not their magnitude or vertical structure. It is thought that direct wind forcing (particularly winds from the northwest), atmospheric pressure changes and possibly eddying between the water bodies may play a roll in the development of the strong currents.
19 Kosarev and Yablonskaya (1994)

AIOC Chirag Oil Project Environmental & Socio-Economic Impact Assessment
Chapter 6: Environmental Description
February 2010 6/29Final
Figure 6.14 Sea Surface Temperature 09:40 (GMT) 3rd February 1996 During a Strong Deep Water Current Event in the ACG Contract Area
Notes:1. The arrows show CASMOS 1 near bottom current vectors at grid point 1456 (north of the front and grid
point 1397 (south of front). 2. Grey areas denote regions of cloud cover.
Measurements of water currents made in the Contract Area from October to December 1996 indicated that currents were generally weak; less than 0.2m/s 90% of the time20. Maximum surface currents were 0.4m/s and mean surface currents 0.1 m/s. Maximum measured current velocity in the mid-water column was 0.65m/s, at a depth of 50m. Near the seabed, current speed and direction data collected along the ACG export pipeline corridor from October 1999 to May 2000, recorded a maximum current velocity of 1.26m/s.
6.5.2.4 Storm Surges and Waves
Storm surges are a common event in the Caspian causing temporary rises or falls in sea level. Significant sea level changes occur in the middle basin of the Caspian where the Contract Area is located. These events are associated with persistent strong winds, particularly the strong prevailing regional winds that blow along the axis of the Caspian, from north and northwest or from south and southeast21. Waves in the Caspian Sea, including in the Contract Area, are wind driven and subsequently the windiest months also exhibit the greatest wave action. The largest waves can be expected when the wind direction is northerly or southerly, as waves have longer time to build up at these wind directions.
Wave height data recorded at Nyeftyanye Kamni/Oil Rocks indicates that the months of July, August and September have the strongest winds and storms, with a higher frequency of wave heights in excess of 2m recorded. The period of October to February however shows the greatest number of wave heights between 1 and 2m, reflecting the steady occurrence of strong winds during this period.
South of the Absheron Peninsula northerly winds will create a fall in sea level while southerly winds result in a rise. In Baku Bay this change can be ±70-80cm. The typical time period for a storm surge is estimated at between 6-24 hours13.
The area of greatest wave development extends from the western portion of the Middle Caspian basin, down and across the central section of the Absheron Ridge.
Severe weather in the Caspian is associated with strong winds blowing along the axis of the Sea: from the northwest/north or from the south/southeast. A variety of meteorological processes can generate strong winds over the Sea, the most important being extra-tropical cyclones and ridges of high pressure. Storm winds from the north are more frequent and
20 Phase 1 ESIA, URS (2002) 21 Kosarev and Yablonskaya (1994)
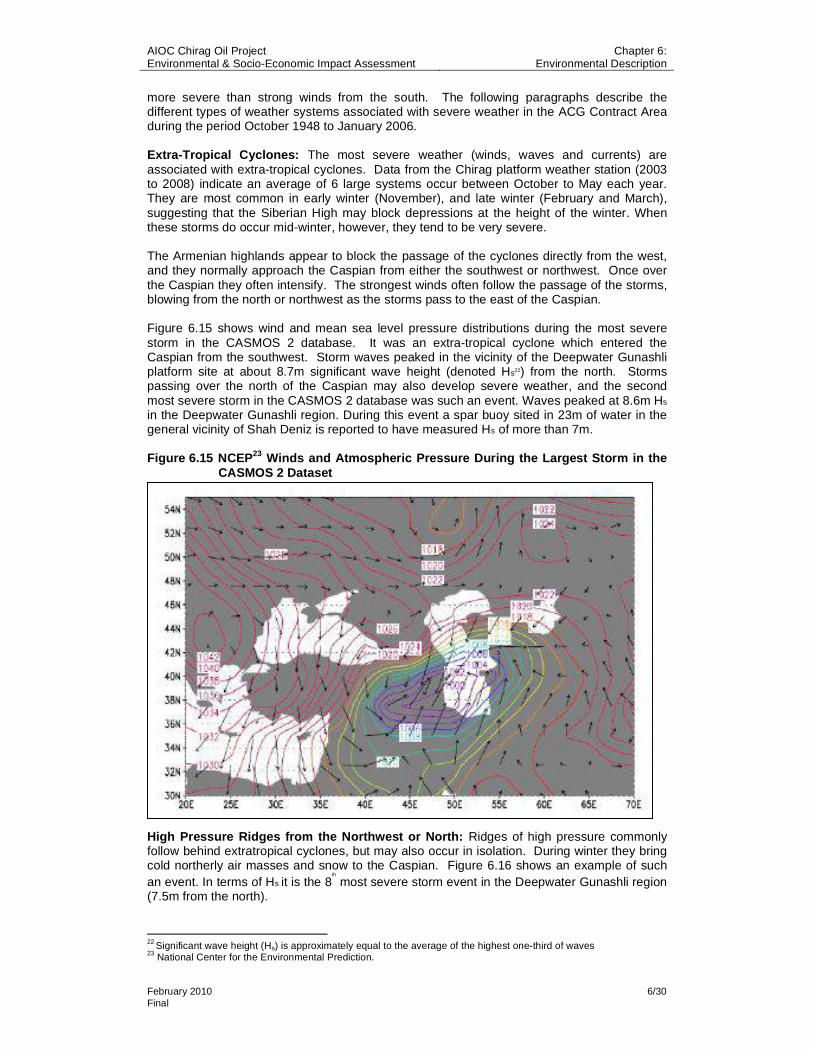
AIOC Chirag Oil Project Environmental & Socio-Economic Impact Assessment
Chapter 6: Environmental Description
February 2010 6/30Final
more severe than strong winds from the south. The following paragraphs describe the different types of weather systems associated with severe weather in the ACG Contract Area during the period October 1948 to January 2006.
Extra-Tropical Cyclones: The most severe weather (winds, waves and currents) are associated with extra-tropical cyclones. Data from the Chirag platform weather station (2003 to 2008) indicate an average of 6 large systems occur between October to May each year. They are most common in early winter (November), and late winter (February and March), suggesting that the Siberian High may block depressions at the height of the winter. When these storms do occur mid-winter, however, they tend to be very severe.
The Armenian highlands appear to block the passage of the cyclones directly from the west, and they normally approach the Caspian from either the southwest or northwest. Once over the Caspian they often intensify. The strongest winds often follow the passage of the storms, blowing from the north or northwest as the storms pass to the east of the Caspian.
Figure 6.15 shows wind and mean sea level pressure distributions during the most severe storm in the CASMOS 2 database. It was an extra-tropical cyclone which entered the Caspian from the southwest. Storm waves peaked in the vicinity of the Deepwater Gunashli platform site at about 8.7m significant wave height (denoted Hs22) from the north. Storms passing over the north of the Caspian may also develop severe weather, and the second most severe storm in the CASMOS 2 database was such an event. Waves peaked at 8.6m Hs
in the Deepwater Gunashli region. During this event a spar buoy sited in 23m of water in the general vicinity of Shah Deniz is reported to have measured Hs of more than 7m.
Figure 6.15 NCEP23 Winds and Atmospheric Pressure During the Largest Storm in the CASMOS 2 Dataset
High Pressure Ridges from the Northwest or North: Ridges of high pressure commonly follow behind extratropical cyclones, but may also occur in isolation. During winter they bring cold northerly air masses and snow to the Caspian. Figure 6.16 shows an example of such an event. In terms of Hs it is the 8
th
most severe storm event in the Deepwater Gunashli region (7.5m from the north).
22 Significant wave height (Hs) is approximately equal to the average of the highest one-third of waves 23 National Center for the Environmental Prediction.

AIOC Chirag Oil Project Environmental & Socio-Economic Impact Assessment
Chapter 6: Environmental Description
February 2010 6/31Final
Figure 6.16 NCEP Wind and Pressure During a High Pressure Intrusion from the North West
High Pressure to the East: Possibly formed by an intensification of the Siberian Anticyclone and maybe associated with low pressure systems to the west of the Caspian. Such storms may bring strong southeasterly winds and seas to the ACG Contract Area. Their occurrence, however, is rare at something like once every 40 years. The largest in the CASMOS2 dataset generated waves of just 3.6m Hs in the Deepwater Gunashli region.
6.5.2.5 Physical and Chemical Composition of Seabed Sediments
Sediment samples have been taken across the Contract Area during 38 surveys between 1995 and 2006. Since 1998, these samples have been collected and analysed using a consistent methodology, for:
Macrobenthic invertebrates; Physical sediment structure and composition; and Heavy metals and hydrocarbons.
The most recent survey was undertaken in 2006 when sediment samples were taken from 12 regional stations as shown in Figure 6.17. Of these stations, 6 had previously been sampled during the 1995-96 EOP Baseline Surveys.
The results have demonstrated no evidence of systematic change in the physical characteristics of sediments at the 6 regional stations over the period since 1995. Whilst there is some variation at each station, in all cases the general characteristics (particle size range, organic content, etc) remain similar for each station over the period. The station classifications (i.e. silt, fine sand etc.) has remained unchanged. The most distinctive stations are ACGR-22 and ACGR-33, which are situated close to mud volcanoes. These stations have consistently homogeneous sediments with a high proportion of silt-clay and much higher organic content than other stations. Further details regarding physical sediment characteristics in the vicinity of the WC-PDQ platform location are provided in Section 6.5.3.2 below.

AIOC Chirag Oil Project Environmental & Socio-Economic Impact Assessment
Chapter 6: Environmental Description
February 2010 6/32Final
Figure 6.17 Location of ACG 2006 Regional Seabed Sampling Stations
Total hydrocarbon concentrations were low at all stations for the 2006 survey (with the exception of ACGR-22 and ACGR-33), with a range of 4-67 µg/g and a median of 12 µg/g. Average concentrations at stations ACGR-22 and ACGR-33 were 334 µg /g and 147 µg/g respectively, again reflecting the proximity of these stations to mud volcanoes. A very similar pattern was observed for PAHs. There was no evidence of any distinct temporal trend, and the 2006 hydrocarbon values were in most instances similar to, or lower than, the 2004 values. It is concluded that none of the regional stations show any evidence of anthropogenic hydrocarbon contamination.
There were no distinctive temporal trends in sediment concentrations for most heavy metals – concentrations of arsenic, copper, iron, and lead in 2006 were very similar to 2004, and showed no elevation above typical background levels (see Tables 6.12-6.14). Zinc concentrations were 10-20% lower in 2006 than in 2004, but this is not a sufficiently large difference to infer a real trend at present. Cadmium concentrations were consistently higher in 2006 than in 2004, but markedly so only at stations ACGR-W6 and ACGR-C. The highest values (0.42 and 0.43 µg/g) remain within the range of previously observed baseline values. In contrast, average barium concentrations were lower in 2006 than in 2004.
Station ACGR-B was distinctive, with very high arsenic concentrations and iron concentrations; more detailed study of the samples from this station identified the presence of a natural mineral, arsenopyrite.
Stations ACGR-W6 and ACGR-C were also distinctive in terms of sediment barium concentrations which were 6-10 times higher than the concentration at other stations (where concentrations were within the long-term background range). These two stations are located to the N and NNE of the Chirag-1 platform. Although they are not the closest stations in this direction (station ACGR-26 is closer, and lies closer to the direction of the presumed prevailing current), further investigation would be necessary to determine whether water based mud (WBM) and cuttings could be transported as far as these stations and may be the source of the elevated cadmium and barium concentrations.
ACGR-A
ACGR-B
ACGR-01
ACGR-04
ACGR-W6
ACGR-C
ACGR-26
ACGR-D
ACGR-22
ACGR-33
ACGR-46
ACGR-62

AIOC Chirag Oil Project Environmental & Socio-Economic Impact Assessment
Chapter 6: Environmental Description
February 2010 6/33Final
Table 6.12 Summary of 2006 Survey Sediment Metals Concentrations Across 12 Monitoring Stations (µg/g)
As BaHNO3
Ba Fusion Cd Cr Cu Fe Hg Mn Pb Zn
Minimum 4 198 316 0.11 20 10 15700 0.014 303 8 22 Maximum 278 14200 16100 0.51 64 56 120000 0.090 1890 19 64 Median 9 824 999 0.20 45 27 30200 0.037 502 10 49 Mean 18 2138 2521 0.24 44 28 33233 0.040 600 11 48
Table 6.13 Summary of 2004 Survey Sediment Metals Concentrations Across 6 Monitoring Stations (µg/g)
Concentration ( g/g) As Ba Cd Cr Cu Fe Hg Pb Zn
Minimum 4 190 0.06 24 9 11466 0.013 10 26 Maximum 23 19120 0.26 101 45 141295 0.147 22 79 Median 11 2539 0.14 78 25 29716 0.051 15 62 Mean 10 1560 0.14 86 23 27735 0.049 14 67
Table 6.14 Comparison of Sediment Chemistry Concentrations Across Monitoring Stations Surveyed (µg/g),1996-2006
Statistic Year As Ba Cd Cr Cu Fe Hg Mn Pb Zn THC UCM1996 2 213 0.05 23.2 14.9 12400 0.06 263 6.9 32.6 2.3 1 2004 4 190 0.06 24 9 11466 0.013 10 26 3 0.4 Minimum2006 4 198 0.11 20 10 15700 0.014 303 8 22 3.5 2.6 1996 139 4970 0.88 82 55.7 133000 0.18 1060 173 116 660 520 2004 23 19120 0.26 101 45 141295 0.147 22 79 1332 1191 Maximum 2006 278 14200 0.51 64 56 120000 0.09 1890 19 64 333.7 218.1 1996 7.8 1055 0.115 52.6 29 31000 0.09 490 14.3 81.7 24 20.5 2004 11 2539 0.14 78 25 29716 0.051 15 62 10.9 6.2 Median2006 9 824 0.2 45 27 30200 0.037 502 10 49 18.35 15.8
6.5.2.6 Biological Characteristics of Seabed Sediments
A general description of the benthic environment of the Contract Area is provided within the ACG Phase 1, 2 and 3 ESIA. The results of the IEMP monitoring undertaken, as presented in the IEMP annual reports, confirmed that the benthos is typically dominated by a small number of amphipod and annelid species. Generally, the communities comprise 10-12 frequently occurring taxa, with a highly variable number of less frequently-occurring taxa. Based on the period of sampling and large number of samples taken, the IEMP programme has demonstrated that this variability is a natural characteristic of the area, due, in part, to the dynamic nature of the communities (i.e. a large number of species with rapid growth potential are known to be present) and in part to the scattered nature of the habitat, meaning a very variable distribution of small ‘clumps’ of organisms are present. The grab sampling undertaken to date has therefore resulted in either these organisms being present in reasonably large numbers in the sample taken or not being present at all.
The 2004-2005 IEMP annual report identified this sampling outcome and that, for the majority of species, occurrence in an individual survey is largely a matter of chance. As noted above, only 10-12 species regularly occur in all samples, and these species are common in all surveys. Consequently, there is invariably a high apparent rate of species ‘turnover’ between consecutive surveys, which limits the precision with which impact-related changes can be identified.
There were, however, some very large differences observed between the 2004 and 2006 regional surveys, the identification of which is not subject to these constraints. Between 2004 and 2006, there was a very large reduction in the number of taxa present at all stations. Table 6.15 shows that this was principally associated with much reduced diversity of amphipod and gastropod taxa (these two groups generally account for most of the diversity of South Caspian benthos). The identification of gastropod species is difficult and gastropods are generally present intermittently and in low abundance in most surveys, so it is usually difficult to attach much significance to the actual species present or absent. In the 2006
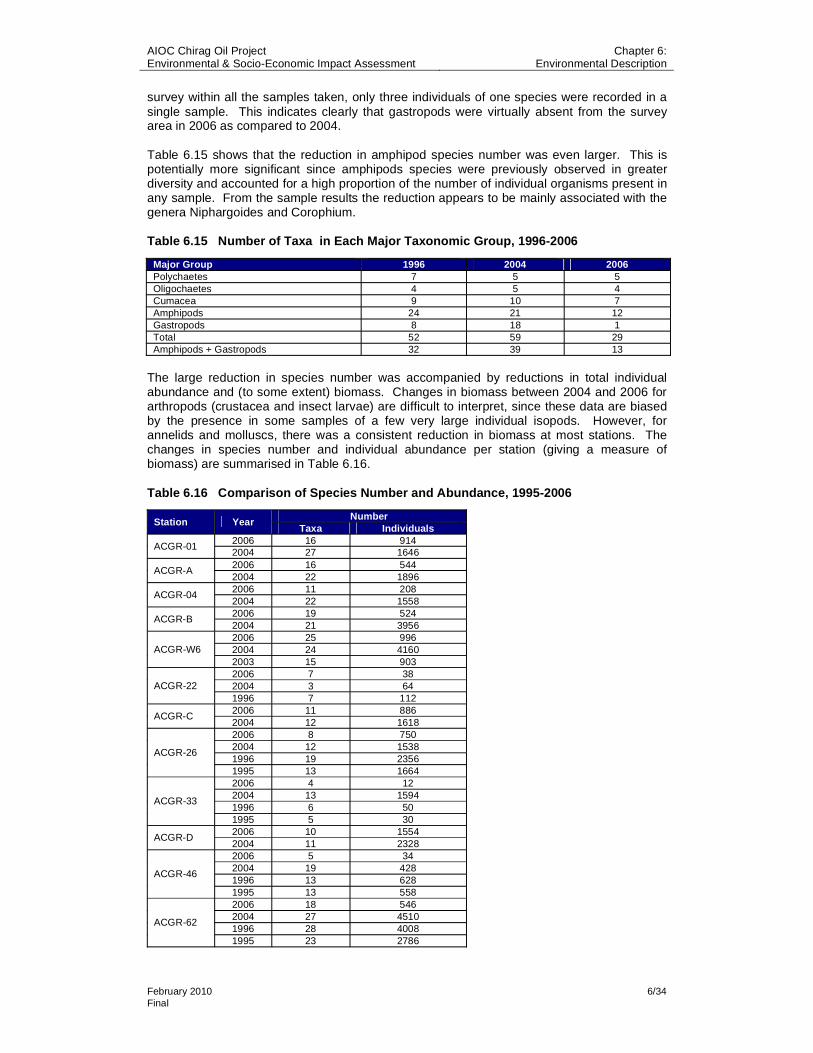
AIOC Chirag Oil Project Environmental & Socio-Economic Impact Assessment
Chapter 6: Environmental Description
February 2010 6/34Final
survey within all the samples taken, only three individuals of one species were recorded in a single sample. This indicates clearly that gastropods were virtually absent from the survey area in 2006 as compared to 2004.
Table 6.15 shows that the reduction in amphipod species number was even larger. This is potentially more significant since amphipods species were previously observed in greater diversity and accounted for a high proportion of the number of individual organisms present in any sample. From the sample results the reduction appears to be mainly associated with the genera Niphargoides and Corophium.
Table 6.15 Number of Taxa in Each Major Taxonomic Group, 1996-2006
Major Group 1996 2004 2006Polychaetes 7 5 5 Oligochaetes 4 5 4 Cumacea 9 10 7 Amphipods 24 21 12 Gastropods 8 18 1 Total 52 59 29 Amphipods + Gastropods 32 39 13
The large reduction in species number was accompanied by reductions in total individual abundance and (to some extent) biomass. Changes in biomass between 2004 and 2006 for arthropods (crustacea and insect larvae) are difficult to interpret, since these data are biased by the presence in some samples of a few very large individual isopods. However, for annelids and molluscs, there was a consistent reduction in biomass at most stations. The changes in species number and individual abundance per station (giving a measure of biomass) are summarised in Table 6.16.
Table 6.16 Comparison of Species Number and Abundance, 1995-2006
Number Station YearTaxa Individuals
2006 16 914 ACGR-01
2004 27 1646 2006 16 544
ACGR-A 2004 22 1896 2006 11 208
ACGR-04 2004 22 1558 2006 19 524
ACGR-B 2004 21 3956 2006 25 996 2004 24 4160 ACGR-W6 2003 15 903 2006 7 38 2004 3 64 ACGR-22 1996 7 112 2006 11 886
ACGR-C 2004 12 1618 2006 8 750 2004 12 1538 1996 19 2356
ACGR-26
1995 13 1664 2006 4 12 2004 13 1594 1996 6 50
ACGR-33
1995 5 30 2006 10 1554
ACGR-D 2004 11 2328 2006 5 34 2004 19 428 1996 13 628
ACGR-46
1995 13 558 2006 18 546 2004 27 4510 1996 28 4008
ACGR-62
1995 23 2786

AIOC Chirag Oil Project Environmental & Socio-Economic Impact Assessment
Chapter 6: Environmental Description
February 2010 6/35Final
Surveys undertaken since 2004 have identified the presence of the alien polychaete Nereiswhich has been observed at all platform survey locations with the exception of DWG. In the 2004 regional survey, Nereis was present (one or two individuals) at two stations (ACGR-1 and ACGR-22). In 2006, one individual only was present in a sample collected at station ACGR-W6. Nereis therefore does not seem to have established a permanent presence at any of the regional monitoring stations.
As discussed in Section 6.5.2.5, the 2006 ACG regional survey indicated that there were no identifiable temporal trends in sediment structure or chemistry, and that the status of the sediment remained within established background conditions. There was, at most stations, no evidence of anthropogenic contamination and the concentrations of measured contaminants were well within the thresholds previously observed to support healthy biological communities.
Sediments at stations ACGR-W6 and ACGR-C exhibited higher concentrations of barium and cadmium than other stations. There was however, no evidence that these higher concentrations had any biological significance or impact.
The apparent loss of a large number of amphipod and gastropod species, resulting in communities at all stations being substantially impoverished compared to earlier surveys is not considered to be due to changes in any measured sediment properties. It is hypothetically possible that they could have been caused by contaminants such as pesticides transported into the Contract Area and arising from third party activities or historical pollution. It is equally possible however, that:
These changes are simply part of a natural process of oscillation; or These changes reflect the impact of prior changes in the structure and productivity of
the planktonic community (discussed below) and could possibly represent a point on a long-term trend of impoverishment.
The survey results demonstrate that the biological changes that have occurred throughout the Contract Area are not due to operational activities or the presence of any contaminants which might be associated with operational activities. Preliminary results of monitoring undertaken at the West Azeri platform in 2007 indicate that the diversity of amphipods and gastropods has returned to previous levels, suggesting that 2006 may have been an abnormal year.
6.5.2.7 Benthic Invertebrate Sensitivity
The seabed environment offshore is dominated by oligochaetes, polychaetes (predominantly ampharetid polychaetes) and amphipods. These organisms share several important characteristics:
They are small - no more than 1-2 cm long; They have short generation times - between 4 and 12 weeks, which means that they
can produce several generations per year; and They are either deposit or suspension feeders, which means that they are largely
dependent on fine settled or suspended sedimentary material for food and that they are also exposed to any chemical contaminants associated with sediment particles.
Deposit and suspension feeders are well-adapted to maintaining their position in environments with high sediment deposition rates. Relatively short generation times mean that populations of these animals also have the potential to replace losses within months rather than years. Persistent impact is only likely in instances where there is sustained or persistent chemical contamination. Amphipods, for instance, are sensitive to hydrocarbons in sediment and populations may be reduced for as long as significant contamination is present.
In addition to the amphipods, oligochaetes and polychaetes, several other biological groups are important in the Contract Area. Bivalves become increasingly important closer to shore, although there are areas offshore where Dreissena and Didacna are present. Bivalves are either deposit feeders (Abra) or filter feeders (Dreissena, Didacna, Cardium, Mytilaster).

AIOC Chirag Oil Project Environmental & Socio-Economic Impact Assessment
Chapter 6: Environmental Description
February 2010 6/36Final
Bivalves reproduce and grow relatively slowly. Consequently, any damage to bivalve populations can take longer to repair. With the exception of Abra, bivalves are relatively vulnerable to water contamination because they filter large volumes of water.
Caspian gastropods are a diverse group, all of which are very small and are surface deposit feeders. Under optimal conditions, gastropods are generally capable of achieving high population densities quite rapidly, although there is no evidence of this in the Contract Area. Gastropods will be primarily vulnerable to surface sediment contamination and may also be relatively vulnerable to physical smothering. The evidence from the post-drilling survey at GCA5 (see Section 6.5.4 below) suggests that the discharge of WBM cuttings from a single well does not have any adverse effect on gastropods, even close to the well centre. It is therefore considered unlikely that smothering would, in practice, present a significant risk. The available evidence suggests that these small molluscs are capable of burrowing upwards through significant deposits of cuttings (specifically, WBM cuttings, which do not contain toxic chemical additives).
The insect larvae, Chironomus is similar in size and behaviour to the small annelids, but may be capable of suspension feeding as well as deposit feeding. Larvae can develop to adulthood in approximately 4 weeks, so this species has the capacity to recover rapidly from temporary disturbances.
Larger crustacea, such as cumacea and isopods, occur throughout the Contract Area, although only cumacea achieve significant abundance. Both types of crustacean are surface-dwellers and scavengers. Isopods are often encountered in higher abundance in the most 'impacted' areas close to well centres after drilling. As Section 6.5.4 presents however, low diversity was observed at both the baseline (predrilling) survey location as well as at the post-drill GCA5 location.
It is often suggested that the most vulnerable period for benthos is spring and summer, since this is usually the period of maximum reproduction and growth. This argument relies on an analogy with organisms such as birds and seals, where a major impact during pupping or nesting can severely damage a population. The majority of native benthic organisms have however, several generations per year and it is arguable that in fact they are most vulnerable to impact during winter, when reproduction and growth are at a minimum and the populations are therefore least resilient.
It has been suggested that the presence of Pseudosolenia results in poor feeding of the benthos. Pseudosolenia has been observed to dominate at all times of the year, and is common in BP routine surveys which are normally carried out during the summer months.
Pseudosolenia often takes up much of the available nutrients (Section 6.5.2.8), and also has very large cells which many native copepod species cannot efficiently feed on. However, it is improbable that Pseudosolenia leads to poor feeding of the benthos – the opposite is more likely, since any Pseudosolenia biomass not consumed by the zooplankton will settle onto the seabed when the cells die. With lower zooplankton abundances, and with zooplankton unable to feed effectively on Pseudosolenia, the consequence would be that a higher proportion of primary production would reach the benthic communities.
6.5.2.8 Water Column
Prior to the inception of the IEMP, water samples were taken in small numbers and at irregular intervals (usually at 2-3 stations during benthic surveys). Sample numbers and sampling frequency were too low to provide a reliable picture of water quality and the analytical methodologies did not yield reliable or interpretable results. The IEMP water sampling programme was designed to remedy these shortcomings and thus to provide interpretable information.

AIOC Chirag Oil Project Environmental & Socio-Economic Impact Assessment
Chapter 6: Environmental Description
February 2010 6/37Final
Between 5-11th July 2006, plankton and water samples were collected from the ACG and Inam24 Contract Areas, at locations between these Contract Areas and along the existing ACG export pipeline corridor.
A total of 24 water samples (Figure 6.18) and 25 plankton samples (Figure 6.18 and Figure 6.19) were collected. Conductivity-Temperature-Depth (CTD) measurements were made at 10 deep-water stations (from surface to 100m) covering the Inam and ACG Contract Areas, the existing ACG export pipeline corridor and the potential Inam pipeline route. Salinity, temperature, dissolved oxygen, turbidity and pH measurements were also made on board the survey vessel as each water sample was retrieved to deck. Water and plankton samples were also collected for onshore analysis.
Figure 6.18 Water and Plankton Sampling Locations
24 The Inam Contract Area, located approximately 175km to the south west of the ACG Contract Area, was included in order to provide updated baseline information as a basis for exploration drilling impact assessment and possible future developments
Water Sample
Water and Plankton Sample
ACGR62
EAP0615
CA061
PL1
WC0617
PL3PL6
ACGR22
CH0408
ACGRO1
PL9
PL10
PL11
ACGR63
ACGR64
PL12
ACGR67
ACGR70
ACGR73
INBC16
INBC2
INX213
INBC10
INBC14
Key

AIOC Chirag Oil Project Environmental & Socio-Economic Impact Assessment
Chapter 6: Environmental Description
February 2010 6/38Final
Figure 6.19 Location of ACG Contract Area Plankton Sampling Transects
In situ Physical Water Measurements
Surface temperatures were similar in all samples, ranging between 23 and 25oC. Water temperature decreased with depth, with a distinct thermocline at depths of 25-35m (Figure 6.20).
Salinity varied little with depth or location. Turbidity levels in all samples were low; the highest values were observed in samples collected at the shallow-water ACG export pipeline stations PL 3, 6, 9, 10, 11, 12.
Dissolved oxygen concentrations were at or close to saturation in all surface samples, and declined to around 20% in samples from depths of >350m. Oxygen levels at a depth of 100m were in the range of 60-70%.
Bathymetry
ACG Contract AreaPlankton SamplingTransects

AIOC Chirag Oil Project Environmental & Socio-Economic Impact Assessment
Chapter 6: Environmental Description
February 2010 6/39Final
Figure 6.20 CTD Profiles from ACG, Pipeline and Inam Water Sampling Stations25
25 CTD temperature values at depths of more than 50m were typically 3-4 oC lower than onboard sample values, reflecting the fact that samples recovered onto deck warmed rapidly while the measurements were being taken.
Temperature (°C)
Temperature (°C)

AIOC Chirag Oil Project Environmental & Socio-Economic Impact Assessment
Chapter 6: Environmental Description
February 2010 6/40Final
Chemical Measurements
Total suspended solids levels, biological oxygen demand (BOD) and chemical oxygen demand (COD) were low in all samples and did not vary systematically with location or depth. Nutrient concentrations (nitrate, total nitrogen, silicate and phosphate) increased substantially with depth at most locations. This reflects the sedimentation of phytoplankton through the water column, trapping the nutrients in water below the thermocline. This is a typical summer scenario, which progressively leads to nutrient depletion in surface waters as phytoplankton take up nutrients, die and settle to the seabed. During summer, in the presence of a strong thermocline, the only process which can act to retain nutrients in the surface layers is consumption by zooplankton, which then excrete ammonia and faecal material which can help to sustain phytoplankton populations. The high nutrient levels (particularly silicates), suggest that zooplankton populations were low and were only able to recycle a small proportion of the primary production. The full survey results are presented within the IEMP 2006 annual report.
Total hydrocarbon (THC) concentrations were lower than those recorded in regional water quality surveys in 2004 within the ACG Contract Area and in 2005 within the ACG and SD Contract Areas, with little variation between stations and depths. Concentrations were all close to the previously observed background concentration of 40-80µg/l and ranged from 18µg/l at INBC10 (surface) to 60µg/l at INBC2 (surface), with an overall average of 31.5 µg/l. Surface samples at stations CH08, ACGR CA10, PL9, PL10 and INBC2 were all slightly above the maximum permissible concentration (MPC) for fisheries water of 50µg/l.
Heavy metal concentrations were generally well below the relevant MPC or Environmental Quality Standard (EQS) levels and, with the exception of iron, showed little variation with location or depth. Iron concentrations were higher in the ACG export pipeline samples, to a large extent due to the shallower water where the influence of seabed sediment is greater.
Plankton
Phytoplankton
Table 6.17 summarises the number of phytoplankton species per major taxonomic group for the three areas in which plankton surveys were carried out in 2006. Species richness was higher in the ACG Contract Area than in the other locations surveyed, largely due to higher numbers of bacillarhiophytes. Bacillarhiophytes were the most diverse group in both the ACG Contract Area and the ACG export pipeline corridor. The same small group of taxa were however, numerically dominant in all locations. The invasive Pseudosolenia diatom was frequently the most abundant taxon and since this has an exceptionally large cell size it accounted for more than 80% of the phytoplankton biomass in all samples. This single taxon therefore accounts for a high proportion of the ‘standing crop’ of available food for zooplankton. Although it may have lower cell division rates (and therefore lower intrinsic population growth rates) than smaller species, Pseudosolenia may ‘lock up’ available nutrients and therefore limit the production of other species. Pseudosolenia cells may also be too large for many zooplankton species to feed on.
Table 6.17 Number of Phytoplankton Taxa per Major Taxonomic Group
Group ACG Contract Area
ACG Export Pipeline Corridor
Inam Contract Area
Dominant Taxa
Cyanophyta 7 4 5
Bacillarhiophyta 18 14 8 Coscinodiscus ChaetocerosPseudosolenia
Dinophyta 11 9 12 Prorocentrum Total 36 27 25
Comparison between the ACG 2004 and 2006 surveys indicates that phytoplankton diversity is being maintained within the area with Pseudosolenia species remaining dominant to approximately the same extent across all surveys. Comparisons with earlier surveys (1999

AIOC Chirag Oil Project Environmental & Socio-Economic Impact Assessment
Chapter 6: Environmental Description
February 2010 6/41Final
and 2000) for the ACG export pipeline corridor and Inam Contract Area are not considered reliable, due to differences in methodology and uncertainty about the taxonomic precision of the earlier surveys. There is no indication at present however, of any adverse trends with respect to the phytoplankton.
Zooplankton
Analysis of the samples taken during the 2006 survey for zooplankton revealed that the holoplankton (permanent members of the plankton species, excluding temporary larval forms of fish and benthos) is severely impoverished. In the ACG Contract Area, along the ACG export pipeline corridor and in the Inam Contract Area, the zooplankton was completely dominated by two invasive species, Acartia tonsa (copepod) and Mnemiopsis leydii (predatory ctenophore). The latter has become established in the south Caspian since the late 1990s, and has been present in virtually all samples in IEMP surveys since 2004.
Native or acclimated copepod taxa, such as Halicyclops, Eurytemora, Linmocalanus and Calanipeda were regularly recorded in limited surveys until 2002. Since then, these taxa have been absent from samples collected in the more extensive IEMP surveys. This situation persisted in 2006, with the only exception being a single occurrence of Eurytemora minor in the Inam Contract Area.
Native cladocera have also undergone a substantial reduction in diversity and abundance. Species of only three genera (Evadne, Pleopis, Polyphemus) have been recorded in recent surveys, and these three genera were again the only cladoceran representatives in the 2006 surveys.
Although Acartia dominated the zooplankton in all locations numerically and in biomass, the abundance of this species was low – typically only a few individuals per litre. This suggests that overall productivity is low. However, it is also apparent that the dominance of Acartiameans that at present it is the main available food source for planktivorous fish such as kilka, sprat and shad.
It is probable that the low zooplankton diversity and abundance can be attributed to the development of large and persistent populations of the planktivorous ctenophore Mnemiopsis.Acartia, which may be able to partially escape predation pressure because it has a different reproductive strategy from native zooplankton species.
As discussed above, water quality was generally good throughout the areas surveyed. Phytoplankton diversity appears, over the past few years, to be good and relatively consistent. Zooplankton diversity and abundance have been low across the period of the surveys undertaken, however many native species were not present in samples collected in the period 2004-2006.
Phytoplankton biomass was dominated by an invasive species, Pseudosolenia calcar-avis,and zooplankton biomass was also dominated by an invasive species, Acartia tonsa. Low zooplankton diversity is probably attributable to a third invasive species, Mnemiopsis leydii.These three species constitute the main route of production and energy flow in the pelagic system, and therefore also have a large influence on energy flow to fish populations and to the benthic organisms. All three species are likely to have been introduced over the past few decades in the ballast water of commercial shipping entering the Caspian.
Plankton Sensitivity
Both phytoplankton and zooplankton are considered sensitive to chemical contamination and it is for this reason that planktonic species are widely used in toxicity testing. If chemical contamination is present in the water column for any reason, the plankton are likely to respond more rapidly than other water column species. Plankton diversity and abundance is important, since these organisms represent a significant source of food and energy for higher organisms and in particular for ecologically and commercially important fish species such as kilka.

AIOC Chirag Oil Project Environmental & Socio-Economic Impact Assessment
Chapter 6: Environmental Description
February 2010 6/42Final
High individual sensitivity does not however, mean high population sensitivity. Plankton populations can grow rapidly from just a few individuals (e.g. phytoplankton populations can double in 12 hours, copepod zooplankton populations in 2-3 days). This means that populations can re-establish quickly, this is a natural feature of plankton ecology. In some instances, rapid growth can offset the effects of chemical contamination.
Sustained impact on plankton populations is likely to occur only under conditions where there is a sustained, wide-field discharge of chemicals at continuously toxic concentrations. Short-term, near-field discharges are unlikely to have a measurable impact.
The impact of the ctenophore Mnemiopsis is the subject of a number of studies sponsored by the Caspian Environment Programme and the littoral Caspian states but no conclusions are yet available about the nature and extent of the impact of this organism on the Caspian ecosystem. The observed decline in zooplankton diversity may, as noted above, be a result of predation by Mnemiopsis. If the decline proves to be a sustained phenomenon, then assessment of the impact of oil industry operations may be limited to estimating the effects on a single species.
The apparent decline in zooplankton abundance, if sustained, would be expected to eventually have measurable adverse consequences on both fisheries and on benthic communities, since zooplankton are a key link in the food chain linking these communities to the primary sources of energy.
Fish
Fish commonly found in the Contract Area can be categorised into the three following types:
Migratory Species: This includes sturgeon and shad species whose spawning grounds are the rivers Kura, Terek, Samur and other rivers of the southwestern and southern Caspian. They will only be present in the Contract Area as individuals passing through; Resident species: Several non-commercial species such as gobies, sandsmelt and pipefish, are present within the nearshore and, less frequent, in offshore waters of the South Caspian throughout the year and therefore, individuals may be present within the Contract Area during all seasons; and Other species (Semi Migratory): The kilka (herring family) is the most abundant fish in Caspian fisheries. Kilka are plankton feeders and have a wide distribution in the Caspian with important areas in the south and the middle Caspian, which is likey to include the Contract Area. They are themselves important prey for other species such as sturgeon, salmon and the Caspian seal. They have been observed mostly in the Contract Area during the winter. Mullet were introduced from the Black Sea in the 1930’s. They normally overwinter in the southern Caspian and they migrate in the spring to feeding grounds in the middle and northern Caspian. Spawning takes place in deep waters between June and September26. Mullet can be expected in the Contract Area.
Table 6.18 below shows the months when particular fish species are likely to be present in the Contract Area.
26 Kosarev and Yablonskaya (1994)

AIOC Chirag Oil Project Environmental & Socio-Economic Impact Assessment
Chapter 6: Environmental Description
February 2010 6/43Final
Table 6.18 Seasonal Fish Presence in the Contract Area
A review undertaken in 2008 of the fish recorded in the Contract Area is summarised in Table 6.19.
Table 6.19 Fish Species recorded in the Contract Area, 2008
Name of Species Importance Acipenseridae family – sturgeons All valuable commercial fish Beluga – Huso huso (Linne)* IUCN Endangered Sturgeon, Russian sturgeon – Acipenser guldenstadti (Brandt)* IUCN Endangered Kura (Persian) sturgeon – Acipenser güldenstädtii persicus natio cyrensis(Belyaeff) *
IUCN Endangered
Kura barbel sturgeon – Acipenser nudiventris (Derzhav, Borsenko) * IUCN Endangered Kura (South-Caspian) stellate sturgeon – Asipenser stellatus stellatus natio cyrensis (Berg) *
IUCN Endangered
Clupeidae family – Herrings Clupeonella genus (Kessler) – Kilka All an important food source for other
fish and seals.Anchovy kilka – Clupeonella engrauliformis (Borodin) * IUCN Low Vulnerability, Big-eyed kilka – Clupeonella grimmi (Kessler) * IUCN Low Vulnerability.
Caspian common kilka – Clupeonella delicatula caspia (Stetovidov)* IUCN Low Vulnerability Caspian salmon (Salmo trutta caspius)*** IUCN Endangered Caspian lamprey (Caspiomyzon wagneri)*** IUCN Near Threatened Alosa Cuvier genus – Shad All an important food source for other
fish and seals.Caspian shad – Alosa caspia caspia (Eichwald) * IUCN Least Concern Big-eyed shad – Alosa brashnikovi autumnalis (Berg) * IUCN Least Concern Volga shad – Alosa kessleri volgensis (Berg)* IUCN Least Concern Black-backed shad – Alosa kessleri kessleri (Grimm) * IUCN Least Concern Cyprinidae family – Carps Kutum – Rutilus frisii kutum (Kamensky)* IUCN Least Concern Mugilidae family – Gray Mullets All an important food source for other
fish and sealsGolden mullet – Lisa auratus (Risso) * IUCN Least ConcernLeaping mullet – Lisa saliens (Risso) * IUCN Least ConcernGobiidae family – Gobiids** All an important food source for other
fish and sealsCaspian goby – Neogobius caspius (Eichwald) IUCN Least Concern Round goby – Neogobius melanostomus affinis (Eichwald) IUCN Least Concern Caspian syrman goby – Neogobius syrman eurystomus (Kessler) IUCN Least Concern Monkey goby – Neogobius fluviatilis pallasi (Berg) IUCN Least Concern Caspian big-headed goby – Neogobius kessleri gorlap (Iljin) IUCN Least Concern Knipovich long-tailed goby – Knipowitschia longicaudata (Kessler) IUCN Least Concern Grimm big-headed goby – Benthophilus grimmi (Kessler) IUCN Least Concern Other species Sandsmelt (Atherina mochon pontica)*** Not Evaluated Pipefish (Syngnathus nigrolineatus)*** IUCN Least Concern
* Have swim bladder ** Sometimes lacking swim bladder depending on species. *** Species were observed in previous survey (Phase 3 ESIA Section 6.4.4.5).
In addition to the above species resident species such as pipefish and sandsmelt are thought to be present in the vicinity of the Contract Area (as outlined in the catch data from a sampling program carried out in the Gunashli field, 1999-2001).
MonthSpecies Activity J F M A M J J A S O N D
Feeding Resident Fish Breeding Carp Feeding Sturgeon Migrating Shad Migrating
Feeding KilkaBreeding Feeding MulletBreeding

AIOC Chirag Oil Project Environmental & Socio-Economic Impact Assessment
Chapter 6: Environmental Description
February 2010 6/44Final
During Sangachal fish population studies carried out as part of the ACG Phase 1 ESIA, large numbers of vobla (Rutilus rutilus kurensis) were recorded. This is a sub-species in the carp family unlisted by the ICUN and believed to feed in the area.
Other species of conservation concern that may be present in the Contract Area, but that have not been recorded in previous surveys, include the Caspian Lamprey (ICUN near threatened) and the Caspian salmon (ICUN Endangered). These may be present in the Contract Area as juveniles and outside their spawning periods. The spawning ground for such species are the rivers in southern Caspian.
Stock Declines
There has been substantial stock decline in both sturgeon fish (since the 1970s) and kilka. The loss in sturgeon fish is predominately due to over fishing that has and is currently being subsidised by fish hatcheries, although this is unlikely to greatly increase the natural population. Kilka has undergone decline as a result of over fishing, affecting reproduction scales and due to the invader comb-jelly Mnemiopsis leidyi which consumes kilka roe within its plankton diet.
Fisheries
Fishing activity within the Contract Area is not considered commercially viable due to its remoteness from the fish landing ports. The closest fisheries to the Contract Area are the kilka fisheries, concentrated on offshore banks along the western coast of the southern Caspian.
Sensitivity
The common threats to fish populations are over fishing, high levels of pollution and habitat loss. Impacts relating to the oil industry include direct (accidental spills, such as oil or chemicals) and indirect (consumption of contaminated prey) impacts. Fish species that spawn in the Contract Area are most vulnerable to oil and chemical spills. The most sensitive stages of the life cycle process are egg, larvae and fry. Species which could potentially spawn within the Contract Area are herring (Clupidae), kilka (Culpeonella grimmi and C.angrauliformis) and gray mullet (Liza auratus and L. saliens)
Fish species can also be affected by contaminated plankton. In order for plankton to be contaminated however, there would need to be a sustained, wide field discharge of chemicals at continuously toxic concentrations. Fish reproduce seasonally and therefore it is important that there is adequate food supply for maturing adults larvae and juveniles. A shortage in food supply could potentially deprive sensitive life stages of fish, which impacts on fish populations
Fish species are sensitive to increased turbidity and to noise impacts, which may discourage them from going into the Contract Area. Those species with swim bladders (noted in Table 6.19) are most susceptible. The response to noise is determined by its duration, sound pressure level and frequency and ranges from changes in behaviour to, in extreme instances, fatality. Physical injury or fatalities have been observed to occur at a sound level of 220 dB re. 1µPa and 240 dB re. 1µPa, respectively and auditory damage (temporary and permanent) has been observed at 75dB and 95dB, respectively. Temporary duration is usually assumed to be up to 30 minutes and permanent over 8 hours.

AIOC Chirag Oil Project Environmental & Socio-Economic Impact Assessment
Chapter 6: Environmental Description
February 2010 6/45Final
Fish can detect sound at lower sound levels and may adopt an avoidance response. The four impact levels commonly used are:
A level of 100 dBht (species) corresponds to nearly 100% avoidance by most individuals;
A level of 90 dBht (species) and above which will cause a significant avoidance reaction by most individuals;
A level of 75 dBht (species) and above which will cause a milder avoidance response occurs in a majority of individuals; and
A level of 50 dBht (species) will give rise to a low likelihood of disturbance.
A level of 0 dBht (species) represents a sound that is at the hearing threshold for that species and is therefore at a level at which sound has the potential to be heard by that species. At this, and lower perceived sound levels no response occurs as the receptor cannot hear the sound.
Caspian Seal
In 2008 the Caspian Seal (Phoca caspica) was listed as ‘Endangered’ on the IUCN red list due to “a decline exceeding 50% over the last three generations, reduction in the number of sites used, current hunting levels that almost certainly exceed sustainable harvest levels and the multiple ongoing negative impacts on the habitat of the Caspian Seal”27.
The Caspian Seal is the only marine mammal in the Caspian Sea basin and is endemic to the area. An aerial survey carried out under the Darwin Initiative project in the North Caspian found that in the past decade the numbers of seals in the Caspian Sea reduced from approximately 400 to 111 thousand28,29.
The majority of the Caspian Seals (85-90%) migrate from the north of the Caspian Sea, where they breed in the winter, to the south along the shelf zones where they spend the summer months feeding. Whelping takes place in the north of the Caspian Sea towards the end of January- beginning of February. The newborn pup is weaned for a month after birth, shortly after which the mating of the seals take place between mid-February and mid-March. Once the ice has begun to melt the seals migrate south, this migration has two routes, the majority along the east coast and the minority along the west. In the autumn (October) back migration commences. It should be noted that both breeding and migration timings can be shifted for up to a month subject to weather conditions.
Seals are known to reach the Azerbaijani sector of the Caspian Sea at the end of April / beginning of May, with a peak accumulation in the area observed at the end of May / beginning of June. Another peak in population occurs during the back migration north in early November.
No seals are known to currently breed in the Azerbaijani sector of the Caspian Sea. The majority of seals are only present while feeding during migratory cross overs. Dependent upon the severity of the winter period, the seals initially confine their feeding range to the coastal waters while replenishing their fat reserves, which have been depleted by up to 50% during the winter. They are particularly vulnerable during this time as there ability to swim would have decreased and they cannot stay long in the open water. Seals from the Turkmenistan rookeries and Turkmenistan territorial waters also swim to the Contract Area for feeding. Once their reserves have been replenished and buoyancy restored, the seals will start moving into the deeper water areas of the middle and southern Caspian (during May to June), where the kilka populations are concentrated, returning periodically to their haul-out sites.
27IUCN 2008 Red List. 28 Krylov 1990 29 Report of the Caspian International Seal Survey (CISS) team based on the results of the Caspian seals’ census in 2006

AIOC Chirag Oil Project Environmental & Socio-Economic Impact Assessment
Chapter 6: Environmental Description
February 2010 6/46Final
A small proportion of the seal population is non-migratory and can be found on foraging expeditions all year round leaving their haul-outs and moving into the open water. Few of these seals will however, travel far offshore.
Sensitivity
The main causes of population decline of the Caspian Seal (Phoca caspica) in the past are associated with hunting, fishing activities, outbreaks of canine distemper and accumulation of heavy metal ion and organic pesticides.
Seals are also directly and indirectly sensitive to spills (such as oils or chemicals) and ongoing discharge causing contamination over time. They are most vulnerable during the breeding season and feeding periods (May to November). Seals are dependant on eyesight to hunt and are therefore, sensitive to any increases in turbidity.
Although seals are classed as marine mammals they spend considerable periods of time on land. As a consequence, seals are known to hear very well in-air as well as underwater. When diving or swimming, they may be susceptible to impacts arising from high levels of underwater sound. The response to noise is determined by its duration, sound pressure level and frequency and ranges from changes in behaviour to, in extreme instances, fatality. Physical injury or fatalities have been observed to occur at a sound level of 220 dB re. 1µPaand 240 dB re. 1µPa, respectively and auditory damage (temporary and permanent) has been observed at 75dB and 95dB, respectively. Temporary duration is usually assumed to be up to 30 minutes and permanent over 8 hours.
As with fish, Caspian Seals can detect sound at lower sound levels and may adopt an avoidance response. The same impact level criteria as presented above is commonly used to determine avoidance.
Birds
A number of species of sea birds found in the ACG Contract Area have been identified in previous bird surveys (see Table 6.20). These four species have been highlighted as being the most numerically abundant in published data for the Absheron Peninsula30 and the Shakhdilli-Pirallahi area31. None of these species are species of national and / or international concern. All four of the species are known to breed in the region and may be present throughout the year. Populations may vary with some migration occurring however. the Contract Area is not located within a recorded bird migration flyover route. Birds found in the area will be transient and not resident.32.
Table 6.20 Seabird Species Found in the ACG Contract Area
Common Name Scientific Name Great cormorant Phalacrocorax carbo Herring gull Larus argentatus Common tern Sterna hirundo Sandwich tern Sterna sandvicensis
Sensitivity
Bird species will be most vulnerable to potential oil spills. Birds that have been exposed to oil spills, even small amounts, usually die of hypothermia from loss of insulation, toxic poisoning from ingestion or the inability to feed as a result of the spills. To date no oil spills have occurred due to ACG activities.
30 Gambarov et al. (1958); Gambarov (1968); Mustafaev et al. (1968). 31 Sultanov and Kerimov (1998, 1999). 32 Phase 3 ESIA, Section 6.4.5 (2004)

AIOC Chirag Oil Project Environmental & Socio-Economic Impact Assessment
Chapter 6: Environmental Description
February 2010 6/47Final
Sea birds spend short periods of time under water during hunting and feeding activities. During this activity, the birds may be susceptible to impacts from underwater sound. Being exposed to high levels of underwater sound over an extended period can result in tissue damage and/or hearing loss (temporary or permanent).
6.5.3 WC-PDQ Platform Location Characteristics
6.5.3.1 Sources of Information
The environmental characteristics of the WC-PDQ platform location have been determined principally on the results of a survey carried out in 2003 in an area which includes the proposed WC-PDQ platform position. To provide additional local context, reference is also be made to data from the Deep Water Guneshli (DWG) platform baseline survey carried out in 2001 (designated GCA7 at the time), and a survey carried out in 2000 following exploration well drilling at the nearby GCA5 location. The survey locations and location of the proposed WC-PDQ platform are indicated in Figure 6.21.
The sections below are limited to describing the physical, chemical and biological characteristics of the benthic environment in the vicinity of the proposed WC-PDQ platform location. Specific water column surveys were not conducted in the platform location vicinity but such surveys are of limited relevance; due to the natural variability in water and plankton characteristics, the results of a water column survey at a specific location cannot be considered representative of the location.


AIOC Chirag Oil Project Environmental & Socio-Economic Impact Assessment
Chapter 6: Environmental Description
February 2010 6/49Final
6.5.3.2 Sediment Characteristics
Caspian sediments generally comprise components from distant sources, such as silt, clay and gravel of geological and fluvial origins, together with shell fragments and shell sand. Sediments can be characterised and distinguished using three basic parameters - mean particle diameter, silt / clay content (to indicate the geological component) and carbonate content (to indicate the biological component). Figure 6.22 depicts silt and clay content for sediments in the Contract Area (including the WC-PDQ location), along the ACG export pipeline corridor and in Sangachal Bay based on surveys conducted between 2000 and 2003. Figure 6.23 depicts the mean particle size diameter for the same locations.
The median survey value for sediment particle diameter ranged from less than 10 µm (Sangachal, GCA3, 4, 5 and 6) to almost 700 µm (Phase 1 location). Particle diameter at the ACG export pipeline stations was intermediate. Figure 6.23 shows the wide range of values at each location and the general trend of increasing sediment coarseness from nearshore to offshore.
Across the main part of the Contract Area (which includes the WC-PDQ platform location), median survey sediment particle diameter is in the range of 350 to 700 µm, and increases gradually from northwest (GCA 7) to southeast (Phase 1). Figure 6.23 also shows a difference in the distribution of values between locations with fine sediments (associated with a low median value) and locations with coarse sediments (associated with a high median value).
The pattern of distribution of carbonate content (Figure 6.24) is very similar to that for particle diameter and indicates that shell material contributes significantly to sediment coarseness. Silt-clay content is inversely related to both carbonate content and to particle diameter. Silt-clay content is typically high at Sangachal, along the ACG export pipeline corridor and at the post-drilling locations. Figure 6.22 shows that silt-clay content declines as particle diameter increases along the pipeline corridor from nearshore to offshore and also that it continues to decline gradually from northwest to southeast across the Contract Area, rising again at the most south easterly location (East Azeri).
Figure 6.22 Sediment Silt-Clay Content (%) - Median and Range
0
20
40
60
80
100
120

AIOC Chirag Oil Project Environmental & Socio-Economic Impact Assessment
Chapter 6: Environmental Description
February 2010 6/50Final
0
10
20
30
40
50
60
70
80
90
100
Figure 6.23 Sediment Particle Diameter - Median and Range µm
Figure 6.24 Carbonate (%) - Median and Range
The above figures show that the GCA7 and West Chirag 2003 locations are quite similar in terms of particle diameter, silt-clay content and carbonate content. For all three parameters, values for the West Chirag 2003 location are slightly higher. Since sediments within the Contract Area are however generally heterogeneous over small distances, the differences are not considered to be significant.
It is also worth noting that sediments at the GCA5 location, which is less than 5km from the GCA7 location, are much finer and consist almost entirely of fine silts and clays. The much finer sediments at this location are believed to be primarily related to the greater depth. Figure 6.25 summarises the depth range at survey locations across the Contract Area.
1
10
100
1000
10000

AIOC Chirag Oil Project Environmental & Socio-Economic Impact Assessment
Chapter 6: Environmental Description
February 2010 6/51Final
0
100
200
300
400
500
600
Figure 6.25 Median Depth, and Range, at Survey Locations Across ACG Contract Area
6.5.3.3 Sediment Chemistry
Hydrocarbons
Levels of hydrocarbon detected in sediments at the West Chirag, GCA5 and GCA7 locations are summarised in Table 6.21. This table indicates that total hydrocarbon concentrations at all three locations were within a similar, low, range. There was greater variation in % UCM. UCM represents the proportion of the total hydrocarbon present as an unresolved mixture and higher proportions generally indicate more weathered material. Conversely, lower proportions are often indicative of the presence of fresh (or relatively recently deposited) hydrocarbons. NPD represents the low molecular weight proportion of aromatic hydrocarbons (PAHs); the higher this proportion, the stronger the indication of the presence of fresh oil. Crude oil typically has a % NPD of around 80%, so the range of 46-60% in Table 6.21 suggests that there were no recent inputs of crude at any of the locations at the time of the surveys.
Table 6.21 Sediment Hydrocarbons (Median values for each location are given)
Location Year Type of survey THC (µg/g) %UCM %NPD
GCA7 2001 Baseline 28 79 46
West Chirag 2003 Baseline 25 73 60
GCA5 2000 Post-drilling 20 41 54
Heavy Metals
Table 6.22 summarises the survey medians of sediment concentrations of six heavy metals (copper, iron and zinc, which are naturally present in all sediments and lead, mercury and barium, which are common industrial pollutants). Although these are not the only metals for which analytical data are available, they provide a comprehensive picture of the natural inorganic chemistry of the sediments and also indicate the extent to which drilling activities may have a localised effect on concentrations.

AIOC Chirag Oil Project Environmental & Socio-Economic Impact Assessment
Chapter 6: Environmental Description
February 2010 6/52Final
Table 6.22 Median Trace Metal Concentrations in Sediments (µg/g) at each Survey Location
Location Type of survey Ba Fe Hg Pb Zn Cu
Mean continental crust
concentrations 630 43200 0.04 15 65-106 25
GCA7 Baseline 3591 46007 0.02 51 75 19
West Chirag 2003 Baseline 4609 20608 0.103 15 54 24
GCA5 Post-drilling 998 27170 0.03 17 73 21
Table 6.22 shows that sediments in the West Chirag 2003 and GCA5 locations have similar concentrations of iron. These concentrations are typical of most of the Contract Area. Iron concentrations at the GCA7 location are more than twice as high and are more typical of nearshore sediments (and also of average surface rock concentrations). West Chirag and GCA5 sediments also had much lower lead concentrations (again, typical of most of the Contract Area) than sediments at the GCA7 location. These patterns for iron and lead suggest that the GCA7 sediments are of different origin, or are subject to different influences, than the sediments at the other two locations. This may reflect the fact that the GCA7 location sits on a distinct ridge close to the northern edge of the Contract Area.
Radioactivity in Sediments
Radioactivity in sediments were measured in the Chirag-1 post Saraline survey (2000), the GCA5 and GCA6 Post well survey and the Chirag-1 - Sangachal sub sea pipeline survey (2000).
Ranges observed for selected isotopes were:
241Am (60 keV (kiloelectron volt): 1 – 4 Bq/kg (Becquerel per kilogram); 137Cs (662 keV): 0.6 – 25 Bq/kg; and 210Pb (Uranium series 46 kev): 23 – 111 Bq/kg.33
The results were all within the range that would be expected for surface marine sediments. In most cases, 210Pb activities exceeded those of 226Ra, again consistent with expectation. Any contamination with radium containing tailings or scale would be apparent as a significant excess of 226Ra activity over that of 210Pb or excess of 228Ra over 212Pb and this was not observed in any sample.
Considerable variability was apparent in the specific activities of 234Th and 210Pb, but this is consistent with the well established behaviour of these radionuclides in the marine environment and the observed specific activities were not abnormal. The data revealed no evidence of contamination with radium isotopes at any of these survey locations following drilling activities.
In a survey of sediment quality carried out under the Caspian Environmental Programme34 all sediment samples in the Azerbaijan sector of the Caspian Sea contained <5 µg/g uranium, consistent with background levels.
6.5.3.4 Benthic Fauna
Data obtained from surveys of the 2001 GCA7 and the West Chirag 2003 location have been compiled and examined to establish the range of species likely to be present at the WC-PDQ location. Data from the GCA5 post-drilling survey location have also been included. Also, although no biological impact of drilling was detected at GCA5, the community composition as measured shortly after the cessation of drilling provides a realistic indication of the minimum diversity which might be expected at the WC-PDQ location.
33 Source: AIOC ACG Monitoring Database. 34 Mora and Sheikholeslami (2002)

AIOC Chirag Oil Project Environmental & Socio-Economic Impact Assessment
Chapter 6: Environmental Description
February 2010 6/53Final
Species diversity at all three survey locations was similar to other Contract Area locations, with the following species most common:
Hypania invalida; Isochaetides michaelseni; Psammoryctides deserticola; Caspiohydrobia curta; Gammarus pauxillus; Gammarus warpachowskyi; Saduria entomon caspia; and Chironomus albidus.
The majority of other species are recorded at only a small number of stations and this is typical of the Contract Area as a whole.
56 taxa were recorded at GCA7 and 63 at the West Chirag 2003 location, while a total of 52 taxa were recorded at the GCA5 location. The slightly lower diversity at GCA5 may be attributable, in part, to the deeper water and finer sediment present at this location.
A comparison of the taxonomic composition (in terms of the major taxonomic groups) at the three survey locations is presented in Table 6.22. This shows that the diversity of polychaetes and oligochaetes was very similar between all three locations (although there was considerable variation in the actual species present). The most distinctive features of the table are:
Similar amphipod diversity at GCA7 and West Chirag, but lower diversity at GCA5; Low gastropod diversity at GCA7, but high gastropod diversity at West Chirag and
GCA5; Comparatively high cumacean diversity at GCA7, with much lower diversity at West
Chirag and GCA5; Very low bivalve diversity at GCA7, with much higher diversity at both West Chirag and
GCA5; and Higher bivalve diversity at West Chirag and GCA5.
These observations suggest that molluscs (bivalves and gastropods) are more diverse at GCA5 and West Chirag than at GCA7. Conversely, there are substantially fewer amphipod species at GCA5 than at the other two locations, which may reflect the greater depth and finer sediments at GCA5. Overall, however, there is no simple relationship between community composition and either depth or sediment structure. It is possible that any such relationships are not consistent between taxonomic groups.
The data summarised in Table 6.23 nevertheless provide a clear indication that the biological communities in the general area are characteristically diverse and that at all three locations this diversity is dominated by native invertebrate species. It is therefore reasonable to conclude that the community composition at the WC-PDQ platform location will be similar, given both the proximity of the locations to each other and the fact that the WC-PDQ platform location lies within the depth range covered by the three existing surveys.
A more detailed examination of the species lists for each of the three locations indicates that there are no unusually rare or threatened species present. Since these three locations ‘bracket’ the WC-PDQ platform location horizontally and by depth, it is concluded that it is highly unlikely that any rare, threatened or unusually sensitive species will be present at the WC-PDQ location.

AIOC Chirag Oil Project Environmental & Socio-Economic Impact Assessment
Chapter 6: Environmental Description
February 2010 6/54Final
Table 6.23 Number of Species Representing Each Major Taxonomic Group
GCA7 West Chirag GCA5 Amphipods 22 21 15 Gastropods 7 17 16 Polychaetes 6 5 5 Oligochaetes 7 6 5 Cumacea 8 4 3 Bivalves 1 5 4
6.5.3.5 Sensitivity in WC-PDQ Platform Location
The information presented in the previous section indicates that there is no clear or strong relationship between environmental characteristics and biological characteristics in the area occupied by the three survey locations. Within these survey data, there are also no indications of any relationships between biology and the concentrations of hydrocarbons and heavy metals.
Sediment chemistry suggests however, that the GCA7 location is significantly different from the GCA5 and West Chirag 2003 locations. The fact that there are corresponding differences in the diversity of gastropods, bivalves and cumacea might indicate that this has some biological significance, although no studies have been carried out to investigate this possibility further. The proposed platform location supports a benthic community which comprises typical and common offshore invertebrate species and which has no unusual or unique sensitivities compared to other parts of the Contract Area.
6.5.4 Observed Effect of West Azeri Platform Installation and Operations
This section discusses the observed impacts to the marine environment from the installation and operational activities of a platform.
As each new ACG platform is installed and becomes operational, it has been included in the routine, long-term AzSPU IEMP. The most recent information available is for the West Azeri (WA) platform, where the following benthic surveys have been carried out (see Figure 6.26 for survey locations):
2002: baseline survey for Phase 2 ESIA; 2005: post-installation survey (following template pre-drill activities and platform
installation); and 2007: routine survey after two years of platform operation.
It has been estimated that approximately 1,350 tonnes of cuttings and 1,650m3 of WBM were discharged in the interval between the 2005 and 2007 surveys.
Sediments at the West Azeri location are fairly coarse, with a median particle diameter of 533µm and corresponding low silt-clay content (see Table 6.24). Between 2005 and 2007, particle diameter were found to decrease overall but increase within an elliptical area extending about 200m east and west of the platform and about 500m north and south. Comparison of the three survey data sets indicates that there is a modest long-term decline in sediment particle size across the area as a whole. This does not appear to have any observable biological significance and the consistency of the trend across the area suggests that it is a natural process.

AIOC Chirag Oil Project Environmental & Socio-Economic Impact Assessment
Chapter 6: Environmental Description
February 2010 6/55Final
Figure 6.26 Layout of the West Azeri 2008 Survey Stations
Table 6.24 Comparison of Sediment Properties, West Azeri, 2002-2007
Mean Diameter (µm) % Carbonate
2002 2005 2007 2002 2005 2007
Min 135 9 67 48 28 44
Max 1636 1307 1015 74 66 73
Med 495 448 349 59 61 62
Mean 565 534 478 62 53 61
A small quantity (less than 5 barrels) of linear alpha olefin (LAO) drilling mud was spilled during pre-drill activities in 2004 and this has remained detectable within the sediment samples between 2005 and 2007. Concentrations are low but a clear footprint is evident, extending from the south west to the north east in an elliptical area about 1,400m long and about 700m wide.
Weathered hydrocarbon concentrations are generally low, with the exception of Station 12 (300m south west of platform) and Station 3. Station 3 is anomalous: in both 2005 and 2007, concentrations of total hydrocarbons, PAH and heavy metals were substantially higher than at any other station, suggesting that there has been highly localised contamination by a complex waste material. With the exception of higher THC concentrations at station 12 (which did not indicate serious contamination), there was no overall trend in concentrations between 2002 and 2007, indicating that pre-drill, installation and production operations have not released measurable quantities of petroleum hydrocarbons to the surrounding environment.
West Azeri PlatformWA-0708
WA-0702
WA-0707
WA-0703
WA-0709
WA-0719
WA-0711
WA-0716
WA-0705
WA-0718 WA-0710
WA-0704
WA-0717
WA-0708
WA-0701
WA-0713
WA-0722
WA-0712 WA-0714
WA-0723
WA-0721 WA-0720
WA-0715
Survey Station

AIOC Chirag Oil Project Environmental & Socio-Economic Impact Assessment
Chapter 6: Environmental Description
February 2010 6/56Final
There was also no overall trend in the concentrations of chromium, copper, iron, manganese and zinc over the 2002-2007 period. Mercury and arsenic concentrations increased from 2002-2005 but did not change significantly between 2005 and 2007. Lead concentrations decreased between 2005 and 2007 at most stations. Barium concentrations (obtained from fusion analysis) showed an increase from 2002 to 2005 and an overall decrease between 2005 and 2007. Within this overall trend there was however, an increase in concentration between 2005 and 2007 at stations closest to the WA platform. Concentrations of cadmium, barium and mercury were higher at stations close to the platform, while concentrations of chromium and iron were lower at stations closer to the platform. These changes may be partly associated with the deposition of cuttings generated and discharged whilst drilling with water-based muds.
A total of 85 benthic invertebrate taxa were identified, with between 1 and 50 taxa per station and an average of 36 taxa per station. The average number of taxa per station in 2002 was 19 and in 2005 was 30. Since installation of the platform, species richness per station has exhibited a progressive increase. Overall abundance was also higher in 2007 than in previous years.
The spatial distribution of abundance and species richness indicated that these were slightly lower at stations immediately around the platform; in this area of lower abundance and richness, polychaetes tended to be dominant, while at distances of more than 400m from the platform amphipods were dominant. Even within this area (which corresponds approximately to the barium footprint) species richness and abundance were however, generally high and comparable to both the baseline condition at this location and with the broader regional characteristics.
Since 2002, two distinct changes have been observed:
The insect larva Chironomus has declined in abundance, and is no longer dominant (this species was relatively rare in 1995/96 and gradually became well-established across the Contract Area between 1996 and 2000); and
The alien polychaete Nereis has become established and is present at an increasing number of stations (10 in 2005, 13 in 2007); abundance, however, remains low and the presence of this organism (whilst associated with the area of lowest abundance and richness) does not appear to have a serious impact at present.
These changes have been observed both in the West Chirag platform vicinity and across the ACG Contract Area as discussed within Section 6.5.3.4 above.
Overall, the sediments in the West Azeri platform vicinity show no sign of ecologically significant contamination and the benthic community is diverse and abundant, suggesting that operational impacts have been minimal.

AIOC Chirag Oil Project Environmental & Socio-Economic Impact Assessment
Chapter 6: Environmental Description
February 2010 6/57Final
6.6 Benthic and Sediment Surveys Undertaken in 2009
A limited benthic and sediment survey was carried out in July 2009 to extend the 2003 West Chirag survey area to the NE. The survey comprised 12 stations, five of which were also sampled in 2003 (Stations COP, 6, 7, 12 and 18 in Figure 6.27). The aim of the survey was to assess and compare the status of the area in 2003 and 2009, and to determine whether there was any need to revise the conclusions based on the 2003 survey.
Figure 6.27 2009 COP Benthic Survey Stations
67
101112
15161718
1920
COP
518700.00 518900.00 519100.00 519300.00 519500.00
4443600.00
4443700.00
4443800.00
4443900.00
4444000.00
4444100.00
4444200.00
6.6.1 Biological Data
Table 6.25 presents a comparison of the number of taxa present in the 2003 and 2009 surveys for the major taxonomic groups. These major groups consist almost entirely of native or endemic species, and provide a reliable indication of diversity. The number of taxa present in 2009 was higher (79) than in 2003 (58), and the difference was largely due to the presence of a larger number of amphipod taxa in 2009 (40 versus 21). This magnitude of difference is consistent with the large natural fluctuations observed in ACG regional surveys conducted every two years between 2004 and 2008. Equally large natural fluctuations have been observed in the numbers of taxa observed for the gastropods, which are, together with amphipods, a major component of offshore Caspian biodiversity.
Comparisons of taxonomic richness over time at other ACG locations, and in the regional surveys, have shown that variation is largely associated with species which are present at a small number of stations and in low abundance; there is a high degree of consistency between surveys in terms of the persistent dominance of macrobenthic communities by a small number of ubiquitous amphipod, oligochaete, and polychaete species. This consistency is also present between the 2003 and 2009 COP location surveys.
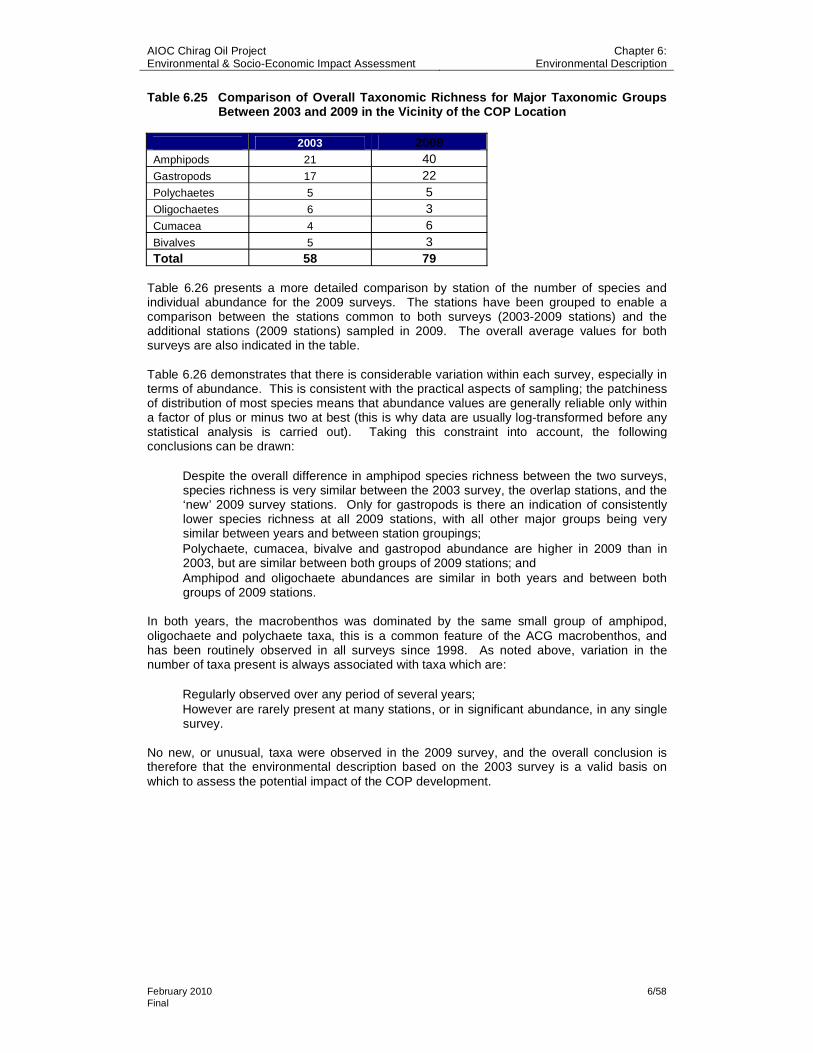
AIOC Chirag Oil Project Environmental & Socio-Economic Impact Assessment
Chapter 6: Environmental Description
February 2010 6/58Final
Table 6.25 Comparison of Overall Taxonomic Richness for Major Taxonomic Groups Between 2003 and 2009 in the Vicinity of the COP Location
2003 2009Amphipods 21 40Gastropods 17 22Polychaetes 5 5Oligochaetes 6 3Cumacea 4 6Bivalves 5 3Total 58 79
Table 6.26 presents a more detailed comparison by station of the number of species and individual abundance for the 2009 surveys. The stations have been grouped to enable a comparison between the stations common to both surveys (2003-2009 stations) and the additional stations (2009 stations) sampled in 2009. The overall average values for both surveys are also indicated in the table.
Table 6.26 demonstrates that there is considerable variation within each survey, especially in terms of abundance. This is consistent with the practical aspects of sampling; the patchiness of distribution of most species means that abundance values are generally reliable only within a factor of plus or minus two at best (this is why data are usually log-transformed before any statistical analysis is carried out). Taking this constraint into account, the following conclusions can be drawn:
Despite the overall difference in amphipod species richness between the two surveys, species richness is very similar between the 2003 survey, the overlap stations, and the ‘new’ 2009 survey stations. Only for gastropods is there an indication of consistently lower species richness at all 2009 stations, with all other major groups being very similar between years and between station groupings;
Polychaete, cumacea, bivalve and gastropod abundance are higher in 2009 than in 2003, but are similar between both groups of 2009 stations; and
Amphipod and oligochaete abundances are similar in both years and between both groups of 2009 stations.
In both years, the macrobenthos was dominated by the same small group of amphipod, oligochaete and polychaete taxa, this is a common feature of the ACG macrobenthos, and has been routinely observed in all surveys since 1998. As noted above, variation in the number of taxa present is always associated with taxa which are:
Regularly observed over any period of several years; However are rarely present at many stations, or in significant abundance, in any single
survey.
No new, or unusual, taxa were observed in the 2009 survey, and the overall conclusion is therefore that the environmental description based on the 2003 survey is a valid basis on which to assess the potential impact of the COP development.

AIOC Chirag Oil Project Environmental & Socio-Economic Impact Assessment
Chapter 6: Environmental Description
February 2010 6/59Final
Table 6.26 Station-by-Station and Overall Comparison of Species Richness and Abundance Between 2003 and 2009
2003-2009 stations Additional 2009 stations Major taxonomic group 2003
average Average Average
Number of taxa 6 7 6 6 6 6 6 7 6 5 5 5 5 7 6Polychaetes Number of
individuals373 1060 850 847 547 826 510 4227 1663 283 767 987 2327 540 1413
Number of taxa 5 3 4 3 4 4 4 4 4 3 3 4 4 3 4Oligochaetes Number of
individuals337 177 383 160 63 196 310 743 460 63 327 263 323 120 326
Number of taxa 3 5 4 5 1 4 2 4 5 4 2 3 6 4 4Cumacea Number of
individuals7 197 80 67 3 87 50 130 33 30 80 17 163 53 70
Number of taxa 22 24 27 18 22 23 27 26 22 23 15 23 23 23 23Amphipods Number of
individuals 469 353 427 470 477 432 317 573 307 260 103 707 323 823 427
Number of taxa 5 4 5 4 3 4 4 5 2 4 2 4 3 1 3Bivalves Number of
individuals 7 127 237 197 140 175 220 187 163 140 33 83 67 53 118
Number of taxa 18 13 11 11 8 11 12 17 11 9 10 15 19 9 13Gastropods Number of
individuals30 340 247 263 120 242 340 607 283 173 167 427 387 253 330
6.6.2 Sediment Composition and Chemistry
A comparison of sediment properties between the 2003 and 2009 surveys are presented in Tables 6.27 to 6.29. These tables indicate that:
The range and average values are similar between 2003 and 2009; The average particle size is slightly larger and the average silt/clay content is slightly
higher; All data is within the range of baseline conditions previously established for the ACG
Contract Area; Evidence indicates that the extended area is generally similar in character to the
original survey area; Values for Cu, Pb, Zn, and Ba are very similar between years; Values for Cr, Fe, and Cd are higher in 2009, possibly reflecting slightly higher silt/clay
content; Values for Hg and THC are lower in 2009, however, THC is low in both surveys; and All values are within the range of baseline concentrations previously observed within
ACG Contract Area.
Overall, the data for 2009 do not indicate any changes since 2003 which lie outside the established level of variation within and between previous surveys. The results are therefore considered to be consistent with, and representative of, the COP area.
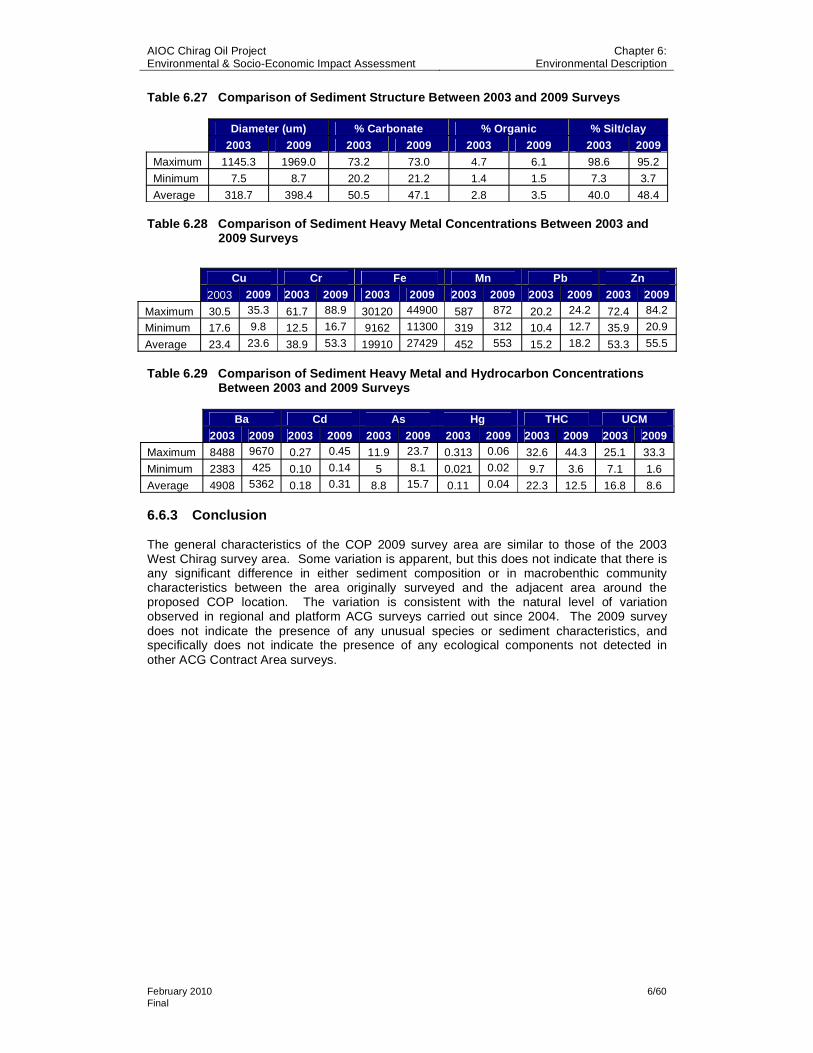
AIOC Chirag Oil Project Environmental & Socio-Economic Impact Assessment
Chapter 6: Environmental Description
February 2010 6/60Final
Table 6.27 Comparison of Sediment Structure Between 2003 and 2009 Surveys
Diameter (um) % Carbonate % Organic % Silt/clay 2003 2009 2003 2009 2003 2009 2003 2009
Maximum 1145.3 1969.0 73.2 73.0 4.7 6.1 98.6 95.2
Minimum 7.5 8.7 20.2 21.2 1.4 1.5 7.3 3.7
Average 318.7 398.4 50.5 47.1 2.8 3.5 40.0 48.4
Table 6.28 Comparison of Sediment Heavy Metal Concentrations Between 2003 and 2009 Surveys
Table 6.29 Comparison of Sediment Heavy Metal and Hydrocarbon Concentrations Between 2003 and 2009 Surveys
Ba Cd As Hg THC UCM2003 2009 2003 2009 2003 2009 2003 2009 2003 2009 2003 2009
Maximum 8488 9670 0.27 0.45 11.9 23.7 0.313 0.06 32.6 44.3 25.1 33.3
Minimum 2383 425 0.10 0.14 5 8.1 0.021 0.02 9.7 3.6 7.1 1.6
Average 4908 5362 0.18 0.31 8.8 15.7 0.11 0.04 22.3 12.5 16.8 8.6
6.6.3 Conclusion
The general characteristics of the COP 2009 survey area are similar to those of the 2003 West Chirag survey area. Some variation is apparent, but this does not indicate that there is any significant difference in either sediment composition or in macrobenthic community characteristics between the area originally surveyed and the adjacent area around the proposed COP location. The variation is consistent with the natural level of variation observed in regional and platform ACG surveys carried out since 2004. The 2009 survey does not indicate the presence of any unusual species or sediment characteristics, and specifically does not indicate the presence of any ecological components not detected in other ACG Contract Area surveys.
Cu Cr Fe Mn Pb Zn
2003 2009 2003 2009 2003 2009 2003 2009 2003 2009 2003 2009
Maximum 30.5 35.3 61.7 88.9 30120 44900 587 872 20.2 24.2 72.4 84.2
Minimum 17.6 9.8 12.5 16.7 9162 11300 319 312 10.4 12.7 35.9 20.9
Average 23.4 23.6 38.9 53.3 19910 27429 452 553 15.2 18.2 53.3 55.5

AIOC Chirag Oil Project Environmental & Socio-Economic Impact Assessment
Chapter 7: Socio-Economic Description
February 2010 7/1Final
7 Socio-Economic Description
Contents
7.1 Introduction .......................................................................................................................27.2 Demographic Profile..........................................................................................................2
7.2.1 Population ............................................................................................................27.3 Education ..........................................................................................................................37.4 Human Resource Development........................................................................................57.5 Income ..............................................................................................................................67.6 Community Programmes ..................................................................................................6
7.6.1 Socio-Economic and Environmental Programmes ..............................................67.6.2 Local Content Development.................................................................................7
7.7 Economic Development ....................................................................................................77.7.1 Overview ..............................................................................................................7
7.8 Employment ......................................................................................................................97.8.1 BP Projects Employment ...................................................................................107.8.2 Local Trading Centres ........................................................................................11
7.9 Construction Yards..........................................................................................................12
List of Figures
Figure 7.1 BP Projects Construction Workforce, 2002 to 2007 10
List of Tables
Table 7.1 National Population, 1995 - 2008 2 Table 7.2 Age Profile, Urban and Rural, 2008 3 Table 7.3 Key Education Indicators, 1995 to 2008 4 Table 7.4 Income By Urban and Rural Areas, 2005 to 2006 (AZN / Month) 6 Table 7.5 Wealth Quintiles, Urban and Rural, 2006 6 Table 7.6 BP / AIOC Social Spend, 2002 to 2008 (US$M) 7 Table 7.7 Local Content Spend, 2006 to 2008 (US$M) 7 Table 7.8 Macroeconomic Data 8 Table 7.9 Employment and Unemployment in Baku and Garadagh District 9 Table 7.10 Employment by Sector, 2008 10

AIOC Chirag Oil Project Environmental & Socio-Economic Impact Assessment
Chapter 7: Socio-Economic Description
February 2010 7/2Final
7.1 Introduction
This Chapter reviews the existing socio-economic conditions relevant to the Chirag Oil Project (COP). National level data is drawn largely from the following sources:
State Statistical Committee (SSC) of Azerbaijan reports, 2007, 2008 and 2009; The State Programme on Poverty Reduction and Economic Development, 2003-
2005; Discussions with officials from the SSC, Ministries, local authorities, representatives
of International Organisations (e.g. UNFPA, United Nations Population Fund) and independent experts representing civil society; and
United Nations Human Development Reports.
With the exception of construction and onshore commissioning, COP activities will be predominantly offshore. No upgrade or expansion works are proposed at the Sangachal Terminal. The focus of this chapter is therefore, on providing a general overview of the socio-economic environment and establishing the local (i.e. Garadagh region) employment, community and economic conditions against which onshore construction / commissioning activities and subsequent ongoing COP production activities can be assessed. The socio-economic impact assessment is presented in Chapter 9 of this ESIA. The main interactions likely to arise from COP project activities, as identified through Scoping, are positive impacts on local economy and employment and therefore, this description of existing socio-economic conditions focuses on these.
7.2 Demographic Profile
7.2.1 Population
The population of Azerbaijan in December 2008 was 8,629,900 (Table 7.1)1. In 2008, 51.7% of the national population was officially resident in urban areas, a figure that had remained relatively constant over the previous 10 years. Officially, in 2007, 22% of the national population was resident in Baku city (which includes the Region of Garadagh). There are however, indications that the actual population of Baku may be significantly higher than the official figures suggest. The United Nations Development Programme (UNDP) has for example, suggested that the greater Baku metropolitan area may be home to approximately three million people or 35% of the country’s entire population.2
Table 7.1 National Population, 1995 - 2008
1995 2000 2002 2003 2004 2005 2006 2007 2008
Total 7,643.5 8,016.2 8,141.4 8,202.5 8,265.7 8,347.3 8,436.4 8,532.7 8,629.9
Urban (%) 52.4 51 50.7 50.6 51.5 51.5 51.6 51.5 51.7
Rural (%) 47.6 49 49.3 49.4 48.5 48.5 48.4 48.5 48.3
Male (%) 49.1 48.9 49 49.1 49.1 49.2 49.2 49.3 49
Female (%) 50.9 51.1 51 50.9 50.9 50.8 50.8 50.7 51
Table 7.23 presents national age profiles, including those for urban and rural areas. Overall, the demographic situation in Azerbaijan has been characterised by low population growth. During the period 1990 to 2000, the birth rate and natural growth rate decreased, infant and maternal mortality increased and the country experienced a negative migration balance, mainly due to the emigration of working-age men. Between 2004 and 2007 however, birth rates and the natural fertility rate of the population increased returning closer to their 1995 levels. The fertility rate for 2007 was 2.3 (2.1 for urban and 2.5 for rural
1 Social Economical Development, State Statistical Committee, 2008, # 12, p. 114. 2 United Nations Development Programme (UNDP) Azerbaijan, 2007: Converting Black Gold into Human Gold: Using oil Revenues to Achieve Sustainable Development. 3 State Statistical Committee, 2008.

AIOC Chirag Oil Project Environmental & Socio-Economic Impact Assessment
Chapter 7: Socio-Economic Description
February 2010 7/3Final
areas). The fertility rate for Garadagh District in 2008 was 2.05, lower than the national average4. Maternal mortality rates were lower and infant mortality rates significantly lower than in 1995. By 2007, average life expectancy at birth was 72.4 years (69.7 years among men and 75.1 years among women), significantly higher than 1995 levels.
Table 7.2 Age Profile, Urban and Rural, 2008
Total Urban RuralAge
(‘000) % (‘000) % (‘000) %
0-4: 639.7 7.9% 317.9 7.1% 362.8 8.7%
5-9: 680.7 6.4% 251.0 5.6% 303.3 7.3%
10-14: 764.9 8.9% 357.5 8.0% 407.4 9.8%
15-19: 926.5 10.7% 469.0 10.5% 457.5 11.0%
20-24: 870.9 10.1% 456.9 10.2% 414.0 9.9%
25-29: 724.0 8.4% 385.2 8.6% 338.8 8.1%
30-34: 619.5 7.2% 315.7 7.1% 303.8 7.3%
35-39: 640.7 7.4% 323.7 7.3% 317.0 7.6%
40-44: 670.7 7.8% 352.2 7.9% 318.2 7.6%
45-49: 667.7 7.8% 377.8 8.5% 289.9 7.0%
50-54: 456.5 5.3% 271.8 6.1% 184.7 4.4%
55-59: 304.1 3.5% 188.4 4.2% 115.7 2.8%
60-64: 147.0 1.7% 92.2 2.1% 54.8 1.3%
65-69: 209.4 2.4% 114.0 2.6% 95.4 2.3%
70 and over: 393.3 4.5% 191.5 4.3% 201.8 4.8%
Total: 8,629.9 100.0% 4,464.6 100.0% 4165.1 100.0%
In 2008, 70% of the country’s population were in the age bracket 15 to 64. Twenty-three percent were in the 0 to 14 age bracket and 7% were 65 or older.
Official statistics number the Garadagh District population at 102,716 as of January 1st,20085. The age profile has remained relatively stable over recent years with the main growth sectors in the less than 4, 10 to 14 and 35 to 39 age brackets.
7.3 Education
The Azerbaijan education law guarantees the right to education for all its citizens irrespective of race, nationality or sex. In 2008, approximately 2.2 million people were students and education providers (330,000 teachers and other education providers) at various institutions throughout the country. In the age bracket of six to 16 years, school enrolment rates were 84.1% of the population. Around 86% of workers in the national economy had received an education to secondary level or above and there was almost universal literacy. Enrolment rates declined notably as the level of education increased (i.e. once compulsory education ended).
The period 1995 to 2006 witnessed a small increase in the number of pupils in general day schools and an increase (about 15%) in the number of teachers (Table 7.3)6. The most significant changes were in the growth in the number of secondary school pupils, which increased by 56%. Entries to specialised secondary institutions increased both in absolute terms (56% higher over the period) and as a proportion of the general population (from 10
4 CIA World Fact Book, 2008. 5 State Statistical Committee, 2008. 6 State Statistical Committee, 2008 and 2009. Sustainable Development and Education, Baku, 2008.
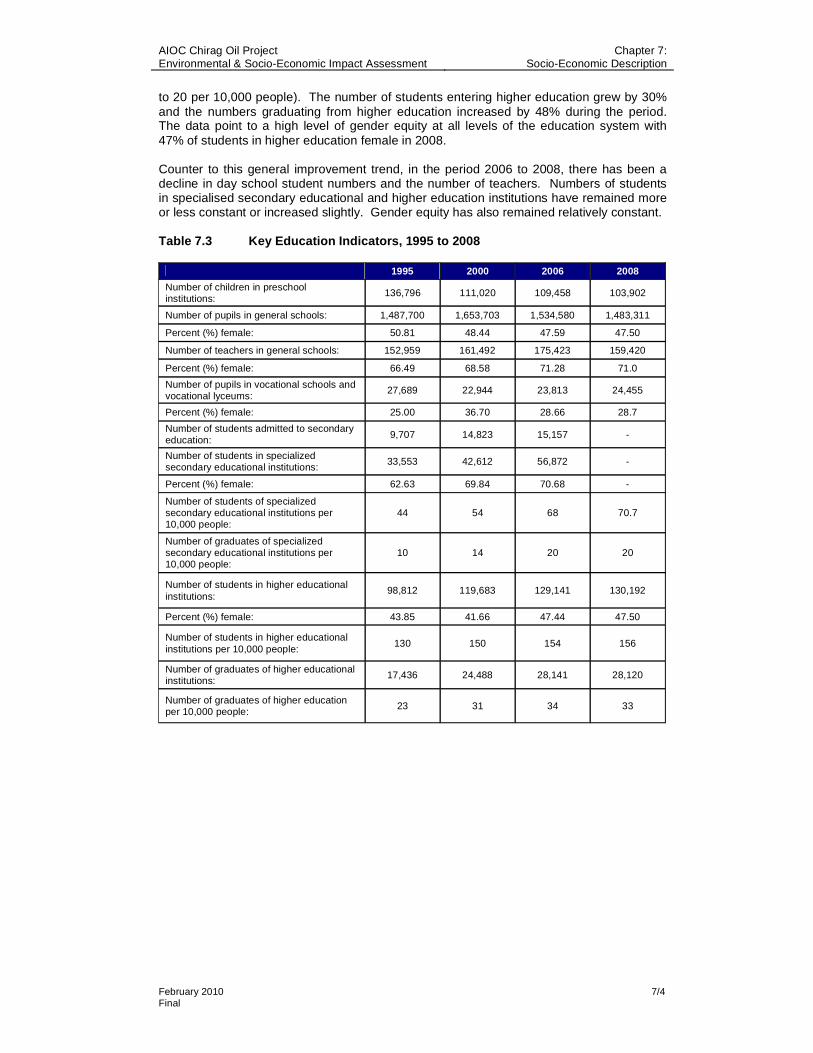
AIOC Chirag Oil Project Environmental & Socio-Economic Impact Assessment
Chapter 7: Socio-Economic Description
February 2010 7/4Final
to 20 per 10,000 people). The number of students entering higher education grew by 30% and the numbers graduating from higher education increased by 48% during the period. The data point to a high level of gender equity at all levels of the education system with 47% of students in higher education female in 2008.
Counter to this general improvement trend, in the period 2006 to 2008, there has been a decline in day school student numbers and the number of teachers. Numbers of students in specialised secondary educational and higher education institutions have remained more or less constant or increased slightly. Gender equity has also remained relatively constant.
Table 7.3 Key Education Indicators, 1995 to 2008
1995 2000 2006 2008
Number of children in preschool institutions:
136,796 111,020 109,458 103,902
Number of pupils in general schools: 1,487,700 1,653,703 1,534,580 1,483,311
Percent (%) female: 50.81 48.44 47.59 47.50
Number of teachers in general schools: 152,959 161,492 175,423 159,420
Percent (%) female: 66.49 68.58 71.28 71.0
Number of pupils in vocational schools and vocational lyceums:
27,689 22,944 23,813 24,455
Percent (%) female: 25.00 36.70 28.66 28.7
Number of students admitted to secondary education: 9,707 14,823 15,157 -
Number of students in specialized secondary educational institutions:
33,553 42,612 56,872 -
Percent (%) female: 62.63 69.84 70.68 -
Number of students of specialized secondary educational institutions per 10,000 people:
44 54 68 70.7
Number of graduates of specialized secondary educational institutions per 10,000 people:
10 14 20 20
Number of students in higher educational institutions:
98,812 119,683 129,141 130,192
Percent (%) female: 43.85 41.66 47.44 47.50
Number of students in higher educational institutions per 10,000 people:
130 150 154 156
Number of graduates of higher educational institutions:
17,436 24,488 28,141 28,120
Number of graduates of higher education per 10,000 people:
23 31 34 33
AIOC Chirag Oil Project Environmental & Socio-Economic Impact Assessment
Chapter 7: Socio-Economic Description
February 2010 7/5Final
7.4 Human Resource Development
Although dominating Azerbaijan’s economic development, the oil and gas sector generates less than 2% of the country’s jobs. The Government of Azerbaijan has therefore begun to implement a National Employment Strategy to “convert black gold into human gold”7 to invest gains from the oil and gas sector in the skills and intellectual development of its people. This strategy is described in the UNDP Azerbaijan 2007 report, Converting Black Gold into Human Gold: Using Oil Revenues to Achieve Sustainable Development.
The report notes that almost 70% of unemployed people are in the 158 to 34 year age bracket and from the late 1990s through to 2007 more than 60% of unemployed had higher or secondary special education. In 2007, 49.7% of the registered unemployed were graduates of higher and vocational educational establishments. The report suggests that vocational education and training have experienced declining enrolments at secondary levels and there appears to be a gap between labour market needs and supply from educational institutions.
The UNDP argue that the focus of a human resource development strategy must be on the interface between those coming into the workplace, their qualifications, competencies and skills as a function of their educational experiences and labour market demand. It identifies three major issues:
The need for re-assessment and reform throughout the entire education system from pre-school through higher education, while recognising strong traditions in education policy and practice;
The need to diversify the national economy beyond the oil and gas sector, which will demand depth and diversity in workforce skills that do not exist at present; and
The need to improve the standards of the vocational education and training facilities and institutions.
A review of the Vocational, Educational and Training (VET) system completed in February 2006 by the European Training Foundation identified a lack of reliable data on educational supply of and occupational demand for skilled workers, lack of coordination between educational level and skills requirements and shortages of middle level qualified workers. Labour Force Survey data suggest that higher educated people tend to concentrate in public sector occupations, which does not support diverse and sustained economic growth.
In summary:
The public education system is creating a large number of secondary educated young people who find it very difficult to obtain jobs and more coordination, information and analysis is required to better understand and address the supply of educated labour and its current and anticipated demand;
Skills development has been absorbed into a public vocational education system and a more integrated response with public / private cooperation and supply and demand analysis is required as is more flexible technical-vocational-educational training to raise skills to make the non-oil sector competitive internationally; and Human resource development alone is not sufficient for sustainable economic development and competitive export industries will be required to ensure employment of skilled workers and this in turn will require creation of economic conditions where potential investors are not deterred by lack of access to export markets, entrenched monopolies or governance issues.
7 UNDP Azerbaijan, 2007, op. cit.8According to Azerbaijan national law the working age starts at 15 years old. This age has been also recommended by the ILO (International Labour Organization UN Institution).
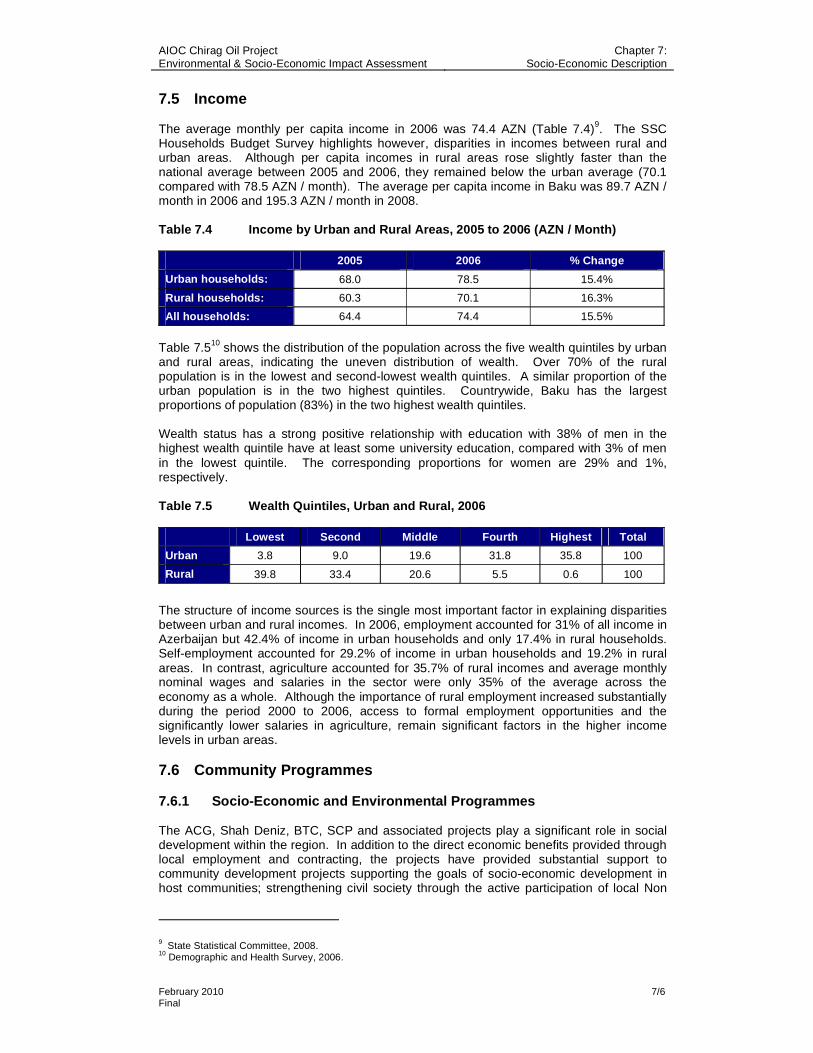
AIOC Chirag Oil Project Environmental & Socio-Economic Impact Assessment
Chapter 7: Socio-Economic Description
February 2010 7/6Final
7.5 Income
The average monthly per capita income in 2006 was 74.4 AZN (Table 7.4)9. The SSC Households Budget Survey highlights however, disparities in incomes between rural and urban areas. Although per capita incomes in rural areas rose slightly faster than the national average between 2005 and 2006, they remained below the urban average (70.1 compared with 78.5 AZN / month). The average per capita income in Baku was 89.7 AZN / month in 2006 and 195.3 AZN / month in 2008.
Table 7.4 Income by Urban and Rural Areas, 2005 to 2006 (AZN / Month)
2005 2006 % Change
Urban households: 68.0 78.5 15.4%
Rural households: 60.3 70.1 16.3%
All households: 64.4 74.4 15.5%
Table 7.510 shows the distribution of the population across the five wealth quintiles by urban and rural areas, indicating the uneven distribution of wealth. Over 70% of the rural population is in the lowest and second-lowest wealth quintiles. A similar proportion of the urban population is in the two highest quintiles. Countrywide, Baku has the largest proportions of population (83%) in the two highest wealth quintiles.
Wealth status has a strong positive relationship with education with 38% of men in the highest wealth quintile have at least some university education, compared with 3% of men in the lowest quintile. The corresponding proportions for women are 29% and 1%, respectively.
Table 7.5 Wealth Quintiles, Urban and Rural, 2006
Lowest Second Middle Fourth Highest Total
Urban 3.8 9.0 19.6 31.8 35.8 100
Rural 39.8 33.4 20.6 5.5 0.6 100
The structure of income sources is the single most important factor in explaining disparities between urban and rural incomes. In 2006, employment accounted for 31% of all income in Azerbaijan but 42.4% of income in urban households and only 17.4% in rural households. Self-employment accounted for 29.2% of income in urban households and 19.2% in rural areas. In contrast, agriculture accounted for 35.7% of rural incomes and average monthly nominal wages and salaries in the sector were only 35% of the average across the economy as a whole. Although the importance of rural employment increased substantially during the period 2000 to 2006, access to formal employment opportunities and the significantly lower salaries in agriculture, remain significant factors in the higher income levels in urban areas.
7.6 Community Programmes
7.6.1 Socio-Economic and Environmental Programmes
The ACG, Shah Deniz, BTC, SCP and associated projects play a significant role in social development within the region. In addition to the direct economic benefits provided through local employment and contracting, the projects have provided substantial support to community development projects supporting the goals of socio-economic development in host communities; strengthening civil society through the active participation of local Non
9 State Statistical Committee, 2008. 10 Demographic and Health Survey, 2006.

AIOC Chirag Oil Project Environmental & Socio-Economic Impact Assessment
Chapter 7: Socio-Economic Description
February 2010 7/7Final
Governmental Organisations (NGO) and community-based organisations and improving ties between local government and local populations.
BP and its co-venturers support to socio-economic development includes a diverse range of initiatives to support regional economic development; local community-based projects; environmental and cultural heritage programmes. BP reports a gross social spend in Azerbaijan, by BP and its co-venturers, of approximately US$39M between 2002 and 2008 (Table 7.6)11.
Table 7.6 BP / AIOC Social Spend, 2002 to 2008 (US$M)
2002 2003 2004 2005 2006 2007 2008 Total
Gross Social Spend
600,000 2,710,000 8,640,000 6,290,000 6,750,000 7,390,000 6,430,000 38,810,000
7.6.2 Local Content Development
Similarly, BP and its co-venturers set ambitious targets to increase the value of contracts placed with local companies. In 2008 BP on behalf of its co-venturers, spent US$128M directly with local Azerbaijani small and medium size enterprises, a 15% increase from 2007 (Table 7.7)12. Key areas of local content development include enterprise development and training and access to finance.
Table 7.7 Local Content Spend, 2006 to 2008 (US$M)
2006 2007 2008
Small & Medium-Sized Enterprises: 77 111 128
State-Owned Enterprises: 60 43 37
Joint Ventures: 520 450 408
Foreign Suppliers In-Country: 826 891 737
Total: 1,483 1,494 1,310
7.7 Economic Development
7.7.1 Overview
The European Bank for Reconstruction and Development has identified the following critical challenges to Azerbaijan’s economy:13
Improving the business environment through sustained anti-corruption measures, strengthening administrative capacity, enhancing the regulatory environment and the rule of law in order to create a level playing field conducive to further development of local private enterprises and attraction of foreign investment;
Developing the non-oil and gas sectors of the economy to ensure poverty alleviation and sustainable development throughout the country including rural areas and cities outside the capital through long-term economic policies and incentive schemes;
Further reforming and strengthening of the financial sector as an effective tool for channelling oil revenues into non-oil sectors and supporting diversification of the economy for sustainable future growth;
Restructuring of the public infrastructure sector and continued investments to improve efficiency and service standards in transport, telecommunications, electricity,
11 BP Azerbaijan Sustainability Reports, 2004-2007. 12 BP Azerbaijan Sustainability Reports, 2006-2007. 13 European Bank for Reconstruction and Development, 2007, Azerbaijan Strategy Overview

AIOC Chirag Oil Project Environmental & Socio-Economic Impact Assessment
Chapter 7: Socio-Economic Description
February 2010 7/8Final
gas, water, sewerage, waste treatment, as well as cleaning the heavily polluted environment; and
Maintaining the efficient long-term management of oil and gas revenues and ensuring macroeconomic stability through prudent monetary and fiscal expenditure policy to avoid excessive inflationary pressure and real exchange appreciation.
Between 1996 and 2000 trade, industry, transport and communications continued steadily to increase their contribution to GDP whereas agriculture declined by almost 30% over the same period. In 2002, the oil sector had accounted for 20% of GDP and over 50% of total industrial output whilst agriculture accounted for approximately 20% of production. In 2004, Azerbaijan was experiencing a sustained period of economic growth, with 2003 showing an 11.3% increase in GDP from the previous year. The key industries included oil and gas, steel, cement, chemicals and textiles.
Table 7.814 highlights rapid change in the macro-economy in the years since the ACG Phase 3 project including increase in GDP from US$8,680 in 2004 to US$29,399 in 2007; annual GDP growth rate of 25.60% in 2006 to 2007 and significant increases in industrial growth, salaries and personal income.
Table 7.8 Macroeconomic Data
2004 2005 2006 2007 2008
GDP (US$M): 8,680.4 13,238.7 20,983.0 29,399.9 46,258.2
GDP Per Capita (US$): 1,060.3 1,600.4 2,508.5 3,473.9 5,403.9
GDP Growth Rate (Real): 9.80% 26.40% 34.50% 25.60% 10.8
Real Industrial Growth: 5.70% 33.50% 36.60% 24.00% 6%
Real Salary Growth: 29.70% 24.30% 14.30% 44.80% 24.2%
Personal Income (US$): 995.8 1,205 1,507 2,089 2,852
Inflation (12-month): 10.40% 5.40% 11.40% 16.70% 20.8%
Cumulative net Foreign Direct Investment (FDI) from 1994 through 2000 was estimated at US$4.1B of which most went into the oil and gas sector. Inflows of FDI over subsequent years, in major investments such as the ACG, BTC, Shah Deniz and SCP projects, contributed to the 2003 FDI figure of circa US$3.0B. Foreign investment had improved logistics facilities for the oil industry, introduced mobile telephony, rehabilitated the construction materials industry and increased demand for modern commercial property and business services in Baku. In 2006, Azerbaijan’s economy received aggregated investments of US$6.7B (representing an annual growth rate of 14.8%) and US$7.97B in 2007 (17.8% annual growth). Foreign investment had however, made little impact on the non-oil sector, including agriculture that was central to the Azerbaijani economy. Continued state ownership of utilities also limited the level of direct foreign investment in this sector.
In the period since 2004, the country’s GDP growth rate accelerated to become the world’s highest, experiencing growth of 34.5% in 2006, 25.6% in 2007 and projected 18.2% in 2008. High levels of investment inflow caused the inflation rate to increase by 16.7% in 2007 and 20.8% in 2008 but the National Bank is now looking to peg the Manat to a basket of currencies rather than to the US dollar alone in order to strengthen the currency and to stimulate imports while maintaining downward pressure on domestic prices. Furthermore, the growth of real personal incomes is helping to counterbalance the negative consequences of increasing inflation.
14 State Statistical Committee, 2008. Social Economic Development (2008) State Statistical Committee, 2008, #12, p. 12.
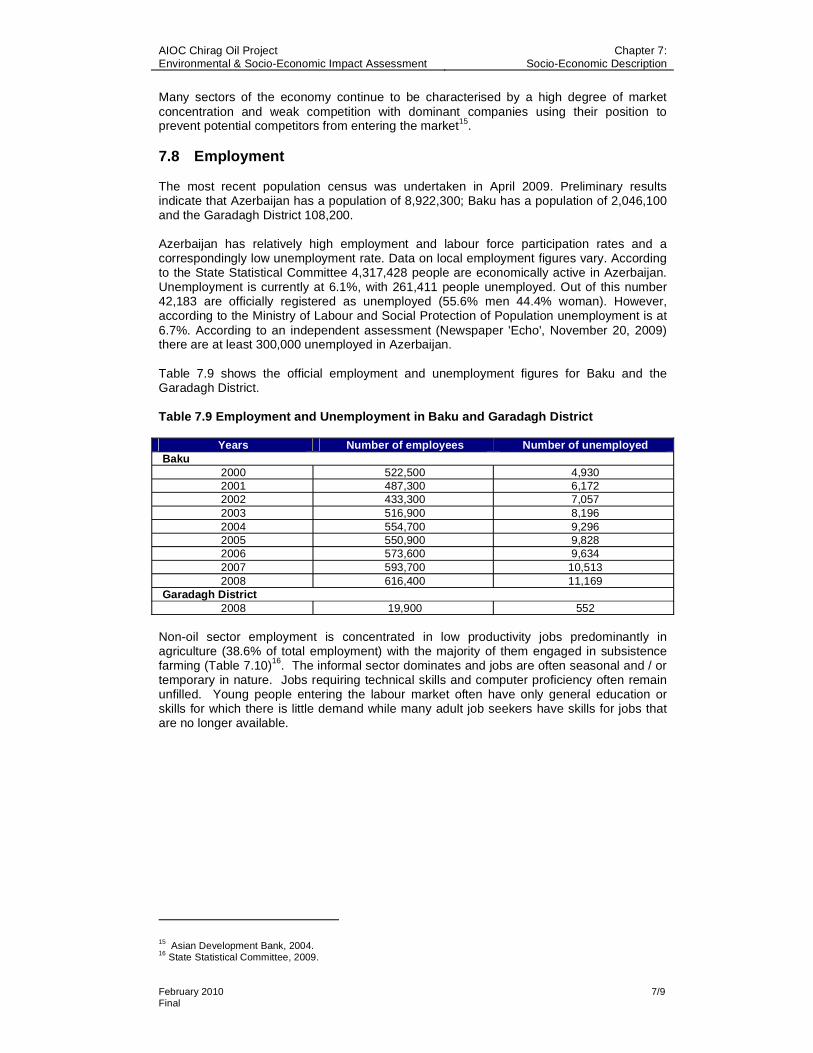
AIOC Chirag Oil Project Environmental & Socio-Economic Impact Assessment
Chapter 7: Socio-Economic Description
February 2010 7/9Final
Many sectors of the economy continue to be characterised by a high degree of market concentration and weak competition with dominant companies using their position to prevent potential competitors from entering the market15.
7.8 Employment
The most recent population census was undertaken in April 2009. Preliminary results indicate that Azerbaijan has a population of 8,922,300; Baku has a population of 2,046,100 and the Garadagh District 108,200.
Azerbaijan has relatively high employment and labour force participation rates and a correspondingly low unemployment rate. Data on local employment figures vary. According to the State Statistical Committee 4,317,428 people are economically active in Azerbaijan. Unemployment is currently at 6.1%, with 261,411 people unemployed. Out of this number 42,183 are officially registered as unemployed (55.6% men 44.4% woman). However, according to the Ministry of Labour and Social Protection of Population unemployment is at 6.7%. According to an independent assessment (Newspaper 'Echo', November 20, 2009) there are at least 300,000 unemployed in Azerbaijan.
Table 7.9 shows the official employment and unemployment figures for Baku and the Garadagh District.
Table 7.9 Employment and Unemployment in Baku and Garadagh District
Years Number of employees Number of unemployed Baku
2000 522,500 4,930 2001 487,300 6,172 2002 433,300 7,057 2003 516,900 8,196 2004 554,700 9,296 2005 550,900 9,828 2006 573,600 9,634 2007 593,700 10,513 2008 616,400 11,169
Garadagh District 2008 19,900 552
Non-oil sector employment is concentrated in low productivity jobs predominantly in agriculture (38.6% of total employment) with the majority of them engaged in subsistence farming (Table 7.10)16. The informal sector dominates and jobs are often seasonal and / or temporary in nature. Jobs requiring technical skills and computer proficiency often remain unfilled. Young people entering the labour market often have only general education or skills for which there is little demand while many adult job seekers have skills for jobs that are no longer available.
15 Asian Development Bank, 2004. 16 State Statistical Committee, 2009.

AIOC Chirag Oil Project Environmental & Socio-Economic Impact Assessment
Chapter 7: Socio-Economic Description
February 2010 7/10Final
Table 7.10 Employment by Sector, 2008
Sector ‘000 People Percent (%)
Agriculture, Hunting and Forestry: 1,553. 38.3% Fishing / Fish Breeding: 4.3 0.1%
Mining: 45.0 1.1% Manufacturing: 198.6 4.9% Energy and Water: 45.5 1.1%
Construction: 226.1 5.6%
Wholesale and Retail: 654.2 16.1% Hotels and Restaurants 23.3 0.6% Transport, Storage and Communications: 208.5 5.2%
Financial Services: 19.0 0.5% Real Estate: 139.4 3.4%
Public Administration: 274.2 6.8% Education: 345.7 8.5%
Health and Social Services: 183.1 4.5% Other: 135.4 3.3%
Total 4,056.0 100.0%
7.8.1 BP Projects Employment
BP projects (construction and operations) have had a significant impact on employment17.Total construction employment from combined projects peaked at approximately 5,500 workers in mid-2004 and for the ACG Phase 3 project, in 2006 at around 2,500 staff (onshore and offshore construction)18. Following completion of construction activities however, the decrease in employment opportunities has been particularly pronounced in the local communities that had benefited from the policy of employing local personnel wherever possible. Figure 7.1 illustrates the construction workforce for ACG Phase 1, 2 and 3, Shah Deniz (terminal only) and BTC (terminal only) projects.
Figure 7.1 BP Projects Construction Workforce, 2002 to 2007
17 BP Azerbaijan Sustainability Reports 2006 - 2007 18 As reported by the ACG Phase 1-3 construction contractors
-500
0
500
1000
1500
2000
2500
3000
3500
4000
4500
Phase I Phase II Phase III Shah Deniz (Terminal) BTC (Terminal)

AIOC Chirag Oil Project Environmental & Socio-Economic Impact Assessment
Chapter 7: Socio-Economic Description
February 2010 7/11Final
To maximise the positive impact from employment, the ACG Phase 1, 2 and 3, Sangachal Terminal and BTC construction projects adopted the following measures:
Targets: BP contractually committed to specific national content targets through each of the projects. By September 2003 85% of the construction workforce was Azerbaijani19;Preference in Recruitment: BP recruitment policy gave priority to local residents and by September 2003, 53% of the construction was from the Garadagh Region and in MacDermott’s construction workforce, residents from Primorsk / Sahil alone accounted for over 40% of all hourly-employed staff throughout the period; Information Centres: Local community information centres were established in Sangachal, Umid and Sahil to enable local people to register for employment and the Centres developed a database of approximately 18,000 potential employees by September 2003; and Training: Extensive training programmes were implemented both prior to and during employment of the construction workforce, focusing on HSE, language and computer skills, driving and certified courses including painting, electronics, slinging and lifting, scaffolding and pipe coating and welding. McDermott’s yard alone provided over 270,000 hours of HSE training; over 244,000 hours of craft training; and nearly 28,000 hours training in management, administration and computing skills. In the craft area, the yard provided 582 welders with an average of 300 hours training; 275 fitters an average of 80 hours craft training; and 258 riggers an average of 85 hours. Over 1,200 externally recognised qualifications were awarded to the yard’s workforce during the period.
It is understood that a majority of the workforce employed and trained in the ACG Phase 1, 2 and 3, Sangachal Terminal and BTC construction projects, are now employed elsewhere in Azerbaijan and abroad. Anecdotal evidence suggests that many have used their skills and experience to gain employment in State-run construction yards, in the Baku construction industry and in the oil and gas sector in Kazakhstan and elsewhere. While this represents a significant benefit in terms of increasing technical skills and experience within the Azerbaijan workforce, it also means that the COP construction may require recruitment and training of a substantially new workforce.
7.8.2 Local Trading Centres
Sadarak Trading Centre, located in the Garadag region, has a management and support staff in of total 111 full-time employees. The trading centre comprises 5,300 individual trading outlets/small stores, providing employment for approximately 11,000 people19.
A second trading centre (Bina) is located closely to the Sadarak Trading Centre, but administratively it belongs to the Nizami region. Administration of the Bina Trading Centre, however, may be soon transferred to the Garadag region. Construction of the Bina Centre, is still in progress and at the time of writing, 1,350 stores have been completed for commercial occupation and 32 people are employed within the centre’s administration. It is predicted that the outlets completed to date will provide employment opportunities for approximately 3,000 people with potentially more employment created once the centre is fully constructed and operational. It can be reasonably assumed that, given the Bina Trading Centre is very close to settlements in the Garadag region, many of the employees will originate from the Garadag settlements. However, no official registration to confirm this data exists and vendors are not required to register their location of domicile residence20.
19 Data provided by trading centre management. Employment estimate based on approximately 2 employees per store.

AIOC Chirag Oil Project Environmental & Socio-Economic Impact Assessment
Chapter 7: Socio-Economic Description
February 2010 7/12Final
7.9 Construction Yards
Two potential fabrication yards may be used for COP construction activities. Their locations are shown in Chapter 6, Figure 6.1.
The Baku Deepwater Jacket Factory (BDJF) Yard (formally the Shelfprojectsroi (SPS) Yard) was used for onshore construction, assembly and pre-commissioning during the ACG Phases 1, 2 and 3 projects. The yard lies approximately 20km south of Baku on the western coastline of the Caspian Sea. There is no informal / incidental use or occupancy of the land within the yard’s boundary. The Bibi Heybet (former Amec-Tekfen-Azfen (ATA)) Yard was used for platform topside onshore construction and pre-commissioning during the ACG Phases 1, 2 and 3 projects. The yard is located within the Bibi Heybet Oilfield approximately 8km to the south of Baku and is bound to the east and south by the Caspian Sea.
A Socio-Economic Baseline Study for the Bibi Heybet Yard was prepared in 2003. The survey identified 122 people living within 1.5km of the yard. A site reconnaissance visit undertaken in 2008 suggests that there are no longer any residential premises within close proximity to the yard.

AIOC Chirag Oil Project Environmental & Socio-Economic Impact Assessment
Chapter 8: Consultation and Disclosure
February 2010 8/1Final
8. Consultation and Disclosure
Contents
8.1. Introduction...................................................................................................................... 2 8.2 COP Consultations and Disclosure Process................................................................... 2
8.2.1 Overview.......................................................................................................... 2 8.2.2 Scoping, Consultation and Disclosure............................................................. 2
8.3. Draft Final ESIA Report Consultation.............................................................................. 6 8.4. Post-ESIA Project Consultations..................................................................................... 6 8.5. Consultation Under the Espoo Convention..................................................................... 6
List of Figures
Figure 8.1 COP ESIA Consultation and Disclosure Process 3
List of Tables
Table 8.1 Key Issues Raised During the COP ESIA Consultation Process 5

AIOC Chirag Oil Project Environmental & Socio-Economic Impact Assessment
Chapter 8: Consultation and Disclosure
February 2010 8/2Final
8.1. Introduction
Stakeholder consultation is a required and crucial element of the ESIA process. Soliciting, collating and documenting the opinions of potentially affected people and interested parties ensures that project design and the ESIA reflects the collective views of the stakeholder base.
The Early Oil Project (EOP) and ACG Phases 1, 2 and 3 ESIA have all been undertaken prior to the COP and have all included extensive stakeholder consultation. Consultation for the COP has built on the consultation framework and methods established during these earlier ACG projects. Lessons learnt from previous projects’ consultation have also guided the COP consultation programme.
8.2. COP Consultations and Disclosure Process
8.2.1 Overview
COP ESIA stakeholder consultation has:
Made use of the consultation framework and methods established for the earlier ACG and other BP projects in Azerbaijan;
Been developed with reference to accepted guidance on expectations of ESIA consultation and disclosure;
Considered the extent of consultation and disclosure already undertaken in recent years acknowledging the potential for stakeholder fatigue; and
Incorporated recommendations made from a ”lessons learned” review of earlier consultation programmes.
Figure 8.1 below illustrates the COP consultation and disclosure process. The COP Public Consultation and Disclosure Plan (PCDP) was initially drafted during the Scoping phase of the ESIA and has been continuously revised and updated at appropriate stages throughout the ESIA process. The PCDP also includes a summary of consultation and disclosure undertaken during earlier ACG phases for context.
8.2.2 Scoping, Consultation and Disclosure
ESIA Scoping phase consultation and disclosure included two workshops and one meeting with the MENR as well as internal consultation with existing offshore and onshore AzSPU operations teams. Consultation with the COP Design Team has also been completed during the preparation of the COP ESIA and during the Select stage of the BP Capital Value Process (CVP).

AIOC Chirag Oil Project Environmental & Socio-Economic Impact Assessment
Chapter 8: Consultation and Disclosure
February 2010 8/3Final
Figure 8.1 COP ESIA Consultation and Disclosure Process
Scoping
ESIAPreparation
Draft Final ESIA
Disclosure
Scoping MeetingsKey Organisations,
Individuals & Groups
Key Issues Identification
Meetings with Project Design &
AzSPU Teams
Input to ESIADraft Final Report
Presentation and Submission to MENR
Input to Final ESIA
MeetingsKey Organisations,
Individuals, Groups & Public
Dissemination of Final ESIA
Final ESIA

AIOC Chirag Oil Project Environmental & Socio-Economic Impact Assessment
Chapter 8: Consultation and Disclosure
February 2010 8/4Final
8.2.2.1 MENR Consultation
A meeting with the MENR was held in August 2008. The meeting outlined AIOC’s major project plans for the near future and included an overview of the COP and Shah Deniz Phase 2 (SDII) projects1, including schedule and key focus areas for the projects’ ESIA.
With regard to COP, the MENR requested the following:
Produced water forecasts and the method for determining these2; and Potential transboundary impacts given that Azerbaijan has ratified the 1991 Convention
on Environmental Impact Assessment in a Transboundary Context (i.e. the Espoo Convention)3.
Appendix 8A presents the minutes from this Scoping meeting.
8.2.2.2 Public Consultation
Two Scoping phase consultation workshops were undertaken in Baku as follows:
22 September 2008: COP ESIA Consultation Workshop for Scientists, Academics and NGO; and 23 September 2008: COP ESIA Consultation Workshops for the general public.
Academic and scientific institutions invited to the September 22 workshop included:
MENR; SOCAR; Baku State University; Caspian Environmental Programme; Gipromorneftegas Institute; State Oil Academy; Cabinet of Minister of the Azerbaijan Republic; Azerbaijan National Department of Hydrometeorology; and Azerbaijan National Academy of Sciences:
- Fishery Institute of the Azerbaijan Republic; - Institute of Zoology; - Institute of Geography; and - Institute of Agrochemistry.
NGO in attendance at the September 22 workshop included:
Ecograph; Sulh; Our House Common; Ecoscope; Sadr; and Azerbaijan Green Movement.
Attendees at this meeting were also invited to short presentations on Drilling, Offshore Production, Offshore Subsea Pipelines and the Sangachal Terminal.
The second consultation took the form of an open Public Meeting, which was advertised in advance in the local press.
1 Preliminary discussions were held with regard to the SD II project as the scope and schedule for the project has yet to be defined. 2 Refer to Chapter 11 Section 11.5.4 3 Refer to Chapter 13

AIOC Chirag Oil Project Environmental & Socio-Economic Impact Assessment
Chapter 8: Consultation and Disclosure
February 2010 8/5Final
All meetings began with a general presentation of the COP followed by a presentation of the ESIA process. Each workshop concluded with a Questions and Answers session.
Scoping meeting presentations, minutes and attendance sheets are presented in Appendix 8B.
8.2.2.3 Offshore and Onshore AzSPU Operations and COP Design Team Consultations
The scope of the COP ESIA has been informed by reviews of previous ACG ESIA undertaken in consultation with AzSPU offshore, terminal and logistic representatives. These consultations highlighted that certain project related activities that may result in impacts, have been overlooked in previous ACG ESIA, which in turn has highlighted the need to consider and, where possible, assess additional technical design options in the COP ESIA4.
8.2.2.4 ACG Research and Monitoring Group
A meeting with the ACG Research and Monitoring Group (RMG)5 on COP Scoping was held on 26 August 2008. At the meeting, the COP and ESIA work scope was presented and discussed. Issues raised by the RMG included:
Status of produced water disposal; Consideration of met ocean data in ESIA development studies; and Sewage treatment package performance.
8.2.2.5 Issues Raised During Scoping Consultation and Disclosure
Key issues raised during COP ESIA Scoping consultation are listed in Table 8.1 below. Those marked with an asterisk (*) were raised previously during the ACG Phases 1, 2 and/or 3 public consultation processes.
Table 8.1 Key Issues Raised During the COP ESIA Scoping Consultation Process
Concern Section(s) Addressed
Disposal of produced water as generated at the offshore platform and at the Terminal. (*)
5.8.45.9.311.5.4
Disposal of drilling muds, drill cuttings and completion fluids as generated at the offshore platform. (*)
5.7.511.5.2
Disposal of domestic waste and sewage as generated at the offshore platform (noting problems on existing platforms).
5.8.6.145.8.6.15
Disposal of hydrotest water from offshore pipelines. (*) 5.510.6.2
Standards that are applied for environmental monitoring of the Caspian. (*) 2.10Chapter 6
Monitoring of radioactivity associated with produced water used in the cement plant and with cuttings. (*) Note 1
Analysis of the geological layers/seismic activity levels at the offshore platform location.
4.2.2
Local community concerns about poor air quality - sooting of laundry and respiratory complaints.
9.310.311.3
1. An assessment of the potential for Naturally Occurring Radioactive material (NORM) to be generated from the ACG Field was conducted for the ACG Phase 3 ESIA. Based on the results of testing of a produced water sample from the Chirag A6 well, the assessment concluded that the potential for NORM to be generated was very low. In the event that it was found to occur in scale build-up in process equipment, management including treatment and disposal will be undertaken in accordance with BP procedures and protocols.
4 Refer to Chapter 3 Table 3.1 for a summary of lessons learnt and how they have been addressed for the COP5 Subsequently renamed the ACG&SD Environmental Monitoring Technical Advisory Group (MTAG)

AIOC Chirag Oil Project Environmental & Socio-Economic Impact Assessment
Chapter 8: Consultation and Disclosure
February 2010 8/6Final
8.3. Draft Final ESIA Report Consultation
As per the UNDP Handbook for EIA Process in Azerbaijan, the Draft Final ESIA report was submitted to the MENR and simultaneously released to public and stakeholder groups for comment. During the three-month review period, AIOC/BP held a public meeting and other relevant stakeholder meetings (Refer to Appendix 8C for meeting minutes).
Copies of the Draft Final ESIA Report, released in English, Russian and Azeri, was made publicly available at the following locations:
BP website; Aarhus Public Environmental Information Centre, Baku; Baku Information Education Centre; Public libraries in Sangachal and Sahil; BP Hyatt, Natavan and Villa Petrolea receptions, Baku; M.F.Akhundov State Library, Baku; and Scientific Library of the Academy of Sciences of Azerbaijan.
Comments received from the public, stakeholder groups and the MENR on the Draft Final ESIA report were collated, analysed and responses issued where relevant. The ESIA was subsequently revised and finalised for MENR approval.
8.4. Post-ESIA Project Consultations
There will be a need for ongoing consultation and disclosure during the construction and operational phases of the COP. This phase of consultation will build on the well-established consultation and disclosure process established for earlier ACG projects bearing in mind differences between the COP and these earlier phases (e.g. minimal change at the Sangachal Terminal resulting from the COP).
When the COP enters its operational phase, the consultation process will be re-evaluated to ensure that it is still appropriate and effective in terms of communicating information about the project and to the right audience.
8.5. Consultation Under the Espoo Convention
As a signatory to the Convention on Environmental Impact Assessment in a Transboundary context (i.e. the Espoo Convention), the Azerbaijan Government is obliged to provide early notification to countries that may be subject to transboundary impacts as a result of a development within Azerbaijan.
Potential transboundary impacts, including potential impacts in the event of a major oil spill (e.g. blow out), are evaluated in detail within Chapter 13 of this ESIA and will be discussed with the MENR as part of the ESIA disclosure process.

AIOC Chirag Oil Project Environmental & Socio-Economic Impact Assessment
Chapter 9: Predrill Environmental Impact Assessment, Mitigation and Monitoring
February 2010 9/1Final
9. Predrill Environmental Impact Assessment, Mitigation and Monitoring
Contents
9.1 Introduction........................................................................................................................39.2 Scoping Assessment .........................................................................................................39.3 Existing Controls, Monitoring and Reporting.....................................................................59.4 Impacts to the Atmosphere ...............................................................................................9
9.4.1 MODU Power Generation.....................................................................................99.4.2 MODU Well Test Flaring.....................................................................................119.4.3 Support Vessels .................................................................................................13
9.5 Impacts to the Marine Environment ................................................................................149.5.1 Underwater Noise & Vibration ............................................................................149.5.2 Drilling Discharges..............................................................................................179.5.3 Cement Discharges ............................................................................................239.5.4 Cooling Water Intake and Discharge..................................................................259.5.5 Other Discharges................................................................................................279.5.6 Seabed Disturbance...........................................................................................29
9.6 Summary of COP Predrill Phase Residual Environmental Impacts................................31
List of Figures
Figure 9.1 MODU Power Generation Predicted Long Term NO2 Concentrations 9 Figure 9.2 MODU Well Test Flaring Predicted Short Term NO2 Concentrations 12 Figure 9.3 Predicted Distances Within Which Fish and Seals React to Underwater Drilling and Vessel Noise 15 Figure 9.4 Barite Deposition Thickness Contour Plots (Discharge from 28”/26” Sections at 11m Depth - 20 Wells) 19
List of Tables
Table 9.1 Structure of COP Impact Assessment 3 Table 9.2 “Scoped Out” COP Predrill Routine and Non-routine Activities 4 Table 9.3 “Assessed” COP Predrill Routine and Non-routine Activities 5 Table 9.4 COP Predrill Existing Controls, Monitoring and Reporting 6 Table 9.5 Event Magnitude 10 Table 9.6 Human Receptor Sensitivity 10 Table 9.7 Biological / Ecological Receptor Sensitivity 11 Table 9.8 Impact Significance 11 Table 9.9 Event Magnitude 12 Table 9.10 Impact Significance 13 Table 9.11 Event Magnitude 13 Table 9.12 Impact Significance 14 Table 9.13 Event Magnitude 15 Table 9.14 Receptor Sensitivity (Seals and Fish) 16 Table 9.15 Impact Significance 16 Table 9.16 Summary of Maximum Extent From the Point of Discharge and Area Covered by Sediment Greater than 1mm Thick for the 36” Section (Seabed Discharge) and the 28”/26” Sections (11 m Depth Discharge) 18 Table 9.17 Seawater Sweeps and Water Based Mud Toxicity Tests (2007) 20 Table 9.18 Event Magnitude 20 Table 9.19 Receptor Sensitivity (Seals and Fish) 21 Table 9.20 Receptor Sensitivity (Zooplankton) 22 Table 9.21 Receptor Sensitivity (Phytoplankton) 22 Table 9.22 Receptor Sensitivity (Benthic Invertebrates) 23 Table 9.23 Impact Significance 23 Table 9.24 Event Magnitude 24

AIOC Chirag Oil Project Environmental & Socio-Economic Impact Assessment
Chapter 9: Predrill Environmental Impact Assessment, Mitigation and Monitoring
February 2010 9/2Final
Table 9.25 Receptor Sensitivity 24 Table 9.26 Impact Significance 24 Table 9.27 Event Magnitude 25 Table 9.28 Receptor Sensitivity (All Receptors) 26 Table 9.29 Impact Significance 26 Table 9.30 Event Magnitude 28 Table 9.31 Receptor Sensitivity (All Receptors) 28 Table 9.32 Impact Significance 29 Table 9.33 Event Magnitude 29 Table 9.34 Receptor Sensitivity (Benthic Invertebrates) 30 Table 9.35 Impact Significance 30 Table 9.36 Summary of Predrill Residual Environmental Impacts 31

AIOC Chirag Oil Project Environmental & Socio-Economic Impact Assessment
Chapter 9: Predrill Environmental Impact Assessment, Mitigation and Monitoring
February 2010 9/3Final
9.1 Introduction
For all phases of the Chirag Oil Project (COP), Activities and Events have been determined based on the COP Base Case as detailed within Chapter 5: Project Description; and the potential for Interactions with the environment identified.
In accordance with the impact assessment methodology (see Chapter 3), ESIA Scoping has been undertaken to identify selected Activities that may be “scoped out” from the full environmental impact assessment process based on Event Magnitude and the likely receptor Interaction. In addition, existing controls and mitigation have been identified. These include:
Existing operational procedures used to ensure that activities are consistent with environmental expectations; and
Feedback from existing operational and ambient monitoring of environmental performance and/or impacts.
Those Activities that have not been scoped out have been assessed on the basis of Event Magnitude and Receptor Sensitivity, taking into account the existing controls and mitigation, and impact significance determined. Monitoring and reporting undertaken to confirm that these controls are implemented and effective, as well as additional mitigation and monitoring to further minimise impacts, are provided.
Assessments of socio-economic, cumulative and transboundary impacts and accidental events have also been undertaken and are provided in Chapters 12, 13 and 14 respectively.
The structure of the impact assessment within this ESIA is provided within Table 9.1 below.
Table 9.1 Structure of COP Impact Assessment
Chapter COP Phase Content 9 Predrilling 10 Onshore Construction and
Commissioning of Offshore Facilities Infield Pipeline Installation, Tie-in and
Commissioning Platform Installation, Hook Up and
Commissioning11 Platform Drilling
Offshore Operations and Production Terminal
Scoping Assessment of COP Activities, Events and Interactions.
Identification of existing controls, mitigation, monitoring and reporting.
Environmental impact assessment of COP activities based on:
o Event Magnitude o Receptor Sensitivity
Identification of any additional mitigation measures.
12 All Phases Assessment of socio-economic impacts.13 All Phases Assessment of cumulative and transboundary impacts
(including impacts associated with greenhouse gas emissions) and impacts arising from accidental events (including oil spills and spill management).
14 All Phases Description of the COP Environmental and Social Management System including waste management plans and procedures.
9.2 Scoping Assessment
The COP predrill phase Activities and associated Events that have been scoped out due to their limited potential to result in discernable environmental impacts are presented in Table 9.2 (see Appendix 9A for all COP predrill Activities, Events and Interactions). The scoping process has used judgement based on prior experience of similar Activities and Events, especially with respect to earlier ACG developments. In some instances, scoping level quantification/numerical analysis has been used to justify the decision. Reference is made to relevant quantification, analysis, survey and/or monitoring reports in these instances.


AIOC Chirag Oil Project Environmental & Socio-Economic Impact Assessment
Chapter 9: Predrill Environmental Impact Assessment, Mitigation and Monitoring
February 2010 9/5Final
The COP routine and non-routine Activities and their associated Events assessed in accordance with the full impact assessment process are presented in Table 9.3.
Table 9.3 “Assessed” COP Predrill Routine and Non-routine Activities
ID COP Activity Ch. 5 Project
Description Reference
Event Receptor
Other discharges to sea
Underwater noise and vibration
Seabed disturbance
MarineEnvironment
Pre-R1 Tow out and positioning of Mobile Offshore Drilling Unit (MODU)
5.3.2.2
Emissions to atmosphere (non GHG)
Atmosphere
Other discharges to sea
Underwater noise and vibration
MarineEnvironment
Pre-R2 Vessel support including supply to MODU and backload to shore
5.3.3Table 5.9
Emissions to atmosphere (non GHG)
Atmosphere
Pre-R3 Drilling and plugging the Pilot Hole
5.3.2.3 Drilling discharges to sea
MarineEnvironment
Underwater noise and vibration
Pre-R4 Drilling with water based muds (WBM) (conductor and surface hole sections drilling)
5.3.2.4
Drilling discharges to sea
MarineEnvironment
Pre-NR5 Discharge of residual WBM
5.3.2.4 Drilling discharges to sea
MarineEnvironment
Pre-R6 Drilling with non WBM (lower hole section drilling)
5.3.2.4 Underwater noise and vibration
MarineEnvironment
Pre-R7 Cementingdischarges to seabed
5.3.2.5 Cement discharges to sea
MarineEnvironment
Pre-NR8 Excess cement discharge to seabed
5.3.2.5 Cement discharges to sea
MarineEnvironment
Pre-NR9 Well test flaring 5.3.2.8 Emissions to atmosphere (non GHG)
Atmosphere
Pre-R10 MODU power generation
5.3.3Table 5.9
Emissions to atmosphere (non GHG) Atmosphere
Water intake/entrainment
Pre-R11 MODU seawater lift and cooling discharge
5.3.3Table 5.9
Cooling water discharge to sea
MarineEnvironment
Pre-R12 MODU treated black water/grey water/drainage discharges
5.3.3Table 5.9
Other discharges to sea Marine
Environment
Other discharges to sea
Seabed disturbance Marine
EnvironmentPre-R14 MODU removal 5.3.2.2
Emissions to atmosphere (non GHG)
Atmosphere
Notes: GHG Emissions are addressed in Chapter 13. Suspension fluid discharges are not planned during the predrill programme but may be necessary for safety reasons (e.g. if hydrogen sulphide is encountered following lower hole drilling). Refer to Chapter 11 Section 11.5.4.
9.3 Existing Controls, Monitoring and Reporting
Existing control measures, monitoring and reporting requirements relevant to the COP predrill routine and non-routine Activities are provided in Table 9.4 and form part of the AzSPU HSSE Integrated Management System (Refer to Chapter 14 for further details).

ATMOSPHERE

MARINE ENVIRONMENT

MARINE ENVIRONMENT

AIOC Chirag Oil Project Environmental & Socio-Economic Impact Assessment
Chapter 9: Predrill Environmental Impact Assessment, Mitigation and Monitoring
February 2010 9/9Final
0 30 60km
Onshore annual average long term standard = 40µg/m3
9.4 Impacts to the Atmosphere
9.4.1 MODU Power Generation
9.4.1.1 Event Magnitude
MODU power demand and generation is discussed in Chapter 5: Project Description, Section 5.3.3. Table 5.10 presents the estimated volume of emissions due to the operation of the MODU power generators and includes emissions associated with operating the MODU engines during tow-out, positioning and subsequent demobilisation11.
Modelling undertaken for MODU power generation is presented in Appendix 11B. The modelling focuses on NOX (which comprises nitrous oxide (NO) and nitrogen dioxide (NO2)) as the main atmospheric pollutant of concern, based on the larger predicted emission volumes as compared to other pollutants (SOX, CO and non methane hydrocarbons) and the potential to impact upon human health and the environment.
Long term (annual average) NO2 concentrations were modelled to assess the contribution of emissions from MODU power generation in the context of the relevant standard for NO2
12.This standard is relevant to locations where humans are normally resident (i.e. onshore settlements) and do not apply to commercial locations and workers, which are subject to standards under separate occupational health requirements.
The modelling conservatively assumed that, for the long term, all NOX is converted to NO2
and a background NO2 concentration of 5.0µg/m3 was assumed based on previous monitoring data obtained along the Sangachal coastline (refer to Chapter 6: Section 6.4.2).
The results demonstrated that, during routine predrilling activities, long term concentrations of NO2 are predicted to increase by 0.5µg/m3 up to 9km from the MODU, reducing to background concentrations at a maximum distance of 30km to the south and approximately 35km to the north (see Figure 9.1).
Figure 9.1 MODU Power Generation Predicted Long Term NO2 Concentrations
11 Appendix 5A presents the assumptions and supporting data used to estimate the emissions. 12 Applicable annual average (long term) standard for NO2 is 40µg/m3.
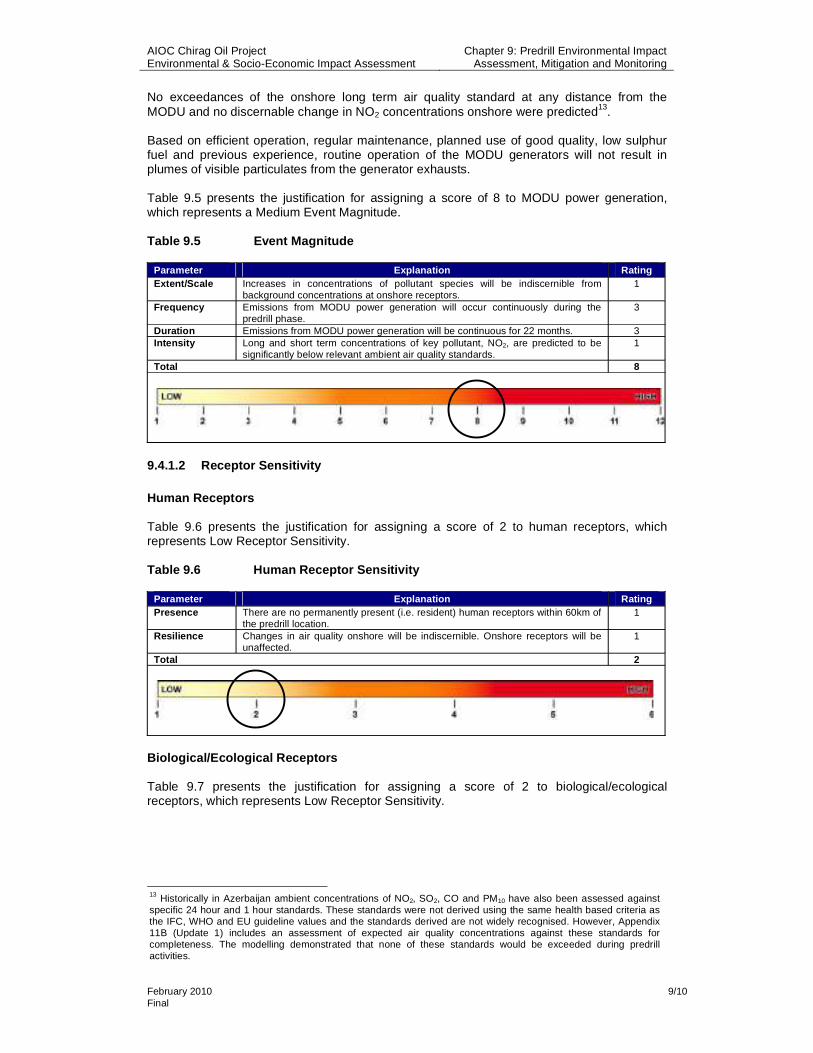
AIOC Chirag Oil Project Environmental & Socio-Economic Impact Assessment
Chapter 9: Predrill Environmental Impact Assessment, Mitigation and Monitoring
February 2010 9/10Final
No exceedances of the onshore long term air quality standard at any distance from the MODU and no discernable change in NO2 concentrations onshore were predicted13.
Based on efficient operation, regular maintenance, planned use of good quality, low sulphur fuel and previous experience, routine operation of the MODU generators will not result in plumes of visible particulates from the generator exhausts.
Table 9.5 presents the justification for assigning a score of 8 to MODU power generation, which represents a Medium Event Magnitude.
Table 9.5 Event Magnitude
Parameter Explanation Rating Extent/Scale Increases in concentrations of pollutant species will be indiscernible from
background concentrations at onshore receptors. 1
Frequency Emissions from MODU power generation will occur continuously during the predrill phase.
3
Duration Emissions from MODU power generation will be continuous for 22 months. 3 Intensity Long and short term concentrations of key pollutant, NO2, are predicted to be
significantly below relevant ambient air quality standards. 1
Total 8
9.4.1.2 Receptor Sensitivity
Human Receptors
Table 9.6 presents the justification for assigning a score of 2 to human receptors, which represents Low Receptor Sensitivity.
Table 9.6 Human Receptor Sensitivity
Parameter Explanation Rating Presence There are no permanently present (i.e. resident) human receptors within 60km of
the predrill location. 1
Resilience Changes in air quality onshore will be indiscernible. Onshore receptors will be unaffected.
1
Total 2
Biological/Ecological Receptors
Table 9.7 presents the justification for assigning a score of 2 to biological/ecological receptors, which represents Low Receptor Sensitivity.
13 Historically in Azerbaijan ambient concentrations of NO2, SO2, CO and PM10 have also been assessed against specific 24 hour and 1 hour standards. These standards were not derived using the same health based criteria as the IFC, WHO and EU guideline values and the standards derived are not widely recognised. However, Appendix 11B (Update 1) includes an assessment of expected air quality concentrations against these standards for completeness. The modelling demonstrated that none of these standards would be exceeded during predrill activities.

AIOC Chirag Oil Project Environmental & Socio-Economic Impact Assessment
Chapter 9: Predrill Environmental Impact Assessment, Mitigation and Monitoring
February 2010 9/11Final
Table 9.7 Biological/Ecological Receptor Sensitivity
Parameter Explanation Rating Presence Marine/bird species are mobile and will not be present at one location for long
periods of time. The Contract Area is not located within a bird migration flyover route. Birds found in the area will be transient and not resident.
1
Resilience Volume of emissions released (including visible particulates) will create a very small increase in pollutant concentrations in the atmosphere and in any washout from rainfall, which will not be discernable to biological / ecological receptors14.
1
Total 2
9.4.1.3 Impact Significance
Table 9.8 summarises impacts on air quality associated with MODU power generation during the predrill phase.
Table 9.8 Impact Significance
Event Event Magnitude
Receptor Sensitivity Impact Significance
(Humans) Low Minor Negative MODU Power Generation Medium (Biological/Ecological)
LowMinor Negative
It is considered that impacts are minimised as far as practicable and necessary through the implementation of the existing control measures (refer to Table 9.4) and no additional mitigation is required.
9.4.2 MODU Well Test Flaring
9.4.2.1 Event Magnitude
As stated within Chapter 5, Section 5.3.2.8, no routine well testing requiring flaring is planned during the predrill phase; well test flaring will be undertaken by exception only. As a worst case, up to 2 well tests may be undertaken with up to approximately 4,000 barrels of oil and approximately 360 tonnes of gas flared. Based on previous ACG experience, well test flaring would have a duration of approximately 2 days, depending on conditions encountered
Modelling undertaken for non routine MODU well test flaring is presented in Appendix 11B, focusing on key pollutant species, NO2. Short term (1 hour peak) NO2 concentrations were modelled to assess the contribution of emissions from well test flaring in the context of relevant standard for NO2
15. The modelling conservatively assumed that, for the short term, 50% of NOX is NO2 and 50% NO.
The results demonstrated that, during well test flaring, short term concentrations of NO2 are predicted to increase by 0.6µg/m3 20km from the MODU, reducing to background concentrations at a maximum distance of 175km to the north and south (see Figure 9.2).
14 Note that ambient air quality standards are not relevant to biological/ecological receptors. 15 Applicable 1 hour average (short term) standard for NO2 is 200µg/m3.

AIOC Chirag Oil Project Environmental & Socio-Economic Impact Assessment
Chapter 9: Predrill Environmental Impact Assessment, Mitigation and Monitoring
February 2010 9/12Final
Figure 9.2 MODU Well Test Flaring Predicted Short Term NO2 Concentrations
No exceedances of the onshore short term air quality standard at any distance from the MODU and no discernable change in NO2 concentrations onshore were predicted13.
Table 9.9 presents the justification for assigning a score of 5, which represents a Medium Event Magnitude.
Table 9.9 Event Magnitude
Parameter Explanation Rating Extent / Scale Increases in concentrations of pollutant species will be indiscernible from
background concentrations at onshore receptors. 1
Frequency Emissions will occur once. 1 Duration Emissions will continue for up to 2 days. 2 Intensity Short term concentrations of key pollutant, NO2, are predicted to be significantly
below relevant ambient air quality standards at the sensitive receptor locations. 1
Total 5
9.4.2.2 Receptor Sensitivity In terms of Emissions to Atmosphere, Receptor Sensitivity is considered to be the same as per Section 9.4.1.2 above; therefore Receptor Sensitivity is Low (2), for both human and biological/ecological receptors.
9.4.2.3 Impact Significance
Table 9.10 summarises impacts on air quality associated with well test flaring during the predrill phase.
Onshore peak 1 hour short term standard = 200µg/m3
0 30 60km

AIOC Chirag Oil Project Environmental & Socio-Economic Impact Assessment
Chapter 9: Predrill Environmental Impact Assessment, Mitigation and Monitoring
February 2010 9/13Final
Table 9.10 Impact Significance
Event Event Magnitude
Receptor Sensitivity Impact Significance
(Humans) Low Minor Negative Well Test Flaring Medium
(Biological/Ecological) Low Minor Negative
It is considered that impacts are minimised as far as practicable and necessary through the implementation of the existing control measures (refer to Table 9.4) and no additional mitigation is required.
9.4.3 Support Vessels
9.4.3.1 Event Magnitude
As stated within Chapter 5 Table 5.9, vessels will be required throughout the predrill phase to supply consumables (e.g. drilling mud, diesel) to the MODU and ship solid and liquid waste to shore for treatment and disposal. Up to 7 support vessels will be required per week16.
Emissions of the key pollutant species relevant to human health, NOx, are expected to be considerably lower from vessels (approximately 234 tonnes) than those anticipated from worst case WC-PDQ platform emissions for the same period (approximately 1,498 tonnes).
Emissions from vessel movements, which will occur across a relatively large geographic area, are expected to disperse rapidly and will result in increases in NO2 concentrations that will be indiscernible from background levels at onshore receptors.
Based on efficient operation, regular maintenance, planned use of good quality, low sulphur fuel and previous experience, routine operation of the support vessels will not result in plumes of visible particulates from the vessel engine exhausts.
Table 9.11 presents the justification for assigning a score of 8, which represents a Medium Event Magnitude.
Table 9.11 Event Magnitude
Parameter Explanation Rating Extent / Scale Increases in concentrations of pollutant species will be indiscernible from
background concentrations at onshore receptors. 1
Frequency Emissions will occur continuously throughout the predrill programme. 3Duration Emissions will continue throughout the predrill programme. 3 Intensity Long and short term concentrations of key pollutant, NO2, are predicted to be
significantly below relevant ambient air quality standards. 1
Total 8
9.4.3.2 Receptor Sensitivity
In terms of Emissions to Atmosphere, Receptor Sensitivity is considered to be the same regardless of the Event. As per Section 9.4.1.2 above, Receptor Sensitivity is Low (2) for both human and biological/ecological receptors.
16 Note that does not include crew change vessels. Refer to Table 9.2 above.

AIOC Chirag Oil Project Environmental & Socio-Economic Impact Assessment
Chapter 9: Predrill Environmental Impact Assessment, Mitigation and Monitoring
February 2010 9/14Final
9.4.3.3 Impact Significance
Table 9.12 summarises impacts on air quality associated with support vessels during the predrill phase.
Table 9.12 Impact Significance
Event Event Magnitude
Receptor Sensitivity Impact Significance
(Humans) Low Minor Negative Vessel Engines Medium
(Biological/Ecological) Low Minor Negative
It is considered that impacts are minimised as far as practicable and necessary through the implementation of the existing control measures (refer to Table 9.4) and no additional mitigation is required.
9.5 Impacts to the Marine Environment
9.5.1 Underwater Noise & Vibration
9.5.1.1 Event Magnitude
Underwater noise will result from drilling of the predrill wells and vessel movements and has the potential to impact biological/ecological receptors (specifically seals and fish) in the marine environment. An analysis of the propagation of underwater noise has been undertaken in order to estimate distances at which various acoustic impacts on marine species may occur.
As described within the assessment, presented in Appendix 11C, thresholds for fatality and physical injury to marine animals have been developed for different species through experiment based on impulsive sound pressure levels. Based on the data available, the assessment used a conservative approach, assuming the same threshold limits for both seals and fish.
Audiological and behavioural thresholds are a function of the noise level and sound frequency and vary for different species. Given that data does not exist for many species including Caspian specific species, a generic audiogram approach17 was adopted to develop representative audiological injury and behavioural thresholds for seals and fish (with and without swim bladders) based on proxy species.
The analysis showed that the source noise levels for vessel operations (190 dB re 1µPa at 1m) and drilling (170 dB re 1µPa at 1m) are below the levels at which lethal injury to fish and seals might occur (established as 240 dB re 1µPa), and at which direct physical injury might occur (established as 220 dB re 1µPa).
In terms of auditory injury, permanent deafness could arise in fish and seals if they remained within 8mof a vessel or the wellhead, for a period of 30 minutes or more. Temporary deafness could occur in fish and seals at distances up to 350m from the noise sources; again, only if the animals remained in the vicinity for a period of 30 minutes or more. In practice, it is deemed very unlikely that either of these conditions would be met.
In terms of behavioural reactions, the underwater assessment determined that noise generated by vessel operations would result in complete/strong avoidance by fish with swimbladders at distances up to 3m, and seals at ranges up to 5m and mild avoidance by both fish and seals up to 15m away (Figure 9.3). The range over which underwater noise remains audible to fish and seal depends on background noise levels. In the absence of site specific data two background noise levels were considered; a lower background noise level
17 Harland E. J., “Measuring Underwater Noise: Perils And Pitfalls”, Proceedings of the Institute of Acoustics, Vol 30, Pt 5, 2008.

AIOC Chirag Oil Project Environmental & Socio-Economic Impact Assessment
Chapter 9: Predrill Environmental Impact Assessment, Mitigation and Monitoring
February 2010 9/15Final
(approximately 80 dB re 1 µPa), characteristic of a deep sea environment dominated by environmental (i.e. wind, rain and wave) noise, and higher background noise level (approximately 120 dB re 1 µPa), characteristic of a marine location where vessels frequently pass and operational offshore drilling platforms are present. Under the lower background noise level scenario, it was calculated that vessel noise would be inaudible to fish with swimbladders and seals beyond 44km from the noise source. Under the higher background noise scenario, it was calculated that vessel and drilling noise would be inaudible beyond 1km.
Figure 9.3 Predicted Distances Within Which Fish and Seals React to Underwater Drilling and Vessel Noise18
Table 9.13 presents the justification for assigning a score of 8, which represents a Medium Event Magnitude.
Table 9.13 Event Magnitude
Parameter Explanation Rating Extent / Scale Underwater sound emissions are unlikely to result in an avoidance response
from fish/seals beyond 15m from the noise source. 1
Frequency Underwater sound emissions occur continuously during the predrill phase. 3 Duration Underwater sound emissions will last for more than one week (over the 22-
month predrill phase). 3
Intensity Taking into account concentration, accumulation and persistence of sound energy in the underwater environment, intensity is low.
1
Total 8
18 Refer to Appendix 11C for source data.
1
10
100
1000
10000
100000
0 1 2 3 4 5
Vessel (Sw im bladder fish)
Vessel (Seals)
Vessel (Non sw im bladder fish)
Drilling (Sw im bladder fish)
Drilling (Seals)
Drilling (Non sw im bladder fish)
Near complete avoidance
Strong avoidance
Mild avoidance
Threshold of audibility (lower
background noise)
Threshold of audibility (higher background noise) - seals and all fish

AIOC Chirag Oil Project Environmental & Socio-Economic Impact Assessment
Chapter 9: Predrill Environmental Impact Assessment, Mitigation and Monitoring
February 2010 9/16Final
9.5.1.2 Receptor Sensitivity
The only relevant biological receptors to underwater noise are seals and fish19.
Seals and Fish
Predrill activities including vessel movements will take place at the WC-PDQ platform location and along support vessel routes from the Logistics Supply Base located at the BDJF yard to the platform location.
Recent data indicates that endangered species such as seals and sturgeon are not common in the ACG Contract Area (Appendix 6B) and the WC-PDQ platform location is not located in an important breeding or migration area for either species. However, Kilka and Mullet are present in the Contract Area.
Table 9.14 presents the justification for assigning a score of 2, which represents Low Receptor Sensitivity.
Table 9.14 Receptor Sensitivity (Seals and Fish)
Parameter Explanation Rating Resilience Possibility that species may be temporarily affected by underwater drilling and
vessel noise but effect would be short term and limited and ecological functionality will be maintained.
1
Presence The fish most likely to be present for extended periods of time in the ACG Contract Area and at the WC-PDQ location are Kilka and Mullet throughout the year. However, neither the COP location nor the ACG Contract Area is exclusively used by these species and the Contract Area is not considered to be of primary importance.
1
Total 2
9.5.1.3 Impact Significance
Table 9.15 summarises impacts to seals and fish associated with drilling and vessel movements during the predrill phase.
Table 9.15 Impact Significance
Event Event Magnitude Receptor Sensitivity
Impact Significance
Drilling and vessel movements Medium (Seals & Fish) Low
Minor Negative
The assessment above demonstrates that a Minor Negative impact to seals and fish from drilling and vessel movements is predicted. This is considered to be a conservative assessment, as the modelling demonstrates that underwater sound emissions are unlikely to result in an avoidance response from fish/seals beyond 15m from the noise source. . It is considered that impacts are minimised as far as practicable and necessary through the implementation of the existing control measures (refer to Table 9.4) and no additional mitigation is required.
19 Plankton cannot sense the low frequency sound generated because the wavelength is longer than the organism and benthic invertebrates do not have sophisticated sound-sensing apparatus.

AIOC Chirag Oil Project Environmental & Socio-Economic Impact Assessment
Chapter 9: Predrill Environmental Impact Assessment, Mitigation and Monitoring
February 2010 9/17Final
9.5.2 Drilling Discharges
9.5.2.1 Event Magnitude
Drilling discharges during predrilling will result from the following:
Pilot Hole - Prior to commencing predrill template drilling, a pilot hole will be drilled with seawater depositing approximately 60m3 of cuttings within an area where subsequent cuttings from template drilling will also be deposited (see Chapter 5: Project Description, Section 5.3.2.4).
36” Conductor Hole - Following pilot hole drilling, the 36” conductor hole sections for up to a maximum of 20 predrill wells will be drilled with seawater with cuttings discharged directly from the holes to the seabed. The discharge from each conductor section will comprise about 230 tonnes of drilled subsurface material, 20 tonnes of bentonite (a clay) and seawater. As the discharge will occur at the seabed there will be limited dispersion of the drill cuttings.
28” Drilling Liner and 26” Surface Holes - Cuttings from the 28” and 26” hole sections will be discharged from the MODU below surface level. The cuttings will be passed through separation equipment to recover as much drilling mud as possible, but it is estimated that for each well approximately 340 tonnes of mud will be discharged associated with approximately 155 tonnes of cuttings. At the end of each 28”/26” section, a further 160 tonnes of mud may be discharged (see Chapter 5: Project Description, Section 5.3.2.4).
A maximum of 20 predrill wells are planned and the deposition of cuttings and mud discharged during the overall predrill programme has been modelled to assess the area and depth of distribution (Appendix 11D). As the drilling mud contains particles of barite, which are of much higher density than other mud and cuttings material, the deposition of barite has been modelled separately. This has the added benefit of allowing the estimated pattern of barite deposition to be directly compared with the results of environmental monitoring following completion of the drilling programme.
Predrill wells will be drilled sequentially over a 22-month period, with an interval of approximately 1 day between successive wells. Drilling of the 36” and the 28”/26” hole sections will take approximately 30 hours per well per section. The water column Events (i.e. cuttings settlement plumes) will therefore be discrete and separated by periods of 4 to 5 weeks, whilst the seabed Events (i.e. cuttings deposition) will be cumulative.
Monitoring around existing platforms has shown evidence of cuttings (e.g. elevated barium concentrations in sediments) at distances of up to 500m. The discharge modelling reinforces this observation. Table 9.16 indicates that, under stagnant current conditions (0.01 m/s), barite and cuttings will be deposited within 40m of the position of the caisson from the 36”, 28” and 26” sections. Under predominant current conditions (0.11 m/s), barite and fine cuttings from the 28”/26” sections will be deposited to a depth of >1mm up to 950m and up to 35m from the 36” sections.
Figure 9.4 indicates that the deposition depth of barite from all 20 of the 28” and 26” sections could, under conditions of constant current direction over the entire drilling programme, be approximately 3 - 4cm at a distance of 500m. Since the drilling programme will last 22 months, it is likely that the ‘plume’ visualised in Figure 9.4 will change direction with the current, resulting in thinner deposits spread radially in accordance with the currents prevailing during each 30-hour discharge period.

AIOC Chirag Oil Project Environmental & Socio-Economic Impact Assessment
Chapter 9: Predrill Environmental Impact Assessment, Mitigation and Monitoring
February 2010 9/18Final
Table 9.16 Summary of Maximum Extent From the Point of Discharge and Area Covered by Sediment Greater than 1mm Thick for the 36” Section (Seabed Discharge) and the 28”/26” Sections (11 m Depth Discharge)
Maximum distance (m) covered by the deposition thickness >1mm (one well) Current Conditions Barite Large Cuttings Small Cuttings
36” 28”/26” 36” 28”/26” 36” 28”/26”Predominant 14 660 21 19 16 0* Near Stagnant 15 26 21 19 17 22
Area (m2) covered by the deposition thickness >1mm (one well) Current Conditions Barite Large Cuttings Small Cuttings
36” 28”/26” 36” 28”/26” 36” 28”/26”Predominant 618 19,676 1,421 855 838 0* Near Stagnant 716 881 1,421 855 956 506
Maximum distance (m) covered by the deposition thickness >1mm (20 wells) **Current Conditions Barite Large Cuttings Small Cuttings
36” 28”/26” 36” 28”/26” 36” 28”/26”Predominant 27 950 34 32 30 835 Near Stagnant 28 38 34 32 31 33
Area (m2) covered by the deposition thickness >1mm (20 wells) **Current Conditions Barite Large Cuttings Small Cuttings
36” 28”/26” 36” 28”/26” 36” 28”/26”Predominant 2,474 59,768 3,940 2,627 2,975 29,579 Near Stagnant 2,675 2,633 3,940 2,627 3,186 1,782
* For the single well case, there is not enough material accumulated at the seabed to surpass the 1mm thickness threshold, and hence the area covered is zero. A large area of >1mm thickness is observed for both Barite and Small cuttings in the 20 well case, while a small or practically inexistent area is observed for the single well case. This is due to the settling behaviour being affected by the current conditions, physical properties of each deposited material (e.g. size and specific gravity), and the fact that it is being deposited from 11m below the sea level. The latter allows for a considerable amount of horizontal advection and diffusion (spreading) of the particles.** 36” hole modelling assumed 48 wells and therefore results presented are an overestimate

AIOC Chirag Oil Project Environmental & Socio-Economic Impact Assessment
Chapter 9: Predrill Environmental Impact Assessment, Mitigation and Monitoring
February 2010 9/19Final
Figure 9.4 Barite Deposition Thickness Contour Plots (Discharge from 28”/26” Sections at 11m Depth - 20 Wells)
C5 = DischargeLocation
C5 = DischargeLocation
b) Predominant Current Conditions
a) Near Stagnant Current Conditions

AIOC Chirag Oil Project Environmental & Socio-Economic Impact Assessment
Chapter 9: Predrill Environmental Impact Assessment, Mitigation and Monitoring
February 2010 9/20Final
Drilling discharges are assigned an intensity score of 1 for the following reasons:
A large proportion (approximately 50%) of the discharge consists of inert geological material (the cuttings);
The drilling fluid components are inert or of very low toxicity; Only the solid, inert components of the drilling mud will settle to the seabed. Low
toxicity soluble components, such as potassium chloride and minor additives, will dilute and disperse in the water column and will have neither acute or persistent effects;
Evidence from monitoring in the vicinity of drilling operations where WBM cuttings have been discharged shows that there is no accumulation of drilling chemicals and only a very small effect on the benthos within the 'footprint' of the discharge (up to 500m from the drilling location); and
The drilling fluids have been the subject of comprehensive testing and assessment and have been approved for use by the MENR for existing operations.
Toxicity tests were conducted on the proposed water-based mud formulations in 2007. The tests were carried out using Caspian zooplankton, phytoplankton and sediment-dwelling species, and assessed toxicity in the water column and sediment20. The results are summarised in Table 9.17, and indicate that all the WBM formulations were of very low toxicity.
Table 9.17 Seawater Sweeps and Water Based Mud Toxicity Tests (2007)
Water column Sediment Mud type Zooplankton 48h LC50
(mg/l) Phytoplankton 72h EC50
(mg/l) Amphipod 96h LC50
(mg/kg) Seawater sweeps (36” section)
>32000 >32000 >32000
KCl mud (28 and 26” sections)
>10000 >32000 >32000
Ultradril WBM (28 and 26” sections)
>32000 15591 >32000
Table 9.18 presents the justification for assigning a score of 6, which represents a Medium Event Magnitude.
Table 9.18 Event Magnitude
Parameter Explanation Rating Extent/Scale Monitoring has shown evidence of cuttings at distances of up to 500m for other
platforms.1
Frequency Discharges of WBM and associated cuttings will occur up to 40 times – once for each of the two well sections for each predrill well.
2
Duration Duration of each discharge event is approximately 30 hours. 2 Intensity Drilling discharges are considered to be of low intensity due to the composition
and evidence from post wells surveys of no accumulation of drilling chemicals and previous toxicity tests.
1
Total 6
20 The species tested were: Zooplankton: Calanipeda aquae dulcis; Phytoplankton: Chaetoceros tenuissimus andSediment: Pontogammarus maeoticus

AIOC Chirag Oil Project Environmental & Socio-Economic Impact Assessment
Chapter 9: Predrill Environmental Impact Assessment, Mitigation and Monitoring
February 2010 9/21Final
9.5.2.2 Receptor Sensitivity
Seals and Fish
Drilling discharges will intermittently generate turbid plumes of limited duration and dimension. These plumes will not however, generate chemical contamination of the water column and will not occupy a significant proportion of the local water column. It is anticipated that both fish and seals will avoid the plumes.
Recent data indicates that endangered species such as seals and sturgeon are not common in the ACG Contract Area (Appendix 6B) and that the WC-PDQ platform location is not located in an important breeding or migration area for either species. However, Kilka and Mullet are present in the Contract Area.
Table 9.19 presents the justification for assigning a score of 2, which represents Low Receptor Sensitivity.
Table 9.19 Receptor Sensitivity (Seals and Fish)
Parameter Explanation Rating Resilience Possibility that species may be temporarily affected by drilling discharges but
effect would be short term and limited and ecological functionality will be maintained.
1
Presence The most likely fish to be present for extended periods of time in the ACG Contract Area and the WC PDQ location are Kilka and Mullet throughout the year. However, neither the WC-PDQ location nor the ACG Contract Area is exclusively used by these species and the Contract Area is not considered to be of primary importance.
1
Total 2
Zooplankton
As for fish and seals, the principal potential interaction of drilling discharges with zooplankton is via the intermittent presence of short-duration turbidity plumes. Discharges from the MODU will normally take place at a depth of 11m, which is within the zooplankton productive zone present during spring, summer and early autumn. Cuttings will however, sink rapidly and will not impact a large volume of the productive zone. Unlike fish and seals, zooplankton cannot avoid turbidity plumes, but the dimension of the plume is sufficiently small that the “residence time” of individual organisms within the plume will be too short to cause significant harm.
In recent years, there has been a substantial impoverishment of zooplankton populations, to the extent that, within the Contract Area and across the wider region, the community appears to be permanently dominated by two alien species. Routine surveys across the Contract Area and the wider South Caspian region since 2004, have repeatedly confirmed the absence of native species of copepod. As discussed within Chapter 6: Environmental Description, with reference to detailed survey findings, changes in population and species presence are not considered to be associated with activities within the Contract Area such as drilling discharges, given that survey findings are equivalent across the wider region. None of the species currently present, or historically present, are rare or unique on a regional basis, and there are no observable regional variations across the Contract Area.
Zooplankton has high reproductive rates during spring, summer and autumn and localised populations tend to develop in patches in response to food availability. These patches then decline as local food resources are depleted. Consequently, zooplankton will be highly resilient to the effects of drilling discharges.

AIOC Chirag Oil Project Environmental & Socio-Economic Impact Assessment
Chapter 9: Predrill Environmental Impact Assessment, Mitigation and Monitoring
February 2010 9/22Final
Table 9.20 presents the justification for assigning a score of 2, which represents Low Receptor Sensitivity.
Table 9.20 Receptor Sensitivity (Zooplankton)
Parameter Explanation Rating Resilience Species or community unaffected or marginally affected. 1 Presence Species not rare or unique on a regional basis. Species are assessed at the
community level only. 1
Total 2
Phytoplankton
Phytoplankton populations across the Contract Area show seasonal variation in species dominance but are generally comprised of a small number of characteristic Caspian genera, mainly diatoms and chlorophytes. There is little spatial variation in overall species diversity within the Contract Area.
As with zooplankton, phytoplankton population development tends to be patchy. In areas where nutrient levels are temporarily high, growth will be rapid and dense patches can develop. The development of patches is limited both by local nutrient availability and by zooplankton grazing. Phytoplankton species are therefore well adapted to rapidly changing conditions.
Table 9.21 presents the justification for assigning a score of 2, which represents Low Receptor Sensitivity.
Table 9.21 Receptor Sensitivity (Phytoplankton)
Parameter Explanation Rating Resilience Species or community unaffected or marginally affected. 1 Presence Species not rare or unique on a regional basis. Little spatial variation in overall
species diversity. 1
Total 2
Benthic Invertebrates
The benthic invertebrate communities in the vicinity of the WC-PDQ platform location are very similar to those across the rest of the Contract Area and the Azerbaijan sector of the South Caspian. There are no rare, unique or endangered species present.
The benthic community is dominated by native amphipod, gastropod, polychaete and oligochaete species, most of which have the potential to reproduce several times a year. With the exception of some bivalves, the dominant taxa are deposit feeders which routinely construct burrows to a depth of 10 cm or more (this is why field surveys take samples to a depth of 10-15 cm). Deposit feeders routinely construct burrows to a depth of 10 cm or more (this is why field surveys take samples to a depth of 10-15 cm). These species are physiologically equipped to construct new burrows through cuttings material deposited in layers of at least similar depth to that which they routinely penetrate during normal burrowing activity. Routine platform monitoring studies undertaken as part of the IEMP provide support for the conclusion that burrowing species can penetrate deposited cuttings, by demonstrating the presence of such organisms in samples taken at locations where barite concentrations

AIOC Chirag Oil Project Environmental & Socio-Economic Impact Assessment
Chapter 9: Predrill Environmental Impact Assessment, Mitigation and Monitoring
February 2010 9/23Final
indicate the presence of significant amounts of cuttings. In addition the cuttings will be of a similar particle size to their natural sediment, and unlike filter feeders, deposit feeders will not suffer from the clogging of feeding appendages.
Table 9.22 presents the justification for assigning a score of 2, which represents Low Receptor Sensitivity.
Table 9.22 Receptor Sensitivity (Benthic Invertebrates)
Parameter Explanation Rating Resilience Species or community unaffected or marginally affected. 1 Presence No rare, unique or endangered species present. Species are assessed at the
community level only. 1
Total 2
9.5.2.3 Impact Significance
Table 9.23 summarises impacts to biological/ecological receptors associated with drilling discharges to sea during the predrill phase.
Table 9.23 Impact Significance
Based on the findings from the surveys as reported in detail within Chapter 6, very limited impact on benthic communities has been observed from existing drilling discharges from predrilling activities and operating platforms. It is considered that impacts are minimised as far as practicable and necessary through the implementation of the existing control measures (refer to Table 9.4) and no additional mitigation is required.
9.5.3 Cement Discharges
9.5.3.1 Event Magnitude
Cement discharge will occur routinely during the cementing of successive well casings. At most, this is estimated to amount to approximately 25 tonnes per well, of which approximately 12 tonnes would be cement, 8 tonnes would be barite, and the remainder would be low toxicity cementing chemicals. Approximately 0.7 tonnes of excess cement of the same composition may also discharged at the end of cementing each of the three well casings.Cementing is described in Chapter 5: Project Description, Section 5.3.2.5.
The event duration will be approximately one hour per casing, and therefore in total about 3 hours per well (although not continuous, since each section has to be drilled before being cemented). The cement is not expected to disperse (being designed to set in a marine environment) and will therefore set in-situ. It is not anticipated that there will be any chemical releases from the cement, which will be effectively chemically inert. The impact of cement discharge will therefore be limited to a small area immediately around the well.
Event Event Magnitude Receptor Sensitivity Impact Significance (Seals & Fish)
LowMinor Negative
(Zooplankton) Low
Minor Negative
(Phytoplankton) Low
Minor Negative Drilling Discharges to Sea Medium
(Benthic Invertebrates) Low
Minor Negative

AIOC Chirag Oil Project Environmental & Socio-Economic Impact Assessment
Chapter 9: Predrill Environmental Impact Assessment, Mitigation and Monitoring
February 2010 9/24Final
Table 9.24 presents the justification for assigning a score of 6, which represents a Medium Event Magnitude.
Table 9.24 Event Magnitude
Parameter Explanation Rating Extent / Scale
Cement will be deposited only within a few metres of the well. 1
Frequency Cement discharges will occur 3 times for each of the predrill wells. 3 Duration Each discharge event will last approximately 1 hour. 1 Intensity The cement comprises inert materials (cement and barite) and low toxicity
chemicals.1
Total 6
9.5.3.2 Receptor Sensitivity
Cement discharges will be confined to a small area of seabed immediately around each well and no chemical releases are anticipated. Consequently, the only biological receptor is the benthic invertebrate community.
Benthic Invertebrates
Table 9.25 presents the justification for assigning a score of 2, which represents Low Receptor Sensitivity.
Table 9.25 Receptor Sensitivity
Parameter Explanation Rating Resilience No rare, unique or endangered species at significant risk of exposure,
receptor confined to benthic community close to well. 1
Presence Toxicity and persistence of cement components is low, and cement will set rapidly. Effects will be limited to physical covering of small area of benthos.
1
Total 2
9.5.3.3 Impact Significance
Table 9.26 summarises impacts to benthic invertebrates associated with cement discharges during the predrill phase.
Table 9.26 Impact Significance
Event Event Magnitude Receptor Sensitivity
Impact Significance
Cement discharges Medium Low Minor Negative
The assessment has demonstrated that a Minor Negative impact to benthic invertebrates is predicted from cement discharges during the predrill phase. Cement chemicals are designed to be of low toxicity, chemically inert and to set in a marine environment. Therefore, only the seabed in the immediate vicinity of the wells will be affected. The Receptor Sensitivity of all marine organisms to cement discharges is considered to be low. It is considered that impacts are minimised as far as practicable and necessary through the implementation of the existing control measures (refer to Table 9.4) and no additional mitigation is required.

AIOC Chirag Oil Project Environmental & Socio-Economic Impact Assessment
Chapter 9: Predrill Environmental Impact Assessment, Mitigation and Monitoring
February 2010 9/25Final
9.5.4 Cooling Water Intake and Discharge
9.5.4.1 Event Magnitude
Cooling water will be lifted and discharged routinely during the 22-month predrill phase (refer to Chapter 5, Table 5.9). The intake/discharge rate may be up to 575m3 per hour corresponding to an average rate of approximately 78l/s. The cooling water will be dosed with biocide onboard the MODU and discharged water will contain a maximum concentration of 270µg/l of Biocide DA, which consists of long-chain diamines. The biocide is readily degradable (78% in standard 28-day OECD test) and will not persist in the environment. Toxicity to marine organisms has been measured and LC50 values for fish species are in the range of 1-2mg/l21
. Applying a conservative safety factor of 100 to the lower value, a no-effect concentration of approximately 10µg/l is estimated. The discharge would therefore require a dilution of 27-fold to reduce the biocide concentration to the conservative no-effect level. Since it is unlikely that any organism would remain permanently in the discharge plume, in practice it is expected that any potential effects would be mitigated at a lower level of dilution and therefore within a few metres of the point of discharge.
The seawater for cooling will be lifted from a depth of 9m and discharged via a caisson 1m above sea level. The intake is shallow and will therefore be at the same ambient temperature as the receiving water at all times of the year. The discharge temperature will be no more than 4-5oC above ambient temperature and would therefore be compliant with the requirement that temperature at the edge of the cooling water mixing zone, 100m from the point of discharge, to be no greater than 3oC more than the ambient water temperature. Since the dilution requirement to meet the temperature criterion is less than a factor of 2, it is expected that the requirement will be achieved within 4-5m of the point of discharge.
Table 9.27 presents the justification for assigning a score of 8, which represents a Medium Event Magnitude.
Table 9.27 Event Magnitude
Parameter Explanation Rating Extent/Scale Affects an area less than 500m from source. 1 Frequency Discharge will occur continuously through predrill. 3 Duration Drilling activities will last for the duration of the predrill phase (22 months). 3 Intensity Low intensity. 1Total 8
9.5.4.2 Receptor Sensitivity
Cooling water intake velocity will be low and screens installed on the cooling water intake will prevent fish entering the cooling water system. Plankton will however, be entrained due to their small size. The volume flow rate is however, small compared to the water volume in the immediate surroundings of the MODU.
As noted above in Section 9.5.4.1, the area and volume of water within which any potentially harmful exposure might occur, is limited to within a few metres from the point of discharge, meaning the discharge plume would be very small in size. The temperature gradient at the edge of the plume is likely to be reasonably abrupt, provoking an avoidance reaction in fish and seals (although the probability of encounter with the plume for either group is very low based on their expected presence and the plume dimensions).
21 Biocide DA MSDS.

AIOC Chirag Oil Project Environmental & Socio-Economic Impact Assessment
Chapter 9: Predrill Environmental Impact Assessment, Mitigation and Monitoring
February 2010 9/26Final
For all plankton, interaction with the plume depends on entrainment from the surrounding water and the process will ensure that individual plankton organisms do not remain in the plume for more than a few tens of seconds.
The cooling water discharge takes place at or immediately below the sea surface and therefore does not have the potential to interact with benthic invertebrates.
Table 9.28 presents the justification for assigning a score of 2, which represents Low Receptor Sensitivity.
Table 9.28 Receptor Sensitivity (All Receptors)
Parameter Explanation Rating Resilience Exposure is negligible, so resilience is in effect high. 1Presence No significant presence of rare, unique or endangered species. 1 Total 2
9.5.4.3 Impact Significance
Table 9.29 summarises the impact of cooling water discharges to sea on seals and fish, zooplankton and phytoplankton based on the impact significance criteria presented in Chapter 3: Impact Assessment Methodology.
Table 9.29 Impact Significance
The assessment has demonstrated that Minor Negative impacts to seals, fish, zooplankton and phytoplankton are predicted from cooling water intake and discharge during the predrill phase. Therefore, no additional mitigation beyond existing control measures (refer to Table 9.4) is deemed to be necessary.
Event Event Magnitude Receptor Sensitivity
Impact Significance
(Seals & Fish) Low
Minor Negative
(Zooplankton) Low
Minor Negative Cooling Water Discharges to Sea Medium
(Phytoplankton) Low
Minor Negative

AIOC Chirag Oil Project Environmental & Socio-Economic Impact Assessment
Chapter 9: Predrill Environmental Impact Assessment, Mitigation and Monitoring
February 2010 9/27Final
9.5.5 Other Discharges
9.5.5.1 Event Magnitude
Other discharges to sea as detailed within Chapter 5, Table 5.9 comprise:
Ballast Water – MODU ballasting activities will consist primarily of:
o Ballasting the drilling rig for transit to the drilling location – minimum draft configuration for towing, so it may involve near shore discharge of some ballast water if the vessel has been anchored close to shore prior to mobilisation;
o Taking on ballast water to increase the draft to the drilling configuration once on site;
o Occasional uptake and discharge of ballast water during drilling operations; and
o De-ballasting prior to demobilisation once drilling is completed.
The ballast tanks are designed to ensure that ballast water does not come into contact with oil or chemicals and the intake is screened to prevent fish entrainment. Ballasting is undertaken in accordance with existing ballast water management plans, which include measures designed to avoid introduction of nearshore species offshore and vice versa. Uptake and discharge are therefore anticipated to have negligible environmental impact.
Treated Black Water – Black water will be treated in accordance with MARPOL 73/78 Annex IV (as revised in 2004) and sludge shipped to shore. Based on 120 POB and an expected generation rate of 0.1m3/person/day, approximately 12m3 of treated effluent will be discharged per day during predrill. The flow rate is low, so the effluent will be rapidly diluted close to the point of discharge. The discharge of biologically treated black water offshore, including total suspended solids at the proposed treatment level, does not pose any risk of environmental impact.
Grey Water - Grey water (approximately 26m3 per day) will be discharged directly to sea. Grey water (from showers, laundry etc) will contain primarily dilute cleaning agents (soaps and detergents) and the impact of discharge will be minimal.
Drainage - Drainage including deck drainage and washwater) will be discharged via the open-drains system. Deck runoff including WBM spills collected via rig floor drains will be recycled to mud system or if not possible for technical reasons, diluted and discharged to sea (>60cm from sea surface) in accordance with applicable PSA requirements22. Oily water and bilge water will not be discharged, but contained on board the MODU and shipped to shore.
Event Magnitude is summarised in Table 9.30.
22 There shall be no discharge of drill cuttings or drilling fluids if the maximum chloride concentration of the drilling fluid system is greater than 4 times the ambient concentration of the receiving water.

AIOC Chirag Oil Project Environmental & Socio-Economic Impact Assessment
Chapter 9: Predrill Environmental Impact Assessment, Mitigation and Monitoring
February 2010 9/28Final
Table 9.30 Event Magnitude
9.5.5.2 Receptor Sensitivity
All of the discharges are low in volume, do not contain toxic or persistent process chemicals and are considered to pose no threat to the environment or the identified biological/ecological receptors.
Table 9.31 presents the justification for assigning a score of 2, which represents Low Receptor Sensitivity.
Table 9.31 Receptor Sensitivity (All Receptors)
Parameter Explanation Rating Resilience The extremely low level of exposure is equivalent to high resilience. 1 Presence There is no significant presence of rare, unique or endangered species (i.e. the
risk of exposure for any such species is close to zero). 1
Total 2
Event Parameter / Discharge Ballast Water Treated Black
Water Grey Water Drainage
Scale 1 1 1 1 Frequency 2 3 3 3 Duration 1 3 3 3 Intensity 1 1 1 1 Event Magnitude 5 8 8 8
Ballast Water:
Treated Black Water:
Grey Water:
Drainage:

AIOC Chirag Oil Project Environmental & Socio-Economic Impact Assessment
Chapter 9: Predrill Environmental Impact Assessment, Mitigation and Monitoring
February 2010 9/29Final
9.5.5.3 Impact Significance
Table 9.32 summarises the impact of other discharges to sea on seals and fish, zooplankton, phytoplankton and benthic invertebrates based on the impact significance criteria presented in Chapter 3: Impact Assessment Methodology.
Table 9.32 Impact Significance
It is considered that impacts are minimised as far as practicable and necessary through the implementation of the existing control measures (refer to Table 9.4) and no additional mitigation is required.
9.5.6 Seabed Disturbance
9.5.6.1 Event Magnitude
Positioning of the MODU will involve temporary disturbance of the seabed due to the anchoring of the drilling rig (Refer to Chapter 5, Section 5.3.2.2).
The area of seabed affected by the anchors and anchor chains is expected to be very small (approximately 12,800m2) in the context of the Contract Area. In practice, it is likely that the majority of organisms within this area would be sufficiently mobile to re-establish themselves in close vicinity to the anchor locations. The presence of the anchors will therefore, render a small area of seabed unavailable to benthic organisms for the duration of the predrill programme. However, this would have no measurable effect on local benthic productivity.
Table 9.33 presents the justification for assigning a score of 4, which represents a Low Event Magnitude.
Table 9.33 Event Magnitude
Parameter Explanation Rating Extent/Scale
Disturbance will be limited to areas of anchor setting. 1
Frequency Once. 1Duration Disturbance event will be of short duration. 1 Intensity Physical disturbance only, within small areas and no potential for lasting damage. 1 Total 4
9.5.6.2 Receptor Sensitivity
Fish, seals and plankton are not considered to be sensitive to physical seabed disturbance of this type and magnitude. Benthic invertebrates are the primary receptor, but the nature of the disturbance is largely limited to temporary physical displacement.
Event Event Magnitude Receptor Sensitivity
Impact Significance
Other Discharges to Sea Ballast Water
Medium (All Receptors) Low
Minor Negative
Other Discharges to Sea Treated Black Water
Medium (All Receptors) Low
Minor Negative
Other Discharges to Sea Grey Water
Medium (All Receptors) Low
Minor Negative
Other Discharges to Sea Drainage
Medium (All Receptors) Low
Minor Negative

AIOC Chirag Oil Project Environmental & Socio-Economic Impact Assessment
Chapter 9: Predrill Environmental Impact Assessment, Mitigation and Monitoring
February 2010 9/30Final
The primary impact associated with anchor setting and chain drag will be the disturbance and displacement of the sediment. The organisms living in the sediment are too small to be crushed by anchor and chain drag, although a small degree of mortality might occur at the point where the anchor initially impacts the seabed.
The displacement of sediment will not cause significant levels of mortality in benthic organisms. A small proportion of animals may be buried too deeply to recover to a position near the sediment surface, but the majority of organisms will be able to re-establish themselves once the anchors and chains have been removed.
Table 9.34 presents benthic invertebrates’ Receptor Sensitivity.
Table 9.34 Receptor Sensitivity (Benthic Invertebrates)
Parameter Explanation Rating Presence No unique, rare or threatened benthos species present. 1 Resilience Physical displacement of organisms will have limited short-term effects and is not
predicted to cause significant long-term damage. 1
Total 2
9.5.6.3 Impact Significance
Table 9.35 summarises the impact of seabed disturbance associated with predrill activities to benthic invertebrates based on the impact significance criteria presented in Chapter 3: Impact Assessment Methodology.
Table 9.35 Impact Significance
Event Event Magnitude Receptor Sensitivity
Impact Significance
Seabed disturbance from anchor handling
Low Low Negligible
It is considered that impacts are minimised as far as practicable and necessary and no mitigation is required.

AIOC Chirag Oil Project Environmental & Socio-Economic Impact Assessment
Chapter 9: Predrill Environmental Impact Assessment, Mitigation and Monitoring
February 2010 9/31Final
9.6 Summary of COP Predrill Phase Residual Environmental Impacts
For all predrill phase environmental impacts assessed, it has been concluded that impacts are minimised as far as practicable and necessary through the implementation of the existing control measures (see Table 9.4) and no additional mitigation is required.
Table 9.36 summarises the residual environmental impacts for the predrill phase of the project.
Table 9.36 Summary of Predrill Residual Environmental Impacts
Event Event Magnitude
Receptor Sensitivity
Impact Significance
Emissions from mobile drilling rig power generation Medium Low Minor Negative
Emissions from well test flaring Medium Low Minor Negative
Emissions from support vessel engines Medium Low Minor Negative
Underwater noise from drilling and vessel movements
Medium Low Minor Negative
Drilling discharges Medium Low Minor Negative
Cement discharges Medium Low Minor Negative
Vessel and drilling rig cooling water discharge Medium Low Minor Negative
Vessel and drilling rig ballast water discharge Medium Low Minor Negative
Vessel and drilling rig treated black water discharge Medium Low Minor Negative
Vessel and drilling rig grey water discharge Medium Low Minor Negative
Vessel and drilling rig drainage discharges Medium Low Minor Negative
Seabed disturbance from anchor handling Low Low Negligible

AIOC Chirag Oil Project Environmental & Socio-Economic Impact Assessment
Chapter 10: Construction, Installation and HUC Environmental Impact Assessment,
Mitigation and Monitoring
February 2010 10/1Final
10. Construction, Installation, Hook-Up & Commissioning Impact Assessment, Mitigation and Monitoring
Contents
10.1 Introduction........................................................................................................................310.2 Scoping Assessment.........................................................................................................310.3 Existing Controls, Monitoring and Reporting.....................................................................710.4 Impacts to the Atmosphere .............................................................................................12
10.4.1 Construction Yard Emission Sources.................................................................1210.4.2 Onshore Platform Generator Commissioning ....................................................1510.4.3 Jacket and Pipeline Installation Vessels ............................................................17
10.5 Impacts to the Terrestrial Environment Associated with Onshore Noise........................1910.5.1 Construction Yard Plant......................................................................................1910.5.2 Onshore Platform Generator Commissioning ....................................................22
10.6 Impacts to the Marine Environment ................................................................................2410.6.1 Construction Yard Cooling Water Discharge......................................................2410.6.2 Pipeline Cleaning and Hydrotest Discharge.......................................................2610.6.3 Cement Discharges............................................................................................3110.6.4 Underwater Noise and Vibration ........................................................................3210.6.5 Seabed Disturbance...........................................................................................3510.6.6 Other Discharges................................................................................................37
10.7 Summary of COP Construction, Installation and HUC Residual Environmental Impacts40
List of Figures
Figure 10.1 Maximum Short Term Ground Level Increase in NO2 Concentration (µg/m3) At Distance from Centre of Yard (High Wind Speed Conditions) 13 Figure 10.2 Maximum Short Term Ground Level NO2 Concentration (µg/m3) at Distance from Source (High Wind Speed Conditions) 16 Figure 10.3 Predicted Noise Levels from Plant/Machinery at the Construction Yard 20 Figure 10.4 Predicted Noise Level Associated with Onshore Platform Generator Commissioning 22 Figure 10.5 Predicted Cooling Water Plume Temperature Above Ambient at Distance from Discharge 24 Figure 10.6 Plume Dimensions for Discharge of 1,200 m3 ‘Fresh’ Hydrotest Water Under Stagnant and Predominant Current Conditions 27 Figure 10.7 Plume Dimensions for Discharge of 7,000m3 Degraded Hydrotest Water 27 Figure 10.8 Relationship Between Produced Water Toxicity (LC50 expressed as % Dilution in Caspian Seawater) and Total Hydrocarbon Concentration 28 Figure 10.9 Predicted Distances Within Which Fish and Seals React to Underwater Piling and Vessel Noise 33
List of Tables
Table 10.1 “Scoped Out” COP Construction, Hook Up and Commissioning Routine and Non- routine Activities 4 Table 10.2 “Assessed” COP Construction, Installation, Hook Up and Commissioning Routine and Non-routine Activities & Interactions 7 Table 10.3 COP Construction, Installation and HUC Existing Controls, Monitoring and Reporting 8 Table 10.4 Event Magnitude 13 Table 10.5 Human Receptor Sensitivity 14 Table 10.6 Biological/Ecological Receptor Sensitivity 14 Table 10.7 Impact Significance 15 Table 10.8 Maximum Short Term NO2 Concentrations Under High, Low and Typical Wind Conditions (Platform Generator Emissions) 15

AIOC Chirag Oil Project Environmental & Socio-Economic Impact Assessment
Chapter 10: Construction, Installation and HUC Environmental Impact Assessment,
Mitigation and Monitoring
February 2010 10/2Final
Table 10.9 Event Magnitude 16 Table 10.10 Impact Significance 17 Table 10.11 Event Magnitude 18 Table 10.12 Human Receptor Sensitivity 18 Table 10.13 Biological/Ecological Receptor Sensitivity 18 Table 10.14 Impact Significance 19 Table 10.15 Event Magnitude 20 Table 10.16 Human Receptor Sensitivity 21 Table 10.17 Biological/Ecological Receptor Sensitivity 21 Table 10.18 Impact Significance 21 Table 10.19 Event Magnitude 23 Table 10.20 Impact Significance 23 Table 10.21 Event Magnitude 25 Table 10.22 Receptor Sensitivity 25 Table 10.23 Impact Significance 26 Table 10.24 Event Magnitude 29 Table 10.25 Receptor Sensitivity 29 Table 10.26 Impact Significance 30 Table 10.27 Event Magnitude 31 Table 10.28 Receptor Sensitivity 31 Table 10.29 Impact Significance 32 Table 10.30 Event Magnitude (Piling) 33 Table 10.31 Event Magnitude (Vessels) 34 Table 10.32 Receptor Sensitivity 34 Table 10.33 Impact Significance 35 Table 10.34 Event Magnitude 35 Table 10.35 Receptor Sensitivity 36 Table 10.36 Impact Significance 36 Table 10.37 Event Magnitude 38 Table 10.38 Receptor Sensitivity (All Receptors) 39 Table 10.39 Impact Significance 39 Table 10.40 Summary of Construction, Installation and HUC Residual Environmental Impacts 40

AIOC Chirag Oil Project Environmental & Socio-Economic Impact Assessment
Chapter 10: Construction, Installation and HUC Environmental Impact Assessment,
Mitigation and Monitoring
February 2010 10/3Final
10.1 Introduction
This Chapter of the Chirag Oil Project (COP) Environmental and Socio-Economic Impact Assessment (ESIA) presents the assessment of environmental impacts associated with the following COP phases:
Onshore Construction and Commissioning of Offshore Facilities; Infield Pipeline Installation, Tie-in and Commissioning; and Platform Installation, Hook Up and Commissioning (HUC).
The impact assessment methodology followed and the structure of the COP impact assessment are described in full within Chapters 3 and 9 of this ESIA respectively.
10.2 Scoping Assessment
The COP Construction, Installation and HUC Activities and Events have been determined based on the COP Base Case, as detailed within Chapter 5: Project Description (see Appendix 10A).
Table 10.1 presents the Activities and associated Events that have been scoped out of the full assessment process due to their limited potential to result in discernable environmental impacts. Judgement is based on prior experience of similar Activities and Events, especially with respect to earlier ACG developments. In some instances, scoping level quantification/numerical analysis has been used to justify the decision. Reference is made to relevant quantification, analysis, survey and/or monitoring reports in these instances.


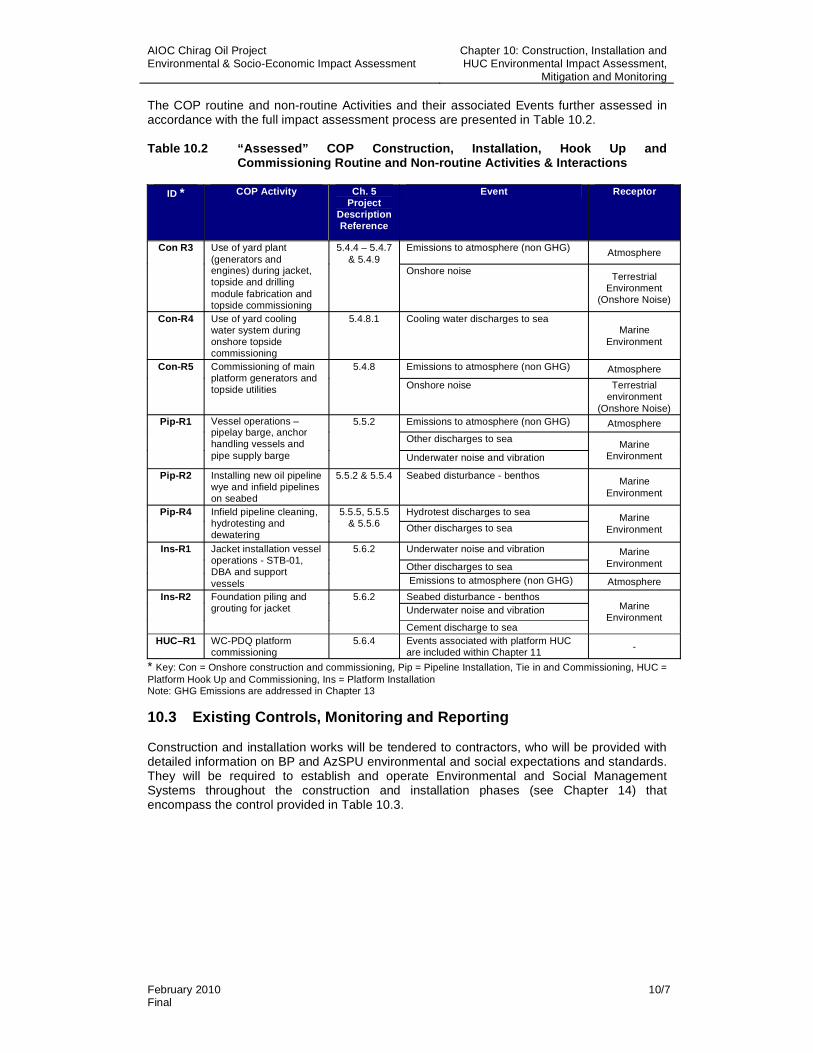
AIOC Chirag Oil Project Environmental & Socio-Economic Impact Assessment
Chapter 10: Construction, Installation and HUC Environmental Impact Assessment,
Mitigation and Monitoring
February 2010 10/7Final
The COP routine and non-routine Activities and their associated Events further assessed in accordance with the full impact assessment process are presented in Table 10.2.
Table 10.2 “Assessed” COP Construction, Installation, Hook Up and Commissioning Routine and Non-routine Activities & Interactions
* Key: Con = Onshore construction and commissioning, Pip = Pipeline Installation, Tie in and Commissioning, HUC = Platform Hook Up and Commissioning, Ins = Platform Installation Note: GHG Emissions are addressed in Chapter 13
10.3 Existing Controls, Monitoring and Reporting
Construction and installation works will be tendered to contractors, who will be provided with detailed information on BP and AzSPU environmental and social expectations and standards. They will be required to establish and operate Environmental and Social Management Systems throughout the construction and installation phases (see Chapter 14) that encompass the control provided in Table 10.3.
ID * COP Activity Ch. 5 Project
Description Reference
Event Receptor
Emissions to atmosphere (non GHG) AtmosphereCon R3 Use of yard plant (generators and engines) during jacket, topside and drilling module fabrication and topside commissioning
5.4.4 – 5.4.7 & 5.4.9
Onshore noise Terrestrial
Environment(Onshore Noise)
Con-R4 Use of yard cooling water system during onshore topside commissioning
5.4.8.1 Cooling water discharges to sea Marine
Environment
Emissions to atmosphere (non GHG) AtmosphereCon-R5 Commissioning of main platform generators and topside utilities
5.4.8
Onshore noise Terrestrial environment
(Onshore Noise) Emissions to atmosphere (non GHG) Atmosphere
Other discharges to sea
Pip-R1 Vessel operations – pipelay barge, anchor handling vessels and pipe supply barge
5.5.2
Underwater noise and vibration Marine
Environment
Pip-R2 Installing new oil pipeline wye and infield pipelines on seabed
5.5.2 & 5.5.4 Seabed disturbance - benthos Marine
Environment
Hydrotest discharges to sea Pip-R4 Infield pipeline cleaning, hydrotesting and dewatering
5.5.5, 5.5.5 & 5.5.6 Other discharges to sea
MarineEnvironment
Underwater noise and vibration
Other discharges to sea
MarineEnvironment
Ins-R1 Jacket installation vessel operations - STB-01, DBA and support vessels
5.6.2
Emissions to atmosphere (non GHG) Atmosphere
Seabed disturbance - benthos Underwater noise and vibration
Ins-R2 Foundation piling and grouting for jacket
5.6.2
Cement discharge to sea
MarineEnvironment
HUC–R1 WC-PDQ platform commissioning
5.6.4 Events associated with platform HUC are included within Chapter 11
-

ATMOSPHERE

TERRESTRIAL NOISE ENVIRONMENT MARINE ENVIRONMENT MARINEENVIRONM

MARINE ENVIRONMENT


AIOC Chirag Oil Project Environmental & Socio-Economic Impact Assessment
Chapter 10: Construction, Installation and HUC Environmental Impact Assessment,
Mitigation and Monitoring
February 2010 10/12Final
10.4 Impacts to the Atmosphere
10.4.1 Construction Yard Emission Sources
10.4.1.1 Event Magnitude
As stated within Chapter 5: Section 5.4, the WC-PDQ topside, jacket and drilling module will be constructed at a combination of established construction yards. At present, the options that are being considered for the construction and commissioning of the WC-PDQ topside and drilling support module include:
BDJF yard; Zykh yard; and Bibi Heybet/South Dock yards15.
It is intended that the WC-PDQ jacket will be constructed at the BDJF yard.
At each yard, the majority of power required for construction activities such as steel cutting, rolling and shaping will be provided from the Azerbaijan national grid. Onsite plant and equipment used including cranes, generators and vehicles, will consume diesel and gasoline resulting in emissions to atmosphere (refer to Appendix 5A).
A dispersion modelling assessment was undertaken to assess the potential magnitude of impacts from onshore construction phase emissions to any nearby receptors (see Appendix 10C). The assessment was based on an estimated diesel consumption by construction yard plant of 8.5 tonnes per day (sourced from records from previous ACG projects) and assumed plant was distributed evenly across the construction yard. The assessment considered NO2
emissions, comparing the short term and long term average modelled concentrations at ground level to applicable air quality standards for the protection of human health16. Modelling of SO2 and particulates was not deemed necessary as concentrations are expected to be very low based on efficient plant operation, regular maintenance and planned use of good quality, low sulphur diesel.
Wind conditions were determined from recent data available from the meteorological station at Baku and typical, high and low speed wind conditions were assessed. To assess a realistic worst case, emissions were modelled based on topside and drilling module construction being undertaken simultaneously at the same yard17.
The background concentration of NO2 (15µg/m3) was determined from the air quality assessment undertaken in the vicinity of Sangachal (refer to Chapter 6: Section 6.4.2).
The modelling demonstrated that construction plant emissions are predicted to result in a maximum short term ground level NO2 concentration of 17.5µg/m3 125m from the centre of the yard, extending up to a distance of 230m away. This reduces to 16.5µg/m3 at 275m and returns to background concentrations at distances over 420m under high wind speeds (15 m/s) (Figure 10.1).
There is predicted to be no increase in short term NO2 concentrations beyond a distance of 200m from the centre of the yard for low wind speeds (1m/s); and 280m for medium wind speeds (5m/s).
15 The Bibi Heybet yard will be operated by Amec-Tekfen-Azfen (ATA) and the South Dock yard will be operated by the Caspian Shipyard Company (CSC). 16 Applicable 1 hour average (short term) and annual average (long term) standards for NO2 are 200µg/m3 and 40µg/m3 respectively. 17 This is an overestimate of emissions from the South Dock yard, as these activities will not occur simultaneously.

AIOC Chirag Oil Project Environmental & Socio-Economic Impact Assessment
Chapter 10: Construction, Installation and HUC Environmental Impact Assessment,
Mitigation and Monitoring
February 2010 10/13Final
Figure 10.1 Maximum Short Term Ground Level Increase in NO2 Concentration (µg/m3) At Distance from Centre of Yard (High Wind Speed Conditions)
Construction yard plant emissions are predicted to contribute approximately 1.5µg/m3 to long term average concentrations of NO2 at 125m from the centre of the yard, returning to background levels at 420m.
Under all conditions assessed, the modelling predicted no exceedances of ambient air quality standards in the vicinity of the yards and no discernable increase in short term or long term concentrations of NO2 more than 420m from the centre of the yard18.
Table 10.4 presents the justification for assigning a score of 8, which represents a Medium Event Magnitude.
Table 10.4 Event Magnitude
Parameter Explanation Rating Extent/Scale Emissions will not affect ambient air quality more than 500m from centre of the
yard (based on worst case modelling). 1
Frequency Emissions will occur continuously. 3 Duration Emissions will continue throughout the construction period. 3 Intensity Modelled long and short term concentrations of key pollutant, NO2, are predicted
to be significantly below relevant ambient air quality standards. 1
Total 8
18 Historically in Azerbaijan ambient concentrations of NO2, SO2, CO and PM10 have also been assessed against specific 24 hour and 1 hour standards. These standards were not derived using the same health based criteria as the IFC, WHO and EU guideline values and the standards derived are not widely recognised. Appendix 10C, however, does show that the historic standards (provided in Appendix 11B Update 1) will not be exceeded during onshoreconstruction and commissioning operations.
Metres from source
Modelled concentration (µg/m3)
15-15.5
15.5 -16
16 -16.5
16.5 -17
17 –17.5
15
Centre of Yard
Short term limit = 200µg/m3

AIOC Chirag Oil Project Environmental & Socio-Economic Impact Assessment
Chapter 10: Construction, Installation and HUC Environmental Impact Assessment,
Mitigation and Monitoring
February 2010 10/14Final
10.4.1.2 Receptor Sensitivity
Human Receptors
All candidate construction yards are currently operational, are located within an industrial setting and have been used previously for ACG/SD construction works. The BDJF yard is the most remote. Residential properties are located within 500m of the South Dock yard boundary and 500m to 1km of the Zykh and Bibi Heybet yard boundaries.
Table 10.5 presents the justification for assigning a score of 3 to human receptors, which represents Medium Receptor Sensitivity.
Table 10.5 Human Receptor Sensitivity
Parameter Explanation Rating
Presence All construction yards are located in established industrial areas. Residential properties are located within 500m to 1km of the boundaries of the Zykh, Bibi Heybet and South Dock yards19.
2
Resilience Modelling results have confirmed that emissions from construction yard sources will not exceed air quality standards and local receptors are not considered to be vulnerable.
1
Total 3
Biological/Ecological Receptors
Table 10.6 presents the justification for assigning a score of 3 to biological/ecological receptors, which represents Medium Receptor Sensitivity.
Table 10.6 Biological/Ecological Receptor Sensitivity
Parameter Explanation Rating Presence Bird species that may occasionally be present at the yard and adjacent areas are
mobile and would not be present for long periods of time, with the exception of the lagoons, which are adjacent to the BDJF yard and support populations of overwintering and residential bird species. Terrestrial ecological receptors are very limited, given the industrial nature of the yards and their surroundings.
2
Resilience Volume of emissions released (including particulates) due to yard generators and engines will create a very small increase in pollutant concentrations in the atmosphere and in any washout from rainfall, which will not be discernable to biological/ecological receptors20.
1
Total 3
10.4.1.3 Impact Significance
Table 10.7 summarises impacts on air quality associated with yard plant emissions during the Construction, Installation and HUC phase.
19 In accordance with the assessment methodology (Chapter 3), commercial locations and workers are considered to be of lower sensitivity than residential properties and in terms of air quality are subject to standards under separate occupational health requirements. 20 Note that ambient air quality standards are not relevant to biological/ecological receptors.

AIOC Chirag Oil Project Environmental & Socio-Economic Impact Assessment
Chapter 10: Construction, Installation and HUC Environmental Impact Assessment,
Mitigation and Monitoring
February 2010 10/15Final
Table 10.7 Impact Significance
Event Event Magnitude
Receptor Sensitivity Impact Significance
(Humans) Medium Moderate Negative Yard generators and engines Medium (Biological/Ecological)
MediumModerate Negative
It is considered that impacts are minimised as far as practicable and necessary through the implementation of the existing control measures (see Table 10.3) and therefore no additional mitigation is required.
10.4.2 Onshore Platform Generator Commissioning
10.4.2.1 Event Magnitude
As stated within Chapter 5: Section 5.4.8.3, all topside utilities will be commissioned at the topside construction yard over a 10 month period. Onshore commissioning of the 3 RB211 generators using diesel is planned to include:
Each generator run separately and intermittently for a week, for up to 8 hours a day at a maximum load of approximately 26%; and
3 synchronisation tests of 8 hour duration, running 2 of the 3 generators together at a maximum load of approximately 26%.
During commissioning of the compression system and topside utilities, the platform generators are planned to run separately and intermittently for approximately 6 months. Commissioning of the topside will occur at either the BDJF yard or the Bibi Heybet yard.
Dispersion modelling, as described in Section 10.4.1, was undertaken to determine the likely magnitude of impacts from platform generator emissions to any nearby receptors (see Appendix 10C). Worst case impacts were considered based on the three 8 hour synchronisation tests and the results obtained were compared against the relevant short term standard for NO2.
The short term concentrations obtained from the modelling under high, medium and low wind speed conditions are presented in Table 10.8.
Table 10.8 Maximum Short Term NO2 Concentrations Under High, Low and Typical Wind Conditions (Platform Generator Emissions)
Wind Conditions
Maximum short term ground level NO2 concentration
(µg/m3)
Distance from source (m)
Increase in short term concentration as % of short term
standard High (15 m/s) 30 500 7.5% Medium (5 m/s) 25 1600 5% Low (1 m/s) 16 3600 0.5%
Figure 10.2 presents the short term ground level NO2 concentrations under high wind conditions.

AIOC Chirag Oil Project Environmental & Socio-Economic Impact Assessment
Chapter 10: Construction, Installation and HUC Environmental Impact Assessment,
Mitigation and Monitoring
February 2010 10/16Final
Figure 10.2 Maximum Short Term Ground Level NO2 Concentration (µg/m3) at Distance from Source (High Wind Speed Conditions)
The results demonstrate that under all meteorological conditions modelled, concentrations of NO2 would not exceed the applicable short term standard for NO2 of 200µg/m3. The maximum predicted short term increase in NO2 concentrations represents less than 10% of the standard and is considered to be indiscernible from background levels21 for all wind conditions18.
Table 10.9 presents the justification for assigning a score of 6, which represents a Medium Event Magnitude.
Table 10.9 Event Magnitude
Parameter Explanation Rating
Extent/Scale Increases in concentrations of pollutant species will be indiscernible from background concentrations at all distances from the emission source.
1
Frequency Emissions will occur continuously. 3 Duration Emissions will occur for less than 24 hours. 1 Intensity Modelled long and short term concentrations of key pollutant, NO2, are predicted
to be significantly below relevant ambient air quality standards. 1
Total 6
21 In accordance with UK Environment Agency Air Quality Assessment Guidance.
Generators
Metres from source
Modelled concentration (µg/m3)
15-20
20-25
25-30
30-35
15
Short term NO2 limit = 200µg/m3
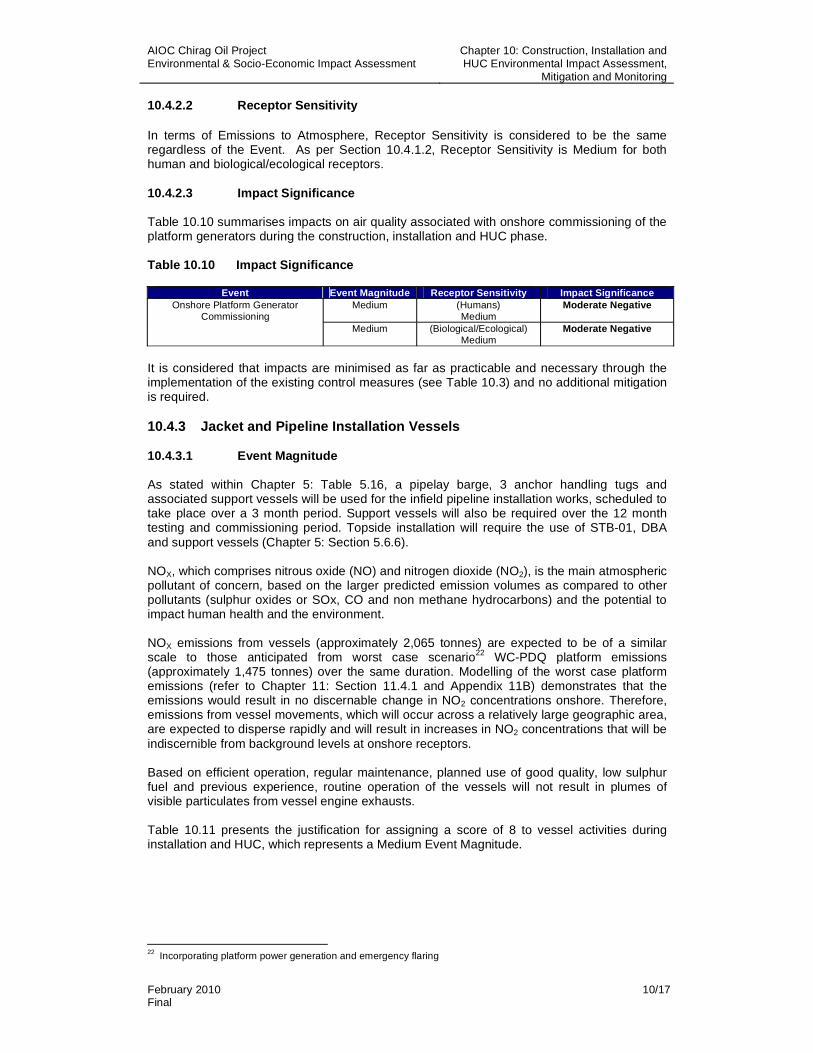
AIOC Chirag Oil Project Environmental & Socio-Economic Impact Assessment
Chapter 10: Construction, Installation and HUC Environmental Impact Assessment,
Mitigation and Monitoring
February 2010 10/17Final
10.4.2.2 Receptor Sensitivity
In terms of Emissions to Atmosphere, Receptor Sensitivity is considered to be the same regardless of the Event. As per Section 10.4.1.2, Receptor Sensitivity is Medium for both human and biological/ecological receptors.
10.4.2.3 Impact Significance
Table 10.10 summarises impacts on air quality associated with onshore commissioning of the platform generators during the construction, installation and HUC phase.
Table 10.10 Impact Significance
Event Event Magnitude Receptor Sensitivity Impact Significance Medium (Humans)
MediumModerate Negative Onshore Platform Generator
CommissioningMedium (Biological/Ecological)
MediumModerate Negative
It is considered that impacts are minimised as far as practicable and necessary through the implementation of the existing control measures (see Table 10.3) and no additional mitigation is required.
10.4.3 Jacket and Pipeline Installation Vessels
10.4.3.1 Event Magnitude
As stated within Chapter 5: Table 5.16, a pipelay barge, 3 anchor handling tugs and associated support vessels will be used for the infield pipeline installation works, scheduled to take place over a 3 month period. Support vessels will also be required over the 12 month testing and commissioning period. Topside installation will require the use of STB-01, DBA and support vessels (Chapter 5: Section 5.6.6).
NOX, which comprises nitrous oxide (NO) and nitrogen dioxide (NO2), is the main atmospheric pollutant of concern, based on the larger predicted emission volumes as compared to other pollutants (sulphur oxides or SOx, CO and non methane hydrocarbons) and the potential to impact human health and the environment.
NOX emissions from vessels (approximately 2,065 tonnes) are expected to be of a similar scale to those anticipated from worst case scenario22 WC-PDQ platform emissions (approximately 1,475 tonnes) over the same duration. Modelling of the worst case platform emissions (refer to Chapter 11: Section 11.4.1 and Appendix 11B) demonstrates that the emissions would result in no discernable change in NO2 concentrations onshore. Therefore, emissions from vessel movements, which will occur across a relatively large geographic area, are expected to disperse rapidly and will result in increases in NO2 concentrations that will be indiscernible from background levels at onshore receptors.
Based on efficient operation, regular maintenance, planned use of good quality, low sulphur fuel and previous experience, routine operation of the vessels will not result in plumes of visible particulates from vessel engine exhausts.
Table 10.11 presents the justification for assigning a score of 8 to vessel activities during installation and HUC, which represents a Medium Event Magnitude.
22 Incorporating platform power generation and emergency flaring
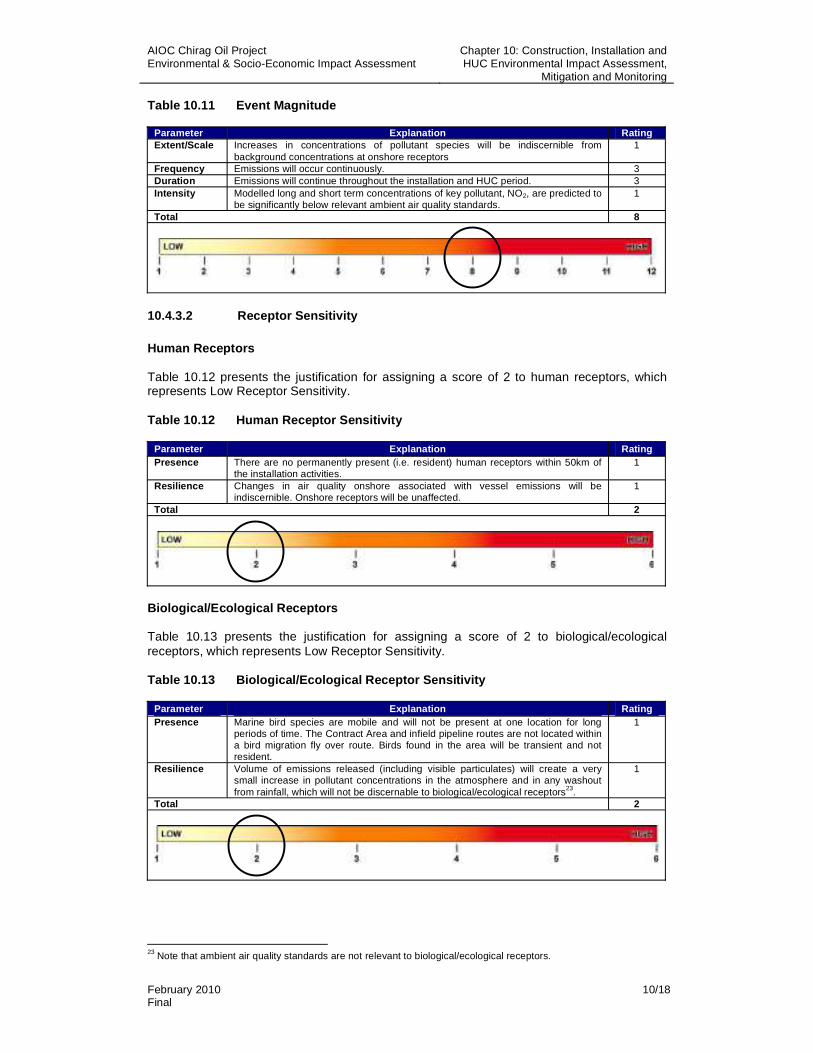
AIOC Chirag Oil Project Environmental & Socio-Economic Impact Assessment
Chapter 10: Construction, Installation and HUC Environmental Impact Assessment,
Mitigation and Monitoring
February 2010 10/18Final
Table 10.11 Event Magnitude
Parameter Explanation Rating Extent/Scale Increases in concentrations of pollutant species will be indiscernible from
background concentrations at onshore receptors 1
Frequency Emissions will occur continuously. 3 Duration Emissions will continue throughout the installation and HUC period. 3 Intensity Modelled long and short term concentrations of key pollutant, NO2, are predicted to
be significantly below relevant ambient air quality standards. 1
Total 8
10.4.3.2 Receptor Sensitivity
Human Receptors
Table 10.12 presents the justification for assigning a score of 2 to human receptors, which represents Low Receptor Sensitivity.
Table 10.12 Human Receptor Sensitivity
Parameter Explanation Rating Presence There are no permanently present (i.e. resident) human receptors within 50km of
the installation activities. 1
Resilience Changes in air quality onshore associated with vessel emissions will be indiscernible. Onshore receptors will be unaffected.
1
Total 2
Biological/Ecological Receptors
Table 10.13 presents the justification for assigning a score of 2 to biological/ecological receptors, which represents Low Receptor Sensitivity.
Table 10.13 Biological/Ecological Receptor Sensitivity
Parameter Explanation Rating Presence Marine bird species are mobile and will not be present at one location for long
periods of time. The Contract Area and infield pipeline routes are not located within a bird migration fly over route. Birds found in the area will be transient and not resident.
1
Resilience Volume of emissions released (including visible particulates) will create a very small increase in pollutant concentrations in the atmosphere and in any washout from rainfall, which will not be discernable to biological/ecological receptors23.
1
Total 2
23 Note that ambient air quality standards are not relevant to biological/ecological receptors.

AIOC Chirag Oil Project Environmental & Socio-Economic Impact Assessment
Chapter 10: Construction, Installation and HUC Environmental Impact Assessment,
Mitigation and Monitoring
February 2010 10/19Final
10.4.3.3 Impact Significance
Table 10.14 summarises impacts on air quality associated with support vessels during the installation and HUC phase.
Table 10.14 Impact Significance
Event Event Magnitude
Receptor Sensitivity Impact Significance
(Humans) Low Minor Negative Vessel Engines Medium
(Biological/Ecological) Low Minor Negative
It is considered that impacts are minimised as far as practicable and necessary through the implementation of the existing control measures and no additional mitigation is required (see Table 10.3).
10.5 Impacts to the Terrestrial Environment Associated with Onshore Noise
10.5.1 Construction Yard Plant
10.5.1.1 Event Magnitude
Noise at the selected construction yard(s) during the construction and commissioning phase will arise from the use of plant and machinery to undertake steel rolling, cutting and shaping, welding, grit blasting and the movement of materials around the site(s) by vehicles/cranes.
A noise modelling assessment was undertaken to determine the potential magnitude of impacts from onshore construction noise to any nearby receptors (see Appendix 10B).
Using reasonable worst case assumptions regarding plant and operating times across the construction period, predictions of potential noise impact from the construction activities at increasing distances from the source were undertaken and compared to the relevant environmental noise level guidelines24.
The noise screening afforded by the buildings and perimeter fencing around each of the yards was assumed conservatively to provide 5dBA of attenuation. No account was taken for current operations at the construction yard(s).
The modelling demonstrated that 155m from the noise source, the daytime limit of 55dB will be met and at 475m, the nightime limit of 45dB Laeq will be met. These limits are applicable to residential dwellings, where people are normally present. The workplace limit of 70dB Laeq, applicable to commercial/industrial properties, was found to be met at a distance of 30m from the source (refer to Figure 10.3). The modelling predicted no exceedances of environmental noise standards at a distance of 475m or more from noise sources at the construction yard.
24 1hour LAeq for 1) Residential; institutional; educational i) Daytime (07:00 - 22:00) – 55dBA ii) Nighttime (22:00 - 07:00) – 45 dBA and 2) Industrial; commercial, Daytime and Nightime – 70 dBA

AIOC Chirag Oil Project Environmental & Socio-Economic Impact Assessment
Chapter 10: Construction, Installation and HUC Environmental Impact Assessment,
Mitigation and Monitoring
February 2010 10/20Final
Figure 10.3 Predicted Noise Levels from Plant/Machinery at the Construction Yard
Table 10.15 presents the justification for assigning a score of 8 to construction yard plant operations, which represents a Medium Event Magnitude.
Table 10.15 Event Magnitude
Parameter Explanation Rating Extent/Scale Noise will affect an area less than 500m from the source. 1Frequency Noise will occur continuously during the construction period. 3 Duration Noise will be generated throughout the construction period. 3Intensity Noise standards will not be exceeded at the nearest residential receptors. 1 Total 8
10.5.1.2 Receptor Sensitivity
Human Receptors
All of the candidate construction yards are currently operational, located within an industrial setting and have been used previously for ACG/SD construction works. The BDJF yard is the most remote. Residential properties are located within 500m of the South Dock yard boundary and 500m to 1km of the Zykh and Bibi Heybet yard boundaries.
Table 10.16 presents the justification for assigning a score of 3 to human receptors, which represents Medium Receptor Sensitivity.
30
35
40
45
50
55
60
65
70
75
80
85
90
0 100 200 300 400 500 600 700 800 900 1000
Distance from source (m)
Predicted Noise Level
Daytime Noise Limit
Night-time Noise Limit
Industrial Noise Limit

AIOC Chirag Oil Project Environmental & Socio-Economic Impact Assessment
Chapter 10: Construction, Installation and HUC Environmental Impact Assessment,
Mitigation and Monitoring
February 2010 10/21Final
Table 10.16 Human Receptor Sensitivity
Parameter Explanation Rating Presence All construction yards are located in established industrial areas. Residential
properties are located within 500m to 1km of the boundaries of the Zykh, Bibi Heybet and South Dock yards.
2
Resilience Local receptors are not considered to be vulnerable to construction yard plant and machinery noise associated with the COP, given the existing operations at the yard and in the immediate yard vicinity.
1
Total 3
Biological/Ecological Receptors
Table 10.17 presents the justification for assigning a score of 3 to biological/ecological receptors, which represents Medium Receptor Sensitivity.
Table 10.17 Biological/Ecological Receptor Sensitivity
Parameter Explanation Rating Presence Birds species that may occasionally be present at the yard and adjacent areas are
mobile and would not be present for long periods of time, with the exception of the lagoons, which are adjacent to the BDJF yard and support populations of overwintering and residential bird species. Terrestrial ecological receptors are very limited given the industrial nature of the yards and their surroundings.
2
Resilience Given the existing industrial activities in and around the yards, species are expected to be unaffected or marginally affected by construction noise associated with the COP.
1
Total 3
10.5.1.3 Impact Significance
Table 10.18 summarises impacts to human receptors from noise due to construction yard plant operations.
Table 10.18 Impact Significance
Event Event Magnitude Receptor Sensitivity Impact Significance (Humans) Medium Moderate Negative Construction yard plant Medium
(Birds) Medium Moderate Negative
It is considered that impacts are minimised as far as practicable and necessary through the implementation of the existing control measures (see Table 10.3) and no additional mitigation is necessary.

AIOC Chirag Oil Project Environmental & Socio-Economic Impact Assessment
Chapter 10: Construction, Installation and HUC Environmental Impact Assessment,
Mitigation and Monitoring
February 2010 10/22Final
10.5.2 Onshore Platform Generator Commissioning
10.5.2.1 Event Magnitude
As described in Section 10.4.2.1, all topside utilities will be commissioned at the topside construction yard including the 3 RB211 generators, which will be run separately and intermittently for approximately 6 months. For an 8 hour period, it is planned to run 2 generators together at a maximum load of 26%. Topside commissioning will be undertaken at the BDJF or Bibi Heybet yards.
Noise modeling, as described in Section 10.5.1, was undertaken to determine the likely magnitude of noise impacts from the platform generators to any nearby receptors (see Appendix 10B). Worst case impacts were considered based on the operation of two generators concurrently for 8 hours and an allowance of 15dB Laeq was made for the screening afforded by the generator housing and acoustic controls associated with the platform generators.
The modelling demonstrated that at 175m or more from the noise source, the daytime limit of 55dB will be met; and at 550m from the noise source, the nightime limit of 45dB Laeq will be met. The industrial workplace limit of 70dB Laeq was found to be met at a distance of 35m from the source (refer to Figure 10.4). The modelling predicted no exceedances of environmental noise standards at a distance of 550m or more from noise sources at the construction yard.
Figure 10.4 Predicted Noise Level Associated with Onshore Platform Generator Commissioning
Table 10.19 presents the Event Magnitude for onshore platform commissioning. A Medium level Event Magnitude is assigned.
30
35
40
45
50
55
60
65
70
75
80
85
90
0 100 200 300 400 500 600 700 800 900 1000
Distance from source (m)
Predicted Noise Level
Daytime Noise Limit
Night-time Noise Limit
Industrial Noise Limit

AIOC Chirag Oil Project Environmental & Socio-Economic Impact Assessment
Chapter 10: Construction, Installation and HUC Environmental Impact Assessment,
Mitigation and Monitoring
February 2010 10/23Final
Table 10.19 Event Magnitude
Parameter Explanation Rating Extent/Scale Noise will be noticeable and above relevant nightime limits
greater than 500m from the construction yard, reducing to limit levels at less than 1km.
2
Frequency Noise will occur continuously. 3 Duration Noise will continue for up to 24 hours. 1 Intensity Noise standards will not be exceeded at the nearest residential
receptors to the selected topside yard. 1
Total 7
10.5.2.2 Receptor Sensitivity
In terms of noise, Receptor Sensitivity is considered to be the same regardless of the Event. As per Section 10.5.1.2, Receptor Sensitivity is Medium (3), for human receptors.
10.5.2.3 Impact Significance
Table 10.20 summarises impacts to human receptors and birds from noise due to onshore platform generator commissioning noise.
Table 10.20 Impact Significance
Event Event Magnitude Receptor Sensitivity Impact Significance (Humans) Medium Moderate Negative Onshore platform generator
commissioning Medium
(Birds) Medium Moderate Negative
10.5.2.4 Additional Mitigation and Monitoring
The assessment above has demonstrated, with reference to numerical modelling, that noise from onshore platform generator commissioning will result in a Moderate Negative impact to bird and human receptors, taking into account the existing controls detailed within Table 10.3. The assessment is considered to be conservative as discussed in Section 10.5.1.1 and it is also unlikely that the platform generator tests will be undertaken during the nightime. Should it be necessary to undertake synchronisation tests of the generators at night, consultation will take place in the local community (within 700m of the sound source).

AIOC Chirag Oil Project Environmental & Socio-Economic Impact Assessment
Chapter 10: Construction, Installation and HUC Environmental Impact Assessment,
Mitigation and Monitoring
February 2010 10/24Final
10.6 Impacts to the Marine Environment
10.6.1 Construction Yard Cooling Water Discharge
10.6.1.1 Event Magnitude
During onshore commissioning, seawater will be supplied to the topside via a temporary seawater lift system from the quayside, fitted with a 3mm diameter mesh to minimise entrainment. The seawater system will be designed to operate at a flow rate of approximately 575m3/hr for a period of up to 6 months and will be of a similar design to that approved for previous ACG projects. Seawater will be abstracted from the construction yard quayside and discharged back to the sea after use. The temperature difference between the seawater intake and discharge will be constant and independent of season as the energy demand on the seawater cooling system when in use will be constant. The system will be designed to meet a temperature specification for the discharge at the edge of the mixing zone, or 100m if a mixing zone is not defined, no greater than 3°C more than the ambient water temperature. Dispersion modelling was carried out for a similar discharge during onshore commissioning of the Central Azeri (Phase 1) platform25. The modelling demonstrated that the temperature of the discharge plume would not be greater than 3°C in comparison with ambient temperatures within 4m of the point of discharge (Figure 10.5).
Figure 10.5 Predicted Cooling Water Plume Temperature Above Ambient at Distance from Discharge
The seawater system will be designed to incorporate continuous dosing of sodium hypochlorite at a concentration of 2mg/l. Prior to discharging the cooling water, a neutralising agent (sodium thiosulphate) will be added. Neutralisation agent dosing will be controlled and checked to ensure neutralisation is effective and residual chlorine content is maintained at less than 1mg/l.
Table 10.21 presents the Event Magnitude for construction yard cooling water discharge. A Medium level Event Magnitude is assigned.
25 Thermal Dispersion Modelling in Support of the ACG Central Azeri Project, ASA, January 2003.
2.0
3.0
4.0
5.0
6.0
7.0
8.0
9.0
10.0
11.0
0 0.5 1 1.5 2 2.5 3 3.5 4 4.5
Horizontal Distance of Plume Centerline from Discharge Pipe (m)
No Current 50th Percentile Current Maximum Current Thermal Guideline

AIOC Chirag Oil Project Environmental & Socio-Economic Impact Assessment
Chapter 10: Construction, Installation and HUC Environmental Impact Assessment,
Mitigation and Monitoring
February 2010 10/25Final
Table 10.21 Event Magnitude
Parameter Explanation Rating Extent/Scale Cooling water discharges will be diluted to an acceptable level within 4m of the
point of discharge.1
Frequency Discharge of cooling water will take place continuously. 3 Duration The discharge will be continuous for 6 - 8 months during topside commissioning. 3 Intensity Discharges will be consistent with project standards and with previously approved
practices and will contain no harmful persistent materials. 1
Total 8
10.6.1.2 Receptor Sensitivity
The discharge will take place close to the quayside adjacent to a construction yard in an industrialised setting. In addition to the modelling for Central Azeri, a risk assessment was carried out for the same discharge process during the commissioning of the DWG-DUQ platform topside. This assessment concluded that neither temperature nor chemical dosage presented an environmental risk, even within the confines of the southern part of the BDJF yard harbour.
Due to the location of the construction yards within heavily industrialised areas, the presence of seals or threatened species of fish is extremely unlikely. The benthos of the coastal zone is largely dominated by pollution-tolerant invasive species, with few native species present. No plankton studies have been carried out in the vicinity of construction yards, but it is probable that species diversity is lower than in open waters; and that communities will tend to be dominated by organisms which are tolerant of, or can competitively exploit, water which will often be of poorer quality than open coastal water.
In summary, no sensitive, rare or threatened species are anticipated to be present in the vicinity of construction yards, and the species most likely to be present and dominant will be those most tolerant of the discharges and emissions historically associated with shipping and industrial activity.
Table 10.22 presents the biological/ecological Receptor Sensitivity.
Table 10.22 Receptor Sensitivity
Parameter Explanation Rating Presence Seals and fish are not expected to be present consistently or in significant numbers
near the discharge source. No significant exposure of benthos or plankton. 1
Resilience The species likely to dominate in the area of the construction yards are expected to be predominantly invasive species with a high tolerance to anthropogenic impacts.
1
Total 2

AIOC Chirag Oil Project Environmental & Socio-Economic Impact Assessment
Chapter 10: Construction, Installation and HUC Environmental Impact Assessment,
Mitigation and Monitoring
February 2010 10/26Final
10.6.1.3 Impact Significance
Table 10.23 summarises impacts to biological/ecological receptors from construction yard onshore topside commissioning cooling water discharge.
Table 10.23 Impact Significance
Event Event Magnitude Receptor Sensitivity Impact Significance Cooling water discharge from
onshore commissioning of topside Medium (Biological/Ecological)
LowMinor Negative
It is considered that impacts are minimised as far as practicable and necessary through the implementation of the existing control measures (see Table 10.3) and no additional mitigation is required.
10.6.2 Pipeline Cleaning and Hydrotest Discharge
10.6.2.1 Event Magnitude
The process of gauging, hydrotesting, leak testing and integrity testing the infield pipelines (gas and oil, water injection and produced water) will use seawater dosed with a biocide, oxygen scavenger and tracer dye. The products planned to be used include a THPS-based biocide product (tetrakys-hydroxymethyl phosphonium sulphate), ammonium bisulphite (oxygen scavenger) and fluorescein (tracer dye).
All 3 COP pipeline hydrotest chemicals (biocide, oxygen scavenger and tracer dye) have been subject to a comprehensive risk assessment for ACG Phases 1, 2 and 3 and for Shah Deniz Stage 1. The oxygen scavenger and tracer dye products are both of very low toxicity and have low bioaccumulation potential.
2 THPS-containing biocide products (B TROSKIL 88 and BIOTREAT 4535) are under consideration both of which meet the performance standards established by previous ACG studies and approved by the MENR.
THPS biocide products have been shown to degrade by more than 90% within six months in the pipeline and an extensive World Health Organisation review has provided evidence that the biocide hydrolyses rapidly in the environment. Experimental studies conducted for ACG Phase 2, Phase 3 and Produced Water Disposal Projects has indicated that toxicity also reduces by 90% during a 6 month holding period26. On the basis of the aforementioned studies, it was estimated conservatively that:
For degraded biocide (i.e. biocide which had been in the pipeline for more than 6 months), a dilution ratio of 300:1 would be required to reach the point at which no biological effects would occur; and
For ‘fresh’ biocide (e.g. discharged as overfill during initial flooding operations), a dilution ratio of 3,000:1 would be required to reach the point at which no biological effects would occur.
Table 5.18 in Chapter 5: Project Description27 indicates that a number of separate discharges of hydrotest water will take place. These will range in volume up to 4,675m3. These discharges will be of limited duration (from approximately 1 minute to approximately 8 hours) and will not overlap in time and space. The discharge of hydrotest water from infield pipelines was thoroughly assessed for ACG Phase 2 and a risk assessment submitted to, and approved by, the MENR. To provide further information specific to the COP on the volume of water potentially impacted, a representative range of discharges (covering depth, volume and
26 Refer to DWG Hydrotest Final Report 2007 27 As stated in Chapter 5: Section 5.5, the design and routing of the infield pipelines is ongoing throughout Define. The cleaning and hydrotest discharge volumes and associated chemical dosing, represent the likely worst case for the purposes of this assessment.

AIOC Chirag Oil Project Environmental & Socio-Economic Impact Assessment
Chapter 10: Construction, Installation and HUC Environmental Impact Assessment,
Mitigation and Monitoring
February 2010 10/27Final
discharge velocity) have been mathematically modelled, including a conservative discharge of 7,000m3, which represents a worst case scenario.
The modelling results for summer and winter conditions (Appendix 10D) indicate that the 3,000:1 dilution criterion will be reached within 200 - 900m for the ‘fresh’ discharges (i.e. up to 1,200m3, Figure 10.6) and that the 300:1 dilution criterion will be reached within 100 - 400m for the larger (i.e. ~7,000m3) ‘degraded’ discharges (Figure 10.7). These plumes, which move horizontally i.e. do not rise or fall, will occur below the productive zone and will be of sufficiently small dimension that it is very unlikely that any individual organism would remain in the plume for more than a few tens of minutes at most. Once the plume is diluted beyond the 300:1 criterion, chemical concentrations will be too low to have any adverse effect and the residual low concentrations of biocide will rapidly hydrolyse into harmless components.
Figure 10.6 Plume Dimensions for Discharge of 1,200 m3 ‘Fresh’ Hydrotest Water Under Stagnant and Predominant Current Conditions
Figure 10.7 Plume Dimensions for Discharge of 7,000m3 Degraded Hydrotest Water
These chemicals, which are not environmentally persistent, have been approved for use in previous ACG and Shah Deniz projects. Data accumulated during these previous hydrotest operations has confirmed a high rate of reduction in biocide concentration and toxicity between the time a pipeline is filled with hydrotest water and the time it is emptied in preparation for commissioning.
As stated within Chapter 5 Section 5.5.4, to tie in the COP infield oil pipeline, it is planned to remove a section of the DWG oil export pipeline and install a new wye piece. The wye will be cleaned and hydrotested prior to tie in. In the event that it is not possible to recover the hydrotest water prior to tie in, it may be necessary to discharge to sea up to 1,110 m3 of hydrotest water containing traces of hydrocarbon at concentrations of up to 100 ppm. The discharge would take place at a depth of 168m, and at a rate of approximately 0.44 m3/s. The discharge duration would be approximately 1.4 hours.
HTW Dilution300:1
840:1
1380:1
1920:1
2460:1
3000:1
No-effect dilution (3000:1)
Summer
Summer
Winter
Winter
HTW Dilution300:1
840:1
1380:1
1920:1
2460:1
3000:1
No-effect dilution (300:1)
Summer
Summer
Winter
Winter

AIOC Chirag Oil Project Environmental & Socio-Economic Impact Assessment
Chapter 10: Construction, Installation and HUC Environmental Impact Assessment,
Mitigation and Monitoring
February 2010 10/28Final
The discharged water will contain ‘fresh’ chemicals of the same type and concentration used in the hydrotest operations described above, and the volume of discharge will be similar to the scenario presented in Figure 10.6. Estimation of the impact of a discharge containing hydrocarbons therefore needs to assess the magnitude of the additional contribution of the hydrocarbons.
It is assumed that the water will be well-mixed with, and equilibrated with, the residual hydrocarbon present in the pipeline following cleaning operations. Consequently, the form and composition of the hydrocarbon in the water is likely to be similar to that of produced water following separation from the production stream. Studies were carried out in March 2008 (refer to Chapter 11 Section 11.5.4.1) on produced water samples obtained from separation equipment at Sangachal Terminal. These studies included comprehensive chemical analysis and toxicity testing. In general, the toxicity of all samples was low, and hydrocarbon (total aliphatics) concentrations ranged from 4.34 mg/l to 171.9 mg/l. Figure 10.8 illustrates the relationship between toxicity (LC50 expressed as % dilution in Caspian seawater) and total hydrocarbon concentration. This shows that, while there is a weak trend towards higher toxicity (lower LC50) at higher hydrocarbon concentrations, toxicity does not increase markedly at very high hydrocarbon concentrations, and that aliphatic hydrocarbons are therefore not a dominant source of toxicity in produced water. However, for the purposes of estimating the impact of wye section discharge, the LC50 for the highest concentration (171.9 mg/l) is used as an approximate indication; this LC50 is 10%, which means that the a 10-fold dilution in seawater is required to reach a concentration at which a 50% effect was observed on the test population. If a very conservative safety factor of 100 is applied to this value, it is estimated that a 1000-fold dilution would be sufficient to reach a no-effect concentration for the discharge. At this point, the hydrocarbon concentration would be approximately 100 µg/l (0.1 ppm).
Figure 10.8 Relationship Between Produced Water Toxicity (LC50 expressed as % Dilution in Caspian Seawater) and Total Hydrocarbon Concentration
In the assessment for discharge of fresh hydrotest water, a dilution of 3000-fold was conservatively estimated to be sufficient to reach a no-effect concentration. This is three times greater than the dilution estimated to be required for water contaminated with hydrocarbon at a concentration in excess of 100 ppm. To assess whether the combined presence of hydrotest chemicals and hydrocarbon will result in an increase in the no-effect plume dimensions a comparison is made with the national MPC for total hydrocarbons (0.05ppm). A dilution of 2000 fold would be required to reduce the discharge hydrocarbon concentration of 100 ppm to this level. The MPC is a concentration which represents an upper limit intended to provide long-term protection to the environment, and concentrations lower than this would therefore not be expected to have any adverse effects. Since this
0
20
40
60
80
100
120
140
160
180
200
0 5 10 15 20 25 30 35 40
LC50 (5 dilution in seawater)

AIOC Chirag Oil Project Environmental & Socio-Economic Impact Assessment
Chapter 10: Construction, Installation and HUC Environmental Impact Assessment,
Mitigation and Monitoring
February 2010 10/29Final
concentration will be reached within the plume predicted for hydrotest chemicals alone, the presence of hydrocarbons at the margins of the hydrotest plume will not contribute any additional effects. It is therefore concluded that the impact of this discharge will be similar, in terms of plume dimension and duration, to that predicted for a 1,200m3 discharge of hydrotest water.
Table 10.24 presents the justification for assigning a score of 5, which represents a Medium Event Magnitude for all hydrotest discharges.
Table 10.24 Event Magnitude
Parameter Explanation Rating Extent/Scale Hydrotest discharges will be diluted to a ‘no effect’ level within 500m of the source. 1 Frequency Discharges will take place up to 50 times. 2 Duration Individual events will have a duration of between a few minutes and a few hours. 1 Intensity Discharges will be consistent with project standards and with previously approved
practices and will contain no harmful persistent materials. 1
Total 5
10.6.2.2 Receptor Sensitivity
Small volume (i.e. approximately 1-20m3) discharges of short duration will take place near the sea surface. No receptors are considered to be sensitive to these small discharges. Dispersion modelling (see Appendix 10D) indicates that a no-effect concentration will be reached within 300m of the source for all surface and near-surface hydrotest discharges.
Larger volume discharges of treated seawater will occur near the seabed and at a level below the productive zone. Plankton (which is present in highest abundance at or near the productive zone around the thermocline) is not considered to be sensitive to these discharges.
While it is possible that seals and bottom-feeding fish may occasionally be present near the location of seabed discharges, the frequency of discharge occurrence is low and the maximum zone of potential impact will be within a radius of no more than 800m. It is therefore considered that seals and fish do not have a particular sensitivity to near seabed discharges.
As the seabed discharges will be discharged in an upward direction, the dispersion plumes will have minimum contact with the seabed and so the potential for benthic invertebrates to be exposed to the hydrotest discharges is low.
Table 10.25 presents the justification for assigning a score of 2 to biological/ecological receptors, which represents Low Receptor Sensitivity.
Table 10.25 Receptor Sensitivity
Parameter Explanation Rating Presence Seals and fish are not expected to be present consistently or in significant numbers
near the seabed discharge sources. No significant exposure of benthos or plankton. 1
Resilience Although exposure is unlikely, seals and fish would not be adversely affected by short-term exposure to the discharges.
1
Total 2

AIOC Chirag Oil Project Environmental & Socio-Economic Impact Assessment
Chapter 10: Construction, Installation and HUC Environmental Impact Assessment,
Mitigation and Monitoring
February 2010 10/30Final
10.6.2.3 Impact Significance
Table 10.26 summarises impacts to biological/ecological receptors associated with pipeline hydrotest discharges.
Table 10.26 Impact Significance
Event Event Magnitude Receptor Sensitivity Impact Significance Hydrotest discharge Medium (Biological/Ecological)
LowMinor Negative
10.6.2.4 Additional Mitigation and Monitoring
The assessment above has demonstrated, with reference to numerical modelling, that pipeline hydrotest discharges will result in a Minor Negative impact to biological/ecological receptors. The selection of a biocide, which degrades readily both in the pipeline and in the environment, is considered to provide good mitigation for environmental impacts. This assessment is supported by a number of field and laboratory studies carried out on the same chemical during previous phases of the ACG development.
Prior to the commencement of pipeline hydrotest activities, a hydrotest management plan will be prepared and subsequently maintained. This plan will establish, and regularly update, a schedule of hydrotest events together with a detailed set of commissioning procedures. The MENR will be informed of the hydrotest schedule and will be notified of any changes to the schedule.
Experience gained during the commissioning of the ACG Phase 3 pipelines demonstrated that, in most instances, it is not technically practicable to undertake a programme of field sampling and analysis during hydrotest activities; this constraint applies particularly to events which involve the discharge of degraded hydrotest chemicals after the fluid has been in a pipeline for a period of several months. Accordingly, the following measures will be undertaken for the COP to provide the most effective and practicable monitoring and assurance:
The amounts of chemicals used, together with the dosage rates and water flow rates during all pipeline filling, top-up and pressure testing activities will be rigorously recorded;
The actual volumes of fresh or degraded hydrotest water released during each pipeline discharge event will be rigorously recorded; and
Laboratory samples (seawater dosed with chemicals at the rate recorded during offshore pipeline fill activities) will be prepared and stored onshore under simulated pipeline conditions. These samples will be periodically subject to chemical analysis and toxicity testing in order to measure the rate of chemical degradation and associated toxicity reduction.
As described in Section 10.6.2.1 above it is planned to send hydrocarbon-contaminated hydrotest water and cleaning fluids from the new wye installation activities to Sangachal. In the event that discharge of hydrocarbon contaminated hydrotest water from the infield oil wye and pipeline cleaning hydrotest activities is necessary, additional laboratory studies will be carried out to establish the toxicity of this water in order to confirm the results of the assessment as presented within this ESIA. The information collected as a result of these hydrotest monitoring and assurance measures will be collated, interpreted, and issued in the form of a final close-out report to the MENR once all pipeline commissioning activities have been completed.

AIOC Chirag Oil Project Environmental & Socio-Economic Impact Assessment
Chapter 10: Construction, Installation and HUC Environmental Impact Assessment,
Mitigation and Monitoring
February 2010 10/31Final
10.6.3 Cement Discharges
10.6.3.1 Event Magnitude
During grouting of the jacket sleeves to the main foundation piles, up to 50m3 of cement will be discharged to the seabed. The volume of cement used to cement jacket piles into position is calculated prior to the start of the activity and the amount of cement discharged will be restricted to the minimum required to ensure that the platform piles are securely grouted into position.
The cement is not expected to disperse (being designed to set in a marine environment) and will therefore set in-situ. It is not anticipated that there will be any chemical releases from the cement, which will be effectively chemically inert. The impact of cement discharge will therefore be limited to a small area, immediately around the foundation piles.
Table 10.27 presents the justification for assigning a score of 4, which represents a Low Event Magnitude.
Table 10.27 Event Magnitude
Parameter Explanation Rating Extent/Scale Scale will be limited to within a few metres of the source and the discharge will not
disperse.1
Frequency Once only. 1Duration Event will be of short duration (less than 24 hours). 1 Intensity Discharges will be consistent with project standards and with previously approved
practices, and will contain no harmful persistent materials. 1
Total 4
10.6.3.2 Receptor Sensitivity
Seals, fish and plankton are not considered to be at risk of exposure to the cement discharge. The discharge will occlude a small area of seabed with consequent impact on the benthos living within this area.
Table 10.28 presents the justification for assigning a score of 2 to benthic invertebratereceptors, which represents Low Receptor Sensitivity.
Table 10.28 Receptor Sensitivity
Parameter Explanation Rating Presence No unique, rare or threatened species of benthos present. 1 Resilience The cement will cover a few square metres of seabed, within which a small amount
of benthic biomass will be damaged. No effect beyond the immediate area and therefore no significant impact on local benthic community health.
1
Total 2
10.6.3.3 Impact Significance
Table 10.29 summarises impacts to biological/ecological receptors associated with piling cement discharges.

AIOC Chirag Oil Project Environmental & Socio-Economic Impact Assessment
Chapter 10: Construction, Installation and HUC Environmental Impact Assessment,
Mitigation and Monitoring
February 2010 10/32Final
Table 10.29 Impact Significance
Event Event Magnitude Receptor Sensitivity Impact Significance Piling cement discharges Low (Biological/Ecological)
LowNegligible
It is considered that impacts are minimised as far as practicable and necessary through the implementation of the existing control measures (see Table 10.3) and no additional mitigation is required.
10.6.4 Underwater Noise and Vibration
10.6.4.1 Event Magnitude
Underwater noise will result from driving the jacket foundation piles and vessel movements. It therefore has the potential to impact biological/ecological receptors (specifically seals and fish) in the marine environment
As discussed within Chapter 9: Section 9.5.1.1, an analysis of the propagation of underwater noise was undertaken in order to estimate distances at which various acoustic impacts on marine species may occur (refer to Appendix 11C). The analysis showed that the source noise levels for vessel operations (190 dB re 1 Pa at 1m) are below the levels at which lethal injury to fish and seals might occur (established as 240 dB re 1 Pa). Piling operations (210-220 dB re 1 Pa at 1m) would only give rise to direct physical injury (established as 220 dB re 1uPa) in seals at up to 1 m from the noise source. It is considered very unlikely that physical injury would occur, given existing controls and the behavioural reactions discussed below.
In terms of auditory injury, the assessment demonstrated that the levels of noise from piling and vessels could cause permanent deafness in fish and seals if they remained within 8 m of a vessel, or 40 m of a piling location, for a period of 30 minutes or more. Temporary deafness could occur in fish and seals at distances up to 350m from the noise source; again, only if the animals remained in the vicinity for a period of 30 minutes or more. In practice, it is deemed unlikely that either of these conditions would be met.
In terms of behavioural reactions, the underwater assessment determined that noise generated by vessel operations would result in complete/strong avoidance by fish with swimbladders at distances up to 3m, and seals at ranges up to 5m and mild avoidance by both fish and seals up to 15m away (Figure 10.9). The range over which underwater noise remains audible to fish and seal depends on background noise levels. In the absence of site specific data two background noise levels were considered in the underwater noise assessment; a lower background noise level (approximately 80 dB re 1 µPa), characteristic of a deep sea environment dominated by environmental (i.e. wind, rain and wave) noise, and higher background noise level (approximately 120 dB re 1 µPa), characteristic of a marine location where vessels frequently pass and operational offshore drilling platforms are present.
Under the lower background noise level scenario, it was calculated that:
Piling noise would result in complete/strong avoidance by fish with swimbladders at distances up to 1.9km, and seals at ranges up to 1.5km, mild avoidance by both fish and seals up to 15km away and would be inaudible to fish with swimbladders and seals beyond 49km from the noise source; and
Vessel noise would be inaudible to fish with swimbladders and seals beyond 44km from the noise source.
Under the higher background noise scenario, it was calculated that:
Vessel noise would be inaudible to all fish and seals beyond 1km; and Piling noise would be inaudible to all fish and seals beyond 2km.

AIOC Chirag Oil Project Environmental & Socio-Economic Impact Assessment
Chapter 10: Construction, Installation and HUC Environmental Impact Assessment,
Mitigation and Monitoring
February 2010 10/33Final
1
10
100
1000
10000
100000
0 1 2 3 4 5
Vessel (Non sw im bladder fish)
Vessel (Seals)
Vessel (Sw im bladder fish)
Piling (Seals)
Piling (Non sw im bladder fish))
Piling (Sw im bladder f ish)
Near complete avoidance
Strong avoidance
Mild avoidance
Threshold of audibility (lower
background level)
Threshold of audibility (higher background noise) Seals and all fish:- Piling- Vessels
Figure 10.9 Predicted Distances Within Which Fish and Seals React to Underwater Piling and Vessel Noise28
Tables 10.30 and 10.31 present the justification for assigning a score of 7 and 8 to piling and vessel activities respectively, which represent Medium Event Magnitudes.
Table 10.30 Event Magnitude (Piling)
Parameter Explanation Rating Extent/Scale Underwater sound emissions may result in an avoidance response from fish/seals
at more than 1km from the noise source. 3
Frequency Underwater sound emissions from pile driving will occur up to 50 times. 2 Duration Each pile driving event will last minutes in duration. 1 Intensity Taking into account the concentration, accumulation and persistence of sound
energy in the underwater environment, it is considered that this is low intensity event.
1
Total 7
28 Refer to Appendix 11C for source data.

AIOC Chirag Oil Project Environmental & Socio-Economic Impact Assessment
Chapter 10: Construction, Installation and HUC Environmental Impact Assessment,
Mitigation and Monitoring
February 2010 10/34Final
Table 10.31 Event Magnitude (Vessels)
Parameter Explanation Rating Extent/Scale Underwater sound emissions are unlikely to result in an avoidance response from
fish/seals beyond 15m from the noise source. 1
Frequency Underwater sound emissions occur continuously over installation and HUC phase. 3 Duration Underwater sound emissions will occur over the installation and HUC phase. 3 Intensity Taking into account concentration, accumulation and persistence of sound energy
in the underwater environment, intensity is low. 1
Total 8
10.6.4.2 Receptor Sensitivity
The only relevant biological receptors to underwater noise are seals and fish29.
Seals and Fish
Piling activities will take place at the WC-PDQ platform location and vessel movements will occur along support vessel routes from the Logistics Supply Base located at the BDJF yard to the platform location.
Recent data indicates that endangered species such as seals and sturgeon are not common in the ACG Contract Area (Appendix 6B) and that the WC-PDQ platform location is not located in an important breeding or migration area for either species. However, Kilka and Mullet are present in the Contract Area.
Table 10.32 presents the justification for assigning a score of 2, which represents Low Receptor Sensitivity.
Table 10.32 Receptor Sensitivity
Parameter Explanation Rating Resilience Possibility that species may be temporarily affected by underwater piling and
vessel noise but effect would be short term and limited. Ecological functionality will be maintained.
1
Presence The fish most likely to be present for extended periods of time in the ACG Contract Area and at the WC PDQ location are Kilka and Mullet throughout the year. However, neither the COP location nor the ACG Contract Area is exclusively used by these species and the Contract Area is not considered to be of primary importance.
1
Total 2
10.6.4.3 Impact Significance
Table 10.33 summarises impacts to seal and fish associated with jacket foundation piling and vessel movements.
29 Plankton cannot sense the low frequency sound generated because the wavelength is longer than the organism and benthic invertebrates do not have sophisticated sound-sensing apparatus.

AIOC Chirag Oil Project Environmental & Socio-Economic Impact Assessment
Chapter 10: Construction, Installation and HUC Environmental Impact Assessment,
Mitigation and Monitoring
February 2010 10/35Final
Table 10.33 Impact Significance
Event Event Magnitude Receptor Sensitivity
Impact Significance
Jacket foundation piling and vessel movements
Medium (Seals & Fish) Low
Minor Negative
It is considered that impacts are minimised as far as practicable and necessary through the implementation of the existing control measures (see Table 10.3) and no additional mitigation is required.
10.6.5 Seabed Disturbance
10.6.5.1 Event Magnitude
Installation of infield pipelines will involve two forms of disturbance:
Temporary disturbance from the repeated relocation of the anchors used to control the position of the pipe-lay barge; and
Permanent disturbance arising from the presence of the pipelines on the seabed.
The pipelines are all of relatively small diameter (maximum 30 inches). The maximum possible disturbance would therefore be the longitudinal area of each pipeline. In total the COP infield pipelines are planned to occupy an area of 0.08km2, 0.02% of the Contract Area (refer to Chapter 5: Section 5.5). In practice, it is likely that the majority of organisms within this area would be sufficiently mobile to re-establish themselves on either side of the pipeline since this would involve movement of only 30cm to 40cm at most. The presence of the pipelines will subsequently render a small area of seabed unavailable to benthic organisms. However, this is a very small fraction of the available area and would have no measurable effect on local benthic productivity.
The concrete coating of the pipeline is chemically inert by design (in order to protect the pipeline over several decades), and will have no effect on either the adjacent sediments or water column.
Table 10.34 presents the justification for assigning a score of 4, which represents a Low Event Magnitude.
Table 10.34 Event Magnitude
Parameter Explanation Rating Extent/Scale
Disturbance will be limited to areas of anchor setting and the area occupied by the COP infield pipelines.
1
Frequency Once only per pipeline. 1 Duration Disturbance events will be of short duration. 1 Intensity Physical disturbance only, within small areas and no potential for lasting damage. 1 Total 4
10.6.5.2 Receptor Sensitivity
Fish, seals and plankton are not considered to be sensitive to physical seabed disturbance. Benthic invertebrates are the primary receptor but the nature of the disturbance is largely limited to temporary physical displacement.
The primary impact associated with anchor setting and chain drag will be the disturbance and displacement of the sediment. The organisms living in the sediment are too small to be

AIOC Chirag Oil Project Environmental & Socio-Economic Impact Assessment
Chapter 10: Construction, Installation and HUC Environmental Impact Assessment,
Mitigation and Monitoring
February 2010 10/36Final
crushed by anchors and chain drag, although a small amount of mortality might occur at the point where the anchor initially impacts the seabed.
The displacement of sediment will not cause significant levels of mortality in benthic organisms. A small proportion of animals may be buried too deeply to recover to a position near the sediment surface, but the majority of organisms will be able to re-establish themselves once the anchor and chain have been moved to their next position.
Table 10.35 presents benthic invertebrates’ Receptor Sensitivity.
Table 10.35 Receptor Sensitivity
Parameter Explanation Rating Presence No unique, rare or threatened benthos species present. 1 Resilience Physical displacement of organisms will have limited short-term effects and is not
predicted to cause significant long-term damage. 1
Total 2
10.6.5.3 Impact Significance
Table 10.36 presents the marine impacts associated with seabed disturbance during the construction, installation and HUC phase.
Table 10.36 Impact Significance
Event Event Magnitude Receptor Sensitivity
Impact Significance
Seabed disturbance from anchor handling and pipelay
Low (Benthic Invertebrates)
Low
Negligible
It is considered that impacts are minimised as far as practicable and necessary (Table 10.3).

AIOC Chirag Oil Project Environmental & Socio-Economic Impact Assessment
Chapter 10: Construction, Installation and HUC Environmental Impact Assessment,
Mitigation and Monitoring
February 2010 10/37Final
10.6.6 Other Discharges
10.6.6.1 Event Magnitude
Other discharges to sea will result from the operation of jacket and pipeline installation vessels (refer to Section 10.4.3. above) and pipeline installation. These will comprise:
Ballast Water – Support vessels will occasionally take up and discharge ballast water during installation support activities.
Vessel ballast tanks are designed to ensure that ballast water does not come into contact with oil or chemicals. Uptake and discharge are not considered to present a significant environmental hazard.
Treated Black Water – Black water will be treated in accordance with MARPOL 73/78 Annex IV (as revised in 2004) requirements and sludge will be shipped to shore. During pipelay, based on 280 POB and an expected generation rate of 0.1m3/person/day, approximately 28m3 of treated effluent will be discharged per day. The flow rate is low, so the effluent will be rapidly diluted close to the point of discharge. Total suspended solids, BOD and coliforms at the proposed treatment level do not pose any risk of environmental impact.
Grey Water - Grey water (approximately 62m3 per day) will be discharged directly to sea. Grey water (from showers, laundry etc) will contain only dilute cleaning agents (soaps, detergents) and the impact of discharge will be minimal.
Drainage - Drainage (including deck drainage and washdown water) will be discharged directly to sea, provided no visible sheen is observable. No contaminated water will be discharged and so no environmental impact is anticipated.
Oil Line Wye Spool Water – approximately 65m3 of seawater containing hydrotest chemicals will be released as the section of existing pipeline is removed to accommodate the new wye piece (refer to Chapter 5: Table 5.19). This water may contain some residual hydrocarbons at concentrations estimated not to exceed 100 mg/l. The volume of the discharge is sufficiently small that hydrocarbon concentrations would be reduced to very low levels within a few metres of the source.
Event Magnitude is summarised in Table 10.37.

AIOC Chirag Oil Project Environmental & Socio-Economic Impact Assessment
Chapter 10: Construction, Installation and HUC Environmental Impact Assessment,
Mitigation and Monitoring
February 2010 10/38Final
Table 10.37 Event Magnitude
10.6.6.2 Receptor Sensitivity
All of the discharges are low in volume (with the exception of sewage chlorination of treated black water) and do not contain toxic or persistent process chemicals. Receptors are not considered to be sensitive to these small discharges.
Table 10.38 presents the justification for assigning a score of 2, which represents Low Receptor Sensitivity.
Event Parameter / Discharge Ballast Water Black Water Grey Water Drainage Oil Line Wye
Spool Water Scale 1 1 1 1 1 Frequency 2 3 3 3 1 Duration 1 3 3 3 1 Intensity 1 1 1 1 1 Event Magnitude 5 8 8 8 4
Ballast Water:
Treated Black Water:
Grey Water:
Drainage:
Oil Line Wye Spool Water:

AIOC Chirag Oil Project Environmental & Socio-Economic Impact Assessment
Chapter 10: Construction, Installation and HUC Environmental Impact Assessment,
Mitigation and Monitoring
February 2010 10/39Final
Table 10.38 Receptor Sensitivity (All Receptors)
Parameter Explanation Rating Resilience The extremely low level of exposure is equivalent to high resilience. 1 Presence There is no significant presence of rare, unique or endangered species (i.e. the
risk of exposure for any such species is close to zero). 1
Total 2
10.6.6.3 Impact Significance
Table 10.39 summarises the impact of other discharges to sea on seals, fish, zooplankton, phytoplankton and benthic invertebrates based on the impact significance criteria presented in Chapter 3: Impact Assessment Methodology.
Table 10.39 Impact Significance
It is considered that impacts are minimised as far as practicable and necessary through the implementation of the existing control measures (see Table 10.3) and no additional mitigation is required.
Event Event Magnitude Receptor Sensitivity
Impact Significance
Other Discharges to Sea Ballast Water
Medium (All Receptors) Low
Minor Negative
Other Discharges to Sea Treated Black Water
Medium (All Receptors) Low
Minor Negative
Other Discharges to Sea Grey Water
Medium (All Receptors) Low
Minor Negative
Other Discharges to Sea Drainage
Medium (All Receptors) Low
Minor Negative
Other Discharges to Sea Oil Line Wye Spool Water
Low (All Receptors) Low
Negligible

AIOC Chirag Oil Project Environmental & Socio-Economic Impact Assessment
Chapter 10: Construction, Installation and HUC Environmental Impact Assessment,
Mitigation and Monitoring
February 2010 10/40Final
10.7 Summary of COP Construction, Installation and HUC Residual Environmental Impacts
For all construction, installation and HUC phase environmental impacts assessed it has been concluded that impacts are minimised as far as practicable and necessary through the implementation of the existing control measures (see Table 10.3) and no additional mitigation is required. Should it be necessary to undertake synchronisation tests of the platform generators at night, additional mitigation will comprise consultation will take place in the local community (within 700m of the sound source) to ensure that impacts are no more than moderate negative.
Table 10.40 summaries the residual environmental impacts for the construction, installation and HUC phase of the project.
Table 10.40 Summary of Construction, Installation and HUC Residual Environmental Impacts
Event Event Magnitude
Receptor Sensitivity
Impact Significance
Emissions from yard generators and engines Medium MediumModerate Negative
Emissions from onshore platform generator commissioning
Medium MediumModerate Negative
Emissions from support vessel engines Medium Low Minor Negative
Noise from construction yard plant Medium MediumModerate Negative
Noise from onshore platform generator commissioning
Medium MediumModerate Negative
Underwater noise from jacket foundation piling and vessel movements
Medium Low Minor Negative
Cooling water discharge from onshore commissioning of topside Medium Low Minor Negative
Pipeline hydrotest discharge Medium Low Minor Negative
Discharge of oil line wye spool water Low Low Negligible
Jacket foundation pile cement discharge Low Low Negligible
Support vessel ballast water discharge Medium Low Minor Negative
Support vessel treated black water discharge Medium Low Minor Negative
Support vessel grey water discharge Medium Low Minor Negative
Support vessel drainage discharge Medium Low Minor Negative
Seabed disturbance from anchor handling and pipelay
Low Low Negligible

AIOC Chirag Oil Project Environmental & Socio-Economic Impact Assessment
Chapter 11: Operations Environmental Impact Assessment,
Mitigation and Monitoring
February 2010 11/1 Final
Chapter 11 Operations Impact Assessment, Mitigationand Monitoring
Contents
11.1 Introduction........................................................................................................................311.2 Scoping Assessment.........................................................................................................311.3 Existing Controls, Monitoring and Reporting.....................................................................611.4 Impacts to the Atmosphere .............................................................................................13
11.4.1 Offshore Operations ...........................................................................................1311.4.2 Support Vessels .................................................................................................1811.4.3 Onshore Operations ...........................................................................................20
11.5 Impacts to the Marine Environment ................................................................................23 11.5.1 Underwater Noise and Vibration ........................................................................2311.5.2 Drilling Discharges..............................................................................................2611.5.3 Cement Discharges............................................................................................3111.5.4 Produced Water Discharge ................................................................................3311.5.5 Water Intake/Entrainment and Cooling Water Discharge ..................................3811.5.6 Pigging Discharge ..............................................................................................4111.5.7 Other Discharges................................................................................................43
11.6 Summary of COP Operations Phase Residual Environmental Impacts .........................46
List of Figures
Figure 11.1 WC-PDQ Platform Predicted Long Term NO2 Concentrations Under Routine Conditions 14 Figure 11.2 WC-PDQ Platform Predicted Short Term NO2 Concentrations From Flaring - Restricted Gas Export at a) Regional Scale b) Local Scale 15 Figure 11.3 WC-PDQ Platform Predicted Short Term NO2 Concentrations From Flaring Due
to Emergency Shutdown Flaring at a) Regional Scale b) Local Scale 16Figure 11.4 Predicted Maximum 1 Hour Peak NO2 Concentrations Moving South West from the Terminal (Emergency Shutdown Flaring of All ACG Facilities) 21 Figure 11.5 Predicted Distances Within Which Seals and Fish React to Underwater Hammering, Drilling and Vessel Noise 24 Figure 11.6 Barite Deposition Thickness Contour Plots (Discharge from Caisson at 136m depth - 28 wells) 28 Figure 11.7 Produced Water Dispersion Plumes Under Stagnant and Dominant Current Conditions 35 Figure 11.8 Temperature Contour Plots for Summer and Winter (Stagnant and Predominant Current Conditions) 39
List of Tables
Table 11.1 “Scoped Out” COP Operations Routine and Non-routine Activities 4 Table 11.2 “Assessed” COP Routine and Non-routine Operations Activities 6 Table 11.3 COP Operations Existing Controls, Monitoring and Reporting 7 Table 11.4 Event Magnitude (Routine Operations) 17 Table 11.5 Event Magnitude (Non-Routine Operations: Flaring) 17 Table 11.6 Human Receptor Sensitivity 18 Table 11.7 Biological/Ecological Receptor Sensitivity 18 Table 11.8 Impact Significance 18 Table 11.9 Event Magnitude 19 Table 11.10 Impact Significance 19 Table 11.11 Event Magnitude (Routine Operations) 21 Table 11.12 Event Magnitude (Non-Routine Operations: Flaring) 22 Table 11.13 Human Receptor Sensitivity 22 Table 11.14 Biological/Ecological Receptor Sensitivity 22

AIOC Chirag Oil Project Environmental & Socio-Economic Impact Assessment
Chapter 11: Operations Environmental Impact Assessment,
Mitigation and Monitoring
February 2010 11/2 Final
Table 11.15 Impact Significance 23 Table 11.16 Event Magnitude (Hammering) 25 Table 11.17 Event Magnitude (Drilling) 25 Table 11.18 Event Magnitude (Vessels) 25 Table 11.19 Receptor Sensitivity 26 Table 11.20 Impact Significance 26 Table 11.21 Predicted Distribution of Discharged Drill Cuttings from MODU Drilling (136m Depth Discharge) 27 Table 11.22 Event Magnitude 29 Table 11.23 Receptor Sensitivity 30 Table 11.24 Receptor Sensitivity 30 Table 11.25 Receptor Sensitivity 31 Table 11.26 Impact Significance 31 Table 11.27 Event Magnitude 32 Table 11.28 Receptor Sensitivity 32 Table 11.29 Impact Significance 32 Table 11.30 Event Magnitude 34 Table 11.31 Results of Terminal Produced Water and Seawater Analysis 35 Table 11.32 Receptor Sensitivity 37 Table 11.33 Impact Significance 37 Table 11.34 Event Magnitude 40 Table 11.35 Receptor Sensitivity 40 Table 11.36 Impact Significance 41 Table 11.37 Event Magnitude 42 Table 11.38 Receptor Sensitivity 42 Table 11.39 Impact Significance 42 Table 11.40 Event Magnitude 44 Table 11.41 Receptor Sensitivity (All Receptors) 45 Table 11.42 Impact Significance 45 Table 11.43 Summary of Operations Residual Environmental Impacts 46

AIOC Chirag Oil Project Environmental & Socio-Economic Impact Assessment
Chapter 11: Operations Environmental Impact Assessment,
Mitigation and Monitoring
February 2010 11/3 Final
11.1 Introduction
This Chapter of the Chirag Oil Project (COP) Environmental and Socio-Economic Impact Assessment (ESIA) presents the assessment of environmental and socio-economic impacts associated with the following elements of the COP operations phase:
Platform Drilling; Offshore Operations and Production; and Terminal Operations.
The impact assessment methodology followed and the structure of the COP impact assessment are described in full within Chapters 3 and 9 of this ESIA respectively.
11.2 Scoping Assessment
The COP Operations Activities and Events have been determined based on the COP Base Case as detailed within Chapter 5: Project Description (see Appendix 11A).
Table 11.1 presents the Activities and associated Events that have been scoped out of the full assessment process, due to their limited potential to result in discernable environmental impacts. Judgement is based on prior experience of similar Activities and Events, especially with respect to earlier ACG developments. In some instances, scoping level quantification/numerical analysis has been used to justify the decision. Reference is made to relevant quantification, analysis, survey and/or monitoring reports in these instances.


AIOC Chirag Oil Project Environmental & Socio-Economic Impact Assessment
Chapter 11: Operations Environmental Impact Assessment,
Mitigation and Monitoring
February 2010 11/6Final
The COP routine and non-routine Activities and their associated Events assessed in accordance with the full impact assessment process are presented in Table 11.2.
Table 11.2 “Assessed” COP Routine and Non-routine Operations Activities
*Key: Ops = Offshore Operations, Ter = Onshore Operations Note: GHG Emissions are addressed in Chapter 13
11.3 Existing Controls, Monitoring and Reporting
Existing control measures, monitoring and reporting requirements relevant to the COP operations routine and non-routine Activities are provided in Table 11.3 and form part of the AzSPU Integrated HSSE Management System (refer to Chapter 14 for further details).
ID* Activity Ch. 5 Project Description Reference
Event Receptor
Ops-R1
Predrill well tie-in and re-entry
5.7.3 Underwater noise and vibration Marine
Environment
Drilling discharges to sea Ops-R2
Driving conductor section and drilling surface hole section with WBM
5.7.4Underwater noise and vibration
MarineEnvironment
Ops-NR3
Discharge of WBM residual mud
5.7.4 Drilling discharges to sea MarineEnvironment
Ops-R4
Cement losses during casing cementing
5.7.7.1 and 5.3.2.5
Cement discharges to sea MarineEnvironment
Ops-NR5
Excess cement discharge to sea
5.7.7.1 and 5.3.2.5
Cement discharges to sea Marine
Environment
Ops-R6
Power generation, cranes, emergency generator testing, purge and pilot flaring
5.8.6.3 and 5.8.6.5
Emissions to atmosphere (non GHG)
Atmosphere
Ops-NR7
Non-routine platform flaring
5.8.6.6Emissions to atmosphere (non GHG)
Atmosphere
Ops-NR8
Non-routine produced water discharge
5.8.4 Produced water discharges to sea Marine
Environment
Water intake/entrainment Ops-R9
Seawater lift and cooling water discharge
5.8.6.6Cooling water discharge to sea
MarineEnvironment
Ops-R11 Platform drainage 5.8.6.11 Other discharges to sea
MarineEnvironment
Ops-R12
Sewage and galley waste discharges
5.8.6.14 and 5.8.6.15
Other discharges to sea Marine
Environment
Ops-R14
Maintenance of produced water and injection water pipelines (pigging)
5.8.7 Pigging discharge to sea Marine
Environment
Emissions to atmosphere (non GHG)
Atmosphere
Underwater noise and vibration Ops-R15
Support vessel operations
5.8.8
Other discharges to sea Marine
Environment
Ter-R1
Use of existing terminal processing and storage facilities
5.9.4Emissions to atmosphere (non GHG)
Atmosphere
Ter-NR2
Non-routine flaring associated with COP at the terminal
5.9.4Emissions to atmosphere (non GHG)
Atmosphere

ATMOSPHERE

ATMOSPHERE MARINEENVIRONMENT

MARINE ENVIRONMENT

MARINE ENVIRONMENT

MARINE ENVIRONMENT

MARINE ENVIRONMENT

AIOC Chirag Oil Project Environmental & Socio-Economic Impact Assessment
Chapter 11: Operations Environmental Impact Assessment,
Mitigation and Monitoring
February 2010 11/13 Final
11.4 Impacts to the Atmosphere
11.4.1 Offshore Operations
11.4.1.1 Event Magnitude
Routine emissions during offshore operations will arise from use of the main power generators, platform cranes, testing of the emergency generators, fire water pumps and pilot/purge flaring. Non-routine emissions will arise from flaring due to emergencies and/or equipment malfunctions, repairs or maintenance or lack of availability for associated gas export15,16 (refer to Chapter 5: Sections 5.8.6.4 - 5.8.6.6). In addition, during platform commissioning and start up, while it is planned to use fuel gas received from the “buy back system” from the 28” marine export gas pipeline, it may be necessary to use temporary diesel generators (refer to Chapter 5: Section 5.6.4 and Appendix 5A).
Modelling undertaken for the offshore operations is presented in Appendix 11B. The modelling focuses on NOX (which comprises nitrous oxide (NO) and nitrogen dioxide (NO2)) as the main atmospheric pollutant of concern, based on the larger predicted emission volumes as compared to other pollutants (SOx, CO and non methane hydrocarbons) and the potential to impact upon human health and the environment.
Short term (1 hour maximum) and long term (annual average) NO2 concentrations were modelled to assess the contribution of emissions from COP offshore operations in the context of relevant standards for NO2
17. These standards are relevant to locations where humans are normally resident (i.e. onshore settlements) and do not apply to commercial locations and workers, which are subject to standards under separate occupational health requirements.
The modelling conservatively assumed that, for the long term, all NOX is NO2 and for the short term, 50% of NOX is NO2, the remainder being NO. A background NO2 concentration of 5.0µg/m3 was assumed based on previous monitoring data obtained along the Sangachal coastline (refer to Chapter 6: Section 6.4.2). Both routine and non-routine operation (i.e. including flaring associated with restricted gas export and emergency shutdown flaring) of the platform was modelled18.
The results demonstrated that, during routine operations, the long term concentration of NO2
is predicted to increase by 0.3µg/m3 2km from the platform, reducing to background concentrations at a maximum distance of 14km to the south and approximately 12km to the north (see Figure 11.1).
15 As defined within Article XV of the ACG PSA. 16 Accidental events and emergencies are discussed in Chapter 13. 17 Applicable 1 hour average (short term) and annual average (long term) standards for NO2 are 200µg/m3 and 40µg/m3 respectively. 18 Appendix 11B provides full details of modelling input and assumptions, for model limitations and sources of uncertainty.

AIOC Chirag Oil Project Environmental & Socio-Economic Impact Assessment
Chapter 11: Operations Environmental Impact Assessment,
Mitigation and Monitoring
February 2010 11/14 Final
Figure 11.1 WC-PDQ Platform Predicted Long Term NO2 Concentrations Under Routine Conditions
No exceedances of the onshore long term air quality standard at any distance from the WC-PDQ platform and no discernable change in NO2 concentrations onshore were predicted19.
Non-routine flaring undertaken at the platform due to restricted gas export will typically be a short term event and would be expected to last, at worst, a number of hours in duration20. The modelling for this scenario demonstrates that the maximum short term concentration of NO2 is predicted to be 10.5µg/m3 at a distance of 1.2km south of the WC-PDQ platform, reducing to 7µg/m3 at a distance of 1.95km. Figure 11.2 shows the results obtained on a a) regional and b) local scale.
19 Historically in Azerbaijan ambient concentrations of NO2, SO2, CO and PM10 have also been assessed against specific 24 hour and 1 hour standards. These standards were not derived using the same health based criteria as the IFC, WHO and EU guideline values and the standards derived are not widely recognised. However, Appendix 11B (Update 1) includes an assessment of expected air quality concentrations against these standards for completeness. The modelling demonstrated that none of these standards would be exceeded during routine platform operations or during non routine flaring. 20 It should be noted that non routine flaring during platform start up may extend for longer periods, however the flowrate of hydrocarbon flared and the associated emission release rates will be less than the restricted gas export scenario modelled.
0
5000
5000
10000
10000
05000 5000 10000 15000 20000
Distance from Source (m)
µg/m3
5.0
Onshore annual mean long term standard = 40µg/m3
5.2
5.3
5.4
5.5

AIOC Chirag Oil Project Environmental & Socio-Economic Impact Assessment
Chapter 11: Operations Environmental Impact Assessment,
Mitigation and Monitoring
February 2010 11/15 Final
Figure 11.2 WC-PDQ Platform Predicted Short Term NO2 Concentrations From Flaring - Restricted Gas Export at a) Regional Scale b) Local Scale21
As a worst case, an emergency depressurisation may be necessary, whereby the platform is isolated from production and export pipelines and the process inventory on the platform is directed to flare. The complete depressurisation of a platform is rapid and typically most of the inventory is flared within one hour.
21 A larger grid size was used when modelling at the regional scale, leading to slight variations in the concentration plots
0
5000
5000
10000
10000
05000 5000 10000 15000 20000Distance from Source (m)
Onshore peak 1 hour short term standard = 200µg/m3
µg/m3
5.0
5.5
6.0
7.0
10.0
10.5
b)
a)
5.50
6.00
6.50
7.00
10.50
0 30 60km

AIOC Chirag Oil Project Environmental & Socio-Economic Impact Assessment
Chapter 11: Operations Environmental Impact Assessment,
Mitigation and Monitoring
February 2010 11/16 Final
Under emergency flaring conditions, the modelling demonstrates that the maximum short term concentration of NO2 is predicted to be 10.5µg/m3 at a distance of 6.9km from the WC-PDQ platform, reducing to 7µg/m3 at a distance of 14km (Figure 11.3).
Figure 11.3 WC-PDQ Platform Predicted Short Term NO2 Concentrations From Flaring Due to Emergency Shutdown Flaring at a) Regional Scale b) Local Scale22
22 A larger grid size was used when modelling at the regional scale, leading to slight variations in the concentration plots
0
5000
5000
10000
10000
05000 5000 10000 15000 20000Distance from Source (m)
Onshore peak 1 hour short term standard = 200µg/m3
µg/m3
5.0
5.5
6.0
7.0
10.0
10.5
DWG
West Chirag
Chirag-1
West Azeri
East Azeri
Central Azeri
b)
a)
5.50
6.00
6.50
7.00
10.50
0 30 60km

AIOC Chirag Oil Project Environmental & Socio-Economic Impact Assessment
Chapter 11: Operations Environmental Impact Assessment,
Mitigation and Monitoring
February 2010 11/17 Final
For both the restricted gas export and emergency scenarios modelled, no exceedances of the onshore short term air quality standard at any distance from the WC-PDQ platform and no discernable change in NO2 concentrations onshore were predicted. Short term concentrations onshore will increase by less than 1µg/m3, which represents less than 1% of the short term standard. Once non-routine flaring ceases and routine operations commence, emissions from these flaring events will disperse rapidly in the atmosphere and NO2 concentrations will return to those forecast for routine operations (Figure 11.1)19.
Based on efficient operation and regular maintenance, operation of the platform generators and flaring will not result in plumes of visible particulates.
Tables 11.4 and 11.5 present the justification for assigning a score of 8 to emissions from routine and non-routine offshore operations, which represents Medium Event Magnitude.
Table 11.4 Event Magnitude (Routine Operations)
Parameter Explanation Rating Extent / Scale Increases in concentrations of pollutant species will be indiscernible from
background concentrations at onshore receptors. 1
Frequency Emissions will continuously throughout offshore operations. 3 Duration Emissions will occur throughout the offshore operations phase. 3 Intensity Modelled long and short term concentrations of key pollutant, NO2, are predicted
to be significantly below relevant ambient air quality standards. 1
Total 8
Table 11.5 Event Magnitude (Non-Routine Operations: Flaring)
Parameter Explanation Rating Extent/Scale Increases in concentrations of pollutant species will be indiscernible from
background concentrations at onshore receptors. 1
Frequency Non-routine flaring will typically occur periodically for short periods throughout offshore operations.
3
Duration Non-routine flaring will typically occur for periods of hours. 1 Intensity Modelled long and short term concentrations of key pollutant, NO2, are predicted
to be significantly below relevant ambient air quality standards. 1
Total 6
11.4.1.2 Receptor Sensitivity
Human Receptors
Table 11.6 presents the justification for assigning a score of 2, which represents Low Receptor Sensitivity.

AIOC Chirag Oil Project Environmental & Socio-Economic Impact Assessment
Chapter 11: Operations Environmental Impact Assessment,
Mitigation and Monitoring
February 2010 11/18 Final
Table 11.6 Human Receptor Sensitivity
Parameter Explanation Rating Presence There are no permanently present (i.e. resident) human receptors within 60km of the
platform location.1
Resilience Changes in air quality onshore associated with emissions from COP offshore operations will be indiscernible. Onshore receptors will be unaffected.
1
Total 2
Biological/Ecological Receptors
Table 11.7 presents the justification for assigning a score of 2, which represents Low Receptor Sensitivity.
Table 11.7 Biological/Ecological Receptor Sensitivity
Parameter Explanation Rating Presence Marine/bird species are mobile and will not be present at one location for long
periods of time. The Contract Area is not located within a bird migration flyover route. Birds found in the area will be transient and not resident.
1
Resilience Volume of emissions released (including visible particulates) due to power generation will create a very small increase in pollutant concentrations in the atmosphere and in any washout from rainfall, which will not be discernable to biological/ecological receptors23.
1
Total 2
11.4.1.3 Impact Significance
Table 11.8 summarises impacts on air quality associated with offshore operations.
Table 11.8 Impact Significance
Event Event Magnitude
Receptor Sensitivity Impact Significance
(Humans) Low Minor Negative Offshore power generation and non-routine flaring
Medium(Biological/Ecological)
Low Minor Negative
It is considered that impacts are minimised are far as practicable and necessary through the implementation of the existing control measures (refer to Table 11.3) and no additional mitigation is required.
11.4.2 Support Vessels
11.4.2.1 Event Magnitude
As stated within Chapter 5: Section 5.8.8, support vessels will be required throughout the operations phase to supply consumables (e.g. drilling mud, diesel) to the platform and ship solid and liquid waste to shore for treatment and disposal. A worst case of one return vessel trip per week has been assumed for the operational phase.
23 Note that ambient air quality standards are not relevant to biological/ecological receptors.

AIOC Chirag Oil Project Environmental & Socio-Economic Impact Assessment
Chapter 11: Operations Environmental Impact Assessment,
Mitigation and Monitoring
February 2010 11/19 Final
Emissions of the key pollutant relevant to human health, NOx, are expected to be considerably lower from vessels (approximately 456 tonnes) than those anticipated from worst case WC-PDQ platform emissions (approximately 9,535 tonnes)24. Emissions from vessel movements will disperse rapidly across a relatively large geographic area, and it is expected that, as for modelled platform emissions, increases in NO2 concentrations will be insignificant and indiscernible from background levels at onshore receptors.
Based on efficient operation, regular maintenance, planned use of good quality, and low sulphur fuel, routine operation of the vessels will not result in large plumes of visible particulates from the vessel engine exhausts25.
Table 11.9 presents the justification for assigning a score of 6, which represents a Medium Event Magnitude.
Table 11.9 Event Magnitude
Parameter Explanation Rating Extent/Scale Increases in concentrations of pollutant species will be indiscernible from
background concentrations at all distances from the emission source. 1
Frequency Emissions will occur more than 50 times. 3 Duration Emissions will occur for up to 24 hours. 1 Intensity Long and short term concentrations of key pollutant, NO2, are predicted to be
significantly below relevant ambient air quality standards. 1
Total 6
11.4.2.2 Receptor Sensitivity
In terms of Emissions to Atmosphere, Receptor Sensitivity is considered to be the same regardless of the Event. As per Section 11.4.1.2, Receptor Sensitivity is Low (2) for both human and biological/ecological receptors.
11.4.2.3 Impact Significance
Table 11.10 summarises impacts on air quality associated with support vessels during the operations phase.
Table 11.10 Impact Significance
Event Event Magnitude
Receptor Sensitivity Impact Significance
(Humans) Low Minor Negative Support Vessel Engines Medium
(Biological/Ecological) Low Minor Negative
It is considered that impacts are minimised are far as practicable and necessary through the implementation of the existing control measures (refer to Table 11.3) and no additional mitigation is required.
24 Incorporating platform power generation and emergency flaring. 25 Note that SO2 emissions from vessels are expected to be approximately 0.1% of platform SO2 emissions (Refer to Appendix 5A)

AIOC Chirag Oil Project Environmental & Socio-Economic Impact Assessment
Chapter 11: Operations Environmental Impact Assessment,
Mitigation and Monitoring
February 2010 11/20 Final
11.4.3 Onshore Operations
11.4.3.1 Event Magnitude
Emissions at the Sangachal Terminal from COP onshore activities will be associated with an increased load on existing heaters and turbines, increased oil storage (resulting in VOC emissions) and an increase in non-routine flaring.
As demonstrated within Figure 5.21 of Chapter 5, the predicted emissions from the COP are not expected to exceed the forecast peak emissions associated with ACG Phases 1 - 3 (due to predicted reductions in emissions from these ACG Phases during the COP’s lifetime26).
Air dispersion modelling was carried out for the ACG Phase 3 ESIA (Appendix 11, ACG Phase 3 ESIA), including EOP, ACG Phase 1, 2 and 3 and Shah Deniz Gas Export Stage 1. Emissions were modelled at the stages they were likely to be highest (i.e. during start up and at peak production):
EOP, ACG Phase 1, 2, Shah Deniz in normal operation plus ACC Phase 3 start up (2008); and
EOP, ACG Phase 1, 2, 3 and Shah Deniz in normal operation (2010), at peak production.
In addition, the following emergency shutdown (ESD) scenarios were modelled:
EOP, ACG Phase 1, 2, 3 and Shah Deniz operation with the addition of ESD of ACG FFD via elevated flare at a rate of 100 MMscfd for 1 hour; and
ACG Phase 1, 2, 3 EOP and Shah Deniz operation with the addition of ESD of Shah Deniz via ground flare at a rate of 990 MMscfd.
At Sangachal Town (approximately 2.5km south west of the Terminal), the modelling demonstrates that, under worst case conditions, assuming emergency shutdown of all ACG platforms, the short term concentration of NO2 is predicted to increase by 63.7µg/m3 above the background short term concentration of 8µg/m3. The annual mean NO2 concentration is predicted to increase by 0.8µg/m3. Figure 11.4 shows the predicted short term NO2
concentrations moving south west.
26 Similarly, light and noise levels generated by Terminal operations are not expected to increase above existing levels as a result of the Terminal receiving COP derived oil and gas.

AIOC Chirag Oil Project Environmental & Socio-Economic Impact Assessment
Chapter 11: Operations Environmental Impact Assessment,
Mitigation and Monitoring
February 2010 11/21 Final
Figure 11.4 Predicted Maximum 1 Hour Peak NO2 Concentrations Moving South West from the Terminal (Emergency Shutdown Flaring of All ACG Facilities)
The modelling of onshore air emissions indicates that under all reasonable normal and worst case plant conditions (i.e. normal operation and emergency/upset worst case flaring conditions), ambient air quality concentrations of all pollutants will comply with the relevant ambient air quality standards at the nearest residential receptors27.
Given that over its lifetime the COP is expected to contribute approximately 20% to the emissions associated with the Terminal, increases in NO2 concentrations associated with COP alone are likely to be indiscernible.
Tables 11.11 and 11.12 present the justification for assigning a score of 8 to emissions from routine and non-routine COP onshore operations, which represent Medium Event Magnitudes.
Table 11.11 Event Magnitude (Routine Operations)
Parameter Explanation Rating Extent/Scale Increases in concentrations of pollutant species associated with the COP will be
insignificant/indiscernible at residential receptors in the vicinity of the Terminal. 1
Frequency Routine emissions will occur continuously. 3 Duration Emissions will continue for the COP project lifetime. 3 Intensity Ambient air quality standards will not be exceeded at the residential receptors in
the vicinity of the Terminal. 1
Total 8
27 The modelling demonstrates that the historic Azeri 1 hour NOX standard of 85 µg/m3 will also be met.
0
50
100
150
200
250
0 0.5 1 1.5 2 2.5 3 3.5 4 4.5 5
Distance from Source (km)
Modelled Concentration
Onshore 1hour short term standard
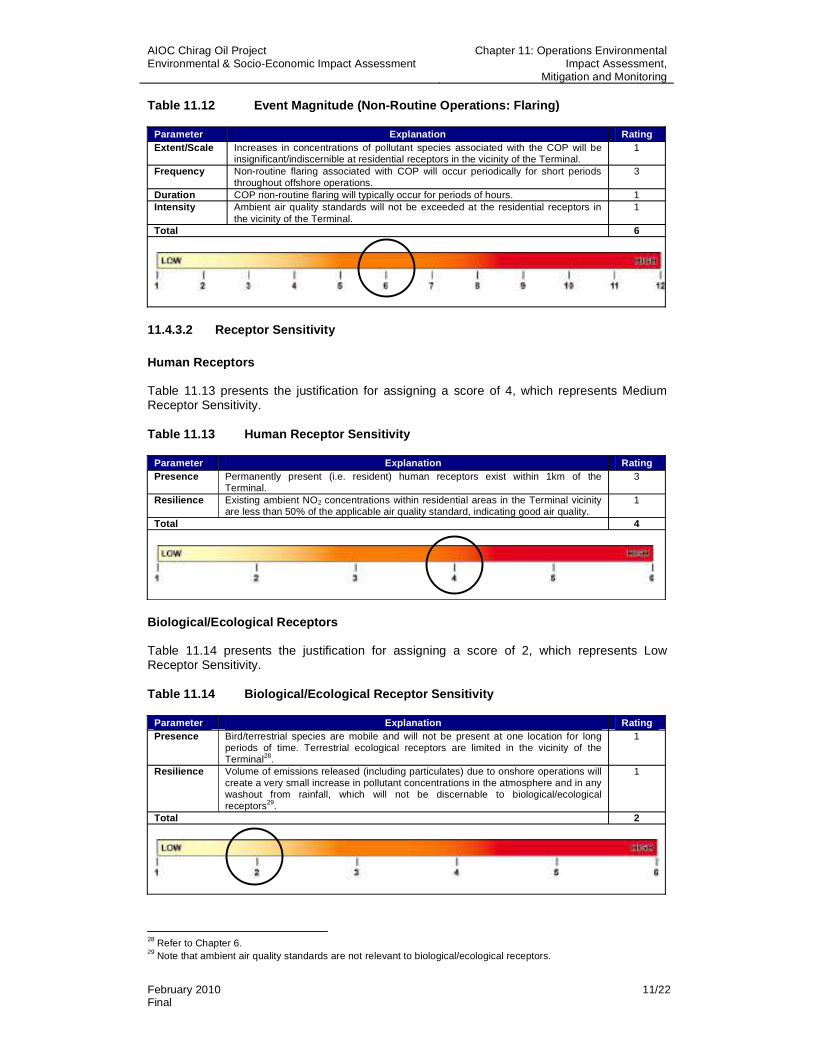
AIOC Chirag Oil Project Environmental & Socio-Economic Impact Assessment
Chapter 11: Operations Environmental Impact Assessment,
Mitigation and Monitoring
February 2010 11/22 Final
Table 11.12 Event Magnitude (Non-Routine Operations: Flaring)
Parameter Explanation Rating Extent/Scale Increases in concentrations of pollutant species associated with the COP will be
insignificant/indiscernible at residential receptors in the vicinity of the Terminal. 1
Frequency Non-routine flaring associated with COP will occur periodically for short periods throughout offshore operations.
3
Duration COP non-routine flaring will typically occur for periods of hours. 1 Intensity Ambient air quality standards will not be exceeded at the residential receptors in
the vicinity of the Terminal. 1
Total 6
11.4.3.2 Receptor Sensitivity
Human Receptors
Table 11.13 presents the justification for assigning a score of 4, which represents Medium Receptor Sensitivity.
Table 11.13 Human Receptor Sensitivity
Parameter Explanation Rating Presence Permanently present (i.e. resident) human receptors exist within 1km of the
Terminal.3
Resilience Existing ambient NO2 concentrations within residential areas in the Terminal vicinity are less than 50% of the applicable air quality standard, indicating good air quality.
1
Total 4
Biological/Ecological Receptors
Table 11.14 presents the justification for assigning a score of 2, which represents Low Receptor Sensitivity.
Table 11.14 Biological/Ecological Receptor Sensitivity
Parameter Explanation Rating Presence Bird/terrestrial species are mobile and will not be present at one location for long
periods of time. Terrestrial ecological receptors are limited in the vicinity of the Terminal28.
1
Resilience Volume of emissions released (including particulates) due to onshore operations will create a very small increase in pollutant concentrations in the atmosphere and in any washout from rainfall, which will not be discernable to biological/ecological receptors29.
1
Total 2
28 Refer to Chapter 6. 29 Note that ambient air quality standards are not relevant to biological/ecological receptors.

AIOC Chirag Oil Project Environmental & Socio-Economic Impact Assessment
Chapter 11: Operations Environmental Impact Assessment,
Mitigation and Monitoring
February 2010 11/23 Final
11.4.3.3 Impact Significance
Table 11.15 summarises impacts on air quality from onshore combustion plant emissions and flaring.
Table 11.15 Impact Significance
Event Event Magnitude
Receptor Sensitivity Impact Significance
(Humans) Medium Moderate Negative Onshore combustion plant emissions and flaring
Medium(Biological/Ecological)
Low Minor Negative
It is considered that impacts are minimised are far as practicable and necessary through the implementation of the existing control measures (see Table 11.3) and no additional mitigation is required.
11.5 Impacts to the Marine Environment
11.5.1 Underwater Noise and Vibration
11.5.1.1 Event Magnitude
Underwater noise will result from a number of operational activities including vessel movements, hydraulic hammering of the conductor drill sections and drilling of the surface and lower holes. It therefore has the potential to impact upon biological/ecological receptors (specifically seals and fish) in the marine environment.
As discussed within Chapter 9: Section 9.5.1.1, an analysis of the propagation of underwater noise was undertaken in order to estimate distances at which various acoustic impacts on marine species may occur (refer to Appendix 11C).
The analysis showed that the source noise levels for vessel operations (190 dB re 1 Pa at 1m) and drilling operations (established as 170 dB re 1 Pa) are below the levels at which lethal injury to fish and seals might occur (established as 240 dB re 1 Pa). Hammering activities (210-220 dB re 1 Pa at 1m) would only give rise to direct physical injury (established as 220 dB re 1 Pa) in seals at up to 1 m from the noise source. It is considered very unlikely that physical injury would occur, given existing controls and the behavioural reactions discussed below.
In terms of auditory injury, the assessment demonstrated that the levels of noise from hammering, drilling and vessels could cause permanent deafness in fish and seals if they remained within 8 m of a vessel or drilling location, or 40 m of a hammering location, for a period of 30 minutes or more. Temporary deafness could occur in fish and seals at distances up to 350m from the noise source; again, only if the animals remained in the vicinity for a period of 30 minutes or more. In practice, it is deemed unlikely that either of these conditions would be met.
In terms of behavioural reactions, the underwater assessment determined that noise generated by vessel and drilling activities would result in complete/strong avoidance by fish with swimbladders at distances up to 3m, and seals at ranges up to 5m and mild avoidance by both fish and seals up to 15m away (Figure 11.5). The range over which underwater noise remains audible to fish and seal depends on background noise levels. In the absence of site specific data two background noise levels were considered in the underwater noise assessment; a lower background noise level (approximately 80 dB re 1 µPa), characteristic of a deep sea environment dominated by environmental (i.e. wind, rain and wave) noise, and higher background noise level (approximately 120 dB re 1 µPa), characteristic of a marine location where vessels frequently pass and operational offshore drilling platforms are present.

AIOC Chirag Oil Project Environmental & Socio-Economic Impact Assessment
Chapter 11: Operations Environmental Impact Assessment,
Mitigation and Monitoring
February 2010 11/24 Final
Under the lower background noise level scenario, it was calculated that:
Hammering noise would result in complete/strong avoidance by fish with swimbladders at distances up to 295m, and seals at ranges up to 235m, mild avoidance by both fish and seals up to 3.9km away and would be inaudible to fish with swimbladders and seals beyond 49km from the noise source; and
Vessel and drilling noise would be inaudible to fish with swimbladders and seals beyond 44km from the noise source.
Under the higher background noise scenario, it was calculated that:
Vessel and drilling noise would be inaudible to all fish and seals beyond 1km; and Hammering noise would be inaudible to all fish and seals beyond 2km.
Figure 11.5 Predicted Distances Within Which Seals and Fish React to Underwater Hammering, Drilling and Vessel Noise30
Tables 11.16, 11.17 and 11.18 present the justification for assigning a score of 8 to drilling, vessel and hammering activities, which represent Medium Event Magnitudes.
30 Refer to Appendix 11C for source data.
1
10
100
1000
10000
100000
0 1 2 3 4 5
Hammering (Sw im bladder fish)Hammering (Seals)Hammering (Non sw im bladder f ish)Vessel (Sw im bladder f ish)Vessel (Seals)Vessel (Non sw im bladder fish)Drilling (Sw im bladder fish)Drilling (Seals)Drilling (Non sw im bladder f ish)
Near complete avoidance
Strong avoidance
Mild avoidance
Threshold of audibility (lower
background level)
Threshold of audibility (higher background noise) Seals and all f ish:- Hammering- Vessels & Drilling

AIOC Chirag Oil Project Environmental & Socio-Economic Impact Assessment
Chapter 11: Operations Environmental Impact Assessment,
Mitigation and Monitoring
February 2010 11/25 Final
Table 11.16 Event Magnitude (Hammering)
Parameter Explanation Rating Extent/Scale Underwater sound emissions will affect an area of greater than 1 km from the
source.3
Frequency Underwater sound emissions from hammering each platform well conductor section.
2
Duration Each event will last approximately three days. 2 Intensity Taking into account the concentration, accumulation and persistence of sound
energy in the underwater environment, it is considered that this is a low intensity event.
1
Total 8
Table 11.17 Event Magnitude (Drilling)
Parameter Explanation Rating Extent/Scale Underwater sound emissions are unlikely to result in an avoidance response from
fish/seals beyond 15m from the noise source 1
Frequency Underwater sound emissions from drilling will occur more than 50 times. 3 Duration Underwater sound emissions will last for more than one week. 3 Intensity Taking into account the concentration, accumulation and persistence of sound
energy in the underwater environment, it is considered that this is a low intensity event.
1
Total 8
Table 11.18 Event Magnitude (Vessels)
Parameter Explanation Rating Extent/Scale Underwater sound emissions are unlikely to result in an avoidance response from
fish/seals beyond 15m from the noise source 1
Frequency Underwater sound emissions occur almost continuously over during the operations phase from regular support vessel activity.
3
Duration Underwater sound emissions will occur over almost continuously during the operations phase from regular supply vessel activity
3
Intensity Taking into account concentration, accumulation and persistence of sound energy in the underwater environment, the intensity is low.
1
Total 8
11.5.1.2 Receptor Sensitivity
The only relevant biological receptors to underwater noise are seals and fish.31
Seals and Fish
Operational underwater noise will emanate from the wellhead locations and along the support vessel route from the Logistics Supply Base located at the BDJF Yard to the platform location.
31 Plankton cannot sense the low frequency sound generated because the wavelength is longer than the organism and benthic invertebrates do not have sophisticated sound sensing apparatus.

AIOC Chirag Oil Project Environmental & Socio-Economic Impact Assessment
Chapter 11: Operations Environmental Impact Assessment,
Mitigation and Monitoring
February 2010 11/26 Final
Recent data indicates that seals and sturgeon are not common in the ACG Contract Area (refer to Appendix 6B for recent survey reviews) and that the WC-PDQ platform location is not an important or significant habitat for either. The likelihood of exposure to hammering, drilling or vessel noise for these species is therefore low.
Table 11.19 presents the justification for assigning a score of 4, which represents Medium Receptor Sensitivity.
Table 11.19 Receptor Sensitivity
Parameter Explanation Rating Resilience Possibility that species may be temporarily affected by underwater hammering,
drilling and vessel noise but the effect would be short term and limited. Ecological functionality will be maintained.
2
Presence The fish most likely to be present for extended periods of time in the ACG Contract Area and at the WC-PDQ location are Kilka and Mullet throughout the year. However, neither the COP location or the ACG Contract Area are not exclusively used by these species and the Contract Area is not considered to be of primary importance.
2
Total 4
11.5.1.3 Impact Significance
Table 11.20 summarises impacts to seals and fish from underwater noise associated with hammering, drilling and vessel activities.
Table 11.20 Impact Significance
Event Event Magnitude Receptor Sensitivity
Impact Significance
Operational noise Medium (Seals & Fish) Medium
Moderate Negative
It is considered that impacts are minimised are far as practicable and necessary (refer to Table 11.3) and no additional mitigation is required.
11.5.2 Drilling Discharges
11.5.2.1 Event Magnitude
For operational well drilling from the platform, it is intended to use the same procedures and drilling mud formulations as the predrill operations (except for the conductor hole). These are described in Chapter 5: Section 5.7.4 and summarised as follows:
The 36” Conductor Hole of each of the planned platform wells will not be drilled. Instead, the conductor will self penetrate as far as subsurface conditions permit and then be driven into place using hydraulic hammering (refer to Chapter 5: Section 5.7.4); and
The 28/”26” Surface Hole section of each of the planned platform wells will be drilled with WBM, as per the predrill wells. Cuttings from the 28”/26” sections will be discharged via the platform cuttings caisson. The cuttings will be passed through separation equipment to recover as much drilling mud as possible. However, it is estimated that for each well, approximately 340 tonnes of mud will be discharged associated with approximately 155 tonnes of cuttings. At the end of surface hole drilling, a further 500 tonnes of mud in total may be discharged (see Chapter 5: Section 5.7.4).
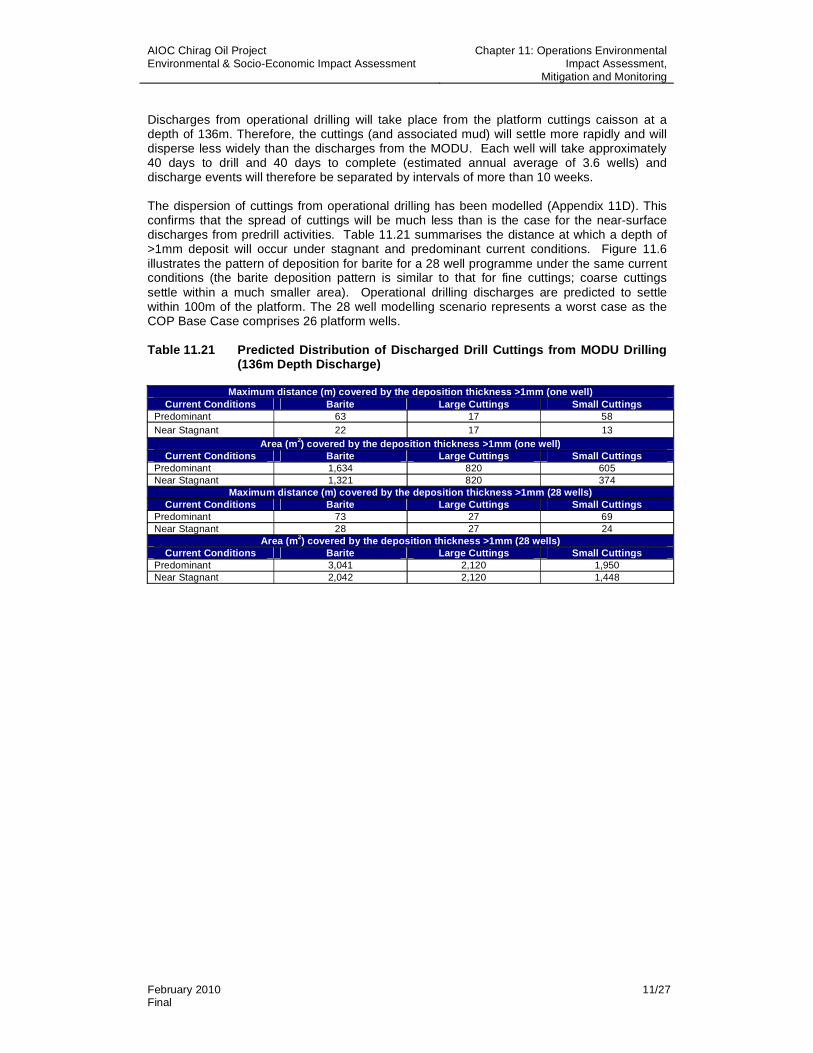
AIOC Chirag Oil Project Environmental & Socio-Economic Impact Assessment
Chapter 11: Operations Environmental Impact Assessment,
Mitigation and Monitoring
February 2010 11/27 Final
Discharges from operational drilling will take place from the platform cuttings caisson at a depth of 136m. Therefore, the cuttings (and associated mud) will settle more rapidly and will disperse less widely than the discharges from the MODU. Each well will take approximately 40 days to drill and 40 days to complete (estimated annual average of 3.6 wells) and discharge events will therefore be separated by intervals of more than 10 weeks.
The dispersion of cuttings from operational drilling has been modelled (Appendix 11D). This confirms that the spread of cuttings will be much less than is the case for the near-surface discharges from predrill activities. Table 11.21 summarises the distance at which a depth of >1mm deposit will occur under stagnant and predominant current conditions. Figure 11.6 illustrates the pattern of deposition for barite for a 28 well programme under the same current conditions (the barite deposition pattern is similar to that for fine cuttings; coarse cuttings settle within a much smaller area). Operational drilling discharges are predicted to settle within 100m of the platform. The 28 well modelling scenario represents a worst case as the COP Base Case comprises 26 platform wells.
Table 11.21 Predicted Distribution of Discharged Drill Cuttings from MODU Drilling (136m Depth Discharge)
Maximum distance (m) covered by the deposition thickness >1mm (one well) Current Conditions Barite Large Cuttings Small Cuttings
Predominant 63 17 58 Near Stagnant 22 17 13
Area (m2) covered by the deposition thickness >1mm (one well) Current Conditions Barite Large Cuttings Small Cuttings
Predominant 1,634 820 605 Near Stagnant 1,321 820 374
Maximum distance (m) covered by the deposition thickness >1mm (28 wells)Current Conditions Barite Large Cuttings Small Cuttings
Predominant 73 27 69 Near Stagnant 28 27 24
Area (m2) covered by the deposition thickness >1mm (28 wells)Current Conditions Barite Large Cuttings Small Cuttings
Predominant 3,041 2,120 1,950 Near Stagnant 2,042 2,120 1,448

AIOC Chirag Oil Project Environmental & Socio-Economic Impact Assessment
Chapter 11: Operations Environmental Impact Assessment,
Mitigation and Monitoring
February 2010 11/28 Final
Figure 11.6 Barite Deposition Thickness Contour Plots (Discharge from Caisson at 136m depth - 28 wells)
a) Near stagnant current conditions
b) Predominant current conditions

AIOC Chirag Oil Project Environmental & Socio-Economic Impact Assessment
Chapter 11: Operations Environmental Impact Assessment,
Mitigation and Monitoring
February 2010 11/29 Final
Drilling discharges are assigned an intensity score of 1 for the following reasons:
A large proportion (approximately 50%) of the discharge consists of inert geological material (the cuttings);
The drilling fluid components are inert or of very low toxicity; Only the solid, inert components of the drilling mud will settle to the seabed; low toxicity
soluble components, such as potassium chloride and minor additives, will dilute and disperse in the water column and will have neither acute or persistent effects;
Evidence from the IEMP in the vicinity of drilling operations where WBM cuttings have been discharged shows that there is no accumulation of drilling chemicals and only a very small effect on the benthos within the 'footprint' of the discharge; and
The drilling fluids have been the subject of comprehensive testing and assessment and have been approved for use by the MENR for existing operations (refer to Chapter 9 Section 9.5.2 for results of toxicity tests).
Table 11.22 presents the justification for assigning a score of 6, which represents a Medium Event Magnitude.
Table 11.22 Event Magnitude
Parameter Explanation Rating Extent/ Scale Modelling has shown evidence of cuttings at distances of up to 500m for other
platforms.1
Frequency Discharge of WBM and cuttings will occur during drilling of each of the 26 platform drilled wells.
2
Duration Duration of each discharge event is approximately 30 hours. 2 Intensity Drilling discharges are considered to be of low intensity due to the composition and
evidence from post well surveys of no accumulation of drilling chemicals. 1
Total 6
11.5.2.2 Receptor Sensitivity
Seals and Fish
Drilling discharges will intermittently generate turbid plumes of limited duration and dimension. These plumes will not however, generate chemical contamination of the water column and will not occupy a significant proportion of the local water column. It is anticipated that both fish and seals will avoid the plumes.
Recent data indicates that endangered species such as seals and sturgeon are not common in the ACG Contract Area (Appendix 6B) and that the WC-PDQ platform location is not located in an important breeding or migration area for either species. However, Kilka and Mullet are present in the Contract Area.
Table 11.23 presents the justification for assigning a score of 2, which represents Low Receptor Sensitivity.

AIOC Chirag Oil Project Environmental & Socio-Economic Impact Assessment
Chapter 11: Operations Environmental Impact Assessment,
Mitigation and Monitoring
February 2010 11/30 Final
Table 11.23 Receptor Sensitivity
Parameter Explanation Rating Resilience Possibility that species may be temporarily affected by drilling discharges but the
effect would be short term and limited. Ecological functionality will be maintained. 1
Presence The fish most likely to be present for extended periods of time throughout the year in the ACG Contract Area and at the WC-PDQ location are Kilka and Mullet. However, the COP location or the ACG Contract Area are not exclusively used by these species and the Contract Area is not considered to be of primary importance.
1
Total 2
Plankton
Due to the depth at which the discharge will take place, the cuttings will settle through a relatively small fraction of the lower water column (about 40m) and will not interfere with the productive zone where the majority of plankton and planktivorous fish (e.g. Kilka) occur.
Table 11.24 presents the justification for assigning a score of 2, which represents Low Receptor Sensitivity.
Table 11.24 Receptor Sensitivity
Parameter Explanation Rating Resilience Highly resilient. 1Presence Species not rare or unique on a regional basis. 1 Total 2
Benthic Invertebrates
The benthic invertebrate communities in the vicinity of the COP are very similar to those across the rest of the Contract Area and the Azerbaijan sector of the South Caspian. There are no rare, unique or endangered species present.
The benthic community is composed of predominantly small organisms and is dominated by native amphipod, gastropod, polychaete and oligochaete species, most of which have the potential to produce several generations per year. With the exception of some bivalves, the dominant taxa are deposit feeders, which burrow in the sediment. These species are unlikely to be affected by less than 10cm of cuttings deposition and will not suffer from the clogging of feeding appendages which can affect filter-feeders. Observations from IEMP monitoring around existing platforms confirms that benthic community diversity and abundance remains high in areas of cuttings deposition (within the range of 250 - 500m of the platform).
Table 11.25 presents the justification for assigning a score of 2, which represents Low Receptor Sensitivity.

AIOC Chirag Oil Project Environmental & Socio-Economic Impact Assessment
Chapter 11: Operations Environmental Impact Assessment,
Mitigation and Monitoring
February 2010 11/31 Final
Table 11.25 Receptor Sensitivity
Parameter Explanation Rating Resilience No rare, unique or endangered species at significant risk of exposure. 1 Presence Drilling mud and cuttings of low toxicity, and monitoring of existing platforms
demonstrates that the benthic community is resilient to the deposition of cuttings. 1
Total 2
11.5.2.3 Impact Significance
Table 11.26 summarises impacts to biological/ecological receptors from drilling discharges.
Table 11.26 Impact Significance
Event Event Magnitude Receptor Sensitivity
Impact Significance
(Seals & Fish) Low
Minor Negative
(Plankton)Low
Minor Negative
Cuttings and WBM discharge Medium
(BenthicInvertebrates)
Low
Minor Negative
Based on the findings from the surveys reported in detail within Chapter 6, very limited impact has been observed from existing drilling discharges from operating platforms. It is considered that impacts are minimised as far as practicable and necessary through the implementation of the existing control measures (see Table 11.3) and no additional mitigation is required.
11.5.3 Cement Discharges
11.5.3.1 Event Magnitude
Cement discharge will occur during the cementing of successive well casings. At most, this is estimated to amount to approximately 13 tonnes per well, of which approximately 5 tonnes would be cement, 6.5 tonnes would be barite, and the remainder would be low toxicity cementing chemicals. Approximately 0.7 tonnes of excess cement of the same composition may also be discharged at the end of cementing each of the 2 lower well casings where it cannot be recovered. As the conductor section will be hammered into place, unlike the predrill wells, it will not be cemented. Cementing associated with platform drilling is described in Chapter 5: Project Description, Section 5.7.7.1.
The discharge event duration would be approximately 1hour per casing and therefore in total about 2 hours per well (although not consecutive, since each section has to be drilled before being cemented). The cement is not expected to disperse (being designed to set in a marine environment) and will therefore set in-situ. It is not anticipated that there will be any chemical releases from the cement, which will be effectively chemically inert. The impact of cement discharge will therefore be limited to a small area of accumulation immediately around the well.
Table 11.27 presents the justification for assigning a score of 6, which represents a Medium Event Magnitude.

AIOC Chirag Oil Project Environmental & Socio-Economic Impact Assessment
Chapter 11: Operations Environmental Impact Assessment,
Mitigation and Monitoring
February 2010 11/32 Final
Table 11.27 Event Magnitude
Parameter Explanation Rating Extent/Scale Cement will be deposited only within a few metres of the well. 1 Frequency 2 discharge events per well for each of the 26 platform drilled wells. 3 Duration Each discharge event will last approximately 1 hour. 1 Intensity The cement comprises inert materials (cement and barite) and low toxicity
chemicals.1
Total 6
11.5.3.2 Receptor Sensitivity
Cement discharges will be confined to a small area of seabed immediately around each well and no chemical releases are anticipated. Consequently, the only potential biological receptor is the benthic invertebrate community.
Benthic Invertebrates
Table 11.28 presents the justification for assigning a score of 2, which represents Low Receptor Sensitivity.
Table 11.28 Receptor Sensitivity
Parameter Explanation Rating Resilience No rare, unique or endangered species at significant risk of exposure.
Receptor confined to benthic community close to well. 1
Presence Toxicity and persistence of cement components is low and cement will set rapidly. Effects will be limited to physical covering of a small area of benthos.
1
Total 2
11.5.3.3 Impact Significance
Table 11.29 summarises impacts to benthic invertebrates from cement discharges.
Table 11.29 Impact Significance
Event Event Magnitude Receptor Sensitivity
Impact Significance
Cement discharge Medium Low Minor Negative
Cement chemicals are of low toxicity, chemically inert and designed to set in a marine environment. Therefore, only the seabed in the immediate vicinity of the wells will be affected. The Receptor Sensitivity of all marine organisms to cement discharges is considered to be low. It is considered that impacts are minimised as far as practicable and necessary through the implementation of the existing control measures (see Table 11.3) and no additional mitigation is required.

AIOC Chirag Oil Project Environmental & Socio-Economic Impact Assessment
Chapter 11: Operations Environmental Impact Assessment,
Mitigation and Monitoring
February 2010 11/33 Final
11.5.4 Produced Water Discharge
11.5.4.1 Event Magnitude
The produced water system is described in Chapter 5: Section 5.8.4. The discharge of produced water would occur only during periods when all or part of the produced water handling and export system to the DWG platform is unavailable (the system is designed for overall 98% availability).
It is not, at this time, possible to estimate with confidence the frequency and duration of discharge events. However, for the purposes of this impact assessment, discharge durations of 12, 24 and 72 hours are considered. From the produced water profile (Chapter 5: Figure 5.2), and on the basis of 98% reinjection availability, it can be estimated that discharge rates will range from a minimum of approximately 33m3/hr in 2015 to a maximum of 833m3/hr in 2024. However, from the profile it is also clear that during most of this period the discharge rate will be in the range of approximately 400 - 500m3/hr.
At the present time, significant amounts of produced water have not been generated from existing (Phase 1, 2 and 3) platforms and therefore no data is available on the ‘routine’ composition of water from ACG operations. Two studies were undertaken where samples were collected from separation or treatment equipment at Sangachal Terminal in 2008 (at that time, all water was separated onshore and this was the most reliable location from which to obtain samples).
Analysis of samples from Terminal coalescers indicated that:
Produced water salinity was typically in the range of 30 - 40‰; Dispersed oil concentrations were generally low (close to the monthly discharge
standard of 29mg/l); and ACG produced water has a characteristically high content of organic and volatile fatty
acids (typically around 10g/l in total).
Produced water separated on the WC-PDQ platform will be treated by hydrocyclones to reduce the dispersed oil concentration32 to a maximum daily oil concentration of 42 mg/l and monthly maximum of 29 mg/l.
The dispersion of discharged produced water was modelled to assess the size of the dispersion plume and mixing zone (refer to Appendix 11E). Modelling covered the 3 discharge durations defined above, for a typical discharge rate of 450m3/hr under stagnant and predominant current conditions. This indicated that the discharge would typically be diluted by a factor of 100 within 40m of the discharge caisson. The modelling indicated that under all conditions the plume would reach a steady state within 5 hours and it would persist for no more than 3 hours after the discharge ceased.
Table 11.30 presents the justification for assigning a score of 8, which represents a Medium Event Magnitude.
32 As defined by EPA method 1664A

AIOC Chirag Oil Project Environmental & Socio-Economic Impact Assessment
Chapter 11: Operations Environmental Impact Assessment,
Mitigation and Monitoring
February 2010 11/34 Final
Table 11.30 Event Magnitude
Parameter Explanation Rating Extent/Scale Dispersion modelling indicates that a produced water discharge of 450m3/hr would
be diluted to no effect concentrations within 500m of the source. 1
Frequency Not certain; likely to be more than 50 times over the operational phase. 3 Duration Not certain; assumed to be between 12 and 72 hours as a worst case. 2 Intensity Available data indicates that ACG produced water is low in toxicity and in
persistent compounds, but assigned a score of 2 to take account of possible changes in composition over time.
2
Total 8
11.5.4.2 Receptor Sensitivity
The Sangachal Terminal samples were tested for aquatic toxicity using Caspian species and test results indicate that, while toxicity was variable, it was also generally low. Effluent toxicity results are normally expressed in terms of the degree of dilution (the percentage of effluent in the test medium) required to reach the test end-point (in this case, 50% mortality of the test organisms in 48hr, or 48hr LC50). The LC50 values for ACG produced water samples from Sangachal ranged from approximately 8% to approximately 32%. These results mean that the 50% toxicity endpoint would occur when the produced water was diluted by between 3 and 12 times.
The discharge plume will be present only in the water column and will not reach the seabed. Consequently, seals, fish and plankton are potentially exposed to the discharge. As noted above, presently available information suggests that ACG produced water is of low toxicity. The most notable components are the organic and volatile fatty acids, which although present in high concentrations are of low toxicity and are readily degradable. While the Sangachal Terminal samples would have contained traces of production chemicals, the low overall toxicity demonstrated that these largely remained in the oil phase and were not present at biologically significant concentrations in the separated water.
The assumed discharge durations are short, and if a ‘safety factor’ of 10 is applied to the LC50
dilution requirements, it is estimated that a dilution of 120-fold would be sufficient to mitigate effects on organisms in the receiving water. As with other discharges, it is important to bear in mind that in practice, it is extremely unlikely that any individual organism would remain in the discharge plume for more than a few minutes: large organisms are able to actively avoid discharge plumes, while smaller organisms can only enter the plume in water entrained by the mixing process, being rapidly carried into areas of higher dilution by the mixing process. The dispersion modelling referred to above indicated that a dilution of 100-fold would be reached within 40m of the point of discharge, and that within 3 hours of the cessation of the discharge all produced water present would be diluted by more than 100-fold (i.e. plume persistence at this level would be a maximum of 3 hours after end of discharge). Figure 11.7 presents typical dispersion plumes (to a dilution of 300-fold) under stagnant and dominant current conditions

AIOC Chirag Oil Project Environmental & Socio-Economic Impact Assessment
Chapter 11: Operations Environmental Impact Assessment,
Mitigation and Monitoring
February 2010 11/35 Final
Figure 11.7 Produced Water Dispersion Plumes Under Stagnant and Dominant Current Conditions
Existing data indicates that oil concentrations in the produced water are likely to be low, and will be further reduced on the WC-PDQ platform by treatment by the hydrocyclones and will have been diluted at the edge of the mixing zone to concentrations, which would not present a risk of bioaccumulation or food chain transfer.
As discussed above the Sangachal Terminal samples were tested for a number of chemicals in addition to oil. Table 11.31 presents the results obtained for various metallic and organic chemical parameters along with representative data for seawater from recent ACG Contract Area environmental surveys.
Table 11.31 Results of Terminal Produced Water and Seawater Analysis
Average of 4 samples, 2008 Average of 3 samples, 2008 Parameter Unit Seawater SL9 SL14 Coalescer 2 Coalescer 4 Coalescer 6
Ba µg/l 25.4 592 1418 1268.3 1166 2598.3 Ni µg/l 0.91 92.2 56.4 49.8 42.1 <25.0* Co µg/l 0.02 78.3 46.9 33.65 30.3 0.6 B mg/l 3.08 50.3 47.6 101.2 91.6 114.4 Mg mg/l 650 30.5 29.4 11.56 9.9 13.29 Zn µg/l 1.04 48.3 28.4 <200* <200* <200* Cu µg/l 0.69 13.3 16.5 <12.5* <12.5* <12.5* Pb µg/l 0.3 5.4 5.1 <10.0* <10.0* <10.0* Cr µg/l 4.35 86.8 53 84.45 104.8 38.9 Fe µg/l <10 70.1 26.6 979.7 1032.3 545.6 Cd µg/l 0.01 0.18 0.59 <0.50* <0.50* <0.50*
Total Phenols mg/l <0.5 1.73 0.74 0.35 0.35 0.57
Total organic acids mg/l nd 6307 5125 4220 2160 74
Total PAH µg/l 0.075 28.4 66.2 0.52 0.84 0.62
Total Aliphatics (C9- 38) mg/l <0.02 1.55 2.78 24 12 1.9
Sea surface
-40m
-80m
-120m
Seabed
Sea surface
-40m
-80m
-120m
Seabed200m0m
30
50
75
120
190
300
Dilution
Stagnant Current Conditions
Dominant Current Conditions
Distance from discharge (m)
AIOC Chirag Oil Project Environmental & Socio-Economic Impact Assessment
Chapter 11: Operations Environmental Impact Assessment,
Mitigation and Monitoring
February 2010 11/36 Final
Average total phenol concentrations varied between 0.35 and 1.73 mg/l in a total of 7 samples collected from ACG coalescers at Sangachal Terminal. A World Health Organisation report33 reported that phenol had little bioaccumulation potential, and typically degraded by 50% in 9 days in seawater; it is therefore of limited persistence and will not accumulate through the food chain. Aquatic toxicity was reported to be moderate, with LC50s for fish and crustacea ranging from 8.8 to 330 mg/l. If a safety factor of 100 is applied (representing a conservative approach for short-duration discharges), the short-term no-effect concentration would lie between 0.088 and 0.33 mg/l. If the lower of these values is compared with the highest average value in Table 11.31, a dilution of approximately 20-fold would be required. If an even more conservative safety factor of 1000-fold was applied, the corresponding dilution would be 200-fold, which is slightly greater than the dilution estimated to be required on the basis of whole-effluent toxicity tests (which therefore suggests that a safety factor of 100 is more appropriate).
The WHO report also considers observed environmental concentrations. Although ACG environmental surveys have recently not detected phenols in seawater above the detection limit of 0.5 µg/l, levels of phenol dissolved in rain water from Portland, USA, were found to range from 0.08 to 1.2 µg/l and averaged above 0.28 µg/l. Concentrations reported for surface water in the Netherlands were 2.5-6.5 µg/l for two major rivers, 0.3-7 µg/l for lakes, and 1.5 µg/l for coastal waters. Industrial rivers in the USA were reported to contain 0-5 µg/l, but 3-24 µg/l was reported for Lake Huron. Phenol was also detected in 2/100 raw water supplies in 1977 in the US EPA National Organics Monitoring Survey.
Quantified cadmium concentrations in ACG produced water samples ranged from 0.18 to 0.59 µg/l, which is approximately 18 to 59 times the concentration recently measured in Caspian seawater. The data represent total cadmium in both produced water and seawater, and the fraction present as the free (toxic) ion is not known. However, at most a dilution of 59-fold would be required to dilute produced water to background ambient levels, and this degree of dilution is well within the overall no-effect dilution requirement (120-fold) estimated on the basis of whole-effluent toxicity measurements using Caspian species.
During periodic well start-up when the platform is operational, it may be necessary to dose the crude oil stream with methanol at a rate of up to 100 litres per hour for up to eight hours to protect flowlines and valves (refer to Chapter 5 Section 5.8.6.16). During this period it is possible that produced water may be discharged as described within Section 11.5.4.1 above. Until the produced water portion in the COP LP separators reaches 5%, produced water will be transported onshore with the oil. Based on a lowest expected produced water rate of 4,000 bpd at the platform the worst-case discharge concentration of methanol (for a single well, and assuming no mixing and dilution with water from other wells which are not being dosed with methanol) would be approximately 3,800 mg/l. Methanol is completely water soluble, so it is assumed that it would all partition into the water phase when injected into the reservoir fluids at the wellhead.
Methanol is classified by the OSPAR Commission as a substance that is considered to pose little or no risk to the marine environment (PLONOR). International studies report LC50sranging from 900-529-5 mg/l for zooplankton and 1400-29700 mg/l for fish, with median values of 18756 and 17720 mg/l respectively. Tests carried out with Caspian zooplankton reported LC50s of >3200 mg/l.
The appropriate no-effect safety factor for a short term discharge (ie, 8 hours duration) is 10. Applying this safety factor to available toxicity data, median no-effect concentrations of 1772-1876 mg/l are estimated for the results of international studies, and >320 mg/l for Caspian studies. Taking a conservative approach, if a no-effect concentration of 320 mg/l is assumed, the discharge (containing up to 3800 mg/l) would require a dilution of 12-fold to ensure that no toxic effects occurred.
A concentration of 3800 mg/l methanol within a produced water discharge containing approximately 10,000 mg/l of organic and volatile fatty acids would increase the soluble 33 IPCS, Environmental Health Criteria no 161, Geneva 1994

AIOC Chirag Oil Project Environmental & Socio-Economic Impact Assessment
Chapter 11: Operations Environmental Impact Assessment,
Mitigation and Monitoring
February 2010 11/37 Final
hydrocarbon loading by approximately 40%. Given that these organic and fatty acids are individually of low toxicity, and that overall produced water toxicity is also moderate, it is therefore assumed, as a worst case, that the presence of methanol would increase produced water toxicity in proportion to its mass contribution. Based on the required 120-fold dilution required to achieve a a no-effect concentration for WC-PDQ produced water as discussed above, it is therefore estimated that the no-effect concentration for a discharge containing methanol at 3800 mg/l would require a dilution of 160-fold. This increased dilution requirement would temporarily increase the distance at which a no-effect concentration was reached from approximately 40m to about 60m (refer to Figure 11.7).
Methanol is highly degradable, with UNEP/WHO reporting 75% degradation in 5 days and 99% degradation in 15-20 days. It is a readily-metabolisable substrate for many types of bacteria. Methanol will not persist in the environment and will not biaccumulate.
Neither seals nor fish are considered to be at risk of anything more than transient exposure to a discharge plume and are therefore not considered to be at risk of toxic effects as a result of direct exposure. The primary potential receptors are therefore planktonic species.
Table 11.32 presents the justification for assigning a score of 2, which represents Low Receptor Sensitivity.
Table 11.32 Receptor Sensitivity
Parameter Explanation Rating Resilience No rare, unique or endangered species at significant risk of exposure. Plankton most
likely to be exposed for brief periods. 1
Presence Toxicity and persistence of produced water are expected to be low, and any limited effects on individual planktonic organisms will not adversely affect local populations.
1
Total 2
11.5.4.3 Impact Significance
Table 11.33 summarises impacts to ecological/biological receptors from produced water discharge.
Table 11.33 Impact Significance
Event Event Magnitude Receptor Sensitivity
Impact Significance
Produced water discharge Medium Low Minor Negative
Results of tests on produced water confirm that the discharge standards will provide adequate protection to the marine environment and the COP design includes equipment, which is capable of achieving these standards. Although it is unlikely to occur, the short-term presence of methanol in a produced water discharge would have minimal additional impact. The size of the no-effect mixing zone would be temporarily increased from about 40m from the discharge point to about 60m. Methanol is not persistent or bioaccumulative and will degrade rapidly. The event magnitude of produced water discharge has been estimated on the assumption of complete unavailability of the COP system for exporting produced water to DWG PCWU for 2% of the time. Careful management and planning of operations and maintenance has the potential to reduce periods of unavailability and COP operations will identify any practicable measures to minimise the need for discharge. The sensitivity of marine species is considered to be low and the resulting Minor Negative impact is deemed to be acceptable. No additional mitigation beyond existing controls is required (see Table 11.3).

AIOC Chirag Oil Project Environmental & Socio-Economic Impact Assessment
Chapter 11: Operations Environmental Impact Assessment,
Mitigation and Monitoring
February 2010 11/38 Final
11.5.5 Water Intake/Entrainment and Cooling Water Discharge
11.5.5.1 Event Magnitude
Cooling water will be lifted and discharged routinely on the WC-PDQ platform during the COP operational phase (refer to Chapter 5: Section 5.8.6.7). The cooling water system will use approximately 3,360m3 of seawater per hour, supplied by 2 pumps lifting water via two separate caissons.
The intake of water via the caissons has been modelled (refer to Appendix 11F) to assess the risk of entrainment of fish and other organisms. The intake modelling study showed that water velocity would not exceed 13cm/s within a few centimetres of the intake and that the velocity gradient would extend less than 3m, even under near-stagnant current conditions. Consequently, it is concluded that:
There is a sufficient velocity gradient for fish to detect the intake; and The water velocity close to the intake is sufficiently low that even small fish would have
no difficulty in avoiding the intake.
A screen is provided as primary protection to obstruct the passage of fish and larger organisms. However the water intake is at a depth of 105m, considerably below the productive zone. At this depth, fish and plankton populations are likely to be minimal and production will be negligible.
The potential impact of the discharge of cooling water has also been modeled (refer to Appendix 11D). The cooling water dispersion plumes for summer and winter under stagnant and typical current conditions are illustrated in Figure 11.8. The black line shown for each plume indicates the point at which the water temperature is estimated to be 3°C above ambient temperature, and in each case this occurs within 30m of the point of discharge.
The cooling water system will include a copper/chlorine biocide control system, but the concentration of both elements in the discharge will be below the international EQS and national MPC levels.


AIOC Chirag Oil Project Environmental & Socio-Economic Impact Assessment
Chapter 11: Operations Environmental Impact Assessment
Mitigation and Monitoring
February 2010 11/40 Final
Table 11.34 presents the justification for assigning a score of 8, which represents a Medium Event Magnitude.
Table 11.34 Event Magnitude
Parameter Explanation Rating Extent / Scale
The area within which intake and cooling water discharge effects might occur is limited to less than 30m for discharge, and to the velocity gradient would extend to less than 3m in any direction for intake.
1
Frequency Intake and discharge occur continuously throughout the COP 13 year operational period.
3
Duration The cooling water system will operate throughout the 13 year operational phase. 3 Intensity Discharges will be consistent with relevant standards and with previously approved
practices. It will contain no harmful persistent materials. 1
Total 8
11.5.5.2 Receptor Sensitivity
Benthic invertebrates will not be exposed to either cooling water intake or discharge. The dimensions of the intake current field and the discharge plume are small and the residence time of any water column organism within the discharge plume will be too short to cause harm. Seals are not considered to be at risk from the intake, and fish present at the intake depth are considered capable of detecting the low intake velocity gradient and avoiding it.
Zooplankton and phytoplankton would not be able to avoid entrainment, but the intake is at a depth of 105m and therefore well below the depth at which the main populations of both groups occur.
Table 11.35 presents the justification for assigning a score of 2, which represents Low Receptor Sensitivity.
Table 11.35 Receptor Sensitivity
Parameter Explanation Rating Resilience Seals, fish and plankton are not expected to be present consistently or in
significant numbers within the water volume affected by either intake or discharge. No significant exposure of benthos.
1
Presence Although exposure is unlikely, seals and fish would not be adversely affected by short term exposure to the discharges. Plankton are unlikely to be exposed to discharge.
1
Total 2
11.5.5.3 Impact Significance
Table 11.36 summarises impacts to biological/ecological receptors from water intake and cooling water discharge.

AIOC Chirag Oil Project Environmental & Socio-Economic Impact Assessment
Chapter 11: Operations Environmental Impact Assessment
Mitigation and Monitoring
February 2010 11/41 Final
Table 11.36 Impact Significance
Event Event Magnitude Receptor Sensitivity
Impact Significance
Water intake and cooling water discharge
Medium Low Minor Negative
11.5.5.4 Additional Mitigation and Monitoring
The design of the intake and discharge process, and in particular the depth at which these occur, will minimise the exposure of marine organisms, which are considered to have low sensitivity. The resulting Minor Negative impact is considered to be acceptable and does not require additional mitigation beyond existing controls (see Table 11.3). However, in order to enable cooling water discharge temperature to be monitored, the temperature probe at the discharge point will be connected to a system for recording temperature at regular intervals. The primary purpose will be to confirm that the discharge temperature is sufficiently low that the edge of the cooling water mixing zone will not exceed ambient by more than 3ºC.. It is extremely unlikely that this would occur, as modelling presented in Appendix 11.D demonstrates, the discharge temperature would need to be 75ºC or more for this to occur, which is beyond the operating parameters of the cooling water system.
11.5.6 Pigging Discharge
11.5.6.1 Event Magnitude
Pigging is described in Chapter 5: Section 5.8.7 and Table 5.30 summarises the produced water and injection water pipeline pigging volumes and locations of discharge. Tables 5.38 and 5.29 describe the chemicals present in the produced water and injection water.
Following the start of production, the produced water pipeline will be pigged from DWG to WC-PDQ typically weekly for up to six months using inhibited seawater from the DWG seawater injection treatment system. Once the percentage of water in oil at the WC-PDQ platform reaches approximately 5% and there is sufficient water from WC-PDQ to drive a pig, the line will be pigged weekly in the opposite direction (i.e. from WC-PDQ to DWG in the normal direction of flow). Pigging may be less frequent and will depend on pipeline condition. In both cases, the pigging operation will generate a discharge of approximately 920m3 of inhibited seawater initially, and then produced water, over a period of approximately 2 hours. Solids recovered during the pigging operation will be shipped to shore for treatment and disposal.
It is planned to pig the injection water line on a weekly basis, although the precise frequency is dependent on pipeline condition. This will generate a similar volume of discharge over a similar period to that generated by pigging the produced water line. The discharge from the injection water line will comprise produced water, a small amount of pigging solids and seawater. The relative amounts of produced water and seawater will depend on the volume required to maintain injection rates at the DWG and WC-PDQ platforms. The presence of seawater will, however, result in lower salinity and lower concentrations of produced water components compared to the discharge from the produced water line.
The composition, depth and rate of discharges from pigging operations are similar to the discharge scenario considered in Section 11.5.5 for non-routine produced water discharge. The frequency of pigging discharge is higher (up to 2 discharge events per week), but the duration is likely to be shorter compared to non-routine produced water discharge.
Table 11.37 presents the justification for assigning a score of 7, which represents a Medium Event Magnitude.

AIOC Chirag Oil Project Environmental & Socio-Economic Impact Assessment
Chapter 11: Operations Environmental Impact Assessment
Mitigation and Monitoring
February 2010 11/42 Final
Table 11.37 Event Magnitude
Parameter Explanation Rating Extent/Scale Dispersion modelling indicates that a produced water discharge of 460m3/hr would
be diluted to no effect concentrations within 500m of the source. This is also applicable to pigging discharges.
1
Frequency Two events per week over the 13 year COP operational phase. 3 Duration 2 hours per event. 1 Intensity Available data indicates that ACG produced water is low in toxicity and in non
persistent compounds, but a conservative score of 2 assigned to take account of possible changes in composition over time.
2
Total 7
11.5.6.2 Receptor Sensitivity
Receptor sensitivity to pigging discharges is subject to the same considerations and criteria as applied to produced water discharge in Section 11.5.5.2. Table 11.38 presents the justification for assigning a score of 2, which represents a Low Receptor Sensitivity.
Table 11.38 Receptor Sensitivity
Parameter Explanation Rating Resilience No rare, unique or endangered species at significant risk of exposure. Plankton most
likely to be exposed for brief periods. 1
Presence Toxicity and persistence of produced water are expected to be low. Any limited effects on individual planktonic organisms will not adversely affect local populations.
1
Total 2
11.5.6.3 Impact Significance
Table 11.39 summarises impacts to biological/ecological receptors from discharges associated with pigging discharges.
Table 11.39 Impact Significance
Event Event Magnitude Receptor Sensitivity
Impact Significance
Pigging discharge Medium Low Minor Negative
As for produced water, described in Section 11.5.5.1, the resulting Minor Negative impact from pigging discharge is considered to be acceptable and does not require additional mitigation beyond the existing controls described in Table 11.3.

AIOC Chirag Oil Project Environmental & Socio-Economic Impact Assessment
Chapter 11: Operations Environmental Impact Assessment
Mitigation and Monitoring
February 2010 11/43 Final
11.5.7 Other Discharges
11.5.7.1 Existing Controls & Event Magnitude
Other discharges to sea as detailed within Chapter 5: Sections 5.8.6.12, 5.8.6.14 and 5.8.6.15 comprise:
Ballast Water – Support vessels ballasting activities will include occasional uptake and discharge of ballast water during supply activities. Vessel ballast tanks are designed to ensure that ballast water does not come into contact with oil or chemicals. Uptake and discharge are not considered to present a significant environmental hazard.
Treated Black Water – Platform sewage treatment package designed in accordance with PSA requirements such that black water effluent is treated to applicable USCG Type II standards34 and discharged via the sewage discharge caisson (17m below sea level). Based on average 150 POB and an expected generation rate 0.1m3/person/day,approximately 15m3 of treated effluent will be discharged per day. The flow rate is low, so the effluent will be rapidly diluted close to the point of discharge. Total suspended solids at the proposed treatment level do not pose any risk of significant environmental impact.
Grey Water – Platform grey water will be discharged in accordance with PSA requirements35. Grey water (from showers, laundry etc) will contain only dilute cleaning agents (soaps, detergents) and the impact of the discharge will be minimal. Environmental factors are considered prior to selection of any chemical for use across the ACG facilities, including cleaning fluids such as detergents.
Galley Waste - Platform galley waste system will be designed to treat food wastes to applicable MARPOL 73/78 Annex V: Prevention of Pollution by Garbage from Ships particle size standard prior to discharge36 via the sewage discharge caisson.
Drainage – The platform hazardous area open drains will be routed to the open drains caisson, designed to ensure that no visible sheen on sea surface. The non-hazardous area open drains will be routed to the CRI well via oily drains tank. If the oily drains tank or the CRI well is unavailable, the non-hazardous area liquids will be discharged to sea via the open drains caisson, provided no visible sheen is observable (Refer to Chapter 5 Section 5.8.6.11). Helideck drainage and deluge from deck drain boxes is discharged directly to sea.
Event Magnitude is summarised in Table 11.40.
34 Sanitary waste may be discharged from a U.S. Coast Guard certified or equivalent Marine Sanitation Device (MSD) to meet USCG Type II standards of total suspended solids of 150mg/l and fecal coliforms of 200MPN (most probable number) per 100ml 35 Grey water may be discharged as long as no floating matter or visible sheen is observable. 36 Macerated to particle size less than 25mm.

AIOC Chirag Oil Project Environmental & Socio-Economic Impact Assessment
Chapter 11: Operations Environmental Impact Assessment
Mitigation and Monitoring
February 2010 11/44 Final
Table 11.40 Event Magnitude
11.5.7.2 Receptor Sensitivity
All of the discharges are low in volume, do not contain toxic or persistent process chemicals and are considered to pose no significant threat to the environment or the identified biological/ecological receptors.
Table 11.41 presents the justification for assigning a score of 2, which represents Low Receptor Sensitivity.
Event Parameter / Discharge Ballast Water Treated Black
Water Grey Water Drainage
Extent/Scale 1 1 1 1 Frequency 2 3 3 3 Duration 1 3 3 3 Intensity 1 1 1 1 Event Magnitude 5 8 8 8
Ballast Water:
Treated Black Water:
Grey Water:
Galley Waste:
Drainage:
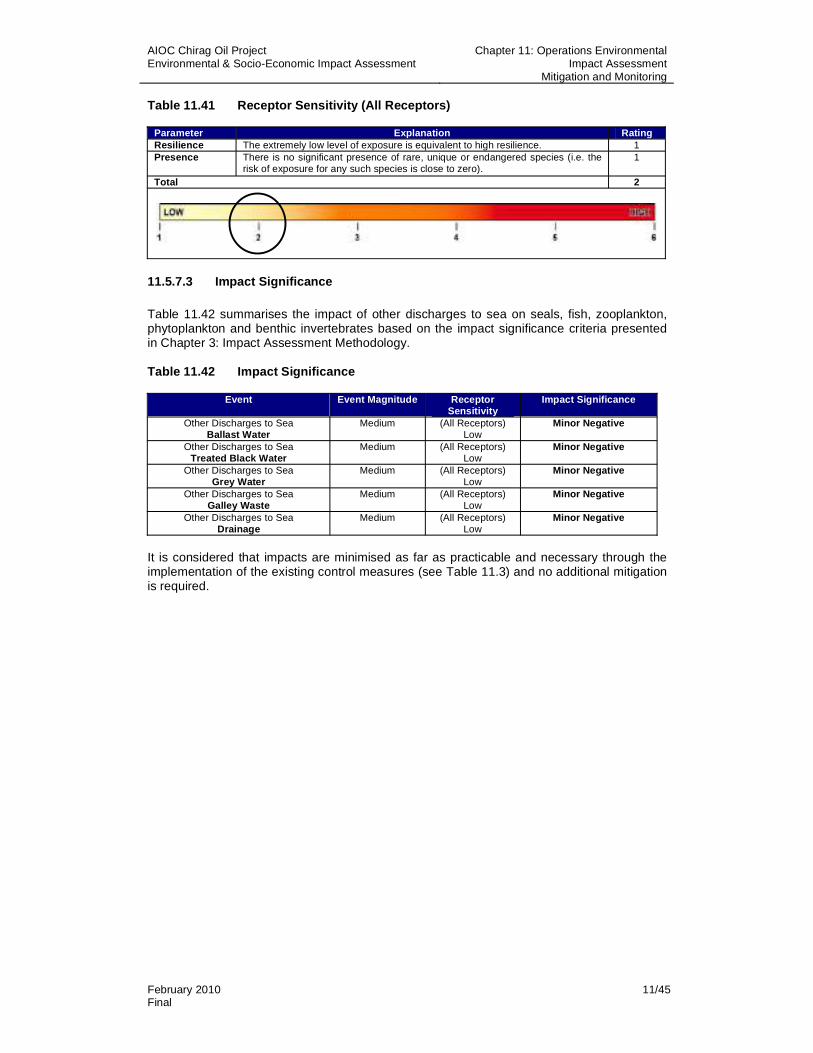
AIOC Chirag Oil Project Environmental & Socio-Economic Impact Assessment
Chapter 11: Operations Environmental Impact Assessment
Mitigation and Monitoring
February 2010 11/45 Final
Table 11.41 Receptor Sensitivity (All Receptors)
Parameter Explanation Rating Resilience The extremely low level of exposure is equivalent to high resilience. 1 Presence There is no significant presence of rare, unique or endangered species (i.e. the
risk of exposure for any such species is close to zero). 1
Total 2
11.5.7.3 Impact Significance
Table 11.42 summarises the impact of other discharges to sea on seals, fish, zooplankton, phytoplankton and benthic invertebrates based on the impact significance criteria presented in Chapter 3: Impact Assessment Methodology.
Table 11.42 Impact Significance
It is considered that impacts are minimised as far as practicable and necessary through the implementation of the existing control measures (see Table 11.3) and no additional mitigation is required.
Event Event Magnitude Receptor Sensitivity
Impact Significance
Other Discharges to Sea Ballast Water
Medium (All Receptors) Low
Minor Negative
Other Discharges to Sea Treated Black Water
Medium (All Receptors) Low
Minor Negative
Other Discharges to Sea Grey Water
Medium (All Receptors) Low
Minor Negative
Other Discharges to Sea Galley Waste
Medium (All Receptors) Low
Minor Negative
Other Discharges to Sea Drainage
Medium (All Receptors) Low
Minor Negative

AIOC Chirag Oil Project Environmental & Socio-Economic Impact Assessment
Chapter 11: Operations Environmental Impact Assessment
Mitigation and Monitoring
February 2010 11/46 Final
11.6 Summary of COP Operations Phase Residual Environmental Impacts
For all operations phase environmental impacts assessed it has been concluded that impacts are minimised as far as practicable and necessary through the implementation of the existing control measures (see Table 11.3) and no additional mitigation is required. However, in order to enable cooling water discharge temperature to be monitored, a temperature probe at the discharge point will be connected to a system for recording temperature at regular intervals. The primary purpose will be to confirm that the discharge temperature is sufficiently low that the edge of the cooling water mixing zone will not exceed ambient by more than 3ºC. Modelling has demonstrated this is extremely unlikely as the discharge temperature would need to be 75ºC or more for this to occur, which is beyond the operating parameters of the cooling water system.
Table 11.43 summarises the residual environmental impacts for the operations phase of the project.
Table 11.43 Summary of Operations Residual Environmental Impacts
Event Event Magnitude
Receptor Sensitivity
Impact Significance
Emissions from offshore platform power generation and non-routine flaring Medium Low Minor Negative
Emissions from support vessel engines Medium Low Minor Negative
(Humans)Medium
Moderate Negative
Emissions from onshore combustion plant and flaring
Medium (Biological / Ecological)
Low Minor Negative
Underwater noise from drilling, hammering and vessel movements
Medium Low Minor Negative
Platform cuttings and WBM discharge Medium Low Minor Negative
Platform cement discharge Medium Low Minor Negative
Platform non routine produced water discharge Medium Low Minor Negative
Platform water intake and cooling water discharge Medium Low Minor Negative
Platform pigging discharges (produced water and injection water infield pipelines)
Medium Low Minor Negative
Support vessel ballast water discharge Medium Low Minor Negative
Platform and support vessel treated black water discharge
Medium Low Minor Negative
Platform and support vessel grey water discharge Medium Low Minor Negative
Platform and support vessel galley waste discharge Medium Low Minor Negative
Platform and support vessel drainage discharge Medium Low Minor Negative
AIOC Chirag Oil Project Environmental & Socio-Economic Impact Assessment
Chapter 12: Socio-Economic Impact Assessment, Mitigation & Monitoring
February 2010 12/1Final
12 Socio-Economic Impact Assessment, Mitigation & Monitoring
Contents
12.1 Introduction........................................................................................................................212.2 Impact Assessment ...........................................................................................................2
12.2.1 Employment..........................................................................................................212.2.2 End of Construction Phase Workforce Reduction................................................512.2.3 Training and Skills Development..........................................................................512.2.4 Economic Activity .................................................................................................512.2.5 Community Disturbance .......................................................................................6
List of Figures
Figure 12.1 Estimates for the Number of Azerbaijani Citizens Likely to be Employed Over the Duration of the COP 3 Figure 12.2 Total Workforce Employed on Jacket and Topsides Construction for ACG Project
Phases 1 (CA-PDQ & C&WP), 2 (EA &WA) and 3 (DWG-DUQ &PCWU) 4
List of Tables
Table 12.1 Socio-Economic Events Leading to Impacts 2

AIOC Chirag Oil Project Environmental & Socio-Economic Impact Assessment
Chapter 12: Socio-Economic Impact Assessment, Mitigation & Monitoring
February 2010 12/2Final
12.1 Introduction
This Chapter of the Chirag Oil Project (COP) Environmental and Social Impact Assessment (ESIA) presents the assessment of the socio-economic impacts associated with all Phases of the COP.
Indicators used to measure potential socio-economic impacts include, but are not necessarily limited to, training and employment opportunities with associated changes in income levels, changes in community demographics, demand for public services and changes in the aesthetic / quality of life of the community. Where possible quantitative measures have been used within the socio-economic impact assessment.
12.2 Impact Assessment
Socio-economic impacts begin to be realised on public announcement of a project. Changes in social structure and interactions among community members may occur once a project is proposed to a community. In addition, real, measurable and sometimes significant impacts on the human environment can begin to take place as soon as there are changes in social or economic conditions.
The COP is predominantly an offshore development. Other than a relatively short onshore construction programme, the majority of COP related Activities occur offshore and use existing operational onshore infrastructure capacities (e.g. Sangachal Terminal, Baku Deep Water Jacket Factory (BDJF), Logistics Supply Base). As such, negative socio-economic impacts are likely to be minor and most will generally be positive arising from those Events identified in Table 12.1.
Table 12.1 Socio-Economic Events Leading to Impacts
COP Phase Event Employment Creation Employment Retrenchment
Training and Skills Development Increased Economic Flows
Predrill Construction Installation, Hook Up & Commissioning Operations
Community Disturbance
Community Health and Safety has been scoped out of the socio-economic impact assessment due to well-established existing controls. The AIOC Community Advisory Plan1
(CAP) outlines procedures for the management of community relations and provision of information on ACG project related works and activities. Additionally interference with commercial fishing activity has been scoped out based on limited fishing activity in the vicinity of shipping routes to and from the Contract Area and on existing marine management controls which aim to minimise inference with other sea users2.
Additional training and skills development to be provided through the COP is likely to increase the resource of technical and managerial skills and experience within the local economy. In addition, the COP is likely to provide some additional stimulus to the local economy by prolonging the demand for goods and services, as instigated via earlier ACG Phases, in the local area.
12.2.1 Employment
As discussed in Chapter 7: Socio-Economic Description, AIOC construction activities and project operations have had a significant impact on employment in the local area. Total direct construction employment from combined AIOC projects in Azerbaijan peaked at
1 The CAP was under development at the time of writing. It builds on the existing Community Liaison Management Plan as developed for the ACG Phase 1 construction programme. 2 Refer to Chapter 6 Section 6.5.2.8

AIOC Chirag Oil Project Environmental & Socio-Economic Impact Assessment
Chapter 12: Socio-Economic Impact Assessment, Mitigation & Monitoring
February 2010 12/3Final
approximately 5,500 workers in mid-2004 and for ACG Phase 3 peaked at around 2,500 staff (onshore and offshore construction) in 20063. Following completion of these construction programmes however, there has been a decrease in employment opportunities associated with the AIOC projects.
Figure 12.1 presents current estimates for the number of Azerbaijani citizens likely to be employed over the duration of the COP. This indicates that the national workforce is expected to peak at just over 2,000 early in 2011, and that the workforce will exceed 1,000 for a period of approximately 18 months. For comparison, Figure 12.2 summarises the total workforce employed on jacket and topsides construction for ACG Project Phases 1 (CA-PDQ and C&WP platforms), 2 (EA and WA platforms) and 3 (DWG-DUQ and PCWU platforms); this indicates that peak employment levels ranged from just under 1,500 (CA-C&WP) to approximately 2,300 (WA). Peak employment for the EA project (the development most similar to the COP) was approximately 1,600. The COP is therefore expected to generate employment opportunities similar to those arising from previous project phases. Because the construction process and facilities are now relatively mature, the duration of the COP construction phase will be short compared to the first ACG platforms, and similar to the duration for more recent platforms.
Figure 12.1 Estimates for the Number of Azerbaijani Citizens Likely to be Employed Over the Duration of the COP
0
200
400
600
800
1000
1200
1400
1600
1800
2000
2200
Client PMT Nationals 0 2 3 3 4 12 38 55 67 75 84 84 84 84 83 82 66 60 51 41 20
Contractor Nationals 0 0 0 0 182 274 176 595 994 1707 2062 1883 1680 1386 713 17 0 0 0 0 0
Operations Nationals 19 29 31 32 32 32 32 32 32 32 34 34 38 39 40 45 45 45 65 67 67
Q1-09 Q2-09 Q3-09 Q4-09 Q1-10 Q2-10 Q3-10 Q4-10 Q1-11 Q2-11 Q3-11 Q4-11 Q1-12 Q2-12 Q3-12 Q4-12 Q1-13 Q2-13 Q3-13 Q4-13 Q1-14
COP Azerbaijani Nationals Manning Profile 2009-2014
3 Based on employment records maintained by the ACG Phase 1-3 construction contractors.
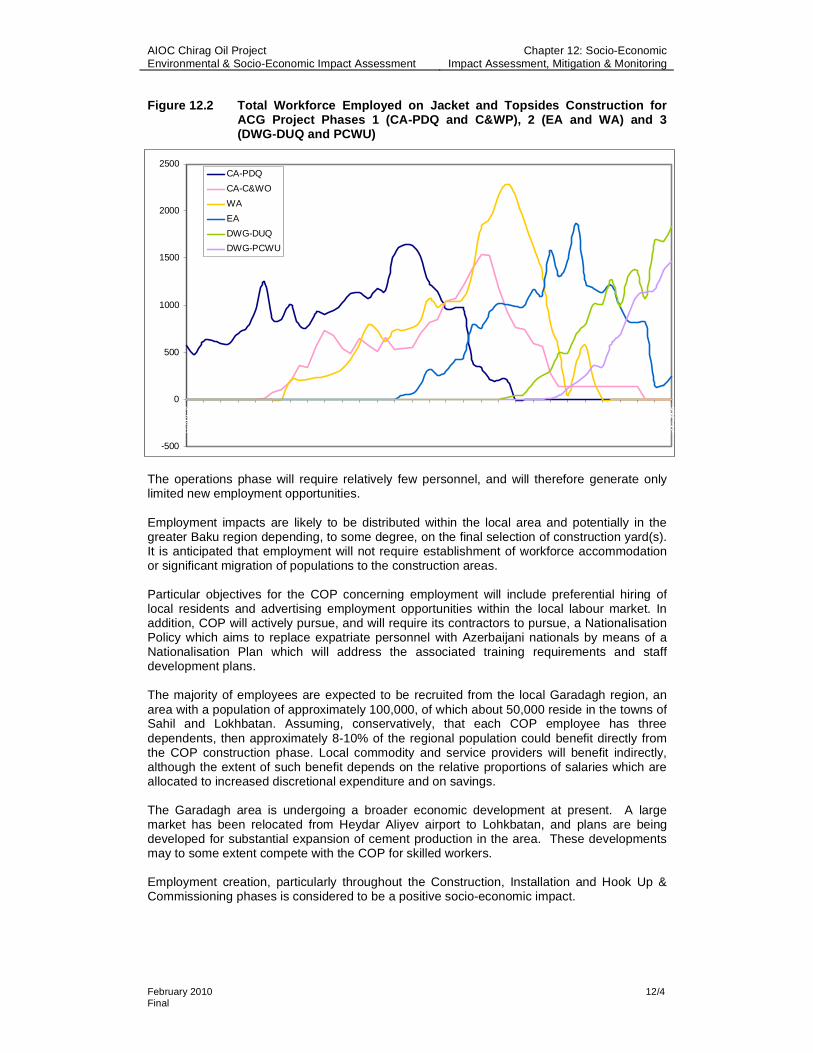
AIOC Chirag Oil Project Environmental & Socio-Economic Impact Assessment
Chapter 12: Socio-Economic Impact Assessment, Mitigation & Monitoring
February 2010 12/4Final
Figure 12.2 Total Workforce Employed on Jacket and Topsides Construction for ACG Project Phases 1 (CA-PDQ and C&WP), 2 (EA and WA) and 3 (DWG-DUQ and PCWU)
The operations phase will require relatively few personnel, and will therefore generate only limited new employment opportunities.
Employment impacts are likely to be distributed within the local area and potentially in the greater Baku region depending, to some degree, on the final selection of construction yard(s). It is anticipated that employment will not require establishment of workforce accommodation or significant migration of populations to the construction areas.
Particular objectives for the COP concerning employment will include preferential hiring of local residents and advertising employment opportunities within the local labour market. In addition, COP will actively pursue, and will require its contractors to pursue, a Nationalisation Policy which aims to replace expatriate personnel with Azerbaijani nationals by means of a Nationalisation Plan which will address the associated training requirements and staff development plans.
The majority of employees are expected to be recruited from the local Garadagh region, an area with a population of approximately 100,000, of which about 50,000 reside in the towns of Sahil and Lokhbatan. Assuming, conservatively, that each COP employee has three dependents, then approximately 8-10% of the regional population could benefit directly from the COP construction phase. Local commodity and service providers will benefit indirectly, although the extent of such benefit depends on the relative proportions of salaries which are allocated to increased discretional expenditure and on savings.
The Garadagh area is undergoing a broader economic development at present. A large market has been relocated from Heydar Aliyev airport to Lohkbatan, and plans are being developed for substantial expansion of cement production in the area. These developments may to some extent compete with the COP for skilled workers.
Employment creation, particularly throughout the Construction, Installation and Hook Up & Commissioning phases is considered to be a positive socio-economic impact.
-500
0
500
1000
1500
2000
2500CA-PDQ
CA-C&WO
WA
EA
DWG-DUQ
DWG-PCWU

AIOC Chirag Oil Project Environmental & Socio-Economic Impact Assessment
Chapter 12: Socio-Economic Impact Assessment, Mitigation & Monitoring
February 2010 12/5Final
12.2.2 End of Construction Phase Workforce Reduction
Assuming that demanning of the COP construction workforce occurs at the end of the COP construction phase, the cessation of economic input via salaries and project related spending on goods and services will impact household incomes of contracted workers and on the local economy, respectively. Figure 12.1 shows that there will be an initial period during which the workforce will decline steadily from the peak to a level of about 700, followed by a more abrupt final stage (currently estimated to occur in Q3-Q4 2012). The initial gradual phase of demanning will take place over a period of approximately one year, which will, to some extent, minimise competition for alternative employment.
To minimise impacts of demanning, planning for the conclusion of contracts will begin at the outset of the construction phase and related activities. Staff communications will ensure the workforce is aware of project progress and completion dates and staff will be provided with financial planning advice to encourage them to make provision for after the construction period. Training programmes will be developed to address skills shortages within the contractor and BP workforce and the employees who receive such training will therefore be in a better position to seek employment once their contract ends.
A register of construction phase employees will be established prior to demanning, and will attempt (as far as practicable, and contingent on the cooperation of departing staff) to track progress in securing subsequent employment. The register will be maintained for the duration of the construction phase.
12.2.3 Training and Skills Development
Many trained personnel engaged in the ACG Phases 1, 2 and 3 construction programmes have now moved on to new jobs in the national and international employment markets4. The COP Construction, Installation and Hook-Up & Commissioning phases are likely to require some investment in supplementing technical, managerial and administrative skills of the workforce. Training and skills development will provide a positive impact in developing the construction workforce skills and qualifications and in expanding the human capital available within the local economy.
12.2.4 Economic Activity
The COP will contribute economically directly, through direct employment and contracting, and indirectly, by increasing demand for goods and services in the local area. This will have a positive impact on the local economy, the magnitude of which will depend on the extent to which:
The COP salaries result in a net increase in regional disposable income (taking into account that salaries are agreed with SOCAR to conform to national rates); and
The COP recruitment has a positive impact on unemployment levels (that is, the extent to which the COP recruits personnel who are unemployed or who are currently in employment).
Direct and indirect expenditure might also provide some temporary stimulus to local businesses for the duration of the construction phase.
Economic developments in the Garadagh region (noted above) are likely to also increase employment levels, disposable income and demand for goods and services. While it is not presently possible to estimate with confidence the timescale over which this might occur, it is possible that such developments will reduce the proportional impact of the COP, during the construction phase and after the construction phase is completed.
4 As reported by the ACG Phase 1-3 construction contractors

AIOC Chirag Oil Project Environmental & Socio-Economic Impact Assessment
Chapter 12: Socio-Economic Impact Assessment, Mitigation & Monitoring
February 2010 12/6Final
Positive impacts will be maximised by promoting the use of local rather than international companies to the extent that this remains consistent with BP procurement policies, HSE requirements and the Code of Conduct. On balance, increased economic flows will result in a positive impact.
12.2.5 Community Disturbance
12.2.5.1 Construction Yards
At the time of writing, a final decision on which construction yard(s) will be used had not been made. Similarly, it was not known whether the yard(s) will / would need to be upgraded and / or expanded. In either case, it is considered that as all candidate yards are existing industrial sites with very limited residential premises in near proximity, the potential for significant disturbance associated with upgrade/expansion works is limited. In the event that site expansion is required, it is highly unlikely that this will include the need to acquire residential land rather will be simply limited to the acquisition of adjacent industrial land via a “willing seller / willing buyer” arrangement. It will be the responsibility of the construction contractor to complete any necessary land acquisition process.
An assessment of potential noise and air quality impacts from the COP construction phase activities including the associated existing controls and mitigation is provided in Chapter 10.
In accordance with the procedures developed during previous construction phases, there will be no discharge to the environment of liquid effluent unless it is approved by the regulatory authorities or is approved through inclusion in this ESIA document. Sewage will either be transported to a licensed municipal treatment works, or will be treated to standards specified by the regulatory authorities in on-site plant with all necessary licenses and permits.
All waste generated at the main fabrication and installation sites will only be managed by licensed waste management contractors. Solid non-hazardous waste which cannot be treated, re-used or recycled will be securely handled and transported and will be disposed of in landfill sites that comply with national legislation.
It is considered that implementation by the COP, during the construction phase, of the practices and procedures developed during previous project phases will ensure that emissions and wastes will have no negative impact on local residents and communities, or on the resources on which they depend.
12.2.5.2 Traffic
Increased road traffic during the COP construction and operation phase has the potential to disrupt communities and businesses along the routes used through increased noise and traffic flows. Peak traffic loads will be experienced during the COP construction phase, associated with the transportation of the construction workforce on a daily basis. BP and its main construction contractors implemented a successful driving and vehicle management plan during the previous ACG Projects which will be adopted for the COP.
The effectiveness of the driving and vehicle management plan can be summarised briefly. Between 2002 and 2008 ACG Project vehicles covered approximately 153,000,000km. During peak activity (2003-2007) there were on average approximately 50 incidents per year involving Project vehicles, of which 85% were classified as involving only slight damage. In 70% of incidents, the project vehicle involved was hit from the side or behind by another vehicle (i.e. the project vehicle was the victim not the likely cause of the incident). Only 8% of incidents occurred on the open highway, 68% in urban areas and 24% on the construction sites. These statistics demonstrate that both driver training and vehicle maintenance achieved high standards of safety, protecting both project employees and the general public.
The key principles of the driving and vehicle management plan will be to ensure driver competence, monitoring of driver hours and performance, vehicle quality standards are

AIOC Chirag Oil Project Environmental & Socio-Economic Impact Assessment
Chapter 12: Socio-Economic Impact Assessment, Mitigation & Monitoring
February 2010 12/7Final
maintained and road route assessment are undertaken. These and other supporting principles will be detailed in driving and vehicle management plans for the construction as well as operational phases of the COP. To reduce the number of vehicles, the use of buses to transport the construction workforce to site will be maximised.
The road system in and around Baku is continually being improved and completed improvements will provide benefit to the transportation of the COP construction workforce. Approved road traffic routes used to transport the main construction workforce will be established and a review mechanism established by the construction contractor(s) to ensure that the safest routes are used and disturbance to communities and businesses is minimised.
Increased economic activity in the Garadagh region (Lokhbatan market, cement plant developments) are likely to lead to an increase in general traffic density, and to a corresponding increase in traffic incidents. Rigorous implementation of BP’s driving policies by all contractors will play a key role in minimising the exposure of the COP-related traffic to this increased risk.
Overall the impact to communities and businesses from the increased traffic is considered to be negligible.

AIOC Chirag Oil Project Environmental & Socio-Economic Impact Assessment
Chapter 13: Cumulative and Transboundary Impacts
and Accidental Events
February 2010 13/1Final
13 Cumulative and Transboundary Impacts and Accidental Events
Contents13.1 Introduction .......................................................................................................................313.2 Cumulative and Transboundary Impacts ......................................................................... 313.3 Marine Environment: Cumulative Impacts...................................................................... 5
13.3.1 Physical Presence ........................................................................................... 513.3.2 Drilling Discharges........................................................................................... 613.3.3 Grey and Black Water Discharges .................................................................. 613.3.4 Cooling Water Discharges............................................................................... 613.3.5 Produced Water Discharges............................................................................ 713.3.6 Conclusion....................................................................................................... 7
13.4 Non-Greenhouse Gas Atmospheric Emissions: Cumulative Impacts .......................... 1013.4.1 Onshore Non-Greenhouse Gas Atmospheric Emissions.............................. 1113.4.2 Offshore Non Greenhouse Gas Atmospheric Emissions .............................. 1213.4.3 Conclusion..................................................................................................... 14
13.5 Non-Greenhouse Gas Atmospheric Emissions: Transboundary Impacts ..................... 1513.6 Greenhouse Gas Atmospheric Emissions: Cumulative and Transboundary Impacts.. 15
13.6.1 Conclusion..................................................................................................... 1713.7 Accidental Events .......................................................................................................... 18
13.7.1 Overview........................................................................................................ 1813.7.2 Previous Crude and Diesel Spill Modelling Relevant to COP ....................... 1813.7.3 Impact of Oil Spills......................................................................................... 3413.7.4 Oil Spill Prevention and Response Planning................................................. 3513.7.5 Reporting ....................................................................................................... 39
List of Figures
Figure 13.1 Location of ACG and SD Offshore Facilities 4 Figure 13.2 WC-PDQ Discharge Locations 9 Figure 13.3 Horizontal Displacement of Produced Water Plume by Cooling Water in the
Absence of a Thermocline Under Stagnant (Upper Graph) and Predominant Current (Lower Graph) Conditions 9
Figure 13.4 COP Non-GHG Emissions Per Project Phase 11 Figure 13.5 NO2 Long Term Concentrations (Normal Operations at All Platforms) 12 Figure 13.6 NO2 Short Term Concentrations (Normal Operations at All Platforms) 13 Figure 13.7 NO2 Short Term Concentrations (West Chirag Emergency Depressurisation,
Other Platform Normal Operations) 14 Figure 13.8 COP Greenhouse Gas Emissions Per Phase 16 Figure 13.9 COP Operational GHG Emissions Relative to Forecast GHG Emissions from
EOP, ACG 1, 2 & 3 and SD Projects (2012 –2024) 16 Figure 13.10 Volume of Spilled Chirag and DWG Crude Oils in 5m/s Wind at 6oC 21 Figure 13.11 Volume of Spilled Chirag and DWG Crude Oils in 10m/s Wind at 6oC 21 Figure 13.12 Volume of Spilled Chirag, DWG and COP Crude Oils in 5m/s Wind at 6oC 22 Figure 13.13 Volume of Spilled Chirag, DWG and COP Crude Oils in 10m/s Wind at 6oC 23 Figure 13.14 Drift of Spilled COP Oil from Blowout in 5m/s Wind from 100o 26Figure 13.15 Drift of Spilled COP Oil from Blowout in 5m/s Wind from 105o 26 Figure 13.16 Drift of Spilled COP Oil from Blowout in 5m/s Wind from 115o 27 Figure 13.17 Drift of Spilled COP Oil from Blowout in Wind from 45o 28 Figure 13.18 Drift of Spilled COP Oil from Blowout in 5m/s Wind from 270o 29 Figure 13.19 Pipeline Rupture: Directions and Distance of Spilled Oil Drift and the Volume
of Spilled Oil Coming Onshore (m3) 32 Figure 13.20 Drift of Spilled COP Oil from Separator Failure in 10m/s Wind from 110o 33 Figure 13.21 OSRP – Responsibility 39

AIOC Chirag Oil Project Environmental & Socio-Economic Impact Assessment
Chapter 13: Cumulative and Transboundary Impacts
and Accidental Events
February 2010 13/2Final
List of Tables
Table 13.1 Areas Occupied by ACG Offshore Facilities (Platforms and Pipelines) 5 Table 13.2 Estimated Pour Points of Crude Oil Residues 20 Table 13.3 Summary of Oil Spill Scenarios Modelled for Previous ACG Projects 24 Table 13.4 Estimated Blow-Out Frequencies for a Range of Drilling Activities 24 Table 13.5 Inputs for COP Blow Out Scenario 25 Table 13.6 COP Blow Out: Locations and Amounts of Spilled Oil Coming Ashore in
Azerbaijan 27 Table 13.7 Blowout: Locations and Amounts of Oil Coming Ashore in Iran 28 Table 13.8 Blowout: Locations and Amounts of Oil Coming Ashore in Turkmenistan 29 Table 13.9 Pipeline Rupture Scenario Inputs 31 Table 13.10 Volumes of Oil Remaining on the Sea Surface after a 1,000 m3 Oil Spill 31 Table 13.11 Pipeline Rupture: Locations and Amounts of Spilled Oil Coming Ashore 31 Table 13.12 Inputs for the COP Separator Failure Scenario 32 Table 13.13 Separator Failure: Locations and Amounts of Spilled Oil Coming Ashore 33

AIOC Chirag Oil Project Environmental & Socio-Economic Impact Assessment
Chapter 13: Cumulative and Transboundary Impacts
and Accidental Events
February 2010 13/3Final
13.1 Introduction
This Chapter of the COP Environmental and Social Impact Assessment (ESIA) discusses:
Cumulative and Transboundary Impacts; and Accidental Events that could potentially occur during the construction, installation and
hook-up & commissioning and operation phases of the Chirag Oil Project (COP) and the control, mitigation and response measures designed to minimise event likelihood and impact.
13.2 Cumulative and Transboundary Impacts
As discussed within Chapter 3, cumulative impacts arise from:
Interactions between separate COP activities and/or impacts; and Interactions between COP activities and activities associated with other AIOC (ACG
and Shah Deniz (SD)) activities.
As outlined in Chapter 1, the COP constitutes the next stage of development of the ACG Contract Area. The development has, so far, been undertaken in a phased approach comprising four discrete investment steps, as follows:
The Early Oil Project (EOP) Chirag-1 platform which came on stream in November 1997;
ACG Phase 1 that will deliver the recoverable reserves in the central section of the Azeri Field including the Central Azeri (CA) platforms that produced first oil in 2005;
ACG Phase 2 that will deliver the recoverable reserves in the West and East sections of the Azeri Field including the East and West Azeri (EA and WA) platforms that produced first oil in 2006; and
ACG Phase 3 that will deliver the recoverable reserves in the Deep Water Gunashli (DWG) Field including the two DWG platforms that produced first oil in May 2008.
The EOP included the construction of the oil receiving facilities at Sangachal Terminal, which were subsequently expanded for ACG Phases 1, 2 and 3. The COP will not require any additional expansion or upgrade works at the Terminal rather will make use of ullage within the existing processing facilities.
Figure 13.1 shows the location of the offshore ACG facilities (including the COP facilities) and the Sangachal Terminal. In addition, the offshore facilities within the SD gas / condensate Contract Area (located approximately 55km southeast of the ACG Contract Area), which commenced production in the first quarter of 2007, are depicted.
ESIAs for each phase of development have been undertaken and the impact associated with emissions and discharges have been assessed. The potential for cumulative impacts between these releases is discussed in the following sections with reference, where relevant, to modelling studies undertaken.


AIOC Chirag Oil Project Environmental & Socio-Economic Impact Assessment
Chapter 13: Cumulative and Transboundary Impacts
and Accidental Events
February 2010 13/5Final
13.3 Marine Environment: Cumulative Impacts
Potential cumulative impacts on the marine environment resulting from interaction between separate COP activities or between COP and other ACG activities include:
Physical presence (area occupied by platform and pipelines); Drilling discharges; Black and grey water discharges; Cooling water discharges; and Non-routine produced water discharges.
Interactions with SD activities are not considered likely during normal operations given the distance between the SD and ACG Contract Areas (approximately 75km) and the limited geographic scope of the above ACG events as discussed below.
13.3.1 Physical Presence
The area occupied by each platform and the pipelines (existing and proposed) within the ACG Contract Area is presented in Table 13.1.
Table 13.1 Areas Occupied by ACG Offshore Facilities (Platforms and Pipelines)
Area (km2)% of ACG Contract
Area % of Caspian Sea
Chirag-1 0.09 0.021 0.000024
CA facilities (PDQ & C&WP) 0.12 0.028 0.000032
WA 0.06 0.014 0.000016
EA 0.07 0.016 0.000019
DWG facilities (DUQ & PCWU) 0.17 0.039 0.000046
WC-PDQ 0.06 0.014 0.000016
All Platforms 0.57 0.132 0.000153 ACG Existing Pipelines 3.83 0.885 0.001032 COP Infield Pipelines
30” Oil Pipeline 0.03 0.007 0.000008
14” Gas Pipeline 0.01 0.002 0.000003
18” Water Injection Pipeline 0.02 0.005 0.000005
16” Produced Water Pipeline 0.02 0.005 0.000005
All Pipelines 3.91 0.904 0.001053 Total 4.48 1.036 0.002413
As Table 13.1 illustrates, the area occupied by the ACG platforms is relatively small (0.57km2). The COP requires the installation of short lengths of pipelines (refer to Chapter 5: Project Description for dimensions) to connect to the main oil and gas export lines and between the WC-PDQ and DWG platforms. These will occupy a small area of approximately 0.08km2.
The key points with respect to physical presence are:
Cumulative area occupied by platforms and pipelines is extremely small in relation to similar habitats both locally and regionally;
Neither COP or any other ACG installation occupies habitat which is critical for local ecosystem function; and
The physical presence of COP and other ACG installations will affect only habitat within the immediate footprint, and will not affect immediately adjacent habitat.

AIOC Chirag Oil Project Environmental & Socio-Economic Impact Assessment
Chapter 13: Cumulative and Transboundary Impacts
and Accidental Events
February 2010 13/6Final
13.3.2 Drilling Discharges
Drilling discharges during the COP and for all other ACG phases consist of:
Cuttings, seawater and gel sweeps from the predrilled conductor sections of each well (during predrilling); and
Cuttings and water based mud (WBM) from the surface-hole sections of each well (during predrilling and platform drilling).
Dispersion and settlement modelling for successive ESIA, including the COP, has demonstrated that deposition of drill cuttings and seawater and gel sweeps and WBM will primarily occur within 200m of the source.
Monitoring at existing platforms (i.e. CA, WA, EA and DWG) has shown that the cumulative effects of predrilling and platform drilling at each location are minor, confirming the predictions of the Phase 1, 2 and 3 ESIA. Drilling activities during the Phase 1, 2 and 3 developments have resulted in an identifiable barium “footprint” arising primarily from barite in predrill WBM discharges but have not caused other identifiable chemical contamination1. Small changes in the concentration of other heavy metals have been observed in some instances but these are associated with the natural composition of the drilled rock and are not derived from drilling fluids.
Biological impacts have been limited to a slight reduction in the number of species within 300-500m of platforms but these changes are considered minor and the biological communities around the Phase 1, 2 and 3 platforms remain healthy and diverse1. The limited areas within which cuttings are deposited and the minor impacts within these areas (up to 500m at most), lead to the conclusion that there will be no interaction of impacts between drilling discharges from adjacent platforms. Consequently, the cumulative effects of ACG drilling discharges will be limited to a total area very similar to that defined by the sum of the 500m safety exclusion zones around each platform (representing 6km2 or 1% of the Contract Area).
13.3.3 Grey and Black Water Discharges
Chapters 9, 10 and 11 of this ESIA have shown that neither black nor grey water discharges from COP activities will have a significant impact and that both will be diluted to environmentally acceptable levels within a few metres of the point of discharge. These discharges comprise primarily organic material, which has little potential for interaction with the contents of other discharges. Consequently, it is considered that these discharges will not make a significant contribution to cumulative impacts either within the COP development or in combination with existing platform operations.
13.3.4 Cooling Water Discharges
Cooling water will be discharged from the MODU during predrill activities. The discharge will take place just above the sea surface at a rate of approximately 78l/s and it has been estimated that a dilution of 27-fold would be sufficient to eliminate any impact from the biocide used to protect the cooling system2. This dilution will occur within a few tens of metres at most, ensuring that the exposure risk for organisms near the sea surface will be very low and that the impact of the MODU cooling water discharge will not interact with other existing ACG platform cooling water discharges and therefore, will not contribute to any cumulative impacts.
Cooling water discharge from the COP WC-PDQ platform at a depth of 45m has two aspects: temperature and the presence of copper and chlorine ions. The concentrations of copper and chlorine in the discharge are very low (close to, or below, international environmental quality standards). Both ionic species will react very quickly following discharge. Copper ions will rapidly combine with chloride and organic material and chlorine will very rapidly be converted
1 Refer to Chapter 6: Environmental Description for further detail 2 Refer to Chapter 9 Section 9.5.5

AIOC Chirag Oil Project Environmental & Socio-Economic Impact Assessment
Chapter 13: Cumulative and Transboundary Impacts
and Accidental Events
February 2010 13/7Final
to chloride in the process of oxidising natural organic material. The consequence of these reactions is that the free ion forms (i.e. the toxic forms) of these elements will only persist for a very short period of time. The complexed and oxidised forms are of relatively low toxicity.
Modelling has shown that temperature is mitigated to acceptable levels within metres of the discharge point and that there is thus no potential for interaction with discharges from other platforms. Consequently, although the cooling water discharges are large in volume, the plume within which water temperature would exceed ambient by more than 3ºC would extend less than 30m. This means that the impact would be sufficiently small that there would be no cumulative interaction with other COP discharges and no overall significant cumulative impact of the combined discharges from the COP and other ACG platforms.
13.3.5 Produced Water Discharges
While it is not planned to discharge produced water routinely, there will be occasions for all ACG offshore facilities where it may be necessary to discharge produced water in accordance with the PSA for limited periods of time.
Studies have been carried out on the composition and toxicity of produced water and discharge scenarios have been developed and modelled. At the present time, no ACG platforms are routinely separating water offshore and estimates of potential environmental impact are therefore based on data obtained from separators at the Sangachal Terminal. This data is for water, which had not been treated to the offshore standards specified in the PSA and therefore, represent a worst-case scenario.
The results of toxicity testing indicated that a dilution of 120-fold would be sufficient to reduce the discharge to no-effect concentrations and modelling of the produced water plume shows that a dilution of 300-fold would be achieved within 100m under dominant current conditions3.If produced water is treated to a concentration of 29mg/l oil-in-water (monthly average), then a dilution of 600-fold would be sufficient to reduce hydrocarbon concentrations to a typical ambient level of 50µg/l. The impact of produced water discharges is, therefore, limited to a small area close to each platform (within approximately 50m based on modelling undertaken for the COP) and there is thus no risk of interaction of impacts between discharges from different platforms, even if these occur simultaneously. Produced water discharges are also typically of short duration (i.e. hours) and take place at a different depth (46m below sea level) to other COP discharges and there is very limited potential for cumulative interaction between the COP discharges.
13.3.6 Conclusion
A key aspect of assessing the impact of discharges was to determine whether each discharge had the potential for:
Additive effect: Due to releasing into the environment persistent pollutants which could have a chronic impact, the effects of which might continue after the discharge had ceased, or beyond the immediate vicinity of the discharge; or Interaction effect: Due to mixing with other discharges to give rise to an impact greater than predicted for either discharge alone.
For each of the discharges, the composition was taken into account, and where appropriate the chemical selection process has ensured that no chemicals which are persistent or are associated with chronic effects are used.
13.3.6.1 Additive Effects
For each of the discharges, the assessments presented within Chapters 9, 10 and 11 of the ESIA as discussed in Sections 13.3.2 – 13.3.5 above, confirmed that any minor impacts
3 Refer to Chapter 11 Section 11.5.4

AIOC Chirag Oil Project Environmental & Socio-Economic Impact Assessment
Chapter 13: Cumulative and Transboundary Impacts
and Accidental Events
February 2010 13/8Final
would be confined to small volumes of water, and that there would be no persistent effects at a greater distance or after the discharge had ceased. The consequence of this is that the impact of each discharge can genuinely be considered transient, that is, there will be the potential for very limited effects within a small mixing zone, but that these will:
not represent a significant reduction in local ecological health or productivity; and have no longer-term ecological consequences after discharge has ceased .
In summary, this means that the potential sequence of discharges will not, cumulatively, lead to any degree of progressive environmental degradation over time due to additive effects. Each represents a minor interaction which is confined to within a few tens or hundreds of metres from the point of discharge, and from which ecological recovery will be rapid and complete.
13.3.6.2 Interaction Effects
Taking into account the location, depth and behaviour of discharges (Refer to Table 1 Appendix 13A) the only potential for cumulative effects associated with interactions would arise from the concurrent discharge from the platform of:
Cooling water and produced water; Cooling water and pigging water; and Cooling water, produced water and pigging water.
During early platform life, pigging of the injection lines will utilise produced water, and potential interactions will therefore be similar to those for produced water. During later platform life, pigging discharges will use inhibited seawater in which chemical dosage has been carefully managed and minimised to ensure that impacts are effectively mitigated. Concurrent discharge of produced water and pigging water (via the same caisson) will therefore generate a slightly larger mixing plume, but will have no more impact than the discharge of produced water alone.
The most probable interaction scenario therefore involves cooling water (a continuous routine discharge) and produced water (an intermittent non routine discharge). Figure 13.2 illustrates the relative positions of the discharge caissons. Under conditions of typical current direction and velocity, it is unlikely that the discharge plumes will interact significantly – i.e., any mixing will occur after both have been highly diluted and at some considerable distance from the platform.
The most likely interaction scenario for cooling water and produced water is under stagnant current conditions. Both discharges are warm (approximately 25oC) and will rise vertically in the absence of any significant current, spreading at the surface in winter and at the bottom of the thermocline in summer. Combined dispersion models were run to assess the degree of interaction between the plumes4. Both discharges are predicted to have diluted to the point where temperature does not exceed ambient by >3oC before they reach the point where they could begin to mix, and any mixing will therefore have no consequences in terms of complying with the IFC temperature requirements.
The cooling water contains very low concentrations of antifouling agents, and is not on its own predicted to have any toxicity impact; there will thus be no chemical interaction with the produced water. The combined dispersion modelling predicts that the only consequence of interaction will be the horizontal displacement of the produced water plume as a result of the spreading of cooling water at the sea surface (Figure 13.3). The area of the surface produced water plume, and the dilution contours, are not materially affected. The conclusion is that concurrent discharge of cooling water and produced water would not result in any cumulative impact.
4 Refer to Appendices 11E and 11F for modelling assumptions and input data.

AIOC Chirag Oil Project Environmental & Socio-Economic Impact Assessment
Chapter 13: Cumulative and Transboundary Impacts
and Accidental Events
February 2010 13/9Final
Figure 13.2 WC-PDQ Platform Discharge Locations
Figure 13.3 Horizontal Displacement of Produced Water Plume by Cooling Water in the Absence of a Thermocline under Stagnant (Upper Graph) and Predominant Current (Lower Graph) Conditions

AIOC Chirag Oil Project Environmental & Socio-Economic Impact Assessment
Chapter 13: Cumulative and Transboundary Impacts
and Accidental Events
February 2010 13/10Final
Planned or unplanned discharges from the COP will be, as with other platforms, of limited impact. Each discharge will make a small incremental contribution to the ACG total but the platform discharges will be isolated from each other and the total itself represents a very small fraction of the assimilative capacity of the Contract Area. Consequently, it is considered that these discharges represent a sustainable situation in which there will be no measurable or progressive deterioration of the marine environment attributable to ACG operations. All of these discharges will be dispersed and diluted to concentrations below the threshold of impact within (at most) a few hundred metres of the source and therefore have no potential for cumulative impacts.
13.3.6.3 Mitigation and Monitoring
Control measures to mitigate impacts to the marine environment from routine and non routine discharges associated with the COP and associated reporting requirements are detailed within Chapters 9, 10 and 11 of this ESIA. These include design and operating principles (e.g. no planned discharge of non-WBM), facility maintenance regimes, appropriate chemical selection and monitoring to confirm effective operation and/or confirm compliance with standards.
Monitoring and reporting procedures and documentation requirements for each ACG phase are included within BP Azerbaijan's Health, Safety, Security and Environment (HSSE) Policy (Refer to Chapter 14). Once operational, COP will become a component of the AzSPU Offshore Organisation (ACG Performance Unit) and will develop a set of project specific monitoring, management and reporting procedures based on, and consistent with, the procedures already in use on existing ACG platforms.
13.4 Non-Greenhouse Gas Atmospheric Emissions: Cumulative Impacts
Atmospheric emissions will arise from each COP phase due to:
The operation of power generation plant; Transportation (e.g. vessels and helicopters); Flaring; and Fugitive emissions from existing tanks at the terminal.
Figure 13.4 presents volumes of the non-greenhouse gas (non-GHG) emissions nitrous oxides, sulphur oxides, carbon monoxide and non methane hydrocarbons, for each phase of the COP.

AIOC Chirag Oil Project Environmental & Socio-Economic Impact Assessment
Chapter 13: Cumulative and Transboundary Impacts
and Accidental Events
February 2010 13/11Final
Figure 13.4 COP Non-GHG Emissions Per Project Phase
NOX, which comprises nitrous oxide (NO) and nitrogen dioxide (NO2), is the main atmospheric pollutant of concern, based on the larger predicted emission volumes as compared to non-GHG emissions and the potential to impact human health and the environment.
13.4.1 Onshore Non-Greenhouse Gas Atmospheric Emissions
Chapters 9, 10 and 11 of this ESIA have shown that NO2 emissions associated with each COP phase will not result in any significant impact to human and biological / ecological receptors. Specifically emissions from offshore activities for all phases were shown to result in no discernable change in NO2 concentrations at relevant onshore receptors. Emissions arising from COP derived oil and gas being received at the Terminal, were not predicted to exceed the forecast peak emissions associated with the combined EOP and ACG Phases 1, 2 and 3 due to the predicted reduction in emissions at the Terminal over the COP lifetime as production from other projects declines.
Modelling of onshore air emissions for previous ACG ESIA, assuming both reasonable normal and worst case plant conditions (i.e. normal operation and emergency / upset worst case flaring conditions), showed that ambient air quality concentrations of all pollutants complied with relevant ambient air quality standards at the nearest residential receptors to the Terminal. It is considered therefore, that cumulative impacts to receptors associated with non-GHG emissions from the Terminal will be insignificant.
BP currently undertakes a program of ambient air quality monitoring at locations around the Terminal and stack emissions monitoring from the major power generation (>500 HP) units. The program is designed to confirm the air quality in the surrounding communities and benchmark the Terminal’s effect on air quality. Results from the most recent air quality monitoring programmes (2006 and 2007) are presented in Chapter 6 of this ESIA. No exceedances of relevant long-term standards or short term exceedances attributable to Terminal operations at locations in and around the Terminal have been recorded.
Existing control measures at the Terminal to minimise non GHG atmospheric emissions are detailed within Chapter 11.
600t2785t
9990t
1722t
60t
365t2474t
5t
170t
450t
7273t
1505t
65t
141t
4606t
1332t
0
2000
4000
6000
8000
10000
12000
14000
16000
NOx SOx CO NMVOC
Onshore Operations
Offshore Operations
Construction, Installation and HUC
Predrill

AIOC Chirag Oil Project Environmental & Socio-Economic Impact Assessment
Chapter 13: Cumulative and Transboundary Impacts
and Accidental Events
February 2010 13/12Final
13.4.2 Offshore Non Greenhouse Gas Atmospheric Emissions
Modelling has been undertaken to establish the cumulative effect from non-GHG emissions due to the operation of the EOP, ACG Phases 1, 2 and 3 and the COP offshore facilities on NO2 concentrations onshore. A number of scenarios were modelled to represent typical and worst case operating conditions including:
Normal routine operation of all offshore platforms; and Emergency depressurisation and flaring of complete inventory at COP offshore facilities
due to restricted gas export with normal routine operation at all other ACG and SD platforms.
For each scenario, the NO2 emissions from both the existing platforms and proposed WC-PDQ platform were modelled to determine the future contribution of emissions to the air quality onshore. Concentrations taking into account existing background levels5 were compared against relevant long term (annual average) and short term (1hour peak) air quality standards for the protection of human health6,.
The modelling demonstrated that during routine operation, NO2 emissions disperse rapidly and the increase in long term NO2 concentrations due to all ACG and SD offshore operations are likely to be indiscernible from background levels (Figure 13.5).
Figure 13.5 NO2 Long Term Concentrations (Normal Operations at All Platforms)
5 Refer to Chapter 6: Environmental Description for background levels 6 Applicable 1 hour average (short term) and annual average (long term) standards for NO2 are 200µg/m3 and 40µg/m3 respectively
0 30 60km
NO2 long term annual standard = 40µg/m3

AIOC Chirag Oil Project Environmental & Socio-Economic Impact Assessment
Chapter 13: Cumulative and Transboundary Impacts
and Accidental Events
February 2010 13/13Final
Under reasonable worst case conditions when emergency depressurisation of the COP facilities may be necessary, which is expected to occur over approximately 1 hour, the short term increase in NO2 concentrations onshore are likely to be insignificant. Figures 13.6 and 13.7 presents the short term modelling results obtained for normal routine operations of all platforms and the worst case scenario when the inventory of the COP facilities are flared.
Figure 13.6 NO2 Short Term Concentrations (Normal Operations at All Platforms)
0 30 60km
NO2 short term peak standard = 200µg/m3

AIOC Chirag Oil Project Environmental & Socio-Economic Impact Assessment
Chapter 13: Cumulative and Transboundary Impacts
and Accidental Events
February 2010 13/14Final
Figure 13.7 NO2 Short Term Concentrations (West Chirag Emergency Depressurisation, Other Platform Normal Operations)
Figures 13.5, 13.6 and 13.7 demonstrate that:
Emissions from the ACG and SD offshore facilities disperse rapidly in the predominant wind directions (north and south);
Changes in NO2 concentrations onshore associated with offshore operations are predominantly due to SD operations;
Short term NO2 concentrations reduce to more than 20 times less than the applicable standard before the emission plume reaches onshore7; and
Changes in short term NO2 concentrations onshore due to offshore operations, even under worst-case conditions, are likely to be indiscernible from background concentrations.
13.4.3 Conclusion
The assessment above demonstrates that it is unlikely that the COP in combination with the EOP, ACG Phases 1, 2 and 3 and SD projects will result in any significant cumulative effects to air quality at relevant onshore receptors.
As for platform discharges, control measures to mitigate impacts to the atmosphere from routine and non routine emissions associated with the COP and associated reporting requirements are detailed within Chapters 9, 10 and 11 of this ESIA. These include design and operating principles (e.g. no continuous routine flaring or venting at the platforms under
7 Historically in Azerbaijan ambient concentrations of NO2, SO2, CO and PM10 have also been assessed against specific 24 hour and 1 hour standards. These standards were not derived using the same health based criteria as the IFC, WHO and EU guideline values and the standards derived are not widely recognised. However, Appendix 11B (Annex 1) includes an assessment of expected air quality concentrations against these standards for completeness. The modelling demonstrated that none of these standards would be exceeded.
NO2 short term peak standard = 200µg/m3
0 30 60km

AIOC Chirag Oil Project Environmental & Socio-Economic Impact Assessment
Chapter 13: Cumulative and Transboundary Impacts
and Accidental Events
February 2010 13/15Final
normal conditions), facility maintenance regimes and monitoring to confirm effective operation and / or confirm compliance with standards.
13.5 Non-Greenhouse Gas Atmospheric Emissions: Transboundary Impacts
The potential for transboundary impacts associated with non-GHG emissions are dependant on the environmental / health effects associated with the pollutant, residence time (i.e. atmospheric lifetime) and the expected dispersion characteristics of the pollutant in the atmosphere in addition to the location of potential receptors.
As discussed in Section 13.4.2 above, the most significant pollutant in terms of health impacts is NO2. It has been demonstrated that emissions associated with COP offshore activities alone and emissions from worst-case cumulative ACG and SD offshore activities are not expected to result any discernable changes in onshore NO2 concentrations. Based on the limited geographic scope of pollutant species, which will disperse rapidly in the atmosphere, no transboundary impacts associated with air quality and human health are predicted.
As discussed within Chapter 11 of this ESIA, impacts to air quality in the vicinity of the Terminal, taking into account all ACG Phases across the PSA period, demonstrated no significant impact to nearby residential receptors. No transboundary impacts to air quality from onshore emissions are therefore, predicted.
For both onshore and offshore activities, the volumes of emissions released (including visible particulates) due to the COP are expected to result in very small increases in pollutant concentrations in the atmosphere and in any washout from rainfall, which will not be discernable to biological / ecological receptors. SO2 emissions will be minimised through the planned use of low sulphur diesel and are expected to disperse rapidly due to appropriate equipment design. Contribution of COP SO2 emissions to acid rain generation is therefore, expected to be insignificant.
The movements of vessels bringing construction materials from overseas will occur over a large geographic area and emissions will be relatively short in duration and are expected to disperse rapidly. No significant transboundary impacts from non-GHG emissions from the COP are therefore predicted.
13.6 Greenhouse Gas Atmospheric Emissions: Cumulative and Transboundary Impacts
Increases in man made GHG (including carbon dioxide and methane) are widely accepted as contributing to changes in the energy balance of the world’s climate system, creating an overall increase in average global temperatures8.
The framework for international efforts to address the challenge of climate change due to anthropogenic GHG emissions is the UN Framework Convention on Climate Change (UNFCCC), signed in 1992. In 1997, the Third Conference of the Parties to the UNFCCC adopted the Kyoto Protocol to the Convention. This Protocol, which entered into force on 16 February 2005, commits industrialised nations (Annex 1 countries) to reduce their GHG emissions by an average of 5.2% of 1990 levels by the 5-year commitment period 2008-2012. The Republic of Azerbaijan is not listed in Annex I of the protocol and is therefore not formally required to meet specific reduction targets for GHG emissions.
Expected greenhouse gas emissions from COP activities are presented in Chapter 5 of this ESIA for all phases of the project. Figure 13.8 shows the predicted contribution per phase.
8 Fourth Assessment Report of the United Nations Intergovernmental Panel on Climate Change - Climate Change 2007, IPCC, 2007.

AIOC Chirag Oil Project Environmental & Socio-Economic Impact Assessment
Chapter 13: Cumulative and Transboundary Impacts
and Accidental Events
February 2010 13/16Final
Figure 13.8 COP Greenhouse Gas Emissions Per Phase
The majority (97%) of GHG result from COP onshore and offshore operational activities. Figure 13.9 presents the volume of the COP operational GHG emissions relative to the previously forecast GHG emissions for the EOP, ACG Phases 1, 2 and 3 and SD projects.
Figure 13.9 COP Operational GHG Emissions Relative to Forecast GHG Emissions from EOP, ACG 1, 2 & 3 and SD Projects (2012 –2024)
Offshore Operations
72.81%
Pipeline Installation &
Commissioning1.19%
Predrill0.70%
Platform Installation &
Commissioning0.13%
Onshore Construction &
Commissioning0.96%
Onshore Operations
24.21%
4,469kt
1,486kt
43kt
59kt 73kt
8kt
ACG FFD78.29%
EOP5.04%
SD-16.03%
COP10.64%
45,150kt
2,905kt
3,475kt
6,138kt

AIOC Chirag Oil Project Environmental & Socio-Economic Impact Assessment
Chapter 13: Cumulative and Transboundary Impacts
and Accidental Events
February 2010 13/17Final
Figure 13.9 demonstrates that the COP will contribute approximately 11% of the total forecast GHG emissions over the PSA period.
The most recent forecast of GHG emissions in Azerbaijan9 indicates that by 2020 total GHG emissions may be approximately 109,895 kt with the majority resulting from fuel combusted in the energy industry. As a proportion COP forecast GHG emissions for 2020 are expected to contribute approximately 0.5% to the national total.
The UNFCCC was approved by Decree by the Milli Mejlis (Parliament) of the Azerbaijan Republic in 1995. Following the signing of the UNFCCC, a Convention State Commission on Problems of Climate Change was established in 1997 by Decree of the then President of Azerbaijan Republic, G.A. Aliyev to implement commitments under the Convention. The chairman of the State Committee on Hydrometeorology was appointed deputy chairman of the Commission. The chairman of the State Committee on Hydrometeorology was replaced with the Minister of Ecology and Natural Resource in the Commission by Decree of the President in 2003. The Climate Change and Ozone Centre was established in 2005 within the Ministry of Ecology and Natural Resources. The aim of the Centre is to ensure the implementation of the Convention, coordinate various activities within the climate change sector and to act as an implementing arm of the State Commission.
The Republic of Azerbaijan is active in developing strategies to abate greenhouse gas emissions and is considering measures including opportunities for use of alternative sources of energy which do not emit carbon and participation in the clean development mechanism, whereby developed countries can invest in clean technologies in developing and transition countries, resulting in a benefit to the developing country and award of GHG credits for the developed country to offset against their agreed GHG quota10.
13.6.1 Conclusion
The principal sources of GHG emissions from ACG and SD operations, including the COP, are associated with power generation, gas compression and water injection, process heating at the terminal and non-routine flaring of gas required for safety reasons. AIOC is committed to assessing and, where practical, reducing the GHG emissions. As each project has come forward, the following principles have been followed:
Evaluate options to reduce flaring - develop and implement an operational flare policy; Maximise energy efficiency in line with BPEO; Challenge and justify well testing requirements; Minimise combustion and fugitive emissions; and Avoid venting.
Design measures across the developments that contribute to GHG savings include:
Onshore flare gas recovery; Onshore inert purge gas; Centralised power offshore for the Azeri Field; No continuous flaring for production; Gas re-injection (as opposed to flaring) at the Azeri Field; External floating roof tanks at the Terminal; Use of aero-derivative turbines; and Electric motor driven export compression on Phase 3 and COP.
In addition to these measures, the ACG Project participates in a gas management strategy whereby the majority of associated gas produced by the ACG developments is routinely re-injected into the subsurface reservoir, and the remaining gas used for offshore platform power generation in the main gas turbines and exported to Sangachal Terminal.
9 First National Communication of Azerbaijan on Climate Change, May 23, 2000 10 UNDP (2009), ‘Azerbaijan Clamps Down on Greenhouse Gas Emissions’.

AIOC Chirag Oil Project Environmental & Socio-Economic Impact Assessment
Chapter 13: Cumulative and Transboundary Impacts
and Accidental Events
February 2010 13/18Final
As described within Chapter 4: Options Assessed, energy efficiency and GHG reduction was a key aspect taken into account during the development of the COP design, contributing to the selection of the electric deck with all power to the platform, including the gas export compressors, provided by the main power generation turbines. Analysis demonstrated that this technology selection resulted in a saving of approximately 300,000t of CO2 emissions across the project’s lifetime.
As for non-GHG emissions, GHG monitoring and reporting procedures and documentation requirements for each ACG phase are included within BP Azerbaijan's Health, Safety, Security and Environment (HSSE) Policy (see Chapter 14). Once operational, COP will become a component of the AzSPU Offshore Organisation (ACG Performance Unit) and will develop a set of specific GHG monitoring, management and reporting procedures based on and consistent with the procedures already in use on existing ACG platforms.
13.7 Accidental Events
13.7.1 Overview
Accidental Events are considered separately from routine and non-routine COP activities as they only arise as a result of a technical failure, human error or as a result of natural phenomena such as a seismic event.
This section addresses the likelihood of potential offshore and onshore spills of various types occurring and the potential impacts, taking into account aspects such as persistence and the potential for intervention or response. Different approaches are adopted for different spill types, determined principally by the following considerations:
A spill of crude oil will be the most persistent pollutant during the COP and the fate of crude oil spills has therefore been the subject of weathering studies and dispersion modelling;
Other chemicals or materials that could be spilled will either sink or disperse in the water column and mitigation measures therefore focus on spill prevention; and
Spills, including type, size and cause, during previous ACG projects have been thoroughly documented, giving an indication of where spill prevention measures will be focused for the COP.
13.7.2 Previous Crude and Diesel Spill Modelling Relevant to COP
13.7.2.1 COP Crude Oil Properties
Since oil has yet to be produced from COP, no crude oil has been available for characterisation. However, COP crude oil is expected to be equivalent to a 50/50 blend of Chirag and DWG crude oils. Chirag (Azeri Light) and DWG crude oils have broadly similar properties, in terms of likely spilled oil behaviour:
They are of similar density (0.8500 at 15ºC) and viscosity (4 to 5 cSt at 50ºC); They have similar degrees of implied evaporative loss:
- Approximately 20% of the crude oil volume is distilled off at 175ºC and 30% volume at 250ºC; and
- The volume distilled at 175ºC is indicative of evaporative loss after approximately 4 hours on the sea and the volume distilled at 250ºC of evaporative loss after 1 to 5 days on the sea. The precise equivalence depends on the prevailing sea temperature and wind speed; and
They have low asphaltene contents, indicating a relatively low tendency to form highly stable water-in-oil emulsions.
The major difference between the two crude oils is the Pour Point; the lowest temperature at which the crude oil will just flow when determined under specific laboratory conditions (ASTM D5853 / D97). The Pour Point is a reflection of the wax content. Stabilised DWG crude oil
AIOC Chirag Oil Project Environmental & Socio-Economic Impact Assessment
Chapter 13: Cumulative and Transboundary Impacts
and Accidental Events
February 2010 13/19Final
has a Pour Point of -27ºC according to 2009 analysis by Intertek Azeri Ltd. The sample of Chirag crude oil provided for the 1997 AEAT weathering study had a Pour Point of -6ºC while the 2003 assay of Azeri Light gives the Pour Point of -9ºC.
The Pour Point of a crude oil is of considerable relevance to the spilled oil behaviour, even before the changes caused by weathering of the oil are considered. The Pour Point is not the temperature at which spilled oil will sharply change from a liquid to a solid; crude oils do not freeze or melt like water at a single, well-defined temperature. Solid wax starts to precipitate at temperatures well above the Pour Point. As the temperature is decreased and approaches the Pour Point more wax is precipitated and forms a gel-like structure that renders the oil semi-solid. Oil near its Pour Point with precipitated wax will exhibit non-Newtonian flow behaviour it will exhibit a much higher viscosity at low shear rates (such as those experienced by spilled oil at sea) than at higher shear rates.
13.7.2.2 Weathering of Spilled Crude Oils
Weathering is the term used to describe the changes in physical properties of spilled crude oils that occurs over time. The major processes contributing to oil weathering behaviour are:
Loss of more volatile oil components by evaporationSpilled crude oil rapidly spreads out to form a thin oil slick on the sea surface. The more volatile components then evaporate at a rate proportional to their individual volatilities (associated to boiling points) and the prevailing temperature. The loss of these oil components decreases the volume of oil that remains at sea. Crude oils with a higher proportion of volatile components will decrease in volume more than crude oils that contain less volatile components. Evaporation slows and eventually stops as the volatile components are progressively lost. The oil that remains at sea will have a higher viscosity than the original oil because the volatile components that are lost by evaporation are of low viscosity.
Incorporation of water into the oil to form w/o (water-in-oil) emulsionsMost crude oils will form w/o emulsions when spilled at sea. W/o emulsification is caused by the prevailing wave action; spilled oils will emulsify faster in rougher seas than in calm conditions as water droplets become incorporated into the oil by the action of breaking waves. W/o emulsions are inherently unstable and will rapidly revert to oil and water unless they are stabilised by asphaltenes precipitated from the crude oil. The precipitated asphaltenes form an elastic skin around the water droplets in the oil and prevent them from coalescing and separating from the oil. Crude oils with a high asphaltene content form more stable emulsions than crude oils with low asphaltene content. The formation of w/o emulsions greatly increases the volume of the emulsified oil on the sea surface. Emulsified oils typically contain a maximum of 60% to 75% volume of water and this causes a 3- to 4-fold increase in volume, compared to that of the volume of oil from which the emulsion is formed. Emulsification ceases when the maximum water content has been achieved.
Natural dispersionNatural dispersion is another process driven by breaking waves. As a breaking wave crest passes through the oil slick, the oil is broken into oil droplets of various sizes and pushed into the water column. The larger oil droplets rapidly float back to the surface, but the very smallest oil droplets are retained in the water column by the prevailing turbulence. The rate of natural dispersion is driven by the prevailing sea state and limited by the viscosity of the emulsified oil; rough seas cause a high rate of natural dispersion, but high emulsified oil viscosity resists this process.
The relative rates of evaporation, w/o emulsification and natural dispersion depend on the prevailing conditions (temperature, wind speed and sea state) and the properties of the spilled oil (as described by the boiling point curve, density, viscosity and asphaltene content).

AIOC Chirag Oil Project Environmental & Socio-Economic Impact Assessment
Chapter 13: Cumulative and Transboundary Impacts
and Accidental Events
February 2010 13/20Final
13.7.2.3 Previous Weathering Studies on Chirag and DWG Crude Oils
Weathering studies, where laboratory procedures are used to simulate the different aspects of the weathering processes, have been performed on samples of:
Chirag crude oil11 for the EOP (Early Oil Project). DWG (Deep Water Gunashli) crude oil12 for ACG Phase 3.
The methodology adopted in these studies was to prepare the oil residues from distillation to 175ºC and 250ºC. These simulate the oil residues that would result from evaporative loss after approximately 4 hours and 1 - 5 days at sea. Emulsions are then produced from each of these residues by mixing them with seawater in a standardised test method.
The weathered (evaporated and emulsified) residues produced from Chirag crude oil have higher viscosities, particularly at low temperature, than the emulsified residues produced from DWG crude oil. This is most probably a reflection of the Pour Points of the crude oils. From results obtained with other crude oils, the Pour Points of the 175ºC and 250ºC residues can reasonably be expected to be approximately 15ºC to 25ºC higher, respectively, than the Pour Point of the ‘parent’ crude oil. The estimated Pour Points of the 175ºC and 250ºC residues are shown in Table 13.2.
Table 13.2 Estimated Pour Points of Crude Oil Residues
DWGcrude oil
Chiragcrude oil
COPcrude oil
Fresh crude oil -27ºC -6ºC -18ºC 175ºC residue -12º +11º -3ºC 250ºC residue 0ºC +19ºC +3ºC
The important factor is the difference between the Pour Point of the oil residue and the prevailing sea temperature. The prevailing winter sea temperature at the location of the WC-PDQ platform is +6ºC. The Pour Points of the Chirag crude oil residues are above this temperature while the Pour Points of the DWG and COP oil residues are below this temperature. On this basis, the 50/50 blend of DWG and Chirag that represents COP oil would have weathering behaviour that is closer to that of the DWG crude oil than of the simple mean of that of DWG and Chirag crude oils.
13.7.2.4 Persistence of Spilled Crude Oils on the Sea Surface
Figures 13.10 and 13.11 illustrate the changes in the amount of spilled Chirag and DWG crude oils on the sea surface, evaporated and dispersed with time. The oil release modelled was of 20,000 bpd (132.5m3/hr for 24 hours) to produce a total oil release of 3,180m3.
Figure 13.10 illustrates the changes in volumes at 5m/s wind speed, approximately 10 knots, and at a sea temperature of 6ºC. The volume of emulsified oil remaining on the sea surface for both the Chirag crude oil (solid red line) and DWG crude (solid blue line) follows a similar form:
There is an initial increase in volume over the first 24 hours as the oil is spilled at 132.5m3/hr;
The oil volume increases beyond the total spilled oil volume of 3,180m3 to a maximum of just over 6,000m3 for Chirag and just below 6,000m3 for DWG at approximately 70 hours as the oil incorporates water to form a larger volume of w/o emulsion; and
The volume of emulsified oil on the sea surface then decreases as more evaporates (broken lines) and naturally disperses (dotted lines).
11 AEA Technology Report AEAT 2299 Issue 1, October 1997 12 AEA Technology Report AEA/ENV/R/2667/ Issue 1, August 2008
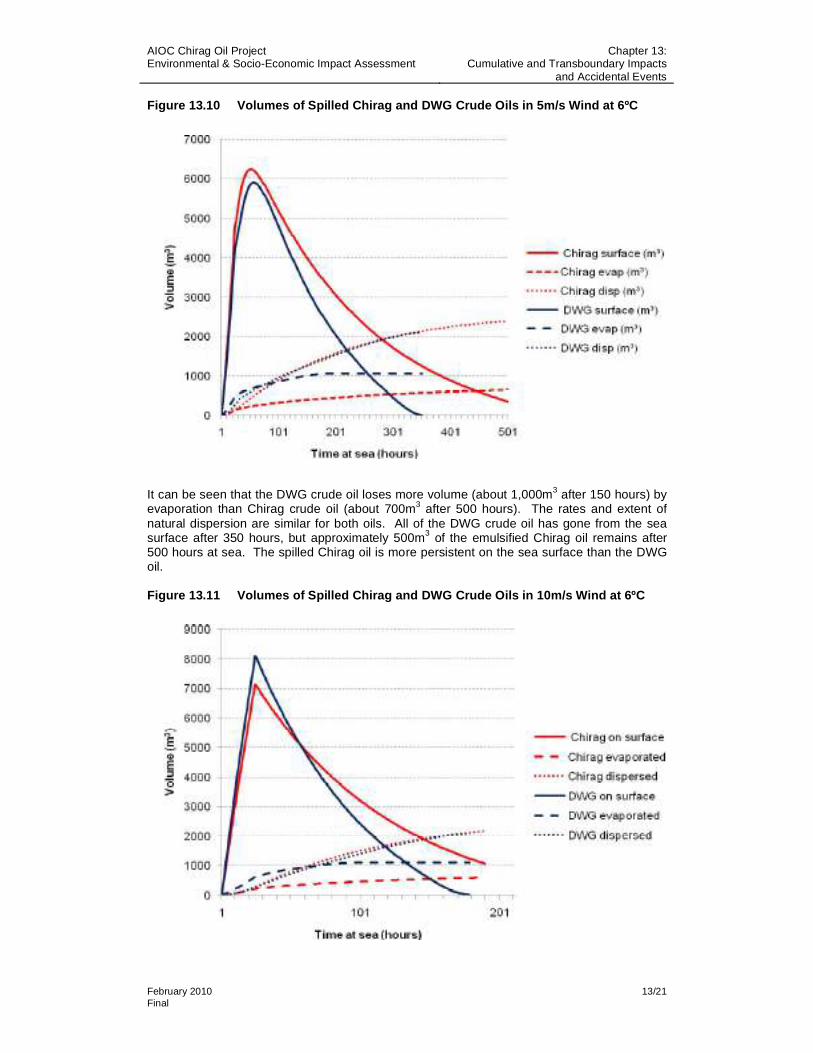
AIOC Chirag Oil Project Environmental & Socio-Economic Impact Assessment
Chapter 13: Cumulative and Transboundary Impacts
and Accidental Events
February 2010 13/21Final
Figure 13.10 Volumes of Spilled Chirag and DWG Crude Oils in 5m/s Wind at 6ºC
It can be seen that the DWG crude oil loses more volume (about 1,000m3 after 150 hours) by evaporation than Chirag crude oil (about 700m3 after 500 hours). The rates and extent of natural dispersion are similar for both oils. All of the DWG crude oil has gone from the sea surface after 350 hours, but approximately 500m3 of the emulsified Chirag oil remains after 500 hours at sea. The spilled Chirag oil is more persistent on the sea surface than the DWG oil.
Figure 13.11 Volumes of Spilled Chirag and DWG Crude Oils in 10m/s Wind at 6ºC
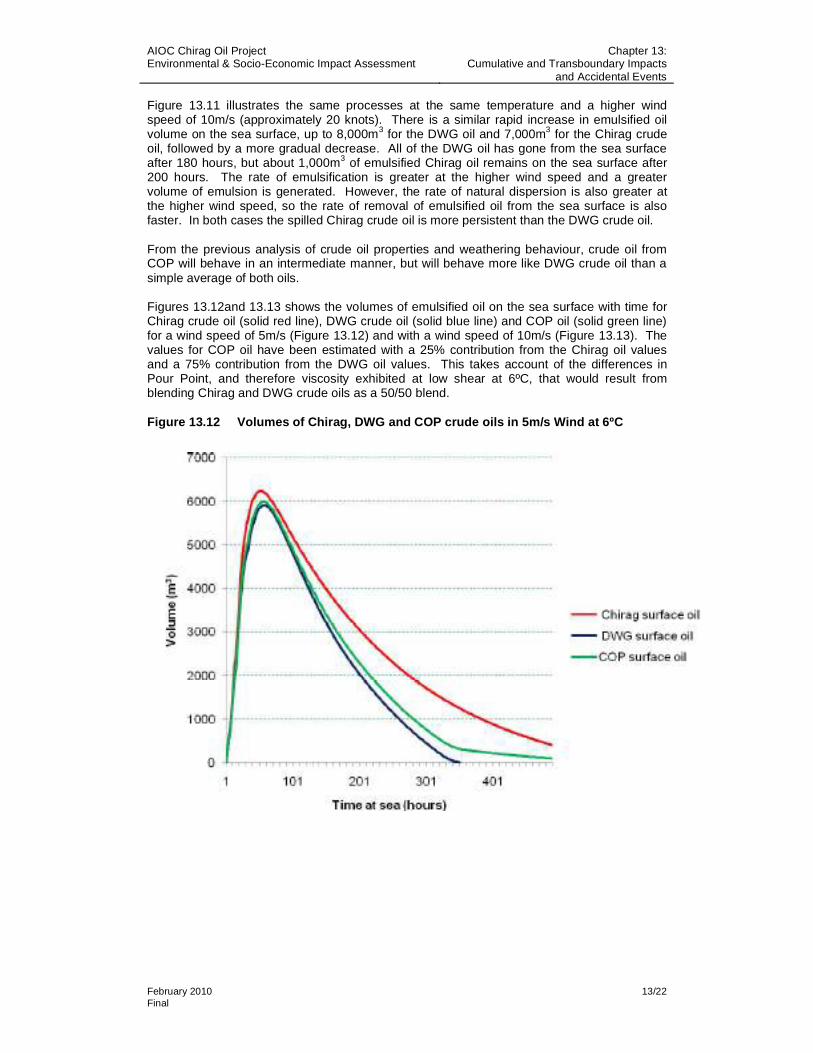
AIOC Chirag Oil Project Environmental & Socio-Economic Impact Assessment
Chapter 13: Cumulative and Transboundary Impacts
and Accidental Events
February 2010 13/22Final
Figure 13.11 illustrates the same processes at the same temperature and a higher wind speed of 10m/s (approximately 20 knots). There is a similar rapid increase in emulsified oil volume on the sea surface, up to 8,000m3 for the DWG oil and 7,000m3 for the Chirag crude oil, followed by a more gradual decrease. All of the DWG oil has gone from the sea surface after 180 hours, but about 1,000m3 of emulsified Chirag oil remains on the sea surface after 200 hours. The rate of emulsification is greater at the higher wind speed and a greater volume of emulsion is generated. However, the rate of natural dispersion is also greater at the higher wind speed, so the rate of removal of emulsified oil from the sea surface is also faster. In both cases the spilled Chirag crude oil is more persistent than the DWG crude oil.
From the previous analysis of crude oil properties and weathering behaviour, crude oil from COP will behave in an intermediate manner, but will behave more like DWG crude oil than a simple average of both oils.
Figures 13.12and 13.13 shows the volumes of emulsified oil on the sea surface with time for Chirag crude oil (solid red line), DWG crude oil (solid blue line) and COP oil (solid green line) for a wind speed of 5m/s (Figure 13.12) and with a wind speed of 10m/s (Figure 13.13). The values for COP oil have been estimated with a 25% contribution from the Chirag oil values and a 75% contribution from the DWG oil values. This takes account of the differences in Pour Point, and therefore viscosity exhibited at low shear at 6ºC, that would result from blending Chirag and DWG crude oils as a 50/50 blend.
Figure 13.12 Volumes of Chirag, DWG and COP crude oils in 5m/s Wind at 6ºC

AIOC Chirag Oil Project Environmental & Socio-Economic Impact Assessment
Chapter 13: Cumulative and Transboundary Impacts
and Accidental Events
February 2010 13/23Final
Figure 13.13 Volumes of Chirag, DWG and COP Crude Oils in 10m/s Wind at 6ºC
In both cases, the consequence is that COP oil behaves in an intermediate way to the DWG and Chirag crude oils, but more closely resembles DWG crude oil than Chirag crude oil. The simulated blend results in a ‘tail’ of emulsified COP oil that is more persistent than that from the DWG crude oil, but is of lower volume than that from the Chirag crude oil.
13.7.2.5 Spill Modelling
Table 13.3 summarises the oil spill scenarios for which modelling studies have been carried out for previous ACG Phases. These oil spill scenarios were devised to represent a wide range of events that could lead to an oil spill from relatively minor releases of 100m3 of diesel fuel up to the most major events such as an uncontrolled well blow-out for a prolonged period, or a total rupture of the 30” sub-sea pipeline near the Sangachal Terminal.
Samples of DWG Crude were not available when modelling was undertaken, and the modelling used available data for Azeri crude. Subsequently, it has become apparent that DWG crude is less persistent than Azeri crude, and as COP Crude is expected to behave in a similar way to DWG crude the modelling results have been adapted to reflect this.

AIOC Chirag Oil Project Environmental & Socio-Economic Impact Assessment
Chapter 13: Cumulative and Transboundary Impacts
and Accidental Events
February 2010 13/24Final
Table 13.3 Summary of Oil Spill Scenarios Modelled for Previous ACG Projects
Blowouts
Blowouts are statistically very rare events and the probability of such extreme situations is very low. Some experts estimate 1 incident for 10,000 wells. Blowouts have been too infrequent on the UKCS for a meaningful analysis of frequency based on historic data. Probabilities of blowout occurrence have been calculated for major projects using the SINTEF and Scandpower databases that estimate blowout frequency at various stages in the development and take into account some reservoir characteristics. Probabilities are presented in Table 13.4. The development drilling category is considered to be most relevant to COP.
Table 13.4 Estimated Blowout Frequencies for a Range of Drilling Activities
Activity Frequency for Oil Well Exploration drilling 2.8 x 10⁻⁴ per well Wildcat drilling 2.5 x 10⁻⁴ per well Appraisal drilling 3.2 x 10⁻⁴ per well Development drilling 7.1 x 10⁻⁵ per well Completion 6.6 x 10⁻⁵ per operation Wireline 5.1 x 10⁻⁶ per operation Coiled tubing 1.1 x 10⁻⁴ per operation Snubbing 2.6 x 10⁻⁴ per operation Workover 1.9 x 10⁻⁴ per operation Producing wells 2.3 x 10⁻⁶ per well-year Producing wells external causes 3.9 x 10⁻⁵ per well-year
Modelling of a blowout at COP scenario was undertaken (refer to Appendix 13B) using the weathering information and OSIS constants available for both Chirag and DWG crude oils. The likely behaviour of COP oil was interpolated between the two sets of results with a 25% from the results obtained with Chirag crude oil and a 75% contribution from the results obtained with DWG crude oil. The inputs for the COP blowout scenario are contained in Table 13.5.
Oil Spill Scenario ACG Phase 3 ACG Phase 2 ACG Phase 1 Report BMT 2004 BMT 2003 BMT 2002 BMES 2001 Oil used Azeri Azeri Chirag Iranian Light Blow-out
Outflow rate (bpd) 30,000 30,000 30,000 30,000 Duration (days) 42 42 42 42 Oil spilled (m3) 200,324 200,324 200,324 200,324
Pipeline rupture Loss rate (m3/hr) 6,000 308 692 3,451 Duration (hours) 2 26 26 26 Oil spilled (m3) 12,000 8,008 17,992 89,197
Diesel spill Duration Instantaneous Instantaneous Oil spilled (m3) 100
Not modelled Not modelled 100
Small leak in export line Loss rate (m3/hr) 1 1 1 Duration (hours) 720 720 720 Oil spilled (m3) 720
Not modelled 720 720
Small process leak Loss rate (m3/hr) 140 140 Duration (hours) 1 1 Oil spilled (m3) 140
Not modelled Not modelled 140

AIOC Chirag Oil Project Environmental & Socio-Economic Impact Assessment
Chapter 13: Cumulative and Transboundary Impacts
and Accidental Events
February 2010 13/25Final
Table 13.5 Inputs for COP Blowout Scenario
Blowout (Wind from ESE Towards Nearest Coast of Azerbaijan)
Previous oil spill studies for ACG have used a wind direction of 110º which will cause the oil to drift towards the Absheron Peninsula. The influence of currents in the Caspian Sea is slight, the current speeds being generally low, but there is a counter-clockwise current that will cause the spilled oil to drift slightly to the south of the wind-driven drift direction.
The drift of spilled COP from a blowout is very sensitive to precise wind direction:
A 5m/s wind from 110º causes all the spilled oil to impact on the Oil Rocks (Figure 13.14) approximately 25km from the WC-PDQ, 75 hours after it was spilled. The modelling indicates that all the spilled oil would be retained on the structures on the Oil Rocks. This is unlikely; in reality a high proportion of the spilled oil would continue to drift past the Oil Rocks towards the tip of the Absheron Peninsula.
The same speed wind from 105º causes the oil to drift south of the Oil Rocks (Figure 13.15), past the southern tip of the Shadili Spit and into the bay, impacting the coast of Azerbaijan south of Sangachal, near Gobustan, approximately 130 km from the site of the blowout.
A 5m/s wind from 115º causes the oil to drift north of the Oil Rocks (Figure 13.16), impacting the coast of Azerbaijan on the Absheron Peninsula, approximately 70 km from the site of the blowout.
As illustrated in Figure 13.12 the amount of spilled and emulsified COP crude oil on the sea surface in a 5m/s wind initially increases and then decreases with time. The amount of spilled oil that comes ashore depends on the drift time of the oil before it beaches and this depends on the distance to shore and the prevailing wind speed.
Location WC-PDQ Easting: 519,004m Northing: 4,443,785mSea temperature 6ºCOil release rate 20,000 bpd (132.5m3/hr for 24 hours, a total of 3,180m3)
Oils Chirag crude oil DWG crude oil
Wind speeds 5m/s (approximately 10 knots) 10m/s (approximately 20 knots)
Wind directions 110º (towards nearest coast of Azerbaijan) 45º (towards nearest coast of Iran)
270º (towards nearest coast of Turkmenistan)

AIOC Chirag Oil Project Environmental & Socio-Economic Impact Assessment
Chapter 13: Cumulative and Transboundary Impacts
and Accidental Events
February 2010 13/26Final
Figure 13.14 Drift of Spilled COP Oil from Blowout in 5m/s Wind from 110º
Figure 13.15 Drift of Spilled COP Oil from Blowout in 5m/s Wind from 105º
Centroid
Oil Particles
Land
Sea
Key
0 54km
Centroid
Oil Particles
Spill History
Land
Sea
Key
0 24km

AIOC Chirag Oil Project Environmental & Socio-Economic Impact Assessment
Chapter 13: Cumulative and Transboundary Impacts
and Accidental Events
February 2010 13/27Final
Figure 13.16 Drift of Spilled COP Oil from Blowout in 5m/s Wind from 115º
Table 13.6 summarises the amount of spilled oil that will come ashore at the different locations for each day of the blowout of 3,180m3 of oil, and the total amount that would come ashore at these locations for the time before well control is regained and the blowout ceases. It should be noted that these are alternatives; the spilled oil will come ashore at the different locations under the influence of the wind direction (105º, 110º or 115º) of the prevailing wind from the ESE at 5m/s.
Table 13.6 Blowout: Locations and Amounts of Oil Coming Ashore in Azerbaijan
COP oil released from a blowout in a 10m/s wind from 110º would follow an almost identical drift to that shown in Figure 13.14 because the higher wind speed would counteract the slight southerly drift caused by the current. Because of the more rapid drift the oil spill (10m/s 100 o
scenario) would impact the coast of the Absheron Peninsula 70 hours after being spilled (refer to Figure 9 of Appendix 13B). Despite the higher rate of natural dispersion caused by the rougher sea at the higher wind speed, more oil would persist on the sea surface to come ashore and the amounts of oil would be approximately 20% higher than shown in Table 13.6 for 5m/s at 115º case.
Spilled COP oil on coast of Azerbaijan (m3)
Duration of blowout
5m/s wind at 110º COP oil impacts
Oil Rocksafter drift time of
75 hours
5m/s wind at 105º COP oil impacts
in Sangachal Bayafter drift time of
300 hours
5m/s wind at 115º COP oil impacts
Absheron Peninsulaafter drift time of
140 hours1 day 5,118 1,900 3,414
10 days 51,180 19,000 34,140 20 days 102,360 38,000 68,280 40 days 204,720 76,000 136,560 60 days 307,080 114,000 204,840
Centroid
Oil Particles
Land
Sea
Key
0 31km

AIOC Chirag Oil Project Environmental & Socio-Economic Impact Assessment
Chapter 13: Cumulative and Transboundary Impacts
and Accidental Events
February 2010 13/28Final
Blowout (Wind from NE Towards the Nearest Coast of Iran)
A wind direction from 45º will cause the spilled oil to drift towards the nearest coast of Iran which is approximately 280 km from the WC-PDQ location.
Modelling of the behaviour of Chirag and DWG crude oils indicates that spilled Chirag crude oil would persist long enough for relatively minor amounts of oil to come ashore, but all of the DWG crude oil would evaporate and be naturally dispersed before it could impact the coast of Iran. The persistence of COP oil is intermediate to that of Chirag and DWG crude oils, but closer to that of DWG crude oil at both 5m/s (Figure 13.12) and 10 m/s (Figure 13.13) wind speeds. Spilled COP oil from the blowout would drift towards the nearest coast of Iran as illustrated in Figure 13.17.
Figure 13.17 Drift of Spilled COP Oil from Blowout in Wind from 45º
A very large proportion of the COP oil that was spilled and subsequently emulsifies would be naturally dispersed during the long drift towards the nearest coast of Iran. Relatively small quantities would persist long enough to come ashore. Table 13.7 summarises the amounts of emulsified COP oil that would come ashore on the nearest coast of Iran following a blowout of different durations.
Table 13.7 Blowout: Locations and Amounts of Oil Coming Ashore in Iran
Spilled COP oil on nearest coast of Iran (m3)Duration of blowout
Wind speed 5m/s Drift time 523 hours
Wind speed 10m/s Drift time 211 hours
1 day 40 175 10 days 400 1,750 20 days 800 3,500 40 days 1,600 7,000 60 days 2,400 10,500
Centroid
Oil Particles
Spill History
Land
Sea
Key
0 140km

AIOC Chirag Oil Project Environmental & Socio-Economic Impact Assessment
Chapter 13: Cumulative and Transboundary Impacts
and Accidental Events
February 2010 13/29Final
Blowout (Wind from W Towards Nearest Coast of Turkmenistan)
A wind direction from 270º will cause the spilled oil to drift towards the nearest coast of Turkmenistan which is approximately 140 km from the WC-PDQ, as illustrated in Figure 13.18 for a 5m/s wind.
Figure 13.18 Drift of Spilled COP Oil from Blowout in 5m/s Wind from 270º
The spilled COP oil drifts to the east on the wind and is deflected slightly to the south by the water current and comes ashore on the Turkmenistan coast on the Kizyl spit.
With a 10m/s wind from the same direction, the oil again drifts to the east on the wind, but is less deflected to the south by the water current because the effect of the dominant wind. The spilled oil comes ashore on the Turkmenistan coast, more to the north, between the towns of Tarta and Avazy.
Table 13.8 summarises the amounts of emulsified COP oil that would come ashore on the nearest coast of Turkmenistan following a blowout of different durations.
Table 13.8 Blowout: Locations and Amounts of Oil Coming Ashore in Turkmenistan
Spilled COP oil on nearest coast of Turkmenistan (m3)Duration of blowout
Wind speed 5m/s Drift time 300 hours
Wind speed 10m/s Drift time 115 hours
1 day 700 2,200 10 days 7,000 22,000 20 days 14,000 44,000 40 days 28,000 88,000 60 days 42,000 132,000
0 61km
Centroid
Oil Particles
Spill History
Land
Sea
Key

AIOC Chirag Oil Project Environmental & Socio-Economic Impact Assessment
Chapter 13: Cumulative and Transboundary Impacts
and Accidental Events
February 2010 13/30Final
Summary of Results of COP Blowout Scenario Modelling
A blowout at COP would result in a major oil spill; one of the largest that has ever occurred. The release of 20,000 bpd (3,180m3) of COP crude oil each day for a prolonged period would result in massive quantities of oil on the sea surface.
The spilled oil would double in volume to 6,000m3 for each day of the blowout after 3 days at sea due to the formation of water-in-oil emulsions. This volume increase would occur despite the loss of nearly one-third of the original oil volume by evaporation of the more volatile components. The spilled oil volume on the sea would then decrease with time as the oil drifted due to natural dispersion. The rate of natural dispersion depends on the prevailing wind speed and is higher at higher wind speeds.
The amount of spilled oil that comes ashore at any location will depend on the drift time from the site of the blowout. The drift time is a function of the distance to the shore and the prevailing wind speed. Most oil would come ashore closest to the blowout site.
Pipeline Rupture
There is no pipeline break oil spill scenario that applies specifically to only COP. The crude oils produced from all Phases of the ACG development are transported from the fields by the two existing 30” Phase 1 and 30” Phase 2 pipelines to the Sangachal Terminal and production from COP will be transported through these pipelines.
The risks to the Phase 1 and Phase 2 30” pipelines that could result in the release of oil have been comprehensively considered in the Quantitative Risk Assessment (QRA of 30” Phase 1 Oil Transport Pipeline. The probability of pipeline rupture in the open sea was calculated as 1.9 x 10⁻⁶ per year, well within the acceptance criteria of 1 x 10⁻⁴. The probability of pipeline rupture in the vicinity of the shipping channel near to shore was calculated to be 4.3 x 10⁻⁶ per year.
The possibility of a catastrophic rupture of either of the pipelines was considered in detail in ACG Phases 1 to 3. The oil spill modelling was conducted with spill locations close to the shore because the greatest risk, although very slight, of catastrophic damage being caused to the pipeline was considered to be from an impact by a deep-draught vessel. In ACG Phase 3 modelling the pipeline break oil spill scenarios from a location (40° 10’ 8.86”N 49°30’ 7.51”E) approximately 4km south-east of the pipeline landfall where the Phase 1 and Phase 2 pipelines pass the 8m water depth contour. This location is used in the consideration of the consequences for the addition of COP crude oil to these pipelines.
The inputs for the pipeline rupture oil spill scenario are contained in Table 13.9. Two temperatures, 27ºC and 6ºC have been used to represent summer and winter conditions. Two wind directions are used, namely, easterly, which would cause spilled oil to drift towards the Azerbaijan coast in Sangachal Bay (5km from the modelled pipeline rupture location) and westerly, which would cause spilled oil to drift towards the Turkmenistan coast (290km from the pipeline rupture location). Two wind speeds, 5m/s (10 knots) and 10m/s (20 knots) are used.

AIOC Chirag Oil Project Environmental & Socio-Economic Impact Assessment
Chapter 13: Cumulative and Transboundary Impacts
and Accidental Events
February 2010 13/31Final
Table 13.9 Pipeline Rupture Scenario Inputs
Location: 4 km south-east of the pipeline landfall Oil Spilled: Azeri (CA/EA) and COP Oil Volume Released: 7,500 m3/hrDuration: 2 hours Total Volume of Oil Released: 15,000m3
Season: Summer Winter Sea Temperature: 27ºC 6ºC
Wind Speeds: 10 knots (5m/s)
20 knots (10m/s)
10 knots (5m/s)
20 knots (10m/s)
Wind Direction: E(90º)
W(270º)
E(90º)
W(270º)
The generic OSIS modelling in the oil weathering studies for Azeri and DWG Crude oils were then consulted to determine the amount of these crude oils that would be present on the sea surface at the relevant times under the defined prevailing conditions of temperature and wind speed (Table 13.10). In view of the uncertainty about the precise blend of crude oils and their individual physical properties, the mean of the volumes of spilled DWG and Azeri Crude oils remaining on the sea were taken as being indicative of the minimum volume of the crude oil from the pipeline that would come ashore, while the volume of Azeri Crude oil that would come ashore was taken as a maximum. The calculated amounts are shown in Table 13.11.
Table 13.10 Volumes of Oil Remaining on the Sea Surface after a 1,000m3 Oil Spill
Volume of Spilled Oil Remaining from a
1000m3 Spill
After 5 hours
@20 knots
After 10 hours @
10 knots
After 290 hours @
20 knots
After 580 hours
@10 knots
10knots
1400m3 DWG 1700m3 Azeri
None Summer27ºC 20
knots 2900m3 DWG 4600m3 Azeri
0m3 DWG 200m3 Azeri
10knots
1250m3 DWG 1450m3 Azeri
0m3 DWG 250m3 Azeri Winter 6ºC
20knots
3050m3 DWG 4900m3 DWG
0m3 DWG 300m3 Azeri
Table 13.11 Pipeline Rupture: Locations and Amounts of Spilled Oil Coming Ashore
Wind Direction East (90º) West (270º)
Wind speed
Season (sea temperature)
Impact on Coast of Sangachal Bay
Impact on Coast of Turkmenistan
Summer(27ºC) 23,000 - 25,000m3 None 10 knots
(5m/s) Winter (6ºC)
20,000 - 22,000m3 2,000 - 3,700m3
Summer(27ºC) 56,000 - 69,000m3 1,500 - 3,000m3
20 knots (10 m/s) Winter
(6ºC) 60,000 - 70,0000m3 2,300m - 4,500m3
Figure 13.19 illustrates the directions and distance of spilled oil drift and the volume of spilled oil coming onshore for pipeline rupture scenario.

AIOC Chirag Oil Project Environmental & Socio-Economic Impact Assessment
Chapter 13: Cumulative and Transboundary Impacts
and Accidental Events
February 2010 13/32Final
Figure 13.19 Pipeline Rupture: Directions and Distance of Spilled Oil Drift and the Volume of Spilled Oil Coming Onshore (m3)
Separator Failure and Diesel Spill
A release of 81m3 of COP Crude oil from a platform separator failure was also modelled. The inputs for the COP separator failure scenario are contained in Table 13.12).
Table 13.12 Inputs for the COP Separator Failure Scenario
Location WC-PDQ Easting: 519,004m Northing: 4,443,785mSea temperature 6ºC
Oil release 81m3 instantaneous release
Oils Chirag crude oil DWG crude oil
Wind speeds 5m/s (approximately 10 knots) 10m/s (approximately 20 knots)
Wind directions 110º (towards nearest coast of Azerbaijan)
The 81m3 of COP oil spilled from the WC-PDQ Platform in a 5m/s wind from 110º would drift in an identical manner to the much larger quantity of oil released from the blowout scenario and illustrated in Figure 13.12. The spilled COP oil would drift, emulsify and 120m3 of emulsified oil would come ashore on the structures on Oil Rocks.
It is possible that this relatively small volume of spilled oil would be retained on the surfaces of the structures on the Oil Rocks, although it is still likely that some spilled oil would drift past the Oil Rocks and eventually impact on the shore of the Absheron Peninsula. The volume of

AIOC Chirag Oil Project Environmental & Socio-Economic Impact Assessment
Chapter 13: Cumulative and Transboundary Impacts
and Accidental Events
February 2010 13/33Final
oil at sea would be decreased by the natural dispersion experienced during the longer drift time to shore of 140 hours. The amount of emulsified COP oil coming ashore would then be approximately 60m3.
The drift trajectory of the spill of 81m3 of COP oil spilled from the WC-PDQ Platform in a 10m/s wind from 110º is illustrated in Figure 13.20. As with the drift of the much larger quantity of oil from the blowout scenario, the higher wind speed counteracts the southerly drift caused by the currents and the oil drifts to the north of Oil Rocks and the oil comes ashore on the Absheron Peninsula.
Figure 13.20 Drift of Spilled COP Oil from Separator Failure in 10m/s Wind from 110º
The amounts of COP oil coming ashore after separator failure on the WC-PDQ Platform at the different locations is shown in Table 13.13.
Table 13.13 Separator Failure: Locations and Amounts of Spilled Oil Coming Ashore
Spilled COP oil on coast of Azerbaijan (m3)
Wind speed 5m/s Oil Rocks
(Drift time 53 hours)
Wind speed 10m/s Absheron Peninsula(Drift time 49 hours)
Separator failure
120 86
In contrast, modelling of a spill of 180m3 of diesel from the platform concluded that no spilled diesel would reach the shoreline at either wind speed; all the diesel fuel would evaporate and naturally disperse in 8 hours in winter and more rapidly in summer.
0 37km
Centroid
Oil Particles
Spill History
Land
Sea
Key

AIOC Chirag Oil Project Environmental & Socio-Economic Impact Assessment
Chapter 13: Cumulative and Transboundary Impacts
and Accidental Events
February 2010 13/34Final
13.7.3 Impact of Oil Spills
Comprehensive information on the generic potential of an oil spill on the offshore environment of the Caspian Sea has been provided in the ACG Phase 1 Chapter 1013 and Phase 2 Chapter 814 ESIA, and is not reproduced here. The section below summarises the impacts of a potential oil spill from the COP.
The principle areas of concern with respect to oil spills are:
Impacts on plankton, fish and seals in open water; and Impacts on coastal habitats (including bird populations) should oil reach a shoreline.
The potential ecological threats in open water may include physical damage (e.g. through oiling of skin or gills of fish) and toxic effects (e.g. due to uptake of volatile toxic components of the crude). Toxic effects would be greatest on plankton, which have limited ability to either avoid the oil or to control uptake. Toxic effects would however, also be quickly mitigated by the rapid evaporation of the most acutely toxic components such as low molecular weight aromatic compounds.
As the toxic volatile components of an oil spill rapidly evaporate on entering the marine environment, the most likely impact of any oil spill will be one of physical smothering and coating by oil. Oil dispersed in the water column however, would have a detrimental impact on seagrass and its associated communities through toxic effects.
Impacts on the nearshore feeding area for fish and birds may be increased through adverse impacts on the benthos. Benthic organisms may be impacted as a result of oil sinking onto the seabed due to the direct toxicity of the oil. Shoreline benthos may also be physically smothered by the oil in the case of shoreline stranding. Impacts are likely to be greatest in the immediate area of the spill and these effects will be greater for oil such as Azeri Crude, which is persistent due to its high viscosity.
Evaluation of the potential risk to seals and fish in previous ACG Phase ESIA concluded that these organisms would be able to avoid oil slicks in open water and thus minimise risk of exposure. The most vulnerable period for seals is during the pupping season. This event occurs however, on winter ice sheets in the North Caspian, which is not at high risk of impact from an oil release in the ACG Contract Area. Previous ACG Phase ESIA noted that, although no long-term impact on fish populations was anticipated, there may be some localised “tainting” of fish that, while not an ecological issue, could temporarily affect the economics of the local fishing industry.
The South Caspian contains a number of potentially sensitive coastal habitats and in general the coastal environment is considered more vulnerable than open water to oil spill impact. As oil approaches the shore:
There is an increased risk to the benthic environment as wave and wind action can more easily cause contact between oil and sediment in shallow water;
The opportunities for intervention are more limited; for example, the use of dispersants would offer less benefit and have the potential to exacerbate the effects; and
The beaching of oil and its incorporation into coastal sediments and soils can result in longer-term persistence and damage to sensitive habitats.
The most sensitive shoreline areas identified are the coastal wetlands, the most extensive of which are to be found in the Kyzyl-Agach15 region towards the south of Sangachal Bay. These areas are highly productive ecosystems, hosting large concentrations of birds and the shallow waters also act as feeding grounds for many fish species.
13 Refer to ESIA Phase 1 Chapter 10 Section 10.6.1 14 Refer to ESIA Phase 2 Chapter 8 Section 8.4.2 15 Refer to Chapter 6 Section 6.4.6.1

AIOC Chirag Oil Project Environmental & Socio-Economic Impact Assessment
Chapter 13: Cumulative and Transboundary Impacts
and Accidental Events
February 2010 13/35Final
In addition, the shallow waters and seagrass habitat identified along the Shahdili spit12, now declared the Absheron National Park, make this area a biologically productive region. It is also of importance for fish and bird species, including resident, migrating, nesting and breeding species at various times of the year.
In addition to potential impacts on flora and fauna in Sangachal Bay and on the Absheron Peninsula, there is the potential for oil to reach the coastline of neighbouring countries resulting in a transboundary impact. The coastlines of Iran and Turkmenistan are of known importance for their coastal wetlands and include a number of designated sites of national and international importance, particularly for their bird populations. Most birds inhabiting this region are waterfowl or shore birds, with sensitive times of the year including spring, summer and autumn (encompassing migration, nesting, fledging and moulting periods) which can be classified as a time of high sensitivity for birds in this area.
According to the oil spill modelling results it is expected that some oil will reach the coastline of Turkmenistan. There is one site of international importance along Turkmensitan’s coastline (Krasnovodsk & North-Cheleken Bays), located behind, and therefore protected by, the Kizyl-Su peninsula. The modelling has demonstrated that no significant amounts of oil are expected to reach the Iranian coastline in the winter. However, typically, amounts of highly weathered crude oil in the form of tar balls and scattered small patches can be found along an affected coastline over a period of weeks and months after a spill. The precise location would be dependant on fluctuations in wind speed and direction.
Considering the scenarios assessed in the preceding sections, the following conclusions can be drawn with regard to the impact of oil spills on the marine environment:
A blowout has the greatest potential for environmental impact; A nearshore pipeline rupture has the potential to impact the Azerbaijan coastal zone,
and Sangachal Bay in particular; and Process system losses and diesel spillages will have little impact and will be either
rapidly dispersed or easily recovered.
Because the trajectory, area and persistence of a large spill depend on weather conditions (temperature, wind direction and strength), it is not possible to predict impacts precisely or quantitatively. Consequently, mitigation through comprehensive spill response preparedness is of high importance (refer to Section 13.7.5).
13.7.4 Oil Spill Prevention and Response Planning
13.7.4.1 Spill Root Causes and Prevention
A review of spill incidents during the ACG Project construction phases and during the operation of the Chirag, CA, WA, EA and DWG platforms has been carried out to determine root causes and to identify appropriate improvement plans. Spills have been initially classified into two main categories:
Equipment failure (hoses, valves, gaskets etc); and Human error.
Within construction yards, equipment failure (predominantly hydraulic hoses) is the most common cause of spills. Human error is primarily associated with:
Errors in loading, lifting and transportation (e.g. by causing damage to tanks and valves);
Errors in setting valves; and Errors in overfilling tanks and reservoirs
Offshore, error is an important factor in spills involving hoses, tanks and valves and failure is an important factor in spills involving flanges, hoses, pipework and welds.

AIOC Chirag Oil Project Environmental & Socio-Economic Impact Assessment
Chapter 13: Cumulative and Transboundary Impacts
and Accidental Events
February 2010 13/36Final
Root cause analysis therefore indicates similar patterns onshore (during construction) and offshore (during operations). In both cases, spills of hydraulic fluid resulting from hose failure account for a greater proportion of spills than any other single source.
Specific prevention measures, applicable to the COP, include:
Chemical selection procedures to minimise chemical use and restricting use to low toxicity chemicals, whenever possible;
Bunding and segregated drainage for fuels and chemical storage areas; Refuelling procedures; Regular preventative maintenance to prevent leaks by repairing or replacing equipment
such as hoses and tanks;; Staff training in hazardous materials management, refuelling and waste management
procedures as applicable to their roles; Reporting of all minor spills to detect underlying trends, and task risk assessment; and Provision of appropriate spill response and containment equipment at specific locations
based on risk assessment. This will allow rapid response should a spill occur.
These prevention and response initiatives will be integrated into the AzSPU HSSE Management System, as described in Chapter 14.
13.7.4.2 Pipeline Rupture Spill Prevention
The pipelines of the ACG field are managed in accordance with the Pipeline Integrity Management System (PIMS). PIMS has four distinct integrity areas:
Operations and Safety Systems; Integrity Management - Internal; Integrity Management - External; and Management of Change.
Pipeline integrity protection systems involve passive protection, monitoring, corrosion protection, active protection, inspection, emergency response, management of change and assurance.
Passive protection of pipelines entails the following:
Pipeline specifications which take into consideration local geohazards, seawater and seabed conditions, fluid properties, process conditions and external influencing factors, to ensure that the production fluids remain in the pipeline with minimal maintenance for the design life;
Routing of pipelines to ensure minimal disturbance from seawater surface activities, vessels and sub sea geohazards;
Near shore pipeline sections which are located in water less than 8m will be buried 1m under the sea floor to prevent disturbance of the pipeline;
Crossing structures will be used to minimise the impact of any two pipelines; Pipelines will have an external concrete coating to ensure that they stay in position, to
control buoyancy and to provide protection against physical damage; and Buckling mitigation will be provided through as–laid profile combined with seabed
supports at critical points to relieve stresses. Pipeline movements shall be identified by periodic surveillance monitoring.
Active protection of pipelines includes:
Valves and/or SSIVs checked at high risk sections close to the platforms to protect pipeline inventory; and
Sub sea valves located in numerous areas along the pipeline network to isolate sections of the pipeline if required.
AIOC Chirag Oil Project Environmental & Socio-Economic Impact Assessment
Chapter 13: Cumulative and Transboundary Impacts
and Accidental Events
February 2010 13/37Final
Corrosion Control is achieved through:
Identifying, understanding and mitigating against, where practicable, the corrosion threats to the pipelines;
Regular review and assessment of the process fluids; Definition of the corrosion monitoring plans; Review and analysis of the corrosion monitoring results; Review of potential and realised metallurgical failure modes; Installation of a cathodic protection system on the pipelines to prevent galvanic
corrosion; and Injection of chemical corrosion inhibitors.
Monitoring of the pipelines entails the following:
Continuous pressure and flow monitoring is conducted at numerous points around the pipeline network. Significant changes in normal operating pressure or flow levels result in the activation of control system alarms and isolation of affected sections;
Production fluids are sampled offshore and at the pipeline terminal for chemical contaminants such as CO2, H2S and H2O which increase corrosion, and sand and particulates that increase erosion. Where possible, these contaminants are removed up stream by chemical or physical separation systems;
Routine pigging is carried out at various frequencies in the field to ensure no stagnant fluids remain in the pipe work which can cause corrosion; and
Tracking systems will be developed to monitor trends in pipeline condition to ensure early identification of problem areas.
Inspection schemes are developed by the Independent Inspection Authority (IIA). The IIA also ensures that inspection and monitoring tasks are performed in a timely manner. Active Emergency plans are compiled, ensuring that teams and equipment are on standby ready to minimise the scale and impact of any leak.
The COP infield pipelines will be incorporated into PIMS to ensure integrity of the pipelines.
13.7.4.3 Response Planning
BP, as operator of AIOC, has developed and maintains a range of Oil Spill Response Plans (OSRP) in place for its offshore and onshore operations in Azerbaijan. These plans encompass all phases for ACG development and establish the notification, response and followup actions that must be implemented should an accidental event occur. The relevant plans will be further expanded to include the operational WC-PDQ platform.
As detailed in Chapter 14, the main fabrication and installation contractors working for BP will be required to develop OSRPs for their activities and these will fit within the frame work of the existing BP OSRP for operational facilities.
BP has adopted the internationally recognised tiered response concept to oil spill response:
Tier 1 spills are defined as small operational spills that can be can be handled immediately by on-site personnel. In most cases, the response would be to clean up using on site resources.
Tier 2 spills are defined as spills that require additional local (in-country) resources and manpower that are not available on the site that the spill occurs. The site response team would carry out cleanup, aided by the dedicated Tier 2 oil spill contractor.
Tier 3 spills are very large, possibly ongoing spills, which will require additional resources from outside the country of spill origin. Such spills are very rare and would only occur through events such as a well blowout or full diameter pipe rupture. All available spill contractors (from within and outside Azerbaijan) would carry out the physical response,

AIOC Chirag Oil Project Environmental & Socio-Economic Impact Assessment
Chapter 13: Cumulative and Transboundary Impacts
and Accidental Events
February 2010 13/38Final
with extensive support from the Incident Management Team and the Business Support Team.
As oil spill modelling scenarios presented in the previous subsections have identified the remote possibility of a transboundary spill from a Tier 3 event, there is the need for a framework to provide international action in response to such a rare event. The Caspian littoral states (i.e. Azerbaijan, Kazakhstan, IR Iran, Russian Federation and Turkmenistan) are developing regional cooperation arrangements to facilitate mutual support in the cases of major oil spill incidents. A Framework Convention, promoting cooperation within the littoral states was signed by Azerbaijan and a number of these Littoral States on the 4th November 2003, and entered into force on 12th August 2006. The Convention envisages a Protocol Concerning Preparedness and Response to Oil Pollution Incidents (OPI) which is expected to be signed in near future.
At the national level, BP is working very closely with the Azerbaijan government to help develop national systems. Once the national plan for the country of Azerbaijan is in place, the relevant BP plans will be updated to reflect any impacts this change may have. Despite the absence of a formal National Plan, BP has a process for notifying the Azerbaijan government in the event of an incident such as a spill.
BP’s overall Oil Spill Response Plan sits within the structure of the BP Incident Management System, which determines the organisational and resource requirements for all incidents, assigns roles and responsibilities, and provides detailed response procedures.
The Oil Spill Response Plan is organised by type and location of asset, with specific documents and procedures for:
Offshore oil spill (platforms and infield pipelines) Upstream (subsea export pipelines) Sangachal Terminal (limited to the boundary where the main onshore export lines leave
the terminal) Onshore export pipelines
The individual spill plans contain detailed information on methodology for estimating the size (and therefore Tier category) of a spill, together with site-specific information on the characteristics of the spilled material (eg weathering rate) and on the estimation of slick trajectory and probable beaching time and location (in the case of offshore spills). The plans also provide guidance on the identification and implementation of the appropriate control and recovery strategy, taking into account the spill characteristics, location, weather conditions and environmental vulnerability and sensitivity16. A separate document defines the procedures for internal and external reporting of incidents, including the timescale (dependent on spill size) for reporting incidents to the Ministry of Environment and Natural Resources.
The OSRPs define a precise sequence of actions following an incident, with formal assignment of responsibility as indicated in Figure 13.21 BP maintains contracts with a number of specialist oil spill response contractors, who are equipped to provide 24-hour availability of containment and recovery services, and whose actions are controlled by the BP Incident Management Team On-Site Commander.
16 Sensitivity mapping undertaken by AzSPU has been incorporated into the AzSPU OSRPs.

AIOC Chirag Oil Project Environmental & Socio-Economic Impact Assessment
Chapter 13: Cumulative and Transboundary Impacts
and Accidental Events
February 2010 13/39Final
Figure 13.21 OSRP – Responsibility
13.7.5 Reporting
All non-approved releases (liquids, gases or solids) including releases exceeding approved limits or specified conditions during all phases of the COP will be internally reported and investigated. External notification requirements agreed with the MENR are:
For liquid releases to the environment exceeding a volume of 50L, notification will be made within 24 hours after the incident verbally and within 72 hours in the written form; and
If the release to the environment is less than 50L, then information about the release will be included into the BP AzSPU Report on Unplanned Releases and sent to the MENR on a monthly basis.
Appropriate environmental reports to the MENR also can contain information about spill reports but they do not replace the BP AzSPU Report on Unplanned Releases.
Contractors(ex: BMES, BUE, EWH, OSRL , ASCO)
ER Organization&
Resources
SRT
IMT, VP room187
* ERC, MCMPIO, LO
EUL
Site ResponseResources
On -scenecommander
OperationSection chief
Planningsection Chief
Logisticssection chief
Incidentcommander
* ERC - Emergency Response Coordinator MCM – Medical Case Manager PIO – Public Information Officer LO – Liaison Officer EUL – Environmental Unit Leader

AIOC Chirag Oil Project Environmental & Socio-Economic Impact Assessment
Chapter 14: Environmental and Social Management
February 2010 14/1Final
14 Environmental and Social Management
Contents
14.1 Introduction........................................................................................................................2 14.2 Overview of AzSPU HSSE Management System.............................................................2
14.2.1 Documentation .....................................................................................................314.3 Emphasis of AzSPU HSSE Management System during COP Phases...........................4
14.3.1 Design & Procurement .........................................................................................514.3.2 Pre-Drilling and Construction, Installation and HUC ............................................614.3.3 Operations ............................................................................................................8
14.4 Common Elements............................................................................................................9 14.4.1 Commitments Register .........................................................................................914.4.2 Integrated Environmental Monitoring Programme (IEMP) .................................1014.4.3 Waste Management ...........................................................................................11
List of Figures
Figure 14.1 AzSPU Integrated HSSE Management System Framework 2 Figure 14.2 Continuous Improvement Philosophy 3 Figure 14.3 Key Management Processes During COP Phases 5
List of Tables
Table 14.1 AzSPU HSSE Management System Tier Structure 4

AIOC Chirag Oil Project Environmental & Socio-Economic Impact Assessment
Chapter 14: Environmental and Social Management
February 2010 14/2Final
14.1 Introduction
Under the ACG PSA, BP as Operator for AIOC is responsible for the environmental and social management of the Chirag Oil Project (COP), for ensuring that project commitments are implemented, and that the project’s performance complies with applicable environmental and social legal, regulatory and corporate requirements.
This Chapter provides an overview of the system that will be used to manage the environmental and social issues associated with the COP.
In 2005, BP’s Azerbaijan Strategic Performance Unit (AzSPU) developed an integrated Health, Safety, Security and Environmental (HSSE) Management System1. The purpose of the system is to design, document and embed processes to ensure the AzSPU consistently manages HSSE risks and opportunities and delivers regulatory compliance, together with any relevant BP Group requirements.
Activities associated with the COP will be undertaken in accordance with the intent of the AzSPU HSSE Management System requirements.
14.2 Overview of AzSPU HSSE Management System
The AzSPU HSSE Management System provides a structured framework to manage the HSSE performance of the organisation (see Figure 14.1) and includes continuous improvement as an integral part of the philosophy (see Figure 14.2).
Figure 14.1 AzSPU Integrated HSSE Management System Framework
The stages in Figure 14.1 can be described as follows:
Planning: Processes are developed in order to formulate objectives, targets and management programmes in accordance with the HSSE Policy, significant environmental and social aspects and impacts, health and safety risks and compliance issues.
Implementation: Processes to execute the objectives, targets and management programmes are developed and implemented.
1 It should be noted that social issues are embedded within the environmental portion of the AzSPU HSSE Management System.

AIOC Chirag Oil Project Environmental & Socio-Economic Impact Assessment
Chapter 14: Environmental and Social Management
February 2010 14/3Final
Checking: The processes are monitored and measured against the HSSE Policy; procedures; objectives and targets; and legal and other requirements. The results are then reported.
Management Review: Actions are taken to continually improve the HSSE performance of the organisation.
Figure 14.2 Continuous Improvement Philosophy
It should be noted that the environmental portion of the AzSPU HSSE Management System for operations is certified to ISO 14001, the leading international standard on environmental management. External certification of all new operations (including the COP WC-PDQ platform) to ISO 14001 within 12 months of becoming operational is a BP requirement.
14.2.1 Documentation
The following documents govern the structure and content of the AzSPU HSSE Management System:
Applicable legal and other requirements; BP Group standards; BP Code of Conduct; BP Global HSSE Compliance Framework; BP getting HSE right; AzSPU HSSE Policy; and ISO 14001: 2004 EMS Standard.
In addition, the following have particular relevance to the COP:
The COP ESIA and associated environmental permission documents; BP Group Environmental and Social Group Defined Practice (GDP) for Major Projects,
Major Exploration Projects, Non-Major Projects in Aquifer Areas and Acquisition Activities; and
Contractor Environmental & Social Management Systems (refer to Section 14.3.2.1).
The AzSPU HSSE Management System is based on a hierarchy of documents reflecting the organizational structure of the company (see Table 14.1).
Tier 1 documents apply to all BP activities and operations throughout the world. Tier 2 documents apply across the entire AzSPU and are essential to the operation of the HSSE
Implementation
Planning
HSSEPolicy
Checking & Corrective
Action
Management Review
Continual Improvement

AIOC Chirag Oil Project Environmental & Socio-Economic Impact Assessment
Chapter 14: Environmental and Social Management
February 2010 14/4Final
Management System. Only where there are more site-specific requirements are Tier 3-5 procedures developed for individual performance units, assets, facilities and projects.
Table 14.1 AzSPU HSSE Management System Tier Structure
Level Business Unit Description Example
Tier 1 BP Corporate Key BP Group policy, programmes, practices,
frameworks, standards and regulations
BP Group Environmental & Social Group Defined
Practice
Tier 2 Azerbaijan Strategic Performance Unit
Key AzSPU policy, procedures, standards and
regulations
AzSPU Integrated Internal Audit Plan
Tier 3 Onshore Organisation, Offshore Organisation, Renewals and Major
Projects
Common procedures and management plans at
organisation level
Offshore Waste Management Procedure
Tier 4 Performance Unit, New Projects, Major / Minor Modifications
PU specific documentation, procedures and operational
controls
ACG PU Seeps & Leaks Management Procedure
Tier 5 Asset / Facility / Project Asset / Facility / Project specific documentation,
procedures and operational controls
Central Azeri Emissions and Discharges Flow
Diagram
Contractor Environmental & Social Management System
procedures
14.3 Emphasis of AzSPU HSSE Management System during COP Phases
Figure 14.3 lists the key management processes applicable to the different phases of the COP and the two main “transitions” between these phases.
A number of different BP teams and contractors will be involved in managing and executing the work as the COP progresses through design, pre-drill, and construction, installation and HUC, towards the WC-PDQ platform becoming an operational facility.
Management system documentation and tools will be periodically reviewed and updated as necessary to reflect changing management responsibilities and priorities as the COP progresses through the different phases of the project
Key documentation covered by the reviews, where relevant and available, will include:
Aspect and Impact Registers and any associated mitigation and management procedures / plans;
Waste forecasts – compared against actual waste arising; Emissions and discharge inventories and sampling reports – to confirm performance
standards are being achieved; Monitoring and baseline data / survey reports; and Technical documents (i.e. engineering basis of design, specifications, vendor / supplier
documents, engineering drawings, etc.).

AIOC Chirag Oil Project Environmental & Socio-Economic Impact Assessment
Chapter 14: Environmental and Social Management
February 2010 14/5Final
Figure 14.3 Key Management Processes During COP Phases Design &
Procurement Pre-DrillingConstruction,
Installation & HUC Operations
Design standards, specifications and acceptancecontrols.
Reliability and operability reviews.
Qualification and selection of suppliers and vendors.
Discharge, emission and waste identification,quantification, reduction, and modelling.
Interaction with existing AzSPU construction and operations teams.
ESIA preparation, review and approval.
ESIA consultation & disclosure.
Contractor qualification and selection of pre-drilling contractor.
Pre-drilling HSSE assurance programme.
Development of MS bridging documents, site-specificprocedures.
Pre-drill programme review to confirm adoption of well design and manage deviations.
Monitoring & reporting – environmental and operational.
Contractor audit. Community
engagement. ESIA commitment
management.
Contractor qualification and selection of construction contractors.
Contractor Environmental & SocialManagement Systems.
Development of ContractorProcedures and control of work systems, MS bridging documents, site-specificprocedures.
Construction reviews to confirm adoption of design and manage deviations.
Construction contractorcommunity engagement.
Monitoring & reporting – environmental and operational.
Contractor audit. Community
engagement. ESIA commitment
management.
Support & supply contractorqualification, selection and HSSE assurance management.
Development of site-specific operating procedures.
Monitoring & reporting – environmental and operational.
AzSPU internal auditing.
Community engagement.
ESIA commitment management.
Operational excellence.
ISO 14001 certification.
Common Elements COP Commitments Register Integrated Environmental Monitoring Programme Waste management Spill Prevention and Response / Incident Management System AzSPU HSSE Management System Lessons learned from previous ACG and Shah Deniz projects
14.3.1 Design & Procurement
The focus of the AzSPU HSSE Management System during the design phase of the project is on ensuring that the COP platform and subsea pipelines design is such that operational performance standards can be achieved.
Key issues that have been considered include:
Emissions and discharges identification, quantification and reduction; System configuration / optimisation; Energy efficiency; Facility vendor qualification; Bunding and containment; and Drainage.

AIOC Chirag Oil Project Environmental & Socio-Economic Impact Assessment
Chapter 14: Environmental and Social Management
February 2010 14/6Final
The ESIA process is critical for this phase of the COP as it tests the Base Case design in terms of its environmental and social impact and highlights where improvements are necessary.
14.3.2 Pre-Drilling and Construction, Installation and HUC
COP pre-drilling and construction, installation and HUC phases will be undertaken at a number of locations, at/on facilities that are generally not BP managed. These include:
Contractor operated Mobile Offshore Drilling Unit (MODU) in the Azerbaijani sector of the Caspian Sea;
Contractor managed construction yards in Azerbaijan; Contractor managed installation and support vessels; and Vendor / supplier factories.
BP will ensure that contractors manage their activities in a manner consistent and compliant with AzSPU standards and expectations, using the continuous improvement cycle shown in Figure 14.2. This is described in the sections below.
14.3.2.1 Planning
Contractor Selection
A rigorous contractor selection process will be in place to ensure that key contractors used during the COP have effective Environmental & Social (E&S) Management Systems that align with BP expectations and are bridged (linked) to the AzSPU HSSE Management System.
Companies invited to tender for pre-drilling, construction, installation and HUC contracts will be provided with detailed information on BP and AzSPU environmental and social expectations and standards The environmental and social capability of the companies and their ability to comply with the expectations and standards will be an element in tender evaluation and award. Companies will be required to present detailed proposals for establishing and operating a compliant E&S Management System throughout the duration of their contracts.
Environmental Aspects and Impact Identification
To ensure environmental aspects and impacts are identified and appropriate mitigation and management procedures are in place, periodic Environmental Impact Identification (ENVIID) workshops will be undertaken during the COP predrilling and construction, installation and HUC phases, led by the contractors and attended by BP representatives. These will be conducted at quarterly intervals in order to review and confirm the validity of the Aspects and Impacts Registers, and to ensure that mitigation and management procedures remain effective.
ENVIID workshops were also completed during the COP design stage to complement the environmental assurance work and to support the development of the ESIA.
14.3.2.2 Implementation
The principle pre-drilling, and construction, installation & HUC contractors will be required to prepare and submit for audit their own E&S Management System and to demonstrate, to BP’s satisfaction, that it is fit for purpose before start of work. The predrill MODU contractorplanned to be used for the COP has previously prepared and submitted their E&S Management System to BP. Following approval, bridging documentation between the MODU contractor’s system and the AzSPU system has been developed. The Construction and Installation Contractors E&S Management System, to be developed by the appointed contractor, will address where applicable:
AIOC Chirag Oil Project Environmental & Socio-Economic Impact Assessment
Chapter 14: Environmental and Social Management
February 2010 14/7Final
Atmospheric Emissions: Contractors will be required to demonstrate that they have appropriate plant and
effective maintenance, monitoring and reporting procedures. Waste Management: Contractors will be required to demonstrate that they have an effective system
and resources for waste minimisation and segregation. Contractors will be required to maintain accurate records of all waste generated
and all waste movements and to report these on a regular basis to BP. BP will manage the collection, transportation, treatment, disposal and storage of
waste via approved waste management contractors. Discharges: Contractors will be required to ensure that any necessary management and
mitigation measures are in place for all discharges identified in the ESIA. Contractors will be required to notify BP of any changes to discharges approved
in the ESIA, and of any new discharges, and the MoC process described in Section 5.1.1 will apply.
Chemical Management: Contractors will be required to maintain an accurate inventory of all chemicals
required for their activities and to establish containment and handling practices, in accordance with legal requirements, to avoid or minimise the risk of environmental pollution.
Contractors will be required to notify BP of new chemicals proposed for use and the MoC process described in Section 5.1.1 will apply.
Spill Management and Response: Contractors will be required to demonstrate that they have thoroughly reviewed
spill risks and that they have in place appropriate spill containment, response, clean-up equipment and procedures, including spill reporting.
Community Consultation and Employment: Contractors will be required to demonstrate that:
They have a grievance process in place whereby community complaints can be received, logged and responded to.
They have a process whereby employment of local community / nationals meets BP’s expectations for local / national content2.
Transportation: Contractors will be required to prepare: Transportation plans and to assess and where necessary mitigate potential
impacts on the transport infrastructure, other users of the infrastructure, residential premises and on any economic or social activities adjacent to transport routes.
Ballast water management plans for shipping of freight and movement of vessels into and within the Caspian Sea.
Reporting: BP will agree with each contractor a detailed set of reporting requirements to
demonstrate compliance with the above, specifying the level of detail and the reporting process and frequency. BP will collate reports from all contractors and deliver them to the appropriate regulatory agencies at agreed intervals.
Training & Competency: Contractors will be required to demonstrate that they have adequate systems in
place to provide training in all HSE areas applicable to their activities and to assess competence.
Each contractor will be required to prepare procedures as part of their E&S Management System which implement the requirements summarised above. BP will review the procedures and will approve them once their compliance with BP expectations and alignment with the AzSPU HSSE Management System has been confirmed.
2 Refer to Chapter 12 regarding local/national content.

AIOC Chirag Oil Project Environmental & Socio-Economic Impact Assessment
Chapter 14: Environmental and Social Management
February 2010 14/8Final
14.3.2.3 Checking & Management Review
BP will conduct formal audits and inspections of contractor operations at regular intervals to assess contractor environmental and social performance and compliance with contract requirements, ESIA commitments, and their E&S Management System (aligned with and linked to the AzSPU HSSE Management System). Where appropriate, the audit and inspection process will be complemented by practical measures such as spill response exercises and sampling and analysis of discharges and emissions.
In cases of non-compliance or unsatisfactory performance, it will be a contractual requirement that the contractor remedy deficiencies in a timely and efficient way. The time permitted for implementing a remedy will be determined in accordance with the severity of the deficiency and with any applicable legal requirements. Whilst BP will provide support and assistance in such cases, the contractor will retain primary responsibility for remedial action and for the subsequent maintenance of compliant operations.
During the final stages of the construction and commissioning phase of the COP WC-PDQ platform, a review of the facilities will be carried out to capture any design changes relevant to the scope of the AzSPU HSSE Management System that occurred during construction. This will ensure that any associated changes to environmental management requirements can be identified and incorporated into operational procedures.
14.3.3 Operations
Once construction, installation and offshore HUC are complete and the WC-PDQ platform is “hydrocarbon live”, it becomes an operational facility, managed directly by BP.
14.3.3.1 Planning
An ENVIID Workshop will be held in order to replace the existing contractor owned pre-drill and construction Aspect and Impacts Registers, with a BP one specific to the operation of the WC-PDQ platform. Significant aspects and impacts identified as a result of this exercise will have objectives, targets and management programmes developed for them in order to drive continual improvement.
In addition the Register for Sangachal Terminal will also be reviewed in order to capture any potential aspects and impacts resulting from the additional WC-PDQ hydrocarbons being delivered to the facility.
14.3.3.2 Implementation
As stated in Section 14.2.1, the AzSPU HSSE Management System is based on a hierarchy of documentation. Tier 2 policies, procedures and plans are applicable across the entire AzSPU and outline requirements and processes for roles and responsibilities, competency and training, communication, documentation, operational control (e.g. chemicals and hazardous materials management, waste management, etc), and emergency preparedness and response.
In addition, site-specific environmental and social management procedures based on, and consistent with, the procedures already in use on existing ACG platforms and the AzSPU Tier 2 procedures will be developed and followed for the WC-PDQ platform operations.
14.3.3.3 Checking & Management Review
AzSPU monitoring is carried out in accordance with the Integrated Environmental Monitoring Programme (IEMP), see Section 14.5.2. The results of both environmental and operational monitoring are reported to the MENR in the form of IEMP survey reports, End of Well Reports, Statistical Committee Reports (water and resource utilisation, waste streams, atmospheric pollution), spill reporting, etc, in accordance with the AzSPU External Environmental Reporting Procedure.

AIOC Chirag Oil Project Environmental & Socio-Economic Impact Assessment
Chapter 14: Environmental and Social Management
February 2010 14/9Final
In terms of operations auditing, AzSPU has an integrated internal audit programme in place which includes the following:
Management system audits - establish the effectiveness of the operations management system against AzSPU procedures and the ISO 14001 standard, in order to verify that the required systems and processes are functioning effectively;
Compliance audits - determine the compliance status of AzSPU operations against HSSE legal & other requirements; and
Subject matter audits – involve reviewing selected sites in respect of a single parameter, e.g. waste, air emissions, health, etc.
As stated previously, the WC-PDQ platform will begin the process of working towards ISO 14001 certification as soon as the platform becomes “hydrocarbon live”. Internal management system audit of the platform will be carried out, to ensure readiness, prior to the external audit by an independent certification body.
In terms of management review, an AzSPU-wide HSSE Management Review Meeting is held on an annual basis to assess the continuing suitability, adequacy and effectiveness of the system. Possible need for changes in policy, objectives and targets, and other elements of the HSSE Management System are addressed in order to achieve continual improvement. Performance Review Meetings are also held periodically, according to operational needs.
14.4 Common Elements
As presented in Figure 14.3, there are a number of environmental and social management processes common to all phases of the COP project, including:
Commitments Register; Integrated Environmental Monitoring Programme; Waste management; and Spill prevention and response planning.
An overview of each element is presented below. Spill prevention and response planning is discussed in Chapter 13.
14.4.1 Commitments Register
The COP ESIA represents the culmination of an extensive and rigorous process to identify the potential environmental and social impacts associated with the project, assess their significance and recommend mitigation measures, where applicable.
The ESIA process ran parallel to the project design phase to ensure that significant environmental and social aspects were taken into account throughout the design process.
Additional mitigation and management to minimise the risk of significant impacts in the project construction and operational phases have been extracted from the COP ESIA and formalised in the COP Commitments Register.
The Commitments Register helps to ensure:
Transparency in translating commitments into actions; Clear identification of responsibilities; Resourcing and budget allocation to achieve commitments; and Required actions are implemented on a timely basis.
The actions in the Commitments Register will be communicated to contractors and BP personnel through a number of mechanisms as described below.

AIOC Chirag Oil Project Environmental & Socio-Economic Impact Assessment
Chapter 14: Environmental and Social Management
February 2010 14/10Final
During pre-drilling and construction, installation & HUC (contractor managed):
Contract provisions; and HSSE Compliance Tasks. The BP AzSPU has a ‘Compliance Task Manager’ database
which manages compliance tasks extracted from applicable legal documents (including the ESIA) and links them to accountable/responsible positions and operational controls. During this phase of the project contractor personnel will be responsible for the majority of Compliance Tasks and BP personnel will be accountable. The contractor may be required to update his procedures to ensure that the operational controls are effective.
During WC-PDQ platform operation (BP managed):
HSSE Compliance Tasks. During this phase of the project BP personnel will be responsible and accountable for the majority of Compliance Tasks; and
AzSPU procedures, checklists, work orders, job descriptions, etc may need to be developed/updated in order to ensure that operational controls are effective.
14.4.2 Integrated Environmental Monitoring Programme (IEMP)
BP’s AzSPU has implemented an Integrated Environmental Monitoring Programme (IEMP) designed to provide a consistent, long-term set of data, with the objective of ensuring an accurate picture of potential impacts of AzSPU activities on the surrounding environment so that they can be managed and mitigated as effectively as possible.
The IEMP follows a 10 year schedule - detailed monitoring plans are prepared for the next 3 years, with outline planning for the following 7 years. This approach allows a progressive and systematic modification of the programme to take into account the results and conclusions of the programme to date.
Offshore marine monitoring can be separated into the following categories:
Baseline surveys – provide a general understanding of the physical, chemical and ecological parameters at a particular location before development commences. Any unusual or sensitive ecological features, which might affect the design of a development, can also be identified;
Post-drill surveys – carried out following drilling operations in order to assess the impact of drilling discharges on the surrounding environment;
Routine environmental monitoring surveys – provide an assessment of the impact of AzSPU operations, aiding responsible environmental management; and
Regional surveys – carried out to assist in the understanding of background environmental trends. Sampling is undertaken at locations remote from AzSPU activities, providing information on changes in the marine environment that have resulted from natural processes, or other third party activities. This helps to distinguish potential impacts resulting from AzSPU activities from natural background environmental changes and other anthropogenic sources.
All of the above have been conducted as part of the ACG Contract Area development, with the primary focus being the benthic environment (sediments and their associated biological communities are widely considered to be the source of the most reliable indicators of ecological status and impact), although periodic water quality sampling is also carried out.
The area in the vicinity of the WC-PDQ platform will be included within the scope of periodic environmental monitoring as part of the IEMP. Baseline survey data will be collected in 2009, to augment that collected previously in 2003. Post-drill and routine environmental monitoring will be conducted as the project progresses and moves into operations. The surveys will follow the standardised IEMP design to maximise the usefulness of comparisons over time and between locations.

AIOC Chirag Oil Project Environmental & Socio-Economic Impact Assessment
Chapter 14: Environmental and Social Management
February 2010 14/11Final
In terms of onshore operations, much effort has been devoted to environmental monitoring in the vicinity of Sangachal Terminal (in the form of terrestrial ecosystem monitoring, bird surveys, ambient air quality monitoring, and groundwater and surface water quality monitoring). In addition, nearshore fish monitoring and biomonitoring has been conducted within Sangachal Bay. Future surveys will be conducted in accordance with the 10 year schedule.
The ambient environmental monitoring programme is currently being expanded to integrate operational monitoring of key discharges carried out by the AzSPU. This will allow a more complete understanding of the potential impacts of AzSPU operations.
The aim of regular monitoring is to establish an understanding of trends over time, taking into account results of concurrent regional surveys and initial baseline data. Combined with operational discharge monitoring, this approach provides a robust basis for assessing the impact of COP operations, and for comparing the observed impact with that predicted in the ESIA.
14.4.3 Waste Management
Waste management during all phases of the COP will benefit from accumulated experience and facilities constructed for the previous ACG and Shah Deniz projects, including:
Effective and reliable procedures for on-site segregation and management of waste; A non-hazardous landfill disposal site which is constructed and operated to EU
standards; and An effective process for identifying and utilising opportunities for waste recovery and
recycling.
All wastes generated on the pre-drilling MODU, by key construction, installation and HUC contractors, and operations on the WC-PDQ platform will be identified and managed in accordance with the following requirements:
Site specific waste management plans will be prepared for each of the main fabrication yards, the MODU and the WC-PDQ platform, installation vessels will also be included within the scope of the waste management plan(s);
Waste minimisation; All waste streams identified and classified; Waste segregation at source; Workforce awareness and training; AzSPU Approved Waste Contractors List; AzSPU Waste Streams Register; and AzSPU Waste Management Strategy.
In accordance with internationally recognised best practice, the waste hierarchy, coupled with the AzSPU Best Practicable Environmental Option (BPEO) assessment of available waste disposal / treatment technologies which was conducted in 2006 and AzSPU Waste Management Strategy and supporting documentation, will be adopted as the basis for guiding waste management decisions. This is intended to ensure that wastes are managed in the most sustainable way and in compliance with all applicable AzSPU standards whilst ensuring they are recovered or disposed of efficiently without endangering human health and minimising environmental and social impacts.

AIOC Chirag Oil Project Environmental & Socio-Economic Impact Assessment
Chapter 14: Environmental and Social Management
February 2010 14/12Final
Waste Management Processes and Procedures
Waste management and minimisation plans will be developed and maintained to cover all stages of the COP to match the anticipated waste streams, likely quantities and any special handling requirements.
A schedule of internal audits will be developed to objectively monitor the performance of the waste management systems during all stages of the COP and to ensure that all corrective actions and improvements are identified and implemented.
To support the waste management plan, employees at the construction yards, installation vessels, the MODU, and onboard the WC-PDQ platform will receive waste management training covering:
Identification of waste types and potential associated hazards; Waste minimisation; Waste segregation; and Waste transfer documentation (if involved in waste movement).
All new waste disposal routes are routinely assessed prior to use and must be compliant with applicable local laws and regulations. Waste will only be routed to those waste disposal facilities that have been approved for use by the AzSPU.
All reasonably foreseeable wastes will be identified in the AzSPU Waste Streams Register and classified as non-hazardous or hazardous. The construction, installation and HUC contractors, the MODU operator and relevant operations personnel shall be provided with this register and shall be required to adopt the descriptions and AzSPU compliant colour-coding scheme, or equivalent.
Waste Segregation and Transfer
Liquid and solid wastes will be segregated. Further segregation will depend on the hazard categorisation. The following minimum segregation will be adopted:
Non-hazardous liquid; Hazardous liquid; Non-hazardous solid; and Hazardous solid.
Waste streams will be segregated at source to permit reuse/recycling and to avoid contact between incompatible materials. The segregation requirements will be clearly indicated by the use of containers with clear signage denoting the waste types that are suitable for the containers provided.
The site-specific waste management plans will identify the location of waste collection points, including recycling points, and the type of containers in use. All waste containers, designed, constructed and deployed to ensure adequate containment and prevent scavenging and infestation, will be regularly inspected whilst in use to ensure they remain fit for purpose and that waste segregation procedures are observed.
The waste management plan will clearly identify the type of container required for each waste type and each site will maintain sufficient containers of each type to accommodate the waste quantities generated.
All waste transfers will be accompanied by the relevant documentation. This includes individual waste transfer notes, confirming the waste type, quantity, waste generator, consignee (if different from the generator), consignor and in the case of hazardous wastes, both Waste Passports and, where required, MSDS documentation. A final visual inspection of all waste consignments will be made prior to transfer note sign-off and uplift. Coloured copies of the waste transfer documentation together with other relevant information e.g.

AIOC Chirag Oil Project Environmental & Socio-Economic Impact Assessment
Chapter 14: Environmental and Social Management
February 2010 14/13Final
MSDS, Waste Passports, will be retained by the waste generator. All parties involved in transporting wastes will retain a copy of the waste transfer note. All documents required by applicable local regulations and applicable international conventions will also be retained and archived by the waste generator as required by the waste management plan procedures.
Depending upon the nature of the waste and the approved method of recycling/disposal, wastes may be routed via a Central Waste Accumulation Area (CWAA), waste transfer station or similar facility, or alternatively may be routed directly to their final approved destination.

AIOC Chirag Oil Project Environmental & Socio-Economic Impact Assessment
Chapter 15: Residual Impacts and Conclusions
February 2010 15/1Final
15 Residual Impacts and Conclusion
Contents
15.1 Introduction........................................................................................................................215.2 Design, Construction and Operation .................................................................................215.3 Socio-Economic Impact.....................................................................................................215.4 Environmental Impacts......................................................................................................3
15.4.1 Predrill...................................................................................................................315.4.2 Construction, Hook-Up and Commissioning ........................................................415.4.3 Operations ............................................................................................................6
15.5 Cumulative, Transboundary and Accidental Events .........................................................815.6 Environmental Management Plan .....................................................................................915.7 Conclusions.......................................................................................................................9
List of Tables
Table 15.1 Summary of Predrill Residual Environmental Impacts 3 Table 15.2 Summary of Construction, Installation Hook-Up and Commissioning Residual
Environmental Impacts 5 Table 15.3 Summary of Operations Residual Environmental Impacts 7

AIOC Chirag Oil Project Environmental & Socio-Economic Impact Assessment
Chapter 15: Residual Impacts and Conclusions
February 2010 15/2Final
15.1 Introduction
This section summarises the residual impacts and conclusions of the COP ESIA.
15.2 Design, Construction and Operation
The COP WC-PDQ platform and the associated infield pipelines are based on established and proven designs and will be constructed and installed by experienced contractors using established facilities and a well-trained workforce. The selected design option (single platform, supported by water injection from the DWG-PCWU platform and implementing an “electric deck” option) will minimise the physical footprint of the installation and will also minimise atmospheric emissions.
15.3 Socio-Economic Impact
The majority of COP related Activities (with the exception of the construction phase) occur offshore and use existing operational onshore infrastructure capacities (e.g. Sangachal Terminal, the Baku Deep Water Jacket Factory (BDJF)). With reference to the experience gained on from the previous ACG Phases, the following key socio-economic issues were assessed:
Employment creation; End of construction phase workforce reduction; Training and skills development; Economic activity; and Community disturbance.
The assessment concluded that the national workforce to be employed during the COP construction phase is likely to peak at approximately 2,000 and will likely exceed 1,000 for a period of approximately 18 months. Additional and new employment during the operations phase will be less in terms of new positions. Employment impacts are likely to be distributed within the local area with the majority of employees expected to be recruited from the local Garadagh area. It is anticipated therefore that employment will not require establishment of workforce accommodation or significant migration of populations to the construction areas.
Although the jobs created during the construction phase will not be required once the COP construction phases are complete, training and skills development, similar to that undertaken during the previous ACG projects, will provide a positive impact in developing the construction workforce skills and qualifications.
As the construction phase will only deliver temporary employment, planning for the conclusion of contracts will begin at the outset of the construction phase and related activities. Staff communications will ensure the workforce is aware of project progress and completion dates and staff will be provided with financial planning advice to encourage them to make provision for after the construction period.
The overall socio-economic impacts of the COP, particularly from employment creation throughout the construction, installation and hook-up and commissioning phases were assessed as positive.
Increased road traffic during the COP construction and operation phases has the potential to disrupt communities and businesses along the routes used through increased noise and traffic flows. BP and its main construction contractors implemented a successful driving and vehicle management plan during earlier ACG projects and this will be adopted for the COP to ensure that this impact is adequately mitigated. Overall the residual impact to communities and businesses from the increased traffic is considered to be minimal and significantly outweighed by the employment and business opportunities gained.

AIOC Chirag Oil Project Environmental & Socio-Economic Impact Assessment
Chapter 15: Residual Impacts and Conclusions
February 2010 15/3Final
Economic developments in the Garadagh area since the completion of previous ACG projects include the relocation of the airport market to Lokhbatan, the proposed expansion of existing cement production facilities and the construction of new cement production facilities. These developments will have an impact on both local employment and traffic and will tend to reduce the relative magnitude of the impact of the COP development.
15.4 Environmental Impacts
Environmental impacts have been assessed separately for the pre-drill, construction (including hook-up and commissioning) and operational phases of the COP. Cumulative impacts, transboundary impacts and accidental events have also been assessed.
15.4.1 Predrill
Table 15.1 summarises the outcome of impact assessment for the predrill phase of the project.
Emissions associated with mobile drilling rig power generation, well test flaring and the activity of support vessels will all occur offshore and disperse into the atmosphere. Modelling was undertaken to determine the concentration of key pollutants associated with these activities at receptor locations (i.e. onshore) and hence event magnitude. Based on existing good air quality relative to recognised standards for the protection of health, receptor sensitivity was considered to be low and the impact of atmospheric emissions was considered to be minor.
Table 15.1 Summary of Predrill Residual Environmental Impacts
During predrilling, the largest discharges to the marine environment by volume are drilling discharges, specifically the discharge of drill cuttings and water based drilling mud, and the discharge of cooling water from the mobile drilling rig generators. Modelling of the drilling discharges was undertaken to confirm the extent and scale of mud and cuttings predicted to be deposited on the seabed during COP predrilling. This was compared to trends observed during pre- and post- drilling surveys at existing platforms undertaken as part of the IEMP. These surveys have shown that such discharges, which are required to meet applicable
Event Receptor Event Magnitude
Receptor Sensitivity
Impact Significance
Emissions from mobile drilling rig power generation
Medium Low Minor
Negative
Emissions from well test flaring Medium Low Minor
Negative Emissions from support vessel engines
Onshorecommunities
(people)Birds
Seals and fish Medium Low Minor
Negative
Underwater noise from drilling and vessel movements
Seals and fish Medium Low Minor
Negative
Drilling discharges
Seals and fish Zooplankton
Phytoplankton Benthic
Invertebrates
Medium Low Minor
Negative
Vessel and drilling rig cooling water intake and discharge
Medium Low Minor
Negative Vessel and drilling rig ballast water discharge
Medium Low Minor
Negative Vessel and drilling rig treated black water discharge
Medium Low Minor
Negative Vessel and drilling rig grey water discharge
Medium Low Minor
Negative Vessel and drilling rig drainage discharges
Seals and fish Zooplankton
Phytoplankton
Medium Low Minor
Negative
Cement discharges Medium Low Minor
Negative Seabed disturbance from anchor handling
BenthicInvertebrates
Low Low Negligible

AIOC Chirag Oil Project Environmental & Socio-Economic Impact Assessment
Chapter 15: Residual Impacts and Conclusions
February 2010 15/4Final
standards prior to discharge, have a very limited ecological impact to marine receptors. Based on the predicted event magnitude, receptor characteristics and observed sensitivities the impact was assessed as minor.
Small quantities of cement may be discharged to the seabed whilst cementing well casings into place. These will remain close to the well-head in the same area as drill cuttings are deposited. The impact to benthic invertebrates, which were evaluated as having a low sensitivity to cement discharges, was therefore assessed as minor.
Cooling water discharges are estimated to have a zone of influence (i.e., where temperature and trace biocide concentrations might have a minor effect) of only a few metres and are also considered to have a minor impact upon biological receptors in the water column (i.e. zooplankton, phytoplankton, seals and fish).
The remaining discharges to sea (ballast water, black water, grey water and deck drainage) are all small in volume (relative to drilling and cooling water discharges) and do not contain components of high environmental concern. These discharges, which are monitored in accordance with existing procedures to ensure applicable project standards are met, will be rapidly diluted and are all assessed as having a minor impact upon biological receptors in the water column.
Seabed disturbance associated with anchor handling during positioning of the mobile drilling rig will cause temporary disturbance to the surface layers of the sediment. The assessment concluded that benthic communities in the area are not, however, sensitive to this form of disturbance and the impact was therefore assessed as negligible.
For all predrill phase environmental impacts assessed it has been concluded that impacts are minimised as far as practicable and necessary through the implementation of the existing control measures and no additional mitigation is required.
15.4.2 Construction, Hook-Up and Commissioning
Table 15.2 summarises the interactions assessed for the construction, hook-up and commissioning phase, and the results of the impact assessment for each interaction.
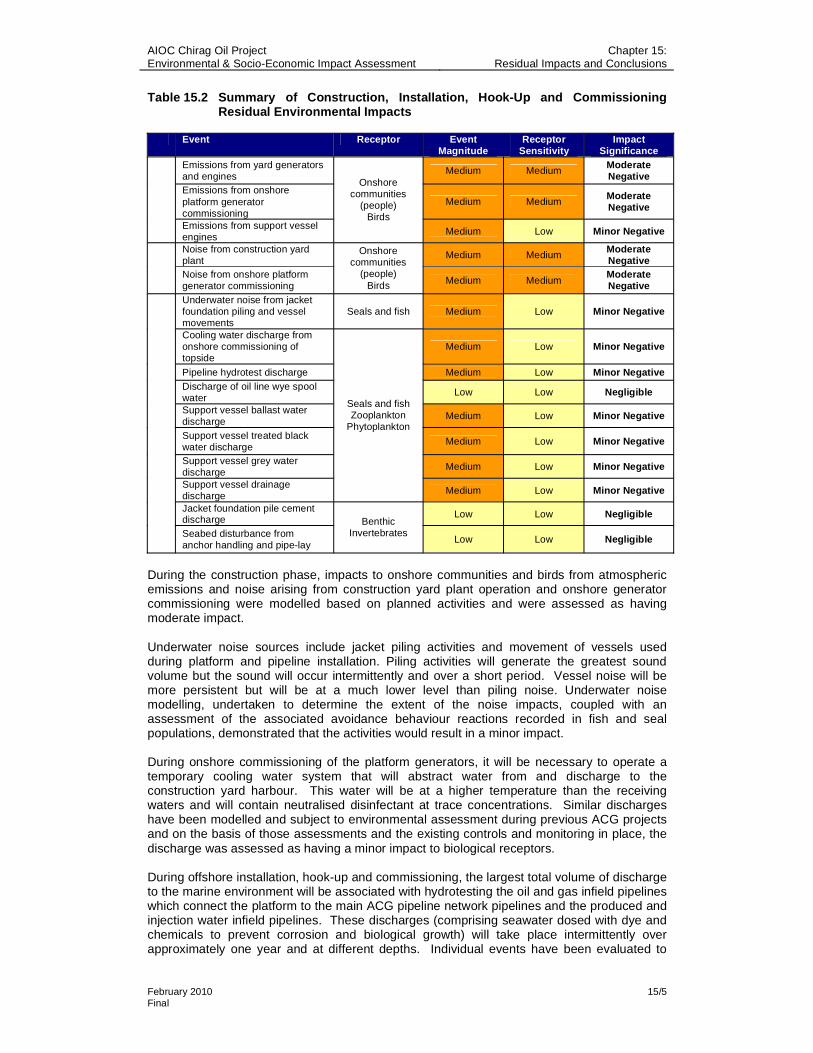
AIOC Chirag Oil Project Environmental & Socio-Economic Impact Assessment
Chapter 15: Residual Impacts and Conclusions
February 2010 15/5Final
Table 15.2 Summary of Construction, Installation, Hook-Up and Commissioning Residual Environmental Impacts
Event Receptor Event Magnitude
Receptor Sensitivity
Impact Significance
Emissions from yard generators and engines
Medium MediumModerate Negative
Emissions from onshore platform generator commissioning
Medium MediumModerate Negative
Emissions from support vessel engines
Onshorecommunities
(people)Birds
Medium Low Minor Negative
Noise from construction yard plant
Medium MediumModerate Negative
Noise from onshore platform generator commissioning
Onshorecommunities
(people)Birds Medium Medium
Moderate Negative
Underwater noise from jacket foundation piling and vessel movements
Seals and fish Medium Low Minor Negative
Cooling water discharge from onshore commissioning of topside
Medium Low Minor Negative
Pipeline hydrotest discharge Medium Low Minor Negative Discharge of oil line wye spool water
Low Low Negligible
Support vessel ballast water discharge
Medium Low Minor Negative
Support vessel treated black water discharge
Medium Low Minor Negative
Support vessel grey water discharge
Medium Low Minor Negative
Support vessel drainage discharge
Seals and fish Zooplankton
Phytoplankton
Medium Low Minor Negative
Jacket foundation pile cement discharge Low Low Negligible
Seabed disturbance from anchor handling and pipe-lay
BenthicInvertebrates
Low Low Negligible
During the construction phase, impacts to onshore communities and birds from atmospheric emissions and noise arising from construction yard plant operation and onshore generator commissioning were modelled based on planned activities and were assessed as having moderate impact.
Underwater noise sources include jacket piling activities and movement of vessels used during platform and pipeline installation. Piling activities will generate the greatest sound volume but the sound will occur intermittently and over a short period. Vessel noise will be more persistent but will be at a much lower level than piling noise. Underwater noise modelling, undertaken to determine the extent of the noise impacts, coupled with an assessment of the associated avoidance behaviour reactions recorded in fish and seal populations, demonstrated that the activities would result in a minor impact.
During onshore commissioning of the platform generators, it will be necessary to operate a temporary cooling water system that will abstract water from and discharge to the construction yard harbour. This water will be at a higher temperature than the receiving waters and will contain neutralised disinfectant at trace concentrations. Similar discharges have been modelled and subject to environmental assessment during previous ACG projects and on the basis of those assessments and the existing controls and monitoring in place, the discharge was assessed as having a minor impact to biological receptors.
During offshore installation, hook-up and commissioning, the largest total volume of discharge to the marine environment will be associated with hydrotesting the oil and gas infield pipelines which connect the platform to the main ACG pipeline network pipelines and the produced and injection water infield pipelines. These discharges (comprising seawater dosed with dye and chemicals to prevent corrosion and biological growth) will take place intermittently over approximately one year and at different depths. Individual events have been evaluated to

AIOC Chirag Oil Project Environmental & Socio-Economic Impact Assessment
Chapter 15: Residual Impacts and Conclusions
February 2010 15/6Final
have a minor impact and, given the spatial and temporal distribution of the discharges, the overall impact was also assessed as minor to biological receptors. Additional measures to monitor and control hydrotest discharges will comprise:
Preparation and maintenance of a hydrotest management plan, which will include a regularly updated schedule of hydrotest events together with a detailed set of commissioning procedures;
Recording of chemical dosage rates and water flow rates during all pipeline hydrotest activities;
Recording of the volume of treated water released during each hydrotest discharge event; and
Preparation of laboratory samples, which will be stored onshore under simulated pipeline conditions and periodically subject to chemical analysis and toxicity testing in order to measure the rate of chemical degradation and associated toxicity reduction.
Based on previous ACG experience, these measures are considered to provide effective and practicable monitoring and assurance during hydrotesting and are designed to ensure that the impact to the marine environment is of no more than minor significance. The impacts of jacket foundation cementing discharges and physical disturbance associated with anchor handling upon benthic invertebrates will be similar to those evaluated for the predrill programme and were assessed as minor.
Aqueous discharges (ballast water, grey water, black water and drainage) will also be similar in magnitude and impact to those for the predrill programme and were assessed as having a minor impact upon biological receptors.
A small volume of water (approximately 65m3) with a low level of residual hydrocarbon (less than 100ppm) may be released to sea during hydrotesting of the wye section that will connect the COP oil export pipeline to the DWG oil export pipeline. This volume will be released at the seabed and will dilute and disperse rapidly. The impact upon biological receptors was assessed to be negligible.
Overall, the majority of residual impacts were assessed as minor or negligible. The only moderate impacts were those arising from air emissions and noise associated with construction yard activity and onshore platform commissioning. These activities will not however, result in the exceedence of ambient air quality or noise standards for the protection of human health. Community liaison and engagement, similar to that undertaken for the previous ACG projects, will be a key element throughout the construction phase to ensure these impacts are minimised. Construction activities will be managed in accordance with previously established practice and AzSPU procedures and impacts are considered to be controlled and mitigated to an acceptable level.
15.4.3 Operations
Table 15.3 summarises the interactions assessed for the operations phase, and the results of the impact assessment for each interaction.

AIOC Chirag Oil Project Environmental & Socio-Economic Impact Assessment
Chapter 15: Residual Impacts and Conclusions
February 2010 15/7Final
Table 15.3 Summary of Operations Residual Environmental Impacts
Event Receptor Event Magnitude
Receptor Sensitivity
Impact Significance
Emissions from offshore platform power generation and non-routine flaring
Medium Low Minor Negative
Emissions from support vessel engines
Medium Low Minor Negative
(Humans)Medium
Moderate Negative Emissions from onshore combustion
plant and flaring
Onshorecommunities
(people)Birds
Medium (Biological /Ecological)
Low Minor Negative
Underwater noise from drilling, hammering and vessel movements
Seals and fish Medium Low Minor Negative
Platform drilling discharges Medium Low Minor Negative
Platform pigging discharges (produced water and injection water infield pipelines)
Seals and fish Zooplankton
Phytoplankton Benthic
InvertebratesMedium Low Minor Negative
Platform cement discharge Benthic
InvertebratesMedium Low Minor Negative
Platform non routine produced water discharge Medium Low Minor Negative
Platform water intake and cooling water discharge
Medium Low Minor Negative
Support vessel ballast water discharge
Medium Low Minor Negative
Platform and support vessel treated black water discharge
Medium Low Minor Negative
Platform and support vessel grey water discharge
Medium Low Minor Negative
Platform and support vessel galley waste discharge Medium Low Minor Negative
Platform and support vessel drainage discharge
Seals and fish ZooplanktonPhytoplankton
Medium Low Minor Negative
The majority of operational interactions are similar to those already considered for predrill and construction activities. Each interaction was assessed based on event magnitude and receptor sensitivity and the impact significance found to be the same as for the previous phases. Events include offshore emissions, underwater noise, drilling discharges (water based mud and cuttings discharge), cement discharge, cooling water discharge and aqueous discharges (i.e. ballast water, black water, grey water, galley waste, drainage). Only air emissions (onshore plant and flaring) were assessed as having a moderate impact. Emissions from onshore plant and flaring associated with the COP will not however, result in exceedences of internationally recognised ambient air quality standards for the protection of health at onshore receptors.
During routine operations, produced water will be reinjected into the reservoir. Discharge of produced water which meets applicable project standards will only occur due to failure of the reinjection system or if produced water is incompatible with seawater that is injected into the reservoir for pressure maintenance purposes. Pigging (i.e. i.e. cleaning of the produced water and injection water pipelines) is planned to occur once a week and discharge of pigging fluids will be of short duration (i.e. hours).
Produced water and pigging fluids have been the subject of chemical analysis, toxicity testing and dispersion modelling. The results of these studies have been used to estimate the degree of dilution required to reach a “no effect” level and the size of the dispersion plume within which such dilution would occur. Both types of discharge will be intermittent and of short duration (i.e. hours) and the plumes will dissipate within a few hours of the end of each discharge event. Based on the modelling conducted the volume of seawater potentially affected by these discharges is limited to a narrow plume of less than 600m in length. Based on the sensitivity of the receptors in the water column to the event and its limited magnitude,

AIOC Chirag Oil Project Environmental & Socio-Economic Impact Assessment
Chapter 15: Residual Impacts and Conclusions
February 2010 15/8Final
produced water and pigging fluid discharges were assessed as having a minor impact upon biological receptors. Overall, the majority of residual impacts from operations are assessed as minor or negligible (with the exception of onshore air emissions). The expected moderate negative impact associated with onshore operations at the Sangachal Terminal will also be mitigated through existing community liaison and engagement supported by the IEMP ambient monitoring undertaken in and around the Terminal. All activities will be managed in accordance with previously established practice and AzSPU procedures and impacts are considered to be controlled and mitigated to an acceptable level.
15.5 Cumulative, Transboundary and Accidental Events
Cumulative impacts, potential transboundary impacts and the impacts of accidental events associated with the COP were also assessed. The routine and non-routine discharges to sea from the COP will be, as with other ACG projects, of limited impact. It was concluded that each discharge will make a small incremental contribution to the ACG total but the platform discharges will be isolated from each other and the total itself represents a very small fraction of the assimilative capacity of the Contract Area. Consequently, it is considered that these discharges represent a sustainable situation and it is predicted that there will be no measurable deterioration of the marine environment attributable to ACG operations.
For both onshore and offshore activities, the volumes of atmospheric emissions released (including visible particulates) due to the COP are expected to result in very small increases in pollutant concentrations in the atmosphere and in any washout from rainfall, which will not be discernable to biological/ecological receptors. SO2 emissions are minimised through the planned use of low sulphur diesel and preferential use of gas as a fuel for the operation of the WC-PDQ platform and are expected to disperse rapidly due to appropriate equipment design and fuel use. Contribution of COP SO2 emissions to acid rain generation is therefore expected to be insignificant.
It was estimated that 97% (5,995,000 tonnes) of the COP GHG emissions (comprising carbon dioxide and methane) will be generated from the operational phase activities onshore and offshore. The annual contribution of COP in the year 2020 to the predicted national Azerbaijan forecast1 was estimated to be approximately 0.5%.
Energy efficiency and GHG reduction was a key aspect taken into account during the development of the COP design, contributing to the selection of the electric drive concept with all power to the platform, including the gas export compressors, being provided by the main power generation turbines. Analysis demonstrated that this technology selection resulted in a saving of approximately 300,000 tonnes of CO2 emissions across the project’s lifetime, when compared to direct drive gas turbine technology. This is a more than 40% reduction.
A review and assessment of accidental events was carried out as part of the COP ESIA. This considered a number of accidental events scenarios that included well blowout and pipeline failure as well as lower magnitude events (e.g. spills). Modelling was undertaken to illustrate the expected behaviour of an oil spill for the blowout and pipeline rupture scenarios for COP. The results were similar to those obtained within previous ACG ESIAs as the the COP crude oil is expected to be more persistent than Azeri oil but less persistent than the Chirag oil.
A platform blowout or major pipeline rupture are the only events with the potential to become regional transboundary events. The precise nature of the impact would depend on the prevailing weather conditions at the time of the spill, the time required for deploying spill response measures and their effectiveness.
BP, as operator of AIOC, has developed and maintains a range of Oil Spill Response Plans (OSRP) in place for its offshore and onshore operations in Azerbaijan. These plans encompass all phases of ACG development and establish the notification, response and followup actions that must be implemented should an accidental event occur. In addition BP
1 First National Communication of Azerbaijan on Climate Change, May 23 2000.
AIOC Chirag Oil Project Environmental & Socio-Economic Impact Assessment
Chapter 15: Residual Impacts and Conclusions
February 2010 15/9Final
has developed a system to manage pipeline integrity across the ACG pipeline network including monitoring and auditing procedures.
Analysis of onshore construction and offshore operation spill data focused on classifying the root causes, types, and quantities of spills. The principal outcome of this analysis was to identify the areas for improvement in equipment specification, training, operating procedures and maintenance procedures to be implemented for the COP. The established procedures for spill recording, investigation and corrective action will also be maintained.
The ESIA predicts that accidental events will be low in frequency, given the preventative measures in place, and if they do occur will be discrete (i.e. have a very low likelihood of overlapping in time and space). With the exception of a major loss of oil containment (i.e., blowout or pipeline rupture) they are also not persistent and such events will, therefore, have no cumulative impact.
15.6 Environmental and Social Management
Each phase of the COP will be subject to formal environmental and social (E&S) management planning under the framework of the integrated AzSPU HSSE Management System.
During the predrill and construction, installation and HUC phases the key contractor companies will be required, under the terms of their contracts, to develop and implement E&S Management Systems that align with the BP expectations and are bridged to the AzSPU HSSE Management System.
Once the WC-PDQ platform is “hydrocarbon live” it will become an operational facility, managed directly by AzSPU. External certification of the platform to ISO 14001 (the leading international standard on environmental management) within 12 months of becoming operational is a BP requirement.
The environmental and social management process during all phases of the COP will benefit from accumulated experience and ‘lessons learned’ from executing the three previous ACG projects. Major benefits of previous project experience include the development of:
Effective and reliable procedures for on-site segregation and management of waste; A non-hazardous landfill site designed and constructed to EU standards; and An effective process for identifying and utilising opportunities for waste recovery and
recycling.
15.7 Conclusions
The COP has benefited, to a considerable extent, from the experience gained by AIOC in designing, constructing, installing and operating the ACG Phase 1, 2 and 3 facilities. The basic design concept has been well-tested and proven and over five years of environmental monitoring have demonstrated that the basic design concept is environmentally sound. Nevertheless, the COP has identified opportunities for improvement, most notably the selection of an electric drive concept that substantially reduces emissions and a more reliable sewage treatment plant. COP is committed to implementing these during project execution.
The COP will also benefit from the fact that the predrilling, construction and installation teams now have extensive practical experience in offshore ACG activities and that these teams can execute the planned activities reliably.
The environmental management process is underpinned by the IEMP. Since 2004, this programme has focused on establishing and executing a regular and structured programme of ambient environmental monitoring around planned, new and operating installations. By 2008, all the ACG Phase 1, 2 and 3 installations were operational and the focus of the IEMP is now shifting towards integration of operational monitoring. Increasingly, the IEMP will concentrate on the results of discharge/emission sampling from operational installations with

AIOC Chirag Oil Project Environmental & Socio-Economic Impact Assessment
Chapter 15: Residual Impacts and Conclusions
February 2010 15/10Final
the aim of confirming design performance and of identifying deviations in over time to minimise adverse effects.
In conclusion, the COP is based on proven design concepts and engineering standards and has benefited from lessons learned during previous ACG project. These previous projects have been the subject of extensive environmental monitoring and the results of this monitoring provide confidence that the environmental impact of the COP design will be acceptable and effectively controlled.

APPENDIX 2A
COP – Appendix IX of PSA


APPENDIX 5A
Emissions Estimate Assumptions


AIOC Chirag Oil Project Environmental & Socio-Economic Impact Assessment
Appendix 5A
February 2010 5A/1 Final
Appendix 5A Onshore and Offshore Atmospheric Emissions Estimates
CONTENTS
1. Introduction ....................................................................................................................... 22. Predrilling .......................................................................................................................... 43. Onshore Construction and Commissioning of Offshore Facilities .................................... 44. In Field Pipeline Installation, Tie In and Commissioning .................................................. 55. Platform Installation, Hook Up and Commissioning.......................................................... 56. Offshore Operations and Production ................................................................................ 67. Terminal .......................................................................................................................... 12

AIOC Chirag Oil Project Environmental & Socio-Economic Impact Assessment
Appendix 5A
February 2010 5A/2 Final
1. Introduction
This Appendix provides supplementary information to the emissions calculations presented in Chapter 5: Project Description and includes pollutant emission factors and the basis of emissions estimates for each COP phase.
Emissions were calculated using internationally accepted emission factors that were calculated based on real time data collected over time. These were obtained from:
E&P Forum Report No. 2.59/197 (Methods for Estimating Atmospheric Emissions from E&P Operations, Report No. 2.59/197; The Oil Industry International E&P Forum, September 1994); and
EEMS Atmospheric Emission Calculations Issue 1.8 (UK Offshore Operators Association Ltd, 2004).
Table 1 presents the relevant emissions factors.

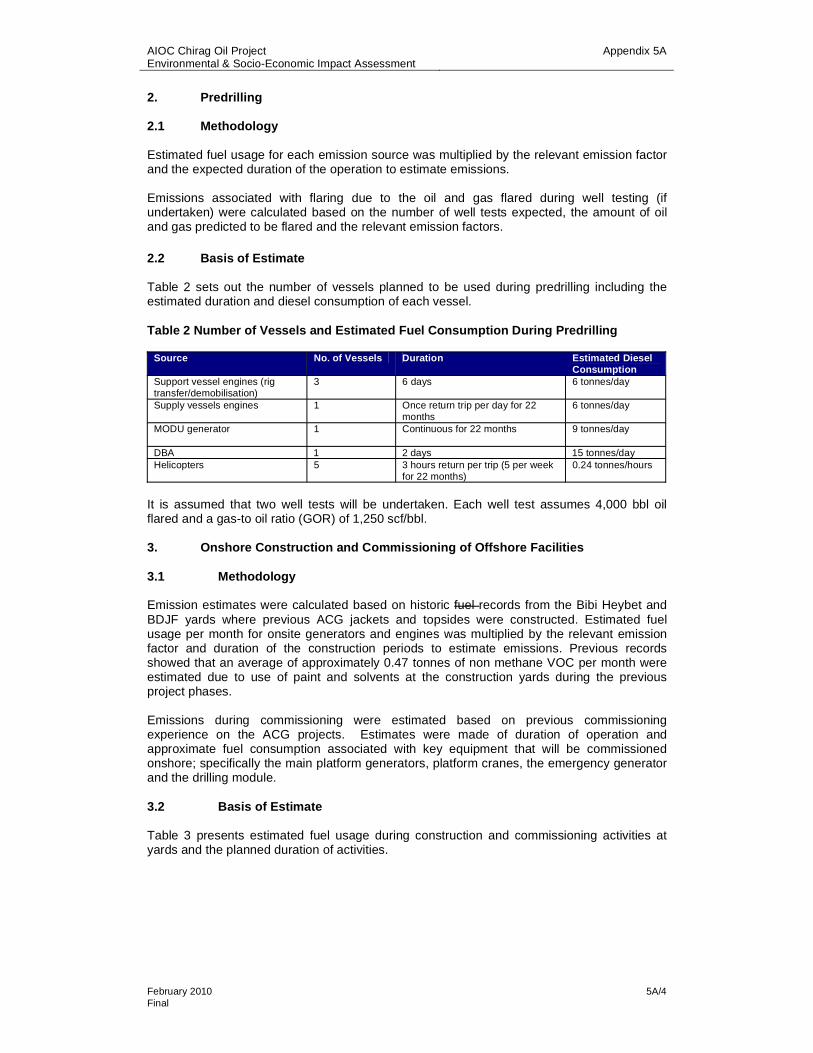
AIOC Chirag Oil Project Environmental & Socio-Economic Impact Assessment
Appendix 5A
February 2010 5A/4 Final
2. Predrilling
2.1 Methodology
Estimated fuel usage for each emission source was multiplied by the relevant emission factor and the expected duration of the operation to estimate emissions.
Emissions associated with flaring due to the oil and gas flared during well testing (if undertaken) were calculated based on the number of well tests expected, the amount of oil and gas predicted to be flared and the relevant emission factors.
2.2 Basis of Estimate
Table 2 sets out the number of vessels planned to be used during predrilling including the estimated duration and diesel consumption of each vessel.
Table 2 Number of Vessels and Estimated Fuel Consumption During Predrilling
Source No. of Vessels Duration Estimated Diesel Consumption
Support vessel engines (rig transfer/demobilisation)
3 6 days 6 tonnes/day
Supply vessels engines 1 Once return trip per day for 22 months
6 tonnes/day
MODU generator 1 Continuous for 22 months 9 tonnes/day
DBA 1 2 days 15 tonnes/day Helicopters 5 3 hours return per trip (5 per week
for 22 months) 0.24 tonnes/hours
It is assumed that two well tests will be undertaken. Each well test assumes 4,000 bbl oil flared and a gas-to oil ratio (GOR) of 1,250 scf/bbl.
3. Onshore Construction and Commissioning of Offshore Facilities
3.1 Methodology
Emission estimates were calculated based on historic fuel records from the Bibi Heybet and BDJF yards where previous ACG jackets and topsides were constructed. Estimated fuel usage per month for onsite generators and engines was multiplied by the relevant emission factor and duration of the construction periods to estimate emissions. Previous records showed that an average of approximately 0.47 tonnes of non methane VOC per month were estimated due to use of paint and solvents at the construction yards during the previous project phases.
Emissions during commissioning were estimated based on previous commissioning experience on the ACG projects. Estimates were made of duration of operation and approximate fuel consumption associated with key equipment that will be commissioned onshore; specifically the main platform generators, platform cranes, the emergency generator and the drilling module.
3.2 Basis of Estimate
Table 3 presents estimated fuel usage during construction and commissioning activities at yards and the planned duration of activities.

AIOC Chirag Oil Project Environmental & Socio-Economic Impact Assessment
Appendix 5A
February 2010 5A/5 Final
Table 3 Construction and Commissioning Emission Sources and Associated Estimated Fuel Consumption
Source Diesel Gasoline Duration Topside yard generators and engines1 130 tonnes/month 40 tonnes/month 31 months2
Jacket yard generators and engines 206 tonnes/month 40 tonnes/month 23 months Drilling module yard generators and engines 206 tonnes/month 40 tonnes/month 17 months Drilling module commissioning – temporary generator
6 tonnes/day - 8 hours/day for 8 months
Platform main generators2 8 tonnes/hour - Refer to Note 2 Platform cranes 25 tonnes/hour - 6 months Platform emergency generator 0.1 tonnes/hour - 2 weeks 1 Records indicate that 65% of fuel used by yard generators and 35% by engines 2 Includes duration that on site generators and engines will be used for construction and commissioning at the topside yard 3 Commissioning of the main platform power generation system will incorporate 3 RB211 generators, comprising, i) each generator run separately and intermittently for a week, each for up to 8 hours a day at a maximum load of approximately 26% and ii) three synchronisation tests of eight hour duration, running two of the three generators together at a maximum load of approximately 26%. The generators will be run separately and intermittently during commissioning of, i) The compression system (up to 4 weeks for up to 8 hours per day); and ii) Topside utilities (up to 6 months for up to 8 hours per day).
4. In Field Pipeline Installation, Tie In and Commissioning
4.1 Methodology
Estimated fuel usage for each vessel planned to be used was multiplied by the expected number of vessels, the relevant emission factor and the expected duration of the activity to estimate emissions. A worst case scenario where vessels are being used continuously for the duration was assumed although vessel use will be intermittent.
4.2 Basis of Estimate
Table 4 lists the vessels that will be used during in field pipeline installation, tie in and commissioning, the duration of use for each vessel and estimated fuel consumption.
Table 4 Number of Vessels and Estimated Fuel Consumption During In Field Pipeline Installation, Tie In and Commissioning
Vessel No. of Vessels Duration (days) Fuel Consumption Pipe-lay barge 1 90 15 tonnes/day Anchor handling vessel 4 90 6 tonnes/day Pipe-haul barge 4 90 15 tonnes/day Tugs 4 90 6 tonnes/day Diving support vessel 1 90 6 tonnes/day Survey vessel 1 90 6 tonnes/day Commissioning support vessel 5 330 6 tonnes/day
5. Platform Installation, Hook Up and Commissioning
5.1 Methodology
Estimated fuel usage for each vessel planned to be used was multiplied by the expected number of vessels, the relevant emission factor and the expected duration of the activity to estimate emissions.
Emissions associated with commissioning activities on the platform (i.e. from platform generators and flaring) were included in the offshore operations estimate (Section 6 below).
5.2 Basis of Estimate
Table 5 lists the vessels that will be used during in field pipeline installation, tie in and commissioning, the duration of use for each vessel and estimated fuel consumption.

AIOC Chirag Oil Project Environmental & Socio-Economic Impact Assessment
Appendix 5A
February 2010 5A/6 Final
Table 5 Number of Vessels and Estimated Fuel Consumption During Platform Installation, Hook Up and Commissioning
Activity Vessel No. Duration (days) Fuel Consumption1 (tonnes/day) Installation of the jacket Support vessel
STB-01DBADSV
3111
45
1
6
15
Installation of the topside Support vessel STB-01DBA
411
26
15WC-PDQ platform commissioning and DWG brownfield works
Support vessel DBADSV
211
502150
9
6. Offshore Operations and Production
6.1 Methodology and Basis of Estimate
Emissions to air were estimated using a combination of (i) emission forecasting software and (ii) spreadsheet-based manual calculations.
6.1.1 WC-PDQ Emissions
The emissions forecasting software was used to calculate CO2 emissions from the main topside emission sources on the WC-PDQ platform during routine operations. CO, NOx, CH4,SO4 and VOC emissions were calculated manually using the EEMS emission factors.
The source of the main data inputs were:
Process data was obtained from the project heat and material balance Fuel Gas composition was taken from the project heat & material balance Equipment Details were obtained from the:
o Electrical Load Summary o Equipment Lists o Equipment Load Profile o Electrical Load Profile o Electrical Load Lists
Production Data was obtained from the latest production profile. Flare rates were estimated at 2% of total gas produced.
Model inputs are summarised in Table 6.
Table 6 Model Input to Calculate Emissions Associated with Offshore Operation and Production
Equipment Model Inputs Power Generation No. of Units, make, model and ISO rating. If a specific vendor is not known or not
present on the database, generic gas turbine options are available. Compression Driver type (motor). Maximum throughput, maximum power input. MOL Pumps Motor driven. Maximum train throughput, maximum train power input (shaft), motor
rating.Seawater Lift Pumps Motor driven. Maximum train throughput, maximum train power input (shaft), motor
rating.
All other items of equipment were modelled as ‘miscellaneous electrical loads’, including flash gas compression which cannot be modelled as an individual item within the current release of the software used. The miscellaneous electrical loads were varied over each year in order to simulate varying demands on the platform and the subsequent impacts on overall emissions/energy efficiency.
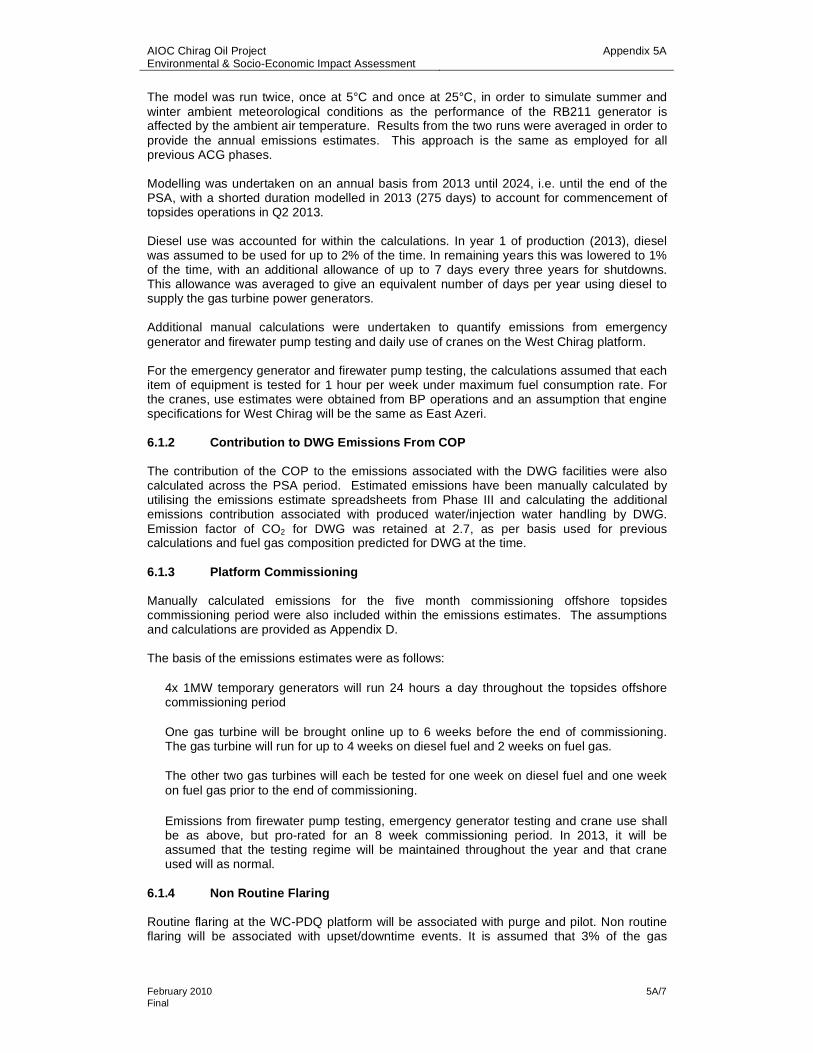
AIOC Chirag Oil Project Environmental & Socio-Economic Impact Assessment
Appendix 5A
February 2010 5A/7 Final
The model was run twice, once at 5°C and once at 25°C, in order to simulate summer and winter ambient meteorological conditions as the performance of the RB211 generator is affected by the ambient air temperature. Results from the two runs were averaged in order to provide the annual emissions estimates. This approach is the same as employed for all previous ACG phases.
Modelling was undertaken on an annual basis from 2013 until 2024, i.e. until the end of the PSA, with a shorted duration modelled in 2013 (275 days) to account for commencement of topsides operations in Q2 2013.
Diesel use was accounted for within the calculations. In year 1 of production (2013), diesel was assumed to be used for up to 2% of the time. In remaining years this was lowered to 1% of the time, with an additional allowance of up to 7 days every three years for shutdowns. This allowance was averaged to give an equivalent number of days per year using diesel to supply the gas turbine power generators.
Additional manual calculations were undertaken to quantify emissions from emergency generator and firewater pump testing and daily use of cranes on the West Chirag platform.
For the emergency generator and firewater pump testing, the calculations assumed that each item of equipment is tested for 1 hour per week under maximum fuel consumption rate. For the cranes, use estimates were obtained from BP operations and an assumption that engine specifications for West Chirag will be the same as East Azeri.
6.1.2 Contribution to DWG Emissions From COP
The contribution of the COP to the emissions associated with the DWG facilities were also calculated across the PSA period. Estimated emissions have been manually calculated by utilising the emissions estimate spreadsheets from Phase III and calculating the additional emissions contribution associated with produced water/injection water handling by DWG. Emission factor of CO2 for DWG was retained at 2.7, as per basis used for previous calculations and fuel gas composition predicted for DWG at the time.
6.1.3 Platform Commissioning
Manually calculated emissions for the five month commissioning offshore topsides commissioning period were also included within the emissions estimates. The assumptions and calculations are provided as Appendix D.
The basis of the emissions estimates were as follows:
4x 1MW temporary generators will run 24 hours a day throughout the topsides offshore commissioning period
One gas turbine will be brought online up to 6 weeks before the end of commissioning. The gas turbine will run for up to 4 weeks on diesel fuel and 2 weeks on fuel gas.
The other two gas turbines will each be tested for one week on diesel fuel and one week on fuel gas prior to the end of commissioning.
Emissions from firewater pump testing, emergency generator testing and crane use shall be as above, but pro-rated for an 8 week commissioning period. In 2013, it will be assumed that the testing regime will be maintained throughout the year and that crane used will as normal.
6.1.4 Non Routine Flaring
Routine flaring at the WC-PDQ platform will be associated with purge and pilot. Non routine flaring will be associated with upset/downtime events. It is assumed that 3% of the gas

AIOC Chirag Oil Project Environmental & Socio-Economic Impact Assessment
Appendix 5A
February 2010 5A/8 Final
produced is flared with 2% flared offshore1 and 1% onshore. Flaring emissions were included within the emissions forecasting modelling.
6.1.5 Helicopters/Supply Vessels
Emissions associated with supply vessels and helicopters were calculated manually using estimated fuel usage, expected number of vessels/helicopters, the relevant emission factor and the expected duration of the activity (Refer to Table 7).
Table 7 Number of Vessels/Helicopters and Estimated Fuel Consumption During Offshore Operations and Production
Vessel No. of Vessels
Duration (days) Fuel Consumption
Helicopters 5 3 hours return per trip (5 per week for 144 months) 0.24 tonnes/hr Supply Vessels 2 2 trips per week for 144 months 6 tonnes/day
6.2 Emissions Data
Table 8 presents the estimated offshore combustion emissions during offshore operations and production including commissioning and start up emissions. Table 9 presents emissions associated with flaring, Table 10 emissions associated with helicopters and supply vessels, and Table 11 presents total estimated emissions during offshore operations and production associated with the COP.
1 Derived from reliability/availability modelling of the WC-PDQ platform. Both offshore and onshore flaring estimates have been benchmarked against actual ACG flaring data.


Chirag Oil Project Environmental and Social Impact Assessment Appendix 5A
February 2010 5A/11 Final
Table 9 Offshore Flaring Emissions (Non Routine Flaring, Flare Purge and Pilot) (Tonnes)
Year CO2 CO NOx CH4 SO2 VOC
2013 1,642 5 1 9 1 7
2014 57,969 170 30 326 38 254
2015 150,484 442 79 847 98 659
2016 110,925 326 58 624 73 486
2017 95,941 282 50 540 63 420
2018 118,645 348 62 667 78 520
2019 106,741 313 56 600 70 468
2020 99,561 292 52 560 65 436
2021 67,976 200 36 383 44 298
2022 81,542 240 43 459 53 357
2023 74,585 219 39 419 49 327
2024 64,385 189 34 362 42 282
TOTAL 1,030,396 3,025 542 5,798 674 4,515Note: SO2 assumed to be equivalent to SOx
Table 10 Offshore Emissions from Helicopters/Supply Vessels (Tonnes)
CO2 CO NOx CH4 SO2 VOC Helicopters/Supply Vessels 27,556 66 456 69 2 19
Table 11 Total Offshore Operations Emissions (Tonnes)
CO2 CO NOx CH4 SO2 VOC
Combustion 3,261,536 4,182 8,992 1,236 1,798 72
Flaring 1,030,396 3,025 542 5,798 674 4,515
Helicopters/Supply Vessels 27,556 66 456 69 2 19
TOTAL 4,319,488 7,273 9,990 7,103 2,474 4,606
Note: SO2 assumed to be equivalent to SOx

Chirag Oil Project Environmental and Social Impact Assessment Appendix 5A
February 2010 5A/12 Final
7. Terminal
7.1 Methodology and Basis of Estimate
7.1.1 Combustion Emissions
The COP will use the 6 existing ACG processing trains and it is assumed the oil and gas are equally split across these trains. To calculate emissions associated with power required for the processing of the COP oil and gas at the Terminal, the fuel demands for ACG Phases 1-3 alone and Phases 1-3 with COP were determined using the project production profiles. The fuel gas required to run the gas turbines (GT) at the required load was calculated according to the power profile; the amount of fuel gas required in the fired heaters (FH) and the dewpoint control units (DPCU) to heat the oil and gas to the required temperature according to the flow through each unit was calculated. Appropriate emission factors to the fuel gas usage were applied, giving tonnes of pollutant per tonne of fuel gas used. The emissions attributable to the COP were determined by subtracting emissions associated with ACG Phases 1-3 alone.
7.1.2 Flaring Emissions
Based on an analysis of ACG flaring to date it has been assumed that 3% of the gas produced is flared with 1% flared onshore. Emissions due to flaring at the Terminal were calculated for ACG Phases 1-3 alone and Phases 1-3 with COP using the project production profiles. The appropriate emission factors were applied to the tonnes of predicted gas flared to give the tonnes of each pollutant over the life of the PSA. The emissions attributable to the COP were determined by subtracting emissions associated with ACG Phases 1-3 alone.
7.1.3 Fugitive Emissions
Fugitive emissions will result from filling, emptying and “breathing losses” from the existing oil storage tanks at the terminal. Emissions were calculated based on the expected throughout associated with oil from ACG Phases 1-3 (using project production profiles) and ACG Phases 1-3 including COP. The COP fugitive emissions were calculated based on the difference. Fugitive emissions were estimated by multiplying expected throughput by the the appropriate emission factor.2
7.2 Emissions Data
Tables 12 and 13 present the predicted emissions for the operations phase at the Sangachal Terminal for ACG Phases 1-3 and for COP arising from combustion and flaring. Table 14 presents expected fugitive emissions and Table 15 presents total estimated onshore COP emissions.
2 Estimated emissions calculated using the detailed TANKS 4 programme for Phase 3 were compared with the results using storage tank throughput (tonnes/hour) and multiplying by the appropriate EEMS emission factors. The results indicated a less than 2% difference in results. Therefore it was considered that using the EEMS emission factor was acceptable.

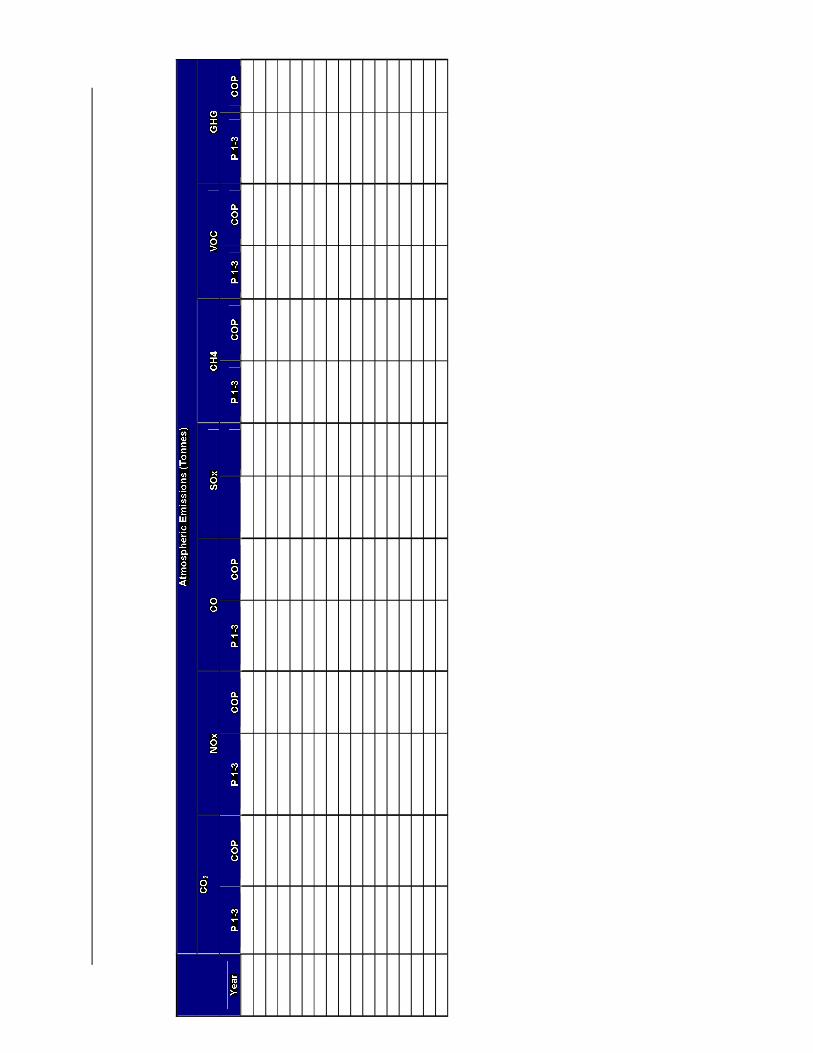

Chirag Oil Project Environmental and Social Impact Assessment Appendix 5A
February 2010 5A/15 Final
Table 14 Fugitive Emissions
Atmospheric Emissions (tonnes)
CH4 VOC Year
P 1-3 COP P 1-3 + COP P 1-3 COP P 1-3 + COP 2009 3.7 - 3.7 33.2 - 33.22010 3.8 - 3.8 34.3 - 34.32011 3.7 - 3.7 32.9 - 32.92012 3.7 - 3.7 33.5 - 33.52013 3.7 0.0 3.8 33.6 0.3 33.92014 3.9 0.4 4.4 35.5 3.8 39.32015 3.6 0.6 4.2 32.3 5.7 37.92016 3.2 0.7 3.9 28.9 6.0 34.92017 2.9 0.5 3.5 26.4 4.9 31.42018 2.6 0.5 3.0 23.0 4.2 27.32019 2.5 0.4 3.0 22.9 4.0 26.92020 2.3 0.4 2.8 21.1 3.9 25.02021 2.1 0.4 2.5 19.0 3.8 22.82022 1.9 0.4 2.3 16.7 3.8 20.52023 1.7 0.4 2.1 15.1 3.6 18.72024 1.6 0.4 2.0 14.2 3.4 17.7
Basis of Estimate: - Assume all storage tanks comprise external floating roofs - Assume throughput is equivalent to production rate
Table 15 Total Onshore COP Emissions
Atmospheric Emissions (Tonnes)
Year CO2 NOx CO SOx CH4 VOC GHG 2008 - - - - - - -2009 - - - - - - -2010 - - - - - - -2011 - - - - - - -2012 - - - - - - -2013 9,696 12 9 0 8 7 9,8552014 119,067 144 124 0 119 108 121,5672015 189,959 221 212 1 217 200 194,5182016 181,883 226 178 1 160 142 185,2442017 151,469 185 152 1 141 126 154,4272018 124,192 131 137 0 149 142 127,3312019 112,109 120 117 0 124 117 114,7112020 123,818 148 130 0 127 115 126,4782021 113,297 131 117 0 116 107 115,7342022 110,670 130 112 0 108 99 112,9482023 112,803 143 111 0 98 87 114,8662024 105,962 132 104 0 98 83 107,925
TOTAL 1,454,925 1,722 1,505 5 1,461 1,332 1,485,604


APPENDIX 5B
Approved CRI Waste Streams


APPENDIX 5C
Composition and Function of COP Chemicals with Potential For Discharge


AIOC Chirag Oil Project Environmental & Socio-Economic Impact Assessment
Appendix 5C
February 2010 5C/1 Final
Tables 1 & 2 provide a list of the product name, chemical composition, function, and usage of products which will, or could, be discharged to sea during each phase of the COP project. The table also indicates the environmental rating of each product (either UK OCNS classification or MENR approval).
Chemicals with the most favourable available environmental rating have been selected for each project phase, with the aim of minimising the environmental impact of any unavoidable discharges. The composition and chemistry of each planned or potential discharge has been fully taken into account in the impact assessment process.


APPENDIX 5D
Determination of Chemical Hazard Categories

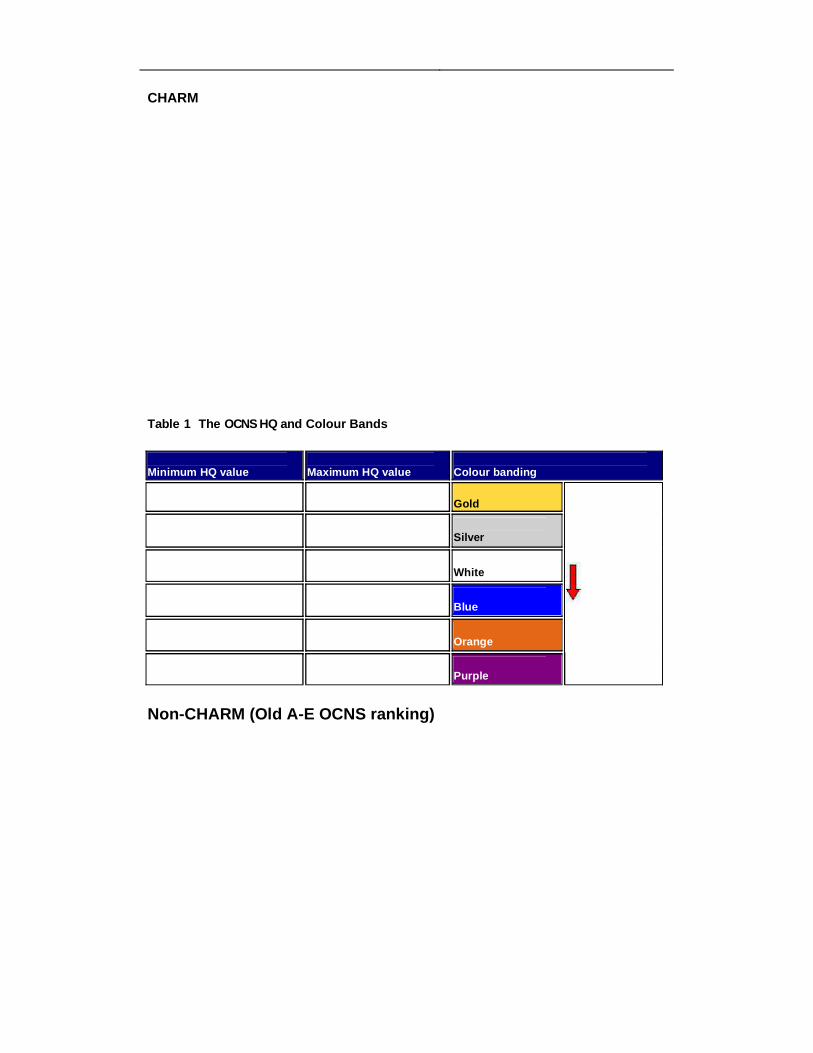
CHARM
Table 1 The OCNS HQ and Colour Bands
Minimum HQ value Maximum HQ value Colour banding
Gold
Silver
White
Blue
Orange
Purple
Non-CHARM (Old A-E OCNS ranking)

Initial Grouping
Table 2 Initial OCNS Grouping
Initial Grouping
A B C D E
Aquatic toxicity
Sediment toxicity
Adjustment for Environmental Performance to Determine final Group
Table 3: Adjustment criteria for OCNS grouping
Increase by 2 Groups e.g. From C to E
Increase by 1 Group e.g. From C to D
Do not adjust initial grouping
Decrease by 1 group e.g. From C to B
Decrease by 2 groups e.g. From C to A
Readily biodegradable
Inherently biodegradable

Not biodegradable
Non-bioaccumulative/non-bioaccumulating
Bioaccumulative/Bioaccumulates
Aquatic toxicity test result
Sediment toxicity test result


Appendix 5E
Seismic Design of the WC-PDQ Platform


AIOC Chirag Oil Project Environmental & Socio-Economic Impact Assessment
Appendix 5E
February 2010 5E/1 Final
Seismic Loads and Seismic Design Criteria
Design Criteria
The seismic design and seismic design criteria shall be in accordance with API RP 2A.The API guidelines for seismic design are based on a two level design check.
Design Seismic Conditions
The design seismic conditions cover the following seismic events:
Firstly, the platform is designed against an earthquake that has a relatively low likelihood of occurrence during the life of the platform. This event is referred to as the Strength Level Earthquake (SLE). The platform is expected to sustain little or no damage under the SLE. The return period of SLE was recommended to be 500 years.
Secondly, the platform is checked against a rare event that has a very low likelihood of occurrence during the platform life. This event is referred to as the Ductility Level Earthquake (DLE). The platform can sustain local damage during the DLE event; however, it should not collapse or have high Health, Safety or Environmental consequences during the DLE. The return period of DLE was recommended to be 3000 years.
Seismic Analysis
Platform location specific seismic SLE and DLE design criteria has been developed in accordance with API RP 2A. Table A and, Figures A and B below show horizontal and vertical acceleration response spectra corresponding to the 500-year return period SLE and 3000-year return period DLE events at the proposed Platform site.
According to comparisons made between AIOC seismic criteria and Azerbaijan offshore seismic design criteria contained in “Field Construction Standards. Offshore Stationary Platforms Design. SIN 0136002-57-98. BY SOCAR. Baku 1998”, AIOC SLE and DLE criteria is comparable to SOCAR & GIPRO intensity (Richter scale) of about 8 and 9 respectively.

AIOC Chirag Oil Project Environmental & Socio-Economic Impact Assessment
Appendix 5E
February 2010 5E/2 Final
Table A
500 year Return Strength Level Earthquake (SLE)
3000 year Return Ductility Level Earthquake (DLE)
Period (Sec)
Horizontal Acceleration
(g)
Vertical Acceleration
(g)
Horizontal Acceleration
(g)
Vertical Acceleration
(g)
PGA 0.196 0.157 0.426 0.341 0.030 0.196 0.157 0.451 0.361 0.050 0.279 0.251 0.586 0.527 0.075 0.351 0.316 0.740 0.666 0.100 0.413 0.372 0.877 0.790 0.150 0.486 0.340 1.065 0.745 0.200 0.494 0.247 1.095 0.547 0.300 0.435 0.218 0.980 0.490 0.500 0.326 0.163 0.778 0.389 0.750 0.238 0.119 0.589 0.295 1.000 0.205 0.102 0.521 0.260 1.500 0.174 0.087 0.445 0.222 2.000 0.150 0.075 0.394 0.197 3.000 0.099 0.050 0.270 0.135 4.000 0.067 0.034 0.188 0.094 5.000 0.047 0.023 0.132 0.066 6.000 0.034 0.017 0.095 0.047 7.000 0.025 0.012 0.070 0.035 8.000 0.019 0.010 0.053 0.027 9.000 0.015 0.008 0.042 0.021 10.000 0.012 0.006 0.034 0.017

AIOC Chirag Oil Project Environmental & Socio-Economic Impact Assessment
Appendix 5E
February 2010 5E/3 Final
Figure A
Figure B


APPENDIX 5F
Estimate of Sludge Generated from the WC-PDQ Platform


Estimate of Sludge Generated from the WC-PDQ Platform
The relationship is as follows:
Daily volumetric sludge production =
MLSSwaterblackforproductionSludgePOB
Maximum persons on board (POB) = 265
Mixed liquor suspended solids concentration (MLSS) = 15,000 g/m3
Sludge production for black water = 20 to 40 g/head.d
The calculated volumetric sludge productions are given below for range of sludge productions:
Units Highest (offshore)
Average (domestic)
Least (vendors)
Calculation steps
Mixedliquorsuspended solids
g/m3 15,000 15,000 15,000 Typical value for membrane bioreactor (MBR) plants
Sludge dry solidsproduction
g/head.day 40 30 20 Black water per person load of 40 g BOD removed/head.d x dry solids production for MBR plants (extended aeration) of 0.3 to 1.0 kg dry solids / kg BOD removed (source).
Daily sludgevolume
m3/d 0.7 0.5 0.35 POB x g/head.day / MLSS
Number of days per month
days 30 30 30 Assumed values
Monthly sludgevolume
m3/month 21 15 11 Daily sludge volume x days/month
Source: Construction Industry Research and Information Association Report (CIRIA) Report (2000) The selection of package wastewater treatment plants. CIRIA report FR/IP/33.


APPENDIX 6A
Fauna and flora surveys in the vicinity of the Sangachal Terminal (2006 and 2008)


AIOC Chirag Oil Project Environmental & Socio-Economic Impact Assessment
Appendix 6A
February 2010 6A/1 Final
The Tables below show the fauna and flora species identified in the vicinity of the Sangachal Terminal (2006 and 2008).
Table 1 Terrestrial fauna observed near Sangachal Terminal during 2008
Scientific name Common name Azerbaijan Red Book
IUCN Red List Observed
Microtus socialis* Social vole Not listed Least concern Old burrow, New burrow
Mus musculus Common mouse Not listed Not listed Yes, trapped.
Eremias velox (lizard) Not listed Not listed Yes
Lepus europaeus*European hare, Brown hare, European brown hare
Not listed Least concern Scat, new burrows
Testudo graeca Spur-thighed Tortoise Listed Vulnerable Yes
Meriones libycus* Libyan jird Not listed Not listed New burrows
Vulpes vulpes* Red Fox, Cross Fox, Silver Fox Not listed Least concern Scat,observed
Ophisops elegans Snake-eyed lizard Not listed Not listed Yes
Erinaceus concolor* Southern white-breasted hedgehog
Not listed Least concern Yes
Cyrtopodion caspium Caspian bent-toed gecko Not listed Not listed Yes
Allactaga elater* Small five-toed jerboa Not listed Least concern Old burrows
*Mammalian species
Table 2 Bird species observed in vicinity of Sangachal Terminal during 2008 survey
Species Common name Resident Migratory
Acrocephalus arundinaceus Great reed warbler +
Acanthis cannabina Linnet +
Acanthis flavirostris Twite +
Accipiter nisus Eurasian sparrowhawk +
Acrocephalus schoenobaenus Sedge warbler +
Acrocephalus scirpaceus Reed warbler +
Alauda arvensis Skylark +
Alcedo atthis Common kingfisher +
Alectoris chukar Chukar +
Anas crecca Common teal +
Anas platyrhynchos Mallard +
Anas querquedula Garganey +
Anser anser Graylag goose +
Anthus pratensis Meadow pipit +
Apus apus Common swift +
Ardea cinerea Gray heron +
Ardea purpurea Purple heron +
Asio flammeus Short-eared owl +
Athene noctua Little owl +
Aythya ferina Common pochard +
Aythya fuligula Tufted duck +

AIOC Chirag Oil Project Environmental & Socio-Economic Impact Assessment
Appendix 6A
February 2010 6A/2 Final
Species Common name Resident Migratory
Botaurus stellarus Great bittern +
Burhinus oedicnemus Stone curlew +
Buteo rufinus Long-legged buzzard +
Calandrella cinerea Red-capped Lark +
Calandrella rufescens Lesser short-toed Lark +
Caprimulgus europaeus European nightjar +
Carduelis carduelis Goldfinch +
Cercotrichas galactotes Rufous bush robin +
Cettia cetti Cetti's warbler +
Charadrius alexandrinus Western snowy plover +
Charadrius leschenaultii Greater sand plover +
Chardrius dubius Little ringed plover +
Chloris chloris Greenfinch +
Circus aeruginosus Marsh harrier +
Circus cyaneus Northern Harrier +
Columba livia Common Pigeon +
Coracias garrulus European Roller +
Corvus cornix Hooded Crow +
Corvus corax Common raven +
Corvus frugilegus Rook +
Coturnix coturnix Common Quail +
Cuculus canorus Common Cuckoo +
Cygnus cygnus Whooper Swan +
Cygnus olor Mute Swan +
Delichon urbica House martin +
Egretta alba Great White Egret +
Emberiza schoeniclus Reed bunting +
Emberizia cia Rock bunting +
Erithacus rubecula European Robin +
Falco cherrug Saker Falcon +
Falco columbarius Merlin +
Falco tinnunclus Common Kestrel +
Fringilla coelebs Chaffinch +
Fulica atra Eurasian Coot +
Galerida cristata Crested Lark +
Himantopus himantopus Black-winged Stilt +
Hippolais caligata Booted Warbler +
Hippolais languida Upchers Warbler +
Hippolais pallida Olivaceous Warbler +
Hirundo rustica Barn Swallow +
Lanius collurio Red-backed shrike +
Lanius minor Lesser Gray Shrike +
Lanius senator Woodchat Shrike +
Larus cachinnans Caspian Gull +
Larus genei Slender-billed Gull +
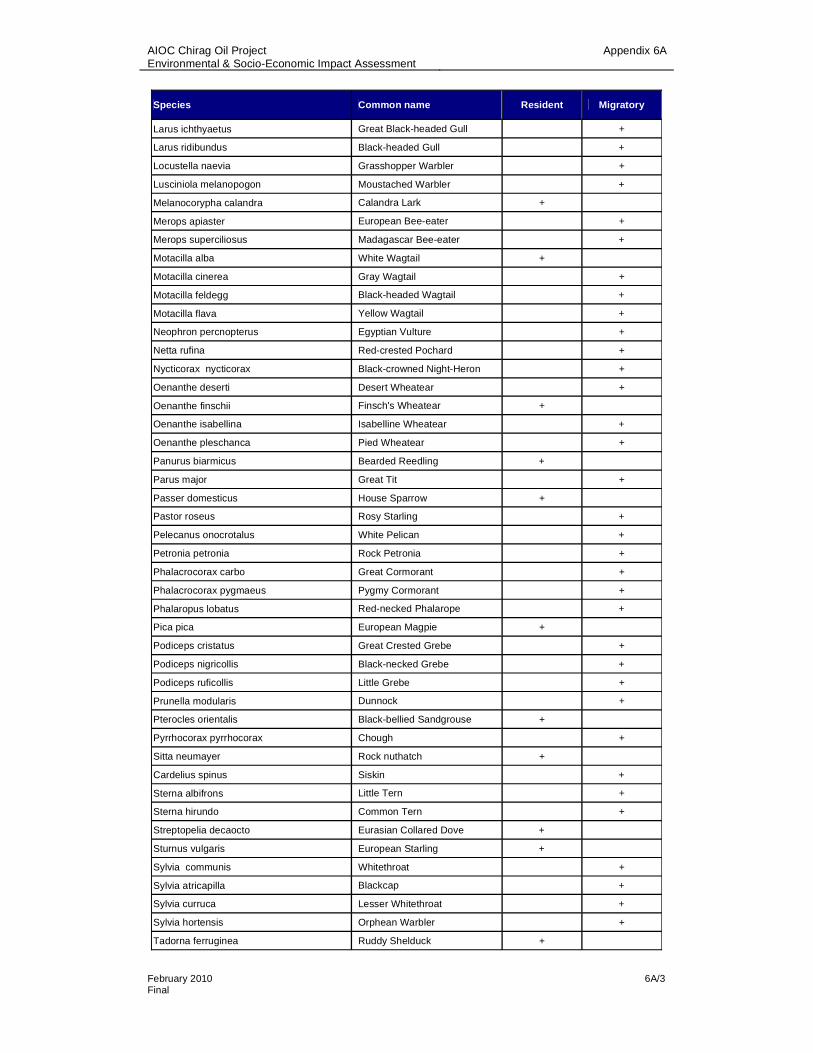
AIOC Chirag Oil Project Environmental & Socio-Economic Impact Assessment
Appendix 6A
February 2010 6A/3 Final
Species Common name Resident Migratory
Larus ichthyaetus Great Black-headed Gull +
Larus ridibundus Black-headed Gull +
Locustella naevia Grasshopper Warbler +
Lusciniola melanopogon Moustached Warbler +
Melanocorypha calandra Calandra Lark +
Merops apiaster European Bee-eater +
Merops superciliosus Madagascar Bee-eater +
Motacilla alba White Wagtail +
Motacilla cinerea Gray Wagtail +
Motacilla feldegg Black-headed Wagtail +
Motacilla flava Yellow Wagtail +
Neophron percnopterus Egyptian Vulture +
Netta rufina Red-crested Pochard +
Nycticorax nycticorax Black-crowned Night-Heron +
Oenanthe deserti Desert Wheatear +
Oenanthe finschii Finsch's Wheatear +
Oenanthe isabellina Isabelline Wheatear +
Oenanthe pleschanca Pied Wheatear +
Panurus biarmicus Bearded Reedling +
Parus major Great Tit +
Passer domesticus House Sparrow +
Pastor roseus Rosy Starling +
Pelecanus onocrotalus White Pelican +
Petronia petronia Rock Petronia +
Phalacrocorax carbo Great Cormorant +
Phalacrocorax pygmaeus Pygmy Cormorant +
Phalaropus lobatus Red-necked Phalarope +
Pica pica European Magpie +
Podiceps cristatus Great Crested Grebe +
Podiceps nigricollis Black-necked Grebe +
Podiceps ruficollis Little Grebe +
Prunella modularis Dunnock +
Pterocles orientalis Black-bellied Sandgrouse +
Pyrrhocorax pyrrhocorax Chough +
Sitta neumayer Rock nuthatch +
Cardelius spinus Siskin +
Sterna albifrons Little Tern +
Sterna hirundo Common Tern +
Streptopelia decaocto Eurasian Collared Dove +
Sturnus vulgaris European Starling +
Sylvia communis Whitethroat +
Sylvia atricapilla Blackcap +
Sylvia curruca Lesser Whitethroat +
Sylvia hortensis Orphean Warbler +
Tadorna ferruginea Ruddy Shelduck +

AIOC Chirag Oil Project Environmental & Socio-Economic Impact Assessment
Appendix 6A
February 2010 6A/4 Final
Species Common name Resident Migratory
Tringa totanus Common Redshank +
Troglodytes troglodytes Wren +
Turdus merula Blackbird +
Upupa epops Common Hoopoe +
Vanellus vanellus Northern Lapwing +
Table 3 Major perennial plant species and ecosystems identified in surveys 2006-2008.
Scientific name Life-form Ecosystem/community types
Alhagi pseudoalhagi Forb Semi-desert areas/chal-meadow
Artemisia lerchiana Semi-shrub Semi-desert
Bolboschoenus maritimus Grass Saline and marshy coastal
Halocnemum strobilaceum Semi-shrub Desert
Halostachys caspica Shrub Desert and semi-desert
Juncus acutus ForbSemi-desert /chal-meadow, wet, saline and sandy areas
Kalidium caspicum Bush Saline and marshy coastal
Lycium ruthenicum Shrub Desert and semi-desert, saline coastal slopes
Phragmites australis Grass Marsh/reedbeds
Poa bulbosa Grass Desert and semi-desert
Salsola dendroides Semi-shrub Desert and semi-desert
Salsola ericoides Shrub Desert
Salsola nodulosa Shrub Desert and semi-desert
Suaeda dendroides Bush Desert and semi-desert
Suaeda mycrophylla Bush Desert and semi-desert
Tamarix ramosissima Shrub Desert and semi-desert


Kura
020406080
100120140160180
Years
Caspian Sea
020406080
100120140160180
Years
020406080
100120
2002 2003 2004 2005 2006 2007Years

Kilka
0
2000
4000
6000
8000
10000
12000
2002 2003 2004 2005 2006 2007
Years
Herring
0
20
40
60
80
100
120
2002 2003 2004 2005 2006 2007
Years


‰ ‰
‰ ‰

‰ ‰
‰ ‰

National Report of the Republic of Azerbaijan. UNDP/Caspian Environmental Programme
Materials of the Azerbaijan Zoologist Society. v. I
Scientific conference materials
Author’s summary
Publication of the Academy of Sciences of the Azerbaijan SSR
Report materials
Report materials
International conference materials
International conference materials
Report # 2
Report materials


Caspian Sea
Azer- baijan
Existing Main Oil Pipeline Route

Abra ovata Mytilaster lineatus
Podiceps cristatus Aythya ferina
Cygnus olor

Pelecanus crispus
Podiceps cristatus, Cygnus olor, C.cygnus, C.bewickii, Netta rufina, Aythya ferina A.fuligula
Phoenicopterus roseus, Cygnus olor, C.bewickii Aythya nyroca
Pelecanus crispus
Phalacrocorax carbo Larus cachinnans, Sterna sandivicensus, S.albifrons, S.hirundo
Phalarocorax carbo Tachybabtus ruficollisTadorna ferruginea Fulica atra
Larus cachinnansSterna hirundo S.sandivicensis
Podiceps cristatusAythya ferina
Aythya fuligula Falica atra
Cygnus olorNumenius arquata


Podiceps cristatusAythya ferina
Aythya fuligula Falica atra
Cygnus olorPorphyrio porphyrio Pelecanus crispus
Podiceps cristatus, Cygnus olor Netta rufina, Aythya ferina A.fulica
Pahalacrocorax carbo, Ph.pygmaeus, Larus genei, L.cachinnans Pelecanus crispus, Larus minutus, L.canus, L.argentatus Sterna hirundo, S.sandivicensis S.albifrons
AnatidaePodicipidae


– in Azeri
– in Azeri
– in Azeri
– in Azeri
– In Russian
– In Russian
– In Russian
– In Azeri
– In Azeri
– In Russian
– In English
– In English
14. – In English

APPENDIX 9A
Predrill Activities and Events

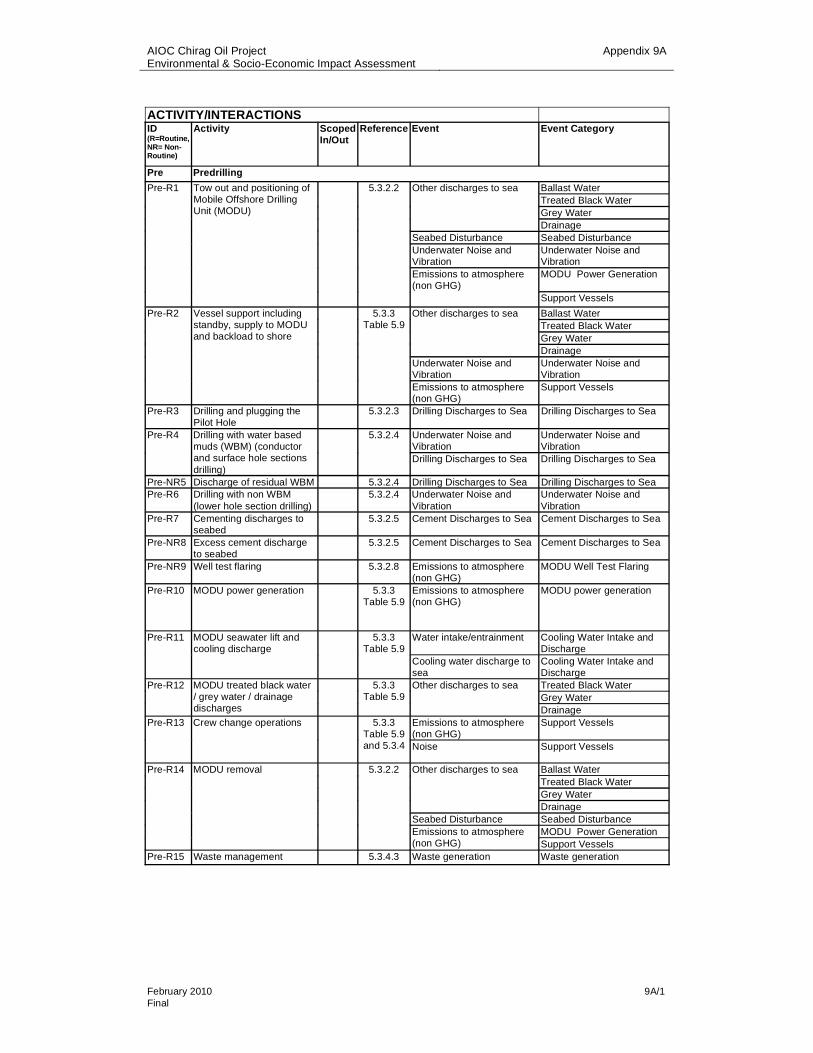
AIOC Chirag Oil Project Environmental & Socio-Economic Impact Assessment
Appendix 9A
February 2010 9A/1 Final
ACTIVITY/INTERACTIONSID(R=Routine, NR= Non-Routine)
Activity Scoped In/Out
Reference Event Event Category
Pre Predrilling
Ballast Water Treated Black Water Grey Water
Other discharges to sea
DrainageSeabed Disturbance Seabed Disturbance Underwater Noise and Vibration
Underwater Noise and Vibration
Emissions to atmosphere (non GHG)
MODU Power Generation
Pre-R1 Tow out and positioning of Mobile Offshore Drilling Unit (MODU)
5.3.2.2
Support Vessels
Ballast Water Treated Black Water Grey Water
Other discharges to sea
DrainageUnderwater Noise and Vibration
Underwater Noise and Vibration
Pre-R2 Vessel support including standby, supply to MODU and backload to shore
5.3.3Table 5.9
Emissions to atmosphere (non GHG)
Support Vessels
Pre-R3 Drilling and plugging the Pilot Hole
5.3.2.3 Drilling Discharges to Sea Drilling Discharges to Sea
Underwater Noise and Vibration
Underwater Noise and Vibration
Pre-R4 Drilling with water based muds (WBM) (conductor and surface hole sections drilling)
5.3.2.4
Drilling Discharges to Sea Drilling Discharges to Sea
Pre-NR5 Discharge of residual WBM 5.3.2.4 Drilling Discharges to Sea Drilling Discharges to Sea Pre-R6 Drilling with non WBM
(lower hole section drilling) 5.3.2.4 Underwater Noise and
VibrationUnderwater Noise and Vibration
Pre-R7 Cementing discharges to seabed
5.3.2.5 Cement Discharges to Sea Cement Discharges to Sea
Pre-NR8 Excess cement discharge to seabed
5.3.2.5 Cement Discharges to Sea Cement Discharges to Sea
Pre-NR9 Well test flaring 5.3.2.8 Emissions to atmosphere (non GHG)
MODU Well Test Flaring
Pre-R10 MODU power generation 5.3.3Table 5.9
Emissions to atmosphere (non GHG)
MODU power generation
Water intake/entrainment Cooling Water Intake and Discharge
Pre-R11 MODU seawater lift and cooling discharge
5.3.3Table 5.9
Cooling water discharge to sea
Cooling Water Intake and DischargeTreated Black Water Grey Water
Pre-R12 MODU treated black water / grey water / drainage discharges
5.3.3Table 5.9
Other discharges to sea
DrainageEmissions to atmosphere (non GHG)
Support Vessels Pre-R13 Crew change operations 5.3.3Table 5.9 and 5.3.4 Noise Support Vessels
Ballast Water Treated Black Water Grey Water
Other discharges to sea
DrainageSeabed Disturbance Seabed Disturbance
MODU Power Generation
Pre-R14 MODU removal 5.3.2.2
Emissions to atmosphere (non GHG) Support Vessels
Pre-R15 Waste management 5.3.4.3 Waste generation Waste generation

Emissions to Atmosphere (non GHG) Marine Environment

Marine Environment


APPENDIX 10A
Construction, Installation and HUC Activities and Events


AIOC Chirag Oil Project Environmental & Socio-Economic Impact Assessment
Appendix 10A
February 2010 10A/1 Final
ACTIVITY/INTERACTIONSID(R=Routine, NR= Non-Routine)
Activity Scoped In/Out Reference Event Event Category
Con Onshore Construction Emissions to atmosphere (non GHG) Construction Yard Emission Sources
Onshore Noise Construction Yard Plant
Non-Hazardous Waste Onshore discharges
Hazardous Waste
Con-NR1 Potential yard upgrades /expansion
5.4.2
Spills Spills
Emissions to atmosphere (non GHG) Construction Yard Emission Sources
Onshore Noise Onshore Noise
Non-Hazardous Waste Onshore discharges
Hazardous Waste
Con-R2 STB01, PLBG and DBA upgrade works
5.4.2
Spills Spills
Construction Yard Emission Sources Emissions to atmosphere (non GHG)
Onshore Platform Generator Commissioning
Construction Yard Plant
Con R3 Use of yard plant (generators and engines) during jacket, topside and drilling module fabrication and topside commissioning
5.4.4 – 5.4.7 & 5.4.9
Onshore noise
Onshore Platform Commissioning
Con-R4 Use of yard cooling water system during onshore topside commissioning
5.4.8.1 Cooling water discharges to sea Construction Yard Cooling Water Discharge
Emissions to atmosphere (non GHG) Onshore Platform Generator CommissioningCon-R5 Commissioning of main platform generators and topside utilities
5.4.8
Onshore noise Onshore Platform Commissioning
Treated Black Water Con-R6 Construction yard utilities (drainage/ sewage)
5.4.10.2 Other Discharges
Drainage
Pip Pipeline Installation, Tie in and Commissioning
Emissions to atmosphere (non GHG) Jacket and Pipeline Installation Vessels
Treated Black Water
Grey Water
Other discharges to sea
Drainage
Pip-R1 Vessel operations – pipelay barge, anchor handling vessels and pipe supply barge
5.5.2
Underwater noise and vibration Underwater noise and vibration (Vessels)
Pip-R2 Installing new oil pipeline wye and infield pipelines on seabed
5.5.2 & 5.5.4
Seabed disturbance - benthos Seabed Disturbance
Pip-R3 Installing concrete mats in areas of soft sediment /free spans
5.5.2. Seabed disturbance - benthos Seabed Disturbance
Hydrotest discharges to sea Pipeline Cleaning and Hydrotest Discharge Pip-R4 Infield pipeline cleaning, hydrotesting and dewatering
5.5.2, 5.5.5 & 5.5.6 Other discharges to sea Oil line wye spool water
Ins Platform Installation
Underwater noise and vibration Underwater noise and vibration (Vessels)
Emissions to atmosphere (non GHG) Jacket and Pipeline Installation Vessels
Treated Black Water
Grey Water
Ins-R1 Jacket installation vessel operations - STB-01, DBA and support vessels
5.6.2
Other discharges to sea
Drainage
Seabed disturbance - benthos Seabed Disturbance
Underwater noise and vibration Underwater noise and vibration (Piling)
Ins-R2 Foundation piling and grouting for jacket
5.6.2
Cement discharge to sea Cement Discharges
Treated Black Water
Grey Water
Drainage
Ins-R3 Topside installation vessel operations - STB-01 and support vessels
5.6.3 Other discharges to sea
Ballast Water

AIOC Chirag Oil Project Environmental & Socio-Economic Impact Assessment
Appendix 10A
February 2010 10A/2 Final
ID(R=Routine, NR= Non-Routine)
Activity Scoped In/Out Reference Event Event Category
HUC Platform Hook Up and Commissioning
HUC–R1 WC-PDQ platform commissioning
5.6.4 Events associated with platform HUC are included within Chapter 11 -
HUC-R2 Installation of buy back valve system
5.6.4 Other discharges to sea -
HUC-R3 Offshore commissioning of deluge system
5.6.4 Other discharges to sea -
HUC-R4 Offshore commissioning of foam system
5.6.4 Other discharges to sea -
Treated Black Water
Grey Water
Drainage
HUC–R5 DWG-PCWU brownfield works – diving support vessels
5.6.5 Other discharges to sea
Ballast Water
Con-R8 Pip-R5Ins-R4 HUC-R6
Waste Generation 5.4.10.35.6.7.3
Waste Generation Waste Generation

Emissions to Atmosphere (non GHG)
Onshore Noise Marine Environment

Marine Environment

APPENDIX 10B
Onshore Noise Screening Assessment


Chirag Oil Project
Preliminary Noise Impact Assessment
May 2009 Final Draft
Issue No 1 49316039 /

Chirag Oil ProjectPreliminary Noise Impact Assessment
Project Title: Chirag Oil Project
Report Title: Preliminary Noise Impact Assessment
Project No: 49316039
Report Ref:
Status: Final Draft
Client Contact Name: Bill Boulton
Client Company Name: Azerbaijan International Operating Company
Issued By: URS Corporation Limited St. George's House 5 St. George's Road Wimbledon SW19 4DR
Document Production / Approval Record
Issue No: 1
Name Signature Date Position
Prepared by
Michael Craven 21st April 2009
Noise Consultant
Checked by
Peter Ward 22nd April 2009
Principal Consultant
Approved by
Anna Rouse 10th May 2009
Project Manager
Document Revision Record
Issue No Date Details of Revisions
1 18th May 2009 Original issue

Chirag Oil ProjectPreliminary Noise Impact Assessment
LIMITATION
URS Corporation Limited (URS) has prepared this Report for the sole use of Azerbaijan International Operating Company in accordance with the Agreement under which our services were performed. No other warranty, expressed or implied, is made as to the professional advice included in this Report or any other services provided by us. This Report may not be relied upon by any other party without the prior and express written agreement of URS. Unless otherwise stated in this Report, the assessments made assume that the sites and facilities will continue to be used for their current purpose without significant change. The conclusions and recommendations contained in this Report are based upon information provided by others and upon the assumption that all relevant information has been provided by those parties from whom it has been requested. Information obtained from third parties has not been independently verified by URS, unless otherwise stated in the Report.
COPYRIGHT
© This Report is the copyright of URS Corporation Limited. Any unauthorised reproduction or usage by any person other than the addressee is strictly prohibited.

Chirag Oil ProjectPreliminary Noise Impact Assessment
UNCONTROLLED WHEN PRINTED Page i
CONTENTS
Section Page No
EXECUTIVE SUMMARY............................................................................................................... 1
1. INTRODUCTION.............................................................................................................. 2
2. PLANNING AND NOISE GUIDANCE ............................................................................. 2
2.1. IFC: Environmental, Health, and Safety General Guidelines........................................... 22.2. British Standard 5228 ‘Code of Practice for noise and vibration control on
construction and open sites’ – Part 1 (2009) ................................................................... 2
3. POTENTIAL SITES ......................................................................................................... 3
4. POTENTIAL ONSITE ACITVITIES.................................................................................. 4
4.1. Upgrade Works ................................................................................................................ 44.2. Construction ..................................................................................................................... 4
5. PREDICTED NOISE LEVELS ......................................................................................... 5
5.1. Methodology..................................................................................................................... 55.2. Assumptions..................................................................................................................... 55.3. Equipment and Noise Levels ........................................................................................... 65.4. Assessment...................................................................................................................... 7
6. MITIGATION MEASURES............................................................................................. 11
7. CONCLUSIONS............................................................................................................. 12

AIOC Chirag Oil Project Environmental & Socio-Economic Impact Assessment
Appendix 10B
June 2009 10B/1 Final Draft
EXECUTIVE SUMMARY
This report has been prepared by URS Corporation Ltd (URS) on behalf of Azerbaijan International Operating Company (AIOC). The report provides a preliminary assessment of the potential noise impact of onshore construction activities associated with the Chirag Oil Project (COP).
Predictions of the potential noise levels during potential site upgrades, construction activities and commissioning of equipment have been undertaken. The predictions used reasonable worst-case assumptions regarding plant and operating times across the construction period. Predictions of the potential noise impact from the construction sites (during site upgrade, fabrication and commissioning works) at increasing distances from the source were undertaken in accordance with British Standard (BS) 5228 ‘Code of Practice for Noise and Vibration Control on Open Sites’ (2009) and compared to the relevant International Finance Corporation (IFC) Environmental, Health, and Safety General Guidelines (2007) 1.
The assessment assumed plant is well maintained and incorporates relevant acoustic covers and screens as required by industry best practice. The noise screening afforded by the buildings and perimeter fencing around each of the yards was assumed conservatively to be 5 dB(A). No account was taken for current operations at the construction yard(s).
For yard upgrade and construction activities, the modelling demonstrated that at 150 m or more from the noise source the daytime limit of 55 dB would be met and at 450 m from the noise source the night-time limit of 45 dB LAeq will be met. The commercial limit of 70 dB LAeq was met at a distance of 30 m from the source. The modelling predicted no exceedances of environmental noise standards at a distance of 450 m or more from noise sources at a construction yard.
For onshore commissioning, the modelling demonstrates that at 180 m or more from the noise source the daytime limit of 55 dB would be met and at 680 m from the noise source the night-time limit of 45 dB LAeq will be met. The commercial limit of 70 dB LAeq was found to be met at a distance of 35 m from the source. The modelling predicted no exceedances of environmental noise standards at a distance of 550 m or more from noise sources at the construction yard.
1 1 hour LAeq for 1) Residential; institutional; educational I) Daytime (07:00 – 22:00) – 55dBA ii) Nighttime (22:00 – 07:00) – 45 dBA and 2) Industrial; commercial I) Daytime (07:00 – 22:00) – 55dBA ii) Nighttime (22:00 – 07:00) – 45 dBA

AIOC Chirag Oil Project Environmental & Socio-Economic Impact Assessment
Appendix 10B
June 2009 10B/2 Final Draft
1. INTRODUCTION
This report has been prepared by URS Corporation Ltd (URS) on behalf of Azerbaijan International Operating Company (AIOC). The report provides a preliminary assessment of the potential noise impact of onshore construction activities associated with the Chirag Oil Project (COP).
Predictions of the potential noise impact from the construction sites (during site upgrade, fabrication and commissioning works) at increasing distances from the source were undertaken in accordance with British Standard (BS) 5228 ‘Code of Practice for Noise and Vibration Control on Open Sites’ and compared to the relevant International Finance Corporation (IFC) Environmental, Health, and Safety General Guidelines (2007).
2. PLANNING AND NOISE GUIDANCE
2.1. IFC: Environmental, Health, and Safety General Guidelines
The IFC: Environmental, Health, and Safety General Guidelines (2007) detail environmental noise issues and provide an indication of applicable noise limits at receptors neighbouring a potential construction site/development.
The guidance states that noise impacts should not exceed the levels presented in the table below, or result in a maximum increase in background levels of 3 dB at the nearest receptor location off-site.
Table 1 Environmental Noise Level Guidelines
One Hour LAeq (dB(A))
Receptor Daytime
07:00 - 22:00
Night-time
22:00 - 07:00
Residential; institutional; educational 55 45
Industrial; commercial 70 70
The guidance discusses mitigation measures from potentially noisy activities and provides several measures to attenuate and/or limit the acoustic impact of plant. It also discusses the potential for noise monitoring.
2.2. British Standard 5228 ‘Code of Practice for noise and vibration control on construction and open sites’ – Part 1 (2009)
BS5228 ‘Code of Practice for noise and vibration control on construction and open sites’ – Part 1 (2009) provides an industry-accepted guide for noise and vibration control and includes sound power level (SWL) data, and measured noise data at 10 m for individual

AIOC Chirag Oil Project Environmental & Socio-Economic Impact Assessment
Appendix 10B
June 2009 10B/3 Final Draft
plant as well as a calculation method for noise from construction activities. The document also provides practical information on noise reduction measures, and promotes a ‘best practicable means’ approach to control noise.
The BS5228 Parts 1 and 2 (2009) documents supersede the previous BS5228 Parts 1 to 5 (1997). This revision involves a restructuring of the standard into two parts, an update of legislative requirements and an update of information relating to methods and equipment. The update also incorporates additional equipment sound levels hitherto provided within the document ‘DEFRA - Update of Noise Database for Predictions of Noise on Construction Sites’ (2006).
3. POTENTIAL SITES
The as yet unselected construction yards where works will potentially take place are:
Baku Deepwater Jacket Factory (BDJF) Yard;
Bibi Heybet Yard;
South Dock Yard; and
Zykh Yard.
All yards are located in existing industrial areas and are operational construction yards used for previous Azeri-Chirag-Gunashli (ACG) projects. The Bibi Heybat and South Dock Yards are located closest to existing residential receptors; the nearest of which to the operational areas of the yards is approximately 500m. The BDJF yard is located furthest from established residential communities, which are approximately 4 km away.

AIOC Chirag Oil Project Environmental & Socio-Economic Impact Assessment
Appendix 10B
June 2009 10B/4 Final Draft
4. POTENTIAL ONSITE ACITVITIES
4.1. Upgrade Works
The potential construction sites may need to be upgraded prior to the construction of the topside, jacket and drilling facilities. Potential upgrade tasks include the following:
Extensions of the yard area to allow for equipment storage and fabrication;
Ground improvement work to increase the weight bearing capacity – e.g. pilling work, back filling and ground compaction; and
New or refurbishment of the existing site support facilities, sewers, electrical systems, material storage areas and waste handling facilities.
4.2. Construction
Activities associated with the fabrication of the topside, jacket and drilling facilities are likely to include the following:
Jacket and Piles – The COP jacket and twelve foundation piles will be fabricated within one or more of the proposed yards. This process will involve assembly, inspection, testing, grit blasting and painting.
Drilling Modules – The Drilling Support Module (DSM) will be constructed over a 16-month period at a selected yard. Testing, pre-commissioning and operator training of the drilling module onshore is expected to take eight months.
Topside – The COP topside will be constructed within one of the proposed yards. This will involve grit blasting, painting, and using cranes to move relevant equipment and modules. The deck frame and components will be tested with non-destructive techniques.
Activities associated with the commissioning of the main platform power generation system, incorporating the testing of three RB211 (28.5 MW) generators are planned to include the following:
Each generator running separately and intermittently over a period of a week, for up to 8 hours a day;
Three tests undertaken using two of the generators run together for an 8 hour period.
Once commissioned, the generators will be run separately and intermittently during further commissioning of:
The compression system (up to 8 hours per day over a period of up to 4 weeks); and

AIOC Chirag Oil Project Environmental & Socio-Economic Impact Assessment
Appendix 10B
June 2009 10B/5 Final Draft
Topside utilities (up to 8 hours per day over a period of up to 6 months).
It is expected that the generators will be running at approximately 26% load during the commissioning periods.
The platform pedestal cranes and the emergency generator will also be commissioned onshore. The cranes are expected to be available for approximately 4-6 months.
The majority of fabrication works (welding, shaping and grit blasting) will be undertaken within buildings.
Potential sources of ground vibration include piling. BS5228 Part 2 (2009) advises that vibration due to piling may be significance at distances of 20 m or less from the source. The nearest receptor to the sites is 30 m and is therefore not considered further.
5. PREDICTED NOISE LEVELS
5.1. Methodology
Predictions of the noise associated with the preparation of the sites (upgrade works) and the noise associated with the fabrication and commissioning of the topside, jacket and drilling facilities has been undertaken using the calculation methodology provided in BS5228 (2009). The method is based on the number and types of equipment operating, percentage-on times, their associated sound power levels, the distances to receptors, and ground conditions together with the effects of any screening.
Predictions of the noise associated with the activities detailed above have been undertaken at varying distances from the potential construction sites.
5.2. Assumptions
URS has made the following assumptions in order to undertake predictions of the noise associated with each potential site.
Table 2 Assumptions
Description Assumption
Upgrade Works During site upgrade works it is assumed that 2 large excavators, 2 large cranes, 2 rollers, 2 dozers and 2 dump trucks (a total of 10 plant) will be operating at any one time.
Construction Vehicles/Plant Operation
It is assumed that plant equipment including 2 large cranes and 8 large heavy goods vehicles (a total of 10 plant) will be moving on site at any one time This will provide most of the normal noise sources during day to day construction activities on the potential sites.
Commissioning An assessment of the worst-case noise impact due to the commissioning of the topside utilities has been undertaken. This

AIOC Chirag Oil Project Environmental & Socio-Economic Impact Assessment
Appendix 10B
June 2009 10B/6 Final Draft
Description Assumption
assumes that two RB211 (28.5MW) generators are operating simultaneously at any one time.
The generators on the topside will incorporate appropriate acoustic covers and silencers and will be housed within a plant room. This is likely to provide an approximate attenuation in noise from commissioning activities of around 15 dB.
Other activities, such as the commissioning of the compression systems, will take place during times when a single generator is operating.
Enclosures A large proportion of fabrication works (e.g. welding, shaping and grit blasting) will be undertaken within buildings. These activities have not been taken into account within the predictions, as they are unlikely to have a significant overall impact on noise levels compared with those works undertaken outside.
Shielding Hoarding surrounds the site and there are also on-site buildings and warehouses of single and multiple storey height. The hoarding and buildings are likely to provide approximately 5 dB reduction in noise emanating from the potential site.
Ground Conditions
Hard ground conditions have been assumed over all ground on and surrounding the construction site.
OperatingTimes
It is assumed that all equipment will be operating for 50% of the time unless where specified.
5.3. Equipment and Noise Levels
The following sections detail the assumed noise levels (from BS5228 (2009)) for each stage of the COP onshore construction activities.
5.3.1. Upgrade Works
Table 3 below provides operational details for the assumed plant associated with the upgrade of a potential site.
Table 3 Assumed Upgrade Works/Site Preparation Equipment Details
Equipment Number % time on SPL @ 10m dB(A) Reference
Tracked Excavator 2 50% 79 C.2-14
Roller 2 50% 73 C.2-38
Dozer 2 50% 81 C.2-12
Dump Truck 2 50% 81 C.2-33

AIOC Chirag Oil Project Environmental & Socio-Economic Impact Assessment
Appendix 10B
June 2009 10B/7 Final Draft
Equipment Number % time on SPL @ 10m dB(A) Reference
Tower Crane 2 50% 77 C.4-49
Total 10 86
5.3.2. Construction
Table 4 below provides operational details for the assumed plant associated with the construction and fabrication of topside, jacket and drilling facilities.
Table 4 Assumed Construction Equipment Details
Equipment Number % time on SPL @ 10m dB(A) Reference
Road Lorry (full) 8 50% 80 C.6-21
Tower Crane 2 50% 77 C.4-49
Total 10 87
Table 5 below provides operational details for the generator proposed to be commissioned on the selected site.
Table 5 Assumed Generator Details
Equipment Number % time on SPL @ 10m dB(A) Reference
Generator Commissioning 2 100% 93
Estimated noise level from similar
equipment
Total 2 98
5.4. Assessment
The sections below detail the predicted noise levels associated with the upgrade works and the fabrication/commissioning/construction of the topside, jacket and drilling facilities.
5.4.1. Upgrade Works
The predicted noise levels associated with the upgrade works are shown within Table 6 and Figure 1 below.

AIOC Chirag Oil Project Environmental & Socio-Economic Impact Assessment
Appendix 10B
June 2009 10B/8 Final Draft
Table 6 Predicted Noise Levels Due to Upgrade Works
1 20.0 5 0.0 2 99.0 55 44 45 54
25 -8.0 5 0.1 2 71.0 55 16 45 26
50 -14.0 5 0.1 2 65.0 55 10 45 20
100 -20.0 5 0.2 2 58.8 55 4 45 14
200 -26.0 5 0.4 2 52.6 55 -2 45 8
400 -32.0 5 0.8 2 46.2 55 -9 45 1
800 -38.1 5 1.6 2 39.4 55 -16 45 -6
1200 -41.6 5 2.4 2 35.1 55 -20 45 -10
*A negative number indicates compliance.
Figure 1 Predicted Noise Levels Due to Upgrade Works
Predicted Noise Levels - Upgrade Works
30
35
40
45
50
55
60
65
70
75
80
85
90
0 100 200 300 400 500 600 700 800 900 1000 1100 1200
Distance (m)
Predicted Noise Level
Daytime Noise Limit
Night-time Noise Limit
Industrial Noise Limit
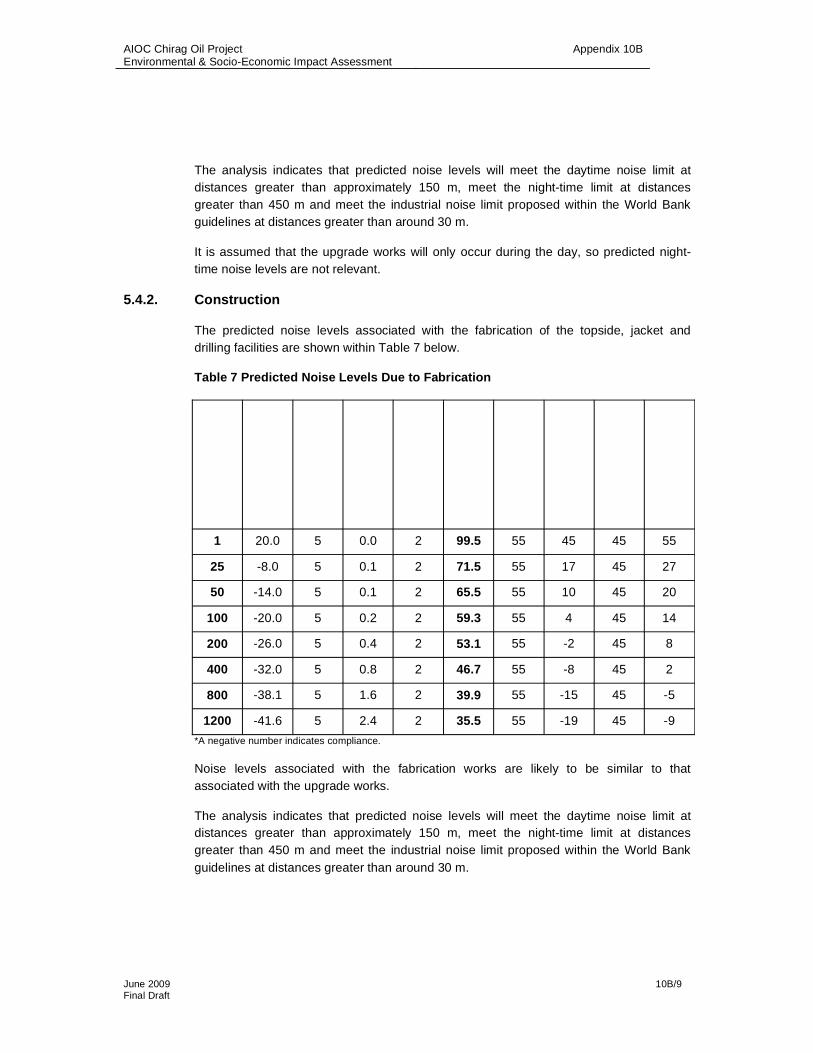
AIOC Chirag Oil Project Environmental & Socio-Economic Impact Assessment
Appendix 10B
June 2009 10B/9 Final Draft
The analysis indicates that predicted noise levels will meet the daytime noise limit at distances greater than approximately 150 m, meet the night-time limit at distances greater than 450 m and meet the industrial noise limit proposed within the World Bank guidelines at distances greater than around 30 m.
It is assumed that the upgrade works will only occur during the day, so predicted night-time noise levels are not relevant.
5.4.2. Construction
The predicted noise levels associated with the fabrication of the topside, jacket and drilling facilities are shown within Table 7 below.
Table 7 Predicted Noise Levels Due to Fabrication
1 20.0 5 0.0 2 99.5 55 45 45 55
25 -8.0 5 0.1 2 71.5 55 17 45 27
50 -14.0 5 0.1 2 65.5 55 10 45 20
100 -20.0 5 0.2 2 59.3 55 4 45 14
200 -26.0 5 0.4 2 53.1 55 -2 45 8
400 -32.0 5 0.8 2 46.7 55 -8 45 2
800 -38.1 5 1.6 2 39.9 55 -15 45 -5
1200 -41.6 5 2.4 2 35.5 55 -19 45 -9
*A negative number indicates compliance.
Noise levels associated with the fabrication works are likely to be similar to that associated with the upgrade works.
The analysis indicates that predicted noise levels will meet the daytime noise limit at distances greater than approximately 150 m, meet the night-time limit at distances greater than 450 m and meet the industrial noise limit proposed within the World Bank guidelines at distances greater than around 30 m.

AIOC Chirag Oil Project Environmental & Socio-Economic Impact Assessment
Appendix 10B
June 2009 10B/10 Final Draft
5.4.3. Commissioning
The predicted noise levels associated with the onshore generator commissioning tests are shown within Table 8 below, these include the activities predicted within Table 8 above.
It is assumed that the onshore generator commissioning tests will only occur during the day, so that the predicted night-time noise levels are not relevant.
Table 8 Predicted Noise Levels Due to Commissioning
1 20.0 15 0.0 2 100.8 55 46 45 56
25 -8.0 15 0.1 2 72.8 55 18 45 28
50 -14.0 15 0.1 2 66.7 55 12 45 22
100 -20.0 15 0.2 2 60.6 55 6 45 16
200 -26.0 15 0.4 2 54.4 55 -1 45 9
400 -32.0 15 0.8 2 47.9 55 -7 45 3
800 -38.1 15 1.6 2 41.1 55 -14 45 -4
1200 -41.6 15 2.4 2 36.8 55 -18 45 -8
*A negative number indicates compliance.

AIOC Chirag Oil Project Environmental & Socio-Economic Impact Assessment
Appendix 10B
June 2009 10B/11 Final Draft
Figure 2 Predicted Noise Levels Due to Generator Commissioning
Predicted Noise Levels - Commissioning
30
35
40
45
50
55
60
65
70
75
80
85
90
0 100 200 300 400 500 600 700 800 900 1000 1100 1200
Distance (m)
Predicted Noise Level
Daytime Noise Limit
Night-time Noise Limit
Industrial Noise Limit
The analysis indicates that predicted noise levels will meet the daytime noise limit at distances greater than approximately 180 m, meet the night-time limit at distances greater than 550 m and meet the industrial noise limit proposed within the World Bank guidelines at distances greater than around 35 m.
The modelling has been undertaken based on the worst case platform generator scenario assuming two of the three generators will be running simultaneously. During periods where only one generator is running, overall noise levels are likely to be around 2 – 3 dB lower than predicted.
6. MITIGATION MEASURES
It is considered that noise is reduced as far as practicable and necessary through the implementation of existing operational control measures including the following:
Steel works planned to be undertaken in fabrication sheds, where practicable and feasible;
Grit blasting to be undertaken in sheds or within enclosures;
Construction contractor to ensure plant/machinery is operated and maintained in accordance with manufacturer’s recommendations;

AIOC Chirag Oil Project Environmental & Socio-Economic Impact Assessment
Appendix 10B
June 2009 10B/12 Final Draft
All platform generators will be operated for minimum duration to complete commissioning;
Where practicable, equipment powered by mains electricity should be used in preference to equipment powered by internal combustion engine or locally generated electricity; and
The generators incorporate appropriate noise measures to ensure the health and safety of personnel offshore and are housed in a generator room on the topside.
For all yards except BDJF, additional mitigation will include a noise monitoring programme at the boundary of the selected construction yards and community disturbance management and engagement plans will be implemented and maintained by the construction contractor as a mechamism of communicating with the community.
7. CONCLUSIONS
URS has undertaken a preliminary assessment of the onshore noise impact associated with the potential site upgrade, construction activities and commissioning of the COP project at four potential construction sites (Baku Deepwater Jacket Factory (BDJF) Yard, Bibi Heybet Yard, South Dock Yard and Zykh Yard).
Using reasonable worst case assumptions regarding plant and operating times across the construction period, predictions of potential noise impact from the construction activities at increasing distances from source were undertaken in accordance with BS 5228 (2009) and compared to the relevant IFC Environmental Noise Level Guidelines.
For construction activities, the modelling demonstrates that at 150 m or more from the noise source the Daytime limit of 45 dB would be met and at 450 m from the noise source the Night-time limit of 55 dB LAeq will be met. The commercial limit of 70 dB LAeq was found to be met at a distance of 30 m from the source (refer to Figure 1). The modelling predicted no exceedances of environmental noise standards at a distance of 450 m or more from noise sources at the construction yard.
For commissioning activities, the modelling demonstrated that at 180 m or more from the noise source the daytime limit of 55 dB would be met and at 680 m from the noise source the nigh-time limit of 45 dB LAeq will be met. The industrial/commercial limit of 70 dB LAeq
was found to be met at a distance of 35 m from the source (refer to Figure 2). The modelling predicted no exceedances of environmental noise standards at a distance of 550 m or more from the potential construction sites.
It is considered that noise is reduced as far as practicable and necessary through the implementation o existing operational control measures.

Appendix 10C
Onshore Air Quality Screening Assessment


Onshore Atmospheric Emissions During Construction
Chirag Oil Project
May 2009 Final Draft
Issue No 1 49316039 /

Onshore Atmospheric Emissions During ConstructionChirag Oil Project
Project Title: Onshore Atmospheric Emissions During Construction
Report Title: Chirag Oil Project
Project No: 49316039
Status: Final Draft
Client Company Name: Azerbaijan International Operating Company
Issued By: URS Corporation Ltd St. George’s House 5 St. George’s Road Wimbledon SW19 4DR
Document Production / Approval Record
Issue No: 1
Name Signature Date Position
Prepared by
Matthew Mitchell 22nd April 2009
Air Quality Consultant
Checked by
Neil Titley 22nd April 2009
Principal Air Quality Consultant
Approved by
Anna Rouse 15th May 2009
Project Manager
Document Revision Record
Issue No Date Details of Revisions
1 20th May 2009 Original draft issue

Onshore Atmospheric Emissions During ConstructionChirag Oil Project
LIMITATION
URS Corporation Limited (URS) has prepared this Report for the sole use of Azerbaijan International Operating Company in accordance with the Agreement under which our services were performed. No other warranty, expressed or implied, is made as to the professional advice included in this Report or any other services provided by us. This Report may not be relied upon by any other party without the prior and express written agreement of URS. Unless otherwise stated in this Report, the assessments made assume that the sites and facilities will continue to be used for their current purpose without significant change. The conclusions and recommendations contained in this Report are based upon information provided by others and upon the assumption that all relevant information has been provided by those parties from whom it has been requested. Information obtained from third parties has not been independently verified by URS, unless otherwise stated in the Report.
COPYRIGHT
© This Report is the copyright of URS Corporation Limited. Any unauthorised reproduction or usage by any person other than the addressee is strictly prohibited.

Onshore Atmospheric Emissions During ConstructionChirag Oil Project
May 2009 i
CONTENTS
Section Page No
EXECUTIVE SUMMARY............................................................................................................... 1
1. INTRODUCTION.............................................................................................................. 2
2. AIR QUALITY STANDARDS........................................................................................... 2
3. STUDY SPECIES............................................................................................................. 3
4. BASELINE CONDITIONS ............................................................................................... 3
5. ASSESSMENT METHODOLOGY................................................................................... 4
5.1. Overview of the Construction Yards................................................................................. 45.2. Methodology..................................................................................................................... 45.3. Meteorological Conditions................................................................................................ 5
6. POTENTIAL IMPACTS.................................................................................................... 6
6.1. Power Generation Emissions........................................................................................... 66.2. Construction Plant Emissions .......................................................................................... 9
7. CONCLUSIONS............................................................................................................. 11
8. MODEL SUITABILITY AND VERIFICATION................................................................ 11
9. REFERENCES............................................................................................................... 12

Onshore Atmospheric Emissions During ConstructionChirag Oil Project
May 2009 1
EXECUTIVE SUMMARY
This report has been prepared by URS Corporation Ltd (URS) on behalf of Azerbaijan International Operating Company (AIOC) to predict the potential atmospheric impacts from onshore construction yard operations associated with the Chirag Oil Project (COP).
It is anticipated that the key emissions to air during onshore construction/commissioning activities will be associated with:
Short term, peak emissions from power generation associated with onshore commissioning of the topside platform; and
Long term, typical emissions associated with construction/commissioning equipment and vehicles (vehicle exhaust emissions).
Based on an initial screening exercise, exhaust emissions from power generation and construction plant are unlikely to cause any significant impacts on local air quality, with concentrations easily complying with the relevant ambient air quality limits. Short term, peak emissions are not expected to exceed 25% of the ambient air quality standards, whilst the average impact on ground level concentrations over the period of a year is expected to result in an increase in the order of only 10% (with ambient concentrations predicted to remain at, or below approximately 50% of the limit).
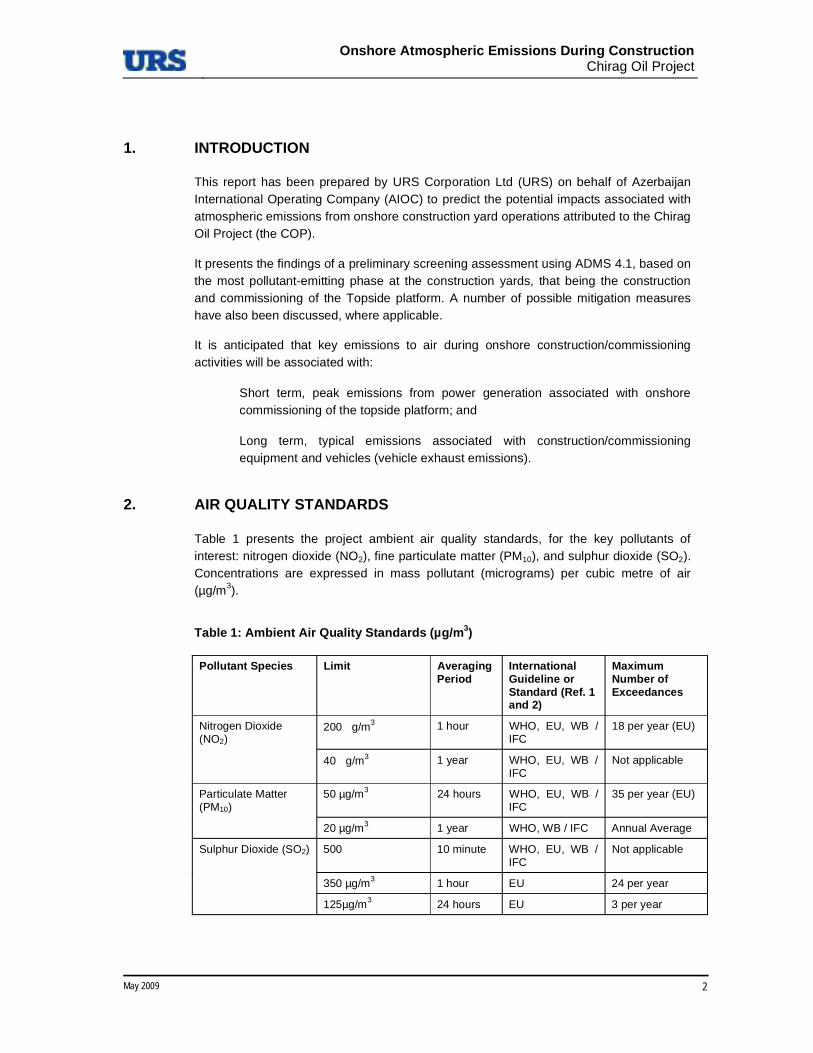
Onshore Atmospheric Emissions During ConstructionChirag Oil Project
May 2009 2
1. INTRODUCTION
This report has been prepared by URS Corporation Ltd (URS) on behalf of Azerbaijan International Operating Company (AIOC) to predict the potential impacts associated with atmospheric emissions from onshore construction yard operations attributed to the Chirag Oil Project (the COP).
It presents the findings of a preliminary screening assessment using ADMS 4.1, based on the most pollutant-emitting phase at the construction yards, that being the construction and commissioning of the Topside platform. A number of possible mitigation measures have also been discussed, where applicable.
It is anticipated that key emissions to air during onshore construction/commissioning activities will be associated with:
Short term, peak emissions from power generation associated with onshore commissioning of the topside platform; and
Long term, typical emissions associated with construction/commissioning equipment and vehicles (vehicle exhaust emissions).
2. AIR QUALITY STANDARDS
Table 1 presents the project ambient air quality standards, for the key pollutants of interest: nitrogen dioxide (NO2), fine particulate matter (PM10), and sulphur dioxide (SO2). Concentrations are expressed in mass pollutant (micrograms) per cubic metre of air (µg/m3).
Table 1: Ambient Air Quality Standards (µg/m3)
Pollutant Species Limit Averaging Period
InternationalGuideline or Standard (Ref. 1 and 2)
MaximumNumber of Exceedances
200 g/m3 1 hour WHO, EU, WB / IFC
18 per year (EU) Nitrogen Dioxide (NO2)
40 g/m3 1 year WHO, EU, WB / IFC
Not applicable
50 µg/m3 24 hours WHO, EU, WB / IFC
35 per year (EU) Particulate Matter (PM10)
20 µg/m3 1 year WHO, WB / IFC Annual Average
500 10 minute WHO, EU, WB / IFC
Not applicable
350 µg/m3 1 hour EU 24 per year
Sulphur Dioxide (SO2)
125µg/m3 24 hours EU 3 per year

Onshore Atmospheric Emissions During ConstructionChirag Oil Project
May 2009 3
3. STUDY SPECIES
Oxides of Nitrogen (NOX) predominately comprise nitric oxide (NO) and nitrogen dioxide (NO2). NO is mainly derived from fossil fuel combustion, and although not considered to be harmful to health, once released to the atmosphere it is usually very rapidly oxidised into NO2, which can irritate the lungs and lower resistance to respiratory infections such as influenza.
SO2 is produced during the combustion of fuels with high sulphur content, principally, through coal and heavy oils associated with the energy production and manufacturing processes. It is a respiratory irritant, and even moderate local concentrations may impair lung function in asthmatics. Typical sulphur content in Azerbaijan diesel fuel is considered to be 0.03% as such sulphur emissions are not considered to be high enough to warrant plausible detection levels and have therefore been screened out of further assessment.
Fine particles are composed of a wide range of materials arising from a variety of sources, including combustion (mainly road traffic) and the suspension of soils and dusts from construction work, for example. Particles are measured in a number of different size fractions according to their mean aerodynamic diameter. Most monitoring is currently focussed on PM10, which has an aerodynamic diameter of 10 microns or less. PM10 can be carried deep into the lungs where they can cause inflammation and a worsening of the condition of people with heart and lung disease. Particulate matter from combustion processes is typically. Modelling of particulates was not deemed necessary as concentrations are expected to be very low based on efficient plant operation, regular maintenance and planned use of good quality, diesel. Emissions of PM10 are on average 4-10 times lower that that of NO2, based on this PM10 has been screened out of further assessment.
Nuisance dust (particles up to 75 micrometers in diameter) has also been considered in a qualitative context. Dust particles are dispersed by their suspension and entrainment in airflow, with dispersal affected by the size of the particles emitted, wind speeds as well as their shaper and density. Large dust particles (greater than 30 µm) typically deposit within 100 metres (m) of a fugitive dust source. Intermediate particles (10-30 µm) are more likely to travel to up to 200-500 m.
The potential for dust generation associated with yard upgrades have been scoped out of the assessment. The construction yards and roads are hard standing, with little or no earth moving activities anticipated. It is therefore expected that dust emissions will be negligible, particularly given the nature of the dry, dusty surroundings.
4. BASELINE CONDITIONS
Ambient concentrations have been determined using the ‘BP AzSPU Integrated Environmental Monitoring Programme: Annual Summary Report for 2007’, which is summarised in Chapter 6: Environmental Description (Ref. 3). The monitoring data suggests that ambient NOX concentrations range between 5-15 µg/m3 in the Sangachal area.

Onshore Atmospheric Emissions During ConstructionChirag Oil Project
May 2009 4
The upper end of the monitoring results have been applied to this study, and assuming 100% conversion of NOX to NO2, yields existing ambient concentrations for NO2 of 15 µg/m3. This easily complies with the relevant ambient air quality project standards.
5. ASSESSMENT METHODOLOGY
5.1. Overview of the Construction Yards
The, as yet unselected, construction yard(s) where works will potentially take place include;
The BDJF Yard,
The Bibi Heybat Yard,
The South Dock Yard, and
The Zykh yard.
5.2. Methodology
This section presents the methodology used for the assessment of the potential impacts to air quality associated with the construction yard activities.
A screening assessment of emissions associated with: (i) worst case short term peak emissions from onshore commissioning associated with the main platform generators, and (ii) typical long term emissions from construction/commissioning plant exhaust emissions, has been undertaken using the UK point source dispersion model ADMS (version 4.1).
5.2.1. Generator Emissions
A generic dispersal model was set up based on a worst-case scenario during the construction and commissioning of the Topside platform (i.e. the activity considered to create highest air emissions).
The three platform generators will be utilised during the topside commissioning phase, run separately and intermittently over a 12 week period. In addition, synchronisation tests will be undertaken over a 24 hour period whereby two generators will be run at a load of approx 26% each using 8 tonnes of diesel per hour each.
Table 2 presents the modelled parameters for a single generator, based on measured data from existing plant associated with ACG operations.

Onshore Atmospheric Emissions During ConstructionChirag Oil Project
May 2009 5
Table 2: Model Parameters for each Power Generator
Parameter Value (per generator)
NOX emission per generator 10.3 g/s
Anticipated Release Height 22 m
Anticipated Stack Diameter 1.1 m
Anticipated Stack Velocity 62 m/s
Anticipated Release Temperature 719 Deg C
NOX Concentrations in exhaust flow 660 mg/Nm3
It has been assumed that 100% of NOX will convert to NO2 when calculating long-term averages, and 50% for the 1-hour averaging period (Ref. 4).
5.2.2. Construction Plant Vehicles and Equipment
Emissions will also be associated with commissioning/construction plant vehicles on site. In the absence of any project data, it has been assumed that the equivalent of 20 heavy equipment will be operating simultaneously at any one time on site and are evenly distributed across a 9 ha construction yard (approximately 300x300m). This is based on an estimated diesel usage of 8.5 tonnes per month by construction equipment.
Using CORINAIR Inventory, (Ref. 5), an emission rate of 2.25 grams per second (g/s) NOX was obtained, and subsequently modelled as an area source using ADMS 4.1 as approximately 0.000025 grams per second per square metre (g/s/m2) of NOX.
5.3. Meteorological Conditions
Local meteorological conditions strongly influence the dispersion of pollutants. Analysis of the annual wind rose for the Sangachal area demonstrates that the proposed construction sites are subject to predominant northwesterly winds, with secondary southerly/southeasterly winds (Figure 1).

Onshore Atmospheric Emissions During ConstructionChirag Oil Project
May 2009 6
Figure 1: Annual wind rose for the Sangachal area (data from Baku airport, 1999-2001)
The ADMS model was run for a single 1-hour period, based on a wind bearing from 180° (to represent a southerly wind). It was not deemed necessary to analyse the effect of northwesterly winds, which would cause emissions to blow from land to sea (where no sensitive receptors are known to exist).
Model runs were undertaken with varying wind speeds of 1, 5 and 15 meters per second (m/s) to represent low, average and high wind speeds respectively, and with corresponding boundary layer heights at 200 m, 800 m and 800 m. This was assumed to represent stable, moderate, and unstable atmospheric conditions in order to identify the potential impacts associated with a range of meteorological conditions.
6. POTENTIAL IMPACTS
This section presents the findings of the screening assessment emissions.
6.1. Power Generation Emissions
As mentioned above, two reasonable worst-case meteorological conditions have been modelled, as well as a more average scenario, as follows:
Wind speed of 15 m/s and boundary layer height of 800 m (i.e. unstable conditions); and
Wind speed of 1 m/s and boundary layer of 200 m (i.e. stable conditions).
Wind speed conditions of 5 m/s and boundary layer of 800 m, average conditions

Onshore Atmospheric Emissions During ConstructionChirag Oil Project
May 2009 7
All scenarios are modelled for a short term 1 hour concentration for comparison against the short term objective of 200µg/m3.
Figure 2 presents the model results for the ground level NOX process contribution under the high wind speed scenario (15 m/s) and unstable meteorological conditions. The maximum ground level process contribution is predicted to be between 30-40 µg/m3,located approximately 500 m to 1.5 km from the emission source. Assuming that 50% of short term NOX is converted into NO2, as discussed above, emissions from the generators are predicted to lead to a maximum increase in 1 hour ground level NO2
concentration of 15-20 µg/m3.
Figure 3 presents the model results for the low wind speed scenario (1 m/s) and stable meteorological conditions. The maximum ground level NOX process contribution in this case is predicted to be 2-3 µg/m3, located approximately 4-6 km away from the emission source. Again, assuming that 50% of short term NOX is converted into NO2, emissions from the generators are predicted to lead to a maximum increase in mean 1 hour level NO2 concentration of 1-1.5 µg/m3.
Figure 4 presents the model results for the average wind speed scenario (5 m/s). The maximum ground level NOX process contribution in this case is predicted to be 20-30 µg/m3, located approximately 500m to 1.5 km away from the emission source. Again, assuming that 50% of short term NOX is converted into NO2, emissions from the generators are predicted to lead to a maximum increase in mean 1 hour level NO2
concentration of 10-15 µg/m3.
Figure 2: Ground Level 1-hour NOX Process Contribution in 15 m/s winds

Onshore Atmospheric Emissions During ConstructionChirag Oil Project
May 2009 8
Figure 3: Ground Level 1-hour NOX process contribution in 1 m/s winds
Figure 4: Ground Level 1-hour NOX process contribution in 5 m/s winds

Onshore Atmospheric Emissions During ConstructionChirag Oil Project
May 2009 9
The worst-case 1-hour NO2 process contribution (occurring under unstable conditions) is therefore expected to increase background concentrations by 30-40 µg/m3, from 15 µg/m3
to 55 µg/m3, which represents approximately 25% of the short-term ambient NO2 limit (of 200 µg/m3).
6.2. Construction Plant Emissions
Construction emissions are predicted to generate a maximum short term ground level NOX contribution of 6 µg/m3 extending up to a distance of 200 m away from the emission source, reducing to 3 µg/m3 at 250 m and returning to background concentrations at over 400 m, under high wind speeds and unstable meteorological conditions (15 m/s) (Figure 5).
Under low wind speed and stable conditions (1 m/s) (Figure 6) there is predicted to be no noticeable increase in NOX concentrations beyond a distance of 200 m from the centre of the construction site.
Typical wind speeds conditions (5 m/s) (Figure 7) are predicted to result in an increase of NOX concentrations of approximately 6 µg/m3 up to 30 m from the centre of the site, reducing to background concentrations at a distance over 200 m.
To convert this average wind speed short term emission input into an annual average (long term) concentration it is assumed that 100% of NOX is converted to NO2, southern winds occur 50% of the time, and construction activities would only occur for a maximum of 50% of the year. Following this, construction equipment is predicted to lead to a maximum increase in NOX concentrations of 1.5 µg/m3, and less than 1 µg/m3 over 200m away from the site boundary. This leads to a 10% increase in baseline NOX, from 15 µg/m3 to 16.5 µg/m3, still easily complying with the mean annual ambient air limit of 40 µg/m3.

Onshore Atmospheric Emissions During ConstructionChirag Oil Project
May 2009 10
Figure 5: Ground Level 1-hour NOX Process Contribution from onsite plant in 15 m/s winds
Figure 6: Ground Level 1-hour NOX Process Contribution from onsite plant in 1 m/s winds

Onshore Atmospheric Emissions During ConstructionChirag Oil Project
May 2009 11
Figure 7: Ground Level short term NOX Process Contribution from onsite plant considering average winds (5 m/s)
7. CONCLUSIONS
Based on an initial screening exercise, exhaust emissions from power generation during topside commissioning and construction plant emissions are unlikely to cause any significant impacts on local air quality.
Short term, peak emissions are not expected to exceed 25% of the ambient air quality standards, whilst the average impact on ground level concentrations over the period of a year is expected to result in an increase in the order of only 10% (with ambient concentrations predicted to remain at, or below approximately 50% of the limit).
8. MODEL SUITABILITY AND VERIFICATION
ADMS 4 version 4.1, developed by Cambridge Environmental Research Consultants Ltd (CERC) was selected as a viable system for the modelling of generator thermal plumes, because of its superior dispersion model and plume rise methodology. ADMS 4 is a short range dispersal model using two main parameters; boundary layer height and Monin-Obukhov length to describe atmospheric boundary layer and a skewed Gaussian concentration distribution to calculate dispersal under convective conditions. The model is typically applied for distances up to 60km downwind of the source though is useful for up to 100km.

Onshore Atmospheric Emissions During ConstructionChirag Oil Project
May 2009 12
Many regulatory authorities explicitly endorse or accept the use of ADMS4. In the UK the Environment Agency does not formally “approve” any model (the UK Government's open policy). However ADMS 4 is used routinely used in applications to the Environment Agencies in the UK and accepted by them; its development was also supported by the Environment Agencies in UK. The three Environment Agencies: Environment Agency of England and Wales, Scottish Environmental Protection Agency and the Department of the Environment in Northern Ireland, are all users of ADMS 4. ADMS 4 is also used routinely as a key model on behalf of DEFRA the government department for the environment.
ADMS 4 is on the US EPA’s Appendix W list of alternative models. ADMS models accepted for all types of environmental impact assessment in China. ADMS models are used by city or regional government and others in France, Italy, the Netherlands, Ireland, the Baltic States, South Africa, Hungary and Thailand and was used by the California Department of Health. The models are also used in Spain, Portugal, Sweden, Cyprus, Austria, United Arab Emirates, Sudan, Saudi Arabia, Tunisia, Slovenia, Poland, New Zealand, Korea, Japan, India, Canada and Australia
9. REFERENCES
Ref. 1. European Commission and the European parliament (1996); The Air Quality Framework Directive (96/62/EC) on ambient air quality assessment and management.
Ref 2. World Health Organization (2005) Air Quality Guidelines.
Ref 3. ESIA COP Chapter 6 Environmental Description.
Ref 4. Environment Agency Air Quality Modelling and Assessment Unit http://www.environment-agency.gov.uk/commondata/acrobat/ noxno2conv2005_1233043.pdf.
Ref 5. European Environment Agency (2007); EMEP/CORINAIR Emissions Inventory Guidebook 2007, http://reports.eea.europa.eu/EMEPCORINAIR5/en/B111vs3.1.pdf, table 24.

APPENDIX 10D
Pipeline Hydrotest Discharge Modelling


Chirag Oil Project Pipeline Hydrotest Water Discharge Modelling
For BP

BMT Fluid Mechanics Limited COMMERCIAL-IN-CONFIDENCE
Chirag Oil ProjectPipeline Hydrotest Water Discharge Modelling 4 of 46 Appendix 10D - Eng FINAL
Report Title Chirag Oil Project
Pipeline Hydrotest Water
Discharge Modelling
Client: BP
Document No: 46217 Report01v2 Release: 2 Copy No:
Status Final Report
Report Date: 04 June 2009
Holds:
Name: Signature: Date:
Prepared by: J. Mindel 04/06/2009
Checked by: A. Lebas 04/06/2009
Approved by: C. Craddock 04/06/2009
Distribution: BP
Previous Release History:
Release No: Status: Date:
46217 Report01v1 1 Draft Report for internal review 04/06/2009
BMT Fluid Mechanics Limited commercial reports may not be published, except in full, unless permission for an approved abstract has previously been obtained from the company.
This report is supplied for the purposes of the client only, and in the expectation that no other person will use or rely upon the results therein. No responsibility to any other person is accepted by the company.

BMT Fluid Mechanics Limited COMMERCIAL-IN-CONFIDENCE
Chirag Oil ProjectPipeline Hydrotest Water Discharge Modelling 5 of 46 Appendix 10D - Eng FINAL
EXECUTIVE SUMMARY A Computational Fluid Dynamics (CFD) study was carried out by BMT Fluid Mechanics (BMT) to assess the dispersion of hydrotest water discharges from interfield pipelines in the Chirag Oil Project (COP) in Azerbaijan. The study was carried out for BP.
A total of 28 hydrotest water discharge scenarios were considered in the analysis, representing three different release depths:
o from a vessel (at sea surface)
o from a caisson (located at a depth of 50m)
o from the seabed (at a depth of 130m)
A range of port diameters and discharge volumes were assessed for each depth.
Discharges from the vessel and the caisson were directed downwards while releases from seabed were directed upwards.
Two current speeds (i.e. near-stagnant and predominant) were modelled for each depth. Two seawater ambient temperatures (summer and winter conditions) were considered for the discharges from the vessel and from the caisson, while only one seawater temperature (winter condition) was modelled for the discharges from the seabed.
A discharge temperature of 7ºC was assumed for all seabed and caisson discharges, while the vessel discharges were of 25 ºC in summer and 7ºC in winter.
For the vessel discharge scenarios, the maximum distance reached by the discharge plume (for a dilution of 1:3000) occurred for the largest summer near-stagnant current discharge (Scenario 6), where the plume reached a distance of 2,068 m.
For the caisson discharge scenarios, the maximum height reached by the discharge plume (for a dilution of 1:3000) occurred for the summer predominant current discharge (Scenario 20), where the plume reached a depth of -38 m. The maximum distance reached by the discharge plume (for a dilution of 1:3000) occurred for the winter near-stagnant current discharge (Scenario 17), where the plume reached a distance of 5,765 m.
For the seabed discharge scenarios, the maximum height reached by the discharge plume (for a dilution of 1:3000) occurred for the winter near-stagnant current discharge (Scenario 27), where the plume reached a depth of -44 m. The maximum distance reached by the discharge plume (for a dilution of 1:3000) occurred for the winter near-stagnant current discharge (Scenario 27), where the plume reached a distance of 40,462 m. Note that the maximum distance travelled by the plume is not representative of the actual plume length. This is further emphasized for near-stagnant scenarios where the slow current allows the creation of a persistent plume subjected mainly to dispersive effects.
The cases investigated in this analysis involve constant current conditions, which constitute a “worst-case” scenario. The presence of fluctuating directions and speeds of the currents would cause the plumes to dissipate earlier.

BMT Fluid Mechanics Limited COMMERCIAL-IN-CONFIDENCE
Chirag Oil ProjectPipeline Hydrotest Water Discharge Modelling 6 of 46 Appendix 10D - Eng FINAL
Plume persistence for a dilution of 1:3000 was observed to be of a maximum of 60 hours for vessel discharges (Scenario 6), 162 hours for the caisson discharges (Scenario 17), and 1,130 hours (~47 days) for the seabed discharges (Scenario 27).
As with the plume lengths and distances covered, plume persistence is a worst-case scenario, and each discharge has a relevant range of concentrations to consider. In this analysis, and for discharges of more than 1200 m3 (i.e. Scenarios 21, 22, 27, and 28) only the 300-fold concentration values are relevant. This is due to the fact that Hydrotest water will have degraded considerably for the larger discharges before they take place. Additionally, due to the chemical nature of the Hydrotest Water, it is reasonable to expect that it will have degraded in 7 days.

BMT Fluid Mechanics Limited COMMERCIAL-IN-CONFIDENCE
Chirag Oil ProjectPipeline Hydrotest Water Discharge Modelling 7 of 46 Appendix 10D - Eng FINAL
Chirag Oil Project Pipeline Hydrotest Water Discharge Modelling
Contents
1. Introduction ........................................................................................................ 8
1.1. General ...................................................................................................... 8
1.2. Report Structure.......................................................................................... 8
1.3. Definitions of Abbreviations and Acronyms..................................................... 8
2. Objectives ........................................................................................................... 9
3. Scope of Work ....................................................................................................10
3.1. Model Construction.....................................................................................10
3.2. Dispersion Analysis .....................................................................................10
3.3. Reporting...................................................................................................10
4. CFD Analysis.......................................................................................................11
4.1. Introduction...............................................................................................11
4.2. Ambient Conditions.....................................................................................11
4.3. Current Conditions......................................................................................11
4.4. Chemical Concentration Limits .....................................................................11
4.5. Assessment Scenarios .................................................................................11
4.6. Results ......................................................................................................12
5. Conclusions ........................................................................................................13
6. References .........................................................................................................14
7. Tables................................................................................................................15
8. Figures...............................................................................................................21
APPENDIX A. CFD Model .........................................................................................43

BMT Fluid Mechanics Limited COMMERCIAL-IN-CONFIDENCE
Chirag Oil ProjectPipeline Hydrotest Water Discharge Modelling 8 of 46 Appendix 10D - Eng FINAL
Chirag Oil Project Pipeline Hydrotest Water Discharge Modelling
1. Introduction
1.1. General
This report presents results of a Computational Fluid Dynamics (CFD) study carried out by BMT Fluid Mechanics (BMT) to assess the dispersion of hydrotest water discharges from interfield pipelines in the Chirag Oil Project (COP) in Azerbaijan. The scope of work is based on requirement outlined in “Chirag Oil Project: scope of work for dispersion modelling of discharges of hydrotest water from interfield pipelines” issued to BMT by BP on the 2nd of February 2009.
The Chirag Oil Project has prepared a comprehensive schedule of hydrotest water discharges, which will occur during the installation, tie-in and testing of interfield gas, oil, injection water and produced water pipelines. In order to assess the potential environmental impact of these discharges, it is necessary to model the dispersion and fate of the hydrotest water fluids.
1.2. Report Structure
Sections 2 and 3 of this report describe the main objectives of the study and the scope of work agreed to meet those objectives. Results of the hydrotest water dispersion analysis are given in section 4. Details of the modelling and supporting information are given in Appendix A.
1.3. Definitions of Abbreviations and Acronyms
Term / Acronym /
Abbreviation Explanation / Definition
BMT BMT Fluid Mechanics Limited CAD Computer Aided Drawing cc Cubic centimetre
CFD Computational Fluid Dynamics ppb Parts Per Billion by volume

BMT Fluid Mechanics Limited COMMERCIAL-IN-CONFIDENCE
Chirag Oil ProjectPipeline Hydrotest Water Discharge Modelling 9 of 46 Appendix 10D - Eng FINAL
2. Objectives
The main objectives of the CFD hydrotest water dispersion analysis were as follows:
Model dispersion and fate of hydrotest water fluid
Assess persistence and distance travelled by discharge plume
Determine concentrations of discharged fluid within plume
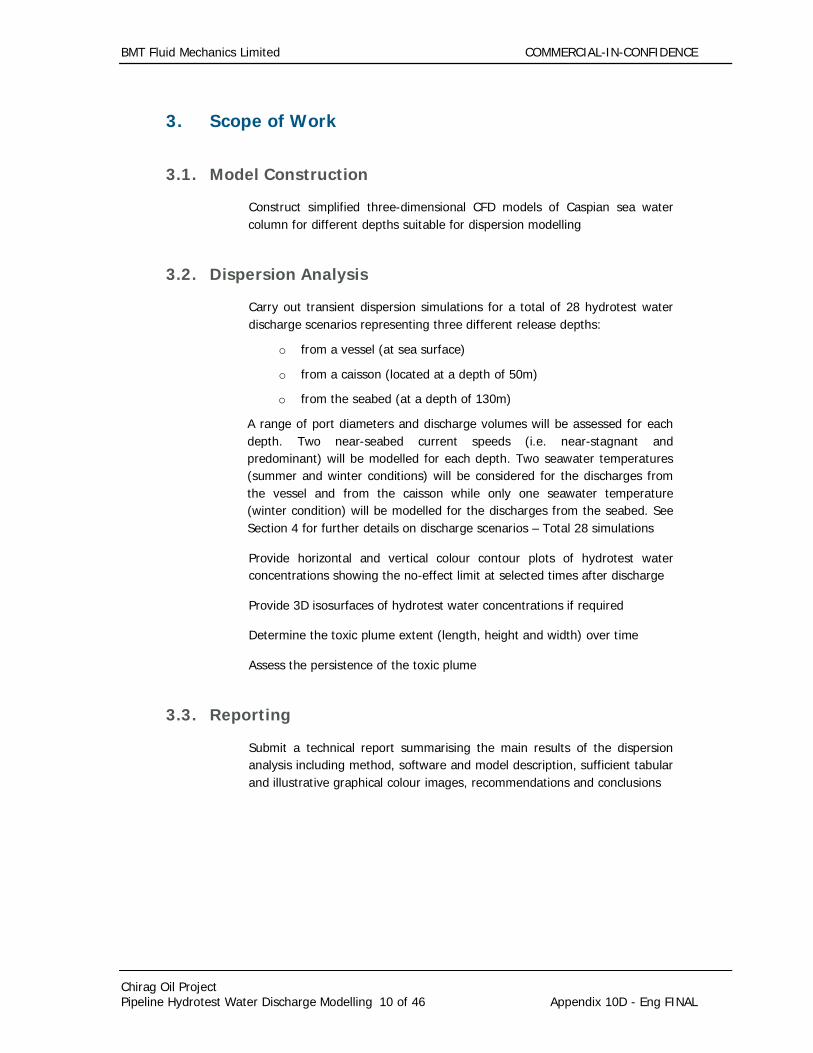
BMT Fluid Mechanics Limited COMMERCIAL-IN-CONFIDENCE
Chirag Oil ProjectPipeline Hydrotest Water Discharge Modelling 10 of 46 Appendix 10D - Eng FINAL
3. Scope of Work
3.1. Model Construction
Construct simplified three-dimensional CFD models of Caspian sea water column for different depths suitable for dispersion modelling
3.2. Dispersion Analysis
Carry out transient dispersion simulations for a total of 28 hydrotest water discharge scenarios representing three different release depths:
o from a vessel (at sea surface)
o from a caisson (located at a depth of 50m)
o from the seabed (at a depth of 130m)
A range of port diameters and discharge volumes will be assessed for each depth. Two near-seabed current speeds (i.e. near-stagnant and predominant) will be modelled for each depth. Two seawater temperatures (summer and winter conditions) will be considered for the discharges from the vessel and from the caisson while only one seawater temperature (winter condition) will be modelled for the discharges from the seabed. See Section 4 for further details on discharge scenarios – Total 28 simulations
Provide horizontal and vertical colour contour plots of hydrotest water concentrations showing the no-effect limit at selected times after discharge
Provide 3D isosurfaces of hydrotest water concentrations if required
Determine the toxic plume extent (length, height and width) over time
Assess the persistence of the toxic plume
3.3. Reporting
Submit a technical report summarising the main results of the dispersion analysis including method, software and model description, sufficient tabular and illustrative graphical colour images, recommendations and conclusions

BMT Fluid Mechanics Limited COMMERCIAL-IN-CONFIDENCE
Chirag Oil ProjectPipeline Hydrotest Water Discharge Modelling 11 of 46 Appendix 10D - Eng FINAL
4. CFD Analysis
4.1. Introduction
This section presents the results of the hydrotest water dispersion analysis carried out to determine the persistence and distance travelled by the discharge plumes for a range of subsea ambient, current conditions and discharge scenarios.
The CFD model and methodology is described in APPENDIX A.
4.2. Ambient Conditions
Two seasonal options were assessed and compared in the analysis:
Summer condition: in this case, a vertical seawater temperature profile was obtained from [1]. The thermal profile’s prime characteristic is a sudden increase from 9 ºC to 24 ºC in the range of 30 m to 50 m depth. Details of the thermal profile used are shown in Figure 4.1
Winter condition: in this case, a constant seawater temperature of 7 ºC was obtained from [1] (i.e. no thermocline)
4.3. Current Conditions
For each ambient condition, two current conditions were assessed in the analysis:
Near-stagnant flow: constant horizontal current flow velocity of 0.01 m/s
Predominant flow: annual average current data obtained from [2], leading to a uniform constant value of 0.11 m/s
4.4. Chemical Concentration Limits
The hydrotest water discharges will comprise chemically treated Caspian seawater. The chemical dose levels will total less than 500ppm and therefore the discharges were considered to have the same density and physical properties as Caspian seawater. The relevant degree of dilution assessed lies in the range of 1:300 to 1:3000.
4.5. Assessment Scenarios
A total of 28 hydrotest water discharge scenarios were considered in the analysis, representing three different release depths:
o from a vessel (at sea surface)
o from a caisson (located at a depth of 50m)
o from the seabed (at a depth of 130m)

BMT Fluid Mechanics Limited COMMERCIAL-IN-CONFIDENCE
Chirag Oil ProjectPipeline Hydrotest Water Discharge Modelling 12 of 46 Appendix 10D - Eng FINAL
A range of port diameters and discharge volumes were assessed for each depth.
Discharges from the vessel and the caisson were directed downwards while releases from seabed were directed upwards.
Two current speeds (i.e. near-stagnant and predominant) were modelled for each depth. Two seawater ambient temperatures (summer and winter conditions) were considered for the discharges from the vessel and from the caisson, while only one seawater temperature (winter condition) was modelled for the discharges from the seabed.
A discharge temperature of 7ºC was assumed for all seabed and caisson discharges, while the vessel discharges were of 25 ºC in summer and 7ºC in winter.
The hydrotest dispersion scenarios investigated in the analysis are summarised in Table 4.1.
4.6. Results
4.6.1. Discharge Plume Dimensions
Table 4.2 to Table 4.5 presents the discharge plume dimensions measured at relevant degrees of dilution (300-fold, 840-fold, 1380-fold, 1920-fold, 2460-fold, and 3000-fold). The corresponding volume time histories are shown in Figure 4.2.
4.6.2. Discharge Plume Persistence
Table 4.6 presents the persistence time (in hours) of the plumes at each concentration of interest for all scenarios investigated.
4.6.3. Discharge Plume Visualisations
Figure 4.3 depicts the vertical centreline contour plots of the plume concentrations of interest, while Figure 4.4 shows a plan view of the same contours, for each of the scenarios investigated.

BMT Fluid Mechanics Limited COMMERCIAL-IN-CONFIDENCE
Chirag Oil ProjectPipeline Hydrotest Water Discharge Modelling 13 of 46 Appendix 10D - Eng FINAL
5. Conclusions
For the vessel discharge scenarios, the maximum distance reached by the discharge plume (for a dilution of 1:3000) occurred for the largest summer near-stagnant current discharge (Scenario 6), where the plume reached a distance of 2,068 m.
For the caisson discharge scenarios, the maximum height reached by the discharge plume (for a dilution of 1:3000) occurred for the summer predominant current discharge (Scenario 20), where the plume reached a depth of -38 m. The maximum distance reached by the discharge plume (for a dilution of 1:3000) occurred for the winter near-stagnant current discharge (Scenario 17), where the plume reached a distance of 5,765 m.
For the seabed discharge scenarios, the maximum height reached by the discharge plume (for a dilution of 1:3000) occurred for the winter near-stagnant current discharge (Scenario 27), where the plume reached a depth of -44 m. The maximum distance reached by the discharge plume (for a dilution of 1:3000) occurred for the winter near-stagnant current discharge (Scenario 27), where the plume reached a distance of 40,462 m.
Note that the maximum distance travelled by the plume (as shown in Table 4.4), is not representative of the actual plume length. This is further emphasized for near-stagnant scenarios where the slow current allows the creation of a persistent plume subjected mainly to dispersive effects. Plume sizes (volumes) can be observed on the graphs presented in Figure 4.2, and the maximum width is shown in Table 4.3.
The cases investigated in this analysis involve constant current conditions, which constitute a “worst-case” scenario. The presence of fluctuating directions and speeds of the currents would cause the plumes to dissipate earlier.
Plume persistence for a dilution of 1:3000 was observed to be of a maximum of 60 hours for vessel discharges (Scenario 6), 162 hours for the caisson discharges (Scenario 17), and 1,130 hours (~47 days) for the seabed discharges (Scenario 27).
As with the plume lengths and distances covered, plume persistence is a worst-case scenario, and each discharge has a relevant range of concentrations to consider. In this analysis, and for discharges of more than 1200 m3 (i.e. Scenarios 21, 22, 27, and 28) only the 300-fold concentration values are relevant. This is due to the fact that Hydrotest water will have degraded considerably for the larger discharges before they take place. Additionally, due to the chemical nature of the Hydrotest Water, it is reasonable to expect that it will have degraded in 7 days.

BMT Fluid Mechanics Limited COMMERCIAL-IN-CONFIDENCE
Chirag Oil ProjectPipeline Hydrotest Water Discharge Modelling 14 of 46 Appendix 10D - Eng FINAL
6. References
[1] ASA, “Hydrodynamic and Dispersion Modelling for the Azeri, Chirag, Gunashi Field Offshore Baku, Azerbaijan”, ASA 01-007, August 2001
[2] Shah Deniz Wind Wave Surge and Current Criteria, v3.1, OceanMetriX Ltd, October 2008


Seawater Temperature [ºC]

a) V
esse
l dis
char
ge (
20 m
3, 0
.01
m3/s
), w
inte
r ne
ar-s
tagn
ant
curr
ent
cond
itio
n (S
cena
rio
1)
b) V
esse
l dis
char
ge (
20 m
3, 0
.01
m3/s
), s
umm
er n
ear-
stag
nant
cur
rent
con
diti
on (
Scen
ario
2)
c) V
esse
l dis
char
ge (
20 m
3 , 0.0
1 m
3/s
), w
inte
r pr
edom
inan
t cu
rren
t co
ndit
ion
(Sce
nari
o 3)
d)
Ves
sel d
isch
arge
(20
m3 , 0
.01
m3 /s
), s
umm
er p
redo
min
ant
curr
ent
cond
itio
n (S
cena
rio
4)
Figu
re 4
.2:
Hyd
rote
st d
isch
arge
plu
me
volu
me
evol
utio
n (
Scen
ario
s 1
to 4
)

a) V
esse
l dis
char
ge (
100
m3, 0
.01
m3/s
), w
inte
r ne
ar-s
tagn
ant
curr
ent
cond
itio
n (S
cena
rio
5)
b) V
esse
l dis
char
ge (
100
m3, 0
.01
m3/s
), s
umm
er n
ear-
stag
nant
cur
rent
con
diti
on (
Scen
ario
6)
c) V
esse
l dis
char
ge (
100
m3 , 0
.01
m3/s
), w
inte
r pr
edom
inan
t cu
rren
t co
ndit
ion
(Sce
nari
o 7)
d)
Ves
sel d
isch
arge
(10
0 m
3 , 0.0
1 m
3 /s),
sum
mer
pre
dom
inan
t cu
rren
t co
ndit
ion
(Sce
nari
o 8)
Figu
re 4
.2 Con
tinued: Hy
drot
est
disc
harg
e pl
ume
volu
me
evol
utio
n (
Scen
ario
s 5
to 8
)

a) C
aiss
on d
isch
arge
(20
m3, 0
.01
m3 /s
), w
inte
r ne
ar-s
tagn
ant
curr
ent
cond
itio
n (S
cena
rio
9)
b) C
aiss
on d
isch
arge
(20
m3, 0
.01
m3 /s
), s
umm
er n
ear-
stag
nant
cur
rent
con
diti
on (
Scen
ario
10)
c) C
aiss
on d
isch
arge
(20
m3, 0
.01
m3 /s
), w
inte
r pr
edom
inan
t cu
rren
t co
ndit
ion
(Sce
nari
o 11
) d)
Cai
sson
dis
char
ge (
20 m
3, 0
.01
m3/s
), s
umm
er p
redo
min
ant
curr
ent
cond
itio
n (S
cena
rio
12)
Figu
re 4
.2 Con
tinued: Hy
drot
est
disc
harg
e pl
ume
volu
me
evol
utio
n (
Scen
ario
s 9
to 1
2)

a) C
aiss
on d
isch
arge
(10
0 m
3, 0
.01
m3 /s
), w
inte
r ne
ar-s
tagn
ant
curr
ent
cond
itio
n (S
cena
rio
13)
b) C
aiss
on d
isch
arge
(10
0 m
3, 0
.01
m3 /s
), s
umm
er n
ear-
stag
nant
cur
rent
con
diti
on (
Scen
ario
14)
c) C
aiss
on d
isch
arge
(10
0 m
3, 0
.01
m3/s
), w
inte
r pr
edom
inan
t cu
rren
t co
ndit
ion
(Sce
nari
o 15
) d)
Cai
sson
dis
char
ge (
100
m3, 0
.01
m3/s
), w
inte
r pr
edom
inan
t cu
rren
t co
ndit
ion
(Sce
nari
o 16
)
Figu
re 4
.2 Con
tinued: Hy
drot
est
disc
harg
e pl
ume
volu
me
evol
utio
n (
Scen
ario
s 13
to
16)
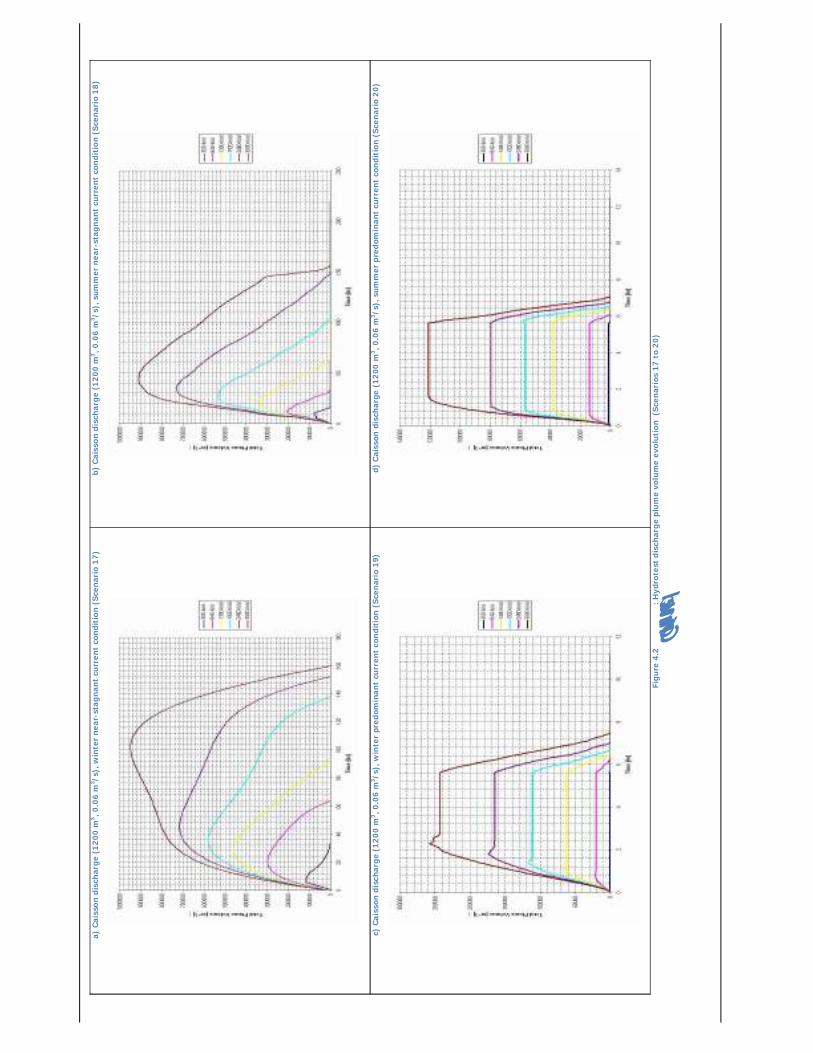
a) C
aiss
on d
isch
arge
(12
00 m
3, 0
.06
m3 /s
), w
inte
r ne
ar-s
tagn
ant
curr
ent
cond
itio
n (S
cena
rio
17)
b) C
aiss
on d
isch
arge
(12
00 m
3, 0
.06
m3/s
), s
umm
er n
ear-
stag
nant
cur
rent
con
diti
on (
Scen
ario
18)
c) C
aiss
on d
isch
arge
(12
00 m
3, 0
.06
m3/s
), w
inte
r pr
edom
inan
t cu
rren
t co
ndit
ion
(Sce
nari
o 19
) d)
Cai
sson
dis
char
ge (
1200
m3, 0
.06
m3/s
), s
umm
er p
redo
min
ant
curr
ent
cond
itio
n (S
cena
rio
20)
Figu
re 4
.2 Con
tinued: Hy
drot
est
disc
harg
e pl
ume
volu
me
evol
utio
n (
Scen
ario
s 17
to
20)

a) S
eabe
d di
scha
rge
(600
0 m
3, 0
.18
m3/s
), w
inte
r ne
ar-s
tagn
ant
curr
ent
cond
itio
n (S
cena
rio
21)
b) S
eabe
d di
scha
rge
(600
0 m
3 , 0.1
8 m
3/s
), w
inte
r pr
edom
inan
t cu
rren
t co
ndit
ion
(Sce
nari
o 22
)
c) S
eabe
d di
scha
rge
(20
m3, 0
.18
m3 /s
), w
inte
r ne
ar-s
tagn
ant
curr
ent
cond
itio
n (
Scen
ario
23)
d)
Sea
bed
disc
harg
e (2
0 m
3, 0
.18
m3/s
), w
inte
r pr
edom
inan
t cu
rren
t co
ndit
ion
(Sce
nari
o 24
)
Figu
re 4
.2 Con
tinued: Hy
drot
est
disc
harg
e pl
ume
volu
me
evol
utio
n (
Scen
ario
s 21
to
24)

a) S
eabe
d di
scha
rge
(100
0 m
3, 0
.18
m3/s
), w
inte
r ne
ar-s
tagn
ant
curr
ent
cond
itio
n (S
cena
rio
25)
b) S
eabe
d di
scha
rge
(100
0 m
3 , 0.1
8 m
3/s
), w
inte
r pr
edom
inan
t cu
rren
t co
ndit
ion
(Sce
nari
o 26
)
c) S
eabe
d di
scha
rge
(700
0 m
3, 0
.18
m3 /s
), w
inte
r ne
ar-s
tagn
ant
curr
ent
cond
itio
n (S
cena
rio
27)
d) S
eabe
d di
scha
rge
(700
0 m
3 , 0.1
8 m
3/s
), w
inte
r pr
edom
inan
t cu
rren
t co
ndit
ion
(Sce
nari
o 28
)
Figu
re 4
.2 Con
tinued: Hy
drot
est
disc
harg
e pl
ume
volu
me
evol
utio
n (
Scen
ario
s 24
to
28)

Figu
re 4
.3:
Hyd
rote
st p
lum
e ve
rtic
al c
entr
elin
e vi
ew a
t th
e en
d of
the
dis
char
ge p
erio
d. (
From
top
to
bott
om, S
cena
rios
1 t
o 4)

Figu
re 4
.3 C
onti
nued
: H
ydro
test
plu
me
vert
ical
cen
trel
ine
view
at
the
end
of t
he d
isch
arge
per
iod.
(Fr
om t
op t
o bo
ttom
, Sce
nari
os 5
to
8)

Figu
re 4
.3 C
onti
nued
: H
ydro
test
plu
me
vert
ical
cen
trel
ine
view
at
the
end
of t
he d
isch
arge
per
iod.
(Fr
om t
op t
o bo
ttom
, Sce
nari
os 9
to
12)

Figu
re 4
.3 C
onti
nued
: H
ydro
test
plu
me
vert
ical
cen
trel
ine
view
at
the
end
of t
he d
isch
arge
. (F
rom
top
to
bott
om, S
cena
rios
13
to 1
6)

Figu
re 4
.3 C
onti
nued
: H
ydro
test
plu
me
vert
ical
cen
trel
ine
view
at
the
end
of t
he d
isch
arge
. (F
rom
top
to
bott
om, S
cena
rios
17
to 2
0)

Figu
re 4
.3 C
onti
nued
: H
ydro
test
plu
me
vert
ical
cen
trel
ine
view
at
the
end
of t
he d
isch
arge
. (F
rom
top
to
bott
om, S
cena
rios
21
to 2
4)

Figu
re 4
.3 C
onti
nued
: H
ydro
test
plu
me
vert
ical
cen
trel
ine
view
at
the
end
of t
he d
isch
arge
. (F
rom
top
to
bott
om, S
cena
rios
25
to 2
8)

Figu
re 4
.4:
Hyd
rote
st p
lum
e pl
an v
iew
at
the
end
of t
he d
isch
arge
per
iod.
(Fr
om t
op t
o bo
ttom
, Sce
nar
ios
1 to
4)

Figu
re 4
.4 C
onti
nued
: H
ydro
test
plu
me
plan
vie
w a
t th
e en
d of
the
dis
char
ge p
erio
d. (
From
top
to
bott
om, S
cena
rios
5 t
o 8)

Figu
re 4
.4 C
onti
nued
: H
ydro
test
plu
me
plan
vie
w a
t th
e en
d of
the
dis
char
ge p
erio
d. (
From
top
to
bott
om, S
cena
rios
9 t
o 12
)

Figu
re 4
.4 C
onti
nued
: H
ydro
test
plu
me
plan
vie
w a
t th
e en
d of
the
dis
char
ge p
erio
d. (
From
top
to
bott
om, S
cena
rios
13
to 1
6)

Figu
re 4
.4 C
onti
nued
: H
ydro
test
plu
me
plan
vie
w a
t th
e en
d of
the
dis
char
ge p
erio
d. (
From
top
to
bott
om, S
cena
rios
17
to 2
0)

Figu
re 4
.4 C
onti
nued
: H
ydro
test
plu
me
plan
vie
w a
t th
e en
d of
the
dis
char
ge p
erio
d. (
From
top
to
bott
om, S
cena
rios
21
to 2
4)

Figu
re 4
.4 C
onti
nued
: H
ydro
test
plu
me
plan
vie
w a
t th
e en
d of
the
dis
char
ge p
erio
d. (
From
top
to
bott
om, S
cena
rios
24
to 2
8)

BMT Fluid Mechanics Limited COMMERCIAL-IN-CONFIDENCE
Chirag Oil ProjectPipeline Hydrotest Water Discharge Modelling 43 of 46 Appendix 10D - Eng FINAL
APPENDIX A. CFD MODEL
A.1. Analysis Software
CFX is regarded as a market-leading product that has been thoroughly validated for dispersion problems relevant to the oil and gas industry both by the specialists BMT and by external specialists. Publically available verification studies for a number of different fluids dynamics problems such as movement of solids through liquids and bubble plume behaviour have been undertaken at the University of Melbourne in Australia and the Paul Scherrer Institute in Switzerland1. Additional case studies including verification studies are provided here:
http://www.ansys.com/industries/sys-testimonials.asp?ID=10
A.2. Methodology
A.2.1. General
Dispersion of hydrotest water fluid was modelled using discharge parameters supplied by BP, which included total volume and duration of discharges.
The hydrotest schedule involved discharges from a variety of locations and depths. The analysis focused on discharges of 20m3 or more and on a subset of representative scenarios for each depth and discharge rate.
Transient dispersion simulations were carried out to determine the extent of the toxic plume for different release depths (i.e. from a vessel, from a caisson at a depth of 50m and from the seabed at a depth of 130m), a range of port diameters and discharge volumes for each depth, different seawater temperatures (summer and winter conditions) and two near-seabed current speeds (i.e. near-stagnant and predominant). For the summer condition, an appropriate thermocline was considered in the analysis while, for the winter condition, a constant temperature profile (7 ºC) was assumed. Discharges from the vessel and the caisson were directed downwards while releases from seabed were directed upwards.
No topography (i.e. flat seabed) was included.
1 http://www.cfd.com.au/cfd_conf03/papers/123Hol.pdf;http://www.cfd.com.au/cfd_conf97/papers/smi002.pdf; Dispersion of neutrally buoyant solids falling vertically into stationary liquid and horizontal channel flow, K. M. Smith, M. R. Davidson and N. J. Lawson Computers & Fluids Volume 29, Issue 4, 1 May 2000, Pages 369-384; On the modelling of bubble plumes in a liquid pool, B. L. Smith, Applied Mathematical Modelling, Volume 22, Issue 10,October 1998, Pages 773-797

BMT Fluid Mechanics Limited COMMERCIAL-IN-CONFIDENCE
Chirag Oil ProjectPipeline Hydrotest Water Discharge Modelling 44 of 46 Appendix 10D - Eng FINAL
A.3. Fluid Properties
A.3.1. Seawater
Table A.1 presents the properties of seawater used in the analysis.
A.3.2. Hydrotest Water
The hydrotest discharges will comprise chemically treated Caspian seawater. The chemical dose levels will total less than 500ppm and therefore the discharges were considered to have the same density and physical properties as Caspian seawater. The relevant degree of dilution will lie in the range of 1:300 to 1:3000.
A.4. Computational Mesh
The computational mesh was generated in the domain bounded by the seabed and the sea surface. The computational domain extended sufficiently far away in each direction to avoid any boundary influence on the flow solution. The computational mesh used for the simulations comprised approximately 4 million tetrahedral cells. Additional mesh refinement was applied in the proximity regions of the release location.
A.5. Turbulence Model
The K- turbulence model was employed in the CFD simulations with standard coefficients.
The K- turbulence model is widely used for applications in the offshore industry and is generally suitable for the assessment of dispersion.
A.6. Heat Transfer Model
Heat transfer was modelled in the dispersion simulations. The ambient seawater temperature varied depending on the season condition. Summer and winter thermal conditions were obtained from [1].
A.7. Buoyancy
Buoyancy forces due to changes in fluid density were modelled in the analysis using the Boussinesq approximation.
A.8. Current Velocity Profile
The current velocity profile was simulated as uniform across the water column and consisted of two distinguished cases:
Predominant current speed = 0.11m/s
Near-stagnant current speed = 0.01m/s

BMT Fluid Mechanics Limited COMMERCIAL-IN-CONFIDENCE
Chirag Oil ProjectPipeline Hydrotest Water Discharge Modelling 45 of 46 Appendix 10D - Eng FINAL
A.9. Boundary Conditions
A.9.1. Upstream and Downstream Boundaries
Current properties and temperature profile for each scenario (see Section 4.2) were applied at the upstream domain boundary.
A.9.2. Seabed
A no-slip wall boundary condition (u, v, w = 0) was applied at the seabed.
A.9.3. Sea surface
A free-slip wall boundary condition (w = 0) was applied at the sea surface.
Seawater
Density (kg/m3) 1,010 Dynamic viscosity (kg/(m.s)) See Figure A.1 Molecular weight (kg/kmole) 18.02
Specific Heat Capacity (J/(kg.K)) 4,181.7 Thermal Conductivity (W/(m.K)) 0.6069
Thermal Expansivity (K-1) 0.000257
Table A.1 – Properties of seawater
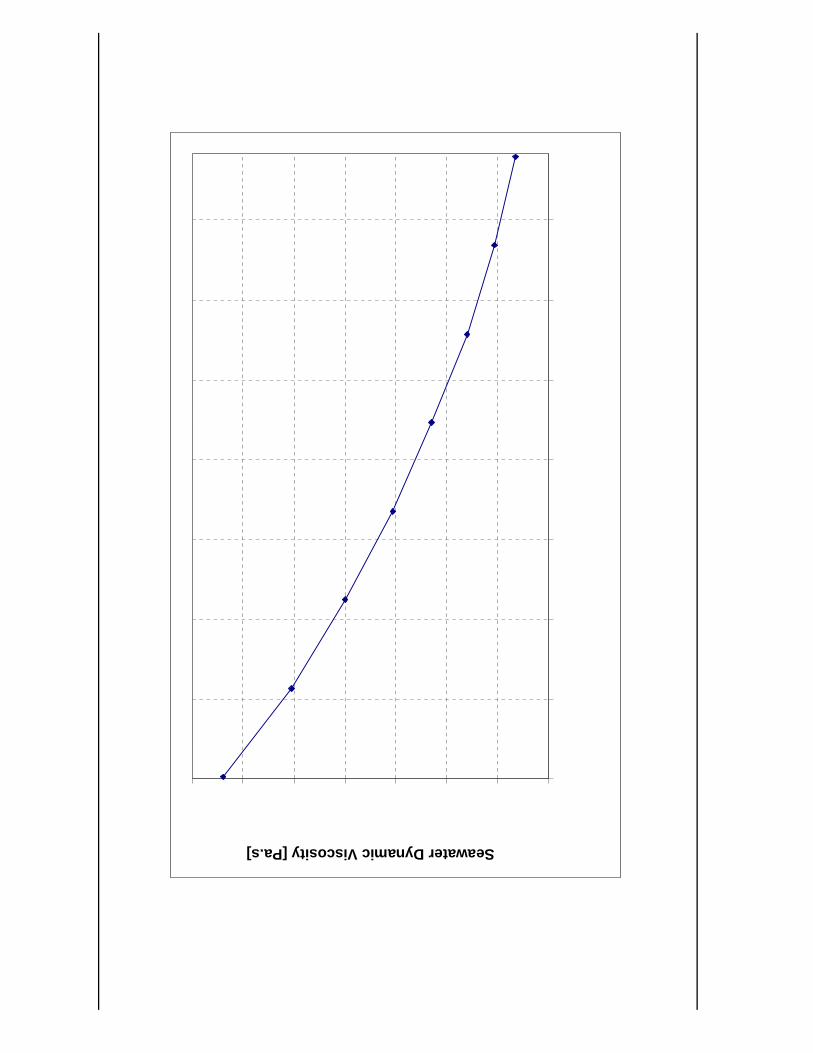
Seawater Dynamic Viscosity [Pa.s]

APPENDIX 11A
Operations Activities and Events


AIOC Chirag Oil Project Environmental & Socio-Economic Impact Assessment
Appendix 11A
February 2010 11A/1 Final
ACTIVITY/INTERACTIONSID(R=Routine, NR= Non-Routine)
Activity Scoped In/Out
Reference Event Event Category
Ops Offshore operations
Ops-R1 Pre-drill well tie-in and re-entry 5.7.3 Underwater noise and vibration Underwater Noise and Vibration (Drilling)
Drilling discharges to sea Drilling Discharges Underwater Noise and Vibration (Drilling)
Ops-R2 Driving conductor section and drilling surface hole section with water based muds (WBM)
5.7.4
Underwater noise and vibration
Underwater Noise and Vibration (Hammering)
Ops-NR3 Discharge of residual mud 5.7.4 Drilling discharges to sea Drilling Discharges Ops-R4 Cement losses 5.7.7.1 and
5.3.2.5Cement discharges to sea Cement Discharges
Ops-NR5 Excess cement discharge to sea 5.7.7.1 and 5.3.2.5
Cement discharges to sea Cement Discharges
Ops-R6 Power generation, cranes, emergency generator testing and pilot flaring
5.8.6.3 and 5.8.6.5
Emissions to atmosphere (non GHG)
Offshore Operations (Routine Operations)
Ops-NR7 Non routine flaring 5.8.6.6 Emissions to atmosphere (non GHG)
Offshore Operations (Non Routine Operations - Flaring)
Ops-NR8 Non routine produced water discharge
5.8.4 Produced water discharges to sea Produced Water Discharge
Water intake/entrainment Water Intake/Entrainment and Cooling Water Discharge
Ops-R9 Seawater lift and cooling water discharge
5.8.6.6
Cooling water discharge to sea Water Intake/Entrainment and Cooling Water DischargeChlorine/copper in discharged water
Ops-NR10 Fire system tests
5.8.6.9
Discharges to sea
Discharge fire fighting foam Ops-R11 Platform drainage 5.8.6.11 Other discharges to sea Deck drainage
Treated black water Ops-R12 Sewage and galley waste discharges
5.8.6.14 and 5.8.6.15
Other discharges to sea
Grey water Ops-NR13 Pipeline operations and
maintenance – pigging of oil and gas lines
5.9.4 Pigging discharge to sea Pigging Discharge
Ops-R14 Maintenance of produced water and injection water pipelines (pigging)
5.8.7 Pigging discharge to sea Pigging Discharge
Emissions to atmosphere (non GHG)
Supply Vessels
Underwater noise and vibration Underwater Noise & Vibration (Vessels) Treated black water
Grey water
Deck drainage
Ops-R15 Supply vessel operations 5.8.8
Other discharges to sea
Ballast Water Emissions to atmosphere (non GHG)
Support Vessels Ops-R16 Crew change operations 5.8.8
Noise Support Vessels Visual Intrusion Visual Intrusion Light Pollution Light Pollution
Ops-R17 Physical presence of WC-PDQ platform
5.8
Physical presence Physical presence Ops-R18 Waste generation 5.8.9 Waste generation Waste generation Ter Onshore Operations
Ter-R1 Use of existing processing and storage facilities
5.9.4 Emissions to atmosphere (non GHG)
Onshore Operations (Routine Operations)
Ter-NR2 Non-routine flaring associated with COP
5.9.4 Emissions to atmosphere (non GHG)
Onshore Operations (Non Routine Operations – Flaring)
Ter-R3 Waste generation 5.9.4 Waste generation Waste generation
Ter-R4 Onshore discharges 5.9.4 Onshore discharges Onshore discharges

Emissions to Atmosphere (non GHG) Marine Environment


APPENDIX 11B
Offshore Air Dispersion Modelling


Hill Park South, Springfield Drive, Leatherhead, Surrey, KT22 7LH www.granherne.com | Tel: +44 1372 380000 | Fax: +44 1372 388888
AZERBAIJAN INTERNATIONAL OPERATING COMPANY (AIOC)
December 2009 9740-COP-RC-X-00001 Revision: 3
0 18/03/2009 Final Report J Rumble S Wilford P Russell E Bridge
1 08/04/2009 Final Report J Rumble S Wilford P Russell E Bridge
2 16/06/2009 Final Report J Rumble S Wilford P Russell E Bridge
3 23/12/2009 Final Report P Russell E Cielslak P Russell K Denton
This document is issued pursuant to an Agreement between Granherne Ltd and/or its subsidiary or affiliate companies (“Granherne”) and AZERBAIJAN INTERNATIONAL OPERATING COMPANY (AIOC) which agreement sets forth the entire rights, obligations and liabilities of those parties with respect to the content and use of the document. Reliance by any other party on the contents of the document shall be at its own risk. Granherne makes no warranty or representation, expressed or implied, to any other party with respect to the accuracy, completeness, or usefulness of the information contained in this document and assumes no liabilities with respect to any other party’s use of or damages resulting from such use of any information, conclusions or recommendations disclosed in this document.

9740-COP-RC-X-00001 Page 4 of 6 Revision: 3 December 2009
2.1 Scope 62.2 Propose 62.3 Methodology 6
5.1 Emission Source Data Summary 65.2 Model Source Inputs 6
6.1 Offshore Domain (All Platform Emission Sources) 66.2 Onshore and Offshore Combined Domain 66.3 Offshore Domain (WC-PDQ Sources Only) 66.4 Central Caspian Regional Domain 66.5 Sensitive Receptors 6
9.1 Background Concentrations 69.2 Discrete Receptor Concentrations 69.3 Offshore Gridded Receptors 69.4 Regional Grid and Onshore Receptors 69.5 WC-PDQ Impact 69.6 Central Caspian Regional Impact 6
9740-COP-RC-X-00001 Page 5 of 6 Revision: 3 December 2009
ACG Azeri-Chirag-Gunashli Oil Field
ACGIH American Conference of Governmental Industrial Hygienists
ADMS Atmospheric Dispersion Modelling System
AERMOD American Meteorological Society/Environmental Protection Agency Regulatory Model
AIOC Azerbaijan International Operating Company
CA Central Azeri Platform
CASMOS Caspian Met Ocean Study
CERC Cambridge Environmental Research Consultants
COP Chirag Oil Project
DUQ Drilling, Utilities and Quarters Platform
DWG Deep Water Gunashli
EA East Azeri
ESIA Environmental and Social Impact Assessment
EU European Union
Fb Heat Release
Fm Momentum Flux
ISCST Industrial Source Complex Short Term
MODU Mobile Offshore Drilling Unit
NOx Nitrogen Oxides
NRPB National Radiological Protection Board
OCD Offshore and Coastal Dispersion Model
PCWU Production, Compression, Water Injection and Utilities Platform
RR Rolls-Royce
SD Shah-Deniz
UKOOA United Kingdom Offshore Operators Association
VOC Volatile Organic Compound
WA West Azeri Platform
WC-PDQ West Chirag Drilling Production Quarters

9740-COP-RC-X-00001 Page 6 of 6 Revision: 3 December 2009
The AIOC Chirag Oil Project (COP) development in the Central Caspian Sea, to the East of Baku, is to include a new West Chirag Production Drilling Quarters (WC-PDQ) platform. It will comprise of drilling, gas and oil processing and export facilities, along with utilities and accommodation. The emission sources on the platform will comprise of 3 gas turbines (for power generation), a safety flare system and a number of minor diesel engines for emergency or support functions.
AIOC commissioned this study to understand the impact of emissions from WC-PDQ and the surrounding installations on the WC-PDQ workers and on the air quality of onshore, coastal locations.
In the comparison of emission quantities, air quality and occupational exposure limits, it was apparent that nitrogen dioxide (NO2) was the most significant emission from the platform in terms of possible impacts (Section 3).
The platform is located in an area with a number of other facilities. In order to examine the exposure of workers on the proposed new platform to air pollution, this study began by modelling emissions from existing platforms in the Central Caspian Sea. Workers on the new platform must not be exposed to concentrations exceeding occupational exposure levels and the modelling predicted that concentrations will be well below exposure levels at the proposed platform location. The limit for occupational exposure is 3760 µg/m3 ACGIH[5], calculated for a twelve hour shift, which can be compared with the predicted peak concentrations which rarely exceed 30 µg/m3
offshore in the vicinity of the platforms.
For the study, recent offshore meteorological measurements have been used, recorded on platforms within the ACG complex and supplied by AIOC. These provide for more accurate predictions of air quality through the use of dispersion modelling.
Onshore air quality standards are based upon a mixed population, in terms of ages and health, and therefore it is generally accepted that onshore standards do not apply offshore, where only those of working age and fitness are present for extended periods.
The emissions from both existing and proposed platforms were modelled to determine the future contribution of emissions to the air quality at Azerbaijan coastal locations, in particular Baku and Sangachal. Account was taken of the background concentrations found in the region. The results showed that the contribution to the long-term average NOx concentration at Baku was less than 1 µg/m3, and the peak would rarely exceed 2 µg/m3 above background. This is a relatively insignificant contribution. However, concentrations over 10 µg/m3 will occasionally occur on the peninsula to the east of Baku. For comparison, the EU standard is 200 µg/m3.

9740-COP-RC-X-00001 Page 7 of 7 Revision: 3 December 2009
The fact that contribution to onshore air quality levels is small is partly due to the prevailing wind direction which limits the proportion of emissions which blow directly towards the shore and partly due to the distance from the shore to the offshore platforms. For example, the WC-PDQ location is over 100 km to the east of Baku.
The development of WC-PDQ is not at risk from exposure to pollution offshore. Equally, the additional emissions from the new platform will not pose a risk of significant additional deterioration of air quality, either offshore or onshore.

9740-COP-RC-X-00001 Page 8 of 8 Revision: 3 December 2009
Granherne Ltd was commissioned by AIOC to carry out an air dispersion modelling study of the effects of emissions on offshore personnel onboard WC-PDQ. The study investigated the contribution of emissions originating from platforms on populated areas of Azerbaijan. The findings on this report will form part of the Chirag Oil Project Environmental and Social Impact Assessment (ESIA).
An air quality dispersion study was required in order to identify any potential health impact on the population of WC-PDQ. This involved comparing findings against the occupational standards for average exposure time of personnel working offshore.
The modelling was also used to identify whether any emissions from the ACG complex of platforms reach landfall either in Azerbaijan or other countries such that they impact on the ambient air quality of any receiving regions. Again, these findings were compared to existing ambient air quality standards.
Modelling also took into account the cumulative impact of other platforms within the ACG and Shah Deniz contract areas also flaring/ operating concurrently.
Modelling scenarios included:
Normal operations with only purge and pilot flaring to include all platforms except SD2;
Normal operations with flaring options likely from one platform due to gas export problems; and
Full emergency flaring, from one platform.
The study has three main aims:
Ensure that workers on the proposed WC-PDQ would not be exposed to pollutants exceeding occupational exposure limits;
Evaluate the contribution of emissions from WC-PDQ on local and regional air quality; and
Determine the impact of emissions from existing and the proposed WC-PDQ onshore.

9740-COP-RC-X-00001 Page 9 of 9 Revision: 3 December 2009
For this study the ADMS-4.1 atmospheric dispersion model was used to predict the impact on air quality from offshore platforms (See Section 4). An initial assessment determined that NOx
emissions from power generation turbines and engines were the most significant sources of emission in terms of health and environmental impact.
The dispersion modelling involved the consideration of:
Source emissions and characteristics;
Evaluation of meteorological conditions and preparation of model input files;
Model selection, set-up and modelling runs;
Provision of contour maps of the air pollution levels; and
Evaluation of impact and of significance.
9740-COP-RC-X-00001 Page 10 of 10 Revision: 3 December 2009
The preliminary screening identified that nitrogen oxides (NOx) are the key pollutant of interest. These are comprised of NO and NO2 but NO2 is the more toxic. Whilst emissions of carbon monoxide occur, exposure limits and air quality standards are far higher than for NO2. As CO is not emitted in significantly larger quantities than NO2, the latter emissions would be the first emission to exceed any limit.
NO converts to NO2 over time in the atmosphere, primarily due to the mixing of the emitted plume with the ozone (O3) present in the background air, its reaction being NO + O3 = NO2 + O2.
The negative health effects of NO2 overexposure can range from chest pain and shortness of breath in the short term, to the gradual development of emphysema, lung oedema or other chronic respiratory disorders following sustained periods of exposure.
The environmental impacts of NO2 include contributions to acid rain, visibility impairment and eutrophication. However, due to the large distances involved,the small number of sources present on the offshore platforms and low amounts of NO2 emitted, these effects will be negligible and the primary focus of this study will be on the effects on human health on the offshore platforms as well as on populated regions on the coastline.
For the prediction of short-term peak concentrations, expressed in terms of the 99.97% percentile, it was assumed that 50% of the NOX emitted was present in the form of NO2, reflecting the fact that less mixing occurs for peak concentrations to exist. For long-term average concentrations, it was assumed that 100% of the NOx was present as NO2.
Azerbaijan standards are evolving and the EU air quality standards, including Directive (99/30/EC), are considered as providing suitable guidance. EU standards were used in the assessment of air quality at the Sangachal Terminal by AIOC. These standards are applicable onshore and may also be used to evaluate impact when the offshore emissions reach the shore.
Offshore, where only workers are generally present for extended periods, with members of the public having only transitory presence, onshore standards are not relevant. However, occupational exposure standards must be met. The American Conference of Governmental Industrial Hygienists (ACGIH) provides occupational exposure limits for NO2 and these, together with the EU air quality standards, are given in Table 3.1. The ACGIH limit is also used by the International Occupational Safety and Health Information Centre, but the limits are under review in Europe and in the USA and it is expected that future occupational health limits for NO2 may be lowered.

9740-COP-RC-X-00001 Page 11 of 11 Revision: 3 December 2009
Offshore workers will spend at least half their day in the accommodation unit and offices on the platform. Their exposure to air pollutants, ignoring indoor air quality, is based on their shift, hence it is the occupational exposure standards that are of most relevance to them.
200 105 1 hour mean not to be exceeded more than 18 times a year
EU limits
Nitrogen Dioxide (NO2)40 21 Annual mean
ACGIH 8 hour 5,640 3,000 Time weighted average exposure 8 hour
ACGIH 12 hour 3,760 2,000 The 8 hour value calculated for a 12 hr shift

9740-COP-RC-X-00001 Page 12 of 12 Revision: 3 December 2009
A range of models is available for dispersion modelling but their use offshore generally requires the re-setting of dispersion parameters and use of suitable meteorological data. Commonly available models include Offshore and Coastal Dispersion model (OCD), National Radiological Protection Board (NRPB-91), Industrial Source Complex Short Term (ISCST), American Meteorological Society/Environmental Protection Agency Regulatory Model (AERMOD) and Atmospheric Dispersion Modelling System (ADMS). ADMS-4.1 incorporates a superior basis for dispersion modelling, based on the Monin-Obhukov length parameter, rather than the Pasquill stability classes/Gaussian profiles used in early models, which include OCD, NRPB-91 and ISCST. The systems in practice give similar results for stable and neutral atmospheric stability conditions, but, under unstable conditions, the predictions of models incorporating the Monin-Obhukov length are regarded as superior.
The ADMS-4.1 model incorporates an integrated plume rise module, rather than the simple empirical formula used in ISCST and the basic AERMOD model. The empirical approach is known to give poor predictions of emissions from small stacks or high-momentum releases as the equations were established primarily from the observations of large power station plumes. A version of the NRPB-91 model is available, called RAMPART; this incorporates the integrated plume rise approach but lacks a Monin-Obhukov based dispersion model.
ADMS-4.1 also introduces a marine boundary layer option which is specifically designed to model offshore sites, such as WC-PDQ. The ability to model the changing offshore marine boundary layer provides a more realistic representation of the metrological conditions, such as lapse rates, encountered offshore.
ADMS-4.1 was selected because of its superior dispersion model and plume rise methodology and integrated offshore marine boundary layer facility. The developers of this model, Cambridge Environmental Research Consultants (CERC), were consulted about the use of the model offshore and the setting up of dispersion parameters.

9740-COP-RC-X-00001 Page 13 of 13 Revision: 3 December 2009
Offshore turbine configuration and loading parameters were based on the available operational data, with emissions calculated accordingly.
The ACG and Shah Deniz platforms have a number of diesel engines which are available for emergency service or periodic use. These include stand-by generators, crane engines and fire pump engines. These diesel-fuelled, emergency-only units are routinely test-run for short periods. Their contribution to emissions is regarded as insignificant and they have not been considered further in this study.
The turbine locations were determined according to the central jacket grid co-ordinates as specified in the supplied structural drawings for the ACG and Shah Deniz 1 platforms.
Most turbines are RB-211 units, manufactured by Rolls-Royce [2]. The emission parameters such as load and exhaust temperature were obtained. In addition, the CA platform has a Solar Mars turbine; on Chirag-1, two Solar Taurus, two ABB-Alstrom Tornadoes and one Solar Saturn turbines are installed.
Electrical power on Shah Deniz 1 is delivered via four dual-fuel reciprocating engines, Bergen B type units, also manufactured by Rolls-Royce. Emissions were determined from rating and manufacturer’s data.
Most gas turbines on the ACG platforms are RB-211 units and emission calculations have been based on the most common model, with data test sheets provided by RR and ACG.
Solar and ABB-Alstrom Tornadoes turbines are also installed and monitoring data and manufacturer’s data sheets were used to derive emissions and stack parameters.
Dimensions for the reciprocating dual-fuel engine stacks present on Shah Deniz 1 were based upon manufacturer’s data.
Flare heights and widths were derived using the supplied piping diagrams taking into account the height of the base platform above sea level.
Turbine and engine configuration and loading parameters were based upon supplied operational data.
Based on the operational data provided, turbines operating as reserve were identified and excluded as they are used only as replacements when other turbines are off-line; hence, there is no change to overall emission rates.
Turbine load information was provided and used to determine emissions: Loads vary from 50-100% and, at lower loads, for a given turbine, emissions are also reduced. Where turbine model emission-load profiles are available, these were used.
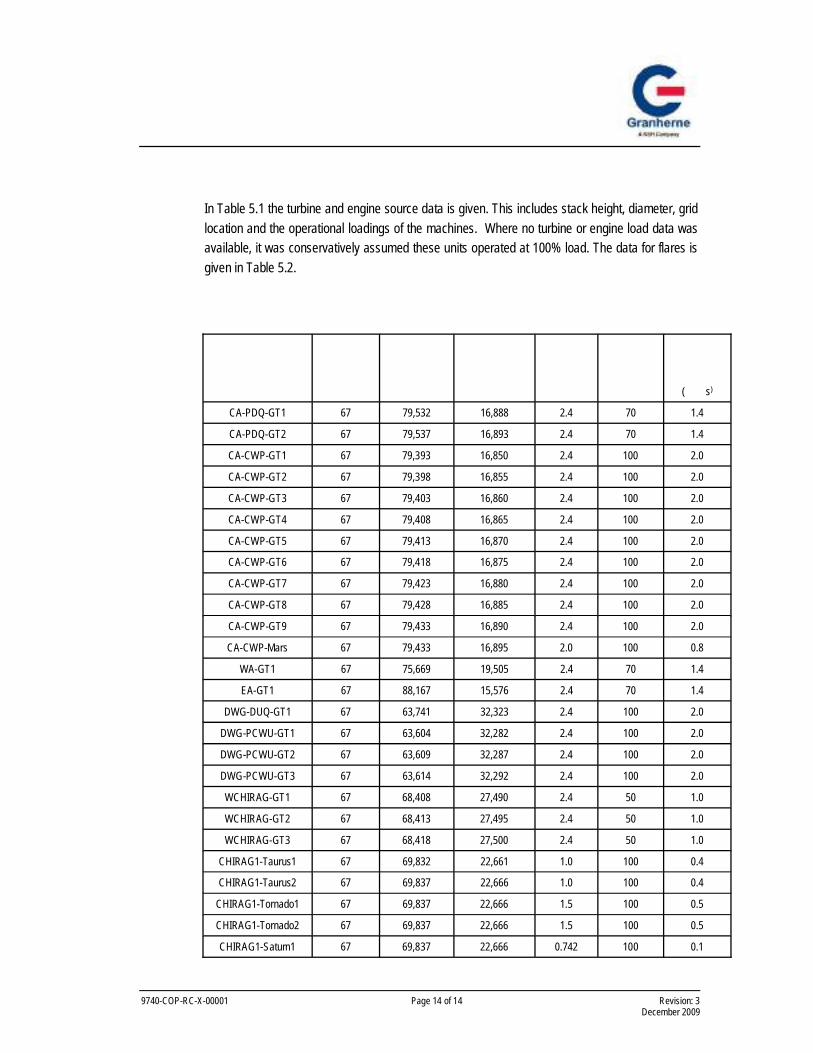
9740-COP-RC-X-00001 Page 14 of 14 Revision: 3 December 2009
In Table 5.1 the turbine and engine source data is given. This includes stack height, diameter, grid location and the operational loadings of the machines. Where no turbine or engine load data was available, it was conservatively assumed these units operated at 100% load. The data for flares is given in Table 5.2.
( s)
CA-PDQ-GT1 67 79,532 16,888 2.4 70 1.4
CA-PDQ-GT2 67 79,537 16,893 2.4 70 1.4
CA-CWP-GT1 67 79,393 16,850 2.4 100 2.0
CA-CWP-GT2 67 79,398 16,855 2.4 100 2.0
CA-CWP-GT3 67 79,403 16,860 2.4 100 2.0
CA-CWP-GT4 67 79,408 16,865 2.4 100 2.0
CA-CWP-GT5 67 79,413 16,870 2.4 100 2.0
CA-CWP-GT6 67 79,418 16,875 2.4 100 2.0
CA-CWP-GT7 67 79,423 16,880 2.4 100 2.0
CA-CWP-GT8 67 79,428 16,885 2.4 100 2.0
CA-CWP-GT9 67 79,433 16,890 2.4 100 2.0
CA-CWP-Mars 67 79,433 16,895 2.0 100 0.8
WA-GT1 67 75,669 19,505 2.4 70 1.4
EA-GT1 67 88,167 15,576 2.4 70 1.4
DWG-DUQ-GT1 67 63,741 32,323 2.4 100 2.0
DWG-PCWU-GT1 67 63,604 32,282 2.4 100 2.0
DWG-PCWU-GT2 67 63,609 32,287 2.4 100 2.0
DWG-PCWU-GT3 67 63,614 32,292 2.4 100 2.0
WCHIRAG-GT1 67 68,408 27,490 2.4 50 1.0
WCHIRAG-GT2 67 68,413 27,495 2.4 50 1.0
WCHIRAG-GT3 67 68,418 27,500 2.4 50 1.0
CHIRAG1-Taurus1 67 69,832 22,661 1.0 100 0.4
CHIRAG1-Taurus2 67 69,837 22,666 1.0 100 0.4
CHIRAG1-Tornado1 67 69,837 22,666 1.5 100 0.5
CHIRAG1-Tornado2 67 69,837 22,666 1.5 100 0.5
CHIRAG1-Saturn1 67 69,837 22,666 0.742 100 0.1

9740-COP-RC-X-00001 Page 15 of 15 Revision: 3 December 2009
( s)
SD1-GRE1 57 2000 2000 1 100 0.5
SD1-GRE2 57 2005 2005 1 100 0.5
SD1-GRE3 57 2010 2010 1 100 0.5
CA-CWP-FLARE 124.9 79,408 16,865 0.6
WA-FLARE 124.9 75,684 19,520 0.4
EA-FLARE 124.9 88,182 15,591 0.4
DWG-PCWU-FLARE 165.5 63,619 32,297 0.6
WCHIRAG-FLARE 124.9 68,423 27,505 0.4
CHIRAG1-FLARE 180.0 69,847 22,676 0.4
The emission rates for the sources modelled are given in Tables 5.3 and 5.4.
100 13.73 44.99
70 6.28 29.60
50 3.08 20.30

9740-COP-RC-X-00001 Page 16 of 16 Revision: 3 December 2009
m4/s2
Pilot & Purge(All) 0.03 1 1
Operational (DWG-PCWU) 76.00 17,314 1,751
Emergency (DWG-PCWU) 284.00 100,000 10,000
Operational (WC-PDQ) 75.00 38,424 1,739
Emergency (WC-PDQ) 284.00 73,272 2,401

9740-COP-RC-X-00001 Page 17 of 17 Revision: 3 December 2009
The offshore modelling domain consisted of the existing ACG contract area (6 platforms), Chirag-1 and Shah Deniz 1 which were enclosed within a 90km x 60km modelling area beginning 2km south and west of Shah Deniz 1. The grid origin was offset from Shah Deniz 1 to account for any possible NO2 dispersion to the south and west of the platform itself. A grid of 81 by 81 points was used, providing an average resolution of 0.8km. A representation of this domain is shown in Figure 6.1.
In addition to the offshore sources, a second separate offshore domain was designated to take into account NO2 concentrations onshore, including the populated regions of Baku and Sangachal Town. This offshore domain grid is a superset of the extended west to include all of the offshore platforms, including WC-PDQ, and the populated region between Baku and Sangachal.
0 10000 20000 30000 40000 50000 60000 70000 80000 90000
Metres
Offshore Platform Locations
0
10000
20000
30000
40000
Shah Deniz 1
DWG Platforms
West Chirag
Chirag-1West Azeri
Central AzeriEast Azeri
ACG Complex

9740-COP-RC-X-00001 Page 18 of 18 Revision: 3 December 2009
To assess the impact of WC-PDQ emissions upon the existing ACG platforms, a separate suite of scenarios was run with emission sources present on WC-PDQ only. The modelling area was changed to 28km x 28km with the grid size remaining at 81 by 81 points providing a resolution of approximately 0.12km.
To illustrate the overall impact of emissions in the Central Caspian region, the modelling area was increased significantly to 550km x 550km covering a substantial section of the Central Caspian Sea and surrounding land borders of Russia, Iran, Turkmenistan and Kazakhstan. The grid size was increased to 101, the maximum permitted in ADMS providing a resolution of approximately 5.45km. A separate suite of scenarios were run to assess the impact of existing platforms, proposed WC-PDQ sources in isolation and well tests preceding the construction of WC-PDQ on the Dada Gorgud Mobile Offshore Drilling Unit (MODU). Note that the prediction of concentrations beyond 60km from source should be view as indicative only due to model limitations.
Platforms located within the ACG contract area currently number six, with the addition of Chirag-1. The nearest platform to the proposed location of WC-PDQ is Chirag-1, located 5.03km away. As all of the ACG complex platforms are manned installations, NO2 concentrations have been predicted over the area occupied by the platforms.
The potential impact on onshore air quality was also assessed. Two receptors were modelled, Baku and Sangachal, with Baku being the main population centre in the region and Sangachal being the town which is close to the AIOC oil and gas reception terminal.
The concentrations predicted at the designated locations are presented in Table 6.1.

9740-COP-RC-X-00001 Page 19 of 19 Revision: 3 December 2009
Central Azeri-PDQ 15.37 South East
Central Azeri-CWP 15.29 South East
West Azeri 10.79 South East
East Azeri 23.07 North South East
Deep Water Gunashli-PDQ 6.72 North West
Deep Water Gunashli-PCWU 6.79 North West
Chirag-1 5.03 South South East
Baku 118.09 West
Sangachal 147.20 West South West

9740-COP-RC-X-00001 Page 20 of 20 Revision: 3 December 2009
The meteorological data used in the dispersion modelling were compiled and produced as part of scope, based on the available offshore measurements.
An annual hourly dataset was created using existing measured platform data and data derived from a CASpian Met Ocean Study (CASMOS2) output [3]. The data was formatted to meet the requirements of the Marine boundary layer scheme of ADMS4 [4]. These parameters included year, Julian day, hour, air temperature, sea temperature, wind speed and wind direction. Sea surface temperature was extracted from the CASMOS2 report and air temperature and wind speed and direction were averaged from CHIRAG-1 and Central Azeri measurements. The surface roughness for calculations was set to 0.001, the ADMS default for the sea.
ADMS determines the offshore lapse rates and turbulence which have a significant impact on plume rise and atmospheric dispersion.
Short-term concentrations for the emergency shutdown flaring scenario utilised a screening metrological dataset used in similar studies, which represents a comprehensive collection of possible stability classes and wind speeds. This enables the determination of the maximum concentrations.

9740-COP-RC-X-00001 Page 21 of 21 Revision: 3 December 2009
Three basic scenarios were evaluated, as given below. A number of variations were also modelled to help distinguish impacts, including SD operating independantly of ACG, WC-PDQ only, MODU operations only and SD running on diesel rather than fuel gas.
The normal operation of the offshore platforms involves power generation etc using turbines, and in the case of SD1, gas engines. Flares operate in pilot and purge mode, the minimum necessary to maintain their safe operation.
During periods of restricted gas export capability, a platform may temporarily flare gas. This is generally due to the need for unplanned maintenance and such flaring is reduced to the lowest practicable level. Rarely would more than one platform be flaring. Any processing platform could need to flare and DWG and the proposed new platform, WC-PDQ, have been modelled.
DWG-PCWU was selected as it is normally upwind of WC-PDQ and is comparatively near. Its selection was to fulfil the objective of evaluating the exposure of workers on the new platform to air pollutants. Flaring from WC-PDQ was also modelled as part of the Environmental and Social Impact Assessment (ESIA) of the proposed facility.
Should there be an incident or alarm on the platform, an emergency depressurisation may be necessary. The platform is isolated from production and export pipelines and the process inventory on the platform is directed to flare. This involves an initial high rate of release which reduces exponentially as the pressure declines. The complete depressurisation of a platform is rapid, with most of the inventory assumed to have been flared within one hour.
As for operational flare modelling, DWG-PCWU and WC-PDQ were selected.
In order to quantify the contribution of the proposed platforms on air quality in the area, the emissions from WC-PDQ were modelled independently of other sources. Normal operations, emergency and restricted gas export scenarios were modelled.
Prior to the installation of WC-PDQ emissions from the drilling rig on location were modelled, along with the emissions from other platforms in the area. The MODU emission consisted of those from the power generators.

9740-COP-RC-X-00001 Page 22 of 22 Revision: 3 December 2009
As above but with well testing in progress. It was assumed that an EverGreen Burner[7] will be used.
Each scenario described above was modelled on various grid sizes. A finer grid included the concession zone, including all offshore platforms and giving good resolution. A medium sized grid was used to include Baku and Sangachal, the main onshore receptors in the area. A regional grid was used which encompassed the Central Caspian Area which includes adjacent states.
In addition, a separate grid size was used to show in detail the near-source concentrations from the operation of WC-PDQ alone.

9740-COP-RC-X-00001 Page 23 of 23 Revision: 3 December 2009
The predicted concentrations resulting from platform emissions are added to the prevailing background concentrations when determining impact. There is limited information on air quality offshore, but measurements taken along the coastline at Sangachal were available. Sample points which where not strongly affected by local sources were taken to be indicative of the background concentrations, giving a value of 5.0 µg/m3, a value typical of unpolluted, rural areas.
The ADMS model allows discrete receptor locations to be assessed, in addition to modelling on a grid. Platforms offshore were included along with the capital Baku and Sangachal Town. In tables 9.1 to 9.5, the results for all platforms operating are given. In tables 9.6 to 9.8, the results are given for the contribution of WC-PDQ only, as part of the Environmental and Social Impact Assessment requirements.
Onshore locations are compared with the EU air quality standards, with the concentrations based on the contribution from offshore sources and background levels. No account is taken of onshore sources, which will result in far higher levels of pollution locally. Two values are given, the annual average and the peak hourly concentrations, expressed as the highest 18 values, the equivalent of the 99.79th percentile.
Offshore, occupational exposure levels are applicable and these generally relate to an 8 or 12 hour shift.

9740-COP-RC-X-00001 Page 24 of 24 Revision: 3 December 2009
Baku 5.2 7.1
Sangachal 5.1 6.8
CA-CWP 5.1 7.0
CA-PDQ 5.1 7.0
Chirag-1 5.5 14.6
DWG-DUQ 5.4 12.6
DWG-PCWU 5.4 12.9
East Azeri 5.2 13.0
Shah Deniz 1 5.1 6.6
West Azeri 5.8 30.8
WC-PDQ 5.5 13.8
Baku 5.2 7.1
Sangachal 5.1 6.8
CA-CWP 5.1 7.2
CA-PDQ 5.1 7.1
Chirag-1 5.5 14.6
DWG-DUQ 5.4 12.6
DWG-PCWU 5.4 12.9
East Azeri 5.2 13.0
Shah Deniz 1 5.1 6.6
West Azeri 5.8 30.8
WC-PDQ 5.5 13.8

9740-COP-RC-X-00001 Page 25 of 25 Revision: 3 December 2009
Baku 5.2 7.1
Sangachal 5.1 6.8
CA-CWP 5.1 7.5
CA-PDQ 5.1 7.4
Chirag-1 5.5 14.6
DWG-DUQ 5.4 12.6
DWG-PCWU 5.4 12.9
East Azeri 5.2 13.0
Shah Deniz 1 5.1 6.7
West Azeri 5.8 30.8
WC-PDQ 5.5 14.0
Baku 5.2 7.1
Sangachal 5.1 6.8
CA-CWP 5.1 7.1
CA-PDQ 5.1 7.1
Chirag-1 5.5 14.6
DWG-DUQ 5.4 12.7
DWG-PCWU 5.4 12.9
East Azeri 5.2 13.0
Shah Deniz 1 5.1 6.6
West Azeri 5.8 30.8
WC-PDQ 5.5 13.8
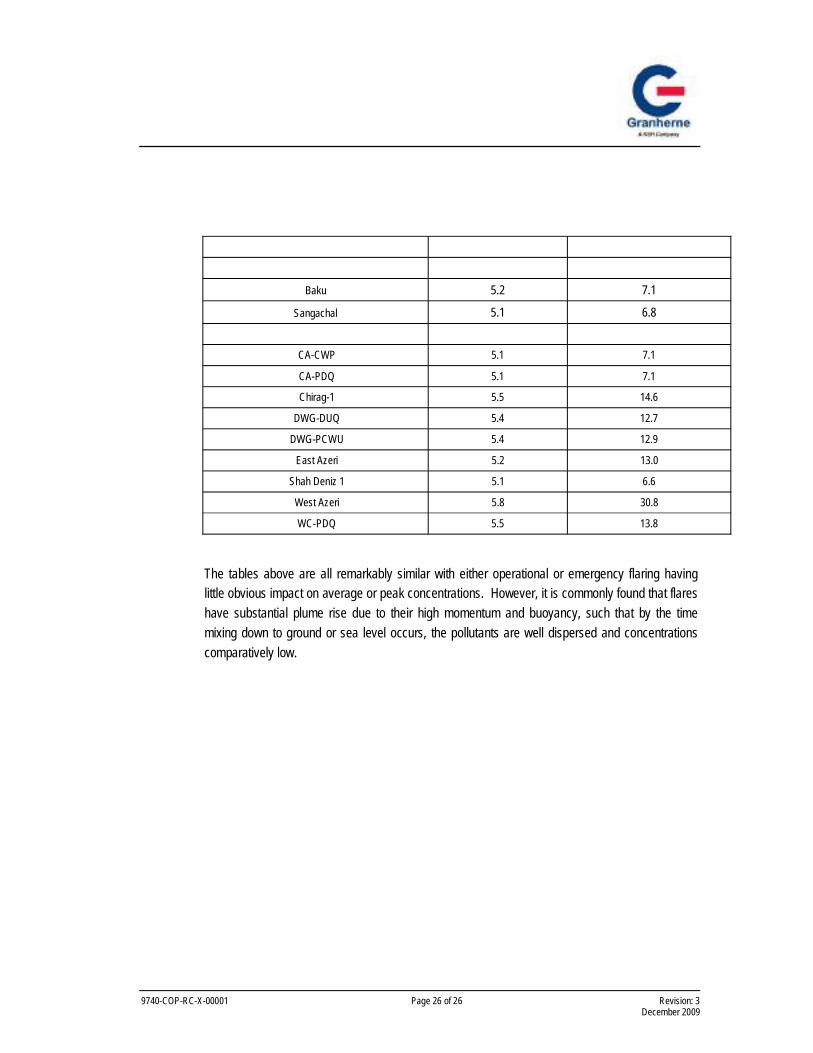
9740-COP-RC-X-00001 Page 26 of 26 Revision: 3 December 2009
Baku 5.2 7.1
Sangachal 5.1 6.8
CA-CWP 5.1 7.1
CA-PDQ 5.1 7.1
Chirag-1 5.5 14.6
DWG-DUQ 5.4 12.7
DWG-PCWU 5.4 12.9
East Azeri 5.2 13.0
Shah Deniz 1 5.1 6.6
West Azeri 5.8 30.8
WC-PDQ 5.5 13.8
The tables above are all remarkably similar with either operational or emergency flaring having little obvious impact on average or peak concentrations. However, it is commonly found that flares have substantial plume rise due to their high momentum and buoyancy, such that by the time mixing down to ground or sea level occurs, the pollutants are well dispersed and concentrations comparatively low.

9740-COP-RC-X-00001 Page 27 of 27 Revision: 3 December 2009
Baku 5.2 7.1
Sangachal 5.1 6.8
CA-CWP 5.1 5.5
CA-PDQ 5.1 5.4
Chirag-1 5.2 7.1
DWG-DUQ 5.2 6.6
DWG-PCWU 5.2 6.6
East Azeri 5.1 5.3
West Azeri 5.1 5.8
WC-PDQ 5.1 5.1
Baku 5.2 7.1
Sangachal 5.1 6.8
CA-CWP 5.1 5.6
CA-PDQ 5.1 5.6
Chirag-1 5.2 7.5
DWG-DUQ 5.2 7.9
DWG-PCWU 5.2 8.0
East Azeri 5.1 5.3
West Azeri 5.1 5.9
WC-PDQ 5.1 5.1

9740-COP-RC-X-00001 Page 28 of 28 Revision: 3 December 2009
Baku 5.2 7.1
Sangachal 5.1 6.8
CA-CWP 5.1 5.5
CA-PDQ 5.1 5.5
Chirag-1 5.2 7.0
DWG-DUQ 5.2 8.7
DWG-PCWU 5.2 9.0
East Azeri 5.1 5.4
West Azeri 5.1 5.7
WC-PDQ 5.1 5.1
WC-PDQ alone makes a very small difference to the air quality, even with respect of other platforms located nearby. .

9740-COP-RC-X-00001 Page 29 of 29 Revision: 3 December 2009
2
3
1
4
65
7
0 10000 20000 30000 40000 50000 60000 70000 80000 90000
Metres
0
10000
20000
30000
40000
5.60
6.00
7.00
9.00
ug/m3
0 10000 20000 30000 40000 50000 60000 70000 80000 90000
Metres
0
10000
20000
30000
40000
2
3
1
4
65
7
10.00
15.00
20.00
40.00
50.00
70.00
80.00
ug/m31.DWG2.West Chirag 3.Chirag-1 4.West Azeri
5.Central Azeri 6.East Azeri 7.Shah Deniz 1
1.DWG2.West Chirag
3.Chirag-1 4.West Azeri 5.Central Azeri
6.East Azeri 7.Shah Deniz 1
In this section contour plots of the 99.79th percentile and annual average NO2 concentrations for the defined scenarios are given. The plots within Section 9.3 show DWG and Central Azeri complexes as single points, representing bridge-linked platforms.

9740-COP-RC-X-00001 Page 30 of 30 Revision: 3 December 2009
0 10000 20000 30000 40000 50000 60000 70000 80000 90000
Metres
0
10000
20000
30000
40000
1
2
34
5 6
7
10.00
15.00
20.00
40.00
50.00
70.00
ug/m31.DWG
2.West Chirag 3.Chirag-1 4.West Azeri
5.Central Azeri 6.East Azeri
7.Shah Deniz 1
2
3
1
4
65
7
0 10000 20000 30000 40000 50000 60000 70000 80000 90000
Metres
0
10000
20000
30000
40000
5.60
6.00
7.00
9.00
ug/m31.DWG
2.West Chirag 3.Chirag-1 4.West Azeri
5.Central Azeri 6.East Azeri 7.Shah Deniz 1

9740-COP-RC-X-00001 Page 31 of 31 Revision: 3 December 2009
1
2
34
5 6
7
0 10000 20000 30000 40000 50000 60000 70000 80000 90000
Metres
0
10000
20000
30000
40000
5.60
6.00
7.00
9.00
ug/m3
0 10000 20000 30000 40000 50000 60000 70000 80000 90000
Metres
0
10000
20000
30000
40000
1
2
34
5 6
7
10.00
15.00
20.00
40.00
50.00
70.00
ug/m3
1.DWG2.West Chirag
3.Chirag-1 4.West Azeri
5.Central Azeri 6.East Azeri 7.Shah Deniz 1
1.DWG
2.West Chirag 3.Chirag-1 4.West Azeri
5.Central Azeri 6.East Azeri 7.Shah Deniz 1

9740-COP-RC-X-00001 Page 32 of 32 Revision: 3 December 2009
0 10000 20000 30000 40000 50000 60000 70000 80000 90000
Metres
0
10000
20000
30000
40000
1
2
34
5 6
7
10.00
15.00
20.00
40.00
50.00
70.00
ug/m31.DWG
2.West Chirag 3.Chirag-1 4.West Azeri
5.Central Azeri 6.East Azeri 7.Shah Deniz 1
1
2
34
5 6
7
0 10000 20000 30000 40000 50000 60000 70000 80000 90000
Metres
0
10000
20000
30000
40000
5.60
6.00
7.00
9.00
ug/m31.DWG
2.West Chirag 3.Chirag-1
4.West Azeri 5.Central Azeri 6.East Azeri
7.Shah Deniz 1

9740-COP-RC-X-00001 Page 33 of 33 Revision: 3 December 2009
1
2
34
5 6
7
0 10000 20000 30000 40000 50000 60000 70000 80000 90000
Metres
0
10000
20000
30000
40000
5.60
6.00
7.00
9.00
ug/m3
0 10000 20000 30000 40000 50000 60000 70000 80000 90000
Metres
0
10000
20000
30000
40000
1
2
34
5 6
7
10.00
15.00
20.00
40.00
50.00
70.00
ug/m31.DWG2.West Chirag 3.Chirag-1
4.West Azeri 5.Central Azeri
6.East Azeri 7.Shah Deniz 1
1.DWG2.West Chirag 3.Chirag-1
4.West Azeri 5.Central Azeri 6.East Azeri
7.Shah Deniz 1

9740-COP-RC-X-00001 Page 34 of 34 Revision: 3 December 2009
The plots of NO2 concentration offshore show the effects of the north-south prevailing wind directions, with the highest concentrations aligned with the wind direction. The areas of higher concentrations, for example above 50 µg/m3 (short–term), are quite limited. Long-term concentrations are only marginally above background at most locations. Flaring, operational or ESD, makes little contribution to pollution levels.
Using a large grid enables onshore receptors to be included. The results are given as contour plots for 99.79th percentile and annual average concentrations in the tables below.
9.00
10.00
20.00
30.00
40.00
55.00
ug/m3
5.75
6.00
6.50
7.00
8.50
ug/m3

9740-COP-RC-X-00001 Page 35 of 35 Revision: 3 December 2009
9.00
10.00
20.00
30.00
40.00
55.00
ug/m3
5.75
6.00
6.50
7.00
8.50
ug/m3

9740-COP-RC-X-00001 Page 36 of 36 Revision: 3 December 2009
9.00
10.00
20.00
30.00
40.00
55.00
ug/m3
5.75
6.00
6.50
7.00
8.50
ug/m3

9740-COP-RC-X-00001 Page 37 of 37 Revision: 3 December 2009
ug/m3
0 5000 10000 15000 20000 25000
Metres
0
5000
10000
15000
20000
25000
DWG
West Chirag
Chirag-1
West Azeri
Central Azeri
East Azeri
5.50
6.00
7.00
10.00
10.50
9.00
10.00
20.00
30.00
40.00
55.00
ug/m3
In this section, only WC-PDQ is assumed to be operating in order to allow the contribution of its emissions to air quality levels. The grid size is reduced to enable near-source concentrations to be show in detail.

9740-COP-RC-X-00001 Page 38 of 38 Revision: 3 December 2009
0 5000 10000 15000 20000 25000
Metres
0
5000
10000
15000
20000
25000
DWG
West Chirag
Chirag-1
West Azeri
Central Azeri
East Azeri 5.20
5.30
5.40
5.50
ug/m3
ug/m3
0 5000 10000 15000 20000 25000
Metres
0
5000
10000
15000
20000
25000
DWG
West Chirag
Chirag-1
West Azeri
Central Azeri
East Azeri
5.50
6.00
7.00
10.00
10.50

9740-COP-RC-X-00001 Page 39 of 39 Revision: 3 December 2009
0 5000 10000 15000 20000 25000
Metres
0
5000
10000
15000
20000
25000
DWG
West Chirag
Chirag-1
West Azeri
Central Azeri
East Azeri 5.20
5.30
5.40
5.50
ug/m3
ug/m3
0 5000 10000 15000 20000 25000
Metres
0
5000
10000
15000
20000
25000
DWG
West Chirag
Chirag-1
West Azeri
Central Azeri
East Azeri
5.50
6.00
7.00
10.00
10.50

9740-COP-RC-X-00001 Page 40 of 40 Revision: 3 December 2009
0 5000 10000 15000 20000 25000
Metres
0
5000
10000
15000
20000
25000
DWG
West Chirag
Chirag-1
West Azeri
Central Azeri
East Azeri 5.20
5.30
5.40
5.50
ug/m3
The figures show that, during normal operations, the maximum concentrations are found under 3km from the platform. When flaring, in particular during the ESD flaring, the maximum is found between 5-15km from the platform. This is due to the greater effective height of the flare plume resulting in a longer period for mixing down to sea level to occur. The maximum concentration remains well below occupational exposure limits.
An area of 550km x 550km was modelled in order to show adjacent states. The results are presented in Appendix II in Figures AII.1a – AII.5b. The contours serve to illustrate the shape of the concentration distrubutions but the pollution levels are well below those considered significant as all points in the grid. It should be bourne in mind that the total emissions from the concession area are below many individual industrial plants or cities, and that emissions sources are comparatively high which aids dispersion, reducing the concentrations at the ground.
The Dada Gorgud MODU was modelled druing drilling and well testing. The NO2 release rate from the well test was found to be less than operational or emergency flaring from a production platform. The results show that the MODU has no significant impact on adjacent offshore receptors or onshore areas. Smoke , a common problem with well tests, should be effectively controlled by the use of the EverGreen Burner.

9740-COP-RC-X-00001 Page 41 of 41 Revision: 3 December 2009
The offshore air quality in the region has been determined on the basis of the emissions from the platforms in the Central Caspian using dispersion modelling. Meteorological data files, suitable for input into dispersion modelling, have been prepared for this study. They have been based upon measurements made offshore of the platforms.
The focus has included both the exposure of workers on the new WC-PDQ platform to air pollutants and of the contribution of the platform itself to air pollution levels in the region. Both offshore and onshore air quality impacts have been assessed.
Occupational exposure limits apply offshore and the prediction concentrations are low compared with the occupational limits. Indeed, the air quality offshore would be regarded as good even when compared with onshore standards. The concentrations of NO2 are well below the EU standards of 40µg/m3 annual average and 200 µg/m3 99.79th percentile.
The findings show that, for receptors within the region, including marine traffic around the offshore platforms and onshore receptors along the coastline, including Baku and Sangachal, NO2
concentrations resulting from platform emission are low. Emissions from the Dada Gorgud MODU during both normal operations and well testing are low with no significant impacts to receptors within the Central Caspian.
In conclusion, the proposed WC-PDQ platform workforce is not at risk from air pollution nor does the addition of the new platform and associated drilling activities cause levels in the region to rise significantly. There is a small contribution from offshore to onshore, but it is well below a level that could be considered significant.

9740-COP-RC-X-00001 Page 42 of 42 Revision: 3 December 2009
1 EU First Daughter Directive (99/30/EC),1999
2 Rolls-Royce,” Combustion Gas Turbine Performance Curves (Purchase Order No. BPAC-ACGX-PMME01A)”, 2005
3 Caspian Sea “Ocean Meteorological And Oceanographic Study 2”,Oceanweather Inc, 2005
4 Cambridge Environmental Research Consultants,”ADMS4 User Guide”, June 2007
5 American Conference of Governmental Industrial Hygienists, 2008
6 UK Offshore Operators Association ,“UKOOA emission factors for flares”,2005
7 Schlumberger, “EverGreen Burner”,2006

9740-COP-RC-X-00001 Appendix I - Page 1 of Revision: 3 December 2009
0
0
3
1.5
6
3.1
10
5.1
16
8.2
(knots)
(m/s)
Wind speed
0° 10°20°
30°
40°
50°
60°
70°
80°
90°
100°
110°
120°
130°
140°
150°160°
170°180°190°200°
210°
220°
230°
240°
250°
260°
270°
280°
290°
300°
310°
320°
330°340°
350°
300
600
900
1200

9740-COP-RC-X-00001 Appendix II - Page 1 of 76 Revision: 3 December 2009

9740-COP-RC-X-00001 Appendix II - Page 2 of 76 Revision: 3 December 2009

9740-COP-RC-X-00001 Appendix II - Page 3 of 76 Revision: 3 December 2009

9740-COP-RC-X-00001 Appendix II - Page 4 of 76 Revision: 3 December 2009

9740-COP-RC-X-00001 Appendix II - Page 5 of 76 Revision: 3 December 2009

9740-COP-RC-X-00001 Appendix II - Page 6 of 76 Revision: 3 December 2009

9740-COP-RC-X-00001 Appendix II - Page 7 of 76 Revision: 3 December 2009

9740-COP-RC-X-00001 Appendix II - Page 8 of 76 Revision: 3 December 2009

9740-COP-RC-X-00001 Appendix II - Page 9 of 76 Revision: 3 December 2009

9740-COP-RC-X-00001 Appendix II - Page 10 of 76 Revision: 3 December 2009

9740-COP-RC-X-00001 Appendix II - Page 11 of 76 Revision: 3 December 2009

9740-COP-RC-X-00001 Appendix II - Page 12 of 76 Revision: 3 December 2009

9740-COP-RC-X-00001 Appendix II - Page 13 of 76 Revision: 3 December 2009
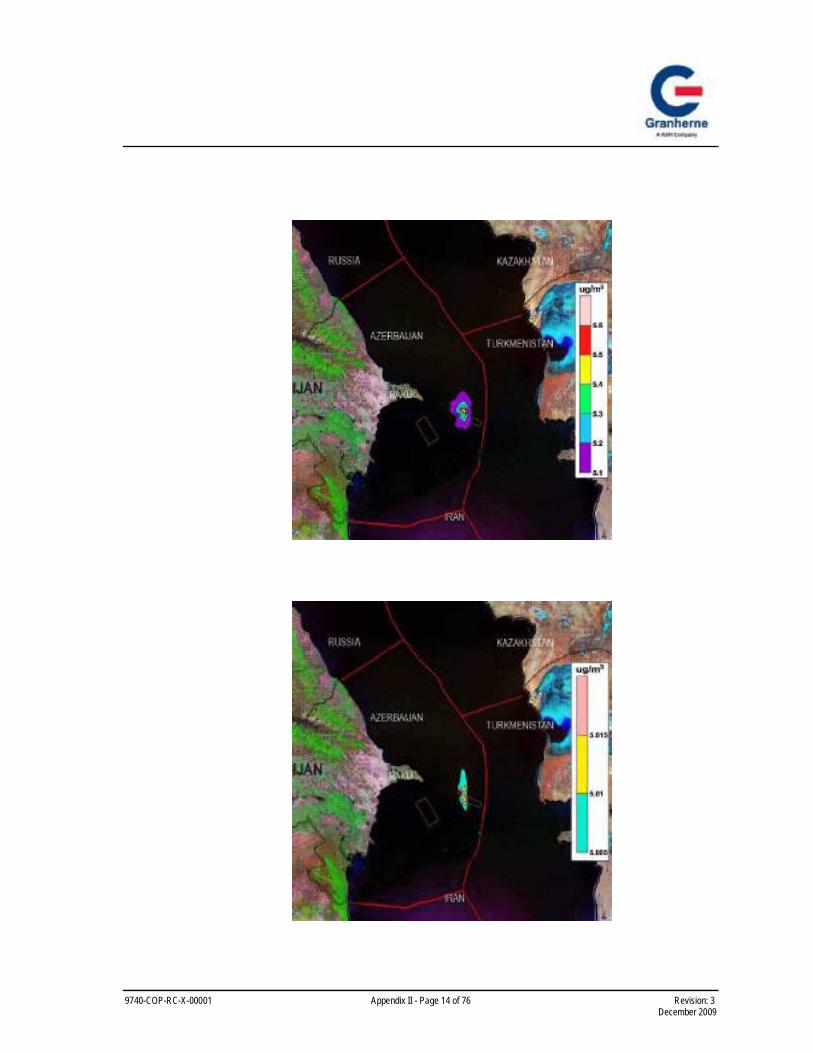
9740-COP-RC-X-00001 Appendix II - Page 14 of 76 Revision: 3 December 2009

9740-COP-RC-X-00001 Appendix II - Page 15 of 76 Revision: 3 December 2009

9740-COP-RC-X-00001 Appendix II - Page 16 of 76 Revision: 3 December 2009


AZERBAIJAN INTERNATIONAL OPERATING COMPANY (AIOC) CHIRAG OIL PROJECT WEST CHIRAG OFFSHORE PLATFORM
APPENDIX 11B UPDATE 1: AIR DISPERSION MODELLING FOR WEST CHIRAG OFFSHORE PLATFORM
December 2009


Following consultation for the COP ESIA a number of amendments and updates have been made to the
offshore dispersion modelling assessment as requested by the ESIA reviewers. These comprise:
Modelling and assessment of emissions of SO2, CO and PM10 from the offshore facilities. Comparison between predicted NO2 concentrations against the traditional (ex Soviet) air quality limits
for Azerbaijan; and Additional details regarding model verification.
This report has recently been updated to include emissions of sulphur dioxide, carbon monoxide and particulates. The gas turbines on the platform are RB-211 units and emission calculations have been based on the data test sheets provided by RR and data from ACG on fuel gas composition.
Offshore turbine configuration and loading parameters were based on the available operational data, with
emissions calculated accordingly. Flare emissions where calculated based on the values given by UKOOA and, for particulate emissions, by CONCAWE. The date on emissions is given in Tables 1 and 2.
Table 1 RB211 Turbine Emission Rates – other emissions (S02, CO, PM10)
Load Percentage Release Rate (g/s) Efflux Velocity
(m/s)
SO2 50% 1.27 20.30
CO 50% 1.46 20.30
PM10 50% 0.13 20.30
Source: RR RB211 Model 6562 data sheet [1]
Table 2 Flare Emissions Rates – other emissions (S02, CO, PM10)
Release Type Release Rate
(g/s)
Fm
(m4/s2)
Fb
(Mw)
Pilot & Purge(All) NO2 (a) 0.03 1 1
Pilot & Purge(All) SO2 (b) 0.04 1 1
Pilot & Purge(All) CO (a) 0.20 1 1
Pilot & Purge(All) PM10 (c) 1.07 1 1
Emergency (WC-PDQ) SO2 (b) 109.70 73,272 2,401
Emergency (WC-PDQ) CO (a) 567.16 73,272 2,401
Emergency (WC-PDQ) PM10 (c) 3115.57 73,272 2,401
Source: (a) UKOOA emission factors for flares[2] (b) Calculated from gas composition (c) CONCAWE factor[3]
Note WC-PDQ emissions amended to reflect updated ESD rate.
The Central Caspian region was modelled using a grid with the dimensions of 550km x 550km, covering a
substantial section of the Central Caspian Sea and surrounding land borders of Russia, Iran, Turkmenistan and Kazakhstan. The number of grid lines used was 101, the maximum permitted in ADMS, providing a resolution of approximately 5.45km.
Further details of the grids used and sensitive receptors in the area are given in the original report ‘Air Dispersion Modelling for West Chirag Offshore Platform’ report (June 2009) Section 6.0 [4].
The meteorological data set used and the surface characteristic have been kept common to those used in the original study, reference should be made to ‘Air Dispersion Modelling for West Chirag Offshore Platform’ report (June 2009) Section 7.0 for further information.
The predicted concentrations resulting from platform emissions are added to the prevailing background concentrations when determining impact. There is limited information on air quality offshore, but measurements taken along the coastline at Sangachal were available [5]. Sample points which where not
strongly affected by local sources were taken to be indicative of the background concentrations, values typical of unpolluted, rural areas. These are given below:
SO2 8.5 µg/m3; and
CO 2000.0 µg/m3.
The background concentrations of PM10 where taken from a study on the air quality of Baku [6].
PM10 38 µg/m3.
Scenario 4 focuses exclusively on WC-PDQ emissions. This is in order to quantify the contribution of the
proposed development on air quality in the area. The emissions from WC-PDQ were modelled independently of other sources. Normal operations, emergency and restricted gas export scenarios were modelled. For further details of the other scenarios modelled please refer to ‘Air Dispersion Modelling for
West Chirag Offshore Platform’ report (June 2009) Section 8.0.
The original study focused on nitrogen dioxide as the prime pollutant of interest. In this updated report sulphur dioxide, carbon monoxide, particulate matter are also assessed and all are evaluated with respect to EU air quality standards and the traditional Azeri air quality concentration limits (as requested by the
ESIA reviewers).
The WC PDQ platform is modelled in normal operational mode and when under going emergency flaring.

In Table 3 the results are given of dispersion modelling for SO2, CO and PM10 for WC PDQ alone, operating normally.
Table 3 WC-PDQ Normal Operations Only, No Other Platforms in Operation
SO2 24hr Peak (ug/m3) 24hr Peak P99.18 (ug/m3) 1 hour P99.73
Receptor Modelled SO2
Concentration SO2 Air Quality Standard Modelled SO2
Concentration
EU Air Quality
StandardModelled SO2
Concentration EU Air Quality
Standard
Baku 8.506 50 8.50 125 8.53 350
Sangachal 8.506 50 8.50 125 8.52 350
CO 24hr Peak (ug/m3) 1hr Peak (ug/m3)
Receptor
Modelled CO Concentration
CO Air Quality Standard as
EU Air Quality
Standard
Modelled CO Concentration CO Air Quality Standard
Baku 2000.01 3000 10,000 2000.09 5000
Sangachal 2000.01 3000 10,000 2000.09 5000
PM10 24hr Peak (ug/m3) 24hr Peak P98.08 (ug/m3) 1hr Peak (ug/m3)
Modelled PM10 Concentration
PM10 Air Quality Standard Modelled PM10 Concentration
EU Air Quality
Standard
Modelled PM10 Concentration
PM10 Air Quality
Standard
Baku 38.02 100 38.002 50 38.04 300
Sangachal 38.02 100 38.002 50 38.03 300
Table 3 shows that the increase in the concentrations of pollutant species associated with emissions from the WC-PDQ platform during normal operations will not result in any exceedances of the traditional Azeri limits.
The incremental contribution of the platform emissions to onshore air pollution is of low significance.
WC PDQ has been modelled under emergency flaring conditions; the results for SO2, CO and PM10 are given in Table 4.
Table 4 WC-PDQ ESD Flaring Only, No Other Platforms in Operation
SO2 24hr Peak (ug/m3) 24hr Peak P99.18 (ug/m3) 1 hour P99.73
Receptor Modelled SO2
Concentration SO2 Air Quality Standard Modelled SO2
Concentration
EU Air Quality
StandardModelled SO2
Concentration EU Air Quality
Standard
Baku 8.56 50 8.60 125 8.53 350
Sangachal 8.534 50 8.53 125 8.51 350

CO 24hr Peak (ug/m3) 1hr Peak (ug/m3)
Receptor
Modelled CO Concentration
CO Air Quality Standard
EU Air Quality
Standard
Modelled CO Concentration CO Air Quality Standard
Baku 2000.3 3000 10,000 2002.34 5000
Sangachal 2000.17 3000 10,000 2001.70 5000
PM10 24hr Peak (ug/m3) 24hr Peak P98.08 (ug/m3) 1hr Peak (ug/m3)
Modelled PM10 Concentration
PM10 Air Quality Standard Modelled PM10 Concentration
EU Air Quality
Standard
Modelled PM10 Concentration
PM10 Air Quality
Standard
Baku 39.64 100 38.39 50 50.77 300
Sangachal 38.93 100 38.07 50 47.27 300
Table 4 shows that the increase in the concentrations of pollutant species associated with emissions from
the WC-PDQ platform during emergency flaring conditions will not result in any exceedances of the traditional Azeri limits.
The incremental contribution of the platform emissions to onshore air pollution is of low significance.
Contour plots showing the predicted dispersion for each pollutant are provided within Appendix I.

The results given in Tables 5 and 6 show that the standards recommended will not be exceeded, including traditional Azeri standards and EU standards.
Table 5 WC-PDQ Normal Operations Only,
No Other Platforms in Operation: Predicted NO2 Concentrations
Baku 5.10 5.18
Sangachal 5.10 5.16
Baku 5.11 5.14
Sangachal 5.11 5.13
CA-CWP 5.1 5.5
CA-PDQ 5.1 5.4
Chirag-1 5.2 7.1
DWG-DUQ 5.2 6.6
DWG-PCWU 5.2 6.6
East Azeri 5.1 5.3
West Azeri 5.1 5.8
WC-PDQ 5.1 5.1
Table 6 WC-PDQ Operational Flaring (Restricted Gas Export) Only,
No Other Platforms in Operation: Predicted NO2 Concentrations
Baku 5.1 5.21
Sangachal 5.1 5.19
Baku 5.11 5.14
Sangachal 5.11 5.13
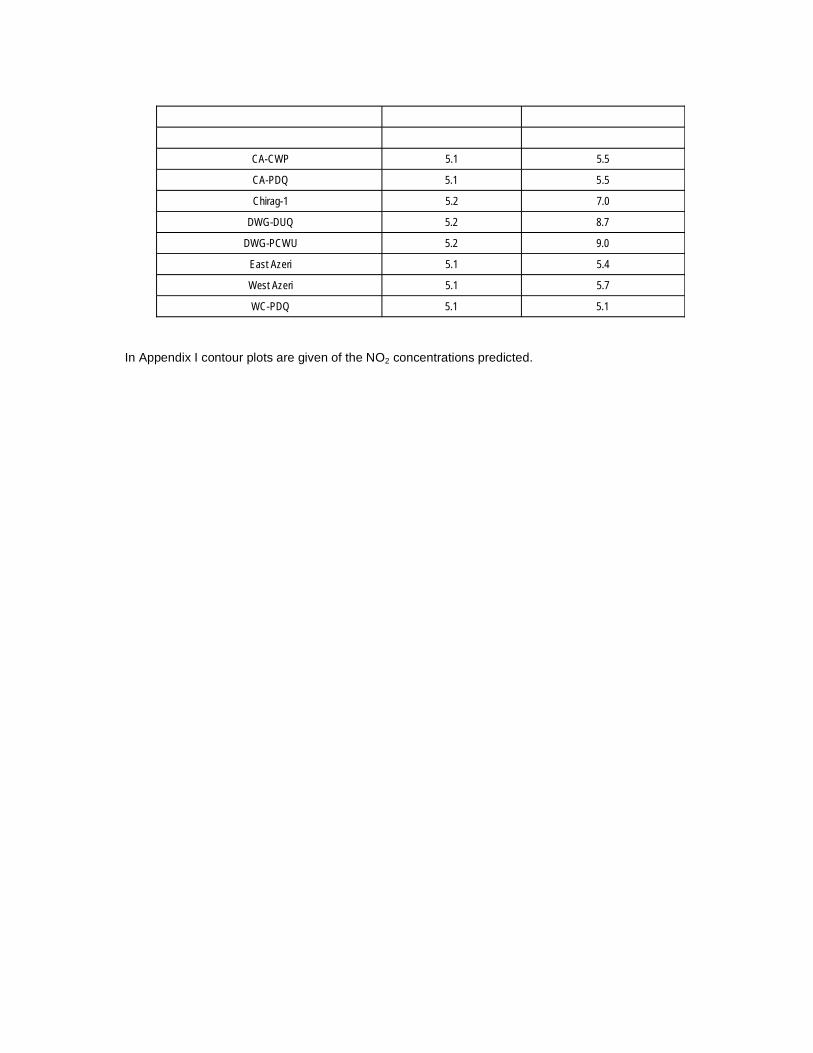
CA-CWP 5.1 5.5
CA-PDQ 5.1 5.5
Chirag-1 5.2 7.0
DWG-DUQ 5.2 8.7
DWG-PCWU 5.2 9.0
East Azeri 5.1 5.4
West Azeri 5.1 5.7
WC-PDQ 5.1 5.1
In Appendix I contour plots are given of the NO2 concentrations predicted.

ADMS-4.1 was selected because of its superior dispersion model and plume rise methodology and integrated offshore marine boundary layer facility. The developers of this model, Cambridge Environmental
Research Consultants (CERC), were consulted about the use of the model offshore and the setting up of dispersion parameters.
Many regulatory authorities explicitly endorse or accept the use of ADMS4. In the UK the Environment Agency does not formally “approve” any model (the UK Government's open policy). However ADMS is used routinely used in applications to the Environment Agencies in the UK and accepted by them; its
development was also supported by the Environment Agencies in UK. The three Environment Agencies: Environment Agency of England and Wales, Scottish Environmental Protection Agency and the Department of the Environment in Northern Ireland, are all users of ADMS. ADMS is also used routinely as
a key model on behalf of DEFRA the government department for the environment.
ADMS is on the US EPA’s Appendix W list of alternative models. ADMS models accepted for all types of environmental impact assessment in China. ADMS models are used by city or regional government and
others in France, Italy, the Netherlands, Ireland, the Baltic States, South Africa, Hungary and Thailand and was used by the California Department of Health. The models are also used in Spain, Portugal, Sweden,
Cyprus, Austria, United Arab Emirates, Sudan, Saudi Arabia, Tunisia, Slovenia, Poland, New Zealand, Korea, Japan, India, Canada and Australia.
An extensive library of ADMS validation reports is available at:
http://www.cerc.co.uk/software/publications.htm
5.0 References
1 Rolls-Royce,” Combustion Gas Turbine Performance Curves (Purchase Order No. BPAC-ACGX-PMME01A)”, 2005
2 UK Offshore Operators Association ,“UKOOA emission factors for flares”, 2005
3 Concawe, 2006. Air pollutant emission estimation methods for EPER and PRTR reporting by refineries (revised), Prepared by the CONCAWE Air Quality Management Group’s Special Task Force on Emission Reporting Methodologies (STF-64), P. Goodsell (Technical Coordinator), Report no. 9/05R, Brussels, April 2006
4 Granherne Air Dispersion Modelling for West Chirag Offshore Platform’ report 9740-COP-RC-X-00001, June 2009
5 Sangachal Ambient Air Quality Monitoring Programme 2007. First round (September). AmC report 7716-R1, 2007
6 Air Quality Monitoring in the Central Caucasus, Joint UNDP/World Bank Energy Sector Management Assistance Programme (ESMAP), no. 21295, 2000
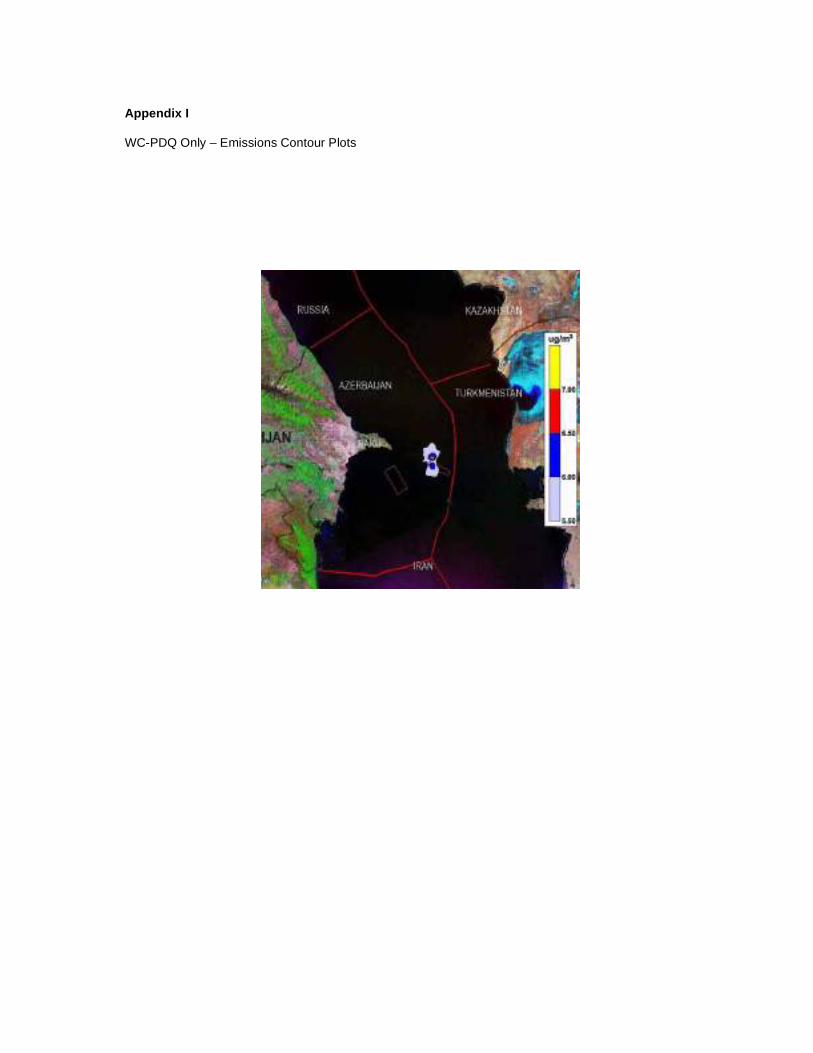
Appendix I
WC-PDQ Only – Emissions Contour Plots


APPENDIX 11C
Underwater Noise Modelling


Acoustic Impact of Drilling and Vessel Noise: Chirag Oil Project

Report Title:
Project No:
Status:
Client Contact Name:
Client Company Name:
Issued By:
Document Production / Approval Record
Issue No: 2
Name Signature Date Position
Document Revision Record
Issue No Date Details of Revisions

LIMITATION
COPYRIGHT
CONTENTS
Section Page
EXECUTIVE SUMMARY............................................................................................................... 5
1. INTRODUCTION.............................................................................................................. 6
2. SENSITIVE MARINE FAUNA IN THE CASPIAN SEA ................................................... 7
3. ACOUSTIC IMPACTS AND THRESHOLDS................................................................. 11
4. SOURCES OF NOISE: VESSEL, DRILLING AND PILING.......................................... 18
5. MODELLING OF THE ACOUSTIC NOISE CAUSED BY SHIPPING AND DRILLING.............................................................................................................. 24
6. ACOUSTIC IMPACT ANALYSIS................................................................................... 31

CONTENTS
Section Page
7. SUMMARY AND CONCLUSIONS ................................................................................ 37

EXECUTIVE SUMMARY

1. INTRODUCTION

2. SENSITIVE MARINE FAUNA IN THE CASPIAN SEA
2.1. Introduction
2.2. Fish
Osteichthyes
Table 2-1: Fish species found in the ACG contract area
Fish Swim Bladder? Conservation Status
Migratory Species
Sturgeon Fish (Acipenseridae)
Huso huso
Acipenser gueldenstaedtii
A. gueldenstaedtii persicus

Fish Swim Bladder? Conservation Status
A. nudiventris
A. stellatus
Kilka (Clupeonella)
Clupeonella grimmi
C. engrauliformis
Clupeonella delicatula caspia
Salmo trutta caspius
Caspiomyzon wagneri
Shad (Alosa Cuvier)
Alosa caspia
A. saposhnikovi
A. kessleri
A. volgensis
Carp (Cyprinidae)
Rutilus frisii kutum
Mullet (Mugilidae)
Liza saliens
L. aurata
Goby (Gobiidae)
Neogobius caspius
Neogobius melanostomus affinis
Neogobius syrman eurystomus
Neogobius fluviatilis pallasi
Neogobius kessleri gorlap
Knipowitschia longicaudata
Benthophilus grimmi
Resident Species
Atherina mochon pontica
Syngnathus nigrolineatus
2.3. Birds
Table 2-2: Seabird species found in the ACG contract area
BIRDS Conservation Status
Phalacrocorax carbo
Larus argentatus
Sterna hirundo
Sterna sandvicensis
2.4. Sea mammals

Table 2-3: Marine mammal species found in the ACG contract area
Mammals
Phoca caspica
2.5. Conclusion

3. ACOUSTIC IMPACTS AND THRESHOLDS
3.1. Introduction
3.2. Lethality and physical injury
et al5
et al9.,
3.3. Auditory damage
3.4. Audiogram data
et al.
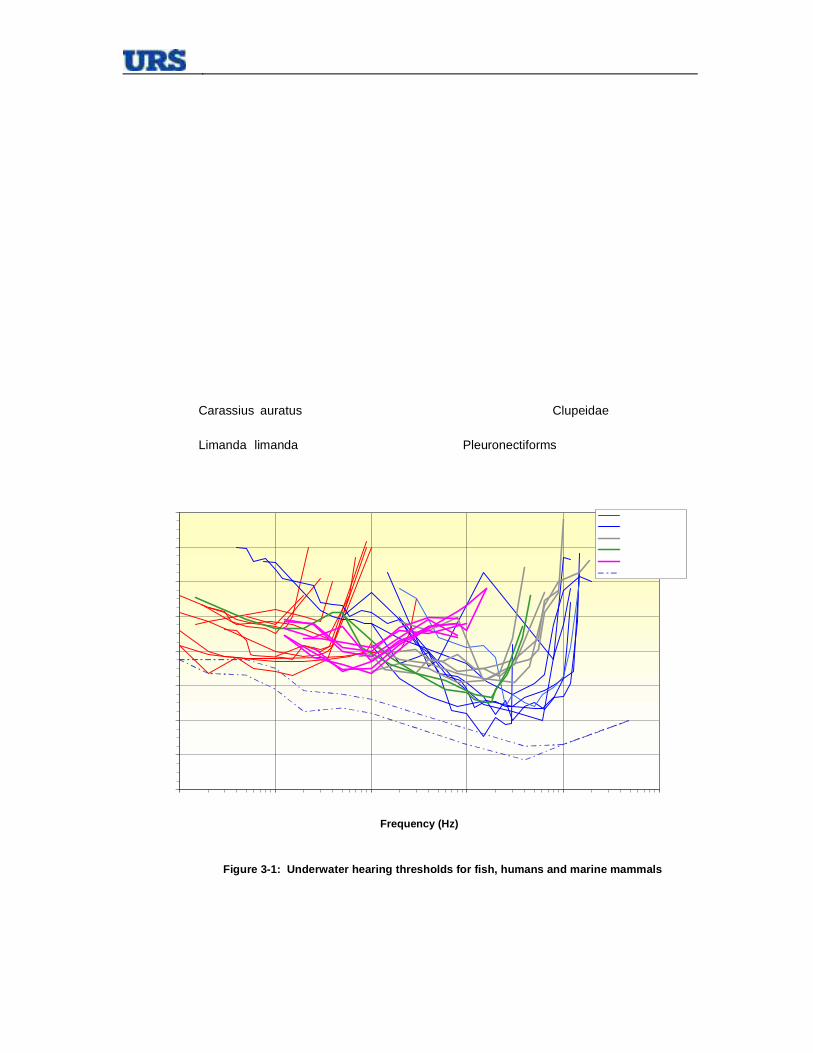
Carassius auratus Clupeidae
Limanda limanda Pleuronectiforms
Frequency (Hz)
Figure 3-1: Underwater hearing thresholds for fish, humans and marine mammals

Phoca vitulina Halichoerus grypusPusa hispida Monachus schauinslandiMirounga Otariidae
Gobiidae
Proceedings of the Institute of Acoustics

Figure 3-2: Audiograms for generic and proxy species
3.5. Behavioural response
et al.15, et al.16,Phoca vitulina
Haliochoerus grypus
Delphinus delphis
Frequency (Hz)

species
species
3.6. Range to masking

3.7. Summary of impact thresholds
3.7.1. Fatality and physical injury
3.7.2. Audiological injury
3.7.3. Behavioural species
species
species
species
species

4. SOURCES OF NOISE: VESSEL, DRILLING AND PILING
4.1. Introduction
4.2. Vessel noise
Table 4-1: Summary details of vessels used in COP project
Vessel Type LOA Gross tonnage

et al
Table 4-2: Source levels of underwater noise for small vessels.
Sources Freq (Hz)
dB re 1 Paat 1 m
Small ship55 m-85m long
MS Sparton 25m long
Arctic Fox
Arctic Fox
Arctic Fox
Arctic Fox
Twin diesel 34m long
Trawlers
Imperial Adgo 16m
Outboard drive
MV Sequel
Zodiac
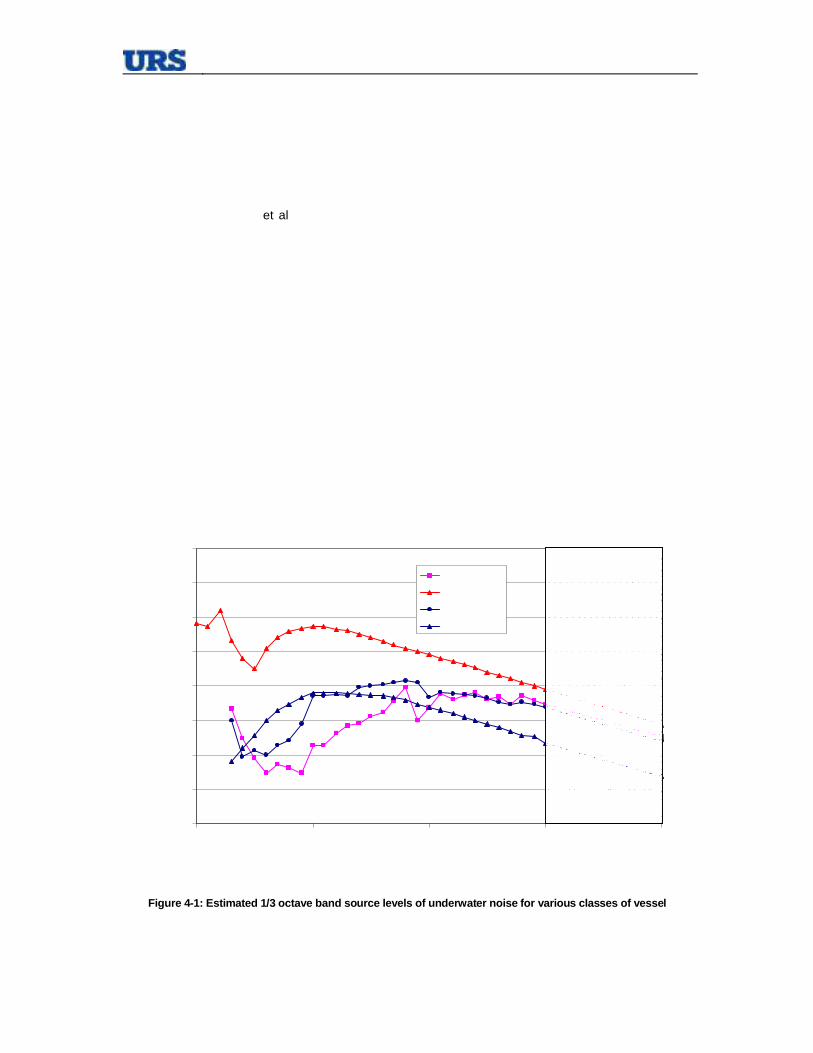
et al
Figure 4-1: Estimated 1/3 octave band source levels of underwater noise for various classes of vessel

Table 4-3: Estimated broadband source levels for various classes of vessel
Vessel type Broadband Source Sound Pressure Level (dB re 1 Pa at 1 m)
Trawler
34 m diesel
Supertanker
Tug/barge
4.3. Drilling noise
et al.21
4.4. Piling noise
Ocean General Pacific Ariki
Pacific Frontier Reef Venture

et al.
et al.

4.5. Background noise
et
al
4.6. Summary of underwater noise sources

5. MODELLING OF THE ACOUSTIC NOISE CAUSED BY SHIPPING AND DRILLING
5.1. Description of the model and limitations
et al.
et al.
5.2. Oceanographic data

5.3. Seabed data

Table 5-1: Seabed sediment properties
Layer Compressional wave velocity
Vp m/s
Density kg/m3
Attenuation dB/m/kHz
Thickness m
Terrigenous mud
Metamorphic basement
Sound speed m/s
Figure 5-1: Seasonal sound speed profiles
Range km
Figure 5-2: Bathymetric profile at the Chirag oilfield site

5.4. Acoustic data
et al
et al.
et al.
Table 5-2: Acoustic modelling input parameters
Vessel Drilling Piling
Frequency Hz
Source depth m
Beam pattern degrees

5.5. Discussion of model runs
Error! Reference source not found.
et al. et al.
et al.

Figure 5-3: Sound pressure level as function of range for vessel noise
Figure 5-4: Sound pressure level as function of range for drilling noise

Figure 5-5: Sound pressure level as function of range for piling noise

6. ACOUSTIC IMPACT ANALYSIS
6.1. Introduction
viz.
6.2. Lethal injury range
6.3. Physical injury range
6.4. Auditory injury range

6.5. Behavioural avoidance range
6.5.1. Behavioural effects from shipping noise
Table 6-1: Apparent loudness of vessel and drilling noise for target species
SpeciesApparent loudness
vessel dBht Apparent loudness
drilling dBht Apparent loudness
30" pile dBht Apparent loudness
96" pile dBht
Non-swimbladder fish
Swimbladder fish
Pinniped

Figure 6-1: Comparison of hearing sensitivity of a fish with no swimbladder against vessel spectrum levels
6.5.2. Behavioural effects from drilling noise
Frequency (Hz)

6.5.3. Behavioural effects from piling noise
6.5.4. Masking ranges

Table 6-2: Behavioural impact ranges for non-swim bladder fish
Nearcomplete avoidance (100 dBht)
Strongavoidance (90 dBht)
Mildavoidance (75 dBht)
Low likelihood
ofavoidance (50 dBht)
Threshold of audibility
(0 dBht)
Maskingrange
Vessel
Drilling
Piling 30"
Winter
Piling 96"
Vessel
Drilling
Piling 30"
Summer
Piling 96"
Table 6-3: Behavioural impact ranges for fish with swim bladders
Nearcomplete avoidance (100 dBht)
Strongavoidance (90 dBht)
Mildavoidance (75 dBht)
Low likelihood
ofavoidance (50 dBht)
Threshold of audibility
(0 dBht)
Maskingrange
Vessel
Drilling
Piling 30"
Winter
Piling 96"
Vessel
Drilling
Piling 30"
Summer
Piling 96"

Table 6-4 : Behavioural impact ranges for pinnipeds
Nearcomplete avoidance (100 dBht)
Strongavoidance (90 dBht)
Mildavoidance (75 dBht)
Low likelihood
ofavoidance (50 dBht)
Threshold of audibility
(0 dBht)
Maskingrange
Vessel
Drilling
Piling 30"
Winter
Piling 96"
Vessel
Drilling
Piling 30"
Summer
Piling 96"

7. SUMMARY AND CONCLUSIONS
viz


APPENDIX 11D
Drilling Discharge Modelling


Azeri Chirag Gunashi Field Drill Cuttings Dispersion Modelling 1 of 40 Appendix 11D Eng FINAL
Report Title Azeri Chirag Gunashi Field
Drill Cuttings Dispersion Modelling
Client: BP
Document No: 46211 Report02v2 Release: 2 Copy No:
Status Final Report
Report Date: 08 June 2009
Holds:
Name: Signature: Date:
Prepared by: J. Mindel 08/06/2009
Checked by: A. Lebas 08/06/2009
Approved by: C. Craddock 08/06/2009
Distribution: BP
Previous Release History:
Release No: Status: Date:
46211 Report02v1 1 Draft Report for internal review
05/06/2009
BMT Fluid Mechanics Limited commercial reports may not be published, except in full, unless permission for an approved abstract has previously been obtained from the company.
This report is supplied for the purposes of the client only, and in the expectation that no other person will use or rely upon the results therein. No responsibility to any other person is accepted by the company.

BMT Fluid Mechanics Limited COMMERCIAL-IN-CONFIDENCE
Azeri Chirag Gunashi Field Drill Cuttings Dispersion Modelling 2 of 40 Appendix 11D Eng FINAL
EXECUTIVE SUMMARY A Computational Fluid Dynamics (CFD) study was carried out by BMT Fluid Mechanics (BMT) to assess the dispersion and deposition of subsea drill cutting discharges from the Chirag Oil Project (COP) Development in the Azeri Chirag Gunashi (ACG) Field 110km off the coast of Baku, Azerbaijan in the Caspian Sea. The study was carried out for BP.
Discharges from drilling the 26” hole section were simulated. The discharges will take place vertically downward from a caisson (C5, Ø 0.8 m) at a depth of 136m. The water depth at the drilling location will be 168m.
A total of 28 wells will be drilled through the COP template. The total drilling duration for a single well is estimated to be 30 hours and will be followed by a post-drilling discharge of 4 hours.
The section will be drilled using Untradrill, a water-based mud which comprises of barite, water and minor chemicals (principally KCI). A total estimate of 500 metric tonnes is to be required to drill this section.
The discharge composition and rates in metric tonnes per hour for the drilling and post-drilling operations are summarised in Table 4.1.
Discharges from drilling the 36” hole section through the 48 well template were modelled. In this case, the material being discharged was composed of bentonite and water-based mud. Discharges take place vertically through the seabed. The total drilling duration for a single well will be 8 hours.
The discharge composition and rates in metric tonnes per hour for the drilling and post-drilling operations are summarised in Table 4.2.
Discharges from drilling the 26” hole section from the MODU were simulated. The discharges will take place vertically downward from a caisson (assumed to be C5 for reference, Ø 0.8 m) at a depth of 11m.
A total of 20 wells will be pre-drilled. The total drilling duration for a single well is estimated to be 30 hours and will be followed by a post-drilling discharge of 4 hours.
The discharge composition and rates in metric tonnes per hour for the drilling and post-drilling operations are summarised in Table 4.1.
From the results obtained in the simulations it can be observed that given a discharge rate and duration, the deposition footprint is highly dependant on both discharge depth and current speed. These factors highly influence the deposition rate, which together with particle size and shape control the height and shape of the deposited material. These influences can be observed in Table 4.4 to Table 4.6.
For the simulations carried out in this report, currents were assumed constant and unidirectional. Hence the footprint length for the predominant current cases, and maximum height for the near-stagnant current conditions, can be considered as worst-case scenarios.

BMT Fluid Mechanics Limited COMMERCIAL-IN-CONFIDENCE
Azeri Chirag Gunashi Field Drill Cuttings Dispersion Modelling 3 of 40 Appendix 11D Eng FINAL
Azeri Chirag Gunashi Field Drill Cuttings Dispersion Modelling
Contents
1. Introduction ........................................................................................................ 4
1.1. General ...................................................................................................... 4
1.2. Report Structure.......................................................................................... 4
2. Objectives ........................................................................................................... 5
3. Scope of Work ..................................................................................................... 6
3.1. Model Construction...................................................................................... 6
3.2. Drill Cuttings ............................................................................................... 6
3.3. Reporting.................................................................................................... 6
4. CFD Analysis........................................................................................................ 7
4.1. Introduction................................................................................................ 7
4.2. Discharge Scenarios..................................................................................... 7
4.3. Material Properties....................................................................................... 8
4.4. Ambient Condition ....................................................................................... 8
4.5. Current Conditions....................................................................................... 8
4.6. Results ....................................................................................................... 8
4.7. Conclusions................................................................................................. 9
5. References .........................................................................................................10
6. Tables................................................................................................................11
7. Figures...............................................................................................................16
APPENDIX A. CFD Model .........................................................................................35
BMT Fluid Mechanics Limited COMMERCIAL-IN-CONFIDENCE
Azeri Chirag Gunashi Field Drill Cuttings Dispersion Modelling 4 of 40 Appendix 11D Eng FINAL
Azeri Chirag Gunashi Field Drill Cuttings Dispersion Modelling
1. Introduction
1.1. General
This report presents the results of a Computational Fluid Dynamics (CFD) study carried out by BMT Fluid Mechanics (BMT) to assess the dispersion and deposition of subsea drill cutting discharges from the Chirag Oil Project (COP) Development in the Azeri Chirag Gunashi (ACG) Field 110km off the coast of Baku, Azerbaijan in the Caspian Sea. The scope of work is based on requirements outlined in “Chirag Oil project – Outline Scope of Work for modelling dispersion and fate of cooling water and drill cuttings” issued to BMT by BP on the 28th of November 2008. The study was carried out for BP.
The COP development will require staged drilling operations. These operations will deposit mud and cuttings into the water column that will disperse and settle on the sea floor. The primary purpose of the modelling is to simulate the dispersion of these discharges and assess the impact on the environment.
1.2. Report Structure
Sections 2 and 3 of this report describe the main objectives of the study and the scope of work agreed to meet those objectives. Results of the dispersion and deposition analysis of subsea drill cutting discharges are given in section 4. Details of the modelling and supporting information are given in Appendix A.

BMT Fluid Mechanics Limited COMMERCIAL-IN-CONFIDENCE
Azeri Chirag Gunashi Field Drill Cuttings Dispersion Modelling 5 of 40 Appendix 11D Eng FINAL
2. Objectives
The main objectives of the subsea drill cutting dispersion and deposition modelling are as follows:
Model dispersion and fate of drill cuttings.
Model the fate of the drilling mud additives, barite and bentonite.
BMT Fluid Mechanics Limited COMMERCIAL-IN-CONFIDENCE
Azeri Chirag Gunashi Field Drill Cuttings Dispersion Modelling 6 of 40 Appendix 11D Eng FINAL
3. Scope of Work
3.1. Model Construction
Construct a CFD model of the water column surrounding the PDQ and CWP to a depth of 150m that is suitable for dispersion modelling. The model will consist of a high-resolution domain out to a 100m radius and a lower resolution domain out to 10 km downstream of the platforms. A simple geometric representation of the risers and releases will be included in the model if required
3.2. Drill Cuttings
Carry out steady-state single well dispersion simulations for a total of 3 release depths and an average and peak winter and summer current condition (to be agreed) (summer condition includes thermocline) – Total 12 simulations
The drill cuttings fluid will include barite discharged at a constant concentration. The cutting fluid will also be discretized into 6 grain sizes
Provide sea bed contour plots of deposition rates for the drill cutting and mud and barite for each scenario (24 plots)
Provide horizontal and vertical colour contour plots of drill fluid concentrations for a selected number scenarios (maximum 12 plots)
Combine the steady state dispersion simulation results with transient current data (to be provided) and data on drilling times and programme (to be provided), to generate contour plots of drill cuttings deposition depths and mass
Repeat the above scope items for two multiple well scenarios (number of wells to be agreed), and an average and peak winter and summer current condition (to be agreed) (summer condition includes thermocline) – Total 8 simulations
3.3. Reporting
Submit a technical report summarising the main results of the dispersion analysis including method, software and model description, sufficient tabular and illustrative graphical colour images, recommendations and conclusions

BMT Fluid Mechanics Limited COMMERCIAL-IN-CONFIDENCE
Azeri Chirag Gunashi Field Drill Cuttings Dispersion Modelling 7 of 40 Appendix 11D Eng FINAL
4. CFD Analysis
4.1. Introduction
This section presents the main results of the subsea drill cuttings dispersion analysis carried out to determine the seabed footprints of the discharged materials during the drilling of the 26” and 36” sections on the seabed.
The CFD model and methodology is described in Appendix A.
4.2. Discharge Scenarios
4.2.1. Production Drilling Discharges from 26” hole sections
Discharges from drilling the 26” hole section were simulated. The discharges will take place vertically downward from a caisson (C5, Ø 0.8 m) at a depth of 136m. The water depth at the drilling location will be 168m.
A total of 28 wells will be drilled through the COP template. The total drilling duration for a single well is estimated to be 30 hours and will be followed by a post-drilling discharge of 4 hours.
The section will be drilled using Untradrill, a water-based mud which comprises of barite, water and minor chemicals (principally KCI). A total estimate of 500 metric tonnes is to be required to drill this section.
The discharge composition and rates in metric tonnes per hour for the drilling and post-drilling operations are summarised in Table 4.1.
4.2.2. Production Drilling Discharges from 36” hole sections
Discharges from drilling the 36” hole section through the 48 well template were modelled. In this case, the material being discharged was composed of bentonite and water-based mud. Discharges take place vertically through the seabed. The total drilling duration for a single well will be 8 hours.
The discharge composition and rates in metric tonnes per hour for the drilling and post-drilling operations are summarised in Table 4.2.
4.2.3. Pre-Drilling Discharges from Mobile Offshore Drilling Unit (MODU) from 26” hole sections
Discharges from drilling the 26” hole section from the MODU were simulated. The discharges will take place vertically downward from a caisson (assumed to be C5 for reference, Ø 0.8 m) at a depth of 11m.

BMT Fluid Mechanics Limited COMMERCIAL-IN-CONFIDENCE
Azeri Chirag Gunashi Field Drill Cuttings Dispersion Modelling 8 of 40 Appendix 11D Eng FINAL
A total of 20 wells will be pre-drilled. The total drilling duration for a single well is estimated to be 30 hours and will be followed by a post-drilling discharge of 4 hours.
The discharge composition and rates in metric tonnes per hour for the drilling and post-drilling operations are summarised in Table 4.1.
4.3. Material Properties
The properties of the cuttings, bentonite, and barite used in the simulations are given in Table 4.3. In order to simplify the modelling, the distribution of cutting sizes was grouped into large and small cutting sizes, with the larger cuttings assumed to comprise 90% of the total mass of cuttings discharged.
4.4. Ambient Condition
Due to only small changes in the thermocline below 80m at all seasons, a constant seawater temperature of 7 ºC, obtained from [1], was used in the analysis.
4.5. Current Conditions
Two current conditions were assessed in the analysis:
Near-stagnant flow: constant horizontal current flow velocity of 0.01 m/s
Predominant flow: annual average current data obtained from [2], leading to a uniform constant value of 0.11 m/s
4.6. Results
4.6.1. Deposition Extent
Table 4.4 to Table 4.6 present the maximum horizontal extent of 1mm thickness deposition and the area covered by more than 1mm thickness deposition for the different discharged materials and scenarios, after the drilling of a single well and multiple wells, respectively.
4.6.2. Deposition Thickness Contour Plots
Figure 4.1 to Figure 4.3 present deposition thickness (in meters) contour plots for the different discharged materials at the seabed, after the drilling of a single well (26” hole section) and discharging from 136 m depth.
Figure 4.4 to Figure 4.6 present deposition thickness (in meters) contour plots for the different discharged materials at the seabed, after the drilling of 28 wells (26” hole section) and discharging from 136 m depth.
Figure 4.7 to Figure 4.9 present deposition thickness (in meters) contour plots for the different discharged materials at the seabed, after the drilling of a single well (36” hole section).

BMT Fluid Mechanics Limited COMMERCIAL-IN-CONFIDENCE
Azeri Chirag Gunashi Field Drill Cuttings Dispersion Modelling 9 of 40 Appendix 11D Eng FINAL
Figure 4.10 to Figure 4.12 present deposition thickness (in meters) contour plots for the different discharged materials at the seabed, after the drilling of 48 wells (36” hole section). The discharges for this case were modelled emulating the drilling template shown in Figure A.1.
Figure 4.13 to Figure 4.15 present deposition thickness (in meters) contour plots for the different discharged materials at the seabed, after the drilling of a single well (26” hole section) and discharging from 11 m depth.
Figure 4.16 to Figure 4.19 present deposition thickness (in meters) contour plots for the different discharged materials at the seabed, after the drilling of 28 wells (26” hole section) and discharging from 11 m depth.
Discharge points (i.e. Caisson C5) and COP platform locations are also indicated in each of these figures.
4.7. Conclusions
From the results obtained in the simulations it can be observed that given a discharge rate and duration, the deposition footprint is highly dependant on both discharge depth and current speed. These factors highly influence the deposition rate, which together with particle size and shape control the height and shape of the deposited material. These influences can be observed in Table 4.4 to Table 4.6.
For the simulations carried out in this report, currents were assumed constant and unidirectional. Hence the footprint length for the predominant current cases, and maximum height for the near-stagnant current conditions, can be considered as worst-case scenarios.

BMT Fluid Mechanics Limited COMMERCIAL-IN-CONFIDENCE
Azeri Chirag Gunashi Field Drill Cuttings Dispersion Modelling 10 of 40 Appendix 11D Eng FINAL
5. References
[1] ASA, “Hydrodynamic and Dispersion Modelling for the Azeri, Chirag, Gunashi Field Offshore Baku, Azerbaijan”, ASA 01-007, August 2001
[2] Shah Deniz Wind Wave Surge and Current Criteria, v3.1, OceanMetriX Ltd, October 2008

BMT Fluid Mechanics Limited COMMERCIAL-IN-CONFIDENCE
Azeri Chirag Gunashi Field Drill Cuttings Dispersion Modelling 11 of 40 Appendix 11D Eng FINAL
6. Tables
Table 4.1: Summary of discharge rates in metric tonnes per hour for the 26” section
Duration (hours) Mud (Barite) Cuttings Total per Hour
Drilling 30 11.3 (4.5) 5.2 16.5
Post Drilling 4 40 (16) 0 40
Total Discharge for Section 500 (200) 155 655
Table 4.2: Summary of discharge rates in metric tonnes per hour for the 36” section
Duration (hours) Mud(Bentonite) Cuttings Total per Hour
Drilling 8 232.5 (2.5) 30 262.5
Total Discharge for Section 1860 (20) 240 2100
Table 4.3: Summary of particle sizes and specific gravities for the cuttings, bentonite, and barite
Specific Gravity Particle Diameter (microns)
Barite 4.54 20
Bentonite 2.4 1
Large Cuttings 2.5 12500
Small Cuttings 3 74

BMT Fluid Mechanics Limited COMMERCIAL-IN-CONFIDENCE
Azeri Chirag Gunashi Field Drill Cuttings Dispersion Modelling 12 of 40 Appendix 11D Eng FINAL
Table 4.4: Summary of maximum extent from the point of discharge and area covered by sediment greater than 1mm thick for the 26” section (136 m depth discharge)
Current Condition Barite Large Cuttings Small CuttingsPredominant 63 17 58Near Stagnant 22 17 13
Current Condition Barite Large Cuttings Small CuttingsPredominant 1,634 820 605Near Stagnant 1,321 820 374
Current Condition Barite Large Cuttings Small CuttingsPredominant 73 27 69Near Stagnant 28 27 24
Current Condition Barite Large Cuttings Small CuttingsPredominant 3,041 2,120 1,950Near Stagnant 2,042 2,120 1,448
Maximum distance (m) covered by the deposition thickness > 1 mm26 inch caisson at 136 m depth (28 well case)
Area (m^2) covered by the deposition thickness > 1 mm26 inch caisson at 136 m depth (28 well case)
Maximum distance (m) covered by the deposition thickness > 1 mm
26 inch caisson at 136 m depth (1 well case)
26 inch caisson at 136 m depth (1 well case)
Area (m^2) covered by the deposition thickness > 1 mm

BMT Fluid Mechanics Limited COMMERCIAL-IN-CONFIDENCE
Azeri Chirag Gunashi Field Drill Cuttings Dispersion Modelling 13 of 40 Appendix 11D Eng FINAL
Table 4.5: Summary of maximum extent from the point of discharge and area covered by sediment greater than 1mm thick for the 36” section (seabed discharge)
Current Condition Bentonite Large Cuttings Small CuttingsPredominant 14 21 16Near Stagnant 15 21 17
Current Condition Bentonite Large Cuttings Small CuttingsPredominant 618 1,421 838Near Stagnant 716 1,421 956
Current Condition Bentonite Large Cuttings Small CuttingsPredominant 27 34 30Near Stagnant 28 34 31
Current Condition Bentonite Large Cuttings Small CuttingsPredominant 2,474 3,940 2,975Near Stagnant 2,675 3,940 3,186
Maximum distance (m) covered by the deposition thickness > 1 mm36 inch discharge at seabed (1 well case)
Area (m^2) covered by the deposition thickness > 1 mm36 inch discharge at seabed (1 well case)
Maximum distance (m) covered by the deposition thickness > 1 mm36 inch discharge at seabed (48 well case)
Area (m^2) covered by the deposition thickness > 1 mm36 inch discharge at seabed (48 well case)

BMT Fluid Mechanics Limited COMMERCIAL-IN-CONFIDENCE
Azeri Chirag Gunashi Field Drill Cuttings Dispersion Modelling 14 of 40 Appendix 11D Eng FINAL
Table 4.6: Summary of maximum extent from the point of discharge and area covered by sediment greater than 1mm thick for the 26” section (11 m depth discharge)
* For the single well case, there is not enough material accumulated at the seabed to surpass the 1mm thickness threshold, and hence the area covered is zero. A large area of >1mm thickness is observed for both Barite and Small cuttings in the 20 well case, while a small or practically inexistent area is observed for the single well case. This is due to the settling behaviour being affected by the current conditions, physical properties of each deposited material (e.g. size and specific gravity), and the fact that it is being deposited from 11m below the sea level. The latter allows for a considerable amount of horizontal advection and diffusion (spreading) of the particles.
Current Condition Barite Large Cuttings Small CuttingsPredominant 660 19 0 *Near Stagnant 26 19 22
Current Condition Barite Large Cuttings Small CuttingsPredominant 19,676 855 0 *Near Stagnant 881 855 506
Current Condition Barite Large Cuttings Small CuttingsPredominant 950 32 835Near Stagnant 38 32 33
Current Condition Barite Large Cuttings Small CuttingsPredominant 59,768 2,627 29,579Near Stagnant 2,633 2,627 1,782
Maximum distance (m) covered by the deposition thickness > 1 mm26 inch caisson at 11 m depth (1 well case)
Area (m^2) covered by the deposition thickness > 1 mm26 inch caisson at 11 m depth (1 well case)
Maximum distance (m) covered by the deposition thickness > 1 mm26 inch caisson at 11 m depth (20 well case)
Area (m^2) covered by the deposition thickness > 1 mm26 inch caisson at 11 m depth (20well case)

BMT Fluid Mechanics Limited COMMERCIAL-IN-CONFIDENCE
Azeri Chirag Gunashi Field Drill Cuttings Dispersion Modelling 15 of 40 Appendix 11D Eng FINAL

BMT Fluid Mechanics Limited COMMERCIAL-IN-CONFIDENCE
Azeri Chirag Gunashi Field Drill Cuttings Dispersion Modelling 16 of 40 Appendix 11D Eng FINAL
7. Figures

a) N
ear
stag
nant
cur
rent
con
diti
ons
b)
Pre
dom
inan
t cu
rren
t co
ndit
ions
Figu
re 4
.1:
Bar
ite
depo
siti
on t
hick
ness
con
tour
plo
ts -
Dis
char
ge f
rom
Cai
sson
at
136
m d
epth
- S
ing
le w
ell

a) N
ear
stag
nant
cur
rent
con
diti
ons
b)
Pre
dom
inan
t cu
rren
t co
ndit
ions
Figu
re 4
.2:
Smal
l cut
tin
gs d
epos
itio
n th
ickn
ess
cont
our
plot
s -
Dis
char
ge f
rom
Cai
sson
at
136
m d
epth
- S
ingl
e w
ell

a) N
ear
stag
nant
cur
rent
con
diti
ons
b)
Pre
dom
inan
t cu
rren
t co
ndit
ions
Figu
re 4
.3:
Larg
e cu
ttin
gs d
epos
itio
n th
ickn
ess
cont
our
plot
s -
Dis
char
ge f
rom
Cai
sson
at
136
m d
epth
- S
ingl
e w
ell

a) N
ear
stag
nant
cur
rent
con
diti
ons
b)
Pre
dom
inan
t cu
rren
t co
ndit
ions
Figu
re 4
.4:
Bar
ite
depo
siti
on t
hick
ness
con
tour
plo
ts -
Dis
char
ge f
rom
Cai
sson
at
136
m d
epth
- 2
8 w
ells

a) N
ear
stag
nant
cur
rent
con
diti
ons
b)
Pre
dom
inan
t cu
rren
t co
ndit
ions
Figu
re 4
.5:
Smal
l cut
tin
gs d
epos
itio
n th
ickn
ess
cont
our
plot
s -
Dis
char
ge f
rom
Cai
sson
at
136
m d
epth
- 2
8 w
ells

a) N
ear
stag
nant
cur
rent
con
diti
ons
b)
Pre
dom
inan
t cu
rren
t co
ndit
ions
Figu
re 4
.6:
Larg
e cu
ttin
gs d
epos
itio
n th
ickn
ess
cont
our
plot
s -
Dis
char
ge f
rom
Cai
sson
at
136
m d
epth
- 2
8 w
ells

a) N
ear
stag
nant
cur
rent
con
diti
ons
b)
Pre
dom
inan
t cu
rren
t co
ndit
ions
Figu
re 4
.7:
Ben
toni
te d
epos
itio
n th
ickn
ess
cont
our
plot
s -
Dis
char
ge f
rom
sea
bed
- Si
ngle
wel
l (36
inch
sec
tion
)

a) N
ear
stag
nant
cur
rent
con
diti
ons
b)
Pre
dom
inan
t cu
rren
t co
ndit
ions
Figu
re 4
.8:
Smal
l cut
tin
gs d
epos
itio
n th
ickn
ess
cont
our
plot
s -
Dis
char
ge f
rom
sea
bed
- Si
ngle
wel
l (36
inch
sec
tion
)

a) N
ear
stag
nant
cur
rent
con
diti
ons
b)
Pre
dom
inan
t cu
rren
t co
ndit
ions
Figu
re 4
.9:
Larg
e cu
ttin
gs d
epos
itio
n th
ickn
ess
cont
our
plot
s -
Dis
char
ge f
rom
sea
bed
- Si
ngle
wel
l (36
inch
sec
tion
)

a) N
ear
stag
nant
cur
rent
con
diti
ons
b)
Pre
dom
inan
t cu
rren
t co
ndit
ions
Figu
re 4
.10:
Ben
toni
te d
epos
itio
n th
ickn
ess
cont
our
plot
s -
Dis
char
ge f
rom
sea
bed
- 48
wel
ls (
36 in
ch s
ecti
on)

a) N
ear
stag
nant
cur
rent
con
diti
ons
b)
Pre
dom
inan
t cu
rren
t co
ndit
ions
Figu
re 4
.11:
Sm
all c
utti
ngs
dep
osit
ion
thic
knes
s co
ntou
r pl
ots
- D
isch
arge
fro
m s
eabe
d -
48 w
ells
(36
inch
sec
tion
)
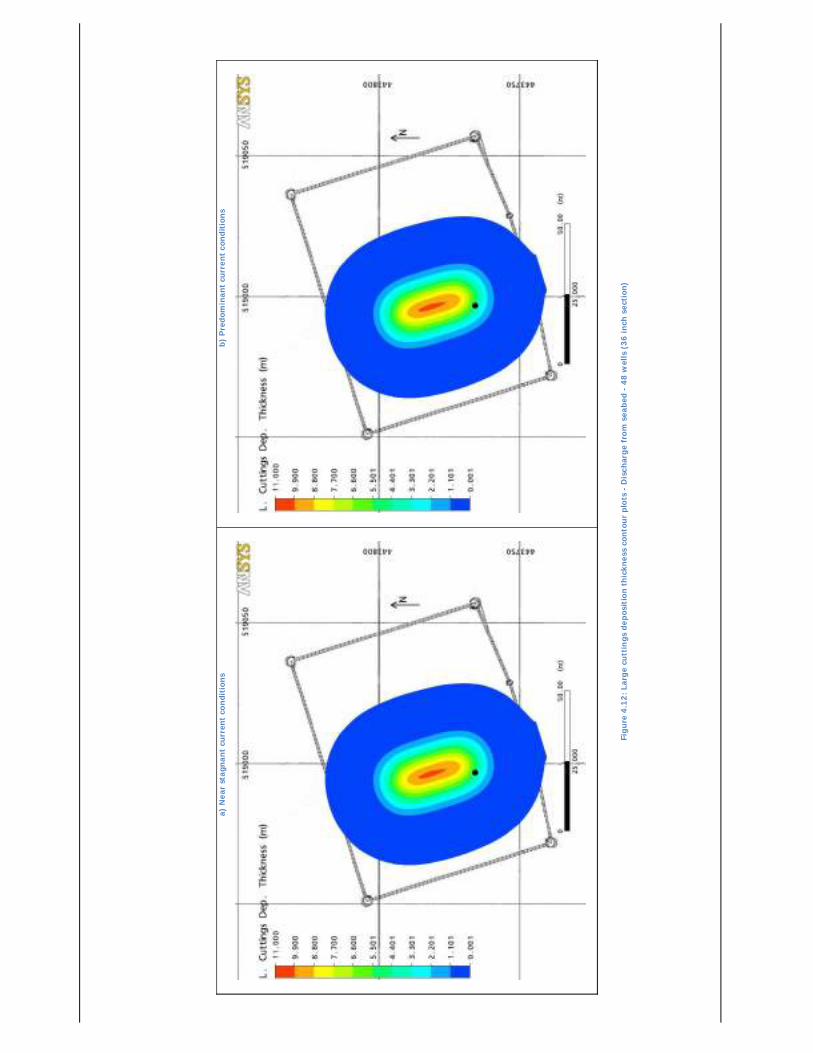
a) N
ear
stag
nant
cur
rent
con
diti
ons
b)
Pre
dom
inan
t cu
rren
t co
ndit
ions
Figu
re 4
.12:
Lar
ge c
utti
ngs
dep
osit
ion
thic
knes
s co
ntou
r pl
ots
- D
isch
arge
fro
m s
eabe
d -
48 w
ells
(36
inch
sec
tion
)

a) N
ear
stag
nant
cur
rent
con
diti
ons
b)
Pre
dom
inan
t cu
rren
t co
ndit
ions
Figu
re 4
.13
Bar
ite
depo
siti
on t
hick
ness
con
tour
plo
ts -
Dis
char
ge f
rom
Cai
sson
at
11 m
dep
th -
Sing
le w
ell

a) N
ear
stag
nant
cur
rent
con
diti
ons
b)
Pre
dom
inan
t cu
rren
t co
ndit
ions
Figu
re 4
.14:
Sm
all c
utti
ngs
dep
osit
ion
thic
knes
s co
ntou
r pl
ots
- D
isch
arge
fro
m C
aiss
on a
t 11
m d
epth
- S
ingl
e w
ell
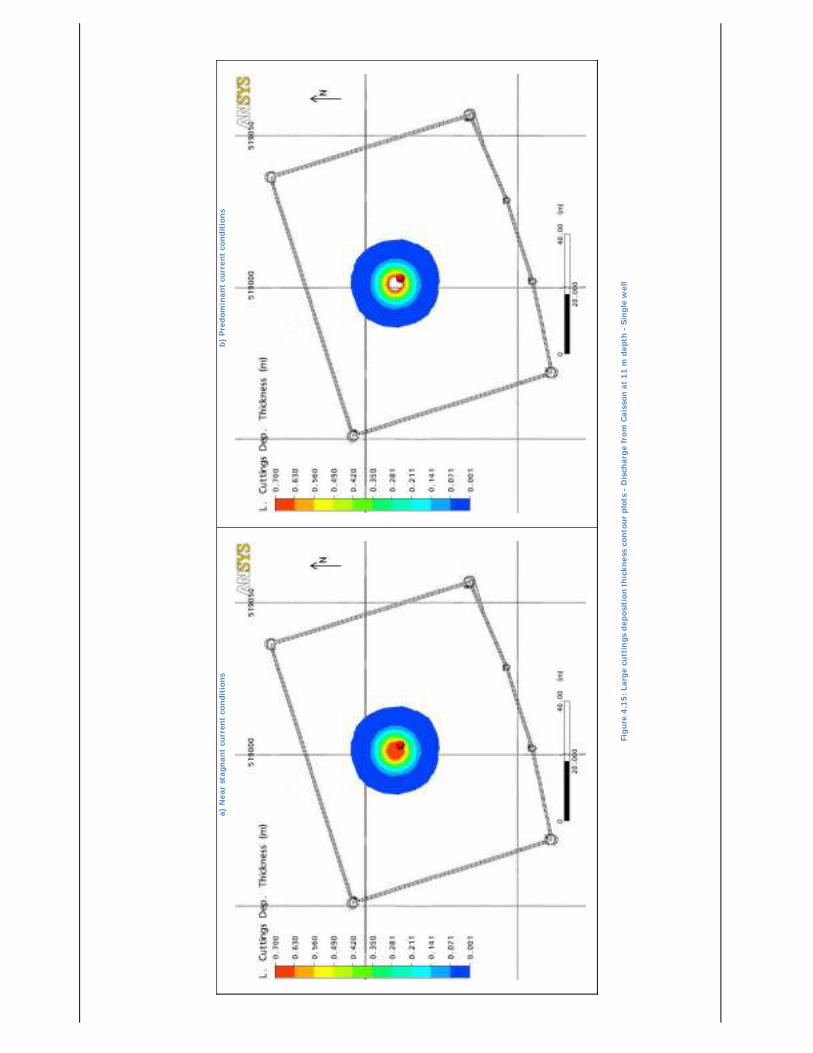
a) N
ear
stag
nant
cur
rent
con
diti
ons
b)
Pre
dom
inan
t cu
rren
t co
ndit
ions
Figu
re 4
.15:
Lar
ge c
utti
ngs
dep
osit
ion
thic
knes
s co
ntou
r pl
ots
- D
isch
arge
fro
m C
aiss
on a
t 11
m d
epth
- S
ingl
e w
ell

a) N
ear
stag
nant
cur
rent
con
diti
ons
b)
Pre
dom
inan
t cu
rren
t co
ndit
ions
Figu
re 4
.16:
Bar
ite
depo
siti
on t
hick
ness
con
tour
plo
ts -
Dis
char
ge f
rom
Cai
sson
at
11 m
dep
th -
20
wel
ls

a) N
ear
stag
nant
cur
rent
con
diti
ons
b)
Pre
dom
inan
t cu
rren
t co
ndit
ions
Figu
re 4
.17:
Sm
all c
utti
ngs
depo
siti
on t
hick
ness
con
tour
plo
ts -
Dis
char
ge f
rom
Cai
sson
at
11 m
dep
th -
20
wel
ls

a) N
ear
stag
nant
cur
rent
con
diti
ons
b)
Pre
dom
inan
t cu
rren
t co
ndit
ions
Figu
re 4
.18:
Lar
ge c
utti
ngs
dep
osit
ion
thic
knes
s co
ntou
r pl
ots
- D
isch
arge
fro
m C
aiss
on a
t 11
m d
epth
- 2
0 w
ells

BMT Fluid Mechanics Limited COMMERCIAL-IN-CONFIDENCE
Azeri Chirag Gunashi Field Drill Cuttings Dispersion Modelling 35 of 40 Appendix 11D Eng FINAL
APPENDIX A. CFD MODEL
A.1. Analysis Software
CFX is regarded as a market-leading product that has been thoroughly validated for dispersion problems relevant to the oil and gas industry both by the specialists BMT and by external specialists. Publically available verification studies for a number of different fluids dynamics problems such as movement of solids through liquids and bubble plume behaviour have been undertaken at the University of Melbourne in Australia and the Paul Scherrer Institute in Switzerland1. Additional case studies including verification studies are provided here:
http://www.ansys.com/industries/sys-testimonials.asp?ID=10
A.2. Methodology
Dispersion of the drill cuttings was modelled using discharge parameters supplied by BP. For the 26” drilling (i.e. discharges from caissons at 11 m and 136 m depth), material was released from a 0.8 m diameter pipe. For the 36” drilling, material was released from a ring of 36” inner diameter and 50” outer diameter centred at the drilling location. For the 36” multi-well case, the discharges were modelled emulating the 48 well locations shown in Figure A.1.
The risers and legs of the platform were assumed not to represent a significant blockage to the flow, and hence were not included in the model.
No topography (i.e. flat seabed) was assumed.
A.3. Fluid Properties
A.3.1. Seawater
Table A.1 presents the properties of seawater used in the analysis.
A.3.2. Drill Cuttings
The properties of the cuttings, barite, and bentonite are presented in Table 4.3.
A.4. Computational Mesh
The computational mesh was generated in the domain bounded by the seabed (-168 m) and the sea surface. The computational domain extended sufficiently far away in each direction to avoid any boundary influence on the flow solution. The computational mesh used for the simulations comprised of approximately 4 million
1 http://www.cfd.com.au/cfd_conf03/papers/123Hol.pdf;http://www.cfd.com.au/cfd_conf97/papers/smi002.pdf; Dispersion of neutrally buoyant solids falling vertically into stationary liquid and horizontal channel flow, K. M. Smith, M. R. Davidson and N. J. Lawson Computers & Fluids Volume 29, Issue 4, 1 May 2000, Pages 369-384; On the modelling of bubble plumes in a liquid pool, B. L. Smith, Applied Mathematical Modelling, Volume 22, Issue 10,October 1998, Pages 773-797

BMT Fluid Mechanics Limited COMMERCIAL-IN-CONFIDENCE
Azeri Chirag Gunashi Field Drill Cuttings Dispersion Modelling 36 of 40 Appendix 11D Eng FINAL
tetrahedral and prismatic cells. Additional mesh refinement was applied in the proximity of the individual release points.
A.5. Multiphase Model
The dispersion of the cuttings and barite were modelled explicitly using the Eulerian-Eulerian inhomogeneous multiphase model. Using this model, each phase (water, cuttings and barite) has a separate velocity field and the interactions between the phases are governed by interphase transfer terms. The principal advantages of using this model are that complete global information for the particle phase is available and the dispersion and deposition of cuttings and barite are modelled separately.
A.6. Turbulence Model
The Shear Stress Transport (SST) turbulence model was employed in the CFD simulations with standard coefficients.
The SST turbulence model is widely used for applications in the offshore industry and is generally suitable for the assessment of dispersion.
A.7. Buoyancy
Buoyancy forces due to changes in fluid density were modelled in the analysis.
A.8. Current Velocity Profile
The current velocity profile was simulated as uniform across the water column and consisted of two cases:
Predominant current speed = 0.11m/s
Near-stagnant current speed = 0.01m/s
Seawater
Density (kg/m3) 1,010 Dynamic viscosity (kg/(m.s)) 0.00105 Molecular weight (kg/kmole) 18.02
Specific Heat Capacity (J/(kg.K)) 4,181.7 Thermal Conductivity (W/(m.K)) 0.6069
Thermal Expansivity (K-1) 0.000257
Table A.1 – Properties of seawater


APPENDIX 11E
Produced Water Modelling


Chirag Oil Project Produced Water Discharge Modelling
For BP

BMT Fluid Mechanics Limited COMMERCIAL-IN-CONFIDENCE
Chirag Oil ProjectProduced Water Discharge Modelling 4 of 32 Appendix 11E Eng FINAL
Report Title Chirag Oil Project
Produced Water Discharge
Modelling
Client: BP
Document No: 46220 Report01v2 Release: 2 Copy No:
Status Final Report
Report Date: 04 June 2009
Holds:
Name: Signature: Date:
Prepared by: J. Mindel 04/06/2009
Checked by: A. Lebas 04/06/2009
Approved by: C. Craddock 04/06/2009
Distribution: BP
Previous Release History:
Release No: Status: Date:
46220 Report01v1 1 Draft report for internal review 04/06/2009
BMT Fluid Mechanics Limited commercial reports may not be published, except in full, unless permission for an approved abstract has previously been obtained from the company.
This report is supplied for the purposes of the client only, and in the expectation that no other person will use or rely upon the results therein. No responsibility to any other person is accepted by the company.

BMT Fluid Mechanics Limited COMMERCIAL-IN-CONFIDENCE
Chirag Oil ProjectProduced Water Discharge Modelling 5 of 32 Appendix 11E Eng FINAL
EXECUTIVE SUMMARY A Computational Fluid Dynamics (CFD) study was carried out by BMT Fluid Mechanics (BMT) to assess the dispersion of produced water discharges from platforms located in the Chirag Oil Project (COP) in Azerbaijan. The study was carried out for BP.
A total of 8 produced water discharge scenarios were considered in the analysis, represented through a downward discharge from a caisson (diameter of 0.9m) at 45 m depth.
Two current speeds (i.e. near-stagnant and predominant) and three discharge durations (i.e. 12 h, 24 h, and 72 h) were modelled. Two seawater ambient temperatures (summer and winter conditions) were considered for the shortest discharge period only (i.e. 12 h).
A discharge temperature of 25 ºC was assumed for all discharges.
The maximum distance reached by the discharge plume (for a dilution of 1:100) occurred for the summer predominant current discharge (Scenario 4), where the plume reached a distance of 39 m from the point of discharge.
In all near-stagnant current scenarios (i.e. Scenarios 1, 3, 5, and 7), the three lowest concentration plumes reached the sea surface, while the highest concentration plume (i.e. 30-fold) reached a maximum of 5 m depth. For predominant current scenarios (i.e. Scenarios 2, 4, 6, and 8), the 100-fold discharge plumes reached a maximum of 28 m depth.
A maximum width of 13 m for the 100-fold discharge plume was obtained for the summer near-stagnant case (Scenario 3).
Discharge plumes at dilution of 1:100 were observed to persist between 1 and 2 hours from the cessation of discharge, for all discharge scenarios investigated.

BMT Fluid Mechanics Limited COMMERCIAL-IN-CONFIDENCE
Chirag Oil ProjectProduced Water Discharge Modelling 6 of 32 Appendix 11E Eng FINAL
Chirag Oil Project Produced Water Discharge Modelling
Contents
1. Introduction ........................................................................................................ 8
1.1. General ...................................................................................................... 8
1.2. Report Structure.......................................................................................... 8
2. Objectives ........................................................................................................... 9
3. CFD Analysis.......................................................................................................10
3.1. Introduction...............................................................................................10
3.2. Ambient Conditions.....................................................................................10
3.3. Current Conditions......................................................................................10
3.4. Chemical Concentration Limits .....................................................................10
3.5. Assessment Scenarios .................................................................................10
3.6. Results ......................................................................................................11
4. Conclusions ........................................................................................................12
5. References .........................................................................................................13
6. Tables................................................................................................................14
7. Figures...............................................................................................................18
APPENDIX A. CFD Model .........................................................................................29

BMT Fluid Mechanics Limited COMMERCIAL-IN-CONFIDENCE
Chirag Oil ProjectProduced Water Discharge Modelling 7 of 32 Appendix 11E Eng FINAL

BMT Fluid Mechanics Limited COMMERCIAL-IN-CONFIDENCE
Chirag Oil ProjectProduced Water Discharge Modelling 8 of 32 Appendix 11E Eng FINAL
Chirag Oil Project Produced Water Discharge Modelling
1. Introduction
1.1. General
This report presents the main results of a Computational Fluid Dynamics (CFD) study carried out by BMT Fluid Mechanics (BMT) to assess the dispersion of produced water discharges from platforms located in the Chirag Oil Project (COP) in Azerbaijan. The scope of work is based on requirement outlined in “COP Produced Water Discharge Modelling” issued to BMT by BP on the 6th of April 2009.
1.2. Report Structure
Section 2 of this report describes the main objectives of the study. Description of the CFD analysis and its results are presented in section 3. Details of the modelling methodology and supporting information are given in Appendix A.

BMT Fluid Mechanics Limited COMMERCIAL-IN-CONFIDENCE
Chirag Oil ProjectProduced Water Discharge Modelling 9 of 32 Appendix 11E Eng FINAL
2. Objectives
The main objectives of the CFD produced water dispersion analysis were as follows:
Model dispersion and fate of produced water fluid
Assess persistence and distance travelled by discharge plume
Determine concentrations of discharged fluid within plume

BMT Fluid Mechanics Limited COMMERCIAL-IN-CONFIDENCE
Chirag Oil ProjectProduced Water Discharge Modelling 10 of 32 Appendix 11E Eng FINAL
3. CFD Analysis
3.1. Introduction
This section presents the results of the produced water dispersion analysis carried out to determine the persistence and distance travelled by the discharge plumes for a range of subsea ambient, current conditions and discharge scenarios.
The CFD model and methodology is described in APPENDIX A.
3.2. Ambient Conditions
Two seasonal options were assessed and compared in the analysis:
Summer condition: in this case, a constant seawater temperature of 12 ºC was used (i.e. no thermocline)
Winter condition: in this case, a constant seawater temperature of 7 ºC was used (i.e. no thermocline)
3.3. Current Conditions
For each ambient condition, two current conditions were assessed in the analysis, as indicated in [1]:
Near-stagnant flow: constant horizontal current flow velocity of 0.01 m/s
Predominant flow: constant horizontal current flow velocity of 0.1 m/s
3.4. Chemical Concentration Limits
The produced water discharges will comprise chemically treated Caspian seawater. The relevant degree of dilution assessed lies in the range of 1:300 to 1:30.
3.5. Assessment Scenarios
A total of 8 produced water discharge scenarios were considered in the analysis, represented through a downward discharge from a caisson (diameter of 0.9m) at 45 m depth.
Two current speeds (i.e. near-stagnant and predominant) and three discharge durations (i.e. 12 h, 24 h, and 72 h) were modelled. Two seawater ambient temperatures (summer and winter conditions) were considered for the shortest discharge period only (i.e. 12 h).
A discharge temperature of 25 ºC was assumed for all discharges.

BMT Fluid Mechanics Limited COMMERCIAL-IN-CONFIDENCE
Chirag Oil ProjectProduced Water Discharge Modelling 11 of 32 Appendix 11E Eng FINAL
The produced water discharge scenarios investigated in the analysis are summarised in Table 3.1.
3.6. Results
3.6.1. Discharge Plume Dimension
Table 3.2 to Table 3.5 presents the discharge plume dimensions measured at relevant degrees of dilution (300-fold, 200-fold, 100-fold, and 30-fold). The corresponding volume time histories are shown in Figure 3.1.
3.6.2. Discharge Plume Persistence
Table 3.6 presents the total persistence time (in hours) of the plumes at each concentration of interest for all scenarios investigated.
Table 3.7 presents the persistence time (in hours), measured from the cessation of discharge, of the plumes at each concentration of interest for all scenarios investigated.
Table 3.8 presents the time (in hours) needed for the discharge plumes to reach a steady state at each concentration of interest for all scenarios investigated.
3.6.3. Discharge Plume Visualisations
Figure 3.2 depicts the vertical centreline contour plots of the plume concentrations of interest, while Figure 3.4 shows a plan view of the same contours for each of the scenarios investigated.

BMT Fluid Mechanics Limited COMMERCIAL-IN-CONFIDENCE
Chirag Oil ProjectProduced Water Discharge Modelling 12 of 32 Appendix 11E Eng FINAL
4. Conclusions
The maximum distance reached by the discharge plume (for a dilution of 1:100) occurred for the summer predominant current discharge (Scenario 4), where the plume reached a distance of 39 m from the point of discharge.
In all near-stagnant current scenarios (i.e. Scenarios 1, 3, 5, and 7), the three lowest concentration plumes reached the sea surface, while the highest concentration plume (i.e. 30-fold) reached a maximum of 5 m depth. For predominant current scenarios (i.e. Scenarios 2, 4, 6, and 8), the 100-fold discharge plumes reached a maximum of 28 m depth.
A maximum width of 13 m for the 100-fold discharge plume was obtained for the summer near-stagnant case (Scenario 3).
Discharge plumes at dilution of 1:100 were observed to persist between 1 and 2 hours from the cessation of discharge, for all discharge scenarios investigated.

BMT Fluid Mechanics Limited COMMERCIAL-IN-CONFIDENCE
Chirag Oil ProjectProduced Water Discharge Modelling 13 of 32 Appendix 11E Eng FINAL
5. References
[1] Shah Deniz Wind Wave Surge and Current Criteria, v3.1, OceanMetriX Ltd, October 2008


BMT Fluid Mechanics Limited COMMERCIAL-IN-CONFIDENCE
Chirag Oil ProjectProduced Water Discharge Modelling 18 of 32 Appendix 11E Eng FINAL
7. Figures

a) C
aiss
on d
isch
arge
(12
hr)
, win
ter
nea
r-st
agna
nt c
urre
nt c
ondi
tion
(Sc
enar
io 1
) b)
Cai
sson
dis
char
ge (
12 h
r), w
inte
r pr
edom
inan
t cu
rren
t co
ndit
ion
(Sce
nari
o 2)
c) C
aiss
on d
isch
arge
(12
hr)
, sum
mer
nea
r-st
agna
nt c
urre
nt c
ondi
tion
(Sc
enar
io 3
) d)
Cai
sson
dis
char
ge (
12 h
r), s
umm
er p
redo
min
ant
curr
ent
cond
itio
n (S
cena
rio
4)
Figu
re 3
.1:
CO
P p
rodu
ced
wat
er d
isch
arge
plu
me
volu
me
tim
e hi
stor
ies
(Sce
nari
os 1
to
4)
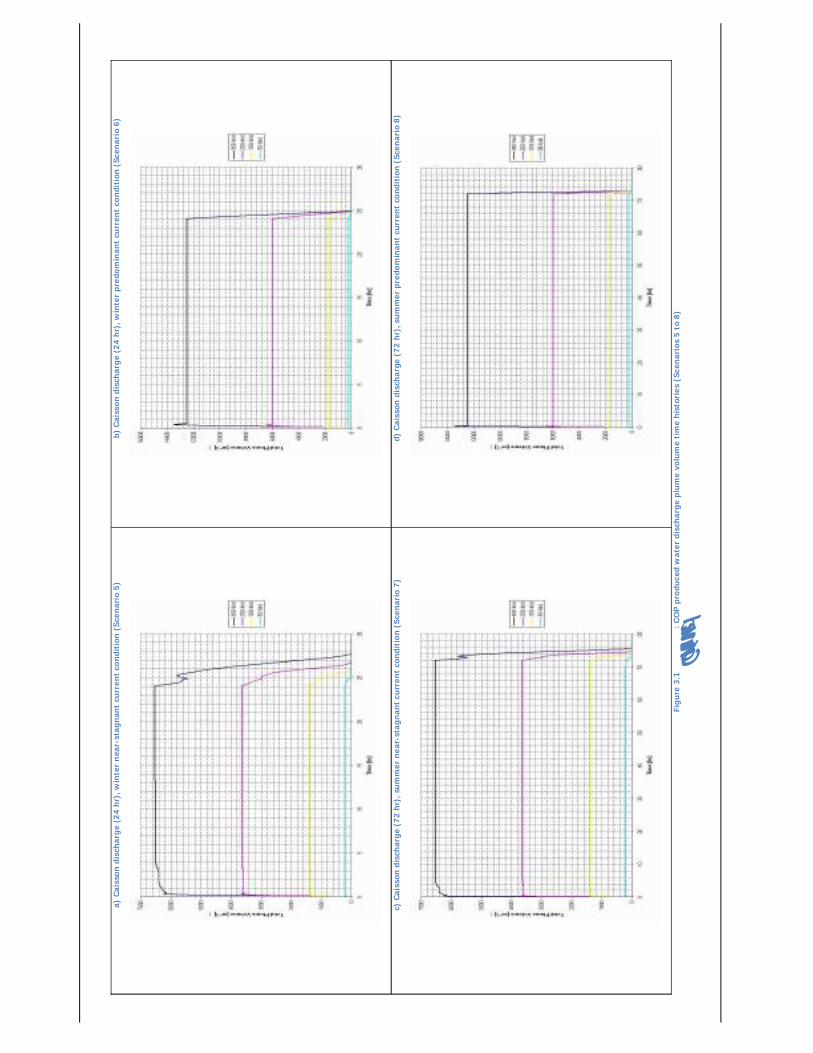
a) C
aiss
on d
isch
arge
(24
hr)
, win
ter
nea
r-st
agna
nt c
urre
nt c
ondi
tion
(Sc
enar
io 5
) b)
Cai
sson
dis
char
ge (
24 h
r), w
inte
r pr
edom
inan
t cu
rren
t co
ndit
ion
(Sce
nari
o 6)
c) C
aiss
on d
isch
arge
(72
hr)
, sum
mer
nea
r-st
agna
nt c
urre
nt c
ondi
tion
(Sc
enar
io 7
) d)
Cai
sson
dis
char
ge (
72 h
r), s
umm
er p
redo
min
ant
curr
ent
cond
itio
n (S
cena
rio
8)
Figu
re 3
.1 Con
tinued: CO
P p
rodu
ced
wat
er d
isch
arge
plu
me
volu
me
tim
e hi
stor
ies
(Sce
nari
os 5
to
8)

Figu
re 3
.2:
Pro
duce
d w
ater
dis
char
ge p
lum
e ve
rtic
al c
entr
elin
e vi
ew a
t th
e en
d of
the
dis
char
ge p
erio
d (F
rom
top
to
bott
om, S
cena
rios
1 a
nd 2
)

Figu
re 3
.2 Con
tinued: Pr
oduc
ed w
ater
dis
char
ge p
lum
e ve
rtic
al c
entr
elin
e vi
ew a
t th
e en
d of
the
dis
char
ge p
erio
d (F
rom
top
to
bott
om, S
cena
rios
3 a
nd 4
)

Figu
re 3
.2 C
onti
nued
: P
rodu
ced
wat
er d
isch
arge
plu
me
vert
ical
cen
trel
ine
view
at
the
end
of t
he d
isch
arge
per
iod
(Fro
m t
op t
o bo
ttom
, Sce
nari
os 5
and
6)

Figu
re 3
.2 C
onti
nued
: P
rodu
ced
wat
er d
isch
arge
plu
me
vert
ical
cen
trel
ine
view
at
the
end
of t
he d
isch
arge
per
iod
(Fro
m t
op t
o bo
ttom
, Sce
nari
os 7
and
8)

Figu
re 3
.3:
Pro
duce
d w
ater
dis
char
ge p
lum
e pl
an v
iew
at
the
end
of t
he d
isch
arge
per
iod
(Fro
m t
op t
o b
otto
m, S
cena
rios
1 a
nd 2
)

Figu
re 3
.3 C
onti
nued
: P
rodu
ced
wat
er d
isch
arge
plu
me
plan
vie
w a
t th
e en
d of
the
dis
char
ge p
erio
d (F
rom
top
to
bott
om, S
cena
rio
s 3
and
4)

Figu
re 3
.3 C
onti
nued
: P
rodu
ced
wat
er d
isch
arge
plu
me
plan
vie
w a
t th
e en
d of
the
dis
char
ge p
erio
d (F
rom
top
to
bott
om, S
cena
rio
s 5
and
6)

Figu
re 3
.3 C
onti
nued
: P
rodu
ced
wat
er d
isch
arge
plu
me
plan
vie
w a
t th
e en
d of
the
dis
char
ge p
erio
d (F
rom
top
to
bott
om, S
cena
rio
s 7
and
8)

BMT Fluid Mechanics Limited COMMERCIAL-IN-CONFIDENCE
Chirag Oil ProjectProduced Water Discharge Modelling 29 of 32 Appendix 11E Eng FINAL
APPENDIX A. CFD MODEL
A.1. Analysis Software
CFX is regarded as a market-leading product that has been thoroughly validated for dispersion problems relevant to the oil and gas industry both by the specialists BMT and by external specialists. Publically available verification studies for a number of different fluids dynamics problems such as movement of solids through liquids and bubble plume behaviour have been undertaken at the University of Melbourne in Australia and the Paul Scherrer Institute in Switzerland1. Additional case studies including verification studies are provided here:
http://www.ansys.com/industries/sys-testimonials.asp?ID=10
A.2. Methodology
A.2.1. General
Dispersion of COP produced water fluid was modelled using discharge parameters supplied by BP, which included volumetric flow and duration of discharges.
Transient dispersion simulations were carried out to determine the extent of the relevant concentration plumes for a release from a caisson at a depth of 45m. The diameter of the discharge was 0.9 m. Different seawater temperatures (summer and winter conditions) and two current speeds (i.e. near-stagnant and predominant) were considered. Constant temperature profiles (7 ºC for winter and 12 ºC for summer) were assumed (i.e. no thermocline). Discharges from the caisson were directed downwards, assumed to be constant during the discharge period and at 25 ºC.
No topography (i.e. flat seabed) was included.
A.3. Fluid Properties
A.3.1. Seawater
Table A.1 presents the properties of seawater used in the analysis.
A.3.2. Hydrotest Water
The COP water discharges will comprise chemically treated Caspian seawater. The relevant degree of dilution will lie in the range of 1:300 to 1:30.
1 http://www.cfd.com.au/cfd_conf03/papers/123Hol.pdf;http://www.cfd.com.au/cfd_conf97/papers/smi002.pdf; Dispersion of neutrally buoyant solids falling vertically into stationary liquid and horizontal channel flow, K. M. Smith, M. R. Davidson and N. J. Lawson Computers & Fluids Volume 29, Issue 4, 1 May 2000, Pages 369-384; On the modelling of bubble plumes in a liquid pool, B. L. Smith, Applied Mathematical Modelling, Volume 22, Issue 10,October 1998, Pages 773-797

BMT Fluid Mechanics Limited COMMERCIAL-IN-CONFIDENCE
Chirag Oil ProjectProduced Water Discharge Modelling 30 of 32 Appendix 11E Eng FINAL
A.4. Computational Mesh
The computational mesh was generated in the domain bounded by the seabed and the sea surface. The computational domain extended sufficiently far away in each direction to avoid any boundary influence on the flow solution. The computational mesh used for the simulations comprised approximately 4 million tetrahedral cells. Additional mesh refinement was applied in the proximity regions of the release location.
A.5. Turbulence Model
The K- turbulence model was employed in the CFD simulations with standard coefficients.
The K- turbulence model is widely used for applications in the offshore industry and is generally suitable for the assessment of dispersion.
A.6. Heat Transfer Model
Heat transfer was modelled in the dispersion simulations. The ambient seawater temperature varied depending on the season condition.
A.7. Buoyancy
Buoyancy forces due to changes in fluid density were modelled in the analysis using the Boussinesq approximation.
A.8. Current Velocity Profile
The current velocity profile was simulated as uniform across the water column and consisted of two distinguished cases:
Predominant current speed = 0.1 m/s
Near-stagnant current speed = 0.01m/s
A.9. Boundary Conditions
A.9.1. Upstream and Downstream Boundaries
Current properties were applied at the upstream domain boundary.
A.9.2. Seabed
A no-slip wall boundary condition (u, v, w = 0) was applied at the seabed.
A.9.3. Sea surface
A free-slip wall boundary condition (w = 0) was applied at the sea surface.

BMT Fluid Mechanics Limited COMMERCIAL-IN-CONFIDENCE
Chirag Oil ProjectProduced Water Discharge Modelling 31 of 32 Appendix 11E Eng FINAL
Seawater
Density (kg/m3) 1,010 Dynamic viscosity (kg/(m.s)) See Figure A.1 Molecular weight (kg/kmole) 18.02
Specific Heat Capacity (J/(kg.K)) 4,181.7 Thermal Conductivity (W/(m.K)) 0.6069
Thermal Expansivity (K-1) 0.000257
Table A.1 – Properties of seawater

Seawater Dynamic Viscosity [Pa.s]

APPENDIX 11F
Cooling Water Dispersion Modelling


Azeri Chirag Gunashi Field Cooling Water Dispersion Modelling
For BP

BMT Fluid Mechanics Limited COMMERCIAL-IN-CONFIDENCE
Azeri Chirag Gunashi Field Cooling Water Dispersion Modelling 4 of 32 Appendix 11F Eng FINAL
Report Title Azeri Chirag Gunashi Field
Cooling Water Dispersion
Modelling
Client: BP
Document No: 46211 Report01v2 Release: 2 Copy No:
Status Progress note for client review
Report Date: 4 June 2009
Holds:
Name: Signature: Date:
Prepared by: J. Mindel 04/06/2009
Checked by: A. Lebas 04/06/2009
Approved by: C. Craddock 04/06/2009
Distribution: BP
Previous Release History:
Release No: Status: Date:
46211 Report01v1 1 Draft Report for internal review
04/06/2009
BMT Fluid Mechanics Limited commercial reports may not be published, except in full, unless permission for an approved abstract has previously been obtained from the company.
This report is supplied for the purposes of the client only, and in the expectation that no other person will use or rely upon the results therein. No responsibility to any other person is accepted by the company.
BMT Fluid Mechanics Limited COMMERCIAL-IN-CONFIDENCE
Azeri Chirag Gunashi Field Cooling Water Dispersion Modelling 5 of 32 Appendix 11F Eng FINAL
EXECUTIVE SUMMARY A Computational Fluid Dynamics (CFD) study was carried out by BMT Fluid Mechanics (BMT) to assess the dispersion of subsea cooling water discharges from the Chirag Oil Project (COP) Development in the Azeri Chirag Gunashi (ACG) Field 110km off the coast of Baku, Azerbaijan in the Caspian Sea. The analysis was carried out for BP.
A total of four baseline scenarios were considered for the cooling water discharge analysis:
two winter simulations were carried out, using a constant temperature profile of 7ºC and two current speeds (i.e. near-stagnant and predominant)
two summer simulations were carried out, using the temperature profile obtained from [1] and two current speeds (i.e. near-stagnant and predominant)
Sensitivity analyses were also carried out by varying the temperature and the depth of the discharge (i.e. 75 ºC at a depth of 75 m and 45 m and 25 ºC at a depth of 45 m).
The cooling water dispersion scenarios investigated in the analysis are summarised in Table 4.2.
A total of two scenarios were considered for the cooling water intake analysis:
near-stagnant current condition
predominant current condition
A constant, uniform ambient temperature of 7 ºC was assumed for both intake scenarios.
For the baseline scenarios (i.e. 25 ºC discharge at a depth of 75 m), the maximum height reached by the thermal plume occurred for the winter near-stagnant scenario, where the top of the plume reaches a depth of 65m.
For the baseline scenarios (i.e. 25 ºC discharge at a depth of 75 m), the maximum length of the thermal plume occurred for the summer predominant current scenario, where the tip of the plume reached a distance of 13 m from the point of discharge.
For the baseline scenarios (i.e. 25 ºC discharge at a depth of 75 m), the thermal plumes generated by the cooling water discharge met the limit recommended by the IFC and also never reached the sea surface for all conditions investigated.
Significant impact on the thermal plume sizes was observed by increasing the discharge temperature to 75 ºC. The maximum plume height reached was 42 m in depth for a 75 m deep discharge. If the discharge was moved to a depth of 45 m, the maximum plume height reached was 12 m. However, the plume extent was still within the 100 m radius prescribed by the IFC and did not reach the sea surface.
Small impact on the thermal plume sizes was observed by varying the discharge depth to 45 m. The maximum plume height reached was 33 m in depth. However, the plume extent was still within the 100 m radius prescribed by the IFC and did not reach the sea surface.

BMT Fluid Mechanics Limited COMMERCIAL-IN-CONFIDENCE
Azeri Chirag Gunashi Field Cooling Water Dispersion Modelling 6 of 32 Appendix 11F Eng FINAL
Copper and chlorine levels discharged with the cooling water were assumed to be of no interest, as the dosing rates were already below the guidelines set by the Environmental Quality Standards.
In terms of the effect on the free stream flow velocity, the intake imposes a 5% disturbance to a maximum distance of 6 m from the pipe for near-stagnant current conditions and 2 m for predominant current conditions.
BMT Fluid Mechanics Limited COMMERCIAL-IN-CONFIDENCE
Azeri Chirag Gunashi Field Cooling Water Dispersion Modelling 7 of 32 Appendix 11F Eng FINAL
Azeri Chirag Gunashi Field Cooling Water Dispersion Modelling
Contents
1. Introduction ........................................................................................................ 8
1.1. General ...................................................................................................... 8
2. Objectives ........................................................................................................... 9
3. Scope of Work ....................................................................................................10
3.1. Model Construction.....................................................................................10
3.2. Cooling Water ............................................................................................10
3.3. Reporting...................................................................................................10
3.4. Definitions of Abbreviations and Acronyms....................................................11
4. CFD Analysis.......................................................................................................12
4.1. Introduction...............................................................................................12
4.2. Ambient Conditions.....................................................................................12
4.3. Current Conditions......................................................................................12
4.4. Discharge conditions...................................................................................12
4.5. Intake conditions........................................................................................12
4.6. Chemical Concentration Limits .....................................................................12
4.7. Assessment Scenarios .................................................................................13
4.8. Results ......................................................................................................13
5. Conclusions ........................................................................................................15
6. References .........................................................................................................16
7. Tables................................................................................................................17
8. Figures...............................................................................................................20
APPENDIX A. CFD Model .........................................................................................28

BMT Fluid Mechanics Limited COMMERCIAL-IN-CONFIDENCE
Azeri Chirag Gunashi Field Cooling Water Dispersion Modelling 8 of 32 Appendix 11F Eng FINAL
Azeri Chirag Gunashi Field Cooling Water Dispersion Modelling
1. Introduction
1.1. General
This progress note presents preliminary results of a Computational Fluid Dynamics (CFD) study carried out by BMT Fluid Mechanics (BMT) to assess the dispersion of subsea cooling water discharges from the Chirag Oil Project (COP) Development in the Azeri Chirag Gunashi (ACG) Field 110km off the coast of Baku, Azerbaijan in the Caspian Sea. The scope of work is based on requirement outlined in “Chirag Oil Project – Outline Scope of Work for modelling dispersion and fate of cooling water and drill cuttings” issued to BMT by BP on the 28th of November 2008.
The COP development will require staged drilling operations. Once the platform is in place, the predominate release into the water column will be cooling water and associated anti-corrosion fluid from the platform. The purpose of the modelling is to simulate the dispersion of these discharges and assess the impact on the environment.
1.2. Report Structure
Sections 2 and 3 of this report describe the main objectives of the study and the scope of work agreed to meet those objectives. Results of the cooling water dispersion analysis are given in section 4. Details of the modelling and supporting information are given in Appendix A.

BMT Fluid Mechanics Limited COMMERCIAL-IN-CONFIDENCE
Azeri Chirag Gunashi Field Cooling Water Dispersion Modelling 9 of 32 Appendix 11F Eng FINAL
2. Objectives
The main objectives of the subsea dispersion modelling presented in this progress note are as follows:
Model near- and far-field dispersion of the cooling water discharge and assess the potential for affecting seawater quality
Determine temperatures of discharged fluid within the water column
Model the cooling water intake and assess its effects on the seawater quality

BMT Fluid Mechanics Limited COMMERCIAL-IN-CONFIDENCE
Azeri Chirag Gunashi Field Cooling Water Dispersion Modelling 10 of 32 Appendix 11F Eng FINAL
3. Scope of Work
3.1. Model Construction
Construct a CFD model of the water column surrounding the PDQ and CWP to a depth of 150m that is suitable for dispersion modelling. The model will consist of a high-resolution domain out to a 100m radius and a lower resolution domain out to 10 km downstream of the platforms. A simple geometric representation of the risers and releases will be included in the model if required
3.2. Cooling Water
Carry out steady-state1 dispersion simulations for a total of 3 discharge conditions (PDQ, CWP & both), an average and peak winter and summer current condition (to be agreed) (summer condition includes thermocline), and vertical and horizontal port orientation – Total 24 simulations
The cooling water fluid will include aqueous copper and chlorine discharged at a constant concentration. If reaction equations can be provided, the reactivity of these fluids with the seawater can be modelled
Provide horizontal and vertical colour contour plots of cooling water temperature and concentrations for each scenario
Provide sea bed contour plots of copper deposition rates
Determine the length, height and width of the plume extent
Determine the local flow velocity patterns resulting from the discharge to assess risk of interference with other discharges and water surface disruption
3.3. Reporting
Submit a technical report summarising the main results of the dispersion analysis including method, software and model description, sufficient tabular and illustrative graphical colour images, recommendations and conclusions
1 Since the plume response time is less than the variational time scale of the hydrodynamics [1], simulations are to be carried out for constant current conditions

BMT Fluid Mechanics Limited COMMERCIAL-IN-CONFIDENCE
Azeri Chirag Gunashi Field Cooling Water Dispersion Modelling 11 of 32 Appendix 11F Eng FINAL
3.4. Definitions of Abbreviations and Acronyms
Term / Acronym /
Abbreviation Explanation / Definition
BMT BMT Fluid Mechanics Limited CAD Computer Aided Drawing cc Cubic centimetre
CFD Computational Fluid Dynamics ppb Parts Per Billion by volume

BMT Fluid Mechanics Limited COMMERCIAL-IN-CONFIDENCE
Azeri Chirag Gunashi Field Cooling Water Dispersion Modelling 12 of 32 Appendix 11F Eng FINAL
4. CFD Analysis
4.1. Introduction
This section presents the results of the subsea cooling water dispersion analysis carried out to determine the distances travelled by the discharge plumes for a range of subsea ambient and current conditions. It also presents the results of the intake flow analysis.
The CFD model and methodology is described in APPENDIX A.
4.2. Ambient Conditions
Two seasonal options were assessed and compared in the analysis:
Summer condition: in this case, a vertical seawater temperature profile was obtained from [1]. The thermal profile’s prime characteristic is a sudden increase from 9 ºC to 24 ºC in the range of 30 m to 50 m depth. Details of the thermal profile used are shown in Figure 4.1
Winter condition: in this case, a constant seawater temperature of 7 ºC was obtained from [1] (i.e. no thermocline)
4.3. Current Conditions
For each ambient condition, two current conditions were assessed in the analysis:
Near-stagnant flow: constant horizontal current flow velocity of 0.01 m/s
Predominant flow: annual average current data obtained from [2], leading to a uniform constant value of 0.11 m/s
4.4. Discharge conditions
Details of the discharge conditions are shown in Table 4.1.
4.5. Intake conditions
Details of the intake conditions are shown in Table 4.1.
4.6. Chemical Concentration Limits
Copper and chlorine levels discharged with the cooling water were assumed to be of no interest, as the dosing rates are already below the guidelines set by the Environmental Quality Standards (EQS). Modelling of the evolution of concentration values for these chemicals was therefore not carried out.

BMT Fluid Mechanics Limited COMMERCIAL-IN-CONFIDENCE
Azeri Chirag Gunashi Field Cooling Water Dispersion Modelling 13 of 32 Appendix 11F Eng FINAL
4.7. Assessment Scenarios
4.7.1. Cooling Water Discharge
A total of four baseline scenarios were considered for the cooling water discharge analysis:
two winter simulations were carried out, using a constant temperature profile of 7ºC and two current speeds (i.e. near-stagnant and predominant)
two summer simulations were carried out, using the temperature profile obtained from [1] and two current speeds (i.e. near-stagnant and predominant)
Sensitivity analyses were also carried out by varying the temperature and the depth of the discharge (i.e. 75 ºC at a depth of 75 m and 45 m and 25 ºC at a depth of 45 m).
The cooling water dispersion scenarios investigated in the analysis are summarised in Table 4.2.
4.7.2. Cooling Water Intake
A total of two scenarios were considered for the cooling water intake analysis:
near-stagnant current condition
predominant current condition
A constant, uniform ambient temperature of 7 ºC was assumed for both intake scenarios.
4.8. Results
4.8.1. Thermal Plume Dimensions
The thermal plume dimensions were assessed and compared with the requirement (recommended by the IFC) that thermal discharges should not increase ambient water temperatures by more than 3 ºC at the edge of a 100 m mixing zone.
A summary of the results, giving the main dimensions of the 3 ºC above ambient plumes, is provided in Error! Reference source not found.3.
For the baseline scenarios (i.e. 25 ºC discharge at a depth of 75 m), the maximum height reached by the thermal plume occurred for the winter near-stagnant scenario (Scenario 1), where the top of the plume reached a depth of 65 m.
The maximum length of the thermal plume occurred for the summer predominant current scenario (Scenario 4), where the tip of the plume reached a distance of 13 m from the point of discharge.
The thermal plume width reached a maximum value of 4 m for each scenario assessed.

BMT Fluid Mechanics Limited COMMERCIAL-IN-CONFIDENCE
Azeri Chirag Gunashi Field Cooling Water Dispersion Modelling 14 of 32 Appendix 11F Eng FINAL
The thermal plumes generated by the cooling water discharge met the limit recommended by the IFC and also never reached the sea surface for all conditions investigated.
Small impact on the thermal plume sizes was observed by varying the discharge depth to 45 m. The maximum plume height reached was 33 m in depth. However, the plume extent was still within the 100 m radius prescribed by the IFC and did not reach the sea surface.
Significant impact on the thermal plume sizes was observed by increasing the discharge temperature to 75 ºC. The maximum plume height reached was 42 m in depth for a 75 m deep discharge. If the discharge was moved to a depth of 45 m, the maximum plume height reached was 12 m. However, the plume extent was still within the 100 m radius prescribed by the IFC and did not reach the sea surface.
4.8.2. Thermal Plumes Visualisations
Figure 4.2 to Figure 4.5 present vertical contour plots of temperature for each scenario investigated. A thick black contour line is also shown on each figure to depict the 3 ºC difference limit with ambient temperature.
4.8.3. Intake flow effects
Results of the simulations carried out to model the effects of the water intake on the surrounding current conditions can be seen in Figure 4.5 to Figure 4.7.
In terms of the effect on the free stream flow velocity, the intake imposes a 5% disturbance to a maximum distance of approximately 6 m from the pipe for near-stagnant current conditions and 2 m for predominant current conditions.

BMT Fluid Mechanics Limited COMMERCIAL-IN-CONFIDENCE
Azeri Chirag Gunashi Field Cooling Water Dispersion Modelling 15 of 32 Appendix 11F Eng FINAL
5. Conclusions
For the baseline scenarios (i.e. 25 ºC discharge at a depth of 75 m), the maximum height reached by the thermal plume occurred for the winter near-stagnant scenario, where the top of the plume reaches a depth of 65m.
For the baseline scenarios (i.e. 25 ºC discharge at a depth of 75 m), the maximum length of the thermal plume occurred for the summer predominant current scenario, where the tip of the plume reached a distance of 13 m from the point of discharge.
For the baseline scenarios (i.e. 25 ºC discharge at a depth of 75 m), the thermal plumes generated by the cooling water discharge met the limit recommended by the IFC and also never reached the sea surface for all conditions investigated.
Significant impact on the thermal plume sizes was observed by increasing the discharge temperature to 75 ºC. The maximum plume height reached was 42 m in depth for a 75 m deep discharge. If the discharge was moved to a depth of 45 m, the maximum plume height reached was 12 m. However, the plume extent was still within the 100 m radius prescribed by the IFC and did not reach the sea surface.
Small impact on the thermal plume sizes was observed by varying the discharge depth to 45 m. The maximum plume height reached was 33 m in depth. However, the plume extent was still within the 100 m radius prescribed by the IFC and did not reach the sea surface.
Copper and chlorine levels discharged with the cooling water were assumed to be of no interest, as the dosing rates were already below the guidelines set by the Environmental Quality Standards.
In terms of the effect on the free stream flow velocity, the intake imposes a 5% disturbance to a maximum distance of 6 m from the pipe for near-stagnant current conditions and 2 m for predominant current conditions.

BMT Fluid Mechanics Limited COMMERCIAL-IN-CONFIDENCE
Azeri Chirag Gunashi Field Cooling Water Dispersion Modelling 16 of 32 Appendix 11F Eng FINAL
6. References
[1] ASA, “Hydrodynamic and Dispersion Modelling for the Azeri, Chirag, Gunashi Field Offshore Baku, Azerbaijan”, ASA 01-007, August 2001
[2] Shah Deniz Wind Wave Surge and Current Criteria, v3.1, OceanMetriX Ltd, October 2008

BMT Fluid Mechanics Limited COMMERCIAL-IN-CONFIDENCE
Azeri Chirag Gunashi Field Cooling Water Dispersion Modelling 17 of 32 Appendix 11F Eng FINAL
7. Tables
Table 4.1: Summary of discharge and intake conditions of cooling water
PropertyCooling water
discharge
(for baseline)
Cooling water intake
(for each intake)
Depth 75 [m] 105 [m]
Caisson Diameter 0.8 [m] 1.1 [m]
Flow Rate 3000 [m3/hr] 1500 [m3/hr]
Flowtemperature 25 [ºC] 7 [ºC]
BFCC Corrosion control
Copper: 5 [ppb] Chlorine: 50 [ppb] N/A
Flow Orientation Downwards Upwards

BMT Fluid Mechanics Limited COMMERCIAL-IN-CONFIDENCE
Azeri Chirag Gunashi Field Cooling Water Dispersion Modelling 18 of 32 Appendix 11F Eng FINAL
Table 4.2: Dispersion scenarios of cooling water discharges
Scenario Ambient Condition Current Condition Discharge Depth DischargeTemperature
1 Winter 0.01 [m/s] 75 [m] 25 [ºC]
2 Winter 0.11 [m/s] 75 [m] 25 [ºC]
3 Summer 0.01 [m/s] 75 [m] 25 [ºC]
4 Summer 0.11 [m/s] 75 [m] 25 [ºC]
5 Winter 0.01 [m/s] 75 [m] 75 [ºC]
6 Winter 0.11 [m/s] 75 [m] 75 [ºC]
7 Summer 0.01 [m/s] 75 [m] 75 [ºC]
8 Summer 0.11 [m/s] 75 [m] 75 [ºC]
9 Winter 0.01 [m/s] 45 [m] 25 [ºC]
10 Winter 0.11 [m/s] 45 [m] 25 [ºC]
11 Summer 0.01 [m/s] 45 [m] 25 [ºC]
12 Summer 0.11 [m/s] 45 [m] 25 [ºC]
13 Winter 0.01 [m/s] 45 [m] 75 [ºC]
14 Winter 0.11 [m/s] 45 [m] 75 [ºC]
15 Summer 0.01 [m/s] 45 [m] 75 [ºC]
16 Summer 0.11 [m/s] 45 [m] 75 [ºC]


Seawater Temperature [ºC]

a) W
inte
r ne
ar-s
tagn
ant
curr
ent
cond
itio
ns –
75
m d
epth
– 2
5 de
gree
s di
scha
rge
b) W
inte
r pr
edom
inan
t cu
rren
t co
ndit
ions
– 7
5 m
dep
th –
25
degr
ees
disc
harg
e
c) S
umm
er n
ear-
stag
nant
cur
rent
con
diti
ons
– 75
m d
epth
– 2
5 de
gree
s di
scha
rge
d) S
umm
er p
redo
min
ant
curr
ent
cond
itio
ns –
75
m d
epth
– 2
5 de
gree
s di
scha
rge
Figu
re 4
.2:
Tem
pera
ture
con
tour
plo
ts a
cros
s th
e pl
ume
cent
relin
e, a
lso
depi
ctin
g (
thic
k bl
ack
line)
the
lim
it o
f 3
degr
ees
abov
e am
bien
t te
mpe
ratu
re (
Scen
ario
s 1
to 4
)

a) W
inte
r ne
ar-s
tagn
ant
curr
ent
cond
itio
ns –
75
m d
epth
– 7
5 de
gree
s di
scha
rge
b) W
inte
r pr
edom
inan
t cu
rren
t co
ndit
ions
– 7
5 m
dep
th –
75
degr
ees
disc
harg
e
c) S
umm
er n
ear-
stag
nant
cur
rent
con
diti
ons
– 75
m d
epth
– 7
5 de
gree
s di
scha
rge
d) S
umm
er p
redo
min
ant
curr
ent
cond
itio
ns –
75
m d
epth
– 7
5 de
gree
s di
scha
rge
Figu
re 4
.3:
Tem
pera
ture
con
tour
plo
ts a
cros
s th
e pl
ume
cent
relin
e, a
lso
depi
ctin
g (
thic
k bl
ack
line)
the
lim
it o
f 3
degr
ees
abov
e am
bien
t te
mpe
ratu
re (
Scen
ario
s 5
to 8
)

a) W
inte
r ne
ar-s
tagn
ant
curr
ent
cond
itio
ns –
45
m d
epth
– 2
5 de
gree
s di
scha
rge
b) W
inte
r pr
edom
inan
t cu
rren
t co
ndit
ions
– 4
5 m
dep
th –
25
degr
ees
disc
harg
e
c) S
umm
er n
ear-
stag
nant
cur
rent
con
diti
ons
– 45
m d
epth
– 2
5 de
gree
s di
scha
rge
d) S
umm
er p
redo
min
ant
curr
ent
cond
itio
ns –
45
m d
epth
– 2
5 de
gree
s di
scha
rge
Figu
re 4
.4:
Tem
pera
ture
con
tour
plo
ts a
cros
s th
e pl
ume
cent
relin
e, a
lso
depi
ctin
g (
thic
k bl
ack
line)
the
lim
it o
f 3
degr
ees
abov
e am
bien
t te
mpe
ratu
re. (
Scen
ario
s 9
to 1
2)

a) W
inte
r ne
ar-s
tagn
ant
curr
ent
cond
itio
ns –
45
m d
epth
– 7
5 de
gree
s di
scha
rge
b) W
inte
r pr
edom
inan
t cu
rren
t co
ndit
ions
– 4
5 m
dep
th –
75
degr
ees
disc
harg
e
c) S
umm
er n
ear-
stag
nant
cur
rent
con
diti
ons
– 45
m d
epth
– 7
5 de
gree
s di
scha
rge
d) S
umm
er p
redo
min
ant
curr
ent
cond
itio
ns –
45
m d
epth
– 7
5 de
gree
s di
scha
rge
Figu
re 4
.5:
Tem
pera
ture
con
tour
plo
ts a
cros
s th
e pl
ume
cent
relin
e, a
lso
depi
ctin
g (
thic
k bl
ack
line)
the
lim
it o
f 3
degr
ees
abov
e am
bien
t te
mpe
ratu
re. (
Scen
ario
s 13
to
16)

a)N
ear-
stag
nant
cur
rent
con
diti
on
b)P
redo
min
ant
curr
ent
cond
itio
ns
Figu
re 4
.6:
Con
tour
plo
ts o
f ve
loci
ty c
hang
e fr
om c
urre
nt m
ean
velo
city
(co
lour
dep
icts
vel
ocit
y pe
rcen
tage
cha
nge
wit
h re
spec
t to
cur
rent
con
diti
on)
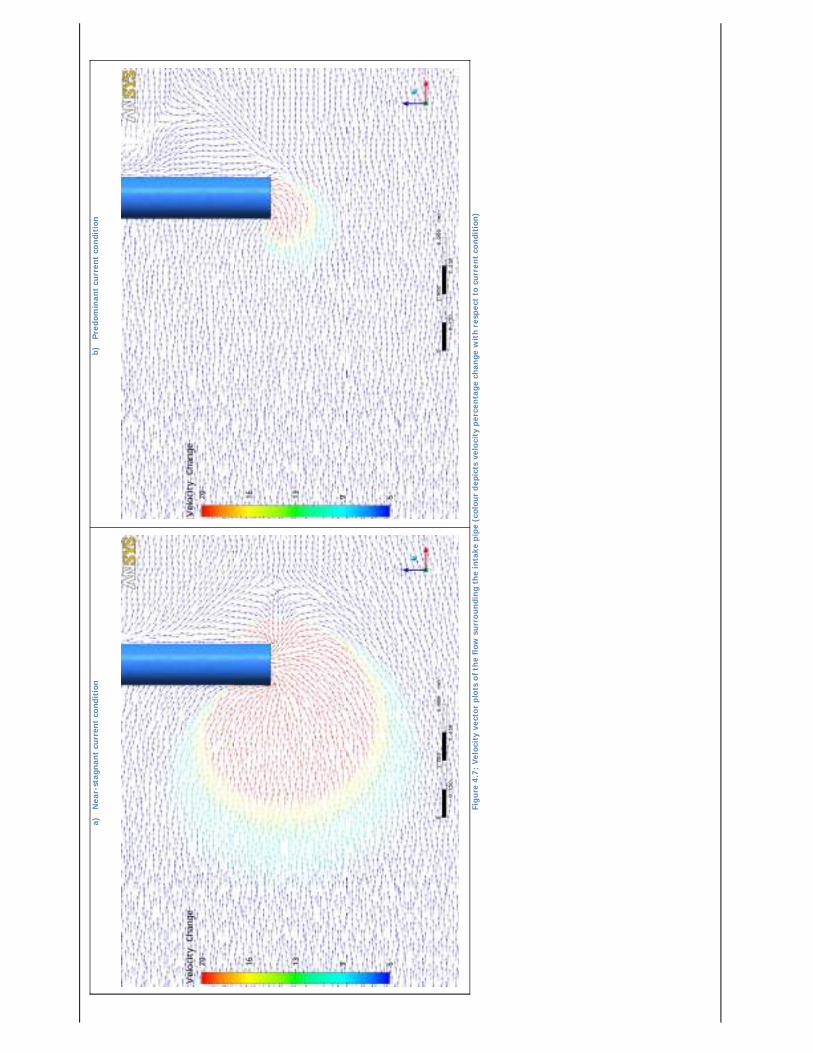
a)N
ear-
stag
nant
cur
rent
con
diti
on
b)P
redo
min
ant
curr
ent
cond
itio
n
Figu
re 4
.7:
Vel
ocit
y ve
ctor
plo
ts o
f th
e fl
ow s
urro
undi
ng t
he in
take
pip
e (c
olou
r de
pict
s ve
loci
ty p
erce
ntag
e ch
ange
wit
h re
spec
t to
cur
rent
con
diti
on)

a)N
ear-
stag
nant
cur
rent
con
diti
on
b)P
redo
min
ant
curr
ent
cond
itio
n
Figu
re 4
.8:
Vel
ocit
y m
agni
tude
con
tour
plo
ts o
f th
e fl
ow s
urro
undi
ng t
he in
take
pip
e

BMT Fluid Mechanics Limited COMMERCIAL-IN-CONFIDENCE
Azeri Chirag Gunashi Field Cooling Water Dispersion Modelling 28 of 32 Appendix 11F Eng FINAL
APPENDIX A. CFD MODEL
A.1. Analysis Software
CFX is regarded as a market-leading product that has been thoroughly validated for dispersion problems relevant to the oil and gas industry both by the specialists BMT and by external specialists. Publically available verification studies for a number of different fluids dynamics problems such as movement of solids through liquids and bubble plume behaviour have been undertaken at the University of Melbourne in Australia and the Paul Scherrer Institute in Switzerland2. Additional case studies including verification studies are provided here:
http://www.ansys.com/industries/sys-testimonials.asp?ID=10
A.2. Methodology
A.2.1. General
Dispersion of cooling water was modelled using discharge parameters supplied by BP. The cooling water release was modelled explicitly as a 0.8m diameter pipe opening.
The risers and the legs of the platform were assumed not to represent a significant blockage to the flow, and hence they were not included in the model.
No topography (i.e. flat seabed) was included.
A.3. Fluid Properties
A.3.1. Seawater
Table A.1 presents the properties of seawater used in the analysis.
A.4. Computational Mesh
The computational mesh was generated in the domain bounded by the seabed and the sea surface. The computational domain extended sufficiently far away in each direction to avoid any boundary influence on the flow solution. The computational mesh used for the simulations comprised approximately 4 million tetrahedral cells. Additional mesh refinement was applied in the proximity regions of the release location.
A.5. Turbulence Model
2 http://www.cfd.com.au/cfd_conf03/papers/123Hol.pdf;http://www.cfd.com.au/cfd_conf97/papers/smi002.pdf; Dispersion of neutrally buoyant solids falling vertically into stationary liquid and horizontal channel flow, K. M. Smith, M. R. Davidson and N. J. Lawson Computers & Fluids Volume 29, Issue 4, 1 May 2000, Pages 369-384; On the modelling of bubble plumes in a liquid pool, B. L. Smith, Applied Mathematical Modelling, Volume 22, Issue 10,October 1998, Pages 773-797

BMT Fluid Mechanics Limited COMMERCIAL-IN-CONFIDENCE
Azeri Chirag Gunashi Field Cooling Water Dispersion Modelling 29 of 32 Appendix 11F Eng FINAL
The Shear Stress Transport (SST) turbulence model was employed in the CFD simulations with standard coefficients.
The SST turbulence model is widely used for applications in the offshore industry and is generally suitable for the assessment of dispersion.
A.6. Heat Transfer Model
Heat transfer was modelled in the dispersion simulations. The ambient seawater temperature varied depending on the season condition. Summer and winter thermal conditions were obtained from [1].
A.7. Buoyancy
Buoyancy forces due to changes in fluid density were modelled in the analysis using the Boussinesq approximation.
A.8. Current Velocity Profile
The current velocity profile was simulated as uniform across the water column and consisted of two distinguished cases:
Predominant current speed = 0.11m/s
Near-stagnant current speed = 0.01m/s
A.9. Boundary Conditions
A.9.1. Upstream and Downstream Boundaries
Current properties and temperature profile for each scenario (see Section 4.2) were applied at the upstream domain boundary.
A.9.2. Seabed
A no-slip wall boundary condition (u, v, w = 0) was applied at the seabed.
A.9.3. Sea surface
A free-slip wall boundary condition (w = 0) was applied at the sea surface.
A.9.4. Side Surfaces
A free-slip wall boundary condition (v = 0) was applied at the surfaces on the sides.

BMT Fluid Mechanics Limited COMMERCIAL-IN-CONFIDENCE
Azeri Chirag Gunashi Field Cooling Water Dispersion Modelling 30 of 32 Appendix 11F Eng FINAL
Seawater
Density (kg/m3) 1,010 Dynamic viscosity (kg/(m.s)) See Figure A.1 Molecular weight (kg/kmole) 18.02
Specific Heat Capacity (J/(kg.K)) 4,181.7 Thermal Conductivity (W/(m.K)) 0.6069
Thermal Expansivity (K-1) 0.000257
Table A.1 – Properties of seawater

Seawater Dynamic Viscosity [Pa.s]


APPENDIX 13A
Routine and Non Routine Discharge Parameters


AIO
C C
hira
g O
il P
roje
ct
Env
ironm
enta
l & S
ocio
-Eco
nom
ic Im
pact
Ass
essm
ent
App
endi
x 13
A


APPENDIX 13B
OSIS Study for COP


OSIS Study for COP (Caspian Sea)
A part of BMT in Energy and Environment
Reference: L40030.1 Date: 15 January 2010
Prepared for: Azerbaijan International Operating Company

OSIS Study for COP (Caspian Sea)_____________________________________________________________________________________________________
_______________________________________________________________________________________________________ A8154October 2008 © BMT ARGOSS
Document status sheet
Title : OSIS Study for COP (Caspian Sea)
Code : L40030.1 Date : 15 January 2010 Status : Draft Issue : 1.0
Contractnr : COP-SO-121 Projectnr : L40030 Prepared for : Azerbaijan International Operating Company
Author(s) : Z. Roberts (BMT ARGOSS)
Approved by : M. Rymell (BMT ARGOSS)
Distribution : A. Lewis

OSIS Study for COP (Caspian Sea)_____________________________________________________________________________________________________
_______________________________________________________________________________________________________ A8126January 2010 © BMT ARGOSS Contents - Page 1
Contents
1. INTRODUCTION.................................................................................................... ..................1
2. MODELLING .................................................................................................... ........................1
2.1. THE OSIS MODEL .................................................................................................... .......12.2. MODEL SCENARIOS .................................................................................................... ...... 2
2.2.1. Oil type.................................................................................................... ................................... 22.2.2. Meteorological Data .................................................................................................... ............. 22.2.3. Hydrodynamic Data .................................................................................................... ............. 2
3. RESULTS AND DISCUSSION ..............................................................................................3
3.1. DETERMINISTIC MODELLING.............................................................................................33.1.1. COP Blowout Scenario.................................................................................................... ........33.1.2. Separator failure of 81m3 crude oil ........................................................................................ 33.1.3. Diesel spill .................................................................................................... .............................3

OSIS Study for COP (Caspian Sea)_____________________________________________________________________________________________________
_______________________________________________________________________________________________________ L40030January 2010 © BMT ARGOSS Page 1
1. Introduction
Azerbaijan International Operating Company (AIOC) has commissioned BMT
Argoss Limited (BMT) to conduct a modelling study on the expected fate of a release of oil from a blowout, a separator failure and a diesel tank located at the
COP platform in the Caspian Sea. BMT’s Oil Spill Information System (OSIS) was
used to model 20 deterministic spill scenarios to assess potential beaching events
and oil weathering.
OSIS is a particle-tracking model that can simulate the fate and dispersion of surface oil slicks. OSIS can be used to run individual deterministic model scenarios
providing results of the trajectory of the slick, together with the evaporated,
dispersed, beached and slick volumes.
The results of the oil spill modelling study are presented in this report.
2. Modelling
Modelling of the oil dispersion was conducted using BMT Cordah’s OSIS system.
OSIS has been jointly developed by BMT Cordah and AEA Technology plc. An
overview of OSIS is given in the following section. More detailed background
documentation can be found in Appendix A.
2.1. The OSIS Model
OSIS is a particle-tracking model that can simulate the fate and dispersion of
surface oil slicks. It represents an oil slick as a collection of free moving particles
which simulate the spreading slick. Simultaneously, weathering algorithms
determine the changes in physical properties of the slick as it spreads.
The transport model takes into account the three dimensional transport processes acting on the oil due to the current, wind, waves, diffusion and buoyancy. As these
effects can be parameterised in terms of environmental conditions, predictions can
be made allowing for a wide variety of weather conditions.
The hydrocarbon properties model uses algorithms to calculate the changes in the
hydrocarbon properties due to evaporation, emulsification and natural dispersion. As a result, physical properties such as density, viscosity and flash point changes
are also predicted. The OSIS model and its algorithms are fully explained in Walker
(1995), which is included in full in Appendix A.

OSIS Study for COP (Caspian Sea)_____________________________________________________________________________________________________
_______________________________________________________________________________________________________ L40030January 2010 © BMT ARGOSS Page 2
OSIS supports several model types, but they can be generally characterised as
being either deterministic or stochastic:
Deterministic models simulate a point source spill scenario under a single
set of metocean conditions. The final results from this type of model are
presented on a map indicating the trajectory of the oil, the area of the slick, and beaching location of the spill after a specified period. An approximation
of the area over which oil sheening will occur is also shown. In addition,
graphs of the variation of spilled oil properties with time are presented (these include the variation in volumes of slick, evaporated, dispersed and beached
oil).
Stochastic models allow the simulation of a point source spill under a specified number of different probable metocean conditions, defined as wind
speed and direction percentage frequencies as either a wind rose or a time
series. This module provides results as contour plots showing the probabilities of surface oiling and a map of beaching locations. No volume
outputs are available from the stochastic module.
2.2. Model scenarios
Spill scenarios were provided by BP and are shown in Table 1. In total 20
deterministic runs were conducted across three scenarios:
Scenario 1A. COP Blowout.
Scenario 1B. Separator failure.
Scenario 1C. Diesel spill.
2.2.1. Oil type
In order to consider weathering of oil within its model, OSIS contains a database of physical and chemical information for over 120 oil types. These have been
characterised by AEA Technology’s laboratories specifically for use in OSIS.
Hydrocarbon releases of Chirag Blend Caspian Sea and DWG Caspian were modelled in this study.
2.2.2. Meteorological Data
The meteorological data used within the model was supplied by AIOC for each
model run.
2.2.3. Hydrodynamic Data
BMT obtained and processed residual surface currents for the Caspian Sea region
from the U.S. Naval Research Laboratory HYCOM Caspian Sea Model. This model

OSIS Study for COP (Caspian Sea)_____________________________________________________________________________________________________
_______________________________________________________________________________________________________ L40030January 2010 © BMT ARGOSS Page 3
operates with a 1/25 degree resolution and provides monthly mean surface
velocities.
As standard, the model assumes a uniform (horizontal) bathymetry, which is
generally suitable for surface spill scenarios.
3. RESULTS AND DISCUSSION
3.1. Deterministic modelling
In the deterministic scenarios constant meteorological conditions have been applied
throughout the model run.
3.1.1. COP Blowout Scenario
Figures 1 - 24 show the spill trajectory and beaching locations, along with variations
of oil in different phases, for the 12 deterministic model runs in the blowout
scenario.
Table 4 shows the volume of beached oil at the final time for a 24 hour release,
along with the expected final time and beached volume for a 42 day release.
The maximum beached volume predicted for a 1 day release occurred in Run 2
(5615.28m3), indicating that after a 42 day release a volume of approximately 236000m3 could be expected to come onshore.
Run 11 exhibited the shortest time to beaching after a 24 hour release at 34 hours.
Two runs (7 and 10) exhibited no beaching.
3.1.2. Separator failure of 81m3 crude oil
Figures 25 – 33 show the spill trajectory and beaching locations, along with variations of oil in different phases, for the 4 deterministic model runs in the
separator failure scenario.
Table 5 shows the volume of beached oil at the final time for an instantaneous
release of crude oil. Run 1 exhibited the maximum beached volume (132.81m3).
Run’s 2 and 3 jointly demonstrated the shortest time to beaching (33 hours).
3.1.3. Diesel spill
Figures 33 – 40 show the spill trajectory variations of oil in different phases, for the
4 deterministic model runs in the diesel spill scenario.
No scenarios exhibited beaching. The diesel evaporated within 11 hours in all
cases.

OSIS Study for COP (Caspian Sea)_____________________________________________________________________________________________________
_______________________________________________________________________________________________________ L40030January 2010 © BMT ARGOSS Page 4
Tables and Figures

OSIS Study for COP (Caspian Sea)_____________________________________________________________________________________________________
_______________________________________________________________________________________________________ L40030January 2010 © BMT ARGOSS Page 5
Wind SpillCharacteristics
RunNo. Location
(Lat/Long WGS84 datum)
StartDate/Time
OilType
SeaTemp(°C)
AirTemp(°C) Speed
(m/s)Directio
n (°)
ReleaseRate
(m3/hr)
ReleaseDuratio
n(hrs)
1 Easting: 519,004m Northing:
4,443,785m
1/02/2010 00:00 Chirag 6 6 5 45 132.5 24 (*42)
2 Easting: 519,004m Northing:
4,443,785m
1/02/2010 00:00 Chirag 6 6 5 110 132.5 24 (*42)
3 Easting: 519,004m Northing:
4,443,785m
1/02/2010 00:00 Chirag 6 6 5 270 132.5 24 (*42)
4 Easting: 519,004m Northing:
4,443,785m
1/02/2010 00:00 Chirag 6 6 10 45 132.5 24 (*42)
5 Easting: 519,004m Northing:
4,443,785m
1/02/2010 00:00
Chirag 6 6 10 110 132.5 24 (*42)
6 Easting: 519,004m Northing:
4,443,785m
1/02/2010 00:00 Chirag 6 6 10 270 132.5 24 (*42)
7 Easting: 519,004m Northing:
4,443,785m
1/02/2010 00:00 DWG 6 6 5 45 132.5 24 (*42)
8 Easting: 519,004m Northing:
4,443,785m
1/02/2010 00:00 DWG 6 6 5 110 132.5 24 (*42)
9 Easting: 519,004m Northing:
4,443,785m
1/02/2010 00:00 DWG 6 6 5 270 132.5 24 (*42)
10 Easting: 519,004m Northing:
4,443,785m
1/02/2010 00:00 DWG 6 6 10 45 132.5 24 (*42)
11 Easting: 519,004m Northing:
4,443,785m
1/02/2010 00:00 DWG 6 6 10 110 132.5 24 (*42)
12 Easting: 519,004m Northing:
4,443,785m
1/02/2010 00:00 DWG 6 6 10 270 132.5 24 (*42)
Table 1 Run descriptions for Scenario 1A COP blowout
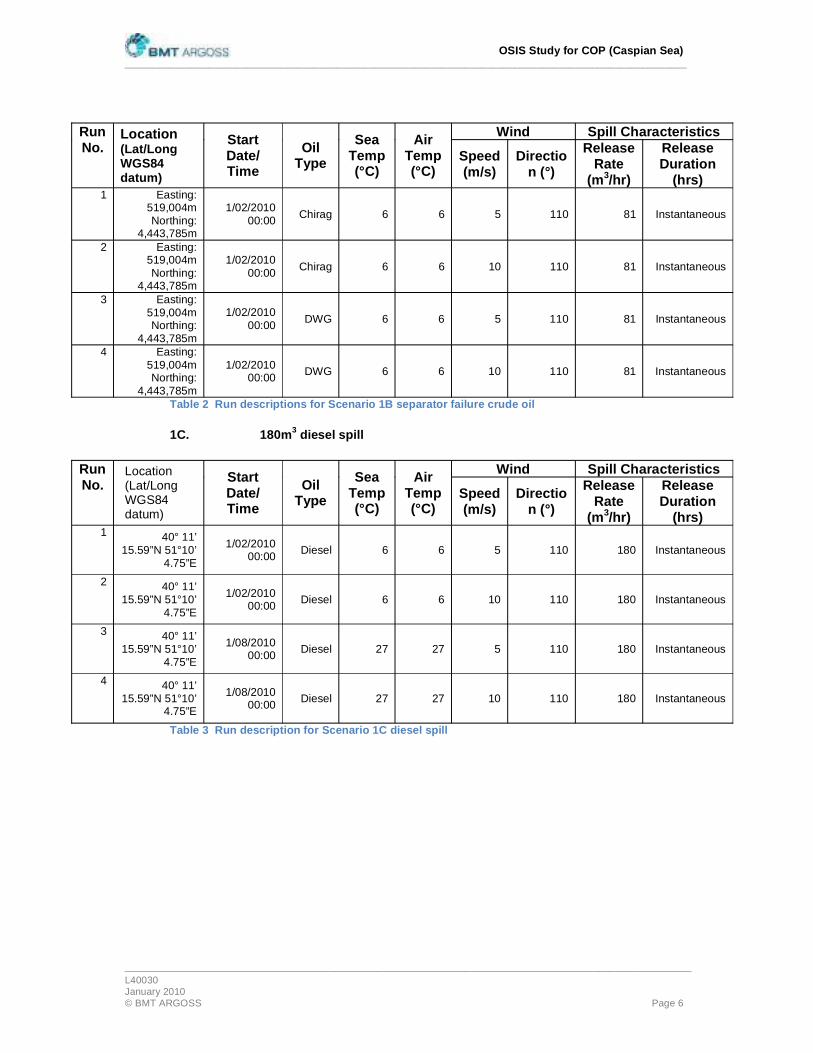
OSIS Study for COP (Caspian Sea)_____________________________________________________________________________________________________
_______________________________________________________________________________________________________ L40030January 2010 © BMT ARGOSS Page 6
Wind Spill Characteristics RunNo.
Location(Lat/Long WGS84 datum)
StartDate/Time
OilType
SeaTemp(°C)
AirTemp(°C)
Speed(m/s)
Direction (°)
ReleaseRate
(m3/hr)
ReleaseDuration
(hrs)1 Easting:
519,004m Northing:
4,443,785m
1/02/2010 00:00 Chirag 6 6 5 110 81 Instantaneous
2 Easting: 519,004m Northing:
4,443,785m
1/02/2010 00:00 Chirag 6 6 10 110 81 Instantaneous
3 Easting: 519,004m Northing:
4,443,785m
1/02/2010 00:00 DWG 6 6 5 110 81 Instantaneous
4 Easting: 519,004m Northing:
4,443,785m
1/02/2010 00:00 DWG 6 6 10 110 81 Instantaneous
Table 2 Run descriptions for Scenario 1B separator failure crude oil
1C. 180m3 diesel spill
Wind Spill Characteristics RunNo.
Location(Lat/Long WGS84 datum)
StartDate/Time
OilType
SeaTemp(°C)
AirTemp(°C)
Speed(m/s)
Direction (°)
ReleaseRate
(m3/hr)
ReleaseDuration
(hrs)1 40° 11’
15.59”N 51°10’ 4.75”E
1/02/2010 00:00 Diesel 6 6 5 110 180 Instantaneous
2 40° 11’ 15.59”N 51°10’
4.75”E
1/02/2010 00:00 Diesel 6 6 10 110 180 Instantaneous
3 40° 11’ 15.59”N 51°10’
4.75”E
1/08/2010 00:00 Diesel 27 27 5 110 180 Instantaneous
4 40° 11’ 15.59”N 51°10’
4.75”E
1/08/2010 00:00 Diesel 27 27 10 110 180 Instantaneous
Table 3 Run description for Scenario 1C diesel spill

OSIS Study for COP (Caspian Sea)_____________________________________________________________________________________________________
_______________________________________________________________________________________________________ L40030January 2010 © BMT ARGOSS Page 7
Run No. Final Time
(hours) Beached Volume
Expected final time for 42
blowout
ExpectedBeached
Volume after 42 day blowout
1 523 154.7 1531 6497.4
2 75 5615.28 1083 235841.8
3 305 1594.25 1313 66958.5
4 211 698.35 1219 29330.7
5 70 4374.94 1078 183747.5
6 114 2702.52 1122 113505.8
7 350 0 1358 0
8 74 4952.45 1082 208002.9
9 302 407.77 1310 17126.34
10 178 0 1186 0
11 69 3986 1077 167412
12 115 2102.67 1123 88312.14
Table 4 Beaching volume results for Scenario 1A COP blowout after a 24 hour model run and expected volumes for a 42 day blowout

OSIS Study for COP (Caspian Sea)_____________________________________________________________________________________________________
_______________________________________________________________________________________________________ L40030January 2010 © BMT ARGOSS Page 8
RunNo.
Final Time (hours)
Beached Volume
1 53 132.81
2 49 96.35
3 53 114.78
4 49 82.33
Table 5 Beaching volume results for Scenario 1B separator failure crude oil
RunNo.
Final Time (hours)
Beached Volume
1 11 0
2 8 0
3 10 0
4 7 0
Table 6 Beaching volume results for Scenario 1C diesel spill

OSIS Study for COP (Caspian Sea)_____________________________________________________________________________________________________
_______________________________________________________________________________________________________ L40030January 2010 © BMT ARGOSS Page 9
0 130
Figure 1 The volumes of oil in different phases over time for Scenario 1A.1.
Figure 2 Spill history for Scenario 1A.1 showing the trajectory of the 24 hour oil spill. The grey area indicates the area most likely to be affected by oil sheening.
0 130km
Key:
Centroid
Oil Particles
Spill History
Land
Sea

OSIS Study for COP (Caspian Sea)_____________________________________________________________________________________________________
_______________________________________________________________________________________________________ L40030January 2010 © BMT ARGOSS Page 10
Figure 3 The volumes of oil in different phases over time for Scenario 1A.2.
Figure 4 Spill history for Scenario 1A.2 showing the trajectory of the 24 hour oil spill. The grey area indicates the area most likely to be affected by oil sheening.
Key:
Centroid
Oil Particles
Spill History
Land
Sea
0 24km

OSIS Study for COP (Caspian Sea)_____________________________________________________________________________________________________
_______________________________________________________________________________________________________ L40030January 2010 © BMT ARGOSS Page 11
Figure 5 The volumes of oil in different phases over time for Scenario 1A.3.
Figure 6 Spill history for Scenario 1A.3 showing the trajectory of the 24 hour oil spill. The grey area indicates the area most likely to be affected by oil sheening.
Key:
Centroid
Oil Particles
Spill History
Land
Sea
0 61km

OSIS Study for COP (Caspian Sea)_____________________________________________________________________________________________________
_______________________________________________________________________________________________________ L40030January 2010 © BMT ARGOSS Page 12
Figure 7 The volumes of oil in different phases over time for Scenario 1A.4.
Figure 8 Spill history for Scenario 1A.4 showing the trajectory of the 24 hour oil spill. The grey area indicates the area most likely to be affected by oil sheening.
Key:
Centroid
Oil Particles
Spill History
Land
Sea
0 140km

OSIS Study for COP (Caspian Sea)_____________________________________________________________________________________________________
_______________________________________________________________________________________________________ L40030January 2010 © BMT ARGOSS Page 13
Figure 9 The volumes of oil in different phases over time for Scenario 1A.5.
Figure 10 Spill history for Scenario 1A.5 showing the trajectory of the 24 hour oil spill. The grey area indicates the area most likely to be affected by oil sheening.
Key:
Centroid
Oil Particles
Spill History
Land
Sea
0 34km

OSIS Study for COP (Caspian Sea)_____________________________________________________________________________________________________
_______________________________________________________________________________________________________ L40030January 2010 © BMT ARGOSS Page 14
Figure 11 The volumes of oil in different phases over time for Scenario 1A.6.
Figure 12 Spill history for Scenario 1A.6 showing the trajectory of the 24 hour oil spill. The grey area indicates the area most likely to be affected by oil sheening.
Key:
Centroid
Oil Particles
Spill History
Land
Sea
0 69km

OSIS Study for COP (Caspian Sea)_____________________________________________________________________________________________________
_______________________________________________________________________________________________________ L40030January 2010 © BMT ARGOSS Page 15
Figure 13 The volumes of oil in different phases over time for Scenario 1A.7.
Figure 14 Spill history for Scenario 1A.7 showing the trajectory of the 24 hour oil spill. The grey area indicates the area most likely to be affected by oil sheening.
Key:
Centroid
Oil Particles
Spill History
Land
Sea
0 110km

OSIS Study for COP (Caspian Sea)_____________________________________________________________________________________________________
_______________________________________________________________________________________________________ L40030January 2010 © BMT ARGOSS Page 16
Figure 15 The volumes of oil in different phases over time for Scenario 1A.8.
Figure 16 Spill history for Scenario 1A.8 showing the trajectory of the 24 hour oil spill. The grey area indicates the area most likely to be affected by oil sheening.
Key:
Centroid
Oil Particles
Spill History
Land
Sea
0 30km
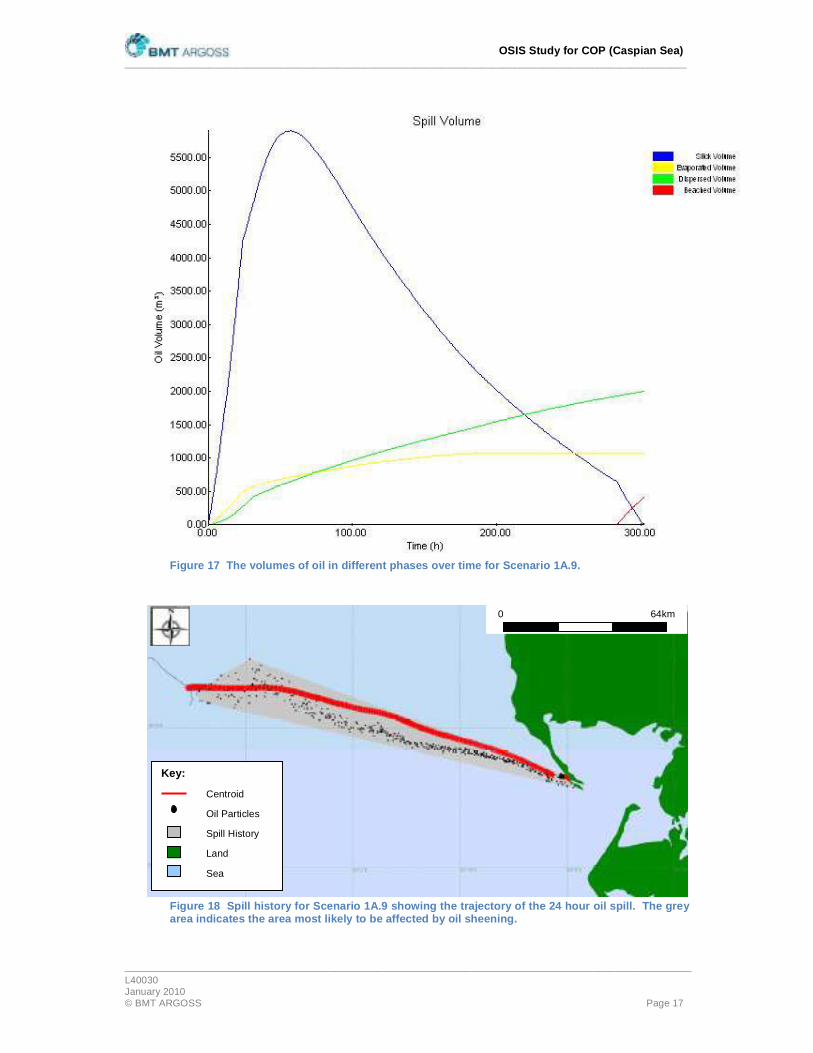
OSIS Study for COP (Caspian Sea)_____________________________________________________________________________________________________
_______________________________________________________________________________________________________ L40030January 2010 © BMT ARGOSS Page 17
Figure 17 The volumes of oil in different phases over time for Scenario 1A.9.
Figure 18 Spill history for Scenario 1A.9 showing the trajectory of the 24 hour oil spill. The grey area indicates the area most likely to be affected by oil sheening.
Key:
Centroid
Oil Particles
Spill History
Land
Sea
0 64km

OSIS Study for COP (Caspian Sea)_____________________________________________________________________________________________________
_______________________________________________________________________________________________________ L40030January 2010 © BMT ARGOSS Page 18
Figure 19 The volumes of oil in different phases over time for Scenario 1A.10.
Figure 20 Spill history for Scenario 1A.10 showing the trajectory of the 24 hour oil spill. The grey area indicates the area most likely to be affected by oil sheening.
Key:
Centroid
Oil Particles
Spill History
Land
Sea
0 120km

OSIS Study for COP (Caspian Sea)_____________________________________________________________________________________________________
_______________________________________________________________________________________________________ L40030January 2010 © BMT ARGOSS Page 19
Figure 21 The volumes of oil in different phases over time for Scenario 1A.11.
Figure 22 Spill history for Scenario 1A.11 showing the trajectory of the 24 hour oil spill. The grey area indicates the area most likely to be affected by oil sheening.
Key:
Centroid
Oil Particles
Spill History
Land
Sea
0 30km

OSIS Study for COP (Caspian Sea)_____________________________________________________________________________________________________
_______________________________________________________________________________________________________ L40030January 2010 © BMT ARGOSS Page 20
Figure 23 The volumes of oil in different phases over time for Scenario 1A.12.
Figure 24 Spill history for Scenario 1A.12 showing the trajectory of the 24 hour oil spill. The grey area indicates the area most likely to be affected by oil sheening.
Key:
Centroid
Oil Particles
Spill History
Land
Sea
0 64km

OSIS Study for COP (Caspian Sea)_____________________________________________________________________________________________________
_______________________________________________________________________________________________________ L40030January 2010 © BMT ARGOSS Page 21
Figure 25 The volumes of oil in different phases over time for Scenario 1B.1.
Figure 26 Spill history for Scenario 1B.1 showing the trajectory of the 24 hour oil spill. The grey area indicates the area most likely to be affected by oil sheening.
Key:
Centroid
Oil Particles
Spill History
Land
Sea
0 23km

OSIS Study for COP (Caspian Sea)_____________________________________________________________________________________________________
_______________________________________________________________________________________________________ L40030January 2010 © BMT ARGOSS Page 22
Figure 27 The volumes of oil in different phases over time for Scenario 1B.2.
Figure 28 Spill history for Scenario 1B.2 showing the trajectory of the 24 hour oil spill. The grey area indicates the area most likely to be affected by oil sheening.
Key:
Centroid
Oil Particles
Spill History
Land
Sea
0 37km

OSIS Study for COP (Caspian Sea)_____________________________________________________________________________________________________
_______________________________________________________________________________________________________ L40030January 2010 © BMT ARGOSS Page 23
Figure 29 The volumes of oil in different phases over time for Scenario 1B.3.
Figure 30 Spill history for Scenario 1B.3 showing the trajectory of the 24 hour oil spill. The grey area indicates the area most likely to be affected by oil sheening.
Key:
Centroid
Oil Particles
Spill History
Land
Sea
0 23km

OSIS Study for COP (Caspian Sea)_____________________________________________________________________________________________________
_______________________________________________________________________________________________________ L40030January 2010 © BMT ARGOSS Page 24
Figure 31 The volumes of oil in different phases over time for Scenario 1B.4.
Figure 32 Spill history for Scenario 1B.4 showing the trajectory of the 24 hour oil spill. The grey area indicates the area most likely to be affected by oil sheening.
Key:
Centroid
Oil Particles
Spill History
Land
Sea
0 28km

OSIS Study for COP (Caspian Sea)_____________________________________________________________________________________________________
_______________________________________________________________________________________________________ L40030January 2010 © BMT ARGOSS Page 25
Figure 33 The volumes of oil in different phases over time for Scenario 1C.1.
Figure 34 Spill history for Scenario 1C.1 showing the trajectory of the 24 hour oil spill. The grey area indicates the area most likely to be affected by oil sheening.
Key:
Centroid
Oil Particles
Spill History
Land
Sea
0 7km

OSIS Study for COP (Caspian Sea)_____________________________________________________________________________________________________
_______________________________________________________________________________________________________ L40030January 2010 © BMT ARGOSS Page 26
Figure 35 The volumes of oil in different phases over time for Scenario 1C.2.
Figure 36 Spill history for Scenario 1C.2 showing the trajectory of the 24 hour oil spill. The grey area indicates the area most likely to be affected by oil sheening.
Key:
Centroid
Oil Particles
Spill History
Land
Sea
0 7km

OSIS Study for COP (Caspian Sea)_____________________________________________________________________________________________________
_______________________________________________________________________________________________________ L40030January 2010 © BMT ARGOSS Page 27
Figure 37 The volumes of oil in different phases over time for Scenario 1C.3.
Figure 38 Spill history for Scenario 1C.3 showing the trajectory of the 24 hour oil spill. The grey area indicates the area most likely to be affected by oil sheening.
Key:
Centroid
Oil Particles
Spill History
Land
Sea
0 7km

OSIS Study for COP (Caspian Sea)_____________________________________________________________________________________________________
_______________________________________________________________________________________________________ L40030January 2010 © BMT ARGOSS Page 28
Figure 39 The volumes of oil in different phases over time for Scenario 1C.4.
Figure 40 Spill history for Scenario 1C.4 showing the trajectory of the 24 hour oil spill. The grey area indicates the area most likely to be affected by oil sheening.
Key:
Centroid
Oil Particles
Spill History
Land
Sea
0 7km
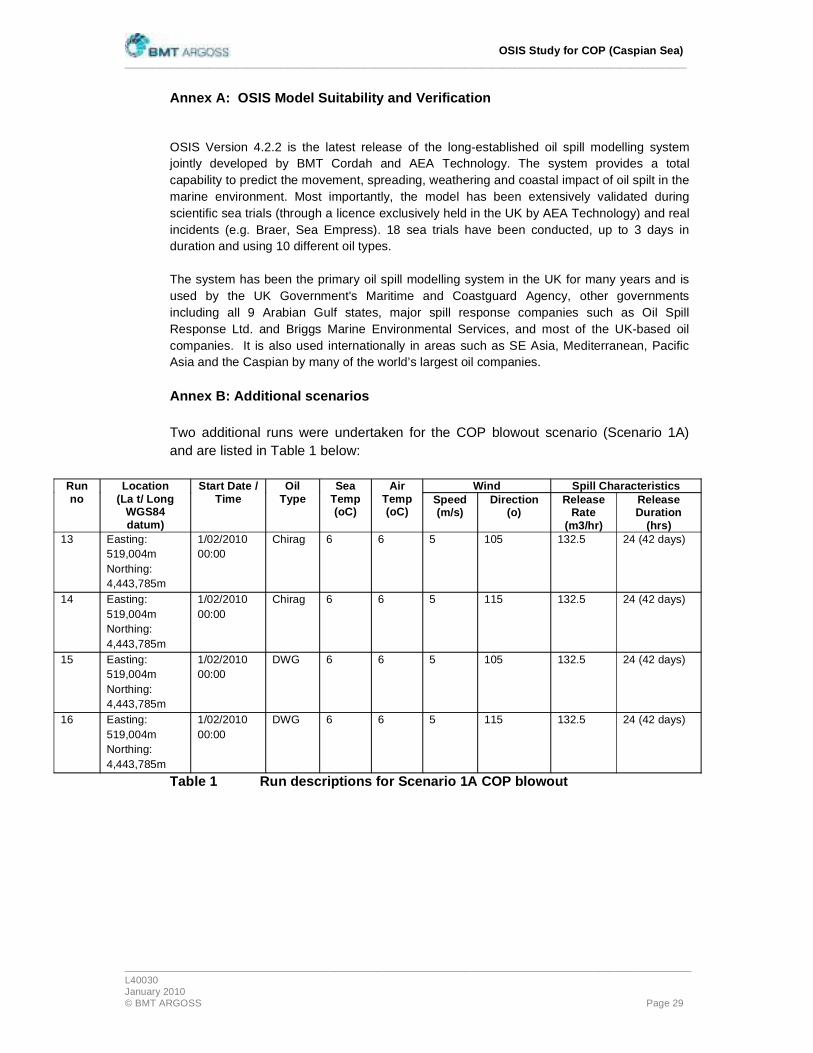
OSIS Study for COP (Caspian Sea)_____________________________________________________________________________________________________
_______________________________________________________________________________________________________ L40030January 2010 © BMT ARGOSS Page 29
Annex A: OSIS Model Suitability and Verification
OSIS Version 4.2.2 is the latest release of the long-established oil spill modelling system jointly developed by BMT Cordah and AEA Technology. The system provides a total capability to predict the movement, spreading, weathering and coastal impact of oil spilt in the marine environment. Most importantly, the model has been extensively validated during scientific sea trials (through a licence exclusively held in the UK by AEA Technology) and real incidents (e.g. Braer, Sea Empress). 18 sea trials have been conducted, up to 3 days in duration and using 10 different oil types.
The system has been the primary oil spill modelling system in the UK for many years and is used by the UK Government's Maritime and Coastguard Agency, other governments including all 9 Arabian Gulf states, major spill response companies such as Oil Spill Response Ltd. and Briggs Marine Environmental Services, and most of the UK-based oil companies. It is also used internationally in areas such as SE Asia, Mediterranean, Pacific Asia and the Caspian by many of the world’s largest oil companies.
Annex B: Additional scenarios
Two additional runs were undertaken for the COP blowout scenario (Scenario 1A) and are listed in Table 1 below:
Wind Spill Characteristics Runno
Location (La t/ Long
WGS84 datum)
Start Date / Time
OilType
SeaTemp (oC)
Air Temp (oC)
Speed (m/s)
Direction (o)
Release Rate
(m3/hr)
Release Duration
(hrs)13 Easting:
519,004m Northing: 4,443,785m
1/02/2010 00:00
Chirag 6 6 5 105 132.5 24 (42 days)
14 Easting: 519,004m Northing: 4,443,785m
1/02/2010 00:00
Chirag 6 6 5 115 132.5 24 (42 days)
15 Easting: 519,004m Northing: 4,443,785m
1/02/2010 00:00
DWG 6 6 5 105 132.5 24 (42 days)
16 Easting: 519,004m Northing: 4,443,785m
1/02/2010 00:00
DWG 6 6 5 115 132.5 24 (42 days)
Table 1 Run descriptions for Scenario 1A COP blowout
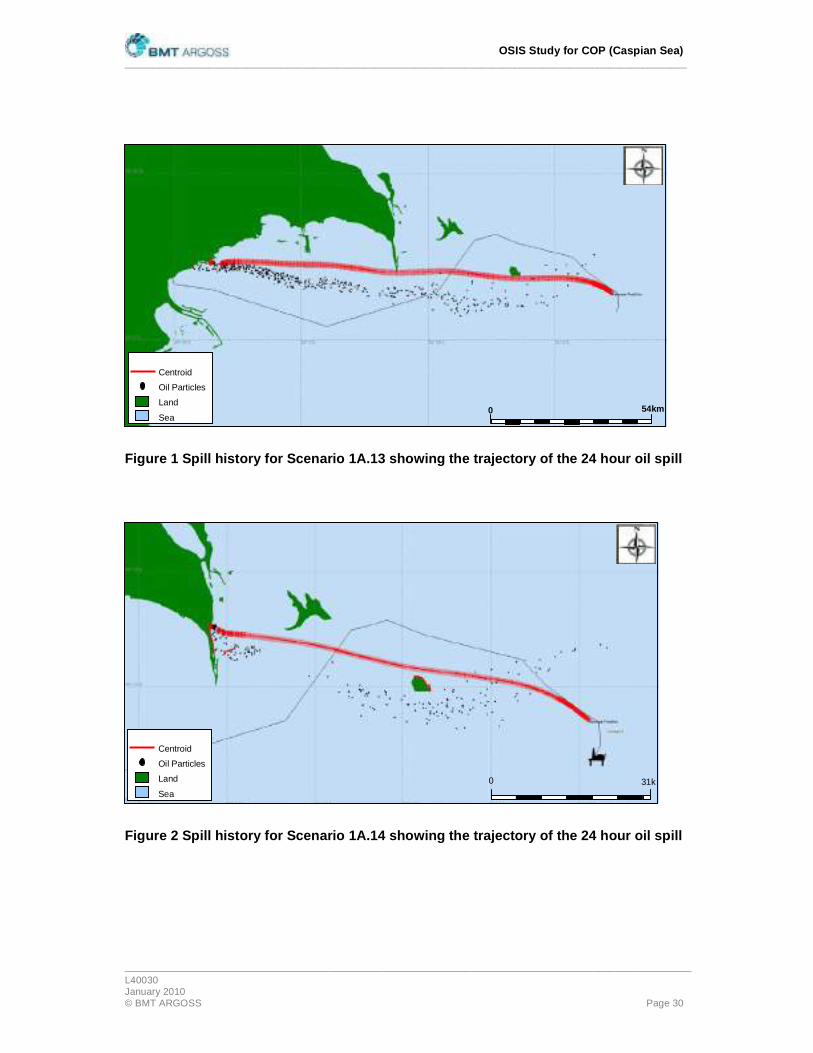
OSIS Study for COP (Caspian Sea)_____________________________________________________________________________________________________
_______________________________________________________________________________________________________ L40030January 2010 © BMT ARGOSS Page 30
Figure 1 Spill history for Scenario 1A.13 showing the trajectory of the 24 hour oil spill
Figure 2 Spill history for Scenario 1A.14 showing the trajectory of the 24 hour oil spill
Centroid
Oil Particles
Land
Sea0 54km
0 31k
Centroid
Oil Particles
Land
Sea

OSIS Study for COP (Caspian Sea)_____________________________________________________________________________________________________
_______________________________________________________________________________________________________ L40030January 2010 © BMT ARGOSS Page 31
Figure 3 Spill history for Scenario 1A.15 showing the trajectory of the 24 hour oil spill
Figure 4 Spill history for Scenario 1A.16 showing the trajectory of the 24 hour oil spill.
Centroid
Oil Particles
Land
Sea0 51km
Centroid
Oil Particles
Land
Sea0 29km

APPENDIX 13A
Routine and Non Routine Discharge Parameters


AIO
C C
hira
g O
il P
roje
ct
Env
ironm
enta
l & S
ocio
-Eco
nom
ic Im
pact
Ass
essm
ent
App
endi
x 13
A


APPENDIX 13B
OSIS Study for COP


OSIS Study for COP (Caspian Sea)
A part of BMT in Energy and Environment
Reference: L40030.1 Date: 15 January 2010
Prepared for: Azerbaijan International Operating Company

OSIS Study for COP (Caspian Sea)_____________________________________________________________________________________________________
_______________________________________________________________________________________________________ A8154October 2008 © BMT ARGOSS
Document status sheet
Title : OSIS Study for COP (Caspian Sea)
Code : L40030.1 Date : 15 January 2010 Status : Draft Issue : 1.0
Contractnr : COP-SO-121 Projectnr : L40030 Prepared for : Azerbaijan International Operating Company
Author(s) : Z. Roberts (BMT ARGOSS)
Approved by : M. Rymell (BMT ARGOSS)
Distribution : A. Lewis

OSIS Study for COP (Caspian Sea)_____________________________________________________________________________________________________
_______________________________________________________________________________________________________ A8126January 2010 © BMT ARGOSS Contents - Page 1
Contents
1. INTRODUCTION.................................................................................................... ..................1
2. MODELLING .................................................................................................... ........................1
2.1. THE OSIS MODEL .................................................................................................... .......12.2. MODEL SCENARIOS .................................................................................................... ...... 2
2.2.1. Oil type.................................................................................................... ................................... 22.2.2. Meteorological Data .................................................................................................... ............. 22.2.3. Hydrodynamic Data .................................................................................................... ............. 2
3. RESULTS AND DISCUSSION ..............................................................................................3
3.1. DETERMINISTIC MODELLING.............................................................................................33.1.1. COP Blowout Scenario.................................................................................................... ........33.1.2. Separator failure of 81m3 crude oil ........................................................................................ 33.1.3. Diesel spill .................................................................................................... .............................3

OSIS Study for COP (Caspian Sea)_____________________________________________________________________________________________________
_______________________________________________________________________________________________________ L40030January 2010 © BMT ARGOSS Page 1
1. Introduction
Azerbaijan International Operating Company (AIOC) has commissioned BMT
Argoss Limited (BMT) to conduct a modelling study on the expected fate of a release of oil from a blowout, a separator failure and a diesel tank located at the
COP platform in the Caspian Sea. BMT’s Oil Spill Information System (OSIS) was
used to model 20 deterministic spill scenarios to assess potential beaching events
and oil weathering.
OSIS is a particle-tracking model that can simulate the fate and dispersion of surface oil slicks. OSIS can be used to run individual deterministic model scenarios
providing results of the trajectory of the slick, together with the evaporated,
dispersed, beached and slick volumes.
The results of the oil spill modelling study are presented in this report.
2. Modelling
Modelling of the oil dispersion was conducted using BMT Cordah’s OSIS system.
OSIS has been jointly developed by BMT Cordah and AEA Technology plc. An
overview of OSIS is given in the following section. More detailed background
documentation can be found in Appendix A.
2.1. The OSIS Model
OSIS is a particle-tracking model that can simulate the fate and dispersion of
surface oil slicks. It represents an oil slick as a collection of free moving particles
which simulate the spreading slick. Simultaneously, weathering algorithms
determine the changes in physical properties of the slick as it spreads.
The transport model takes into account the three dimensional transport processes acting on the oil due to the current, wind, waves, diffusion and buoyancy. As these
effects can be parameterised in terms of environmental conditions, predictions can
be made allowing for a wide variety of weather conditions.
The hydrocarbon properties model uses algorithms to calculate the changes in the
hydrocarbon properties due to evaporation, emulsification and natural dispersion. As a result, physical properties such as density, viscosity and flash point changes
are also predicted. The OSIS model and its algorithms are fully explained in Walker
(1995), which is included in full in Appendix A.
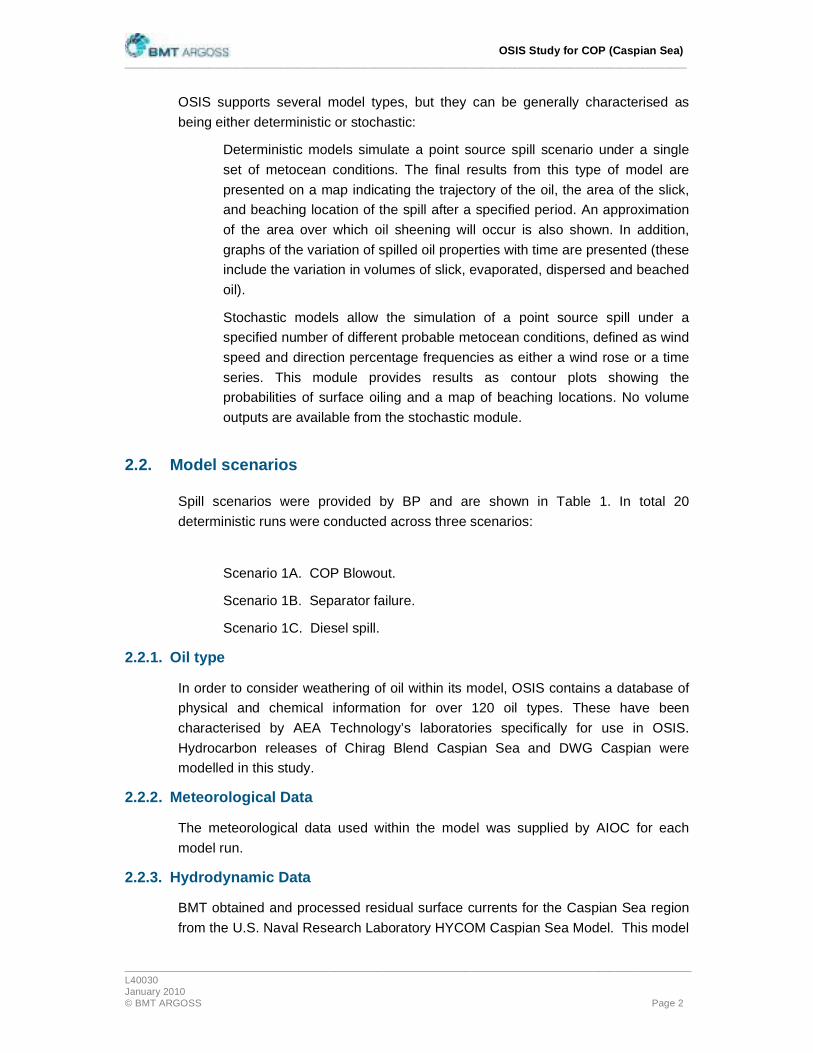
OSIS Study for COP (Caspian Sea)_____________________________________________________________________________________________________
_______________________________________________________________________________________________________ L40030January 2010 © BMT ARGOSS Page 2
OSIS supports several model types, but they can be generally characterised as
being either deterministic or stochastic:
Deterministic models simulate a point source spill scenario under a single
set of metocean conditions. The final results from this type of model are
presented on a map indicating the trajectory of the oil, the area of the slick, and beaching location of the spill after a specified period. An approximation
of the area over which oil sheening will occur is also shown. In addition,
graphs of the variation of spilled oil properties with time are presented (these include the variation in volumes of slick, evaporated, dispersed and beached
oil).
Stochastic models allow the simulation of a point source spill under a specified number of different probable metocean conditions, defined as wind
speed and direction percentage frequencies as either a wind rose or a time
series. This module provides results as contour plots showing the probabilities of surface oiling and a map of beaching locations. No volume
outputs are available from the stochastic module.
2.2. Model scenarios
Spill scenarios were provided by BP and are shown in Table 1. In total 20
deterministic runs were conducted across three scenarios:
Scenario 1A. COP Blowout.
Scenario 1B. Separator failure.
Scenario 1C. Diesel spill.
2.2.1. Oil type
In order to consider weathering of oil within its model, OSIS contains a database of physical and chemical information for over 120 oil types. These have been
characterised by AEA Technology’s laboratories specifically for use in OSIS.
Hydrocarbon releases of Chirag Blend Caspian Sea and DWG Caspian were modelled in this study.
2.2.2. Meteorological Data
The meteorological data used within the model was supplied by AIOC for each
model run.
2.2.3. Hydrodynamic Data
BMT obtained and processed residual surface currents for the Caspian Sea region
from the U.S. Naval Research Laboratory HYCOM Caspian Sea Model. This model

OSIS Study for COP (Caspian Sea)_____________________________________________________________________________________________________
_______________________________________________________________________________________________________ L40030January 2010 © BMT ARGOSS Page 3
operates with a 1/25 degree resolution and provides monthly mean surface
velocities.
As standard, the model assumes a uniform (horizontal) bathymetry, which is
generally suitable for surface spill scenarios.
3. RESULTS AND DISCUSSION
3.1. Deterministic modelling
In the deterministic scenarios constant meteorological conditions have been applied
throughout the model run.
3.1.1. COP Blowout Scenario
Figures 1 - 24 show the spill trajectory and beaching locations, along with variations
of oil in different phases, for the 12 deterministic model runs in the blowout
scenario.
Table 4 shows the volume of beached oil at the final time for a 24 hour release,
along with the expected final time and beached volume for a 42 day release.
The maximum beached volume predicted for a 1 day release occurred in Run 2
(5615.28m3), indicating that after a 42 day release a volume of approximately 236000m3 could be expected to come onshore.
Run 11 exhibited the shortest time to beaching after a 24 hour release at 34 hours.
Two runs (7 and 10) exhibited no beaching.
3.1.2. Separator failure of 81m3 crude oil
Figures 25 – 33 show the spill trajectory and beaching locations, along with variations of oil in different phases, for the 4 deterministic model runs in the
separator failure scenario.
Table 5 shows the volume of beached oil at the final time for an instantaneous
release of crude oil. Run 1 exhibited the maximum beached volume (132.81m3).
Run’s 2 and 3 jointly demonstrated the shortest time to beaching (33 hours).
3.1.3. Diesel spill
Figures 33 – 40 show the spill trajectory variations of oil in different phases, for the
4 deterministic model runs in the diesel spill scenario.
No scenarios exhibited beaching. The diesel evaporated within 11 hours in all
cases.

OSIS Study for COP (Caspian Sea)_____________________________________________________________________________________________________
_______________________________________________________________________________________________________ L40030January 2010 © BMT ARGOSS Page 4
Tables and Figures

OSIS Study for COP (Caspian Sea)_____________________________________________________________________________________________________
_______________________________________________________________________________________________________ L40030January 2010 © BMT ARGOSS Page 5
Wind SpillCharacteristics
RunNo. Location
(Lat/Long WGS84 datum)
StartDate/Time
OilType
SeaTemp(°C)
AirTemp(°C) Speed
(m/s)Directio
n (°)
ReleaseRate
(m3/hr)
ReleaseDuratio
n(hrs)
1 Easting: 519,004m Northing:
4,443,785m
1/02/2010 00:00 Chirag 6 6 5 45 132.5 24 (*42)
2 Easting: 519,004m Northing:
4,443,785m
1/02/2010 00:00 Chirag 6 6 5 110 132.5 24 (*42)
3 Easting: 519,004m Northing:
4,443,785m
1/02/2010 00:00 Chirag 6 6 5 270 132.5 24 (*42)
4 Easting: 519,004m Northing:
4,443,785m
1/02/2010 00:00 Chirag 6 6 10 45 132.5 24 (*42)
5 Easting: 519,004m Northing:
4,443,785m
1/02/2010 00:00
Chirag 6 6 10 110 132.5 24 (*42)
6 Easting: 519,004m Northing:
4,443,785m
1/02/2010 00:00 Chirag 6 6 10 270 132.5 24 (*42)
7 Easting: 519,004m Northing:
4,443,785m
1/02/2010 00:00 DWG 6 6 5 45 132.5 24 (*42)
8 Easting: 519,004m Northing:
4,443,785m
1/02/2010 00:00 DWG 6 6 5 110 132.5 24 (*42)
9 Easting: 519,004m Northing:
4,443,785m
1/02/2010 00:00 DWG 6 6 5 270 132.5 24 (*42)
10 Easting: 519,004m Northing:
4,443,785m
1/02/2010 00:00 DWG 6 6 10 45 132.5 24 (*42)
11 Easting: 519,004m Northing:
4,443,785m
1/02/2010 00:00 DWG 6 6 10 110 132.5 24 (*42)
12 Easting: 519,004m Northing:
4,443,785m
1/02/2010 00:00 DWG 6 6 10 270 132.5 24 (*42)
Table 1 Run descriptions for Scenario 1A COP blowout

OSIS Study for COP (Caspian Sea)_____________________________________________________________________________________________________
_______________________________________________________________________________________________________ L40030January 2010 © BMT ARGOSS Page 6
Wind Spill Characteristics RunNo.
Location(Lat/Long WGS84 datum)
StartDate/Time
OilType
SeaTemp(°C)
AirTemp(°C)
Speed(m/s)
Direction (°)
ReleaseRate
(m3/hr)
ReleaseDuration
(hrs)1 Easting:
519,004m Northing:
4,443,785m
1/02/2010 00:00 Chirag 6 6 5 110 81 Instantaneous
2 Easting: 519,004m Northing:
4,443,785m
1/02/2010 00:00 Chirag 6 6 10 110 81 Instantaneous
3 Easting: 519,004m Northing:
4,443,785m
1/02/2010 00:00 DWG 6 6 5 110 81 Instantaneous
4 Easting: 519,004m Northing:
4,443,785m
1/02/2010 00:00 DWG 6 6 10 110 81 Instantaneous
Table 2 Run descriptions for Scenario 1B separator failure crude oil
1C. 180m3 diesel spill
Wind Spill Characteristics RunNo.
Location(Lat/Long WGS84 datum)
StartDate/Time
OilType
SeaTemp(°C)
AirTemp(°C)
Speed(m/s)
Direction (°)
ReleaseRate
(m3/hr)
ReleaseDuration
(hrs)1 40° 11’
15.59”N 51°10’ 4.75”E
1/02/2010 00:00 Diesel 6 6 5 110 180 Instantaneous
2 40° 11’ 15.59”N 51°10’
4.75”E
1/02/2010 00:00 Diesel 6 6 10 110 180 Instantaneous
3 40° 11’ 15.59”N 51°10’
4.75”E
1/08/2010 00:00 Diesel 27 27 5 110 180 Instantaneous
4 40° 11’ 15.59”N 51°10’
4.75”E
1/08/2010 00:00 Diesel 27 27 10 110 180 Instantaneous
Table 3 Run description for Scenario 1C diesel spill

OSIS Study for COP (Caspian Sea)_____________________________________________________________________________________________________
_______________________________________________________________________________________________________ L40030January 2010 © BMT ARGOSS Page 7
Run No. Final Time
(hours) Beached Volume
Expected final time for 42
blowout
ExpectedBeached
Volume after 42 day blowout
1 523 154.7 1531 6497.4
2 75 5615.28 1083 235841.8
3 305 1594.25 1313 66958.5
4 211 698.35 1219 29330.7
5 70 4374.94 1078 183747.5
6 114 2702.52 1122 113505.8
7 350 0 1358 0
8 74 4952.45 1082 208002.9
9 302 407.77 1310 17126.34
10 178 0 1186 0
11 69 3986 1077 167412
12 115 2102.67 1123 88312.14
Table 4 Beaching volume results for Scenario 1A COP blowout after a 24 hour model run and expected volumes for a 42 day blowout

OSIS Study for COP (Caspian Sea)_____________________________________________________________________________________________________
_______________________________________________________________________________________________________ L40030January 2010 © BMT ARGOSS Page 8
RunNo.
Final Time (hours)
Beached Volume
1 53 132.81
2 49 96.35
3 53 114.78
4 49 82.33
Table 5 Beaching volume results for Scenario 1B separator failure crude oil
RunNo.
Final Time (hours)
Beached Volume
1 11 0
2 8 0
3 10 0
4 7 0
Table 6 Beaching volume results for Scenario 1C diesel spill
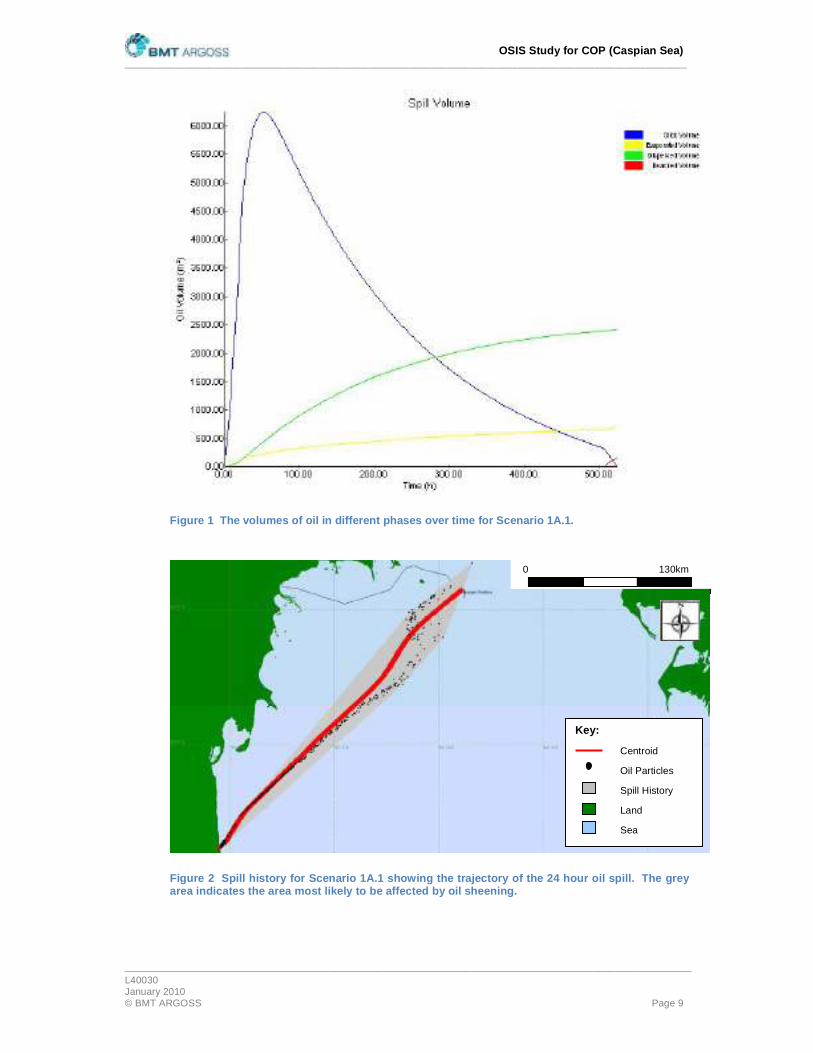
OSIS Study for COP (Caspian Sea)_____________________________________________________________________________________________________
_______________________________________________________________________________________________________ L40030January 2010 © BMT ARGOSS Page 9
0 130
Figure 1 The volumes of oil in different phases over time for Scenario 1A.1.
Figure 2 Spill history for Scenario 1A.1 showing the trajectory of the 24 hour oil spill. The grey area indicates the area most likely to be affected by oil sheening.
0 130km
Key:
Centroid
Oil Particles
Spill History
Land
Sea

OSIS Study for COP (Caspian Sea)_____________________________________________________________________________________________________
_______________________________________________________________________________________________________ L40030January 2010 © BMT ARGOSS Page 10
Figure 3 The volumes of oil in different phases over time for Scenario 1A.2.
Figure 4 Spill history for Scenario 1A.2 showing the trajectory of the 24 hour oil spill. The grey area indicates the area most likely to be affected by oil sheening.
Key:
Centroid
Oil Particles
Spill History
Land
Sea
0 24km
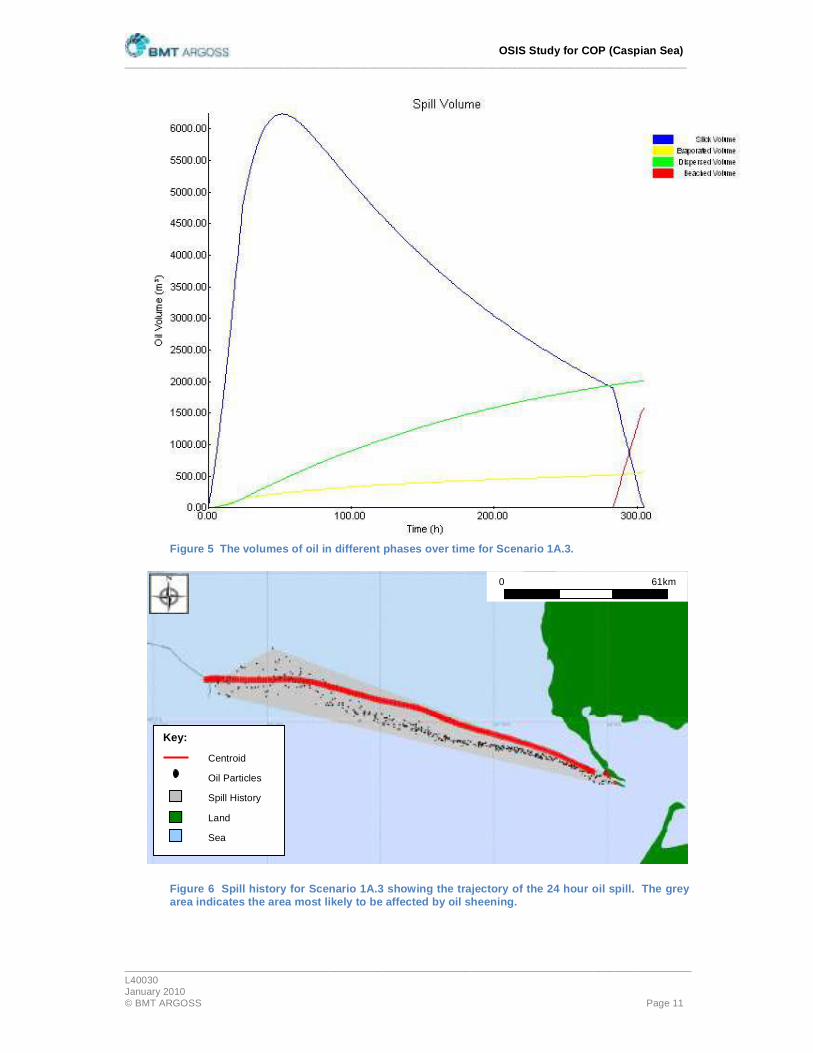
OSIS Study for COP (Caspian Sea)_____________________________________________________________________________________________________
_______________________________________________________________________________________________________ L40030January 2010 © BMT ARGOSS Page 11
Figure 5 The volumes of oil in different phases over time for Scenario 1A.3.
Figure 6 Spill history for Scenario 1A.3 showing the trajectory of the 24 hour oil spill. The grey area indicates the area most likely to be affected by oil sheening.
Key:
Centroid
Oil Particles
Spill History
Land
Sea
0 61km
OSIS Study for COP (Caspian Sea)_____________________________________________________________________________________________________
_______________________________________________________________________________________________________ L40030January 2010 © BMT ARGOSS Page 12
Figure 7 The volumes of oil in different phases over time for Scenario 1A.4.
Figure 8 Spill history for Scenario 1A.4 showing the trajectory of the 24 hour oil spill. The grey area indicates the area most likely to be affected by oil sheening.
Key:
Centroid
Oil Particles
Spill History
Land
Sea
0 140km

OSIS Study for COP (Caspian Sea)_____________________________________________________________________________________________________
_______________________________________________________________________________________________________ L40030January 2010 © BMT ARGOSS Page 13
Figure 9 The volumes of oil in different phases over time for Scenario 1A.5.
Figure 10 Spill history for Scenario 1A.5 showing the trajectory of the 24 hour oil spill. The grey area indicates the area most likely to be affected by oil sheening.
Key:
Centroid
Oil Particles
Spill History
Land
Sea
0 34km

OSIS Study for COP (Caspian Sea)_____________________________________________________________________________________________________
_______________________________________________________________________________________________________ L40030January 2010 © BMT ARGOSS Page 14
Figure 11 The volumes of oil in different phases over time for Scenario 1A.6.
Figure 12 Spill history for Scenario 1A.6 showing the trajectory of the 24 hour oil spill. The grey area indicates the area most likely to be affected by oil sheening.
Key:
Centroid
Oil Particles
Spill History
Land
Sea
0 69km

OSIS Study for COP (Caspian Sea)_____________________________________________________________________________________________________
_______________________________________________________________________________________________________ L40030January 2010 © BMT ARGOSS Page 15
Figure 13 The volumes of oil in different phases over time for Scenario 1A.7.
Figure 14 Spill history for Scenario 1A.7 showing the trajectory of the 24 hour oil spill. The grey area indicates the area most likely to be affected by oil sheening.
Key:
Centroid
Oil Particles
Spill History
Land
Sea
0 110km

OSIS Study for COP (Caspian Sea)_____________________________________________________________________________________________________
_______________________________________________________________________________________________________ L40030January 2010 © BMT ARGOSS Page 16
Figure 15 The volumes of oil in different phases over time for Scenario 1A.8.
Figure 16 Spill history for Scenario 1A.8 showing the trajectory of the 24 hour oil spill. The grey area indicates the area most likely to be affected by oil sheening.
Key:
Centroid
Oil Particles
Spill History
Land
Sea
0 30km

OSIS Study for COP (Caspian Sea)_____________________________________________________________________________________________________
_______________________________________________________________________________________________________ L40030January 2010 © BMT ARGOSS Page 17
Figure 17 The volumes of oil in different phases over time for Scenario 1A.9.
Figure 18 Spill history for Scenario 1A.9 showing the trajectory of the 24 hour oil spill. The grey area indicates the area most likely to be affected by oil sheening.
Key:
Centroid
Oil Particles
Spill History
Land
Sea
0 64km
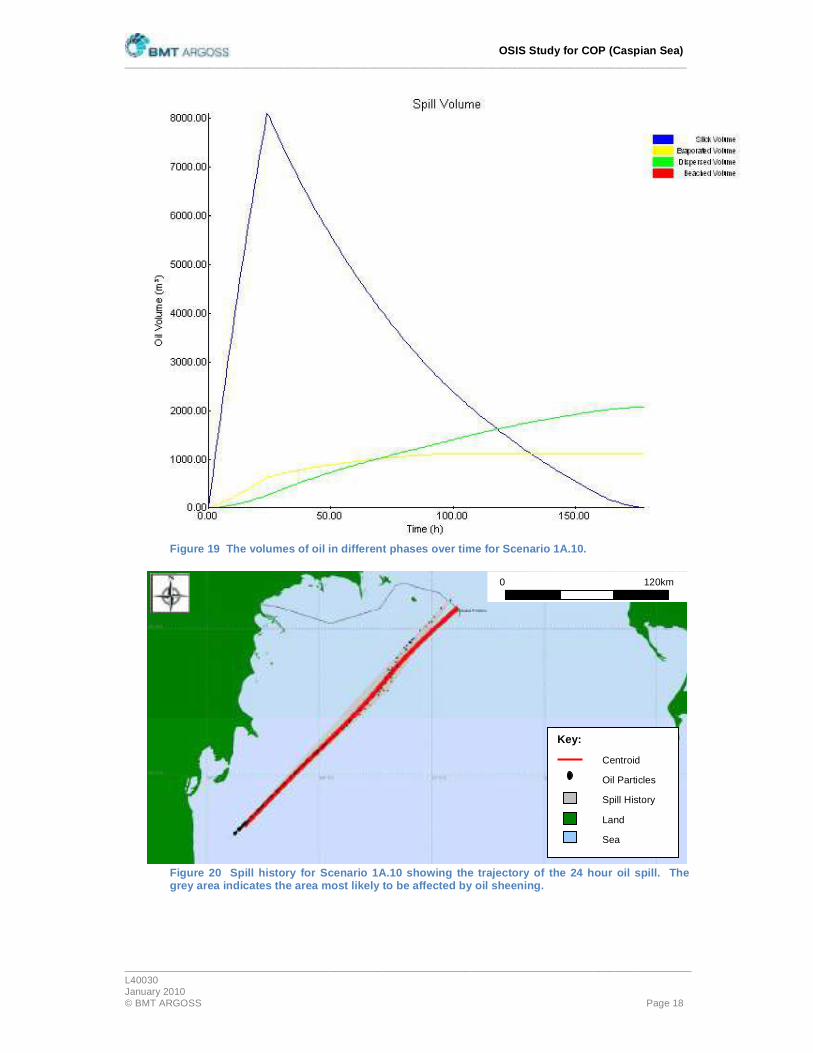
OSIS Study for COP (Caspian Sea)_____________________________________________________________________________________________________
_______________________________________________________________________________________________________ L40030January 2010 © BMT ARGOSS Page 18
Figure 19 The volumes of oil in different phases over time for Scenario 1A.10.
Figure 20 Spill history for Scenario 1A.10 showing the trajectory of the 24 hour oil spill. The grey area indicates the area most likely to be affected by oil sheening.
Key:
Centroid
Oil Particles
Spill History
Land
Sea
0 120km

OSIS Study for COP (Caspian Sea)_____________________________________________________________________________________________________
_______________________________________________________________________________________________________ L40030January 2010 © BMT ARGOSS Page 19
Figure 21 The volumes of oil in different phases over time for Scenario 1A.11.
Figure 22 Spill history for Scenario 1A.11 showing the trajectory of the 24 hour oil spill. The grey area indicates the area most likely to be affected by oil sheening.
Key:
Centroid
Oil Particles
Spill History
Land
Sea
0 30km

OSIS Study for COP (Caspian Sea)_____________________________________________________________________________________________________
_______________________________________________________________________________________________________ L40030January 2010 © BMT ARGOSS Page 20
Figure 23 The volumes of oil in different phases over time for Scenario 1A.12.
Figure 24 Spill history for Scenario 1A.12 showing the trajectory of the 24 hour oil spill. The grey area indicates the area most likely to be affected by oil sheening.
Key:
Centroid
Oil Particles
Spill History
Land
Sea
0 64km

OSIS Study for COP (Caspian Sea)_____________________________________________________________________________________________________
_______________________________________________________________________________________________________ L40030January 2010 © BMT ARGOSS Page 21
Figure 25 The volumes of oil in different phases over time for Scenario 1B.1.
Figure 26 Spill history for Scenario 1B.1 showing the trajectory of the 24 hour oil spill. The grey area indicates the area most likely to be affected by oil sheening.
Key:
Centroid
Oil Particles
Spill History
Land
Sea
0 23km

OSIS Study for COP (Caspian Sea)_____________________________________________________________________________________________________
_______________________________________________________________________________________________________ L40030January 2010 © BMT ARGOSS Page 22
Figure 27 The volumes of oil in different phases over time for Scenario 1B.2.
Figure 28 Spill history for Scenario 1B.2 showing the trajectory of the 24 hour oil spill. The grey area indicates the area most likely to be affected by oil sheening.
Key:
Centroid
Oil Particles
Spill History
Land
Sea
0 37km

OSIS Study for COP (Caspian Sea)_____________________________________________________________________________________________________
_______________________________________________________________________________________________________ L40030January 2010 © BMT ARGOSS Page 23
Figure 29 The volumes of oil in different phases over time for Scenario 1B.3.
Figure 30 Spill history for Scenario 1B.3 showing the trajectory of the 24 hour oil spill. The grey area indicates the area most likely to be affected by oil sheening.
Key:
Centroid
Oil Particles
Spill History
Land
Sea
0 23km

OSIS Study for COP (Caspian Sea)_____________________________________________________________________________________________________
_______________________________________________________________________________________________________ L40030January 2010 © BMT ARGOSS Page 24
Figure 31 The volumes of oil in different phases over time for Scenario 1B.4.
Figure 32 Spill history for Scenario 1B.4 showing the trajectory of the 24 hour oil spill. The grey area indicates the area most likely to be affected by oil sheening.
Key:
Centroid
Oil Particles
Spill History
Land
Sea
0 28km

OSIS Study for COP (Caspian Sea)_____________________________________________________________________________________________________
_______________________________________________________________________________________________________ L40030January 2010 © BMT ARGOSS Page 25
Figure 33 The volumes of oil in different phases over time for Scenario 1C.1.
Figure 34 Spill history for Scenario 1C.1 showing the trajectory of the 24 hour oil spill. The grey area indicates the area most likely to be affected by oil sheening.
Key:
Centroid
Oil Particles
Spill History
Land
Sea
0 7km

OSIS Study for COP (Caspian Sea)_____________________________________________________________________________________________________
_______________________________________________________________________________________________________ L40030January 2010 © BMT ARGOSS Page 26
Figure 35 The volumes of oil in different phases over time for Scenario 1C.2.
Figure 36 Spill history for Scenario 1C.2 showing the trajectory of the 24 hour oil spill. The grey area indicates the area most likely to be affected by oil sheening.
Key:
Centroid
Oil Particles
Spill History
Land
Sea
0 7km

OSIS Study for COP (Caspian Sea)_____________________________________________________________________________________________________
_______________________________________________________________________________________________________ L40030January 2010 © BMT ARGOSS Page 27
Figure 37 The volumes of oil in different phases over time for Scenario 1C.3.
Figure 38 Spill history for Scenario 1C.3 showing the trajectory of the 24 hour oil spill. The grey area indicates the area most likely to be affected by oil sheening.
Key:
Centroid
Oil Particles
Spill History
Land
Sea
0 7km

OSIS Study for COP (Caspian Sea)_____________________________________________________________________________________________________
_______________________________________________________________________________________________________ L40030January 2010 © BMT ARGOSS Page 28
Figure 39 The volumes of oil in different phases over time for Scenario 1C.4.
Figure 40 Spill history for Scenario 1C.4 showing the trajectory of the 24 hour oil spill. The grey area indicates the area most likely to be affected by oil sheening.
Key:
Centroid
Oil Particles
Spill History
Land
Sea
0 7km

OSIS Study for COP (Caspian Sea)_____________________________________________________________________________________________________
_______________________________________________________________________________________________________ L40030January 2010 © BMT ARGOSS Page 29
Annex A: OSIS Model Suitability and Verification
OSIS Version 4.2.2 is the latest release of the long-established oil spill modelling system jointly developed by BMT Cordah and AEA Technology. The system provides a total capability to predict the movement, spreading, weathering and coastal impact of oil spilt in the marine environment. Most importantly, the model has been extensively validated during scientific sea trials (through a licence exclusively held in the UK by AEA Technology) and real incidents (e.g. Braer, Sea Empress). 18 sea trials have been conducted, up to 3 days in duration and using 10 different oil types.
The system has been the primary oil spill modelling system in the UK for many years and is used by the UK Government's Maritime and Coastguard Agency, other governments including all 9 Arabian Gulf states, major spill response companies such as Oil Spill Response Ltd. and Briggs Marine Environmental Services, and most of the UK-based oil companies. It is also used internationally in areas such as SE Asia, Mediterranean, Pacific Asia and the Caspian by many of the world’s largest oil companies.
Annex B: Additional scenarios
Two additional runs were undertaken for the COP blowout scenario (Scenario 1A) and are listed in Table 1 below:
Wind Spill Characteristics Runno
Location (La t/ Long
WGS84 datum)
Start Date / Time
OilType
SeaTemp (oC)
Air Temp (oC)
Speed (m/s)
Direction (o)
Release Rate
(m3/hr)
Release Duration
(hrs)13 Easting:
519,004m Northing: 4,443,785m
1/02/2010 00:00
Chirag 6 6 5 105 132.5 24 (42 days)
14 Easting: 519,004m Northing: 4,443,785m
1/02/2010 00:00
Chirag 6 6 5 115 132.5 24 (42 days)
15 Easting: 519,004m Northing: 4,443,785m
1/02/2010 00:00
DWG 6 6 5 105 132.5 24 (42 days)
16 Easting: 519,004m Northing: 4,443,785m
1/02/2010 00:00
DWG 6 6 5 115 132.5 24 (42 days)
Table 1 Run descriptions for Scenario 1A COP blowout

OSIS Study for COP (Caspian Sea)_____________________________________________________________________________________________________
_______________________________________________________________________________________________________ L40030January 2010 © BMT ARGOSS Page 30
Figure 1 Spill history for Scenario 1A.13 showing the trajectory of the 24 hour oil spill
Figure 2 Spill history for Scenario 1A.14 showing the trajectory of the 24 hour oil spill
Centroid
Oil Particles
Land
Sea0 54km
0 31k
Centroid
Oil Particles
Land
Sea

OSIS Study for COP (Caspian Sea)_____________________________________________________________________________________________________
_______________________________________________________________________________________________________ L40030January 2010 © BMT ARGOSS Page 31
Figure 3 Spill history for Scenario 1A.15 showing the trajectory of the 24 hour oil spill
Figure 4 Spill history for Scenario 1A.16 showing the trajectory of the 24 hour oil spill.
Centroid
Oil Particles
Land
Sea0 51km
Centroid
Oil Particles
Land
Sea0 29km