ANNUAL REPORT 2020 - Aker BP
142
ANNUAL REPORT 2020
-
Upload
khangminh22 -
Category
Documents
-
view
0 -
download
0
Transcript of ANNUAL REPORT 2020 - Aker BP

ANNUALREPORT 2020
v
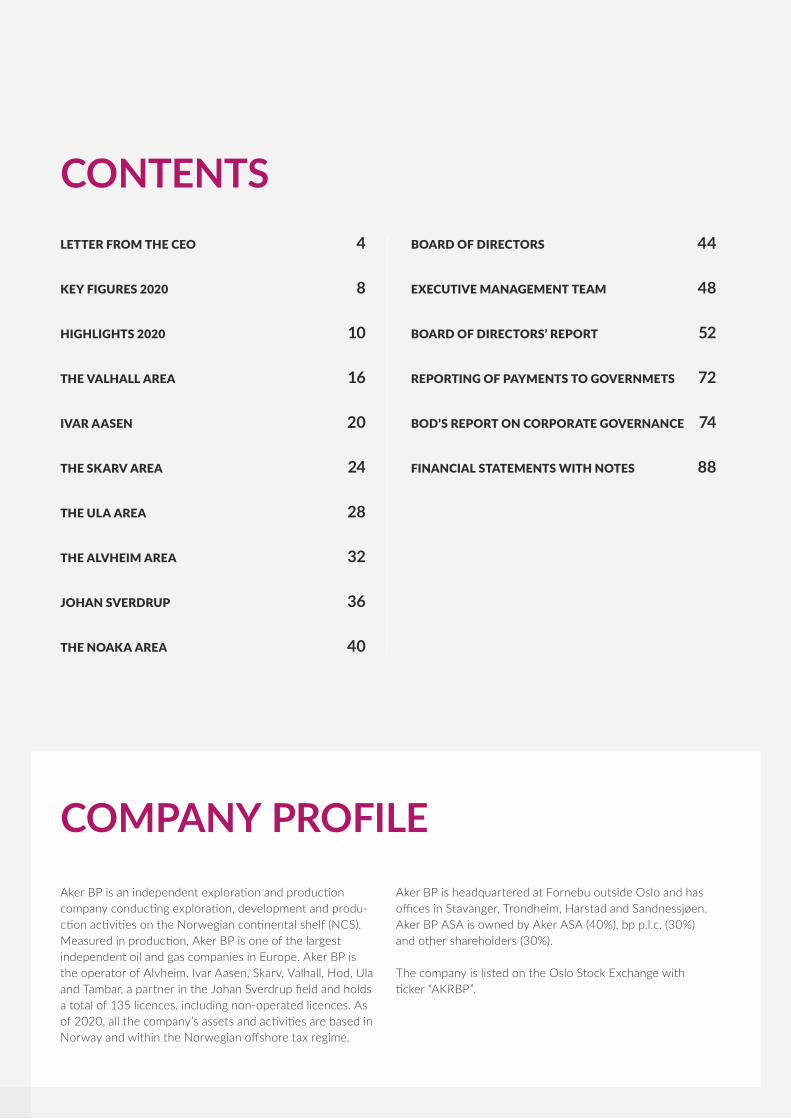
LETTER FROM THE CEO 4
KEY FIGURES 2020 8
HIGHLIGHTS 2020 10
THE VALHALL AREA 16
IVAR AASEN 20
THE SKARV AREA 24
THE ULA AREA 28
THE ALVHEIM AREA 32
JOHAN SVERDRUP 36
THE NOAKA AREA 40
BOARD OF DIRECTORS 44
EXECUTIVE MANAGEMENT TEAM 48
BOARD OF DIRECTORS’ REPORT 52
REPORTING OF PAYMENTS TO GOVERNMETS 72
BOD’S REPORT ON CORPORATE GOVERNANCE 74
FINANCIAL STATEMENTS WITH NOTES 88
CONTENTS
COMPANY PROFILEAker BP is an independent exploration and production company conducting exploration, development and produ-ction activities on the Norwegian continental shelf (NCS). Measured in production, Aker BP is one of the largest independent oil and gas companies in Europe. Aker BP is the operator of Alvheim, Ivar Aasen, Skarv, Valhall, Hod, Ula and Tambar, a partner in the Johan Sverdrup field and holds a total of 135 licences, including non-operated licences. As of 2020, all the company’s assets and activities are based in Norway and within the Norwegian offshore tax regime.
Aker BP is headquartered at Fornebu outside Oslo and has offices in Stavanger, Trondheim, Harstad and Sandnessjøen. Aker BP ASA is owned by Aker ASA (40%), bp p.l.c. (30%) and other shareholders (30%).
The company is listed on the Oslo Stock Exchange with ticker “AKRBP”.

v
ESG IN AKER BPAker BP’s Sustainability report 2020 describes the company’s management approach and performance to environment, social and governance.
The report can be found here
·
Skarv
Alvheim
Ivar Aasen
Johan Sverdrup(operated by Equinor)
Ula/Tambar
Valhall/Hod
Harstad
Trondheim
Sandnessjøen
Fornebu
Stavanger
SUSTAINABILITY REPORT 2020ESG in Aker BP
OUR ASSETSAND OFFICES

4 · Aker BP Annual Report 2020 · Letter from the CEO
LETTER FROM THE CEO
UNIQUELY POSITIONED FOR VALUE CREATION2020 proved a more challenging year than any of us could have imagined. The COVID-19 pandemic shut down the world and oil prices plummeted. We all had to deal with unprecedented uncertainty and fast-paced change. I am immensely proud to say that the Aker BP team rose to the challenges. We enter 2021 stron-ger than we were a year ago, with a robust balance sheet and a solid investment portfolio, poised for further value creation.
Strong performance in a challenging yearOperating our assets safely, efficiently, and with low costs is the cornerstone of Aker BP’s value creation. Despite challen-ges, we delivered strong operational performance in 2020.
Protecting our people and operations was our immediate priority in response to the COVID-19 outbreak. We moved swiftly to establish a comprehensive regime of personnel transport, quarantine hotels, and testing stations. Our mea-sures proved effective: By year-end, our operations had not experienced any COVID-19 disruptions.
Protecting our financial strength was another initial key priority in our pandemic response. We adapted to macro uncertainties and put all new investment decisions on hold, postponed exploration wells, and reduced quarterly dividend payments by two thirds.
We delivered on our production guidance for 2020 and our costs came in below projections for the year. Production costs amounted to USD 8.3 per barrel, a significant redu-ction compared with the corresponding 2019 figure. Factors that contributed to this cost reduction include top-quartile production efficiency of 92 percent, and new low-cost production from the Johan Sverdrup field. Our ambition is a production cost below USD 7 per barrel.
Our CO2 emissions intensity for 2020 was 4.5 kg per barrel of oil equivalent (boe), which is approximately one-third of the world average for our industry. Nevertheless, our ambition is not only to remain below 5 kg/boe, but to further reduce emission intensity.

5 · Aker BP Annual Report 2020 · Letter from the CEO
Pure-play oil and gas company with industry-leading low emissionsThe energy transition the world is facing will require the most carbon and cost efficient barrels of oil that can be produced. Low-cost, low-carbon-emission production is an integral part of Aker BP’s business strategy.
Aker BP is and will continue as a pure-play oil and gas company. For the world to maintain an affordable, secure, and sustainable energy system throughout the energy trans-ition, oil and gas must remain an essential part of the global energy mix in coming years. The climate challenge can only be resolved if oil and gas companies mobilise the full range of their technological and commercial capabilities. Thus, Aker BP’s dedication as a pure-play oil and gas company remains firm.
We will maximise the value creation from our assets and activities. In so doing, we will not only grow the profits we can distribute to our shareholders, but also make impor-tant contributions through the taxes we pay. Such profits and taxes can then be redeployed, wherever economic and environmental returns are most beneficial.
We are committed to minimising emissions from our ope-rations. Reducing emissions is important, and not only from an environmental perspective. As the cost of emitting carbon dioxide rises, CO2 emissions have a direct financial impact.
We will share our data, know-how and technology with other industries. Aker BP’s role in the energy transition is not limited to how we produce energy. It is also about developing innovative industries and generating new busi-ness opportunities.
Efficient low-cost operations enabled by digitalisationDigitalisation remains one of the pillars of Aker BP’s impro-vement program, and we have made significant progress in this area over the last several years.
Through the Cognite Data Fusion we are aggregating all our operational data in one single platform, available 24/7 with exceptionally low latency. We utilise the data gathered to improve our business and decision-making processes. We have established our own digital organisation, EurekaX, tasked with managing all our digital projects and driving the necessary digital transformation at Aker BP.
I am convinced that digitalisation can deliver radical impro-vements in project execution time, cost, and quality. Such improvements will result in greater returns on Aker BP’s investments. Our long-standing collaboration with Aker Solutions has led to the establishment of Aize, an indus-trial software company in which Aker BP has a 10 percent ownership interest. Aize helps customers make fundamen-tal, data-driven changes to the planning and execution of complex, capital-intensive projects and operations.
Our next big digitalisation initiative is within subsurface, where we already have enormous amounts of data. Once we liberate these data and make them available on one platform, I believe we will experience a revolution in data-driven auto-mation, innovation, and insight, which will in turn facilitate further value creation.
30
25
20
15
10
0
LOWER EMISSION INTENSITY
NorthAmerica
2018
Africa2018
Globalavg.
2018
Norway2019
Aker BP2019
Aker BP2020
Aker BPambition
next decade
5
30
25
20
15
10
0
5
CO₂ kg/boe
14
12
10
8
6
0
LOWER COST
Aker BPambition
next decade
2020 2019 2018
4
2
14
12
10
8
6
0
4
2
Production cost USD/boe
Source: NOROG/IOGP

6 · Aker BP Annual Report 2020 · Letter from the CEO
Project execution through world-class alliancesAker BP has formed strategic partnerships with key suppli-ers. Collaborating under our One Team approach in the Aker BP alliance model, we have established eight alliances, and have made great advances. Our subsea tieback projects are executed significantly faster than before, our drilling opera-tions have become more efficient, and we are constructing platforms faster and cheaper than ever.
On 12 November 2020, Aker BP and our partners Equinor, Wintershall DEA, and PGNiG announced production start-up at Ærfugl Phase 1 in the Norwegian Sea. This alliance project was delivered on time and budget. Ærfugl, which is a tie-in to the Skarv FPSO, has become one of the most profitable development projects on the Norwegian continental shelf with a break-even price below USD 15 per barrel.
From concept selection in 2017 to production start the Ærfugl development has recorded a 20 percent CAPEX reduction and an improvement in the per-barrel break-even price of more than 50 percent. Moreover, execution time has been cut by 40 percent compared with a more traditional project execution model. The Subsea Alliance, Semi Alliance, and Modification Alliance have all played a vital role in these achievements.
To me the Ærfugl development project is a manifest of our strategy aiming to maximise value and reduce carbon
footprint. Ærfugl has contributed to an increase in produ-ction from the Skarv FPSO and up to 30 percent cut in CO2 emissions per barrel of oil equivalent. We have demonstrated top-class teamwork. Together with our alliance partners, Aker BP has introduced new technology, such as a full digital twin of the topsides, wells and subsea, and a high level of automation that will fast-track Skarv into the future.
Strong production growth from investing in high-return barrelsIn June 2020, the Norwegian parliament introduced tem-porary changes to Norway’s petroleum tax regime. These changes were made in response to a sharp decline in invest-ment activity. The purpose of the time-limited changes is to stimulate companies to resume investing, thus protecting jobs, and preserving expertise and industry capacity and capabilities. The tax regime is also intended to support value creation and generate additional long-term tax revenues for Norway.
The temporary tax regime applies to all CAPEX in 2020 and 2021, and all CAPEX up until production start for new projects where a field development plan is submitted to the relevant authorities by year-end 2022. Aker BP has prepared a list of 11 prioritised projects that we intend to fit within the temporary tax system. Collectively, these projects represent more than 500 million barrels of net oil and gas resources with an average break-even price of USD 27 per barrel.
2P OIL AND GAS RESERVESin production and under development
8%
12%
36%
34%
10%
842mmboe
83% liquids
Ska
rv
A
lvheim
Other Valhall
Johan Sverdrup
2C CONTINGENT RESOURCESoil and gas discoveries
23%
37%
22%
8%
10%
895mmboe
72% liquids
O
ther
NOAKA
Skarv Alvheim Valhall

7 · Aker BP Annual Report 2020 · Letter from the CEO
Under the temporary tax regime, the capital required to fund these projects is reduced by more than half.
Aker BP cut the first steel for the Hod project just hours after the tax changes were introduced by parliament. Five Aker BP alliances will collaborate in redeveloping the Hod field, which is a near replica of the Valhall Flank West project, with the same team performing the same job, based on identical blueprints. The development is possible through efficiency gains and cost reductions using our alliance model.
In June 2020, Aker BP, Equinor, and LOTOS announced a coordinated development of the licences Krafla, Fulla, and North of Alvheim (NOAKA). The goal is to have a develop-ment plan ready for submission in 2022, before the deadline set forth in the temporary tax regime. NOAKA is one of the largest remaining field developments on the Norwegian continental shelf. Total field resources are estimated at more than 500 million barrels of oil equivalent. NOAKA will be developed with a processing hub operated by Aker BP, an unmanned processing platform operated by Equinor, three unmanned wellhead platforms, and four subsea tiebacks.
With NOAKA and other developments, plus contributions from smaller projects and infill wells, we target a daily produ-ction goal in excess of 350,000 barrels in 2028. That figure corresponds to organic growth of more than 70 percent compared with 2020, creating substantial value for Aker BP and its shareholders.
Robust free cash flow and attractive returnsWith USD 4.5 billion in available liquidity, no debt maturities before 2024, and an investment-grade credit rating, Aker BP enjoys a strong financial position. Furthermore, we expect to generate significant positive cash flow in the period leading
up to 2028. These factors give us strong financial capabi-lities, allowing for a lower debt level and sustainable, rising dividends to our shareholders.
Our net profit for the full year 2020 amounted to USD 45 million, compared with USD 141 million in 2019. The main reason for the decrease in net profit was a 36 percent drop in realised oil and gas prices from 2019 to 2020. Dividends paid in 2020 totaled USD 425 million, a 50 percent reduction compared to our original plan for dividend distribution.
Our guidance for 2021 is a net production of 210-220 thousand barrels of oil equivalent per day (mboepd), and production costs of between USD 8.5-USD 9.0 per boe, the latter figure representing a reduction in the underlying cost level in Norwegian kroner. We expect increased investments in profitable growth in 2021, with capital spend of USD 2.2-2.3 billion. For 2021, dividend payments of USD 450 million are proposed.
Prepared for volatile future“Now is the time to show what we are made of.” This was my message to the Aker BP team in a March digital town hall, after the COVID-19 pandemic became a fact. Looking back at 2020, the Aker BP team delivered strong performance despite extreme conditions in a year of great uncertainty, rapid change, and continuous challenges.
Oil and gas companies that will thrive in the future must be increasingly adaptive, efficient, and sustainable. In 2020, Aker BP demonstrated that we have what it takes to meet an increasingly volatile future. I am extremely proud to lead this fantastic team, and I would like to express my sincere thanks to every one of you. You truly proved what you are made of!
Karl Johnny Hersvik CEO, Aker BP ASA

8 · Aker BP Annual Report 2020 · Key figures 2020
KEY FIGURES 2020PRODUCTION PER HUBmmboe mmboe
Share price (index)
20
120
100
80
60
40
20
120
100
80
60
40
Share price (index)
Jan 2019 Jan 2020Oct 2019Jul 2019Apr 2019
SHARE PRICE AKERBP STOXX 600 OIL & GAS INDEX OSLO ENERGY INDEX BRENT OIL PRICE
250
150
50
200
0
100
1000
800
600
400
200
0
P50 RESERVES DEVELOPMENT
2014 20162015 2018 2019 20202017
mmboe mmboe
1000
800
600
400
200
0
250
150
50
200
0
100
2014 20172015 2016 2018 2019 2020
JOHAN SVERDRUP OTHERULAIVAR AASEN SKARVVALHALLALVHEIM
P50 RESERVES 2020
8%
12%
36%
34%
10%
842mmboe
83% liquids
Ska
rv
A
lvheim
Other Valhall
Johan Sverdrup

9 · Aker BP Annual Report 2020 · Key figures 2020
SUMMARY OF FINANCIAL RESULTS
Key figures Units 2020 2019 2018*
Total income USDm 2 979 3 347 3 752
EBITDA USDm 2 128 2 286 2 745
Net profit/loss USDm 45 141 476
Earnings per share (EPS) USD 0,12 0,39 1,32
Capex USDm 1 306 1 667 1 202
Exploration spend USDm 246 501 359
Abandonment spend USDm 178 109 243
Production cost USD/boe 8,3 12,4 12,1
Taxes paid USDm -181 619 606
Net interest-bearing debt** USDm 3 647 3 493 1 973
Leverage ratio 1,5 1,2 0,6
SUMMARY OF PRODUCTION
Key figures Units 2020 2019 2018*
Alvheim area boepd 55 351 54 438 59 513
Ivar Aasen boepd 20 123 21 810 23 523
Johan Sverdrup boepd 51 916 7 945 -
Skarv boepd 21 018 22 260 25 344
Ula area boepd 10 976 8 530 9 433
Valhall area boepd 50 748 39 005 35 979
Other boepd 526 1 865 1 866
SUM boepd 210 658 155 852 155 658
Liquids price USD/boe 40,0 64,8 70,8
Gas price USD/scm 0,14 0,18 0,29
* Total income, EBITDA, EPS, net profit and realized prices figures for 2018 are restated, see note 1 in the 2019 Financial Statements.** The definition of net interest-bearing debt includes Lease debt, which is recognized from Q1 2019 following the implementation of IFRS 16
Leases. The comparative figures for previous periods have not been restated. See also the description of “Alternative performance measures” atthe end of the Financial Statements for definitions.
PRODUCTION PER HUBmmboe mmboe
Share price (index)
20
120
100
80
60
40
20
120
100
80
60
40
Share price (index)
Jan 2019 Jan 2020Oct 2019Jul 2019Apr 2019
SHARE PRICE AKERBP STOXX 600 OIL & GAS INDEX OSLO ENERGY INDEX BRENT OIL PRICE
250
150
50
200
0
100
1000
800
600
400
200
0
P50 RESERVES DEVELOPMENT
2014 20162015 2018 2019 20202017
mmboe mmboe
1000
800
600
400
200
0
250
150
50
200
0
100
2014 20172015 2016 2018 2019 2020
JOHAN SVERDRUP OTHERULAIVAR AASEN SKARVVALHALLALVHEIM
P50 RESERVES 2020
8%
12%
36%
34%
10%
842mmboe
83% liquids
Ska
rv
A
lvheim
Other Valhall
Johan Sverdrup

10 · Aker BP Annual Report 2020 · Highlights 2020 – Q1
HIGHLIGHTS 2020
50
100
0
150
200
250
300
20
40
60
80
100
Aker BP stock priceNOK
Brent blendUSD
8 JANUARYThe company strengthens its liquidity by issuing USD 1.5 billion in new long-dated bonds at attractive terms.
11 FEBRUARYAker BP increases its ownership and becomes development operator for the Shrek discovery near Skarv.
11 FEBRUARYCapital markets update and Q4 2019 presentation.
16 MARCHProduction start-up from the Skogul field.
7 JANUARYOfficial opening of Johan Sverdrup by Prime Minister Erna Solberg. The field started production on 5 October 2019 and produces an average of 300,000 barrels per day.
14 JANUARYAker BP is offered ownership interests in 15 licences in the Awards in Predefined Areas (APA) 2019.
January March
24 FEBRUARYDividend payment of USD 0.5901(NOK 5.45251) per share.

11 · Aker BP Annual Report 2020 · Highlights 2020 – Q2
50
100
0
150
200
250
300
20
40
60
80
100
Aker BP stock priceNOK
Brent blendUSD
8 JANUARYThe company strengthens its liquidity by issuing USD 1.5 billion in new long-dated bonds at attractive terms.
11 FEBRUARYAker BP increases its ownership and becomes development operator for the Shrek discovery near Skarv.
11 FEBRUARYCapital markets update and Q4 2019 presentation.
16 MARCHProduction start-up from the Skogul field.
7 JANUARYOfficial opening of Johan Sverdrup by Prime Minister Erna Solberg. The field started production on 5 October 2019 and produces an average of 300,000 barrels per day.
14 JANUARYAker BP is offered ownership interests in 15 licences in the Awards in Predefined Areas (APA) 2019.
January March
24 FEBRUARYDividend payment of USD 0.5901(NOK 5.45251) per share.
50
100
0
150
200
250
300
20
40
60
80
100
Aker BP stock priceNOK
Brent blendUSD
22 APRILAccelerated production start-up from Ærfugl Phase 2 – three years ahead of the original plan.
24 JUNEAker BP submits Plan for Development and Operation for Hod.
11 JUNEAker BP and Equinor agree on
the way forward for development of the Krafla, Fulla and North of Alvheim (NOAKA) licences. The development will
have a significant impact on the Norwegian supplier industry.
21 APRILAlvheim reaches a production of 500 million barrels of oil. Production started on 8 June 2008.
6 MAYAker BP presents its first quarter results. The company reports a new production record despite the COVID-19 pandemic.
19 JUNEDrilling program completed on Valhall Flank West with world-class results. In 11 months, the drilling rig set 12 conductors, drilled nine wells including 22,000 metres of reservoir.
8 JUNEDue to the COVID-19 downturn, the
Norwegian government announces temporary changes to the Norwegian
petroleum tax system to increase investment activity in the industry.
April June
22 MAYDividend payment of USD 0.1967(NOK 2.02683) per share.

12 · Aker BP Annual Report 2020 · Highlights 2020 – Q3
50
100
0
150
200
250
300
20
40
60
80
100
Aker BP stock priceNOK
Brent blendUSD
14 JULYAker BP presents results from the second quarter and announces a new production record for the company.
23 SEPTEMBERThe company issues USD 1,250 million in
new long-dated bonds. This further strengthens Aker BP’s liquidity, extends its maturity profile, and reduces the average
interest rate on the company’s debt.
28 JULYJohan Sverdrup reaches 100 million barrels of produced oil.
July September
10 AUGUSTDividend payment of USD 0.1967(NOK 1.85169) per share.

13 · Aker BP Annual Report 2020 · Highlights 2020 – Q4
50
100
0
150
200
250
300
20
40
60
80
100
Aker BP stock priceNOK
Brent blendUSD
14 JULYAker BP presents results from the second quarter and announces a new production record for the company.
23 SEPTEMBERThe company issues USD 1,250 million in
new long-dated bonds. This further strengthens Aker BP’s liquidity, extends its maturity profile, and reduces the average
interest rate on the company’s debt.
28 JULYJohan Sverdrup reaches 100 million barrels of produced oil.
July September
10 AUGUSTDividend payment of USD 0.1967(NOK 1.85169) per share.
50
100
0
150
200
250
300
20
40
60
80
100
Aker BP stock priceNOK
Brent blendUSD
29 OCTOBERAker BP presents results from the third quarter and announces plan for maturing over 500 mmboe of
resources to a final investment decision by end 2022.
17 DECEMBERAker BP and partners make
investment decision for Gråsel.
18 NOVEMBEROperator Equinor announces an estimated increase in production on Johan Sverdrup, where Aker BP holds 11.5733 percent of the licence, from 470,000 to 500,000 barrels per day.
8 OCTOBERDisposal of Valhall QP, the old living quarters platform, at Kvaerner Stord. At least 95 percent of the steel is recycled.
27 OCTOBERAker Offshore Wind and Aker BP sign a collaboration agreement to drive down CO₂ emissions on the Norwegian continental shelf. The agreement aims to accelerate the process of decarbonising oil and gas assets and realising large-scale offshore wind in Norway.
13 NOVEMBERÆrfugl Phase 1 starts production on time and budget.
8 DECEMBERPlan for Development and Operation for Hod is approved.
October December
12 NOVEMBERDividend payment of USD 0.1967 (NOK 1.85169) per share.

14 · Aker BP Annual Report 2020 · Highlights 2020
J A N U A R Y
F E B R U A R Y
M A R C H
A P R I L
M A Y
J U N E
March – Kristin Alne, leader for digitalisation and technology in the business area operations and field development, is voted among Norway’s foremost tech women by the Abelia and Oda networks.
April – Aker BP starts to book a hotel as a quarantine venue. After sufficient time at the hotel without symptoms, people were allowed to travel offshore. Departure interviews were conducted by nurses for every single person travelling offshore. More than 200 people were “held back” because they disclosed respiratory symptoms or exposure.
January – Prime Minister Erna Solberg opened the Johan Sverdrup field. Digital solutions and electrification are some of the tools that make this a future-oriented oil field with high value creation and record-low emissions. Equinor is the operator of the field. Aker BP is a proud partner with Lundin Norway, Petoro and Total.
May – As the first operator on the Norwegian continental shelf, Aker BP established departure testing as part of the offshore travel procedure. More than 12,000 tests were conducted in 2020. Six people tested positive and were prevented from travelling offshore.
March – Norway was in lock-down for six weeks starting March 12. Most onshore employees in Aker BP have worked from home since then.
March – Aker BP starts to stream digital townhalls to employees weekly. The executive managmenet team shares information and answers questions from the employees.
SOCIAL MEDIA HIGHLIGHTS
2 0 2 0

15 · Aker BP Annual Report 2020 · Highlights 2020
J U L Y
A U G U S T
S E P T E M B E R
O C T O B E R
N O V E M B E R
D E C E M B E R
October – All career fairs went digital in 2020. Aker BP posted a film to present the company and ran an online advertising campaign to recruit graduates. This resulted in 1,375 applications for 10 available graduate positions.
December – Aker BP advertised apprenticeship positions in December, a unique opportunity for vocational students curious about the oil and gas industry and who would like to pursue a career offshore. The company received 786 applications for 10 positions.
September – Aker BP welcomed eight new apprentices who will work in a offshore rotation for the next 18-32 months as part of their education. After completion they will be able to do a trade examination and qualify for a trade certificate.
November – When the plan for development and operation was submitted in 2017, the goal for the start-up of production of Ærfugl phase 1 wells was 12 November 2020. The project was delivered on time and budget, and without incidents. The project is one of the most profitable on the Norwegian shelf. Total investment costs for the Ærfugl project are around NOK 8 billion and the project has created jobs throughout Norway.
June – The commercial agreement on the field development of NOAKA was signed. The project will provide 50,000 full-time equivalents and investments in excess of NOK 50 billion.
July – Up to 150 different suppliers are involved in the Hod project that Aker BP and partner Pandion are developing. Many of the major contracts are Norwegian. Of the cost share for construction and infrastructure, 70 per cent is resident in Norway. On 1 July, one of the suppliers, CRE8 Systems, celebrated that employees could return to work due to the Hod-project.
F O L L O W U S
Facebook Instagram LinkedIn YouTube

Net 2P Reserves: 302 mmboeVALHALL AREATHE
Producing field
Field development
Discovery
HodValhall
Valhall SSPR NORPIPE Y
20
40
60
80
100
120
140
2000 202019851982 19951990 201520102005
Hod – PL 033Aker BP: 90%Partner: Pandion2P reserves: 39 mmboe (net)
Valhall – Vallhall UnitAker BP: 90%Partner: Pandion2P reserves: 263 mmboe (net)
Embla FlankNorth
FlankWest
FlankSouth
Eldfisk
Ekofisk
Edda
Vest ekofisk
Production history (mboepd gross)

17 · Aker BP Annual Report 2020 · The Valhall Area
Production efficiency 2020:Production 2020:Production start:
86%50.7Valhall: 1982Hod: 1990Valhall Flank West: 2019
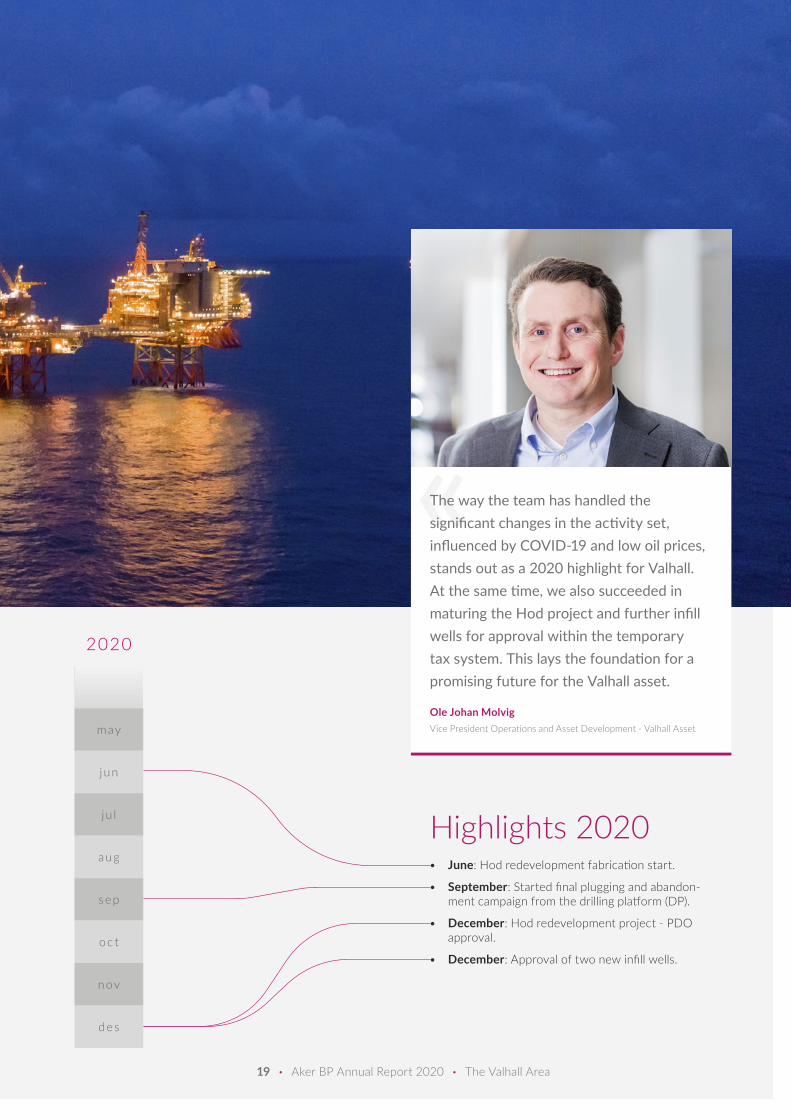
FULL SPEED AHEADThe Valhall modernisation path was further accelerated in 2020 with the decision to redevelop Hod, to launch the New Central Platform project, and the approval of further infill drilling.
This was achieved while delivering strong underlying operati-ons, exemplified by reaching 700+ days without self-induced shutdown.
Game-changer2020 started with a high activity level, with two simultane-ous drilling operations and ramping up new wells on Valhall Flank West. However, the activity was significantly reduced
early in the year due to COVID-19 and the aim of minimising activities, most significantly the drilling hiatus at the Valhall field center.
Aker BP and the alliance partners’ handling of the COVID-19 threat to our operations, combined with the temporary petroleum tax system, was a complete game-changer and has further accelerated the Valhall modernisation path in 2020.
mboepd (net)

18 · Aker BP Annual Report 2020 · The Valhall Area
may
jun
ju l
aug
sep
oc t
nov
des
2020
HodThe first major factor was the Hod redevelopment project. The Ministry of Petroleum and Energy approved the Plan for Development and Operation (PDO) for Hod in December.
The Hod field will be developed with a normally unmanned installation remotely operated from the Valhall field centre, with very low CO2 emissions due to power from shore. Hod is among the first projects to be realised under the recently introduced temporary changes to the Norwegian petroleum tax system.
Production start is scheduled for the first quarter of 2022. Recoverable reserves for Hod are estimated at around 40 million barrels of oil equivalent.
New central platformThe second major factor was the start-up of a new ear-ly-phase field development project, New Central Platform, to replace the current Wellhead Platform installation. This project is well under way and the goal is to submit a PDO by year-end 2022.
Infill wellsThe third major factor was approving two new infill wells to be drilled in 2021 with the drilling rig Maersk Invincible.
The latest plugging and abandonment campaign with Maersk invincible is ahead of schedule at Drilling Platform (DP), laying the foundation for removing the old Valhall complex platforms Quarters Platform jacket, Production Platform and DP in 2021 and 2022.
19 · Aker BP Annual Report 2020 · The Valhall Area
Highlights 2020• June: Hod redevelopment fabrication start.
• September: Started final plugging and abandon-ment campaign from the drilling platform (DP).
• December: Hod redevelopment project - PDO approval.
• December: Approval of two new infill wells.
may
jun
ju l
aug
sep
oc t
nov
des
2020
Ole Johan MolvigVice President Operations and Asset Development - Valhall Asset
The way the team has handled the significant changes in the activity set, influenced by COVID-19 and low oil prices, stands out as a 2020 highlight for Valhall. At the same time, we also succeeded in maturing the Hod project and further infill wells for approval within the temporary tax system. This lays the foundation for a promising future for the Valhall asset.

Net 2P Reserves: 41 mmboeIVAR AASEN AREA
Producing field
Field development
Discovery
IVAR AASEN –Ivar Aasen unitAker BP: 34.8%Partners: Equinor, Spirit, Wintershall, Neptune, Lundin, OKEA2P reserves: 35 mmboe (net)
HANZ – PL 028BAker BP: 35%Partners: Equinor, Spirit2P reserves: 6 mmboe (net)
JK
Edvard Grieg
Johan Sverdrup
Production history (mboepd gross)
20
40
60
80
100
2018 2019 202020172016
THE

21 · Aker BP Annual Report 2020 · Ivar Aasen
Production efficiency 2020:Production 2020:Production start:
90%
Ivar Aasen delivered strong health, safety and environment performance and high production efficiency in 2020. Two new production wells were drilled late 2020 and a new drilling campaign was approved for 2021.
Ivar Aasen continues to deliver world-class performance at 90 percent production efficiency, including a two-week planned maintenance shutdown. This is expected to improve even more starting in 2022, when the platform will receive power from shore via the Johan Sverdrup field.
All non-critical activities were postponed to minimise the risk of COVID-19 offshore. The first planned maintenance shutdown since the field came on stream was scheduled for June. Due to COVID-19, the decision was made to post-pone these maintenance activities to 2021 in cooperation
with Edvard Grieg. Ivar Aasen and Edvard Grieg decided to re-mobilise and perform the maintenance activities in August/September. Ivar Aasen approved two new produ-ction wells before the summer and the drilling campaign also started in August. The simultaneous activities of drilling wells and executing our first planned maintenance shutdown, in combination with COVID-19, were challenging. However, the team coordinated the activities in an excellent way and the maintenance activities were executed with no incidents and completed one day ahead of schedule.
BUSY YEAR – STRONG PERFORMANCE
2016 20.1 mboepd (net)

22 · Aker BP Annual Report 2020 · Ivar Aasen
Two new production wellsTwo new production wells were drilled at Ivar Aasen in 2020 and were put on production in first quarter 2021. These wells provide additional drainage points in the reservoir and were drilled with good performance. After this, a total of eleven wells are producing oil on Ivar Aasen, supported by eight water injection wells.
Improvement and digitalisationIvar Aasen is Aker BP’s digital pilot, where the company implements new technology to create the digital oil field of the future. This technology reduces costs over a facility’s lifecycle through performance analytics and optimisation in the virtual environment. It also enables campaign-based maintenance supported by predictive algorithms. All opera-tors are equipped with personal digital devices, which ena-bles easy communication and paperless access to technical documentation, as well as live equipment data. The handheld devices make the work more efficient, more productive, and safer.
The Ivar Aasen team continues to strive for improved effici-ency and reduced emissions. The Hanz project is considering re-use of subsea equipment from Jette and water injection support from a water reservoir formation. This will reduce power and chemical consumption from the platform and shrink the environmental footprint.
Future opportunitiesAker BP has worked persistently throughout 2020 to mature the Hanz project and new improved oil recovery targets for future campaigns. A decision was made to drill two new wells in the second half of 2021 and an investment decision for the Hanz-project is planned for late 2021.
Aker BP acquired a 10 percent ownership interest in the nearby Lille Prinsen discovery in PL 167, which is operated by Equinor. This could be a potential subsea tie-back to Ivar Aasen.
Aker BP will continue its exploration activities in the area in the coming years, targeting new possible tiebacks to Ivar Aasen.

23 · Aker BP Annual Report 2020 · Ivar Aasen
Gudmund EvjuVice President Operations and Asset Development – Ivar Aasen
Highlights 2020
may
jun
ju l
aug
sep
oc t
nov
des
2020
• August: Rig intake for two new production wells.
• September: Successfully executed 2020 maintenance shutdown.
• December: Approved IOR 2021 drilling campaign.
• December: Acquired 10 percent ownership in nearby Lille Prinsen discovery in PL 167, which is operated by Equinor.
• December: Maersk Integrator demobilized from Ivar Aasen.
Production from Ivar Aasen fell during the summer from the plateau after more than three years of production. To utilise the maximum capacity, we decided to drill two new production wells in 2020. Both wells were drilled with good performance and production started in first quarter 2021. This goal was reached thanks to One team collaboration and avoiding COVID-19 offshore.

Net 2P Reserves: 97 mmboeSKARV AREATHE
Producing field
Field development
Discovery
ÆRFUGL Aker BP: 23.8%Partners: Equinor, DEA, PGNiG2P reserves: 56 mmboe (net)
ÆRFUGL NORDAker BP: 30%Partners: Equinor, DEA, PGNiG2P reserves: 8 mmboe (net)
Production history (mboepd gross)
20
40
60
80
100
120
140
160
SKARVAker BP: 23.8%Partners: Equinor, DEA, PGNiG2P reserves: 30 mmboe (net)
PGNiG
Aker BP: 23.8%Partners: Equinor, DEA, PGNiG2P reserves: 3 mmboe (net)
PGNiG
ALVE NORD
GRÅSEL
SHREK
IDUN NORD
ØRN
NIDHOGG
ALVE NE
ÆrfuglSkarv
2013 2014 2015 2016 2017 2018 2019 2020
– PL 212E

25 · Aker BP Annual Report 2020 · The Skarv Area
Production efficiency 2020:Production 2020:Production start:
95%Skarv:Ærfugl:
*Test production from Ærfugl A-1H 2013
20122020*
Skarv delivered historically good results in 2020 despite a volatile year; zero serious injuries, production efficiency of 95 percent, and reduced operating cost.
On 19 April 2020, Ærfugl Phase 2 started production from the first of a total of three wells in the Ærfugl Phase 2 program. The well came on stream just 166 days after the project was sanctioned, made possible by excellent perfor-mance from and cooperation between the Aker BP alliances. The two remaining wells in Phase 2 are expected to come on stream in fourth quarter 2021. Production started from Ærfugl Phase 1 on 12 November 2020. This was on the same date as promised in the PDO submitted three years earlier. The Ærfugl project was completed safely, efficiently, on time and within budget during a time with a “black swan”; COVID-19 and a substantial decline in the price of oil. The
project has achieved significant improvements since concept selection and PDO approval, which has made Ærfugl one of the most profitable development projects on the Norwegian continental shelf.
Ærfugl plays a crucial role. It returns Skarv to its initial pro-duction plateau, reduces CO2 emissions per barrel by up to 30 percent during 2022, and extends the Skarv field lifetime by five years. Overall, the Ærfugl project brought significant ripple effects for local suppliers in the Helgeland region and throughout Norway. This supports the expectations associa-ted with the tax regime implemented in 2020.
GROWING INTO A MAJOR HUB
21.0 mboepd (net)

26 · Aker BP Annual Report 2020 · The Skarv Area
Production recordWith the start-up of Ærfugl and the upgrade of the gas processing plant, Skarv has set a production record for gas with processing up to 24.5 MCM per day. Total production is now almost 140 thousand barrels of oil equivalent per day through the Skarv plant. In gross terms this makes Skarv the most productive operated asset in the Aker BP portfolio.
GråselOperator Aker BP and the Skarv partners, Equinor, Wintershall Dea and PGNiG have decided to develop the Gråsel discovery. The partners approved the final investment decision for the Gråsel development on 17 December 2020. The Gråsel reservoir is situated above the Skarv reservoir. Gråsel holds a total of approximately 13 million barrels of oil equivalent. The oil and gas production will utilise available capacity on the existing production vessel (FPSO) on the Skarv field. First oil from Gråsel is planned for the fourth quarter of 2021 with option to accelerate.
Developing satellitesThe transaction with PGNiG that brought the Shrek disco-very into Aker BP’s operated portfolio in the Skarv area enabled us to start maturing the “Skarv Satellites Project”, consisting of several smaller discoveries around Skarv cluste-red together. The intention is to ensure optimal utilisation of the FPSO capacity, through the development of the disco-veries in parallel and have them on stream within 2025. By organising the projects as a portfolio, synergies, dependen-cies and interfaces across the developments are optimised in all phases for maximum value creation.
Innovative maintenance Skarv has significantly increased its use of digital remote support by working with vendors and third parties to address work opportunities that can be executed with onshore support. One example is DNV, which carried out remote crane verifications from onshore. This was done both for periodic verification of the offshore pedestal crane and verification following a modification on a local crane offshore needed for the turbine replacement.

27 · Aker BP Annual Report 2020 · The Skarv Area
Highlights 2020j an
feb
mar
apr
may
jun
ju l
aug
sep
oc t
nov
des
2020
Sverre Isak BjørnVice President Operations and Asset Development - Skarv
The Skarv team has yet again demonstrated that we are capable of safely delivering world-class results, both from an operational, field development and project delivery point of view. We are transforming the Skarv facilities into a major hub for surrounding discoveries. The Skarv journey has only just begun.
• January: Five new digital tools successfully imple-mented, including a new ERP system.
• February: Transaction with PGNiG to transfer operatorship of Shrek and farm-down in Alve North (PL127C) licence.
• April: Production started from Ærfugl Phase 2 – more than three years ahead of the original schedule.
• April: Completed the drilling of four Ærfugl wells.
• May: Pull in of umbilicals for Ærfugl project.
• July: Five new Xmas trees in place for Ærfugl project.
• August: Turnaround on critical maintenance and modifications to enable Ærfugl start-up.
• November: Start-up of Ærfugl Phase 1 on time and within budget. Gas production record of up to 24.5 million MCM per day processed over the Skarv FPSO.
• December: Sanctioning of the Gråsel development.

Net 2P Reserves: 40 mmboeULA AREATHE
50
100
150
200
1995 200019901986 2005 2010 2015 2020
TambarUla OdaProduction history (mboepd gross)
Producing field
Field development
Discovery
ULA – PL 019Aker BP: 80%Partner: DNO2P reserves: 29 mmboe (net)
ODA – PL 405Operator: SpiritPartners: Aker BP (15%), DNO, Suncor2P reserves: 4 mmboe (net)
TAMBAR – PL 065Aker BP: 55%Partner: DNO2P reserves: 7 mmboe (net)
ULA Pipeline to Ekofisk
KING LEAR

29 · Aker BP Annual Report 2020 · The Ula Area
Production efficiency 2020:Production 2020:Production start:
82%Ula: 1986Tambar: 2001Tambar East: 2007Oda: 2019
A late-life strategy is established for Ula. The main priorities now are to build a robust operation and further enhance the opportunities in a field that has more resources left to produce.
In recent years, Aker BP and its partners have undertaken a significant effort to understand the resource potential and business opportunities in the Ula area. In 2020, this resul-ted in a clear recommendation to continue focusing on Ula as-is, and to develop an updated depletion strategy aimed at producing well into the 2030s. This work will continue and will be matured in the asset subsurface teams. Submitting the Tambar lifetime extension in 2020 will also support the longevity of the Ula Hub, consisting of tie-backs from the Tambar, Blane and Oda fields.
Host optionsThe King Lear project has been matured into a selection phase. Aker BP considers this asset to be an important part of our portfolio. With the strategy work and subsurface evaluations in the King Lear project and Ula strategy projects complete, we will now look at other host options continuing into the selection phase. As for Ula, other exploration oppor-tunities will be evaluated and pursued in the years to come, such as the Mugnetind field.
THE COURSE IS SET
11.0 mboepd (net)

30 · Aker BP Annual Report 2020 · The Ula Area
Stable productionProduction efficiency was significantly improved from 69 percent in 2019 to 82 percent in 2020, driven by systematic implementation of LEAN principles in the front line, and an integrated effort across the technical functions. The work to manage, optimise, and improve the maintenance programs has yielded great results so far and will continue as part of the implementation of the new Aker BP operating model. COVID-19 has affected offshore operations and measures have been implemented to prevent the virus from spreading to the offshore installations. So far, no cases have been detected, all critical work has been executed, and produ-ction from the field has not been negatively affected by this situation.
Infill drillingAker BP believes there is further resource potential in the Ula area, mainly from improved oil recovery from the Ula and Tambar fields.
The Maersk Integrator rig finalised drilling on Ula in June 2020. Four wells were successfully completed during the campaign, which started in July 2019. The completed well scope consists of two water alternating gas injectors, two producers (one re-drill, one workover) and pilots. In August 2020, the Ula and Tambar licence approved a new rig commitment with the Maersk Integrator to drill an infill well, Ula Unit F Producer 1, and a sidetrack in the K2 Tambar well, both in 2021.
Facility upgradesThe Ula licence period expires in 2028. The resource potential extends beyond the licence period and cessation of production will be determined by the technical life of the facilities and the economic cut-off. For the Tambar instal-lation, an application to extend the lifetime to 2028 was prepared in 2020 and submitted to the authorities.
More work will be done next year to understand the techn-ical conditions and build a plan for technical upgrades to ensure stable production on a facility with the barriers and technical integrity required for the lifetime of Ula.

31 · Aker BP Annual Report 2020 · The Ula Area
Jorun KvåleVice President Operations and Asset Development - Ula
Highlights 2020
j an
feb
mar
apr
may
jun
ju l
aug
sep
oc t
nov
des
2020
• May: One new turbine in operation from the power upgrade project.
• June: New field strategy establishing the direction for late-life.
• June: Drilling campaign on Ula completed; two producers, two injectors.
• August: New Tambar reservoir model.
• August: Rig commmittment for 2021 drilling campaign approved: one well on Ula and one well on Tambar.
• October: King Lear field moved forward to selection phase.
• December: Tambar lifetime extension application submitted to the Petroleum Safety Authority.
Deliver a robust late-life business for the Ula hub! This new ambition will set a steady course for Ula for the future, ensuring robust operations while striving towards world-class recovery at the Ula field enabled by the water alternating gas injection scheme.

Net 2P Reserves: 71 mmboeALVHEIM AREATHE
Producing field
Field development
* Frosk test producer
Discovery
ALVHEIM – PL 203
Aker BP: 65%Partners: Lundin, ConocoPhillips2P reserves: 53 mmboe (net)
VILJE – PL 036 D
Aker BP: 46,9%Partners: Equinor, PGNiG2P reserves: 7 mmboe (net)
FROSK
BØYLA – PL 340
Aker BP: 65%Partners: Vår Energi, Lundin2P reserves: 2 mmboe (net)
Aker BP: 65%Partners: Vår Energi, Lundin2P reserves: 1 mmboe (net)*
VOLUND – PL 150
Aker BP: 65%Partner: Lundin2P reserves: 6 mmboe (net)
TRELL
TRINE
CATERPILLAR
GEKKO
FROSKELÅR
SKOGUL – PL 460
Aker BP: 65%Partner: PGNiG2P reserves: 4 mmboe (net)
Production history (mboepd gross)
20
40
60
80
100
120
140
160
2008 2009 2010 2011 2012 2013 2014 2015 2016 2017 2018 2019 2020
Alvheim Vilje Volund Bøyla/Frosk Skogul

33 · Aker BP Annual Report 2020 · The Alvheim Area
Production efficiency 2020:Production 2020:Production start:
96%2008
Alvheim continued to deliver safe and reliable operations in 2020. Optimal use of gas handling facilities and deferred water breakthrough in several of the fields led to production delivery exceeding the target with more than 15 percent.
At the end of 2020 Alvheim had delivered 500+ days wit-hout any unplanned breakdowns or complete shutdowns. Production has been stable through 2020 with high produ-ction efficiency at 96 percent.
Net production from the Alvheim Area, including Boa, Vilje, Volund, Bøyla and Skogul, was 55.4 mboepd in 2020. This was significantly above target and was achieved through high uptime for the production facilities, reduced shutdown scope related to the East Mid Water Arch incident, which occurred in 2019, and better performance from the Alvheim and Volund wells.
HSE results from operations have been positive with no serious incidents or spills. Energy optimisation initiatives have been high on the agenda throughout 2020 and led to changes in flare settings, which reduced CO2 emissions by 1,120 tonnes.
Asset developmentThe maturation of the Alvheim asset development plan continued in 2020, which emphasised the strategic direction of removing capacity constraints on the FPSO, extending facility lifetimes and adding new production.
As for all offshore activity, COVID-19 impacted operations and led to a reduced activity level. All non-critical activities were postponed to minimise the risk of COVID-19 offshore.
Another Alvheim infill well, Boa Attic South (BAS) was appro-ved in the first quarter of 2020. The drilling of this well star-ted in November 2020, and production is expected to start in early second quarter 2021. Production started on Skogul in March (in line with the PDO) and contributed as expected to high and stable production on Alvheim.
EXCEEDING TARGETS
55.4 mboepd (net)

34 · Aker BP Annual Report 2020 · The Alvheim Area
The Kameleon Infill Mid (KIM) well came on stream in the fourth quarter after a challenging drilling operation.
Digital oilfields Alvheim is also part of Aker BP’s digitalisation story, and has benefitted from a production optimisation initiative called Digital Oil Field, in addition to installing Wi-Fi offshore and implementing handheld devices developed by the user for the user.
Future opportunitiesThe continued focus on increased oil recovery in the Alvheim area delivered in line with the track record, which supports Aker BP’s strategy. We continued to mature oppor-tunities in 2020, with a potential of approving two new wells for drilling as early as 2021. This will enable us to take advantage of the temporary tax regime and add valuable production to arrest base decline. These wells will be in addi-tion to the already mentioned KIM and BAS wells.
In 2020, Aker BP continued to mature both the Kobra East Gekko (KEG), Frosk and Trell and Trine developments. KEG is the most mature of these projects. The KEG discoveries are located approximately 10 km south-east of the Alvheim FPSO. The plan is to develop these discoveries with four multilateral wells and a subsea tie-back to Alvheim through the Kneler B manifold.
The Frosk development project is a close second with a similar decision gate in February 2021, while Trell and Trine will come later in the year.
The Alvheim FPSO has limited capacity to handle produced water and gas. Two projects will mitigate this limitation; gas de-bottlenecking and produced water capacity, with offshore execution in 2021. These projects are important in securing capacity for new tie-back projects to Alvheim. Lifetime extension beyond 2033 has also been evaluated, and a work program has been developed.

35 · Aker BP Annual Report 2020 · The Alvheim Area
Highlights 2020• March: Skogul field started production.
• March: Drilling started on Alvheim Kameleon Infill Mid (KIM).
• August: Ministry of Petroleum and Energy approval received for continued Frosk test production up to August 2021.
• November: Drilling started on the Boa Attic South (BAS) well.
• November: Production started from the KIM well.
• December: Project approved to handle increased produced water capacity.
• December: Decision to mature Kobra East Gekko (KEG) towards investment decision in summer 2021.
mar
apr
may
jun
ju l
aug
sep
oc t
nov
des
2020
Thomas Hoff HansenVice President Operations and Asset Development - Alvheim
Despite a demanding year with the COVID-19 pandemic, Alvheim has again delivered great operational performance. The organisation has really been put to the test and I’m proud to see what they’ve delivered. In 2020, we’ve successfully completed tie-in and start-up of the Kameleon Infill Mid and Skogul. Towards the end of 2020, we spudded BAS for completion in early 2021. Throughout the year, the Alvheim team has been working continuously to further mature future development options and support our ambition to produce more than a billion barrels from the Alvheim FPSO.

Net 2P Reserves: 290 mmboeJOHAN SVERDRUP
Producing field
Field development
Discovery
Production history (mboepd gross)
100
200
300
400
500
Edvard Grieg
Ivar Aasen
Hanz
JOHAN SVERDRUP – Johan Sverdrup unitOperator: EquinorPartners: Aker BP (11.6%) Lundin, Petoro, Total2P reserves: 290 mmboe (net)
2019 2020

37 · Aker BP Annual Report 2020 · Johan Sverdrup
Production efficiency 2020:Production 2020:Production start:
High2019
During the first full year of operation, average net daily production from Johan Sverdrup to Aker BP amounted to 51.9 mboepd. The break-even price for the full field development is less than USD 20 per barrel.
Johan Sverdrup, where Aker BP holds an 11.6 percent ownership, Phase 1 delivered strong health, safety and environment performance and high regularity/production efficiency in 2020.
High performanceThe first new well was spudded from the fixed drilling plat-form in early January, and by year-end, four new oil produ-cers had been successfully drilled, completed and put on stream. All wells are performing according to expectations
at very high rates. One new water injector was also drilled. Drilling from the fixed drilling platform will continue for the next two to three years.
The production design capacity of 440 mbblpd (thousand barrels per day) was already reached in spring and was incre-ased stepwise to a record-high 500 mbblpd in December to take advantage of the wells’ high production capacity, on average above 40 mbblpd.
MASSIVE VALUE CREATION
51.9 mboepd (net)
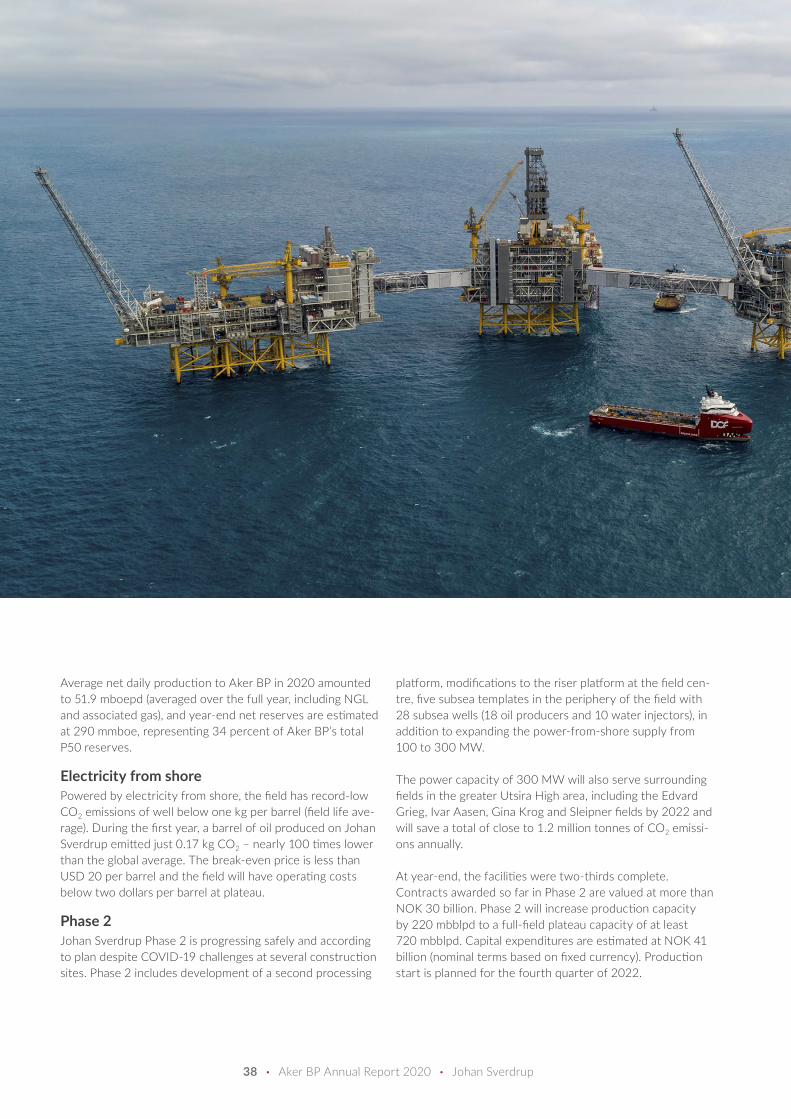
38 · Aker BP Annual Report 2020 · Johan Sverdrup
Average net daily production to Aker BP in 2020 amounted to 51.9 mboepd (averaged over the full year, including NGL and associated gas), and year-end net reserves are estimated at 290 mmboe, representing 34 percent of Aker BP’s total P50 reserves.
Electricity from shorePowered by electricity from shore, the field has record-low CO2 emissions of well below one kg per barrel (field life ave-rage). During the first year, a barrel of oil produced on Johan Sverdrup emitted just 0.17 kg CO2 – nearly 100 times lower than the global average. The break-even price is less than USD 20 per barrel and the field will have operating costs below two dollars per barrel at plateau.
Phase 2Johan Sverdrup Phase 2 is progressing safely and according to plan despite COVID-19 challenges at several construction sites. Phase 2 includes development of a second processing
platform, modifications to the riser platform at the field cen-tre, five subsea templates in the periphery of the field with 28 subsea wells (18 oil producers and 10 water injectors), in addition to expanding the power-from-shore supply from 100 to 300 MW.
The power capacity of 300 MW will also serve surrounding fields in the greater Utsira High area, including the Edvard Grieg, Ivar Aasen, Gina Krog and Sleipner fields by 2022 and will save a total of close to 1.2 million tonnes of CO2 emissi-ons annually.
At year-end, the facilities were two-thirds complete. Contracts awarded so far in Phase 2 are valued at more than NOK 30 billion. Phase 2 will increase production capacity by 220 mbblpd to a full-field plateau capacity of at least 720 mbblpd. Capital expenditures are estimated at NOK 41 billion (nominal terms based on fixed currency). Production start is planned for the fourth quarter of 2022.

39 · Aker BP Annual Report 2020 · Johan Sverdrup
Odd Ragnar HeumVice President Operations and Asset Development - Johan Sverdrup
Highlights 2020
may
apr i l
jun
ju l
aug
sep
oc t
nov
des
2020
• April: Production design capacity of 440 mbblpd was reached.
• July: 100 million barrels of produced oil equivalents.
• December: Production design capacity was stepwise increased to record high 500 mbblpd.
• December: Johan Sverdrup Phase 2 (the full field development) progressed safely and according to plan despite COVID-19 challenges at several construction sites. At year end the facilities were 2/3 complete.
In 2020, Johan Sverdrup confirmed its massive value creation potential for Aker BP and the other partners, as well as for the broader Norwegian society, as Phase 1 has reached record-high production levels and Phase 2 has progressed according to plan, despite COVID-19 challenges. Both the operator, the partners and the contractors deserve praise for their continued excellent achievements.

Net 2C contingent volumes: 200–430 mmboeNOAKA AREATHE
Producing field
Field development
Discovery
Oseberg Gasstransport
Huldra Gassrør
Frostpipe
Skogul
FullaAker BP: 40%Partner: Equinor, LOTOS
Krafla og AskjaOperator: EquinorPartner: Aker BP (50%)
NOAAker BP: ~90%Partner: LOTOS
2027Aiming for first oil in

41 · Aker BP Annual Report 2020 · The NOAKA Area
Expected production start:
2027
THE FIELD OF THE FUTUREThe NOAKA area is located between Oseberg and Alvheim in the Norwegian sector of the North Sea. The area is home to several oil and gas discoveries with gross recoverable resources estimated at more than 500 million barrels of oil equ-ivalent, with further exploration and appraisal potential.
The area represents the next major field development on the Norwegian continental shelf (NCS). The NOAKA area consists of the discoveries Frigg Gamma Delta, Langfjellet, Frøy, Fulla, Frigg, Rind and Krafla-Askja.
In June 2020, Aker BP, LOTOS and Equinor entered into an agreement in principle on commercial terms for a coordinated development of Krafla, Fulla and North of Alvheim (NOA).

42 · Aker BP Annual Report 2020 · The NOAKA Area
The development plans for the area consist of a process platform in the south operated by Aker BP, an unmanned process platform in the north operated by Equinor and several satellite platforms and tie-backs to cover the various discoveries.
Aker BP is working together with strategic partners in cross-functional teams to further mature and improve the development concept for NOA and Fulla. A concept sele-ction is planned for the third quarter of 2021. Equinor, as the operator of Krafla, is maturing the Krafla concept in close collaboration with Aker BP to optimise the total area development concept
The concept will be further optimised prior to submitting Plans for Development and Operation in the fourth quarter of 2022.
Lars HøierSenior Vice President/Asset Manager - NOAKA
The NOAKA ambition is to have a field development solution with a minimum environmental footprint. We will apply advanced technological solutions to secure high regularity and low emissions. The field will be fully electrified with power from shore, and extensive digital solutions will be implemented in both the project development and production phases.

43 · Aker BP Annual Report 2020 · The NOAKA Area
Highlights 2020• February: Agreement on main technical building
blocks in area development, between Equinor, LOTOS and Aker BP.
• June: Agreement in principle on commercial terms for a coordinated development of Krafla, Fulla and North of Alvheim (NOA).
• July/August: Mobilisation of asset and project organisation.
• September: Revised design basis and initiation of concept development studies.
• October: Value enhancement studies in concept development phase.
• November: Subsurface sprints to mature reservoir understanding and optimise drainage strategies.
• December: Revised design basis and initiation of studies with strategic partners.
• December: Start large-scale digital initiative for NOAKA along with Aker Solutions, aiZe and Cognite, to ensure efficient project execution and optimised production phase through digitalisation.
j an
feb
mar
apr
may
jun
ju l
aug
sep
oc t
nov
des
2020
44 · Aker BP Annual Report 2020 · Board of Directors
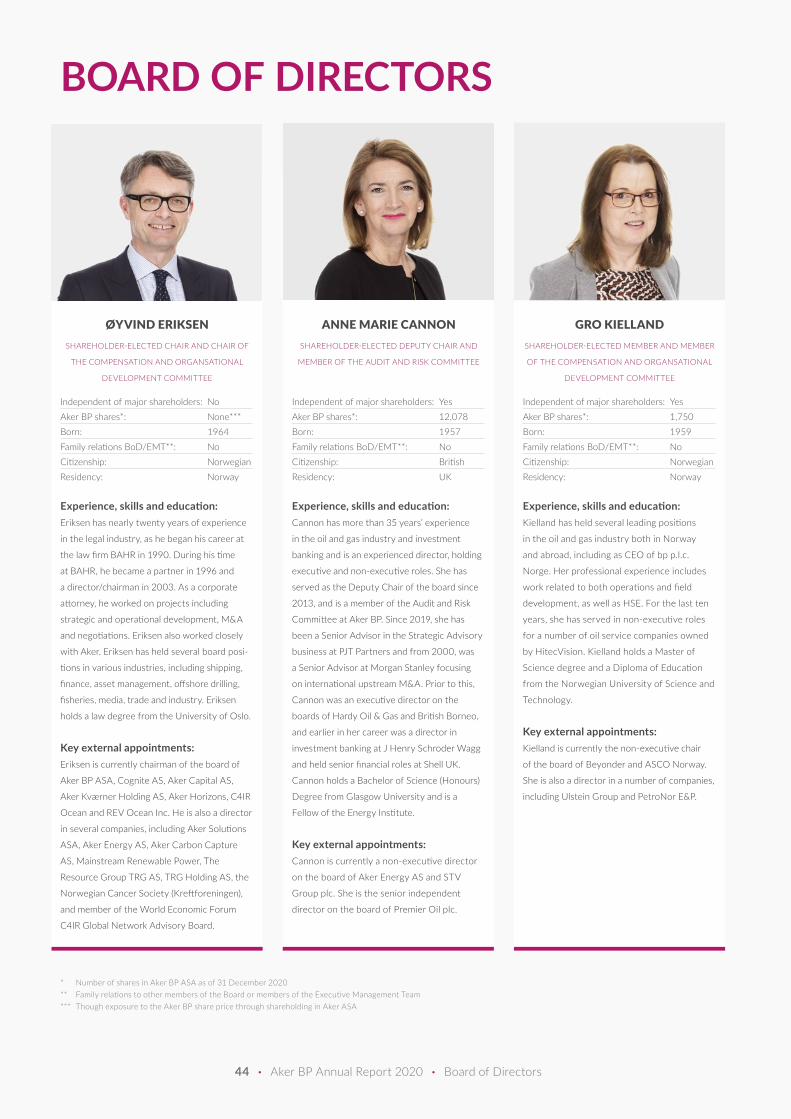
ØYVIND ERIKSENSHAREHOLDER-ELECTED CHAIR AND CHAIR OF
THE COMPENSATION AND ORGANSATIONAL
DEVELOPMENT COMMITTEE
Independent of major shareholders: NoAker BP shares*: None***Born: 1964Family relations BoD/EMT**: NoCitizenship: NorwegianResidency: Norway
Experience, skills and education: Eriksen has nearly twenty years of experience
in the legal industry, as he began his career at
the law firm BAHR in 1990. During his time
at BAHR, he became a partner in 1996 and
a director/chairman in 2003. As a corporate
attorney, he worked on projects including
strategic and operational development, M&A
and negotiations. Eriksen also worked closely
with Aker. Eriksen has held several board posi-
tions in various industries, including shipping,
finance, asset management, offshore drilling,
fisheries, media, trade and industry. Eriksen
holds a law degree from the University of Oslo.
Key external appointments: Eriksen is currently chairman of the board of
Aker BP ASA, Cognite AS, Aker Capital AS,
Aker Kværner Holding AS, Aker Horizons, C4IR
Ocean and REV Ocean Inc. He is also a director
in several companies, including Aker Solutions
ASA, Aker Energy AS, Aker Carbon Capture
AS, Mainstream Renewable Power, The
Resource Group TRG AS, TRG Holding AS, the
Norwegian Cancer Society (Kreftforeningen),
and member of the World Economic Forum
C4IR Global Network Advisory Board.
GRO KIELLANDSHAREHOLDER-ELECTED MEMBER AND MEMBER
OF THE COMPENSATION AND ORGANSATIONAL
DEVELOPMENT COMMITTEE
Independent of major shareholders: YesAker BP shares*: 1,750Born: 1959Family relations BoD/EMT**: NoCitizenship: NorwegianResidency: Norway
Experience, skills and education: Kielland has held several leading positions
in the oil and gas industry both in Norway
and abroad, including as CEO of bp p.l.c.
Norge. Her professional experience includes
work related to both operations and field
development, as well as HSE. For the last ten
years, she has served in non-executive roles
for a number of oil service companies owned
by HitecVision. Kielland holds a Master of
Science degree and a Diploma of Education
from the Norwegian University of Science and
Technology.
Key external appointments: Kielland is currently the non-executive chair
of the board of Beyonder and ASCO Norway.
She is also a director in a number of companies,
including Ulstein Group and PetroNor E&P.
ANNE MARIE CANNONSHAREHOLDER-ELECTED DEPUTY CHAIR AND
MEMBER OF THE AUDIT AND RISK COMMITTEE
Independent of major shareholders: YesAker BP shares*: 12,078Born: 1957Family relations BoD/EMT**: NoCitizenship: BritishResidency: UK
Experience, skills and education: Cannon has more than 35 years’ experience
in the oil and gas industry and investment
banking and is an experienced director, holding
executive and non-executive roles. She has
served as the Deputy Chair of the board since
2013, and is a member of the Audit and Risk
Committee at Aker BP. Since 2019, she has
been a Senior Advisor in the Strategic Advisory
business at PJT Partners and from 2000, was
a Senior Advisor at Morgan Stanley focusing
on international upstream M&A. Prior to this,
Cannon was an executive director on the
boards of Hardy Oil & Gas and British Borneo,
and earlier in her career was a director in
investment banking at J Henry Schroder Wagg
and held senior financial roles at Shell UK.
Cannon holds a Bachelor of Science (Honours)
Degree from Glasgow University and is a
Fellow of the Energy Institute.
Key external appointments: Cannon is currently a non-executive director
on the board of Aker Energy AS and STV
Group plc. She is the senior independent
director on the board of Premier Oil plc.
BOARD OF DIRECTORS
* Number of shares in Aker BP ASA as of 31 December 2020** Family relations to other members of the Board or members of the Executive Management Team*** Though exposure to the Aker BP share price through shareholding in Aker ASA
45 · Aker BP Annual Report 2020 · Board of Directors
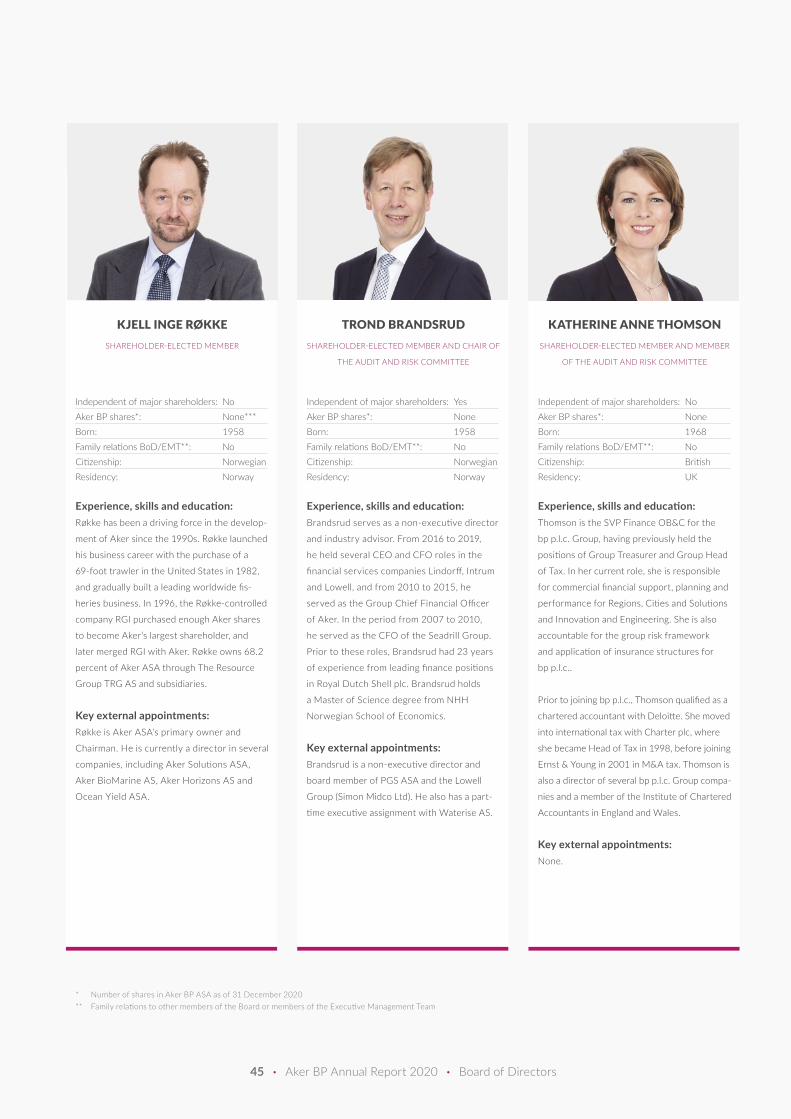
TROND BRANDSRUDSHAREHOLDER-ELECTED MEMBER AND CHAIR OF
THE AUDIT AND RISK COMMITTEE
Independent of major shareholders: YesAker BP shares*: NoneBorn: 1958Family relations BoD/EMT**: NoCitizenship: NorwegianResidency: Norway
Experience, skills and education: Brandsrud serves as a non-executive director
and industry advisor. From 2016 to 2019,
he held several CEO and CFO roles in the
financial services companies Lindorff, Intrum
and Lowell, and from 2010 to 2015, he
served as the Group Chief Financial Officer
of Aker. In the period from 2007 to 2010,
he served as the CFO of the Seadrill Group.
Prior to these roles, Brandsrud had 23 years
of experience from leading finance positions
in Royal Dutch Shell plc. Brandsrud holds
a Master of Science degree from NHH
Norwegian School of Economics.
Key external appointments: Brandsrud is a non-executive director and
board member of PGS ASA and the Lowell
Group (Simon Midco Ltd). He also has a part-
time executive assignment with Waterise AS.
KJELL INGE RØKKESHAREHOLDER-ELECTED MEMBER
Independent of major shareholders: NoAker BP shares*: None***Born: 1958Family relations BoD/EMT**: NoCitizenship: NorwegianResidency: Norway
Experience, skills and education: Røkke has been a driving force in the develop-
ment of Aker since the 1990s. Røkke launched
his business career with the purchase of a
69-foot trawler in the United States in 1982,
and gradually built a leading worldwide fis-
heries business. In 1996, the Røkke-controlled
company RGI purchased enough Aker shares
to become Aker’s largest shareholder, and
later merged RGI with Aker. Røkke owns 68.2
percent of Aker ASA through The Resource
Group TRG AS and subsidiaries.
Key external appointments: Røkke is Aker ASA’s primary owner and
Chairman. He is currently a director in several
companies, including Aker Solutions ASA,
Aker BioMarine AS, Aker Horizons AS and
Ocean Yield ASA.
KATHERINE ANNE THOMSONSHAREHOLDER-ELECTED MEMBER AND MEMBER
OF THE AUDIT AND RISK COMMITTEE
Independent of major shareholders: NoAker BP shares*: NoneBorn: 1968Family relations BoD/EMT**: NoCitizenship: BritishResidency: UK
Experience, skills and education: Thomson is the SVP Finance OB&C for the
bp p.l.c. Group, having previously held the
positions of Group Treasurer and Group Head
of Tax. In her current role, she is responsible
for commercial financial support, planning and
performance for Regions, Cities and Solutions
and Innovation and Engineering. She is also
accountable for the group risk framework
and application of insurance structures for
bp p.l.c..
Prior to joining bp p.l.c., Thomson qualified as a
chartered accountant with Deloitte. She moved
into international tax with Charter plc, where
she became Head of Tax in 1998, before joining
Ernst & Young in 2001 in M&A tax. Thomson is
also a director of several bp p.l.c. Group compa-
nies and a member of the Institute of Chartered
Accountants in England and Wales.
Key external appointments: None.
* Number of shares in Aker BP ASA as of 31 December 2020** Family relations to other members of the Board or members of the Executive Management Team

46 · Aker BP Annual Report 2020 · Board of Directors
TERJE SOLHEIMEMPLOYEE-ELECTED MEMBER AND MEMBER
OF THE COMPENSATION AND ORGANSATIONAL
DEVELOPMENT COMMITTEE
Independent of major shareholders: YesAker BP shares*: 1,787Born: 1962Family relations BoD/EMT**: NoCitizenship: NorwegianResidency: Norway
Experience, skills and education: Solheim is the General Manager of Aker BP’s
Harstad office. He has been with Aker BP
since 2013 and has held several positions with
the company.
Solheim has an extensive background from the
Norwegian Armed Forces and was one of the
founders of Norwegian Petro Services (NPS).
He came to Aker BP from Det Norske Veritas
(DNV).
Key external appointments: None.
ANETTE HOEL HELGESENEMPLOYEE-ELECTED MEMBER
Independent of major shareholders: YesAker BP shares*: 1,134Born: 1987Family relations BoD/EMT**: NoCitizenship: NorwegianResidency: Norway
Experience, skills and education: Helgesen has been with Aker BP since 2011.
She holds the position of HSSEQ Manager
Project & Concept Development. Prior to
this, Helgesen held various positions in Aker
BP and bp p.l.c. Norway, as Operations
Engineering Manager for the Ula field, Process
Engineer and Onshore Operations Supervisor
for the Valhall Field.
Helgesen holds a Master of Science degree
in Chemical Engineering from the Norwegian
University of Science and Technology in
Trondheim.
Key external appointments: None.
MURRAY AUCHINCLOSSSHAREHOLDER-ELECTED MEMBER
Independent of major shareholders:Aker BP shares*:Born: 1970Family relations BoD/EMT**:Citizenship: CanadianResidency: UK
Experience, skills and education: Auchincloss joined Amoco Canada in 1992
and bp p.l.c. through the merger in 1999.
He has built a career performing a range
of commercial and leading roles across the
company. Most recently he served as bp p.l.c.’s
Upstream CFO (2015 to 2020).
Auchincloss holds a Bachelor of Finance
degree from the University of Calgary. He also
completed his Chartered Financial Analyst
(CFA) certification in 1995.
Key external appointments: Auchincloss is the Chief Financial Officer of
bp p.l.c. He is a member of bp p.l.c.’s Executive
Board and serves on the Main Board Audit
Committee.
* Number of shares in Aker BP ASA as of 31 December 2020** Family relations to other members of the Board or members of the Executive Management Team

47 · Aker BP Annual Report 2020 · Board of Directors
ØRJAN HOLSTADEMPLOYEE-ELECTED MEMBER
Independent of major shareholders: YesAker BP shares*: 4,384Born: 1989Family relations BoD/EMT**: NoCitizenship: NorwegianResidency: Norway
Experience, skills and education: Holstad has been with Aker BP since 2010
and works as a P&O Business Partner for the
offshore segment in Operations and Asset
Development. He has served as a full-time
employee representative in bp p.l.c. Norge and
member of the bp p.l.c. Norge AS Board of
Directors from 2014 to 2016.
Holstad has a background as an Instrument
Technician and has offshore and project expe-
rience from the Skarv FPSO.
Key external appointments: None.
INGARD HAUGEBERGEMPLOYEE-ELECTED MEMBER
Independent of major shareholders: YesAker BP shares*: 1,510Born: 1962Family relations BoD/EMT**: NoCitizenship: NorwegianResidency: Norway
Experience, skills and education: Haugeberg serves as a full-time employee
representative. Prior to this position, he was
the HSSE Site Lead on the Ula field.
Haugeberg has broad experience from the
Royal Norwegian Air Force in Bodø as a techn-
ical grenadier and as department manager for
Safelift A/S. He started in Amoco Norge as
a mechanic on the Valhall field in 1991. He
has held several positions in bp p.l.c. Norge
since 1998. Haugeberg has also held a number
of different directorships in bp p.l.c. Norge,
Industrimaskiner A/S, Global Clean Energy,
I/E Media and trippEl A/S. He was trained
as an electro-mechanical repair tech at the
Royal Norwegian Air Force technical school at
Kjevik and has a company-approved bachelor
in mechanics.
Key external appointments: None.
* Number of shares in Aker BP ASA as of 31 December 2020** Family relations to other members of the Board or members of the Executive Management Team

48 · Aker BP Annual Report 2020 · Executive Management Team
EXECUTIVE MANAGEMENT TEAM
KARL JOHNNY HERSVIK
CHIEF EXECUTIVE OFFICER
Aker BP shares*: 10,355Born: 1972Family relations BoD/EMT**: NoCitizenship: NorwegianResidency: Norway
Experience, skills and education: Hersvik has been CEO of Aker BP since May
2014. Prior to joining Aker BP, he served as
head of research for Statoil. Hersvik has held
a number of specialist and executive positions
with Norsk Hydro and StatoilHydro. Hersvik
holds an MSc degree in Industrial Mathematics
from the University of Bergen.
Key external appointments: Hersvik is the chairman of the Board of
Directors of Aker Energy AS and aiZe. He is a
member of the Board of Directors in Cognite,
the Norwegian Oil and Gas Association
and the Norwegian Church Abroad
(Sjømannskirken).
MARIT BLAASMO
SVP HSSEQ
Aker BP shares*: 2,153Born: 1975Family relations BoD/EMT**: NoCitizenship: NorwegianResidency: Norway
Experience, skills and education: Blaasmo has been the SVP HSSEQ in Aker BP
since May 2019. Prior to this, she was respon-
sible for the performance and improvement
agenda in Drilling & Wells. Blaasmo has been
with the company since August 2017.
She has more than 18 years’ experience from
Equinor and Baker Hughes INTEQ and has
held multiple operational and management
positions within Drilling & Wells disciplines.
Blaasmo holds a Master’s degree in Petroleum
Engineering from the Norwegian University of
Science and Technology (NTNU).
Key external appointments: None.
DAVID TORVIK TØNNE
CHIEF FINANCIAL OFFICER
Aker BP shares*: 13,900Born: 1985Family relations BoD/EMT**: NoCitizenship: NorwegianResidency: Norway
Experience, skills and education: Tønne has been the Chief Financial Officer
of Aker BP ASA since January 2019 after
advancing from the position of VP Corporate
Controlling. Tønne has been with Aker BP
since January 2017.
Prior to Aker BP, Tønne worked for the Boston
Consulting Group, where he co-led the Nordic
Energy Practice Area supporting clients in oil
and gas, Private Equity, Shipping and Industrial
Goods across a wide range of functional topics
in Europe, North America and the Middle East.
Tønne holds a Master’s degree in Finance from
NHH Norwegian School of Economics.
Key external appointments: None.
* Number of shares in Aker BP ASA as of 31 December 2020** Family relations to other members of the Board or members of the Executive Management Team

49 · Aker BP Annual Report 2020 · Executive Management Team
INE DOLVE
SVP OPERATIONS AND ASSET DEVELOPMENT
Aker BP shares*: 4,033Born: 1975Family relations BoD/EMT**: NoCitizenship: NorwegianResidency: Norway
Experience, skills and education: Dolve has been the SVP Operations and
Asset Development since July 2020. She
comes from the position of VP Operations &
Asset development for Skarv in Aker BP. She
has worked with the company since 2010
and been involved in various key projects
to develop and improve both company and
industry performance.
Before joining Aker BP, she worked in
management consulting (PwC) within finance,
management of change and digitalisation
for oil and gas. She also has several years of
experience from the Armed Forces, nationally
and internationally.
Dolve holds a Master’s degree in Finance
and International Management from NHH
Norwegian School of Economics/ESADE,
Barcelona. She is also educated at the Air
Force Officer Candidate School and the
Norwegian Naval Academy in Bergen.
Key external appointments: None.
PER HARALD KONGELF
SVP IMPROVEMENT
Aker BP shares*: 5,546Born: 1959Family relations BoD/EMT**: NoCitizenship: NorwegianResidency: Norway
Experience, skills and education: Kongelf is responsible for Aker BP’s impro-
vement program.
Prior to joining Aker BP, he served as head of
Norwegian operations in Aker Solutions. He
has more than 30 years of industrial experi-
ence from numerous technical and manage-
ment positions in Aker Solutions.
Kongelf holds a Master’s degree from
the Norwegian University of Science and
Technology (NTNU).
Key external appointments: Kongelf is a board member and Aker represen-
tative for Eureka Logistics AS, Eureka Pumps
AS, FPE Sontum AS and Origo Solutions AS.
EVY GLØRSTAD
SVP EXPLORATION
Aker BP shares*: 5,866Born: 1975Family relations BoD/EMT**: NoCitizenship: NorwegianResidency: Norway
Experience, skills and education: Glørstad has been SVP Exploration since July
2018. She came from the position of Asset
Development Manager for NOAKA. Glørstad
has been with the company since 2011.
She has broad experience as a geologist in
bp p.l.c. in Norway and the US and has held
several managerial positions since joining the
company.
Glørstad holds a Master of Science degree
from the University of Bergen and a PhD in
petroleum geology/sedimentology from the
University of Oslo.
Key external appointments: None.
* Number of shares in Aker BP ASA as of 31 December 2020** Family relations to other members of the Board or members of the Executive Management Team

50 · Aker BP Annual Report 2020 · Executive Management Team
LENE LANDØYSVP STRATEGY & BUSINESS DEVELOPMENT
Aker BP shares*: 10,122Born: 1979Family relations BoD/EMT**: NoCitizenship: NorwegianResidency: Norway
Experience, skills and education: Landøy has been the SVP Strategy & Business
Development since January 2019. She advan-
ced from VP Strategy, Portfolio & Analysis
and has been with the company since January
2017.
Before joining Aker BP, Landøy led the busi-
ness development unit on the Norwegian con-
tinental shelf in Statoil ASA, now Equinor. She
held various positions in Statoil, in Technology
and innovation, Finance, Natural gas and infra-
structure and Global business development.
Landøy holds a Master’s degree in finance
from the NHH Norwegian School of
Economics and the University of California
Los Angeles (UCLA). She also holds a master’s
degree in international finance from the Skema
Business School.
Key external appointments: None.
KNUT SANDVIKSVP PROJECTS
Aker BP shares*: 2,577Born: 1962Family relations BoD/EMT**: NoCitizenship: NorwegianResidency: Norway
Experience, skills and education: Sandvik has been SVP Projects in Aker BP
since July 2019. He has more than 30 years’
experience from the oil and gas industry.
Throughout his career, Sandvik has held
various senior project and leadership positions
across Aker Solutions, including four years
as a member of the Executive Management
Team. Sandvik holds a degree in Mechanical
Offshore Engineering from Heriot-Watt
University in Scotland.
Key external appointments: None.
LARS HØIERSVP AND ASSET MANAGER NOAKA
Aker BP shares*: 5,675Born: 1967Family relations BoD/EMT**: NoCitizenship: NorwegianResidency: Norway
Experience, skills and education: Høier has been SVP and Asset Manager for
NOAKA since August 2020. He joined Aker
BP in 2019 as VP for Concept Development
and Technology.
Høier has more than 20 years of experience
from Equinor, with positions as SVP for R&D,
as well as production director for several
assets, including the Troll field.
Høier holds a Master of Science degree in
Physics from the University in Oslo and a PhD
in Petroleum technology from the Norwegian
University of Science and Technology (NTNU).
Key external appointments: None.
* Number of shares in Aker BP ASA as of 31 December 2020** Family relations to other members of the Board or members of the Executive Management Team

51 · Aker BP Annual Report 2020 · Executive Management Team
TOMMY SIGMUNDSTADSVP DRILLING & WELLS
Aker BP shares*: 9,418Born: 1970Family relations BoD/EMT**: NoCitizenship: NorwegianResidency: Norway
Experience, skills and education: Sigmundstad has been SVP Drilling & Wells in
Aker BP since 2016. Prior to this, he was Vice
President Wells in bp p.l.c. Asia Pacific.
Sigmundstad has broad experience within the
oil and gas industry from companies such as
Baker Hughes and Philips, before joining bp
p.l.c. in 2000. Within bp p.l.c., Sigmundstad
has held various operational, engineering and
management positions in Norway, the United
Kingdom, Azerbaijan and Indonesia.
Sigmundstad holds a Master’s degree in
Petroleum Engineering from the University of
Stavanger.
Key external appointments: Sigmundstad is a member of the board of
directors in MHWirth.
ØYVIND BRATSBERGSPECIAL ADVISOR
Aker BP shares*: 54,802Born: 1959Family relations BoD/EMT**: NoCitizenship: NorwegianResidency: Norway
Experience, skills and education: Bratsberg has been a special advisor reporting
to the Aker BP management team since 2014.
He joined Aker BP in 2008 as Chief Operating
Officer and has more than 30 years’ experi-
ence from several companies in the areas of
marketing, business development and ope-
rations. Before taking up his position at Det
Norske (Aker BP), he was responsible for ear-
ly-phase field development on the Norwegian
continental shelf for StatoilHydro.
Bratsberg holds an MSc degree in Mechanical
Engineering from the Norwegian University of
Science and Technology (NTNU).
Key external appointments: Bratsberg is a member of the Board for
Standard Contracts on the Norwegian conti-
nental shelf.
* Number of shares in Aker BP ASA as of 31 December 2020** Family relations to other members of the Board or members of the Executive Management Team

52 · Aker BP Annual Report 2020 · Board of Directors Report
BOARD OF DIRECTORS’ REPORTAker BP continued to deliver strong operational performance in 2020, with record high production, improved safety record, lower unit production cost, and further reduced CO2 emissions intensity.
In response to the COVID-19 pandemic and a sharp drop in oil prices, the company quickly reduced its investment activity and dividend payments to pre-serve its financial flexibility. Following the introduction of temporary changes to the Norwegian petroleum tax system, the company resumed its investment acti-vity. The company has a significant resource base, a strong financial position, pro-ven execution skills, and is well positioned for value creation in the years to come.
Aker BP carries out significant operations related to explo-ration and production of oil and gas on the Norwegian Continental Shelf (NCS). Environmental, Social and Governance (ESG) issues are of paramount importance to the Board of Directors of Aker BP. Accordingly, the Board recognizes its responsibility for the safety of people and the environment and devotes appropriate time and resources to comply with all regulations and adhere to the highest stan-dards in the oil and gas industry regarding Health, Safety, Security and Environment (HSSE).
To meet the challenges of an uncertain macro environment and to strengthen its long-term competitiveness, Aker BP has established a strong platform for value creation. The company leverages an effective business model built on lean principles, strong technological competence, and industrial cooperation to ensure safe and efficient operations.
Aker BP has a comprehensive improvement agenda with four focus areas. The aim is to reduce cost and improve efficiency across all disciplines to enable sanctioning of new stand-alone projects at break-even prices below USD 30 per barrel of oil equivalent (boe). The focus areas are:
1. Reorganization of the value chain with strategic part-nerships and alliances to improve efficiency and increase productivity
2. Digitalization of the Exploration & Production (E&P) business model
3. Development of management systems and culture to build on «Lean» principles by prioritizing flow efficiency over resource efficiency
4. Bringing these together inside one organization and one business model that withstands volatility and has the flexibility to sustain growth.
Managing the risks associated with the COVID-19 pan-demic has been a top priority since the beginning in early 2020. In February, Aker BP started monitoring the develop-ment in the spread of the coronavirus and a task force was then established to issue company instructions to prevent transmission and procedures for handling confirmed cases onshore as well as offshore.
In March, Aker BP decided to mobilize its Incident Command System (ICS) to further strengthen the response to protect the health and safety of the company’s employees and contractors, and to maintain safe and reliable operations. Since then Aker BP has also participated in several commit-tees within the Norwegian Oil and Gas Association, working with issues related to several aspects of the joint industry response including helicopter logistics, medical standards, and communication with regulatory bodies.
Aker BP was the first operator on the Norwegian Continental Shelf to implement mandatory COVID-19 pre-departure testing for all personnel traveling offshore. In May, test faci-lities were operationalised and by the end of the year close to 13,000 tests had been performed using PCR (molecular) diagnostics. In addition, all our manned installations had PCR testing capabilities on board to be used in case of suspected infection or to verify status of close contacts.
The ICS organization has an experienced team of professi-onals from different disciplines, including medical, and our intention is to keep this dedicated team operational until the overall situation, both nationally and internationally, is deemed to be sufficiently safe.
53 · Aker BP Annual Report 2020 · Board of Directors Report
The company’s policies and procedures to handle the pande-mic have proved effective and will remain in place for as long as necessary.
An updated business plan was communicated to the market in March 2020. All non-sanctioned field development proje-ctes were put on hold, exploration spending and production costs were reduced, and the original dividend plan was assessed and later retracted.
Under the extraordinary circumstances affecting the oil market in 2020, Aker BP’s main financial priorities have been to secure the company’s financial robustness, to protect its investment grade credit profile, and to maintain financial flexibility to pursue value-accretive growth opportunities.
The company’s financial situation remains strong and the temporary changes in the Petroleum Tax Law provides Aker BP with a foundation for continued high investment activity to drive further value creation. The Hod development in the Valhall area was the first project to be launched as a direct result of the tax changes. The company is currently maturing a significant part of the resource base for final investment decision by the end of 2022.
Despite the challenges of COVID-19, Aker BP has delive-red on its production ambitions for 2020. Aker BP’s net production was 210.7 thousand barrels of oil equivalents per day (mboepd), which is a new record in the history of the company. Total net production volume was 77.1 million barrels of oil equivalents (mmboe).
Aker BP continues to be an operator with low carbon emissi-ons intensity. In 2020, Aker BP’s CO2 intensity was below 5 kg CO2 per barrel of oil equivalents (equity share), in line with
the company’s goal. This is less than half of the global indus-try average and significantly below the average for the NCS. In addition, Aker BP methane emissions remain low. The goal for 2021 is to not exceed a methane intensity of 0.1 percent.
The overall HSE performance has been improved throug-hout 2020 with a reduced number of injuries and serious incidents. The company had zero Process Safety Events in 2020, which is an encouraging result. Three incidents with high potential were reported. These incidents have been thoroughly investigated, and the lessons learned have been shared across all operated assets. Overall, the HSE perfor-mance is a strong achievement during a challenging year with regards to the COVID-19 pandemic. Maintaining and further improving the HSE performance requires relentless efforts and continuous attention. Aker BP continues to further strengthen its safety culture based on a strong foundation of systematic learning from incidents and structured risk management.
All field development projects progressed according to plans, including phase 1 and 2 of the Ærfugl development, Johan Sverdrup phase 2 and Hod. The company’s project portfo-lio is expected to contribute significantly to the company’s production and profitability in the years to come. First oil from both Ærfugl phase 1 and the Skogul development was achieved during 2020.
The company participated in four exploration wells in 2020. The exploration activities resulted in two small discoveries. The company further expanded its license portfolio through the Awards in pre-defined Areas (APA) 2020. Aker BP was offered interests in ten new production licences on the NCS, of which eight are as operator.

54 · Aker BP Annual Report 2020 · Board of Directors Report
The company has a large resource base, with 2P reserves of 842 (906) mmboe and contingent resources of 895 (931) mmboe. This resource base provides a basis for future organic growth.
The company has a robust and diversified capital structure with USD 4.5 billion in available liquidity as of 31 December 2020. The company paid USD 425 million in dividends to shareholders, representing a 50 percent reduction compared to the original plan, as a response to the weak oil market and high levels of uncertainty in the global economy following the COVID-19 pandemic.
The Board is of the opinion that Aker BP is well positioned for further value accretive growth on the NCS and is cons-cious of the risks associated with project execution and the changing market conditions in which the company operates. The Board is prioritizing capital discipline and mitigation of risk wherever possible throughout the organization.
Share price performance and ownership structure In 2020, the share price for Aker BP ended at NOK 216.2 per share, compared to NOK 288 per share at the end of 2019. The total number of shares issued was unchanged through the year at 360.1 million. Aker ASA remains the
largest owner with 40 percent, while bp p.l.c. owns 30 percent of the shares. The remaining 30 percent were split among more than 22,000 shareholders. Aker BP is listed on Oslo Børs under the ticker symbol «AKRBP».
BUSINESS DESCRIPTION Description of the companyAker BP is an independent E&P company with exploration, development and production activities. At the end of 2020, all the company’s assets and activities are based in Norway and within the Norwegian offshore tax regime.
Aker BP remains convinced that the NCS offers attractive opportunities for oil and gas exploration and development. The company plans to continue to be an active industry player in the coming years.
The company’s registered address is at Lysaker in Bærum municipality. The company also has offices in Harstad, Sandnessjøen, Stavanger and Trondheim. Karl Johnny Hersvik is Chief Executive Officer. At the end of 2020, the company had 1,748 (1,742) employees. The company has interests in a total of 135 (141) licenses, including non-operated licenses.

55 · Aker BP Annual Report 2020 · Board of Directors Report
Production assets and field developmentsAker BP’s oil and gas production in 2020 averaged 210.7 (155.9) mboepd. Of this, 84 percent was oil and liquids, while 16 percent was natural gas. The production comes predo-minantly from six fields or hubs: Alvheim, Ivar Aasen, Johan Sverdrup, Skarv, Ula, and Valhall.
The Alvheim area consists of the fields Alvheim, Volund, Vilje, Bøyla and Skogul, which are all being produced through the Alvheim FPSO (floating production, storage, and offlo-ading vessel). All these fields are operated by Aker BP. The oil is exported by shuttle tankers, and the produced gas is exported through the SAGE system.
Aker BP’s net production from the Alvheim area in 2020 averaged 55.4 (54.4) mboepd. The increase was driven by Skogul which started producing in the first quarter, and by Bøyla where the Frosk test production continued, which contributed to offset the underlying decline from other reservoirs. The operational performance was strong with a production efficiency of 96 percent.
The field development activities in the Alvheim area conti-nued in 2020. The Kameleon Infill Mid well started produ-ction in November and was followed by drilling start of the Boa Attic South well, which is planned to start production in the second quarter 2021. Furthermore, a new dual-lateral well, Kameleon Infill West, is being matured and drilling is scheduled to take place during the fourth quarter 2021.
The Frosk development project is being matured towards final investment decision, planned in the second half of 2021.
A concept decision for the development of the Kobra East and the Gekko (KEG) discoveries was made in the fourth quarter 2020, with final investment decision planned for the second half of 2021. These discoveries are located approxi-mately 10 km south-east of the Alvheim FPSO. The plan is to develop these discoveries with four multilateral wells and a subsea tie-back to Alvheim through the Kneler B manifold.
A project to upgrade the water capacity at the Alvheim FPSO was sanctioned in the fourth quarter, with offshore installation planned in 2021. The installation will be done in conjunction with a gas debottlenecking project, increasing the gas capacity by approximately 15 percent. Together, these projects will improve the capacity for future tie-back projects at Alvheim.
The Ivar Aasen field is developed with a production, drilling and quarters (PDQ) platform with a steel jacket, and requires a separate jack-up rig for drilling and completion. The plat-form has spare slots for possible additional wells. First stage processing is carried out on the Ivar Aasen platform, and the
partly processed fluids are transported to the Edvard Grieg field for final processing and export. Ivar Aasen is powered by electricity which is currently supplied from Edvard Grieg. In 2022, this will be replaced with power from shore. The field is operated by Aker BP.
Aker BP’s net production from Ivar Aasen in 2020 averaged 20.1 (21.8) mboepd. Production efficiency in 2020 was 90 percent and was negatively impacted by routine activities related to well interventions, drilling operations and planned maintenance.
Two new production wells were drilled at Ivar Aasen in 2020 and started production after the end of the year. Two more wells are planned to be drilled in 2021.
The Johan Sverdrup field came on stream in October 2019 after a successful construction and installation phase. Phase 1 of the project consisted of four large bridge-linked plat-forms (the field center), Norway’s largest oil export pipeline, a gas export pipeline, three subsea water injection templates, 20 pre-drilled production and water injection wells, and 100 MW power from shore. The field is operated by Equinor.
The processing capacity for Johan Sverdrup Phase 1 at star-tup was 440,000 barrels of oil per day (bblpd). During 2020, it was established that the capacity exceeded the initial assumptions, and by the end of the year it had been increa-sed to 500,000 bblpd. The operator is currently working to expand the water injection capacity at the field and expe-cts to further increase the processing capacity to around 535,000 bblpd during 2021.
Johan Sverdrup Phase 2 is progressing well and according to plan. Phase 2 includes development of a second processing platform, modifications of the riser platform at the field center, five subsea templates in the periphery of the field, in addition to expanding the power-from-shore supply. The increased power capacity will also serve several surrounding fields in the greater Utsira High area, including Ivar Aasen, and will contri-bute to an annual reduction in total CO2 emissions of nearly 1.2 million tonnes. Phase 2 will increase the production capa-city to a full field plateau capacity of 720 mbblpd. Production start is planned for the fourth quarter 2022.
Average daily production net to Aker BP in 2020 amounted to 51.9 mboepd including associated gas.
Powered with electricity from shore, the Johan Sverdrup field has record-low CO2 emissions of well below 1 kg per barrel. The break-even oil price is less than USD 20 per barrel and the field will have operating costs below USD 2 per barrel at plateau.

56 · Aker BP Annual Report 2020 · Board of Directors Report
Skarv is an oil and gas field in the northern part of the Norwegian Sea and is developed with an FPSO anchored to the seabed. The oil is offloaded to shuttle tankers, while the gas is transported to the Kårstø terminal in a pipeline conne-cted to the Åsgard Transport System. The field is operated by Aker BP.
Ærfugl is a gas condensate field situated close to the Skarv FPSO and mostly within the Skarv Unit. The PDO for Ærfugl was approved by Norwegian authorities in April 2018 and covers the full field development including the resources in both the Ærfugl and Ærfugl Nord fields. The field is being developed in two phases. The first phase includes three new production wells in the southern part of the field tied into the Skarv FPSO via a trace heated pipe-in-pipe flowline. This phase has been successfully completed, and production started in December 2020.
The second phase of the development is currently in exe-cution. This phase consists of one production well drilled through the existing Idun template, and two production wells in the northern part of the field. The first well through the Idun template was drilled as part of the Ærfugl phase 1 drilling campaign, and production started in the summer of 2020. For the two remaining wells, production start is plan-ned in the fourth quarter 2021.
In December 2020, the Skarv partnership decided to develop the Gråsel discovery which is situated within the Skarv licence area. Gråsel is estimated to contain around 13 mmboe of recoverable resources and will utilize existing capacities in Skarv’s FPSO and subsea infrastructure. Several other disco-veries in the Skarv area are also being considered for future development as subsea tiebacks to the Skarv FPSO.
Net production from Skarv, including Ærfugl, averaged 21.0 mboepd in 2020. The production efficiency was 95 percent.
The Ula area consists of the fields Ula, Tambar, and Oda, which are all being produced through the Ula field centre. The oil is exported via Ekofisk to Teeside, while the gas is reinjected into the Ula reservoir to enhance recovery.
In recent years, Aker BP has been working to mature a re-de-velopment plan for Ula. In 2020, it was concluded that such re-development did not meet the company’s investment criteria. Consequently, a late-life strategy has now been adopted for Ula, and production is expected to end in the early 2030’s.
Net production for Aker BP from the Ula area averaged 11.0 mboepd in 2020. The production efficiency was 82 percent.
The Valhall area consists of the Valhall and Hod fields in the southern part of the Norwegian North Sea. Valhall started production in 1982. The infrastructure in the area currently consists of the field centre with four separate bridge-con-nected platforms. In addition, the field has three unmanned flank platforms. The produced oil is exported via pipeline to Ekofisk and further to Teesside in the UK, while the gas is exported via Norpipe to Emden in Germany.
Aker BP’s net production from Valhall averaged 50.7 mboepd in 2020. This was an increase of 33 percent from the pre-vious year and was driven by production from Valhall Flank West and new wells at the field centre. Production efficiency was stable at 86 percent.

57 · Aker BP Annual Report 2020 · Board of Directors Report
The original Hod development produced from 1990 to 2012 via a remotely operated wellhead platform tied back to Valhall. Hod currently produces from wells drilled from the Valhall Flank South platform. All wells on the Hod platform are currently shut in and plug and abandon operations are currently ongoing.
In June 2020, Aker BP and its partner Pandion Energy sub-mitted the plan for development and operation (PDO) for the Hod field. Hod will be developed in collaboration with Aker BP’s alliance partners with a Normally Unmanned Installation remotely controlled from the Valhall field centre. The project is utilising the same concept, execution model and organisa-tion as the Valhall Flank West project, which was success-fully completed in 2019.
Hod will be powered from shore via the Valhall field cen-tre and will hence generate very low CO2 emissions. Total investments for the development are estimated at around USD 600 million. Production start is planned for first quarter 2022. Recoverable reserves for Hod are estimated at around 40 mmboe (gross). Aker BP is the operator for the field.
The NOAKA area (Krafla, Fulla and North of Alvheim) is located between Oseberg and Alvheim in the Norwegian North Sea. The area holds several oil and gas discoveries with gross recoverable resources estimated at more than 500 million barrels of oil equivalents, with further explora-tion and appraisal potential. In 2020, Aker BP and Equinor entered into an agreement in principle on commercial terms for a coordinated development of the area.
The development plans for the area consist of a processing platform in the south operated by Aker BP, an unmanned processing platform in the north operated by Equinor and several satellite platforms and tiebacks to cover the various discoveries. Aker BP is working together with its strate-gic partners in cross-functional teams to further mature and improve the development concept for NOA and Fulla. Equinor, as operator for Krafla, is maturing the Krafla concept in close collaboration with Aker BP. A concept select decision is planned for the third quarter 2021, and the ambition is to submit PDO in the fourth quarter 2022. Production start is targeted in 2027.
The fields Atla, Enoch and Gina Krog produced an average of 0.5 mboepd net to Aker BP in 2020. Aker BP divested its ownership in Gina Krog during the year.
Exploration activitiesAker BP’s ambition is to be the leading exploration company on the Norwegian Continental Shelf. The company has delivered strong exploration results in recent years and has exceeded its ambition of discovering 250 mmboe net in the period from 2016 to 2020.
The company continues to seek additional prospect oppor-tunities while improving the available data and technology to create a competitive edge. Aker BP’s exploration acti-vity is grouped in two categories; Exploration near own producing fields (Infrastructure led exploration – ILX) and exploration for growth opportunities (new hubs). Over time, the company is seeking an 80/20 balance between ILX and growth exploration targets.
In 2020, Aker BP originally planned to participate in ten exploration wells. Six of these wells were rescheduled to 2021, mainly due to the activity reductions implemented in response to the pandemic. Of the four wells that were completed, two resulted in minor discoveries.
Total investments in exploration in 2020 amounted to USD 246 (501) million. Exploration expenses in the Income state-ment amounted to USD 174 (306) million, including expensed dry wells of USD 57 (176) million, while new capitalized explo-ration expenditures amounted to USD 127 (370) million.
In January 2021, Aker BP was awarded ten new licenses, including eight operatorships, through Awards in Predefined Areas (APA 2020). Most of these licenses are located close to the company’s existing core areas.
THE ANNUAL ACCOUNTS The parent and group prepare its financial statements in accordance with International Financial Reporting Standards (IFRS) as adopted by EU and the Norwegian Accounting Act.
Income statementThe parent and group’s total income amounted to USD 2,979 (3,347) million. Total production volume was 77.1 (56.9) mmboe. The average realized liquids price was 40.0 (64.8) USD per barrel, while the realized price for natural gas avera-ged USD 0.14 (0.18) per standard cubic metre (scm).
Production costs for the oil and gas sold in 2020 were USD 628 (720) million. Production costs per boe produced in 2020 amounted to USD 8.3 (12.4). Exploration expenses amounted to USD 174 (306) million and were mainly related to dry and non-commercial wells, seismic data, field evaluat-ion and general exploration activities. Depreciation amoun-ted to USD 1,122 (812) million.
Impairments amounted to USD 573 (147) million, mainly rela-ted to Ula/Tambar and Ivar Aasen, in addition to exploration assets. A breakdown of the impairment charges is included in note 13 to the financial statements.
Other operating expenses amounted to USD 49 (35) million.

58 · Aker BP Annual Report 2020 · Board of Directors Report
The parent and group reported an operating profit of USD 433 (1,327) million. The pre-tax profit amounted to USD 164 (1,084) million, and the tax expense amounted to USD 119 (943) million.
The tax rules and tax calculations are described in notes 1 and 10 to the financial statements.
The net profit was USD 45 (141) million.
Statement of financial positionTotal assets at year-end amounted to USD 12,420 (12,227) million.
Equity amounted to USD 1,987 (2,368) million at the end of 2020, corresponding to an equity ratio of 16 (19) percent. Net interest-bearing debt, including leasing obligations, was USD 3,647 (3,493) million.
In January 2020, the company issued a 5-year USD 500 million bond and a 10-year USD 1 billion bond. In September 2020, the company issued a USD 500 million bond due in 2026 and a USD 750 billion bond due in 2031.
At the end of the year, the company had total available liquidity of USD 4.5 (2.7) billion, comprising USD 538 (107) million in cash and cash equivalents and USD 4.0 (2.55) bil-lion in undrawn credit facilities. For information about terms on the credit facilities, see note 23. Financial covenants for the company’s debt instruments were comfortably within applicable thresholds. The company has a robust balance sheet and ample financial flexibility.
Aker BP is currently rated by three rating agencies, S&P, Fitch, and Moody’s. S&P Global Ratings has assigned a BBB- long-term corporate credit rating with stable outlook. In February 2021, Moody’s assigned a Baa3 long-term issuer rating with stable outlook. Fitch has assigned a BBB-rating with stable outlook.
Statement of cash flow Net cash flow from operating activities amounted to USD 1,857 million, down from USD 1,885 million in 2019.
Net cash flow used in investment activities amounted to USD 1,501 (2,178) million. The main item was investments in fixed assets of USD 1,278 (1,703) million.
Accounting standardsAs described in note 1, there have been no changes to accounting standards and interpretations that have a material impact on the financial statements. The accounting prin-ciples used for the 2020 annual financial statements are
thus consistent with the principles used in the 2019 annual financial statements.
Hedging The company seeks to reduce the risk related to foreign exchange, interest rates and commodity prices through hed-ging instruments. The company actively manages its exposu-res through a mix of forward contracts and options.
At year-end 2020, the company had purchased oil put options with strike prices of around USD 40 per barrel for approximately 40 percent of the expected oil production for the first half of 2021 (after tax).
The going concern assumption2020 has been significantly impacted by the COVID-19 crisis, with significant drop in oil and gas prices in the first half of the year. Towards the end of the year, and in the beginning of 2021, the market has recovered to levels before COVID-19. The company has a solid financial position, inclu-ding USD 4.5 billion in available liquidity as of year end 2020.
Therefore, pursuant to the Norwegian Accounting Act section 3-3a, the Board of Directors confirms that the requ-irements of the going concern assumption are met and that the annual accounts have been prepared on that basis. The Board considers the financial position and the liquidity of the company to be sound. Cash flow from operations, combined with the total available liquidity, is expected to be more than sufficient to finance the company’s commitments in 2021.
In the Board of Directors’ view, the annual accounts give a true and fair view of the company’s assets and liabilities, financial position, and results. The Board of Directors is not aware of any factors that materially affect the assessment of the company’s position as of 31 December 2020, or the result for 2020, other than those presented in the Board of Directors’ Report or that otherwise follow from the financial statements.
Resource accounts Aker BP complies with guidelines from Oslo Stock Exchange and the Society of Petroleum Engineers’ (SPE) classification system for quantification of petroleum reserves and contin-gent resources. Total net P90/1P reserves are estimated at 641 (666) mmboe, while net P50/2P reserves amounted to 842 (906) mmboe at year-end 2020. See note 31 for a more detailed review of the resource accounts. The reserves have been certified by an independent third party.
Profit for the yearThe Board of directors proposes that the profit for the year is transferred to retained earnings.

59 · Aker BP Annual Report 2020 · Board of Directors Report
HSSEQ IN AKER BP’S OPERATIONSHealth, Safety, Security, Environment and Quality (HSSEQ) is always the number one priority in all of Aker BP’s activities. The company strives to ensure that all its operations, drilling campaigns and projects are carried out under the highest HSSEQ standards.
Hsseq performanceAker BP’s goal is to prevent any kind of harm and ensure a safe workplace. Everyone who works for the company – our employees, hired personnel and contractors – shall be able to perform their work in an environment where the emphasis is on safety. Our facilities shall be in good condition, and must be planned, designed, and maintained in a manner that ensures their technical integrity.
The company’s overall HSSEQ performance displays a positive trend. However, to meet our ambition of no harm to people and the environment we need to maintain our continuous effort to seek improvements in our HSSEQ performance.
During 2020, Aker BP had zero Process Safety Events (PSE), which is an encouraging result we aim to sustain. However, three incidents with high potential were reported. Out of these, one included a helicopter that lost altitude to a level below helideck under night conditions with rain and dimi-nished visibility. The other two concerned dropped objects. These incidents were thoroughly investigated in accordance with the company’s established event management proces-ses. The learnings have been shared both locally and, where relevant, across all operating assets.
The Total Recordable Injuries Frequency (TRIF) for 2020 is 1.2 which is significantly lower compared to 2019 TRIF which was 3.5. The Serious Incident Frequency (SIF) for 2020 has also improved from 0.7 to 0.5. In September we experienced unintentional release of deluge with foam from fire water when conducting the annual emergency shut-down test. This resulted in one Loss of Primary Containment (LOPC) incident.
In cooperation with other operating companies, Aker BP has developed quarterly learning campaigns focusing on major accident risk, personnel safety, dropped objects and health/working environment. This initiative is delivered online and contains practical tasks to be performed in offshore as well as onshore teams. This is repeated annually with updated case histories and tasks and is a strong contribution to our proactive HSE effort.
Combining risk insight with learnings from events and successes constitutes the foundation for further impro-vement to our HSSEQ performance and requires a conti-nuous and systematic effort from the whole organization.
All deviations reported in the Inspection audits have been addressed and actions have been closed out. A revised appli-cation of discharge has been submitted for both Ivar Aasen and Alvheim and the Norwegian Environment Agency (NEA) has issued new permits for both assets. Relevant require-ments and processes in the business management system and reporting routines have been reviewed and updated. Roles and responsibilities for all involved parties have been revised. Dashboards showing application and discharge of chemicals have been developed to ensure transparency and strengthen follow-up. Verification protocol for application and discharges of chemicals has been established.
60 · Aker BP Annual Report 2020 · Board of Directors Report
An NGO has reported Aker BP and several other opera-tors, to the Police for the negligent discharge of lubribation oil from submerged sea water pumps on Ivar Aasen and Alvheim. Aker BP has conducted a survey of all submerged pumps and thrusters on all assets and, where findings were made, issued a new application to the NEA. Updated permits have been received.
The Petroleum Safety Authority (PSA) carried out 13 regular audits of Aker BP operations and activities in 2020. In addi-tion, the PSA also carried out a total of nine sectoral focus projects. The NEA conducted two audits and other regula-tory bodies conducted in total five audits:
• Norwegian Petroleum Directorate (NPD) – four audits• Directorate for Radiation Protection and Nuclear Safety
(DSA) – one audit
Aker BP received zero notices of order from the Authorities in 2020.
Aker BP had during 2020 applied for a total of 23 Application for Discharge and 14 Application for Consents.
SecurityAker BP divides security into three main areas: personnel, object and information security. The company works within
these areas to protect the company’s values in accordance with relevant legislation and company needs. This work is also an integrated part of Aker BP’s risk and barrier management.
Security differs from safety by focusing solely on unwanted events caused by intentional actions. Through intelligence, value, and threat assessments, as well as by raising aware-ness in the company, Aker BP works to ensure that neither the business nor the personnel are directly affected by threat agents.
In 2020 Aker BP’s cyber security program has operationa-lized capacities to monitor, detect and respond to security incidents. A professional team, “Cyber Security Operations”, is established to manage the new capacities. Training this team together with the emergency preparedness organiza-tion and the delivery of several digital security improvements has improved Aker BP’s cyber resilience, resulting in a redu-ced cyber risk to the company.
The company has enabled and continued to develop its new threat intelligence capacity program to reduce uncertainty and enhance decision support to the Executive Management Team and specific business units.

61 · Aker BP Annual Report 2020 · Board of Directors Report
Business Management System and assuranceThe Business Management System (BMS) is the company’s framework for creating and sustaining value, trust, and pre-dictability. BMS describes how Aker BP works, controls risk and improves through approximately 300 business processes supplemented by governing documents, requirements, and descriptions. Based on findings and feedback from a compre-hensive work carried out during 2019 and 2020, a project has been initiated to acquire, configure, and migrate existing BMS content to a new and modern management system software platform. The new BMS system platform will be implemented across all business units.
Risk-based assurance of conformity to the business mana-gement system requirements is governed by the company’s “Three lines of assurance” model. An improved framework for Aker BP’s “Three lines of assurance” was introduced in 2020 and is continually under improvement with regards to processes and tools to enhance execution.
Climate strategy and statusAker BP acknowledges the conclusions from the Intergovernmental Panel on Climate Change (IPCC) and is committed to take responsibility for the company’s carbon footprint.
Climate issues are formally integrated and embedded into Aker BP’s strategy and decision making. The Board of Directors have ownership of climate related objectives and expectations in Aker BP’s climate strategy, and reviews and guides the major plans of action when it comes to invest-ment decisions for climate initiatives.
In 2020, the company’s CO2 intensity was 4.5 kg CO2 per boe (equity share), which is less than half the global average, and below the average for the NCS. The upstream methane intensity was 0.03 percent. In 2020, Aker BP set an absolute CO2 reduction goal of 50 percent within the 2030s. Aker BP’s improvement agenda includes energy management and the implementation of energy efficiency and emission redu-ction measures. Power from shore (hydro-electric power) is part of the active energy management along with offshore wind considerations. In 2020 we continued to evaluate options for the existing fields in relation to life extension and emission reductions. Ula’s expected lifetime was reduced from 2040 to early 2030’s which directly impacts the CO2 profiles. Valhall already has power from shore and Ivar Aasen will receive power from shore in 2022 (receives power from near-by asset Edvard Grieg today). The new development project NOAKA, has a base case design using hydro-electric power from shore.
Employees and working conditions
Status of employees and recruitment • At year-end 2020, the company had 1,748 (1,742)
employees. • Aker BP recruited 56 new employees and 8 apprentices
in 2020.• Aker BP has a long-standing collaboration with graduate
schools and universities to recruit talent as well as coope-ration with regards to student internships.
Equal opportunities The company is committed to maintain a working environ-ment with equal opportunities for all based on qualifications, irrespective of gender, ethnicity, sexual orientation, or disa-bility. In 2020, Aker BP established a Diversity and Inclusion Policy expressing the principles to be followed, with clear targets and a plan for action. The company does not tolerate any form of discrimination, whether it be trade union affili-ation, social background, political opinion, sensitive medical conditions and so forth. There were no incidents of discrimi-nation reported in 2020.
In December 2020, women held 21.5 percent of the posi-tions in the company. The share of women on the Board of directors was 36 percent. The share of women in the exe-cutive management team was 40 percent and in the middle management it was 24 percent.
Men and women with the same jobs, with equal professional experience who perform equally well, shall receive the same pay in Aker BP. The complexity of the job, discipline area and work experience affect the pay level of individual employees.
At the end of 2020, 9 percent of the employees were of non-Norwegian origin.
The working environment Aker BP has a working environment committee (AMU) as described in the Norwegian Working Environment Act. The committee plays an important role in monitoring and improving the working environment and in ensuring that the company complies with laws and regulations in this area.
Employees enjoy freedom of association and the company is committed to maintaining an open and constructive dialogue with the employee representatives through meetings on a regular basis throughout the year. Five local trade unions are registered as being represented in the company: Tekna, Lederne, SAFE, Industri Energi and NITO.

62 · Aker BP Annual Report 2020 · Board of Directors Report
The working environment in Aker BP during 2020 was affe-cted by several factors, including the COVID-19 pandemic, organisational adjustments, and subsequent activity increa-ses following the introduction of temporary changes to the petroleum tax system. The employee satisfaction surveys show a marginally negative trend during the year. This was not unexpected, given the significant changes in working environment caused by the COVID situation, Overall, the working environment is considered to be good.
Sickness absence Working for Aker BP shall promote and not reduce the health of our employees and employee health is of major importance for us. Aker BP has several proactive and health promoting measures available for our employees. Several of these offers are available through our occupational health service and includes physical therapy, ergonomic guidance, crisis support line, workouts, travel medicine and vaccines, personal health, and occupational health.
In 2020, the total sickness absence in Aker BP was 3.0 per-cent, which is significantly lower than the national average of six percent in Norway. For onshore personnel the figure was 2.3 percent. For offshore personnel, the figure was 4.6 percent, which is comparable with other NCS operators. Reference is also made to the company’s ESG report, which includes further details on Aker BP’s working environment.
Ethics and IntegrityAker BP’s values are Enquiring (Søkende), Responsible (Ansvarlig), Predictable (Forutsigbar), Committed (Engasjert) and Respectful (Respektfull). The Norwegian words form the abbreviation SAFER. The values define the company culture and describe how we want to work in Aker BP. The values also guide our behaviour in the workplace and enable us to live by our Code of Conduct. Our goal is that every employee habitually acts according to our core values.
During 2020, Aker BP continued to strengthen its anti-cor-ruption compliance program with focus on training and awa-reness activities, introduction of new internal procedures, business partner integrity due diligence, and risk mapping of our supply chain. The company updated its Code of Conduct and approved a new human rights policy to address changes and developments in relevant regulatory frameworks, and to clarify expectations to employees, consultants, and busi-ness partners. The human rights policy describes Aker BP’s commitments and how human rights impacts are managed in our supply chain and across our operations. Both policy documents are available at the company’s website. Reference is also made to the company’s ESG report, which includes further details on Aker BP’s work in these areas.
Social Responsibility Aker BP works to create value for all key stakeholders, including local communities where we operate, by integrating social responsibility into the way we do business. We partner with local, regional, and national businesses, organisations, and authorities to achieve mutual understanding of expecta-tions, facilitate direct and indirect local benefits, and create opportunities for stakeholders.
Stakeholder engagement Our stakeholders are the many individuals and organizations who are affected in some way by Aker BP’s activities – whet-her it is in our role as an energy provider, an employer or as a business that helps boost local economies through jobs and revenue.
Open and proactive dialogue with stakeholders facilitates our ability to access the resources we require through the whole life cycle of our assets.
We work with governments, communities, and non-go-vernmental organizations to implement social investment programs that can have a sustainable beneficial impact. We invest in community projects that align with local needs and our business activities.
When planning projects, we assess the potential impacts on communities. This helps to identify early on whether any activities could affect stakeholders or the environment in nearby communities, and to find ways to prevent or mitigate those impacts. We consult with communities, so that we can understand their expectations and address concerns. Through this, we hope to resolve potential disagreements, avoiding negative impacts on others and disruption to our activities.
Local business and community benefits Aker BP is committed to stimulating local content by creating jobs and growing local businesses in the communities in which the company operates.
All five operated hubs (Alvheim, Valhall, Ula, Ivar Aasen and Skarv) have performed and secured acceptance for the impact assessment studies as part of the Government approval process.
The Hod development is providing activity and jobs for supplier companies across Norway. During 2020, Aker BP awarded one hundred contracts each worth more than NOK 1 million for construction of the Hod B platform.

63 · Aker BP Annual Report 2020 · Board of Directors Report
75 percent of the contract values for construction of the Hod B platform and subsea installations have been awarded to Norwegian supplier companies. The contracts have been awarded to companies in a total of 23 municipalities in nine counties around the country.
According to the Government’s Northern Area Policy, special focus should be given to the development and operation of fields located in Northern Norway to help stimulate local content and create value in the regions. The compa-ny’s Ærfugl development field, located offshore west of Helgeland, is in this category.
Aker BP has continued the contract strategy from Skarv to the Ærfugl development project, where the company con-tinues to focus on four elements to stimulate local engage-ment and value creation:
1. Maximizing the local impacts 2. Decentralized contracts 3. Local procurement function and active supplier
development 4. Close contact and cooperation with Nordland County,
local municipalities in Helgeland, business, schools, and educational institutions.
Aker BP is a member of the Oil and Gas Cluster Helgeland, an organization located in Northern Norway with a key focus on how to involve local and regional business enterprises.
To stimulate the cooperation with schools and education, Aker BP is supporting activities and public offices that contri-bute to the growth and development of the local community by offering studies, competence-raising measures and innovation processes and projects such as «Kunnskapsparken Helgeland», «Tverrfaglig Opplæringskontor», «Studiesenter
Ytre Helgeland», and «Sandnessjøen upper secondary school».
Aker BP is further developing the cooperation agreement with Nordland County focusing on local business develop-ment, schools, and education.
Research and development The aim of Aker BP’s Research & Development (R&D) efforts is to support our journey to become the leading independent offshore E&P company. We invest in R&D across our whole value chain, and we have a balanced portfolio of projects targeting knowledge and methods, physical technology development, and digital / software development. We led or participated in around 90 projects in 2020 with a total spend close to NOK 320 million.
During 2020, the R&D council (with representatives from all Business Units) further strengthened the link between the R&D portfolio and the assets’ business needs. An annual process has been implemented, where the assets document their “top problems to solve” and the R&D council prioritize project candidates to meet these needs. This resulted in a more nuanced technology strategy, and clear customers to realize the value from the R&D projects.
Some highlights from our R&D portfolio are:
• Continuing our development of a platform for acquisition, processing, and storage of data from industrial sensors, meeting big data, robotics, and machine learning challen-ges through our EurekaX digitalisation programme
• Developing a downhole valve that separates water/gas based on density
• Developing tools and knowledge to increase efficiency of Well Plugging & Abandonment operations

64 · Aker BP Annual Report 2020 · Board of Directors Report
Corporate governance Aker BP believes that good corporate governance with a clear distribution of roles and responsibility between the owners, the Board and executive personnel is crucial for the company to deliver value to its shareholders.
The Board of Aker BP is responsible for maintaining the highest corporate governance standards. The Board carries out an annual review of the company’s principles. The company complies with relevant rules and regulations for corporate governance, including the most recent version of the Norwegian Code of Conduct for Corporate Governance, published on 17 October 2018, unless otherwise specified.
An account of corporate governance is provided in a sepa-rate section of the annual report and on the company’s website.
The company has emphasized the importance of providing accurate information in interim reports, capital market upda-tes and through direct dialogue with relevant authorities.
Reporting of payments to governments Aker BP has prepared a report on government payments in accordance with the Norwegian Accounting Act § 3-3 d) and the Norwegian Securities Trading Act § 5-5a. It states that companies engaged in activities within the extractive indus-tries shall annually prepare and publish a report containing information about their payments to governments at country and project level. The report is provided in a separate section of the annual report and on the company’s website www.akerbp.com.
RISK FACTORS The risk factors highlighted below could have a material adverse effect separately, or in combination, on our financial condition. Accordingly, investors should carefully consider these risks.
Response and measures we use to manage or mitigate our risks are embedded in our governance and business mana-gement system complemented by our risk management framework.
Risk-based assurance of the business management system requirements is governed by the company’s three lines of assurance model. Assurance is an activity to provide confidence that quality requirements will be fulfilled. Aker BP’s three lines of assurance model is continually under improvement with regards to processes and tools to enhance execution and safeguard inherent and identified risk.
Market risksAker BP’s business depends significantly on the level of oil and gas prices, which are volatile, and are further subject to market expectations regarding such prices. If oil and gas prices decline, our results of operations, cash flows, finan-cial condition and access to capital could be materially and adversely affected.
The company’s profitability is determined in large part by the difference between the income received from the oil and gas produced and the operational costs, taxation costs relating to recovery (which are assessable irrespective of sales), as well as costs incurred in transporting and selling the oil and

65 · Aker BP Annual Report 2020 · Board of Directors Report
gas. Lower prices for oil and gas may thus reduce the amount of oil and gas that the company is able to produce econo-mically. This may also reduce the economic viability of the production levels of specific wells or of projects planned or in development to the extent that production costs exceed anticipated revenue from such production.
The economics of producing from some wells and assets may also result in a reduction in the volumes of the company’s reserves. Aker BP might also decide not to produce from certain wells at lower prices. These factors could result in a material decrease in net production revenue, causing a redu-ction in oil and gas acquisition and development activities. In addition, certain development projects could become unpro-fitable because of a decline in price and could result in the company having to postpone or cancel a planned project, or if it is not possible to cancel the project, carry out the project with negative economic impact.
In addition, a substantial material decline in prices from historical average prices could reduce the company’s ability to refinance its outstanding credit facilities. Changes in the oil and gas prices may thus adversely affect the company’s business, results of operations, cash flow, ability to pay divi-dends, financial condition, and prospects.
Systemic risksRisks arising from the systems around our business may escalate and in combination shape systemic risk. Whole or parts of systems could be severely affected including those where the company conduct business. Financial systems, supply systems, resource system, even the human population system may solely or by combination be shocked because of e.g. infectious diseases spreading worldwide or by a global financial crisis. The different scenarios exhibit a large degree of uncertainty, lack of control, and undecisive impact from management actions. Under such circumstances psychologi-cal behavior could be driven by fear and reactivity.
The company may face situations where there are extensive strain or full-scale shortage of resources (e.g. personnel, goods & services, finances) to perform our business acti-vities as a result from systemic risk. Any such conditions could drain cash-flow, have material negative effect on our financial condition, force undesired change in strategic dire-ction, and impact our ability to conduct business and deliver production.
Safety and environmental risksExploration, development, and production operations involve numerous safety and environmental risks and hazards that may result in material losses or additional expenditures.
Developing oil and gas resources and reserves into commer-cial production involves risk. Aker BP’s exploration opera-tions are subject to all the risks common in the oil and gas industry. These risks include, but are not limited to, enco-untering unusual or unexpected subsurface features, rock formations or geological pressures, geological uncertainties, seismic shifts, blowouts, oil spills, uncontrollable flows of oil, natural gas or well fluids, explosions, fires, improper instal-lation or operation of equipment and equipment damage or failure. Given the nature of offshore operations, Aker BP’s exploration, operating and drilling facilities are also subject to the hazards inherent in marine operations, such as capsizing, sinking, grounding and damage from severe storms or other severe weather conditions, as well as loss of containment, fires or explosions. Occurrence of any such significant events may result in material losses and adversely impact our cash-flow and financial position.
Climate changes could potentially have significant physical effects, such as increased frequency and severity of storms, droughts, floods, and other climatic events. Aker BP’s offs-hore operations and infrastructure could be at risk from such climatic events.
The market in which the company operates is highly competitive The oil and gas industry is highly competitive. Competition is particularly intense in the acquisition of (prospective) oil and gas licenses. Aker BP’s competitive position depends on its geological, geophysical, and engineering expertise, financial resources, the ability to develop its assets and the ability to select, acquire, and develop proven reserves. Unsatisfactory ability to maneuver the competitive landscape may have a material effect on the company, its growth ambition, and ability to replace produced reserves.
Climate change regulation The company’s business and results of operations could be adversely affected by climate change and the adoption of new climate change laws, policies, and regulations. Growing concerns about climate change and greenhouse gas emis-sions have led to the adoption of various regulations and policies, including the Paris Agreement negotiated at the 2015 United Nations Conference on Climate Change (COP 21), which requires participating nations to reduce carbon emissions every five years beginning in 2023. Multiple plans have also been proposed in the Norwegian parliament to reduce carbon emissions from companies operating in certain sectors, including the oil and gas industry, and create a carbon trading system linked to the European Union’s emissions trading scheme.

66 · Aker BP Annual Report 2020 · Board of Directors Report
The emission reduction targets and other provisions of the recent Norwegian climate change law, the Paris Agreement, or similar legislative or regulatory initiatives enacted in the future, could adversely impact the company’s business by imposing increased costs in the form of taxes or for the pur-chase of emission allowances, limiting the company’s ability to develop new oil and gas reserves, decreasing the value of its assets, challenge asset lifetime extension, or reducing the demand for hydrocarbons and refined petroleum products.
Concentration of operationsAker BP’s production of oil and gas is delivered from a limited number of offshore fields. If mechanical or techni-cal problems, abnormal weather or other events affect the production on one of these offshore fields or our partner operated assets, it may have direct and significant impact on a substantial portion of the company’s production. Also, if the actual reserves associated with any one of these fields are less than the estimated reserves, the company’s results from operations and financial condition could be materially adversely affected.
Risks related to redetermination of unitized petroleum depositsUnitization agreements relating to production licenses may include a redetermination clause, stating that the apportion-ment of the deposit between licenses can be adjusted within certain agreed time periods. Any such redetermination of interest in any of the company’s licenses may have a nega-tive effect on its interest in the unitized deposit, including its tract participation and cash flow from production. No assurance can be made that any such redetermination will be satisfactorily resolved or will be resolved within reasonable time and without incurring significant costs. Any redetermi-nation negatively affecting the company’s interest in a unit may have a material adverse effect on its business, results of operations, cash flow, financial conditions, and prospects.
Projects are associated with risks relating to delays and cost overrunsAker BP’s ongoing development or decommissioning proje-cts involve advanced engineering, extensive procurement activities and complex construction work to be carried out under various contract packages at different locations ons-hore. Furthermore, the company (together with its license partners), must carry out drilling operations, install, test and commission offshore installations and obtain governmental approval to take them into use prior to commencement of production. The complexity of such development projects makes them sensitive to circumstances that may affect the planned progress or sequence of the various activities.
Although Aker BP believes that the development or commis-sioning projects will be completed on schedule in accordance
with all license requirements and within the estimated budgets, the current or future projected target dates for production or cessation may be delayed and cost overruns may incur.
Furthermore, estimated exploration costs are subject to many assumptions that may not prove to be correct. Any such inability to explore, appraise, develop, or decommission petroleum operations or incorrect assumptions regarding exploration costs may have an adverse effect on the compa-ny’s growth ambitions, future business and revenue, opera-ting results, financial condition, and cash flow.
Third-party risks in terms of operators and partners Where the company is not the operator of a license, alt-hough it may have consultation rights or the right to with-hold consent in relation to significant operational matters depending on the level of its interest in such license (as most decisions by the management committee only require a majority vote), the company has limited control over mana-gement of the assets and mismanagement by the operator or disagreements with the operator as to the most appropriate course of action may result in significant delays, losses or increased costs to Aker BP.
Third-party risks in terms of contractors Market conditions may impair the liquidity situation of con-tractors and consequently their ability to meet its obligations towards the company. This may in turn impact both timeline and cost expectations to our projects and operations.
Oil and gas production could vary significantly from reported reserves and resources Aker BP’s reserve evaluations are prepared in accordance with existing guidelines. These evaluations include many assumptions relating to factors such as initial production rates, recovery rates, production decline rates, ultimate recovery of reserves, timing and amount of capital expen-ditures, marketability of production, future prices of oil and gas, operating costs, and royalties and other government levies that may be imposed over the producing life of the reserves and resources. Actual production and cash flows will vary from these evaluations, and such variations could be material. Although the company understands the life expectancy of each of its assets, the life of an asset may be shorter than anticipated. Among other things, evaluations are based, in part, on the assumed success of activities intended to be undertaken in future years. The reserves, resources and estimated cash flows contained in such eva-luations will be reduced to the extent that such activities do not achieve the level of success assumed in the evaluations, and such reductions may have a material adverse effect on the company’s business, results of operations, cash flow and financial condition.

67 · Aker BP Annual Report 2020 · Board of Directors Report
Aker BP may be adversely affected by COVID-19 or other pandemicsThe COVID-19 pandemic has caused significant business dis-ruption globally, significant volatility in international debt and equity markets and significant disruption to the economy. Under such pandemics, Aker BP’s operations may experience delays or disruptions, such as the temporary suspension of operations at one or more of our operating facilities, with potentially negative impact on the company’s financial results. Moreover, such events may also have a negative impact on the demand for oil and gas and hence lead to lower oil and gas prices and reduced revenues for Aker BP.
Risk of cyber-attacks The company could be a target of cyber-attacks designed to penetrate the security of its network or internal systems, misappropriate proprietary information, commit financial fraud and/or cause interruptions to the company’s activities, including a reduction or halt in production. Such attacks could include, but not limited to, adversaries obtaining access to company systems, the introduction of malicious computer code or denial of service attacks. Such actual or perceived breaches of network security could adversely affect the company’s business performance, and reputation, and may create exposure to the loss of information, litigation, and possible liability.
Risk of changes in taxation and regulations There is no assurance that future political conditions in Norway will not result in the government adopting different policies for petroleum taxation. In the event of changes to this tax regime, it could lead to new investments being less attractive and challenge further growth of the company.
Furthermore, the amounts of taxes could also change signi-ficantly because of new interpretations of the relevant tax laws and regulations or changes to such laws and regulations. In addition, tax authorities could review and question the company’s tax returns leading to additional taxes and tax penalties which could be material.
The Norwegian Government has implemented a tax reform in Norway. The tax reform has, inter alia, led to a reduction in the general corporate tax rate, while the special petroleum tax rate has been increased. The overall effect of the rate changes for the petroleum sector is that the total marginal tax rate of 78% has remained unchanged. Further tax reform may result in changes in the Norwegian tax system (which may include changes in the tax treatment of interest costs and to withholding tax on interest payments) that may affect our current and future tax positions, net income after tax and financial condition.

68 · Aker BP Annual Report 2020 · Board of Directors Report
The company may require additional capital, which may not be available on favorable termsThe company’s future capital requirements depend on many factors, including whether the company’s cash flow from operations is sufficient to fund the company’s business plans. The company may need additional funds in the longer term to further develop exploration and development programs or to acquire assets or shares of other companies. In particular, the development projects require significant capital expen-ditures in the years to come. Even though the company has taken measures to ensure a solid financial basis for the development projects, the company cannot assure that it will be able to generate or obtain sufficient funds to finance the projects. Given the extensive scope of the projects, any unforeseen circumstances, or actions to be dealt with that are not accounted for, may result in a substantial gap between estimated and actual costs. Thus, the actual costs necessary to carry out the projects may be considerably hig-her than currently estimated. These investments, along with the company’s ongoing operations, may be financed partially or wholly with debt, which may increase the company’s debt levels above industry standards.
The company may also have to manage its business in a certain way to service its debt and other financial obligati-ons. Should the financing of the company not be sufficient to meet its financing needs, the company may, among other things, be forced to reduce or delay capital expenditures or research and development expenditures or sell assets
or businesses at unanticipated times and/or at unfavorable prices or other terms, or to seek additional equity capital or to restructure or refinance its debt. There can be no assu-rance that such measures would be successful or would be adequate to meet debt and other obligations as they come due or would not result in the company being placed in a less competitive position.
International and national policies, the general financial market conditions, stock exchange climate, interest level, the investors’ interest in the company and their preferences regarding exposure to oil and gas production, the share price of the company, as well as several other factors beyond the company’s control, may restrict the company’s ability to raise necessary funds for future growth and/or investments. Thus, additional funding may not be available to the company or, if available, may not be available on acceptable terms. If the company is unable to raise additional funds as needed, the scope of its operations may be reduced and, as a result, the company may be unable to fulfil its long-term development program, or meet its obligations under its contracts, which may ultimately be withdrawn or terminated for non-compli-ance. The company may also have to forfeit or forego various opportunities, curtail its growth and/or reduce its assets. This could have a material adverse effect on the company’s business, prospects, financial condition, results of operations and cash flows, and on the company’s ability to fund the development of its business.

69 · Aker BP Annual Report 2020 · Board of Directors Report
Risks related to interest rates and liquidity The company’s long-term debt is primarily based on fixed interest rates. The company has covenants related to its financial commitments. Failure to comply with financial covenants and other covenants may entail material adverse consequences, including the need to refinance, restructure, or dispose of certain parts of, the company’s businesses to fulfil the company’s financial obligations and there can be no assurances that the company in such event will be able to fulfil its financial obligations.
Risks related to changes in foreign exchange rates The company is exposed to market fluctuations in foreign exchange rates since the company reports profit and loss and the balance sheet in USD. Revenues are in USD for oil and in GBP and EUR for gas, while operational costs and investments are in several other currencies in addition to USD. Moreover, taxes are calculated and paid in NOK. The company actively manages its foreign currency exposure through a mix of forward contracts and options, however significant fluctuations in exchange rates between USD and NOK could adversely affect the liquidity position of the company. Volatility in exchange rates generally represents increased risk for the company.
Risk of counterparties being unable to fulfil their financial obligationsThe company’s partners and counterparties consist of a diverse group of companies with no single material source of credit risk. However, a general downturn in financial markets and economic activity may result in a higher volume of late payments and outstanding receivables, which may in turn adversely affect the company’s business performance, ope-rating results, cash flows and financial condition.
The company is vulnerable to adverse market perceptionsThe company is vulnerable to adverse market perception as it must display a high level of integrity and maintain the trust and confidence of investors, license participants, public authorities, counterparties, employees, and the society. Any mismanagement, fraud, or failure to satisfy fiduciary or regulatory responsibilities, allegations of such activities, or negative publicity resulting from such other activities, or the association of any of the above with the company could materially adversely affect our reputation and the value of our brand, as well as our business, results of operations, cash flows and financial condition, and our ability to attract and retain talent.
The company is dependent on realization of new technologies and digitizing the value chainTechnology and digitalization are important parts of the company’s strategy and we strongly believe those will contri-bute to Aker BP’s growth and improved efficiency. Inefficient, or mis-judged implementation of such technologies and digitalization could have a negative effect on expected value realization and the company’s strategy, reputation, cost pro-file, and safe operations. We also recognize that the develop-ment of new technologies and digitalisation may require additional funding and support beyond what is expected, and such consequences may adversely affect our reputation, cash flows, and potentially our financial condition.
Violation of anti-bribery, anti-corruption laws, or compliance riskAnti-bribery, anti-corruption, including tax-evasion and anti-money laundering laws, and other compliance require-ments apply to the company, potential future joint ventures, and associates, in countries in which we do business. Any violation of such laws, regulations, and requirements could have a material adverse effect on our cash flows, financial condition, and reputation.
The company is dependent on attracting and retaining talent The company operates in a competitive environment, and its future growth prospect depends upon its ability to access executive and senior management and key personnel. Executive or senior personnel may terminate employment with the company rendering certain knowledge and skills in shortage. Large numbers of personnel leaving the company in a short timeframe could be a significant challenge to replace or find alternatives to recover. If we are unable to fill positions and retain executive and senior management and key personnel with needed skills and expertise, it could have a longer-term adverse effect on our business, financial position, and results of operations.
Company financial reporting routines – errors and omissions riskAlthough the company continuously strive for accurate, transparent, and comprehensive financial reporting, errors and omissions may penetrate our control mechanisms. Such errors and omissions, should they be significant, could drain senior management attention and require measures diver-ting efforts and prospects for growth. Inaccuracies could adversely affect our strategic decision making, productivity, slow growth and therefore may impact our cash flows and financial condition. The company’s reputation and goodwill could also be adversely affected.

70 · Aker BP Annual Report 2020 · Board of Directors Report
The company may be exposed to more stringent HSSE laws and regulationsThe company’s operations are subject to extensive HSSE regulatory requirements that may change and are likely to become more stringent over time. Government could require operators to adjust their future production plans, effecting production and costs related to development projects and our operations. We could incur additional costs in the future due to compliance with these requirements or because of violations of, or liabilities under, laws and regulations, such as fines, penalties, clean-up costs and third-party claims. Therefore, HSSE risks, should they materialise, may result in material negative effect to our financial condition.
The company may be subject to insufficient insurance coverageThe company could be subject to losses from risks related to insufficient insurance. The company’s insurance policy is continually renewed and negotiated through agents and the market. The company could face a situation where the coverage either is not sufficient or the policy does not grant coverage, which may result in material negative effects to the company’s financial condition. The company could also face a situation where changed practices in the insurance industry in response to the issue of climate change could reduce the company’s ability to achieve full insurance coverage.
The company may be engaged in litigation arising from other risk factorsThe company may face litigation arising from other risk factors. Litigation in a variety of jurisdictions could result in substantial costs (including civil or criminal penalties, or both, damages, or the imposition of import trade measures), requ-ire the company to devote substantial resources and divert management attention, which may result in a negative effect on the financial condition.
EVENTS AFTER THE REPORTING PERIOD On 19 January 2021, Aker BP was offered ten new licenses, including eight operatorships in the Awards in Predefined Areas (APA) 2020 licensing round.
On 18 February 2021, Aker BP disbursed USD 112.5 million in dividends to shareholders.

71 · Aker BP Annual Report 2020 · Board of Directors Report
The Board of Directors of Aker BP ASA Akerkvartalet, 18 March 2021
ØYVIND ERIKSENChairman
KJELL INGE RØKKEBoard member
ANNE MARIE CANNONDeputy chair
MURRAY AUCHINCLOSSBoard member
TROND BRANDSRUDBoard member
GRO KIELLANDBoard member
INGARD HAUGEBERGBoard member
KATE THOMSONBoard member
ANETTE HOEL HELGESENBoard member
ØRJAN HOLSTADBoard member
TERJE SOLHEIMBoard member
KARL JOHNNY HERSVIKChief Executive Officer
SIGNATURE PAGE
BOARD OF DIRECTORS

72 · Aker BP Annual Report 2020 · Reporting of Payments to Governments
REPORTING OF PAYMENTS TO GOVERNMETSThis report is prepared in accordance with the Norwegian Accounting Act Section § 3-3 d) and Securities Trading Act § 5-5 a). It states that companies engaged in activities within the extractive industries shall annually prepare and publish a report containing information about their payments to governments at country and project level. The Ministry of Finance has issued a regulation (F20.12.2013 nr 1682 – ”the regulation”) stipulating that the reporting obligation only apply to reporting entities above a certain size and to payments above certain threshold amounts. In addition, the regulation stipulates that the report shall include other information than payments to governments, and it provides more detailed rules applicable to definitions, publication and group reporting.
The management of Aker BP has applied judgment in the interpretation of the wording in the regulation with regard to the specific type of payment to be included in this report, and on what level it should be reported. When payments are required to be reported on a project-by-project basis, it is reported on a field-by-field basis. Only gross amounts on operated licences are reported, as all payments within the licence performed by non-operators will normally be cash calls transferred to the operator and will as such not be pay-ments to the government.
As of 2020, the company had activities related to the Norwegian Continental Shelf only. Hence, the tax and fees referred to in this report, are fully paid to Norwegian governments.
Reporting of paymentsThe regulation’s Section 2 no. 5 defines the different types of payments subject to reporting. In the following sections, only those applicable to Aker BP will be described.
Income taxThe income tax is calculated and paid on corporate level and is therefore reported for the whole company rather than licence-by-licence. Net tax refunds in 2020 of NOK 1 540 823 495 (including interest) are mainly related to tax instalments for the income year 2019 and tax refunds for the income year 2020.
CO2 taxCO2 tax is to some extent included in the fuel price/rig rental paid to external rig companies. The CO2 tax paid on the Alvheim field includes the fields tied in to the Alvheim FPSO (Vilje, Volund, Bøyla and Skogul) as Alvheim performs the payment and charges the other fields via opex share. The CO2 tax paid on the Ula field is partly charged to Tambar through a tariff.
Name of field/license CO2 tax paid in 2020 (NOK)
Alvheim 90,243,742
Ivar Aasen 9,569,717
Hod 186,801
Valhall 14,436,091
Ula 95,995,629
Skarv 176,566,217
Total CO2 tax paid 386,998,196
NOx
The company is member of the NOx fund and all NOx pay-ments are made to this fund rather than to the government.

73 · Aker BP Annual Report 2020 · Reporting of Payments to Governments
Area feeThe table below specifies the area fee paid by Aker BP on behalf of the different licences in 2020. Licenses of which the company has received net refund of area fee are not included in the figures.
Name of field/license Area fee paid in 2020 (NOK)
Alvheim 12,240,000
Bøyla 3,589,000
Hod 2,695,000
Ivar Aasen 101,213
Skarv 20,043,000
Skogul 306,000
Tambar 1,683,000
Ula 6,014,000
Valhall 8,624,000
Vilje 931,000
Volund 765,000
PL 019C 1,519,000
PL 036E 965,254
PL 102D 16,524,000
PL 102F 3,978,000
PL 127C 4,896,000
PL 146 13,311,000
PL 159D 1,071,000
PL 212E 2,142,000
PL 242 2,448,000
PL 261 10,404,000
PL 442 9,975,000
PL 685 29,279,469
PL 858 84,829,326
238,333,262
Other information required to be reportedWhen companies are required to report payments as the above, it is also mandatory to report on investments, sales income, production volumes and purchases of goods and services in the country in which companies have activities within the extractive industries. As mentioned above, Aker BP operates on the Norwegian Continental Shelf only. This reporting requirement is therefore deemed to be met by the financial statements as specified below:
• Total net investments amounted to USD -1 500 710 thousand, as specified in the cash flow analysis in the financial statements.
• Sales income (Petroleum revenues) in 2020 amounted to USD 2 868 153 thousand, as specified in Note 4 to the financial statements
• Total production in 2020 was 77 101 thousand barrels of oil equivalents, see Note 5 to the financial statements
• For information about purchases of goods and services, reference is made to the Income Statement and the related notes

74 · Aker BP Annual Report 2020 · BOD's Report on Corporate Governance
BOARD OF DIRECTORS REPORT ON CORPORATE GOVERNANCEAker BP ASA (Aker BP) aims to ensure the greatest possible value creation to shareholders and society over time in a safe and prudent manner. A good mana-gement and control model with a clear division of responsibility and roles between the owners, represented by the shareholders in the General Meeting, the Board of Directors and corporate management is crucial to achieve this.
1. IMPLEMENTATION AND REPORTING ON CORPORATE GOVERNANCE
The Board of Aker BP is responsible for actively adhering to sound corporate governance standards.
Aker BP is a Norwegian public limited liability company (ASA), listed on Oslo Børs and established under Norwegian laws. In accordance with the Norwegian Accounting Act, section 3-3b, Aker BP includes a description of principles for corporate governance as part of the Board of Directors’ Report in the annual report or alternatively makes a refe-rence to where this information can be found.
The Norwegian Corporate Governance Board (NCGB) has issued the Norwegian Code of Practice for Corporate Governance (the Code of Practice). The Code of Practice can be found on www.nues.no. Adherence to the Code of Practice is based on the “comply or explain” principle, which means that a company must comply with all the recommen-dations of the Code of Practice or explain why it has chosen an alternative approach to specific recommendations.
Oslo Børs requires listed companies to publish an annual statement of their policy on corporate governance in accor-dance with the Code of Practice in force at the time. Issuer Rules for companies listed on Oslo Børs is available at www.euronext.com/en/markets/oslo.
Aker BP complies with the current edition of the Code of Practice, issued on 17 October 2018, unless otherwise specifically stated. The following statement on corporate governance is structured in the same way as the Code of
Practice, thus following the 15 chapters included in the Code of Practice.
More detailed reporting on corporate governance issues can be found on our website www.akerbp.com, in this Annual report and in our Sustainability/ESG report.
Deviations to the code: None
2. BUSINESSAccording to Aker BP’s Articles of Association article 3, its objective is ”to carry out exploration for, and recovery of, petroleum and activities related thereto, and, by subscribing for shares or by other means, to participate in corresponding businesses or other business, alone or in cooperation with other enterprises and interests”. Further information about the Articles of Association is available at the company’s website.
Through an annual strategy process, the Board defines and evaluates the company’s objectives, main strategies, and risk profiles for the company’s business activities such that the company creates value for shareholders. Environmental, social and governance issues are an important part of the Board’s annual strategy process. Together with the compa-ny’s financial status, the objectives of the company are communicated to the market.
It is Aker BP’s vision to create the leading independent offs-hore exploration and production (E&P) company. To achieve this, the company will carry out exploration, development and production activities and be opportunistic in its appro-ach to M&A, including buying and selling interests in compa-nies, fields, and discoveries.

75 · Aker BP Annual Report 2020 · BOD's Report on Corporate Governance
In the beginning of 2020, the spread of the COVID-19 pande-mic created increased uncertainty and disruption to the global economy. Throughout the year, the Board’s objective has been to make sure that Aker BP took all necessary measures to protect its people and operations from the virus, and to make sure the company is prepared to handle the potential operational and financial consequences of the situation.
As described in the Board of Directors’ report, the company rapidly mobilized its Incident Command System to further strengthen the response to protect the health and safety of the company’s employees and contractors, and to maintain safe and reliable operations. The company’s policies and procedures have proved effective and will remain in place for as long as necessary.
An updated business plan was communicated to the market in March 2020. All non-sanctioned field development projects were put on hold, exploration spending and production costs were reduced, and the original dividend plan was retracted.
Following the temporary changes to the Norwegian petro-leum tax system, enacted by the Norwegian parliament in June 2020, the company decided to resume its investment plans. The changes and developments to the company’s business plan have been communicated throughout the year, following Aker BP’s procedures for information and commu-nications (see chapter 13). The company’s latest business plan was communicated at its annual Capital Markets Update on 4 February 2021.
In 2020, the company’s Code of Conduct has been updated to ensure that employees, hired personnel, consultants and others acting on behalf of Aker BP, operate in a consistent
manner with respect to ethics and good business practice. The Code of Conduct clarifies the company’s fundamental ethical values and is a guideline for those making decisions on behalf of the company. During the year, Aker BP has also published a Human rights policy to clarify its human rights commitments and describe how the company manages human rights impacts in the supply chain and across its ope-rations. The Code of Conduct and the Human rights policy are both available on the company’s website.
The company demonstrates responsibility through actions, the quality of its work, the projects, and products and all its activities. The company’s ambition is that business activities shall integrate social, ethical, and environmental goals and measures. As a minimum, Aker BP will comply with laws, regulations, and conventions in the areas where the company operates, but the established set of ethical guidelines extends beyond such compliance. Established procurement procedures secure non-discrimination and transparency in the procurement processes. Aker BP has established an anti-corruption compliance program, and it is also stated in the Code of Conduct that no form of corruption is tolerated. Aker BP’s Anti-Corruption Policy sets out in more detail the company’s expectations with regard to the actions of Aker BP Representatives and Business Partners and is available on the company’s website.
In addition, the company has a sponsorship policy and pro-gram to promote the company and its activities. Guidelines for the use of sponsorships are included in the sponsorship policy and in the Code of Conduct. Aker BP supports measures that improve the company’s brand and profile, and measures that can be for the benefit of the employees. Information about ongoing sponsorships are available on the company’s website.

76 · Aker BP Annual Report 2020 · BOD's Report on Corporate Governance
The company integrates considerations related to its stake-holders into its value creation and shall achieve its objectives in accordance with the Code of Conduct. In Aker BP’s annual Sustainability Report, the company describes its business acti-vities in terms of sustainability performance and development, including information on matters that relate to human rights, employee rights and social matters, the external environment, the prevention of corruption, the working environment, equal treatment, discrimination and environmental impact. The report is available on the company’s website.
Deviations to the code: None
3. EQUITY AND DIVIDENDS The Board seeks to optimize the company’s capital structure by balancing risk, return on equity against lenders’ security and liquidity requirements. The company aims to have a good reputation in all debt and equity markets. The Board continuously evaluates the company’s capital structure, ensuring a capital and debt structure that is appropriate to the company’s objective, strategy, and risk profile. This invol-ves monitoring available funding sources and related cost of capital. It is the company’s goal that over time, Aker BP’s sha-reholders shall receive a competitive return on their invest-ment through increased share price and cash dividends. The Annual General Meeting (AGM) in April 2020 authorized the Board to approve the distribution of dividends based on the approved annual accounts for 2019. The background of this proposal was to facilitate the company’s aim to distribute dividends quarterly.
In 2020, the company paid USD 425 million in dividends to shareholders, after retracting its original dividend plan as a
response to the weak oil market and high uncertainty in the global economy following the COVID-19 pandemic.
The company’s dividend policy is an integrated part of its overall capital allocation framework, together with and dependent on its financing and investment policies. The ambition is to provide a reliable dividend which grows in line with Aker BP’s long-term value creation. Aker BP pays dividends in cash on a quarterly basis.
The company’s financial liquidity is considered to be good with cash and cash equivalents of USD 538 million and undrawn amounts on committed credit facilities of USD 4 billion as at 31 December 2020.
Aker BP is currently rated by three rating agencies, S&P, Fitch, and Moody’s. S&P Global Ratings has assigned a BBB- long-term corporate credit rating with stable outlook. Fitch has also assigned a BBB- rating with stable outlook. In February 2021, Moody’s upgraded its rating of Aker BP, assigning a Baa3 long-term issuer rating with stable outlook. With this, all three rating agencies have assigned Investment Grade credit ratings to Aker BP.
As demonstrated during 2020, the company is able to make necessary adjustments in investment plans and shareholder distributions to protect the liquidity and the robustness of its balance sheet, and to retain its investment grade (IG) credit profile.
At year-end 2020, the company’s book equity was USD 2.0 billion, which represents 16 percent of the balance sheet total of USD 12.4 billion. The market value of the compa-ny’s equity was USD 9.1 billion (NOK 77.9 billion) on 31 December 2020.

77 · Aker BP Annual Report 2020 · BOD's Report on Corporate Governance
In April 2020, the AGM authorized the Board to increase the share capital by a maximum of NOK 18,005,675, represen-ting up to five percent of the total share capital at the time of such meeting. The authorization can be utilized for share capital increases to strengthen the company’s equity, con-vert debt into equity and fund business opportunities. At 31 December 2020, the mandate had not been used.
The AGM in April 2020 also provided the Board with a mandate to acquire company shares equivalent to up to five percent of the total share capital at the time of such meeting. The purpose for this mandate was i) utilization as transaction currency in connection with acquisitions, mergers, demer-gers or other transactions, ii) of investment or for subsequ-ent sale or cancellation of such shares and iii) in connection with the share savings plan for employees. The mandate is valid until the AGM in 2021. At 31 December 2020, the mandate had only been used in part and in connection with the share savings plan for employees. The company’s employees subscribed for a total of 1,014,155 shares (0.28 percent of total shares outstanding). After delivery of these shares, Aker BP held 3,294 shares.
Deviations to the code: None
4. EQUAL TREATMENT OF SHARE-HOLDERS AND TRANSACTIONS WITH CLOSE ASSOCIATES
The company has one class of shares and all shares carry the same rights.
When the company considers it to be in the best interest of shareholders to issue new equity there is a clear objective to limit the level of dilution. Aker BP will carefully consider alternative financing options, its overall capital structure, the purpose and need for new equity, the timing of such an offe-ring, the offer share price, the financial market conditions and the need for compensating existing shareholders in the event that pre-emption rights are waived. Arguments for waiving pre-emption rights will be clearly stated.
If the Board decides to use its current authorization to re-purchase company shares, the transactions will be car-ried out through the stock exchange or at prevailing stock exchange prices if carried out in any other way.
At 31 December 2020, Aker ASA (Aker) owned 40 percent and bp p.l.c. owned 30 percent of Aker BP. Aker and bp p.l.c. accounts for Aker BP in accordance with the equity method.
Aker BP is committed to equal treatment of all shareholders. The Board is of the view that it is positive for Aker BP that Aker and bp p.l.c. assume the role of active owners and are actively involved in matters of major importance to Aker BP and to all shareholders. The cooperation with Aker and bp p.l.c. offers Aker BP access to expertise and resources within upstream business activities, HSSEQ, technology, strategy, transactions, and funding. It may be necessary to offer Aker and bp p.l.c. special access to commercial information in connection with such cooperation. Any information disclo-sed to Aker’s and bp p.l.c.’s representatives in such a context will be disclosed in compliance with the laws and regulations governing the stock exchange and the securities market.
Applicable accounting standards and regulations require Aker and bp p.l.c. to prepare their consolidated financial state-ments to include accounting information of Aker BP. Aker BP is considered an associate of Aker and bp p.l.c. under the applicable accounting standard. To comply with these acco-unting standards, Aker and bp p.l.c. have in the past recei-ved, and will going forward receive, unpublished accounting information from Aker BP. Such distribution of unpublished accounting information from Aker BP to Aker and bp p.l.c. is executed under strict confidentiality and in accordance with applicable regulations on the handling of inside information.
The Board recognizes Aker’s and bp p.l.c.’s contribution as active shareholders. Investor communication seeks to ensure that any shareholders can contribute, and management will actively meet with and seek the views of shareholders.
Aker BP has no related parties, as defined in the Public Limited Liability Company Act (Allmennaksjeloven). The company has nevertheless established policy for transacti-ons with such parties and extended these to include Aker. This policy requires that any material business acquisitions or agreements with Aker (or its related parties) which are not part of Aker BP’s ordinary course of business are subject to an independent valuation. The Board of Directors and executive management are very conscious that all relations with Aker and bp p.l.c., their subsidiaries and other compa-nies in which Aker or bp p.l.c. have ownership interests or entities they have significant control over, shall be premised on commercial terms and are entered into on an arm’s length basis. Transactions with Aker and bp p.l.c. controlled compa-nies are described in the financial statements’ disclosure about transactions with related parties.
Deviations to the code: None

78 · Aker BP Annual Report 2020 · BOD's Report on Corporate Governance
5. SHARES AND NEGOTIABILITYAker BP’s shares are freely negotiable securities and the company’s Articles of Association do not impose any form of restriction on their negotiability.
The company’s shares are listed on Oslo Børs and the company works actively to attract the interest of new Norwegian and foreign shareholders. Strong liquidity in the company’s shares is essential if the company is to be viewed as an attractive investment and thus achieve a low cost of capital.
Deviations to the code: None
6. GENERAL MEETINGSThe General Meeting of shareholders is the company’s hig-hest authority. The Board strives to ensure that the General Meeting is an effective forum for communication between the shareholders and the Board and encourages sharehol-ders to participate in the meetings.
The Board can convene an extraordinary General Meeting at any time. A shareholder or a group holding at least five percent of the company’s shares can request an extraordi-nary General Meeting. The Board is then obliged to hold the meeting within one month of receiving the request.
Preparation for General MeetingsThe AGM is normally held before the end of April each year, and no later than the end of June, which is the latest date permitted by the Public Limited Liability Companies Act. The date of the next AGM is normally included in the company’s financial calendar, which is available at the company’s website.
The notice of a General Meeting is sent to shareholders and published on the company’s website and the stock exchange, no later than 21 days prior to the meeting.
Article 7 of the company’s Articles of Association, about the General Meeting, stipulates that documents concer-ning matters to be considered by the General Meeting will be made available to the shareholders on the company’s website. This also applies to documents that are required by law to be included in or enclosed with the notice of the General Meeting.
The supporting documentation provides the necessary information for shareholders to form a view on the matters to be considered.
Participation in a General MeetingAll shareholders are entitled to participate in the general meeting. According to Article 7 in the Articles of Association, the right to attend and vote at the General Meeting can only be exercised when the share transaction is recorded in the shareholder register no later than the fifth business day prior to the General Meeting (registration date).
Shareholders who are unable to attend a General Meeting are encouraged to vote by proxy or in writing, and instructi-ons for how to do this are included with the notice. Voting and appointment of proxy can also be done electronically through the VPS web portal. Separate voting instructions can be given for each matter to be considered by the mee-ting. The deadline for registration is set as close as possible to the date of the meeting, normally the day before.
For the 2021 General Meeting in particular, the share-holders are encouraged to vote electronically due to the COVID-19 pandemic.
Conduct of a General Meeting and agenda for AGMThe Board proposes the agenda for the AGM. The main agenda items are determined by the requirements of the Public Limited Liability Companies Act and Article 7 in the company’s Articles of Association.
Before the AGM, the Board will nominate a person who can vote on behalf of shareholders as their authorized represen-tative. Shareholders may cast their votes in writing, including by means of electronic communication, in a period prior to the General Meeting. Appropriate arrangements are made for shareholders to be able to vote on each individual matter.
The chair of Aker BP’s General Meetings is elected by the General Meeting itself.
The Code of Practice states that it is appropriate that all members of the Board should attend General Meetings. Representatives from the Board, the nomination committee, the auditor, and the executive management will attend the AGM.
Minutes of General Meetings are published on the compa-ny’s website and through a stock exchange announcement.
Deviations from the code: The Code of Practice recommends that all members of the Board are present at the General Meeting and that the chairman of the Nomination Committee should attend the AGM. Due to the nature of discussions at General Meetings, Aker BP has not deemed it necessary to require all Board members and the chairman of the Nomination Committee to be present.

79 · Aker BP Annual Report 2020 · BOD's Report on Corporate Governance
7. NOMINATION COMMITTEEArticle 8 in the company’s Articles of Association stipula-tes the composition of and states the main duties of the Nomination Committee.
The company’s Nomination Committee shall consist of three members elected by the General Meeting. The Nomination Committee should be composed in such a way that it repre-sents a wide range of shareholders’ interests, and if possible, both genders should be represented. More than half of the members shall be independent of the Board and the exe-cutive management, and the members shall be elected for a period of two years at a time.
The Nomination Committee shall propose candidates for - and remuneration to - the Board of Directors and the Nomination Committee and justify its recommendation for each candidate separately. The Nomination Committee’s recommendations shall be well-grounded. When repor-ting its recommendations to the General Meeting, the Nomination Committee provides an account of how it has carried out its work.
The Nomination Committee ensures that the shareholder’s views are taken into consideration when candidates are proposed. The committee also ensures that the proposed composition of the Board covers all relevant fields of compe-tence, and that the requirement of at least 40 percent of each gender on the Board is met.
Shareholders have an opportunity to submit proposals to the committee. The electronic mailbox for submitting proposals to the committee, with deadlines for submitting proposals where such apply, is accessible through the company’s web-site at http://www.akerbp.com/proposecandidate.
At the AGM in April 2020, Svein Oskar Stoknes was elected as the Chair of the Nomination Committee for two years. Ingebret Hisdal and Donna Riley were elected as members of the Nomination Committee for two years. No members of the committee are members of executive management or the Board of Aker BP.
Deviations from the code: None
8. BOARD OF DIRECTORS: COMPOSITION AND INDEPENDENCE
The Board of Aker BP consisted of eleven members at 31 December 2020. The company’s Articles of Associations Article 5 stipulates that the Board shall consist of up to eleven members. As required for all Norwegian public limited liability companies, each gender shall be represented by at least 40 percent of the Board members.

80 · Aker BP Annual Report 2020 · BOD's Report on Corporate Governance
The general meeting elects the Board members and Chairman of the Board. The term of office for members of the Board is two years at a time.
Among the shareholder-elected Board members, two (Kjell Inge Røkke and Øyvind Eriksen) are affiliated with the company’s largest shareholder Aker, and two (Murray Auchincloss and Kate Thomson) are affiliated with the company’s second largest shareholder bp p.l.c. All other Board members are considered independent of the compa-ny’s two main shareholders, as well as of the company’s material business contacts. All Board members are conside-red independent of the company’s executive personnel.
In 2020, the Board conducted a total of 11 Board meetings. Participation was 91 percent.
The Board composition ensures alignment of interests with all shareholders and members of the Board are encouraged to own shares in the company. It is the Board’s view that the Board collectively meets the need for expertise, capacity, and diversity. Aker BP’s Board members possess strong experience from the oil and gas industry in general, and from reservoir engineering, exploration, and field developments in particular, as well as from banking and finance.
An overview of the expertise of the Board members is availa-ble on the website: https://akerbp.com/en/board-of-directors.
Deviations from the code: None
9. THE WORK OF THE BOARD OF DIRECTORS
The Board has authority over and is responsible for super-vising the company’s business operations and management and has adopted a yearly plan for its activities. The Board handles matters of major importance, or of an extraordinary nature and may in addition require management to refer any matter to it. The objectives of the Board’s work are to create value for the company’s shareholders in both the short and long term and to ensure that Aker BP fulfils its obligations. An important task for the Board is to appoint the CEO and while the CEO is responsible for the day-to-day management of the company’s business activities, the Board acknowled-ges its responsibility for the overall management of the company. The Board is responsible for:
A. Drawing up strategic plans and supervising these through regular reporting and reviewing,
B. Identifying significant risks to Aker BP’s activities and establishing appropriate systems to monitor and manage such risks,
C. Ensuring that shareholders have access to timely and cor-rect information about financial circumstances and important business-related events in accordance with relevant legisla-tion, and
D. Ensuring the establishment and securing the integrity of the company’s internal control and management systems.
The Board recognizes the significant risks associated with operations. Consequently, the Board has dedicated signifi-cant resources and time to understand and discuss not only general risks facing an E&P company, but also inherent risks connected to organization, culture, and leadership. For a company like Aker BP, the Board views the risks in taking on an operated development project and meeting the required financing for its entire portfolio as well as taking on operated assets, to be among the most significant risks. Accordingly, this is where the mitigating efforts are concentrated.
The work of the Board is based on the rules of procedure describing the Board’s responsibility including the division of roles between the Board and the CEO. There are specific instructions to guide the work of the CEO. The CEO, CFO and the company secretary attend all Board meetings. Other members of the company’s executive management attend the Board meetings by invitation and as necessary due to specific matters. If the Chair of the Board has been perso-nally involved in matters of a material character, the Deputy Chair takes over the tasks of the chair directing the Board’s work in the specific matter.
Considering the size of the company and the scope of its activities, the Board finds it appropriate to keep all Board members informed about all Board matters, except for cases where Board members may have conflicting interests with the company.
The Board regularly carries out self-evaluations of its own performance, including evaluations of the Board’s compe-tence and potential areas for strengthening this compe-tence. The head of the Audit and Risk Committee conducts one-on-one discussions with all board members as part of these self-evaluations. The latest self-evaluation was carried out by the Board at the turn of the year, and the results of the self-evaluations are communicated to and used by the Nomination Committee in its work.
The Board ensures that board members and executive personnel make the company aware of any material interests that they may have in items to be considered by the board of directors. The company’s Code of Conduct provides clear guidelines as to how employees and representatives of the company’s governing bodies should act in situations where there is a risk of conflicts of interest and partiality.

81 · Aker BP Annual Report 2020 · BOD's Report on Corporate Governance
Audit and Risk CommitteeThe Board has established an Audit and Risk Committee consisting of the following Board members:
• Trond Brandsrud, Chair • Anne Marie Cannon• Kate Thomson
All members are independent of the company’s executive management. Anne Marie Cannon sits on the Board of Directors in Aker Energy AS, which is 50 percent owned by Aker (the largest shareholder in Aker BP). Kate Thomson is SVP Finance for Other Business & Corporate at bp p.l.c.
The Chair of the Audit and Risk Committee is considered to have experience and formal background qualifying as “financial expert” according to the requirement stated in the Public Limited Liability Company Act. In the period 2016-2017 Trond Brandsrud was Chief Financial Officer at Lindorff. From 2010 to 2015, he was the Chief Financial Officer of Aker ASA. He has also been Chief Financial Officer in Seadrill, and he has held several leading financial positions in Shell for 20 years, both in Norway and globally.
The Audit and Risk Committee holds regular meetings and reviews the quality of all interim and annual reports before they are reviewed by the Board of Directors and then publis-hed. In 2020, the committee held 8 meetings.
The company’s auditor works closely with the Audit and Risk Committee and attended all meetings during the year. The committee also oversees the company’s financial risk management and monitors and reviews the company’s busi-ness risk. The Audit and Risk Committee oversees Aker BP’s anti-corruption compliance program and handling of reports submitted via the company’s whistleblowing channel.
The management and the Audit and Risk Committee evaluate the risk management on financial reporting and the effective-ness of established internal controls. Identified risks and effe-cts of financial reporting are discussed on a quarterly basis.
It is the view of the committee that cooperation between the auditor and executive management is good. The Audit and Risk Committee has worked together with executive management and the auditor to improve the internal con-trol environment according to the principles of the COSO (Committee of Sponsoring Organizations of the Treadway Commission) framework over the last 4 years.
Oversight of HSSE and operational risksThe oversight of health, safety, security, and environmental matters (HSSE) is retained directly by the Board. HSSE-issues, including cyber security, is at the top of the agenda in every single Board meeting.

82 · Aker BP Annual Report 2020 · BOD's Report on Corporate Governance
In addition, the Board has established a committee to strengthen the administration work on health, safety, cyber security, and environmental matters. The committee reports to the Board on a quarterly basis and consist of the following eight members:
• Fawaz Bitar, Senior Vice President (SVP) HSE & carbon, bp p.l.c. – Chair of the committee
• Karl Johnny Hersvik, CEO, Aker BP• Marit Blaasmo, SVP HSSEQ, Aker BP• Ine Dolve, SVP Operations & Asset Development, Aker BP• Knut Sandvik, SVP Projects, Aker BP• Mike Zanghi, Vice President (VP) Safety and Operational
Risk assurance (S&ORA) wells, bp p.l.c.• Emeka Emembolu, SVP North Sea, bp p.l.c.• Tommy Sigmundstad, SVP Drilling and Well, Aker BP• Gemma Maclellan, Business Advisor, HSE & carbon, bp p.l.c.• Dave Roberts, Business Manager Aker BP, bp p.l.c.
The committee reviews risks related to operating activities. The committee shares experiences and practices in the HSSE area, learnings from incidents and aligns leadership experiences on common areas of focus in relation to management of safety and operational risks. In 2020, the committee held 4 meetings.
Compensation and Organizational Development CommitteeThe Board has a Compensation and Organizational Development Committee consisting of the following three Board members:
• Øyvind Eriksen, Chair • Gro Kielland • Terje Solheim
The Compensation and Organizational Development Committee is established to ensure that remuneration arran-gements support the strategy of the business and enable the recruitment, succession planning and leadership develop-ment, and motivation and retention of senior executives. It needs to comply with the requirements of regulatory and governance bodies, satisfy the expectations of shareholders and remain consistent with the expectations of the wider employee population. Further, the committee shall ensure that the overall organizational structure is set up to deli-ver on the company’s strategy going forward. In 2020, the committee held four meetings.
In addition to the Audit and Risk Committee and Compensation and Organizational Development Committee, the Board may appoint various ad hoc sub-committees when required, with a limited timeframe and scope. The authority of a sub-committee is limited to preparing items and making recommendations to the Board.
Deviations from the code: None
10. RISK MANAGEMENT AND INTERNAL CONTROL
Risk Management Appropriate internal control and risk management contri-butes to transparency and quality reporting for the benefit of the company, stakeholders, shareholders’ long-term interests and operational excellence as an operator on the Norwegian Continental Shelf.

83 · Aker BP Annual Report 2020 · BOD's Report on Corporate Governance
The company continuously and systematically operates a robust and transparent risk management process throughout the organization. The purpose of the process is to enable the company to maximize opportunities, minimize threats and optimize achievements of business objectives.
As of 2020, the company’s operational activities are limited to Norway and are subject to Norwegian regulations. All activities taking place in a production license are subject to supervision and audits from governmental bodies (e.g. the Petroleum Safety Authority Norway (Norwegian PSA), the Norwegian Environment Agency, and license partners.
The Board considers risk in the context of growing a sustainable business while meeting governance, safety and accountability expected by stakeholders. The Board and the Audit and Risk Committee regularly review major risks identi-fied and communicated through the company Enterprise Risk Management process.
The Business Management System (BMS) is the company’s framework for creating and sustaining value, trust, and predictability. BMS describes how Aker BP works, controls risk and improves. The BMS describes approximately 300 business processes supplemented by governing documents, requirements, and descriptions. Based on findings and feed-back from comprehensive work carried out in during 2019 and 2020, a project has been initiated to acquire, configure, and migrate existing BMS content to a new and modern management system software platform. The new BMS sys-tem platform will be implemented across all business units.
Risk-based assurance of conformity to the business mana-gement system requirements is governed by the company’s “Three lines of assurance” model. An improved framework for Aker BP’s “Three lines of assurance” has been introduced in 2020 and is continually under improvement with regards to processes and tools to enhance execution.
Internal control for financial reportingAker BP has established a framework for Internal Control for Financial Reporting based on the principles of the Committee of Sponsoring Organizations of the Treadway Commission (COSO) and is operationalized as follows:
• Internal Control Environment• Risk Assessment• Risk Response and Control Activities• Information and communication• Monitoring
The established framework is an integrated part of the compa-ny’s management system. The company’s internal control environment is characterized by clearly defined responsibilities and roles between the Board of Directors, Audit and Risk committee and management. The implemented procedure for financial reporting is integrated with the company’s mana-gement system, including ethical guidelines that describe how the representatives of the company must act. Aker BP’s Anti-Corruption Policy and Speak-up policy provide additional control mechanisms to address and detect deviations.
The company has established processes, procedures, and controls for financial reporting, which are appropriate for an exploration and production company. The company’s docu-mented procedures are designed to provide:
• Effective and appropriate identification and mitigation of financial reporting risks
• Measurement of compliance against procedures• Appropriate segregation of duties• Provision of relevant, timely and reliable financial repor-
ting that provides a fair view of Aker BP’s business • Safeguard against fraudulent manipulation of reported
figures• Compliance with all relevant requirements of IFRS
A risk assessment related to financial reporting is perfor-med and documented by management and reviewed by the Audit and Risk Committee, which also performs a quarterly risk review of business risks. The Committee reports any findings or deviations to the Board of Directors. In 2020, the following main risk areas were identified related to financial reporting:
• Impairment of goodwill, tangible and intangible assets – There is a risk that reductions in recoverable values below book values are not identified and recorded in an appropriate manner
• Tax – Complexity in tax regulations and calculation entail risk of error in financial reporting
• Asset retirement obligation - There is a risk of errors in the estimates and calculations during the ARO process
The company seeks to communicate transparently on its activities and its financial reporting based on significant interaction between financial reporting management and management responsible for exploration, development, pro-duction, and decommissioning activities in the business.

84 · Aker BP Annual Report 2020 · BOD's Report on Corporate Governance
Key events that may affect the financial reporting are identi-fied and monitored continuously. Judgmental items regarding the financial reporting and tax consideration are presented to the Audit and Risk Committee at least on a quarterly basis.
The Finance Department monitors the compliance with established procedures and reports any material deviations to the Audit and Risk Committee. It also identifies actions to improve procedures and conducts a self-assessment of its performance against objectives, which are then presented and discussed with the Audit and Risk Committee.
Deviations from the code: None
11. REMUNERATION OF THE BOARD OF DIRECTORS
The remuneration of the Board members is not perfor-mance-based but based on a fixed annual fee. None of the shareholder-elected Board members have pension schemes or termination payment agreements with the company. The company does not grant share options to members of the Board. Information about all remuneration paid to individual Board members is provided in Note 7 to the annual accounts.
The General Meeting decides the remuneration of the Board and the sub-committees. The Nomination Committee proposes the remuneration of the Board to the General Meeting and ensures that it reflects the responsibility of its members and the time spent on Board work. The Board must approve any Board member’s consultancy work for the company and remuneration for such work. No such work was carried out during 2020.
Deviations from the code: None
12. REMUNERATION OF EXECUTIVE PERSONNEL
The Board makes guidelines for executive remuneration, including the CEO’s remuneration and other terms and conditions of employment. These guidelines set out the main principles applied in determining the salary and other remuneration of executive personnel and are addressed as a separate item at the General Meeting. Note 7 to the annual accounts contains details about the remuneration of the Board and Executive Management Team (EMT), including payroll, bonus payments and pension expenses.
Members of EMT are covered under the same budget, guide-lines, and limitations as onshore Aker BP employees. The CEO base salary is determined by the Board.

85 · Aker BP Annual Report 2020 · BOD's Report on Corporate Governance
The bonus for all employees, including the EMT, is determi-ned by the performance on a set of company-wide perfor-mance indicators (KPIs) and the delivery on a set of carefully selected company Priorities. The KPIs for 2020 are specified in the table below. The targets and the stretch targets are labelled ‘execute’ and ‘improve’ respectively.
KEY PERFORMANCE INDICATORS FOR AKER BP 2020
Execute Improve Actual
Safety (SIF per million hours) 0.5 0.45 0.46
Production (mboepd)1) 207.9 214.9 210.7
Production cost (USD/boe)2) 8 7 7.9
Relative Shareholder Return 5% 10% -1.5%
CO2 intensity - operated fields (kg/boe)
8 7 6.7
Total headcount 2,220 2,210
1) Adjusted for curtailments and asset sale 2) FX adjusted based on USDNOK 10.0
Company Priorities are either important improvement initia-tives or activities with clear deliverables that are critical for the company’s future success. Below is a list of the priorities for 2020:
• Deliver on improvements plans to improve assets on opex benchmark in 2020
• Deliver 1st gas on Ærfugl by end of November at plan-ned quality and cost
• Progress Skogul to ~100% complete by Q1 at planned quality and cost
• Mature Hod Development to DG3 by end Q1• Complete stimulation of two named Valhall wells by Q1
and five wells by Q2• Deliver three efficiency projects that reduces environ-
mental footprint per operated asset• Develop Aker BP’s operating model concept by end Q2• Mature Frosk to DG1 by end April 2020• Realise value from NOAKA through finding a solution for
the area• Deliver decisions and related cost effect from COVID-19
actions taken• Deliver new organisational structure establishing a fit for
purpose organization• Establish new ways of working post the COVID-19
pandemic• Progress Hod Field Development to 23% by end of year
2021 at planned quality and cost
These KPIs and company priorities are each weighted 50 percent when estimating the bonus outcome. The final bonus outcome, following the formulaic assessment of performance relative to targets is specifically reserved as a matter for the CEO and the Compensation & Organisational Committee. Accordingly, the committee may exercise its discretion to adjust the outcome upwards or downwards. The CEO has maximum bonus potential corresponding to 100 percent of his base salary. For other members of EMT, the limit is 60 percent. The maximum bonus for employees outside the EMT varies from 10 percent to 30 percent based on internal job grade.
In addition, certain members of the EMT participate in a five-year incentive program started in January 2019, through December 2023, linked to the relative performance of the Aker BP share price versus a benchmark index consisting of the average of the Oslo Energy Index and the Stoxx 600 Europe Oil & Gas index (each weighted 50 percent). The incentive program payment is calculated as a linear function of market outperformance, where an outperformance of 30 percent or more will result in a payment of the maximum cap. The maximum total payment is capped at 200 percent of the executive manager’s annual base salary. The CEO incentive program has the same mechanics and start/end date and is capped at NOK 30 million.
The pension scheme continued to be a defined contribution plan capped at twelve times the National Insurance scheme basic amount (12G) for all employees including the executive management.
The CEO and Members of the Executive Management team have 6 months mutual notice period, as opposed to 3 months for the rest of the organization. The Company has during 2020 worked to change its severance practices with effect in 2021. The Executive Management Team will also fall under the new severance scheme if applicable. The new severance scheme will provide a period of pay (6-12 months based on age), in addition to maintaining some employee benefits and outplacement assistance.
Deviations from the code: None

86 · Aker BP Annual Report 2020 · BOD's Report on Corporate Governance
13. INFORMATION AND COMMUNICATIONS
Aker BP maintains a proactive dialogue with analysts, inves-tors, and other stakeholders of the company. The company strives to continuously publish relevant information to the market in a timely, effective, and non-discriminatory manner, and has a clear goal to attract both Norwegian and foreign investors and to promote higher stock liquidity. The company complies with the Oslo Børs Code of Practice for IR of 1 July 2019.
All stock exchange announcements are made available on the Oslo Børs’ website, www.newsweb.no, as well as the compa-ny’s website at the same time. The announcements are also distributed to news agencies and other online services.
Aker BP publishes its preliminary annual accounts by the end of February, as part of its fourth quarter report. The complete annual report, including approved and audited accounts and the Board of Directors’ Report, is available no later than three weeks before the AGM. Information sent to shareholders is published on the website simultaneously.
The company’s financial calendar for the coming year is published as a stock exchange announcement and made avai-lable on the company’s website no later than 31 December each year, in accordance with the continuing obligations for companies listed on Oslo Børs.
Aker BP’s presentations of quarterly results and its annual Capital Markets Update are webcasted live through the company’s web page and are also made available for replay. At the presentations, executive management review and comment on the published results, market conditions and the company’s future activities, and answer questions from the audience.
The company’s management gives high priority to commu-nication with the investor market. Individual meetings are organized for a wide range of existing and potential new investors and analysts. The company also attends relevant industry and investor conferences.
Aker BP will reduce its contacts with analysts, investors, and journalists in the final 30 days before publication of its results. During this period, the company will give no comments to the media or other parties about the compa-ny’s results and outlook. This is to ensure that all interested parties in the market are treated equally.
Deviations from the code: None
14. TAKE-OVERSThe Board has established a separate set of guidelines for how it will act in the event of a takeover bid, as recommen-ded by the Code of Practice. The overriding principle for review of a takeover bid is equal treatment of shareholders. The principles are based on the Board of Directors and management having an independent responsibility for fair and equal treatment of shareholders in a takeover process, and that the day-to-day operations of the company are not unnecessarily disturbed. It is management’s responsibility to ensure that the Board of Directors is made aware of any potential takeover bid, while the Board of Directors is responsible for ensuring that shareholders are kept informed and are given reasonable time to consider the offer.
Unless the Board of Directors has a particular reason, it will not take steps to prevent or obstruct a takeover bid for the company’s shares, nor hinder the progress of the bid without approval from shareholders.
If an offer is made for Aker BP’s shares, the Board of Directors should make a statement to the shareholders that contains an assessment of the bid, the Board of Directors’ recommendations and the reason for the recommendation. If the Board of Directors is unable to make a recommenda-tion to shareholders, the Board of Directors shall explain its reasoning for this.
Transactions that have the effect of a sale of the company or a major part of it must be decided on by shareholders at a shareholders’ meeting.
Deviations from the code: None

87 · Aker BP Annual Report 2020 · BOD's Report on Corporate Governance
15. AUDITOR The AGM elects the auditor and approves the auditor’s fee. The Board of Directors will meet with the auditor annually without representatives of company management being pre-sent, to review internal control procedures and discuss any weaknesses and proposals for improvement. The auditor is invited and participates in the Board meetings to discuss the annual accounts. In these meetings, the auditor reports on any material changes in the company’s accounting principles and key aspects of the audit, including matters on which there has been disagreement between the auditor and the executive management of the company.
The auditor participates in all meetings with the Audit and Risk Committee and meets the Audit and Risk Committee without the company’s management being present. The
Board ensures that the auditor submits the main features of the plan for the annual audit of the company to the Audit and Risk Committee annually. The auditor’s independence in relation to the company is evaluated annually. The auditor may carry out certain audit related or non-audit services for the company, providing these are not in conflict with its duties as auditor. The company has established an audit and non-audit service policy.
In the annual financial statements, the auditor’s remuneration is split between the audit fee and fees for other services. In the presentation to the AGM, the chair presents a break-down between the audit fee and fees for other services.
Deviations from the code: None

88 · Aker BP Annual Report 2020 · Financial Statements with Notes
OOVVEERRVVIIEEWW OOFF TTHHEE FFIINNAANNCCIIAALL SSTTAATTEEMMEENNTTSS AANNDD NNOOTTEESS
Income statement
Statement of comprehensive income
Statement of financial position
Statement of changes in equity
Statement of cash flow
Notes to the accounts
Note 1 Summary of IFRS accounting principles
Note 2 Overview of subsidiaries
Note 3 Segment information
Note 4 Income
Note 5 Produced volumes and over/underlift adjustment
Note 6 Exploration expenses
Note 7 Payroll expenses and remuneration
Note 8 Auditors fee
Note 9 Financial items
Note 10 Taxes
Note 11 Earnings per share
Note 12 Tangible fixed assets and intangible assets
Note 13 Impairments
Note 14 Accounts receivable
Note 15 Other short-term receivables
Note 16 Inventories
Note 17 Other non-current assets
Note 18 Cash and cash equivalents
Note 19 Share capital and shareholders
Note 20 Bonds
Note 21 Provision for abandonment liabilities
Note 22 Derivatives
Note 23 Other interest-bearing debt
Note 24 Other current liabilities
Note 25 Lease agreements
Note 26 Commitments
Note 27 Transactions with related parties
Note 28 Financial instruments
Note 29 Investments in joint operations
Note 30 Events after the balance sheet date
Note 31 Classification of reserves and contingent resources (unaudited)
Statement by the Board of Directors and Chief Executive Officer
Alternative performance measures
Independent Auditor's Report
FINANCIAL STATEMENTS WITH NOTES
FINANCIAL STATEMENTS WITH NOTES

89 · Aker BP Annual Report 2020 · Financial Statements with Notes
INCOME STATEMENT
(USD 1 000) NNoottee 22002200 22001199
Petroleum revenues 4 2 868 153 3 338 667
Other operating income 4 111 110 8 421
TToottaall iinnccoommee 22 997799 226633 33 334477 008888
Production costs 5 627 975 720 321
Exploration expenses 6 174 099 305 516
Depreciation 12 1 121 818 811 874
Impairments 12,13 573 128 146 808
Other operating expenses 7,8 49 457 35 328
TToottaall ooppeerraattiinngg eexxppeennsseess 22 554466 447777 22 001199 884488
OOppeerraattiinngg pprrooffiitt 443322 778866 11 332277 224411
Interest income 3 763 16 490
Other financial income 170 865 35 255
Interest expenses 181 677 76 587
Other financial expenses 262 052 218 145
NNeett ffiinnaanncciiaall iitteemmss 9 --226699 110011 --224422 998866
PPrrooffiitt bbeeffoorree ttaaxxeess 116633 668855 11 008844 225544
Taxes (+)/tax income (-) 10 118 970 943 204
NNeett pprrooffiitt 4444 771155 114411 005511
Weighted average no. of shares outstanding basic and diluted 11 359 808 121 360 014 176
Basic and diluted earnings USD per share 11 0.12 0.39
STATEMENT OF COMPREHENSIVE INCOME
(USD 1 000) NNoottee 22002200 22001199
Profit for the period 44 715 141 051
IItteemmss wwhhiicchh wwiillll nnoott bbee rreeccllaassssiiffiieedd oovveerr pprrooffiitt aanndd lloossss ((nneett ooff ttaaxxeess))
Actuarial gain/loss pension plan 9 -4
TToottaall ccoommpprreehheennssiivvee iinnccoommee iinn ppeerriioodd 4444 772244 114411 004466
GGrroouupp && PPaarreenntt
GGrroouupp && PPaarreenntt

90 · Aker BP Annual Report 2020 · Financial Statements with Notes
STATEMENT OF FINANCIAL POSITION
(USD 1 000) NNoottee 3311..1122..22002200 3311..1122..22001199
AASSSSEETTSS
IInnttaannggiibbllee aasssseettss
Goodwill 12 1 647 436 1 712 809
Capitalized exploration expenditures 12 521 922 621 315
Other intangible assets 12 1 521 311 1 915 968
TTaannggiibbllee ffiixxeedd aasssseettss
Property, plant and equipment 12 7 266 137 7 023 276
Right-of-use assets 12 132 735 194 328
FFiinnaanncciiaall aasssseettss
Long-term receivables 29 086 27 418
Other non-current assets 17 30 210 10 364
Long-term derivatives 22 12 841 2 706
TToottaall nnoonn--ccuurrrreenntt aasssseettss 1111 116611 667788 1111 550088 118833
IInnvveennttoorriieess
Inventories 16 112 704 87 539
RReecceeiivvaabblleess
Accounts receivable 14 297 880 193 444
Other short-term receivables 15 286 817 330 516
Short-term derivatives 22 23 212 -
CCaasshh aanndd ccaasshh eeqquuiivvaalleennttss
Cash and cash equivalents 18 537 801 107 104
TToottaall ccuurrrreenntt aasssseettss 11 225588 441144 771188 660033
TTOOTTAALL AASSSSEETTSS 1122 442200 009911 1122 222266 778866
GGrroouupp && PPaarreenntt

91 · Aker BP Annual Report 2020 · Financial Statements with Notes
STATEMENT OF FINANCIAL POSITION
(USD 1 000) NNoottee 3311..1122..22002200 3311..1122..22001199
EEQQUUIITTYY AANNDD LLIIAABBIILLIITTIIEESS
EEqquuiittyy
Share capital 19 57 056 57 056
Share premium 3 637 297 3 637 297
Other equity -1 707 071 -1 326 767
TToottaall eeqquuiittyy 11 998877 228811 22 336677 558855
NNoonn--ccuurrrreenntt lliiaabbiilliittiieess
Deferred taxes 10 2 642 461 2 235 357
Long-term abandonment provision 21 2 650 263 2 645 420
Long-term bonds 20 3 968 566 1 630 936
Long-term lease debt 25 131 856 202 592
Other interest-bearing debt 23 - 1 429 132
TToottaall nnoonn--ccuurrrreenntt lliiaabbiilliittiieess 99 339933 114466 88 114433 443377
CCuurrrreenntt lliiaabbiilliittiieess
Trade creditors 113 517 144 942
Short-term bonds 20 - 226 700
Accrued public charges and indirect taxes 25 761 25 974
Tax payable 10 163 352 361 157
Short-term derivatives 22 3 539 42 994
Short-term abandonment provision 21 155 244 142 798
Short-term lease debt 25 83 904 110 664
Other current liabilities 24 494 346 660 535
TToottaall ccuurrrreenntt lliiaabbiilliittiieess 11 003399 666644 11 771155 776655
TToottaall lliiaabbiilliittiieess 1100 443322 881100 99 885599 220011
TTOOTTAALL EEQQUUIITTYY AANNDD LLIIAABBIILLIITTIIEESS 1122 442200 009911 1122 222266 778866
Øyvind Eriksen, Chairman of the Board Kjell Inge Røkke, Board member
Anne Marie Cannon, Deputy Chair Trond Brandsrud, Board member
Kate Thomson, Board member Murray Auchincloss, Board member
Gro Kielland, Board member Terje Solheim, Board member
Ingard Haugeberg, Board member Anette Hoel Helgesen, Board member
Karl Johnny Hersvik, Chief Executive Officer Ørjan Holstad, Board member
The Board of Directors and the CEO of Aker BP ASA
Akerkvartalet, 18 March 2021
GGrroouupp && PPaarreenntt
ØYVIND ERIKSENChairman
KJELL INGE RØKKEBoard member
ANNE MARIE CANNONDeputy chair
MURRAY AUCHINCLOSSBoard member
TROND BRANDSRUDBoard member
GRO KIELLANDBoard member
INGARD HAUGEBERGBoard member
KATE THOMSONBoard member
ANETTE HOEL HELGESENBoard member
ØRJAN HOLSTADBoard member
TERJE SOLHEIMBoard member
KARL JOHNNY HERSVIKChief Executive Officer

92 · Aker BP Annual Report 2020 · Financial Statements with Notes
STATEMENT OF CHANGES IN EQUITY
(USD 1 000)
EEqquuiittyy aass ooff 3311..1122..22001188 5577 005566 33 663377 229977 573 083 -81 -115 491 -1 175 324 --771177 881144 22 997766 553399
Dividends distributed - - - - - -750 000 -750 000 -750 000
Profit for the period - - - - - 141 051 141 051 141 051
Other comprehensive income for the period - - - -4 - - -4 -4
EEqquuiittyy aass ooff 3311..1122..22001199 5577 005566 33 663377 229977 573 083 -85 -115 491 -1 784 274 --11 332266 776677 22 336677 558855
Dividends distributed - - - - - -425 000 -425 000 -425 000
Profit for the period - - - - - 44 715 44 715 44 715
Purchase/sale of treasury shares2) - - - - - -28 -28 -28
Other comprehensive income for the period - - - 9 - - 9 9
EEqquuiittyy aass ooff 3311..1122..22002200 ((GGrroouupp aanndd PPaarreenntt)) 5577 005566 33 663377 229977 573 083 -76 -115 491 -2 164 587 --11 770077 007711 11 998877 228811
OOtthheerr eeqquuiittyy
Other comprehensive income
Accumulated
deficit
TToottaall ootthheerr
eeqquuiittyy TToottaall eeqquuiittyy
1) The amount arose mainly as a result of the change in functional currency in 2014.
2) The treasury shares are purchased/sold for use in the company's share saving plan.
SShhaarree ccaappiittaall SShhaarree pprreemmiiuumm
Other paid-in
capital
Actuarial
gains/(losses)
Foreign currency
translation
reserves1)

93 · Aker BP Annual Report 2020 · Financial Statements with Notes
STATEMENT OF CASH FLOW
(USD 1 000) NNoottee 22002200 22001199
163 685 1 084 254
-145 286 -618 593
326 208 -
12 1 121 818 811 874
12,13 573 128 146 808
9,21 116 947 121 723
9 201 131 199 569
9 -184 068 -194 033
4,9 -15 999 22 484
9 19 813 21 705
6,12 56 626 176 419
-161 027 14 369
-215 923 98 567
11 885577 005533 11 888855 114466
21 -150 306 -104 890
12 -1 277 869 -1 703 213
12 -127 283 -370 185
54 747 -
12 - -143
--11 550000 771100 --22 117788 443311
-1 451 550 1 425 222
-612 553 -
- -950 000
2 721 748 740 159
-56 804 -
-57 885 -88 718
-43 709 -20 880
-425 000 -750 000
-28 -
28 7744 221199 335555 778822
443300 556622 6622 449988
107 104 44 944
134 -338
18 553377 880011 110077 110044
Repayment of bonds
Net drawdown/repayment of reserve-based lending facility
Changes in inventories, accounts payable and receivables
Interest paid (including interest element of lease payments)
Changes in derivatives
Amortized loan costs
Expensed capitalized dry wells
Changes in other current balance sheet items
Payment for removal and decommissioning of oil fields
Disbursements on investments in fixed assets
Disbursements on investments in licenses
Net drawdown/repayment of revolving credit facility
Disbursements on investments in capitalized exploration
Cash received from sale of licenses
Interest expenses (including interest element of lease payments)
Profit before taxes
Taxes paid
Taxes refunded
Depreciation
Net impairment losses
Accretion expenses
GGrroouupp && PPaarreenntt
CCAASSHH AANNDD CCAASSHH EEQQUUIIVVAALLEENNTTSS AATT EENNDD OOFF PPEERRIIOODD
Net purchase/sale of treasury shares
Cash and cash equivalents at start of period
Effect of exchange rate fluctuation on cash held
CCAASSHH FFLLOOWW FFRROOMM OOPPEERRAATTIINNGG AACCTTIIVVIITTIIEESS
NNEETT CCAASSHH FFLLOOWW FFRROOMM OOPPEERRAATTIINNGG AACCTTIIVVIITTIIEESS
CCAASSHH FFLLOOWW FFRROOMM IINNVVEESSTTMMEENNTT AACCTTIIVVIITTIIEESS
CCAASSHH FFLLOOWW FFRROOMM FFIINNAANNCCIINNGG AACCTTIIVVIITTIIEESS
NNeett cchhaannggee iinn ccaasshh aanndd ccaasshh eeqquuiivvaalleennttss
NNEETT CCAASSHH FFLLOOWW UUSSEEDD IINN IINNVVEESSTTMMEENNTT AACCTTIIVVIITTIIEESS
NNEETT CCAASSHH FFLLOOWW FFRROOMM FFIINNAANNCCIINNGG AACCTTIIVVIITTIIEESS
Net proceeds from bond issues
Receipt/payment upon settlement of derivatives related to financing
Payments on lease debt related to investments in fixed assets
Payments on other lease debt
Paid dividend

94 · Aker BP Annual Report 2020 · Financial Statements with Notes
NOTES TO THE ACCOUNTSGeneral informationAker BP ASA (“Aker BP” or “the company”) is an oil company involved in exploration, development and production of oil and gas on the Norwegian Continental Shelf (NCS).
The company is a public limited liability company registered and domiciled in Norway. Aker BP’s shares are listed on Oslo Stock Exchange (Oslo Børs) under the ticker AKRBP. The company’s registered business address is Oksenøyveien 10, 1366 Lysaker, Norway.
The Aker BP group comprise the parent company Aker BP ASA and the three subsidiaries Det norske oljeselskap AS (including its subsidiary Aker BP UK Limited), Alvheim AS and Sandvika Fjellstue AS. Due to materiality considerations the subsidiaries are not consolidated in the group accounts in 2020 and in the relevant comparable periods., resulting in no difference between the group and parent numbers. For more information regarding subsidiaries, see note 2.
The financial statements were approved by the Board of Directors on 18 March 2021 and will be presented for approval at the Annual General Meeting on 15 April 2021.
COVID-19The disruption to the global economy caused by COVID-19 resulted in a sharp decrease in oil prices and triggered a reduction in the company’s investment program, though operational performance and production levels have been maintained. The fall in oil and gas prices has had a negative impact on operational results and cash flows in the period, and impairments of USD 654 million were recognized in Q1 2020. These impairments have subsequently been partly reversed, mainly as a result of increased oil and gas prices.
In the second quarter, temporary changes to the Norwegian petroleum tax system strengthened the company’s invest-ment capacity and are contributing to liquidity (see note 10).
Actions have been taken to protect financial flexibility, including an updated and reduced investment program, cut in dividends and issuance of new bonds. As of 31 December 2020 available liquidity on the Revolving Credit Facility is USD 4.0 billion and the related financial covenants meets the applicable thresholds by a substantial margin (see note 23).
The COVID-19 pandemic and associated uncertainties and disruption to the global economy may have negative effects on demand for oil and gas and / or result in interruptions to the company’s operations. Such events may adversely impact the company’s future results from operations and cash flows, and may lead to impairment of assets.
Note 1 Summary of IFRS accounting principles
1.1 Basis of preparationThe group consolidated and the company’s financial sta-tements have been prepared in accordance with the Norwegian Accounting Act and International Financial Reporting Standards as adopted by the EU (“IFRS”). In these financial statements, reference to the company is applicable to the group and the parent entity unless otherwise stated.
The financial statements have been prepared on a historical cost basis with the exception of the following accounting items which are measured on an alternative basis at each reporting date:
• Financial instruments at fair value through profit or loss.• Loans, receivables and other financial liabilities, which are
recognized at amortized cost.
All amounts have been rounded to the nearest thousand unless otherwise stated. As a result of rounding adjustments, the figures in one or more rows or columns included in the financial statements and notes may not add up to the total of that row or column.
1.2 Functional currency and presentation currencyThe functional currency of Aker BP ASA and the presenta-tion currency of the group is United States Dollars (“USD”).
1.3 Important accounting judgments, estimates and assumptions
The preparation of financial statements in accordance with IFRS requires management to make judgments, estimates and assumptions that have an effect on the application of accounting principles and the reported assets, liabilities, income and expenses.
The significant judgments management has made regarding the application of accounting principles are as follows:

95 · Aker BP Annual Report 2020 · Financial Statements with Notes
Goodwill allocation and methodology for impairment testingFor the purpose of impairment testing, goodwill is allocated to a cash-generating unit (CGU), or groups of CGUs that are expected to benefit from the synergies of the business combination from which it arose. The allocation of goodwill requires judgment and may significantly impact any subsequ-ent impairment charge. Although not an IFRS term, “techn-ical goodwill” is used by Aker BP to describe the category of goodwill arising as an offsetting account to deferred tax liabilities recognised in business combinations, as described in section 1.8 below. There are no specific IFRS guideli-nes pertaining to the allocation of technical goodwill, and management has therefore applied the general guidelines for allocating goodwill. In general, technical goodwill is allocated at the CGU level for impairment testing purposes, while resi-dual goodwill may be allocated across all CGUs based on the facts and circumstances of the business combination.
When performing the impairment test for technical goodwill, deferred tax liabilities recognized in relation to the acquired licenses reduce the net carrying value prior to any impair-ment charges. This methodology avoids an immediate impai-rment of all technical goodwill. When deferred tax liabilities from the initial recognition decreases, additional technical goodwill is ‘exposed’ to impairment. Subsequent to the initial purchase price allocation, depreciation of book values will result in decreasing deferred tax liabilities.
Accounting estimates are used to determine reported amo-unts, including the depreciation of assets, the cost and timing of decommissioning activities, impairment testing of good-will and the recognition and measurement of tax liabilities. Whilst these estimates are based on management’s best judgment and assessments of previous and current events and actions, the actual results may deviate from the original estimates. Changes to accounting estimates are recognized in the period when they arise. The main sources of uncer-tainty when making estimates and judgments relate to the following:
Proven and probable oil and gas reservesOil and gas reserves are estimated by the company’s experts in accordance with industry standards. The estimates are based on Aker BP’s own assessment of internal information and information received from operators. In addition, proven and probable reserves are certified by an external party. Proven and probable oil and gas reserves consist of the estimated quantities of crude oil, natural gas and condensa-tes shown by geological and technical data to be recoverable with reasonable certainty from known reservoirs under existing economic and operational conditions, i.e. on the date that the estimates are prepared. Current market prices are used in the estimates.
Proven and probable reserves and production volumes are used to calculate the depreciation of oil and gas fields by applying the unit-of-production method. Reserve estimates are also used as basis for impairment testing of license-re-lated assets and goodwill. Changes in petroleum prices and cost estimates may change reserve estimates and accor-dingly economic cut-off, which may impact the timing of assumed decommissioning and removal activities. Changes to reserve estimates can also result from updated production and reservoir information. Future changes to proven and probable oil and gas reserves can have a material effect on depreciation, life of field, impairment of license-related assets and goodwill, and operating results.
Successful Effort Method - explorationExpenses relating to the drilling of exploration wells are temporarily recognized in the Statement of financial position as capitalized exploration expenditures, pending an evalua-tion of potential oil and gas discoveries. If resources are not discovered, or if recovery of the resources is considered technically or commercially unviable, the costs of explo-ration wells are expensed. Judgments as to whether this expenditure should remain capitalized or be expensed at the reporting date may materially affect the operating result for the period.
Fair value measurementThe fair values of non-financial assets and liabilities are requ-ired to be determined, for example in a business combina-tion, to determine the allocation of purchase price in an asset deal or when the recoverable amount of an asset or CGU is based on fair value less cost to sell. Fair value is the price that would be received to sell an asset or paid to transfer a liability in an orderly transaction between market partici-pants at the measurement date. The fair value of an asset or a liability is measured using the assumptions that market participants would use when pricing the asset or liability.
A fair value measurement of a non-financial asset takes into account a market participant’s ability to generate economic benefits by using the asset in its highest and best use or by selling it to another market participant that would use the asset in its highest and best use. The group uses valuat-ion techniques that are appropriate in the circumstances and for which sufficient data are available to measure fair value, maximizing the use of relevant observable inputs and minimizing the use of unobservable inputs. The fair value of oil fields in production and development phase is normally based on discounted cash flow models, where the determination of inputs to the model may require signifi-cant judgment, as described in the section below regarding impairment.

96 · Aker BP Annual Report 2020 · Financial Statements with Notes
Impairment/reversal of impairmentChanges in the expected future value/cash flows of CGUs results in impairment if the estimated recoverable value is lower than the book value (including any allocated goodwill) or the reversal of previously recognized impairment if the recoverable value is higher than the book value (though impairment of goodwill is not reversed). Estimates of recoverable value involve the application of judgment and assumptions, including in relation to the modelling of future cash flows to estimate the CGUs value in use or fair value.
The evaluation of impairment requires long-term assumpti-ons concerning a number of often volatile economic factors, including future oil prices, oil production, currency exchange rates and discount rates. Such assumptions require the esti-mation of relevant factors such long-term prices, the levels of capex and opex, production estimates and decomissioning costs. These evaluations are also necessary to determine a CGU’s fair value unless information can be obtained from an actual observable market transaction. See note 12 ’ Tangible fixed assets and intangible assets’ and note 13 ’Impairments’ for details of impairments.
Decommissioning and removal obligationsThe company has obligations to decommission and remove offshore installations at the end of their production period. Obligations associated with decommissioning and removal of long-term assets are recognized at present value of future expenditures at the date they are expected to be incurred. At the initial recognition of an obligation, the estimated cost is capitalized as production plant and depreciated over the useful life of the asset (typically by application of the unit-of-production method). There is significant future uncertainty in the estimate of costs for decommissioning and removal, as these estimates are based on currently applica-ble laws and regulations, and existing technologies. Many decommissioning and removal activities will take place many decades in the future, and the technology and related costs are expected to evolve in this time. The estimates include costs based on expected removal concepts using existing technology and estimated costs of maritime operations, hiring of sigle-lift and heavy-lift barges and drilling rigs. As as result, there may be significant adjustments to the estimates of decomissioning liabilities and associated assets that can affect future financial results. See note 21 ‘Provision for abandonment liabilities’ for further details about decommissi-oning and removal obligations.
Income taxIncome tax expense, tax payables or receivables, and deferred taxes are based on management’s interpretation of applicable laws and regulations, and on relevant court decisions where relevant. These estimates are dependent on
management’s ability to interpret and apply the requirements of tax and other relevant legislation, and requires judgment in respect of the recognition and measurement of any uncer-tain tax positions. See note 10 ‘Taxes’ for further details.
1.4 Foreign currency transactions
Transactions and balancesTransactions denominated in foreign currencies are trans-lated using the exchange rate on the transaction date. Monetary items denominated in foreign currencies in the Statement of Financial Position are translated using the exchange rates at the reporting date. Foreign exchange gains and losses are recognized as incurred. Non-monetary items that are measured at historical costs in a foreign currency are translated using the exchange rates on the date of the initial transaction. Non-monetary items measured at fair value in a foreign currency are translated using the exchange rate on the date when the fair value is determined.
1.5 Revenue recognition Revenue from the sale of liquids or gas is recognised at the point in time when the company’s contractual performance obligations has been fulfilled and control is transferred to the customer, which will ordinarily be at the point of delivery when title passes (sales method).
There is no significant judgement applying IFRS 15 ‘Revenue from contracts with customers’ to the company’s revenue generating contracts.
The group recognized revenue on the basis of the propor-tionate share of production during the period, regardless of actual sales (entitlement method). As a result, changes in over/underlift balances are valued at production cost inclu-ding depreciation and presented as an adjustment to cost. See note 5 for further details.
Gains or losses on asset disposals as described in section 1.9 are included in other operating income.
Tariff revenue from processing of oil and gas is recognized as earned in line with underlying agreements.
1.6 Interests in joint arrangements IFRS defines a joint arrangement as an arrangement over which two or more parties have joint control. Joint control is the contractually agreed sharing of control which exists only when decisions about the relevant activities (being those that significantly affect the returns of the arrangement) requ-ire unanimous consent of the parties sharing control.

97 · Aker BP Annual Report 2020 · Financial Statements with Notes
The company has interests in licenses on the Norwegian Continental Shelf. Under IFRS 11 Joint Arrangements, a joint operation is a joint arrangement whereby the parties that have joint control of the arrangement have rights to the assets and obligations for the liabilities, relating to the arrangement. The company recognizes investments in joint operations (oil and gas production licenses) by reporting its share of related revenues, expenses, assets, liabilities and cash flows under the respective items in the company’s financial statements.
For those licenses that are not deemed to be joint arrange-ments pursuant to the definition in IFRS 11 as there is no joint control, the company recognizes its share of related expenses, assets, liabilities and cash flows on a line-by-line basis in the financial statements in accordance with applica-ble IFRSs.
1.7 Classification in statement of financial position Current assets and current liabilities include items that fall due for payment less than a year from the end of the repor-ting period and items relating to the ordinary business cycle. The following year’s instalments on long-term liabilities are classified as current liabilities. Financial investments in shares are classified as current assets, while strategic investments are classified as non-current assets.
1.8 Business combinations and goodwill In order to consider an acquisition as a business combination, the acquired asset or groups of assets must constitute a business (an integrated set of operations and assets conduc-ted and managed for the purpose of providing a return to the investors). The combination consists of inputs and substan-tive processes applied to these inputs that have the ability to create outputs. Amendments to IFRS 3 effective in January 2020 introduce a new optional ‘concentration test’ which may result in a business combination being accounted for as an asset acquisition if substantially all of the fair value of the gross assets acquired is concentrated in a single identifiable asset or group or similar identifiable assets.
Acquired businesses are included in the financial statements from the transaction date. The transaction date is defined as the date on which the company obtains control over the financial and operating assets. This date may differ from the actual date on which the assets are transferred.
For accounting purposes, the acquisition method is applied to the purchase of businesses. Acquisition cost equals the fair value of consideration, including contingent conside-ration, equity instruments issued and liabilities assumed in
connection with the transfer of control. Acquisition cost is measured against the fair value of the acquired assets and liabilities. Identifiable intangible assets are included in conne-ction with acquisitions if they can be separated from other assets or meet the legal contractual criteria. If the acquisition cost at the time of the acquisition exceeds the fair value of the acquired net assets (when the acquiring entity achieves control of the transferring entity), goodwill arises.
In a business combination, if the fair value of the net iden-tifiable assets acquired exceeds the acquisition cost on the acquisition date, the excess amount is taken to the Income statement immediately.
In a business combination, goodwill is allocated to the CGUs or groups of CGUs that are expected to benefit from synergy effects of the acquisition. The allocation of goodwill may vary depending on the basis for its initial recognition.
The majority of the company’s goodwill is related to the requirement to recognize deferred tax for the difference between the assigned fair values and the related tax base (”technical goodwill”). The fair value of of the compa-ny’s licenses, all of which are located on the Norwegian Continental Shelf, are based on cash flows after tax. This is because these licenses are only sold in an after-tax mar-ket based on the tax carry-over principles pursuant to the Petroleum Taxation Act section 10. The purchaser is the-refore not entitled to a tax deduction for the consideration paid over and above the seller’s tax values. In accordance with IAS 12 paragraphs 15 and 24, a provision is made for deferred tax corresponding to the difference between the acquisition cost and the transferred tax depreciation basis. The offsetting entry to this deferred tax is goodwill. Hence, goodwill arises as a technical effect of deferred tax. Technical goodwill is tested for impairment separately for each CGU which give rise to the technical goodwill. A CGU may be individual oil fields, or a group of oil fields that are connected to the same infrastructure/production facilities.
The estimation of fair value and goodwill may be adjusted up to 12 months after the acquisition if new information has emerged about facts and circumstances that existed at the time of the acquisition and which, had they been known, would have affected the calculation of the amounts recognized.
Acquisition-related costs, except costs to issue related debt or equity securities, are expensed as incurred.

98 · Aker BP Annual Report 2020 · Financial Statements with Notes
1.9 Acquisitions, sales and license swaps On acquisition of a license that involves the right to explore for and produce petroleum resources, it is considered in each case whether the acquisition should be treated as a business combination (see Item 1.8) or an asset purchase. Generally, purchases of licenses in a development or production phase will be regarded as a business combination. Other license purchases regarded as asset purchases are described below.
Oil and gas production licensesFor licenses in the development phase, the acquisition cost is allocated between capitalized exploration expenses, license rights and production plant.
When entering into agreements regarding the purchase/swap of assets, the parties agree on an effective date for the takeover of the net cash flow (usually 1 January in the calendar year which would also normally be the effective date for tax purposes). In the period between the effective date and the completion date, the seller will include its sold share of the license in the financial statements. In accordance with the purchase agreement, there is a settlement with the seller of the net cash flow from the asset in the period from the effective date to the completion date (pro & contra settlement). The pro & contra settlement will be adjusted to the seller’s losses/gains and to the assets for the purchaser, in that the settlement (after a tax reduction) is deemed to be part of the consideration in the transaction. Revenues and expenses from the relevant license are included in the purchaser’s Income statement from the acquisition date, as defined in 1.8 above.
For tax purposes, the purchaser will include the net cash flow (pro & contra) and any other income and costs as from the effective date.
When acquiring licenses that are defined as asset acquisiti-ons, no provision is made for deferred tax.
Farm-in agreementsFarm-in agreements are usually entered into in the explora-tion phase and are characterised by the transferor waiving future financial benefits in the form of reserves, in exchange for reduced future financing obligations. For example, a license interest is taken over in return for a share of the transferor’s expenses relating to the drilling of a well. In the exploration phase, the company normally accounts for farm-in agreements on a historical cost basis, as the fair value cannot be reliably determined.
SwapsSwaps of assets are calculated at the fair value of the asset being surrendered, unless the transaction lacks commercial substance, or neither the fair value of the asset received, nor
the fair value of the asset surrendered, can be effectively measured. In the exploration phase, the company normally recognizes swaps based on historical cost, as the fair value cannot be reliably measured.
1.10 Unitizations According to Norwegian law, a unitization is required if a petroleum deposit extends over several production licenses and these production licenses have different ownership interests. Consensus must be achieved with regard to the most beneficial coordination of the joint development and ownership distribution of the petroleum deposit. A uni-tization agreement shall be approved by the Ministry of Petroleum and Energy.
The company normally recognizes unitizations in the explora-tion phase based on historical cost, as the fair value cannot be reliably measured. For unitizations involving licenses out-side the exploration phase, it has to be considered whether the transaction has commercial substance. If so, the unitiza-tion is recognized at fair value.
1.11 Tangible fixed assets and intangible assets
GeneralTangible fixed assets are recognized on a historical cost basis.
The book value of tangible fixed assets consists of acquisi-tion cost net of accumulated depreciation and impairment losses.
Ordinary repair and maintenance costs relating to day-to-day operations are charged to the Income statement in the period in which they are incurred.
Gains and losses relating to the disposal of assets are deter-mined by comparing the selling price with the book value, and are included in other operating income/expenses on a post tax basis. Assets held for sale are measured at the lower of the book value and the fair value less cost to sell.
Operating assets related to petroleum activities
Exploration and development costs relating to oil and gas fieldsCapitalized exploration expenditures are classified as intan-gible assets and reclassified to tangible assets at the start of development. For accounting purposes, the field is considered to enter the development phase when the technical feasibi-lity and commercial viability of extracting hydrocarbons from the field are demonstrable, normally at the time of concept selection. All costs relating to the development of commercial oil and/or gas fields are recognized as tangible assets. Pre-operational costs are expensed as they are incurred.
99 · Aker BP Annual Report 2020 · Financial Statements with Notes
The company employs the ’successful efforts’ method to account for exploration and development costs. All explo-ration costs (including seismic shooting, seismic studies and ’own time’), with the exception of acquisition costs of licenses and drilling costs for exploration wells, are expensed as incurred. When exploration drilling is ongoing in a period after the reporting date and the result of the drilling is subse-quently not successful, the capitalized exploration cost as of the reporting date is expensed if the evaluation of the well is completed before the date when the financial statements are authorized for issue.
Drilling cost for exploration wells are temporarily capitalized pending the evaluation of potential discoveries of oil and gas resources. Such costs can remain capitalized for more than one year. The main criteria is that there must be plans for future activity in the license area or that a development decision is expected in the near future. If no resources are discovered, or if recovery of the resources is considered technically or commercially unviable, expenses relating to the drilling of exploration wells are charged to expense.
Acquired license rights are recognized as intangible assets at the time of acquisition. Acquired license rights related to fields in the exploration phase remain as intangible assets also when the related fields enter the development or produ-ction phase.
Depreciation of oil and gas fieldsCapitalized exploration and evaluation expenditures, development expenditures from construction, installation or completion of infrastructure facilities such as platforms, pipelines and production wells, and field-dedicated transport systems for oil and gas are capitalized as production facilities and are depreciated using the unit-of-production method based on proven and probable developed reserves expec-ted to be recovered from the area during the concession or contract period. Acquired assets used for the recovery and production of petroleum deposits, including license rights, are also depreciated using the unit-of-production method based on proven and probable reserves. The reserve basis used for depreciation purposes is updated at least annually. Any changes in the reserves affecting unit-of-production calculations are reflected prospectively.
Depreciation of assets other than oil and gas fields, inclu-ding right of use assets, is calculated using the straight-line method over estimated useful lives and adjusted for any impairment or change in residual value, if applicable.
1.12 Impairment
Tangible fixed assets and intangible assetsTangible fixed assets and intangible assets (including license rights, exclusive of goodwill) with a finite useful life will be assessed for potential impairment when events or changes in circumstances indicate that the book value of the assets is higher than the recoverable amount.
The unit of account for assessment of impairment is based on the lowest level at which it is possible to identify cash inflows that are independent of cash inflows from other groups of fixed assets. For oil and gas assets, this is typically the field or license level. Impairment is recognized when the book value of the CGU (including any allocated goodwill) exceeds the recoverable amount. The recoverable amount is the higher of the asset’s fair value less cost of disposal and value in use. When estimating value in use and fair value less cost of disposal, expected future cash flows are discounted to the net present value by applying a discount rate after tax that reflects the current market valuation of the time value of money and the specific risk related to the asset. The discount rate is derived from the Weighted Average Cost of Capital (WACC).
The lifetime of the field for the purpose of impairment testing is normally determined by the point in time when the operating cash flow from the field becomes negative.
For exploration licenses, impairment is based on an assess-ment of whether plans for further activities have been esta-blished or, if applicable, an evaluation of whether develop-ment will be decided on in the near future as described in section 1.11.
A previously recognized impairment can only be reversed if changes have occurred in the estimates used for the calculation of the recoverable amount. However, the reversal cannot be to an amount that is higher than it would have been if the impairment had not previously been recognized. Such reversals are recognized in the Income statement. After a reversal, the depreciation amount is adjusted in future periods in order to distribute the asset’s revised book value, minus any residual value, on a systematic basis over the asset’s expected remaining life.
GoodwillGoodwill is tested for impairment annually or more frequ-ently if events or changes in circumstances indicate that the value may be impaired.

100 · Aker BP Annual Report 2020 · Financial Statements with Notes
Impairment is recognized if the recoverable amount of the CGU (or group of CGUs) to which the goodwill is related is less than the book value, including associated goodwill and deferred tax as described in section 1.8. Losses relating to impairment of goodwill cannot be reversed in future periods.
1.13 Financial instruments The company has classified the financial instruments into the following categories of financial assets and liabilities:
• Financial assets at fair value designated as such upon initial recognition
• Cash and receivables • Financial liabilities at fair value designated as such upon
initial recognition• Financial liabilities measured at amortized costs
Financial assets with fixed or determinable cash flows that are not quoted in an active market are classified as loans and receivables.
Financial liabilities that do not form part of the “held for tra-ding purposes” category and which have not been designa-ted as being at fair value with changes in value through profit or loss are classified as other financial liabilities.
Further details on fair values of financial instruments are pro-vided in note 29 ‘Financial instruments’.
1.14 Impairment of financial assets Financial assets that are held at amortized cost are impaired when, based on objective evidence, it is likely that the instru-ment’s cash flows have been negatively affected by one or more events that have occurred after initial recognition. In addition, the loss event must have an impact on estimated future cash flows that can be reliably estimated. The impair-ment is recognized in the Income statement.
1.15 Research and development Research consists of original, planned studies carried out with a view to achieving new scientific or technical knowledge or understanding, and the associated costs are expensed as incurred. Development consists of the appli-cation of information gained through research, or of other knowledge, to a plan or design for the production of new or significantly improved materials, facilities, products, proces-ses, systems or services before commercial production or use commences. Development costs are capitalized when the underlying project is technically feasible.
1.16 Presentation of payroll and administration costs The company presents its payroll and administration costs based on the functions in development, operational and exploration activities respectively, based on allocation of
registered hours worked, net of amounts recharged to ope-rated licenses.
1.17 Leases At the inception of a contract, the company assesses whet-her the contract is, or contains, a lease. A contract is, or contains, a lease if the contract conveys the right to control the use of an identified asset for a period of time in exchange for consideration.
The lease liability is recognized at the commencement date and measured at the present value of the remaining lease payments, discounted using the company’s incremental bor-rowing rate at the commencement date. The borrowing rate is derived from the terms of the company’s existing credit facilities. RoU assets are depreciated over the lease term as this is ordinarily shorter than the useful life of the assets. The lease term represents the non-cancellable period of the lease, together with periods covered by an option either to extend or to terminate the lease when the company is reaso-nably certain to exercise this option.
The company applies the exemption for short term leases (12 months or less) and low value leases. As such, related lease payments are not recognized in the balance sheet, but expensed or capitalized in line with the accounting treatment for other non-lease expenses. The inclusion of non-lease components may vary across different lease categories, but for the most material class of assets (rigs), the company has excluded the non-lease components when measuring the lease liability.
The company may enter into lease contracts as an operator on behalf of a license, and has for such leases only recog-nized its net share of the related lease liability. Whether a contract is entered into on behalf of the license is subject to a contract specific assessment, but the general principle is that there needs to be a direct link between the lease contract and the license or field on which the RoU asset shall be used. Other lease contracts, such as offices and supply vessels not linked to specific fields, are recognized on a gross basis although the related cashflows are charged to the license partners, typically via cost pools. For such contracts, the partner’s share of the cost recovered by the company are presented as other income.
The company may enter into lease contracts in its own name at the initial signing, and subsequently allocate the related RoU asset to operated licenses. In such cases, the license allocation will normally be the basis for determining both the commencement and the duration of the lease (and applica-tion of the short-term lease exemption).

101 · Aker BP Annual Report 2020 · Financial Statements with Notes
1.18 Trade debtors Trade debtors are recognized in the Statement of Financial Position at nominal value after a deduction for the provision for credit losses.
1.19 Borrowing costs Borrowing costs that can be directly ascribed to procure-ment, processing or production of a qualifying asset are capitalized as part of the asset’s acquisition cost. Borrowing cost is only capitalized during the development phase. Other borrowing costs are expensed in the period in which they are incurred.
A qualifying asset is one that necessarily takes a substantial period of time to be made ready for its intended use or sale. Qualifying assets are generally those that are subject to major development or construction projects.
1.20 Inventories Inventories mainly consists of equipment for the drilling of exploration and production wells and are valued at the lower of cost price (based on weighted average cost) and net realizable value.
1.21 Cash and cash equivalents Cash and cash equivalents include cash, bank deposits, and other short-term highly liquid investments with an original due date of three months or less. Bank overdrafts are included in the Statement of Financial Position as short-term loans.
1.22 Interest-bearing debt All borrowings are initially recognized at transaction price, which equals the fair value of the amount received net of costs directly related to the establishment of the loan or issuance of debt.
Subsequently, interest-bearing borrowings are valued at amortized cost using the effective interest method; the diffe-rence between the transaction price (after transaction costs) and the face value is recognized in the Income statement in the period until the loan falls due. Amortized costs are cal-culated by considering all issue costs on the settlement date, except for any discount or premium expensed immediately.
1.23 Tax
GeneralTax consists of tax payable and changes in deferred tax. Deferred tax/tax benefits are calculated on the basis of the differences between book value and tax basis values of assets and liabilities, with the exception of temporary differences on acquisition of licenses that are defined as asset purchases.
Deferred tax is measured using the expected tax rate when the tax benefit is realised or the tax liability is met, based on tax rates and tax regulations that have been enacted or substantively enacted at the reporting date.
Tax payable and deferred tax is recognized directly against equity or other comprehensive income insofar as the tax items are related to equity transactions or items of other comprehensive income.
Deferred tax and tax benefits are presented net, where netting is legally permitted and the deferred tax benefit and liability are related to the same tax subject and are payable to the same tax authorities.
Functional currencyThe company’s functional currency is USD, while it is a statu-tory requirement to calculate the current tax based on NOK functional currency. This may impact the effective tax rate when the exchange rate between NOK and USD fluctuates. The revaluation of tax receivable and payable is presented as foreign exchange gain/loss, while the impact on deferred tax from revaluation of tax balances is presented as tax expense / income.
Petroleum taxationAs a production company, Aker BP is subject to the special provisions of the Petroleum Taxation Act. Taxable profits from activities on the Norwegian Continental Shelf are liable to ordinary company tax and special tax. The tax rate for general corporate tax was 22 percent in 2019, and was unchanged in 2020. The rate for special tax was 56% for both years.
Tax depreciationPipelines and production facilities can be depreciated by up to 16 2/3 percent annually, i.e., using the straight-line method over six years. Tax depreciation commences when the expenses are incurred. When a field stops producing, any remaining tax values (except for future uplift) may be deducted in that year.
Certain temporary changes in the Petroleum Tax Law were enacted on 19 June 2020. The changes in tax law inclu-ded a temporary rule for depreciation and uplift, whereby all investments incurred for income year 2020 and 2021 including 24% uplift can be deducted for special tax (56%) in the year of investment. The temporary changes will also be applicable for investments up to and including year of produ-ction start in accordance with new PDOs delivered within 31 December 2022 and approved within 31 December 2023.

102 · Aker BP Annual Report 2020 · Financial Statements with Notes
UpliftUplift is a special income deduction in the basis for cal-culation of special tax. Uplift is calculated on the basis of investments in pipelines and production facilities, and can be regarded as an extra depreciation deduction in the special tax regime. The uplift rate was 5.2 percent in 2019 over a period of four years, totalling 20.8 percent from 2019. Uplift is recognized in the year it is deducted in the companies’ tax returns, and this has a similar effect on the tax for the period as a permanent difference. Under the temporary tax rule enacted in 2020, the uplift is 24% for income year 2020 and 2021 and can be deducted for special tax (56%) in the year of investment.
Financial itemsInterest on debt with associated currency losses/gains (net financial expenses on interest-bearing debt) is distributed between the offshore and onshore tax regimes. Offshore interest deduction is calculated as the net financial costs of interest-bearing debt multiplied by 50 percent of the ratio between net asset value for tax purposes allocated to the offshore tax regime as of 31 December in the income year and the average interest-bearing debt through the income year.
Remaining financial expenses, currency losses and all interest income as well as currency gains are allocated to the onshore jurisdiction.
Uncovered losses in the onshore tax jurisdictions resulting from the distribution of net financial items can be allocated to the offshore tax jurisdictions and deducted from regular income.
Only 50 percent of other losses in the onshore tax juris-dictions are permitted to be reallocated to the offshore tax jurisdictions as deductions in regular income.
Tax lossCompanies subject to special tax may, without time limi-tations, carry forward losses with the addition of interest. A corresponding rule also applies to unused uplift. The tax position can be transferred on realisation of the company or merger. Alternatively, disbursement of the tax value can be claimed from the State if the company ceases petroleum activities. The tax loss will thus be reclassified from deferred tax to current tax at the time the petroleum activity ceases, or is transferred to another company. Under the temporary tax rule encated in 2020, the value of tax losses incurred in 2020 and 2021 will be refunded from the state.
1.24 Employee benefits
Pension schemesThe company complies with the requirement to have an occupational pension scheme in accordance with the Norwegian law on required occupational pension (“lov om obligatorisk tjenestepensjon”).
The company makes contributions to the pension plan for full-time employees equal to 7 percent for salary up to 7.1 G and 25.1 percent between 7.1 and 12 G. The pension premi-ums are charged to expenses as they are incurred.
An early retirement scheme (AFP) has been introduced for all employees. The scheme is a multi-employer defined benefit plan, but is accounted for as a defined contribution pension, and premiums are expensed as incurred.
1.25 Provisions A provision is recognized when the company incurs a commitment (legal or constructive) as a result of a past event, it is probable that financial settlement will take place as a result of this commitment, and the amount can be reli-ably calculated. Provisions are evaluated at each period end and are adjusted to reflect the best estimate.
An onerous contract is a contract in which the unavoidable costs of meeting the obligations under the contract exceed the economic benefits expected to be received under it. A provision for onerous contracts is measured at the present value of the lower of the expected cost of terminating the contract and the expected net cost of continuing with the contract.If the discounting effect is significant, provisions are discounted using a discount rate before tax that reflects the market’s pricing of the time value and risk specifically associated with the commitment. As discounting unwinds, the book value of the provisions is increased in each period to reflect the change in time relative to the due date of the commitment. The effect of this increase is expensed as an accretion expense.
Decommissioning and removal costs: In accordance with the license terms and conditions for the licenses in which the company participates, the Norwegian State can require license owners to remove the installation in whole or in part when production ceases or the license period expires.
In the initial recognition of the decommissioning and removal obligations, the company provides for the net present value of future costs related to decommissioning and removal. A corresponding asset is capitalized as a tangible fixed asset and depreciated using the unit-of-production method.

103 · Aker BP Annual Report 2020 · Financial Statements with Notes
Changes in the time value (net present value) of the obliga-tion related to decommissioning and removal accretion are charged to income as financial expenses and increase the balance-sheet liability related to future decommissioning and removal expenses. Changes in the best estimate for expen-ses related to decommissioning and removal are recognized in the Statement of financial position, except where it relates to licenses with no future production. The discount rate used in the calculation of the fair value of the decommissioning and removal obligation is the risk-free rate with the addition of a credit risk element.
1.26 SegmentSince its formation, the company has conducted its entire business in one consistent segment, defined as exploration for and production of petroleum in Norway. The company conducts its activities on the Norwegian Continental Shelf, and management monitors the company at this level. The financial information relating to geographical distribution and large customers is presented in note 3.
1.27 Earnings per share Earnings per share are calculated by dividing the net profit/loss attributable to ordinary equity holders of the parent entity by the weighted average number of the total outstan-ding shares. Shares issued during the year are weighted in relation to the period in which they have been outstanding.
1.28 Contingent liabilities and assets Except for in the event of a business combination, neither contingent liabilities nor contingent assets are recognized.
A contingent liability is a possible obligation that arises from past events and whose existence will be confirmed only by the occurrence or non-occurrence of one or more uncertain future events not wholly within the control of the entity; or a present obligation that arises from past events but is not recognized because it is not probable that an outflow of resources embodying economic benefits will be required to settle the obligation or the amount of the obligation cannot be measured with sufficient reliability.
Contingent liabilities are disclosed with the exception of con-tingent liabilities where the probability of the liability having to be settled is remote.
Contingent assets are possible asset that arises from past events and whose existence will be confirmed only by the occurrence or non-occurrence of one or more uncertain future events not wholly within the control of the entity. Information about such contingent assets is provided if inflow of economic benefits is probable.
1.29 Changes to accounting standards and interpretations that:
Have entered into force: The group has applied the following standards and amend-ment for the first time for their annual reporting period commencing 1 January 2020:
• Definition of Material – amendments to IAS 1 and IAS 8• Interest Rate Bencmark Reform – amendments to IFRS 9,
IAS 39 and IFRS 7• Revised Conceptual Framework for Financial Reporting
The amendments listed above did not have any impact on the amounts recognized in prior periods and are not expec-ted to significantly affect the current or future periods.
Definition of a Business - amendments to IFRS 3The amendments provide updated guidance on whether an acquisition is of a business or a group of assets.
The amended definition emphasises that the output of a business is to provide goods and services to customers, whe-reas the previous definition focused on returns in the form of dividends, lower costs or other economic benefits to inves-tors and others. In addition to amending the wording of the definition, the Board has provided supplementary guidance.
The amendments did not have any impact on the amounts recognized in prior periods. However, it may have an impact on the assessment of whether a group of assets constitutes a business with regard to future acquisitions.
Have been issued but have not entered into force: Certain new accounting standards and interpretations are issued, but not yet effective as of 31 December 2020. These standards are not expected to have a material impact on the group in the current or future reporting periods.

104 · Aker BP Annual Report 2020 · Financial Statements with Notes
Note 2 Overview of subsidiaries
DDeett nnoorrsskkee oolljjeesseellsskkaapp AASS (100 percent)
AAkkeerr BBPP UUKK LLiimmiitteedd (100 percent)
AAllvvhheeiimm AASS (65 percent)
SSaannddvviikkaa FFjjeellllssttuuee AASS (100 percent)
Note 3 Segment information
Note 4 Income
BBrreeaakkddoowwnn ooff ppeettrroolleeuumm rreevveennuueess (USD 1 000) 22002200 22001199
Sales of liquids 2 581 776 2 993 456
Sales of gas 270 404 328 816
Tariff income 15 973 16 395
TToottaall ppeettrroolleeuumm ssaalleess 22 886688 115533 33 333388 666677
Sales of liquids (boe 1 000) (unaudited) 64 549 46 224
Sales of gas (boe 1 000) (unaudited) 12 384 11 317
OOtthheerr iinnccoommee (USD 1 000)
Realized gain/loss (-) on oil derivatives 55 328 -12 824
Unrealized gain/loss (-) on oil derivatives -1 734 -19 058
Gain on license transactions 5 417 -
Other income1) 52 099 40 303
TToottaall ootthheerr ooppeerraattiinngg iinnccoommee 111111 111100 88 442211
The company's business is entirely related to exploration for and production of petroleum in Norway. The company's activities are considered to have a homogeneous risk and return profile before tax, and the business in 2020 was located in the geographical area Norway. The company operates within a single operating segment which matches the internal reporting to the company's executive management. In 2020 the company had sales transactions with one customer, BP Oil International Ltd, which represented more than 10% of total sales, and accounted for USD 2 547 million. In 2019 the company also had sales transactions with one customer, BP Oil International Ltd, which represented more than 10% of total sales, and accounted for USD 2 883 million.
Det norske oljeselskap AS, previously Marathon Oil Norge AS, was acquired by Aker BP in October 2014. All activity was transferred to Aker BP on 31 October 2014. During 2020, Aker BP UK Limited (see below) was established as a subsidiary of Det norske oljeselskap AS. Except for the subsidiary, the only asset in this company is cash equivalents reflecting the share capital amounting to USD 1.0 million.
Aker BP ASA has four subsidiaries which are not consolidated in the group accounts in 2020 due to materiality considerations:
Sandvika Fjellstue AS owns a conference centre used by Aker BP, located in Sandvika in Verdal.
The sole purpose of Alvheim AS is to act as legal owner of MST Alvheim, the floating production facility which is used to produce oil and gas from the Alvheim fields. The costs of and benefits from operating the MST Alvheim will be carried by the partners in the Alvheim field. Hence, Alvheim AS only has the formal ownership rather than the actual value of the production facilities. Aker BP has a 65 percent share in Alvheim AS, which corresponds to the ownership in the Alvheim field. There were no activities in 2020.
Aker BP UK Limited was established as a subsidiary of Det norske oljeselskap AS during 2020. There were no activities in 2020. In Q1 2021, the company entered into an agreement with Eni UK to acquire a 50 percent non-operated interest in license P2511 on the UK Continental Shelf. License P2511 is located to the borderline of the Norwegian continental shelf. The key objective for the newly established partnership between Eni UK and Aker BP UK is to explore the resource potential, based on the knowledge obtained in the Alvheim area.
GGrroouupp && PPaarreenntt
1) The amounts include insurance settlements, in addition to partner coverage of RoU assets recognized on gross basis in the balance sheet and used in operated activity.
Refer to note 22 and 28 for further details regarding commodity derivatives.

105 · Aker BP Annual Report 2020 · Financial Statements with Notes
Note 5 Produced volumes and over/underlift adjustment
(USD 1 000) 22002200 22001199
Total produced volumes (boe 1 000) (unaudited) 77 101 56 886
Production cost per boe produced (USD/boe) 8.3 12.4
Production cost based on produced volumes 640 111 706 308
Adjustment for over/underlift (-) -12 137 14 014
PPrroodduuccttiioonn ccoosstt bbaasseedd oonn ssoolldd vvoolluummeess 662277 997755 772200 332211
Note 6 Exploration expenses
BBrreeaakkddoowwnn ooff eexxpplloorraattiioonn eexxppeennsseess (USD 1 000) 22002200 22001199
Seismic 25 522 28 875
Area fees 15 272 15 537
Field evaluation 44 718 42 532
Dry well expenses 56 626 176 419
Other exploration expenses 31 961 42 153
TToottaall eexxpplloorraattiioonn eexxppeennsseess 117744 009999 330055 551166
Note 7 Payroll expenses and remuneration
BBrreeaakkddoowwnn ooff ppaayyrroollll eexxppeennsseess (USD 1 000) 22002200 22001199
Payroll expenses 265 874 293 363
Pension 26 748 26 988
Social security tax 41 505 45 368
Other personnel costs 5 348 4 984
TToottaall ppaayyrroollll eexxppeennsseess 333399 447755 337700 770044
EEmmppllooyyeeee sshhaarree pprrooggrraamm
NNuummbbeerr ooff ffuullll ttiimmee eeqquuiivvaalleennttss eemmppllooyyeedd dduurriinngg tthhee yyeeaarr 22002200 22001199
Europe 1 745 1 703
TToottaall 11 774455 11 770033
GGrroouupp && PPaarreenntt
The company has an annual share purchase program for all employees, including senior executives. The shares in the program were in 2020 offered at a 25 percent discount and are subject to a three-year lock-up period, during which employees are not allowed to sell the shares. In connection with the share purchase program, all employees are also offered an interest free loan of 60 percent of the basic amount in the National Insurance scheme ("G"), to be repaid within one year. In total, employees subscribed for USD 11.9 million in 2020, compared to USD 11.5 million in 2019.
GGrroouupp && PPaarreenntt
GGrroouupp && PPaarreenntt
GGrroouupp && PPaarreenntt

106 · Aker BP Annual Report 2020 · Financial Statements with Notes
(USD 1 000) BBoonnuuss****
Karl Johnny Hersvik (Chief Executive Officer)1)830 521 133 227 1 712 19 10 355 0.0 %
Øyvind Bratsberg (Special Advisor) 406 156 2 3 567 19 54 802 0.0 %
Per Harald Kongelf (SVP Improvement) 401 155 2 1 559 20 5 546 0.0 %
Tommy Sigmundstad (SVP D&W) 356 139 4 20 519 19 9 418 0.0 %
Ole Johan Molvig (SVP Reservoir Development)2)356 139 1 - 496 19 14 874 0.0 %
Evy Glørstad (SVP Exploration & Reservoir Development)3)347 143 3 4 497 20 5 866 0.0 %
Lene Landøy (SVP Strategy and Business Development) 327 130 6 - 462 19 10 122 0.0 %
David Torvik Tønne (Chief Financial Officer) 346 139 5 - 489 19 13 900 0.0 %
Marit Blaasmo (SVP HSSEQ) 254 103 2 - 359 20 2 153 0.0 %
Kjetel Rokseth Digre (Chief Operating Officer) 4)308 93 1 - 403 13 3 002 0.0 %
Knut Arne Kristian Sandvik (SVP projects) 305 205 7 6 523 20 2 577 0.0 %
Ine Dolve (SVP Operations & Asset Development) 5)284 91 5 10 390 20 4 033 0.0 %
Lars Høier (SVP Operations & Asset Development - NOAKA)6278 89 1 5 373 19 5 675 0.0 %
TToottaall rreemmuunneerraattiioonn ooff sseenniioorr eexxeeccuuttiivveess iinn 22002200 44 779988 22 110011 117733 227777 77 334499 224466 114422 332233 00..00 %%
1) Other includes final settlement of previous LTIP scheme2) SVP Reservoir Development until 31.08.20203) SVP Exploration until 31.08.20204) Chief Operating Officer until 31.07.20205) SVP Operations & Asset Development since 01.08.20206) SVP Operations & Asset Development - NOAKA since 01.09.2020
(USD 1 000) BBoonnuuss****
Karl Johnny Hersvik (Chief Executive Officer) 826 517 1 6 1 350 20 6 081 0.0 %
Øyvind Bratsberg (Special Advisor) 425 155 1 4 584 21 54 802 0.0 %
Per Harald Kongelf (SVP Improvement) 416 153 1 - 571 21 - -
Tommy Sigmundstad (SVP D&W) 369 137 3 - 510 20 8 538 0.0 %
Ole Johan Molvig (SVP Reservoir Development) 369 137 1 - 508 20 9 582 0.0 %
Evy Glørstad (SVP Exploration) 338 133 1 2 475 21 5 866 0.0 %
Lene Landøy (SVP Strategy and Business Development) 1)316 128 2 - 447 20 5 221 0.0 %
David Torvik Tønne (Chief Financial Officer) 2)348 137 2 - 487 20 5 778 0.0 %
Marit Blaasmo (SVP HSSEQ) 3)253 82 1 1 337 21 - -
Kjetel Rokseth Digre (Chief Operating Officer) 4)285 174 1 796 1 256 14 3 002 0.0 %
Knut Arne Kristian Sandvik (SVP projects) 5)145 77 1 - 223 11 - -
Alexander Krane (Chief Financial Officer) 6)190 - 1 - 191 5 17 021 0.0 %
Olav Henriksen (SVP Projects) 7)294 53 - 1 348 11 - -
Jorunn Kvåle (SVP HSSE) 8)270 67 1 17 356 21 - -
Svein Jakob Liknes (SVP Operations) 9)209 38 2 - 249 10 - -
TToottaall rreemmuunneerraattiioonn ooff sseenniioorr eexxeeccuuttiivveess iinn 22001199 55 005544 11 998899 2233 882288 77 889933 225566 111155 889911 00..00 %%
1) SVP Strategy and Business Development since 01.02.20192) Chief Financial Officer since 01.02.20193) SVP HSSEQ since 01.05.20194) Chief Operating Officer since 01.05.2019. Other includes signing on fee 5) SVP Projects since 01.07.20196) Chief Financial Officer until 31.01.20197) SVP Projects until 31.03.20198) SVP HSSEQ until 30.04.20199) Acting SVP Operations and Asset Development until 30.04.2019
OOwwnniinngg
iinntteerreesstt
* All remuneration to senior executives is paid in NOK and converted to USD using a yearly average USD/NOK-rate of 9.4004.
** Numbers represent actual ordinary bonus earned in 2020, excluding LTIP (see description below).*** These shares have been purchased by the individuals and are not part of the remuneration. The numbers include shares held in companies where the senior executives have controlling interest.
RReemmuunneerraattiioonn ooff sseenniioorr eexxeeccuuttiivveess iinn 22002200**
SSaallaarryy
PPaayymmeennttss iinn
kkiinndd OOtthheerr
TToottaall
rreemmuunneerraattiioonn PPeennssiioonn ccoossttss
TToottaall nnuummbbeerr
ooff sshhaarreess******
RReemmuunneerraattiioonn ooff sseenniioorr eexxeeccuuttiivveess iinn 22001199**
TToottaall nnuummbbeerr
ooff sshhaarreess******
OOwwnniinngg
iinntteerreesstt
* All remuneration to senior executives is paid in NOK and converted to USD using a yearly average USD/NOK-rate of 8.8037.
** Numbers represent actual ordinary bonus earned in 2019, excluding LTIP (see description below).
*** These shares have been purchased by the individuals and are not part of the remuneration. The numbers include shares held in companies where the senior executives have controlling interest.
SSaallaarryy
PPaayymmeennttss iinn
kkiinndd OOtthheerr
TToottaall
rreemmuunneerraattiioonn PPeennssiioonn ccoossttss

107 · Aker BP Annual Report 2020 · Financial Statements with Notes
FFeeeess iinn 22002200**
NNaammee CCoommmmeennttss
Øyvind Eriksen Chairman of the Board from 11.03.2016. Chair of the Organizational Development and Compensation committee. 96 - -
Anne Marie Cannon Deputy Chair from 17.04.2013. Member of the Audit & Risk committee. 59 12 078 0.0 %
Kjell Inge Røkke Board member from 17.04.2013. 44 - -
Murray Auchincloss Board member from 16.04.2020 - - -
Trond Brandsrud Board member from 11.03.2016. Chairman of the Audit & Risk committee from 28.04.2016. 62 - -
Kate Thomson - - -
Gro Kielland 53 1 750 0.0 %
Terje Solheim 24 1 787 0.0 %
Ørjan Holstad 21 4 384 0.0 %
Ingard Haugeberg Employee representative from 30.08.2018. 21 1 510 0.0 %
Anette Hoel Helgesen Employee representative from 30.08.2018. 21 1 134 0.0 %
Nina Aas Deputy employee representative from 30.08.2018. 3 3 892 0.0 %
Oddbjørn Aune Deputy employee representative from 30.08.2018. 3 5 796 0.0 %
Hilde K.Brevik Deputy employee representative from 30.08.2018. 3 721 0.0 %
Svein Oskar Stoknes Chair of the Nomination committee from 16.04.2020. 4 - -
Ingebret Hisdal Member of the Nomination committee from 16.04.2020. 4 - -
Donna Riley Member of the Nomination committee from 16.04.2020. - - -
MMeemmbbeerr uunnttiill 1166..0044..22002200
Bernard Looney Board member from 30.09.2016. to 16.04.2020 - - -
Hilde Myberg Member of the Nomination committee from 2012 to 16.04.2020 4 - -
Arild Støren Frick Chairman of the Nomination committee from 16.04.2015 to 16.04.2020 4
TToottaall 442244 3333 225522 00..00 %%
FFeeeess iinn 22001199**
NNaammee CCoommmmeennttss
Øyvind Eriksen Chairman of the Board from 11.03.2016. Chair of the Organizational Development and Compensation committee. 102 - -
Anne Marie Cannon Deputy Chair from 17.04.2013. Member of the Audit & Risk committee. 65 12 078 0.0 %
Bernard Looney Board member from 30.09.2016. - - -
Kjell Inge Røkke Board member from 17.04.2013. 45 - -
Trond Brandsrud Board member from 11.03.2016. Chairman of the Audit & Risk committee from 28.04.2016. 68 - -
Kate Thomson - - -
Gro Kielland 50 1 750 0.0 %
Terje Solheim 26 1 787 0.0 %
Ørjan Holstad 22 2 656 0.0 %
Murray Auchincloss Deputy board member from 01.04.2017. - - -
Nina Aas Deputy employee representative from 30.08.2018. 4 2 800 0.0 %
Oddbjørn Aune Deputy employee representative from 30.08.2018. 4 4 068 0.0 %
Hilde K.Brevik Deputy employee representative from 30.08.2018. 4 350 0.0 %
Arild Støren Frick Chairman of the Nomination committee. 4 - -
Finn Haugan Member of the Nomination committee. 4 - -
Hilde Myrberg Member of the Nomination committee. 4 - -
Ingard Haugeberg Employee representative from 30.08.2018. 22 970 0.0 %
Anette Hoel Helgesen Employee representative from 30.08.2018. 22 - -
MMeemmbbeerr uunnttiill 3300..0044..22001199
Lone Margrethe Olstad Employee representative from 11.03.2016 to 30.04.2019. 1 - -
TToottaall 444455 2266 445599 00..00 %%
FFeeee
(USD 1 000)TToottaall nnuummbbeerr
ooff sshhaarreess
OOwwnniinngg
iinntteerreesstt
The tables below include regular fees to the Board and fees for participation in the Board's subcommittees, including the nomination committee. Fees to Board members employed by Aker ASA is
paid to the company, not to the Board member in person. The table also includes the number of shares and owning interest in Aker BP ASA held directly or indirectly through related parties. Indirect
ownership through other companies is included as a whole where the ownership interest is 50 percent or more.
Board member from 30.09.2016. Member of the Audit & Risk committee from 04.10.2016.
Board member from 20.03.2014. Member of the Organizational Development and Compensation committee.
Employee representative from 01.11.2017.
* Fee to board members are paid in NOK and converted to USD using a yearly average USD/NOK-rate of 9.4004.
FFeeee
(USD 1 000)TToottaall nnuummbbeerr
ooff sshhaarreess
OOwwnniinngg
iinntteerreesstt
Board member from 30.09.2016. Member of the Audit & Risk committee from 04.10.2016.
Board member from 20.03.2014. Member of the Organizational Development and Compensation committee.
Employee rep. from 20.03.2014. Member of the Organizational Development and Compensation committee.
Employee representative from 01.11.2017.
* Fee to board members are paid in NOK and converted to USD using a yearly average USD/NOK-rate of 8.8037.
Employee rep. from 20.03.2014. Member of the Organizational Development and Compensation committee.

108 · Aker BP Annual Report 2020 · Financial Statements with Notes
GGuuiiddeelliinneess aanndd aaddhheerreennccee ttoo tthhee qquuiiddeelliinneess ffoorr eexxeeccuuttiivvee rreemmuunneerraattiioonn
KKPPII (unaudited) EExxeeccuuttee IImmpprroovvee AAccttuuaall
0.5 0.45 0.46207.9 214.9 210.7
8 7 7.9
5% 10% -1.5%
8 7 6.7
2 220 2 210
Company Priorities are either important improvement initiatives or activities with clear deliverables that are critical for the company's future success. Below is a list of the priorities for 2020:
· Deliver on improvements plans to improve Assets on opex benchmark in 2020
· Deliver 1st gas on Ærfugl by end of November at planned quality and cost
· Progress Skogul to ~100% complete by Q1 at planned quality and cost
· Mature Hod Development to DG3 by end Q1
· Complete stimulation of two named Valhall wells by Q1 and five wells by Q2
· Deliver three efficiency projects that reduces environmental footprint per operated asset
· Develop Aker BP’s operating model concept by end Q2
· Mature Frosk to DG1 by end April 2020
· Realise value from NOAKA through finding a solution for the area
· Deliver decisions and related cost effect from COVID 19 actions taken
· Deliver new organisational structure establishing a fit for purpose organization
· Establish new ways of working post Covid-19
· Progress Hod Field Development to 23% by end of year 2021 at planned quality and cost
The Board makes guidelines for executive remuneration, including the CEO’s remuneration and other terms and conditions of employment. These guidelines set out the main principles applied in
determining the salary and other remuneration of executive personnel and are addressed as a separate item at the General Meeting.
In 2020, the company`s remuneration policy has been in accordance with the guidelines described in the Board of Director`s Report for 2019 and submitted to the annual general meeting for an
advisory vote in April 2020.
Relatively Shareholder Return
CO2 Intensity (kg CO2/boe) - operated fields
Total Headcount (including consultants)1) Adjusted for curtailments and asset sale2) FX adjusted based on USDNOK = 10.0
Senior executives receive a basic salary, adjusted annually. The company's senior executives participate in the general arrangements applicable to all the company's employees as regards bonus
programme (see below), pension plans and other payments in kind such as free internet connection at home and subsidized fitness centre fees. In special cases, the company may offer other benefits
in order to recruit personnel, including to compensate for bonus rights earned in previous employment.
The bonus for all employees, including the CEO and EMT, is determined by the company’s performance on a pre-defined set of key performance indicators (KPIs) and Company Priorities, which are
important improvement initiatives or activities with clear deliverables that are critical for the company's future success. For 2020, the KPIs were as follows:
Safety (SIF/1 mill hrs)
Production (mboepd)1)
Production Cost (USD/boe)2)
It is up to the Board to decide whether to pay bonuses, based on the previous year’s performance. For 2020, the bonus will be disbursed in Q1 2021.
These KPIs and company priorities are each weighted 50 percent when estimating the bonus outcome. The final bonus outcome, following the formulaic assessment of performance relative to
targets is specifically reserved as a matter for the CEO and the Compensation & Organisational Committee. Accordingly, the committee may exercise its discretion to adjust the outcome upwards or
downwards. The CEO has maximum bonus potential corresponding to 100 percent of his base salary. For other members of EMT, the limit is 60 percent. The maximum bonus for employees outside
the EMT varies from 10 percent to 30 percent based on internal job grade.
Certain members of the EMT participate in a five-year incentive program (LTIP) started in January 2019, through December 2023, linked to the relative performance of the Aker BP share price
versus a benchmark index consisting of the average of the Oslo Energy Index and the Stoxx 600 Europe Oil & Gas index (each weighted 50 percent). The incentive program payment is calculated as a
linear function of market outperformance, where an outperformance of 30 percent or more will result in a payment of the maximum cap. The market outperformance as of year end 2020 was 26%.
The maximum total payment is capped at 200 percent of the executive manager’s annual base salary. The CEO incentive program has the same mechanics and start/end date and is capped at NOK
30 million.
The pension scheme continues to be a defined contribution plan capped at twelve times the National Insurance scheme basic amount (12G) for all employees including the executive management.
The CEO and Members of the Executive Management team have 6 months mutual notice period, as opposed to 3 months for the rest of the organization. The Company has during 2020 worked to
change its severance practices with effect in 2021. The Executive Management Team will also fall under the new severance scheme if applicable. The new severance scheme will provide a period of
pay (6-12 months based on age), in addition to maintaining some employee benefits and outplacement assistance.
Adjustment of the CEO's base salary is decided by the Board. Adjustment of the base salaries for other senior executives is decided by the CEO within the wage settlement framework adopted by the
Board.

109 · Aker BP Annual Report 2020 · Financial Statements with Notes
Note 8 Auditors fee
(USD 1 000) 22002200 22001199
Fees for statutory audit services - KPMG (excluding VAT) 452 546
Fees for other attestations - KPMG (excluding VAT) 217 139
TToottaall aauuddiittoorr''ss ffeeeess 666699 668855
Note 9 Financial items
(USD 1 000) 22002200 22001199
TToottaall iinntteerreesstt iinnccoommee 33 776633 1166 449900
Realized gains on derivatives 16 821 11 261
Change in fair value of derivatives 74 537 7 316
Net currency gains 79 507 16 677
TToottaall ootthheerr ffiinnaanncciiaall iinnccoommee 117700 886655 3355 225555
Interest expenses 184 501 175 672
Interest on lease debt 16 629 23 897
Capitalized interest cost, development projects -39 267 -144 686
Amortized loan costs 19 813 21 705
TToottaall iinntteerreesstt eexxppeennsseess 118811 667777 7766 558877
Realised loss on derivatives 125 791 46 751
Change in fair value of derivatives - 10 742
Accretion expenses 116 947 121 723
Other financial expenses 19 314 38 929
TToottaall ootthheerr ffiinnaanncciiaall eexxppeennsseess 226622 005522 221188 114455
NNeett ffiinnaanncciiaall iitteemmss --226699 110011 --224422 998866
Note 10 Taxes
TTaaxx ffoorr tthhee ppeerriioodd (USD 1 000) 22002200 22001199
Current year tax payable/receivable -333 104 461 984
Prior period adjustments to current tax 7 275 -1 396
CCuurrrreenntt ttaaxx eexxppeennssee ((++))//iinnccoommee ((--)) --332255 882299 446600 558888
Change in current year deferred tax 448 393 463 106
Prior period adjustments to deferred tax -3 595 19 509
DDeeffeerrrreedd ttaaxx eexxppeennssee ((++))// iinnccoommee ((--)) 444444 779999 448822 661155
TTaaxx eexxppeennssee ((++))//iinnccoommee ((--)) 111188 997700 994433 220044
EEffffeeccttiivvee ttaaxx rraattee iinn %% 7733%% 8877 %%
GGrroouupp && PPaarreenntt
GGrroouupp && PPaarreenntt
GGrroouupp && PPaarreenntt
The rate (weighted average interest rate) used to determine the amount of borrowing cost eligible for capitalisation in 2020 is 5.30 percent. The corresponding rate for 2019 was 6.57 percent.

110 · Aker BP Annual Report 2020 · Financial Statements with Notes
RReeccoonncciilliiaattiioonn ooff ttaaxx eexxppeennssee (USD 1 000) TTaaxx rraattee 22002200 22001199
78% tax rate on profit/loss before tax 78% 127 674 845 718
Tax effect of uplift 56% -268 564 -129 619
Permanent differences on impairment 78% 169 670 114 907
Foreign currency translation of NOK monetary items 78% -62 040 -12 535
Foreign currency translation of USD monetary items 78% 129 042 -16 006
Tax effect of financial and other 22% items 56% 37 761 81 593
Currency movements of tax balances1) 78% -30 321 34 297
78% 15 748 24 848
TTaaxx eexxppeennssee ((++))//iinnccoommee ((--)) 111188 997700 994433 220044
22002200 22001199
Tangible fixed assets -3 686 831 -3 134 183
Capitalized exploration cost -407 099 -484 626
Other intangible assets -856 493 -1 037 789
Abandonment provision 2 186 518 2 170 198
Lease debt 168 293 244 340
Financial instruments -7 153 8 863
Other provisions -39 696 -2 160
NNeett ddeeffeerrrreedd ttaaxx lliiaabbiilliittyy ((--))//ddeeffeerrrreedd ttaaxx aasssseett ((++)) --22 664422 446611 --22 223355 335577
22002200 22001199
Deferred tax liability/asset at beginning of period -2 235 357 -1 752 757
Change in current year deferred tax -448 393 -463 106
Deferred tax related to acquisitions/sales1)37 727 -
Prior period adjustments 3 595 -19 509
Deferred tax charged to OCI and equity -33 15
NNeett ddeeffeerrrreedd ttaaxx lliiaabbiilliittyy ((--))//ddeeffeerrrreedd ttaaxx aasssseett ((++)) --22 664422 446611 --22 223355 335577
CCaallccuullaatteedd ttaaxx ppaayyaabbllee ((--))// ttaaxx rreecceeiivvaabbllee ((++)) (USD 1 000) 22002200 22001199
Tax payable/receivable at beginning of period -361 157 -540 860
Current year tax payable/receivable 333 104 -461 984
Tax payable/receivable related to acquisitions/sales -3 855 520
Net tax payment/tax refund -180 922 618 593
Prior period adjustments and change in estimate of uncertain tax positions -10 425 16 955
Currency movements of tax payable/receivable 59 903 5 619
NNeett ttaaxx ppaayyaabbllee ((--))//rreecceeiivvaabbllee ((++)) --116633 335522 --336611 115577
BBrreeaakkddoowwnn ooff ttaaxx eeffffeecctt ooff tteemmppoorraarryy ddiiffffeerreenncceess (USD 1 000)
GGrroouupp && PPaarreenntt
1) Tax balances are in NOK and converted to USD using the period end currency rate. When the NOK weakens against USD, the tax rate increases as there is less remaining tax depreciation measured in USD.
Other permanent differences, prior period adjustments and change in estimate of uncertain tax positions
GGrroouupp && PPaarreenntt
GGrroouupp && PPaarreenntt
DDeeffeerrrreedd ttaaxx lliiaabbiilliittyy ((--))//aasssseett ((++)) (USD 1 000)
In accordance with statutory requirements, the calculation of current tax is required to be based on NOK functional currency. This may impact the effective tax rate as the company's functional currency is USD.
GGrroouupp && PPaarreenntt
Certain temporary changes in the Petroleum Tax Law were enacted on 19 June 2020. The changes in tax law included a temporary rule for depreciation and uplift, whereby all investments incurred for income year 2020 and 2021 including 24% uplift can be deducted for special tax (56%) in the year of investment. The temporary changes will also be applicable for investments up to and including year of production start in accordance with new PDOs delivered within 31 December 2022 and approved within 31 December 2023. In addition, the value of tax losses incurred in 2020 and 2021 will be refunded from the state.
1) Related to sale of the Gina Krog field completed in Q2 2020

111 · Aker BP Annual Report 2020 · Financial Statements with Notes
Note 11 Earnings per share
(USD 1 000) 22002200 22001199
Profit for the year attributable to ordinary equity holders of the parent entity 44 715 141 051
The year's average number of ordinary shares (in thousands) 359 808 360 014
EEaarrnniinnggss ppeerr sshhaarree iinn UUSSDD 00..1122 00..3399
Note 12 Tangible fixed assets and intangible assets
TTAANNGGIIBBLLEE FFIIXXEEDD AASSSSEETTSS -- GGRROOUUPP AANNDD PPAARREENNTT
PPrrooppeerrttyy,, ppllaanntt aanndd eeqquuiippmmeenntt
(USD 1 000)
BBooookk vvaalluuee 3311..1122..22001188 22 228833 660022 33 338855 000055 7777 666699 55 774466 227755
AAccqquuiissiittiioonn ccoosstt 3311..1122..22001188 22 228833 660022 66 008866 336622 113355 006622 88 550055 002277
Additions 1 528 536 362 334 30 633 1 921 503
Disposals/retirement - - - -
Reclassification -2 561 772 2 617 326 4 718 60 271
AAccqquuiissiittiioonn ccoosstt 3311..1122..22001199 11 225500 336655 99 006666 002222 117700 441133 1100 448866 880000
AAccccuummuullaatteedd ddeepprreecciiaattiioonn aanndd iimmppaaiirrmmeennttss 3311..1122..22001188 -- 22 770011 335577 5577 339944 22 775588 775511
Depreciation - 677 217 28 065 705 282
Impairment/reversal (-) - -509 - -509
Disposals/retirement depreciation - - - -
AAccccuummuullaatteedd ddeepprreecciiaattiioonn aanndd iimmppaaiirrmmeennttss 3311..1122..22001199 -- 33 337788 006655 8855 445599 33 446633 552244
BBooookk vvaalluuee 3311..1122..22001199 11 225500 336655 55 668877 995577 8844 995544 77 002233 227766
AAccqquuiissiittiioonn ccoosstt 3311..1122..22001199 11 225500 336655 99 006666 002222 117700 441133 1100 448866 880000
Additions 586 301 739 166 21 954 1 347 421
Disposals/retirement1) - 675 733 -69 675 664
Reclassification2) -747 913 757 420 48 867 58 375
AAccqquuiissiittiioonn ccoosstt 3311..1122..22002200 11 008888 775544 99 888866 887755 224411 330044 1111 221166 993322
AAccccuummuullaatteedd ddeepprreecciiaattiioonn aanndd iimmppaaiirrmmeennttss 3311..1122..22001199 -- 33 337788 006655 8855 445599 33 446633 552244
Depreciation - 963 619 40 776 1 004 395
Impairment/reversal (-) - 67 099 - 67 099
Disposals/retirement depreciation1) - -584 292 69 -584 223
AAccccuummuullaatteedd ddeepprreecciiaattiioonn aanndd iimmppaaiirrmmeennttss 3311..1122..22002200 -- 33 882244 449911 112266 330055 33 995500 779955
BBooookk vvaalluuee 3311..1122..22002200 11 008888 775544 66 006622 338844 111144 999999 77 226666 113377
PPrroodduuccttiioonn ffaacciilliittiieess iinncclluuddiinngg wweellllss
FFiixxttuurreess aanndd ffiittttiinnggss,, ooffffiiccee
mmaacchhiinneerryy TToottaallAAsssseettss uunnddeerr ddeevveellooppmmeenntt
1) The disposal is mainly related to sale of the Gina Krog field and relinquishment of the Jette license.
Capitalized exploration expenditures are reclassified to "Assets under development" when the field enters into the development phase. If development plans are subsequently re-evaluated, the associated costs remain in assets under development and are not reclassified back to exploration assets. Assets under development are reclassified to "Production facilities" from the start of production. Production facilities, including wells, are depreciated in accordance with the unit-of-production method. Office machinery, fixtures and fittings etc. are depreciated using the straight-line method over their useful life, i.e. 3 - 5 years. Removal and decommissioning costs are included as production facilities or assets under development.
2) The reclassification is mainly relating to the Skogul and Ærfugl phase 1 development projects, which entered into production phase during 2020.
See note 13 for information regarding impairment charges.
Earnings per share is calculated by dividing the year's profit attributable to ordinary equity holders of the parent entity, which was USD 45 million (USD 141 million in 2019) by the year's weighted average number of outstanding ordinary shares, which was 359.8 million (360.0 million in 2019). There are no option schemes or convertible bonds in the company, meaning there is no difference between the ordinary and diluted earnings per share.
GGrroouupp && PPaarreenntt
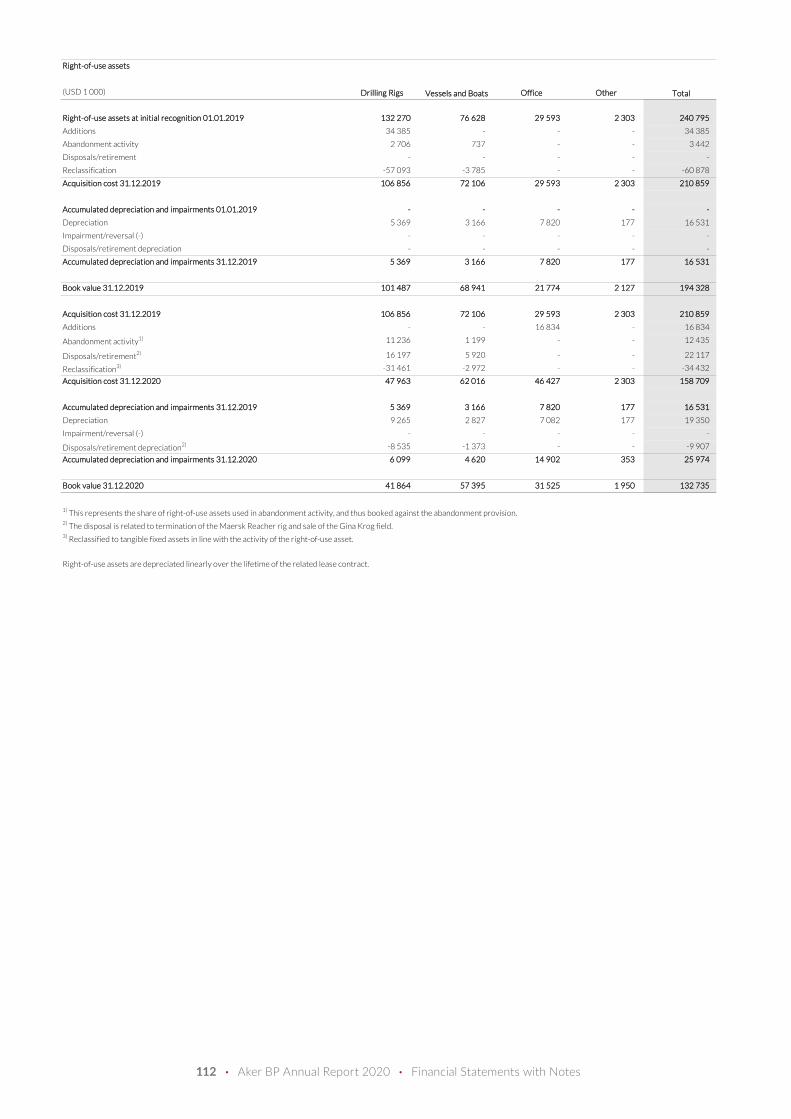
112 · Aker BP Annual Report 2020 · Financial Statements with Notes
RRiigghhtt--ooff--uussee aasssseettss
(USD 1 000) DDrriilllliinngg RRiiggss OOffffiiccee OOtthheerr
RRiigghhtt--ooff--uussee aasssseettss aatt iinniittiiaall rreeccooggnniittiioonn 0011..0011..22001199 113322 227700 7766 662288 2299 559933 22 330033 224400 779955
Additions 34 385 - - - 34 385
Abandonment activity 2 706 737 - - 3 442
Disposals/retirement - - - - -
Reclassification -57 093 -3 785 - - -60 878
AAccqquuiissiittiioonn ccoosstt 3311..1122..22001199 110066 885566 7722 110066 2299 559933 22 330033 221100 885599
AAccccuummuullaatteedd ddeepprreecciiaattiioonn aanndd iimmppaaiirrmmeennttss 0011..0011..22001199 -- -- -- -- --
Depreciation 5 369 3 166 7 820 177 16 531
Impairment/reversal (-) - - - - -
Disposals/retirement depreciation - - - - -
AAccccuummuullaatteedd ddeepprreecciiaattiioonn aanndd iimmppaaiirrmmeennttss 3311..1122..22001199 55 336699 33 116666 77 882200 117777 1166 553311
BBooookk vvaalluuee 3311..1122..22001199 110011 448877 6688 994411 2211 777744 22 112277 119944 332288
AAccqquuiissiittiioonn ccoosstt 3311..1122..22001199 110066 885566 7722 110066 2299 559933 22 330033 221100 885599
Additions - - 16 834 - 16 834
Abandonment activity1) 11 236 1 199 - - 12 435
Disposals/retirement2) 16 197 5 920 - - 22 117
Reclassification3) -31 461 -2 972 - - -34 432
AAccqquuiissiittiioonn ccoosstt 3311..1122..22002200 4477 996633 6622 001166 4466 442277 22 330033 115588 770099
AAccccuummuullaatteedd ddeepprreecciiaattiioonn aanndd iimmppaaiirrmmeennttss 3311..1122..22001199 55 336699 33 116666 77 882200 117777 1166 553311
Depreciation 9 265 2 827 7 082 177 19 350
Impairment/reversal (-) - - - - -
Disposals/retirement depreciation2) -8 535 -1 373 - - -9 907
AAccccuummuullaatteedd ddeepprreecciiaattiioonn aanndd iimmppaaiirrmmeennttss 3311..1122..22002200 66 009999 44 662200 1144 990022 335533 2255 997744
BBooookk vvaalluuee 3311..1122..22002200 4411 886644 5577 339955 3311 552255 11 995500 113322 773355
1) This represents the share of right-of-use assets used in abandonment activity, and thus booked against the abandonment provision.
3) Reclassified to tangible fixed assets in line with the activity of the right-of-use asset.
Right-of-use assets are depreciated linearly over the lifetime of the related lease contract.
VVeesssseellss aanndd BBooaattss
2) The disposal is related to termination of the Maersk Reacher rig and sale of the Gina Krog field.
TToottaall

113 · Aker BP Annual Report 2020 · Financial Statements with Notes
IINNTTAANNGGIIBBLLEE AASSSSEETTSS -- GGRROOUUPP AANNDD PPAARREENNTT
(USD 1 000) LLiicceennsseess eettcc.. SSooffttwwaarree TToottaall GGooooddwwiillll
BBooookk vvaalluuee 3311..1122..22001188 22 000055 888855 -- 22 000055 888855 442277 443399 11 886600 112266
AAccqquuiissiittiioonn ccoosstt 3311..1122..22001188 22 339966 229900 77 550011 22 440033 779911 442277 443399 22 773388 997733
Additions 143 - 143 370 185 -
Disposals/expensed dry wells - - - 176 916 -
Reclassification - - - 608 -
AAccqquuiissiittiioonn ccoosstt 3311..1122..22001199 22 339966 443333 77 550011 22 440033 993344 662211 331155 22 773388 997733
AAccccuummuullaatteedd ddeepprreecciiaattiioonn aanndd iimmppaaiirrmmeennttss 3311..1122..22001188 339900 440044 77 550011 339977 990066 -- 887788 884477
Depreciation 90 060 - 90 060 - -
Impairment - - - - 147 317
Retirement/transfer depreciations - - - - -
AAccccuummuullaatteedd ddeepprreecciiaattiioonn aanndd iimmppaaiirrmmeennttss 3311..1122..22001199 448800 446655 77 550011 448877 996666 -- 11 002266 116655
BBooookk vvaalluuee 3311..1122..22001199 11 991155 996688 -- 11 991155 996688 662211 331155 11 771122 880099
AAccqquuiissiittiioonn ccoosstt 3311..1122..22001199 22 339966 443333 77 550011 22 440033 993344 662211 331155 22 773388 997733
Additions - - - 127 283 -
Disposals/expensed dry wells 27 448 - 27 448 56 626 12 391
Reclassification - - - -23 942 -
AAccqquuiissiittiioonn ccoosstt 3311..1122..22002200 22 336688 998855 77 550011 22 337766 448866 666688 002299 22 772266 558833
AAccccuummuullaatteedd ddeepprreecciiaattiioonn aanndd iimmppaaiirrmmeennttss 3311..1122..22001199 448800 446655 77 550011 448877 996666 -- 11 002266 116655
Depreciation 98 073 - 98 073 - -
Impairment/reversal (-) 294 549 - 294 549 146 107 65 373
Disposals/retirement depreciation -25 413 - -25 413 - -12 391
AAccccuummuullaatteedd ddeepprreecciiaattiioonn aanndd iimmppaaiirrmmeennttss 3311..1122..22002200 884477 667744 77 550011 885555 117755 114466 110077 11 007799 114466
BBooookk vvaalluuee 3311..1122..22002200 11 552211 331111 -- 11 552211 331111 552211 992222 11 664477 443366
DDeepprreecciiaattiioonn iinn tthhee IInnccoommee ssttaatteemmeenntt (USD 1 000) 22002200 22001199
Depreciation of tangible fixed assets 1 004 395 705 282
Depreciation of right-of-use assets 19 350 16 531
Depreciation of intangible assets 98 073 90 060
TToottaall ddeepprreecciiaattiioonn iinn tthhee IInnccoommee ssttaatteemmeenntt 11 112211 881188 881111 887744
IImmppaaiirrmmeenntt iinn tthhee IInnccoommee ssttaatteemmeenntt (USD 1 000)
Impairment/reversal of tangible fixed assets 67 099 -509
Impairment/reversal of other intangible assets 294 549 -
Impairment/reversal of capitalized exploration expenditures 146 107 -
Impairment of goodwill 65 373 147 317
TToottaall iimmppaaiirrmmeenntt iinn tthhee IInnccoommee ssttaatteemmeenntt 557733 112288 114466 880088
GGrroouupp && PPaarreenntt
CCaappiittaalliizzeedd eexxpplloorraattiioonn
eexxppeennddiittuurreess
OOtthheerr iinnttaannggiibbllee aasssseettss
Licenses include both planned and producing projects on various fields. The producing projects are depreciated in line with the unit-of-production method for the applicable field.
See note 13 for information regarding impairment charges.

114 · Aker BP Annual Report 2020 · Financial Statements with Notes
Note 13 Impairments
IImmppaaiirrmmeenntt tteessttiinngg
OOiill aanndd ggaass pprriicceess
YYeeaarr UUSSDD//BBOOEE
2021 51.4
2022 50.2
2023 49.6
From 2024 (in real terms) 65.0
YYeeaarr GGBBPP//tthheerrmm
2021 0.47
2022 0.43
2023 0.42
From 2024 (in real terms)1) 0.52
OOiill aanndd ggaass rreesseerrvveess
FFuuttuurree eexxppeennddiittuurree
DDiissccoouunntt rraattee
The discount rate is derived from the company's weighted average cost of capital ("WACC"). The capital structure considered in the WACC calculation is derived from the capital structures of an identified peer group and market participants with consideration given to optimal structures. The cost of equity is derived from the expected return on investment by the company's investors. The cost of debt is based on the interest-bearing borrowings on debt specific to the assets acquired. The beta factors are evaluated annually based on publicly available market data about the identified peer group.
The nominal oil prices applied in the impairment test are as follows:
For producing licenses and licenses in the development phase, recoverable amount is estimated based on discounted future after tax cash flows. Below is an overview of the key assumptions applied for impairment testing purposes as of 31 December 2020.
The nominal gas prices applied in impairment test are as follows:
Impairment is recognized when the book value of an asset or a cash-generating unit, including associated goodwill, exceeds the recoverable amount. Correspondingly, a reversal of impairment is recognized when the recoverable amount exceeds the book value. Prior period impairment of goodwill is not subject to reversal. The recoverable amount is the higher of the asset's fair value less cost to sell and value in use. The impairment testing for 2020 has been performed in accordance with the fair value method (level 3 in fair value hierarchy) and based on discounted cash flows. The expected future cash flow is discounted to the net present value by applying a discount rate after tax that reflects the current market valuation of the time value of money, and the specific risk related to the asset. The discount rate is derived from the weighted average cost of capital (WACC) for a market participant. Cash flows are projected for the estimated lifetime of the fields, which may exceed periods greater than five years.
- Impairment test of fixed assets and related intangible assets, other than goodwill
- Impairment test of goodwill
Future price level is a key assumption and has significant impact on the net present value. Forecasted oil and gas prices are based on management's estimates and available market data. Information about market prices in the near future can be derived from the futures contract market. The information about future prices is less reliable on a long-term basis, as there are fewer observable market transactions going forward. In the impairment test, the oil and gas prices are therefore based on the forward curve from the beginning of 2021 to the end of 2023. From 2024, the oil and gas prices are based on the company's long-term price assumptions. Long-term oil price assumption is unchanged from year-end 2019.
Future capex, opex and abandonment cost are calculated based on the expected production profiles and the best estimate of the related cost.
The post tax nominal discount rate used in Q4 is 8.1 percent. This represents a change from 7.8 percent applied in previous quarters in 2020 and year end 2019
Impairment tests of individual cash-generating units are performed when impairment or reversal triggers are identified, and for goodwill impairment is tested at least annually. In 2020, two categories of impairment tests have been performed:
Future cash flows are calculated on the basis of expected production profiles and estimated proven and probable remaining reserves. For more information about the determination of the reserves, reference is made to note 1, section 1.3, and to note 31.
1) Except for 2026 and 2027 where 0.37 GBP/therm (in real terms) are applied.

115 · Aker BP Annual Report 2020 · Financial Statements with Notes
CCuurrrreennccyy rraatteess
YYeeaarr UUSSDD//NNOOKK
2021 8.59
2022 8.62
2023 8.67
From 2024 8.00
IInnffllaattiioonn
IImmppaaiirrmmeenntt tteessttiinngg ooff aasssseettss iinncclluuddiinngg tteecchhnniiccaall ggooooddwwiillll
CCaasshh--ggeenneerraattiinngg uunniitt (USD 1 000) Ula/Tambar Ivar Aasen
Net carrying value 854 116 1 043 418
Recoverable amount 689 876 928 383
IImmppaaiirrmmeenntt//rreevveerrssaall ((--)) 116644 223399 111155 003355
Allocated as follows:
Technical goodwill 54 202 11 170
Other intangible assets/license rights 110 037 36 504
Tangible fixed assets - 67 361
SSeennssiittiivviittyy aannaallyyssiiss
AAssssuummppttiioonn (USD 1 000) CChhaannggee
Oil and gas price forward period +/- 50 % -171 841 605 232
Oil and gas price long-term +/- 20 % -171 841 351 629
Production profile (reserves) +/- 5 % -133 225 133 225
Discount rate +/- 1 % point 68 234 -73 544
Currency rate USD/NOK +/- 2.0 NOK -152 416 412 548
Inflation +/- 1 % point -145 025 131 350
EExxpplloorraattiioonn aasssseettss
IImmppaaiirrmmeenntt tteessttiinngg ooff rreessiidduuaall ggooooddwwiillll
Below is an overview of the impairment charge and the carrying value per cash generating unit where impairment has been recognized in 2020:
During 2020 the market situation has increased the uncertainty of the exploration portfolio. As a result, a total impairment charge of USD 293.9 million has been recognized in the year. The impairment charge has been allocated between other intangible assets and capitalized exploration expenditures with USD 147.7 million and USD 146.1 million respectively. The impairment charge mainly relates to Gohta and Filicudi, as well as parts of Trell & Trine and King Lear.
The table below shows how the impairment or reversal of impairment of assets and technical goodwill would be affected by changes in the various assumptions, given that the remaining assumptions are constant. The CGU's impacted are Ula/Tambar, Ivar Aasen and Alvheim.
CChhaannggee iinn ggooooddwwiillll iimmppaaiirrmmeenntt aafftteerr
IInnccrreeaassee iinn aassssuummppttiioonn DDeeccrreeaassee iinn aassssuummppttiioonn
The main reasons for the impairment are decrease in the near-term oil and gas prices and updated cost and production profiles.
Although illustrative impairment sensitivity assumes no changes to other input factors, a price reduction of 20% is likely to result in changes in business plans as well as other factors used when estimating an asset’s recoverable amount. Changes in such input factors would likely significantly reduce the actual impairment amount compared to the illustrative sensitivity above.
Long term currency rate has been changed from USD/NOK 7.5 at year end 2019.
The technical goodwill recognized in previous business combinations is allocated to each CGU for the purpose of impairment testing. Hence, the impairment test of technical goodwill is included in the impairment testing of assets, and the technical goodwill is written down before the asset. The carrying value of the assets is the sum of tangible assets, intangible assets and technical goodwill as of the assessment date. In the impairment test performed, carrying value is adjusted by the remaining part of deferred tax from which the technical goodwill arose, to avoid an immediate impairment of all technical goodwill. When deferred tax liabilities from the acquisitions decreases as a result of depreciation, more goodwill is as such exposed for impairment. This may lead to future impairment charges even though other assumptions remain stable.
Residual goodwill is allocated across all CGUs for impairment testing. The combined recoverable amount exceeds the carrying amount by a substantial margin. Based on this, no impairment of residual goodwill has been recognized.
The long-term inflation rate is assumed to be 2.0 percent, which is the same as applied at year-end 2019.
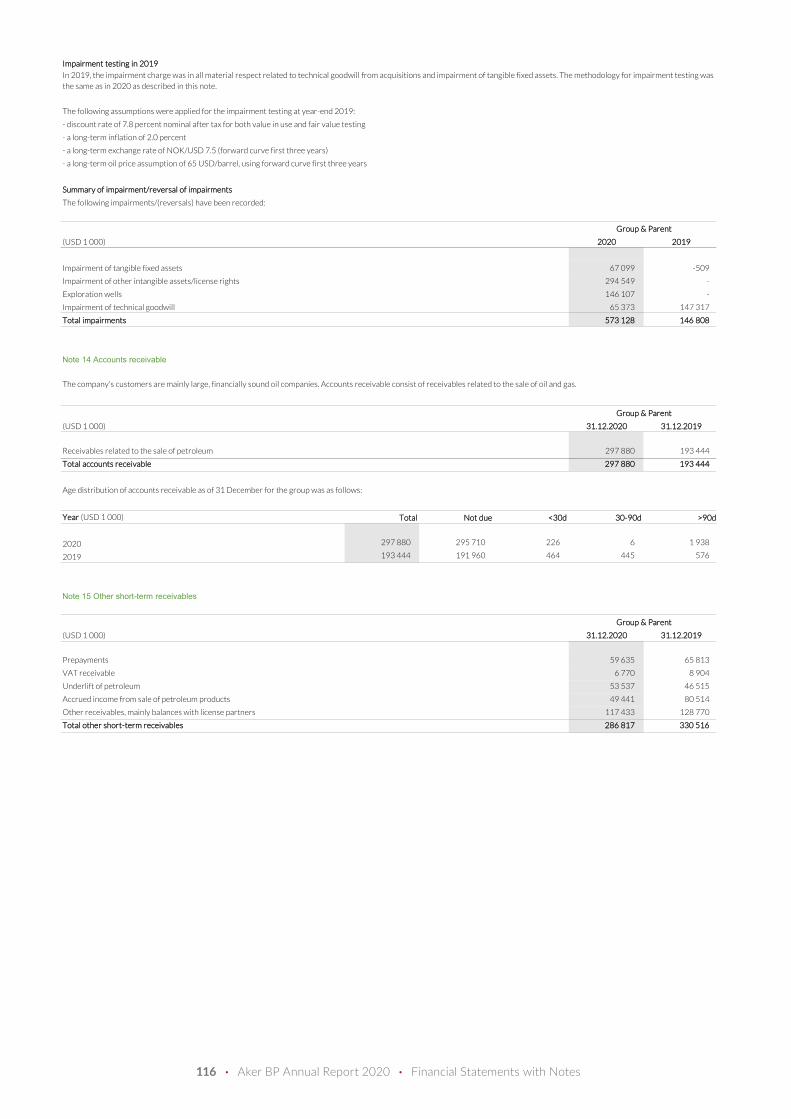
116 · Aker BP Annual Report 2020 · Financial Statements with Notes
IImmppaaiirrmmeenntt tteessttiinngg iinn 22001199
SSuummmmaarryy ooff iimmppaaiirrmmeenntt//rreevveerrssaall ooff iimmppaaiirrmmeennttss
The following impairments/(reversals) have been recorded:
(USD 1 000) 22002200 22001199
Impairment of tangible fixed assets 67 099 -509
Impairment of other intangible assets/license rights 294 549 -
Exploration wells 146 107 -
Impairment of technical goodwill 65 373 147 317
TToottaall iimmppaaiirrmmeennttss 557733 112288 114466 880088
Note 14 Accounts receivable
(USD 1 000) 3311..1122..22002200 3311..1122..22001199
Receivables related to the sale of petroleum 297 880 193 444
TToottaall aaccccoouunnttss rreecceeiivvaabbllee 229977 888800 119933 444444
Age distribution of accounts receivable as of 31 December for the group was as follows:
YYeeaarr (USD 1 000) TToottaall NNoott dduuee <<3300dd 3300--9900dd >>9900dd
2020 297 880 295 710 226 6 1 938
2019 193 444 191 960 464 445 576
Note 15 Other short-term receivables
(USD 1 000) 3311..1122..22002200 3311..1122..22001199
Prepayments 59 635 65 813
VAT receivable 6 770 8 904
Underlift of petroleum 53 537 46 515
Accrued income from sale of petroleum products 49 441 80 514
Other receivables, mainly balances with license partners 117 433 128 770
TToottaall ootthheerr sshhoorrtt--tteerrmm rreecceeiivvaabblleess 228866 881177 333300 551166
The company's customers are mainly large, financially sound oil companies. Accounts receivable consist of receivables related to the sale of oil and gas.
GGrroouupp && PPaarreenntt
GGrroouupp && PPaarreenntt
In 2019, the impairment charge was in all material respect related to technical goodwill from acquisitions and impairment of tangible fixed assets. The methodology for impairment testing was the same as in 2020 as described in this note.
GGrroouupp && PPaarreenntt
- a long-term inflation of 2.0 percent
- a long-term exchange rate of NOK/USD 7.5 (forward curve first three years)
- a long-term oil price assumption of 65 USD/barrel, using forward curve first three years
- discount rate of 7.8 percent nominal after tax for both value in use and fair value testing
The following assumptions were applied for the impairment testing at year-end 2019:

117 · Aker BP Annual Report 2020 · Financial Statements with Notes
Note 16 Inventories
The inventory mainly consists of equipment for the drilling of exploration and production wells.
IInnvveennttoorryy vvaalluuee (USD 1 000) 22002200 22001199
Inventories - measured at cost 142 291 116 595
Provision for obsolete equipment 29 586 29 057
BBooookk vvaalluuee ooff iinnvveennttoorriieess 111122 770044 8877 553399
Note 17 Other non-current assets
(USD 1 000) 3311..1122..22002200 3311..1122..22001199
Shares in Alvheim AS 10 10
Shares in Det norske oljeselskap AS 1 021 1 021
Shares in Sandvika Fjellstue AS 1 814 1 814
IInnvveessttmmeenntt iinn ssuubbssiiddiiaarriieess 22 884455 22 884455
Tenancy deposit 1 969 1 914
Unamortized fees - RCF1) 16 020 -
Other non-current assets 9 376 5 606
TToottaall ootthheerr nnoonn--ccuurrrreenntt aasssseettss 3300 221100 1100 336644
Note 18 Cash and cash equivalents
The item 'Cash and cash equivalents' consists of bank accounts and short-term investments that constitute parts of the group's transaction liquidity.
BBrreeaakkddoowwnn ooff ccaasshh aanndd ccaasshh eeqquuiivvaalleennttss (USD 1 000) 3311..1122..22002200 3311..1122..22001199
Bank deposits 537 801 107 104
CCaasshh aanndd ccaasshh eeqquuiivvaalleennttss 553377 880011 110077 110044
4 000 000 2 550 000
GGrroouupp && PPaarreenntt
Alvheim AS, Det norske oljeselskap AS (including its subsidiary Aker BP UK Limited) and Sandvika Fjellstue AS have been deemed immaterial for consolidation purposes. For more information regarding shares in subsidiaries, see note 2.
GGrroouupp && PPaarreenntt
Unused Revolving Credit Facility (see note 23)
GGrroouupp && PPaarreenntt
1) Remaining unamortized fees related to the Revolving Credit Facility (RCF), see note 23. These have been reclassified from other interest-bearing debt as the RCF was undrawn as at 31 December 2020.

118 · Aker BP Annual Report 2020 · Financial Statements with Notes
Note 19 Share capital and shareholders
(USD 1 000) 3311..1122..22002200 3311..1122..22001199
Share capital 57 056 57 056
Total number of shares (in 1 000) 360 114 360 114
Nominal value per share in NOK 1.00 1.00
OOvveerrvviieeww ooff tthhee 2200 llaarrggeesstt sshhaarreehhoollddeerrss rreeggiisstteerreedd aass ooff 3311 DDeecceemmbbeerr 22002200
AKER CAPITAL AS 144 049 40.00%
BP Exploration Operating Company Ltd 108 021 30.00%
FOLKETRYGDFONDET 13 619 3.78%
State Street Bank and Trust Comp1) 3 751 1.04%
State Street Bank and Trust Comp1) 2 633 0.73%
VERDIPAPIRFONDET DNB NORGE 2 037 0.57%
JPMorgan Chase Bank, N.A., London1) 1 913 0.53%
State Street Bank and Trust Comp1) 1 870 0.52%
The Bank of New York Mellon SA/NV1) 1 685 0.47%
DANSKE INVEST NORSKE INSTIT. II. 1 659 0.46%
CACEIS Bank Spain SA1) 1 625 0.45%
VERDIPAPIRFONDET NORDEA KAPITAL 1 317 0.37%
RBC INVESTOR SERVICES BANK S.A.1) 1 242 0.34%
VERDIPAPIRFONDET KLP AKSJENORGE IN 1 149 0.32%
The Bank of New York Mellon SA/NV1) 1 091 0.30%
VERDIPAPIRFONDET KLP AKSJENORGE 1 028 0.29%
VPF DNB AM NORSKE AKSJER 1 015 0.28%
State Street Bank and Trust Comp1) 1 009 0.28%
J.P. Morgan Bank Luxembourg S.A.1) 940 0.26%
VERDIPAPIRFONDET NORGE SELEKTIV 907 0.25%
OTHER 67 553 18.76%
TToottaall 336600 111144 110000..0000%%
1) Nominee accounts
Note 20 Bonds
(USD 1 000) MMaattuurriittyy 3311..1122..22002200 3311..1122..22001199
AKERBP – Senior Notes 6.000% (17/22) Jul 2022 - 395 046
AKERBP – Senior Notes 4.750% (19/24) Jun 2024 743 329 741 421
AKERBP – Senior Notes 3.000% (20/25) Jan 2025 496 417 -
AKERBP – Senior Notes 5.875% (18/25) Mar 2025 495 523 494 470
AKERBP – Senior Notes 2.875% (20/26) Jan 2026 496 394 -
AKERBP – Senior Notes 3.750% (20/30) Jan 2030 992 764 -
AKERBP – Senior Notes 4.000% (20/31) Jan 2031 744 139 -
LLoonngg--tteerrmm bboonnddss -- bbooookk vvaalluuee 33 996688 556666 11 663300 993366
LLoonngg--tteerrmm bboonnddss -- ffaaiirr vvaalluuee 44 119911 337755 11 772277 220055
DETNOR02 Senior unsecured bond Jul 2020 - 226 700
SShhoorrtt--tteerrmm bboonnddss -- bbooookk vvaalluuee -- 222266 770000
SShhoorrtt--tteerrmm bboonnddss -- ffaaiirr vvaalluuee -- 223388 774444
GGrroouupp && PPaarreenntt
Interest is paid on a semi annual basis. None of the bonds have financial covenants.
NNoo.. ooff sshhaarreess (in 1 000)
OOwwnniinngg iinntteerreesstt
There is only one single class of shares in the company and all shares carry a single voting right.
PPaarreenntt

119 · Aker BP Annual Report 2020 · Financial Statements with Notes
Note 21 Provision for abandonment liabilities
(USD 1 000) 3311..1122..22002200 3311..1122..22001199
Provisions as of beginning of period 2 788 218 2 552 592
Change in abandonment liability due to asset sales -13 122 -
Incurred removal cost -162 741 -108 332
Accretion expense 116 947 121 723
Impact of changes to discount rate 20 554 238 053
Change in estimates and provisions relating to new drilling and installations 55 650 -15 818
TToottaall pprroovviissiioonn ffoorr aabbaannddoonnmmeenntt lliiaabbiilliittiieess 22 880055 550077 22 778888 221188
BBrreeaakkddoowwnn ooff tthhee pprroovviissiioonn ttoo sshhoorrtt--tteerrmm aanndd lloonngg--tteerrmm lliiaabbiilliittiieess
Short-term 155 244 142 798
Long-term 2 650 263 2 645 420
TToottaall pprroovviissiioonn ffoorr aabbaannddoonnmmeenntt lliiaabbiilliittiieess 22 880055 550077 22 778888 221188
Note 22 Derivatives
(USD 1 000) 3311..1122..22002200 3311..1122..22001199
Unrealized gain currency contracts 12 841 2 706
LLoonngg--tteerrmm ddeerriivvaattiivveess iinncclluuddeedd iinn aasssseettss 1122 884411 22 770066
Unrealized gain on currency contracts 23 212 -
SShhoorrtt--tteerrmm ddeerriivvaattiivveess iinncclluuddeedd iinn aasssseettss 2233 221122 --
TToottaall ddeerriivvaattiivveess iinncclluuddeedd iinn aasssseettss 3366 005533 22 770066
Unrealized losses commodity derivatives 3 539 1 805
Unrealized losses interest rate swaps - 37 017
Unrealized losses currency contracts - 4 172
SShhoorrtt--tteerrmm ddeerriivvaattiivveess iinncclluuddeedd iinn lliiaabbiilliittiieess 33 553399 4422 999944
TToottaall ddeerriivvaattiivveess iinncclluuddeedd iinn lliiaabbiilliittiieess 33 553399 4422 999944
GGrroouupp && PPaarreenntt
GGrroouupp && PPaarreenntt
Estimates are based on executing a concept for abandonment in accordance with the Petroleum Activities Act and international regulations and guidelines. The calculations assume an inflation rate of 2.0 percent and a nominal discount rate before tax of between 3.1 percent and 4.6 percent. For previous quarters in 2020 and year end 2019 the inflation rate was 2.0 percent and the discount rate was between 3.8 percent and 4.6 percent. The credit margin included in the discount rate is 3.0 percent. For previous quarters in 2020 and year end 2019 the credit margin was 2.2 percent.
The company has various types of economic hedging instruments. Commodity derivatives are used to hedge the risk of oil price reduction. The company currently has limited exposure towards fluctuations in interest rate, but generally manages such exposure by using interest rate derivatives. Foreign currency exchange derivatives are used to manage the company's exposure to currency risks, mainly costs in NOK, EUR and GBP. These derivatives are mark to market with changes in market value recognized in the income statement. In the income statement, impacts from commodity derivatives are presented as other income, while impacts from other derivatives are presented as financial items.

120 · Aker BP Annual Report 2020 · Financial Statements with Notes
Note 23 Other interest-bearing debt
(USD 1 000) 3311..1122..22002200 3311..1122..22001199
Revolving credit facility1) - 1 429 132
LLoonngg--tteerrmm iinntteerreesstt--bbeeaarriinngg ddeebbtt -- 11 442299 113322
Note 24 Other current liabilities
BBrreeaakkddoowwnn ooff ootthheerr ccuurrrreenntt lliiaabbiilliittiieess (USD 1 000) 3311..1122..22002200 3311..1122..22001199
Balances with license partners 20 915 67 199
Share of other current liabilities in licenses 245 158 379 787
Overlift of petroleum 11 331 15 660
Payroll liabilities, accrued interest and other provisions 216 942 197 889
TToottaall ootthheerr ccuurrrreenntt lliiaabbiilliittiieess 449944 334466 666600 553355
Note 25 Lease agreements
SSiiggnniiffiiccaanntt lleeaassee aaggrreeeemmeennttss
We also had two semi-submersible rig commitment contract with Odfjell Drilling: The Deepsea Stavanger and the Deepsea Nordkapp. The Deepsea Stavanger was on contract until the end of the Ærfugl Phase 1 campaign in April 2020. A new contract was signed in 2020, committing the rig for five wells expected to be drilled in 2021. The Deepsea Nordkapp is on a three year contract commitment until June 2022, with a further one year option to extend the contract to June 2023. These rig leases have been entered into in the company’s name at the initial signing, and subsequently partly allocated to licenses. According to the planned use of the related leased assets, the duration for each license indicate that the short-term exemption will be applied. It is thus not expected that these commitments at any point in time will be recognized as a lease liability.
Non-lease components such as the service element of rig commitments are not included as part of the lease debt. As at 31 December 2020 this amounts to USD 50 million.
- Interest Coverage Ratio: EBITDA divided by Interest expenses shall be a minimum of 3.5 times
GGrroouupp && PPaarreenntt
- Leverage Ratio: Total net debt divided by EBITDAX shall not exceed 3.5 times
GGrroouupp && PPaarreenntt
1) The outstanding amount under the RCF was repaid in connection with the bond issuance in Q3. The remaining unamortized fees of USD 16.0 million is thus included in other non-current assets at 31 December 2020.
The senior unsecured Revolving Credit Facility (RCF) was established in May 2019 and comprise a 3-year USD 2.0 billion Working Capital Facility and a USD 2.0 billion 5-year Liquidity Facility. The Liquidity Facility includes two 12-month extension options, of which the first was exercised in April 2020. The interest rate is LIBOR plus a margin of 1.08 percent for the Liquidity Facility and 1.33 percent for the Working Capital Facility. In addition, a utilization fee is applicable for the Liquidity Facility. A commitment fee of 35 percent of applicable margin is paid on the undrawn facility. The financial covenants are as follows:
For 2020, the group had four rig commitments in place. This included three jack-up rigs from Maersk Drilling: the Maersk Invincible, Maersk Integrator and Maersk Reacher. The Maersk Invincible is contracted by the Valhall license until May 2022 and is included as lease in the table below. The Maersk Integrator was contracted by the Ula license until July 2020 and was included as lease in the table below. The rig was contracted until the end of 2020 by the Ivar Aasen license for infill drilling under a new well contract, and is committed by other licenses under seperate well contracts in 2021. The new well contracts will fall under the short-term exemption under IFRS 16. In addition, the Maersk Reacher was on hire for accommodation purposes on Valhall under a contract originally ending October 2020, but was terminated with effect from end of April 2020. The remaining lease debt has been derecognized.
The company has entered into leases for rig contracts, other license related commitments and office premises. The leases do not contain any restrictions on the company's dividend policy or financing. To the extent the lease has been approved and committed by the partners in the relevant Aker BP operated licenses, the committments disclosed represent Aker BP share only.
The financial covenants in the group's current debt facilities exclude the effects from IFRS 16, and therefore cannot be directly derived from the group's financial statements. See reconciliations of Alternative Performance Measures for detailed information.
The financial covenants are calculated on a 12 months rolling basis. As at 31 December 2020 the Leverage Ratio is 1.51 and Interest Coverage Ratio is 10.5 (see APM section for further details), which are well within the thresholds mentioned above. Based on the company's current business plans and applying oil and gas price forward curves at end of 2020, the company’s estimates show that the financial covenants will continue to be within the thresholds by a substantial margin.

121 · Aker BP Annual Report 2020 · Financial Statements with Notes
(USD 1 000) 22002200 22001199
LLeeaassee ddeebbtt aass ooff bbeeggiinnnniinngg ooff ppeerriioodd 331133 225566 338899 883333
New lease debt recognized in the period 16 834 34 385
Payments of lease debt1)-118 224 -134 253
Lease debt derecognized in the period -12 767 -
Interest expense on lease debt 16 629 23 897
Currency exchange differences 32 -606
TToottaall lleeaassee ddeebbtt 221155 776600 331133 225566
BBrreeaakk ddoowwnn ooff tthhee lleeaassee ddeebbtt ttoo sshhoorrtt--tteerrmm aanndd lloonngg--tteerrmm lliiaabbiilliittiieess
Short-term 83 904 110 664
Long-term 131 856 202 592
TToottaall lleeaassee ddeebbtt 221155 776600 331133 225566
11)) PPaayymmeennttss ooff lleeaassee ddeebbtt sspplliitt bbyy aaccttiivviittiieess (USD 1 000): 22002200 22001199
Investments in fixed assets 67 125 108 587
Abandonment activity 27 660 4 444
Operating expenditures 18 075 15 278
Exploration expenditures 874 1 384
Other income 4 489 4 561
TToottaall 111188 222244 113344 225533
NNoommiinnaall lleeaassee ddeebbtt mmaattuurriittyy bbrreeaakkddoowwnn (USD 1 000):
Within one year 95 124 127 747
Two to five years 99 809 175 947
After five years 57 464 61 518
TToottaall 225522 339977 336655 221122
Note 26 Commitments
CCaappiittaall ccoommmmiittmmeennttss aanndd ootthheerr ccoonnttrraaccttuuaall oobblliiggaattiioonnss
(USD 1 000) 3311..1122..22002200 3311..1122..22001199
Within one year 603 269 355 386
One to five years 321 994 520 204
After five years 92 285 102 951
TToottaall 11 001177 554488 997788 554411
GGuuaarraanntteeeess
The company has a bank guarantee related to withheld payroll tax of NOK 300 million.
The incremental borrowing rate applied in discounting of the nominal lease debt is between 2.71 percent and 6.67 percent, dependent on the duration of the lease and when it was intially recognized.
The total expenditure relating to short-term leases which are not recognized as part of lease liabilities was USD 70 million in 2020 (USD 126 million in 2019).
In connection with the booking of capacity in the infrastructure on the Norwegian Continental Shelf, the operator of the infrastructure (Gassco) requires a guarantee covering the expected transportation cost in the coming two years. This guarantee amounts to NOK 1,060 million as of year-end 2020 (NOK 980 million in 2019).
The group does not have any residual value guarantees or variable lease payments. Extension options are included in the lease liability when, based on management's judgement, it is reasonably certain that an extension will be exercised. No such extension options are recognized as at 31 December 2020. No sublease of right-of-use assets has occured.
Aker BP`s net share of capital commitments and other contractual obligations in the table below are mainly related to rig commitments not recognized as lease liabilities, rig leases not yet commenced and booked future gas transportation capacity. Parts of the rig leases have been entered into in the company’s name at the initial signing, and subsequently partly allocated to licenses. The figures have been calculated based on the assumed net share for the company based on the planned use of the related leased assets as at 31 December 2020. The planned duration for each license indicate that the short-term exemption will be applied. It is thus not expected that these commitments at any point in time will be recognized as a lease liability. The numbers below exclude any liabilities disclosed in note 25 in relation to right-of-use assets.
GGrroouupp && PPaarreenntt
GGrroouupp && PPaarreenntt

122 · Aker BP Annual Report 2020 · Financial Statements with Notes
CCoonnttiinnggeenntt lliiaabbiilliittiieess
Note 27 Transactions with related parties
TTrraannssaaccttiioonnss wwiitthh rreellaatteedd ppaarrttiieess
RReellaatteedd ppaarrttyy (USD 1 000) RReecceeiivvaabblleess ((++)) // lliiaabbiilliittiieess ((--)) 3311..1122..22002200 3311..1122..22001199
aiZe AS Other receivables 2 704 -
Cognite AS Other receivables 1 021 -
Aker Solutions ASA1) Trade creditors - -6 759
Other Aker Group Companies Trade creditors -244 -1 916
Other BP Group Companies Trade creditors -2 -1
BP Oil International Ltd. Trade debtors 294 742 126 224
Other BP Group Companies Trade debtors -368 858
Other Aker Group Companies Trade debtors - 145
RReellaatteedd ppaarrttyy (USD 1 000) RReevveennuueess ((--)) // eexxppeennsseess ((++)) 22002200 22001199
AGR Consultancy Services AS1) Purchases of consultant services 7 718 4 773
AGR Petroleum Service AS1) Exploration expenses 3 087 5 533
Aker ASA Board remuneration etc 286 553
Aker Solutions ASA1) Development costs 159 409 220 523
Aker Energy AS Recharge of consultants and shared services -159 -2 280
Akastor Real Estate AS1) Office rental 1 556 2 948
Cognite AS Purchases of consultant and IT services 12 548 11 053
Kværner AS1) Development costs 62 407 37 623
OCY Frayja Limited Platform supply vessel leases 4 210 4 251
OCY Orla Limited Platform supply vessel leases 4 210 4 251
Other Aker companies Operating expenses 1 472 1 085
BP Exploration Operating Co Other operating income/expenses -992 2 844
BP Oil International Sales of Oil and NGL -2 613 806 -2 880 261
BP Gas Marketing Sales of Gas -171 917 -279 191
Other BP Group Companies Other operating expenses 588 854
As for other licenses on the NCS, the company has unlimited liability for damage, including pollution damage. The company has insured its pro rata liability on the NCS on a par with other oil companies. Installations and liability are covered by an operational liability insurance policy.
During the normal course of its business, the company will be involved in disputes, including tax disputes. Potential tax claims related to previous taxable income of acquired companies can to some extent be reimbursed from the sellers. The company has made accruals for probable liabilities related to litigation and claims based on management's best judgment and in line with IAS 37 and IAS 12.
At year-end 2020, Aker (Aker Capital AS) and BP Exploration Operating Company Ltd are the two major shareholders in Aker BP, with a total ownership interest of 40.00 and 30.00 percent. An overview of the 20 largest shareholders is provided in note 19. Entities controlled either by the Aker Group or the BP Group are considered to be related parties under IFRS.
GGrroouupp && PPaarreenntt
GGrroouupp && PPaarreenntt
Transactions with related parties are carried out on the basis of the "arm’s length" principle.
1) These entities are not deemed related parties to Aker BP ASA from 22 December 2020, due to reduced ownership interest and the reclassification of Aker's interests in these entities to associates in the Aker Group. For practical purposes, transactions for the full year have been included but balances as of year end 2020 are excluded.

123 · Aker BP Annual Report 2020 · Financial Statements with Notes
Note 28 Financial instruments
CCaappiittaall ssttrruuccttuurree aanndd eeqquuiittyy
CCaatteeggoorriieess ooff ffiinnaanncciiaall aasssseettss aanndd lliiaabbiilliittiieess
CCaatteeggoorriieess ooff ffiinnaanncciiaall aasssseettss aanndd ffiinnaanncciiaall lliiaabbiilliittiieess -- GGrroouupp aanndd PPaarreenntt
TToottaall
AAsssseettss
Accounts receivable - 297 880 - - 297 880
Other short-term receivables1) - 227 182 - - 227 182
Cash and cash equivalents - 537 801 - - 537 801
Derivatives 36 053 - - - 36 053
TToottaall ffiinnaanncciiaall aasssseettss 3366 005533 11 006622 886622 -- -- 11 009988 991155
LLiiaabbiilliittiieess
Derivatives - - 3 539 - 3 539
Trade creditors - - - 113 517 113 517
Bonds - - - 3 968 566 3 968 566
Other interest bearing debt - - - - -
Other short-term liabilities - - - 494 346 494 346
TToottaall ffiinnaanncciiaall lliiaabbiilliittiieess -- -- 33 553399 44 557766 442299 44 557799 996688
TToottaall
AAsssseettss
Accounts receivable - 193 444 - - 193 444
Other short-term receivables1) - 264 702 - - 264 702
Cash and cash equivalents - 107 104 - - 107 104
Derivatives 2 706 - - - 2 706
TToottaall ffiinnaanncciiaall aasssseettss 22 770066 556655 225511 -- -- 556677 995577
LLiiaabbiilliittiieess
Derivatives - - 42 994 - 42 994
Trade creditors - - - 144 942 144 942
Bonds - - - 1 857 636 1 857 636
Other interest bearing debt - - - 1 429 132 1 429 132
Other short-term liabilities - - - 660 132 660 132
TToottaall ffiinnaanncciiaall lliiaabbiilliittiieess -- -- 4422 999944 44 009911 884422 44 113344 883377
1) Prepayments are not included in other short-term receivables, as they do not meet the definition of financial instruments.
The main objective of the company's management of the capital structure is to maximize return to the owners by ensuring competitive conditions for both the company's own capital and borrowed capital.
The company is rated by S&P Global, Fitch and Moody's. The investment grade rating assigned by all three companies (following Moody's upgrade in February 2021) has increased access to capital markets, including bank and bond financing, at attractive terms. The company's production level, financial position and resource and reserve levels are important parameters in relation to the assigned rating. The company continues to optimize its capital structure by balancing the return on equity against liquidity requirements.
The company monitors changes in financing needs, risk, assets and cash flows, and evaluates the capital structure continuously. To maintain the desired capital structure, the company considers various types of capital transactions, including refinancing of its debt, purchase or issue new shares or debt instruments, sell assets or pay back capital to the owners.
Unless specified otherwise, the numbers below apply both to the group and the parent.
The company has the following financial assets and liabilities: financial assets and liabilities recognized at fair value through profit or loss, cash and receivables, and other liabilities. The latter two are recognized in the accounts at amortized cost, while the first item is recognized at fair value.
3311..1122..22002200
FFiinnaanncciiaall aasssseettss aatt ffaaiirr vvaalluuee ddeessiiggnnaatteedd aass ssuucchh uuppoonn iinniittiiaall
rreeccooggnniittiioonn
CCaasshh,, ccaasshh eeqquuiivvaalleennttss aanndd
rreecceeiivvaabblleess
FFiinnaanncciiaall lliiaabbiilliittiieess aatt ffaaiirr vvaalluuee ddeessiiggnnaatteedd aass ssuucchh uuppoonn iinniittiiaall
rreeccooggnniittiioonn
FFiinnaanncciiaall lliiaabbiilliittiieess mmeeaassuurreedd aatt aammoorrttiizzeedd
ccoosstt
3311..1122..22001199
FFiinnaanncciiaall aasssseettss aatt ffaaiirr vvaalluuee ddeessiiggnnaatteedd aass ssuucchh uuppoonn iinniittiiaall
rreeccooggnniittiioonn
CCaasshh,, ccaasshh eeqquuiivvaalleennttss aanndd
rreecceeiivvaabblleess
FFiinnaanncciiaall lliiaabbiilliittiieess aatt ffaaiirr vvaalluuee ddeessiiggnnaatteedd aass ssuucchh uuppoonn iinniittiiaall
rreeccooggnniittiioonn
FFiinnaanncciiaall lliiaabbiilliittiieess mmeeaassuurreedd aatt aammoorrttiizzeedd
ccoosstt

124 · Aker BP Annual Report 2020 · Financial Statements with Notes
FFiinnaanncciiaall rriisskk
((ii)) CCoommmmooddiittyy pprriiccee rriisskk
(USD 1 000) IInnccrreeaassee//ddeeccrreeaassee iinn ooiill pprriiccee 3311..1122..22002200 3311..1122..22001199
Effect on pre-tax profit/loss: + 30% -2 548 -4 263
- 30% 9 050 31 977
((iiii)) CCuurrrreennccyy rriisskk
The table below shows the company's exposure in NOK as of 31 December:
EExxppoossuurree rreellaattiinngg ttoo (USD 1 000) 3311..1122..22002200 3311..1122..22001199
Tax receivables, cash and cash equivalents, other short-term receivables and deposits 153 700 136 056
Trade creditors, tax payable, leasing liability and other short-term liabilities -643 834 -960 920
Bonds - -230 392
NNeett eexxppoossuurree ttoo NNOOKK --449900 113344 --11 005555 225566
The company is also exposed to change in other exchange rates such as GBP/USD and EUR/USD, but the amounts are deemed immaterial.
(USD 1 000) CChhaannggee iinn eexxcchhaannggee rraattee 3311..1122..22002200 3311..1122..22001199
Effect on pre-tax profit/loss: + 10% -3 609 14 900
- 10% 4 411 -21 470
The company has financed its activities with a revolving credit facility with a syndication of banks (see note 23) and bonds (see note 20). In addition, the company has financial instruments such as accounts receivable, trade creditors, cash balances etc., directly related to its day-to-day operations. For hedging purposes, the company has different types of economic hedging instruments, but no hedge accounting is applied. Commodity derivatives are used to hedge against lower oil prices. Foreign currency exchange contracts and options are used in order to reduce currency risk related to cash flows. The company manages a portion of its interest rate exposure with a cross currency interest rate swap and interest rate derivatives. As of year end 2020 all outstanding debt holds fixed rate coupon.
The most important financial risks which the company is exposed to relate to lower oil and gas prices, change in foreign exchange rates and access to cost efficient funding.
Aker BP's revenues are derived from the sale of petroleum products, and the revenue flow is therefore exposed to oil and gas price fluctuations. The company is continuously evaluating and assessing opportunities for hedging as part of a prudent financial risk management process. At year end 2020, the company has hedges in place for 5 percent of estimated 2021 oil production, corresponding to approximately 19 percent of the after tax value, and with an average strike of 40 USD/bbl.
In 2020 the company had put options in place with a strike of 25, 30, 35, 50 and 55 USD/bbl. for approximately 21 percent of the 2020 oil production, corresponding to approximately 73 percent of the undiscounted after-tax value.
The following table summarizes the sensitivity of the commodity derivatives to a reasonably possible change in the forward oil price as of 31 December 2020, with all other variables held constant. As the company has not hedged production after 2021, the calculation is based on 2021 forward curve only. The impact presented below is on the fair value of the commodity derivatives only, and does not include other Income statement effects from changes in oil prices.
Revenues from sale of petroleum and gas are mainly in USD, EUR and GBP, while expenditures are mainly in NOK, USD, EUR and GBP. Sales and expenses in the same currency contribute to mitigating some of the currency risk. Currency derivatives may be used to further reduce this risk.
The amounts above does not include tax balances in NOK, as they are not deemed to be financial instruments.The company's management of currency risk takes into account the USD values of non-USD assets, liabilities, opex and investments over time, including those exposures arising from the requirement to perform the tax calculation in NOK while the company's functional currency is USD.
The table below shows the impact on profit/loss from changes in NOK/USD exchange rate. Other currencies are not included as the exposure is deemed immaterial.
The sensitivity above includes the impact from currency derivatives.
The company's risk management, including financial risk management, is designed to ensure identification, analysis and systematic and cost-efficient handling of risk. Established management procedures provide a sound basis for reporting and monitoring of the company's financial risk exposure.

125 · Aker BP Annual Report 2020 · Financial Statements with Notes
((iiiiii)) IInntteerreesstt--rraattee rriisskk
CChhaannggee iinn iinntteerreesstt rraattee lleevveell iinn bbaassiiss ppooiinnttss (USD 1 000) 3311..1122..22002200 3311..1122..22001199
Effect on pre-tax profit/loss: + 100 points - -11 435
- 100 points - 11 882
In order to calculate sensitivity of interest rate changes, floating interest rates have been changed by + / - 100 basis points.
((iivv)) LLiiqquuiiddiittyy rriisskk//lliiqquuiiddiittyy mmaannaaggeemmeenntt
The company's liquidity risk is the risk that it will not be able to meet its financial obligations as they fall due.
The company's objective for the placement and management of excess capital is to maintain a low risk profile and good liquidity.
The table below shows the payment structure for the company's financial commitments, based on undiscounted contractual payments:
3311..1122..22002200 BBooookk vvaalluuee 11--22 yyeeaarrss 22--55 yyeeaarrss oovveerr 55 yyeeaarrss SSUUMM
Non-derivative financial liabilities:
Bonds 3 968 566 152 630 161 875 2 160 000 2 590 938 5 065 443
Other interes bearing debt - - - - - -
Trade creditors and other liabilities 607 862 607 862 - - - 607 862
Derivative financial liabilities
Derivatives 3 539 3 539 - - 3 539
TToottaall aass ooff 3311..1122..22002200 44 557799 996688 776644 003322 116611 887755 22 116600 000000 22 559900 993388 55 667766 884444
3311..1122..22001199 BBooookk vvaalluuee 11--22 yyeeaarrss 22--55 yyeeaarrss oovveerr 55 yyeeaarrss SSUUMM
Non-derivative financial liabilities:
Bonds 1 857 636 329 761 89 000 1 339 188 507 344 2 265 293
Other interes bearing debt 1 429 132 56 150 56 150 1 607 426 - 1 719 726
Trade creditors and other liabilities 805 074 805 074 - - - 805 074
Derivative financial liabilities
Derivatives 40 289 42 994 -2 706 - - 40 289
TToottaall aass ooff 3311..1122..22001199 44 113322 113311 11 223333 998800 114422 444444 22 994466 661144 550077 334444 44 883300 338822
In July 2017 the UK’s Financial Conduct Authority announced that from 1 January 2022 it would no longer compel panel banks to submit the rates required to calculate LIBOR and the transition away from IBOR to alternative reference rates moves at various speed in different markets. However, new benchmark regulation demands that an alternative fallback rate must be in place in the event that the current IBOR rate should be discontinued. The various countries are at different stages in deciding and implementing this new rate and determining the fallback mechanism.
The company is exposed to interest-rate risk to borrowings and cash deposits. Floating-interest loans involve risk exposure for the company's future cash flows. As of 31 December 2020, the company has no oustanding debt liabilities exposed to floating interest rate risk . The corresponding debt liabilities as of 31 December 2019 amounted to approximately USD 1,7 billion with floating interest risk, distributed between short-term bonds and the revolving credit facility.
The terms of the company's debt instruments are described in notes 20 and 23. The interest-rate risk relating to cash and cash equivalents is relatively limited. The following table shows the company's sensitivity to potential changes in interest rates which is reasonably possible:
This will require Aker BP to replace the references to the relevant IBOR rates in financial agreements, with new benchmark rates or insert fallback language to cater for a discontinuation of IBOR rates, at the earliest by the end of 2021. Aker BP expects no material impact and will continue to follow the development closely.
Short-term (12 months) and long-term (five years) forecasts are prepared on a regular basis to plan the company's liquidity requirements. These plans are updated regularly for various scenarios and form part of the decision basis for the company's management and Board of Directors.
Excess liquidity is defined as the sum of bank account balances, short term bank deposits and unused credit facilities. For excess liquidity, the requirement for low liquidity risk (i.e. the risk of realization on short notice) is generally more important than maximizing the return.
The company's liquid assets as of 31 December 2020 are deposited in bank accounts and on short term time deposits with banks. As of 31 December 2020, the company had cash reserves of USD 538 million (2019: USD 107 million). Revenues and expenses are carefully managed on a day-to-day basis for liquidity risk management purposes.
CCoonnttrraacctt rreellaatteedd ccaasshh ffllooww
LLeessss tthhaann 11 yyeeaarr
CCoonnttrraacctt rreellaatteedd ccaasshh ffllooww
LLeessss tthhaann 11 yyeeaarr

126 · Aker BP Annual Report 2020 · Financial Statements with Notes
((vv)) CCrreeddiitt rriisskk
DDeetteerrmmiinnaattiioonn ooff ffaaiirr vvaalluuee
FFaaiirr vvaalluuee ooff ffiinnaanncciiaall iinnssttrruummeennttss (USD 1 000) BBooookk vvaalluuee FFaaiirr vvaalluuee BBooookk vvaalluuee FFaaiirr vvaalluuee
Financial liabilities measured at amortized cost:
Bonds 3 968 566 4 191 375 1 857 636 1 965 949
Other interest-bearing debt - - 1 429 132 1 429 132
TToottaall ffiinnaanncciiaall lliiaabbiilliittiieess 33 996688 556666 44 119911 337755 33 228866 776688 33 339955 008800
FFaaiirr vvaalluuee hhiieerraarrcchhyy
The company has no assets or liabilities in Level 3.
3311..1122..22002200
FFiinnaanncciiaall iinnssttrruummeennttss rreeccooggnniizzeedd aatt ffaaiirr vvaalluuee (USD 1 000) LLeevveell 11 LLeevveell 22 LLeevveell 33
Financial assets or liabilities measured at fair value with changes in value recognized through profit or loss
Derivatives - 32 514 -
3311..1122..22001199
FFiinnaanncciiaall iinnssttrruummeennttss rreeccooggnniizzeedd aatt ffaaiirr vvaalluuee (USD 1 000) LLeevveell 11 LLeevveell 22 LLeevveell 33
Financial assets or liabilities measured at fair value with changes in value recognized through profit or loss
Derivatives - -40 289 -
In the course of the reporting period, there were no changes in the fair value measurements that involved any transfers between levels.
The fair value of forward exchange contracts is determined using the forward exchange rate at the end of the reporting period. The fair value of commodity derivatives is determined using the forward Brent blend curve at the end of the reporting period. The fair value of interest rate swaps and cross currency interest rate swaps is determined by using the expected floating interest rates at the end of the period and is confirmed by external market sources. See note 22 for detailed information about the derivatives.
In the management of the company's liquid assets, low credit risk is prioritized. Liquid assets are generally placed in bank deposits that represent a low credit risk. All investments are subject to internal policy that requires a rating equivalent to A-2 from S&P and limits investment with a single counterparty.
The risk of counterparties being financially incapable of fulfilling their obligations is regarded as minor as there have not historically been any losses on accounts receivable. The company's customers and license partners are generally large and credit worthy oil companies, and it has thus not been necessary to make any provision for credit losses.
The maximum credit risk exposure corresponds to the book value of financial assets. The company deems its maximum risk exposure to correspond with the book value of cash and cash equivalents, accounts receivable and other short-term receivables, see notes 14, 15 and 18.
The following of the company's financial instruments have not been valued at fair value: trade debtors, other short-term receivables, other long-term receivables, short-term loans and other short-term liabilities, bonds and other interest bearing liabilities.
The carrying amount of cash and cash equivalents is approximately equal to fair value, since these instruments have a short term to maturity. Similarly, the carrying amount of accounts receivable, other receivables, trade creditors and other short-term liabilities is materially the same as their fair value as they are entered into on ordinary terms and conditions.
The USD 4,75%, 4,00%, 3,75%, 3,00% and 2,875% Senior Notes are all listed on The Luxembourg Stock Exchange and the USD 5,875% Senior Note is listed on The International Stock Exchange. The fair values for disclosure purposes are determined using the quoted value as of 31 December 2020.
The following is a comparison between the book value and fair value of the company's financial instruments, except those where the carrying amount is a reasonable approximation of fair value (such as short-term trade receivables and payables in addition to instruments measured to fair value).
3311..1122..22002200 3311..1122..22001199
The company classifies fair value measurements by employing a value hierarchy that reflects the significance of the input used in preparing the measurements. The fair value hierarchy consists of the following levels:
Level 2 - input other than listed prices of assets and liabilities included in Level 1 that is observable for assets or liabilities, either directly (i.e. as prices) or indirectly (i.e. derived from prices).
Level 1 - input in the form of listed (unadjusted) prices in active markets for identical assets or liabilities.
Level 3 - input for assets or liabilities for which there is no observable market data (non-observable input).

127 · Aker BP Annual Report 2020 · Financial Statements with Notes
RReeccoonncciilliiaattiioonn ooff lliiaabbiilliittiieess aarriissiinngg ffrroomm ffiinnaanncciinngg aaccttiivviittiieess
3311..1122..22001199 CCaasshh fflloowwss AAmmoorrttiizzaattiioonn CCuurrrreennccyy OOtthheerr ffiinn eexxpp11)) 3311..1122..22002200
Long-term interest-bearing debt (RCF) 1 429 132 -1 451 550 6 348 - 16 070
Bonds 1 857 636 2 109 195 13 465 -17 839 6 109 3 968 566
Paid dividends - -425 000 - - - -
TToottaallss 33 228866 776688 223322 664455 1199 881133 --1177 883399 2222 117799 33 996688 556666
3311..1122..22001188 CCaasshh fflloowwss AAmmoorrttiizzaattiioonn CCuurrrreennccyy OOtthheerr ffiinn eexxpp22)) 3311..1122..22001199
Long-term interest-bearing debt (RBL) 907 954 -950 000 7 249 - 34 796 -
Long-term interest-bearing debt (RCF) - 1 425 222 3 909 - - 1 429 132
Bonds 1 110 488 740 159 10 546 -3 654 97 1 857 636
Paid dividends - -750 000 - - - -
TToottaallss 22 001188 444433 446655 338811 2211 770055 --33 665544 3344 889933 33 228866 776688
2) Other financial expenses mainly represents the remaining unamortized fees in relation to the refinancing of the RBL facility (2019)
The table below shows a reconciliation between the opening and the closing balances in the statement of financial position for liabilities arising from financing activities.
NNoonn--ccaasshh cchhaannggeess
NNoonn--ccaasshh cchhaannggeess
1) Other financial expenses mainly repesents: Reclass of remaining unamortized fees of USD 16.0 million related to the RCF facility, included in other non-current assets at 31 December 2020. Discount on new bonds in 2020.

128 · Aker BP Annual Report 2020 · Financial Statements with Notes
Note 29 Investments in joint operations
FFiieellddss ooppeerraatteedd:: 3311..1122..22002200 3311..1122..22001199 FFiieellddss ooppeerraatteedd:: 3311..1122..22002200 3311..1122..22001199
Alvheim 65.000 % 65.000 % Volund 65.000 % 65.000 %
Bøyla 65.000 % 65.000 % Tambar 55.000 % 55.000 %
Hod 90.000 % 90.000 % Skogul 65.000 % 65.000 %
Ivar Aasen Unit 34.786 % 34.786 % Tambar Øst 46.200 % 46.200 %
Jette Unit1) 0.000 % 70.000 % Ula 80.000 % 80.000 %
Valhall 90.000 % 90.000 % Skarv 23.835 % 23.835 %
Vilje 46.904 % 46.904 %
Production licenses in which Aker BP is the operator:
LLiicceennssee:: 3311..1122..22002200 3311..1122..22001199 LLiicceennssee:: 3311..1122..22002200 3311..1122..22001199
PL 001B 35.000 % 35.000 % PL 777C1) 0.000 % 40.000 %
PL 006B 90.000 % 90.000 % PL 777D1) 0.000 % 40.000 %
PL 019 80.000 % 80.000 % PL 784 40.000 % 40.000 %
PL 019C1) 0.000 % 80.000 % PL 814 40.000 % 40.000 %
PL 019E 80.000 % 80.000 % PL 818 40.000 % 40.000 %
PL 019F3) 55.000 % 0.000 % PL 818B 40.000 % 40.000 %
PL 019H1) 0.000 % 80.000 % PL 822S 60.000 % 60.000 %
PL 026 92.130 % 92.130 % PL 8384) 35.000 % 0.000 %
PL 026B 90.260 % 90.260 % PL 8391) 0.000 % 23.835 %
PL 028B 35.000 % 35.000 % PL 8431) 0.000 % 40.000 %
PL 033 90.000 % 90.000 % PL 858 40.000 % 40.000 %
PL 033B 90.000 % 90.000 % PL 867 40.000 % 40.000 %
PL 036C 65.000 % 65.000 % PL 867B2) 40.000 % 0.000 %
PL 036D 46.904 % 46.904 % PL 868 60.000 % 60.000 %
PL 036E 64.000 % 64.000 % PL 869 60.000 % 60.000 %
PL 036F2) 64.000 % 0.000 % PL 873 40.000 % 40.000 %
PL 065 55.000 % 55.000 % PL 874 90.260 % 90.260 %
PL 065B 55.000 % 55.000 % PL 8931) 0.000 % 60.000 %
PL 088BS 65.000 % 65.000 % PL 906 60.000 % 60.000 %
PL 102D 50.000 % 50.000 % PL 907 60.000 % 60.000 %
PL 102F 50.000 % 50.000 % PL 914S 34.786 % 34.786 %
PL 102G 50.000 % 50.000 % PL 915 35.000 % 35.000 %
PL 102H 50.000 % 50.000 % PL 9161) 0.000 % 40.000 %
PL 127C4) 88.083 % 100.000 % PL 919 65.000 % 65.000 %
PL 146 77.800 % 77.800 % PL 932 60.000 % 60.000 %
PL 150 65.000 % 65.000 % PL 9416) 80.000 % 50.000 %
PL 159D 23.835 % 23.835 % PL 9481) 0.000 % 40.000 %
PL 203 65.000 % 65.000 % PL 9511) 0.000 % 40.000 %
PL 212 30.000 % 30.000 % PL 9631) 0.000 % 70.000 %
PL 212B 30.000 % 30.000 % PL 964 40.000 % 40.000 %
PL 212E 30.000 % 30.000 % PL 977 60.000 % 60.000 %
PL 242 35.000 % 35.000 % PL 978 60.000 % 60.000 %
PL 261 50.000 % 50.000 % PL 979 60.000 % 60.000 %
PL 262 30.000 % 30.000 % PL 9866) 50.000 % 30.000 %
PL 300 55.000 % 55.000 % PL 10055) 40.000 % 60.000 %
PL 333 77.800 % 77.800 % PL 1008 60.000 % 60.000 %
PL 340 65.000 % 65.000 % PL 1022 40.000 % 40.000 %
PL 340BS 65.000 % 65.000 % PL 1026 40.000 % 40.000 %
PL 364 90.260 % 90.260 % PL 1028 50.000 % 50.000 %
PL 442 90.260 % 90.260 % PL 1030 50.000 % 50.000 %
PL 442B 90.260 % 90.260 % PL 10412) 40.000 % 0.000 %
PL 442C2) 90.260 % 0.000 % PL 10422) 40.000 % 0.000 %
PL 460 65.000 % 65.000 % PL 10452) 65.000 % 0.000 %
PL 685 40.000 % 40.000 % PL 10472) 40.000 % 0.000 %
PL 7621) 0.000 % 20.000 % PL 10662) 50.000 % 0.000 %
PL 7771) 0.000 % 40.000 % PL 10812) 60.000 % 0.000 %
PL 777B1) 0.000 % 40.000 %
NNuummbbeerr ooff lliicceennsseess iinn wwhhiicchh AAkkeerr BBPP iiss tthhee ooppeerraattoorr 7799 8822
1) Relinquished license or Aker BP has withdrawn from the license
5) License swap with A/S Norske Shell
1) Relinquished license
2) Interest awarded in the APA Licensing round3) Acquired license4) License swap with PGNiG - PL838 from partner to operator
6) Transfer of shares from Wellesley Petroleum

129 · Aker BP Annual Report 2020 · Financial Statements with Notes
FFiieellddss nnoonn--ooppeerraatteedd:: 3311..1122..22002200 3311..1122..22001199
Atla 10.000 % 10.000 %
Enoch 2.000 % 2.000 %
Gina Krog4) 0.000 % 3.300 %
Johan Sverdrup 11.573 % 11.573 %
Oda 15.000 % 15.000 %
4) License swap with PGNiG
Production licenses in which Aker BP is a partner:
LLiicceennssee:: 3311..1122..22002200 3311..1122..22001199 LLiicceennssee:: 3311..1122..22002200 3311..1122..22001199
PL 006C 15.000 % 15.000 % PL 8111) 0.000 % 20.000 %
PL 006E 15.000 % 15.000 % PL 8384) 0.000 % 30.000 %
PL 006F 15.000 % 15.000 % PL 838B 30.000 % 30.000 %
PL 029B4) 0.000 % 20.000 % PL 8441) 0.000 % 20.000 %
PL 035 50.000 % 50.000 % PL 852 40.000 % 40.000 %
PL 035C 50.000 % 50.000 % PL 852B 40.000 % 40.000 %
PL 048D 10.000 % 10.000 % PL 852C 40.000 % 40.000 %
PL 102C 10.000 % 10.000 % PL 8571) 0.000 % 20.000 %
PL 127 50.000 % 50.000 % PL 862 50.000 % 50.000 %
PL 127B 50.000 % 50.000 % PL 8631) 0.000 % 40.000 %
PL 220 15.000 % 15.000 % PL 863B1) 0.000 % 40.000 %
PL 265 20.000 % 20.000 % PL 8641) 0.000 % 20.000 %
PL 272 50.000 % 50.000 % PL 892 30.000 % 30.000 %
PL 272B 50.000 % 50.000 % PL 902 30.000 % 30.000 %
PL 405 15.000 % 15.000 % PL 902B 30.000 % 30.000 %
PL 457BS 40.000 % 40.000 % PL 942 30.000 % 30.000 %
PL 492 60.000 % 60.000 % PL 954 20.000 % 20.000 %
PL 502 22.222 % 22.222 % PL 955 30.000 % 30.000 %
PL 533 35.000 % 35.000 % PL 961 30.000 % 30.000 %
PL 533B 35.000 % 35.000 % PL 962 20.000 % 20.000 %
PL 554 30.000 % 30.000 % PL 966 30.000 % 30.000 %
PL 554B 30.000 % 30.000 % PL 968 20.000 % 20.000 %
PL 554C 30.000 % 30.000 % PL 981 40.000 % 40.000 %
PL 554D 30.000 % 30.000 % PL 982 40.000 % 40.000 %
PL 6151) 0.000 % 4.000 % PL 985 20.000 % 20.000 %
PL 615B1) 0.000 % 4.000 % PL 1031 20.000 % 20.000 %
PL 719 20.000 % 20.000 % PL 10402) 30.000 % 0.000 %
PL 722 20.000 % 20.000 % PL 10512) 20.000 % 0.000 %
PL 780 40.000 % 40.000 % PL 10522) 20.000 % 0.000 %
PL 782S 20.000 % 20.000 % PL 10542) 30.000 % 0.000 %
PL 782SB 20.000 % 20.000 % PL 10565) 10.000 % 0.000 %
PL 782SC 20.000 % 20.000 % PL 10642) 30.000 % 0.000 %
PL 782SD 20.000 % 20.000 % PL 10692) 50.000 % 0.000 %
NNuummbbeerr ooff lliicceennsseess iinn wwhhiicchh AAkkeerr BBPP iiss aa ppaarrttnneerr 5566 5599
5) License swap with A/S Norske Shell
4) License swap with PGNiG - PL838 from partner to operator
1) Relinquished license or Aker BP has withdrawn from the license
3) Acquired license
2) Interest awarded in the APA Licensing round

130 · Aker BP Annual Report 2020 · Financial Statements with Notes
Note 30 Events after the balance sheet date
Note 31 Classification of reserves and contingent resources (unaudited)
CCllaassssiiffiiccaattiioonn ooff rreesseerrvveess aanndd ccoonnttiinnggeenntt rreessoouurrcceess
FFiigguurree 11 -- SSPPEE''ss ccllaassssiiffiiccaattiioonn ssyysstteemm uusseedd bbyy AAkkeerr BBPP AASSAA
RReesseerrvveess,, ddeevveellooppeedd aanndd nnoonn--ddeevveellooppeedd
Aker BP ASA's reserve and contingent resource volumes have been classified in accordance with the Society of Petroleum Engineer’s (SPE’s) “Petroleum Resources Management System”. This classification system is consistent with Oslo Børs requirements for the disclosure of hydrocarbon reserves and contingent resources. The framework of the classification system is illustrated in Figure 1.
All reserve estimates are based on all available data including seismic, well logs, core data, drill stem tests and production history. Industry standards are used to establish 1P and 2P. This includes decline analysis for mature fields in which reliable trends are established. For undeveloped fields and less mature producing fields reservoir simulation models or simulations models in combination with decline analysis have been used for profiles generation.
Note that an independent third party, AGR Petroleum Services AS, has certified 1P and 2P reserves for all Aker BP assets except for the minor assets Atla and Enoch, representing 0.002 percent of total 2P reserves.
On 26 January 2021 the result of the exploration well Bask was announced by the operator Lundin Energy. Although traces of hydrocarbons were found, it is not consideredcommercial and the well is classified as dry. Hence, USD 7 million representing incurred capitalized exploration as of year end 2020, has been charged to the income statement asdry well cost in Q4 2020.
On 18 February 2021, Aker BP disbursed USD 112.5 million in dividend to shareholders.
RESERVES
PROSPECTIVERESOURCES
UNRECOVERABLE
UNRECOVERABLE
CONTINGENTRESOURCES
TO
TA
L P
ET
RO
LEU
M IN
ITIA
LLY
-IN
-PLA
CE
(PII
P)
UN
RE
CO
VE
RE
D
PII
P
CO
MM
ER
CIA
LSU
B-C
OM
ME
RC
IAL
DIS
CO
VE
RE
D P
IIP
PRODUCTIONPPrroojjeecctt MMaattuurriittyy
ssuubb--ccllaasssseess
On Production
Approved forDevelopment
Justified for Development
Development Pending
Development Unclarified or On Hold
Development Not Viable
Prospect
Lead
Play
Range of uncertainty
Incr
easi
ng C
hanc
e of
Com
mer
cial
ity
Not to scale

131 · Aker BP Annual Report 2020 · Financial Statements with Notes
TTaabbllee 11 -- AAkkeerr BBPP ffiieellddss -- DDeevveellooppeedd rreesseerrvveess
FFiieelldd//pprroojjeecctt
Alvheim (Norwegian part, including Kameleon, Kneler and Viper/Kobra)
Boa
Bøyla
Frosk Test Production
Kameleon Infill Mid
Skogul
Vilje
Volund
Ivar Aasen
Johan Sverdup Phase 1
Oda
Skarv
Ærfugl A-1H
Ærfugl Phase 1
Ærfugl Phase 2
Tambar
Tambar East
Ula
Ula Drilling phase 1
Hod
Vahall
Atla
Enoch
TTaabbllee 22 -- AAkkeerr BBPP ffiieellddss -- UUnnddeevveellooppeedd rreesseerrvveess
FFiieelldd//pprroojjeecctt
Alvheim Kameleon Gas Cap Blow Down
Boa Attic South
Hanz
Ivar Aasen OP-E-SK2 (D-20)
Ivar Aasen OP-W (D-17)
Johan Sverdup Phase 2 (incl WAG)
Snadd Outer
Tambar K2 Sidetrack
Ula A-10 Recompletion
Ula Unit F Producer 1
Hod Field Development
Valhall Flank North Infill N1
Valhall Flank North Infill Phase 2
Valhall Flank North Water Injection
Valhall WP Lifetime Extension
Skarv Gråsel
65.00 % Aker BP On Production
57.62 % Aker BP On Production
Aker BP ASA has a working interest in 39 fields/projects containing reserves, see Table 1 and 2. Out of these fields/projects, 23 are in the sub-class “On Production”/Developed, 15 are in the sub-class “Approved for Development”/Undeveloped and one is in the sub-class “Justified for Development”/Undeveloped. Note that several fields have reserves in more than one reserve sub-class.
IInnvveessttmmeenntt sshhaarree OOppeerraattoorr RReessoouurrccee ccllaassss
65.00 % Aker BP On Production
65.00 % Aker BP On Production
65.00 % Aker BP On Production
65.00 % Aker BP On Production
34.79 % Aker BP On Production
11.57 % Equinor On Production
46.90 % Aker BP On Production
65.00 % Aker BP On Production
23.84 % Aker BP On Production
23.84 % Aker BP On Production
15.00 % Spirit Energy On Production
23.84 % Aker BP On Production
46.20 % Aker BP On Production
80.00 % Aker BP On Production
23.84 % Aker BP On Production
55.00 % Aker BP On Production
90.00 % Aker BP On Production
10.00 % Total On Production
80.00 % Aker BP On Production
90.00 % Aker BP On Production
65.00 % Aker BP Approved for Development
57.62 % Aker BP Approved for Development
2.00 % Repsol Sinopec On Production
IInnvveessttmmeenntt sshhaarree OOppeerraattoorr RReessoouurrccee ccllaassss
34.79 % Aker BP Approved for Development
11.57 % Equinor Approved for Development
35.00 % Aker BP Approved for Development
34.79 % Aker BP Approved for Development
80.00 % Aker BP Approved for Development
80.00 % Aker BP Approved for Development
30.00 % Aker BP Approved for Development
55.00 % Aker BP Approved for Development
Justified for Development
90.00 % Aker BP Approved for Development
90.00 % Aker BP Approved for Development
90.00 % Aker BP Approved for Development
90.00 % Aker BP Approved for Development
Total net proven reserves (1P/P90) as of 31 December 2020 to Aker BP ASA are estimated at 641 million barrels of oil equivalents. Total net proven plus probable reserves (2P/P50) are estimated at 842 million barrels of oil equivalents. The split between liquid and gas and between the different subcategories are given in tables 3 and 4.
90.00 % Aker BP Approved for Development
23.84 % Aker BP

132 · Aker BP Annual Report 2020 · Financial Statements with Notes
TTaabbllee 33 -- RReesseerrvveess bbyy ffiieelldd,, aarreeaa aanndd rreesseerrvvee ccllaassss
Gross oil Gross NGL Gross gas Gross oil equiv Net oil equiv. Gross oil/cond Gross NGL Gross gas Gross oil equiv Net oil equiv.
31.12.2020 (mmboe) (mmboe) (mmboe) (mmboe) (mmboe) (mmboe) (mmboe) (mmboe) (mmboe) (mmboe)
40 - 14 54 34 57 - 26 83 53
2 - 0 2 2 3 - 0 3 2
1 - 0 1 1 1 - 0 1 1
2 - 0 2 1 5 - 0 6 4
9 - - 9 4 14 - - 14 7
4 - 1 5 3 6 - 2 9 6
5588 -- 1166 7744 4455 8877 -- 2299 111166 7711
24 1 - 25 20 35 1 - 36 29
6 0 2 7 4 10 0 2 13 7
0 0 0 0 0 0 0 0 0 0
3300 11 22 3333 2244 4466 22 22 5500 3366
190 9 34 233 210 238 11 43 292 263
27 1 4 33 29 36 1 6 43 39
221177 1100 3399 226666 224400 227744 1133 4499 333366 330022
47 3 8 57 20 82 4 13 100 35
9 1 2 11 4 14 1 3 18 6
5555 33 1100 6688 2244 9977 55 1166 111188 4411
20 15 70 104 25 28 20 92 139 33
22 31 146 199 49 29 41 192 262 64
4422 4466 221166 330033 7744 5577 6600 228833 440011 9977
11 991177 3399 4477 22 000033 223322 22 339977 5544 5577 22 550088 229900
- - - - - - - - - -
- - - - - 1 - - 1 0
16 1 1 17 3 22 1 1 24 4
Alvheim (incl Boa)
Volund
Vilje
Bøyla
Frosk Test Production Skogul
AAllvvhheeiimm AArreeaa
Ula
Tambar
Tambar East
UUllaa AArreeaa
Valhall
Hod
VVaallhhaallll AArreeaa
Ivar Aasen
Hanz
IIvvaarr AAaasseenn AArreeaa
Skarv
ÆrfuglSSkkaarrvv AArreeaa
JJoohhaann SSvveerrddrruupp
Atla
Enoch
Oda
OOtthheerr ((AAttllaa,, EEnnoocchh aanndd OOddaa)) 1166 11 11 1177 33 2233 11 11 2255 44
TToottaall 22 333366 110000 332299 22 776644 664411 22 998800 113355 443377 33 555533 884422
TTaabbllee 44 -- RReesseerrvveess bbyy pprroojjeecctt aanndd rreesseerrvvee ccllaassss
IInntteerreesstt
OOnn pprroodduuccttiioonn Gross oil/cond. Gross NGL Gross gas Gross oil equiv Net oil equiv. Gross oil Gross NGL Gross gas Gross oil equiv Net oil equiv.
31.12.2020 % (mmboe) (mmboe) (mmboe) (mmboe) (mmboe) (mmboe) (mmboe) (mmboe) (mmboe) (mmboe)
Alvheim 65.0 % 27 - 2 29 19 39 - 7 46 30
Boa 57.6 % 7 - 1 8 5 10 - 2 12 7
Bøyla 65.0 % 2 - 0 2 2 3 - 0 3 2
Frosk Test Production 65.0 % 1 - 0 1 1 1 - 0 1 1
Kameleon Infill Mid 65.0 % 2 - 0 2 1 4 - 0 4 2
Skogul 65.0 % 2 - 0 2 1 5 - 0 6 4
Vilje 46.9 % 9 - - 9 4 14 - - 14 7
Volund 65.0 % 4 - 1 5 3 6 - 2 9 6
Ivar Aasen 34.8 % 42 2 7 52 18 75 4 12 91 32
Johan Sverdup Phase 1 11.6 % 1 538 38 46 1 622 188 1 797 49 52 1 898 220
Oda 15.0 % 16 1 1 17 3 22 1 1 24 4
Skarv 23.8 % 15 15 67 97 23 19 19 88 126 30
Ærfugl A-1H 23.8 % 5 7 34 47 11 8 12 55 74 18
Ærfugl Phase 1 23.8 % 9 11 53 73 17 10 13 61 84 20
Ærfugl Phase 2 23.8 % 7 9 41 57 14 9 12 56 76 18
Tambar 55.0 % 3 0 1 4 2 6 0 1 7 4
Tambar East 46.2 % 0 0 0 0 0 0 0 0 0 0
Ula 80.0 % 7 0 - 7 6 10 0 - 11 9
Ula Drilling phase 1 80.0 % 13 0 - 13 10 17 1 - 18 14
Hod 90.0 % 2 0 0 3 2 3 0 0 3 3
Vahall 90.0 % 162 8 30 200 180 197 9 36 242 218
Atla 10.0 % - - - - - - - - - -
Enoch 2.0 % - - - - - 1 - - 1 0
TToottaall 11 887755 9911 228866 22 225522 551111 22 225566 112200 337755 22 775511 664477
11PP // PP9900 ((llooww eessttiimmaattee)) 22PP // PP5500 ((bbeesstt eessttiimmaattee))
11PP // PP9900 ((llooww eessttiimmaattee)) 22PP // PP5500 ((bbeesstt eessttiimmaattee))
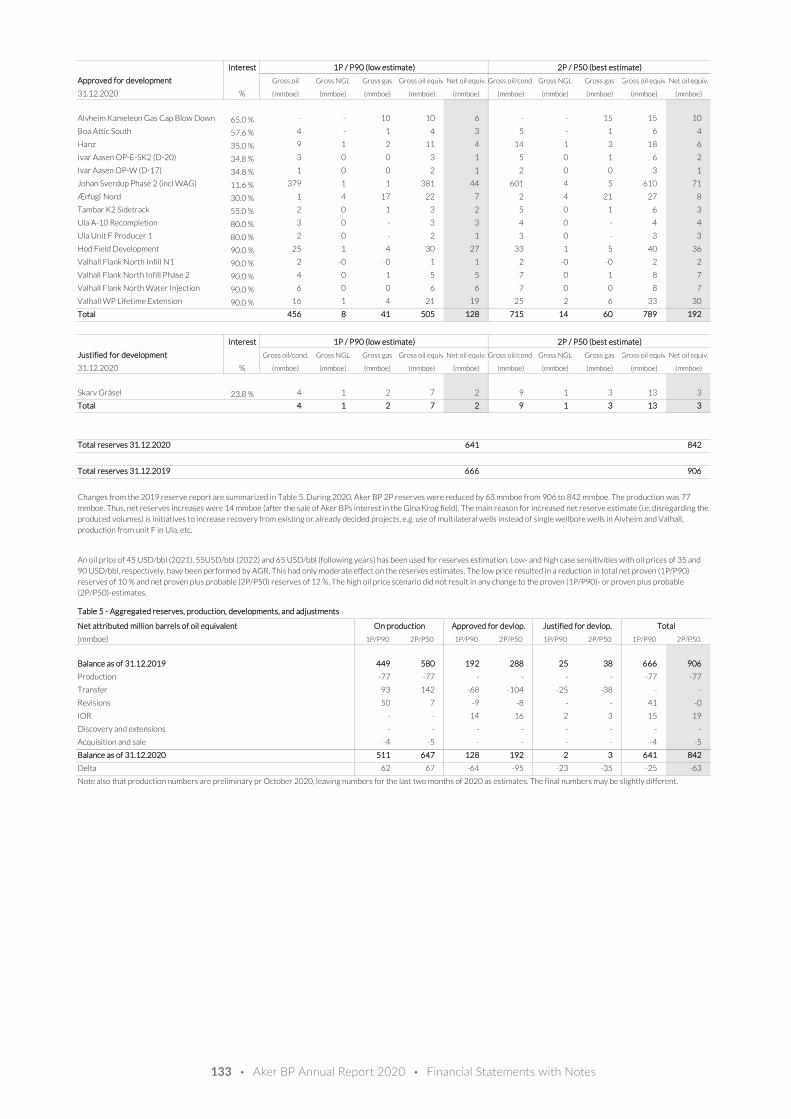
133 · Aker BP Annual Report 2020 · Financial Statements with Notes
IInntteerreesstt
AApppprroovveedd ffoorr ddeevveellooppmmeenntt Gross oil Gross NGL Gross gas Gross oil equiv Net oil equiv. Gross oil/cond Gross NGL Gross gas Gross oil equiv Net oil equiv.
31.12.2020 % (mmboe) (mmboe) (mmboe) (mmboe) (mmboe) (mmboe) (mmboe) (mmboe) (mmboe) (mmboe)
65.0 % - - 10 10 6 - - 15 15 10
57.6 % 4 - 1 4 3 5 - 1 6 4
35.0 % 9 1 2 11 4 14 1 3 18 6
34.8 % 3 0 0 3 1 5 0 1 6 2
34.8 % 1 0 0 2 1 2 0 0 3 1
11.6 % 379 1 1 381 44 601 4 5 610 71
30.0 % 1 4 17 22 7 2 4 21 27 8
55.0 % 2 0 1 3 2 5 0 1 6 3
80.0 % 3 0 - 3 3 4 0 - 4 4
80.0 % 2 0 - 2 1 3 0 - 3 3
90.0 % 25 1 4 30 27 33 1 5 40 36
90.0 % 2 -0 -0 1 1 2 -0 -0 2 2
90.0 % 4 0 1 5 5 7 0 1 8 7
90.0 % 6 0 0 6 6 7 0 0 8 7
Alvheim Kameleon Gas Cap Blow Down Boa Attic South
Hanz
Ivar Aasen OP-E-SK2 (D-20)
Ivar Aasen OP-W (D-17)
Johan Sverdup Phase 2 (incl WAG) Ærfugl NordTambar K2 Sidetrack
Ula A-10 Recompletion
Ula Unit F Producer 1
Hod Field Development
Valhall Flank North Infill N1
Valhall Flank North Infill Phase 2 Valhall Flank North Water Injection Valhall WP Lifetime Extension 90.0 % 16 1 4 21 19 25 2 6 33 30
TToottaall 445566 88 4411 550055 112288 771155 1144 6600 778899 119922
IInntteerreesstt
JJuussttiiffiieedd ffoorr ddeevveellooppmmeenntt Gross oil/cond. Gross NGL Gross gas Gross oil equiv Net oil equiv. Gross oil/cond Gross NGL Gross gas Gross oil equiv Net oil equiv.
31.12.2020 % (mmboe) (mmboe) (mmboe) (mmboe) (mmboe) (mmboe) (mmboe) (mmboe) (mmboe) (mmboe)
Skarv Gråsel 23.8 % 4 1 2 7 2 9 1 3 13 3
TToottaall 44 11 22 77 22 99 11 33 1133 33
TToottaall rreesseerrvveess 3311..1122..22002200 664411 884422
TToottaall rreesseerrvveess 3311..1122..22001199 666666 990066
TTaabbllee 55 -- AAggggrreeggaatteedd rreesseerrvveess,, pprroodduuccttiioonn,, ddeevveellooppmmeennttss,, aanndd aaddjjuussttmmeennttss
NNeett aattttrriibbuutteedd mmiilllliioonn bbaarrrreellss ooff ooiill eeqquuiivvaalleenntt
(mmboe) 1P/P90 2P/P50 1P/P90 2P/P50 1P/P90 2P/P50 1P/P90 2P/P50
BBaallaannccee aass ooff 3311..1122..22001199 444499 558800 119922 228888 2255 3388 666666 990066
Production -77 -77 - - - - -77 -77
Transfer 93 142 -68 -104 -25 -38 - -
Revisions 50 7 -9 -8 - - 41 -0
IOR - - 14 16 2 3 15 19
Discovery and extensions - - - - - - - -
Acquisition and sale -4 -5 - - - - -4 -5
BBaallaannccee aass ooff 3311..1122..22002200 551111 664477 112288 119922 22 33 664411 884422
Delta 62 67 -64 -95 -23 -35 -25 -63
OOnn pprroodduuccttiioonn AApppprroovveedd ffoorr ddeevvlloopp.. JJuussttiiffiieedd ffoorr ddeevvlloopp.. TToottaall
Note also that production numbers are preliminary pr October 2020, leaving numbers for the last two months of 2020 as estimates. The final numbers may be slightly different.
11PP // PP9900 ((llooww eessttiimmaattee)) 22PP // PP5500 ((bbeesstt eessttiimmaattee))
11PP // PP9900 ((llooww eessttiimmaattee)) 22PP // PP5500 ((bbeesstt eessttiimmaattee))
Changes from the 2019 reserve report are summarized in Table 5. During 2020, Aker BP 2P reserves were reduced by 63 mmboe from 906 to 842 mmboe. The production was 77 mmboe. Thus, net reserves increases were 14 mmboe (after the sale of Aker BPs interest in the Gina Krog field). The main reason for increased net reserve estimate (i.e. disregarding the produced volumes) is initiatives to increase recovery from existing or already decided projects, e.g. use of multilateral wells instead of single wellbore wells in Alvheim and Valhall, production from unit F in Ula, etc.
An oil price of 45 USD/bbl (2021), 55USD/bbl (2022) and 65 USD/bbl (following years) has been used for reserves estimation. Low- and high case sensitivities with oil prices of 35 and 90 USD/bbl, respectively, have been performed by AGR. This had only moderate effect on the reserves estimates. The low price resulted in a reduction in total net proven (1P/P90) reserves of 10 % and net proven plus probable (2P/P50) reserves of 12 %. The high oil price scenario did not result in any change to the proven (1P/P90)- or proven plus probable (2P/P50)-estimates.

134 · Aker BP Annual Report 2020 · Financial Statements with Notes
STATEMENT BY THE BOARD OF DIRECTORS AND CHIEF EXECUTIVE OFFICER
Øyvind Eriksen, Chairman of the Board Kjell Inge Røkke, Board member
Anne Marie Cannon, Deputy Chair Trond Brandsrud, Board member
Kate Thomson, Board member Murray Auchincloss, Board member
Gro Kielland, Board member Terje Solheim, Board member
Ingard Haugeberg, Board member Anette Hoel Helgesen, Board member
Karl Johnny Hersvik, Chief Executive Officer Ørjan Holstad, Board member
The Board of Directors of Aker BP ASA
Akerkvartalet, 18 March 2021
Pursuant to the Norwegian Securities Trading Act section § 5-5 with pertaining regulations, we hereby confirm that, to the best of our knowledge, the company's and the
group's financial statements for 2020 have been prepared in accordance with IFRS, as adopted by the EU, and requirements in accordance with the Norwegian Accounting
Act. The information presented in the financial statements gives a true and fair view of the company's liabilities, financial position and results overall.
To the best of our knowledge, the Board of Directors' Report gives a true and fair view of the development, performance and financial position of the company, and
includes a description of the principal risk and uncertainty factors facing the company and the group. Additionally, we confirm to the best of our knowledge that the report
'Payment to governments' as provided in a separate section in this annual report has been prepared in accordance with the requirements in the Norwegian Securities
Trading Act Section 5-5a with pertaining regulations.
ØYVIND ERIKSENChairman
KJELL INGE RØKKEBoard member
ANNE MARIE CANNONDeputy chair
MURRAY AUCHINCLOSSBoard member
TROND BRANDSRUDBoard member
GRO KIELLANDBoard member
INGARD HAUGEBERGBoard member
KATE THOMSONBoard member
ANETTE HOEL HELGESENBoard member
ØRJAN HOLSTADBoard member
TERJE SOLHEIMBoard member
KARL JOHNNY HERSVIKChief Executive Officer

135 · Aker BP Annual Report 2020 · Financial Statements with Notes
Alternative performance measures
IInntteerreesstt ccoovveerraaggee rraattiioo is calculated as twelve months rolling EBITDA, divided by interest expenses, excluding any impacts from IFRS 16.
1) Includes payments of lease debt as disclosed in note 25.
Aker BP may disclose alternative performance measures as part of its financial reporting as a supplement to the financial statements prepared in accordance with IFRS. Aker BP believes that the alternative performance measures provide useful supplemental information to management, investors, security analysts and other stakeholders and are meant to provide an enhanced insight into the financial development of Aker BP’s business operations and to improve comparability between periods.
AAbbaannddoonnmmeenntt ssppeenndd ((aabbeexx)) is payment for removal and decommissioning of oil fields1)
DDeepprreecciiaattiioonn ppeerr bbooee is depreciation divided by number of barrels of oil equivalents produced in the corresponding period
DDiivviiddeenndd ppeerr sshhaarree ((DDPPSS)) is dividend paid during the year divided by number of shares outstanding
CCaappeexx is disbursements on investments in fixed assets deducted by capitalized interest cost1)
OOppeerraattiinngg pprrooffiitt//lloossss is short for earnings/loss before interest and other financial items and taxes
PPrroodduuccttiioonn ccoosstt ppeerr bbooee is production cost basd on produced volumes, divided by number of barrels of oil equivalents produced in the corresponding period (see note 5)
EEBBIITTDDAA is short for earnings before interest and other financial items, taxes, depreciation and amortisation and impairments
EEBBIITTDDAAXX is short for earnings before interest and other financial items, taxes, depreciation and amortisation, impairments and exploration expenses
EEqquuiittyy rraattiioo is total equity divided by total assets
EExxpplloorraattiioonn ssppeenndd ((eexxppeexx)) is exploration expenses plus additions to capitalized exploration wells less dry well expenses1)
LLeevveerraaggee rraattiioo is calculated as Net interest-bearing debt divided by twelve months rolling EBITDAX, excluding any impacts from IFRS 16
NNeett iinntteerreesstt--bbeeaarriinngg ddeebbtt is book value of current and non-current interest-bearing debt less cash and cash equivalents

136 · Aker BP Annual Report 2020 · Financial Statements with Notes
(USD 1 000) NNoottee 22002200 22001199
AAbbaannddoonnmmeenntt ssppeenndd
Payment for removal and decommissioning of oil fields 150 306 104 890
Payments of lease debt (abandonment activity) 25 27 660 4 444
AAbbaannddoonnmmeenntt ssppeenndd 177 966 109 334
DDeepprreecciiaattiioonn ppeerr bbooee
Depreciation 12 1 121 818 811 874
Total produced volumes (boe 1 000) 5 77 101 56 886
DDeepprreecciiaattiioonn ppeerr bbooee 14.6 14.3
DDiivviiddeenndd ppeerr sshhaarree
Paid dividend 425 000 750 000
Number of shares outstanding 359 808 360 014
DDiivviiddeenndd ppeerr sshhaarree 1.18 2.08
CCaappeexx
Disbursements on investments in fixed assets 1 277 869 1 703 213
Payments of lease debt (investments in fixed assets) 25 67 125 108 587
Capitalized interest 9 -39 267 -144 686
CCAAPPEEXX 1 305 727 1 667 113
EEBBIITTDDAA
Total income 4 2 979 263 3 347 088
Production costs 5 -627 975 -720 321
Exploration expenses 6 -174 099 -305 516
Other operating expenses -49 457 -35 328
EEBBIITTDDAA 2 127 731 2 285 922
EEBBIITTDDAAXX
Total income 4 2 979 263 3 347 088
Production costs 5 -627 975 -720 321
Other operating expenses -49 457 -35 328
EEBBIITTDDAAXX 2 301 830 2 591 439
EEqquuiittyy rraattiioo
Total equity 1 987 281 2 367 585
Total assets 12 420 091 12 226 786
EEqquuiittyy rraattiioo 16% 19%
EExxpplloorraattiioonn ssppeenndd
Disbursements on investments in capitalized exploration expenditures 127 283 370 185
Exploration expenses 6 174 099 305 516
Dry well 6 -56 626 -176 419
Payments of lease debt (exploration expenditures) 25 874 1 384
EExxpplloorraattiioonn ssppeenndd 245 629 500 666

137 · Aker BP Annual Report 2020 · Financial Statements with Notes
(USD 1 000) NNoottee 22002200 22001199
IInntteerreesstt ccoovveerraaggee rraattiioo
Twelve months rolling EBITDA 2 127 731 2 285 922
Twelve months rolling EBITDA, impacts from IFRS 16 25 -23 438 -20 636
Twelve months rolling EBITDA, excluding impacts from IFRS 16 2 104 293 2 265 287
Twelve months rolling interest expenses 9 184 501 175 672
Twelve months rolling amortized loan cost 9 19 813 21 705
Twelve months rolling interest income 9 3 763 16 490
Net interest expenses 200 552 180 886
IInntteerreesstt ccoovveerraaggee rraattiioo 10.5 12.5
LLeevveerraaggee rraattiioo
Long-term bonds 20 3 968 566 1 630 936
Other interest-bearing debt 23 - 1 429 132
Short-term bonds 20 - 226 700
Cash and cash equivalents 18 537 801 107 104
Net interest-bearing debt excluding lease debt 3 430 766 3 179 664
Twelve months rolling EBITDAX 2 301 830 2 591 439
Twelve months rolling EBITDAX, impacts from IFRS 16 25 -22 564 -19 839
Twelve months rolling EBITDAX, excluding impacts from IFRS 16 2 279 266 2 571 600
LLeevveerraaggee rraattiioo 1.51 1.24
NNeett iinntteerreesstt--bbeeaarriinngg ddeebbtt
Long-term bonds 20 3 968 566 1 630 936
Long-term lease debt 25 131 856 202 592
Other interest-bearing debt 23 - 1 429 132
Short-term bonds 20 - 226 700
Short-term lease debt 25 83 904 110 664
Cash and cash equivalents 18 537 801 107 104
NNeett iinntteerreesstt--bbeeaarriinngg ddeebbtt 3 646 526 3 492 920
OOppeerraattiinngg pprrooffiitt//lloossss see Income Statement
PPrroodduuccttiioonn ccoosstt ppeerr bbooee see note 5

KPMG ASSørkedalsveien 6 Postboks 7000 Majorstuen 0306 Oslo
Telephone +47 04063Fax +47 22 60 96 01Internet www.kpmg.noEnterprise 935 174 627 MVA
To the General Meeting of Aker BP ASA
Independent Auditor’s Report
Report on the Audit of the Financial Statements
Opinion
We have audited the financial statements of Aker BP ASA (“the Company”, together with its subsidiaries “the Group”. The financial statements comprise:
• The financial statements of the Company and the Group, which comprise the statement of financial position as at 31 December 2020, and income statement, statement of comprehensive income, statement of changes in equity and statement of cash flow for the year then ended, and notes to the financial statements, including a summary of significant accounting policies.
In our opinion:
• The financial statements are prepared in accordance with the law and regulations.
• The accompanying financial statements give a true and fair view of the financial position of the Company and the Group as at 31 December 2020, and the financial performance and cash flows for the year then ended in accordance with International Financial Reporting Standards as adopted by the EU.
Basis for Opinion
We conducted our audit in accordance with laws, regulations, and auditing standards and practices generally accepted in Norway, including International Standards on Auditing (ISAs). Our responsibilities under those standards are further described in the Auditor’s Responsibilities for the Audit of the Financial Statements section of our report. We are independent of the Company and the Group as required by laws and regulations, and we have fulfilled our other ethical responsibilities in accordance with these requirements. We believe that the audit evidence we have obtained is sufficient and appropriate to provide a basis for our opinion.
Key Audit Matter
Key audit matters are those matters that, in our professional judgment, were of most significance in our audit of the financial statements for the current period. This matter was addressed in the context of our audit of the financial statements as a whole, and in forming our opinion thereon, and we do not provide a separate opinion on this matter.
Auditor's Report - 2020Aker BP ASA
2
Impairment of producing licence assets and associated goodwillRefer to Board of Directors' report and financial statement Note 1.3 (Important accounting judgments, estimates and assumptions), Note 1.12 (Impairment accounting policy) and Note 13 (Impairments).
The key audit matter How the matter was addressed in our audit
The recoverable amounts of producing licence assets and the associated goodwill are sensitive to changes in assumptions, in particular oil and gas prices, discount rate and forecast operational performance including the volumes of oil and gas to be produced and licence related expenditures. Any negative developments in these assumptions and forecasts may be an impairment trigger, even if other factors have moved favourably. Similarly, positive developments in such assumptions and forecasts may be a trigger to reverse previously recognised impairments.
In addition, the goodwill balances allocated to producing licence cash generating units will be subject to impairment charges over time as the related oil and gas reserves are produced. Impairment of goodwill is not reversed.
Management's determination of the recoverable amounts of producing licence assets requires a number of estimates and assumptions relating to operational and market factors, some of which involve a high degree of judgment. In addition, the calculation of recoverable amounts requires complex financial modelling of the cash flows of each cash generating unit.
Significant auditor judgment is required when evaluating whether the recoverable amounts, and the assumptions which drive the underlying cash flow estimates, are reasonable and supportable.
For each producing licence cash generating unit where a material risk of impairment or reversal was identified, we critically assessed the key elements of the cash flow forecasts, including:• production profiles with reference to reserves
estimates prepared by the Company's reservoir engineers and third party reserves certification reports;
• three-year oil and gas prices with reference to forward curve data and the Company's long term oil price assumptions against benchmark data from third party analysts;
• opex and capex expenditures with reference to historical forecasts, approved licence budgets and management forecasts; and
• abandonment expenditures with reference to our audit work on the abandonment provision .
In addition, KPMG valuation specialists assessed the mathematical and methodological integrity of management's impairment models, including the modelling of tax related cash flows, and assessed the reasonableness of the discount rate applied with reference to market data.
We also considered whether the disclosures regarding key assumptions and sensitivities adequately reflected the underlying impairment assessments and reasonably possible changes in assumptions.
Other information
Management is responsible for the other information. The other information comprises information included in the Annual report, but does not include the financial statements and our auditor's report thereon.
Our opinion on the financial statements does not cover the other information and we do not express any form of assurance conclusion thereon.
In connection with our audit of the financial statements, our responsibility is to read the other information and, in doing so, consider whether the other information is materially inconsistent with the financial statements or our knowledge obtained in the audit or otherwise appears to be materially misstated.
If, based on the work we have performed, we conclude that there is a material misstatement of this other information, we are required to report that fact. We have nothing to report in this regard.
Auditor's Report - 2020Aker BP ASA
3
Responsibilities of the Board of Directors and the Chief Executive Officer for the Financial Statements
The Board of Directors and the Chief Executive Officer (Management) are responsible for the preparation and fair presentation of the financial statements in accordance with International Financial Reporting Standards as adopted by the EU, and for such internal control as management determines is necessary to enable the preparation of financial statements that are free from material misstatement, whether due to fraud or error.
In preparing the financial statements, management is responsible for assessing the Company’s and the Group’s ability to continue as a going concern, disclosing, as applicable, matters related to going concern. The financial statements of the Company use the going concern basis of accounting insofar as it is not likely that the enterprise will cease operations. The financial statements of the Group use the going concern basis of accounting unless management either intends to liquidate the Group or to cease operations, or has no realistic alternative but to do so.
Auditor’s Responsibilities for the Audit of the Financial Statements
Our objectives are to obtain reasonable assurance about whether the financial statements as a whole are free from material misstatement, whether due to fraud or error, and to issue an auditor’s report that includes our opinion. Reasonable assurance is a high level of assurance, but is not a guarantee that an audit conducted in accordance with laws, regulations, and auditing standards and practices generally accepted in Norway, including ISAs, will always detect a material misstatement when it exists. Misstatements can arise from fraud or error and are considered material if, individually or in aggregate, they could reasonably be expected to influence the economic decisions of users taken on the basis of these financial statements.
As part of an audit in accordance with laws, regulations, and auditing standards and practices generally accepted in Norway, including ISAs, we exercise professional judgment and maintain professional skepticism throughout the audit. We also:
• identify and assess the risks of material misstatement of the financial statements, whether due to fraud or error. We design and perform audit procedures responsive to those risks, and obtain audit evidence that is sufficient and appropriate to provide a basis for our opinion. The risk of not detecting a material misstatement resulting from fraud is higher than for one resulting from error, as fraud may involve collusion, forgery, intentional omissions, misrepresentations, or the override of internal control.
• obtain an understanding of internal control relevant to the audit in order to design audit procedures that are appropriate in the circumstances, but not for the purpose of expressing an opinion on the effectiveness of the Company’s or the Group's internal control.
• evaluate the appropriateness of accounting policies used and the reasonableness of accounting estimates and related disclosures made by management.
• conclude on the appropriateness of management’s use of the going concern basis of accounting and, based on the audit evidence obtained, whether a material uncertainty exists related to events or conditions that may cast significant doubt on the Company’s or the Group's ability to continue as a going concern. If we conclude that a material uncertainty exists, we are required to draw attention in our auditor’s report to the related disclosures in the financial statements or, if such disclosures are inadequate, to modify our opinion. Our conclusions are based on the audit evidence obtained up to the date of our auditor’s report. However, future events or conditions may cause the Company or the Group to cease to continue as a going concern.
• evaluate the overall presentation, structure and content of the financial statements, including the disclosures, and whether the financial statements represent the underlying transactions and events in a manner that achieves fair presentation.
• obtain sufficient appropriate audit evidence regarding the financial information of the entities or business activities within the Group to express an opinion on the consolidated financial statements. We are responsible for the direction, supervision and performance of the group audit. We remain solely responsible for our audit opinion.
We communicate with the Board of Directors regarding, among other matters, the planned scope and timing of the audit and significant audit findings, including any significant deficiencies in internal control that we identify during our audit
Auditor's Report - 2020Aker BP ASA
4
We also provide the Board of Directors with a statement that we have complied with relevant ethical requirements regarding independence, and to communicate with them all relationships and other matters that may reasonably be thought to bear on our independence, and where applicable, related safeguards.
From the matters communicated with the Board of Directors, we determine those matters that were of most significance in the audit of the financial statements of the current period and are therefore the key audit matters. We describe these matters in our auditor’s report unless law or regulation precludes public disclosure about the matter or when, in extremely rare circumstances, we determine that a matter should not be communicated in our report because the adverse consequences of doing so would reasonably be expected to outweigh the public interest benefits of such communication.
Report on Other Legal and Regulatory Requirements
Opinion on the Board of Directors’ report
Based on our audit of the financial statements as described above, it is our opinion that the information presented in the Board of Directors’ report, the statement on Corporate Governance and the Environmental, Social and Governance Report concerning the financial statements, the going concern assumption, and the proposal for the allocation of profit is consistent with the financial statements and complies with the law and regulations.
Opinion on Registration and Documentation
Based on our audit of the financial statements as described above, and procedures we have considered necessary in accordance with the International Standard on Assurance Engagements (ISAE) 3000, Assurance Engagements Other than Audits or Reviews of Historical Financial Information, it is our opinion that management has fulfilled its duty to produce a proper and clearly set out registration and documentation of the Company’s accounting information in accordance with the law and bookkeeping standards and practices generally accepted in Norway.
Oslo, 18 March 2021KPMG AS
Mona Irene LarsenState Authorised Public Accountant

Design: Headspin
Photo credits per page:
Anne Lise Norheim: 1, 2, 29, 42, 53, 54, 56, 59, 60, 63, 64, 67, 68, 70, 75, 76, 79, 81, 82, 84, 87
CF Wesenberg: 4
Øyvind Gravås: 17, 18
Elisabeth Tønnessen: 19, 27, 31, 35, 46, 47, 48, 49, 50, 51
Stig Jacobsen: 26
Stuart Conway: 30
Woldcam: 46, 47
IKM: 25
Equinor: 37, 38
Aker BP ASA
Fornebuporten, Building B Oksenøyveien 10
1366 Lysaker
Postal address: P.O. Box 65
1324 Lysaker, Norway
Telephone: +47 51 35 30 00 E-mail: [email protected]
www.akerbp.com
CONTACT
Please contact Vice President Communications, Tore Langballe, if you have any questions.
[email protected] Tel: +47 416 87 486