2020 annual report - CN
140
oN ESSENTIAL. 2020 ANNUAL REPORT 2020 annual report ESSENTIAL .
-
Upload
khangminh22 -
Category
Documents
-
view
0 -
download
0
Transcript of 2020 annual report - CN

oN ESSENTIAL. 2020 ANNUAL REPORT 2 0 2 0 a n n u a l r e p o r tESSENTIAL.

nage Sir on lir loam lot rinowctudiairmriluo renedon• obcomo• Om. rm. Clmoeio obihoo wevickSevo dor burr of Ladiora• in NONnSil WM IN =NW, raw* lag Ala
Cent Otnrirti loducted b IMO ward repot conetliaercrocrdixiarg tante oillE th rrooirg N Fr Liainia• in PISS Nadia Ligrile•PAr. Acte tlfdordkr de•Ccroxbr ruckdkie tons ay tisk boord-boldro Karst' Ir WIN I he. WCNIOIrtIN cote kopIon.. TM Cryan MAW nfin b VON wtbn n WW1/4En Co deldiarm* war coliccm airs ro rev rood+ au monks, v. Wag h now obi* ofd.ONO 04 My wow nods. • Jject realm kocurtzirty. • tan ti key Oa r Min &Ow rotary WPM orolo eon rt dorm. kr en.% mch Minns , oboes ',zap eft COVO-49 patter to. booboo ono rota. nnridcd rum b d Inridcd per , cod on Fe glabolompp4dIch cod olotrorti chat 04 we wow* wan, cod ham
b,. coon 0J. rirmod-koldr otarrrni rot be Wm~ In *V
kligetran0,41 w des INftel C *TOM 740 IOWIN 'bong 'cabal" Ws 'Wolf cr. alleriloracr own.
Raman:aol& *anti a ru !Farman orIon purraworce mellow:kora.. InnnOWN No, nfrof Woo. otich rot mow LI ornoi rat' wpwb.o.c.d Ole Conamy to bo noir* row* hog Ow oath cr. coy bare Man w portno co krolird tri ouch actotrni. tape real um odder MOO rin• krok• ranCON rnarcgochirg otarreto. impaexo Uhl roam dot waif Moot Ow ramod-lochiro
iracticbd taw rct kraal Ox *gown:kr co et' ortho COM-19 Fordone pro NA war cot cod Winn mistime. potato* b Fr eco ton eft C0110-19 Forthodc hi OA I/7 onottloc bbtlm, earn No, Mt nig nunwOn, C ohnON NS P/W.: b INNIN Wolin • W. douNornonte ownpiono with WNW NW W ION and oo *do , octio, • brew bait borne in wirtwonn ond morally
b: Po OS *V Freon n•PICV m boo ft , ad Erb d v./flaky rimic rah odes on irarrctiond rod ono pawnWowmat dbcocrtbou itoarialc MONA westkis coal do god cpueion.. lonalac cd bbnodn ra olinrin Co d MINA Ono IP ▪ ds inn moot uk *molt- boLloodo d ecllo.ohn: dim dim or atom mop cedars crui clowdolorrior moo tol **a
Co coa
d plocadrg • o • dhow Mao d ddrrou ogd Megotlxv Moo ord BSI cdoirg denanur te fret aid mner d cupid Nor ror VW its ano Mole Otrtni WEI thn I. rigor., Ned
WJ Nth MANION Mg RON CaWoond UAW SOM. Remo CM doJd
Wd• blb.opw o n ISONI d 1410104. in MO wiredOW Kelm own. An yl Wronico VW rbn LO-F Nth Comecon cod 11Z.• motive mg miR• • cod ooScele CMonba• tonawcf.icr odes d oior rh II roam.
rbmodbolbp eta Linn/a 19 tannin, w Of 04 • din m wies Us, cm not Mooing nO ~Or 1ptbb n TIN bread- boldrg • nrrrorti aSIMrare WWd papa bdcrrbcw.pdo.pw ato.krde• • netbrd by oppicoble no.rthie ton. lo *moat CM don add on, broad-Wry eV:tat roi, lowc• • lod13 be node Oct CM oM MAO WOW, cd %%IMMO oil+ IN pun spot STORM rt nktric,no Of On ithor icrwcreixiaro • ton t
th wrd horolComporreor CM rein Corodo. Ward Pram. Caw, cod au Us col limo MOM. b d Oh Om, old ow bpldbrin.
111401019•APHY PROUT COPIER ini0T01 FEW N. T OP INEJ nni I WEN.' SON CP GROW Undo,Ains 0 PM PE ban MC rtinC4 Elwood Coo Cia 'won Oil rilINT1 llwortinon Me4cnin Dv rn. CO. nli h Ocirla CP MN ito•So ***dot blares dos wail &only/woof Mpg to bett• pal p*togo• ix rope* oaf ream op uodrogorortd leapt& SaortNteca Mc•Old.CIC
Except where otherwise indicated, all financial information reflected in this document is expressed in Canadian dollars and determined on the basis of United States generally accepted accounting principles (GAAP).
Certain statements included in this annual report constitute “forward‑looking statements” within the meaning of the United States Private Securities Litigation Reform Act of 1995 and under Canadian securities laws. By their nature, forward‑looking statements involve risks, uncertainties and assumptions. The Company cautions that its assumptions may not materialize and that current economic conditions render such assumptions, although reasonable at the time they were made, subject to greater uncertainty. Forward‑looking statements by their nature address matters that are, to different degrees, uncertain, such as statements about the impacts of the COVID‑19 pandemic on business operations, financial results and financial position and on the global supply chain, and statements about the economic recovery and its future impact on CN. Forward‑looking statements may be identified by the use of terminology such as “believes,” “expects,” “anticipates,” “assumes,” “outlook,” “plans,” “targets” or other similar words.
Forward‑looking statements are not guarantees of future performance and involve risks, uncertainties and other factors, which may cause the actual results or performance of the Company to be materially different from the outlook or any future results or performance implied by such statements. Accordingly, readers are advised not to place undue reliance on forward‑looking statements. Important risk factors that could affect the forward‑looking statements include, but are not limited to, the duration and effects of the COVID‑19 pandemic; general economic and business conditions, particularly in the context of the COVID‑19 pandemic; industry competition; inflation, currency and interest rate fluctuations; changes in fuel prices; legislative and/or regulatory developments; compliance with environmental laws and regulations; actions by regulators; increases in maintenance and operating costs; security threats; reliance on technology and related cybersecurity risk; trade restrictions or other changes to international trade arrangements; transportation of hazardous materials; various events, which could disrupt operations, including illegal blockades of rail networks and natural events such as severe weather, droughts, fires, floods and earthquakes; climate change; labour negotiations and disruptions; environmental claims; uncertainties of investigations, proceedings or other types of claims and litigation; risks and liabilities arising from derailments; timing and completion of capital programs; and other risks detailed from time to time in reports filed by CN with securities regulators in Canada and the United States. Reference should be made to “Management’s Discussion and Analysis” in CN’s annual and interim reports, Annual Information Form and Form 40‑F, filed with Canadian and U.S. securities regulators and available on CN’s website (www.cn.ca), for a description of major risk factors.
Forward‑looking statements reflect information as of the date on which they are made. CN assumes no obligation to update or revise forward‑looking statements to reflect future events, changes in circumstances, or changes in beliefs, unless required by applicable securities laws. In the event CN does update any forward‑looking statement, no inference should be made that CN will make additional updates with respect to that statement, related matters, or any other forward‑looking statement.
As used herein, “Company” or “CN” refers to Canadian National Railway Company and, as the context requires, its wholly owned subsidiaries.
photo g r a ph y (e xce p t w h e r e i n dic ate d) :Alpha Presse:Pascale SimardDan CallisTrevor HaganSteve LeonardStuart McCall
front cov e r photo:Sasha Goodwin, HostlerSurrey, BC
photo on r ig ht :Benjamin Dunn, Carman, is holding a new mobile device that improves data quality, helps to better pinpoint areas for repair and reduces our environmental footprint.Montreal, QC

TABLE OF CONTENTS
Meaa ge frcm Robert Pooe
hiemage from JJ Rued
2020 - A Yecr Ule No Other
llwric 'eau
higNiahts
Going Abase o rid Bernd to Daher Freight
arikling fcro Sustainable RAI"
Bond of EXiectors
Select Salim Offices
Shmehdder aid Mesta. Info-mai:Ian
FINANCIAL SECTION
Sdectecl Rcaroad Statistics - mcudited
MtnagernentS [Micmac++ ad /mar*
iwirnagementS Report cn Internal Contra] cue+ Rnancial Rerxrang
Rep crt of independent Flealitenx1 Pllblc Accowiting Firm
ConsoldotedFlnandol Stu rents
Notes to the Consca do bed Financial Statements
CM AMMUAL REPORT I
TABLE OF CONTENTS
I I Message from Robert Pace
IV Message from JJ Ruest
VI 2020 – A Year Like No Other
VII I Thank You
X Highlights
XII Going Above and Beyond to Deliver Freight
XVII Building for a Sustainable Future
XXIV Board of Directors
XXV Select Senior Officers
XXVII I Shareholder and Investor Information
F I N A N C I A L S E C T I O N
1 Selected Railroad Statistics – unaudited
2 Management’s Discussion and Analysis
58 Management’s Report on Internal Control over Financial Reporting
59 Report of Independent Registered Public Accounting Firm
62 Consolidated Financial Statements
66 Notes to the Consolidated Financial Statements
c n 2 0 2 0 a n n u a l r e p o r t i

MESSAGE FROM ROBERT PACE ari 2020 was a year that tested us in every sense. Despite the Extraordinary challenges, CN railroaders focused relentlessly on their mission to deliver the essential goods people rely at every day. I am Extremely proud of what they accomplished, and grateful fix their commitment. I am also sincerely thankful to our customers, partner % and shareholders whose ccnfidence and collaboration made it possible for 04 to provide our essential services,
SETTING AMBITIOUS GOALS FOR SI/STAINABILITY
I Pea WC ban NOS WolrboManwtlond jOWney t, [big gm with CM primtine:1m 25 lipcn ORo
and by the potential ow Uwe hake. CM evolution born on ardent dowarrortcrocked Sway ao locel, dateable *nob* or bode ly nothing torte notncokoblulato look forward to the num mot chapter ▪ o tr Co ming' Coy, ea ors Irrearmotal new iwatotonwtot 'odd ab omirace Mao Pot thotwn nitnrome PPM ow o Soder moo nd North Amman Clow I re Imo de cod OCTOPI the *Ma trorentotion mkt. 0 Le Nog se=em nod le b) be otter loading edge or °to I 133 beet Fedi ora
CN hoe Immo left o roma oo the tuba len* the Ineent Oleo ode ore In looping with all Peron Ray to id the wilco, Po leholdon who rely on ug to continuo to ewers, Morin, and lead We Cocnpayi Noma ow the act 2:6 way cod !mood It le In No eroldna context [het the CN goadrrnedd.elvely tO putln doom now rnoaemie to are the Coinpaly N w4 motioned to room complex choleroid
EMBEDDING EMERGING BEST PRACTICES
al opiate "RM.. aratMcientto nerly 200 mere kincivormont thin 110 FkotRatkee and PRY Pinto doe In sight palmed To trend them all nekoln I eel Ird aura co man CN hoe crated the CN M atom Adder? Co Pa IAq, tel Independent bodycomplied cit Intl WW1 Nodes 'torn avow Cando. The IAC Wide untie totraiotkei ot the OV Aboighof o rd hoe microdots b) odds, CM Roo re o rd maculae ori awe other CN orth • IAC Wee me Minn tO CN, etch cm Iona cod Inchdion.
A second kW anent Or phew 136 nornrnitrnera N cm odytooty map by Mat olden on the Canal mil Clitin Anon pal b) tOk• dace moth yeaOtpl Areal Sad Pardon USrb. ThU Initiative co mclerroca eta Ion trite re *g cod robot Irma chcod• dodo dew oralanomilo gag (ERG *Sono and owismowimpor P orn= to reduce ow 046 iwnleil ono Inanity. We bane OMNI IhtelehOkiere fel OdvIlOgY v001 On 0170hOte Anon Elm pmildoe atom mare occo inlay ado rmrdobs to borate Weird Ion Ma In [Nodal endear.
Coacthe 2:6 wore eirce paw dation, ate goad MN corneal to oda to Ind wort gownma Pahl., that reflect eradnd b=tlh-*n reo Wad Ow new moo era Induce o co MITI bnntn Roo nil ci hanky wiwtety ot Nat Felib or the Indeardert fl ea come from dame Pon be** 0 Bender GO *IC Father, ese One MOO tfrel are CO rplrOte fernernira p LIN bx reduce the booty Mn to 10 In apeman t Inman phd the CECt are [hotel (erector, Ore IllbeeCt b) 0 14-y•Cc bare lab by
II CN 202 0 ANNUAL REPORT
MESSAGE FROM ROBERT PACE2020 was a year that tested us in every sense. Despite the extraordinary challenges, CN railroaders focused relentlessly on their mission to deliver the essential goods people rely on every day. I am extremely proud of what they accomplished, and grateful for their commitment. I am also sincerely thankful to our customers, partners, and shareholders whose confidence and collaboration made it possible for CN to provide our essential services.
S ET TI NG AM B ITIOUS GOAL S FOR SUSTAI NAB I LIT Y
I have long been inspired by our transformational journey that began with CN’s privatization 25 years ago and by the potential our future holds. CN’s evolution from an inefficient government‑owned railway into a lean, sustainable enabler of trade is nothing short of remarkable. As we look forward to the next great chapter in our Company’s history, we are implementing new environmental, social and governance (ESG) initiatives that will reinforce CN’s status as a leader among North American Class I railroads and across the entire transportation sector. Our longer‑term goal is to be at the leading edge of global ESG best practices.
CN has always kept a focus on the future, not just the present. Our goals are in keeping with our responsibility to all the various stakeholders who rely on us to continue to evolve, modernize, and lead this Company forward over the next 25 years and beyond. It is in this evolving context that the CN Board moved decisively to put in place new measures to ensure the Company is well positioned to meet complex challenges.
E M B E DDI NG E M E RG I NG B E ST PR AC TICE S
CN operates within or adjacent to nearly 200 reserve lands of more than 110 First Nations and Métis territories in eight provinces. To strengthen our relations with Indigenous communities, CN has created the CN Indigenous Advisory Council (IAC), an independent body comprised of Indigenous leaders from across Canada. The IAC builds on the foundation of the CN Aboriginal Vision and has a mandate to advise CN’s Board and executives on issues either CN or the IAC believe are relevant to CN, such as diversity and inclusion.
A second key element of our new ESG commitments is an advisory vote by shareholders on the Company’s Climate Action Plan to take place each year at our Annual General Meeting (AGM). This initiative complements CN’s long‑standing and robust climate change disclosures of our greenhouse gas (GHG) emissions and our year‑over‑year progress to reduce our GHG emissions intensity. We believe giving shareholders an advisory vote on our Climate Action Plan provides a strong measure of accountability and a mandate to continue making progress in this vital endeavour.
Over the 25 years since privatization, CN’s Board has continued to strive to implement governance policies that reflect evolving best‑in‑class practices. Our new measures include a commitment to Board diversity whereby at least 50% of the independent directors come from diverse groups, including gender parity. Further, we are updating CN’s corporate governance policies to: reduce the board size to 10 independent directors plus the CEO; ensure that all directors are subject to a 14‑year tenure limit by
i i c n 2 0 2 0 a n n u a l r e p o r t

As we look forward to the next great chapter in our Company's history, we are implementing new environmental, social and governance initiatives that will reinforce CN's status as a leader among North American Class I railroads and across the entire transportation sector."
removing the current grandfathering provision; lowering the retirement age for directors from 75 to 72; and, changing the policy on over-boarding to permit directors to serve on a maximum of three public boards, including CN.
We at CN recognize the importance of consistent engagement with all our stakeholders, including our shareholders, and we encourage open and meaningful dialogue and the exchange of ideas. We are grateful for the input that has helped inform these new ESG measures.
A HEARTFELT FAREWELL AND THANKS
These new governance measures are integral elements of our strategy to ensure CN's sustained success in the future and have the Board's unanimous support. To facilitate the new governance practices, five directors have advised that they will not stand for re-election at the upcoming AGM. These are: Donald Carty, Maureen Kempston Darkes, Gordon Giffin, Edith Holiday and Denis Losier.
On behalf of the entire CN family, I want to thank these distinguished directors for their wisdom, expertise and the careful oversight they have contributed to CN's success as it has grown and prospered. The Company is deeply indebted to them and will pay them proper tribute at the AGM.
I want to express my appreciation to two new directors who have agreed to be nominated in our proxy circular and, together with Margaret McKenzie who joined our Board last fall, bring the Board to 10 independent directors and the CEO.
CN takes pride in the essential role we play in the economy. I, along with the other members of CN's Board, the Company's executive team, and all employees, also view our commitment to sustainable business practices as essential to our long-term competitiveness and our ability to continue to flourish together with our customers, communities, Indigenous partners, shareholders and many other important stakeholders.
Robert Pace, D.COM M., C.M.
Chair of the Board
CN 2020 ANNUAL REPORT III
removing the current grandfathering provision; lowering the retirement age for directors from 75 to 72; and, changing the policy on over‑boarding to permit directors to serve on a maximum of three public boards, including CN.
We at CN recognize the importance of consistent engagement with all our stakeholders, including our shareholders, and we encourage open and meaningful dialogue and the exchange of ideas. We are grateful for the input that has helped inform these new ESG measures.
A H E ARTFE LT FAREWE LL AN D THAN KS
These new governance measures are integral elements of our strategy to ensure CN’s sustained success in the future and have the Board’s unanimous support. To facilitate the new governance practices, five directors have advised that they will not stand for re‑election at the upcoming AGM. These are: Donald Carty, Maureen Kempston Darkes, Gordon Giffin, Edith Holiday and Denis Losier.
On behalf of the entire CN family, I want to thank these distinguished directors for their wisdom, expertise and the careful oversight they have contributed to CN’s success as it has grown and prospered. The Company is deeply indebted to them and will pay them proper tribute at the AGM.
I want to express my appreciation to two new directors who have agreed to be nominated in our proxy circular and, together with Margaret McKenzie who joined our Board last fall, bring the Board to 10 independent directors and the CEO.
CN takes pride in the essential role we play in the economy. I, along with the other members of CN’s Board, the Company’s executive team, and all employees, also view our commitment to sustainable business practices as essential to our long‑term competitiveness and our ability to continue to flourish together with our customers, communities, Indigenous partners, shareholders and many other important stakeholders.
Robert Pace, d.comm., c.m. Chair of the Board
As we look forward to the next great chapter in our Company’s history, we are implementing new environmental, social and governance initiatives that will reinforce CN’s status as a leader among North American Class I railroads and across the entire transportation sector.”
c n 2 0 2 0 a n n u a l r e p o r t i i i

MESSAGE FROM JJ RUEST Ina year of global change and adjustment chi =timed to invest, grow, and deploy imiosatin technologies that helped ensure the safe and effective movanalt of our alone goods to market, with the tactraccdinau support of cur dedicated1nm of essential railroadeis, as wen as our supply chain partneri and custumem, we tackled the difficult challenges of the global pandemic head on, We took the necessary steps to putect all of our employees, the communities in which weepers as well as the employees of our customers, vendors, and partners in xi:sponseto CO= S.
The pin yawbrought new perspecthes m the word at] at' At 0J, %ern haw always taken ow nosponal AY as on mem dot mow or the eowtothy mid smoblenof Pads wry mil* cWho dto I ink In the gipbol economy Qs theorem and rep* chain pwthere, op reel a Ni.
rely on ue to deer the attar geoids they need gran doe. Otters:Iola commItmerno folfMna the rowan Wades rose to not 'wee In 2020ontO milt to thank eon) ns r their area balks. In playing on word al role In lowing the economy Framing clserlte the pa odernic.
A [not sample of Wile the rnmennent of grain. Fan Arm to Mb* Invitee a lot of pm* to move thls 'educible • rnmoolty We woukl Me to thalk farnersdi min
to mPa Net tenon toff, port wailers, as sel as otr CM to Rea dee, kr o Im dneek mirth which CM we record,
for Cam CAO bac fionnIPmelm fce10 conmathre months, In 2020, CN depend Mil tam meth c to nom or
CA nal km 0 mil In both happen and contol nem which h IBA Woe lila, the plrAo us mar nth 2018.
A TRIBUTE TO OUR PEOPLE
Kospkg o nano nook.° go rolyor4.ftisody Mit o teen *Met from my con ducton and to ono the end nen who operate otrtrolm the ien0theettnn ad meth wird people who rnalnben °WM*, me tonna eln,tooar ethettlera le Me !opus of per and on acwdda
Sods In 2020 ad gooey 202I, we aped ce4 the heattnea line keg of row of ow mho gum Jo Khde R
Bona Ftilfta, Wide as ad Tool Ik rwao.T here we fewworm cIrmonsbmces In my me oder% Mk then to lose o co-wetter. My teepee cardamom no out to the Arran friends, and co -worlenv of Ws id pod and the rty cot WORM*. M CN, safety le *nore the
net n1Witttht ['Moot of cajole. It metre net we met reenter pep rk to Improve the safety of mr people and ovoid exli pa* bvIdentp This Is as um compromag co nsmItment b) the heath and safety of otrenclowse, the commutes In which we opera Os, ['rend the curlthee tee mra. Woe wO continue co beet In oar IMP* MO IS and WO robe net CE w alto In as goal &being the worse re Small In North Americca Ith only wU imwaverbg Pedro don b) vasty that so am honotr ar colleagues.
InIVESTINO FOR TOMORROW
Rol= cing Yin tosseints.W. bursa Ws annual'? Irma a pproakno dly 20% of CAN meows to support
the la MY of oar network SnOrrne ors Nlldewy crod naves, and ow Ue Einetth. In MOO, therthe the Rea nclo I krpo ate &the glob:11 Foment, w hello pm- co pith budget rol dy too dy mid rand $29 Mon bock In to the threes Pew re Ni. opmetarto bey $1.6 Mon ea Impede Co thin then the bogie ROW ty or the network, we oho cora ued to rent In troth and 5n ni occooltY mho moments, me ktly In Western CO meth le new, more theleMdert Imonether ht net, Nonsn-co platy groin hopper on and In teem dog es that supixet sof•IY and efAcAncy
IY ON 4020 ANNUAL REPORT
MESSAGE FROM JJ RUESTIn a year of global change and adjustment, CN continued to invest, grow, and deploy innovative technologies that helped ensure the safe and effective movement of our customers’ goods to market. With the extraordinary support of our dedicated team of essential railroaders, as well as our supply chain partners and customers, we tackled the difficult challenges of the global pandemic head on. We took the necessary steps to protect all of our employees, the communities in which we operate, as well as the employees of our customers, vendors, and partners in response to COVID‑19.
The past year brought new perspectives to the word “essential.” At CN, we have always taken our responsibility as an essential mover of the economy and enabler of trade very seriously. CN is a vital link in the global economy. Our customers and supply chain partners, as well as the public, rely on us to deliver the critical goods they need every day. Our employees’ commitment to fulfilling their responsibilities rose to new levels in 2020 and I want to thank everyone for their contribution in playing an essential role in keeping the economy moving despite the pandemic.
A great example of this is the movement of grain. From farm to table, it takes a lot of people to move this valuable commodity. We would like to thank farmers, grain companies, elevator staff, port workers, as well as our own CN railroaders, for a landmark year in which CN set records for Canadian bulk grain shipments for 10 consecutive months. In 2020, CN delivered 33 million metric tonnes of Canadian grain in both hoppers and containers, which is 15% more than the previous record set in 2018.
A TRI BUTE TO OU R PEOPLE
Keeping our trains running safely and efficiently 24/7 is a team effort, from our conductors and locomotive engineers who operate our trains, the engineering and mechanical people who maintain our tracks and rolling stock, to our operations folks who keep us all safe and on schedule.
Sadly, in 2020 and early 2021, we experienced the heart‑breaking loss of four of our colleagues: Jasvinder Riar,
Daniel Paulusse, Valerie Ellis and Yoan Morneau. There are few worse circumstances in any railroader’s life than to lose a co‑worker. My deepest condolences go out to the families, friends, and co‑workers of these valued and dearly missed colleagues. At CN, safety is simply the most important aspect of our jobs. It means that we must relentlessly work to improve the safety of our people and avoid such tragic incidents. This is our uncompromising commitment to the health and safety of our employees, the communities in which we operate, and the customers we serve. We will continue to invest in our people, infrastructure, and technology until we attain our goal of being the safest railroad in North America. It is only with unwavering dedication to safety that we can honour our colleagues.
I NVE STI NG FOR TOMORROW
Railroading is an asset‑intensive business. We annually invest approximately 20% of CN’s revenues to support the safety of our network, improve our efficiency and resilience, and enable growth. In 2020, despite the financial impacts of the global pandemic, we held our capital budget fairly steady and invested $2.9 billion back into the business. Beyond the approximately $1.6 billion we invested to maintain the basic integrity of the network, we also continued to invest in track and yard capacity enhancements, mainly in Western Canada; in new, more fuel‑efficient locomotives; in new, higher‑capacity grain hopper cars; and in technologies that support safety and efficiency.
i v c n 2 0 2 0 a n n u a l r e p o r t

A VISION FOR THE FUTURE
For more than 100 years, CN has been at the forefront of innovation. We pioneered the now industry-standard Precision Scheduled Railroading (PSR) more than 20 years ago. Today, we are taking PSR to the next level by layering advanced technology and automation onto every aspect of our operations. We are calling this next generation "Digital Scheduled Railroading" (DSR).
DSR is already paying dividends for safety. We are putting powerful sensor and Al technology into automated track inspection railcars that run on regular trains. As a result, in 2020, we were able to inspect 20 times more track than ever before.
DSR is also changing how we inspect our railcar fleet. Our seven new automated inspection portals feature ultra-high-definition cameras that can detect defects not visible to the human eye as a train travels at track speed through the portal.
In 2020, CN launched an ever-expanding suite of digital application programming interfaces (APIs), that allow CN customers to seamlessly connect with CN to track and trace their shipments using real-time GPS technology, signalling a new era of innovation and supply chain visibility aimed at helping our customers win in their markets.
CREATING A SUSTAINABLE FUTURE
At CN, we are creating the railroad of the future by pulling together as ONE TEAM. We empower our people to make decisions, and we ask for and listen to their viewpoints. We are continuing to push toward increasing inclusion and diversity in our teams and ensuring equity. We all obtain stronger results from a wider range of insights and perspectives, and we all have a role to play in creating an inclusive workplace where every CN employee can be their authentic self.
In 2020, CN was listed on the Dow Jones Sustainability World Index for the ninth consecutive year and in January 2021, we were ranked 10th in the world on the Corporate Knights 2021 Global 100 Index of the most sustainable companies.
At CN, we are creating the railroad of the future by pulling together as ONE TEAM."
A sustainable future also means always considering how our activities affect the environment. Rail transport is part of the climate change solution, and CN continues to be an active leader through our actions and transparency. CN has been making robust annual climate change disclosures for more than a decade. In 2020, CN also became a supporter of the Task Force on Climate-related Financial Disclosures (TCFD) and we issued our first stand-alone TCFD report, a first in the North American rail sector. Also in 2020, CN's actions to reduce emissions, mitigate climate risks and develop the low-carbon economy resulted in CN being one of only three Canadian companies listed on CDP's global Climate A List. As a Company, we are enormously proud of these world-wide recognitions of our sustainability efforts.
CN has a strong track record of fuel and carbon efficiency, and we have improved locomotive emissions intensity by 40% since 1993. Today, CN remains the North American rail industry leader, consuming approximately15% less locomotive fuel per gross ton mile than the average of our Class I peers. In fact, we delivered our best fuel efficiency ever in 2020 —4% better than the previous record set in 2019 — which avoided approximately 275,000 tonnes of CO2 emissions.
At CN, our vision is to be the safest and most carbon-efficient, operationally effective, and customer-centric railroad in North America. That is our business — an essential business. We will accomplish it by attracting and retaining a diverse team of committed and talented railroaders. The best in the business; essential in all they do.
In closing, I would like to thank our customers and stakeholders for their valued support. I am optimistic about CN's future, about our ability to embrace change and come out stronger, and about the entire team's determination to not only succeed, but to innovate and lead for many years to come.
JJ Ruest President and Chief Executiue Officer
CN 2020 ANNUAL REPORT V
A VIS ION FOR TH E FUTU RE
For more than 100 years, CN has been at the forefront of innovation. We pioneered the now industry‑standard Precision Scheduled Railroading (PSR) more than 20 years ago. Today, we are taking PSR to the next level by layering advanced technology and automation onto every aspect of our operations. We are calling this next generation “Digital Scheduled Railroading” (DSR).
DSR is already paying dividends for safety. We are putting powerful sensor and AI technology into automated track inspection railcars that run on regular trains. As a result, in 2020, we were able to inspect 20 times more track than ever before.
DSR is also changing how we inspect our railcar fleet. Our seven new automated inspection portals feature ultra‑high‑definition cameras that can detect defects not visible to the human eye as a train travels at track speed through the portal.
In 2020, CN launched an ever‑expanding suite of digital application programming interfaces (APIs), that allow CN customers to seamlessly connect with CN to track and trace their shipments using real‑time GPS technology, signalling a new era of innovation and supply chain visibility aimed at helping our customers win in their markets.
CRE ATI NG A SUSTAI NAB LE FUTU RE
At CN, we are creating the railroad of the future by pulling together as ONE TEAM. We empower our people to make decisions, and we ask for and listen to their viewpoints. We are continuing to push toward increasing inclusion and diversity in our teams and ensuring equity. We all obtain stronger results from a wider range of insights and perspectives, and we all have a role to play in creating an inclusive workplace where every CN employee can be their authentic self.
In 2020, CN was listed on the Dow Jones Sustainability World Index for the ninth consecutive year and in January 2021, we were ranked 10th in the world on the Corporate Knights 2021 Global 100 Index of the most sustainable companies.
At CN, we are creating the railroad of the future by pulling together as ONE TEAM.”A sustainable future also means always considering how our activities affect the environment. Rail transport is part of the climate change solution, and CN continues to be an active leader through our actions and transparency. CN has been making robust annual climate change disclosures for more than a decade. In 2020, CN also became a supporter of the Task Force on Climate‑related Financial Disclosures (TCFD) and we issued our first stand‑alone TCFD report, a first in the North American rail sector. Also in 2020, CN’s actions to reduce emissions, mitigate climate risks and develop the low‑carbon economy resulted in CN being one of only three Canadian companies listed on CDP’s global Climate A List. As a Company, we are enormously proud of these world‑wide recognitions of our sustainability efforts.
CN has a strong track record of fuel and carbon efficiency, and we have improved locomotive emissions intensity by 40% since 1993. Today, CN remains the North American rail industry leader, consuming approximately 15% less locomotive fuel per gross ton mile than the average of our Class I peers. In fact, we delivered our best fuel efficiency ever in 2020 — 4% better than the previous record set in 2019 — which avoided approximately 275,000 tonnes of CO2 emissions.
At CN, our vision is to be the safest and most carbon‑efficient, operationally effective, and customer‑centric railroad in North America. That is our business — an essential business. We will accomplish it by attracting and retaining a diverse team of committed and talented railroaders. The best in the business; essential in all they do.
In closing, I would like to thank our customers and stakeholders for their valued support. I am optimistic about CN’s future, about our ability to embrace change and come out stronger, and about the entire team’s determination to not only succeed, but to innovate and lead for many years to come.
JJ Ruest President and Chief Executive Officer
c n 2 0 2 0 a n n u a l r e p o r t v

2020 - A YEAR LIKE NO OTHER The magnitude of disruption the pandemic has wrought on economies, societies, families, waiters and companies is almost inralrulable. At CN, our employees rose to the pandemic challenge. They persevered in the vital 'vie of moving a vast array of goods and materials, while quickly adapting to strict pandemic protocols to keep each other, and our communities and customers, safe.
2020 – A YEAR LIKE NO OTHER The magnitude of disruption the pandemic has wrought on economies, societies, families, workers and companies is almost incalculable. At CN, our employees rose to the pandemic challenge. They persevered in the vital role of moving a vast array of goods and materials, while quickly adapting to strict pandemic protocols to keep each other, and our communities and customers, safe.
CN took all necessary steps to protect our employees, communities, and stakeholders in response to COVID‑19.
Ryan Trithardt, ConductorSurrey, BCv i c n 2 0 2 0 a n n u a l r e p o r t

The wegtolta• lapin Patna lo the Athol/of 2020 woe
Wand byo robot tut nut orbo mod b the bock holt It took 'norm° ut dints to (glut the ctgober o crn, ( comet] we me arm to meet the !cloth mown o r rag or o tr cuto min( Apply choke. Ewe, then, loclubY demo cod and bag c pattern, (Id oct mom" Fenn
to .rio mot' Through the (iodation of ois endwise, and thou, orotgcutahere, w (trolopecl new ouppki did no and bonprtotkn option. Whlo the Impact of CCNID-19
continues to MOM deep C et, there ae tales or ear 'nom and rekcient1011 boon oho beg told
Lumeen °alarm nETWIT--.1f2. 011 • WI Sr Kg Int* Mini or Vie Unite bxlittEY hi Wiesen Cab,* which larva tho WES* had peso o *N iko rt (tointro In dermal gland IN a *ant Wet 1. so raw people re ling from home and with Onto , ay wood kg on two* cat 'MORO broil* • hold, the rwwctla. ma rl•Pt twIl'enbId and Olio dermal Fa Can don kkotOgreuned boo& b hcal 4 the wow. CN took nacre out of Seam Wooed to0 tO natal [0 eupplemen own rat ad, h Canber 202Ct w ot tot kW at catnip nerd Nth Ice ksobtr Ohtoolota
CN CUSTOMER HELPS US DELIVER
Throughout the Patina CN how eased lath cow *Friday**, to onus o soh and hyglrtk work* 00 g0 they con do thoklobo or howl tit OWtOtooro nowity
M moontiol efothontax am tun* chino how to b. S. to offectkooly cloy ow cdtkoI Foie In ow mamma'
Kaki cho
TIM CN porn rated arty In the pinion* VI at o W MerA0 r wean or so other moy (sotto olio MI hew up with the ktreatecl dech(nd dw to Ni.h antra MA from the meta GO minty aid peaty algae,The anther oupply rho lo
wol h )eOP:othc but Mwhil out Or [NM pedal, vno not
• 01:00n Oudan (41.1 Orly deckled to wan the pmducts neeciod to make otk um ea other cold sag Ulna wipe, Iro r
MIPICIONY d... WOrkbv bl the fleid 174
bride the to or o tr locomotives.
Clnio of the ampoule. vo land ho OW 0 la) hol ?rpm wpg ow Mar my Rego diem Ina WNW Oa wn Wee tee wth requeott tr[hle mace reran% Owi pbrktrrl CN OA o path. mid rippler or 011 'I WO 01 ease tO OWITL
Arrrod Wth 50,000 Rim (tEl,000 USD0101A Or 1100WITI 01,01104 cm wok at cocked* quantities or dry Wpm, the CN beam mooted OLr ow Mae or (110 a /a kin %Out llian4 a ro two Ma Recochen, thlele Jut o he ward •
or the brit:11n work or ONE TEAM ha do no cksIlla the pork as do rtb) alga calcitic'', mid lamp th • economy Forma,
CN EMPLOYEES DELIVERING THE ESSENTIALS
Them anomaly akin hero et wat&iapt Vdo Illnr 10MI nate dune the PONdmiTI a 71w on mantle, of ow ONE TEAM who ono macho woes:JIM coottbutkow. big and nook to help CN delver tor ow gearbox Non lo one
Omni* or ntrei: 9woo CoSoon. to roporation 'brm Gotwww, LA. Shim how domotOOTOted Con loo der0412 dung the PO radii* to Imp the troko rumba atMoyyad [0 dear IMO Om re products, (rade, o cod Other eeleentION.
Toe hod r0 And wWw r0 ride Onnt d 000100:1• rag le oboor4na the 0 *Slow Or PIW0001 d latrave sou 9woo. "To tho tend, sat and bland° fly good (tool, coupled with common Vat The TO et Imp) rnt thing Ino man Win
o putty., attitude( June otgotNIty le contagion, so o re GOMM *la lm PTO UP or h ow macro ran hook gloved me the froodom to omit mypekh thU tole, cm wog og mothrobod mom wow Stn. cat Wad *Ant thU chant Int tine'
CM 2040 ANNUAL REPORT VII
“The most important thing is to maintain a positive attitude!”Shena Coleman, Transportation ManagerGeismar, LAPhoto provided by Shena Coleman
The precipitous drop in volumes in the first half of 2020 was followed by a robust but uneven rebound in the back half. It took enormous efforts to adjust the number of crews, locomotives and railcars to meet the volatile recovery of many of our customers’ supply chains. Even then, industry demand and traffic patterns did not necessarily return to “normal.” Through the dedication of our employees and those of our customers, we developed new supply chains and transportation options. While the impact of COVID‑19 continues to create deep challenges, there are stories of silver linings and reinvention that are also being told.
LU M B E R DE MAN D RETU RN S
One such silver lining is the revival of the lumber industry in Western Canada, which before the pandemic had seen a significant downturn in demand followed by mill closures. With so many people working from home and with discretionary spending on travel and entertainment on hold, the renovation market benefited and the demand for Canadian lumber reversed trend. To handle the surge, CN took railcars out of storage, leased more railcars to supplement our fleet and, in December 2020, we attained an all‑time record high for lumber shipments.
CN CUSTOM E R H E LPS US DE LIVE R
Throughout the pandemic, CN has worked with our employees to ensure a safe and hygienic workplace so they can do their jobs of keeping our customers running. As essential workers, our own supply chains have to be strong to effectively play our critical role in our customers’ supply chains.
The CN team realized early in the pandemic that our regular vendors of sanitizer may not be able to keep up with the increased demand due to the strong pull from the medical community and society at large. The sanitizer supply chain was in jeopardy, but running out of these products was not an option. Our team quickly decided to secure the products needed to make our own sanitizer and sanitizing wipes for our employees, especially those working in the field and inside the cabs of our locomotives.
One of the companies we sourced isopropyl alcohol from was our customer, Recochem Inc. While they were inundated with requests for this scarce resource, they prioritized CN as a partner and supplier of an essential service to them.
Armed with 50,000 liters (13,000 US gallons) of isopropyl alcohol, as well as industrial quantities of dry wipes, the CN team created our own supplies of disinfecting wipes. Thanks to partners like Recochem, this is just one example of the impressive work our ONE TEAM has done during the pandemic to adapt to adverse conditions and keep the economy moving.
CN E M PLOYE E S DE LIVE RI NG TH E E SS E NTIAL S
There are many unsung heroes working to provide essential rail service during the pandemic. They are members of our ONE TEAM who are making valuable contributions, big and small, to help CN deliver for our customers. Here is one example of many: Shena Coleman, Transportation Manager, Geismar, LA. Shena has demonstrated strong leadership during the pandemic to keep the trains running at Mays Yard to deliver healthcare products, groceries and other essentials.
“I’ve had to find ways to remain present and accessible while observing the guidelines of physical distancing,” says Shena. “To that end, I’ve used technology a good deal, coupled with common sense. The most important thing is to maintain a positive attitude! Just as negativity is contagious, so are positive vibes. I’m proud of how management has allowed me the freedom to assert myself in this role, as well as motivated me to grow, learn, and lead during this challenging time.”
c n 2 0 2 0 a n n u a l r e p o r t v i i

1111114.
THANK YOU
Mark Vinzon, ConductorWinnipeg, MB
Maxime Desrosiers, Assistant Track SupervisorMontreal, QC
Hope Patrick, Labourer, Moving Units YardWinnipeg, MB
Peter Temitope Akinriyibi, ElectricianWinnipeg, MB
THANK YOU

4
There is much talk of heroes these days, and deservedly so, especially healthcare providers,
teachers, and the many other frontline workers, whom we wish to thank wholeheartedly. We would
also like to thank our own frontline workers, the deeply dedicated CNers who keep the
railway running, no matter what. We thank them for their exemplary service and professionalism,
and for keeping the economy moving.
We Rutherford, Engine HKURYOid rsiliTnnipg, MB
Julie Rutherford, Engine Hostler YardWinnipeg, MB
Wayne Meddaugh, Foreman, SignalsStevens Point, WI
James C. Jackson, Mechanical SupervisorFond du Lac, WI
Jonathan Côté, ConductorLévis, QC
There is much talk of heroes these days, and deservedly so, especially healthcare providers, teachers, and the many other frontline workers,
whom we wish to thank wholeheartedly. We would also like to thank our own frontline workers, the deeply dedicated CNers who keep the
railway running, no matter what. We thank them for their exemplary service and professionalism,
and for keeping the economy moving.

HIGHLIGHTS Revenues
$13.8B 2020 revenues declined $11 billion, or 7%, compared to 2019.
Earnings
$5.00 DILUTED EPS
5.31 ADJUSTED DILUTED EPS'
Diluted earnings per share (EPS) decreased 14% compared to 2019; adjusted diluted EPS' decreased 8%.
Investing for the Future
CAPITAL .9 B EXPENDITURES
Supporting the safety and fluidity of our network.
Record Fuel Efficiency in 2020 40/ mi IMPROVEMENT IN
ViO LOCOMOTIVE FUEL EFFICIENCY IN 2020 vs. 2019
-275K tonnes of CO, emissions avoided and almost $60 million in savings.
'See the section entitled Adjusted performancemeasures in the MD&A for an explanation of this non-GAAP measure.
X CN 2020 ANNUAL REPORT
Kamloops
Fort NelsonHay River
Fort McMurray
MataneBaie-Comeau
Sept-Îles
Springfield
East St. Louis
East Peoria
Conneaut
Pittsburgh
Hearst
Stevens Point
Omaha
Sioux City
Sault Ste. Marie
Fond du LacSarnia Buffalo
Milton
Baton Rouge
Minneapolis/St. Paul
Regina
Toledo
Decatur
Jackson
Prince George
Moncton
Arcadia
Chippewa Falls
Indianapolis
Joliet
Duluth
GreenBay
Gulfport
Pascagoula
Mobile
Thunder BayQuebec
Montreal
New Orleans
Prince Rupert
Vancouver
Saint John
Halifax
Toronto
Detroit
Edmonton
Calgary
Memphis
Winnipeg
Saskatoon
Chicago
Revenues
$13.8B
2020 revenues declined $1.1 billion, or 7%, compared to 2019.
Earnings
$5.00 DILUTED EPS
$5.31 ADJUSTED DILUTED EPS1
Diluted earnings per share (EPS) decreased 14% compared to 2019; adjusted diluted EPS1 decreased 8%.
Investing for the Future
$2.9B CAPITAL EXPENDITURES
Supporting the safety and fluidity of our network.
Record Fuel Efficiency in 2020
4% IMPROVEMENT IN LOCOMOTIVE FUEL EFFICIENCY IN 2020 vs. 2019
~275K tonnes of CO2 emissions avoided and almost $60 million in savings.
HIGHLIGHTS
1 See the section entitled Adjusted performance measures in the MD&A for an explanation of this non‑GAAP measure.
x c n 2 0 2 0 a n n u a l r e p o r t

Thunder Bay
Duluth
Chippewa Falls MinneapoliS/St. Paul
Arcade:
Sioux City
Omaha d
Sept-Ties
Buie-Comeau a
Quebec
Montreal
Spri
East St. LOW
Jocks°
Baton Rouge ascogaula
a Hearst
phi
_ ( NewOrleans
Saint John
CN main lines
Secondary and feeder lines
Shortline partners
0 Ports served by CN
Halifax
CN 2020 ANNUAL REPORT XI
Kamloops
Fort NelsonHay River
Fort McMurray
MataneBaie-Comeau
Sept-Îles
Springfield
East St. Louis
East Peoria
Conneaut
Pittsburgh
Hearst
Stevens Point
Omaha
Sioux City
Sault Ste. Marie
Fond du LacSarnia Buffalo
Milton
Baton Rouge
Minneapolis/St. Paul
Regina
Toledo
Decatur
Jackson
Prince George
Moncton
Arcadia
Chippewa Falls
Indianapolis
Joliet
Duluth
GreenBay
Gulfport
Pascagoula
Mobile
Thunder BayQuebec
Montreal
New Orleans
Prince Rupert
Vancouver
Saint John
Halifax
Toronto
Detroit
Edmonton
Calgary
Memphis
Winnipeg
Saskatoon
Chicago
CN main lines
Secondary and feeder lines
Shortline partners
Ports served by CN
c n 2 0 2 0 a n n u a l r e p o r t x i

GOING ABOVE AND BEYOND TO DELIVER FREIGHT Tramportationieblisim critical' for both businesses and people, hem supporting commodity extraction and mamffachuingplocesses to hdpinget finhhed goods orb store shelve.CN, with our unique trawc.inevtalread, playa vital role in these supply Chaim
GOING ABOVE AND BEYOND TO DELIVER FREIGHTTransportation is “mission critical” for both businesses and people, from supporting commodity extraction and manufacturing processes to helping get finished goods onto store shelves. CN, with our unique transcontinental reach, plays a vital role in these supply chains.
CN aims to deliver valuable transportation services for our customers and to work with all our supply
chain partners as ONE TEAM with ONE GOAL.Terrace, BC
Photo by Eric Demski, CN Drone Operations Supervisorx i i c n 2 0 2 0 a n n u a l r e p o r t

Atth. °atm k o the po riding; din, rid rce CPA oinIcoo dropped olorattit wth the mood quota roglawIng the not proricannod Sara Moot nominal kV Ello win moody* Impacted to in ging don rot 'apt rce owl-food ti.a bole and pro cad grob otd Writ in bat Oro oat:. CN Karoo don o dopted giddy to Iwo conwrion otodood wth boob goo do aro bad MY and taloa of o oda cm calm naiad aware aid piano! pro dal octicrnort rce the tontine woken totdtig ttio padrt
Whin o Ma intorno (Waned In Waal otd 44 mete thcr awing locornothme mid co re b Fa Psort, the Do olbnd oppo ocli whom mania hk4, too bo coley rnaoal thin mob.. whore they wotM to nowt moot o do IqO norny rooporiod. Thlo morn loolabol oar cloo wog nacho scar by or moot rroparrionts In 'Snot Nowak' Piano logy, cri taffy bid ci IMO watt col olyilo and oinulotion tool tho t mobil o nob maownonn to Orin Multi t network co po dtt cot aid nutlet Tito In now d. woo ooh helped old away In the rig ht plow, so we wid homt. ochre amp, whom they cony cal in on to no oholupo ✓orndriod otociod.
Ws oho ms/S OrnlootrY o clAbriora to or worn, roo to nxtch cuto nor demo rid. w. roost this action, wore mowy aid in working hoof m am the coral tiono fora MA Fawn to week. TOW hag Included mobto hint our coptrd I nmparront porton *a to prinpati or* tad • In oddean. In July, we order 1.500 new grin
taxa cot wNch anion thin as Iona torrocompittramorconoo manor* ranowy tame h Yob
tica In the no nub ctang sector and bolo it coot] nuo to root the growling neat or rob to not
2020 wog o kat mak Y.orbr DI NOV woad onted o moults or mon tiol Canton 0ro In to to0 &It CN wit nocordo for Co nal col (yob ✓oyaimont b r 10 co roicuthro nontt• bet Imba In link In Ocbobrot CN It col off -Ono u. y Clioln roan for Co rod rto ki Faint bY 'Nat ow a 27 ran nitric to nro. PPM Morin. Owen, CN clawed MO wth ovor 92144T or Condon gro ohippod do tab od, wowing as boot yew (2016 by 4.Z Prior or 1596. Co ntotiorbod grail 'Nona° *at ito rn Colo do oho hot non rd trot In 2020, wth CN mooing wow 1.4 Isirrt b cal tiOn to in knee oblopod fro rn Fran Colo do. Those moo rd g rob oblionoots co artutod to bliKing the waid Id cluing the pooling a
CN o to wit o noon b Coopenbor 2020 of 53,000 bar* W propo nO mrimport noun *to ero Mari Mind Ftopor t Tema! bl Rho. Rip.rt RC. A other co moot* mom to rocaor b the moored ha, or 2020 wo watts hp rang Woe coin". &ma fly co nornootY OrouPt m o pet oth
th • toed+ nolo month, or 2020, ook wore ih ri record alkalis of bombe aid con [droned prod unto to moot port-up comae demo* o rid moot o thor connocitioo orp0000d d 2019 rowel quo MO atria tee the no tott• NE01121011 ammo onenTi and outo mato wears/.
Tito mammy, though Mt VW CO mole, wag =Neal Hth CN moody adopting moon lea tO notch cultOroort now ion dOrIXold by ofra arrollog 'lock boltOm its ad by oral oak nicant Wag hod Do In col d ongi no nowt
tho whlo mooing they cord Mod their required so lay Do holm prior to tOttookla tO
CM 2020 ANNUAL REPORT XIII
In 2020, CN set records for Canadian grain movement for 10 consecutive months beginning in March.Spruce Grove, AB
At the outbreak of the pandemic, demand for CN’s services dropped significantly, with the second quarter registering the most pronounced decline. Most commodity groups were negatively impacted to varying degrees, except for agri‑food (e.g. bulk and processed grain and refrigerated groceries). CN railroaders adapted quickly to keep consumers stocked with basic goods like food, fuel and toiletries as well as critical medical supplies and personal protective equipment for the frontline workers battling the pandemic.
When our traffic volumes declined in March and April, rather than storing locomotives and cars in rail yards, the traditional approach when equipment is idle, we strategically moved them to sites where they would be needed most as the economy reopened. This massive logistical exercise was made easier by our recent investments in “Smart Network” technology, an integrated digital scenario analysis and simulation tool that models train movements to improve insight on network capacity, cost and fluidity. This innovative approach helped us add capacity in the right places so we could handle volume surges when they came and ensure store shelves remained stocked.
We also made temporary adjustments to our workforce to match customer demand. We regret these actions were necessary and are working hard to create the conditions for a full return to work. This has included maintaining our capital investment program close to pre‑pandemic levels. In addition, in July, we ordered 1,500 new grain
hopper cars, which strengthens our long‑term competitiveness, encourages economic recovery through job creation in the manufacturing sector and helps us continue to meet the growing needs of grain farmers.
2020 was a landmark year for bringing unprecedented amounts of essential Canadian grain to market. CN set records for Canadian grain movement for 10 consecutive months beginning in March. In October, CN set an all‑time supply chain record for Canadian grain movement by shipping over 3.27 million metric tonnes (MMT) of grain. Overall, CN closed 2020 with over 32 MMT of Canadian grain shipped via carload, exceeding our best year ever (2018) by 4.25 MMT, or 15%. Containerized grain shipments direct from Western Canada also hit record levels in 2020, with CN moving over 1.25 MMT, in addition to volumes shipped from Eastern Canada. These record grain shipments contributed to keeping the world fed during the pandemic.
CN also set a record in December 2020 of 53,000 barrels of propane for export from AltaGas’ Ridley Island Propane Export Terminal in Prince Rupert, BC. As other commodities began to recover in the second half of 2020, we started handling higher volumes of many commodity groups, to a point where, in the last three months of 2020, we were shipping record volumes of lumber and containerized products to meet pent‑up consumer demand, and most other commodities surpassed their 2019 fourth quarter volumes (with the notable exception of some energy and automotive sectors).
This recovery, though not yet complete, was achieved with CN rapidly adapting resource levels to match customers’ increasing demand by bringing our rolling stock back on line, and by gradually recalling furloughed train and engine crews, all the while ensuring they completed their required safety training prior to returning to work.
c n 2 0 2 0 a n n u a l r e p o r t x i i i

$440
125 140 ,
In 2020, CN committed
$2.9B in capital investments for a strong network and to enable safe and reliable supply chains.
I
THE INVESTMENTS BEHIND THE RESULTS
Moving large volumes of grain, propane, lumber and containers, while keeping pace with the recovery of other commodity groups, was a result of the can-do attitude of our people supported by the investment of over $10 billion in capital over the last three years, which also kept our network well maintained, safe and robust.
Highlights of our 2020 capacity enhancement investments included:
Three long siding additions on the Edmonton-to-Prince Rupert corridor for increased capacity to/from the Port of Prince Rupert.
Multi-year capacity enhancements in both the Vancouver and Prince Rupert areas, matching new port terminal capacity and enabling greater throughput.
Continuing to double track sections of our Western Canadian network, bringing the total to 140 miles of new double track completed since 2018.
5M
6 0.5
0 '
20
$25M $25M
2020 investments, in C$ and US$, for Canada and the United States, respectively, excluding rolling stock.
• Major yard capacity expansion projects in key locations, which extended yard tracks for greater throughput.
• New spillway bridge on the McComb Subdivision near New Orleans, LA, bringing greater reliability and safety to this challenging location.
• Acquisition of the last 41 units of our 2017 purchase of 260 new high-horsepower and fuel-efficient locomotives.
Took delivery of 1,009 of the 1,500 high-capacity grain hopper cars purchased in 2020, bringing the total number of new cars in-service since 2018 to 2,009.
Acquisition of autonomous track inspection cars for greater safety and track time efficiency.
Acquisition of 41 additional air distribution cars, for a total of 101 since 2019, for more reliable train operations during cold winter weather.
Replacing approximately 445 miles of rail and 1.6 million rail ties.
XIV N 2020 ANNUAL REPORT
$95M$95M$45M$45M
$55M$55M$25M$25M
$140M$140M$10M$10M
$20M$20M$10M$10M
$440M$440M
$25M$25M
$210M$210M$140M$140M
$265M$265M$420M$420M
$125M$125M
$5M$5M$35M$35M
$60M$60M$0.5M$0.5M
$70M$70M
In 2020, CN committed
$2.9Bin capital investmentsfor a strong network and to enable safe and reliable supply chains.
THE INVESTMENTS BEHIND THE RESULTS
Moving large volumes of grain, propane, lumber and containers, while keeping pace with the recovery of other commodity groups, was a result of the can‑do attitude of our people supported by the investment of over $10 billion in capital over the last three years, which also kept our network well maintained, safe and robust.
Highlights of our 2020 capacity enhancement investments included:
• Three long siding additions on the Edmonton‑to‑Prince Rupert corridor for increased capacity to/from the Port of Prince Rupert.
• Multi‑year capacity enhancements in both the Vancouver and Prince Rupert areas, matching new port terminal capacity and enabling greater throughput.
• Continuing to double track sections of our Western Canadian network, bringing the total to 140 miles of new double track completed since 2018.
• Major yard capacity expansion projects in key locations, which extended yard tracks for greater throughput.
• New spillway bridge on the McComb Subdivision near New Orleans, LA, bringing greater reliability and safety to this challenging location.
• Acquisition of the last 41 units of our 2017 purchase of 260 new high‑horsepower and fuel‑efficient locomotives.
• Took delivery of 1,009 of the 1,500 high‑capacity grain hopper cars purchased in 2020, bringing the total number of new cars in‑service since 2018 to 2,009.
• Acquisition of autonomous track inspection cars for greater safety and track time efficiency.
• Acquisition of 41 additional air distribution cars, for a total of 101 since 2019, for more reliable train operations during cold winter weather.
• Replacing approximately 445 miles of rail and 1.6 million rail ties.
2020 investments, in C$ and US$, for Canada and the United States, respectively, excluding rolling stock.
x i v c n 2 0 2 0 a n n u a l r e p o r t

The M Mor bx Ma Pub wi Schen ter wed ro. hi bal termii. eRrOal brow coltdr um fan Cal &bin pat en bon mum
INVESTING FOR GROWTH
Wang ohlairawing taking o sod& o pwooch m co Ow I iromobnind that wo ippon Wt 114 Nan growth. kande, etch kwtowd mOd• Or WWI rad Inda
Nein UN bra Hub — An karma:lel Foley thin wE arellathell the nO tiOne I ILVEly chi o and claw CN tO adding blamed d•nXrid h the erlealer on aid Warn Areo through the nodal Met or good, Rem Ion ee/ [Twice to roll On kr umir 21 2024 th• WWI Oviernment o waved th • valet eutfect to comparam with cowl done nelotina MI the *who oned d COred0O On with I Nig plow roma among others.
tietwnen el Tennis! — lhe nr• multiptewee Nay in Now 11 canons* WI, WI lodUcie On OUI0 ITO tho CO mine, d fir M *held web Wee and On ideroXodol bemgno I tO eenr• Mimeo ad noc•Nen el the metro pot) n moo or Poirroopoie and So ht Prcul,14J.
Ile.. UN Wee Pea — The NO-tech rocEty In pow* AL, WI etude o hdlg krboRMna and co ̂ Unahlrg Pkwtic pled with cm annual coOdciti or 25,000 twenty-foot *maw Lent Mite (TEUd ad wE pa *Om meaner, with ortoota glower cop/city MI (loam Ms% Lotto Anwical, wad Brown onk•te without walliwung co ete orniquiring doutl • laid Ing
97t11 1771 1", r17"-71 7
19,500 route miles of track a-, a Canada and the United States; the only railroadconnecting Canada' Eastern and Western coasts with the U.S. South.
Pert 4tMnw rale — lair* eeroed by CH, No northom Fedoop-wator vet Pin tho *atilt FPS bilitOro Aela Itbaked frOm QJ. lowaroura h boa n al long w F droOnt0 n-to -Prince Rupert corridor, wNch iemetionald 'titbit growth In 2021) deed be the parda.rtF lho ocicRion 01E4000 Nieto, double bock CO otiolied In 2:120 neCr Port EdWItli, PC, m ham neiwerk CO Po nitY bl eupixet of theiRldiei Wood and IP World Minh* Th. Fairview Torrid connector rood nwooine on schedule.
likw MwrMeinNene Owl le — collo tem [inn with the HOW= Po rt 1400 rity, adeell0 Idea, OCOCel cml R. mid cuito room, CN beam MI offiet ow or Kly 2020. Ingo:04 lobliTradol 101dOne th oxioh owl's:re:too Ind aimed ot nedudna do orthad truddng In Hal 7 hie new irk, *I We !clue cal ruppo Me growth in the frantic region lhe Port 0 I Ho lin I • Maher Chl-wolurrepOrt with ORO t PO Mita kr growth.
lend est Winn — CN, Nutchleon Porte aid the Porta Qtt.c a re wail rg tag other to pioneer a new I nownocia I container termini. I hie new, etotrof-th tort rocEty h rot to bane o co mentors.' or the cie*P-wober, Wern‘rici port The new tent d wit b. woahroly monist by CN, .Rh SKIL:odd platy babe to Chico go, Detroit o nd Toro nto. lhe opening h which' .d fOr2024, biters*, abject to read° torY Provoie.
ANNUAL REPORT XV
The Milton Logistics Hub will address the need for inland terminals, essential to move containers from Canadian ports to urban areas.
I NVE STI NG FOR G ROW TH
Moving ahead requires taking a strategic approach to capital investments that we expect will fuel future growth. Examples of such investments made or advanced include:
Milton Logistics Hub — An intermodal facility that will strengthen the national supply chain and allow CN to address increased demand in the Greater Toronto and Hamilton Area through the modal shift of goods from long‑haul trucks to rail. On January 21, 2021, the federal government approved the project subject to compliance with conditions relating to the environment and consultation with Indigenous peoples, among others.
New Richmond Terminal — The new multipurpose facility in New Richmond, WI, will include an automotive compound for finished vehicles and an intermodal terminal to serve shippers and receivers in the metropolitan area of Minneapolis and Saint Paul, MN.
Mobile Logistics Park — The high‑tech facility in Mobile, AL, will include a facility for bagging and containerizing plastic pellets with an annual capacity of 25,000 twenty‑foot equivalent units (TEUs) and will provide customers with extensive export capacity to access Asian, Latin American, and European markets without warehousing costs or requiring double handling.
Port of Prince Rupert — Exclusively served by CN, this northern BC deep‑water port offers the shortest route to/from Asia. It benefits from CN’s investments in long sidings along our Edmonton‑to‑Prince Rupert corridor, which experienced further growth in 2020 despite the pandemic. The addition of 18,000 feet of double track continued in 2020 near Port Edward, BC, to increase network capacity in support of the Ridley Island and DP World terminals. The Fairview Terminal connector road remains on schedule.
New Atlantic Intermodal Service — In collaboration with the Halifax Port Authority, stakeholders, ocean carriers and customers, CN began to offer, as of May 2020, integrated intermodal solutions through our Moncton Yard aimed at reducing short‑haul trucking in Halifax. This new service drives value and supports growth in the Atlantic region. The Port of Halifax is another CN‑exclusive port with great potential for growth.
Project Laurentia — CN, Hutchison Ports and the Port of Quebec are working together to pioneer a new intermodal container terminal. This new, state‑of‑the‑art facility is set to become a cornerstone of the deep‑water, year‑round port. The new terminal will be exclusively served by CN, with dedicated priority trains to Chicago, Detroit and Toronto. The opening is scheduled for 2024, but remains subject to regulatory approvals.
CN’s network of
19,500route miles of trackspans Canada and the United States; the only railroad connecting Canada’s Eastern and Western coasts with the U.S. South.
c n 2 0 2 0 a n n u a l r e p o r t x v
AUTOMATION, DIGITALIZATION AND DATA ARE STRATEGIC DRIVERS OF VALUE
OJ h moving Ito m FiecnIon
Scheduled RolroodIna P5R7 to Clot° Sciinduled Rdnwdig p9?4 with Wanted Intimation beqino login cob o roan on bolo nag orraloyea quip roir cob Mlaelddrlw.d. ad obloctine With COe C6R
bold. on the ningdee eetoti ed
by FSF while taro Bina canned and nein, ted ton n* irt0 kith. IITOONI0122200000, Panty ad eine or do Ina bail DSR al be ouppated
IN modem onto I do Warne With OW. rale ad .Wob4 ordatectina whin HI trineform o od modern 01. Minn 0100Y lo onto p, ad to wool* bettor coo Raab , ond co ictorotlo n with matonon ad Fortran. Thh ant e& delqinment Or tednology— QJenureddwrdvdae — h 2022 Lrldency
OJ tame that col outooxted roi nark lo WYforCN to keop
ma•infl the economic It ovE no neinn
Nam tan cad ling vlarailoo
bona.. byttlixina named FOXY ad reduced coat An mini* or some dime or tato motion leo with Revs inn Control Pt, In o tr • oporotlo ne. Thlo Wino logy (newt to prat anvil a cddentv nowitIna from hirnonerroc ouch
cn inionpeed dominion. The eon ton Intl* te o Maw** train on:Moodie, to Spa Din V
the (222N donor t Wks aka In Ileante2020, vuoninflay completed the at required Interpol" ley Marna we. Waal* who 042200111Y con repro tone on 01. 95 vutohilelore equipped
lixand dram o1 Over kW ID eVerrs#1 IIX4g kirCritiptbr r d paid*
2.1101.0 • b hump kr Noffin um of PhINWP MOM 0.•290 d. pontrt.
nen0012220e. Car oiedocio Cana+
with FRC In the Unbd Stone. The Pedal Folioed AdmInlitrolion (FlOA1
oho a pproaed arid (trifled 01.
FTC ivflt
Coto Iv moth or Impqrunt tote* omit New Mr ology pito min
ho roan nnldr. dot, fl owering the whole .prey choke to mare
bettie-inkirriod decnicao. in Mien MOO, OJ ruined t.not outs of na dintol oPPloOtlin 1:20012EnrnbrI kado 010 Ginel.
min El mann to COrelea eionleiely Path OJ kerne:kora Done elan; Infamotion, nixing n tirricted tine of aria rd CFS (cod* n — o roi 'reentry int
OJ h olio *Nang pa opine alined
ot trartraig pp Whit% ndudrel coon ad note OCCISMIY CO Mt. Ina 111•111.04. b dud, w **VW ONIr 10,C00 cricinkl darn to train green cold 950 more to cored locomotion radio nice In 2020 ove bawd on
*thing worts on do arida:10n for cnnee alto more,o rid rnedmIcal woe ad ended the yea math mare Ow n main °Menotti'', to *ninon npetitreo Mks. In
cattail to hawed eilicaclea Coro *Maid pas !Sn
Katy by Swing ug to dodgy
OPOCCIOnne eonhi the pad—to command Inkemotlo n *tag ad to Inelq frOntIne ware oat or *awl pa On theersirortmnINI
front *am Jay 2020, Ye how wad oar 6 all pages or pa yr with Case deacon
ZVI CM 2020 ANNUAL REPORT
Handheld devices also allowed us to communicate information and provide
functions to keep frontline workers out of shared spaces during the pandemic.
Brandon Pietka, Car MechanicGary, IN
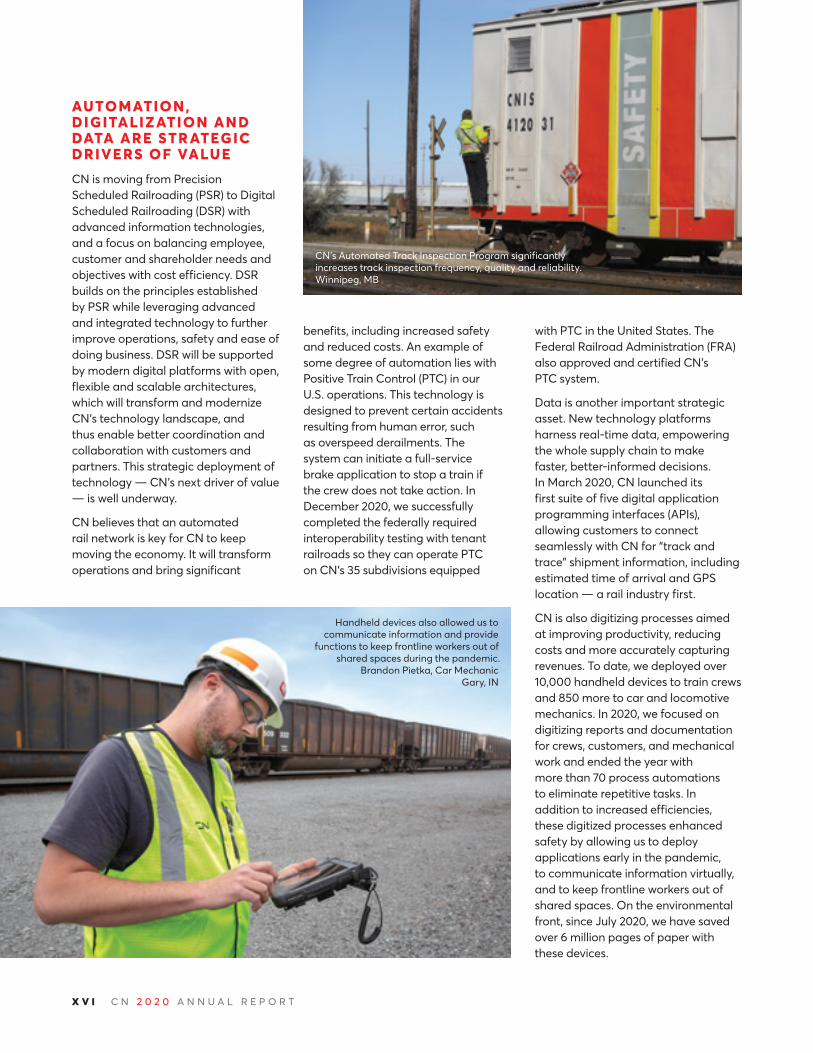
CN’s Automated Track Inspection Program significantly increases track inspection frequency, quality and reliability.Winnipeg, MB
AUTOMATION , DIG ITALIZ ATION AN D DATA ARE STR ATEG IC DRIVE RS OF VALU E
CN is moving from Precision Scheduled Railroading (PSR) to Digital Scheduled Railroading (DSR) with advanced information technologies, and a focus on balancing employee, customer and shareholder needs and objectives with cost efficiency. DSR builds on the principles established by PSR while leveraging advanced and integrated technology to further improve operations, safety and ease of doing business. DSR will be supported by modern digital platforms with open, flexible and scalable architectures, which will transform and modernize CN’s technology landscape, and thus enable better coordination and collaboration with customers and partners. This strategic deployment of technology — CN’s next driver of value — is well underway.
CN believes that an automated rail network is key for CN to keep moving the economy. It will transform operations and bring significant
benefits, including increased safety and reduced costs. An example of some degree of automation lies with Positive Train Control (PTC) in our U.S. operations. This technology is designed to prevent certain accidents resulting from human error, such as overspeed derailments. The system can initiate a full‑service brake application to stop a train if the crew does not take action. In December 2020, we successfully completed the federally required interoperability testing with tenant railroads so they can operate PTC on CN’s 35 subdivisions equipped
with PTC in the United States. The Federal Railroad Administration (FRA) also approved and certified CN’s PTC system.
Data is another important strategic asset. New technology platforms harness real‑time data, empowering the whole supply chain to make faster, better‑informed decisions. In March 2020, CN launched its first suite of five digital application programming interfaces (APIs), allowing customers to connect seamlessly with CN for “track and trace” shipment information, including estimated time of arrival and GPS location — a rail industry first.
CN is also digitizing processes aimed at improving productivity, reducing costs and more accurately capturing revenues. To date, we deployed over 10,000 handheld devices to train crews and 850 more to car and locomotive mechanics. In 2020, we focused on digitizing reports and documentation for crews, customers, and mechanical work and ended the year with more than 70 process automations to eliminate repetitive tasks. In addition to increased efficiencies, these digitized processes enhanced safety by allowing us to deploy applications early in the pandemic, to communicate information virtually, and to keep frontline workers out of shared spaces. On the environmental front, since July 2020, we have saved over 6 million pages of paper with these devices.
x v i c n 2 0 2 0 a n n u a l r e p o r t

BUILDING FOR A SUSTAINABLE FUTURE In the 25 years since CN was privatized, its suixesses have beat widely recognized. The Company has prospexed acconlingly But the expectations of our stakeholders axe evolving, and CN is determined in maintain its leadership position in the years that lie ahead. That means not just moving our cusinmerse goods safely and efficiently, but doing it in an enviromnentallyrespaisible manner. It means attracting developing and xetaining diverse talent. It means helpingIn make the comnramities we eerie sax and atm:roger, and it means setting impeccable ethical standards. CN will be guided bya simple maxim: how we deliver success is just as important as what we achieve. For CN, this is embodied by Delivering Responsib/y
CM 2020 AMI11141 RE1, 0121" XVII
BUILDING FOR A SUSTAINABLE FUTUREIn the 25 years since CN was privatized, its successes have been widely recognized. The Company has prospered accordingly. But the expectations of our stakeholders are evolving, and CN is determined to maintain its leadership position in the years that lie ahead. That means not just moving our customers’ goods safely and efficiently, but doing it in an environmentally responsible manner. It means attracting, developing and retaining diverse talent. It means helping to make the communities we serve safer and stronger, and it means setting impeccable ethical standards. CN will be guided by a simple maxim: how we deliver success is just as important as what we achieve. For CN, this is embodied by Delivering Responsibly.
At CN, we continue to Deliver Responsibly for a sustainable future.Red Pass, BCPhoto by Tim Stevens, CN Lubricator Maintainer c n 2 0 2 0 a n n u a l r e p o r t x v i i

ONI cif •
freffellemenne andtedtemo Intkont-cetia-frm walla
Ow materme platy I. en* ser nein. m Ilk Oletele•le a men loin.wen ca Ms
Gay eine Win Edon Svp...n.
vanotm, ON
CPJ waded the UMW Notion'. &atonable numb moat Goole and le ronalrg m those an Mace we tiara we coo ham the anode Impact — anat. Action, Imo ..etl and Intro uvula Decent Work and Economic Growt, Wad node Mee and Cororrentne, and Gender F 0,.d
CN glare with g bbd beet moan, Pato& My receding formwork, to men tan ipmeray and co rid ode oir b connencotino de Woman op to to lobo kale. Om earn hotly perforaxnam him cora ued to mom
the Corry:ow o doge groom the mrldli bed b 2020, CN wog op* lobed on the Dow Mom &r Inabaty World bed, and b Jaw ry 2)21, we nal 10th on the COMORO Knighte 2021 0(401100 locher or the root afloat. conga ilea.
ET 7
Sa lay o one %due otCN that nke, tr action °crow die Wits's Welke) II rode harent to CN thai rare kei o more rtaroa d. We thee to edema rd oteednYne, meets, want gouda renhbomIng co mmtrae, and the OrrAWSTIOnt Ohirrrit Ow (yoga) be the idea rag rood b North Americo by cul the that on wring Katy cubes and baba b techoolony and Infroaructwe to an the a hey or ow mrcloYeee and opentlmI
Chly Levorrido al On commitment to a flay h mnerlArned by blob& lea Mahn, and technology. Ow Loceikg Fin0d1Ode pa gran le err Oh safety cultist 'tie o AO Forded that *raglan ore tom htmdeea,00dledd Ingot* do Oak practice to are venom Bon home scaly ot the end or the do y It le o pea-to-peor pogrom that &cum on robing coonmee moon al erraloyee, or,
the to p cane or Weird one 'Mae, and on WeetrYba Ind manna are mrkproaehen, Donna wan au to be man or their 'would loge one recognize Patera I at-dohwork Exaction, oral teaching erraloyeee how to Meade coretructhe feedback to poem
ar ire toiled Ala dro to *robed a rely Utter Mm LOUR the an, mina [Ion They bee tleir din-to-110Y caddies with the potential MI come sada horn, mime of Mt These rune ore deed on pat Weird mal we deelarual to h p erase they do not home, apob. FlarY ierranne h tom ht to in derettnd ad follow then NW, and b) Mare their peen do the NKr*.
b 2020, CN oleo Introduced o raw Katy leadembn Donlon Program [ha t Modes erranyeee the Immure,. or mondial opaline to r$c and m dreebpaai the attitude oral behavior, required kea ea efOrkElOCIL
CN h oleo 4WD Bing Me teem* or to drhei ImpiVAKI ✓ariety pet manor. For nen*, (N h Intoam pewqrful Meer 0 nti 0 rtlicipl I MORONIC, Val dole rite alternated buck harioction on patio rod In na Like DIM enet3/4 1 track Moode., o t nomad track speed. b 2020, a 0 M, maw Lane ea uhelincil CN Inepecteci needy 875,000 ran or Doc& with on or many co rrldon fl ag up to 20 Onto mono Irerealorie dal yity,
Menu, nethodobe
AI Mama !MY le oleo tea mato how CM impede b rolcor fleet Ultro-hnh-deoltloo careen b meow outmoded IrePedno PO Mb COpttre 0 £160' New Mo bob gee It Mel, tiro ugh o t mannal track epee& hie method or Idea main bin VMa Urn mitChlrorleardnO Oki atom, roma, kePeCtno qua It% freemen; gad rola.. der b 2020, QJ buat on b 20e9 Mon aid tv embinahl *erten drab wort Oa completed, them on adhere wit bate dedide with so hewn loteroctloo, rod mocha (do modally Dewy bet work Orlin nr tor repair.
Roth thee, Meal:Wore el atdna [Ion — the track Inerectloo nacre oral rob b ipedlor, paw, — know bepectIon frequency oral quaky and cloy ormared role b poreletb0 'odder°. The goal le to ream ey .rein the rtek or Nyman error aid me otroaed enaloyeee to repair defects rather On, worth ðers.
XVIII CN 2020 ANNUAL REPORT
Every CN employee is committed to an incident‑ and injury‑free workplace.
Our number one priority is to train our workforce on Life Critical Rules so we all go home safely, every single day.
Greg Banks, Work Equipment Supervisor
Vaughan, ON
CN supports the United Nation’s Sustainable Development Goals and is focusing on those areas where we believe we can have the greatest impact — Climate Action, Innovation and Infrastructure, Decent Work and Economic Growth, Sustainable Cities and Communities, and Gender Equality.
CN aligns with global best practice sustainability reporting frameworks to ensure transparency and consistency in communicating our performance to stakeholders. Our sustainability performance has continued to earn the Company a place among the world’s best. In 2020, CN was again listed on the Dow Jones Sustainability World Index, and in January 2021, we ranked 10th on the Corporate Knights 2021 Global 100 Index of the most sustainable companies.
SAFET Y
Safety is a core value at CN that guides our actions across the business. Nothing is more important to CN than running a safe railroad. We strive to safeguard our employees, assets, customers’ goods, neighbouring communities, and the environment — always. Our goal is to be the safest railroad in North America by cultivating an unwavering safety culture and investing in technology and infrastructure to ensure the safety of our employees and operations.
CN’s uncompromising commitment to safety is underpinned by training, leadership, and technology. Our Looking Out For Each Other program is key to CN’s safety culture. It is a vital mindset that employees are taught and encouraged to integrate into daily practice to ensure everyone goes home safely at the end of the day. It is a peer‑to‑peer program that focuses on raising awareness among all employees on
the top causes of incidents and injuries, and on identifying and reviewing safe work procedures, training employees to be aware of their surroundings and recognize potential at‑risk work practices, and teaching employees how to provide constructive feedback to peers.
Our Life Critical Rules aim to embed safety further throughout the organization. They identify day‑to‑day activities with the potential to cause serious harm or loss of life. These rules are based on past incidents and are designed to help ensure they do not happen again. Every employee is taught to understand and follow these rules, and to ensure their peers do the same.
In 2020, CN also introduced a new safety leadership training program that teaches employees the importance of controlling exposures to risk, and on developing the attitudes and behaviours required for a safe workplace.
CN is also leveraging new technology to drive improved safety performance. For example, CN is installing powerful sensor and artificial intelligence (AI) tech into automated track inspection cars positioned in regular trains, enabling track inspections at normal track speed. In 2020, using this new autonomous technology, CN inspected nearly 375,000 miles of track, with some of our key corridors receiving up to 20 times more inspections than with previous methodologies.
AI technology is also changing how CN inspects its railcar fleet. Ultra‑high‑definition cameras in our new automated inspection portals capture a 360° view of a train as it travels through at normal track speed. This method of railcar maintenance, using machine‑learning algorithms, improves inspection quality, frequency, and railcar reliability. In 2020, CN built on its 2019 field trial by extending algorithm development. Once completed, these algorithms will locate defects with zero human interaction, and produce automatically generated work orders for car repair.
Both these innovations in automation — the track inspection railcars and train inspection portals — increase inspection frequency and quality and play an essential role in preventing incidents. The goal is to eventually eliminate the risk of human error and use our skilled employees to repair defects rather than search for them.
x v i i i c n 2 0 2 0 a n n u a l r e p o r t

Our relentless lbcus on safety has resulted in both our FAA personal injury and train accident ratios improving by
P CNPWPred tIPPOI ndirric naves Illy, Patine blpha men to
Irtubt the Moth crld whey crow th• co ', inmate, In
%Abb..* opine* VS iiiiibtatoci CINIb4bbiCCNID-151bcrn,
fiblitoffoncloccupotkai ,ad punt %
inlays *cam to hool th ond wil Yaw moo wow hadnil bienlocbn, CP4 Biciwup
FOrniv M.arms Room n 0111bnbil hifith tip, nd
CN Rai al grad with guldo nop Atm Wald Rooth 0 Feat° don,
as proacial,nond &d.. aRMtaaW. rritdcbod dirnOcaotromil,inatied work from lane fin 01110ovia not requisci en ilte, mcnd d.aarlg mama In4Ytocador.,radr aid Iftvicol 'Atom:big rimming cold and fro nalia wedges «we iquipsoci big opyropia PrIO nal proem:So scidpnort b bbbon, owe that raided to port, nn molten* ra or co nanction work knableithelrbtwoctiongidth kat =Innis* OF thrOUgh a of Wttratcominrdwdmaadyoodcad go ode chaery ardour. AI that mnumina b• robe:trod Y12021, b con° kola idth pubic bah ntbarbg *Paha
15%..18%, respectively.
CM ANNUAL. REPORT XI X
Ensuring the safety and integrity of our tracks is a daily task at CN.Jean‑Jacques Gionet, Track SupervisorHalifax, NS
Our relentless focus on safety has resulted in both ourFRA personal injury and train accident ratios improving by
15% and 18%,respectively.
PAN DE M IC RE S PON S E
CN triggered its pandemic response early, putting in place measures to protect the health and safety of our employees, and the communities in which we operate. We established a dedicated COVID‑19 team, deploying our medical staff and occupational health department, and providing employees access to health and wellness resources, including telemedicine, CN’s Employee and Family Assistance Program, as well as mental health tips and resources.
CN fully aligned with guidance from the World Health Organization, as well as provincial, state and federal authorities. We restricted employee travel, enabled work from home for employees not required on site, amplified cleaning regimes in all locations, implemented strict physical distancing measures and ensured frontline workers were equipped with the appropriate personal protective equipment. In addition, crews that needed to perform maintenance or construction work limited their interactions with local communities through use of electronic communication and food and goods delivery services. All these measures will be maintained in 2021, in compliance with public health authorities’ directives.
c n 2 0 2 0 a n n u a l r e p o r t x i x

CN's team is composed of approximately
n4 000 talented railroaders, all dedicated to r our service flut_ the economy moving.
PEOPLE
Oh pool* an ow onto twt nowt They powwow exzeget
Looking °hood, w. ta roam on attractko3 In MINK dokolodno tholr yea mei pooling the wort or In &aloe wortcloco that wE rw. door My Ingrate and nwnoln no wailed CN trnp4owook
CN a odno to how a woo deo too diotnAoao doo dkocolty or duo Owntntwano In wNdl ea Ocetobe. We how ea
[Meet to Meth by 2022, cold doontorter moIntoln,
wolatkok mcnagetnott Nom el which at hoot80%colo women:Mb ta toot alone wth cadet* bo tleCeeNtibe th• ada, C.aerK Or ee) nee el buds ow wet elute, the Co tolyotAmord 2022 to wNdl CN ban* a elgeOblef ▪ 2020.
Rtoultv an whet ni I natty- h do yosn a Way_ wE
do mon to el Rol an bwin enekehmott ete PI MR Meet* tolgtoe and khentltic We an ontetateeci MI ova dno a cuttwo whoa drhnonno h wolund and wo a toting
co no** action to MCC rt thatcottehltneet Ircrecting outreach to trnpkottoo — re know la otal to recta — mid crwo the Emit:kyle Rowers ego ta whom ✓ainy... rat *taw boolynxwodo a radio r ballad ael flatlet* Ana. Ideal el 213(20, woo appolnbod a Dinar or Elworolty, Equity and Insktolon.
In Fobrucry2021,CN oho winowood do matt:0 or an kid lgorsour AddroryCarci 0.04. m Indocondwit body oornplond of Indloentel Woe, teem aaow do ▪ teley.lhe IACti mandato le to porada °dila to do Neat ha or alma nagonwt on anytime the I AC or CN mcoxigettort down *ow it to CN, bxixing rokokosontnt or Wonky and bwiwkon le ow NotkdOeh
YY CN RORO ANNUAL REPORT
CN is committed to the advancement of women within our teams. Having a diverse workforce that
reflects the fabric of the communities we serve and the various stakeholders we work with is important.
Vanessa Burzynski, Labourer, Moving Units YardWinnipeg, MB
PEOPLE
CN’s people are our greatest asset. They power our success. Looking ahead, we will focus on attracting diverse talent, developing their skills, and providing the sort of inclusive workplace that will ensure they fully integrate and remain as valued CN employees.
CN aspires to have a workforce that reflects the diversity of the communities in which we operate. We have set a target to attain, by 2022, and thereafter maintain, an executive management team in which at least 30% are women. This target aligns with our pledge to accelerate the advancement of women in business, as set out in the Catalyst Accord 2022, to which CN became a signatory in 2020.
Results are what will matter in the years to come. We will do more to ensure an inclusive environment across race, gender, religion and identity. We are committed to creating a culture where difference is valued and we are taking concrete action to support that commitment, including increasing outreach to employees — we know it is vital to listen — and creating Employee Resource Groups where employees with similar backgrounds and/or interests can gather to share ideas. In 2020, we appointed a Director of Diversity, Equity and Inclusion.
In February 2021, CN also announced the creation of an Indigenous Advisory Council (IAC), an independent body comprised of Indigenous peoples from across the country. The IAC’s mandate is to provide advice to the highest levels of CN management on any issue the IAC or CN management deems relevant to CN, including reinforcement of diversity and inclusion in our workplace.
CN’s team is composed of approximately
24,000talented railroaders,all dedicated to keeping our service fluid and the economy moving.
x x c n 2 0 2 0 a n n u a l r e p o r t

Moving goods by rail instead of truck is
4x more fuel
-̀a-̀2Ih 1< 9.-, c
71'1,46 icilin275 {."„ru
cifFr.lcrihtm ,cirj
ENVIRONMENT
Cgricogreisitetctr cfrna We dimein& and tha [buil aim nut not rank adapt theynut be pat or the woke° n. 0 is goal le to conduct ow owedone with minimal endronmentol Imp:laced to ploy a Fabian:he role In the tra akin to a Incarton won arm co reining rumba protecting and new rim rated ecoriebieneta ail a dei nag the *wily eanornicl hie le whyGN rumen the Pale Agreement and aim ti exabigiee and target. wth anat. wiliece
CN hao a tong track nand oft* mil co rb:in d7ldeawtcand ha Wowed lacanothe wan kitenvityby apptairnatehriii)% 1993. to [h. din CN reran the North Any/ban r bwkeirY103der, conning raaaNY1596.1••• lacanothe frrel pc grow tan Minh", the vine and Clow I ration peat trorming ml kettle long had Ng aka ndy rum (alp ennui° re.
b 2020, CN bane an ofibloi oupixeter or the Toik Face on 0 Inate-nil add Roundel Dielowne MFG, mil wog the fintNorth Amelan rota ail to mole a eta r4-do no TCF0 repwt ars action, to reduce errant, matigabi tirmabi riga mil Sulk* the low-co kon wino Yreafld ti CN being one or aray tine Co nada cornciblei Sad on COP% 2020 meth* ui Moats A Lk
Ribrucry2021,CN nomad twr hoki a.odbr whireholciere each pia r at id ARM on Ni. COmpavie Ohr WO Action Pim Thle b t corraermea CNti bnirita acing mil rebus tdined Gage dodo am, tr pibic repwting or air ale wank aced 0 ir antil3 'go reduce (346 renhebn earrellY, CO wee CO Olt wo mina' menial.
CPJ employee we a ctiay engaged in ow witinatey erratic nailing Wen* welre tO reduce energy ale at kr/ yaxig by rough)/ fl ow the wit decade mil Sect cixtrairnatebir 90%9amwaits from laid fag through
rockinernicidearew mein.
CN le corninittel to protecting bioliervity and ram %big the load in the Kirke, beaten through Mier OW Weak are, Including ha:lona Pahl( roiled, mildew ad wetkricit ar Ecoeornedono progrErn contrbitee to tiocOvnitir by.RAoktrg TON aeFaaeebxlm b tile corm-mit*, mil Riot Natflo along ow as tot
Protecting and restoring natural ecosystems is part of the way CN conducts its business.Trimble, TNPhoto by Eric Graf, CN Labourer
E NVI RON M E NT
CN recognizes that our climate is changing, and that businesses must not merely adapt, they must be part of the solution. Our goal is to conduct our operations with minimal environmental impact and to play a substantive role in the transition to a lower carbon economy, conserving resources, protecting and restoring natural ecosystems, and advancing the circular economy. This is why CN supports the Paris Agreement and aligns its strategies and targets with climate science.
CN has a strong track record of fuel and carbon efficiency, and has improved locomotive emissions intensity by approximately 40% since 1993. To this day, CN remains the North American rail industry leader, consuming roughly 15% less locomotive fuel per gross ton mile than the average of its Class I railway peers. Leveraging rail for the long haul significantly reduces GHG emissions.
In 2020, CN became an official supporter of the Task Force on Climate‑related Financial Disclosures (TCFD) and was the first North American railroad to release a stand‑alone TCFD report. CN’s actions to reduce emissions, mitigate climate risks and develop the low‑carbon economy resulted in CN being one of only three Canadian companies listed on CDP’s 2020 prestigious Climate A List.
In February 2021, CN announced it will hold a vote by shareholders each year at its AGM on the Company’s Climate Action Plan. This initiative complements CN’s long‑standing and robust climate change disclosures, our public reporting of our GHG emissions, and our strategy to reduce GHG emissions intensity, as well as our year‑over‑year progress.
CN employees are actively engaged in our sustainability efforts, finding concrete ways to reduce energy use at key yards by roughly 35% over the past decade and divert approximately 90% of our waste from landfills through reduce‑reuse‑recycle‑renew programs.
CN is committed to protecting biodiversity and managing the land in the various habitats through which our network runs, including national parks, forests, prairies and wetlands. Our EcoConnexions program contributes to biodiversity by supporting mass reforestation in the communities and First Nations along our rail lines.
Moving goods by rail instead of truck is
4× more fuel efficientandreduces GHG emissions by
75%.
c n 2 0 2 0 a n n u a l r e p o r t x x i

Since 2012, CN and our partners in Canada and the U.S. have planted
millon million trees,
COM
MtPrato boo good mightoK avothig socio-ram mac bloat crd hvaputrig to maks co nix., Itin Sorg's' wad
making CN one of pin, win. ongogblig 0m0[okt0Snto bAd ktttirg
the leading private invemnpatorthenx.iyiewto,,,,cnci bxigimw. olidtionela Ostia rot oonttnt, cm hostmon on
non-forestry tree planters.
an n r opoici m 0 i•pra•Oarmiail d ti * ads togrAra tancts davit,:
01.11.•• One* origilngric, M Seat how Porta! two 'Alan o.w o• wet i"?
airantirortlogio coemigise. . *WPM 114
sty, Cbootb
CO mute. OGIVIII nave At QJr impeckey proud • ft eniekvnathxd done Pawn arra' don torn th• Cala cim Cad Ike Atm' ghxd &lima r olr GpnrrarrratowaMrg with I nag *flout
rniThlratille cnci taws
Al CN, au h practices do o °Mop we, ax ow' • 111005.14, nor do thowatop Ordr knat oral pTrlw.. S ty rinds to o IN CO ntrElan, Witornor Mg 0 rad th • C.:11 11•1 n which re opleolbk Bray 'MOS iabite te Wile la the anninCy 1711111XMINIIIM along • niltm dr. Fora 111:40,al Invortznt ar g work inuccong 7RANSCAER• fronoatOtiOn
CCo rrnrity Aim MINIM mil &now * , igadtiliblin:1111%Lon
by notated. N 2D2D, (WPM Ibacilli:los blIcond W etaCO=49 widen* 01 prtidrotssi N Iwo rtY ISO TRWCAER owirti,titiavalticoltrobliv to ono lit 2,100 co itkipmat W• oho so mod th• pmeWoug 7A1NSCAERNotkmol Achi owlet Arc rd from the Amodart Chipatry Co Lad a r the 12th conecutka yam
W 44nOvomig oho mole h ur dors of insingeong mow& a) to thouKride orchadom 0 oth ode o corm-sulky own kt Co nod° Ond SOIL atp, do, v &ng Rol So Fey Wee, °tout tho Impytmes of
• gority mid the do nein &wiling orplpyfrgon or row ramytro ckt to Ma croon, that molly too k the firm obatuol soiletY ridothilc
CN is engaged in Delivering Responsibly and in the fight against climate change.
CN, Tree Canada and America in Bloom have planted two million trees as part of
our commitment to greener communities.Winnipeg, MB
© Tree Canada
COM M U N ITI E S
CN strives to be a good neighbour, creating socio‑economic benefits and investing to make communities stronger and safer, while engaging our stakeholders to build lasting relationships. Over the past century, CN has been an important part of the many cities, towns, and Indigenous communities across our network. CN is especially proud of its Progressive Aboriginal Relations Bronze Level certification from the Canadian Council for Aboriginal Business for our commitment to working with Indigenous communities and businesses.
At CN, safe practices do not stop with our own employees, nor do they stop at the limit of our premises. Safety extends to our contractors, customer sites and the communities in which we operate. Every year, we take steps to enhance the emergency preparedness of communities along our network. For example, an important component of CN’s work is supporting TRANSCAER® (Transportation Community Awareness and Emergency Response), an outreach effort to train community emergency personnel situated near rail lines where dangerous goods are transported. In 2020, despite limitations imposed by the COVID‑19 pandemic, CN participated in nearly 130 TRANSCAER events, bringing critical training to almost 2,100 participants. We also earned the prestigious TRANSCAER National Achievement Award from the American Chemistry Council for the 12th consecutive year.
CN employees also make hundreds of presentations annually, talking to thousands of children and adults at schools and community events in Canada and the U.S., especially during Rail Safety Week, about the importance of rail safety and the dangers of walking or playing on or near railway tracks. In 2020, of course, these mainly took the form of virtual safety initiatives.
Since 2012, CN and our partners in Canada and the U.S. have planted over
2 million trees,making CN one of the leading private non‑forestry tree planters.
x x i i c n 2 0 2 0 a n n u a l r e p o r t
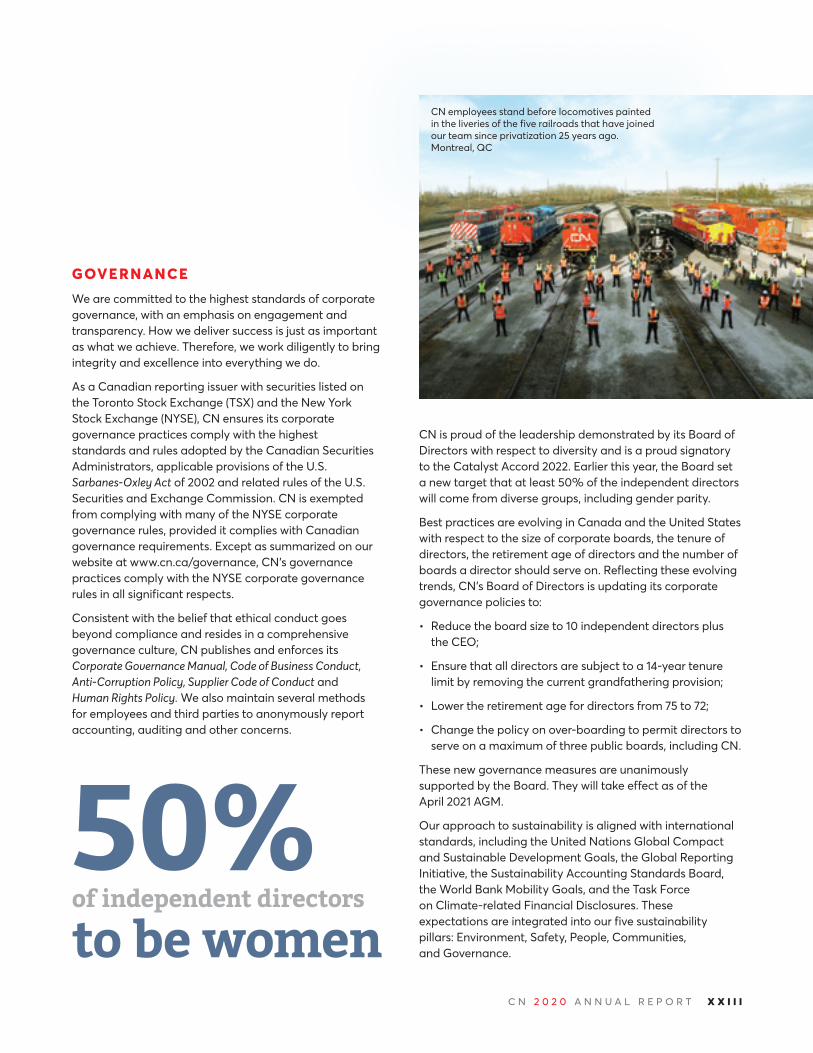
• entiam. tore tam lonam:44•• point& into swim clan rim camon *ix bow•Jcir air atm dna Frierciecticr 25 'Nagoya motrod.00
GOVEDEIP,EICE
We in command to do h [toot itaxiade or amp, rata gobrornimax W d. a onchabie on engagement d tra narennolcil ow wo Sas mom, flat au Irmo not ob what widow lhonbronx w. work dgoondy d ixing
ty and wawa into ranthing wo do.
Au a Colada, reporting limy with obasitio good on tho Toronb) StackEesigo (1.53.4 anddo Now ‘1)rk StECICEnrifio re ljE1 alarm itvaxpixa bp gobrorninxi Ira cite, co rnbly with do high** itaxlirde and nAio adobtid by do Co nada Swat*, Adrnbliitratorx applcotbe porieloro or dio US. Scotaregykt or2002and mind nig, or do US. Sabo, and Echo ngo Corse nn CNY mowrptild from complying th rnirry or the NersE corporate goxonxmco °Am palled it cord ha with Canada,goxonxmom rocf.iinbrnora. Ebcobt ow Firma rind on ow web** at tinintayarnowncmax gammanom maks, comply with the thSE caw rata worm, ol nAio in at Apr omit nowt*.
Conant with the toWthot othkol conduct gooe briond cornutram and rook*, in a obrnpahonfl governs adbee, W cobgehow and glebe to CorpxottGounnct Kw* Cocirorguthatt Conduct Art-Carupbal Fbilqs.SuppWrCocir oftorduct and Nino ROM Raw. Ws aloo maintain weal method, foe on1010a , mod third Fort*, to a nonyrnoubly nowt °conning ,a biting aid edit/coolant
afixteis isrit directors
to be women
CN h proud ordolpdrW.bd..na.wtraddbykTBoador Cinicto rebid th nowt to dhervity a nd I. a proud elm awry to tho Co talyetAccord 2022. Ea riir [hie yea; do Ford bit a now [ogre[ tha t a tiosot50%or di • indopwodort cfrocbm wg gyro from On gran bximing god. conic
Pout rime in ow Ping in Canada and do US W Stabio with nowtMI do to or corm rata bard., do Winn or cinictorx do nitinbrnort ago or In:tore and do reran or boat. a cinntre eibouki arm on. RiAbcting dal etching Mode, CM Boat of Diniaore i updo [Mg Id amp:tad goxonxmco po IS. We
• Riduom the too rd vial to 10 indopondwt director, pk• do CECt
• Ewa theta' cirocbre an autfact to a 14-or Win aria by, nwvhg do owlet gra ndrothodng pro.4orc
• Lon tho nitinbrnort ago ror director, rrorn 75 MI TZ
• amigo tho raw on ow-beading pwrnt cirocbre to ▪ o a woman of throe p.iblcboardb, bxiacing W.
now gown moo moo ono an Ism 'mourn Rand by do Pard.liwir WI Wks dicta, or do AVI MO ACM.
approodl to eubtainotEtylo aped Wd. mnodwnl itaxlirdx do USW hiadon • Global Compost a.dS.ritabbablo ilrekiornortedook t. (Now Reratine w esta, t. Suitt atm ty Accantinn Sbrod cr. Boat, do *,fay Palk Wait/ Gook and tho Took Force on anato-nblobid Rno WI CI &mom Thai 0:11,4CtOtking an Integrated Into o lr fkr• alto bleary Ian Bwironnent,Sorotis Pool* Comenmitin
d Gown° not
XXIII
CN employees stand before locomotives painted in the liveries of the five railroads that have joined our team since privatization 25 years ago.Montreal, QC
GOVE RNANCE
We are committed to the highest standards of corporate governance, with an emphasis on engagement and transparency. How we deliver success is just as important as what we achieve. Therefore, we work diligently to bring integrity and excellence into everything we do.
As a Canadian reporting issuer with securities listed on the Toronto Stock Exchange (TSX) and the New York Stock Exchange (NYSE), CN ensures its corporate governance practices comply with the highest standards and rules adopted by the Canadian Securities Administrators, applicable provisions of the U.S. Sarbanes‑Oxley Act of 2002 and related rules of the U.S. Securities and Exchange Commission. CN is exempted from complying with many of the NYSE corporate governance rules, provided it complies with Canadian governance requirements. Except as summarized on our website at www.cn.ca/governance, CN’s governance practices comply with the NYSE corporate governance rules in all significant respects.
Consistent with the belief that ethical conduct goes beyond compliance and resides in a comprehensive governance culture, CN publishes and enforces its Corporate Governance Manual, Code of Business Conduct, Anti‑Corruption Policy, Supplier Code of Conduct and Human Rights Policy. We also maintain several methods for employees and third parties to anonymously report accounting, auditing and other concerns.
CN is proud of the leadership demonstrated by its Board of Directors with respect to diversity and is a proud signatory to the Catalyst Accord 2022. Earlier this year, the Board set a new target that at least 50% of the independent directors will come from diverse groups, including gender parity.
Best practices are evolving in Canada and the United States with respect to the size of corporate boards, the tenure of directors, the retirement age of directors and the number of boards a director should serve on. Reflecting these evolving trends, CN’s Board of Directors is updating its corporate governance policies to:
• Reduce the board size to 10 independent directors plus the CEO;
• Ensure that all directors are subject to a 14‑year tenure limit by removing the current grandfathering provision;
• Lower the retirement age for directors from 75 to 72;
• Change the policy on over‑boarding to permit directors to serve on a maximum of three public boards, including CN.
These new governance measures are unanimously supported by the Board. They will take effect as of the April 2021 AGM.
Our approach to sustainability is aligned with international standards, including the United Nations Global Compact and Sustainable Development Goals, the Global Reporting Initiative, the Sustainability Accounting Standards Board, the World Bank Mobility Goals, and the Task Force on Climate‑related Financial Disclosures. These expectations are integrated into our five sustainability pillars: Environment, Safety, People, Communities, and Governance.
50%of independent directors
to be womenc n 2 0 2 0 a n n u a l r e p o r t x x i i i

BOARD OF DIRECTORS As at March 9,2021
Robert Pace, D. COMM., C.M. Chair of the Board Canadian National Railway Company President and Chief Executive Officer The Pace Group COMMITTEES: 3, 4*, 5, 7
Jean-Jacques Ruest President and Chief Executive Officer Canadian National Railway Company COMMITTEES: 4, 8
Shauneen Bruder Retired Executive Vice-President, Operations Royal Bank of Canada COMMITTEES: 1*, 4, 5, 6
Donald J. Carty, O.C., LL.D. Retired Chairman and Chief Executive Officer American Airlines COMMITTEES: 1, 5, 6, 7, 8
Ambassador Gordon D. Giffin Partner Dentons U.S. LLP COMMITTEES: 2*, 4, 5, 8
Julie Godin Co-Chair of the Board, Executive Vice-President, Strategic Planning and Corporate Development CGI Inc. COMMITTEES: 2, 3, 6, 7
Edith E. Holiday Former General Counsel, United States Treasury Department and Secretary of the Cabinet The White House COMMITTEES: 1, 2, 4, 8*
V. Maureen Kempston Darkes, O.C., D. COMM., LL.D. Retired Group Vice-President General Motors Corporation and President GM Latin America, Africa and Middle East COMMITTEES: 1, 2, 7*, 8
The Honourable Denis Losier, P.C., LL.D., C.M. Retired President and Chief Executive Officer Assumption Life COMMITTEES: 2, 4, 7, 8
The Honourable Kevin G. Lynch, P.C., O.C., PH.D, LL.D. Retired Vice-Chair BMO Financial Group COMMITTEES: 1, 3, 6*, 7, 8
Margaret A. McKenzie Founder and former Chief Financial Officer Range Royalty Management Ltd. COMMITTEES: 2, 3, 5, 6, 7
James E. O'Connor Retired Chairman and CEO Republic Services, Inc. COMMITTEES: 1, 2, 3, 5
Robert L. Phillips President R.L. Phillips Investments Inc. COMMITTEES: 2, 3*, 5, 6
Laura Stein Executive Vice President, Corporate & Legal Affairs and General Counsel Mondelez International COMMITTEES: 1, 2, 5*, 6
COMMITTEES: 1 Audit 2 Finance
3 Corporate governance and nominating
4 Donations and sponsorships 5 Environment, safety and security 6 Human resources and compensation
7 Strategic planning
8 Pension and investment * Denotes chair of the committee
XXIV CN 2020 ANNUAL REPORT
BOARD OF DIRECTORSRobert Pace, d. comm., c.m.Chair of the BoardCanadian National Railway CompanyPresident and Chief Executive OfficerThe Pace Groupcommittees: 3, 4*, 5, 7
Jean‑Jacques RuestPresident and Chief Executive OfficerCanadian National Railway Companycommittees: 4, 8
Shauneen BruderRetired Executive Vice‑President, OperationsRoyal Bank of Canadacommittees: 1*, 4, 5, 6
Donald J. Carty, o.c., ll.d.Retired Chairman and Chief Executive OfficerAmerican Airlinescommittees: 1, 5, 6, 7, 8
Ambassador Gordon D. GiffinPartnerDentons U.S. LLPcommittees: 2*, 4, 5, 8
Julie GodinCo‑Chair of the Board, Executive Vice‑President, Strategic Planning and Corporate DevelopmentCGI Inc.committees: 2, 3, 6, 7
Edith E. HolidayFormer General Counsel,United States Treasury Departmentand Secretary of the CabinetThe White Housecommittees: 1, 2, 4, 8*
V. Maureen Kempston Darkes, o.c., d. comm., ll.d.Retired Group Vice‑PresidentGeneral Motors Corporationand PresidentGM Latin America,Africa and Middle Eastcommittees: 1, 2, 7*, 8
The Honourable Denis Losier, p.c., ll.d., c.m.Retired President and Chief Executive OfficerAssumption Lifecommittees: 2, 4, 7, 8
The Honourable Kevin G. Lynch, p.c., o.c., ph.d, ll.d.Retired Vice‑ChairBMO Financial Groupcommittees: 1, 3, 6*, 7, 8
Margaret A. McKenzieFounder and former Chief Financial OfficerRange Royalty Management Ltd.committees: 2, 3, 5, 6, 7
James E. O’ConnorRetired Chairman and CEORepublic Services, Inc.committees: 1, 2, 3, 5
Robert L. PhillipsPresidentR.L. Phillips Investments Inc.committees: 2, 3*, 5, 6
Laura SteinExecutive Vice President, Corporate & Legal Affairs and General CounselMondelez Internationalcommittees: 1, 2, 5*, 6
CO M M IT T E E S :
1 Audit2 Finance3 Corporate governance
and nominating4 Donations and sponsorships5 Environment, safety and security6 Human resources and compensation7 Strategic planning8 Pension and investment * Denotes chair of the committee
As at March 9, 2021
x x i v c n 2 0 2 0 a n n u a l r e p o r t

SELECT SENIOR OFFICERS Lirtitth ISOM
Jeleal-latqual Rant RMNntadCa WE meatier Ci Mar
Dardraque Deldeadlint Empathy eice4:teekrnet
d Chit larcerootion d Technology Cram
KC Bin Sono rVice-Fteekira t Co mere RD cect STOW Cho In
Obit Ergrall amcutter Vice-Pred diet ad ChleRna rola I Officer
10/1101 eldral Sselor alcm-Theekiset Fa Centric Supyty aoti
noutia7h= Sena ka-Preekiset Network Clinic re
'sr fag_
Babert In scientRaeutlw ad OW Operating Caw
ee's
•
13C0)thli. Data Sono reice-Fteeldra t ceidaknOrrei RIMO MOM dear
Naar Thayettille eice-Prrekient Rna ndo I FIcrednp
It
- 1 IIt
.redi AzSlat Pita Peocutter Vre-Pred diet Corporate Send am ad chwupoi caw
Th
DORI PECTICald.d. Sete alarTheekiret Cram W the Froldeet ad CEO.Sa.d,I Rolled
"bra Parka Peek** and Oeer FeeatNe Offloor CN Invotrnent DvWon
CM 2020 ANNUAL REPORT
SELECT SENIOR OFFICERS
Jean‑Jacques RuestPresident and Chief Executive Officer
Ghislain HouleExecutive Vice‑President and Chief Financial Officer
Robert ReillyExecutive Vice‑President and Chief Operating Officer
Sean FinnExecutive Vice‑President Corporate Services and Chief Legal Officer
Dominique MalenfantExecutive Vice‑President and Chief Information and Technology Officer
James CairnsSenior Vice‑President Rail Centric Supply Chain
Dorothea KleinSenior Vice‑President and Chief Human Resources Officer
Doug McDonaldSenior Vice‑President, Office of the President and CEO, Special Projects
Keith ReardonSenior Vice‑President Consumer Product Supply Chain
Doug RyhorchukSenior Vice‑President Network Operations
Janet DrysdaleVice‑President Financial Planning
Marlene PufferPresident and Chief Executive Officer CN Investment Division
Paul ButcherVice‑President Investor Relations
As at March 9, 2021
c n 2 0 2 0 a n n u a l r e p o r t x x v

1ft w•Ing dot.o..0dmgovt•or,.. c.01, 235 1.x. d. cabr.NF.crgatl.FAR.Ap.d.M CWo• kpo qw*ftcr•o1•43 cc* *• pm., a MP, ewore. rk..,101.10C OC.A0,15Th..........s0k=n4 Co tot VAcore.C.Pot Esmarn.
A CN engine with five locomotives representing the railways that have joined our team since our privatization, 25 years ago. Each one features the colours of the railway at the time it merged with CN as well as the logo specially created to commemorate the quarter century of our IPO. From left to right: BC Rail; Grand Trunk Western; CN; Illinois Central; Wisconsin Central; and Elgin, Joliet & Eastern.


SHAREHOLDER AND INVESTOR INFORMATION Annual meeting
The annual meeting of shareholders will be held online via webcast at 10:00 a.m. (EDT) on April 27, 2021.
Please refer to www.cn.ca for meeting details.
Annual imormation ?arm
The annual information form may be obtained by writing to:
The Corporate Secretary Canadian National Railway Company 935 de La Gauchetiere Street West Montreal, QC, Canada H3B 2M9
It is also available on CN's website (www.cn.ca).
Transfer agent and registrar
Computershare Trust Company of Canada
Offices in Canada: Montreal, Quebec Toronto, Ontario Calgary, Alberta Vancouver, British Columbia
Telephone:1-800-564-6253 www.investorcentre.com
Co-transfer agent and co-registrar
Computershare Trust Company N.A. Att: Stock Transfer Department
Overnight Mail Delivery: 462 South 4th Street, Louisville, KY, United States 40202
Regular Mail Delivery: P.O. Box 505005, Louisville, KY, United States 40233-5005
Telephone: 1-800-962-4284
Shareholder services
Shareholders having inquiries concerning their shares, wishing to obtain information about CN, or to receive dividends by direct deposit or in U.S. dollars may obtain detailed information by communicating with:
Computershare Trust Company of Canada Shareholder Services 100 University Avenue, 8th Floor Toronto, ON, Canada M5J 2Y1
Telephone:1-800-564-6253 www.investorcentre.com
Stock excharlytm
CN common shares are listed on the Toronto and New York stock exchanges.
Ticker symbols: CNR Toronto Stock Exchange CNI New York Stock Exchange
Investor relations
Paul Butcher Vice-President, Investor Relations Telephone: 514-399-0052
Canadian National Railway Company 935 de La Gauchetiere Street West Montreal, QC, Canada H3B 2M9
P.O. Box 8100 Montreal, QC, Canada H3C 3N4
DE
SIG
N:
Ver
onic
a C
hin
XXVIII CN 2020 ANNUAL REPORT
de
sig
n:
Ver
onic
a C
hin
SHAREHOLDER AND INVESTOR INFORMATIONAnnual meeting
The annual meeting of shareholders will be held online via webcast at 10:00 a.m. (EDT) on April 27, 2021.
Please refer to www.cn.ca for meeting details.
Annual information form
The annual information form may be obtained by writing to:
The Corporate SecretaryCanadian National Railway Company935 de La Gauchetière Street WestMontreal, QC, Canada H3B 2M9
It is also available on CN’s website (www.cn.ca).
Transfer agent and registrar
Computershare Trust Company of Canada
Offices in Canada:Montreal, QuebecToronto, OntarioCalgary, AlbertaVancouver, British Columbia
Telephone: 1‑800‑564‑6253www.investorcentre.com
Co‑transfer agent and co‑registrar
Computershare Trust Company N.A.Att: Stock Transfer Department
Overnight Mail Delivery: 462 South 4th Street, Louisville, KY, United States 40202
Regular Mail Delivery: P.O. Box 505005, Louisville, KY, United States 40233‑5005
Telephone: 1‑800‑962‑4284
Shareholder services
Shareholders having inquiries concerning their shares, wishing to obtain information about CN, or to receive dividends by direct deposit or in U.S. dollars may obtain detailed information by communicating with:
Computershare Trust Company of CanadaShareholder Services100 University Avenue, 8th FloorToronto, ON, Canada M5J 2Y1
Telephone: 1‑800‑564‑6253www.investorcentre.com
Stock exchanges
CN common shares are listed on the Toronto and New York stock exchanges.
Ticker symbols:CNR Toronto Stock ExchangeCNI New York Stock Exchange
Investor relations
Paul ButcherVice‑President, Investor RelationsTelephone: 514‑399‑0052
Head office
Canadian National Railway Company935 de La Gauchetière Street WestMontreal, QC, Canada H3B 2M9
P.O. Box 8100Montreal, QC, Canada H3C 3N4
x x v i i i c n 2 0 2 0 a n n u a l r e p o r t

Selected Railroad Statistics - unaudited
2020 2019 2018
Financial measures
Key financial performance indicators (1)
Total revenues ($ millions) 13,819 14,917 14,321
Freight revenues ($ millions) 13,218 14,198 13,548
Operating income ($ millions) 4,777 5,593 5,493
Adjusted operating income ($ millions) (2) 5,263 5,708 5,520
Net income ($ millions) 3,562 4,216 4,328
Adjusted net income ($ millions) (2) 3,784 4,189 4,056
Diluted earnings per share ($) 5.00 5.83 5.87
Adjusted diluted earnings per share ($) (2) 5.31 5.80 5.50
Free cash flow ($ millions) (3) 3,227 1,992 2,514
Gross property additions ($ millions) 2,863 4,079 3,531
Share repurchases ($ millions) 379 1,700 2,000
Dividends per share ($) 2.30 2.15 1.82
Financial position (1)
Total assets ($ millions) 44,804 43,784 41,214
Total liabilities ($ millions) 25,153 25,743 23,573
Shareholders' equity ($ millions) 19,651 18,041 17,641
Financial ratios
Operating ratio (%) 65.4 62.5 61.6
Adjusted operating ratio (%) (2) 61.9 61.7 61.5
Adjusted debt-to-adjusted EBITDA (times) (3) 1.98 2.02 1.94
Return on invested capital (ROIC) (%) (4) 12.7 15.3 16.7
Adjusted ROIC (%) (4) 13.4 15.1 15.7
Operational measures (5)
Statistical operating data
Gross ton miles (GTMs) (millions) 455,368 482,890 490,414
Revenue ton miles (RTMs) (millions) 230,390 241,954 248,383
Carloads (thousands) 5,595 5,912 5,976
Route miles (includes Canada and the U.S.) 19,500 19,500 19,500
Employees (end of year) 24,381 25,975 25,720
Employees (average for the year) 23,786 26,733 25,423
Key operating measures
Freight revenue per RTM (cents) 5.74 5.87 5.45
Freight revenue per carload ($) 2,362 2,402 2,267
GTMs per average number of employees (thousands) 19,144 18,063 19,290
Operating expenses per GTM (cents) 1.99 1.93 1.80
Labor and fringe benefits expense per GTM (cents) 0.60 0.61 0.58
Diesel fuel consumed (US gallons in millions) 407.2 451.4 462.7
Average fuel price ($/US gallon) 2.42 3.17 3.32
Fuel efficiency (US gallons of locomotive fuel consumed per 1,000 GTMs) 0.89 0.93 0.94
Train weight (tons) 9,501 9,125 9,163
Train length (feet) 8,572 8,232 8,247
Car velocity (car miles per day) 188 198 188
Through dwell (entire railroad, hours) 8.6 7.9 8.3
Through network train speed (miles per hour) 18.5 18.5 18.0
Locomotive utilization (trailing GTMs per total horsepower) 196 198 208
Safety indicators (6)
Injury frequency rate (per 200,000 person hours) 1.69 1.98 1.83
Accident rate (per million train miles) 1.74 2.11 2.02
(1) Amounts expressed in Canadian dollars and prepared in accordance with United States generally accepted accountable principles (GAAP), unless otherwise noted. (2) See the section entitled Adjusted performance measures in the MD&A for an explanation of these non-GAAP measures. (3) See the section entitled Liquidity and capital resources in the MD&A for an explanation of these non-GAAP measures.
(4) See the section entitled ROW and adjusted ROW in the MD&A for an explanation of these non-GAAP measures. (5) Statistical operating data, key operating measures and safety indicators are unaudited and based on estimated data available at such time and are subject to change as
more complete information becomes available. Definitions of gross ton miles, fuel efficiency, train weight, train length, car velocity, through dwell and through network train speed are included within the Company's Management's Discussion and Analysis. Definitions of all other indicators are provided on CN's website, www. cn. ca/glossary.
(6) Based on Federal Railroad Administration (FRA) reporting criteria.
2020 Annual Report 1

Management's Discussion and Analysis
Contents
Business profile 3
Corporate organization 3
Strategy overview 4
Forward-looking statements 9
2020 Financial outlook 10
Financial highlights 10
2020 compared to 2019 10
Operating highlights 11
Non-GAAP measures 11
Adjusted performance measures 12
ROIC and adjusted ROIC 14
Constant currency 15
Revenues 15
Operating expenses 20
Other income and expenses 21
2019 compared to 2018 22
Summary of quarterly financial data 27
Summary of fourth quarter 2020 27
Financial position 28
Liquidity and capital resources 29
Off balance sheet arrangements 37
Outstanding share data 37
Financial instruments 37
Recent accounting pronouncements 39
Critical accounting estimates 40
Business risks 48
Controls and procedures 57
2 2020 Annual Report
Management's Discussion and Analysis
This Managements Discussion and Analysis (MD&A) dated February 1, 2021, relates to the consolidated financial position and results of operations of Canadian National Railway Company, together with its wholly-owned subsidiaries, collectively "CN" or the "Company," and should
be read in conjunction with the Company's 2020 Annual Consolidated Financial Statements and Notes thereto. All financial information
reflected herein is expressed in Canadian dollars and prepared in accordance with United States generally accepted accounting principles (GAAP), unless otherwise noted.
CN's common shares are listed on the Toronto and New York stock exchanges. Additional information about CN filed with Canadian
securities regulatory authorities and the United States Securities and Exchange Commission (SEC), including the Company's 2020 Annual
Information Form and Form 40-F, may be found online on SEDAR at www.sedar.com, on the SEC's website at www.sec.gov through EDGAR, and
on the Company's website at www.cn.ca in the Investors section. Printed copies of such documents may be obtained by contacting CN's Corporate Secretary's Office.
Rosiness profile
CN is engaged in the rail and related transportation business. CN's network of 19,500 route miles of track spans Canada and the United States
of America (U.S.); the only railroad connecting Canada's Eastern and Western coasts with the U.S. South. CN's extensive network and efficient
connections to all Class I railroads provide CN customers access to Canada, the U.S. and Mexico. Essential to the economy, to the customers,
and to the communities it serves, CN safely transports more than 300 million tons of cargo, serving exporters, importers, retailers, farmers and manufacturers. CN and its affiliates have been contributing to community prosperity and sustainable trade since 1919. CN is committed to
programs supporting social responsibility and environmental stewardship.
CN's freight revenues are derived from seven commodity groups representing a diversified and balanced portfolio of goods transported
between a wide range of origins and destinations. This product and geographic diversity better positions the Company to face economic
fluctuations and enhances its potential for growth opportunities. For the year ended December 31, 2020, CN's largest commodity group
accounted for 27% of total revenues. From a geographic standpoint, 16% of revenues relate to U.S. domestic traffic, 31% transborder traffic,
17% Canadian domestic traffic and 36% overseas traffic. The Company is the originating carrier for over 85%, and the originating and terminating carrier for over 65%, of traffic moving along its network, which allows it both to capitalize on service advantages and build on
opportunities to efficiently use assets.
Corporate organization
The Company manages its rail operations in Canada and the U.S. as one business segment. Financial information reported at this level, such as
revenues, operating income and cash flow from operations, is used by the Company's corporate management in evaluating financial and
operational performance and allocating resources across CN's network. The Company's strategic initiatives are developed and managed
centrally by corporate management and are communicated to its regional activity centers (the Western Region and Eastern Region), whose role is to manage the day-to-day service requirements of their respective territories, control direct costs incurred locally, and execute the strategy
and operating plan established by corporate management.
See Note 23 — Segmented information to the Company's 2020 Annual Consolidated Financial Statements for additional information on the
Company's corporate organization, as well as selected financial information by geographic area.
2020 Annual Report 3

Management's Discussion and Analysis
Strategy overview
CN's business strategy is anchored on the continuous pursuit of Operational and Service Excellence, an unwavering commitment to safety and
sustainability, and the development of a solid team of motivated and competent railroaders. CN's goal is to deliver valuable transportation
services for its customers and to grow the business at a low incremental cost. A clear strategic agenda, driven by a commitment to innovation,
productivity, improving supply chains through collaboration, potential acquisitions and other opportunities, running trains safely, and minimizing
environmental impact, drives the Company's efforts to create value for customers. CN thereby creates value for its shareholders by striving for
sustainable financial performance through profitable top-line growth, adequate free cash flow and return on invested capital. CN is also focused on returning value to shareholders through dividend payments and share repurchases.
CN's success and long-term economic viability depend on the presence of a supportive regulatory and policy environment that drives
investment and innovation. CN's success also depends on a stream of capital investments that supports its business strategy. These
investments cover a wide range of areas, from track infrastructure and rolling stock, to information and operating technologies, as well as other
equipment and assets that improve the safety, efficiency and reliability of CN's service offering. Investments in track infrastructure enhance the
productivity and integrity of the plant, increase the capacity and the fluidity of the network, promote service excellence, and support growth at
low incremental cost. The acquisition of new locomotives and railcars generates several key benefits. New locomotives increase capacity, fuel
productivity and efficiency, and improve the reliability of service. Locomotives equipped with distributed power allow for greater productivity of trains, particularly in cold weather, while improving train handling and safety. Targeted railcar acquisitions aim to tap growth opportunities, complementing the fleet of privately owned railcars that traverse CN's network. CN is also investing in, and deploying, advanced technology. CN
pioneered scheduled railroading and its vision is to be the first railroad to take it to the next level, using advanced technology as a driver for
safety as well as customer and shareholder value.
COVID-19 pandemic
The COVID-19 pandemic has necessitated governments, businesses and communities to take extraordinary actions to mitigate the contagion,
resulting in unprecedented uncertainty arising from a severe economic contraction. During the first wave of the pandemic, government-
mandated widespread closures of non-essential businesses significantly curbed customer demand for transportation services. Following this
first wave, governments gradually reopened most areas of the economy, with some segments of the economy subsequently experiencing a
recovery in the second half of the year. A second wave of COVID-19 cases began in late 2020 and some governments mandated business
closures and other restrictions again, in addition to continued social distancing measures. The focus for CN has been on nimbly adjusting to the
partial economic shutdown, and remaining alert to potential further restrictive measures, as well as the high level of uncertainty with respect to
the demand environment. As an essential service provider, CN continued to execute its business continuity plans to keep employees safe and
deliver for its customers, the economy and the communities in which it operates, demonstrating its key role in the integrated global supply chain.
As CN is part of an integrated global supply chain, the impact of the COVID-19 pandemic on aspects of the supply chain, including ocean carriers, ports, terminals, trucking firms, and other railroads, has a consequent impact on the Company's operations.
Starting in late March 2020, the spread of the COVID-19 pandemic resulted in significantly weaker demand for freight transportation
services. During the second half of the year, demand partially recovered, with sequential improvements in volumes relative to the initial decline
in the second quarter. By the fourth quarter, demand for some commodities had recovered at or above pre-pandemic levels, including
intermodal, driven by a shift in consumer spending from services to goods, which CN was well-positioned to capitalize on, leveraging the acquisitions of TransX and H&R; and forest products, reflecting strong demand for lumber and panels used in home renovations and
construction of new homes. The demand for less economically-sensitive products, such as export grain and fertilizers continued to remain
positive compared to last year. The demand for other commodities that CN transports remained below pre-pandemic levels including finished
vehicles and parts, pulp and paper, metals and minerals, plastics, chemicals and energy related commodities including petroleum crude, refined
petroleum products and frac sand.
4 2020 Annual Report

Management's Discussion and Analysis
In response to the rapid partial economic shutdown faced earlier in the year, CN undertook various actions to quickly adapt significantly increasing its liquidity as well as enhancing its overall financial and operational resilience:
• CN adjusted its resources and costs to align with the rapid and significant reduction in demand for rail transportation services, including temporarily storing locomotives and railcars, as well as reducing headcount, and rationalizing certain local yards and mechanical shops;
• In the second half of the year, CN added resources back into the business as volumes began recovering; • In light of anticipated lower volumes for the year, the 2020 capital expenditure program was reduced in the first quarter by a net amount of
$0.1 billion from $3.0 billion to $2.9 billion; • CN paused its share repurchases between the end of March 2020 and January 2021 due to the economic circumstances; and • CN secured $390 million of one-year supplementary revolving credit facilities, closed a second tranche of a variable rate, 20-year term loan
for US$310 million and issued US$600 million 30-year 2.45% Notes in the U.S. debt capital markets.
Balancing "Operational and Service Excellence"
The basic driver of the Company's business is demand for reliable, efficient, and cost effective transportation for customers. As such, the Company's focus is the pursuit of Operational and Service Excellence: striving to operate safely and efficiently while providing a high level of
service to customers.
CN operates with a mindset that drives cost efficiency and asset utilization. That mindset flows naturally from CN's Scheduled Railroading
model, which focuses on improving every process that affects delivery of customers' goods. It is a highly disciplined process whereby CN
manages all aspects of railroad operations to meet customer commitments efficiently and profitably. This calls for the relentless measurement
of results and the use of such results to generate further execution improvements in the service provided to customers. The Company's
continuous search for efficiency is best captured in its performance according to key operating metrics such as train weight, train length,
through network train speed, fuel efficiency, through dwell and car velocity. All are at the center of a highly productive and fluid railroad operation, requiring daily engagement in the field. The Company works hard to run more efficient trains, reduce dwell times at terminals and improve overall network velocity. The railroad is run based on a disciplined operating methodology, executing with a sense of urgency and
accountability. This philosophy is a key contributor to CN's operating ratio, earnings growth and return on invested capital.
CN understands the importance of balancing its drive for productivity while enhancing customer service. The Company's efforts to deliver
Operational and Service Excellence are anchored on an end-to-end supply chain mindset, working closely with customers and supply chain partners, as well as involving all relevant areas of the Company in the process. By fostering better end-to-end service performance and encouraging all supply-chain players to continuously improve daily engagement, information sharing, problem solving, and execution, CN aims
to help customers achieve greater competitiveness in their own markets. Supply chain collaboration agreements with ports, terminal operators
and customers leverage key performance metrics that drive efficiencies across the entire supply chain.
The Company is strengthening its commitment to Operational and Service Excellence through a wide range of innovations anchored on its
continuous improvement philosophy. CN is building on its industry leadership in terms of fast and reliable hub-to-hub service by continuing to
improve across the range of customer touch points. The Company's major push in first-mile/last-mile service is focused on improving the
quality of customer interactions — developing a sharper outside-in perspective; better monitoring of traffic forecasts; higher and more responsive car order fulfillment; and proactive customer communication at the local level.
CN's broad-based service innovations benefit customers and support the Company's goal to drive top-line growth. CN understands the
importance of being the best operator in the business, as well as the best service innovator.
CN's focus on sustainability
Sustainability is at the heart of how the Company is building for the future; CN calls this Delivering Responsibly. It means moving customer
goods safely and efficiently, being environmentally responsible, attracting and developing the best diverse team of railroaders, helping build
safer and stronger communities, while adhering to the highest ethical standards. CN is proud of its Delivering Responsibly philosophy — it drives
how the Company conducts its business and supports its continuing transformational journey.
An unwavering commitment to safety
CN is committed to the safety of its employees, the communities in which it operates and the environment. Safety consciousness permeates
every aspect of CN's operations. The Company's long-term safety improvement is driven by continued significant investments in infrastructure,
rigorous safety processes and a focus on employee training and safety awareness. CN continues to strengthen its safety culture by investing significantly in training, coaching, recognition and employee involvement initiatives. In September 2020, CN established a new conductor training curriculum with a strong emphasis on commitment to safety. Additionally, in 2020, CN provided a year long safety leadership program
to over 300 of its leaders in operating functions, with plans to provide the training to another 250 in 2021.
2020 Annual Report 5

Management's Discussion and Analysis
In response to the COVID-19 pandemic, CN deployed its multi-phase Pandemic Plan in March and continued to institute various measures to protect its employees, customers, and the communities in which CN operates:
• CN's medical team and occupational health department, who are members of the Association of American Railroads Health Committee, have played a pivotal role in CN's pandemic planning, taking direction from the World Health Organization, as well as provincial, state and
federal authorities, as required, and offering best practices shared amongst North American railroads.
• CN implemented preventative measures to ensure the safety of its employees and by extension, of its customers and communities. These
measures included a work from home policy for employees not required on site, restriction of employee travel, social distancing measures
at CN locations, segregating mission critical rail traffic control employees, and amplifying cleaning regimens on trains, in terminals, in crew
accommodation facilities, and in offices.
• Understanding the importance of timely and reliable information, CN increased employee communications by providing frequent updates
on the state of the Company's operations, as well as employee support for any questions or concerns.
• With operations spanning eight provinces, 16 states and over 2,000 communities across the Company's network, CN continued to play an important role in the communities in which it operates. CN donated over $1 million to charities directly or indirectly affected by the
economic impacts of the pandemic, such as food banks, homeless shelters, domestic violence shelters, healthcare centers, and anti-
poverty organizations.
CN's Safety Management Plan is the framework for putting safety at the center of its day-to-day operations. This proactive plan is designed to minimize risk, drive continuous improvement in the reduction of injuries and accidents, and engage employees at all levels of the
organization. CN believes that the rail industry can enhance safety by working more closely with communities. Under CN's structured Community Engagement program, the Company engages with municipal officers and their emergency responders in an effort to assist them in their emergency response planning. In many cases, this outreach includes meetings, during which CN discusses its comprehensive safety
programs; its safety performance; the nature, volume and economic importance of dangerous commodities it transports through their communities; a review of emergency response planning; and arranging for training sessions for emergency responders. The outreach builds on
CN's involvement in the Transportation Community Awareness and Emergency Response (TRANSCAER®), through which the Company has
been working for many years to help communities in Canada and the U.S. understand the movement of hazardous materials and what is
required in the event of transportation incidents.
Protecting the environment for generations to come The Company's goal is to conduct operations with minimal environmental impact, while providing cleaner, more sustainable transportation
services to customers. With approximately 85% of CN's direct Greenhouse Gas (GHG) emissions generated from rail operations, CN believes
the best way to reduce its carbon footprint is by continuously improving fuel efficiency. Over the years, this focus has resulted in significant
progress in decoupling volume growth from carbon emissions. CN is making a positive contribution in the fight against climate change by offering a carbon efficient and environmentally friendly way to move goods.
As part of the Company's comprehensive sustainability action plan and to comply with CN's environmental policy, the Company engages in
a number of initiatives, including the use of fuel-efficient locomotives and trucks that reduce GHG emissions; increasing and building operational efficiencies; investing in energy-efficient data centers and recycling programs for information technology systems; reducing,
recycling and reusing waste and scrap at its facilities and on its network; and engaging in modal shift agreements that favor low emission
transport services. The Company combines its expert resources, environmental management procedures, training and audits for employees
and contractors, and emergency preparedness response activities to help ensure that it conducts its operations and activities while protecting the natural environment. The Company's environmental activities include monitoring CN's environmental performance in Canada and the U.S., identifying environmental issues inside the Company, and managing them in accordance with CN's environmental policy, which is overseen by the Environment, Safety and Security Committee of the Board of Directors. Certain risk mitigation strategies, such as periodic audits, employee training programs and emergency plans and procedures, are in place to minimize the environmental risks to the Company.
Building a solid team of railroaders
CN's ability to develop the best railroaders in the industry has been a key contributor to the Company's success. CN recognizes that without the
right people - no matter how good a service plan or business model a company may have - it will not be able to fully execute. CN is taking steps
to further align its business and talent strategies by placing a greater emphasis on the identification of specific roles across all functions that
drive the greatest impact to the Company's business agenda, and ensuring the right talent are in these critical roles. The Company continues to focus on hiring the right people, onboarding them successfully, helping them build positive relationships with their colleagues, and supporting
all employees to grow and develop, while deepening its commitment to develop talent and plan for the future. CN also recognizes the
importance of diversity as it provides for a broad range of strengths, perspectives and experiences that makes CN better. It helps the Company
attract and retain qualified talent, and it fosters innovation by bringing the best solutions to the table. As part of its strategy to build a solid
team of railroaders, the Company leverages its state-of-the-art training facilities in preparing employees to be highly skilled, safety conscious
6 2020 Annual Report

Management's Discussion and Analysis
and confident in their work environment. Curricula for technical training and leadership development has been designed to meet the learning needs of CN's railroaders - both current and future. These programs and initiatives provide a solid platform for the assessment and
development of the Company's talent pool, and are tightly integrated with the Company's business strategy. Progress made in developing
current and future leaders through the Company's leadership development programs is reviewed by the Human Resources and Compensation
Committee of the Board of Directors.
2020 Highlights
While CN's results were adversely impacted by the COVID-19 pandemic, the Company continued to deliver for its customers, providing essential transportation services and demonstrating its key role in the integrated global supply chain. By the end of the year, the Company began
recovering from pandemic related demand declines as demand for some commodities recovered at or above pre-pandemic levels in the fourth
quarter, most notably in the grain and fertilizers and intermodal commodity groups.
Financial highlights - 2020 compared to 2019
• Revenues decreased by $1,098 million, or 7%, to $13,819 million.
• Operating expenses decreased by $282 million, or 3%, to $9,042 million.
• Operating income decreased by $816 million, or 15%, to $4,777 million and adjusted operating income decreased by $445 million, or 8%, to $5,263 million. (1)
• Operating ratio of 65.4%, an increase of 2.9 points and adjusted operating ratio of 61.9%, an increase of 0.2 points. (1)
• Net income decreased by $654 million, or 16%, to $3,562 million and diluted earnings per share decreased by 14% to $5.00.
• Adjusted net income decreased by $405 million, or 10%, to $3,784 million and adjusted diluted earnings per share decreased by 8% to $5.31 (1)
• The Company generated record free cash flow of $3,227 million, a 62% increase. (2)
• ROIC of 12.7%, a decrease of 2.6 points and adjusted ROIC of 13.4%, a decrease of 1.7 points. (3)
• CN achieved 10 consecutive months of record Canadian grain movements, which resulted in record revenues for the year for the Grain and fertilizers commodity group.
• An all-time record fuel efficiency of 0.89 US gallons of locomotive fuel consumed per 1,000 gross ton miles.
(1) See the section of this MD&A entitled Adjusted performance measures for an explanation of these non-GAAP measures.
(2) See the section of this MD&A entitled Liquidity and capital resources - Free cash flow for an explanation of this non-GAAP measure.
(3) See the section of this MD&A entitled ROW and adjusted ROW for an explanation of these non-GAAP measures.
Assets held for sale
In the second quarter of 2020, the Company committed to a plan and is actively marketing for sale for on-going rail operations, certain non-core lines in Wisconsin, Michigan and Ontario representing approximately 850 miles and has met the criteria for classification of the related assets
as assets held for sale. Accordingly, a $486 million loss ($363 million after-tax) was recorded to adjust the carrying amount of these track and
roadway assets to their estimated selling price. The carrying amount of assets held for sale of $90 million is included in Other current assets in
the Consolidated Balance Sheet as at December 31, 2020. The estimated selling price is based primarily on discounted cash flow projections.
These projections are based on Level 3 inputs of the fair value hierarchy and reflect the Company's best estimate of market participants' pricing of the assets as well as the general condition of the assets. The significant assumptions in the valuation model include projected cash flows,
discount rate and growth rate. Actual results could differ from the Company's estimates, but such differences are not expected to have a
material impact on the fair value assessment. As at December 31, 2020, the criteria for the classification of assets held for sale continued to be
met and there was no change in the Company's carrying amount of assets held for sale.
Reinvestment in the business In 2020, CN spent approximately $2.9 billion in its capital program, with $1.6 billion invested to maintain the safety and integrity of the network, particularly track infrastructure. CN's capital spending also included $0.8 billion on strategic initiatives to increase capacity, enable growth and improve network resiliency, including line capacity upgrades and information technology initiatives, $0.4 billion on equipment capital
expenditures, including the acquisition of 41 new high-horsepower locomotives and 1,449 new grain hopper cars, and $0.1 billion on
implementation of Positive Train Control (PTC), the safety technology system mandated by the U.S. Congress.
2020 Annual Report 7

Management's Discussion and Analysis
Acquisitions On April 6, 2020, the Surface Transportation Board (STB) issued its decision conditionally approving the acquisition of the Massena rail line
from CSX Corporation ("CSX"), which the Company announced its agreement to purchase on August 29, 2019. On June 6, 2020, CN and CSX
sought reconsideration asking the STB to remove its condition which requires the parties to propose a change to the line sale agreement for the STB's review. The petitions for reconsideration remain pending for the STB's decision. The acquisition represents more than 220 miles of track
between Valleyfield, Quebec, and Woodard, New York, and will allow CN to continue to expand its network and foster additional supply chain
solutions.
In the first quarter of 2020, the Company completed the purchase price allocation of the Manitoba based TransX Group of Companies ("TransX") which was acquired on March 20, 2019. In the fourth quarter of 2019, the fair value of net assets acquired was adjusted to reflect the
settlement of working capital as well as changes to current and deferred income tax balances. The acquisition positions CN to strengthen its
intermodal business, and allows the Company to expand capacity and foster additional supply chain solutions.
In the fourth quarter of 2020, the Company completed the purchase price allocation of the intermodal temperature-controlled
transportation division of the Alberta-based H&R Transport Limited ("H&R") which was acquired on December 2, 2019. The acquisition positions
CN to expand its presence in moving customer goods by offering more end-to-end rail supply chain solutions to a wider range of customers.
Shareholder returns The Company repurchased 3.3 million of its common shares during the year, returning $0.4 billion to its shareholders. CN paused its share
repurchases at the end of March 2020 due to the economic circumstances resulting from the COVID-19 pandemic. CN also increased its quarterly dividend per share by 7% to $0.5750 from $0.5375 in 2019, effective for the first quarter of 2020, and paid $1.6 billion in dividends in
2020.
Sustainability disclosures and recognition
The Company's sustainability practices earned it a place on the Dow Jones Sustainability World and North American Indices, for the 9th and 12th
consecutive year, respectively. CN has also been recognized by CDP for the 11th consecutive year and is one of only three Canadian companies
to have earned a position on the Climate A List in 2020. CN is the only Canadian company and the only North American railroad listed in the
Transportation and Transportation Infrastructure sector World Index. In addition, CN ranked among Corporate Knights' 2021 Global 100 Most
Sustainable Corporations in the World. The Company's CDP Report, Task Force on Climate-related Financial Disclosures report, sustainability report entitled "Delivering Responsibly' and the Company's Corporate Governance Manual, which outlines the role and responsibilities of the
Environment, Safety and Security Committee of the Board of Directors, are available on CN's website in the Delivering Responsibly section.
2021 Business outlook and assumptions
For 2021, the Company expects growth across a range of commodities, particularly in coal exports, intermodal traffic, petroleum crude, lumber
and panels, frac sand, metals and minerals, as well as lower volumes of U.S. grain and potash.
Underpinning the 2021 business outlook, the Company assumes that North American industrial production will increase in the mid single-
digit range. For the 2020/2021 crop year, the grain crop in Canada was above its three-year average and the U.S. grain crop was in line with its three-year average. The Company assumes that the 2021/2022 grain crops in both Canada and the U.S. will be in line with their respective
three-year averages.
Future value creation
Reinvestment in the business In 2021, CN plans to invest approximately $3.0 billion in its capital program, of which $1.6 billion is targeted toward track and railway
infrastructure maintenance to support safe and efficient operations. A further $1.2 billion is expected to be spent on initiatives to increase capacity and enable growth, such as track infrastructure expansion; investments in yards and intermodal terminals; and on information
technology to improve safety performance, operational efficiency and customer service. CN's equipment capital expenditures are targeted at
$0.2 billion in 2021, allowing the Company to tap growth opportunities and improve the quality of the fleet. In order to handle expected traffic
increase and improve operational efficiency, CN expects to take delivery of 491 new grain hopper cars in the first quarter of 2021.
Shareholder returns
On January 26, 2021, the Company's Board of Directors approved a new Normal Course Issuer Bid (NCIB) that allows for the repurchase of up to 14 million common shares between February 1, 2021 and January 31, 2022. In addition, on that same day, the Company's Board of Directors
approved an increase of 7% to the quarterly dividend to common shareholders, from $0.5750 per share in 2020 to $0.6150 per share in 2021,
effective for the first quarter. The Company expects to resume its share repurchases in the first quarter of 2021 under the new NCIB.
8 2020 Annual Report

Management's Discussion and Analysis
The forward-looking statements discussed in this section are subject to risks and uncertainties that could cause actual results or performance
to differ materially from those expressed or implied in such statements and are based on certain factors and assumptions which the Company
considers reasonable about events, developments, prospects and opportunities that may not materialize or that may be offset entirely or
partially by other events and developments. In addition to the assumptions and expectations discussed in this section, reference should be
made to the section of this MD&A entitled Forward-looking statements for assumptions and risk factors affecting such statements.
Forward-looking statements
Certain statements included in this MD&A are "forward-looking statements" within the meaning of the United States Private Securities Litigation
Reform Act of 1995 and under Canadian securities laws. By their nature, forward-looking statements involve risks, uncertainties and
assumptions. The Company cautions that its assumptions may not materialize and that current economic conditions render such assumptions,
although reasonable at the time they were made, subject to greater uncertainty. Forward-looking statements by their nature address matters
that are, to different degrees, uncertain, such as statements about the impacts of the COVID-19 pandemic on the business operations, financial
results and financial position and on the global supply chain, and statements about the economic recovery and its future impact on CN.
Forward-looking statements may be identified by the use of terminology such as "believes," "expects," "anticipates," "assumes," "outlook,"
"plans," "targets" or other similar words.
Forward-looking statements include, but are not limited to, those set forth in the table below, which also presents key assumptions used in
determining the forward-looking statements. See also the section of this MD&A entitled Strategy overview - 2021 Business outlook and
assumptions.
Forward-looking statements Key assumptions
Statements relating to revenue growth opportunities, including those referring to general economic and business conditions
North American and global economic growth Long-term growth opportunities being less affected by current economic conditions The COVID-19 pandemic gradually diminishing in intensity in the second half of 2021 following increased vaccination No material increase in disruption of CN's operations or of the economy's supply chains as a result of the COVID-19 pandemic in the shorter term
Statements relating to the Company's ability to meet debt repayments and future obligations in the foreseeable future, including income tax payments, and capital spending
Adequate credit ratios Investment-grade credit ratings Access to capital markets Adequate cash generated from operations and other sources of financing
Statements relating to pension contributions Adequate cash generated from operations and other sources of financing Adequate long-term return on investment on pension plan assets Level of funding as determined by actuarial valuations, particularly influenced by discount rates for funding purposes
Forward-looking statements are not guarantees of future performance and involve risks, uncertainties and other factors which may cause the
actual results or performance of the Company to be materially different from the outlook or any future results or performance implied by such
statements. Accordingly, readers are advised not to place undue reliance on forward-looking statements. Important risk factors that could
affect the forward-looking statements include, but are not limited to, the duration and effects of the COVID-19 pandemic; general economic and
business conditions, particularly in the context of the COVID-19 pandemic; industry competition; inflation, currency and interest rate
fluctuations; changes in fuel prices; legislative and/or regulatory developments; compliance with environmental laws and regulations; actions
by regulators; increases in maintenance and operating costs; security threats; reliance on technology and related cybersecurity risk; trade
restrictions or other changes to international trade arrangements; transportation of hazardous materials; various events which could disrupt
operations, including illegal blockades of rail networks and natural events such as severe weather, droughts, fires, floods and earthquakes;
climate change; labor negotiations and disruptions; environmental claims; uncertainties of investigations, proceedings or other types of claims
and litigation; risks and liabilities arising from derailments; timing and completion of capital programs; and other risks detailed from time to
time in reports filed by CN with securities regulators in Canada and the U.S., including its Annual Information Form and Form 40-F. See the
section entitled Business risks of this MD&A for a description of major risk factors.
Forward-looking statements reflect information as of the date on which they are made. CN assumes no obligation to update or revise
forward-looking statements to reflect future events, changes in circumstances, or changes in beliefs, unless required by applicable securities
laws. In the event CN does update any forward-looking statement, no inference should be made that CN will make additional updates with
respect to that statement, related matters, or any other forward-looking statement.
2020 Annual Report 9

Management's Discussion and Analysis
2020 Financial outlook
On January 28, 2020, the Company issued its 2020 financial outlook. On April 27, 2020 due to the continued global spread of the COVID-19
pandemic and consequent unprecedented economic uncertainty, the Company withdrew its 2020 outlook.
Financial highlights
Change
Favorable/(Unfavorable)
In millions, except percentage and per share data 2020 2019 2018 2020 vs 2019 2019 vs 2018
Revenues $ 13,819 $ 14,917 $ 14,321 (7%) 4%
Operating income $ 4,777 $ 5,593 $ 5,493 (15%) 2%
Adjusted operating income (1) $ 5,263 $ 5,708 $ 5,520 (8%) 3%
Net income $ 3,562 $ 4,216 $ 4,328 (16%) (3%)
Adjusted net income (1) $ 3,784 $ 4,189 $ 4,056 (10%) 3%
Basic earnings per share $ 5.01 $ 5.85 $ 5.89 (14%) (1%)
Adjusted basic earnings per share (1) $ 5.32 $ 5.81 $ 5.52 (8%) 5%
Diluted earnings per share $ 5.00 $ 5.83 $ 5.87 (14%) (1%)
Adjusted diluted earnings per share (1) $ 5.31 $ 5.80 $ 5.50 (8%) 5%
Dividends declared per share $ 2.30 $ 2.15 $ 1.82 7% 18%
Total assets $ 44,804 $ 43,784 $ 41,214 2% 6%
Total long-term liabilities $ 21,879 $ 21,456 $ 20,073 (2%) (7%)
Operating ratio (2) 65.4% 62.5% 61.6% (2.9)-pts (0.9)-pts
Adjusted operating ratio (1) 61.9% 61.7% 61.5% (0.2)-pts (0.2)-pts
Free cash flow (3) $ 3,227 $ 1,992 $ 2,514 62% (21%)
(1) See the section of this MD&A entitled Adjusted performance measures for an explanation of these non-GAAP measures.
(2) Operating ratio is defined as operating expenses as a percentage of revenues.
(3) See the section of this MD&A entitled Liquidity and capital resources - Free cash flow for an explanation of this non-GAAP measure.
2020 compared to 2019
Net income for the year ended December 31, 2020 was $3,562 million, a decrease of $654 million, or 16%, when compared to 2019, and diluted
earnings per share decreased by 14% to $5.00.
Operating income for the year ended December 31, 2020 decreased by $816 million, or 15%, to $4,777 million. The decrease mainly reflects
lower volumes across most commodity groups and a loss on assets held for sale, partly offset by freight rate increases and lower fuel prices. The operating ratio, defined as operating expenses as a percentage of revenues, was 65.4% in 2020, compared to 62.5% in 2019.
Revenues for the year ended December 31, 2020 were $13,819 million compared to $14,917 million in 2019. The decrease of $1,098
million, or 7%, was mainly attributable to lower volumes across most commodity groups, primarily in the second and third quarter, caused by
the ongoing effects of the COVID-19 pandemic and lower applicable fuel surcharge rates, partly offset by freight rate increases as well as
record shipments of Canadian grain.
Operating expenses for the year ended December 31, 2020 were $9,042 million compared to $9,324 million in 2019. The decrease of $282
million, or 3%, was mainly due to lower fuel and labor costs and decreased purchased services and material expense; partly offset by a loss on assets held for sale, resulting from the Company's decision to market for sale for on-going rail operations, certain non-core lines.
The Company generated record free cash flow for the year ended December 31, 2020 of $3,227 million compared to $1,992 million in 2019.
The increase of $1,235 million, or 62%, was mainly due to lower property additions in 2020 compared to the record 2019 capital expenditure
program, lower income tax instalment payments and a U.S. tax refund received in 2020 as a result of the CARES Act, partly offset by lower earnings excluding non-cash items.
10 CN 12020 Annual Report

Management's Discussion and Analysis
Operating highlights
The following table lists key measures of the Company's operating performance, for the purpose of measuring the efficiency and effectiveness of train operations:
Change Favorable/(Unfavorable)
2020 2019 2018 2020 vs 2019 2019 vs 2018
Gross ton miles (GTMs) (millions) (1) 455,368 482,890 490,414 (6%) (2%)
Train weight (tons) (2) 9,501 9,125 9,163 4% —%
Train length (feet) (3) 8,572 8,232 8,247 4% —%
Through network train speed (miles per hour) (4) 18.5 18.5 18.0 —% 3%
Fuel efficiency (US gallons of locomotive fuel consumed per 1,000 GTMs) (5) 0.89 0.93 0.94 4% 1%
Through dwell (entire railroad, hours) (6) 8.6 7.9 8.3 (8%) 5%
Car velocity (car miles per day) (7) 188 198 188 (5%) 5%
(1) GTMs: The workload performed by system trains in hauling freight or equipment. GTMs are calculated by multiplying the trailing weight by the distance the train moved. A larger number is an indicator of more traffic (and thus more revenue) being moved.
(2) Train weight: An efficiency measurement on how much tonnage each mainline train handles on average as it crosses the network. Calculated as the total of GTMs and divided by total train miles, this measure provides insight on how well each train was maximized in terms of its capacity to move traffic. This operating measure was formerly named Train productivity.
Train length: An efficiency measurement on average trailing length of each mainline train on the network. Calculated as the total of car foot miles (the sum of car length multiplied by miles travelled for each trailing car) divided by total train miles, this measure provides insight on how well each train was maximized in terms of its capacity to move traffic.
(4) Through network train speed: A measure of the line-haul movement from origin to destination, including time at terminals. The average speed is calculated by dividing train miles by total hours operated, excluding yard and local trains, passenger trains, maintenance of way trains, and foreign trains. This measure represents the fluidity of trains on the network, with a higher value also indicating a more fluid network.
Fuel efficiency This measure represents how efficient the Company is in the generation and utilization of locomotive horsepower in freight train operations, with a lower number indicating improved performance. Fuel efficiency is defined as US gallons of locomotive fuel consumed per 1,000 GTMs.
(6) Through dwell: The average time a car resides within terminal boundaries expressed in hours. The measurement begins with a customer release, received interchange, or train arrival event and ends with a customer placement (actual or constructive), delivered or offered in interchange, or train departure event. This excludes stored, bad ordered, maintenance of way cars, or cars with dwell greater than 10 days. This measure represents the efficiency of handling cars within the terminal, with a lower value indicating higher performance.
Car velocity: The average miles per day traveled by loaded and empty cars (including all active cars whether private, foreign or CN owned) on company lines. This measure represents the fluidity of cars on the network, calculated by the sum of miles each car traveled divided by the sum of all of the care active time, with a higher value indicating a smoother and more fluid operation.
(3)
(5)
(7)
For the year ended December 31, 2020, when compared to 2019, GTMs were negatively impacted by the COVID-19 pandemic. In response to the
reduction in volumes, the Company increased efficiencies with increased Train weight and Train length, which negatively impacted Through
dwell, Car velocity, and Through network train speed. However, this allowed the Company to achieve an all-time record Fuel efficiency.
For the year ended December 31, 2019, when compared to 2018, GTMs were negatively impacted by the weakening economic environment
and a conductor strike in the fourth quarter of 2019. However, with capacity improvements enabling fluidity, Through dwell, Car velocity,
Through network train speed, as well as Fuel efficiency, had all improved.
Non-GAAP measures
This MD&A makes reference to non-GAAP measures including adjusted performance measures, constant currency, return on invested capital (ROIC) and adjusted ROIC, free cash flow, and adjusted debt-to-adjusted earnings before interest, income taxes, depreciation and amortization (EBITDA) multiple that do not have any standardized meaning prescribed by GAAP and therefore, may not be comparable to similar measures
presented by other companies. From managements perspective, these non-GAAP measures are useful measures of performance and provide
investors with supplementary information to assess the Company's results of operations and liquidity. These non-GAAP measures should not
be considered in isolation or as a substitute for financial measures prepared in accordance with GAAP.
For further details of these non-GAAP measures, including a reconciliation to the most directly comparable GAAP financial measures, refer
to the sections entitled Adjusted performance measures, Constant currency, ROIC and adjusted ROIC, and Liquidity and capital resources.
2020 Annual Report 11

Management's Discussion and Analysis
Adjusted performance measures
Management believes that adjusted net income, adjusted earnings per share, adjusted operating income and adjusted operating ratio are useful
measures of performance that can facilitate period-to-period comparisons, as they exclude items that do not necessarily arise as part of CN's
normal day-to-day operations and could distort the analysis of trends in business performance. Management uses adjusted performance
measures, which exclude certain income and expense items in its results that management believes are not reflective of CN's underlying
business operations, to set performance goals and as a means to measure CN's performance. The exclusion of such income and expense
items in these measures does not, however, imply that these items are necessarily non-recurring. These measures do not have any
standardized meaning prescribed by GAAP and therefore, may not be comparable to similar measures presented by other companies. For the year ended December 31, 2020, the Company reported adjusted net income of $3,784 million, or $5.31 per diluted share, which
excludes a loss of $486 million, or $363 million after-tax ($0.51 per diluted share) in the second quarter, resulting from the Company's decision to market for sale for on-going rail operations, certain non-core lines in Wisconsin, Michigan and Ontario, and a current income tax recovery of $141 million ($0.20 per diluted share) in the first quarter resulting from the enactment of the Coronavirus Aid, Relief, and Economic Security
(CARES) Act, a U.S. tax-and-spending package aimed at providing additional stimulus to address the economic impact of the COVID-19 pandemic.
For the year ended December 31, 2019, the Company reported adjusted net income of $4,189 million, or $5.80 per diluted share, which
excludes employee termination benefits and severance costs related to a workforce reduction program of $31 million, or $23 million after-tax
($0.03 per diluted share) in the fourth quarter; a deferred income tax recovery of $112 million ($0.15 per diluted share or $0.16 per basic share)
in the second quarter, resulting from the enactment of a lower provincial corporate income tax rate; and a depreciation expense of $84 million,
or $62 million after-tax ($0.09 per diluted share) in the first quarter, related to costs previously capitalized for a PTC back office system following the deployment of a replacement system.
For the year ended December 31, 2018, the Company reported adjusted net income of $4,056 million, or $5.50 per diluted share, which
excludes employee termination benefits and severance costs related to a workforce reduction program of $27 million, or $20 million after-tax
($0.03 per diluted share) in the fourth quarter and gains on disposal of property of $338 million, or $292 million after-tax ($0.40 per diluted
share), consisting of the following:
• in the fourth quarter, a gain previously deferred on the 2014 disposal of a segment of the Guelph subdivision located between Georgetown
and Kitchener, Ontario, together with the rail fixtures and certain passenger agreements (the "Guelph"), of $79 million, or $70 million after-
tax ($0.10 per diluted share);
• in the third quarter, a gain on disposal of property located in Montreal, Quebec (the "Doney and St-Francois Spurs") of $36 million, or $32 million after-tax ($0.04 per diluted share); and
• in the second quarter, a gain on transfer of the Company's finance lease in the passenger rail facilities in Montreal, Quebec, together with its interests in related railway operating agreements (the "Central Station Railway Lease), of $184 million, or $156 million after-tax ($0.21
per diluted share), and a gain on disposal of land located in Calgary, Alberta, excluding the rail fixtures (the "Calgary Industrial Lead"), of $39 million, or $34 million after-tax ($0.05 per diluted share).
12 CN 12020 Annual Report

Management's Discussion and Analysis
The following table provides a reconciliation of net income and earnings per share in accordance with GAAP, as reported for the years
ended December 31, 2020, 2019 and 2018, to the non-GAAP adjusted performance measures presented herein:
In millions, except per share data Year ended December 31, 2020 2019 2018
Net income
Adjustments: Operating expenses
Other income
Income tax expense (recovery) (1)
3,562
486
— (264)
$ 4,216
115
— (142)
$ 4,328
27
(338)
39
Adjusted net income $ 3,784 $ 4,189 $ 4,056
Basic earnings per share
Impact of adjustments, per share $ 5.01
0.31
$ 5.85
(0.04) $ 5.89
(0.37)
Adjusted basic earnings per share 5.32 $ 5.81 $ 5.52
Diluted earnings per share
Impact of adjustments, per share $ 5.00
0.31
$ 5.83 (0.03)
$ 5.87 (0.37)
Adjusted diluted earnings per share 5.31 $ 5.80 $ 5.50
(1) Includes the tax impact of (i) adjustments based on the nature of the item for tax purposes and related tax rates in the applicable jurisdiction; or (ii) tax law changes and rate enactments.
The following table provides a reconciliation of operating income and operating ratio in accordance with GAAP, as reported for the years
ended December 31, 2020, 2019 and 2018, to the non-GAAP adjusted performance measures presented herein:
In millions, except percentage Year ended December 31, 2020 2019 2018
Operating income $ 4,777 $ 5,593 $ 5,493 Operating expense adjustments:
Depreciation expense — 84 —
Employee termination benefits and severance costs — 31 27
Loss on assets held for sale 486 — —
Total operating expense adjustments 486 115 27
Adjusted operating income 5,263 $ 5,708 $ 5,520
Operating ratio 65.4% 62.5% 61.6% Impact of adjustment (3.5)-pts (0.8)-pts (0.1 )-pts
Adjusted operating ratio 61.9% 61.7% 61.5%
2020 Annual Report 13

Management's Discussion and Analysis
ROIC and adjusted ROIC
Management believes ROIC and adjusted ROIC are useful measures of the efficiency in the use of capital funds. The Company calculates ROIC
as return divided by average invested capital. Return is defined as net income plus interest expense after-tax, calculated using the Company's
effective tax rate. Average invested capital is defined as the sum of total shareholders' equity, long-term debt and current portion of long-term
debt less cash and cash equivalents, and restricted cash and cash equivalents, averaged between the beginning and ending balance over a
twelve-month period. The Company calculates adjusted ROIC as adjusted return divided by average invested capital. Adjusted return is defined
as adjusted net income plus interest expense after-tax, calculated using the Company's effective tax rate, excluding the tax effect of
adjustments used to determine adjusted net income. ROIC and adjusted ROIC do not have any standardized meaning prescribed by GAAP and therefore, may not be comparable to similar measures presented by other companies.
The following table provides a reconciliation of net income and adjusted net income to return and adjusted return, respectively, as well as
the calculation of average invested capital, which have been used to calculate ROIC and adjusted ROIC:
In millions, except percentage As at and for the year ended December 31, 2020 2019 2018
Net income $ 3,562 $ 4,216 $ 4,328
Interest expense 554 538 489
Tax on interest expense (1) (120) (120) (116)
Return $ 3,996 $ 4,634 $ 4,701
Average total shareholders' equity $ 18,846 $ 17,841 $ 17,149
Average long-term debt 11,931 11,626 10,067
Average current portion of long-term debt 1,420 1,557 1,632
Less: Average cash, cash equivalents, restricted cash and restricted cash equivalents (844) (674) (656)
Average invested capital $ 31,353 $ 30,350 $ 28,192
ROIC 12.7% 15.3% 16.7%
Adjusted net income (2) $ 3,784 $ 4,189 $ 4,056
Interest expense 554 538 489
Adjusted tax on interest expense (3) (137) (131) (120)
Adjusted return $ 4,201 $ 4,596 $ 4,425
Average invested capital $ 31,353 $ 30,350 $ 28,192
Adjusted ROIC 13.4% 15.1% 15.7%
(1) The effective tax rate for 2020 used to calculate the tax on interest expense was 21.6% (2019 - 22.3%; 2018 - 23.8%).
(2) See the section of this MD&A entitled Adjusted performance measures for an explanation of this non-GAAP measure.
(3) The adjusted effective tax rate for 2020 used to calculate the adjusted tax on interest expense was 24.8% (2019 - 24.4%; 2018 - 24.5%).
14 CN 12020 Annual Report

Management's Discussion and Analysis
Constant currency
Financial results at constant currency allow results to be viewed without the impact of fluctuations in foreign currency exchange rates, thereby
facilitating period-to-period comparisons in the analysis of trends in business performance. Measures at constant currency are considered non-
GAAP measures and do not have any standardized meaning prescribed by GAAP and therefore, may not be comparable to similar measures
presented by other companies. Financial results at constant currency are obtained by translating the current period results denominated in US
dollars at the foreign exchange rates of the comparable period of the prior year. The average foreign exchange rates were $1.34 and $1.33 per
US$1.00, for the years ended December 31, 2020 and 2019, respectively.
On a constant currency basis, the Company's net income for the year ended December 31, 2020 would have been lower by $13 million
($0.02 per diluted share).
Revenues
In millions, unless otherwise indicated Year ended December 31, 2020 2019 % Change
% Change at constant
currency
Freight revenues $ 13,218 $ 14,198 (7%) (7%) Other revenues 601 719 (16%) (17%)
Total revenues $ 13,819 $ 14,917 (7%) (8%)
Freight revenues Petroleum and chemicals $ 2,631 $ 3,052 (14%) (14%) Metals and minerals 1,409 1,643 (14%) (15%) Forest products 1,700 1,808 (6%) (7%) Coal 527 658 (20%) (20%) Grain and fertilizers 2,609 2,392 9% 9% Intermodal 3,751 3,787 (1%) (1%) Automotive 591 858 (31%) (31%)
Total freight revenues $ 13,218 $ 14,198 (7%) (7%)
Revenue ton miles (RTMs) (millions) 230,390 241,954 (5%) (5%) Freight revenue/RTM (cents) 5.74 5.87 (2%) (3%) Carloads (thousands) 5,595 5,912 (5%) (5%) Freight revenue/carload ($) 2,362 2,402 (2%) (2%)
Revenues for the year ended December 31, 2020, totaled $13,819 million compared to $14,917 million in 2019. The decrease of $1,098 million,
or 7%, was mainly attributable to lower volumes across most commodity groups, primarily in the second and third quarter, caused by the
ongoing effects of the COVID-19 pandemic and lower applicable fuel surcharge rates, partly offset by freight rate increases as well as record shipments of Canadian grain. Fuel surcharge revenues decreased by $330 million in 2020, mainly as a result of lower applicable fuel surcharge
rates and lower volumes. In 2020, RTMs, measuring the weight and distance of freight transported by the Company, declined by 5% relative to 2019. Freight revenue
per RTM decreased by 2% in 2020 when compared to 2019, mainly driven by lower applicable fuel surcharge rates, partly offset by freight rate
increases.
Petroleum and chemicals
% Change at constant
Year ended December 31, 2020 2019 % Change currency
Revenues (millions) $ 2,631 $ 3,052 (14%) (14%) RTMs (millions) 43,556 53,989 (19%) (19%) Revenue/RTM (cents) 6.04 5.65 7% 6% Carloads (thousands) 597 688 (13%) (13%)
2020 Annual Report 15

Management's Discussion and Analysis
The petroleum and chemicals commodity group comprises a wide range of commodities, including chemicals and plastics, refined petroleum products, natural gas liquids, crude oil and sulfur. The primary markets for these commodities are within North America, and as such, the
performance of this commodity group is closely correlated with the North American economy as well as oil and gas production. Most of the
Company's petroleum and chemicals shipments originate in the Louisiana petrochemical corridor between New Orleans and Baton Rouge; in
Western Canada, a key oil and gas development area and a major center for natural gas feedstock and world-scale petrochemicals and plastics;
and in eastern Canadian regional plants.
For the year ended December 31, 2020, revenues for this commodity group decreased by $421 million, or 14%, when compared to 2019,
mainly due to lower volumes of petroleum crude, chemicals and plastic products, refined petroleum products and natural gas liquids due to the COVID-19 pandemic, partly offset by liquidated damages relating to volume commitments under customer contracts.
Revenue per RTM increased by 7% in 2020 when compared to 2019, mainly due to the decrease in the average length of haul and liquidated
damages relating to volume commitments under customer contracts.
Percentage of commodity group revenues 2020 2019
Chemicals and plastics 41 % 36 % Refined petroleum products 40 % 38 % Crude and condensate 15 % 22 % Sulfur 4 % 4 %
Metals and minerals
% Change at constant
Year ended December 31, 2020 2019 % Change currency
Revenues (millions) $ 1,409 $ 1,643 (14%) (15%) RTMs (millions) 21,561 25,449 (15%) (15%) Revenue/RTM (cents) 6.53 6.46 1% —% Carloads (thousands) 935 1,008 (7%) (7%)
The metals and minerals commodity group consists primarily of materials related to oil and gas development, steel, iron ore, non-ferrous base
metals and ores, construction materials, machinery, railway equipment, and dimensional (large) loads. The Company provides unique rail
access to base metals, iron ore and frac sand mining as well as aluminum and steel producing regions, which are among the most important in
North America. This strong origin franchise, coupled with the Company's access to port facilities and the end markets for these commodities,
has made CN a leader in the transportation of metals and minerals products. The key drivers for this market segment are oil and gas development, automotive production, and non-residential construction.
For the year ended December 31, 2020, revenues for this commodity group decreased by $234 million, or 14%, when compared to 2019,
mainly due to reduced shipments of frac sand and semi-finished steel products due to the COVID-19 pandemic. Revenue per RTM increased by 1% in 2020 when compared to 2019, mainly due to a decrease in the average length of haul.
Percentage of commodity group revenues 2020 2019
Metals 31 % 30 % Minerals 28 % 27 % Energy materials 21 % 26 % Iron ore 20% 17%
Forest products
% Change at constant
Year ended December 31, 2020 2019 % Change currency
Revenues (millions) $ 1,700 $ 1,808 (6%) (7%) RTMs (millions) 25,602 27,187 (6%) (6%) Revenue/RTM (cents) 6.64 6.65 —% (1%) Carloads (thousands) 342 375 (9%) (9%)
16 CN 12020 Annual Report
Management's Discussion and Analysis
The forest products commodity group includes various types of lumber, panels, paper, wood pulp and other fibers such as logs, recycled paper, wood chips, and wood pellets. The Company has extensive rail access to the western and eastern Canadian fiber-producing regions, which are
among the largest fiber source areas in North America. In the U.S., the Company is strategically located to serve both the Midwest and southern
U.S. corridors with interline connections to other Class I railroads. The key drivers for the various commodities are: for lumber and panels,
housing starts and renovation activities primarily in the U.S.; for fibers (mainly wood pulp), the consumption of paper, pulpboard and tissue in
North American and offshore markets; and for newsprint, advertising lineage, non-print media and overall economic conditions, primarily in the
U.S.
For the year ended December 31, 2020, revenues for this commodity group decreased by $108 million, or 6%, when compared to 2019, mainly due to lower volumes across a broad range of forest products and lower applicable fuel surcharge rates, partly offset by freight rate
increases. Revenue per RTM remained flat in 2020 when compared to 2019.
Percentage of commodity group revenues 2020 2019
Lumber 39 % 38 % Pulp 30 % 30 % Paper 17 % 18 % Panels 14 % 14 %
Coal
% Change at constant
Year ended December 31, 2020 2019 % Change currency
Revenues (millions) $ 527 $ 658 (20%) (20%) RTMs (millions) 16,173 17,653 (8%) (8%) Revenue/RTM (cents) 3.26 3.73 (13%) (13%) Carloads (thousands) 289 335 (14%) (14%)
The coal commodity group consists of thermal grades of bituminous coal, metallurgical coal and petroleum coke. Canadian thermal and
metallurgical coal are largely exported via terminals on the west coast of Canada to offshore markets. In the U.S., thermal coal is transported from mines served in southern Illinois, or from western U.S. mines via interchange with other railroads, to major utilities in the Midwest and
Southeast U.S., as well as offshore markets via terminals on the U.S. Gulf Coast. Petroleum coke, a by-product of the oil refining process, is
exported to offshore markets via terminals on the west coast of Canada and the U.S. Gulf Coast, as well as shipped to industrial users in
domestic markets. The key drivers for this market segment are weather conditions, environmental regulations, global supply and demand
conditions, and for U.S. domestic coal, the price of natural gas. For the year ended December 31, 2020, revenues for this commodity group decreased by $131 million, or 20%, when compared to 2019,
mainly due to lower volumes of U.S. thermal coal exports via the Gulf Coast due to competitive market pricing as well as reduced domestic
shipments to U.S. utilities and Canadian metallurgical coal via west coast ports due to the COVID-19 pandemic; partly offset by higher Canadian
thermal coal exports via west coast ports.
Revenue per RTM decreased by 13% in 2020 when compared to 2019, mainly due to an increase in the average length of haul.
Percentage of commodity group revenues 2020 2019
Canadian coal - export 49 % 40 % Petroleum coke 25 % 22 % U.S. coal - domestic 17 % 19 % U.S. coal - export 9% 19 %
2020 Annual Report 17

Management's Discussion and Analysis
Grains and fertilizers
% Change at constant
Year ended December 31, 2020 2019 % Change currency
Revenues (millions) $ 2,609 $ 2,392 9% 9% RTMs (millions) 61,736 55,597 11% 11% Revenue/RTM (cents) 4.23 4.30 (2%) (2%) Carloads (thousands) 663 619 7% 7%
The grain and fertilizers commodity group depends primarily on crops grown and fertilizers processed in Western Canada and the U.S. Midwest.
The grain segment consists of wheat, oats, barley, flaxseed, rye, peas, lentils, corn, ethanol, dried distillers grain, canola seed and canola
products, soybeans and soybean products. Production of grain varies considerably from year to year, affected primarily by weather conditions,
seeded and harvested acreage, the mix of grains produced and crop yields. Grain exports are sensitive to the size and quality of the crop
produced, international market conditions and foreign government policy. The majority of grain produced in Western Canada and moved by CN
is exported via the ports of Vancouver, Prince Rupert and Thunder Bay. These rail movements are subject to government regulation that
establishes a maximum revenue entitlement that railways can earn. Although railway companies are free to set freight rates for western grain
shipments, total revenue is limited based on a formula that takes into account tonnage, length of haul, and a specified price index. Shipments of
grain that are exported to the U.S. are not regulated. Grain grown in the U.S. Midwest is exported as well as transported to domestic processing
facilities and feed markets. The Company also serves major producers of potash in Canada, as well as producers of ammonium nitrate, urea
and other fertilizers across Canada and the U.S. The key drivers for fertilizers are input prices, demand, government policies, and international competition.
For the year ended December 31, 2020, revenues for this commodity group increased by $217 million, or 9%, when compared to 2019,
mainly due to record Canadian grain volumes and freight rate increases, partly offset by lower applicable fuel surcharge rates.
Revenue per RTM decreased by 2% in 2020 when compared to 2019, mainly due to an increase in the average length of haul and lower
applicable fuel surcharge rates; partly offset by freight rate increases.
Percentage of commodity group revenues 2020 2019
Canadian grain - regulated 47 % 42 % U.S. grain - domestic 18 % 19 % Canadian grain - commercial 11 % 13 % Fertilizers - potash 10 % 10 % Fertilizers - other 9% 10 % U.S. grain - exports 5% 6%
Intermodal
% Change at constant
Year ended December 31, 2020 2019 % Change currency
Revenues (millions) $ 3,751 $ 3,787 (1%) (1%) RTMs (millions) 59,165 58,344 1% 1% Revenue/RTM (cents) 6.34 6.49 (2%) (3%) Carloads (thousands) 2,582 2,618 (1%) (1%)
The intermodal commodity group includes rail and trucking services and is comprised of two markets: domestic intermodal and international
intermodal. Domestic intermodal transports consumer products and manufactured goods, serving retail, wholesale and logistics provider channels, within domestic Canada, domestic U.S., Mexico and transborder, while international intermodal handles import and export container
traffic, serving the major ports of Vancouver, Prince Rupert, Montreal, Halifax, New Orleans and Mobile. CN's network of inland intermodal
terminals, located near ports and large urban centers, connects customers to major markets in North America and overseas. Domestic
intermodal is driven by consumer markets, with growth generally tied to the economy. International intermodal is driven by North American
economic and trade conditions as well as global trade patterns. Revenues for TransX and H&R are included in this commodity group within the
domestic market.
18 CN 12020 Annual Report

Management's Discussion and Analysis
For the year ended December 31, 2020, revenues for this commodity group decreased by $36 million, or 1%, when compared to 2019, mainly due to lower applicable fuel surcharge rates and lower international container volumes via the ports of Prince Rupert and Montreal, as
well as reduced shipments for domestic logistic providers; partly offset by higher international container traffic via the Ports of Vancouver and
New Orleans, as well as increased domestic retail shipments.
Revenue per RTM decreased by 2% in 2020 when compared to 2019, mainly due to lower applicable fuel surcharge rates.
Percentage of commodity group revenues 2020 2019
International 67 % 68 % Domestic 33 % 32 %
Automotive
% Change at constant
Year ended December 31, 2020 2019 % Change currency
Revenues (millions) RTMs (millions) Revenue/RTM (cents) Carloads (thousands)
$ 591 $ 858 (31%) (31%) 2,597 3,735 (30%) (30%) 22.76 22.97 (1%) (1%)
187 269 (30%) (30%)
The automotive commodity group moves both domestic finished vehicles and parts throughout North America, providing service to certain vehicle assembly plants in Ontario, Michigan and Mississippi. The Company also serves vehicle distribution facilities in Canada and the U.S., as
well as parts production facilities in Michigan and Ontario. The Company serves shippers of finished vehicle imports via the ports of Halifax and
Vancouver, and through interchange with other railroads. CN's broad network of auto compounds is used to facilitate distribution of vehicles
throughout Canada and the U.S. Midwest. The primary drivers for this market are automotive production and sales in North America, which are
driven by the average age of vehicles in North America and the price of fuel.
For the year ended December 31, 2020, revenues for this commodity group decreased by $267 million, or 31%, when compared to 2019, mainly due to lower volumes of finished vehicles due to the COVID-19 pandemic, including the temporary shutdown of assembly plants and
production between April and June, as well as lower applicable fuel surcharge rates.
Revenue per RTM decreased by 1% in 2020 when compared to 2019, mainly due to lower applicable fuel surcharge rates.
Percentage of commodity group revenues 2020 2019
Finished vehicles Auto parts
92 % 93 % 8% 7%
Other revenues
% Change at constant
Year ended December 31, 2020 2019 % Change currency
Revenues (millions) $ 601 $ 719 (16%) (17%)
Other revenues are derived from non-rail logistics services that support the Company's rail business including vessels and docks, transloading
and distribution, automotive logistics, and freight forwarding and transportation management.
For the year ended December 31, 2020, Other revenues decreased by $118 million, or 16%, when compared to 2019, mainly due to lower
revenues from vessels and automotive logistics due to the COVID-19 pandemic.
Percentage of other revenues 2020 2019
Vessels and docks Other non-rail services Other revenues
45 % 46 % 9%
47 % 44% 9%
2020 Annual Report 19
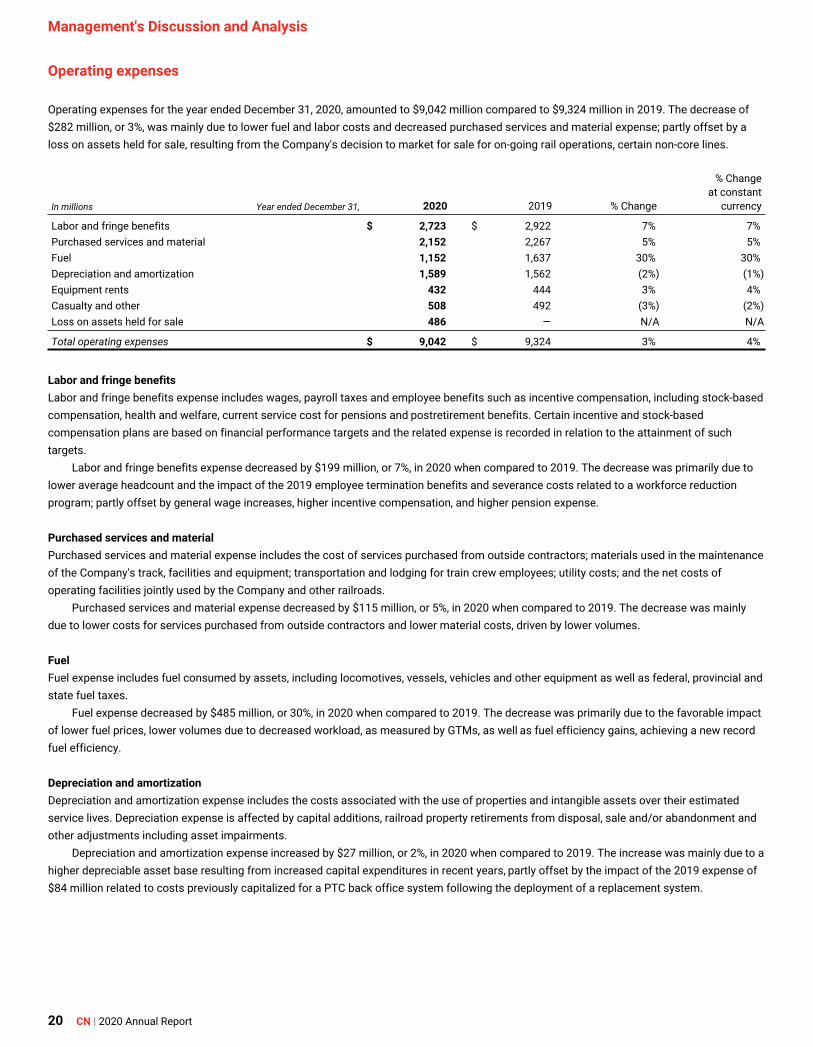
Management's Discussion and Analysis
Operating expenses
Operating expenses for the year ended December 31, 2020, amounted to $9,042 million compared to $9,324 million in 2019. The decrease of
$282 million, or 3%, was mainly due to lower fuel and labor costs and decreased purchased services and material expense; partly offset by a
loss on assets held for sale, resulting from the Company's decision to market for sale for on-going rail operations, certain non-core lines.
In millions Year ended December 31, 2020 2019 % Change
% Change at constant
currency
Labor and fringe benefits $ 2,723 $ 2,922 7% 7% Purchased services and material 2,152 2,267 5% 5% Fuel 1,152 1,637 30% 30% Depreciation and amortization 1,589 1,562 (2%) (1%) Equipment rents 432 444 3% 4% Casualty and other 508 492 (3%) (2%) Loss on assets held for sale 486 — N/A N/A
Total operating expenses $ 9,042 $ 9,324 3% 4%
Labor and fringe benefits
Labor and fringe benefits expense includes wages, payroll taxes and employee benefits such as incentive compensation, including stock-based
compensation, health and welfare, current service cost for pensions and postretirement benefits. Certain incentive and stock-based
compensation plans are based on financial performance targets and the related expense is recorded in relation to the attainment of such
targets.
Labor and fringe benefits expense decreased by $199 million, or 7%, in 2020 when compared to 2019. The decrease was primarily due to lower average headcount and the impact of the 2019 employee termination benefits and severance costs related to a workforce reduction
program; partly offset by general wage increases, higher incentive compensation, and higher pension expense.
Purchased services and material
Purchased services and material expense includes the cost of services purchased from outside contractors; materials used in the maintenance
of the Company's track, facilities and equipment; transportation and lodging for train crew employees; utility costs; and the net costs of
operating facilities jointly used by the Company and other railroads. Purchased services and material expense decreased by $115 million, or 5%, in 2020 when compared to 2019. The decrease was mainly
due to lower costs for services purchased from outside contractors and lower material costs, driven by lower volumes.
Fuel
Fuel expense includes fuel consumed by assets, including locomotives, vessels, vehicles and other equipment as well as federal, provincial and
state fuel taxes.
Fuel expense decreased by $485 million, or 30%, in 2020 when compared to 2019. The decrease was primarily due to the favorable impact of lower fuel prices, lower volumes due to decreased workload, as measured by GTMs, as well as fuel efficiency gains, achieving a new record fuel efficiency.
Depreciation and amortization
Depreciation and amortization expense includes the costs associated with the use of properties and intangible assets over their estimated
service lives. Depreciation expense is affected by capital additions, railroad property retirements from disposal, sale and/or abandonment and
other adjustments including asset impairments.
Depreciation and amortization expense increased by $27 million, or 2%, in 2020 when compared to 2019. The increase was mainly due to a higher depreciable asset base resulting from increased capital expenditures in recent years, partly offset by the impact of the 2019 expense of
$84 million related to costs previously capitalized for a PTC back office system following the deployment of a replacement system.
20 CN 12020 Annual Report

Management's Discussion and Analysis
Equipment rents Equipment rents expense includes rental expense for the use of freight cars owned by other railroads (car hire) or private companies and for the
lease of freight cars, locomotives and intermodal equipment, net of rental income from other railroads for the use of the Company's freight cars (car hire) and locomotives.
Equipment rents expense decreased by $12 million, or 3%, in 2020 when compared to 2019. The decrease was primarily due to lower rail
car lease costs driven by lower volumes, as well as lower car hire expense; partly offset by higher locomotive horsepower-hour expense.
Casualty and other
Casualty and other expense includes expenses for personal injuries, environmental, freight and property damage, insurance, bad debt, operating
taxes, and travel expenses.
Casualty and other expense increased by $16 million, or 3%, in 2020 when compared to 2019. The increase was mainly due to lower
recoveries of costs from passenger trains using CN's system and higher property taxes, partly offset by lower travel expenses and legal
provisions.
Loss on assets held for sale
In the second quarter of 2020, the Company recorded a loss of $486 million on assets held for sale, resulting from the Company's decision to market for sale for on-going rail operations, certain non-core lines in Wisconsin, Michigan and Ontario. See Note 5 - Assets held for sale to the
Company's 2020 Annual Consolidated Financial Statements for information on the valuation of assets held for sale.
Other income and expense
Interest expense In 2020, Interest expense was $554 million compared to $538 million in 2019. The increase was mainly due to a higher average level of debt
partly offset by a lower weighted-average interest rate.
Other components of net periodic benefit income
In 2020, Other components of net periodic benefit income was $315 million compared to $321 million in 2019. The decrease was mainly due to higher amortization of net actuarial loss, partly offset by lower interest cost.
Other income In 2020, Other income was $6 million compared to $53 million in 2019, primarily due to lower gains on sale of land.
Income tax expense
The enactment of the Tax Cuts and Jobs Act ("U.S. Tax Reform") in 2017 brought about significant tax law changes, which included a reduction
to the U.S. federal corporate income tax rate from 35% to 21% and allowed the immediate capital expensing of new investments in certain
qualified depreciable assets which will be phased down starting in 2023. The U.S. Tax Reform also introduced the creation of a Base Erosion
Anti-abuse Tax (BEAT) that subjects certain payments from U.S. corporations to foreign related parties to additional taxes, and limitations to the deduction for net interest expense incurred by U.S. corporations. Since the enactment of the U.S. Tax Reforms, U.S. authorities have issued
various proposed and finalized regulations and guidance interpreting its provisions. These interpretations have been taken into account in
calculating the Company's current year income tax provision and tax payments. The U.S. Tax Reform and these regulations are also expected to
impact the Company's income tax provisions and tax payments in future years. On March 27, 2020, the U.S. government enacted the CARES Act, which included corporate income tax measures allowing U.S. federal net
operating losses (NOLs) arising in tax years 2018, 2019, and 2020 to be fully carried back to each of the five tax years preceding the tax year of
the NOL.
In 2020, the Company recorded an income tax expense of $982 million compared to an income tax expense of $1,213 million in 2019.
Included in the 2020 figure was a current income tax recovery of $141 million recorded in the first quarter, resulting from the enactment of the
CARES Act; the Company reclassified its 2019 deferred income tax asset of $213 million on the NOL that arose in 2019, to a current income tax
receivable and recorded a current income tax recovery of $141 million to reflect an amount recoverable at the higher U.S. federal corporate
income tax rate of 35% applicable to pre-2018 tax years. Included in the 2019 figure was a deferred income tax recovery of $112 million
recorded in the second quarter, resulting from the enactment of a lower provincial corporate income tax rate.
The effective tax rate for 2020 was 21.6% compared to 22.3% in 2019. Excluding the aforementioned income tax recoveries, the effective tax rate for 2020 was 24.7% compared to 24.4% in 2019.
For 2021, the Company anticipates the estimated annual effective tax rate to be approximately 25.0%.
2020 Annual Report 21

Management's Discussion and Analysis
2019 compared to 2018
Net income for the year ended December 31, 2019 was $4,216 million, a decrease of $112 million, or 3%, when compared to 2018, and diluted
earnings per share decreased by 1% to $5.83.
Operating income for the year ended December 31, 2019 increased by $100 million, or 2%, to $5,593 million. The increase mainly reflects
increased petroleum and crude and intermodal revenues; partly offset by higher purchased services and material expense, as well as higher
depreciation and amortization expense. The operating ratio was 62.5% in 2019, compared to 61.6% in 2018.
Revenues for the year ended December 31, 2019 were $14,917 million compared to $14,321 million in 2018. The increase of $596 million,
or 4%, was mainly attributable to freight rate increases, the inclusion of TransX in the intermodal commodity group within the domestic market, the positive translation impact of a weaker Canadian dollar and higher volumes of petroleum crude, natural gas liquids and refined petroleum
products in the first nine months. These factors were partly offset by lower volumes of a broad range of forest products, reduced U.S. thermal
coal exports via the Gulf Coast and lower shipments of frac sand.
Operating expenses for the year ended December 31, 2019 were $9,324 million compared to $8,828 million in 2018. The increase of $496
million, or 6%, was mainly due to increased purchased services and material expense, due to the inclusion of TransX, higher depreciation
expense and the negative translation impact of a weaker Canadian dollar; partly offset by lower fuel prices.
Constant currency
Financial results at constant currency allow results to be viewed without the impact of fluctuations in foreign currency exchange rates, thereby
facilitating period-to-period comparisons in the analysis of trends in business performance. Measures at constant currency are considered non-
GAAP measures and do not have any standardized meaning prescribed by GAAP and therefore, may not be comparable to similar measures
presented by other companies. Financial results at constant currency are obtained by translating the current period results denominated in US
dollars at the foreign exchange rates of the comparable period of the prior year. The average foreign exchange rates were $1.33 and $1.30 per
US$1.00, for the years ended December 31, 2019 and 2018, respectively.
On a constant currency basis, the Company's net income for the year ended December 31, 2019 would have been lower by $65 million
($0.09 per diluted share).
Revenues
In millions, unless otherwise indicated Year ended December 31, 2019 2018 % Change
% Change at constant
currency
Freight revenues $ 14,198 $ 13,548 5% 3% Other revenues 719 773 (7%) (8%)
Total revenues $ 14,917 $ 14,321 4% 3%
Freight revenues Petroleum and chemicals $ 3,052 $ 2,660 15% 13% Metals and minerals 1,643 1,689 (3%) (5%) Forest products 1,808 1,886 (4%) (6%) Coal 658 661 —% (2%) Grain and fertilizers 2,392 2,357 1% —% Intermodal 3,787 3,465 9% 8% Automotive 858 830 3% 1%
Total freight revenues $ 14,198 $ 13,548 5% 3%
Revenue ton miles (RTMs) (millions) 241,954 248,383 (3%) (3%) Freight revenue/RTM (cents) 5.87 5.45 8% 6% Carloads (thousands) 5,912 5,976 (1%) (1%) Freight revenue/carload ($) 2,402 2,267 6% 4%
Revenues for the year ended December 31, 2019, totaled $14,917 million compared to $14,321 million in 2018. The increase of $596 million, or
4%, was mainly attributable to freight rate increases, the inclusion of TransX in the intermodal commodity group within the domestic market, the
positive translation impact of a weaker Canadian dollar and higher volumes of petroleum crude, natural gas liquids and refined petroleum products in the first nine months. These factors were partly offset by lower volumes of a broad range of forest products, reduced U.S. thermal
coal exports via the Gulf Coast and lower shipments of frac sand. Fuel surcharge revenues decreased by $31 million in 2019, as a result of
lower applicable fuel surcharge rates, partly offset by the positive translation impact of a weaker Canadian dollar.
22 CN 12020 Annual Report

Management's Discussion and Analysis
In 2019, RTMs declined by 3% relative to 2018. Freight revenue per RTM increased by 8% in 2019 when compared to 2018, mainly driven by
freight rate increases, the inclusion of TransX in the intermodal commodity group and the positive translation impact of a weaker Canadian
dollar.
Petroleum and chemicals
% Change at constant
Year ended December 31, 2019 2018 % Change currency
Revenues (millions) $ 3,052 $ 2,660 15% 13% RTMs (millions) 53,989 50,722 6% 6% Revenue/RTM (cents) 5.65 5.24 8% 6% Carloads (thousands) 688 653 5% 5%
For the year ended December 31, 2019, revenues for this commodity group increased by $392 million, or 15%, when compared to 2018, mainly
due to higher volumes of petroleum crude, natural gas liquids and refined petroleum products in the first nine months; freight rate increases and
the positive translation impact of a weaker Canadian dollar.
Revenue per RTM increased by 8% in 2019 when compared to 2018, mainly due to freight rate increases and the positive translation impact
of a weaker Canadian dollar.
Metals and minerals
% Change at constant
Year ended December 31, 2019 2018 % Change currency
Revenues (millions) $ 1,643 $ 1,689 (3%) (5%) RTMs (millions) 25,449 27,993 (9%) (9%) Revenue/RTM (cents) 6.46 6.03 7% 5% Carloads (thousands) 1,008 1,030 (2%) (2%)
For the year ended December 31, 2019, revenues for this commodity group decreased by $46 million, or 3%, when compared to 2018, mainly
due to lower volumes of frac sand and a broad range of metal products; partly offset by freight rate increases and the positive translation
impact of a weaker Canadian dollar.
Revenue per RTM increased by 7% in 2019 when compared to 2018, mainly due to a decrease in the average length of haul, freight rate
increases and the positive translation impact of a weaker Canadian dollar.
Forest products
% Change at constant
Year ended December 31, 2019 2018 % Change currency
Revenues (millions) $ 1,808 $ 1,886 (4%) (6%) RTMs (millions) 27,187 29,918 (9%) (9%) Revenue/RTM (cents) 6.65 6.30 6% 3% Carloads (thousands) 375 418 (10%) (10%)
For the year ended December 31, 2019, revenues for this commodity group decreased by $78 million, or 4%, when compared to 2018, mainly
due to lower volumes of a broad range of forest products, partly offset by freight rate increases and the positive translation impact of a weaker
Canadian dollar.
Revenue per RTM increased by 6% in 2019 when compared to 2018, mainly due to freight rate increases and the positive translation impact
of a weaker Canadian dollar.
2020 Annual Report 23

Management's Discussion and Analysis
Coal
% Change at constant
Year ended December 31, 2019 2018 % Change currency
Revenues (millions) $ 658 $ 661 —% (2%) RTMs (millions) 17,653 17,927 (2%) (2%) Revenue/RTM (cents) 3.73 3.69 1% —% Carloads (thousands) 335 346 (3%) (3%)
For the year ended December 31, 2019, revenues for this commodity group remained flat when compared to 2018, mainly due to lower U.S.
thermal coal exports via the Gulf Coast; offset by higher metallurgical and thermal coal exports via west coast ports and freight rate increases. Revenue per RTM increased by 1% in 2019 when compared to 2018, mainly due to freight rate increases.
Grain and fertilizers
% Change at constant
Year ended December 31, 2019 2018 % Change currency
Revenues (millions) $ 2,392 $ 2,357 1% —% RTMs (millions) 55,597 57,819 (4%) (4%) Revenue/RTM (cents) 4.30 4.08 5% 4% Carloads (thousands) 619 632 (2%) (2%)
For the year ended December 31, 2019, revenues for this commodity group increased by $35 million, or 1%, when compared to 2018, mainly due
to freight rate increases, the positive translation impact of a weaker Canadian dollar and higher U.S. soybean exports; partly offset by lower
volumes of potash. Revenue per RTM increased by 5% in 2019 when compared to 2018, mainly due to freight rate increases and the positive translation impact
of a weaker Canadian dollar.
Intermodal
% Change at constant
Year ended December 31, 2019 2018 % Change currency
Revenues (millions) $ 3,787 $ 3,465 9% 8% RTMs (millions) 58,344 60,120 (3%) (3%) Revenue/RTM (cents) 6.49 5.76 13% 12% Carloads (thousands) 2,618 2,634 (1%) (1%)
For the year ended December 31, 2019, revenues for this commodity group increased by $322 million, or 9%, when compared to 2018, mainly due to the inclusion of TransX, higher international container traffic via the Port of Prince Rupert, freight rate increases and the positive
translation impact of a weaker Canadian dollar; partly offset by lower international container traffic via the Port of Vancouver and reduced domestic retail volumes, as well as lower applicable fuel surcharge rates.
Revenue per RTM increased by 13% in 2019 when compared to 2018, mainly due to the inclusion of TransX, freight rate increases and the
positive translation impact of a weaker Canadian dollar.
24 CN 12020 Annual Report

Management's Discussion and Analysis
Automotive
% Change at constant
Year ended December 31, 2019 2018 % Change currency
Revenues (millions) RTMs (millions) Revenue/RTM (cents) Carloads (thousands)
$ 858 $ 830 3% 1% 3,735 3,884 (4%) (4%) 22.97 21.37 7% 5%
269 263 2% 2%
For the year ended December 31, 2019, revenues for this commodity group increased by $28 million, or 3%, when compared to 2018, mainly due to higher volumes of domestic finished vehicles and vehicle parts in the first nine months, the positive translation impact of a weaker Canadian
dollar and freight rate increases; partly offset by lower import volumes of finished vehicles via the Port of Halifax.
Revenue per RTM increased by 7% in 2019 when compared to 2018, mainly due to a decrease in the average length of haul, the positive translation impact of a weaker Canadian dollar and freight rate increases.
Other revenues
% Change at constant
Year ended December 31, 2019 2018 % Change currency
Revenues (millions) $ 719 $ 773 (7%) (8%)
For the year ended December 31, 2019, Other revenues decreased by $54 million, or 7%, when compared to 2018, mainly due to lower revenues from vessels.
Operating expenses
Operating expenses for the year ended December 31, 2019 amounted to $9,324 million compared to $8,828 million in 2018. The increase of
$496 million, or 6%, was mainly due to increased purchased services and material expense, due to the inclusion of TransX, higher depreciation
expense and the negative translation impact of a weaker Canadian dollar; partly offset by lower fuel prices.
In millions Year ended December 31, 2019 2018 % Change
% Change at constant
currency
Labor and fringe benefits $ 2,922 $ 2,860 (2%) (1%) Purchased services and material 2,267 1,971 (15%) (14%) Fuel 1,637 1,732 5% 8% Depreciation and amortization 1,562 1,329 (18%) (16%) Equipment rents 444 467 5% 7% Casualty and other 492 469 (5%) (3%)
Total operating expenses $ 9,324 $ 8,828 (6%) (4%)
Labor and fringe benefits Labor and fringe benefits expense increased by $62 million, or 2%, in 2019 when compared to 2018. The increase was primarily due to the
inclusion of TransX, general wage increases and the negative translation impact of a weaker Canadian dollar; partly offset by lower incentive compensation.
Purchased services and material
Purchased services and material expense increased by $296 million, or 15%, in 2019 when compared to 2018. The increase was mainly due to the inclusion of TransX, higher repairs, maintenance and materials costs, higher costs for services purchased from outside contractors and the negative translation impact of a weaker Canadian dollar.
2020 Annual Report 25

Management's Discussion and Analysis
Fuel Fuel expense decreased by $95 million, or 5%, in 2019 when compared to 2018. The decrease was primarily due to lower fuel prices, decreased
volumes of traffic and increased fuel productivity; partly offset by the negative translation impact of a weaker Canadian dollar.
Depreciation and amortization
Depreciation and amortization expense increased by $233 million, or 18%, in 2019 when compared to 2018. The increase was mainly due to a
higher depreciable asset base resulting from increased capital expenditures in recent years, an expense related to costs previously capitalized
for a PTC back office system following the deployment of a replacement system and the negative translation impact of a weaker Canadian dollar.
Equipment rents
Equipment rents expense decreased by $23 million, or 5%, in 2019 when compared to 2018. The decrease was primarily due to lower costs for
leased locomotives, partly offset by higher car hire expense and the negative translation impact of a weaker Canadian dollar.
Casualty and other
Casualty and other expense increased by $23 million, or 5%, in 2019 when compared to 2018. The increase was mainly due to higher incident
costs and the negative translation impact of a weaker Canadian dollar; partly offset by lower legal provisions.
Other income and expenses
Interest expense In 2019, Interest expense was $538 million compared to $489 million in 2018. The increase was mainly due to a higher average level of debt
and the negative translation impact of a weaker Canadian dollar; partly offset by a lower average interest rate.
Other components of net periodic benefit income In 2019, Other components of net periodic benefit income was $321 million compared to $302 million in 2018. The increase was mainly due to
lower amortization of net actuarial loss, partly offset by higher interest cost.
Other income In 2019, Other income was $53 million compared to $376 million in 2018. Included in Other income for 2018 was a gain previously deferred on
the 2014 disposal of the Guelph of $79 million, a gain on disposal of the Doney and St-Francois Spurs of $36 million, a gain on the transfer of
the Central Station Railway Lease of $184 million, and a gain on disposal of the Calgary Industrial Lead of $39 million.
Income tax recovery (expense)
On December 22, 2017, the President of the United States signed into law the U.S. Tax Reform, which reduced the U.S. federal corporate income
tax rate from 35% to 21% effective as of January 1, 2018. The U.S. Tax Reform also allows for immediate capital expensing of new investments
in certain qualified depreciable assets made after September 27, 2017, which will be phased down starting in year 2023. As a result of the U.S.
Tax Reform, the Company's net deferred income tax liability decreased by $1,764 million for the year ended December 31,2017.
The U.S. Tax Reform introduced other important changes to U.S. corporate income tax laws including the creation of a new Base Erosion Anti-abuse Tax (BEAT) that subjects certain payments from U.S. corporations to foreign related parties to additional taxes and limitations to the
deduction for net interest expense incurred by U.S. corporations. Since the enactment of the U.S. Tax Reform, U.S. authorities have issued
various proposed and finalized regulations and guidance interpreting its provisions. These interpretations have been taken into account in
calculating the Company's current year income tax provision and tax payments. The U.S. Tax Reform and these regulations are expected to
impact the Company's income tax provisions and tax payments in future years.
In 2019, the Company recorded an income tax expense of $1,213 million compared to an income tax expense of $1,354 million in 2018.
Included in the 2019 figure was a deferred income tax recovery of $112 million recorded in the second quarter, resulting from the enactment of a lower provincial corporate income tax rate.
The effective tax rate for 2019 was 22.3% compared to 23.8% in 2018. Excluding the aforementioned deferred income tax recovery, the
effective tax rate for 2019 was 24.4% compared to 23.8% in 2018. The increase in the effective tax rate was mainly attributable to lower gains
on disposal of property in 2019, taxed at the lower capital gain inclusion rate.
26 CN 12020 Annual Report

Management's Discussion and Analysis
Summary of quarterly financial data
In millions, except per share data
2020
Quarters
2019
Quarters
Fourth Third Second First Fourth Third Second First
Revenues $ 3,656 $ 3,409 $ 3,209 $ 3,545 $ 3,584 $ 3,830 $ 3,959 $ 3,544
Operating income (1) $ 1,411 $ 1,366 $ 785 $ 1,215 $ 1,218 $ 1,613 $ 1,682 $ 1,080
Net income (1) $ 1,021 $ 985 $ 545 $ 1,011 $ 873 $ 1,195 $ 1,362 $ 786
Basic earnings per share (1) $ 1.44 $ 1.39 $ 0.77 $ 1.42 $ 1.22 $ 1.66 $ 1.89 $ 1.08
Diluted earnings per share (1) $ 1.43 $ 1.38 $ 0.77 $ 1.42 $ 1.22 $ 1.66 $ 1.88 $ 1.08
Dividends per share $ 0.5750 $ 0.5750 $ 0.5750 $ 0.5750 $ 0.5375 $ 0.5375 $ 0.5375 $ 0.5375
(1) Certain quarters include items that management believes do not necessarily arise as part of CN's normal day-to-day operations and can distort the analysis of trends in business performance. See the section of this MD&A entitled Adjusted performance measures for additional information on these items.
Revenues generated by the Company during the year are influenced by seasonal weather conditions, general economic conditions, cyclical
demand for rail transportation, competitive forces in the transportation marketplace and the effects of the COVID-19 pandemic beginning in the
second quarter of 2020 (see the section entitled Business risks of this MD&A). Operating expenses reflect the impact of freight volumes,
seasonal weather conditions, labor costs, fuel prices, and the Company's productivity initiatives. Fluctuations in the Canadian dollar relative to the US dollar have also affected the conversion of the Company's US dollar-denominated revenues and expenses and resulted in fluctuations in net income in the rolling eight quarters presented above.
Summary of fourth quarter 2020
Fourth quarter 2020 net income was $1,021 million, an increase of $148 million, or 17%, when compared to the same period in 2019, and diluted
earnings per share increased by 17% to $1.43.
Operating income for the quarter ended December 31, 2020 increased by $193 million, or 16%, to $1,411 million, when compared to the same period in 2019. The increase mainly reflects lower fuel costs, freight rate increases and the impact of the November 2019 conductor
strike; partly offset by lower applicable fuel surcharge rates. The operating ratio was 61.4% in the fourth quarter of 2020 compared to 66.0% in
the fourth quarter of 2019.
Revenues for the fourth quarter of 2020 increased by $72 million, or 2%, to $3,656 million, when compared to the same period in 2019. The
increase was mainly attributable to record shipments of Canadian grain, increased shipments of U.S. grain, higher international container traffic
via the Port of Vancouver and freight rate increases; partly offset by lower applicable fuel surcharge rates and lower volumes of petroleum
crude. Fuel surcharge revenues decreased by $92 million in the fourth quarter of 2020, mainly due to lower applicable fuel surcharge rates. RTMs in the fourth quarter of 2020 increased by 10% when compared to the same period in 2019. Freight revenue per RTM decreased by 6% in
the fourth quarter of 2020 when compared to the same period in 2019, mainly driven by an increase in the average length of haul, changes in
business mix and lower applicable fuel surcharge rates; partly offset by freight rate increases.
Operating expenses for the fourth quarter of 2020 decreased by $121 million, or 5%, to $2,245 million, when compared to the same period
in 2019. The decrease was mainly due to lower fuel costs as well as lower purchased services and materials expense.
2020 Annual Report 27

Management's Discussion and Analysis
Financial position
The following tables provide an analysis of the Company's balance sheet as at December 31, 2020 as compared to 2019. Assets and liabilities
denominated in US dollars have been translated to Canadian dollars using the foreign exchange rate in effect at the balance sheet date. As at
December 31, 2020 and 2019, the foreign exchange rates were $1.2725 and $1.2990 per US$1.00, respectively.
In millions December 31, 2020 2019
Total assets $ 44,804 $ 43,784
Cash and cash equivalents and restricted cash and cash equivalents
1,100 588
Other current assets, excluding cash and cash equivalents and restricted cash and cash equivalents
2,002 2,242
Properties 40,069 39,669
Operating lease right-of-use-assets 435 520
Pension asset 777 336
Intangible assets, goodwill and other
421 429
Total liabilities and Shareholders' equity $ 44,804 $ 43,784
Accounts payable and other excluding current portion of operating lease liabilities
2,257 2,235
Deferred income taxes 8,271 7,844
Other liabilities and deferred credits 534 634
Pension and other postretirement benefits
767 733
Total long-term debt, including the current portion
12,906 13,796
Operating lease liabilities including the current portion
418 501
Total shareholders' equity 19,651 18,041
Variance Explanation of variance
$ 1,020
512 Refer to the Consolidated Statements of Cash Flows of the Company's 2020 Annual Consolidated Financial Statements.
(240) Decrease primarily due to a $159 million decrease in accounts receivable and a $134 million decrease in income taxes receivable, partly offset by $90 million of assets classified as held for sale.
400 See the section of this MD&A entitled Liquidity and capital resources - Investing activities, increase primarily due to property additions of $2,863 million, partly offset by depreciation of $1,583 million, assets held for sale of $576 million and foreign exchange of $368 million.
(85) Decrease primarily due to the return of leases that were coming to maturity in 2020.
441 Increase primarily due to actual returns and employer contributions, partly offset by actuarial losses arising from the reduction in the year-end discount rate from 3.10% to 2.55%, as well as interest cost and service cost.
(8) Decrease primarily due to the amortization of intangibles and the change in fair value of the net assets acquired in the 2019 acquisition of TransX which resulted in a decrease to goodwill.
$ 1,020
22 Increase primarily due to a long term deferred revenue contract classified as short term, partly offset by an overall decrease in various accruals.
427 Increase primarily due to a deferred income tax expense of $487 million recorded in Net income which included $213 million from the enactment of the CARES Act, a deferred income tax expense of $67 million recorded in Other comprehensive income, both of which were mostly attributable to new temporary differences generated during the year, partly offset by $95 million in foreign exchange.
(100) Decrease mainly due to a long term deferred revenue contract classified as short term.
34 Increase primarily due to actuarial losses arising from the decrease in year-end discount rates as well as interest cost, partly offset by actual returns.
(890) See the section of this MD&A entitled Liquidity and capital resources - Financing activities, overall decrease primarily due to higher debt repayments than issuances in 2020, partly offset by $203 million in foreign exchange.
(83) Decrease primarily due to the return of leases that were coming to maturity in 2020.
1,610 Refer to the Consolidated Statements of Changes in Shareholders' Equity of the Company's 2020 Annual Consolidated Financial Statements.
28 CN 12020 Annual Report

Management's Discussion and Analysis
Liquidity and capital resources
The Company's principal source of liquidity is cash generated from operations, which is supplemented by borrowings in the money markets and
capital markets. To meet its short-term liquidity needs, the Company has access to various financing sources, including unsecured revolving
credit facilities, commercial paper programs, and an accounts receivable securitization program. In addition to these sources, the Company can
issue debt securities to meet its longer-term liquidity needs. The strong focus on cash generation from all sources gives the Company increased flexibility in terms of meeting its financing requirements.
The Company's primary uses of funds are for working capital requirements, including income tax instalments, pension contributions, and
contractual obligations; capital expenditures relating to track infrastructure and other; acquisitions; dividends; and share repurchases. The Company sets priorities on its uses of available funds based on short-term operational requirements, expenditures to continue to operate a safe
railway and pursue strategic initiatives, while also considering its long-term contractual obligations and returning value to its shareholders; and
as part of its financing strategy, the Company regularly reviews its capital structure, cost of capital, and the need for additional debt financing. The Company has a working capital deficit, which is common in the capital-intensive rail industry, and is not an indication of a lack of
liquidity. The Company maintains adequate resources to meet daily cash requirements, and has sufficient financial capacity to manage its day-
to-day cash requirements and current obligations. As at December 31, 2020 and 2019, the Company had Cash and cash equivalents of $569 million and $64 million, respectively; Restricted cash and cash equivalents of $531 million and $524 million, respectively; and a working capital deficit of $172 million and $1,457 million, respectively. The cash and cash equivalents pledged as collateral for a minimum term of one month
pursuant to the Company's bilateral letter of credit facilities are recorded as Restricted cash and cash equivalents. There are currently no specific requirements relating to working capital other than in the normal course of business as discussed herein.
The Company's U.S. and other foreign subsidiaries maintain sufficient cash to meet their respective operational requirements. If the
Company should require more liquidity in Canada than is generated by its domestic operations, the Company could decide to repatriate funds
associated with undistributed earnings of its foreign operations, including its U.S. and other foreign subsidiaries. The impact on liquidity
resulting from the repatriation of funds held outside Canada would not be significant as such repatriation of funds would not cause significant
tax implications to the Company under the tax laws of Canada and the U.S. and other foreign tax jurisdictions, and the tax treaties currently in
effect between them. The Company expects cash from operations and its various sources of financing to be sufficient to meet its ongoing obligations. The
Company is not aware of any trends or expected fluctuations in its liquidity that would impact its ongoing operations or financial condition as of
the date of this MD&A.
The Company adopted Accounting Standards Update (ASU) 2016-02: Leases and related amendments (Topic 842) in the first quarter of
2019 using a modified retrospective approach with no restatement of comparative period financial information. Additional information is
provided in Note 12 — Leases to the Company's 2020 Annual Consolidated Financial Statements.
Available financing sources
Shelf prospectus and registration statement On February 11, 2020, the Company filed a new shelf prospectus with Canadian securities regulators and a registration statement with the
United States Securities and Exchange Commission (SEC), pursuant to which CN may issue up to $6.0 billion of debt securities in the Canadian
and U.S. capital markets over the 25 months from the filing date. This shelf prospectus and registration statement replaced CN's previous shelf
prospectus and registration statement that expired on March 13, 2020. On May 1, 2020, under its current shelf prospectus and registration
statement, the Company issued US$600 million ($837 million) 2.45% Notes due 2050 in the U.S. capital markets, which resulted in net proceeds of $810 million. As at December 31, 2020, the remaining capacity of this shelf prospectus and registration statement was $5.2 billion. Access to
the Canadian and U.S. capital markets under the shelf prospectus and registration statement is dependent on market conditions.
The Company's access to long-term funds in the capital markets depends on its credit ratings and market conditions. The Company believes that it continues to have access to the capital markets. If the Company were unable to borrow funds at acceptable rates in the capital
markets, the Company could borrow under its credit facilities, draw down on its accounts receivable securitization program, raise cash by
disposing of surplus properties or otherwise monetizing assets, reduce discretionary spending or take a combination of these measures to
assure that it has adequate funding for its business.
Revolving credit facilities
The Company has a revolving credit facility of $2.0 billion that consists of a $1.0 billion tranche maturing on May 5, 2022 and a $1.0 billion
tranche maturing on May 5, 2024. The accordion feature included in the credit facility agreement provides for an additional $500 million subject
to the consent of individual lenders. The credit facility is available for general corporate purposes, including backstopping the Company's
commercial paper programs. As at December 31, 2020 and 2019, the Company had no outstanding borrowings under this revolving credit facility.
2020 Annual Report 29

Management's Discussion and Analysis
On March 27, 2020, the Company entered into a $250 million one year revolving credit facility agreement. The credit facility is available for working capital and general corporate purposes and provides for borrowings at various interest rates, plus a margin. On May 19, 2020, the
Company entered into a supplement to the original agreement to increase the credit facility to $390 million. As at December 31, 2020, the
Company had no outstanding borrowings under this revolving credit facility and there were no draws in 2020.
Non-revolving credit facility The Company has a US$300 million, non-revolving term loan credit facility agreement for financing or refinancing the purchase of equipment,
which was available to be drawn upon through March 31, 2020. On March 27, 2020, the Company entered into loan supplements to the original
agreement for an additional principal amount of US$310 million, which is available to be drawn through March 31, 2021.Term loans made under
this facility have a tenor of 20 years, bear interest at a variable rate, are repayable in equal quarterly instalments, are prepayable at any time
without penalty, and are secured by rolling stock. As at December 31, 2020, the Company had outstanding borrowings of US$289 million ($368 million) and had US$310 million available
under this non-revolving term loan facility. As at December 31, 2019, the Company had no outstanding borrowings and had US$300 million
available under this non-revolving term loan facility.
Commercial paper
The Company has a commercial paper program in Canada and in the U.S. Both programs are backstopped by the Company's revolving credit facility. The maximum aggregate principal amount of commercial paper that could be issued is $2.0 billion, or the US dollar equivalent, on a
combined basis. The commercial paper programs, which are subject to market rates in effect at the time of financing, provide the Company with a flexible financing alternative, and can be used for general corporate purposes. The cost of commercial paper and access to the
commercial paper market in Canada and the U.S. are dependent on credit ratings and market conditions. If the Company were to lose access to
its commercial paper program for an extended period of time, the Company could rely on its $2.0 billion revolving credit facility to meet its
short-term liquidity needs.
As at December 31, 2020 and 2019, the Company had total commercial paper borrowings of US$44 million ($56 million) and
US$983 million ($1,277 million), respectively, presented in Current portion of long-term debt on the Consolidated Balance Sheets.
Accounts receivable securitization program
The Company has an agreement to sell an undivided co-ownership interest in a revolving pool of accounts receivable to unrelated trusts for maximum cash proceeds of $450 million. On February 27, 2020, the Company extended the term of its agreement by two years to
February 1, 2023. The trusts are multi-seller trusts and the Company is not the primary beneficiary. Funding for the acquisition of these assets
is customarily through the issuance of asset-backed commercial paper notes by the unrelated trusts.
The Company has retained the responsibility for servicing, administering and collecting the receivables sold. The average servicing period is approximately one month and is renewed at market rates then in effect. Subject to customary indemnifications, each trusts recourse is
limited to the accounts receivable transferred.
The accounts receivable securitization program provides the Company with readily available short-term financing for general corporate
use. In the event the program is terminated before its scheduled maturity, the Company expects to meet its future payment obligations through its various sources of financing including its revolving credit facilities and commercial paper program, and/or access to capital markets.
As at December 31, 2020, the Company had no borrowings under the accounts receivable securitization program. As at December 31,
2019, the Company had borrowings under the accounts receivable securitization program of $200 million, secured by and limited to $224 million of accounts receivable, presented in Current portion of long-term debt on the Consolidated Balance Sheets.
Bilateral letter of credit facilities
The Company has a series of committed and uncommitted bilateral letter of credit facility agreements. On June 11, 2020, the Company
extended the maturity date of certain committed bilateral letter of credit facility agreements to April 28, 2023. The agreements are held with
various banks to support the Company's requirements to post letters of credit in the ordinary course of business. Under these agreements, the
Company has the option from time to time to pledge collateral in the form of cash or cash equivalents, for a minimum term of one month, equal
to at least the face value of the letters of credit issued.
As at December 31, 2020, the Company had outstanding letters of credit of $421 million (2019 - $424 million) under the committed
facilities from a total available amount of $492 million (2019 - $459 million) and $165 million (2019 - $149 million) under the uncommitted
facilities.
As at December 31, 2020, included in Restricted cash and cash equivalents was $424 million (2019 - $429 million) and $100 million (2019 -
$90 million) pledged as collateral under the committed and uncommitted bilateral letter of credit facilities, respectively.
30 CN 12020 Annual Report

Management's Discussion and Analysis
Additional information relating to the Company's financing sources is provided in Note 15 — Debt to the Company's 2020 Annual Consolidated Financial Statements.
Credit ratings
The Company's ability to access funding in the debt capital markets and the cost and amount of funding available depends in part on its credit
ratings. Rating downgrades could limit the Company's access to the capital markets, or increase its borrowing costs. The following table provides the credit ratings that CN has received from credit rating agencies as of the date of this MD&A
Long-term debt rating Commercial paper rating Dominion Bond Rating Service A R-1 (low) Moody's Investors Service A2 P-1 Standard & Poor's A A-1
The Company's credit ratings remained unchanged from 2019.
These credit ratings are not recommendations to purchase, hold, or sell the securities referred to above. Ratings may be revised or withdrawn at
any time by the credit rating agencies. Each credit rating should be evaluated independently of any other credit rating.
Cash flows
In millions Year ended December 31, 2020 2019 Variance
Net cash provided by operating activities $ 6,165 $ 5,923 $ 242 Net cash used in investing activities (2,946) (4,190) 1,244 Net cash used in financing activities (2,707) (1,903) (804) Effect of foreign exchange fluctuations on cash, cash equivalents, restricted cash, and
restricted cash equivalents — (1) 1 Net increase (decrease) in cash, cash equivalents, restricted cash, and
restricted cash equivalents 512 (171) 683 Cash, cash equivalents, restricted cash, and restricted cash equivalents,
beginning of year 588 759 (171)
Cash, cash equivalents, restricted cash, and restricted cash equivalents, end of year 1,100 588 512
Free cash flow
Management believes that free cash flow is a useful measure of liquidity as it demonstrates the Company's ability to generate cash for debt
obligations and for discretionary uses such as payment of dividends, share repurchases and strategic opportunities. The Company defines its
free cash flow measure as the difference between net cash provided by operating activities and net cash used in investing activities, adjusted
for the impact of business acquisitions, if any. Free cash flow does not have any standardized meaning prescribed by GAAP and therefore, may
not be comparable to similar measures presented by other companies. The following table provides a reconciliation of net cash provided by operating activities in accordance with GAAP, as reported for the
years ended December 31, 2020, 2019 and 2018, to the non-GAAP free cash flow presented herein:
In millions Year ended December 31, 2020 2019 2018
Net cash provided by operating activities $ 6,165 $ 5,923 $ 5,918 Net cash used in investing activities (2,946) (4,190) (3,404)
Net cash provided before financing activities 3,219 1,733 2,514
Adjustment: Acquisitions, net of cash acquired (1) 8 259
Free cash flow 3,227 1,992 2,514
(1) Relates to the acquisitions of H&R Transport Limited ("H&R") and the TransX Group of Companies ("TransX"). See the section of this MD&A entitled Liquidity and capital resources - Investing activities for additional information.
2020 Annual Report 31

Management's Discussion and Analysis
Operating activities Net cash provided by operating activities increased by $242 million in 2020 mainly due to lower income tax instalment payments and a U.S. tax
refund received in 2020 as a result of the CARES Act, partly offset by lower earnings excluding non-cash items.
Pension contributions
The Company's contributions to its various defined benefit pension plans are made in accordance with the applicable legislation in Canada and
the U.S. and such contributions follow minimum and maximum thresholds as determined by actuarial valuations. Pension contributions for the
years ended December 31, 2020 and 2019 of $115 million and $128 million, respectively, primarily represent contributions to the CN Pension
Plan, for the current service cost as determined under the Company's current actuarial valuations for funding purposes. The Company expects
to make total cash contributions of approximately $135 million for all pension plans in 2021.
See the section of this MD&A entitled Critical accounting estimates — Pensions and other postretirement benefits for additional information
pertaining to the funding of the Company's pension plans. Additional information relating to the pension plans is provided in Note 17 — Pensions
and other postretirement benefits to the Company's 2020 Annual Consolidated Financial Statements.
Income tax payments
The Company is required to make scheduled instalment payments as prescribed by the tax authorities. In Canada, the Company's domestic jurisdiction, tax instalments in a given year are generally based on the prior year's taxable income whereas in the U.S., the Company's
predominant foreign jurisdiction, they are based on forecasted taxable income of the current year. In 2020, net income tax payments were $353 million (2019 - $822 million). The decrease was mainly due to the $329 million income tax
refund received in the fourth quarter of 2020 related to the carryback of U.S. federal net operating losses permitted under the CARES Act, and lower required instalment payments in Canada.
For 2021, the Company's net income tax payments are expected to be approximately $800 million. Excluding the aforementioned U.S. income tax refund, the increase is primarily due to higher required instalment payments in Canada.
Investing activities
Net cash used in investing activities decreased by $1,244 million in 2020, mainly as a result of lower property additions in 2020 compared to the
record 2019 capital expenditure program and the Company's acquisitions of TransX and H&R in 2019.
Property additions
In millions Year ended December 31, 2020 2019
Track and roadway (1) $ 1,842 $ 2,262
Rolling stock 478 999
Buildings 103 87
Information technology 301 421
Other 139 310
Gross property additions 2,863 4,079
Less: Finance leases (2) 214
Property additions (3) 2,863 $ 3,865
(1) In 2020, approximately 76% (2019 - 65%) of the Track and roadway property additions were incurred to renew basic infrastructure. Costs relating to normal repairs and maintenance of Track and roadway properties are expensed as incurred, and amounted to approximately11% of the Company's total operating expenses in 2020 (2019 -11%).
(2) Includes re-measurement of finance leases.
(3) Includes $141 million associated with the U.S. federal government legislative PTC implementation in 2020 (2019 - $227 million).
Disposal of property In 2020 and 2019, there were no significant disposals of property. Additional information relating to disposals of property is provided in Note 6 — Other income to the Company's 2020 Annual Consolidated Financial Statements.
Acquisitions
On December 2, 2019, the Company acquired H&R for a total purchase price of $105 million, consisting of $95 million cash paid on the closing
date and subsequent consideration of $10 million mostly related to funds withheld for the indemnification of claims, of which $2 million
remains to be paid.
32 CN 12020 Annual Report

Management's Discussion and Analysis
The allocation of the purchase price to the assets acquired and liabilities assumed was performed on the basis of their respective fair values. The Company used a third party to assist in establishing the fair values of the assets acquired and liabilities assumed which resulted in
the recognition of identifiable net assets of $93 million and goodwill of $12 million. The goodwill acquired through the business combination is
mainly attributable to the premium of an established business operation. The Company's purchase price allocation is now final.
The Company's Consolidated Balance Sheets include the assets and liabilities of H&R as of December 2, 2019, the acquisition date. Since
the acquisition date, H&R's results of operations have been included in the Company's results of operations. The Company has not provided pro forma information relating to the pre-acquisition period as it was not material.
On March 20, 2019, the Company acquired TransX. The total purchase price of $192 million included an initial cash payment of $170 million and additional consideration of $25 million paid on August 27, 2019 upon achievement of targets, less an adjustment of $3 million in the
fourth quarter of 2019 to reflect the settlement of working capital.
The allocation of the purchase price to the assets acquired and liabilities assumed was performed on the basis of their respective fair
values. The Company used a third party to assist in establishing the fair values of the assets acquired and liabilities assumed which resulted in
the recognition of identifiable net assets of $134 million and goodwill of $58 million. The goodwill acquired through the business combination
is mainly attributable to the premium of an established business operation. The Company's purchase price allocation is now final.
The Company's Consolidated Balance Sheets include the assets and liabilities of TransX as of March 20, 2019, the acquisition date. Since the acquisition date, TransX's results of operations have been included in the Company's results of operations. The Company has not provided pro forma information relating to the pre-acquisition period as it was not material.
Additional information relating to the acquisitions is provided in Note 3 - Business combinations to the Company's 2020 Annual Consolidated
Financial Statements.
2021 Capital expenditure program
In 2021, the Company expects to invest approximately $3.0 billion in its capital program, which will be financed with cash generated from operations or with cash from financing activities as required, as outlined below:
• $1.6 billion on track and railway infrastructure maintenance to support safe and efficient operations, including the replacement of rail and
ties, as well as bridge improvements and other general asset maintenance; • $1.2 billion on initiatives to increase capacity and enable growth, such as track infrastructure expansion, investments in yards and
intermodal terminals, and on information technology to improve safety performance, operational efficiency and customer service; and • $0.2 billion on equipment capital expenditures, allowing the Company to tap growth opportunities and improve the quality of the fleet. In
order to handle expected traffic increase and improve operational efficiency, CN expects to take delivery of 491 new grain hopper cars in
the first quarter of 2021.
Financing activities Net cash used in financing activities increased by $804 million in 2020, primarily driven by higher net repayment of debt; partly offset by lower
repurchases of common shares.
Debt financing activities Debt financing activities in 2020 included the following:
• On May 1, 2020, issuance of US$600 million ($837 million) 2.45% Notes due 2050 in the U.S. capital markets, which resulted in net
proceeds of $810 million;
• On February 3, 2020, repayment of US$300 million ($397 million) 2.40% Notes due 2020 upon maturity;
• On February 3, 2020, issuance of US$300 million ($397 million) equipment loan under the non-revolving credit facility;
• On December 1, 2020, issuance of US$25 million ($32 million) equipment loan;
• Repayment of equipment loan under the non-revolving credit facility of $15 million;
• Net repayment of commercial paper of $1,273 million;
• Proceeds from borrowings under the accounts receivable securitization program of $450 million;
• Repayment of borrowings under the accounts receivable securitization program of $650 million;
• Proceeds from borrowings under revolving credit facility agreement of $100 million;
• Repayment of borrowings under revolving credit facility agreement of $100 million; and
• Repayment of finance leases of $59 million.
2020 Annual Report 33

Management's Discussion and Analysis
Debt financing activities in 2019 included the following: • On November 1, 2019, issuance of $450 million 3.05% Notes due 2050 in the Canadian capital markets, which resulted in net proceeds of
$443 million;
• On February 8, 2019, issuance of $350 million 3.00% Notes due 2029 and $450 million 3.60% Notes due 2049 in the Canadian capital
markets, which resulted in total net proceeds of $790 million;
• Net issuance of commercial paper of $141 million;
• Proceeds from borrowings under the accounts receivable securitization program of $420 million;
• Repayment of borrowings under the accounts receivable securitization program of $220 million; and
• Repayment of finance leases of $162 million.
Cash obtained from the issuance of debt was used for general corporate purposes, including the redemption and refinancing of outstanding
indebtedness, share repurchases, acquisitions and other business opportunities. Additional information relating to the Company's outstanding
debt securities is provided in Note 15 — Debt to the Company's 2020 Annual Consolidated Financial Statements.
Repurchase of common shares
The Company may repurchase its common shares pursuant to a NCIB at prevailing market prices plus brokerage fees, or such other prices as may be permitted by the Toronto Stock Exchange (TSX). The Company repurchased 2.0 million common shares under its NCIB effective
between February 1, 2020 and January 31, 2021, which allowed for the repurchase of up to 16.0 million common shares.
Previous NCIBs allowed for the repurchase of up to 22.0 million common shares between February 1, 2019 and January 31, 2020, and up
to 5.5 million common shares between October 30, 2018 and January 31, 2019. The following table provides the information related to the share repurchases for the years ended December 31, 2020, 2019 and 2018:
In millions, except per share data Year ended December 31, 2020 2019 2018 Total NCIB
February 2020 - January 2021 NCIB Number of common shares 2.0 N/A N/A 2.0 Weighted-average price per share (1) $ 113.56 N/A N/A $ 113.56 Amount of repurchase (1) $ 226 N/A N/A $ 226
February 2019 - January 2020 NCIB Number of common shares 1.3 12.8 N/A 14.1 Weighted-average price per share (1) $ 122.38 $ 120.03 N/A $ 120.24 Amount of repurchase (1) $ 153 $ 1,547 N/A $ 1,700
October 2018 - January 2019 NCIB Number of common shares N/A 1.5 2.6 4.1 Weighted-average price per share (1) N/A $ 106.78 $ 109.92 $ 108.82 Amount of repurchase (1) N/A $ 153 $ 293 $ 446
Total for the year Number of common shares 3.3 14.3 19.0 (2)Weighted-average price per share (1) $ 116.97 $ 118.70 $ 104.99 (2)Amount of repurchase (1) $ 379 $ 1,700 $ 2,000 (2)
(1) Includes brokerage fees. (2) Includes 2018 repurchases from the October 2017 - October 2018 NCIB, which consisted of 16.4 million common shares, a weighted-average price per share of $104.19
and an amount of repurchase of $1,707 million.
On January 26, 2021, the Board of Directors of the Company approved a new NCIB, which allows for the repurchase of up to 14 million common
shares between February 1, 2021 and January 31, 2022. The Company expects to resume its share repurchases in the first quarter of 2021
under the new NCIB.
The Company's NCIB notices may be found online on SEDAR at www.sedar.com and on the SEC's website at www.sec.gov through EDGAR.
Printed copies may be obtained by contacting the Corporate Secretary's Office.
34 CN 12020 Annual Report
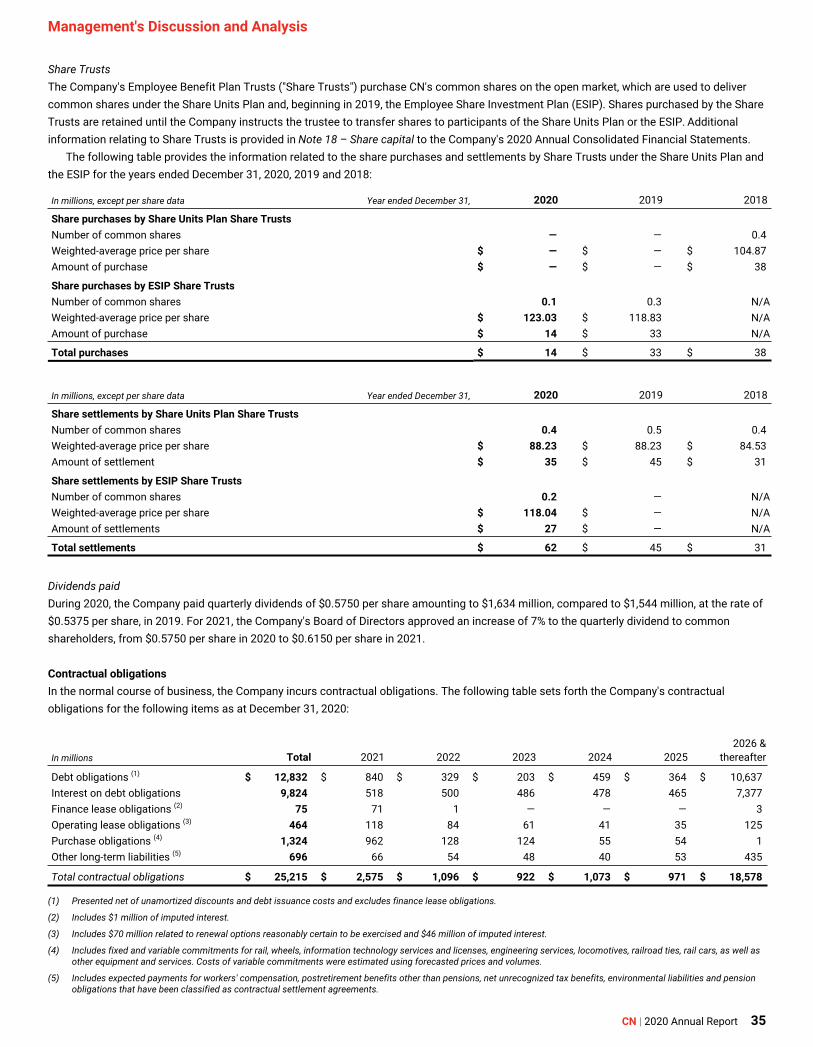
Management's Discussion and Analysis
Share Trusts
The Company's Employee Benefit Plan Trusts ("Share Trusts") purchase CN's common shares on the open market, which are used to deliver
common shares under the Share Units Plan and, beginning in 2019, the Employee Share Investment Plan (ESIP). Shares purchased by the Share
Trusts are retained until the Company instructs the trustee to transfer shares to participants of the Share Units Plan or the ESIP. Additional
information relating to Share Trusts is provided in Note 18 — Share capital to the Company's 2020 Annual Consolidated Financial Statements.
The following table provides the information related to the share purchases and settlements by Share Trusts under the Share Units Plan and
the ESIP for the years ended December 31, 2020, 2019 and 2018:
In millions, except per share data Year ended December 31, 2020 2019 2018
Share purchases by Share Units Plan Share Trusts
Number of common shares
Weighted-average price per share
Amount of purchase
Share purchases by ESIP Share Trusts
Number of common shares
Weighted-average price per share
—
$ —
$ —
0.1
$ 123.03
—
$ —
$ —
0.3
$ 118.83
0.4
$ 104.87
$ 38
N/A
N/A
Amount of purchase $ 14 $ 33 N/A
Total purchases 14 $ 33 $ 38
In millions, except per share data Year ended December 31, 2020 2019 2018
Share settlements by Share Units Plan Share Trusts
Number of common shares 0.4 0.5 0.4
Weighted-average price per share $ 88.23 $ 88.23 $ 84.53
Amount of settlement $ 35 $ 45 $ 31
Share settlements by ESIP Share Trusts
Number of common shares 0.2 — N/A
Weighted-average price per share $ 118.04 $ — N/A
Amount of settlements $ 27 $ — N/A
Total settlements 62 $ 45 $ 31
Dividends paid
During 2020, the Company paid quarterly dividends of $0.5750 per share amounting to $1,634 million, compared to $1,544 million, at the rate of
$0.5375 per share, in 2019. For 2021, the Company's Board of Directors approved an increase of 7% to the quarterly dividend to common
shareholders, from $0.5750 per share in 2020 to $0.6150 per share in 2021.
Contractual obligations
In the normal course of business, the Company incurs contractual obligations. The following table sets forth the Company's contractual
obligations for the following items as at December 31, 2020:
2026 & In millions Total 2021 2022 2023 2024 2025 thereafter
Debt obligations (1) $ 12,832 $ 840 $ 329 $ 203 $ 459 $ 364 $ 10,637 Interest on debt obligations 9,824 518 500 486 478 465 7,377
Finance lease obligations (2) 75 71 1 — — — 3
Operating lease obligations (3) 464 118 84 61 41 35 125 Purchase obligations (4) 1,324 962 128 124 55 54 1 Other long-term liabilities (5) 696 66 54 48 40 53 435
Total contractual obligations $ 25,215 $ 2,575 $ 1,096 $ 922 $ 1,073 $ 971 $ 18,578
(1) Presented net of unamortized discounts and debt issuance costs and excludes finance lease obligations.
(2) Includes $1 million of imputed interest.
(3) Includes $70 million related to renewal options reasonably certain to be exercised and $46 million of imputed interest.
(4) Includes fixed and variable commitments for rail, wheels, information technology services and licenses, engineering services, locomotives, railroad ties, rail cars, as well as other equipment and services. Costs of variable commitments were estimated using forecasted prices and volumes.
(5) Includes expected payments for workers' compensation, postretirement benefits other than pensions, net unrecognized tax benefits, environmental liabilities and pension obligations that have been classified as contractual settlement agreements.
2020 Annual Report 35

Management's Discussion and Analysis
Adjusted debt-to-adjusted EBITDA multiple
Management believes that the adjusted debt-to-adjusted EBITDA multiple is a useful credit measure because it reflects the Company's ability to
service its debt and other long-term obligations. The Company calculates the adjusted debt-to-adjusted EBITDA multiple as adjusted debt
divided by adjusted EBITDA. These measures do not have any standardized meaning prescribed by GAAP and therefore, may not be
comparable to similar measures presented by other companies. The following table provides a reconciliation of debt and net income in accordance with GAAP, as reported for the years ended
December 31, 2020, 2019 and 2018, to the adjusted measures presented herein, which have been used to calculate the non-GAAP adjusted
debt-to-adjusted EBITDA multiple:
In millions, unless otherwise indicated As at and for the year ended December 31, 2020 2019 2018
Debt
Adjustments:
Operating lease liabilities, including current portion (1)
Pension plans in deficiency
$ 12,906
418
553
$ 13,796
501
521
$ 12,569
579
477
Adjusted debt 13,877 $ 14,818 $ 13,625
Net income 3,562 4,216 4,328
Interest expense 554 538 489
Income tax expense 982 1,213 1,354
Depreciation and amortization 1,589 1,562 1,329
EBITDA 6,687 7,529 7,500
Adjustments:
Loss on assets held for sale 486
Other income (6) (53) (376)
Other components of net periodic benefit income (315) (321) (302)
Operating lease cost (1) 143 171 218
Adjusted EBITDA 6,995 $ 7,326 $ 7,040
Adjusted debt-to-adjusted EBITDA multiple (times) 1.98 2.02 1.94
(1) The Company adopted Accounting Standards Update (ASU) 2016-02: Leases and related amendments (Topic 842) in the first quarter of 2019. The Company now includes operating lease liabilities, as defined by Topic 842, in adjusted debt and excludes operating lease cost, as defined by Topic 842, in adjusted EBITDA. Comparative balances previously referred to as present value of operating lease commitments and operating lease expense have not been adjusted and are now referred to as operating lease liabilities and operating lease cost, respectively. See Note 12 - Leases to the Company's 2020 Annual Consolidated Financial Statements for additional information.
All forward-looking statements discussed in this section are subject to risks and uncertainties and are based on assumptions about events and
developments that may not materialize or that may be offset entirely or partially by other events and developments. See the section of this
MD&A entitled Forward-looking statements for a discussion of assumptions and risk factors affecting such forward-looking statements.
36 CN 12020 Annual Report

Management's Discussion and Analysis
Off balance sheet arrangements
Guarantees and indemnifications
In the normal course of business, the Company enters into agreements that may involve providing guarantees or indemnifications to third
parties and others, which may extend beyond the term of the agreements. These include, but are not limited to, standby letters of credit, surety
and other bonds, and indemnifications that are customary for the type of transaction or for the railway business. As at December 31, 2020, the
Company has not recorded a liability with respect to guarantees and indemnifications. Additional information relating to guarantees and indemnifications is provided in Note 21 — Major commitments and contingencies to the Company's 2020 Annual Consolidated Financial
Statements.
Outstanding share data
As at February 1, 2021, the Company had 710.3 million common shares and 4.3 million stock options outstanding.
Financial instrument
Risk management
In the normal course of business, the Company is exposed to various risks from its use of financial instruments. To manage these risks, the Company follows a financial risk management framework, which is monitored and approved by the Company's Finance Committee, with a goal of maintaining a strong balance sheet, optimizing earnings per share and free cash flow, financing its operations at an optimal cost of capital and preserving its liquidity. The Company has limited involvement with derivative financial instruments in the management of its risks and does
not hold or issue them for trading or speculative purposes.
Credit risk
Credit risk arises from cash and temporary investments, accounts receivable and derivative financial instruments. To manage credit risk associated with cash and temporary investments, the Company places these financial assets with governments, major financial institutions, or
other creditworthy counterparties, and performs ongoing reviews of these entities. To manage credit risk associated with accounts receivable,
the Company reviews the credit history of each new customer, monitors the financial condition and credit limits of its customers, and keeps the
average daily sales outstanding within an acceptable range. The Company works with customers to ensure timely payments, and in certain
cases, requires financial security, including letters of credit. CN also obtains credit insurance for certain high risk customers. Although the
Company believes there are no significant concentrations of customer credit risk, economic conditions can affect the Company's customers
and can result in an increase to the Company's credit risk and exposure to business failures of its customers. A widespread deterioration of
customer credit and business failures of customers could have a material adverse effect on the Company's results of operations, financial position or liquidity. The Company considers the risk due to the possible non-performance by its customers to be remote.
The Company has limited involvement with derivative financial instruments, however from time to time, it may enter into derivative
financial instruments to manage its exposure to interest rates or foreign currency exchange rates. To manage the counterparty risk associated with the use of derivative financial instruments, the Company enters into contracts with major financial institutions that have been accorded
investment grade ratings. Though the Company is exposed to potential credit losses due to non-performance of these counterparties, the
Company considers this risk to be remote.
Liquidity risk
Liquidity risk is the risk that sufficient funds will not be available to satisfy financial obligations as they come due. In addition to cash generated from operations, which represents its principal source of liquidity, the Company manages liquidity risk by aligning other external sources of
funds which can be obtained upon short notice, such as revolving credit facilities, commercial paper programs, and an accounts receivable
securitization program. As well, the Company can issue debt securities in the Canadian and U.S. capital markets under its shelf prospectus and
registration statement. The Company's access to long-term funds in the debt capital markets depends on its credit ratings and market
conditions. The Company believes that its investment grade credit ratings contribute to reasonable access to capital markets. See the section of this MD&A entitled Liquidity and capital resources for additional information relating to the Company's available financing sources and its
credit ratings.
2020 Annual Report 37

Management's Discussion and Analysis
Foreign currency risk
The Company conducts its business in both Canada and the U.S. and as a result, is affected by currency fluctuations. Changes in the exchange
rate between the Canadian dollar and the US dollar affect the Company's revenues and expenses. To manage foreign currency risk, the
Company designates US dollar-denominated debt of the parent company as a foreign currency hedge of its net investment in foreign
operations. As a result, from the dates of designation, foreign exchange gains and losses on translation of the Company's US dollar-
denominated debt are recorded in Accumulated other comprehensive loss, which minimizes volatility of earnings resulting from the conversion
of US dollar-denominated debt into the Canadian dollar.
The Company also enters into foreign exchange forward contracts to manage its exposure to foreign currency risk. As at December 31, 2020, the Company had outstanding foreign exchange forward contracts with a notional value of US$397 million (2019 - US$1,088 million).
Changes in the fair value of foreign exchange forward contracts, resulting from changes in foreign exchange rates, are recognized in Other
income in the Consolidated Statements of Income as they occur. For the year ended December 31, 2020, the Company recorded a loss of $3 million (2019 - loss of $75 million; 2018 - gain of $157 million), related to foreign exchange forward contracts. These gains and losses were
largely offset by the re-measurement of US dollar-denominated monetary assets and liabilities recognized in Other income. As at December 31,
2020, the fair value of outstanding foreign exchange forward contracts included in Other current assets and Accounts payable and other was $nil and $18 million, respectively (2019 - $nil and $24 million, respectively).
The estimated annual impact on net income of a one-cent change in the Canadian dollar relative to the US dollar is approximately $35 million.
Interest rate risk
The Company is exposed to interest rate risk, which is the risk that the fair value or future cash flows of a financial instrument will vary as a
result of changes in market interest rates. Such risk exists in relation to the Company's debt. The Company mainly issues fixed-rate debt, which
exposes the Company to variability in the fair value of the debt. The Company also issues debt with variable interest rates, which exposes the Company to variability in interest expense.
To manage interest rate risk, the Company manages its borrowings in line with liquidity needs, maturity schedule, and currency and interest
rate profile. In anticipation of future debt issuances, the Company may use derivative instruments such as forward rate agreements. The
Company does not currently hold any significant derivative instruments to manage its interest rate risk.
The estimated annual impact on net income of a one-percent change in the interest rate on floating rate debt is approximately $10 million.
Commodity price risk
The Company is exposed to commodity price risk related to purchases of fuel and the potential reduction in net income due to increases in the price of diesel. Fuel prices are impacted by geopolitical events, changes in the economy or supply disruptions. Fuel shortages can occur due to
refinery disruptions, production quota restrictions, climate, and labor and political instability.
The Company manages fuel price risk by offsetting the impact of rising fuel prices with the Company's fuel surcharge program. The
surcharge applied to customers is determined in the second calendar month prior to the month in which it is applied, and is generally calculated using the average monthly price of On-Highway Diesel, and, to a lesser extent, West-Texas Intermediate crude oil.
While the Company's fuel surcharge program provides effective coverage, residual exposure remains given that fuel price risk cannot be
completely managed due to timing and given the volatility in the market. As such, the Company may enter into derivative instruments to manage such risk when considered appropriate.
Fair value of financial instruments
The financial instruments that the Company measures at fair value on a recurring basis in periods subsequent to initial recognition are categorized into the following levels of the fair value hierarchy based on the degree to which inputs are observable:
• Level 1: Inputs are quoted prices for identical instruments in active markets • Level 2: Significant inputs (other than quoted prices included in Level 1) are observable • Level 3: Significant inputs are unobservable
The carrying amounts of Cash and cash equivalents and Restricted cash and cash equivalents approximate fair value. These financial instruments include highly liquid investments purchased three months or less from maturity, for which the fair value is determined by reference
to quoted prices in active markets.
The carrying amounts of Accounts receivable, Other current assets and Accounts payable and other approximate fair value due to their
short maturity, unless otherwise specified. The fair value of derivative financial instruments, included in Other current assets and Accounts
payable and other is classified as Level 2 and is used to manage the Company's exposure to foreign currency risk. The fair value is measured by
discounting future cash flows using a discount rate derived from market data for financial instruments subject to similar risks and maturities.
38 CN 12020 Annual Report

Management's Discussion and Analysis
The fair value of assets held for sale, included in Other current assets is classified as Level 3. Additional disclosures are provided in Note 5 —Assets held for sale to the Company's 2020 Annual Consolidated Financial Statements.
The carrying amount of the Company's debt does not approximate fair value. The fair value is estimated based on quoted market prices for
the same or similar debt instruments, as well as discounted cash flows using current interest rates for debt with similar terms, company rating, and remaining maturity. The Company classifies debt as Level 2. As at December 31, 2020, the Company's debt, excluding finance leases, had a carrying amount of $12,832 million (2019 - $13,662 million) and a fair value of $16,046 million (2019 - $15,667 million).
Recent accounting pronouncements
The following recent ASU issued by the Financial Accounting Standards Board (FASB) was adopted by the Company during the current year:
ASU 2016-13 Financial instruments - Credit losses (Topic 326): Measurement of credit losses on financial instruments
The ASU requires financial assets measured at amortized cost to be presented at the net amount expected to be collected. The new standard replaces the current incurred loss impairment methodology with one that reflects expected credit losses.
The Company adopted this standard in the first quarter of 2020 with an effective date of January 1, 2020. The adoption of this standard did
not have an impact on the Company's Consolidated Financial Statements, other than the update to the Accounts receivable accounting policy in
Note 1- Summary of significant accounting policies to the Company's 2020 Annual Consolidated Financial Statements.
The following recent ASU issued by FASB came into effect during the current year and has not been adopted by the Company:
ASU 2020-04 Reference rate reform (Topic 848): Facilitation of the effects of reference rate reform on financial reporting London Interbank Offered Rate (LIBOR) is a benchmark interest rate referenced in a variety of agreements that are used by all types of entities. At the end of 2021, banks will no longer be required to report information that is used to determine LIBOR. As a result, LIBOR could be
discontinued. Other interest rates used globally could also be discontinued for similar reasons.
The ASU provides optional expedients and exceptions for applying generally accepted accounting principles to transactions affected by
reference rate reform if certain criteria are met. These transactions include contract modifications, hedging relationships, and sale or transfer of
debt securities classified as held-to-maturity.
The provisions of the ASU are effective starting on March 12, 2020; however, they will only be available until December 31, 2022, when the
reference rate replacement activity is expected to be completed. The Company may apply the provisions of the ASU as of the beginning of a
reporting period when the elections are made, or prospectively from the date within an interim period that includes or is subsequent to
March 12, 2020. The Company currently has outstanding loans and finance lease obligations referencing LIBOR totaling approximately
US$325 million that would be affected by the provisions of this ASU. The Company is evaluating the effects that the adoption of the ASU will
have on its Consolidated Financial Statements and related disclosures, and whether it will elect to apply any of the optional expedients and
exceptions provided in the ASU.
The following recent ASU issued by FASB has an effective date after December 31, 2020 and has not been adopted by the Company:
ASU 2019-12 Income taxes (Topic 740): Simplifying the accounting for income taxes
The ASU adds new guidance to simplify accounting for income taxes, changes the accounting for certain income tax transactions and makes minor improvements to the codification. The ASU introduces new guidance that provides a policy election to not allocate consolidated income
taxes when a member of a consolidated tax return is not subject to income tax, and provides guidance to evaluate whether a step-up in tax
basis of goodwill relates to a business combination in which book goodwill was recognized or a separate transaction. In addition, the ASU
changes the current guidance by making an intraperiod allocation if there is a loss in continuing operations and gains outside of continuing
operations; by determining when a deferred tax liability is recognized after an investor in a foreign entity transitions to or from the equity method of accounting; by accounting for tax law changes and year-to-date losses in interim periods; and by determining how to apply the
income tax guidance to franchise taxes and other taxes that are partially based on income. The ASU is effective for annual and any interim period beginning after December 15, 2020. Early adoption is permitted.
The Company has evaluated the effects that the adoption of the ASU will have on its Consolidated Financial Statements and has
concluded it will not have a significant impact.
Other recently issued ASUs required to be applied for periods beginning on or after January 1, 2021 have been evaluated by the Company and
are not expected to have a significant impact on the Company's Consolidated Financial Statements.
2020 Annual Report 39

Management's Discussion and Analysis
Critical accounting estimates
The preparation of financial statements in accordance with GAAP requires management to make estimates, judgments and assumptions that
affect the reported amounts of revenues, expenses, assets and liabilities, and the disclosure of contingent assets and liabilities at the date of
the financial statements. On an ongoing basis, management reviews its estimates based upon available information. Actual results could differ
from these estimates. The Company's policies for income taxes, capital expenditures, depreciation, pensions and other postretirement benefits, personal injury and other claims and environmental matters, require managements more significant judgments and estimates in the
preparation of the Company's consolidated financial statements and, as such, are considered to be critical. The following information should be read in conjunction with the Company's 2020 Annual Consolidated Financial Statements and Notes thereto.
Management discusses the development and selection of the Company's critical accounting policies, including the underlying estimates
and assumptions, with the Audit Committee of the Company's Board of Directors. The Audit Committee has reviewed the Company's related
disclosures.
Income taxes
The Company follows the asset and liability method of accounting for income taxes. Under the asset and liability method, the change in the net
deferred income tax asset or liability is included in the computation of Net income or Other comprehensive income (loss). Deferred income tax
assets and liabilities are measured using enacted income tax rates expected to apply to taxable income in the years in which temporary differences are expected to be recovered or settled. As a result, a projection of taxable income is required for those years, as well as an
assumption of the ultimate recovery/settlement period for temporary differences. The projection of future taxable income is based on
managements best estimate and may vary from actual taxable income.
On an annual basis, the Company assesses the need to establish a valuation allowance for its deferred income tax assets, and if it is
deemed more likely than not that its deferred income tax assets will not be realized, a valuation allowance is recorded. The ultimate realization
of deferred income tax assets is dependent upon the generation of sufficient future taxable income, of the necessary character, during the
periods in which those temporary differences become deductible. Management considers the scheduled reversals of deferred income tax liabilities, the available carryback and carryforward periods, and projected future taxable income in making this assessment. As at December 31, 2020, in order to fully realize all of the deferred income tax assets, the Company will need to generate future taxable income of approximately $2.7 billion, and, based upon the level of historical taxable income, projections of future taxable income of the necessary
character over the periods in which the deferred income tax assets are deductible, and the reversal of taxable temporary differences,
management believes, following an assessment of the current economic environment, it is more likely than not that the Company will realize
the benefits of these deductible differences.
In addition, Canadian, or domestic, tax rules and regulations, as well as those relating to foreign jurisdictions, are subject to interpretation and require judgment by the Company that may be challenged by the taxation authorities upon audit of the filed income tax returns. Tax
benefits are recognized if it is more likely than not that the tax position will be sustained on examination by the taxation authorities. As at
December 31, 2020, the total amount of gross unrecognized tax benefits was $92 million, before considering tax treaties and other
arrangements between taxation authorities. The amount of net unrecognized tax benefits as at December 31, 2020 was $67 million. If
recognized, $16 million of the net unrecognized tax benefits as at December 31, 2020 would affect the effective tax rate. The Company believes
that it is reasonably possible that $15 million of the net unrecognized tax benefits as at December 31, 2020 related to Canadian federal and provincial income tax matters, may be recognized over the next twelve months as a result of settlements and a lapse of the applicable statute of limitations, and will not affect the effective tax rate as they relate to temporary differences.
The Company's deferred income tax assets are mainly composed of temporary differences related to the pension liability, lease liabilities,
net operating losses and tax credit carryforwards, accruals for personal injury and other claims, other postretirement benefits liability, and
compensation reserves. The Company's deferred income tax liabilities are mainly composed of temporary differences related to properties, the
pension asset and operating lease right-of-use assets. These deferred income tax assets and liabilities are recorded at the enacted tax rates of
the periods in which the related temporary differences are expected to reverse. As a result, fiscal budget changes and/or changes in income tax laws that affect a change in the timing, the amount, and/or the income tax rate at which the temporary difference components will reverse, could materially affect deferred income tax expense as recorded in the Company's results of operations. The reversal of temporary differences
is expected at future-enacted income tax rates which could change due to fiscal budget changes and/or changes in income tax laws. As a result, a change in the timing and/or the income tax rate at which the components will reverse, could materially affect deferred income tax
expense as recorded in the Company's results of operations. From time to time, the federal, provincial, and state governments enact new corporate income tax rates resulting in either lower or higher tax liabilities. A one-percentage-point change in the Canadian and U.S. statutory
federal tax rate would have the effect of changing the deferred income tax expense by $169 million and $141 million in 2020, respectively.
For the year ended December 31, 2020, the Company recorded an income tax expense of $982 million, of which $487 million was a
deferred income tax expense. The current income tax expense included a recovery of $141 million resulting from the enactment of the CARES
40 CN 12020 Annual Report

Management's Discussion and Analysis
Act. For the year ended December 31, 2019, the Company recorded an income tax expense of $1,213 million, of which $569 million was a
deferred income tax expense. The deferred income tax expense included a recovery of $112 million resulting from the enactment of a lower
provincial corporate income tax rate. For the year ended December 31, 2018, the Company recorded total income tax expense of $1,354 million,
of which $527 million was a deferred income tax expense. The Company's net deferred income tax liability as at December 31, 2020 was $8,271
million (2019 - $7,844 million). Additional disclosures are provided in Note 7 — Income taxes to the Company's 2020 Annual Consolidated
Financial Statements.
Depreciation Properties are carried at cost less accumulated depreciation including asset impairment write-downs. The Company has a process in place to
determine whether or not costs qualify for capitalization, which requires judgment. The cost of properties, including those under finance leases,
net of asset impairment write-downs, is depreciated on a straight-line basis over their estimated service lives, measured in years, except for rail
and ballast whose services lives are measured in millions of gross tons. The Company follows the group method of depreciation whereby a
single composite depreciation rate is applied to the gross investment in a class of similar assets, despite small differences in the service life or
salvage value of individual property units within the same asset class. The Company uses approximately 40 different depreciable asset classes.
For all depreciable assets, the depreciation rate is based on the estimated service lives of the assets. Assessing the reasonableness of the estimated service lives of properties requires judgment and is based on currently available information, including periodic depreciation studies
conducted by the Company. The Company's U.S. properties are subject to comprehensive depreciation studies as required by the STB and are
conducted by external experts. Depreciation studies for Canadian properties are not required by regulation and are conducted internally. Studies
are performed on specific asset groups on a periodic basis. Changes in the estimated service lives of the assets and their related composite
depreciation rates are implemented prospectively.
The studies consider, among other factors, the analysis of historical retirement data using recognized life analysis techniques, and the
forecasting of asset life characteristics. Changes in circumstances, such as technological advances, changes to the Company's business
strategy, changes in the Company's capital strategy or changes in regulations can result in the actual service lives differing from the Company's
estimates. A change in the remaining service life of a group of assets, or their estimated net salvage value, will affect the depreciation rate used to
amortize the group of assets and thus affect depreciation expense as reported in the Company's results of operations. A change of one year in
the composite service life of the Company's fixed asset base would impact annual depreciation expense by approximately $63 million.
Depreciation studies are a means of ensuring that the assumptions used to estimate the service lives of particular asset groups are still
valid and where they are not, they serve as the basis to establish the new depreciation rates to be used on a prospective basis. In 2020, the
Company completed depreciation studies for equipment properties and as a result, the Company changed the estimated service lives for
various types of equipment assets and their related composite depreciation rates. The results of these depreciation studies did not materially
affect the Company's annual depreciation expense. Given the nature of the railroad and the composition of its network which is made up of homogeneous long-lived assets, it is impractical to
maintain records of specific properties at their lowest unit of property.
Retirements of assets occur through the replacement of an asset in the normal course of business, the sale of an asset or the
abandonment of a section of track. For retirements in the normal course of business, generally the life of the retired asset is within a reasonable
range of the expected useful life, as determined in the depreciation studies, and, as such, no gain or loss is recognized under the group method.
The assets cost is removed from the asset account and the difference between its cost and estimated related accumulated depreciation (net
of salvage proceeds), if any, is recorded as an adjustment to accumulated depreciation and no gain or loss is recognized. The historical cost of the retired asset is estimated by using deflation factors or indices that closely correlate to the properties comprising the asset classes in
combination with the estimated age of the retired asset using a first-in, first-out approach, and applying it to the replacement value of the asset.
In each depreciation study, an estimate is made of any excess or deficiency in accumulated depreciation for all corresponding asset
classes to ensure that the depreciation rates remain appropriate. The excess or deficiency in accumulated depreciation is amortized over the remaining life of the asset class.
For retirements of depreciable properties that do not occur in the normal course of business, the historical cost, net of salvage proceeds, is
recorded as a gain or loss in income. A retirement is considered not to be in the normal course of business if it meets the following criteria: (i) it is unusual, (ii) it is significant in amount, and (iii) it varies significantly from the retirement pattern identified through depreciation studies. A
gain or loss is recognized in Other income for the sale of land or disposal of assets that are not part of railroad operations. For the year ended December 31, 2020, the Company recorded total depreciation expense of $1,583 million (2019 - $1,559 million; 2018 -
$1,327 million). As at December 31, 2020, the Company had Properties of $40,069 million, net of accumulated depreciation of $14,443 million
(2019 - $39,669 million, net of accumulated depreciation of $13,912 million). Additional disclosures are provided in Note 11 — Properties to the
Company's 2020 Annual Consolidated Financial Statements.
2020 Annual Report 41

Management's Discussion and Analysis
GAAP requires the use of historical cost as the basis of reporting in financial statements. As a result, the cumulative effect of inflation, which has significantly increased asset replacement costs for capital-intensive companies such as CN, is not reflected in operating expenses.
Depreciation charges on an inflation-adjusted basis, assuming that all operating assets are replaced at current price levels, would be
substantially greater than historically reported amounts.
Pensions and other postretirement benefits
The Company's plans have a measurement date of December 31. The following table provides the Company's pension asset, pension liability
and other postretirement benefits liability as at December 31, 2020, and 2019:
In millions December31, 2020 2019
Pension asset Pension liability Other postretirement benefits liability
777 553 228
336 521 227
The descriptions in the following paragraphs pertaining to pensions relate generally to the Company's main pension plan, the CN Pension Plan,
unless otherwise specified.
Calculation of net periodic benefit cost (income)
In accounting for pensions and other postretirement benefits, assumptions are required for, among other things, the discount rate, the expected
long-term rate of return on plan assets, the rate of compensation increase, health care cost trend rates, mortality rates, employee early
retirements, terminations and disability. Changes in these assumptions result in actuarial gains or losses, which are recognized in Other
comprehensive income (loss). The Company generally amortizes these gains or losses into net periodic benefit cost (income) over the
expected average remaining service life of the employee group covered by the plans only to the extent that the unrecognized net actuarial gains and losses are in excess of the corridor threshold, which is calculated as 10% of the greater of the beginning-of-year balances of the projected
benefit obligation or market-related value of plan assets. The Company's net periodic benefit cost (income) for future periods is dependent on
demographic experience, economic conditions and investment performance. Recent demographic experience has revealed no material net
gains or losses on termination, retirement, disability and mortality. Experience with respect to economic conditions and investment
performance is further discussed herein.
For the years ended December 31, 2020, 2019 and 2018, the consolidated net periodic benefit cost (income) for pensions and other
postretirement benefits were as follows:
In millions Year ended December31, 2020 2019 2018
Net periodic benefit income for pensions (141) $ (183) $ (139) Net periodic benefit cost for other postretirement benefits 3 $ 7 $ 9
As at December 31, 2020 and 2019, the projected pension benefit obligation and accumulated other postretirement benefit obligation were
as follows:
In millions December 31, 2020 2019
Projected pension benefit obligation Accumulated other postretirement benefit obligation
$ 19,499 $ 18,609 228 $ 227
Discount rate assumption
The Company's discount rate assumption, which is set annually at the end of each year, is determined by management with the aid of third-party actuaries. The discount rate is used to measure the single amount that, if invested at the measurement date in a portfolio of high-quality
debt instruments with a rating of AA or better, would provide the necessary cash flows to pay for pension benefits as they become due. For the
Canadian pension and other postretirement benefit plans, future expected benefit payments are discounted using spot rates based on a derived
AA corporate bond yield curve for each maturity year. A year-end discount rate of 2.55% based on bond yields prevailing at December 31, 2020
(2019 - 3.10%) was considered appropriate by the Company.
The Company uses the spot rate approach to measure current service cost and interest cost for all defined benefit pension and other
postretirement benefit plans. Under the spot rate approach, individual spot discount rates along the same yield curve used in the determination of the projected benefit obligation are applied to the relevant projected cash flows for current service cost at the relevant maturity. More
specifically, current service cost is measured using the cash flows related to benefits expected to be accrued in the following year by active
42 CN 12020 Annual Report
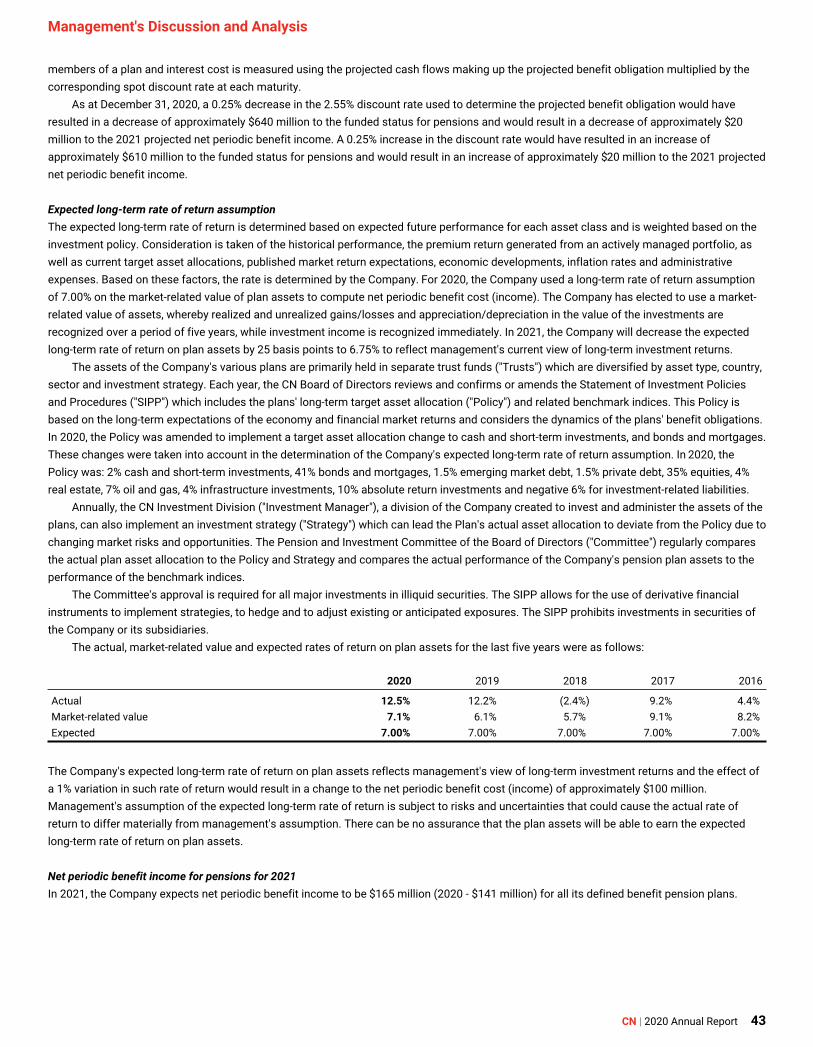
Management's Discussion and Analysis
members of a plan and interest cost is measured using the projected cash flows making up the projected benefit obligation multiplied by the corresponding spot discount rate at each maturity.
As at December 31, 2020, a 0.25% decrease in the 2.55% discount rate used to determine the projected benefit obligation would have
resulted in a decrease of approximately $640 million to the funded status for pensions and would result in a decrease of approximately $20
million to the 2021 projected net periodic benefit income. A 0.25% increase in the discount rate would have resulted in an increase of
approximately $610 million to the funded status for pensions and would result in an increase of approximately $20 million to the 2021 projected
net periodic benefit income.
Expected long-term rate of return assumption
The expected long-term rate of return is determined based on expected future performance for each asset class and is weighted based on the
investment policy. Consideration is taken of the historical performance, the premium return generated from an actively managed portfolio, as
well as current target asset allocations, published market return expectations, economic developments, inflation rates and administrative
expenses. Based on these factors, the rate is determined by the Company. For 2020, the Company used a long-term rate of return assumption
of 7.00% on the market-related value of plan assets to compute net periodic benefit cost (income). The Company has elected to use a market-
related value of assets, whereby realized and unrealized gains/losses and appreciation/depreciation in the value of the investments are recognized over a period of five years, while investment income is recognized immediately. In 2021, the Company will decrease the expected
long-term rate of return on plan assets by 25 basis points to 6.75% to reflect managements current view of long-term investment returns.
The assets of the Company's various plans are primarily held in separate trust funds ("Trusts") which are diversified by asset type, country,
sector and investment strategy. Each year, the CN Board of Directors reviews and confirms or amends the Statement of Investment Policies
and Procedures ("SIPP") which includes the plane long-term target asset allocation (Policy) and related benchmark indices. This Policy is
based on the long-term expectations of the economy and financial market returns and considers the dynamics of the plane benefit obligations.
In 2020, the Policy was amended to implement a target asset allocation change to cash and short-term investments, and bonds and mortgages.
These changes were taken into account in the determination of the Company's expected long-term rate of return assumption. In 2020, the Policy was: 2% cash and short-term investments, 41% bonds and mortgages, 1.5% emerging market debt, 1.5% private debt, 35% equities, 4%
real estate, 7% oil and gas, 4% infrastructure investments, 10% absolute return investments and negative 6% for investment-related liabilities. Annually, the CN Investment Division (Investment Manager), a division of the Company created to invest and administer the assets of the
plans, can also implement an investment strategy ("Strategy') which can lead the Plan's actual asset allocation to deviate from the Policy due to changing market risks and opportunities. The Pension and Investment Committee of the Board of Directors ("Committee) regularly compares
the actual plan asset allocation to the Policy and Strategy and compares the actual performance of the Company's pension plan assets to the
performance of the benchmark indices. The Committees approval is required for all major investments in illiquid securities. The SIPP allows for the use of derivative financial
instruments to implement strategies, to hedge and to adjust existing or anticipated exposures. The SIPP prohibits investments in securities of
the Company or its subsidiaries.
The actual, market-related value and expected rates of return on plan assets for the last five years were as follows:
2020 2019 2018 2017 2016
Actual 12.5% 12.2% (2.4%) 9.2% 4.4% Market-related value 7.1% 6.1% 5.7% 9.1% 8.2% Expected 7.00% 7.00% 7.00% 7.00% 7.00%
The Company's expected long-term rate of return on plan assets reflects managements view of long-term investment returns and the effect of
a 1% variation in such rate of return would result in a change to the net periodic benefit cost (income) of approximately $100 million.
Managements assumption of the expected long-term rate of return is subject to risks and uncertainties that could cause the actual rate of return to differ materially from managements assumption. There can be no assurance that the plan assets will be able to earn the expected long-term rate of return on plan assets.
Net periodic benefit income for pensions for 2021
In 2021, the Company expects net periodic benefit income to be $165 million (2020 - $141 million) for all its defined benefit pension plans.
2020 Annual Report 43

Management's Discussion and Analysis
Plan asset allocation Based on the fair value of the assets held as at December 31, 2020, the assets of the Company's various plans are comprised of 3% in cash and
short-term investments, 37% in bonds and mortgages, 2% in emerging market debt, 3% in private debt, 38% in equities, 2% in real estate, 3% in
oil and gas, 3% in infrastructure, 10% in absolute return investments, 1% in alternative risk premia investments and negative 2% in investment-
related liabilities. See Note 17 - Pensions and other postretirement benefits to the Company's 2020 Annual Consolidated Financial Statements for information on the fair value measurements of such assets.
A significant portion of the plane assets are invested in publicly traded equity securities whose return is primarily driven by stock market
performance. Debt securities also account for a significant portion of the plans' investments and provide a partial offset to the variation in the pension benefit obligation that is driven by changes in the discount rate. The funded status of the plan fluctuates with market conditions and
impacts funding requirements. The Company will continue to make contributions to the pension plans that as a minimum meet pension legislative requirements.
Rate of compensation increase
The rate of compensation increase is determined by the Company based upon its long-term plans for such increases. For 2020, a basic rate of
compensation increase of 2.75% was used to determine the projected benefit obligation and the net periodic benefit cost (income).
Mortality
The Canadian Institute of Actuaries (CIA) published in 2014 a report on Canadian Pensioners' Mortality (Report"). The Report contained
Canadian pensioners' mortality tables and improvement scales based on experience studies conducted by the CIA. The CIA's conclusions were
taken into account in selecting managements best estimate mortality assumption used to calculate the projected benefit obligation as at
December 31, 2020, 2019 and 2018.
Funding of pension plans The Company's main Canadian defined benefit pension plan, the CN Pension Plan, accounts for 93% of the Company's pension obligation and can produce significant volatility in pension funding requirements, given the pension fund's size, the many factors that drive the plan's funded
status, and Canadian statutory pension funding requirements. Adverse changes to the assumptions used to calculate the plan's funding status,
particularly the discount rate used for funding purposes, as well as changes to existing federal pension legislation, regulation and guidance
could significantly impact the Company's future contributions.
For accounting purposes, the funded status is calculated under generally accepted accounting principles for all pension plans. For funding
purposes, the funded status is also calculated under going concern and solvency scenarios as prescribed under pension legislation and subject to guidance issued by the CIA and the Office of the Superintendent of Financial Institutions (OSFI) for all registered Canadian defined benefit
pension plans. The Company's funding requirements are determined upon completion of actuarial valuations. Actuarial valuations are generally
required on an annual basis for all Canadian defined benefit pension plans, or when deemed appropriate by the OSFI. Actuarial valuations are
also required annually for the Company's U.S. qualified defined benefit pension plans.
The Company's most recently filed actuarial valuations for funding purposes for its Canadian registered defined pension plans conducted
as at December 31, 2019 indicated a funding excess on a going concern basis of approximately $3.5 billion and a funding excess on a solvency
basis of approximately $0.6 billion, calculated using the three-year average of the plane hypothetical wind-up ratio in accordance with the Pension Benefit Standards Regulations, 1985. The federal pension legislation requires funding deficits, if any, to be paid over a number of years,
as calculated under current pension regulations. Alternatively, a letter of credit can be subscribed to fulfill required solvency deficit payments.
In November 2019, the OSFI proposed revisions to its Instruction guide for the Preparation of Actuarial Reports for Defined Benefit Pension
Plans ("Guide"). In November 2020, the OSFI issued its revised Guide and informed stakeholders that some of the proposed revisions to the
Guide affecting solvency valuations have been postponed until further review is conducted. If those proposed revisions were to be adopted as
originally issued, they would affect actuarial valuations by reducing the solvency status of the Company's defined benefit pension plans, and
could negatively impact the Company's pension funding requirements.
The Company's next actuarial valuations for funding purposes for its Canadian registered defined benefit pension plans required as at December 31, 2020 will be performed in 2021. These actuarial valuations are expected to identify a funding excess on a going concern basis of approximately $3.4 billion, while on a solvency basis a funding excess of approximately $0.5 billion is expected.
Based on the anticipated results of these valuations, the Company expects to make total cash contributions of approximately $135 million
for all of the Company's pension plans in 2021. The Company expects cash from operations and its other sources of financing to be sufficient
to meet its 2021 funding obligations.
44 CN 12020 Annual Report

Management's Discussion and Analysis
Information disclosed by major pension plan The following table provides the Company's plan assets by category, projected benefit obligation at end of year, as well as Company and
employee contributions by major defined benefit pension plan:
In millions CN
December 31, 2020 Pension Plan BC Rail
Pension Plan U.S. and
other plans Total
Plan assets by category Cash and short-term investments 575 $ 12 $ 7 $ 594 Bonds 6,655 391 171 7,217 Mortgages 21 — — 21 Emerging market debt 398 6 2 406 Private debt 561 12 2 575 Public equities 7,034 113 134 7,281 Private equities 296 6 1 303 Real estate 371 8 2 381 Oil and gas 634 13 2 649 Infrastructure 557 11 3 571 Absolute return 1,851 30 8 1,889 Alternative risk premia 187 3 1 191 Total investments 19,140 605 333 20,078 Investment-related liabilities (1) (432) (7) (2) (441) Other (2) 66 4 16 86
Total plan assets 18,774 $ 602 $ 347 $ 19,723
Projected benefit obligation at end of year $ 18,075 $ 524 900 $ 19,499 Company contributions in 2020 70 $ 23 $ 93 Employee contributions in 2020 59 $ — $ 59
(1) Investment-related liabilities include securities sold under repurchase agreements. (2) Other consists of operating assets of $262 million and liabilities of $176 million required to administer the Trusts' investment assets and the plans' benefit and funding
activities.
Additional disclosures are provided in Note 17 — Pensions and other postretirement benefits to the Company's 2020 Annual Consolidated
Financial Statements.
Personal injury and other claims
In the normal course of business, the Company becomes involved in various legal actions seeking compensatory and occasionally punitive
damages, including actions brought on behalf of various purported classes of claimants and claims relating to employee and third-party
personal injuries, occupational disease and property damage, arising out of harm to individuals or property allegedly caused by, but not limited to, derailments or other accidents.
Canada
Employee injuries are governed by the workers' compensation legislation in each province whereby employees may be awarded either a lump
sum or a future stream of payments depending on the nature and severity of the injury. As such, the provision for employee injury claims is
discounted. In the provinces where the Company is self-insured, costs related to employee work-related injuries are accounted for based on
actuarially developed estimates of the ultimate cost associated with such injuries, including compensation, health care and third-party
administration costs. An actuarial study is generally performed at least on a triennial basis. For all other legal actions, the Company maintains,
and regularly updates on a case-by-case basis, provisions for such items when the expected loss is both probable and can be reasonably
estimated based on currently available information.
In 2020, 2019 and 2018 the Company recorded a decrease of $13 million and $7 million, and an increase of $4 million, respectively, to its
provision for personal injuries in Canada as a result of actuarial valuations for employee injury claims.
2020 Annual Report 45

Management's Discussion and Analysis
As at December 31, 2020, 2019 and 2018, the Company's provision for personal injury and other claims in Canada was as follows:
In millions 2020 2019 2018
Beginning of year $ 207 $ 207 $ 183 Accruals and other 31 29 52 Payments (32) (29) (28)
End of year $ 206 $ 207 $ 207
Current portion - End of year $ 68 $ 55 $ 60
The assumptions used in estimating the ultimate costs for Canadian employee injury claims include, among other factors, the discount rate, the rate of inflation, wage increases and health care costs. The Company periodically reviews its assumptions to reflect currently available
information. Over the past three years, the Company has not had to significantly change any of these assumptions. Changes in any of these
assumptions could materially affect Casualty and other expense as reported in the Company's results of operations.
For all other legal claims in Canada, estimates are based on the specifics of the case, trends and judgment.
United States Personal injury claims by the Company's employees, including claims alleging occupational disease and work-related injuries, are subject to the provisions of the Federal Employers' Liability Act (FELA). Employees are compensated under FELA for damages assessed based on a finding of
fault through the U.S. jury system or through individual settlements. As such, the provision is undiscounted. With limited exceptions where
claims are evaluated on a case-by-case basis, the Company follows an actuarial-based approach and accrues the expected cost for personal
injury, including asserted and unasserted occupational disease claims, and property damage claims, based on actuarial estimates of their
ultimate cost. An actuarial study is performed annually.
For employee work-related injuries, including asserted occupational disease claims, and third-party claims, including grade crossing,
trespasser and property damage claims, the actuarial valuation considers, among other factors, the Company's historical patterns of claims filings and payments. For unasserted occupational disease claims, the actuarial valuation includes the projection of the Company's experience
into the future considering the potentially exposed population. The Company adjusts its liability based upon managements assessment and the
results of the study. On an ongoing basis, management reviews and compares the assumptions inherent in the latest actuarial valuation with
the current claim experience and, if required, adjustments to the liability are recorded.
Due to the inherent uncertainty involved in projecting future events, including events related to occupational diseases, which include but
are not limited to, the timing and number of actual claims, the average cost per claim and the legislative and judicial environment, the
Company's future payments may differ from current amounts recorded.
In 2020, the Company recorded a decrease of $10 million to its provision for U.S. personal injury and other claims attributable to non-occupational disease claims, third-party claims and occupational disease claims pursuant to the 2020 actuarial valuation. In 2019 and 2018,
actuarial valuations resulted in an increase of $2 million and $13 million, respectively. The prior years' adjustments from the actuarial valuations
were mainly attributable to third-party claims, non-occupational disease claims and occupational disease claims reflecting changes in the
Company's estimates of unasserted claims and costs related to asserted claims. The Company has an ongoing risk mitigation strategy focused
on reducing the frequency and severity of claims through injury prevention and containment; mitigation of claims; and lower settlements of existing claims.
As at December 31, 2020, 2019 and 2018, the Company's provision for personal injury and other claims in the U.S. was as follows:
In millions 2020 2019 2018
Beginning of year $ 145 $ 139 $ 116 Accruals and other 28 44 41 Payments (29) (31) (28) Foreign exchange (3) (7) 10
End of year $ 141 $ 145 $ 139
Current portion - End of year $ 41 $ 36 $ 37
For the U.S. personal injury and other claims liability, historical claim data is used to formulate assumptions relating to the expected number of
claims and average cost per claim for each year. Changes in any one of these assumptions could materially affect Casualty and other expense
as reported in the Company's results of operations. A 5% change in the asbestos average claim cost would result in an increase or decrease in the liability recorded of approximately $1 million and a 1% change in the inflation trend rate for all injury types would result in an increase or
decrease in the liability recorded of approximately $3 million.
46 CN 12020 Annual Report

Management's Discussion and Analysis
Environmental matters Known existing environmental concerns
The Company is or may be liable for remediation costs at individual sites, in some cases along with other potentially responsible parties,
associated with actual or alleged contamination. The ultimate cost of addressing these known contaminated sites cannot be definitively
established given that the estimated environmental liability for any given site may vary depending on the nature and extent of the
contamination; the nature of anticipated response actions, taking into account the available clean-up techniques; evolving regulatory standards governing environmental liability; and the number of potentially responsible parties and their financial viability. As a result, liabilities are
recorded based on the results of a four-phase assessment conducted on a site-by-site basis. A liability is initially recorded when environmental
assessments occur, remedial efforts are probable, and when the costs, based on a specific plan of action in terms of the technology to be used
and the extent of the corrective action required, can be reasonably estimated. The Company estimates the costs related to a particular site
using cost scenarios established by external consultants based on the extent of contamination and expected costs for remedial efforts. In the
case of multiple parties, the Company accrues its allocable share of liability taking into account the Company's alleged responsibility, the
number of potentially responsible parties and their ability to pay their respective share of the liability. Adjustments to initial estimates are
recorded as additional information becomes available. The Company's provision for specific environmental sites is undiscounted and includes costs for remediation and restoration of sites, as
well as monitoring costs. Environmental expenses, which are classified as Casualty and other in the Consolidated Statements of Income,
include amounts for newly identified sites or contaminants as well as adjustments to initial estimates. Recoveries of environmental remediation
costs from other parties are recorded as assets when their receipt is deemed probable.
As at December 31, 2020, 2019 and 2018, the Company's provision for specific environmental sites was as follows:
In millions 2020 2019 2018
Beginning of year $ 57 $ 61 $ 78 Accruals and other 44 31 16 Payments (42) (34) (34) Foreign exchange — (1) 1
End of year $ 59 $ 57 $ 61
Current portion - End of year $ 46 $ 38 $ 39
The Company anticipates that the majority of the liability at December 31, 2020 will be paid out over the next five years. Based on the information currently available, the Company considers its provisions to be adequate.
Unknown existing environmental concerns
While the Company believes that it has identified the costs likely to be incurred for environmental matters based on known information, the
discovery of new facts, future changes in laws, the possibility of releases of hazardous materials into the environment and the Company's ongoing efforts to identify potential environmental liabilities that may be associated with its properties may result in the identification of
additional environmental liabilities and related costs. The magnitude of such additional liabilities and the costs of complying with future environmental laws and containing or remediating contamination cannot be reasonably estimated due to many factors, including: • the lack of specific technical information available with respect to many sites;
• the absence of any government authority, third-party orders, or claims with respect to particular sites;
• the potential for new or changed laws and regulations and for development of new remediation technologies and uncertainty regarding the timing of the work with respect to particular sites; and
• the determination of the Company's liability in proportion to other potentially responsible parties and the ability to recover costs from any third parties with respect to particular sites.
Therefore, the likelihood of any such costs being incurred or whether such costs would be material to the Company cannot be determined at
this time. There can thus be no assurance that liabilities or costs related to environmental matters will not be incurred in the future, or will not
have a material adverse effect on the Company's financial position or results of operations in a particular quarter or fiscal year, or that the
Company's liquidity will not be adversely impacted by such liabilities or costs, although management believes, based on current information,
that the costs to address environmental matters will not have a material adverse effect on the Company's financial position or liquidity. Costs
related to any unknown existing or future contamination will be accrued in the period in which they become probable and reasonably estimable.
2020 Annual Report 47

Management's Discussion and Analysis
Future occurrences In railroad and related transportation operations, it is possible that derailments or other accidents, including spills and releases of hazardous
materials, may occur that could cause harm to human health or to the environment. As a result, the Company may incur costs in the future,
which may be material, to address any such harm, compliance with laws and other risks, including costs relating to the performance of clean-
ups, payment of environmental penalties and remediation obligations, and damages relating to harm to individuals or property.
Regulatory compliance
The Company may incur significant capital and operating costs associated with environmental regulatory compliance and clean-up requirements, in its railroad operations and relating to its past and present ownership, operation or control of real property. Environmental
expenditures that relate to current operations are expensed unless they relate to an improvement to the property. Expenditures that relate to an
existing condition caused by past operations and which are not expected to contribute to current or future operations are expensed. Operating
expenses related to regulatory compliance activities for environmental matters for the year ended December 31, 2020 amounted to $25 million (2019 - $25 million; 2018 - $22 million). For 2021, the Company expects to incur operating expenses relating to environmental matters in the
same range as 2020. In addition, based on the results of its operations and maintenance programs, as well as ongoing environmental audits
and other factors, the Company plans for specific capital improvements on an annual basis. Certain of these improvements help ensure facilities, such as fueling stations, waste water and storm water treatment systems, comply with environmental standards and include new
construction and the updating of existing systems and/or processes. Other capital expenditures relate to assessing and remediating certain
impaired properties. The Company's environmental capital expenditures for the year ended December 31, 2020 amounted to $20 million (2019 -
$25 million; 2018 - $19 million). For 2021, the Company expects to incur capital expenditures relating to environmental matters in the same
range as 2020.
Business risks
In the normal course of business, the Company is exposed to various business risks and uncertainties that can have an effect on the
Company's results of operations, financial position, or liquidity. While some exposures may be reduced by the Company's risk management strategies, many risks are driven by external factors beyond the Company's control or are of a nature which cannot be eliminated. The key areas
of business risks and uncertainties described in this section are not the only ones that can affect the Company. Additional risks and
uncertainties not currently known to management or that may currently not be considered material by management, could nevertheless also
have an adverse effect on the Company's business.
Pandemic risk and economic downturn
Severe disruptions in regional economies and the world economy can be caused by the outbreak of a contagious illness, such as the current COVID-19 pandemic. The transmission of COVID-19 and efforts to contain its spread have resulted in international, national and local border
closings, travel restrictions, significant disruptions to business operations, supply chains, customer activity and demand, service cancellations,
reductions and other changes, significant challenges in healthcare service preparation and delivery, and quarantines, as well as considerable
general concern and uncertainty, all of which have negatively affected the economic environment and may in the future have further and larger
impacts. It is not possible to predict what additional measures and restrictions will be imposed by governmental authorities and the period in time during which those measures and restrictions will apply. Prolonged border closings and economic and supply chain disruptions could
further materially affect the Company's financial results and operations. The COVID-19 pandemic could also further and significantly impact
freight demand and commodity prices in connection with the ensuing economic downturn, supply shortages, trade disruption, temporary staff shortages and temporary closures of facilities in geographic locations more importantly impacted by the outbreak. The scope and severity of
such disruptions and their impact on the Company's financial results and operations have been, and are expected to continue to be material.
Competition
The Company faces significant competition, including from rail carriers and other modes of transportation, and is also affected by its
customers' flexibility to select among various origins and destinations, including ports, in getting their products to market. Specifically, the
Company faces competition from Canadian Pacific Railway Company (CP), which operates the other major rail system in Canada and services most of the same industrial areas, commodity resources and population centers as the Company; major U.S. railroads and other Canadian and
U.S. railroads; long-distance trucking companies, transportation via the St. Lawrence-Great Lakes Seaway and the Mississippi River and transportation via pipelines. In addition, while railroads must build or acquire and maintain their rail systems, motor carriers and barges are able
to use public rights-of-way that are built and maintained by public entities without paying fees covering the entire costs of their usage.
48 CN 12020 Annual Report

Management's Discussion and Analysis
Competition is generally based on the quality and the reliability of the service provided, access to markets, as well as price. Factors affecting the competitive position of customers, including exchange rates and energy cost, could materially adversely affect the demand for
goods supplied by the sources served by the Company and, therefore, the Company's volumes, revenues and profit margins. Factors affecting
the general market conditions for the Company's customers can result in an imbalance of transportation capacity relative to demand. An
extended period of supply/demand imbalance could negatively impact market rate levels for all transportation services, and more specifically
the Company's ability to maintain or increase rates. This, in turn, could materially and adversely affect the Company's business, results of
operations or financial position.
The level of consolidation of rail systems in the U.S. has resulted in larger rail systems that are in a position to compete effectively with the Company in numerous markets.
There can be no assurance that the Company will be able to compete effectively against current and future competitors in the
transportation industry, or that further consolidation within the transportation industry and legislation allowing for more leniency in size and
weight for motor carriers will not adversely affect the Company's competitive position. No assurance can be given that competitive pressures
will not lead to reduced revenues, profit margins or both.
Environmental matters The Company's operations are subject to numerous federal, provincial, state, municipal and local environmental laws and regulations in Canada
and the U.S. concerning, among other things, emissions into the air; discharges into waters; the generation, handling, storage, transportation,
treatment and disposal of waste, hazardous substances and other materials; decommissioning of underground and aboveground storage tanks; and soil and groundwater contamination. A risk of environmental liability is inherent in railroad and related transportation operations; real
estate ownership, operation or control; and other commercial activities of the Company with respect to both current and past operations. As a
result, the Company incurs significant operating and capital costs, on an ongoing basis, associated with environmental regulatory compliance
and clean-up requirements in its railroad operations and relating to its past and present ownership, operation or control of real property.
While the Company believes that it has identified the costs likely to be incurred for environmental matters in the next several years based on known information, the discovery of new facts, future changes in laws, the possibility of releases of hazardous materials into the environment and the Company's ongoing efforts to identify potential environmental liabilities that may be associated with its properties may result in the identification of additional environmental liabilities and related costs.
In railroad and related transportation operations, it is possible that derailments or other accidents, including spills and releases of
hazardous materials, may occur that could cause harm to human health or to the environment. In addition, the Company is also exposed to
potential catastrophic liability risk, faced by the railroad industry in general, in connection with the transportation of toxic inhalation hazard
materials such as chlorine and anhydrous ammonia, or other dangerous commodities such as crude oil and propane that the Company may be required to transport as a result of its common carrier obligations. Therefore, the Company may incur costs in the future, which may be
material, to address any such harm, compliance with laws or other risks, including costs relating to the performance of clean-ups, payment of
environmental penalties and remediation obligations, and damages relating to harm to individuals or property. The environmental liability for any given contaminated site varies depending on the nature and extent of the contamination; the available
clean-up techniques; evolving regulatory standards governing environmental liability; and the number of potentially responsible parties and their
financial viability. As such, the ultimate cost of addressing known contaminated sites cannot be definitively established. Also, additional
contaminated sites yet unknown may be discovered or future operations may result in accidental releases. While some exposures may be reduced by the Company's risk mitigation strategies (including periodic audits, employee training programs,
emergency plans and procedures, and insurance), many environmental risks are driven by external factors beyond the Company's control or are
of a nature which cannot be completely eliminated. Therefore, there can be no assurance, notwithstanding the Company's mitigation strategies,
that liabilities or costs related to environmental matters will not be incurred in the future or that environmental matters will not have a material
adverse effect on the Company's results of operations, financial position or liquidity, or reputation.
Personal injury and other claims In the normal course of business, the Company becomes involved in various legal actions seeking compensatory and occasionally punitive
damages, including actions brought on behalf of various purported classes of claimants and claims relating to employee and third-party
personal injuries, occupational disease, and property damage, arising out of harm to individuals or property allegedly caused by, but not limited
to, derailments or other accidents. The Company maintains provisions for such items, which it considers to be adequate for all of its
outstanding or pending claims and benefits from insurance coverage for occurrences in excess of certain amounts. The final outcome with
respect to actions outstanding or pending at December 31, 2020, or with respect to future claims, cannot be predicted with certainty, and
therefore there can be no assurance that their resolution will not have a material adverse effect on the Company's results of operations, financial position or liquidity, in a particular quarter or fiscal year.
2020 Annual Report 49

Management's Discussion and Analysis
Labor negotiations As at December 31, 2020, CN employed a total of 17,645 employees in Canada, of which 12,585, or 71%, were unionized employees and 6,736
employees in the U.S., of which 5,624, or 83%, were unionized employees. The Company's relationships with its unionized workforce are
governed by, amongst other items, collective agreements which are negotiated from time to time. Disputes relating to the renewal of collective
agreements could potentially result in strikes, slowdowns and loss of business. Future labor agreements or renegotiated agreements could
increase labor and fringe benefits and related expenses. There can be no assurance that the Company will be able to renew and have its
collective agreements ratified without any strikes or lockouts or that the resolution of these collective bargaining negotiations will not have a
material adverse effect on the Company's results of operations or financial position.
Canadian workforce
There are no material collective agreements in Canada that are open for negotiation at this time. The Company's collective agreements remain in effect until the bargaining process outlined under the Canada Labour Code has been exhausted.
U.S. workforce
As of February 1, 2021, collective agreements covering all non-operating and operating craft employees at Grand Trunk Western Railroad
Company (GTW), companies owned by Illinois Central Corporation (ICC), companies owned by Wisconsin Central Ltd. (WC) and Bessemer & Lake Erie Railroad Company (BLE), and all employees at Pittsburgh and Conneaut Dock Company (PCD) were ratified. The agreements in place
have various moratorium provisions, which preserve the status quo with respect to the given collective agreement during the terms of such
moratoriums. Where negotiations are ongoing, the terms and conditions of existing agreements generally continue to apply until new
agreements are reached or the processes of the Railway Labor Act have been exhausted.
The general approach to labor negotiations by U.S. Class I railroads is to bargain on a collective national basis with the industry, which GTW, ICC, WC and BLE currently participate in, for collective agreements covering all non-operating and operating employees, with the
exception of two employee groups working at PCD covering fewer than 35 employees. The next national bargaining round has commenced.
Regulation
In order to facilitate the continued movement of goods during the COVID-19 pandemic, regulatory agencies in the U.S. and Canada have issued waivers or exemptions to railway companies providing relief from the strict application of some regulations. These reliefs were provided to
facilitate social distancing and compliance with other constraints associated with the COVID-19 pandemic that would prevent railways from
complying with requirements in a manner consistent with existing provisions.
Economic regulation — Canada
The Company's rail operations in Canada are subject to economic regulation by the Canadian Transportation Agency under the Canada
Transportation Act, which provides rate and service remedies, including final offer arbitration, long-haul interswitching rates and mandatory
interswitching. It also regulates the maximum revenue entitlement for the movement of regulated grain, charges for railway ancillary services
and noise-related disputes. In addition, various Company business transactions must gain prior regulatory approval, with attendant risks and
uncertainties, and the Company is subject to government oversight with respect to rate, service and business practice issues.
No assurance can be given that any current or future regulatory or legislative initiatives by the Canadian federal government and agencies will
not materially adversely affect the Company's results of operations or its competitive and financial position.
Economic regulation — U.S.
The Company's U.S. rail operations are subject to economic regulation by the STB. The STB serves as both an adjudicatory and regulatory body
and has jurisdiction over certain railroad rate and service issues and rail restructuring transactions such as mergers, line sales, line construction
and line abandonments. As such, various Company business transactions must gain prior regulatory approval and aspects of its pricing and
service practices may be subject to challenge, with attendant risks and uncertainties. Recent proceedings undertaken by the STB in a number of significant matters remain pending.
The Passenger Rail Investment and Improvement Act of 2008 (PRIIA) required Amtrak and the Federal Railroad Administration (FRA) to
jointly promulgate the PRIIA performance standards. The prior metrics were vacated and the arbitration provision in the statute was severed by
the U.S. Court of Appeals for the District of Columbia. On November 16, 2020, the FRA adopted metrics for measuring performance. As part of
PRIIA, U.S. Congress authorized the STB to investigate any railroad over whose track Amtrak operates that fails to meet the performance
standards under PRIIA and the STB is authorized to assess damages against the host railroad.
50 CN 12020 Annual Report

Management's Discussion and Analysis
On August 8, 2019, the STB issued interim findings and guidance to National Railroad Passenger Corporation (Amtrak) and the Company regarding the terms and conditions for Amtrak's use of the Company's lines. The STB ordered Board-sponsored mediation, which was
concluded in January 2020. This case remains pending at the STB.
On April 30, 2020, the STB adopted a final rule and policy statement relating to demurrage and proposed supplemental rules relating to
demurrage invoices.
On June 23, 2020, the STB withdrew its proposal to change its existing methodology for determining the rail industry's cost of capital.
On August 3, 2020, the STB issued a final rule to adopt a streamlined approach for pleading market dominance in a case challenging the
reasonableness of a railroad's rate. Several shipper associations have sought reconsideration. On September 30, 2020, the STB requested public comment concerning a new proposed approach that could be used to consider whether
to revoke existing commodity exemptions and instead subject those commodities to STB regulation.
On November 25, 2020, the STB announced that it is instituting a rulemaking on a proposal by five Class I railroads to modify the STB's
rules to create a new, voluntary small rate case arbitration program.
On December 30, 2020, the STB instituted a rulemaking proceeding to consider a petition by three Class I railroads to change the Board's
procedures for determining annually which Class I railroads are revenue adequate by examining the railroads in comparison to the performance
of S&P 500 companies. The Board requested comments on the petition as well as responses to specific questions posed by the Board.
No assurance can be given that these and any other current or future regulatory or legislative initiatives by the U.S. federal government and
agencies will not materially adversely affect the Company's results of operations or its competitive and financial position.
Safety regulation — Canada
The Company's rail operations in Canada are subject to safety regulation by the Minister under the Railway Safety Act as well as the rail portions
of other safety-related statutes, which are administered by Transport Canada. The Company may be required to transport toxic inhalation
hazard materials as a result of its common carrier obligations and, as such, is also subject to additional regulatory oversight in Canada. The Transportation of Dangerous Goods Act, also administered by Transport Canada, establishes the safety requirements for the transportation of
goods classified as dangerous and enables the adoption of regulations for security training and screening of personnel working with dangerous
goods, as well as the development of a program to require a transportation security clearance for dangerous goods, the tracking of dangerous
goods during transport and the development of an emergency response plan.
In 2014, Transport Canada's new Grade Crossings Regulations under the Railway Safety Act came into force, which establish specific
standards for new grade crossings and requirements that existing crossings be upgraded to basic safety standards by November 2021, as well
as safety related data that must be provided by railway companies on an annual basis. The Company has complied with the information
requirements by providing road authorities with specific information respecting public grade crossings. The Company has also initiated the
work required to have grade crossings on its network to meet the new standards. On January 4, 2021, Transport Canada informed the public
that it intends to modify the Grade Crossings Regulations so that low-risk crossings do not need to meet all requirements. Transport Canada
also intends to extend the November 2021 deadline by one year for high-risk grade crossings and by three years for all other crossings. On April 26, 2017, the Minister initiated the review of the Railway Safety Act, which was initially scheduled for 2018, and a panel of three
persons was appointed to proceed with the review. On May 31, 2018, the Minister tabled in the House of Commons the report of the three-
person panel.
Transport Canada's new regulations aimed at lowering the risk of terrorism on the Canadian rail system, entitled Transportation of
Dangerous Goods by Rail Security Regulations, were adopted on May 6, 2019 and are coming into force in sequence. The provisions under which
rail carriers have to conduct security inspections of certain railway vehicles containing dangerous goods, report potential security threats and
concerns to the Canadian Transport Emergency Centre, and employ a rail security coordinator came into force on August 6, 2019. The
requirements that all rail carriers proactively engage in security planning processes and manage security risks, by introducing security
awareness training for employees, security plans that include measures to address assessed risks, and security plan training for employees
with duties related to the security plan or security sensitive dangerous goods came into force on June 1, 2020. CN is in compliance with these requirements.
On November 6, 2020, the Minister issued a new order restricting the speed of key trains carrying dangerous goods based on cold
temperature conditions, instead of restricting their speed based on a winter date range as stated in the previously issued order on April 1, 2020.
The maximum speed of the trains also depend on the safety measures implemented by railway companies to be detailed into a Winter Operation Risk Mitigation Plan and on the type of railway signal and traffic control systems present on the railway networks which take into
account the substantial investments made to equip main line tracks with automated signaling technology, on which the vast majority of CN's
traffic is handled. Considering that speed restrictions applicable to a single category of trains nevertheless affect the speed of all trains operating on a rail network, this revised approach will enable CN to maintain normal speed operations unless the conditions require speed
restrictions in the interest of safety.
2020 Annual Report 51

Management's Discussion and Analysis
Bill C-49, which came into force on May 23, 2018, contains provisions that amend the Railway Safety Act to prohibit a railway company from operating railway equipment unless it is fitted with prescribed recording instruments and the prescribed information is recorded, collected
and preserved. These changes are not yet in force as the Locomotive Voice and Video Recorder Regulations ("LVVR Regulations") detailing their
conditions were published by Transport Canada on September 2, 2020 but will only come into force two years later on September 2, 2022. The
LVVR Regulations require railway companies to procure and install LVVR equipment within two years of coming into force. The LVVR
Regulations also set out the technical specifications of the equipment, deal with record keeping, provide for privacy protection and detail how
railway companies can access the information on a random basis. LVVR technology will assist in preventing accidents and facilitate
investigations to better understand the circumstances of accidents. On December 20, 2018, the Minister issued an order requesting Canadian railway companies to revise the Work/Rest Rules under the
Railway SafetyAct to reflect the latest fatigue science and fatigue management practices and address a series of related elements. The draft
rules proposed by the Canadian rail industry were filed with the Minister on September 11, 2020. On November 25, 2020, the Minister approved
the new Duty and Rest Period Rules for Operating Employees subject to conditions which clarified some aspects of the Rules. The majority of the
provisions applicable to CN will come into effect on May 25, 2023.
On October 6, 2020, Transport Canada issued new Passenger Rail Security Regulations, with their provisions coming into force in sequence.
These regulations require passenger railway and host companies to effectively manage their security risks by implementing risk-based security practices, including security awareness training, security risk assessments, security plans and security inspections by July 6, 2021, the
designation of a rail security coordinator and security incident reporting by October 6, 2021 and security plan training and security exercises by
January 6, 2022.
No assurance can be given that these and any other current or future regulatory or legislative initiatives by the Canadian federal government
and agencies will not materially adversely affect the Company's results of operations or its competitive and financial position.
Safety regulation - U.S. The Company's U.S. rail operations are subject to safety regulation by the FRA under the Federal Railroad Safety Act as well as rail portions of
other safety statutes, with the transportation of certain hazardous commodities also governed by regulations promulgated by the Pipeline and
Hazardous Materials Safety Administration (PHMSA). PHMSA requires carriers operating in the U.S. to report annually the volume and route-
specific data for cars containing these commodities; conduct a safety and security risk analysis for each used route; identify a commercially
practicable alternative route for each used route; and select for use the practical route posing the least safety and security risk. In addition, the
Transportation Security Administration (TSA) requires rail carriers to provide upon request, within five minutes for a single car and 30 minutes for multiple cars, location and shipping information on cars on their networks containing toxic inhalation hazard materials and certain radioactive or explosive materials; and ensure the secure, attended transfer of all such cars to and from shippers, receivers and other carriers that will move from, to, or through designated high-threat urban areas.
On October 16, 2008, the U.S. Congress enacted the Rail Safety Improvement Act of 2008, which required all Class I railroads and intercity
passenger and commuter railroads to implement a PTC system by December 31, 2015 on mainline track where intercity passenger railroads
and commuter railroads operate and where toxic inhalation hazard materials of certain thresholds are transported. PTC is a collision avoidance
technology designed to override locomotive controls and prevent train-to-train collisions, overspeed derailments, misaligned switch
derailments, and unauthorized incursions onto established work zones. In 2019, CN initiated PTC revenue operation on its remaining
subdivisions where PTC is required and began interoperability testing with tenant railroads. In 2020, the Company completed interoperability
testing with tenant railroads that operate on the Company's PTC-equipped tracks pursuant to regulations. On June 29, 2020, CN submitted its
Request for Amendment to the PTC Safety Plan. On November 18, 2020, CN submitted its Request for Amendment to its PTC Implementation
Plan, as per FRA's request. On December 11, 2020, FRA approved CN's request and certified CN's PTC system. CN has completed the federal
requirements to implement PTC by the deadline of December 31, 2020. Noncompliance with these or other laws and regulations may subject
the Company to fines, penalties and/or service interruptions. PTC may result in reduced operational efficiency and service levels.
On February 18, 2020, the FRA issued a final rule that requires each Class I railroad and certain shortline railroads to develop a Railroad Risk Reduction Program in a written plan that will be reviewed and approved by the FRA and will be subject to audit. Written plans must be
submitted by August 2021. On April 10, 2020, the AAR sought reconsideration from the FRA on certain aspects of the final rule. On May 8, 2020,
the FRA denied AAR's request for reconsideration of the implementation deadlines. On November 16, 2020, the FRA decided the remaining
issues in the requests for reconsideration and agreed to reconsider provisions of the rules relating to whether contractors would be deemed
directly affected employees.
No assurance can be given that these and any other current or future regulatory or legislative initiatives by the U.S. federal government and
agencies will not materially adversely affect the Company's results of operations or its competitive and financial position.
52 CN 12020 Annual Report

Management's Discussion and Analysis
Regulation — Vessels The Company's vessel operations are subject to regulation by the U.S. Coast Guard and the Department of Transportation, Maritime Administration, which regulate the ownership and operation of vessels operating on the Great Lakes and in U.S. coastal waters. In addition, the Environmental Protection Agency has authority to regulate air emissions from these vessels.
Security
The Company is subject to statutory and regulatory directives in the U.S. addressing homeland security concerns. In the U.S., safety matters
related to security are overseen by the TSA, which is part of the U.S. Department of Homeland Security (DHS) and PHMSA, which, like the FRA,
is part of the U.S. Department of Transportation. Border security falls under the jurisdiction of U.S. Customs and Border Protection (CBP), which
is part of the DHS. In Canada, the Company is subject to regulation by the Canada Border Services Agency (CBSA). Matters related to
agriculture-related shipments crossing the Canada/U.S. border also fall under the jurisdiction of the U.S. Department of Agriculture (USDA) and
the Food and Drug Administration (FDA) in the U.S. and the Canadian Food Inspection Agency (CFIA) in Canada. More specifically, the Company
is subject to:
• border security arrangements, pursuant to an agreement the Company and CP entered into with the CBP and the CBSA;
• the CBP's Customs-Trade Partnership Against Terrorism (C-TPAT) program and designation as a low-risk carrier under CBSA's Customs Self-Assessment (CSA) program;
• regulations imposed by the CBP requiring advance notification by all modes of transportation for all shipments into the U.S. The CBSA is also working on similar requirements for Canada-bound traffic;
• inspection for imported fruits and vegetables grown in Canada and the agricultural quarantine and inspection (AQI) user fee for all traffic
entering the U.S. from Canada; and • gamma ray screening of cargo entering the U.S. from Canada, and potential security and agricultural inspections at the Canada/U.S.
border.
The Company has worked with the AAR to develop and put in place an extensive industry-wide security plan to address terrorism and security-driven efforts by state and local governments seeking to restrict the routings of certain hazardous materials. If such state and local
routing restrictions were to go into force, they would be likely to add to security concerns by foreclosing the Company's most optimal and
secure transportation routes, leading to increased yard handling, longer hauls, and the transfer of traffic to lines less suitable for moving
hazardous materials, while also infringing upon the exclusive and uniform federal oversight over railroad security matters.
While the Company will continue to work closely with the CBSA, CBP, and other Canadian and U.S. agencies, as described above, no assurance
can be given that these and future decisions by the U.S., Canadian, provincial, state, or local governments on homeland security matters, legislation on security matters enacted by the U.S. Congress or Parliament, or joint decisions by the industry in response to threats to the North American rail network, will not materially adversely affect the Company's results of operations, or its competitive and financial position.
Transportation of hazardous materials
As a result of its common carrier obligations, the Company is legally required to transport toxic inhalation hazard materials regardless of risk or
potential exposure or loss. A train accident involving the transport of these commodities could result in significant costs and claims for
personal injury, property damage, environmental penalties and remediation in excess of insurance coverage for these risks, which may materially adversely affect the Company's results of operations, or its competitive and financial position.
Economic conditions
The Company is susceptible to changes in the economic conditions of the industries and geographic areas that produce and consume the
freight it transports or the supplies it requires to operate. In addition, many of the goods and commodities carried by the Company experience cyclicality in demand. For example, the volatility in domestic and global energy markets could impact the demand for transportation services as
well as impact the Company's fuel costs and surcharges. In addition, the volatility in other commodity markets such as coal and iron ore could
have an impact on volumes. Many of the bulk commodities the Company transports move offshore and are affected more by global rather than North American economic conditions. Adverse North American and global economic conditions, or economic or industrial restructuring, that
affect the producers and consumers of the commodities carried by the Company, including customer insolvency, may have a material adverse
effect on the volume of rail shipments and/or revenues from commodities carried by the Company, and thus materially and negatively affect its
results of operations, financial position, or liquidity.
2020 Annual Report 53

Management's Discussion and Analysis
Pension funding volatility The Company's funding requirements for its defined benefit pension plans are determined using actuarial valuations. See the section of this
MD&A entitled Critical accounting estimates — Pensions and other postretirement benefits for information relating to the funding of the
Company's defined benefit pension plans. Adverse changes with respect to pension plan returns and the level of interest rates as well as
changes to existing federal pension legislation and regulation may significantly impact future pension contributions and have a material
adverse effect on the funding status of the plans and the Company's results of operations.
In November 2019, the OSFI proposed revisions to its Instruction guide for the Preparation of Actuarial Reports for Defined Benefit Pension
Plans ("Guide"). In November 2020, the OSFI issued its revised Guide and informed stakeholders that some of the proposed revisions to the Guide affecting solvency valuations have been postponed until further review is conducted. If those proposed revisions were to be adopted as
originally issued, they would affect actuarial valuations by reducing the solvency status of the Company's defined benefit pension plans, and
could negatively impact the Company's pension funding requirements.
There can be no assurance that the Company's pension expense and funding of its defined benefit pension plans will not increase in the future
and thereby negatively impact earnings and/or cash flow.
Reliance on technology and related cybersecurity risk The Company relies on information technology in all aspects of its business. While the Company has business continuity and disaster recovery
plans, as well as other security and mitigation programs in place to protect its operations, information and technology assets, a cybersecurity
attack and significant disruption or failure of its information technology and communications systems could result in service interruptions,
safety failures, security violations, regulatory compliance failures or other operational difficulties, leading to possible litigation and regulatory
oversight. Security threats are evolving, and can come from nation states, organized criminals, hacktivists and others with malicious intent. A
security incident could compromise corporate information and assets, as well as operations. If the Company is unable to restore service or to
acquire or implement any needed new technology, it may suffer a competitive disadvantage, which could also have an adverse effect on the Company's results of operations, financial position or liquidity. The Company is investing to meet evolving network and data security
expectations and regulations, in an effort to mitigate the impact a security incident might have on the Company's results of operations, financial
position or liquidity. The final outcome of a potential security incident cannot be predicted with certainty, and therefore there can be no
assurance that its resolution will not have a material adverse effect on the Company's reputation, goodwill, results of operations, financial position or liquidity, in a particular quarter or fiscal year.
Trade restrictions Global as well as North American trade conditions, including trade barriers on certain commodities, may interfere with the free circulation of
goods across Canada and the U.S. or the cost associated therewith. Following the expiration of the Softwood Lumber Agreement (SLA)
between Canada and the U.S., including the expiration of the one year moratorium period preventing the U.S. from launching any trade action
against Canadian producers, on January 3, 2018, based on affirmative final determinations by both the U.S. Department of Commerce and the U.S. International Trade Commission, antidumping and countervailing duty orders were imposed on imports of Canadian softwood lumber to
the U.S. and Canada responded to the imposition by the U.S. of antidumping and countervailing duties, in connection with lumber and other
commodities, by filing a complaint with the World Trade Organization (WTO). On August 24, 2020, the WTO ruled that US duties on Canadian softwood lumber are inconsistent with the WTO obligations of the United States and on November 24, 2020, the US Department of Commerce
concluded their first administrative review of Canadian lumber countervailing and antidumping duties, reducing the average rate of duties.
On November 30, 2018, the U.S., Canada and Mexico signed the United States-Mexico-Canada Agreement (USMCA), a new trade
agreement to replace the North American Free Trade Agreement. All three countries have ratified the agreement which came into force on
July 1, 2020.
It remains too early to assess the potential outcome of other ongoing various trade actions taken by governments and agencies. As such,
there can be no assurance that trade actions will not materially adversely affect the volume of rail shipments and/or revenues from
commodities carried by the Company, and thus materially and negatively impact earnings and/or cash flow.
Terrorism and international conflicts
Potential terrorist actions can have a direct or indirect impact on the transportation infrastructure, including railway infrastructure in North
America, and can interfere with the free flow of goods. Rail lines, facilities and equipment could be directly targeted or become indirect
casualties, which could interfere with the free flow of goods. International conflicts can also have an impact on the Company's markets.
Government response to such events could adversely affect the Company's operations. Insurance premiums could also increase significantly or
coverage could become unavailable.
54 CN 12020 Annual Report

Management's Discussion and Analysis
Customer credit risk
In the normal course of business, the Company monitors the financial condition and credit limits of its customers and reviews the credit history
of each new customer. Although the Company believes there are no significant concentrations of credit risk, economic conditions can affect
the Company's customers and can result in an increase to the Company's credit risk and exposure to the business failures of its customers. A
widespread deterioration of customer credit and/or business failures of customers could have a material adverse effect on the Company's
results of operations, financial position or liquidity.
Liquidity Disruptions in financial markets or deterioration of the Company's credit ratings could hinder the Company's access to external sources of
funding to meet its liquidity needs. There can be no assurance that changes in the financial markets will not have a negative effect on the
Company's liquidity and its access to capital at acceptable terms and rates.
Supplier concentration
The Company operates in a capital-intensive industry where the complexity of rail equipment limits the number of suppliers available. The
supply market could be disrupted if changes in the economy caused any of the Company's suppliers to cease production or to experience
capacity or supply shortages. The supply market could become further concentrated and could result in changes to the product or service offerings by suppliers. This could also result in cost increases to the Company and difficulty in obtaining and maintaining the Company's rail
equipment and materials. Since the Company also has foreign suppliers, international relations, trade restrictions and global economic and
other conditions may potentially interfere with the Company's ability to procure necessary equipment and materials. Widespread business
failures of, or restrictions on suppliers, could have a material adverse effect on the Company's results of operations or financial position.
Availability of qualified personnel
The Company may experience demographic challenges in the employment levels of its workforce. Changes in employee demographics, training
requirements and the availability of qualified personnel, particularly locomotive engineers and conductors, could negatively impact the
Company's ability to meet demand for rail service. The Company monitors employment levels and seeks to ensure that there is an adequate
supply of personnel to meet rail service requirements. However, the Company's efforts to attract and retain qualified personnel may be hindered
by specific conditions in the job market. No assurance can be given that demographic or other challenges will not materially adversely affect
the Company's results of operations or its financial position.
Fuel costs The Company is susceptible to the volatility of fuel prices due to changes in the economy or supply disruptions. Fuel shortages can occur due
to refinery disruptions, production quota restrictions, climate, as well as labor and political instability. Increases in fuel prices or supply
disruptions may materially adversely affect the Company's results of operations, financial position or liquidity.
Foreign exchange
The Company conducts its business in both Canada and the U.S. and as a result, is affected by currency fluctuations. Changes in the exchange
rate between the Canadian dollar and other currencies (including the US dollar) make the goods transported by the Company more or less
competitive in the world marketplace and thereby may adversely affect the Company's revenues and expenses.
Interest rates
The Company is exposed to interest rate risk relating to the Company's debt. The Company mainly issues fixed-rate debt, which exposes the
Company to variability in the fair value of the debt. The Company also issues debt with variable interest rates, which exposes the Company to
variability in interest expense. Adverse changes to market interest rates may significantly impact the fair value or future cash flows of the
Company's financial instruments. There can be no assurance that changes in the market interest rates will not have a negative effect on the
Company's results of operations or liquidity.
Transportation network disruptions
Due to the integrated nature of the North American freight transportation infrastructure, the Company's operations may be negatively affected
by service disruptions of its own network, including illegal blockades, as well as of other transportation links such as ports and other railroads which interchange with the Company. A significant prolonged service disruption of CN's network or one or more of these entities could have an
adverse effect on the Company's results of operations, financial position or liquidity. Furthermore, deterioration in the cooperative relationships
with the Company's connecting carriers could directly affect the Company's operations.
2020 Annual Report 55

Management's Discussion and Analysis
Severe weather The Company's success is dependent on its ability to operate its railroad efficiently. Severe weather and natural disasters, such as extreme cold
or heat, flooding, droughts, fires, hurricanes and earthquakes, can disrupt operations and service for the railroad, affect the performance of
locomotives and rolling stock, as well as disrupt operations for both the Company and its customers. Business interruptions resulting from
severe weather could result in increased costs, increased liabilities and lower revenues, which could have a material adverse effect on the
Company's results of operations, financial condition or liquidity.
Climate change Climate change, including the impacts of global warming, has the potential physical risks of increasing the frequency of adverse weather
events, which can disrupt the Company's operations and damage its infrastructure or properties. It could also affect the markets for, or the
volume of, the goods the Company carries or otherwise have a material adverse effect on the Company's results of operations, financial
position or liquidity. Government action or inaction to address climate change could also affect CN. The Company is currently subject to climate
change and other emissions-related laws and regulations that have been proposed and, in some cases adopted, on the federal, provincial and
state levels. While CN is continually focused on efficiency improvements and reducing its carbon footprint, cap and trade systems, carbon
taxes, or other controls on emissions of greenhouse gasses imposed by various government bodies could increase the Company's capital and operating costs. The Company may not be able to offset such impacts, including, for example, through higher freight rates. Climate change
legislation and regulation could also affect CN's customers; make it difficult for CN's customers to produce products in a cost-competitive
manner due to increased energy costs; and increase legal costs related to defending and resolving legal claims and other litigation related to
climate change.
56 CN 12020 Annual Report

Management's Discussion and Analysis
Controls and procedures
The Company's Chief Executive Officer and its Chief Financial Officer, after evaluating the effectiveness of the Company's disclosure controls
and procedures (as defined in Exchange Act Rules 13a-15(e) and 15d-15(e)) as of December 31, 2020, have concluded that the Company's
disclosure controls and procedures were effective.
During the fourth quarter ended December 31, 2020, there was no change in the Company's internal control over financial reporting that
has materially affected, or is reasonably likely to materially affect, the Company's internal control over financial reporting.
As of December 31, 2020, management has assessed the effectiveness of the Company's internal control over financial reporting using the
criteria set forth by the Committee of Sponsoring Organizations of the Treadway Commission in Internal Control — Integrated Framework (2013).
Based on this assessment, management has determined that the Company's internal control over financial reporting was effective as of
December 31, 2020, and issued Managements Report on Internal Control over Financial Reporting dated February 1, 2021 to that effect.
2020 Annual Report 57

Management's Report on Internal Control over Financial Reporting
Management is responsible for establishing and maintaining adequate internal control over financial reporting. Internal control over financial
reporting is a process designed to provide reasonable assurance regarding the reliability of financial reporting and the preparation of financial
statements for external purposes in accordance with generally accepted accounting principles. Because of its inherent limitations, internal
control over financial reporting may not prevent or detect misstatements.
Management has assessed the effectiveness of the Company's internal control over financial reporting as of December 31, 2020 using the
criteria set forth by the Committee of Sponsoring Organizations of the Treadway Commission in Internal Control - Integrated Framework (2013).
Based on this assessment, management has determined that the Company's internal control over financial reporting was effective as of
December 31, 2020.
KPMG LLP, an independent registered public accounting firm, has issued an unqualified audit report on the effectiveness of the Company's internal control over financial reporting as of December 31, 2020 and has also expressed an unqualified audit opinion on the Company's 2020
consolidated financial statements as stated in their Reports of Independent Registered Public Accounting Firm dated February 1, 2021.
(s) Jean-Jacques Ruest
President and Chief Executive Officer
February 1, 2021
(s) Ghislain Houle
Executive Vice-President and Chief Financial Officer
February 1, 2021
58 CN 12020 Annual Report

Report of Independent Registered Public Accounting Firm
To the Shareholders and Board of Directors Canadian National Railway Company:
Opinion on the consolidated financial statements
We have audited the accompanying consolidated balance sheets of Canadian National Railway Company (the "Company") as of December 31,
2020 and 2019, the related consolidated statements of income, comprehensive income, changes in shareholders' equity, and cash flows for
each of the years in the three-year period ended December 31, 2020, and the related notes (collectively, the "consolidated financial
statements"). In our opinion, the consolidated financial statements present fairly, in all material respects, the financial position of the Company as of December 31, 2020 and 2019, and the results of its operations and its cash flows for each of the years in the three-year period ended
December 31, 2020, in conformity with U.S. generally accepted accounting principles.
We also have audited, in accordance with the standards of the Public Company Accounting Oversight Board (United States) ("PCA0B"), the
Company's internal control over financial reporting as of December 31, 2020, based on criteria established in Internal Control — Integrated
Framework (2013) issued by the Committee of Sponsoring Organizations of the Treadway Commission, and our report dated February 1, 2021
expressed an unqualified opinion on the effectiveness of the Company's internal control over financial reporting.
Change in accounting principle
As discussed in Note 12 to the consolidated financial statements, the Company has changed its method of accounting for leases as of
January 1, 2019 due to the adoption of Accounting Standards Codification Topic 842 Leases, using a modified retrospective adoption approach.
Basis for opinion
These consolidated financial statements are the responsibility of the Company's management. Our responsibility is to express an opinion on
these consolidated financial statements based on our audits. We are a public accounting firm registered with the PCAOB and are required to be independent with respect to the Company in accordance with the U.S. federal securities laws and the applicable rules and regulations of the
Securities and Exchange Commission and the PCAOB.
We conducted our audits in accordance with the standards of the PCAOB. Those standards require that we plan and perform the audit to
obtain reasonable assurance about whether the consolidated financial statements are free of material misstatement, whether due to error or
fraud. Our audits included performing procedures to assess the risks of material misstatement of the consolidated financial statements,
whether due to error or fraud, and performing procedures that respond to those risks. Such procedures included examining, on a test basis,
evidence regarding the amounts and disclosures in the consolidated financial statements. Our audits also included evaluating the accounting principles used and significant estimates made by management, as well as evaluating the overall presentation of the consolidated financial
statements. We believe that our audits provide a reasonable basis for our opinion.
Critical audit matters
The critical audit matters communicated below are matters arising from the current period audit of the consolidated financial statements that
were communicated or required to be communicated to the audit committee and that: (1) relate to accounts or disclosures that are material to
the consolidated financial statements and (2) involved our especially challenging, subjective, or complex judgments. The communication of
critical audit matters does not alter in any way our opinion on the consolidated financial statements, taken as a whole, and we are not, by communicating the critical audit matters below, providing separate opinions on the critical audit matters or on the accounts or disclosures to which they relate.
Evaluation of income taxes
As discussed in Note 7 to the consolidated financial statements, the net deferred income tax liability was $8,271 million as of December 31,
2020 and income tax expense was $982 million for the year ended December 31, 2020. The Company operates in different tax jurisdictions which requires the Company to make significant judgments and estimates in relation to its tax positions.
We identified the evaluation of the net deferred income tax liability and income tax expense as a critical audit matter due to the magnitude
of these tax balances and complexities in the evaluation of the application of the relevant tax regulations applicable to the Company. A high
degree of auditor judgment was required in assessing certain of the Company's tax positions and balances.
© 2020 KPMG LLP, an Ontario limited liability partnership and a member firm of the KPMG global organization of independent member firms affiliated with KPMG International
Limited, a private English company limited by guarantee. All rights reserved.
2020 Annual Report 59

Report of Independent Registered Public Accounting Firm
The following are the primary procedures we performed to address this critical audit matter. We evaluated the design and tested the operating effectiveness of certain internal controls related to the Company's reconciliation and analysis of its deferred income tax balances. We involved income tax and transfer pricing professionals with specialized skills and knowledge who assisted in: (1) assessing the Company's
interpretation of the relevant tax regulations; (2) evaluating the Company's tax positions and transfer pricing arrangements; (3) analyzing the
Company's deferred income tax balances by comparing prior year tax estimates to actual tax returns filed, and evaluating the Company's
reconciliation of the deferred income tax balances to the underlying temporary differences.
Evaluation of capitalization of costs relating to track and railway infrastructure and depreciation related to properties As discussed in Note 11 to the consolidated financial statements, capital additions were $2,863 million for the year ended December 31, 2020, of which $1,427 million related to track and railway infrastructure maintenance, including the replacement of rail, ties, bridge improvements, and
other general track maintenance. As discussed in Note 1 to the consolidated financial statements, expenditures related to self-constructed
properties include direct material, labor, and contracted services, as well as other allocated costs. The Company follows the group method of
depreciation whereby a single composite depreciation rate is applied to the gross investment in a class of similar assets. Depreciation expense
relating to properties was $1,583 million for the year ended December 31, 2020. The Company performs comprehensive Canadian and U.S.
depreciation studies on specific asset groups on a periodic basis, which require significant judgment. These studies incorporate numerous assumptions related to the remaining service lives and the U.S. studies involve a third-party specialist. The depreciation studies consider,
among other factors, the analysis of historical retirement data, and the forecasting of asset life characteristics. Changes in estimated service lives can significantly impact the amount of depreciation expense.
We identified the evaluation of capitalization of costs relating to track and railway infrastructure and depreciation expense related to
properties as a critical audit matter. The magnitude and complexities in self-constructed properties, as well as the judgments involved in
determining whether the expenditure met the Company's pre-determined capitalization criteria required subjective auditor judgment. Further,
there was a high degree of auditor judgment required in evaluating the estimated service lives of the respective asset classes. The following are the primary procedures we performed to address this critical audit matter. We evaluated the design and tested the
operating effectiveness of certain internal controls related to the Company's capital additions process, including controls related to the
monitoring of budget versus actual costs on capital projects and the Company's assessment that the expenditures charged to projects meet
the Company's pre-determined capitalization criteria. We also evaluated the design and tested the operating effectiveness of certain internal
controls related to the Company's depreciation expense process, including controls related to the Company's assessment of the Canadian and
U.S. depreciation studies. For a sample of capital expenditure additions, we examined underlying documentation and assessed whether the
expenditure met the Company's pre-determined capitalization criteria. The testing was performed at a disaggregated level by type of cost
(including direct material, labor, and contracted services), and for rail, included comparisons to prior period per unit measures by region. We compared the data used in depreciation studies to underlying documentation for certain asset classes. To evaluate the reasonableness of
significant assumptions used in determining the estimated service lives in the Company's Canadian and U.S. depreciation studies, we
compared the Company's historical retirement patterns to the service lives used in the depreciation studies, and interviewed both the
Company's personnel with specialized knowledge of the subject matter and, for certain asset classes, a third party specialist.
(s) KPMG LLP*
We have served as the Company's auditor since 1992.
Montreal, Canada February 1, 2021
* CPA auditor, CA, public accountancy permit No. A123145
60 CN 12020 Annual Report

Report of Independent Registered Public Accounting Firm
To the Shareholders and Board of Directors Canadian National Railway Company:
Opinion on internal control over financial reporting
We have audited the Canadian National Railway Company's (the "Company") internal control over financial reporting as of December 31, 2020,
based on criteria established in Internal Control - Integrated Framework (2013) issued by the Committee of Sponsoring Organizations of the Treadway Commission. In our opinion, the Company maintained, in all material respects, effective internal control over financial reporting as of
December 31, 2020, based on criteria established in Internal Control - Integrated Framework (2013) issued by the Committee of Sponsoring Organizations of the Treadway Commission ("COSO").
We also have audited, in accordance with the standards of the Public Company Accounting Oversight Board (United States) ("PCA0B"), the
consolidated balance sheets of the Company as of December 31, 2020 and 2019, the related consolidated statements of income,
comprehensive income, changes in shareholders' equity and cash flows for each of the years in the three-year period ended December 31, 2020,
and the related notes, and our report dated February 1, 2021 expressed an unqualified opinion on those consolidated financial statements.
Basis for opinion
The Company's management is responsible for maintaining effective internal control over financial reporting and for its assessment of the effectiveness of internal control over financial reporting included in the accompanying Managements Report on Internal Control over Financial
Reporting. Our responsibility is to express an opinion on the Company's internal control over financial reporting based on our audit. We are a
public accounting firm registered with the PCAOB and are required to be independent with respect to the Company in accordance with the U.S.
federal securities laws and the applicable rules and regulations of the Securities and Exchange Commission and the PCAOB.
We conducted our audit in accordance with the standards of the PCAOB. Those standards require that we plan and perform the audit to
obtain reasonable assurance about whether effective internal control over financial reporting was maintained in all material respects. Our audit of internal control over financial reporting included obtaining an understanding of internal control over financial reporting, assessing the risk that a material weakness exists, and testing and evaluating the design and operating effectiveness of internal control based on the assessed
risk. Our audit also included performing such other procedures as we considered necessary in the circumstances. We believe that our audit
provides a reasonable basis for our opinion.
Definition and limitations of internal control over financial reporting
A company's internal control over financial reporting is a process designed to provide reasonable assurance regarding the reliability of financial
reporting and the preparation of financial statements for external purposes in accordance with generally accepted accounting principles. A company's internal control over financial reporting includes those policies and procedures that (1) pertain to the maintenance of records that, in
reasonable detail, accurately and fairly reflect the transactions and dispositions of the assets of the company; (2) provide reasonable assurance
that transactions are recorded as necessary to permit preparation of financial statements in accordance with generally accepted accounting
principles, and that receipts and expenditures of the company are being made only in accordance with authorizations of management and
directors of the company; and (3) provide reasonable assurance regarding prevention or timely detection of unauthorized acquisition, use, or
disposition of the company's assets that could have a material effect on the financial statements. Because of its inherent limitations, internal control over financial reporting may not prevent or detect misstatements. Also, projections of
any evaluation of effectiveness to future periods are subject to the risk that controls may become inadequate because of changes in conditions,
or that the degree of compliance with the policies or procedures may deteriorate.
(s) KPMG LLP*
Montreal, Canada February 1, 2021
* CPA auditor, CA, public accountancy permit No. A123145
© 2020 KPMG LLP, an Ontario limited liability partnership and a member firm of the KPMG global organization of independent member firms affiliated with KPMG International
Limited, a private English company limited by guarantee. All rights reserved.
2020 Annual Report 61

Consolidated Statements of Income
In millions, except per share data Year ended December 31, 2020 2019 2018
Revenues (Note 4) $ 13,819 $ 14,917 $ 14,321
Operating expenses Labor and fringe benefits 2,723 2,922 2,860 Purchased services and material 2,152 2,267 1,971
Fuel 1,152 1,637 1,732 Depreciation and amortization (Note 11) 1,589 1,562 1,329 Equipment rents 432 444 467 Casualty and other 508 492 469 Loss on assets held for sale (Note 5) 486 - -
Total operating expenses 9,042 9,324 8,828
Operating income 4,777 5,593 5,493
Interest expense (554) (538) (489)
Other components of net periodic benefit income (Note 17) 315 321 302
Other income (Note 6) 6 53 376
Income before income taxes 4,544 5,429 5,682
Income tax expense (Note 7) (982) (1,213) (1,354)
Net income $ 3,562 $ 4,216 $ 4,328
Earnings per share (Note 8) Basic $ 5.01 $ 5.85 $ 5.89 Diluted $ 5.00 $ 5.83 $ 5.87
Weighted-average number of shares (Note 8) Basic 711.3 720.1 734.5 Diluted 713.0 722.6 737.7
See accompanying notes to consolidated financial statements.
Consolidatea statements of Comprehensive Income
In millions Year ended December 31, 2020 2019 2018
Net income $ 3,562 $ 4,216 $ 4,328
Other comprehensive income (loss) (Note 20)
Net gain (loss) on foreign currency translation (82) (256) 403
Net change in pension and other postretirement benefit plans (Note 17) 160 (440) (759)
Other comprehensive income (loss) before income taxes 78 (696) (356)
Income tax recovery (expense) (67) 62 291
Other comprehensive income (loss) 11 (634) (65)
Comprehensive income $ 3,573 $ 3,582 $ 4,263
See accompanying notes to consolidated financial statements.
62 CN 12020 Annual Report

Consolidated Balance Sheets
In millions December 31, 2020 2019
Assets
Current assets Cash and cash equivalents $ 569 $ 64 Restricted cash and cash equivalents (Note 15) 531 524 Accounts receivable (Note 9) 1,054 1,213 Material and supplies 583 611 Other current assets (Note 10) 365 418
Total current assets 3,102 2,830
Properties (Note 11) 40,069 39,669 Operating lease right-of-use assets (Note 12) 435 520 Pension asset (Note 17) 777 336 Intangible assets, goodwill and other (Note 13) 421 429
Total assets $ 44,804 $ 43,784
Liabilities and shareholders' equity
Current liabilities Accounts payable and other (Note 14) $ 2,364 $ 2,357 Current portion of long-term debt (Note 15) 910 1,930
Total current liabilities 3,274 4,287
Deferred income taxes (Note 7) 8,271 7,844 Other liabilities and deferred credits (Note 16) 534 634 Pension and other postretirement benefits (Note 17) 767 733 Long-term debt (Note 15) 11,996 11,866 Operating lease liabilities (Note 12) 311 379
Shareholders' equity Common shares (Note 18) 3,698 3,650 Common shares in Share Trusts (Note 18) (115) (163) Additional paid-in capital 379 403 Accumulated other comprehensive loss (Note 20) (3,472) (3,483) Retained earnings 19,161 17,634
Total shareholders' equity 19,651 18,041
Total liabilities and shareholders' equity $ 44,804 $ 43,784
See accompanying notes to consolidated financial statements.
On behalf of the Board of Directors:
(s) Robert Pace (s) Jean-Jacques Ruest
Director Director
2020 Annual Report 63

Consolidated Statements of Changes in Shareholders' Equity
In millions
Number of common shares
Common shares
Common shares
in Share Trusts
Additional paid-in capital
Accumulated other
comprehensive loss
Retained earnings
Total shareholders'
equity Share
Outstanding Trusts
Balance at December 31, 2017 742.6 2.0 $ 3,613 $ (168) $ 434 $ (2,784) $ 15,561 $ 16,656
Net income 4,328 4,328
Stock options exercised 1.7 120 (17) 103
Settlement of equity settled awards (Note 18) 0.4 (0.4) 31 (68) (30) (67)
Stock-based compensation expense and other 59 (2) 57
Repurchase of common shares (Note 18) (19.0) (99) (1,901) (2,000)
Share purchases by Share Trusts (Note 18) (0.4) 0.4 (38) (38)
Other comprehensive loss (Note 20) (65) (65)
Dividends ($1.82 per share) (1,333) (1,333)
Balance at December 31, 2018 725.3 2.0 3,634 (175) 408 (2,849) 16,623 17,641
Net income 4,216 4,216
Stock options exercised 1.1 89 (12) 77
Settlement of equity settled awards (Note 18) 0.5 (0.5) 45 (56) (61) (72)
Stock-based compensation expense and other 63 (2) 61
Repurchase of common shares (Note 18) (14.3) (73) (1,627) (1,700)
Share purchases by Share Trusts (Note 18) (0.3) 0.3 (33) (33)
Other comprehensive loss (Note 20) (634) (634)
Dividends ($2.15 per share) (1,544) (1,544)
Cumulative-effect adjustment from the adoption of ASU 2016-02 (1) 29 29
Balance at December 31, 2019 712.3 1.8 3,650 (163) 403 (3,483) 17,634 18,041
Net income 3,562 3,562
Stock options exercised 0.8 65 (9) 56
Settlement of equity settled awards (Note 18) 0.6 (0.6) 62 (82) (37) (57)
Stock-based compensation expense and other 67 (2) 65
Repurchase of common shares (Note 18) (3.3) (17) (362) (379)
Share purchases by Share Trusts (Note 18) (0.1) 0.1 (14) (14)
Other comprehensive income (Note 20) 11 11
Dividends ($2.30 per share) (1,634) (1,634)
Balance at December 31, 2020 710.3 1.3 $ 3,698 $ (115) $ 379 $ (3,472) $ 19,161 $ 19,651
(1) The Company adopted Accounting Standards Update (ASU) 2016-02: Leases and related amendments (Topic 842) in the first quarter of 2019 using a modified retrospective approach with a cumulative-effect adjustment to Retained earnings recognized on January 1, 2019, with no restatement of comparative period financial information.
See accompanying notes to consolidated financial statements.
64 CN 12020 Annual Report

Consolidated Statements of Cash Flows
In millions Year ended December 31, 2020 2019 2018
Operating activities Net income $ 3,562 $ 4,216 $ 4,328 Adjustments to reconcile net income to net cash provided by operating activities:
Depreciation and amortization 1,589 1,562 1,329 Pension income and funding (234) (288) (209) Deferred income taxes (Note 7) 487 569 527 Loss on assets held for sale (Note 5) 486 — —Gain on disposal of property (Note 6) — — (338)
Changes in operating assets and liabilities: Accounts receivable 158 (7) (91) Material and supplies 20 (60) (120) Accounts payable and other (49) (498) 379 Other current assets — 5 14
Other operating activities, net 146 424 99
Net cash provided by operating activities 6,165 5,923 5,918
Investing activities Property additions (2,863) (3,865) (3,531) Acquisitions, net of cash acquired (Note 3) (8) (259) Disposal of property (Note 6) 194 Other investing activities, net (75) (66) (67)
Net cash used in investing activities (2,946) (4,190) (3,404)
Financing activities Issuance of debt (Note 15) 1,789 1,653 3,268 Repayment of debt (Note 15) (1,221) (402) (2,393) Change in commercial paper, net (Note 15) (1,273) 141 99 Settlement of foreign exchange forward contracts on debt 26 2 53 Issuance of common shares for stock options exercised (Note 19) 56 77 103 Withholding taxes remitted on the net settlement of equity settled awards
(Note 19) (48) (61) (51) Repurchase of common shares (Note 18) (379) (1,700) (2,000) Purchase of common shares for settlement of equity settled awards (9) (11) (16) Purchase of common shares by Share Trusts (Note 18) (14) (33) (38) Dividends paid (1,634) (1,544) (1,333) Acquisition, additional cash consideration (Note 3) — (25) —
Net cash used in financing activities (2,707) (1,903) (2,308)
Effect of foreign exchange fluctuations on cash, cash equivalents, restricted cash, and restricted cash equivalents — (1) —
Net increase (decrease) in cash, cash equivalents, restricted cash, and restricted cash equivalents 512 (171) 206
Cash, cash equivalents, restricted cash, and restricted cash equivalents, beginning of year 588 759 553
Cash, cash equivalents, restricted cash, and restricted cash equivalents, end of year $ 1,100 $ 588 $ 759
Cash and cash equivalents, end of year $ 569 $ 64 $ 266 Restricted cash and cash equivalents, end of year 531 524 493
Cash, cash equivalents, restricted cash, and restricted cash equivalents, end of year $ 1,100 $ 588 $ 759
Supplemental cash flow information Interest paid $ (551) $ (521) $ (488) Income taxes paid (Note 7) $ (353) $ (822) $ (776)
See accompanying notes to consolidated financial statements.
2020 Annual Report 65

Notes to the Consolidated Financial Statements
Contents
1 Summary of significant accounting policies 67
2 Recent accounting pronouncements 73
3 Business combinations 74
4 Revenues 75
5 Assets held for sale 76
6 Other income 76
7 Income taxes 77
8 Earnings per share 80
9 Accounts receivable 80
10 Other current assets 80
11 Properties 81
12 Leases 81
13 Intangible assets, goodwill and other 83
14 Accounts payable and other 83
15 Debt 84
16 Other liabilities and deferred credits 87
17 Pensions and other postretirement benefits 88
18 Share capital 95
19 Stock-based compensation 97
20 Accumulated other comprehensive loss 102
21 Major commitments and contingencies 103
22 Financial instruments 106
23 Segmented information 107
24 Subsequent events 108
66 CN 12020 Annual Report

Notes to the Consolidated Financial Statements
Canadian National Railway Company, together with its wholly-owned subsidiaries, collectively "CN" or the "Company', is engaged in the rail and related transportation business. CN spans Canada and the United States of America (U.S.), the only railroad connecting Canada's Eastern and
Western coasts with the U.S. South. CN's freight revenues are derived from the movement of a diversified and balanced portfolio of goods, including petroleum and chemicals, grain and fertilizers, coal, metals and minerals, forest products, intermodal and automotive.
1 - Summary of significant accounting policies
Basis of presentation
These consolidated financial statements are expressed in Canadian dollars, except where otherwise indicated, and have been prepared in
accordance with United States generally accepted accounting principles (GAAP) as codified in the Financial Accounting Standards Board
(FASB) Accounting Standards Codification (ASC).
Principles of consolidation
These consolidated financial statements include the accounts of all subsidiaries and variable interest entities for which the Company is the primary beneficiary. The Company is the primary beneficiary of the Employee Benefit Plan Trusts ("Share Trusts") as the Company funds the Share Trusts. The Company's investments in which it has significant influence are accounted for using the equity method and all other investments for which fair value is not readily determinable are accounted for at cost minus impairment, plus or minus observable price
changes.
Use of estimates The preparation of financial statements in conformity with GAAP requires management to make estimates and assumptions that affect the reported amounts of revenues, expenses, assets and liabilities, and the disclosure of contingent assets and liabilities at the date of the financial
statements. On an ongoing basis, management reviews its estimates, including those related to goodwill, intangible assets, identified assets
and liabilities acquired in business combinations, income taxes, depreciation, pensions and other postretirement benefits, personal injury and
other claims, and environmental matters, based upon available information. Actual results could differ from these estimates.
Revenues
Nature of services
The Company's revenues consist of freight revenues and other revenues. Freight revenues include revenue from the movement of freight over rail and are derived from the following seven commodity groups: • Petroleum and chemicals, which includes chemicals and plastics, refined petroleum products, crude and condensate, and sulfur; • Metals and minerals, which includes energy materials, metals, minerals, and iron ore;
• Forest products, which includes lumber, pulp, paper, and panels; • Coal, which includes coal and petroleum coke; • Grain and fertilizers, which includes Canadian regulated grain, Canadian commercial grain, U.S. grain, potash and other fertilizers; • Intermodal, which includes rail and trucking services for domestic and international traffic; and • Automotive, which includes finished vehicles and auto parts.
Freight revenues also comprise revenues for optional services beyond the basic movement of freight including asset use, switching, storage,
and other services.
Other revenues are derived from non-rail logistics services that support the Company's rail business including vessels and docks,
transloading and distribution, automotive logistics, and freight forwarding and transportation management.
Revenue recognition Revenues are recognized when control of promised services is transferred to customers in an amount that reflects the consideration the
Company expects to be entitled to receive in exchange for those services.
The Company accounts for contracts with customers when it has approval and commitment from both parties, each party's rights have
been identified, payment terms are defined, the contract has commercial substance and collection is probable. For contracts that involve
multiple performance obligations, the Company allocates the transaction price to each performance obligation in the contract based on relative
standalone selling prices and recognizes revenue when, or as, performance obligations in the contract are satisfied.
Revenues are presented net of taxes collected from customers and remitted to governmental authorities.
2020 Annual Report 67
Notes to the Consolidated Financial Statements
Freight revenues Freight services are arranged through publicly-available tariffs or customer-specific agreements that establish the pricing, terms and conditions
for freight services offered by the Company. For revenue recognition purposes, a contract for the movement of freight over rail exists when
shipping instructions are sent by a customer and have been accepted by the Company in connection with the relevant tariff or customer-
specific agreement. Revenues for the movement of freight over rail are recognized over time due to the continuous transfer of control to the customer as
freight moves from origin to destination. Progress towards completion of the performance obligation is measured based on the transit time of freight from origin to destination. The allocation of revenues between periods is based on the relative transit time in each period with expenses recorded as incurred. Revenues related to freight contracts that require the involvement of another rail carrier to move freight from origin to
destination are reported on a net basis. Freight movements are completed over a short period of time and are generally completed before
payment is due. Freight receivables are included in Accounts receivable on the Consolidated Balance Sheets.
The Company has no material contract assets associated with freight revenues.
Contract liabilities represent consideration received from customers for which the related performance obligation has not been satisfied.
Contract liabilities are recognized into revenues when or as the related performance obligation is satisfied. The Company includes contract liabilities within Accounts payable and other and Other liabilities and deferred credits on the Consolidated Balance Sheets.
Revenues for optional services are recognized at a point in time or over time as performance obligations are satisfied, depending on the
nature of the service.
Freight contracts may be subject to variable consideration in the form of volume-based incentives, rebates, or other items, which affect the
transaction price. Variable consideration is recognized as revenue to the extent that it is probable that a significant reversal in the amount of
cumulative revenue recognized will not occur. Variable consideration is accrued on the basis of managements best estimate of the expected
amount, which is based on available historical, current and forecasted information.
Other revenues Other revenues are recognized at a point in time or over time as performance obligations are satisfied, depending on the nature of the service.
Income taxes
The Company follows the asset and liability method of accounting for income taxes. Under the asset and liability method, the change in the net
deferred income tax asset or liability is included in the computation of Net income or Other comprehensive income (loss). Deferred income tax
assets and liabilities are measured using enacted tax rates expected to apply to taxable income in the years in which temporary differences are
expected to be recovered or settled.
Earnings per share
Basic earnings per share is calculated using the weighted-average number of basic shares outstanding during the period. The weighted-average
number of basic shares outstanding excludes shares held in the Share Trusts and includes vested equity settled stock-based compensation
awards other than stock options. Diluted earnings per share is calculated using the weighted-average number of diluted shares outstanding
during the period, applying the treasury stock method. The weighted-average number of diluted shares outstanding includes the dilutive effects
of common shares issuable upon exercise of outstanding stock options and nonvested equity settled awards.
Foreign currency
All of the Company's foreign subsidiaries use the US dollar as their functional currency. Accordingly, the foreign subsidiaries' assets and
liabilities are translated into Canadian dollars at the exchange rate in effect at the balance sheet date and the revenues and expenses are
translated at the average exchange rates during the year. All adjustments resulting from the translation of the foreign operations are recorded in
Other comprehensive income (loss).
The Company designates the US dollar-denominated debt of the parent company as a foreign currency hedge of its net investment in
foreign operations. Accordingly, foreign exchange gains and losses, from the dates of designation, on the translation of the US dollar-denominated debt are included in Other comprehensive income (loss).
Cash and cash equivalents Cash and cash equivalents include highly liquid investments purchased three months or less from maturity and are stated at cost plus accrued interest, which approximates fair value.
68 CN 12020 Annual Report

Notes to the Consolidated Financial Statements
Restricted cash and cash equivalents The Company has the option, under its bilateral letter of credit facility agreements with various banks, to pledge collateral in the form of cash
and cash equivalents for a minimum term of one month, equal to at least the face value of the letters of credit issued. Restricted cash and cash equivalents include highly liquid investments purchased three months or less from maturity and are stated at cost plus accrued interest, which
approximates fair value.
Accounts receivable
Accounts receivable are recorded at cost net of billing adjustments and an allowance for credit losses. The allowance for credit losses is based on relevant information about past events, including historical experience, current conditions, and reasonable and supportable forecasts that
affect the collectibility of the reported amount. When a receivable is deemed uncollectible, it is written off against the allowance for credit
losses. Subsequent recoveries of amounts previously written off are credited to bad debt expense in Casualty and other in the Consolidated
Statements of Income.
Material and supplies
Material and supplies, which consist mainly of rail, ties, and other items for construction and maintenance of property and equipment, as well as
diesel fuel, are measured at weighted-average cost.
Assets held for sale
Assets that are classified as held for sale are measured at the lower of their carrying amount or fair value less expected selling costs
("estimated selling price") with a loss recognized to the extent that the carrying amount exceeds the estimated selling price. The classification
is applicable at the date upon which the sale of assets is probable, and the assets are available for immediate sale in their present condition.
The transfer of the assets must also be expected to qualify for recognition as a completed sale within the year following the date of classification.
Assets once classified as held for sale, are not subject to depreciation or amortization and both the assets and any liabilities directly
associated with the assets held for sale are classified as current in the Company's Consolidated Balance Sheets.
Subsequent changes to the estimated selling price of assets held for sale are recorded as gains or losses to the Consolidated Statements
of Income wherein the recognition of subsequent gains is limited to the cumulative loss previously recognized.
Properties
Capitalization of costs The Company's railroad operations are highly capital intensive. The Company's properties mainly consist of homogeneous or network-type
assets such as rail, ties, ballast and other structures, which form the Company's Track and roadway properties, and Rolling stock. The
Company's capital expenditures are for the replacement of existing assets and for the purchase or construction of new assets to enhance
operations or provide new service offerings to customers. A large portion of the Company's capital expenditures are for self-constructed
properties, including the replacement of existing track and roadway assets and track line expansion, as well as major overhauls and large refurbishments of rolling stock.
Expenditures are capitalized if they extend the life of the asset or provide future benefits such as increased revenue-generating capacity,
functionality or service capacity. The Company has a process in place to determine whether or not costs qualify for capitalization, which requires judgment. For Track and roadway properties, the Company establishes basic capital programs to replace or upgrade the track
infrastructure assets which are capitalized if they meet the capitalization criteria.
In addition, for Track and roadway properties, expenditures that meet the minimum level of activity as defined by the Company are also
capitalized as follows: • grading: installation of road bed, retaining walls, and drainage structures;
• rail and related track material: installation of 39 or more continuous feet of rail;
• ties: installation of 5 or more ties per 39 feet; and • ballast: installation of 171 cubic yards of ballast per mile.
For purchased assets, the Company capitalizes all costs necessary to make the assets ready for their intended use. For self-constructed
properties, expenditures include direct material, labor, and contracted services, as well as other allocated costs. These allocated costs include,
but are not limited to, project supervision, fringe benefits, maintenance on equipment used on projects as well as the cost of small tools and
supplies. The Company reviews and adjusts its allocations, as required, to reflect the actual costs incurred each year.
For the rail asset, the Company capitalizes the costs of rail grinding which consists of restoring and improving the rail profile and removing
irregularities from worn rail to extend the service life. The service life of the rail asset is increased incrementally as rail grinding is performed
2020 Annual Report 69

Notes to the Consolidated Financial Statements
thereon, and as such, the costs incurred are capitalized given that the activity extends the service life of the rail asset beyond its original or current condition as additional gross tons can be carried over the rail for its remaining service life.
For the ballast asset, the Company engages in shoulder ballast undercutting that consists of removing some or all of the ballast, which has
deteriorated over its service life, and replacing it with new ballast. When ballast is installed as part of a shoulder ballast undercutting project, it
represents the addition of a new asset and not the repair or maintenance of an existing asset. As such, the Company capitalizes expenditures
related to shoulder ballast undercutting given that an existing asset is retired and replaced with a new asset. Under the group method of
accounting for properties, the deteriorated ballast is retired at its historical cost.
Costs of deconstruction and removal of replaced assets, referred to herein as dismantling costs, are distinguished from installation costs for self-constructed properties based on the nature of the related activity. For Track and roadway properties, employees concurrently perform
dismantling and installation of new track and roadway assets and, as such, the Company estimates the amount of labor and other costs that
are related to dismantling. The Company determines dismantling costs based on an analysis of the track and roadway installation process.
Expenditures relating to the Company's properties that do not meet the Company's capitalization criteria are expensed as incurred. For
Track and roadway properties, such expenditures include but are not limited to spot tie replacement, spot or broken rail replacement, physical
track inspection for detection of rail defects and minor track corrections, and other general maintenance of track infrastructure.
Depreciation
Properties are carried at cost less accumulated depreciation including asset impairment write-downs. The cost of properties, including those
under finance leases, net of asset impairment write-downs, is depreciated on a straight-line basis over their estimated service lives, measured in
years, except for rail and ballast whose service lives are measured in millions of gross tons. The Company follows the group method of
depreciation whereby a single composite depreciation rate is applied to the gross investment in a class of similar assets, despite small
differences in the service life or salvage value of individual property units within the same asset class. The Company uses approximately 40
different depreciable asset classes.
For all depreciable asset classes, the depreciation rate is based on the estimated service lives of the assets. Assessing the reasonableness of the estimated service lives of properties requires judgment and is based on currently available information, including
periodic depreciation studies conducted by the Company. The Company's United States (U.S.) properties are subject to comprehensive
depreciation studies as required by the Surface Transportation Board (STB) and are conducted by external experts. Depreciation studies for
Canadian properties are not required by regulation and are conducted internally. Studies are performed on specific asset groups on a periodic
basis. Changes in the estimated service lives of the assets and their related composite depreciation rates are implemented prospectively.
The service life of the rail asset is based on expected future usage of the rail in its existing condition, determined using railroad industry
research and testing (based on rail characteristics such as weight, curvature and metallurgy), factoring in the rail assets usage to date. The annual composite depreciation rate for the rail asset is determined by dividing the estimated annual number of gross tons carried over the rail
by the estimated service life of the rail measured in millions of gross tons. The Company amortizes the cost of rail grinding over the remaining
life of the rail asset, which includes the incremental life extension generated by rail grinding.
Given the nature of the railroad and the composition of its network which is made up of homogeneous long-lived assets, it is impractical to
maintain records of specific properties at their lowest unit of property.
Retirements of assets occur through the replacement of an asset in the normal course of business, the sale of an asset or the
abandonment of a section of track. For retirements in the normal course of business, generally the life of the retired asset is within a reasonable range of the expected useful life, as determined in the depreciation studies, and, as such, no gain or loss is recognized under the group method.
The assets cost is removed from the asset account and the difference between its estimated historical cost and estimated related
accumulated depreciation (net of salvage proceeds and dismantling costs), if any, is recorded as an adjustment to accumulated depreciation
and no gain or loss is recognized. The estimated historical cost of the retired asset is estimated by using deflation factors or indices that
closely correlate to the properties comprising the asset classes in combination with the estimated age of the retired asset using a first-in, first-
out approach, and applying it to the replacement value of the asset.
In each depreciation study, an estimate is made of any excess or deficiency in accumulated depreciation for all corresponding asset classes to ensure that the depreciation rates remain appropriate. The excess or deficiency in accumulated depreciation is amortized over the remaining life of the asset class.
For retirements of depreciable properties that do not occur in the normal course of business, the historical cost, net of salvage proceeds, is
recorded as a gain or loss in income. A retirement is considered not to be in the normal course of business if it meets the following criteria: (i) it is unusual, (ii) it is significant in amount, and (iii) it varies significantly from the retirement pattern identified through depreciation studies. A
gain or loss is recognized in Other income for the sale of land or disposal of assets that are not part of railroad operations.
70 CN 12020 Annual Report

Notes to the Consolidated Financial Statements
Leases The Company engages in short and long-term leases for rolling stock including locomotives and freight cars, equipment, real estate and service
contracts that contain embedded leases. The Company determines whether or not a contract contains a lease at inception. Leases with a term
of twelve months or less are not recorded by the Company on the Consolidated Balance Sheets.
Finance and operating lease right-of-use assets and liabilities are recognized based on the present value of the future lease payments over
the lease term at the commencement date. Where the implicit interest rate is not determinable from the lease, the Company uses internal
incremental borrowing rates by tenor and currency to initially measure leases in excess of twelve months on the Consolidated Balance Sheets.
Operating lease expense is recognized on a straight-line basis over the lease term. The Company's lease contracts may contain termination, renewal, and/or purchase options, residual value guarantees, or a combination
thereof, all of which are evaluated by the Company on a quarterly basis. The majority of renewal options available extend the lease term from
one to five years. The Company accounts for such contract options when the Company is reasonably certain that it will exercise one of these options.
Lease contracts may contain lease and non-lease components that the Company generally accounts for separately, with the exception of
the freight car asset category for which the Company has elected to not separate the lease and non-lease components.
Intangible assets
Intangible assets consist mainly of customer contracts and relationships acquired through business acquisitions. Intangible assets are
generally amortized on a straight-line basis over their expected useful lives, ranging from 20 to 50 years. If a change in the estimated useful life
of an intangible asset is determined, amortization is adjusted prospectively.
With respect to impairment, the Company tests the recoverability of its intangible assets held and used whenever events or changes in
circumstances indicate that the carrying amount may not be recoverable, based on future undiscounted cash flows. If the carrying amount of
an intangible asset is not recoverable and exceeds the fair value, an impairment loss is recognized for the amount by which the carrying amount
of the asset exceeds the fair value.
Goodwill
The Company recognizes goodwill as the excess of the purchase price over the fair value of identifiable net assets acquired in business
combinations. Goodwill is assigned to the reporting units that are expected to benefit from the business acquisition. The carrying amount of
goodwill is not amortized; instead, it is tested for impairment annually as of the first day of the fiscal fourth quarter or more frequently if events
or changes in circumstances indicate that it is more likely than not that the fair value of a reporting unit is less than the carrying amount.
With respect to impairment, the Company may first assess certain qualitative factors to determine if it is more likely than not that the fair value of a reporting unit is less than its carrying amount, including goodwill, or proceed directly to a quantitative goodwill impairment test.
Qualitative factors include but are not limited to, economic, market and industry conditions, cost factors and overall financial performance of
the reporting unit, and events such as changes in management or customers. If the qualitative assessment indicates that it is more likely than
not that the fair value of a reporting unit is less than its carrying amount, the quantitative impairment test must be performed. The quantitative
impairment test is performed by comparing the fair value of a reporting unit with its carrying amount, including goodwill, and an impairment
loss is recognized for the amount by which the carrying amount exceeds the reporting unit's fair value, up to the value of goodwill. The
Company defines the fair value of a reporting unit as the price that would be received to sell the reporting unit as a whole in an orderly transaction between market participants as of the impairment date. To determine the fair value of a reporting unit, the Company uses the
discounted cash flow method using the pre-tax discount rate that reflects current market assessments of the time value of money and the risks
specific to the asset or group of assets.
Accounts receivable securitization
Based on the structure of its accounts receivable securitization program, the Company accounts for the proceeds received as secured borrowings.
2020 Annual Report 71

Notes to the Consolidated Financial Statements
Pensions Pension costs are determined using actuarial methods. Net periodic benefit cost (income) includes the current service cost of pension benefits
provided in exchange for employee service rendered during the year, which is recorded in Labor and fringe benefits expense. Net periodic
benefit cost (income) also includes the following, which are recorded in Other components of net periodic benefit income (cost):
• the interest cost of pension obligations;
• the expected long-term return on pension fund assets;
• the amortization of prior service costs and amendments over the expected average remaining service life of the employee group covered
by the plans; and • the amortization of cumulative net actuarial gains and losses in excess of 10% of the greater of the beginning of year balances of the
projected benefit obligation or market-related value of plan assets, over the expected average remaining service life of the employee group
covered by the plans.
The pension plans are funded through contributions determined in accordance with the projected unit credit actuarial cost method.
Postretirement benefits other than pensions
The Company accrues the cost of postretirement benefits other than pensions using actuarial methods. These benefits, which are funded as they become due, include life insurance programs, medical benefits and, for a closed group of employees, free rail travel benefits.
The Company amortizes the cumulative net actuarial gains and losses in excess of 10% of the projected benefit obligation at the beginning
of the year, over the expected average remaining service life of the employee group covered by the plan.
Additional paid-in capital
Additional paid-in capital includes the stock-based compensation expense on equity settled awards and other items relating to equity settled
awards. Upon the exercise of stock options, the stock-based compensation expense related to those awards is reclassified from Additional
paid-in capital to Common shares. Upon settlement of all other equity settled awards, the Company reclassifies from Additional paid-in capital to Retained Earnings the stock-based compensation expense and other items related to equity settled awards, up to the amount of the
settlement cost. The excess, if any, of the settlement cost over the stock-based compensation expense is recorded in Retained Earnings.
Stock-based compensation
For equity settled awards, stock-based compensation costs are accrued over the requisite service period based on the fair value of the awards
at the grant date. The grant date fair value of performance share unit (PSU) awards is dependent on the type of PSU award. The grant date fair
value of PSU-ROIC awards is determined using a lattice-based model incorporating a minimum share price condition and the grant date fair value of PSU-TSR awards is determined using a Monte Carlo simulation model. The grant date fair value of equity settled deferred share unit
(DSU) awards is determined using the stock price at the grant date. The grant date fair value of stock option awards is determined using the
Black-Scholes option-pricing model. For cash settled awards, stock-based compensation costs are accrued over the requisite service period
based on the fair value determined at each period-end. The fair value of cash settled DSU awards is determined using their intrinsic value.
Personal injury and other claims
In Canada, the Company accounts for costs related to employee work-related injuries based on actuarially developed estimates on a discounted
basis of the ultimate cost associated with such injuries, including compensation, health care and third-party administration costs. In the U.S., the Company accrues the expected cost for personal injury, property damage and occupational disease claims, based on actuarial estimates of
their ultimate cost on an undiscounted basis. For all other legal actions in Canada and the U.S., the Company maintains, and regularly updates
on a case-by-case basis, provisions for such items when the expected loss is both probable and can be reasonably estimated based on
currently available information.
Environmental expenditures
Environmental expenditures that relate to current operations, or to an existing condition caused by past operations, are expensed as incurred. Environmental expenditures that provide a future benefit are capitalized. Environmental liabilities are recorded when environmental
assessments occur, remedial efforts are probable, and when the costs, based on a specific plan of action in terms of the technology to be used
and the extent of the corrective action required, can be reasonably estimated. The Company accrues its allocable share of liability taking into
account the Company's alleged responsibility, the number of potentially responsible parties and their ability to pay their respective shares of the liability. Recoveries of environmental remediation costs from other parties are recorded as assets when their receipt is deemed probable.
72 CN 12020 Annual Report

Notes to the Consolidated Financial Statements
Derivative financial instruments The Company uses derivative financial instruments from time to time in the management of its interest rate and foreign currency exposures.
Derivative instruments are recorded on the balance sheet at fair value. The changes in fair value of derivative instruments not designated or not
qualified as a hedge are recorded in Net income in the current period.
2 - Recent accounting pronouncements
The following recent Accounting Standards Update (ASU) issued by the FASB was adopted by the Company during the current year:
ASU 2016-13 Financial instruments - Credit losses (Topic 326): Measurement of credit losses on financial instruments
The ASU requires financial assets measured at amortized cost to be presented at the net amount expected to be collected. The new standard
replaces the current incurred loss impairment methodology with one that reflects expected credit losses.
The Company adopted this standard in the first quarter of 2020 with an effective date of January 1, 2020. The adoption of this standard did
not have an impact on the Company's Consolidated Financial Statements, other than the update to the Accounts receivable accounting policy in
Note 1- Summary of significant accounting policies.
The following recent ASU issued by FASB came into effect during the current year and has not been adopted by the Company:
ASU 2020-04 Reference rate reform (Topic 848): Facilitation of the effects of reference rate reform on financial reporting
London Interbank Offered Rate (LIBOR) is a benchmark interest rate referenced in a variety of agreements that are used by all types of entities. At the end of 2021, banks will no longer be required to report information that is used to determine LIBOR. As a result, LIBOR could be
discontinued. Other interest rates used globally could also be discontinued for similar reasons.
The ASU provides optional expedients and exceptions for applying generally accepted accounting principles to transactions affected by
reference rate reform if certain criteria are met. These transactions include contract modifications, hedging relationships, and sale or transfer of debt securities classified as held-to-maturity.
The provisions of the ASU are effective starting on March 12, 2020; however, they will only be available until December 31, 2022, when the
reference rate replacement activity is expected to be completed. The Company may apply the provisions of the ASU as of the beginning of a
reporting period when the elections are made, or prospectively from the date within an interim period that includes or is subsequent to
March 12, 2020. The Company currently has outstanding loans and finance lease obligations referencing LIBOR totaling approximately
US$325 million that would be affected by the provisions of this ASU. The Company is evaluating the effects that the adoption of the ASU will
have on its Consolidated Financial Statements and related disclosures, and whether it will elect to apply any of the optional expedients and
exceptions provided in the ASU.
The following recent ASU issued by FASB has an effective date after December 31, 2020 and has not been adopted by the Company:
ASU 2019-12 Income taxes (Topic 740): Simplifying the accounting for income taxes
The ASU adds new guidance to simplify accounting for income taxes, changes the accounting for certain income tax transactions and makes minor improvements to the codification. The ASU introduces new guidance that provides a policy election to not allocate consolidated income
taxes when a member of a consolidated tax return is not subject to income tax, and provides guidance to evaluate whether a step-up in tax
basis of goodwill relates to a business combination in which book goodwill was recognized or a separate transaction. In addition, the ASU changes the current guidance by making an intraperiod allocation if there is a loss in continuing operations and gains outside of continuing
operations; by determining when a deferred tax liability is recognized after an investor in a foreign entity transitions to or from the equity
method of accounting; by accounting for tax law changes and year-to-date losses in interim periods; and by determining how to apply the
income tax guidance to franchise taxes and other taxes that are partially based on income. The ASU is effective for annual and any interim period beginning after December 15, 2020. Early adoption is permitted.
The Company has evaluated the effects that the adoption of the ASU will have on its Consolidated Financial Statements and has
concluded it will not have a significant impact.
Other recently issued ASUs required to be applied for periods beginning on or after January 1, 2021 have been evaluated by the Company and
are not expected to have a significant impact on the Company's Consolidated Financial Statements.
2020 Annual Report 73

Notes to the Consolidated Financial Statements
3 - Business combinations
2019 Acquisition of intermodal division of H&R Transport Limited
On December 2, 2019, the Company acquired the intermodal temperature-controlled transportation division of the Alberta-based H&R Transport
Limited ("H&R"). The acquisition positions CN to expand its presence in moving customer goods by offering more end-to-end rail supply chain
solutions to a wider range of customers.
The Company's Consolidated Balance Sheets include the assets and liabilities of H&R as of December 2, 2019, the acquisition date. Since
the acquisition date, H&R's results of operations have been included in the Company's results of operations. The Company has not provided pro forma information relating to the pre-acquisition period as it was not material.
The total purchase price of $105 million included $95 million cash paid on the closing date and subsequent consideration of $10 million
mostly related to funds withheld for the indemnification of claims, of which $2 million remains to be paid.
The following table summarizes the consideration transferred to acquire H&R, as well as the fair value of the assets acquired and liabilities
assumed, and goodwill that were recognized at the acquisition date:
December 2
In millions 2019
Consideration transferred Cash paid at closing 95
Subsequent consideration (1) 10
Fair value of total consideration transferred 105
Recognized amounts of identifiable assets acquired and liabilities assumed (2)Current assets 10
Non-current assets (3) 84
Non-current liabilities (1)
Total identifiable net assets (4) 93
Goodwill (5) 12
(1) Primarily comprised of funds withheld for the indemnification of claims, of which $2 million remains to be paid.
(2) As at the acquisition date, the purchase price was preliminary and subject to change over the measurement period, permitted to be up to one year from the acquisition date. The Company's purchase price allocation is now final.
(3) Includes identifiable intangible assets of $52 million.
(4) Includes operating lease right-of-use assets and liabilities.
(5) The goodwill acquired through the business combination is mainly attributable to the premium of an established business operation. The goodwill is deductible for tax purposes.
Acquisition of the TransX Group of Companies
On March 20, 2019, the Company acquired the Manitoba-based TransX Group of Companies ("TransX"). TransX provides various transportation
and logistics services, including intermodal, truckload, less than truckload and specialized services. The acquisition positions CN to strengthen
its intermodal business, and allows the Company to expand capacity and foster additional supply chain solutions. The Company's Consolidated Balance Sheets include the assets and liabilities of TransX as of March 20, 2019, the acquisition date. Since
the acquisition date, TransX's results of operations have been included in the Company's results of operations. The Company has not provided pro forma information relating to the pre-acquisition period as it was not material.
The total purchase price of $192 million included an initial cash payment of $170 million, additional consideration of $25 million, less an
adjustment of $3 million in the fourth quarter of 2019 to reflect the settlement of working capital. The acquisition date fair value of the
additional consideration, recorded as a contingent liability, was estimated based on the expected outcome of operational and financial targets,
and remained unchanged since the acquisition date. The fair value measure was based on Level 3 inputs not observable in the market. On
August 27, 2019, the additional consideration was paid.
74 CN 12020 Annual Report

Notes to the Consolidated Financial Statements
The following table summarizes the consideration transferred to acquire TransX, as well as the fair value of the assets acquired and
liabilities assumed, and goodwill that were recognized at the acquisition date:
In millions
March 20
2019
Consideration transferred
Cash paid at closing 170
Additional cash consideration and other (1) 22
Fair value of total consideration transferred 192
Recognized amounts of identifiable assets acquired and liabilities assumed (2)
Current assets 85
Non-current assets (3) 260
Current liabilities (134)
Non-current liabilities (77)
Total identifiable net assets (4) 134
Goodwill (5) 58
(1) Includes additional cash consideration paid of $25 million less an adjustment of $3 million to reflect the settlement of working capital.
(2) As at the acquisition date, the purchase price was preliminary and subject to change over the measurement period, permitted to be up to one year from the acquisition date. In the first quarter of 2020, based on updated information available to the Company, the fair value of net assets acquired was adjusted to reflect a net decrease to current and deferred income tax balances of $7 million, resulting in a decrease to Goodwill for the same amount. The Company's purchase price allocation is now final.
(3) Includes identifiable intangible assets of $34 million.
(4) Includes finance and operating lease right-of-use assets and liabilities.
(5) The goodwill acquired through the business combination is mainly attributable to the premium of an established business operation. The goodwill is not deductible for tax purposes.
4 - Revenues
The following table provides disaggregated information for revenues:
In millions Year ended December 31, 2020 2019 2018
Freight revenues
Petroleum and chemicals $ 2,631 $ 3,052 $ 2,660
Metals and minerals 1,409 1,643 1,689
Forest products 1,700 1,808 1,886
Coal 527 658 661
Grain and fertilizers 2,609 2,392 2,357
Intermodal 3,751 3,787 3,465
Automotive 591 858 830
Total freight revenues 13,218 14,198 13,548
Other revenues 601 719 773
Total revenues (1) (2) 13,819 $ 14,917 $ 14,321
(1) As at December 31, 2020, the Company had remaining performance obligations related to freight in-transit, for which revenues of $101 million (2019 - $91 million) are expected to be recognized in the next period.
(2) See Note 23 - Segmented information for the disaggregation of revenues by geographic area.
2020 Annual Report 75

Notes to the Consolidated Financial Statements
Contract liabilities The following table provides a reconciliation of the beginning and ending balances of contract liabilities for the years ended December 31, 2020,
and 2019:
In millions 2020 2019
Beginning of year $ 211 $ 3 Revenue recognized included in the beginning balance (16) (3) Increase due to consideration received, net of revenue recognized 5 211
End of year $ 200 $ 211
Current portion - End of year $ 115 $ 50
5 - Assets held for sale
In the second quarter of 2020, the Company committed to a plan and is actively marketing for sale for on-going rail operations, certain non-core lines in Wisconsin, Michigan and Ontario representing approximately 850 miles and has met the criteria for classification of the related assets
as assets held for sale. Accordingly, a $486 million loss ($363 million after-tax) was recorded to adjust the carrying amount of these track and
roadway assets to their estimated selling price. The carrying amount of assets held for sale of $90 million is included in Other current assets in
the Consolidated Balance Sheet at December 31, 2020. The estimated selling price is based primarily on discounted cash flow projections.
These projections are based on Level 3 inputs of the fair value hierarchy and reflect the Company's best estimate of market participants' pricing
of the assets as well as the general condition of the assets. Had alternative significant Level 3 inputs been used to calculate the estimated selling price at December 31, 2020, the alternative calculation would not have been materially different. The significant assumptions in the
valuation model include projected cash flows, discount rate and growth rate. As at December 31, 2020, the criteria for the classification of
assets held for sale continued to be met and there was no change in the Company's carrying amount of assets held for sale.
6 - Other income
In millions Year ended December 31, 2020 2019 2018
Gain on disposal of property Gain on disposal of land Other (1)
$ 11
(5)
$ 50 3
$ 338 27 11
Total other income $ 6 $ 53 $ 376
(1) Includes foreign exchange gains and losses related to foreign exchange forward contracts and the re-measurement of foreign currency denominated monetary assets and liabilities. See Note 22 - Financial instruments for additional information.
Disposal of property
2018 Guelph
On November 15, 2018, the Company recorded a gain of $79 million ($70 million after-tax) in Other income upon transfer of control of a
segment of the Guelph subdivision located between Georgetown and Kitchener, Ontario, together with the rail fixtures and certain passenger
agreements (the "Guelph"). The gain recognized in 2018 was previously deferred from a 2014 transaction at which time the Company did not transfer control.
Doney and St-Francois Spurs
On September 5, 2018, the Company completed the sale of property located in Montreal, Quebec (the "Doney and St-Francois Spurs") for cash proceeds of $40 million. The transaction resulted in a gain of $36 million ($32 million after-tax) that was recorded in Other income on that date.
76 CN 12020 Annual Report

Notes to the Consolidated Financial Statements
Central Station Railway Lease On April 9, 2018, the Company completed the transfer of its finance lease in the passenger rail facilities in Montreal, Quebec, together with its
interests in related railway operating agreements (the "Central Station Railway Lease"), for cash proceeds of $115 million. The transaction resulted in a gain of $184 million ($156 million after-tax) that was recorded in Other income on that date. The gain includes the difference
between the net book value of the asset and the cash proceeds, the extinguishment of the finance lease obligation, and the recognition of a gain previously deferred from a sale-leaseback transaction.
Calgary Industrial Lead On April 6, 2018, the Company completed the sale of land located in Calgary, Alberta, excluding the rail fixtures (the "Calgary Industrial Lead"),
for cash proceeds of $39 million. The transaction resulted in a gain of $39 million ($34 million after-tax) that was recorded in Other income on
that date.
7 - Income taxes
The Company's consolidated effective income tax rate differs from the Canadian, or domestic, statutory federal tax rate. The effective tax rate
is affected by recurring items in provincial, U.S. federal, state and other foreign jurisdictions, such as tax rates and the proportion of income
earned in those jurisdictions. The effective tax rate is also affected by discrete items such as income tax rate enactments, and lower corporate income tax rates on capital dispositions that may occur in any given year.
The enactment of the Tax Cuts and Jobs Act ("U.S. Tax Reform") in 2017 brought about significant tax law changes, which included a
reduction to the U.S. federal corporate income tax rate from 35% to 21% and allowed the immediate capital expensing of new investments in
certain qualified depreciable assets which will be phased down starting in year 2023. The U.S. Tax Reform also introduced the creation of a
Base Erosion Anti-abuse Tax (BEAT) that subjects certain payments from U.S. corporations to foreign related parties to additional taxes, and
limitations to the deduction for net interest expense incurred by U.S. corporations. Since the enactment of the U.S. Tax Reforms, U.S. authorities
have issued various proposed and finalized regulations and guidance interpreting its provisions. These interpretations have been taken into account in calculating the Company's current year income tax provision and tax payments. The U.S. Tax Reform and these regulations are also
expected to impact the Company's income tax provisions and tax payments in future years.
On March 27, 2020, the U.S. government enacted the Coronavirus Aid, Relief, and Economic Security (CARES) Act, a tax-and-spending
package aimed at providing additional stimulus to address the economic impact of the COVID-19 pandemic. The CARES Act corporate income
tax measures allow for U.S. federal net operating losses (NOLs) arising in tax years 2018, 2019, and 2020 to be fully carried back to each of the
five tax years preceding the tax year of the NOL. As a result of the CARES Act, the Company reclassified its 2019 deferred income tax asset of
$213 million on the NOL that arose in 2019, to a current income tax receivable and recorded a current income tax recovery of $141 million in
2020 to reflect an amount recoverable at the higher U.S. federal corporate income tax rate of 35% applicable to pre-2018 tax years. The following table provides a reconciliation of income tax expense:
In millions Year ended December 31, 2020 2019 2018
Canadian statutory federal tax rate 15% 15% 15%
Income tax expense at the Canadian statutory federal tax rate $ 682 $ 814 $ 852
Income tax expense resulting from:
Provincial and foreign income taxes (1) 416 551 535
Income tax adjustments due to rate enactments and tax law changes (2) (141) (112) —
Gain on disposals (3) (1) (6) (51)
Other (4) 26 (34) 18
Income tax expense 982 1,213 1,354
Net cash payments for income taxes 353 822 776
(1) Includes mainly the impact of Canadian provincial taxes and U.S. federal and state taxes.
(2) Includes income tax recoveries (current or deferred as appropriate) resulting from the enactment of provincial, U.S. federal, and state corporate income tax laws and/or rates.
(3) Relates to the permanent differences arising from lower capital gain tax rates on the gain on disposal of the Company's properties in Canada.
(4) Includes adjustments relating to the filing or resolution of matters pertaining to prior years' income taxes, including net recognized tax benefits, excess tax benefits, and other items.
2020 Annual Report 77

Notes to the Consolidated Financial Statements
The following table provides tax information on a domestic and foreign basis:
In millions Year ended December 31, 2020 2019 2018
Income before income taxes
Domestic $ 3,637 $ 4,162 $ 4,400
Foreign 907 1,267 1,282
Total income before income taxes 4,544 $ 5,429 $ 5,682
Current income tax expense (recovery)
Domestic 616 $ 608 $ 818
Foreign (121) 36 9
Total current income tax expense 495 $ 644 $ 827
Deferred income tax expense
Domestic $ 389 $ 423 $ 419
Foreign 98 146 108
Total deferred income tax expense 487 $ 569 $ 527
The following table provides the significant components of deferred income tax assets and liabilities:
In millions December 31, 2020 2019
Deferred income tax assets
Pension liability 145 $ 137
Lease liabilities 126 127
Net operating losses and tax credit carryforwards (1) 70 234
Personal injury and other claims 68 61
Other postretirement benefits liability 59 59
Compensation reserves 41 51
Other 69 69
Total deferred income tax assets 578 $ 738
Deferred income tax liabilities
Properties 8,321 $ 8,222
Pension asset 203 88
Operating lease right-of-use assets 118 131
Unrealized foreign exchange gains 45 15
Other 162 126
Total deferred income tax liabilities 8,849 $ 8,582
Total net deferred income tax liability 8,271 $ 7,844
Total net deferred income tax liability
Domestic 4,612 $ 4,184
Foreign 3,659 3,660
Total net deferred income tax liability 8,271 $ 7,844
(1) As at December 31, 2020, the Company had net interest expense deduction carryforwards of $100 million which are available to offset future U.S. federal and state taxable income over an indefinite period. In addition, the Company had net operating loss carryforwards of $462 million for U.S. state tax purposes which are available to offset future U.S. state taxable income and are expiring between the years 2021 and 2040. The Company also had net operating loss carryforwards of $92 million for Canadian federal and provincial tax purposes, which are available to offset future Canadian federal and provincial taxable income and are expiring between the years 2031 and 2039.
On an annual basis, the Company assesses the need to establish a valuation allowance for its deferred income tax assets, and if it is
deemed more likely than not that its deferred income tax assets will not be realized, a valuation allowance is recorded. The ultimate realization
of deferred income tax assets is dependent upon the generation of future taxable income, of the necessary character, during the periods in
which those temporary differences become deductible. Management considers the scheduled reversals of deferred income tax liabilities, the available carryback and carryforward periods, and projected future taxable income in making this assessment. As at December 31, 2020, in
order to fully realize all of the deferred income tax assets, the Company will need to generate future taxable income of approximately $2.7
billion, and, based upon the level of historical taxable income, projections of future taxable income of the necessary character over the periods
in which the deferred income tax assets are deductible, and the reversal of taxable temporary differences, management believes, following an
assessment of the current economic environment, it is more likely than not that the Company will realize the benefits of these deductible
78 CN 12020 Annual Report

Notes to the Consolidated Financial Statements
differences. As at December 31, 2020, the Company has not recognized a deferred income tax asset of $259 million (2019
the unrealized foreign exchange loss recorded in Accumulated other comprehensive loss relating to its net investment in U
the Company does not expect this temporary difference to reverse in the foreseeable future. The following table provides a reconciliation of unrecognized tax benefits on the Company's domestic and foreign tax
- $244 million) on
.S. subsidiaries, as
positions:
In millions Year ended December 31, 2020 2019 2018
Gross unrecognized tax benefits at beginning of year 62 $ 74 74
Increases for: Tax positions related to the current year 17 5 12 Tax positions related to prior years 28 2
Decreases for: Tax positions related to prior years (15) (17) (13) Settlements (1)
Gross unrecognized tax benefits at end of year 92 62 74 Adjustments to reflect tax treaties and other arrangements (25) (2) (5)
Net unrecognized tax benefits at end of year 67 $ 60 $ 69
As at December 31, 2020, the total amount of gross unrecognized tax benefits was $92 million, before considering tax treaties and other
arrangements between taxation authorities. The amount of net unrecognized tax benefits as at December 31, 2020 was $67 million. If
recognized, $16 million of the net unrecognized tax benefits as at December 31, 2020 would affect the effective tax rate. The Company believes
that it is reasonably possible that $15 million of the net unrecognized tax benefits as at December 31, 2020 related to Canadian federal and provincial income tax matters, may be recognized over the next twelve months as a result of settlements and a lapse of the applicable statute of limitations, and will not affect the effective tax rate as they relate to temporary differences.
The Company recognizes accrued interest and penalties related to gross unrecognized tax benefits in Income tax expense in the
Company's Consolidated Statements of Income. For the year ended December 31, 2020, the Company recognized accrued interest and
penalties of $16 million (2019 - $1 million; 2018 - $3 million). As at December 31, 2020, the Company had accrued interest and penalties of $27
million (2019 - $11 million).
In Canada, the Company's federal and provincial income tax returns filed for the years 2014 to 2019 remain subject to examination by the
taxation authorities. An examination of the Company's federal income tax returns for the years 2014 and 2015 are currently in progress and are expected to be completed during 2021. During 2020, the tax authorities proposed certain audit adjustments and as a result, the Company re-
evaluated the relevant tax positions for all open years and recorded a $25 million deferred tax expense which is comprised of net unrecognized
tax benefits and related interest charges. In the U.S., the federal income tax returns filed for the years 2013 to 2019 and the state income tax
returns filed for the years 2016 to 2019 remain subject to examination by the taxation authorities. Examination of certain of the Company's
state income tax returns are currently in progress. The Company does not anticipate any additional significant impacts to its results of
operations or financial position as a result of the final resolutions of such matters.
2020 Annual Report 79

Notes to the Consolidated Financial Statements
8 - Earnings per share
The following table provides a reconciliation between basic and diluted earnings per share:
In millions, except per share data Year ended December 31, 2020 2019 2018
Net income
Weighted-average basic shares outstanding
Dilutive effect of stock-based compensation
$ 3,562
711.3
1.7
$ 4,216
720.1
2.5
$ 4,328
734.5
3.2
Weighted-average diluted shares outstanding 713.0 722.6 737.7
Basic earnings per share
Diluted earnings per share $ 5.01
$ 5.00
$
$
5.85
5.83
$
$
5.89
5.87
Units excluded from the calculation as their inclusion would not have a dilutive effect
Stock options 0.7 0.5 0.6
Performance share units 0.3 0.2 0.3
9 - Accounts receivable
In millions December 31, 2020 2019
Freight $ 869 $ 1,008
Non-freight 211 233
Gross accounts receivable 1,080 1,241
Allowance for credit losses (26) (28)
Net accounts receivable $ 1,054 $ 1,213
10 - Other current assets
In millions December 31, 2020 2019
Prepaid expenses $ 148 $ 142
Assets held for sale (Note 5) 90 —
Income taxes receivable 85 219
Other 42 57
Total other current assets $ 365 $ 418
80 CN 12020 Annual Report

Notes to the Consolidated Financial Statements
11 - Properties
December 31, 2020 December 31, 2019
Depreciation In millions rate Cost
Accumulated Depreciation Net Cost
Accumulated Depreciation Net
Properties including finance leases
Track and roadway (1) (2)
Rolling stock
Buildings
Information technology (3)
Other
2 %
5 %
3 %
9 %
5 %
$ 39,805
7,665
2,047
2,218
2,777
$ 8,717
2,986
727
833
1,180
$ 31,088
4,679
1,320
1,385
1,597
$ 39,395
7,538
1,956
1,972
2,720
$ 8,502
2,941
692
688
1,089
$ 30,893
4,597
1,264
1,284
1,631
Total properties including finance leases (4) (5) $ 54,512 $ 14,443 $ 40,069 $ 53,581 $ 13,912 $ 39,669
Finance leases included in properties
Track and roadway (6)
Rolling stock
Buildings
Other
$ 406
61
27
107
$ 90
3 10
21
$ 316
58
17
86
$ 406
87
27
128
$ 85
2
9
18
$ 321
85
18
110
Total finance leases included in properties 601 $ 124 $ 477 $ 648 $ 114 $ 534
(1)
(2)
(3) (4)
(5)
(6)
As at December 31, 2020, includes land of $2,316 million (2019 - $2,401 million).
In 2020, the Company made an adjustment of $576 million for assets held for sale. See Note 5 - Assets held for sale for additional information.
In 2020, the Company capitalized costs for internally developed software and related licenses of $205 million (2019 - $273 million).
In 2020, property additions, net of finance leases, were $2,863 million (2019 - $3,865 million), of which $1,427 million (2019 - $1,489 million) related to track and railway infrastructure maintenance, including the replacement of rail, ties, bridge improvements, and other general track maintenance.
In 2020, depreciation expense related to properties was $1,583 million (2019 - $1,559 million).
As at December 31, 2020, includes right-of-way access of $106 million (2019 - $106 million).
In the first quarter of 2019, the Company recognized an expense of $84 million related to costs previously capitalized for a Positive Train
Control (PTC) back office system following the deployment of a replacement system. The expense was recognized in Depreciation and amortization on the Consolidated Statements of Income.
The Company adopted ASU 2016-02 Leases in the first quarter of 2019 with an effective date of January 1, 2019 using a modified retrospective
approach with a cumulative-effect adjustment to Retained earnings recognized on January 1, 2019, with no restatement of comparative period financial information. As at January 1, 2019, the cumulative-effect adjustment to adopt the new standard increased the balance of Retained earnings by $29 million, relating to a deferred gain on a sale-leaseback transaction of a real estate property. The initial adoption transition adjustment to record right-of-use assets and lease liabilities for leases over twelve months on the Company's Consolidated Balance Sheet was
$756 million to each balance. The initial adoption transition adjustment is comprised of finance and operating leases of $215 million and $541 million, respectively. New finance lease right-of-use assets and finance lease liabilities are a result of the reassessment of leases with
purchase options that are reasonably certain to be exercised by the Company under the transition to Topic 842, previously accounted for as
operating leases.
2020 Annual Report 81

Notes to the Consolidated Financial Statements
The following table provides the Company's lease costs for the year ended December 31, 2020 and 2019:
In millions Year ended December 31, 2020 2019
Finance lease cost Amortization of right-of-use assets 12 $ 11 Interest on lease liabilities 3 8
Total finance lease cost 15 19
Operating lease cost 143 171
Short-term lease cost 42 47
Variable lease cost (1) 63 63
Total lease cost (2) 263 $ 300
(1) Mainly relates to leases of trucks for the Company's freight delivery service contracts.
(2) Includes lease costs from Purchased services and material and Equipment rents in the Consolidated Statements of Income.
Rental expense for operating leases for the year ended December 31, 2018 was $218 million.
The following table provides the Company's lease right-of-use assets and lease liabilities, and their classification on the Consolidated Balance Sheets as at December 31, 2020 and 2019:
In millions Classification December 31, 2020 2019
Lease right-of-use assets Finance leases Properties 477 $ 534 Operating leases Operating lease right-of-use assets 435 520
Total lease right-of-use assets 912 $ 1,054
Lease liabilities
Current Finance leases Current portion of long-term debt 70 $ 59 Operating leases Accounts payable and other 107 122
Noncurrent Finance leases Long-term debt 4 75 Operating leases Operating lease liabilities 311 379
Total lease liabilities 492 $ 635
The following table provides the remaining lease terms and discount rates for the Company's leases as at December 31, 2020 and 2019:
December 31, 2020 2019
Weighted-average remaining lease term (years) Finance leases 0.8 1.4
Operating leases 6.8 7.0
Weighted-average discount rate (%) Finance leases 3.10 3.21
Operating leases 2.79 3.12
The following table provides additional information for the Company's leases for the year ended December 31, 2020 and 2019:
In millions Year ended December 31, 2020 2019
Cash paid for amounts included in the measurement of lease liabilities ($) Operating cash outflows from operating leases 142 170
Operating cash outflows from finance leases 3 6 Financing cash outflows from finance leases 59 162
Right-of-use assets obtained in exchange for lease liabilities ($) Operating lease 53 79
Finance lease
82 CN 12020 Annual Report

Notes to the Consolidated Financial Statements
The following table provides the maturities of lease liabilities for the next five years and thereafter as at December 31, 2020:
In millions Finance leases Operating leases (1)
2021 71 $ 118
2022 1 84
2023 61
2024 41
2025 35
2026 and thereafter 3 125
Total lease payments 75 464
Less: Imputed interest 1 46
Present value of lease payments 74 $ 418
(1) Includes $70 million related to renewal options that are reasonably certain to be exercised.
ntangible assets, goodwill and other
In millions December 31, 2020 2019
Intangible assets 145 $ 152
Investments (1) 83 84
Goodwill (Note 3) 70 77
Deferred costs 64 67
Long-term receivables 37 31
Other long-term assets 22 18
Total intangible assets, goodwill and other 421 $ 429
(1) As at December 31, 2020, the Company had $56 million (2019 - $60 million) of investments accounted for under the equity method and $27 million (2019 - $24 million) of investments for which fair value was not readily determinable accounted for at cost minus impairment, plus or minus observable price changes.
14 - Accounts payable and other
In millions December 31, 2020 2019
Trade payables 780 $ 866
Payroll-related accruals 349 284
Accrued charges 293 318
Income and other taxes 223 202
Accrued interest 162 161
Contract liabilities (Note 4) 115 50
Personal injury and other claims provisions (Note 21) 109 91
Operating lease liabilities (Note 12) 107 122
Environmental provisions (Note 21) 46 38
Other postretirement benefits liability (Note 17) 14 15
Other 166 210
Total accounts payable and other 2,364 $ 2,357
2020 Annual Report 83

Notes to the Consolidated Financial Statements
15 - Debt
In millions Maturity
US dollar-denominated
amount December 31, 2020 2019
Notes and debentures (1)
Canadian National series:
2.40% 2-year notes (2) Feb 3, 2020 US$ 300 $ - , 390
2.75% 7-year notes (2) Feb 18, 2021 250 250
2.85% 10-year notes (2) Dec 15, 2021 US$ 400 509 520
2.25% 10-year notes (2) Nov 15, 2022 US$ 250 318 325
7.63% 30-year debentures May 15, 2023 US$ 150 191 195
2.95% 10-year notes (2) Nov 21, 2024 US$ 350 445 455
2.80% 10-year notes (2) Sep 22, 2025 350 350
2.75% 10-year notes (2) Mar 1, 2026 US$ 500 636 649
6.90% 30-year notes (2) Jul 15, 2028 US$ 475 604 617
3.20% 10-year notes (2) Jul 31, 2028 350 350
3.00% 10-year notes (2) Feb 8, 2029 350 350
7.38% 30-year debentures (2) Oct 15, 2031 US$ 200 255 260
6.25% 30-year notes (2) Aug 1, 2034 US$ 500 636 649
6.20% 30-year notes (2) Jun 1, 2036 US$ 450 573 585
6.71% Puttable Reset Securities PURSSM (2) Jul 15, 2036 US$ 250 318 325
6.38% 30-year debentures (2) Nov 15, 2037 US$ 300 382 390
3.50% 30-year notes (2) Nov 15, 2042 US$ 250 318 325
4.50% 30-year notes (2) Nov 7, 2043 US$ 250 318 325
3.95% 30-year notes (2) Sep 22, 2045 400 400
3.20% 30-year notes (2) Aug 2, 2046 US$ 650 827 844
3.60% 30-year notes (2) Aug 1, 2047 500 500
3.65% 30-year notes (2) Feb 3, 2048 US$ 600 764 779
3.60% 30-year notes (2) Jul 31, 2048 450 450
4.45% 30-year notes (2) Jan 20, 2049 US$ 650 827 844
3.60% 30-year notes (2) Feb 8, 2049 450 450
3.05% 30-year notes (2) Feb 8, 2050 450 450
2.45% 30-year notes (2) May 1, 2050 US$ 600 764 -
4.00% 50-year notes (2) Sep 22, 2065 100 100
Illinois Central series:
7.70% 100-year debentures Sep 15, 2096 US$ 125 159 162
BC Rail series:
Non-interest bearing 90-year subordinated notes (3) Jul 14, 2094 842 842
Total notes and debentures 13,336 13,131
Other
Commercial paper 56 1,277
Accounts receivable securitization 200
Finance leases 74 134
Equipment loans and other (4) 402 4
Total debt, gross 13,868 14,746
Net unamortized discount and debt issuance costs (3) (962) (950)
Total debt (5) 12,906 13,796
Less: Current portion of long-term debt 910 1,930
Total long-term debt $ 11,996 $ 11,866
(1) The Company's notes and debentures are unsecured.
(2) The fixed rate debt securities are redeemable, in whole or in part, at the option of the Company, at anytime, at the greater of par and a formula price based on interest rates prevailing at the time of redemption.
(3) As at December 31, 2020, these notes were recorded as a discounted debt of $13 million (2019 - $12 million) using an imputed interest rate of 5.75% (2019- 5.75%). The discount of $829 million (2019 - $830 million) is included in Net unamortized discount and debt issuance costs.
(4) Includes $368 million of equipment loan under the non-revolving credit facility and $34 million of other equipment loans payable monthly at a weighed average interest rate of 2.00%. (5) See Note 22 - Financial instruments for the fair value of debt
84 ;N 12020 Annual Report

Notes to the Consolidated Financial Statements
Notes and debentures
For the year ended December 31, 2020, the Company issued and repaid the following:
• On May 1, 2020, issuance of US$600 million ($837 million) 2.45% Notes due 2050 in the U.S. capital markets, which resulted in net
proceeds of $810 million; and
• On February 3, 2020, repayment of US$300 million ($397 million) 2.40% Notes due 2020 upon maturity.
For the year ended December 31, 2019, the Company issued the following: • On November 1, 2019, issuance of $450 million 3.05% Notes due 2050 in the Canadian capital markets, which resulted in net proceeds of
$443 million; and
• On February 8, 2019, issuance of $350 million 3.00% Notes due 2029 and $450 million 3.60% Notes due 2049 in the Canadian capital
markets, which resulted in total net proceeds of $790 million.
Revolving credit facilities The Company has an unsecured revolving credit facility with a consortium of lenders, which is available for general corporate purposes, including backstopping the Company's commercial paper programs. The Company's revolving credit facility of $2.0 billion consists of a $1.0
billion tranche maturing on May 5, 2022 and a $1.0 billion tranche maturing on May 5, 2024. Subject to the consent of the individual lenders, the
Company has the option to increase the facility by an additional $500 million during its term and to request an extension once a year to
maintain the tenors of three years and five years of the respective tranches. The credit facility provides for borrowings at various benchmark
interest rates, plus applicable margins, based on CN's debt credit ratings. In 2020, the Company borrowed $100 million and repaid $100 million
on this facility. As at December 31, 2020 and 2019, the Company had no outstanding borrowings under this revolving credit facility.
On March 27, 2020, the Company entered into a $250 million one year revolving credit facility agreement. The credit facility is available for
working capital and general corporate purposes and provides for borrowings at various interest rates, plus a margin. On May 19, 2020, the Company entered into a supplement to the original agreement to increase the credit facility to $390 million. As at December 31, 2020, the
Company had no outstanding borrowings under this revolving credit facility and there were no draws in 2020.
Both credit facility agreements have one financial covenant, which limits debt as a percentage of total capitalization, and with which the
Company is in compliance.
Non-revolving credit facility The Company has a US$300 million, non-revolving term loan credit facility agreement for financing or refinancing the purchase of equipment,
which was available to be drawn upon through March 31, 2020. On March 27, 2020, the Company entered into loan supplements to the original agreement for an additional principal amount of US$310 million, which is available to be drawn through March 31, 2021.Term loans made under
this facility have a tenor of 20 years, bear interest at a variable rate, are repayable in equal quarterly instalments, are prepayable at any time
without penalty, and are secured by rolling stock.
On February 3, 2020, the Company issued a US$300 million ($397 million) equipment loan under this facility and repaid US$11 million ($15
million) in 2020.
As at December 31, 2020, the Company had outstanding borrowings of US$289 million ($368 million), at an interest rate of 0.87% and had US$310 million available under this non-revolving term loan facility. As at December 31, 2019, the Company had no outstanding borrowings and
had US$300 million available under this non-revolving term loan facility.
Commercial paper
The Company has a commercial paper program in Canada and in the U.S. Both programs are backstopped by the Company's revolving credit facility. The maximum aggregate principal amount of commercial paper that could be issued is $2.0 billion, or the US dollar equivalent, on a
combined basis.
As at December 31, 2020 and 2019, the Company had total commercial paper borrowings of US$44 million ($56 million) and US$983
million ($1,277 million), respectively, at a weighted-average interest rate of 0.13% and 1.77%, respectively, presented in Current portion of long-
term debt on the Consolidated Balance Sheets.
2020 Annual Report 85

Notes to the Consolidated Financial Statements
The following table provides a summary of cash flows associated with the issuance and repayment of commercial paper:
In millions Year ended December 31, 2020 2019 2018
Commercial paper with maturities less than 90 days Issuance $ 5,315 $ 5,069 $ 8,292 Repayment (6,076) (5,141) (8,442)
Change in commercial paper with maturities less than 90 days, net $ (761) $ (72) $ (150)
Commercial paper with maturities of 90 days or greater Issuance $ 736 $ 2,115 $ 1,135 Repayment (1,248) (1,902) (886)
Change in commercial paper with maturities of 90 days or greater, net $ (512) $ 213 $ 249
Change in commercial paper, net $ (1,273) $ 141 $ 99
Accounts receivable securitization program
The Company has an agreement to sell an undivided co-ownership interest in a revolving pool of accounts receivable to unrelated trusts for maximum cash proceeds of $450 million. On February 27, 2020, the Company extended the term of its agreement by two years to
February 1, 2023.
As at December 31, 2020, the Company had no borrowings under the accounts receivable securitization program. As at December 31,
2019, the Company had borrowings under the accounts receivable securitization program of $200 million at a weighted-average interest rate of
1.90%, secured by and limited to $224 million of accounts receivable, presented in Current portion of long-term debt on the Consolidated
Balance Sheets. The following table provides a summary of cash flows associated with the proceeds received and repayment of the accounts receivable
securitization program:
In millions Year ended December 31, 2020 2019 2018 Beginning of year
Proceeds received Repayment Foreign exchange
$ 200 450
(650) —
$ — 420
(220) —
$ 421 530
(950) (1)
End of year $ — $ 200 $
Bilateral letter of credit facilities
The Company has a series of committed and uncommitted bilateral letter of credit facility agreements. On June 11, 2020, the Company
extended the maturity date of certain committed bilateral letter of credit facility agreements to April 28, 2023. The agreements are held with
various banks to support the Company's requirements to post letters of credit in the ordinary course of business. Under these agreements, the
Company has the option from time to time to pledge collateral in the form of cash or cash equivalents, for a minimum term of one month, equal
to at least the face value of the letters of credit issued.
As at December 31, 2020, the Company had outstanding letters of credit of $421 million (2019 - $424 million) under the committed
facilities from a total available amount of $492 million (2019 - $459 million) and $165 million (2019 - $149 million) under the uncommitted
facilities.
As at December 31, 2020, included in Restricted cash and cash equivalents was $424 million (2019 - $429 million) and $100 million (2019 -
$90 million) which were pledged as collateral under the committed and uncommitted bilateral letter of credit facilities, respectively.
86 CN 12020 Annual Report

Notes to the Consolidated Financial Statements
Debt maturities
The following table provides the debt maturities, excluding finance lease liabilities, as at December 31, 2020, for the next five years and
thereafter:
In millions Debt (1)2021
2022
2023
2024
2025
2026 and thereafter
840
329
203
459
364
10,637
Total 12,832
Finance lease liabilities (2) 74
Total debt 12,906
(1) Presented net of unamortized discounts and debt issuance costs.
(2) See Note 12 - Leases for maturities of finance lease liabilities.
Amount of US dollar-denominated debt
In millions December 31, 2020 2019
Notes and debentures US$ 6,950 US$ 6,650
Commercial paper 44 983
Finance lease liabilities 50 74
Equipment loans and other 314
Total amount of US dollar-denominated debt in US$ US$ 7,358 US$ 7,707
Total amount of US dollar-denominated debt in C$ 9,363 $ 10,011
16 - Other liabilities and deferred credits
In millions December 31, 2020 2019
Personal injury and other claims provisions (Note 21) (1) 238 $ 261
Contract liabilities (Note 4) (1) 85 161
Stock-based compensation liability (Note 19) 14 16
Environmental provisions (Note 21) (1) 13 19
Deferred credits and other 184 177
Total other liabilities and deferred credits 534 $ 634
(1) See Note 14 - Accounts payable and other for the related current portion.
2020 Annual Report 87

Notes to the Consolidated Financial Statements
17 - Pensions and other postretirement benefits
The Company has various retirement benefit plans under which substantially all of its employees are entitled to benefits at retirement age,
generally based on compensation and length of service and/or contributions. Senior and executive management employees, subject to certain minimum service and age requirements, are also eligible for an additional retirement benefit under their Special Retirement Stipend
Agreements, the Supplemental Executive Retirement Plan or the Defined Contribution Supplemental Executive Retirement Plan.
The Company also offers postretirement benefits to certain employees providing life insurance, medical benefits and, for a closed group of
employees, free rail travel benefits during retirement. These postretirement benefits are funded as they become due. The information in the
tables that follow pertains to all of the Company's defined benefit plans. However, the following descriptions relate solely to the Company's main pension plan, the CN Pension Plan, unless otherwise specified.
Description of the CN Pension Plan
The CN Pension Plan is a contributory defined benefit pension plan that covers the majority of CN employees. It provides for pensions based
mainly on years of service and final average pensionable earnings and is generally applicable from the first day of employment. Indexation of
pensions is provided after retirement through a gain/loss sharing mechanism, subject to guaranteed minimum increases. An independent trust
company is the Trustee of the Companys pension trust funds (which includes the CN Pension Trust Fund). As Trustee, the trust company
performs certain duties, which include holding legal title to the assets of the CN Pension Trust Fund and ensuring that the Company, as Administrator, complies with the provisions of the CN Pension Plan and the related legislation. The Company utilizes a measurement date of
December 31 for the CN Pension Plan.
Funding policy
Employee contributions to the CN Pension Plan are determined by the plan rules. Company contributions are in accordance with the
requirements of the Government of Canada legislation, the Pension Benefits Standards Act, 1985, including amendments and regulations
thereto, and such contributions follow minimum and maximum thresholds as determined by actuarial valuations. Actuarial valuations are generally required on an annual basis for all Canadian defined benefit pension plans, or when deemed appropriate by the Office of the
Superintendent of Financial Institutions. These actuarial valuations are prepared in accordance with legislative requirements and with the
recommendations of the Canadian Institute of Actuaries for the valuation of pension plans. Actuarial valuations are also required annually for
the Company's U.S. qualified defined benefit pension plans.
The Company's most recently filed actuarial valuations for funding purposes for its Canadian registered defined benefit pension plans
conducted as at December 31, 2019 indicated a funding excess on a going concern basis of approximately $3.5 billion and a funding excess on
a solvency basis of approximately $0.6 billion, calculated using the three-year average of the plane hypothetical wind-up ratio in accordance with the Pension Benefit Standards Regulations, 1985. The federal pension legislation requires funding deficits, if any, to be paid over a number
of years, as calculated under current pension regulations. Alternatively, a letter of credit can be subscribed to fulfill required solvency deficit
payments.
The Company's next actuarial valuations for funding purposes for its Canadian registered defined benefit pension plans required as at December 31, 2020 will be performed in 2021. These actuarial valuations are expected to identify a funding excess on a going concern basis of approximately $3.4 billion, while on a solvency basis a funding excess of approximately $0.5 billion is expected. Based on the anticipated
results of these valuations, the Company expects to make total cash contributions of approximately $135 million for all of the Companys
pension plans in 2021. As at February 1, 2021 the Company had contributed $64 million to its defined benefit pension plans for 2021.
Plan assets
The assets of the Company's various Canadian defined benefit pension plans are primarily held in separate trust funds ("Trusts") which are
diversified by asset type, country, sector and investment strategy. Each year, the CN Board of Directors reviews and confirms or amends the
Statement of Investment Policies and Procedures ("SIPP") which includes the plane long-term target asset allocation ("Policy) and related
benchmark indices. This Policy is based on the long-term expectations of the economy and financial market returns and considers the
dynamics of the plane pension benefit obligations. In 2020, the Policy was amended to implement a target asset allocation change to cash and short-term investments, and bonds and mortgages.
The CN Investment Division (Investment Manager), a division of the Company created to invest and administer the assets of the plan, can
also implement an investment strategy ("Strategy") which can lead the Plan's actual asset allocation to deviate from the Policy due to changing
market risks and opportunities. The Pension and Investment Committee of the Board of Directors ("Committee") regularly compares the actual
plan asset allocation to the Policy and Strategy and compares the actual performance of the Company's pension plan assets to the
performance of the benchmark indices.
88 CN 12020 Annual Report

Notes to the Consolidated Financial Statements
The Company's 2020 Policy and actual asset allocation for the Company's pension plans based on fair value are as follows:
Actual plan asset allocation Policy 2020 2019
Cash and short-term investments 2 % 3 % 3 % Bonds and mortgages 41 % 37 % 36 % Emerging market debt 1.5 % 2 % 3 % Private debt 1.5 % 3 % 3 % Equities 35 % 38 % 37 % Real estate 4 % 2 % 2 % Oil and gas 7 % 3 % 5 % Infrastructure 4 % 3 % 3 % Absolute return 10 % 10 % 10 % Alternative risk premia (1) — % 1 % 1 % Investment-related liabilities (6)% (2)% (3) %
Total 100 % 100 % 100 %
(1) Asset class description has been changed from risk-factor allocation to alternative risk premia.
The Committee's approval is required for all major investments in illiquid securities. The SIPP allows for the use of derivative financial
instruments to implement strategies, hedge and adjust existing or anticipated exposures. The SIPP prohibits investments in securities of the
Company or its subsidiaries. Investments held in the Company's pension plans consist mainly of the following:
• Cash and short-term investments consist of highly liquid securities which ensure adequate cash flows are available to cover near-term
benefit payments. Short-term investments are mainly obligations issued by Canadian chartered banks and by Canadian governments.
• Bonds include bond instruments, issued or guaranteed by governments and non-government entities. As at December 31, 2020, 80% (2019
- 80%) of bonds were issued or guaranteed by Canadian, U.S. or other governments. Mortgages consist of mortgage products which are primarily conventional or participating loans secured by commercial properties. On an exposure basis, the Plan's Policy for bonds and
mortgages is 46%. This comprises a 41% allocation mainly to government and corporate bonds and a 5% allocation to derivative financial
instruments related to bond exposure.
• Emerging market debt consists of units of co-mingled funds or in separate accounts managed by external managers whose mandate is to
invest in debt instruments of emerging market countries.
• Private debt includes participations in private debt funds focused on generating steady yields.
• Equity investments include publicly traded securities diversified by industry sector, country and issuer and investments in mainly energy related private equity funds. As at December 31, 2020, the most significant allocation to an individual issuer of a publicly traded security
was 3% (2019 - 1%) and the most significant allocation to an industry sector was 17% (2019 -12%). On an exposure basis, the Plan's Policy
for equities is 40%. This comprises a 35% allocation to equities and a 5% allocation to derivative financial instruments related to equity
exposure.
• Real estate is a diversified portfolio of Canadian land and commercial properties and investments in real estate private equity funds.
• Oil and gas investments include petroleum and natural gas properties and listed and non-listed securities of oil and gas companies.
• Infrastructure investments include participations in private infrastructure funds, term loans and notes of infrastructure companies.
• Absolute return investments are primarily a portfolio of units of externally managed hedge funds, which are invested in various long/short
strategies within multi-strategy, fixed income, global macro funds and growth insurance. Managers are monitored on a continuous basis
through investment and operational due diligence. • Alternative risk premia investments are a portfolio of units of externally managed funds and internally managed strategies on a risk-
adjusted basis.
• Investment-related liabilities reflect a certain level of financing associated with securities sold under repurchase agreements and other
assets.
2020 Annual Report 89

Notes to the Consolidated Financial Statements
The plans' Investment Manager monitors market events and risk exposures to foreign currencies, interest rates, market risks, credit risks and liquidity risks daily. When investing in foreign securities, the plans are exposed to foreign currency risk that may be adjusted or hedged; the effect of which is included in the valuation of the foreign securities. Net of the adjusted or hedged amount, the plans were 60% exposed to the
Canadian dollar, 23% to the US dollar, 8% to European currencies, 2% to the Japanese Yen and 7% to various other currencies as at December
31, 2020. Interest rate risk represents the risk that the fair value of the investments will fluctuate due to changes in market interest rates.
Sensitivity to interest rates is a function of the timing and amount of cash flows of the interest-bearing assets and liabilities of the plans.
Derivatives are contractual agreements whose value is derived from interest rates, foreign currencies, commodities or equities, among other
fluctuating inputs and factors. They may include forwards, futures, options, and swaps. Derivatives are included in the investment asset classes based on their underlying exposure and are used from time to time to synthetically replace any investment activity that would otherwise be
accomplished through a direct investment in any investment asset class. When derivatives are used for hedging purposes, the gains or losses
on the derivatives are offset by a corresponding change in the value of the hedged assets. To manage counterparty credit risk, established
policies require dealing with counterparties considered to be of high credit quality. Adequate liquidity is maintained to cover cash flows by
monitoring factors such as fair value, collateral pledged and received, repurchase agreements and securities lending agreements.
Overall return in the capital markets and the level of interest rates affect the funded status of the Company's pension plans, particularly the
Company's main Canadian pension plan. Adverse changes with respect to pension plan returns and the level of interest rates from the date of the last actuarial valuations may have a material adverse effect on the funded status of the plans and on the Company's results of operations.
90 CN 12020 Annual Report

Notes to the Consolidated Financial Statements
The following tables present the fair value of plan assets by asset class as at December 31, 2020 and 2019:
In millions Total
Cash and short-term investments (1) $ 594 Bonds (2)
Canada, U.S. and supranational 642 Provinces of Canada and municipalities 5,103 Corporate 1,472
Emerging market debt (3) 406 Mortgages (4) 21 Private debt (5) 575 Public equities (6)
Canadian 555 U.S. 3,249 International 3,477
Private equities (7) 303 Real estate (8) 381 Oil and gas (9) 649 Infrastructure (10) 571 Absolute return funds (11)
Multi-strategy 1,032 Fixed income 68 Global macro 697 Growth insurance 92
Alternative risk premia (12) 191
Total investments (13) 20,078 Investment-related liabilities (14) (441) Other (15) 86
Total plan assets 19,723
In millions Total
Cash and short-term investments (1) $ 502 Bonds (2)
Canada, U.S. and supranational 771 Provinces of Canada and municipalities 4,503 Corporate 1,347
Emerging market debt (3) 500 Mortgages (4) 52 Private debt (5) 481 Public equities (6)
Canadian 338 U.S. 3,265 International 3,006
Private equities (7) 215 Real estate (8) 435 Oil and gas (9) 901 Infrastructure (10) 619 Absolute return funds (11)
Multi-strategy 1,083 Fixed income 175 Global macro 490 Growth Insurance 17
Alternative risk premia (12) 288
Total investments (13) 18,988 Investment-related liabilities (14) (565) Other (15) 1
Total plan assets 18,424
Level 1: Fair value based on quoted prices in active markets for identical assets. Level 2: Fair value based on other significant observable inputs. Level 3: Fair value based on significant unobservable inputs. NAV: Investments measured at net asset value as a practical expedient.
Fair value measurements at December 31, 2020 Level 1 Level 2 Level 3 NAV
$ 41 $ 553 $ -
- 642 -
- 5,103 -
- 1,472 - - 406 -
- 21 -
$
-----
- - - 575
555 - - -3,214 35 - -3,477 - - -
- - - 303 - - 279 102
128 17 504 -
- 65 - 506
- - - 1,032 - - - 68 - - - 697
92 - - -- - - 191
$ 7,507 $ 8,314 $ 783 $ 3,474
Fair value measurements at December 31, 2019 Level 1 Level 2 Level 3 NAV
$ 92
- -
- - - -
338 3,234 3,006
-
- 177
-
- - -
17 -
$ 410
771 4,503 1,347
500 52
-
-
31 - -
- 17 66
- - - -
-
$ -
- - - - -
-
-
- -
329 707
-
- - - -
-
$
-----
481
-
-215 106
-553
1,083 175 490
-288
$ 6,864 $ 7,697 $ 1,036 $ 3,391
Footnotes to the tables follow on the next page.
2020 Annual Report 91

Notes to the Consolidated Financial Statements
The following table reconciles the beginning and ending balances of the fair value of investments classified as Level 3:
In millions
Fair value measurements based on significant unobservable inputs (Level 3)
Real estate (8) Oil and gas (9) Total
Balance at December 31, 2018 321 $ 728 $ 1,049
Actual return relating to assets still held at the reporting date 13 7 20
Purchases 3 — 3
Sales (1) — (1)
Disbursements (7) (28) (35)
Balance at December 31, 2019 329 707 1,036
Actual return relating to assets still held at the reporting date (54) (188) (242)
Purchases 6 6
Sales (1) (1)
Disbursements (1) (15) (16)
Balance at December 31, 2020 279 504 783
(1) Cash and short-term investments with related accrued interest are valued at cost which approximates fair value, and are categorized as Level 1 and Level 2 respectively.
(2) Bonds are valued using mid-market prices obtained from independent pricing data suppliers. When prices are not available from independent sources, the fair value is based on the present value of future cash flows using current market yields for comparable instruments.
(3) Emerging market debt funds are valued based on the net asset value which is readily available and published by each fund's independent administrator.
(4) Mortgages are valued based on the present value of future net cash flows using current market yields for comparable instruments.
(5) Private debt investments are valued based on the net asset value as reported by each fund's manager, generally based on the present value of future net cash flows using current market yields for comparable instruments.
(6) The fair value of public equity investments is based on quoted prices in active markets for identical assets.
(7) Private equity investments are valued based on the net asset value as reported by each fund's manager, generally using discounted cash flow analysis or earnings multiples.
(8) The fair value of real estate investments categorized as Level 3 includes immoveable properties. Land is valued based on the fair value of comparable assets, and income producing properties are valued based on the present value of estimated future net cash flows or the fair value of comparable assets. Independent valuations of all immoveable properties are performed triennially on a rotational basis. The fair value of real estate investments categorized as NAV consists mainly of investments in real estate private equity funds and is based on the net asset value as reported by each fund's manager, generally using a discounted cash flow analysis or earnings multiples.
(9) Oil and gas investments categorized as Level 1 are valued based on quoted prices in active markets. Oil and gas participations traded on a secondary market are valued based on the most recent transaction price and are categorized as Level 2. Investments in oil and gas categorized as Level 3 consist of operating oil and gas properties and the fair value is based on estimated future net cash flows that are discounted using prevailing market rates for transactions in similar assets. Estimated future net cash flows are based on forecasted oil and gas prices and projected annual production and costs.
(10) The fair value of infrastructure investments categorized as Level 2 is based on the present value of future cash flows using current market yields for comparable instruments. The fair value of infrastructure funds categorized as NAV is based on the net asset value as reported by each fund's manager, generally using a discounted cash flow analysis or earnings multiples.
(11) Absolute return investments are valued using the net asset value as reported by each fund's independent administrator. All absolute return investments have contractual redemption frequencies, ranging from monthly to annually, and redemption notice periods varying from 5 to 90 days.
(12) Alternative risk premia investments are valued using the net asset value as reported by each fund's independent administrator or fund manager. All funds have contractual redemption frequencies ranging from daily to annually, and redemption notice periods varying from 5 to 60 days.
(13) Derivative financial instruments, which are included in total investments, are valued using quoted market prices when available and are categorized as Level 1, or based on valuation techniques using market data, when quoted market prices are not available and are categorized as Level 2. Derivatives are included in the investment asset categories based on their underlying exposure.
(14) Investment-related liabilities include securities sold under repurchase agreements. The securities sold under repurchase agreement do not meet the conditions to remove from the assets and are therefore maintained on the books with an offsetting liability recorded to represent the financing nature of this transaction. These agreements are recorded at cost which together with accrued interest approximates fair value due to their short-term nature.
(15) Other consists of operating assets of $262 million (2019 - $108 million) and liabilities of $176 million (2019 - $107 million) required to administer the Trusts' investment assets and the plane benefit and funding activities. Such assets are valued at cost and have not been assigned to a fair value category.
92 CN 12020 Annual Report

Notes to the Consolidated Financial Statements
Obligations and funded status for defined benefit pension and other postretirement benefit plans
Pensions Other postretirement benefits
In millions Year ended December 31, 2020 2019 2020 2019
Change in benefit obligation
Projected benefit obligation at beginning of year $ 18,609 $ 17,275 $ 227 $ 247
Amendments — — — —
Interest cost 532 596 6 8
Actuarial loss (gain) on projected benefit obligation (1) 1,208 1,611 9 (9) Current service cost 175 143 2 2
Plan participants' contributions 59 64 —
Foreign currency changes (7) (15) — (3) Benefit payments, settlements and transfers (1,077) (1,065) (16) (18)
Projected benefit obligation at the end of the year (2) $ 19,499 $ 18,609 $ 228 $ 227
Component representing future salary increases (271) (253)
Accumulated benefit obligation at end of year 19,228 $ 18,356 $ 228 $ 227
Change in plan assets
Fair value of plan assets at beginning of year $ 18,424 $ 17,244 $ — $
Employer contributions 93 105
Plan participants' contributions 59 64
Foreign currency changes (6) (11)
Actual return on plan assets 2,230 2,087
Benefit payments, settlements and transfers (1,077) (1,065)
Fair value of plan assets at end of year (2) 19,723 $ 18,424 $ — $
Funded status - Excess (deficiency) of fair value of plan assets over projected benefit obligation at end of year 224 $ (185) $ (228) $ (227)
(1) Substantially all of the pensions' actuarial loss for the year ended December 31, 2020 and actuarial loss for the year ended December 31, 2019 is the result of the change in the end of year discount rate of the current year versus the prior year (55 basis points decrease for 2020 and 67 basis points decrease for 2019).
(2) For the CN Pension Plan, as at December 31, 2020, the projected benefit obligation was $18,075 million (2019 - $17,252 million) and the fair value of plan assets was $18,774 million (2019 - $17,523 million). The measurement date of all plans is December 31.
Amounts recognized in the Consolidated Balance Sheets
Pensions Other postretirement benefits
In millions December 31, 2020 2019 2020 2019
Noncurrent assets - Pension asset $ 777 $ 336 $ — $ Current liabilities (Note 14) — — (14) (15)
Noncurrent liabilities - Pension and other postretirement benefits (553) (521) (214) (212)
Total amount recognized $ 224 $ (185) $ (228) $ (227)
Amounts recognized in Accumulated other comprehensive loss (Note 20)
Pensions Other postretirement benefits
In millions December 31, 2020 2019 2020 2019
Net actuarial gain (loss) (4,165) $ (4,336) $
Prior service credit (cost) — $ (3) $ 4
14
4
2020 Annual Report 93

Notes to the Consolidated Financial Statements
Information for defined benefit pension plans with an accumulated benefit obligation in excess of plan assets
Pensions
In millions December 31, 2020 2019
Accumulated benefit obligation (1)
Fair value of plan assets (1)
724
242
676
225
(1) All of the Company's other postretirement benefit pension plans have an accumulated benefit obligation in excess of plan assets.
Information for defined benefit pension plans with a projected benefit obligation in excess of plan assets
Pensions
In millions December 31, 2020 2019
Projected benefit obligation
Fair value of plan assets
900
347
843
322
Components of net periodic benefit cost (income) for defined benefit pension and other postretirement benefit plans
Pensions Other postretirement benefits
In millions Year ended December 31, 2020 2019 2018 2020 2019 2018
Current service cost $ 175 $ 143 $ 170 $ 2 $ 2 $ 2
Other components of net periodic benefit cost (income)
Interest cost 532 596 568
Settlement loss 2 5 3
Expected return on plan assets (1,095) (1,085) (1,083)
Amortization of prior service cost 3 3 3
Amortization of net actuarial loss (gain) 242 155 200
Total Other components of net periodic benefit cost (income) $ (316) $ (326) $ (309) $
Net periodic benefit cost (income) $ (141) $ (183) $ (139) $
6 8 9
(5) (3)
1 $ 5 $
3 $ 7 $
(2)
7
9
Weighted-average assumptions used in accounting for defined benefit pension and other postretirement benefit plans
December 31,
Pensions Other postretirement benefits
2020 2019 2018 2020 2019 2018
To determine projected benefit obligation
Discount rate (1) 2.55 % 3.10 % 3.77 % 2.53 % 3.14 % 4.00 %
Rate of compensation increase (2) 2.75 % 2.75 % 2.75 % 2.75 % 2.75 % 2.75 %
To determine net periodic benefit cost (income)
Rate to determine current service cost (3) 3.20 % 3.93 % 3.68 % 3.35 % 4.25 % 3.83 %
Rate to determine interest cost (3) 2.86 % 3.47 % 3.15 % 2.84 % 3.68 % 3.23 %
Rate of compensation increase (2) 2.75 % 2.75 % 2.75 % 2.75 % 2.75 % 2.75 %
Expected return on plan assets (4) 7.00 % 7.00 % 7.00 % N/A N/A N/A
(1) The Company's discount rate assumption, which is set annually at the end of each year, is determined by management with the aid of third-party actuaries. The discount rate is used to measure the single amount that, if invested at the measurement date in a portfolio of high-quality debt instruments with a rating of AA or better, would provide the necessary cash flows to pay for pension benefits as they become due. For the Canadian pension and other postretirement benefit plans, future expected benefit payments are discounted using spot rates based on a derived AA corporate bond yield curve for each maturity year.
(2) The rate of compensation increase is determined by the Company based upon its long-term plans for such increases.
(3) The Company uses the spot rate approach to measure current service cost and interest cost for all defined benefit pension and other postretirement benefit plans. Under the spot rate approach, individual spot discount rates along the same yield curve used in the determination of the projected benefit obligation are applied to the relevant projected cash flows at the relevant maturity.
(4) The expected long-term rate of return is determined based on expected future performance for each asset class and is weighted based on the investment policy. For 2020, the Company used a long-term rate of return assumption of 7.00% on the market-related value of plan assets to compute net periodic benefit cost (income). The Company has elected to use a market-related value of assets, whereby realized and unrealized gains/losses and appreciation/depreciation in the value of the investments are recognized over a period of five years, while investment income is recognized immediately. In 2021, the Company will decrease the expected long-term rate of return on plan assets by 25 basis points to 6.75% to reflect management's current view of long-term investment returns.
94 CN 12020 Annual Report

Notes to the Consolidated Financial Statements
Expected future benefit payments The following table provides the expected benefit payments for pensions and other postretirement benefits for the next five years and the
subsequent five-year period:
In millions Other postretirement
Pensions benefits
2021 $ 1,066 $ 14 2022 $ 1,059 $ 14 2023 $ 1,054 $ 13 2024 $ 1,046 $ 12 2025 $ 1,040 $ 12 Years 2026 to 2030 $ 5,070 $ 55
Defined contribution and other plans The Company maintains defined contribution pension plans for certain salaried employees as well as certain employees covered by collective bargaining agreements. The Company also maintains other plans including a Section 401(k) savings plan for U.S. based employees. The
Company's contributions under these plans were expensed as incurred and, in 2020, amounted to $22 million (2019 - $23 million; 2018 - $22
million).
Contributions to multi-employer plan
Under collective bargaining agreements, the Company participates in a multi-employer benefit plan named the Railroad Employees National Early Retirement Major Medical Benefit Plan which provides certain postretirement health care benefits to certain retirees. The Company's
contributions under this plan were expensed as incurred and amounted to $10 million in 2020 (2019 - $12 million; 2018 - $13 million). The
annual contribution rate for the plan was $153.43 per month per active employee for 2020 (2019 - $164.12). The plan covered 388 retirees in 2020 (2019 -445 retirees).
18 - Share capital
Authorized capital stock
The authorized capital stock of the Company is as follows: • Unlimited number of Common Shares, without par value • Unlimited number of Class A Preferred Shares, without par value, issuable in series • Unlimited number of Class B Preferred Shares, without par value, issuable in series
Common shares
In millions December 31, 2020 2019 2018
Issued common shares 711.6 714.1 727.3 Common shares in Share Trusts (1.3) (1.8) (2.0)
Outstanding common shares 710.3 712.3 725.3
Repurchase of common shares
The Company may repurchase its common shares pursuant to a Normal Course Issuer Bid (NCIB) at prevailing market prices plus brokerage
fees, or such other prices as may be permitted by the Toronto Stock Exchange. The Company may repurchase up to 16.0 million common
shares between February 1, 2020 and January 31, 2021 under its NCIB. As at December 31, 2020, the Company had repurchased 2.0 million
common shares under this NCIB.
The Company paused its share repurchases at the end of March 2020 due to the economic circumstances resulting from the COVID-19
pandemic.
2020 Annual Report 95

Notes to the Consolidated Financial Statements
The following table provides the information related to the share repurchases for the years ended December 31, 2020, 2019 and 2018:
In millions, except per share data Year ended December 31, 2020 2019 2018
Number of common shares repurchased 3.3 14.3 19.0
Weighted-average price per share (1) $ 116.97 $ 118.70 $ 104.99
Amount of repurchase (1) $ 379 $ 1,700 $ 2,000
(1) Includes brokerage fees.
See Note 24 - Subsequent events for information on the Company's new NCIB.
Share Trusts
The Company's Share Trusts purchase CN's common shares on the open market, which are used to deliver common shares under the Share Units Plan and, beginning in 2019, the Employee Share Investment Plans (ESIP) (see Note 19 — Stock-based compensation). Shares purchased
by the Share Trusts are retained until the Company instructs the trustee to transfer shares to the participants of the Share Units Plan or the
ESIP. Common shares purchased by the Share Trusts are accounted for as treasury stock. The Share Trusts may sell shares on the open
market to facilitate the remittance of the Company's employee tax withholding obligations under the Share Units Plan.
The following table provides the information related to the share purchases and settlements by Share Trusts under the Share Units Plan
and the ESIP for the years ended December 31, 2020, 2019 and 2018:
In millions, except per share data Year ended December 31, 2020 2019 2018
Share purchases by Share Units Plan Share Trusts
Number of common shares
Weighted-average price per share
Amount of purchase
Share purchases by ESIP Share Trusts
Number of common shares
Weighted-average price per share
—
$ —
$ —
0.1
$ 123.03
—
$ —
$ —
0.3
$ 118.83
0.4
$ 104.87
$ 38
N/A
N/A
Amount of purchase $ 14 $ 33 N/A
Total purchases $ 14 $ 33 $ 38
In millions, except per share data Year ended December 31, 2020 2019 2018
Share settlements by Share Units Plan Share Trusts
Number of common shares 0.4 0.5 0.4
Weighted-average price per share $ 88.23 $ 88.23 $ 84.53
Amount of settlement $ 35 $ 45 $ 31
Share settlements by ESIP Share Trusts
Number of common shares 0.2 — N/A
Weighted-average price per share $ 118.04 $ — N/A
Amount of settlements $ 27 $ — N/A
Total settlements $ 62 $ 45 $ 31
96 CN 12020 Annual Report

Notes to the Consolidated Financial Statements
19 - Stock-based compensation
The Company has various stock-based compensation plans for eligible employees. A description of the major plans is provided herein.
The following table provides the stock-based compensation expense for awards under all plans, as well as the related tax benefit and
excess tax benefit recognized in income, for the years ended December 31, 2020, 2019 and 2018:
In millions Year ended December 31, 2020 2019 2018
Share Units Plan 28 $ 26 $ 38 Voluntary Incentive Deferral Plan (VIDP) 4 4 —Stock option awards 11 12 12 Employee Share Investment Plan (ESIP) 21 15 40
Total stock-based compensation expense 64 $ 57 $ 90
Income tax impacts of stock-based compensation Tax benefit recognized in income $ 14 $ 12 $ 21 Excess tax benefit recognized in income $ 16 $ 23 $ 13
Share Units Plan
The objective of the Share Units Plan is to enhance the Company's ability to attract and retain talented employees and to provide alignment of
interests between such employees and the shareholders of the Company. Under the Share Units Plan, the Company grants performance share
unit (PSU) awards.
PSU-ROIC awards settle depending on the level of attainment of a target return on invested capital (ROIC) performance condition, as
defined by the award agreement, over the plan period of three years. The level of attainment of the performance condition results in a performance factor that ranges from 0% to 200%. Settlement is also conditional upon the attainment of a minimum share price market
condition, calculated using the average of the last three months of the plan period.
PSU-TSR awards settle depending on the level of attainment of a target total shareholder return (TSR) market condition, as defined by the
award agreement, over the plan period of three years. The level of attainment of the market condition results in a performance factor that
ranges from 0% to 200% depending on the Company's TSR relative to a Class I Railways peer group and the S&P/TSX 60 companies.
PSUs are settled in common shares of the Company, subject to the attainment of their respective performance and market conditions, by
way of disbursement from the Share Trusts (see Note 18 — Share capital). The number of shares remitted to the participant upon settlement is equal to the number of PSUs awarded multiplied by the performance factor, less shares withheld to satisfy the participants withholding tax
requirement.
For the 2018 grant, the level of ROIC attained resulted in a performance factor of 111%, and the level of TSR attained resulted in a
performance factor of 99% for the plan period ended December 31, 2020. The total fair value of the equity settled PSU awards that vested in 2020 was $27 million (2019 - $45 million; 2018 - $42 million). As the respective performance and market conditions under each award were met
as at December 31, 2020, a settlement of approximately 0.2 million shares, net of withholding taxes, is expected to occur in the first quarter of 2021.
2020 Annual Report 97

Notes to the Consolidated Financial Statements
The following table provides a summary of the activity related to PSU awards:
PSU-ROIC (1) PSU-TSR (2)
Units Weighted-average
grant date fair value Units Weighted-average
grant date fair value
In millions In millions
Outstanding at December 31, 2019 1.0 58.35 0.3 $ 112.08
Granted 0.3 73.92 0.1 $ 153.00
Settled (3) (0.4) 53.19 (0.1) $ 103.36
Forfeited 64.80 - 129.51
Outstanding at December 31, 2020 0.9 $ 65.06 0.3 $ 131.57
Nonvested at December 31, 2019 0.6 S 61.29 0.2 $ 117.04
Granted 0.3 S 73.92 0.1 $ 153.00
Vested (4) (0.3) S 50.77 (0.1) $ 104.58
Forfeited S 64.80 - 129.51
Nonvested at December 31, 2020 0.6 $ 72.22 0.2 $ 142.37
(1) The grant date fair value of equity settled PSUs-ROIC granted in 2020 of $20 million is calculated using a lattice-based valuation modeL As at December 31, 2020, total unrecognized compensation cost related to all outstanding awards was $12 million and is expected to be recognized over a weighted-average period of 1.6 years.
(2) The grant date fair value of equity settled PSUs-TSR granted in 2020 of $21 million is calculated using a Monte Carlo simulation modeL As at December 31, 2020, total unrecognized compensation cost related to all outstanding awards was $13 million and is expected to be recognized over a weighted-average period of 1.7 years.
Equity settled PSUs-ROIC granted in 2017 met the minimum share price condition for settlement and attained a performance factor of 169%. Equity settled PSUs-TSR granted in 2017 attained a performance factor of 100%. In the first quarter of 2020, these awards were settled, net of the remittance of the participants' withholding tax obligation of $41 million, by way of disbursement from the Share Trusts of 0.4 million common shares.
(4) These awards are expected to be settled in the first quarter of 2021.
(3)
The following table provides assumptions related to the the fair values of PSU awards, and the weighted-average grant date fair values for
units granted in 2020 , 2019 and 2018:
Year of grant 2020 2019 2018
Assumptions
Stock price ($) (1) 125.82 110.41 97.77
Expected stock price volatility (%) (2) 17 17 18
Expected term (years) (3) 3.0 3.0 3.0
Risk-free interest rate (%) (4) 1.40 1.75 1.92
Dividend rate ($) (5) 2.30 2.15 1.82
Weighted-average grant date fair value ($)
ROIC 73.92 70.76 50.77
TSR 153.00 128.20 104.58
(1) Represents the closing share price on the grant date.
(2) Based on the historical volatility of the Company's stock over a period commensurate with the expected term of the award.
(3) Represents the period of time that awards are expected to be outstanding.
(4) Based on the implied yield available on zero-coupon government issues with an equivalent term commensurate with the expected term of the awards.
(5) Based on the annualized dividend rate.
98 CN 12020 Annual Report

Notes to the Consolidated Financial Statements
Voluntary Incentive Deferral Plan The Company's Voluntary Incentive Deferral Plan (VIDP) provides eligible senior management employees the opportunity to elect to receive
their annual incentive bonus payment in deferred share units (DSU) up to specific deferral limits. A DSU is equivalent to a common share of the
Company and also earns dividends when normal cash dividends are paid on common shares. The number of DSUs received by each participant
is established at the time of deferral. For each participant, the Company will grant a further 25% of the amount elected in DSUs, which will vest
over a period of four years. The election to receive eligible incentive payments in DSUs is no longer available to a participant when the value of
the participants vested DSUs is sufficient to meet the Company's stock ownership guidelines.
Equity settled awards
DSUs are settled in common shares of the Company at the time of cessation of employment by way of an open market purchase by the
Company. The number of shares remitted to the participant is equal to the number of DSUs awarded less shares withheld to satisfy the
participants withholding tax requirement.
Cash settled awards
The value of each participants DSUs is payable in cash at the time of cessation of employment.
Stock price volatility
The Company's liability for the cash settled VIDP is marked-to-market at each period-end and varies with the Company's share price.
Fluctuations in the Company's share price cause volatility to stock-based compensation expense as recorded in Net income. The Company
does not currently hold any derivative financial instruments to manage this exposure. The following table provides a summary of the activity related to DSU awards:
Equity settled Cash settled DSUs (1) DSUs (2)
Weighted-average Units grant date fair value Units
In millions In millions
Outstanding at December 31, 2019 0.7 $ 81.91 0.1
Granted — $ 124.14
Settled (3) (0.1) $ 80.39
Outstanding at December 31, 2020 (4) 0.6 $ 83.47 0.1
(1) The grant date fair value of equity settled DSUs granted is calculated using the Company's stock price on the grant date. As at December 31, 2020, the aggregate intrinsic value of all equity settled DSUs outstanding amounted to $76 million.
(2) The fair value of cash settled DSUs as at December 31, 2020 is based on the intrinsic value. As at December 31, 2020, the liability for all cash settled DSUs was $14 million (2019 - $16 million). The closing stock price used to determine the liability was $139.94. The total fair value of cash settled DSU awards vested in 2020, 2019 and 2018 was $niL
For the year ended December 31, 2020 the shares purchased for the settlement of equity settled DSUs were net of the remittance of the participants' withholding tax obligation of $7 million.
(4) The total fair value of equity settled DSU awards vested, the number of units outstanding that were nonvested, unrecognized compensation cost and the remaining recognition period for cash and equity settled DSUs have not been quantified as they relate to a minimal number of units.
(3)
2020 Annual Report 99

Notes to the Consolidated Financial Statements
Stock option awards The Company's stock option plan allows for eligible employees to acquire common shares of the Company upon vesting at a price equal to the
market value of the common shares at the grant date. The options issued by the Company are conventional options that vest over a period of
time. The right to exercise options generally accrues over a period of four years of continuous employment for options granted prior to 2020,
and five years for options granted in 2020. Options are not generally exercisable during the first 12 months after the date of grant and expire
after 10 years. As at December 31, 2020, 14.3 million common shares remained authorized for future issuances under these plans.
During the year ended December 31, 2020, the Company granted 0.7 million (2019 - 0.9 million; 2018 -1.1 million) stock options.
The following table provides the activity of stock option awards during 2020, and for options outstanding and exercisable at December 31, 2020, the weighted-average exercise price:
Options outstanding Nonvested options
Number of options
Weighted-average exercise price
Number of options
Weighted-average grant date fair value
In millions In millions
Outstanding at December 31, 2019 (1) 3.8 $ 86.89 2.1 $ 15.00
Granted (2) 0.7 $ 126.13 0.7 $ 19.09
Forfeited/Cancelled (0.1) $ 106.84 (0.1) $ 16.46
Exercised (3) (0.8) $ 70.05 N/A N/A
Vested (4) N/A N/A (0.8) $ 13.99
Outstanding at December 31, 2020 (1) 3.6 $ 97.15 1.9 $ 17.04
Exercisable at December 31, 2020 (1) 1.7 $ 82.42 N/A N/A
(1) Stock options with a US dollar exercise price have been translated to Canadian dollars using the foreign exchange rate in effect at the balance sheet date.
(2) The grant date fair value of options granted in 2020 of $14 million ($19.09 per option) is calculated using the Black-Scholes option-pricing model. As at December 31, 2020, total unrecognized compensation cost related to all outstanding awards was $10 million and is expected to be recognized over a weighted-average period of 3.1 years.
(3) The total intrinsic value of options exercised in 2020 was $47 million (2019 - $53 million; 2018 - $78 million). The cash received upon exercise of options in 2020 was $56 million (2019 - $77 million; 2018 - $103 million) and the related excess tax benefit realized in 2020 was $2 million (2019 - $3 million; 2018 - $3 million).
(4) The grant date fair value of options vested in 2020 was $12 million (2019 - $12 million; 2018 - $12 million).
The following table provides the number of stock options outstanding and exercisable as at December 31, 2020 by range of exercise price
and their related intrinsic value, and for options outstanding, the weighted-average years to expiration. The table also provides the aggregate intrinsic value for in-the-money stock options, which represents the value that would have been received by option holders had they exercised
their options on December 31, 2020 at the Company's closing stock price of $139.94.
Options outstanding Options exercisable
Weighted- Weighted- Aggregate Weighted- Aggregate Number of average years average intrinsic Number of average intrinsic
options to expiration exercise price value options exercise price value
Range of exercise prices In millions In millions In millions In millions
$ 34.45 - $ 85.00 0.8 3.8 $ 66.17 $ 60 0.8 $ 66.17 $ 60
$ 85.01 - $ 95.00 0.7 5.9 $ 89.92 33 0.4 $ 89.55 22
$ 95.01 - $ 105.00 0.6 7.1 $ 98.60 25 0.3 $ 98.60 11
$ 105.01 - $ 115.00 0.7 8.1 $ 108.37 23 0.2 $ 108.94 6
$ 115.01 - $ 137.36 0.8 9.1 $ 123.01 14 - $ 118.41 1
Balance at December 31, 2020 (1) 3.6 6.7 $ 97.15 $ 155 1.7 $ 82.42 $ 100
(1) Stock options with a US dollar exercise price have been translated to Canadian dollars using the foreign exchange rate in effect at the balance sheet date. The weighted-average years to expiration of exercisable stock options was 5.3 years.
100 2020 Annual Report

Notes to the Consolidated Financial Statements
The following table provides assumptions related to the fair values of stock option awards, and the weighted-average grant date fair values for units granted in 2020, 2019, and 2018:
Year of grant 2020 2019 2018
Assumptions
Grant price ($) 126.13 110.94 98.05
Expected stock price volatility (%) (1) 19 18 18
Expected term (years) (2) 5.7 5.5 5.5
Risk-free interest rate (%) (3) 1.26 1.75 2.08
Dividend rate ($) (4) 2.30 2.15 1.82
Weighted-average grant date fair value ($) 19.09 16.34 15.34
(1) Based on the historical volatility of the Company's stock over a period commensurate with the expected term of the award.
(2) Represents the period of time that awards are expected to be outstanding. The Company uses historical data to predict option exercise behavior.
(3) Based on the implied yield available on zero-coupon government issues with an equivalent term commensurate with the expected term of the awards.
(4) Based on the annualized dividend rate.
ESIP
The Company has an ESIP giving eligible employees the opportunity to subscribe for up to 10% of their gross salaries to purchase shares of the
Company's common stock on the open market and to have the Company invest, on the employees' behalf, a further 35% of the amount invested
by the employees, up to 6% of their gross salaries.
Company contributions to the ESIP, which consist of shares purchased on the open market, are subject to a one-year vesting period and
are forfeited should certain participant contributions be sold or disposed of prior to vesting. Company contributions to the ESIP are held in
Share Trusts until vesting, at which time shares are delivered to the employee. The following table provides a summary of the activity related to the ESIP:
ESIP
Number of shares
Weighted-average share price
In millions
Unvested contributions, December 31, 2019 0.3 118.83
Company contributions (1) 0.2 121.12
Vested (2) (0.2) 118.71
Forfeited (0.1) 118.53
Unvested contributions, December 31, 2020 (3) 0.2 122.07
(1) In light of the uncertain and unprecedented economic environment, Company contributions were temporarily suspended between May 25, 2020 and October 1, 2020.
(2) The total fair value of units purchased with Company contributions that vested in 2020 was $27 million (2019 - $nil).
(3) As at December 31, 2020, total unrecognized compensation cost related to all outstanding units was $8 million and is expected to be recognized over the next 12 months.
The following table provides the number of participants holding shares, the total number of ESIP shares purchased on behalf of
employees, including the Company's contributions for the years ended December 31, 2020, 2019 and 2018:
Year ended December 31, 2020 2019 2018
Number of participants holding shares 20,270 21,674 22,185
Total number of ESIP shares purchased on behalf of employees (millions) 1.1 1.5 1.8
2020 Annual Report 101

Notes to the Consolidated Financial Statements
20 - Accumulated other comprehensive loss
In millions
Foreign currency
translation adjustments
Pension and other
postretirement benefit plans
Total before
tax
Income tax recovery
(expense) (1)
Total net of
tax
Balance at December 31, 2017 $ (444) $ (3,122) $ (3,566) $ 782 $ (2,784)
Other comprehensive income (loss) before reclassifications:
Foreign exchange gain on translation of net investment in foreign operations 1,038 1,038 — 1,038
Foreign exchange loss on translation of US dollar-denominated debt designated as a hedge of the net investment in foreign operations (635) (635) 86 (549)
Actuarial loss arising during the year (969) (969) 262 (707) Prior service credit arising during the year 6 6 (2) 4
Amounts reclassified from Accumulated other comprehensive loss: Amortization of net actuarial loss 198 198 (2) (54) (3) 144 Amortization of prior service costs 3 3 (2) — (3) 3 Settlement loss arising during the year 3 3 (2) (1) (3) 2
Other comprehensive income (loss) 403 (759) (356) 291 (65)
Balance at December 31, 2018 (41) (3,881) (3,922) 1,073 (2,849)
Other comprehensive income (loss) before reclassifications:
Foreign exchange loss on translation of net investment in foreign operations (636) (636) — (636)
Foreign exchange gain on translation of US dollar-denominated debt designated as a hedge of the net investment in foreign operations 380 380 (52) 328
Actuarial loss arising during the year (600) (600) 155 (445)
Amounts reclassified from Accumulated other comprehensive loss: Amortization of net actuarial loss 152 152 (2) (39) (3) 113 Amortization of prior service costs 3 3 (2) (1) (3) 2
Settlement loss arising during the year 5 5 (2) (1) (3) 4
Other comprehensive income (loss) (256) (440) (696) 62 (634)
Balance at December 31, 2019 (297) (4,321) (4,618) 1,135 (3,483)
Other comprehensive income (loss) before reclassifications:
Foreign exchange loss on translation of net investment in foreign operations (269) (269) — (269)
Foreign exchange gain on translation of US dollar-denominated debt designated as a hedge of the net investment in foreign operations 187 187 (24) 163
Actuarial loss arising during the year (82) (82) 22 (60)
Amounts reclassified from Accumulated other comprehensive loss: Amortization of net actuarial loss 237 237 (2) (64) (3) 173 Amortization of prior service costs 3 3 (2) (1) (3) 2
Settlement loss arising during the year 2 2 (2) — (3) 2
Other comprehensive income (loss) (82) 160 78 (67) 11
Balance at December 31, 2020 (379) $ (4,161) $ (4,540) $ 1,068 $ (3,472)
(1) The Company releases stranded tax effects from Accumulated other comprehensive loss to Net income upon the liquidation or termination of the related item.
(2) Reclassified to Other components of net periodic benefit income in the Consolidated Statements of Income and included in net periodic benefit cost. See Note 17 -Pensions and other postretirement benefits.
Included in Income tax expense in the Consolidated Statements of Income. (3)
102 2020 Annual Report

Notes to the Consolidated Financial Statements
21 - Major commitments and contingencies
Purchase commitments
As at December 31, 2020, the Company had fixed and variable commitments to purchase rail, wheels, information technology services and
licenses, engineering services, locomotives, railroad ties, rail cars, as well as other equipment and services with a total estimated cost of $1,324 million. Costs of variable commitments were estimated using forecasted prices and volumes.
Contingencies
In the normal course of business, the Company becomes involved in various legal actions seeking compensatory and occasionally punitive
damages, including actions brought on behalf of various purported classes of claimants and claims relating to employee and third-party personal injuries, occupational disease and property damage, arising out of harm to individuals or property allegedly caused by, but not limited
to, derailments or other accidents.
Canada
Employee injuries are governed by the workers' compensation legislation in each province whereby employees may be awarded either a lump
sum or a future stream of payments depending on the nature and severity of the injury. As such, the provision for employee injury claims is
discounted. In the provinces where the Company is self-insured, costs related to employee work-related injuries are accounted for based on actuarially developed estimates of the ultimate cost associated with such injuries, including compensation, health care and third-party
administration costs. An actuarial study is generally performed at least on a triennial basis. For all other legal actions, the Company maintains,
and regularly updates on a case-by-case basis, provisions for such items when the expected loss is both probable and can be reasonably
estimated based on currently available information.
In 2020, 2019 and 2018 the Company recorded a decrease of $13 million and $7 million, and an increase of $4 million, respectively, to its
provision for personal injuries in Canada as a result of actuarial valuations for employee injury claims.
As at December 31, 2020, 2019 and 2018, the Company's provision for personal injury and other claims in Canada was as follows:
In millions 2020 2019 2018
Beginning of year $ 207 $ 207 $ 183 Accruals and other 31 29 52 Payments (32) (29) (28)
End of year $ 206 $ 207 $ 207
Current portion - End of year $ 68 $ 55 $ 60
United States Personal injury claims by the Company's employees, including claims alleging occupational disease and work-related injuries, are subject to the provisions of the Federal Employers' Liability Act (FELA). Employees are compensated under FELA for damages assessed based on a finding of fault through the U.S. jury system or through individual settlements. As such, the provision is undiscounted. With limited exceptions where
claims are evaluated on a case-by-case basis, the Company follows an actuarial-based approach and accrues the expected cost for personal
injury, including asserted and unasserted occupational disease claims, and property damage claims, based on actuarial estimates of their
ultimate cost. An actuarial study is performed annually.
For employee work-related injuries, including asserted occupational disease claims, and third-party claims, including grade crossing,
trespasser and property damage claims, the actuarial valuation considers, among other factors, the Company's historical patterns of claims
filings and payments. For unasserted occupational disease claims, the actuarial valuation includes the projection of the Company's experience into the future considering the potentially exposed population. The Company adjusts its liability based upon managements assessment and the
results of the study. On an ongoing basis, management reviews and compares the assumptions inherent in the latest actuarial valuation with
the current claim experience and, if required, adjustments to the liability are recorded.
Due to the inherent uncertainty involved in projecting future events, including events related to occupational diseases, which include but
are not limited to, the timing and number of actual claims, the average cost per claim and the legislative and judicial environment, the
Company's future payments may differ from current amounts recorded.
In 2020, the Company recorded a decrease of $10 million to its provision for U.S. personal injury and other claims attributable to non-occupational disease claims, third-party claims and occupational disease claims pursuant to the 2020 actuarial valuation. In 2019 and 2018,
actuarial valuations resulted in an increase of $2 million and $13 million, respectively. The prior years' adjustments from the actuarial valuations
were mainly attributable to third-party claims, non-occupational disease claims and occupational disease claims reflecting changes in the
Company's estimates of unasserted claims and costs related to asserted claims. The Company has an ongoing risk mitigation strategy focused
2020 Annual Report 103

Notes to the Consolidated Financial Statements
on reducing the frequency and severity of claims through injury prevention and containment; mitigation of claims; and lower settlements of existing claims.
As at December 31, 2020, 2019 and 2018, the Company's provision for personal injury and other claims in the U.S. was as follows:
In millions 2020 2019 2018
Beginning of year $ 145 $ 139 $ 116 Accruals and other 28 44 41 Payments (29) (31) (28) Foreign exchange (3) (7) 10
End of year $ 141 $ 145 $ 139
Current portion - End of year $ 41 $ 36 $ 37
Although the Company considers such provisions to be adequate for all its outstanding and pending claims, the final outcome with respect
to actions outstanding or pending at December 31, 2020, or with respect to future claims, cannot be reasonably determined. When establishing provisions for contingent liabilities the Company considers, where a probable loss estimate cannot be made with reasonable certainty, a range
of potential probable losses for each such matter, and records the amount it considers the most reasonable estimate within the range. However, when no amount within the range is a better estimate than any other amount, the minimum amount in the range is accrued. For
matters where a loss is reasonably possible but not probable, a range of potential losses cannot be estimated due to various factors which may include the limited availability of facts, the lack of demand for specific damages and the fact that proceedings were at an early stage. Based on
information currently available, the Company believes that the eventual outcome of the actions against the Company will not, individually or in
the aggregate, have a material adverse effect on the Company's financial position. However, due to the inherent inability to predict with certainty
unforeseeable future developments, there can be no assurance that the ultimate resolution of these actions will not have a material adverse
effect on the Company's results of operations, financial position or liquidity.
Environmental matters
The Company's operations are subject to numerous federal, provincial, state, municipal and local environmental laws and regulations in Canada and the U.S. concerning, among other things, emissions into the air; discharges into waters; the generation, handling, storage, transportation,
treatment and disposal of waste, hazardous substances, and other materials; decommissioning of underground and aboveground storage tanks; and soil and groundwater contamination. A risk of environmental liability is inherent in railroad and related transportation operations; real
estate ownership, operation or control; and other commercial activities of the Company with respect to both current and past operations.
Known existing environmental concerns
The Company is or may be liable for remediation costs at individual sites, in some cases along with other potentially responsible parties, associated with actual or alleged contamination. The ultimate cost of addressing these known contaminated sites cannot be definitively
established given that the estimated environmental liability for any given site may vary depending on the nature and extent of the
contamination; the nature of anticipated response actions, taking into account the available clean-up techniques; evolving regulatory standards governing environmental liability; and the number of potentially responsible parties and their financial viability. As a result, liabilities are
recorded based on the results of a four-phase assessment conducted on a site-by-site basis. A liability is initially recorded when environmental
assessments occur, remedial efforts are probable, and when the costs, based on a specific plan of action in terms of the technology to be used
and the extent of the corrective action required, can be reasonably estimated. The Company estimates the costs related to a particular site using cost scenarios established by external consultants based on the extent of contamination and expected costs for remedial efforts. In the
case of multiple parties, the Company accrues its allocable share of liability taking into account the Company's alleged responsibility, the
number of potentially responsible parties and their ability to pay their respective share of the liability. Adjustments to initial estimates are
recorded as additional information becomes available. The Company's provision for specific environmental sites is undiscounted and includes costs for remediation and restoration of sites, as
well as monitoring costs. Environmental expenses, which are classified as Casualty and other in the Consolidated Statements of Income,
include amounts for newly identified sites or contaminants as well as adjustments to initial estimates. Recoveries of environmental remediation costs from other parties are recorded as assets when their receipt is deemed probable.
104 2020 Annual Report

Notes to the Consolidated Financial Statements
As at December 31, 2020, 2019 and 2018, the Company's provision for specific environmental sites was as follows:
In millions 2020 2019 2018
Beginning of year $ 57 $ 61 $ 78 Accruals and other 44 31 16 Payments (42) (34) (34) Foreign exchange — (1) 1
End of year $ 59 $ 57 $ 61
Current portion - End of year $ 46 $ 38 $ 39
The Company anticipates that the majority of the liability at December 31, 2020 will be paid out over the next five years. Based on the information currently available, the Company considers its provisions to be adequate.
Unknown existing environmental concerns
While the Company believes that it has identified the costs likely to be incurred for environmental matters based on known information, the
discovery of new facts, future changes in laws, the possibility of releases of hazardous materials into the environment and the Company's
ongoing efforts to identify potential environmental liabilities that may be associated with its properties may result in the identification of
additional environmental liabilities and related costs. The magnitude of such additional liabilities and the costs of complying with future environmental laws and containing or remediating contamination cannot be reasonably estimated due to many factors, including: • the lack of specific technical information available with respect to many sites;
• the absence of any government authority, third-party orders, or claims with respect to particular sites;
• the potential for new or changed laws and regulations and for development of new remediation technologies and uncertainty regarding the timing of the work with respect to particular sites; and
• the determination of the Company's liability in proportion to other potentially responsible parties and the ability to recover costs from any
third parties with respect to particular sites. Therefore, the likelihood of any such costs being incurred or whether such costs would be material to the Company cannot be determined at
this time. There can thus be no assurance that liabilities or costs related to environmental matters will not be incurred in the future, or will not
have a material adverse effect on the Company's financial position or results of operations in a particular quarter or fiscal year, or that the
Company's liquidity will not be adversely impacted by such liabilities or costs, although management believes, based on current information,
that the costs to address environmental matters will not have a material adverse effect on the Company's financial position or liquidity. Costs
related to any unknown existing or future contamination will be accrued in the period in which they become probable and reasonably estimable.
Future occurrences In railroad and related transportation operations, it is possible that derailments or other accidents, including spills and releases of hazardous
materials, may occur that could cause harm to human health or to the environment. As a result, the Company may incur costs in the future,
which may be material, to address any such harm, compliance with laws and other risks, including costs relating to the performance of clean-
ups, payment of environmental penalties and remediation obligations, and damages relating to harm to individuals or property.
Regulatory compliance
The Company may incur significant capital and operating costs associated with environmental regulatory compliance and clean-up requirements, in its railroad operations and relating to its past and present ownership, operation or control of real property. Operating expenses
related to regulatory compliance activities for environmental matters for the year ended December 31, 2020 amounted to $25 million (2019 -
$25 million; 2018 - $22 million). In addition, based on the results of its operations and maintenance programs, as well as ongoing environmental
audits and other factors, the Company plans for specific capital improvements on an annual basis. Certain of these improvements help ensure
facilities, such as fueling stations, waste water and storm water treatment systems, comply with environmental standards and include new
construction and the updating of existing systems and/or processes. Other capital expenditures relate to assessing and remediating certain
impaired properties. The Company's environmental capital expenditures for the year ended December 31, 2020 amounted to $20 million (2019 -
$25 million; 2018 - $19 million).
Guarantees and indemnifications
In the normal course of business, the Company enters into agreements that may involve providing guarantees or indemnifications to third
parties and others, which may extend beyond the term of the agreements. These include, but are not limited to, standby letters of credit, surety
and other bonds, and indemnifications that are customary for the type of transaction or for the railway business.
2020 Annual Report 105

Notes to the Consolidated Financial Statements
As at December 31, 2020, the Company had outstanding letters of credit of $421 million (2019 - $424 million) under the committed bilateral letter of credit facilities and $165 million (2019 - $149 million) under the uncommitted bilateral letter of credit facilities, and surety and other bonds of $168 million (2019 - $169 million), all issued by financial institutions with investment grade credit ratings to third parties to indemnify them in the event the Company does not perform its contractual obligations.
As at December 31, 2020, the maximum potential liability under these guarantee instruments was $754 million (2019 - $742 million), of
which $688 million (2019 - $681 million) related to other employee benefit liabilities and workers' compensation and $66 million (2019 - $61
million) related to other liabilities. The guarantee instruments expire at various dates between 2021 and 2025.
As at December 31, 2020, the Company had not recorded a liability with respect to guarantees as the Company did not expect to make any payments under its guarantees.
General indemnifications
In the normal course of business, the Company provides indemnifications, customary for the type of transaction or for the railway business, in various agreements with third parties, including indemnification provisions where the Company would be required to indemnify third parties and
others. During the year, the Company entered into various contracts with third parties for which an indemnification was provided. Due to the
nature of the indemnification clauses, the maximum exposure for future payments cannot be reasonably determined. To the extent of any actual claims under these agreements, the Company maintains provisions for such items, which it considers to be adequate. As at December
31, 2020, the Company had not recorded a liability with respect to any indemnifications.
22 - Financial instruments
Risk management
In the normal course of business, the Company is exposed to various risks from its use of financial instruments. To manage these risks, the Company follows a financial risk management framework, which is monitored and approved by the Company's Finance Committee, with a goal of maintaining a strong balance sheet, optimizing earnings per share and free cash flow, financing its operations at an optimal cost of capital and preserving its liquidity. The Company has limited involvement with derivative financial instruments in the management of its risks and does
not hold or issue them for trading or speculative purposes.
Foreign currency risk
The Company conducts its business in both Canada and the U.S. and as a result, is affected by currency fluctuations. Changes in the exchange rate between the Canadian dollar and the US dollar affect the Company's revenues and expenses. To manage foreign currency risk, the
Company designates US dollar-denominated debt of the parent company as a foreign currency hedge of its net investment in foreign
operations. As a result, from the dates of designation, foreign exchange gains and losses on translation of the Company's US dollar-
denominated debt are recorded in Accumulated other comprehensive loss, which minimizes volatility of earnings resulting from the conversion
of US dollar-denominated debt into the Canadian dollar.
The Company also enters into foreign exchange forward contracts to manage its exposure to foreign currency risk. As at December 31,
2020, the Company had outstanding foreign exchange forward contracts with a notional value of US$397 million (2019 - US$1,088 million).
Changes in the fair value of foreign exchange forward contracts, resulting from changes in foreign exchange rates, are recognized in Other income in the Consolidated Statement of Income as they occur. For the year ended December 31, 2020, the Company recorded a loss of $3 million (2019 - loss of $75 million; 2018 - gain of $157 million) related to foreign exchange forward contracts. These gains and losses were
largely offset by the re-measurement of US dollar-denominated monetary assets and liabilities recognized in Other income. As at December 31,
2020, the fair value of outstanding foreign exchange forward contracts included in Other current assets and Accounts payable and other was $nil and $18 million, respectively (2019 - $nil and $24 million, respectively).
Interest rate risk The Company is exposed to interest rate risk, which is the risk that the fair value or future cash flows of a financial instrument will vary as a
result of changes in market interest rates. Such risk exists in relation to the Company's debt. The Company mainly issues fixed-rate debt, which
exposes the Company to variability in the fair value of the debt. The Company also issues debt with variable interest rates, which exposes the Company to variability in interest expense.
To manage interest rate risk, the Company manages its borrowings in line with liquidity needs, maturity schedule, and currency and interest
rate profile. In anticipation of future debt issuances, the Company may use derivative instruments such as forward rate agreements. The
Company does not currently hold any significant derivative instruments to manage its interest rate risk.
106 2020 Annual Report

Notes to the Consolidated Financial Statements
Fair value of financial instruments The financial instruments that the Company measures at fair value on a recurring basis in periods subsequent to initial recognition are categorized into the following levels of the fair value hierarchy based on the degree to which inputs are observable:
• Level 1: Inputs are quoted prices for identical instruments in active markets • Level 2: Significant inputs (other than quoted prices included in Level 1) are observable • Level 3: Significant inputs are unobservable
The carrying amounts of Cash and cash equivalents and Restricted cash and cash equivalents approximate fair value. These financial instruments include highly liquid investments purchased three months or less from maturity, for which the fair value is determined by reference to quoted prices in active markets.
The carrying amounts of Accounts receivable, Other current assets and Accounts payable and other approximate fair value due to their
short maturity, unless otherwise specified. The fair value of derivative financial instruments, included in Other current assets and Accounts
payable and other is classified as Level 2 and is used to manage the Company's exposure to foreign currency risk. The fair value is measured by
discounting future cash flows using a discount rate derived from market data for financial instruments subject to similar risks and maturities.
The fair value of assets held for sale, included in Other current assets is classified as Level 3. Additional disclosures are provided in Note 5 —
Assets held for sale. The carrying amount of the Company's debt does not approximate fair value. The fair value is estimated based on quoted market prices for
the same or similar debt instruments, as well as discounted cash flows using current interest rates for debt with similar terms, company rating, and remaining maturity. The Company classifies debt as Level 2. As at December 31, 2020, the Company's debt, excluding finance leases, had a carrying amount of $12,832 million (2019 - $13,662 million) and a fair value of $16,046 million (2019 - $15,667 million).
23 - Segmented information
The Company manages its operations as one business segment over a single network that spans vast geographic distances and territories,
with operations in Canada and the U.S. Financial information reported at this level, such as revenues, operating income, and cash flow from
operations, is used by the Company's management, including its chief operating decision-maker, in evaluating financial and operational
performance and allocating resources across CN's network.
The Company's strategic initiatives, which drive its operational direction, are developed and managed centrally by management and are
communicated to its regional activity centers (the Western Region and Eastern Region). The Company's management is responsible for, among
others, CN's marketing strategy, the management of large customer accounts, overall planning and control of infrastructure and rolling stock,
the allocation of resources, and other functions such as financial planning, accounting and treasury.
The role of each region is to manage the day-to-day service requirements within their respective territories and control direct costs incurred
locally. Such cost control is required to ensure that pre-established efficiency standards set at the corporate level are met. The regions execute the overall corporate strategy and operating plan established by the Company's management, as the regions' management of throughput and
control of direct costs does not serve as the platform for the Company's decision-making process. Approximately 95% of the Company's freight
revenues are from national accounts for which freight traffic spans North America and touches various commodity groups. As a result, the
Company does not manage revenues on a regional basis since a large number of the movements originate in one region and pass through and/
or terminate in another region.
The regions also demonstrate common characteristics in each of the following areas:
• each region's sole business activity is the transportation of freight over the Company's extensive rail network;
• the regions service national accounts that extend over the Company's various commodity groups and across its rail network;
• the services offered by the Company stem predominantly from the transportation of freight by rail with the goal of optimizing the rail
network as a whole; and
• the Company and its subsidiaries, not its regions, are subject to regulatory regimes in both Canada and the U.S.
For the years ended December 31, 2020, 2019, and 2018, no major customer accounted for more than 10% of total revenues and the
largest freight customer represented approximately 3% of total annual freight revenues.
2020 Annual Report 107

Notes to the Consolidated Financial Statements
The following tables provide information by geographic area:
In millions Year ended December 31, 2020 2019 2018
Revenues Canada $ 9,588 $ 10,167 $ 9,610 U.S. 4,231 4,750 4,711
Total revenues $ 13,819 $ 14,917 $ 14,321
Net income Canada $ 2,632 $ 3,131 $ 3,163 U.S. 930 1,085 1,165
Total net income $ 3,562 $ 4,216 $ 4,328
In millions December 31, 2020 2019
Properties Canada $ 22,235 $ 21,482 U.S. 17,834 18,187
Total properties $ 40,069 $ 39,669
I - Subsequent eventr
Normal course issuer bid
On January 26, 2021, the Board of Directors of the Company approved a new NCIB, which allows for the repurchase of up to 14 million common
shares between February 1, 2021 and January 31, 2022. The Company expects to resume its share repurchases in the first quarter of 2021
under the new NCIB.
Notes and debentures
On January 18, 2021, as a result of lower prevailing interest rates and pursuant to an early repayment option within the Company's fixed rate
debt agreements, the Company repaid in full the seven-year 2.75% Notes due February 18, 2021. The payment consisted of $250 million of
principal plus $3 million of accrued interest.
108 2020 Annual Report

Adctonal coda of [hie novo rt a re (mkt% faxrc
MANI. Allen 995 de La Goudiotibre StrolutWint
Kota* Quotoc 119132149 WW1 aroc1-8913-0131143909
Emak conbxtealca
La wink., fro maim du plowt rapport wit avant% ti I bdroon .hfl:
arm putel DOM 1:11 S La Goudilitibre OM*
Keno] on) REs 049 104phon•:1 999 89943909 CouaW:aianctewca
nolo neat ha boon ixtrad an 20% roit-con liner nwidod await
SIMIt .rnCttant tintrtaxisfr.Cenctoxin
TS.S.01.1
• as s as • HQ T 01 Rpm Sisk Conches
tars IC
Additional copies of this report are available from:
CN Public Affairs935 de La Gauchetière Street West
Montreal, Quebec H3B 2M9 Telephone: 1‑888‑888‑5909
Email: [email protected]
La version française du présent rapport est disponible à l’adresse suivante :
Affaires publiques du CN935, rue de La Gauchetière Ouest Montréal (Québec) H3B 2M9 Téléphone : 1 888 888‑5909 Courriel : [email protected]
This report has been printed on 30% post‑consumer recycled content.
30%
photo a b ov e:Anwar Azzahir, Conductor
Toronto, ON
b ack cov e r photo:Ryan Trithardt, Conductor
Surrey, BC

Lef
985 do La CO uch eke Streit Walt Mono Quipb•c H WO maw
935 de La Gauchetière Street West Montreal, Quebec H3B 2M9cn.ca